Embed Size (px)
Citation preview

443
DGA in Non-Mineral Oils and Load Tap Changers and Improved DGA Diagnosis Criteria
Working Group D1.32
December 2010

1
WG D1.32
DGA in Non-Mineral Oils and Load Tap Changers and Improved DGA
Diagnosis Criteria
Contributing members Michel Duval (Convenor) Ivanka Hoehlein Fabio Scatiggio Marc Cyr Marius Grisaru Rainer Frotscher Maria Martins Lisa Bates Paul Boman A.C.Hall Gordon Wilson Lars Arvidsson Maria Szebeni Kjell Carrander
Canada Germany Italy Canada Israel Germany Portugal USA USA UK UK Sweden Hungary Sweden
Helen Athanassatou Anne Marie Haug Albrecht Moellmann Hans Josef Knab Julie VanPeteghem Gerhard Buchgraber Stefan Tenbohlen Riccardo Maina Bruce Pahlavanpour Patrick McShane Colin Myers Russel Martin Zhongdong.Wang
Greece Norway Germany Switzerland Belgium Austria Germany Italy UK USA UK UK UK
Participating members Alfonso de Pablo Jan Olov Persson Jean Claude Duart
Spain Sweden Switzerland
Bernd-Klaus Goettert Vander Tumiatti Liselotte Westlin
Germany Italy Sweden
Copyright © 2010 “Ownership of a CIGRE publication, whether in paper form or on electronic support only infers right of use for personal purposes. Are prohibited, except if explicitly agreed by CIGRE, total or partial reproduction of the publication for use other than personal and transfer to a third party; hence circulation on any intranet or other company network is forbidden”. Disclaimer notice “CIGRE gives no warranty or assurance about the contents of this publication, nor does it accept any responsibility, as to the accuracy or exhaustiveness of the information. All implied warranties and conditions are excluded to the maximum extent permitted by law”.
ISBN: 978- 2- 85873- 131-2

2
TABLE OF CONTENTS 1 EXECUTIVE SUMMARY ..................................................................................................................................... 3
1.1 INTRODUCTION....................................................................................................................................... 3 1.2 APPLICATION OF DGA TO NON-MINERAL OILS .................................................................................. 3 1.3 APPLICATION OF DGA TO LOAD TAP CHANGERS.............................................................................. 3 1.4 IMPROVED DGA DIAGNOSIS CRITERIA................................................................................................4
2 INTRODUCTION.................................................................................................................................................. 5 3 APPLICATION OF DGA TO NON-MINERAL OILS ............................................................................................. 5
3.1 DGA ANALYTICAL TECHNIQUES FOR NON-MINERAL OILS............................................................... 5 3.2 IDENTIFICATION OF FAULTS IN NON-MINERAL OILS......................................................................... 7 3.3 TYPICAL CONCENTRATION VALUES IN NON-MINERAL OILS............................................................ 9 3.4 GAS FORMATION IN HYBRID SYSTEMS............................................................................................. 10
4 APPLICATION OF DGA TO LOAD TAP CHANGERS ...................................................................................... 10 4.1 CLASSIFICATION OF LTCS ACCORDING TO ELECTRICAL COMPONENTS USED AND TYPE OF DESIGN ................................................................................................................................................................ 10 4.2 CLASSIFICATION OF LTCS ACCORDING TO GASES FORMED DURING NORMAL OPERATION..11 4.2 CLASSIFICATION OF LTCS ACCORDING TO GASES FORMED DURING NORMAL OPERATION..11 24.3 FAULT IDENTIFICATION IN LTCS......................................................................................................... 12 4.4 GAS LEVELS IN LTCS ........................................................................................................................... 14 4.5 MINIMUM GAS CONCENTRATIONS FOR ATTEMPTING DIAGNOSIS IN LTCS ................................ 15
5 IMPROVED DGA DIAGNOSIS CRITERIA ........................................................................................................ 15 5.1 OIL SAMPLING FOR DGA...................................................................................................................... 15 5.2 GAS LEVELS IN SERVICE..................................................................................................................... 16 5.3 HEAT RUN TESTS ON REPAIRED TRANSFORMERS ........................................................................ 18 5.4 GAS LOSSES FROM TRANSFORMERS OF THE CONSERVATOR-TYPE......................................... 19 5.5 STRAY GASSING OF PASSIVATED OILS ............................................................................................ 20 5.6 ON-LINE CONTINUOUS DEGASSING OF TRANSFORMERS............................................................. 21 5.7 FORMATION OF CARBON OXIDES IN TRANSFORMERS.................................................................. 21
6 CONCLUSIONS................................................................................................................................................. 22 6.1 APPLICATION OF DGA TO NON-MINERAL OILS ................................................................................ 22 6.2 APPLICATION OF DGA TO LOAD TAP CHANGERS............................................................................ 22 6.3 IMPROVED DGA DIAGNOSIS CRITERIA.............................................................................................. 22
7 REFERENCES................................................................................................................................................... 23 8 TRADEMARKED PRODUCTS .......................................................................................................................... 24 9 CONTRIBUTING MEMBERS............................................................................................................................. 24 ANNEX A: MEASUREMENT OF PARTITION COEFFICIENTS BY HEAD SPACE METHOD.................................... 25 ANNEX B: LABORATORY TESTS ON NON-MINERAL OILS ..................................................................................... 26 ANNEX C: DGA RESULTS OF WG15 IN LOAD TAP CHANGERS ............................................................................ 28

3
1 EXECUTIVE SUMMARY
1.1 Introduction Dissolved gas analysis (DGA) is widely used for detecting faults in insulating fluid-filled, high voltage electrical equipment in service. Historically, DGA has been applied mainly to trans-formers filled with mineral oils. This report presents progress made by WG D1.32 (WG32) concerning: -the application of DGA to non-mineral oils. -the application of DGA to load tap changers. -the effect of oil sampling on DGA results. -the use of DGA during heat-run tests on repaired or upgraded transformers. -gas losses from transformers of the open conservator-type. -stray gassing of passivated oils. -the use of DGA in continuously degassed transformers. -the formation of carbon oxides in mineral oil-filled transformers.
1.2 Application of DGA to non-mineral oils Non-mineral oils such as natural and synthetic esters are increasingly used for applications in transformers where less-flammable or environmentally-friendly oils are desirable. It has been evaluated by WG32 that the analytical techniques and interpretation methods used for min-eral oils can be used with some adjustments for non-mineral oils. On the analytical side, a significant difference concerns the partition coefficients used for cali-brating the Head Space method with standard gas mixtures. These coefficients are quite dif-ferent for non-mineral oils for some gases and are provided in this report at 20°C. The recommendation of WG32, however, is rather to calibrate the Head Space method with gas-in-oil standards, for both mineral and non-mineral oils. This does not require the knowl-edge of partition coefficients. Values of the solubility of air in the different oils are also indicated in this report. The interpretation of DGA results is basically the same as for mineral oils, and the small ad-justments to fault zone boundaries that are necessary for non-mineral oils are provided in this report. Non-mineral oils appear to be more stray gassing than mineral oils, and tools are provided to distinguish this stray gassing from more serious faults in service such as carbonization of paper. Typical concentration values in service are lower than with mineral oils, but this could be due to the relatively small number of DGA results available with non-mineral oils.
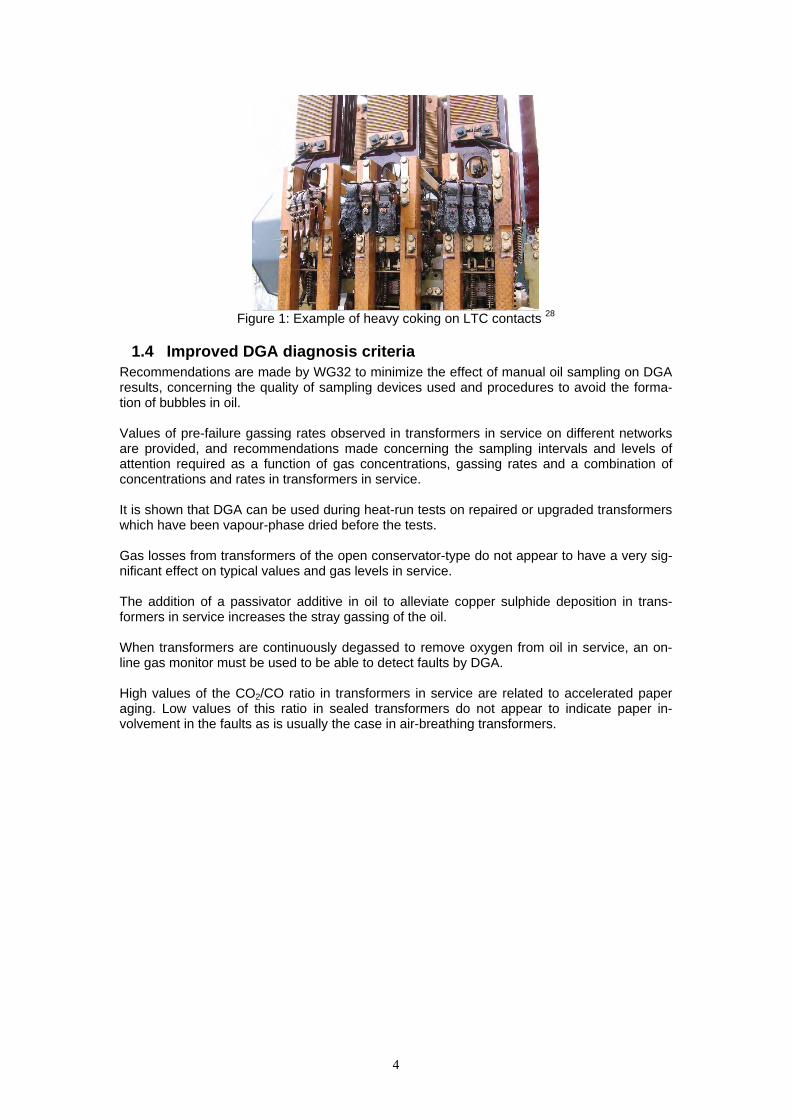
1.3 Application of DGA to load tap changers DGA is often considered as difficult to apply to load tap changers (LTCs) because normal operation of this equipment involves arc-breaking between LTC contacts and/or resistor heat-ing, which interferes with the identification of actual faults in the LTCs. This report provides interpretation methods allowing the detection of faults in LTCs where arc breaking occurs: - in oil (reactor and resistor types). - in vacuum (reactor and resistor types) - with commutation switches in the same or in separate oil compartments A more precise classification of LTCs is given in the report. Gas levels in LTCs depend very much on the number of operations. After a change of LTC oil, contamination by the previous oil must be taken into account before attempting a diagno-sis. An example of heavy coking on LTC contacts is shown in Figure 1.
4
Figure 1: Example of heavy coking on LTC contacts 28
1.4 Improved DGA diagnosis criteria Recommendations are made by WG32 to minimize the effect of manual oil sampling on DGA results, concerning the quality of sampling devices used and procedures to avoid the forma-tion of bubbles in oil. Values of pre-failure gassing rates observed in transformers in service on different networks are provided, and recommendations made concerning the sampling intervals and levels of attention required as a function of gas concentrations, gassing rates and a combination of concentrations and rates in transformers in service. It is shown that DGA can be used during heat-run tests on repaired or upgraded transformers which have been vapour-phase dried before the tests. Gas losses from transformers of the open conservator-type do not appear to have a very sig-nificant effect on typical values and gas levels in service. The addition of a passivator additive in oil to alleviate copper sulphide deposition in trans-formers in service increases the stray gassing of the oil. When transformers are continuously degassed to remove oxygen from oil in service, an on-line gas monitor must be used to be able to detect faults by DGA. High values of the CO2/CO ratio in transformers in service are related to accelerated paper aging. Low values of this ratio in sealed transformers do not appear to indicate paper in-volvement in the faults as is usually the case in air-breathing transformers.

5
2 INTRODUCTION Dissolved gas analysis (DGA) is among the most powerful tools for detecting faults in electri-cal equipment in service. For that reason, DGA analytical techniques and interpretation meth-ods are continuously being investigated and improved. CIGRE in particular has done a lot of work on DGA in the past decade. The new laboratory techniques of gas extraction developed during the late 90’s have been evaluated by Task Force TF 15.01.07 [1] and introduced into IEC Standard 60567 in 2005 [2]. The typical gas concentrations and rates of gas increase observed in transformers in service worldwide have been surveyed by Joint Task Force JTF D1.01/A2.11 (TF11) [3] and have been introduced into IEC Standard 60599 in 2007 [4]. TF11 has also made significant pro-gress concerning pre-failure concentrations in service, stray gassing of oils at relatively low temperatures, gas formation from paper, and gases trapped in paper insulation. In 2008, TF D1-01-15 (recently renamed WG.D1.15 then WG D1.32 or “WG32”) has prepared a CIGRE Brochure [5] on gas monitors, devices which are increasingly used to follow gas and fault formation in transformers on-line. The present document reports the findings of WG32 on the other subjects it has examined: -application of DGA to non-mineral oils and load tap changers. -pre-failure rates of gas increase in service and oil sampling for DGA. -heat-run tests on repaired transformers and on-line degassing. -solubility of gases in oils and carbon oxide formation in service. Note: superscripts in this report (from 1 to 27) refer to members of WG32 who made specific contributions to the report (unpublished data or concepts). The list of superscripts and corresponding authors can be found in section 9. References to published documents (from [1] to [21]), are listed in section 7.
3 APPLICATION OF DGA TO NON-MINERAL OILS Still today, most transformers and electrical equipment in service are filled with mineral oil. Non-mineral oils (such as natural and synthetic esters and silicone oils) are increasingly used, however, for special applications where less flammable or more biodegradable oils are desir-able (such as indoors, in urban areas or in railway transformers). The DGA analytical techniques and interpretation methods to use with such oils have been examined by WG32.
3.1 DGA analytical techniques for non-mineral oils It has been evaluated by WG32 that the same basic techniques used for mineral oils can also be used for non-mineral oils with a few adjustments. For the extraction of gases dissolved in oil, all the methods described in IEC 60567 [2] can be used (Toepler, Partial Degassing, Stripping, Head Space). A small adjustment in the case of non-mineral oils concerns the equilibrium time necessary for gas extraction. The more vis-cous the oil, the longer the equilibrium time, typically 10 to 15 minutes (or higher) for the more viscous silicone oils vs. 1 to 3 minutes for mineral oils (see section 7 of 60567 [2]). A more important adjustment concerns the calibration of the Head Space method with gas standards (section 7.5.5.2 of 60567 [2]). This procedure requires knowing the partition coeffi-cients of gases in oil, which are very different in mineral and non-mineral oils for several gases. Round robin tests have thus been organized by WG32 to determine the partition coefficients of gases in non-mineral oils, using the two head space methods recommended in IEC 60567 [2]: gas-in-oil standards and the slope/intercept method (section 7.5.5.3). Gas-in-oil standards have thus been prepared 4, 5, and analyzed by several experienced labo-ratories 2-5, 19, using the Head Space method. The corresponding partition coefficients k were

6
then calculated using equation (2a) of IEC 60567 [2] (section 7.5.5.3), with CL = known gas concentrations in the prepared gas-in-oil standard and CG = gas concentrations in the gas phase of the vials measured by gas chromatography. Examples of k values thus obtained for mineral oil are indicated in Table A1 of Annex A. The large dispersion of values suggests that the measurement of k values by head space is de-pendant on the analytical conditions used by individual laboratories and therefore not reliable. The same dispersion of results is observed with non-mineral oils. Laboratory procedures us-ing the Headspace method must establish partition coefficients related to the analytical equip-ment used. Partition coefficients also appear to be strongly dependant on gas concentrations, as illus-trated with mineral oils in Table A2 of Annex A 2. The same concentration dependence is ob-served with non-mineral oils 2. The poor reproducibility of head space extraction efficiency between laboratories, especially for the less soluble gases, has been proposed to explain this large dispersion of results 4. The non-linearity of the calibration curves used for the Head Space method at the phase ratios used in the vials, as shown for example in Figure A1 of Annex A5, may also be a reason for the unreliable values also obtained when using the slope/intercept method. As a result, the k values that have been published so far for non-mineral oils and determined by the head space method are uncertain and are not recommended for general use. A more direct and reliable method for the determination of partition coefficients has been de-veloped by WG32 4. It consists in bubbling in oil pure gases or 1% mixtures of these gases in air up to equilibrium, extracting these gases completely using Toepler or Partial Degassing with multiple cycles of vacuum extraction, then measuring the total volume of gas extracted. The k values thus obtained at equilibrium, also known as the solubility coefficients, are indi-cated at 20C in Table 1 for different types of mineral and non-mineral oils 4, using 1% mix-tures.
Table 1: Solubility/ partition coefficients k of gases in mineral and non-mineral oils at 20C 4
Gas: H2 O2 N2 CH4 CO CO2 C2H2 C2H4 C2H6 C3H6 Oil type: Mineral 0.0504 0.172 0.091 0.423 0.125 1.10 1.25 1.81 2.88 9.64 FR3 0.0471 0.134 0.074 0.341 0.108 1.54 2.58 1.67 2.14 7.46 Midel 0.0479 0.152 0.091 0.378 0.130 2.08 4.26 1.85 2.20 7.67 Silicone 0.0869 0.267 0.155 0.580 0.189 1.63 2.04 2.18 3.10 9.91
It has been observed 4 that k values may vary depending on the matrix of gases present in oil. For instance, with all types of oils they are 10% lower for hydrogen when using 1% mixtures of hydrogen in air rather than pure hydrogen. With silicone oils they are 8% lower for carbon monoxide. They also depend on the high or low levels of air, nitrogen or fault gases present in oils, and may thus be different in sealed and air-breathing equipment. They depend on the chemical composition of oils and are different in oxidized oils 6 and in the presence in oil of chemicals such as acetone 2,4-6. Calibrating the Head Space method with gas standards is thus considered by WG32 2,5 as not reliable because of this uncertainty on k values. The procedure recommended by WG32 2, 5 rather consists in using the calibration method described in section 7.5.5.1 of IEC 60567 [2] with several gas-in-oil standards at different concentrations. These oil standards can either be purchased or prepared in the laboratory according to section 6 of IEC 60567 [2]. With this procedure, k values do not need to be known. The determination of k values at 70C is in preparation4, for those who would still want to use the procedure of calibration of the Head Space method with gas standards, even though it is
7
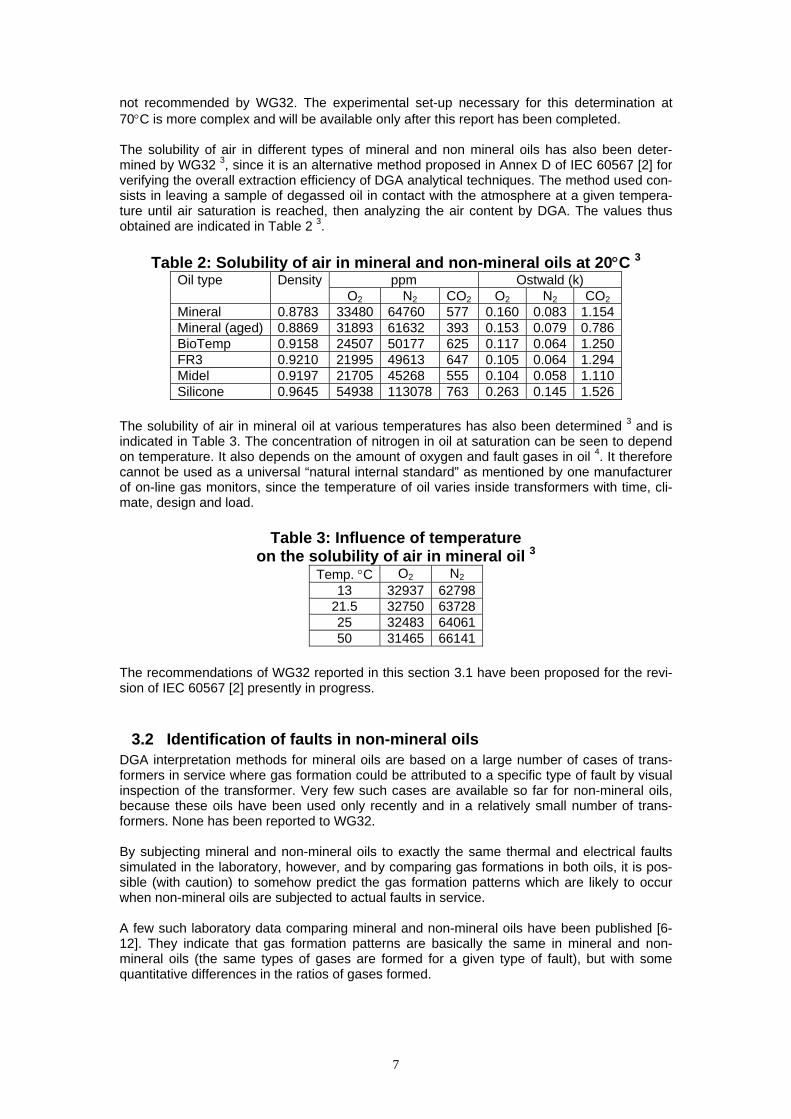
not recommended by WG32. The experimental set-up necessary for this determination at 70C is more complex and will be available only after this report has been completed. The solubility of air in different types of mineral and non mineral oils has also been deter-mined by WG32 3, since it is an alternative method proposed in Annex D of IEC 60567 [2] for verifying the overall extraction efficiency of DGA analytical techniques. The method used con-sists in leaving a sample of degassed oil in contact with the atmosphere at a given tempera-ture until air saturation is reached, then analyzing the air content by DGA. The values thus obtained are indicated in Table 2 3.
Table 2: Solubility of air in mineral and non-mineral oils at 20C 3 ppm Ostwald (k) Oil type Density
O2 N2 CO2 O2 N2 CO2 Mineral 0.8783 33480 64760 577 0.160 0.083 1.154 Mineral (aged) 0.8869 31893 61632 393 0.153 0.079 0.786 BioTemp 0.9158 24507 50177 625 0.117 0.064 1.250 FR3 0.9210 21995 49613 647 0.105 0.064 1.294 Midel 0.9197 21705 45268 555 0.104 0.058 1.110 Silicone 0.9645 54938 113078 763 0.263 0.145 1.526
The solubility of air in mineral oil at various temperatures has also been determined 3 and is indicated in Table 3. The concentration of nitrogen in oil at saturation can be seen to depend on temperature. It also depends on the amount of oxygen and fault gases in oil 4. It therefore cannot be used as a universal “natural internal standard” as mentioned by one manufacturer of on-line gas monitors, since the temperature of oil varies inside transformers with time, cli-mate, design and load.
Table 3: Influence of temperature on the solubility of air in mineral oil 3
Temp. C O2 N2 13 32937 62798
21.5 32750 6372825 32483 6406150 31465 66141
The recommendations of WG32 reported in this section 3.1 have been proposed for the revi-sion of IEC 60567 [2] presently in progress.
3.2 Identification of faults in non-mineral oils DGA interpretation methods for mineral oils are based on a large number of cases of trans-formers in service where gas formation could be attributed to a specific type of fault by visual inspection of the transformer. Very few such cases are available so far for non-mineral oils, because these oils have been used only recently and in a relatively small number of trans-formers. None has been reported to WG32. By subjecting mineral and non-mineral oils to exactly the same thermal and electrical faults simulated in the laboratory, however, and by comparing gas formations in both oils, it is pos-sible (with caution) to somehow predict the gas formation patterns which are likely to occur when non-mineral oils are subjected to actual faults in service. A few such laboratory data comparing mineral and non-mineral oils have been published [6-12]. They indicate that gas formation patterns are basically the same in mineral and non-mineral oils (the same types of gases are formed for a given type of fault), but with some quantitative differences in the ratios of gases formed.

8
Figure B1 of Annex B indicates the differences observed between mineral oil and 4 different types of non-mineral oils. They occur mostly in the T1-T3 zones of thermal faults. From these differences, it is possible [13] to adjust zone boundaries for each type of non-mineral oil as indicated in Figure 1 and Table 4. Values in brackets in Table 4 are extrapolated and will need to be confirmed in the future. These zone boundaries for non-mineral oils, based on laboratory comparisons with mineral oils, may need some further adjustments when actual cases of faults are reported in transformers in service. Until then they can be used by default. Fault zones in Figure 1 are the same as in the classical Duval Triangle for mineral oil: PD = Corona Partial discharges; D1 = Discharges of low energy; D2 = Discharges of high energy; T1 = Thermal faults of temperature < 300ºC; T2 = Thermal faults of temperature 300ºC < T < 700ºC; T3 = Thermal faults of temperature > 700ºC; DT = mixtures of electrical and thermal faults.
Silicone Midel
FR3 BioTemp
Figure 1: Identification of faults in non-mineral oils
Table 4: Fault zone boundaries for non-mineral oils (when different from mineral oils), in % C2H4
Boundary between zones:
Mineraloils
Silicone Midel FR3 BioTemp
D1/ D2 23 9 26 25 20 T1/ T2 20 16 39 43 52 T2/ T3 50 (46) (68) 63 (82)
Pyrolysis tests of the T3-type on mineral and non-mineral oils have also been performed at 700 and 1200 °C by WG32 7 and are indicated in Table B1 of Annex B. They suggest that some small additional adjustments to the T2/T3 zone boundaries of Figure 1 may be neces-sary in the future, when inspected cases of such faults in transformers become available.

9
Laboratory test results should be used only with caution to predict the actual temperature of faults in transformers in service, because faults in transformers are more complex than faults in the laboratory in terms of paper-to-oil ratios involved, temperature gradients around the fault, and oil convection. It has thus been observed with mineral oils (in Figures 3-5 of ref. [14]) that the same gas for-mation pattern may be related to different temperatures: -measured in laboratory tests in oil only. -measured in laboratory in paper only -actually observed in transformers by visual observation of the damage done. The actual temperature of insulation decomposed to form gases during laboratory tests may also be different from the measured temperature, because of temperature gradients. When comparing two different oils (mineral and non-mineral oil) under exactly the same ex-perimental conditions in the laboratory, however, it is not necessary to know for sure these actual temperatures. Some non-mineral oils such as natural esters (e.g., FR3) are more stray gassing than mineral oils, producing significant amounts of gases such as hydrogen and ethane at relatively low temperatures of 90 to 200C [12] which are considered only as mild overheating. Such stray gassing can be distinguished from more severe overheating or carbonization of paper by us-ing the Triangle for low temperature faults in FR3 [15], indicated in Figure 2. Fault zones in Figure 2 are identified as: S = Stray gassing of FR3; C = Hot spots with car-bonization of paper (T >300°C); O = Overheating (T < 250°C).(zone PD = Corona Partial Dis-charges which occurs in the right upper part of the Triangle is not indicated in Figure 2).
Figure 2: Identification of stray gassing in FR3 oils
with the Triangle for low temperature faults The higher stray gassing tendency of FR3 has tentatively been related to its higher viscosity 3 or to the additives it contains 8. Very little stray gassing, however, has been observed at 250°C with silicone oils 5, despite their high viscosity.
3.3 Typical concentration values in non-mineral oils Evaluating typical concentration values in transformers filled with non-mineral oils requires data banks of DGA results in service with such oils. Very few such data have been made available to WG32. The 90% typical concentration values reported for non-mineral oils are indicated in Table 5. They appear to be lower than for mineral oil, possibly because it takes higher temperatures to form gases with such oils, or because too few data are available so far to be really represen-tative of their actual behaviour in service.

10
Table 5: Examples of 90% typical concentration values observed in non-mineral oils
Ref. Oil type Network Traction H2 CH4 C2H4 C2H2 C2H6 CO CO2 Population[4] Mineral X 100 80 170 3 55 500 8900 > 20,000 22 Midel X 37 68 70 1 50 1148 4120 138 1 FR3 X 35 12 12 1 20 400 3000 180 14 BioTemp X 41 7 5 1 4 199 38 2 Silicones X 25 28 1 1 0 405 2614 25 2 Midel X 21 7 9 2 2 201 1536 38
3.4 Gas formation in hybrid systems Only inconclusive laboratory DGA data concerning the decomposition of the high tempera-ture-grade papers and boards (aramid based papers and boards such as Nomex®) used in “hybrid systems have been reported to WG32 7, 5. Pyrolysis testing without the presence of oxygen indicated that up to 250°C only water is de-tected (equal to the moisture regain of the paper and board). Between 250°C and 350°C a small amount of DMAc (dimethyl acetamide) can be detected. The DMAc is from the manu-facturing process and is not a degradation product. Degradation (under pyrolysis) of the ara-mid paper and board occurs between 450°C and 1000°C with major components being CO2 and high molecular weight hydrocarbons 7. 4 APPLICATION OF DGA TO LOAD TAP CHANGERS A high percentage of transformer failures are due to load tap changer (LTC) failures. How-ever, because of the interference of gases produced by the normal operation of LTCs, DGA has long been considered as difficult to apply to LTCs, or even as not applicable to some types of LTCs [16]. To be able to detect abnormal faults in LTCs by DGA, their normal operation must first be identified precisely. Depending on the electrical components used and their operating condi-tions in service, normal operation in oil may involve various combinations of arcing between contacts and/or heating in transition resistors.
4.1 Classification of LTCs according to electrical components used and type of design
To evaluate the gas generation of tap-changers, it is necessary to distinguish between the different tap-changer types which are worldwide in service. The following classification of LTCs has been proposed 12 and is indicated in Table 6.
11
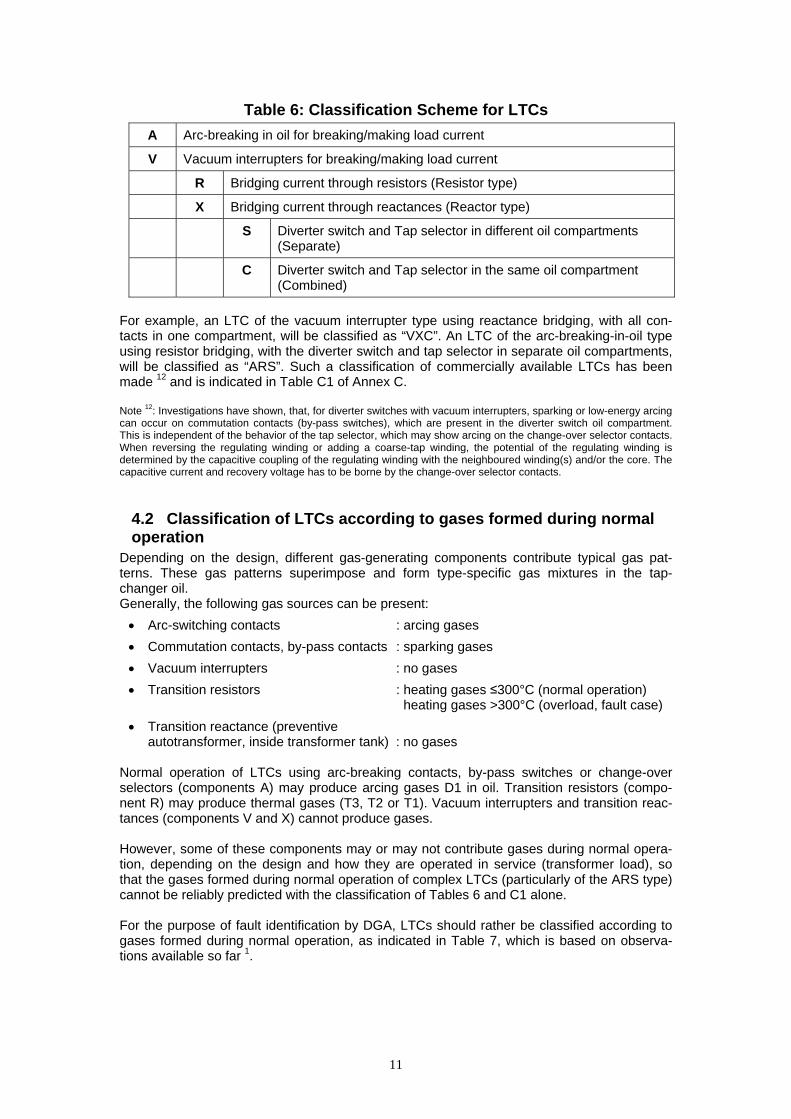
Table 6: Classification Scheme for LTCs
A Arc-breaking in oil for breaking/making load current
V Vacuum interrupters for breaking/making load current
R Bridging current through resistors (Resistor type)
X Bridging current through reactances (Reactor type)
S Diverter switch and Tap selector in different oil compartments (Separate)
C Diverter switch and Tap selector in the same oil compartment (Combined)
For example, an LTC of the vacuum interrupter type using reactance bridging, with all con-tacts in one compartment, will be classified as “VXC”. An LTC of the arc-breaking-in-oil type using resistor bridging, with the diverter switch and tap selector in separate oil compartments, will be classified as “ARS”. Such a classification of commercially available LTCs has been made 12 and is indicated in Table C1 of Annex C. Note 12: Investigations have shown, that, for diverter switches with vacuum interrupters, sparking or low-energy arcing can occur on commutation contacts (by-pass switches), which are present in the diverter switch oil compartment. This is independent of the behavior of the tap selector, which may show arcing on the change-over selector contacts. When reversing the regulating winding or adding a coarse-tap winding, the potential of the regulating winding is determined by the capacitive coupling of the regulating winding with the neighboured winding(s) and/or the core. The capacitive current and recovery voltage has to be borne by the change-over selector contacts.
4.2 Classification of LTCs according to gases formed during normal operation
Depending on the design, different gas-generating components contribute typical gas pat-terns. These gas patterns superimpose and form type-specific gas mixtures in the tap-changer oil. Generally, the following gas sources can be present:
Arc-switching contacts : arcing gases
Commutation contacts, by-pass contacts : sparking gases
Vacuum interrupters : no gases
Transition resistors : heating gases ≤300°C (normal operation) heating gases >300°C (overload, fault case)
Transition reactance (preventive autotransformer, inside transformer tank) : no gases
Normal operation of LTCs using arc-breaking contacts, by-pass switches or change-over selectors (components A) may produce arcing gases D1 in oil. Transition resistors (compo-nent R) may produce thermal gases (T3, T2 or T1). Vacuum interrupters and transition reac-tances (components V and X) cannot produce gases. However, some of these components may or may not contribute gases during normal opera-tion, depending on the design and how they are operated in service (transformer load), so that the gases formed during normal operation of complex LTCs (particularly of the ARS type) cannot be reliably predicted with the classification of Tables 6 and C1 alone. For the purpose of fault identification by DGA, LTCs should rather be classified according to gases formed during normal operation, as indicated in Table 7, which is based on observa-tions available so far 1.

12
Table 7: Classification of LTCs
according to gases formed during normal operation
LTC type Main gases formed during
normal operation
Classification acc. to Table 6 Compartment
type In-tank
type Arcing
D1 Thermal T3/T2
ThermalT1
AXC, AXS X X
ARC, ARS X X
ARS type 1 X X (X)
ARS type 2 X X
ARS type 3 X (X) (X)
Arc-breaking-in-oiltype
ARS type 4 X X X
VXC X
VRC X (X) (X) Vacuum
type VRS X (X) X
(X): depending on the mode of operation Compartment types indicated in Table 7 correspond to LTCs with similar gas formation during normal operation and manufactured for example by ABB, Allis Chalmers, Cooper, Federal Pioneer, GE, McGraw Edison, Moloney, Reinhausen, Siemens, Waukesha and Westinghouse. In-tank types indicated in Table 7, as an example, correspond to LTCs of the OILTAP® and VACUTAP® series manufactured by Reinhausen. Gas amount and gas composition depend on additional parameters, like:
Number of operations/day
Actual percentage load of the transformer
Stray gassing behaviour of the oil
Venting system (sealed/not sealed)
However, these will not significantly change the classification of Table 7.
4.3 Fault identification in LTCs
4.3.1 LTCs of the arc-breaking-in-oil compartment type A large majority of the LTCs presently in operation are used in North America and are of the arc-breaking-in-oil compartment type (“conventional oil type”), as indicated in Table 7 (AXC, AXS, ARC and ARS). Specific methods of interpretation of DGA in these LTCs have been developed, such as the Stenestam code 14, the C2H4/C2H2 ratio and the Triangle method [13]. The coloured dots in Figure 3 using the Triangle method correspond to actual cases of faults or normal operation inspected in service in LTCs of these types. The experience so far is that LTCs of the conventional oil-types have very similar gassing behaviour during normal operation, suggesting that the resistors used in LTCs of these ARC and ARS types do not contribute significantly to gassing during normal operation.

13
: Normal operation; : Severe coking; : Light coking;
: “Heating”; : Strong arcing D2; : Arcing D1
Figure 3: Identification of faults in LTCs of the arc-breaking-in-oil compartment type (conventional oil type)
Fault zones in Figure 3 are: N = Normal operation of the LTC; T3 = Severe thermal faults of temperature > 700 ºC; T2 = Severe thermal faults of temperature 300 ºC < T < 700 ºC; X3 = fault T3 in progress (in a majority of cases), or abnormal severe arcing D2; D1 = Abnormal arcing D1; X1 = possibly thermal fault T1 (T < 300 ºC) in progress. The normal operation zone N indicated in Figure 3 applies to all LTCs of the conventional oil-types monitored by DGA so far. For specific individual types of such LTCs, the actual size of the N zone is usually smaller and should preferably be determined first in order to more pre-cisely detect cases of abnormal operation occurring outside of the N zone. In zone X3, to distinguish between faults T3 in progress and abnormal arcing D2, it is sug-gested to change the oil and run a few LTC operations (~ 100). If the DGA point moves to-wards the N zone, this may indicate a fault T3 in progress, since it takes some time for tem-perature to rise to T3 levels on LTC contacts. If the DGA point remains unchanged, it is more likely abnormal arcing D2. The Triangle method of Figure 3 has been applied to DGA data in LTCs of the conventional oil-types provided by members of WG32. Results are indicated in Figure C1 of Annex C. They confirm the attribution of fault zones in Figure 3. Two examples of gas formation change with time in service are indicated in Figure C2 of Annex C. 4.3.2 LTCs of the arc-breaking-in-oil in-tank type ARS The normal operation of LTCs of the ARS in-tank type may involve arc-breaking-in-oil but also current dissipation in the transition resistors [16]. Depending on the design of the contact sys-tem, actual load current and dimensioning of transition resistors, arcing gases or/and thermal gases may be formed, as can be seen in Table 7. For example 1, as indicated in Figure C3(a) of Annex C, normal operation of LTCs of the in-tank ARS type 1 is observed first in the N (arcing) zone of Figure 3, then moves slowly to-wards the thermal zone T1, due to heating of oil at relatively low temperatures. Two examples of gas formation change with time in LTCs of the in-tank ARS type 1 are indi-cated in Figure C4 of Annex C. Gas formation moving towards the T1 zone after an oil change corresponds to normal operation according to Figure C3(a) of Annex C, while gas formation moving towards the T3 zone might indicate some overheating.

14
In Figure C3(b) of Annex C, the normal operation of LTCs of the in-tank ARS type 2 involves heating of the resistors at high temperatures, so that their normal operation occurs in the lower part of zones T3 and X3. 4.3.3 LTCs of the vacuum type VXC In LTCs of the vacuum reactor VXC type, normal operation involves only arc-breaking in a vacuum bottle. The change-over selector in the oil of such LTCs operates very seldom 12 and is not expected to contribute arcing gases in oil, or only very low insignificant amounts. Any significant gas formation in the surrounding cooling oil therefore indicates some abnormal behaviour of the LTC (electrical or thermal), which can be identified using the same methods as for transformers, e.g., the general Triangle for transformers filled with mineral oils indicated in Figure C5 of Annex C. Gas levels in the oil of such LTCs are usually very low. Figure C5 of Annex C also indicates a few cases of abnormal operation in such LTCs, which are mostly located in the thermal fault zones (T2, T3), with indeed no arcing gases observed. 4.3.4 LTCs of the vacuum types VRC and VRS Normal operation of LTCs of the VRC and VRS types may involve current heating through transition resistors and/or sparking of commutation contacts (by-pass switches) immersed in the surrounding cooling oil 12. In such LTCs, thermal and/or arcing gases may thus be formed during normal operation, as indicated in Table 7, and this appears to depend very much on the mode of operation of these LTCs. For example, the gassing behaviour of two LTCs of the vacuum in-tank type VRC 12 is indi-cated in Figure C6 of Annex C. In service (Figure C6a of Annex C), normal operation occurs mostly in the N zone of Figure 3, suggesting that only sparking of the commutation contacts is involved, with no significant contribution from the resistors 1. During power switching tests in the factory 12, however, normal operation occurs in the T2/DT zone (Figure C6b of annex C), suggesting that mostly heating of the resistors is involved, at relatively high temperatures T2, with only a minor contribution of the commutation contacts. Only the last part of the normal operation curve in blue is significant (gas levels are low and unreliable in the first parts). In Figure C7 of Annex C, the normal operation of LTCs of the vacuum in-tank type VRS also occurs in the T2/DT zone 1, 12.
4.4 Gas levels in LTCs A relatively constant amount of gas, which depends on the type of LTC, is formed per LTC operation during the normal operation of LTCs, as illustrated in Table 8 (in ppm of total dis-solved combustible gases). Significantly larger amounts are formed in the case of abnormal operation. Looking at gas levels in service without taking into account the number of operations may therefore be misleading. Furthermore, the number of operations is seldom available from LTC operators.
Table 8: Examples of normal gas formation per LTC operation
Ref. LTC type ~ ppm/1000 operations1 AXC and ARC 500 1, 12 VXC 0 -10 12, 1 ARS 6000 12, 1 VRC and VRC 10-30

15
4.5 Minimum gas concentrations for attempting diagnosis in LTCs Identification of faults in LTCs should be attempted only when gases in oil are above a mini-mum level (~ >10 ppm of C2H2 and/or C2H4), because of laboratory uncertainty at low gas levels [17]. Furthermore, for LTCs where the oil has been removed and replaced by new oil, contamina-tion by the previous oil may occur, especially if the LTC has been subjected to a large number of operations 1. The amount of oil left on LTC surfaces after changing the oil has been evalu-ated at about 0.16% 6, and should be taken into account to determine the minimum level of gases above which this oil leftover may interfere with diagnosis. For example, if concentration of a gas in the previous oil was 10,000 ppm, only levels of this gas above 16 ppm in the new oil should be used for diagnosis. 5 IMPROVED DGA DIAGNOSIS CRITERIA
5.1 Oil sampling for DGA
It has been suggested, based on systematic differences between readings of some on-line gas monitors and the corresponding laboratory results, that manual oil sampling could lead to losses of gases from the oil (particularly the less soluble ones like H2 and CO), and/or con-tamination of the oil with oxygen or air (in sealed equipment). A survey has thus been organized by WG32 to investigate if and how oil sampling actually affects DGA results. The most frequently mentioned concerns related to oil sampling are the lack of training or experience of sampling personnel, standard sampling procedures not fol-lowed properly, need for more detailed sampling procedures, use of poor quality sampling equipment, formation of gas bubbles in syringes and contact of oil in bottles with atmospheric air when sampling. It has been found by WG32 that bubbles are observed on average in only 20% of syringes received by laboratories, and large bubbles (of more than 0.3 ml or 5 divisions in a 25 ml sy-ringe) in 2% of cases. These percentages are lower for some laboratories and higher for oth-ers, which would need to improve their sampling skills. The matter of bubbles in syringes therefore is not a general sampling problem but one limited to a relatively small number of laboratories. Using good-quality syringes with matched piston and barrel, priming the piston with clean oil before sampling and using well-trained and experienced sampling personnel are recommended by WG32 to avoid gas bubbles in syringes. Gas bubbles in syringes do not affect DGA results using the Toepler and Partial Degassing methods, since the bubbles are injected in the extraction vessel with the oil. With the Head Space method, however, the bubbles are not injected with the oil and gas losses by diffusion from the oil to the gas bubbles should be calculated. A similar correction should be made for the air gap left in rigid (glass or metallic) bottles used for sampling for DGA. Examples of calculated and measured gas losses from oil to bubbles of two different sizes (small and large) in syringes are indicated in Table 9 4. The air gap left in rigid sampling bot-tles is the equivalent of a medium-sized bubble in syringes.
Table 9: Gas losses (in %) from oil to bubbles in syringes 4 Bubble
size Syringe divisions
Bubble volume, ml
H2 CO C2H2
small 1 0.05 -3 -1 -0.1 large 5 0.3 -15 -6 -1

16
H2 losses have been found to be higher when the syringe has its tip 30° down and the gas bubble is in contract with the piston of the syringe 3. Gas losses are also higher in case of an air bubble in air-saturated oil, since the bubble cannot redissolve in oil 3. In the absence of a gas bubble in oil, no significant gas loss from the oil is measured after a few weeks of storage of the syringe in darkness 4. Bubbles are often formed in syringes (and probably also in sampling bottles) when oil tem-perature in the transformer is high 8. Placing the syringe in its protective box in the vertical position, standing on the piston and with the syringe tip upwards, until the oil has slowly cooled down, efficiently prevents such bubble formation 1. Bubbles are also formed during air transportation of oil samples because of the reduced pres-sure inducing over-saturation of air or nitrogen in oil. Specially sealed boxes have been de-veloped to eliminate this problem 4. Appropriate septa of the butyl rubber type should be used with vials 2, 27, since silicone septa are not gas-tight 2, 21. No gas losses or air contamination have been observed when using 3-way plastic valves on syringes 4, 10. It has been reported 3 that dissolved gases reach the bottom oil much more rapidly than usu-ally assumed, and therefore that DGA results obtained from this location are in general quite representative, except in cases of very rapid gas formation. The recommendations of WG15 in this section 5 have been proposed for the revision of IEC 60567 [2] presently in preparation.
5.2 Gas levels in service The 90% typical gas concentrations (TGC) and typical rates of gas increase (TRGI) observed in power transformers in service have been determined previously by CIGRE JTF D1.01/A2.11 (TF11) [3]. Since then, it was reported to WG32 10 that in UK TGC values are lower because transform-ers are operated at only 60% of nominal load, resulting in lower operating temperatures and therefore less gassing in service. Similarly, in Belgium TGC values are higher 19, probably because transformers there are mostly of the shell-type. The oil to paper ratio is lower in such equipment, so that the same amount of gases formed is dissolved in a smaller volume of oil, resulting in higher typical values in ppm. Above typical values, it is recommended in IEC 60599 [4] to increase the frequency of oil sampling for DGA. Pre-failure gas concentrations (PFGC) in service have also been determined by TF11. PFGC values are the values above which the probability of having a failure-related event in service (such as fault gas alarm, tripping or failure requiring repairs or replacement) increases dramatically. They were found by TF11 to be surprisingly close on different network, suggest-ing that failure occurs when a critical amount of insulation is destroyed [3]. The pre-failure rates of gas increase (PFRGI) in service have similarly been determined by WG32 1, 3, 6 and are indicated in Table 10 (“NS” means that no PFRGI values are observed in service for these gases). They are also observed to be surprisingly close on different net-works, and relatively similar in sealed and air breathing equipment.
Table 10: Pre-failure rates of gas increase in service, in in μl/l /day Ref. C2H2 H2 CH4 C2H4 C2H6 CO CO2
1 0.5 3 5 5 11 NS NS 6 0.3 1.3 4.6 3.9 8.8 NS NS 3 0.2 3.3 2.5 1.4 7.9 NS NS

17
In-between typical and pre-failure values, it is possible to calculate the oil sampling intervals and levels of attention required as a function of gas concentration and rate of gas increase in service [18]. For gas concentrations, the extrapolation method used is illustrated in Figure 4 and the numerical values are given in Table 11. The curve and values for CO2 were obtained by analogy with those of total dissolved combustible gases (TDCG), since no PFGC value is observed for this gas. For rates of gas increase, numerical values are given in Table 12. The corresponding curves can be obtained by replacing the typical and pre-failure concentrations of Figure 6 by the typi-cal and pre-failure rates of gas increase given in Table 10. The curves and values for CO and CO2 were obtained by analogy with those for TDCG since no PFRGI values are observed for these gases. Typical values in Tables 11 and 12 are the average values surveyed by TF11. The actual ranges of individual typical values on different networks are indicated in [3-4]. To calculate rates of gas increase in service, more than two successive DGA concentration values should preferably be used for a better accuracy [17].
Figure 4: Oil sampling intervals versus gas concentrations
in CIGRE power transformers in service
Table 11: Oil sampling intervals versus gas concentrations in CIGRE power transformers in service, in μl/l
Concentration H2 CH4 C2H4 C2H6 C2H2 CO CO2 TDCG Sampling intervals
Typical 100 80 170 55 3 500 8900 908 Yearly
Level 2 180 129 270 126 13 766 14885 1542 Monthly Level 3 254 170 352 205 32 983 20084 2101 Weekly Level 4 403 248 505 393 102 1372 29980 3175 Daily
Pre-failure 725 400 800 900 450 2100 50000 5380 Hourly

18
Table 12: Oil sampling intervals versus rates of gas increase
in CIGRE power transformers in service, in μl/l/year Rate H2 CH4 C2H4 C2H6 C2H2 CO CO2 TDCG Sampling
intervals Typical 83 65 89 47 2 660 5850 946 Yearly
Level 2 179 175 218 176 7 1737 15382 2539 Monthly Level 3 280 313 369 382 17 3054 27012 4513 Weekly Level 4 509 679 745 1074 47 6491 57351 9738 Daily
Pre-failure 1095 1825 1825 4015 182 17000 150000 26000 Hourly It may happen in service that different oil sampling intervals and levels of attention are re-quired by gas concentrations and by rates of gas increase. In such cases, the oil sampling intervals and levels of attention corresponding to a combination of concentrations and rates can be used, as indicated in Table 13 1.
Table 13: Oil sampling intervals versus a combination of rates of gas increase and gas concentrations in CIGRE power transformers in ser-
vice 1 Sampling intervals based on combined
gas rate levels and gas concentration levels Gas ratelevel #
Gas conc. level #
Daily Weekly Monthly Quarterly Yearly
4 4 X 4 3 X 4 2 X 4 1 X 3 4 X 3 3 X 3 2 X 3 1 X 2 4 X 2 3 X 2 2 X 2 1 X 1 4 X 1 3 X 1 2 X 1 1 X
Values in Tables 11-13 correspond to the average typical values observed by CIGRE in trans-formers worldwide and can be used by default. Typical values on individual networks may be slightly different, however, depending on operating conditions, types of transformers used and climate. Individual networks are therefore encouraged to calculate their actual typical values in service as indicated in [18], and to use them in Tables 11-13 instead of the average CIGRE typical values.
5.3 Heat run tests on repaired transformers Factory acceptance tests (heat-run tests) are routinely performed on newly-built transformers, and maximum gas formation limits during these tests have been specified in IEC 61181 [19].

19
The use of DGA during heat-run tests on repaired or refurbished transformers is not recom-mended in 61181 [19], for fear that gases trapped in paper insulation before repair may inter-fere with gases formed during the tests. However, since such tests are quite useful and actu-ally used to evaluate if the transformers have been repaired correctly, they have been revis-ited by WG32. DGA results after heat-run tests on a number of repaired or upgraded transformers 3,5 is indi-cated in Table 14. All transformers had been vapour phase-dried before the tests. Before tests # 10 and 11, new windings had been installed. Tank and radiators were upgraded be-fore tests # 1-9. CO2 could not be measured during tests # 1-9 because of analytical calibra-tion problems. Gas formation during the tests remains below the limits of 61181 [19], meaning that any gases left in transformers after repair do not interfere with the tests, and therefore that heat-run tests can be used for repaired transformers, provided they have been vapour-phase dried before the tests.
Table 14: Gas formation after heat run tests on repaired transformers, in ppm/ hour
H2 + Cn CO CO2 IEC 61181
gas limits:
0.1-1.6
0.4-2
5-18Passes
test Gassing back
in service Ref. Transf. # ::
1 0.08 0.17 - x 2 0.25 0 - x 3 0 0.04 - x 4 0.04 0.37 - x x 5 0.70 0 - x x 6 1.70 0 - x 7 0.12 0.37 - x x 8 0.29 1 - x x
5
9 0.50 0 - x x 10 0.31 2.63 3.56 3
11 0.33 1.92 3.08 x This lack of interference is possibly due to the fact 5 that the test duration is short as com-pared to the time needed for gases left in the repaired transformers to diffuse out of paper. The accuracy of DGA results during factory acceptance tests, a concern of CIGRE A2 9, has been evaluated by IEC 61181 [19] as acceptable if analytical procedures are followed cor-rectly.
5.4 Gas losses from transformers of the conservator-type Gas losses from transformers of the open conservator-type are often assumed to be higher than from transformers of the sealed-type, because of the diffusion of gases from the oil to the conservator and from there to the atmosphere. Typical gas concentrations in the two types of transformers, however, have been observed by TF11 to be quite similar [3], suggesting that gas losses in transformers of the air breathing-type may not be as high as thought. This has been investigated by WG32 11, using a de-energized transformer of this type con-taining significant amounts of fault gases, and following the decrease of gas content in oil during several months with an on-line Transfix monitor. The results are indicated in Table 15.

20
Table 15: Gas losses from a de-energized transformer
of the conservator-type 11 Initial conc. in
Gas losses in:
ppm ppm/year %/month
H2 75 52 6 CH4 370 520 12 C2H4 810 780 8 CO2 1,600 1210 6
Gas losses are proportional to the initial gas concentration in oil, which is consistent with the general laws of mass transfer. They are of about 10 % per month on average, and it takes about one year for gases to escape totally from the transformer. A possible reason for these lower than expected gas losses is that diffusion of gases though the very long (more than 1 m) piece of piping connecting the main tank to the conservator is very slow (a few cm per day). When the transformer is in operation, temperature variations between day and night transfer some volume of oil back and forth between the tank and the conservator, because of oil ex-pansion/contraction. Only about 1 % of the total oil volume is involved in such transfers, how-ever, (based on a 15°C difference between day and night and a coefficient of oil expansion of 0.00078 ml/ml/°C), which corresponds to about 15 % per month (assuming that half of dis-solved gases in the conservator are lost to the atmosphere during the day) 1. This is only marginally higher than the losses by diffusion indicated above. According to this calculation, above the typical rates of gas increase of Table 12 [4] gas losses are compensated by gas formation. They indeed do not appear to have a very signifi-cant impact on typical values and gas levels in service [3]. However, actual losses may be higher than calculated above because of thermo-siphon effects in oil 14, and would need fur-ther experimental investigation. In a transformer equipped with a membrane in the conservator, it has been observed 14 that the loss of H2 was about 2% per month, which will not affect the typical values observed in such equipment in service.
5.5 Stray gassing of passivated oils Metal passivator additives are routinely added to transformers filled with oils containing corro-sive sulphur compounds such as DBDS, in order to alleviate potential problems of copper sulphide deposition in paper in service. It has been suggested that passivated oils are more stray gassing than non-passivated ones, possibly interfering with DGA diagnosis. Stray gas-sing is the unexpected gassing of oil at relatively low temperatures of 90 to 200°C [3].This has been investigated by WG32. It was found 3 that if the transformer has been filled with passivated oil from the beginning, very little or no stray gassing is observed. If passivator is added to a non-passivated oil al-ready in a transformer for some time, increasing amounts of H2 and CO are formed, in corre-lation with the decrease in passivator content in the transformer. Gas formation occurs in the stray gassing zone of mineral oils, and might be due to the degradation of the passivator 3. A steep increase in the formation of H2 has also been observed 6 when the amount of pas-sivator additive starts to decrease in oil as a result of oxidation. Significant increases in H2 formation have also been observed at higher contents of passivator additives (500 ppm) 11. Further investigations on the use of passivator and associated effects have been started in 2009 within CIGRE SC A2 (WG A2 40).

21
5.6 On-line continuous degassing of transformers Some transformer users 11 favour the on-line continuous degassing of free-breathing trans-formers in order to reduce the oxygen content of oil and therefore the long-term degradation of paper and oil. Others 3, 14, 16 consider that this will result in the loss of DGA diagnosis and therefore is not advisable. Using an on-line gas monitor appears to somehow alleviate this concern 1. It has been shown (see Fig.11 of [20]) that new faults can thus be detected as spikes on the continuous back-ground of dissolved gases, allowing to calculate the rate of fault gas formation and to identify the type of fault. Information about the accumulated gas concentrations formed, however, will likely be lost. Further investigation would be needed, however, to evaluate the accuracy of such a calculation. An alternative to continuously degassing is of course to use transformers with air preservation systems (nitrogen blankets or membranes).
5.7 Formation of carbon oxides in transformers It has previously been shown by TF11 (see Table 19 of ref. [3]) that CO2/CO ratios of 20 to 50 are formed when overheating prototype transformers at 160 to 130C, respectively. Additional observations made by WG32 2 indicate that there is a correlation in transformers in service between degrees of polymerization of paper DP of 200 to 400, CO2/CO ratios in oil of 20 to 55, respectively, and high concentrations of CO2. The distribution of CO2/CO ratios in open and closed-type transformers for different types of applications (distribution, transmission, generation and power level) on different networks has therefore been evaluated by WG32 1, 3, 8 and is indicated in Table 16.
Table 16: Distribution of CO2/CO ratios on different networks Ref.: 1 3 8
Open x x x x Closed x x x x x
CO2/CO: % of DGA cases: > 50 2 1 1 1 0 0 8 4 17
50-20 10 1 5 9 9 5 15 18 25 20-4 80 95 88 83 87 81 63 64 48 < 4 10 3 5 7 4 15 14 14 8
High CO2/CO ratios (>20) are observed mostly in the closed-type transformers of one net-work. There is no correlation between high ratios and the amounts of the other hydrocarbon gases formed. On the other hand, it has been pointed out 2 [21] and confirmed 5, 20, 16 that low values of the CO2/CO ratio (<3) are often observed in sealed transformers, which do not appear to be re-lated to an actual fault or to paper involvement as indicated in IEC 60599 [22] for mostly air-breathing equipment. This will have to be investigated further by WG32 and indicated in the IEC document when it comes under revision 2.

22
6 CONCLUSIONS
6.1 Application of DGA to non-mineral oils It has been evaluated by WG32 that the analytical techniques and interpretation methods used for mineral oils can be used with some adjustments for non-mineral oils. The partition coefficients used for calibrating the Head Space method with standard gas mix-tures are significantly different for non-mineral oils. The recommendation of WG32, however, is rather to calibrate the Head Space method with gas-in-oil standards, which does not require the knowledge of partition coefficients, for both mineral and non-mineral oils. The small adjustments to fault zone boundaries which are necessary for non-mineral oils are indicated in this report, as well as tools to distinguish the stray gassing of some non-mineral oils from more serious faults in service. Typical concentration values in service appear to be lower than for mineral oils.
6.2 Application of DGA to load tap changers Interpretation methods are provided in this report for the detection of faults in LTCs where arc breaking occurs: - in oil (reactor and resistor types). - in vacuum (reactor and resistor types) - with commutation switches in the same or separate oil compartments After a change of oil in the LTC, contamination by the previous oil must be taken into account before attempting a diagnosis.
6.3 Improved DGA diagnosis criteria Recommendations are proposed to minimize the effect of oil sampling on DGA results (quality of sampling devices used and procedures to avoid the formation of bubbles in oil). The pre-failure gassing rates observed in transformers in service are indicated in this report, as well as recommendations concerning the sampling intervals and levels of attention re-quired as a function of gas concentrations and gassing rates in service. DGA can be used during heat-run tests on repaired or upgraded transformers which have been vapour-phase dried before the tests. Gas losses from transformers of the open conservator-type do not appear to have a very sig-nificant effect on typical values and gas levels in service. The addition of a passivator additive in oil to alleviate copper sulphide deposition in trans-formers in service increases the stray gassing of the oil. DGA can be used to detect faults in continuously degassed transformers in service only with the help of an on-line gas monitor. High values of the CO2/CO ratio in transformers in service appear to be related to accelerated paper aging and are observed mostly in transformers of the closed-type. Low values of this ratio in sealed transformers do not necessarily indicate paper involvement in the faults as in the case of air-breathing transformers.

23
7 REFERENCES [1] CIGRE TF D1.01.07, “New Techniques for Dissolved Gas-in-Oil Analysis”, Electra, No.
198, pp.20-27, October 2001 (Summary of Report). Complete report in IEEE Elec.Insul.Magazine, Vol.19, No.2, pp. 7-15, 2003.
[2] Guide for the Sampling of Gases and of Oil from Oil-Filled Electrical Equipment and for
the Analysis of Free and Dissolved Gases, IEC Publication 60567-2005. [3] M.Duval et al, JTF D1.01/A2.11, “Recent Developments in DGA Interpretation”, CIGRE
Brochure # 296, June 2006 (available from [email protected] ). [4] Mineral Oil-Impregnated Electrical Equipment in Service - Guide to the Interpretation of
Dissolved and Free Gases Analysis, Publication 60599 – Amendment I to Ed.2.0 (2007).
[5] M.Duval et al, TF D1.01.15, “Report on Gas Monitors for Oil-Filled Electrical Equip-
ment”, CIGRE Brochure # , 2009 (available from [email protected] ). [6] P.J.Griffin, “Analysis for Combustible Gases in Transformer Silicone Fluids”, Int. Conf. of
Doble Clients, Sec.10-701/707, 1985 [7] H.Kuwahara et al “Study of Explosion and Fire hazards of Silicone Liquid under Arc
Conditions”, Mitsubishi Technical Brochure, 1987. [8] T.V.Oommen, “Vegetable Oils for Liquid-Filled Transformers”, IEEE
Elec.Insul.Magazine, Vol.18, No.1, pp.6-11, 2002. [9] H.Borsi, “Gassing Behavior of Different Insulating Liquids for Transformers”, Electra, No.
185, 1999. [10] L.Lewand, “Laboratory Evaluation of Several Synthetic and Agricultural-Based Dielectric
Liquids”, Int. Conf. of Doble Clients, 2001. [11] Cooper Power Systems, “Envirotemp FR3 Fluid – Dissolved Gas Guide”, Technical
Brochure R900-20-19, 2006. [12] I.U.Khan et al, “Dissolved Gas Analysis of Alternative Fluids for Power Transformers”,
IEEE Elec.Insul.Magazine, Vol.23, No.5, pp. 5-14, 2007. [13] M.Duval, “The Duval Triangle for Load Tap Changers, Non-Mineral Oils and Low Tem-
perature Faults in Transformers”, IEEE Elec.Insul.Magazine, Vol.24, No.6, pp. 22-29, 2008.
[14] M.Duval, “A Review of Faults Detectable by Gas-in-Oil Analysis in Transformers”, IEEE
Elec.Insul.Magazine, Vol.18, No.3, pp. 8-17, 2002. [15] M.Duval and R.Baldyga, “Stray gassing of FR3 Oils in Transformers in Service”, Int.
Conf. of Doble Clients, 2009. [16] R.Frotscher, “DGA for MR Tap-Changers”, MRcademy Convention Report, Orlando, FL,
pp.119-135, Dec. 2008. [17] M.Duval and J.Dukarm, “ Improving the Reliability of Transformer Gas-in-Oil Diagnosis”,
IEEE Elec.Insul.Magazine, Vol.21, No.4, pp. 21-27, 2005. [18] M.Duval, “Calculation of DGA Limit Values and Sampling Intervals in Transformers in
Service”, IEEE Elec.Insul.Magazine, Vol.24, No.5, pp. 7-13, 2008.

24
[19] Application of dissolved gas analysis (DGA) to factory tests on electrical equipment, IEC
Publication 61181- 2007. [20] E.Braesel, “Further development of gas analytical transformer diagnosis on the basis of
IEC 60567/60599”, GATRON Technical Brochure, 2008. [21] I.Atanasova-Hoehlein et al, “Gassing and Oxidation Behaviour of Insulating Fluids under
Thermal Stress”, CIGRE South Africa Regional Conference, Paper C107, 2009. [22] Mineral Oil-ImpregnatedElectrical Equipment in Service - Guide to the Interpretation of
Dissolved and Free Gases Analysis, IEC Publication 60599-1999. 8 TRADEMARKED PRODUCTS BioTemp : ABB FR3 : Cooper Power Systems Midel : M&I Materials Nomex: E.I. du Pont de Nemours OILTAP, VACUTAP: MR Reinhausen 9 CONTRIBUTING MEMBERS 1 M.Duval, 2 I.Atanassova-Hoehlein, 3 F.Scatiggio, 4 M.Cyr, 5 M.Grisaru, 6 M.Martins, 7 L.Bates, 8 P.Boman, 9 A.C.Hall, 10 G.Wilson, 11 L.Arvidsson, 12 R.Frotscher, 13 M.Szebeni, 14
K.Carrander, 15 H.Athanassatou, 16 A.M.Haug, 17 A.Moellmann, 18 H.J.Knab, 19
J.VanPeteghem, 20 G.Buchgraber, 21 S.Tenbohlen, 22 R.Maina, 23 B.Pahlavanpour, 24 P.McShane, 25 R.Martin, 26 Z.Wang, 27 C.Myers, 28 M.Foata.
25
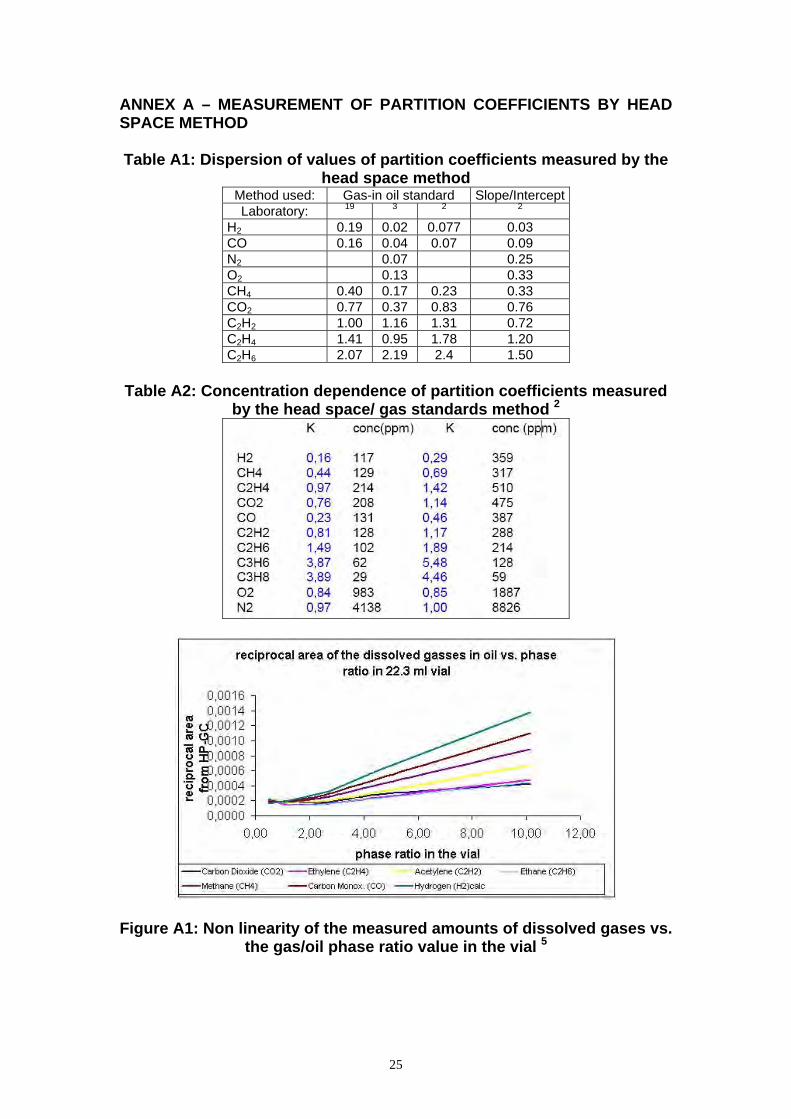
ANNEX A – MEASUREMENT OF PARTITION COEFFICIENTS BY HEAD SPACE METHOD Table A1: Dispersion of values of partition coefficients measured by the
head space method
Table A2: Concentration dependence of partition coefficients measured
by the head space/ gas standards method 2
Figure A1: Non linearity of the measured amounts of dissolved gases vs. the gas/oil phase ratio value in the vial 5
Method used: Gas-in oil standard Slope/Intercept Laboratory: 19 3 2 2
H2 0.19 0.02 0.077 0.03 CO 0.16 0.04 0.07 0.09 N2 0.07 0.25 O2 0.13 0.33 CH4 0.40 0.17 0.23 0.33 CO2 0.77 0.37 0.83 0.76 C2H2 1.00 1.16 1.31 0.72 C2H4 1.41 0.95 1.78 1.20 C2H6 2.07 2.19 2.4 1.50

26
ANNEX B: LABORATORY TESTS ON NON-MINERAL OILS
: Mineral oil; : Silicone oil [6], [7] : Mineral oil; : Midel [9], [12]
: Mineral oil; : FR3 [10-12] : Mineral oil; : BioTemp [8], [10] Note: zone boundaries indicated in Figure B1 are those of mineral oils.
Figure B1: Comparison of published DGA results of mineral and non-mineral oils subjected to the same faults (PD, D1, T1, T3) in the labora-
tory

27
Table B1: Gas formation from laboratory pyrolysis tests on mineral and non-mineral oils performed by WG32 7 (arbitrary units)
Mineral Midel Silicone FR3 BioTemp1200 °C CH4 2.72 3.14 1.51 2.80 3.36 C2H4 12.5 17.8 1.59 6.14 10.71 C2H6 1.61 2.2 0.13 0.65 1.16 C2H2 1.61 3.2 0.26 0.96 2.43 700 °C CH4 0.73 1.07 0.13 1.41 1.34 C2H4 2.57 5.15 0.30 4.09 5.17 C2H6 0.99 2.13 0.04 1.28 1.82 C2H2 - - - - -

28
ANNEX C: DGA RESULTS OF WG32 IN LOAD TAP CHANGERS
Table C1: Classification of commercial LTCs according to Table 6 12
Manufacturer Type Classification
Reinhausen OILTAP® V, H, C ARC
OILTAP® R, M, D, G, MS, F, T ARS types 1, 2, 3, 4
VACUTAP® VV VRC
VACUTAP® VR VRS
VACUTAP® RMV-I, RMV-II, RMV-A VXC
RMT, RMS AXC
ABB UZB.., UZC.., UZD.., UZE.., UZF.. ARC
UBB ARC
UCB, UCC, UCD, UCG, UCL ARS
UVT VXC
VUCG VRS
Westinghouse URS, UTN, UTS, UNR, UTT AXC
URT AXS
UVT, UVW VXC
UTH ARS
Cooper, McGraw Edison, Pennsylania
550, 995 AXC
394, 494, 396B, 996 AXS
Allis-Chalmers TLH-xx AXC
Federal Pacific TC-515, TC-525 AXC
TC-34, TC-46, TC-546 AXS
Ferranti RT ARC
GE LR-25, LRT-38, LRT-48, LRT-68, LRT-72, LRT-65, LRT-83, LRS-83
AXC
LRT-45, LRT-59, LRT-85 AXS
LRT-200, LRT-300, LRT-400, LRT-500, LRT-700
VXC
Huaming SYZZ, CV, SV ARC
CM, CMB, CMD ARS
HDK VXC
HWV VRC
VCV, SHUV, SHJV VRC
SHZV VRS
Hyundai-Elprom RS4, RS5, RS6, RS7, RS9, RS18, RS12, RS16, RS19
ARS
RSV5, RSV19 VRS
ATL (UK) AT, ATV, AE ARC

29
Note 1: the 3 gases used in the triangles of Figures C1 to C7 are CH4, C2H4 and C2H2 as for the general interpreta-tion of DGA in transformers.
Ref: 3; : Normal operation;
Inspected faults: : Overheating; : Arcing; Ref: 8; : no fault suspected, no inspection made;
: arc burns, debris : damaged contact
Ref: 13; : no inspections made Ref: 6; : no inspections made
Figure C1: Normal and faulty operation of LTCs of the arc-breaking-in-oil compartment type (conventional oil type AXC, ARC)
No inspections made
Figure C2: Gas formation change in two LTCs of the arc-breaking-in-oil compartment type (conventional oil type AXC, ARC) 6
Note 2: in Figures C1 and C2, fault zones and zone boundaries are as in Figure 3 of section 4.3.1.

30
(a): ARS type 1 (b): ARS type 2 : Normal operation
Figure C3: Normal operation of LTCs of the arc-breaking-in-oil in-tank type (ARS types 1 and 2) 1
: no inspection made; : oil change
Figure C4: Gas formation change in two LTCs of the arc-breaking-in-oil in-tank type (ARS type 1) 6
Note 3: in Figures C3, C4 and C7, fault zones T1, T2, T3 and D1 are those used for the general interpretation of DGA in transformers (see Figure 1 of section 3.2 for identification). Zones N and N1 correspond to normal operation. X3 is an intermediate zone.

31
: no inspection made
Figure C5: LTCs of the vacuum
compartment type (VXC) 8 Note 4: in Figure C5, fault zones are those used for the general interpretation of DGA in transformers (see Figure 1 of section 3.2 for identification).
(a): in service (b): during power switching tests
: Normal operation; : formation of a very high temperature hot spot
Figure C6: Two different modes of operation of LTCs of the vacuum in-tank type VRC 12, 1

32
: Normal operation
Figure C7: Normal operation of LTCs of the vacuum
in-tank type VRS 12, 1
(see Note 3 for the identification of fault zones)