Embed Size (px)
Citation preview
D.G. Khan Cement Company Limited
CONTENTS
D.G. Khan Cement Company Limited
Corporate Profile 3
Directors’ Report 4
Condensed Interim Balance Sheet 8
Condensed Interim Profit and Loss Account 10
Condensed Interim Cash Flow Statement 11
Condensed Interim Statement of Comprehensive Income 12
Condensed Interim Statement of Changes in Equity 13
Selected Notes to the Condensed Interim Financial Information 14
Directors’ Report 23
Condensed Interim Consolidated Balance Sheet 24
Condensed Interim Consolidated Profit and Loss Account 26
Condensed Interim Consolidated Cash Flow Statement 27
Condensed Interim Consolidated Statement of Comprehensive Income 28
Condensed Interim Consolidated Statement of Changes in Equity 29
Selected Notes to the Condensed Interim Consolidated Financial Information 30
D.G. Khan Cement Company Limited and its Subsidiary
Board of DirectorsMrs. Naz Mansha ChairpersonMian Raza Mansha Chief ExecutiveMr. Khalid Qadeer QureshiMr. Zaka-ud-DinMr. Farid FazalMr. Inayat Ullah Niazi Chief Financial OfficerMs. Nabiha Shahnawaz Cheema
Audit Committee Mr. Khalid Qadeer Qureshi Member/ChairmanMr. Farid Fazal MemberMs. Nabiha Shahnawaz Cheema Member
Company Secretary Mr. Khalid Mahmood Chohan
Bankers Allied Bank Limited Habib Metropolitan Bank LimitedAskari Bank Limited MCB Bank LimitedBank Alfalah Limited NIB BankBank Islami Pakistan Limited Meezan Bank LimitedBarclays Bank Plc National Bank of PakistanCitibank N.A. Samba Bank LimtedDeutsche Bank AG Standard Chartered Bank (Pakistan)Dubai Islamic Bank LimitedFaysal Bank Limited Silk Bank LimitedFirst Women Bank Limited The Bank of PunjabHabib Bank Limited United Bank LimitedHSBC
External Auditors KPMG Taseer Hadi & Co, Chartered Accountants
Cost Auditors Avais Hyder Liaquat Nauman, Chartered Accountants
Legal Advisors Mr. Shahid Hamid, Bar-at-Law
Registered Office Nishat House, 53-A, Lawrence Road,Lahore-PakistanPhone: 92-42-36367812-20 UAN: 111 11 33 33Fax: 92-42-36367414Email: [email protected] site: www.dgcement.com
Factory 1. Khofli Sattai, Distt. Dera Ghazi Khan-PakistanPhone: 92-641-460025-7Fax: 92-641-462392Email: [email protected]
2. 12, K.M. Choa Saidan Shah Road,Khairpur, Tehsil Kallar Kahar,Distt. Chakwal-PakistanPhone: 92-543-650215-8Fax: 92-543-650231
CORPORATE PROFILE
D.G. Khan Cement Company Limited
03 20113rd QUARTER
DIRECTORS' REPORT
The board of directors is pleased to submit theirquarterly report along with the financial statementsfor the nine months ended March 31, 2011.
Performance Outlook
Cement Industry
The prospects of returning to macro-economicstability improved in initial months of the financialyear 2011 with most key indicators continuing thepositive trend that began in closing months offinancial year 2010. Business confidence was alsohelped by signs of recovery in global economy.However, first quarter of the period witnessedthe worst ever floods in the country's history thatnegatively impacted the GDP growth asdevelopment expenditure was truncated to providethe resources for reconstruction and rehabilitationof the flood affected areas.
In economic terms, post floods era will beremembered as an era of crisis. The constructionindustry suffered a slump, particularly in northernpart of the country. The situation was especiallyacute in the Khyber Pakhtoonkhwa province, butthe construction sector also underwent a severerecession in lower Punjab and some parts of Sindh.Given the tumbling construction industry, thebuilding materials sector was bound to suffer froman economic slump.
The industry wide performance of cementproducers showed a downward trend owing toplummeting domestic cement consumption.Cement industry operated at an average of 74%of the installed production capacity. Plant shutdowns during the flood and post flood period werefeatured all across the country. With a decline indomestic cement consumption, cement producerswere forced to seek foreign markets for sale ofcement thereby accumulating cement exports toaround 30% of the entire sales during the periodthough registering a decline of 15% comparedwith the same period last year. In the intenselycompetitive foreign market, Afghanistan provedto be an attractive region where we were alreadypoised to capitalize on the demand.
On the domestic side, consumption of cementcondensed by 1.3 million MT due to constrictedGovernment spending on public infrastructure andother development projects. There was, however,slight pickup in non-governmental spending in thelater part of the period under report due to post-flood construction activities in the rural areas;however that was not sufficient to counterbalancethe reduction in Government spending. Themeager operational performance across the wholecement industry along with high level of input costsare expected to translate into operational lossesduring the period, however the recent priceincreases and sales pick up would offset thoselosses to some extent.
04 20113rd QUARTER
D.G. Khan Cement Company Limited
20119 months
up toMarch 31
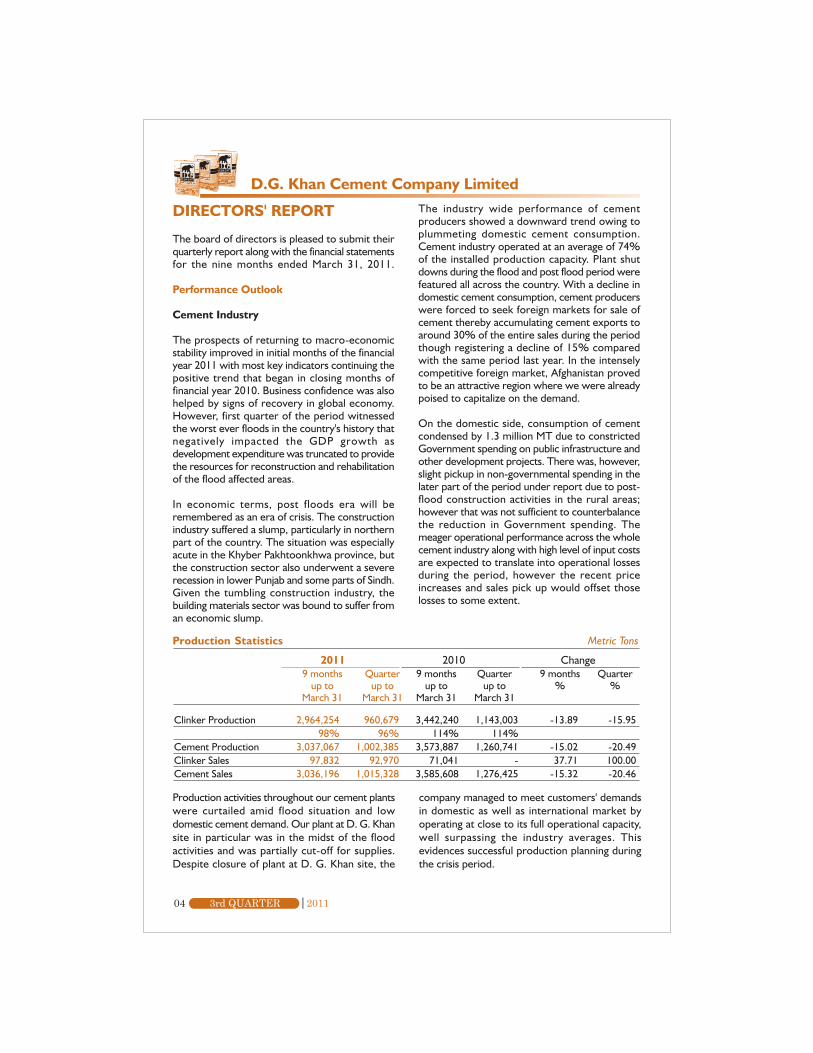
Clinker Production 2,964,254 960,679 3,442,240 1,143,003 -13.89 -15.9598% 96% 114% 114%
Cement Production 3,037,067 1,002,385 3,573,887 1,260,741 -15.02 -20.49Clinker Sales 97,832 92,970 71,041 - 37.71 100.00Cement Sales 3,036,196 1,015,328 3,585,608 1,276,425 -15.32 -20.46
Production Statistics Metric Tons
2010 ChangeQuarter
up toMarch 31
9 monthsup to
March 31
Quarterup to
March 31
9 months%
Quarter%
Production activities throughout our cement plantswere curtailed amid flood situation and lowdomestic cement demand. Our plant at D. G. Khansite in particular was in the midst of the floodactivities and was partially cut-off for supplies.Despite closure of plant at D. G. Khan site, the
company managed to meet customers' demandsin domestic as well as international market byoperating at close to its full operational capacity,well surpassing the industry averages. Thisevidences successful production planning duringthe crisis period.

D.G. Khan Cement Company Limited
05 20113rd QUARTER
Sales - Net 13,078 4,904 11,851 3,893Profit from operations 1,979 664 1,865 434Finance Cost -1,555 -539 -1,422 -466Investment Income 715 209 587 301Other Operating Income/ Expenses (Net) -11 -10 -21 -66Profit/ (Loss) Before Tax 423 125 444 -31Taxation -246 -140 -55 -50Profit/ (Loss) After Tax 177 -15 389 -81
Financial Performance Rupees in million
20119 months
up toMarch 31
Quarterup to
March 31
Despite the devastating floods that began in Augustyour company was still able to register gross salesof Rs 13.078 billion representing 10% top linegrowth over comparable period last year. Theperformance in March Quarter 2011 in particularrecorded a superb growth of 26% when comparedwith March Quarter 2010. This growth in the salesrevenue is attributable to good cement pricesprevailing in the domestic cement market. Salevolumes, as described earlier, drifted downwardsdue to depression in construction sector all acrossthe country.
Global acceptability of company's product enabledus to record a superb volumetric growth wherebythe export volumes more than doubled.Improvements were observed in the markets ofAfghanistan and India where we registered 73%growth. Other than regional exports, wesuccessfully tapped new markets in East and SouthAfrican Nations where exports more than tripledduring the period.
The worsening energy crisis is continuouslyimpeding the country's economic growth byrestraining the growth in almost every sector ofthe economy especially the manufacturing sector.The company however, improved its efficiency ina difficult environment. Extensive cost-cuttingmeasures and good levels of business in theemerging markets made a significant contribution toits success. The third quarter of 2011 saw operatingmargins exceed the previous year's figures.
Additionally, the company faced several challengesin constricting its production costs. Major shareof production cost was taken by cost of fuels that
largely includes costs of imported coal and furnaceoil. The prices of both the commodities in theinternational market increased significantly duringthe period (by 38%). Due to worsening gas non-availability situation existing throughout the periodwe were forced to use furnace oil as a source ofpower generation, particularly in the month ofJanuary which resulted in operational loss for suchperiod.
Provision for taxation during the period includesdeferred tax provision amounting to Rs 114 millionarising chiefly due to reduction in available taxlosses due to change in the export and local salesmix during the period.
Summing up, volume pickups in the closing monthsof the period under review improved our earningsand we registered 53% growth in the earningsbefore finance cost in the later quarter of theperiod. Although, production and finance costsshowed an increase during the period but we stillmanaged to come close to the bottom line profitof the comparable period last year.
Operational Performance
Consistent growth in sales substantiatesmanagement's pledge on consumer satisfactionachieved through process optimizations techniquesand quality management. In the current period thecompany achieved sales growth of 10% overprevious period touching the 13 billion rupeesmark on net turnover scale.
This splendid performance coupled with processoptimization has actualized into operating profit
9 monthsup to
March 31
Quarterup to
March 31
2010

Future Outlook
Opportunities and risks
Despite the economic upturn, risks remain fora sustained recovery. The high debt level ofsome European countries is continuouslythreatening the stability of the global financialand banking system having direct impact on ourburning material demand and finance costs. Itwill be necessary for governments around theworld to reduce spending.
Other risks are primarily associated with
- Volatile energy costs (imported coal);- Growing geopolitical tensions; and- Increasing petroleum prices.
We see opportunities in consistentlyimplementing our strategy and further improvingour operational excellence. We will continueto concentrate on process improvements andmaterial management strategies.
Important milestone in the successfulimplementation of our strategy is our contractualdevelopment with the world renowned cement
plant supplier FLSmidth for installation of anotherWaste Heat Recovery plant at Khairpur Plantsite which has now reached the stage of designconferences post 20% advance payment. TheWaste Heat Recovery plant at D. G. Khan siteis already operational and is pulling off cashsavings for the company.
Various Refused Derived Fuel plant projects areunderway including extension project atKhairpur Plant site all in an effort to bring downour dependence on imported coal. Till date10%-15% of the imported coal has beensubstituted by various alternative fuels throughthis project.
Going forward your company, as a premiercement producer, is well equipped to takeadvantage of the industry growth anticipated inthe last quarter of the year 2011. Historically,last quarter yields sales growth due to boom inconstruction activities both in rural areas (postharvest season) and housing sector in urbanareas.
Coal prices, currently hovering at aroundUSD150 - USD160 would, however, hamperour profit margins. We expect a positive and
06 20113rd QUARTER
D.G. Khan Cement Company Limited
14,000
12,000
10,000
8,000
6,000
4,000
2,000
-2007 2008 2009 2010 2011
Cost of SalesNet of Sales
4,000
3,000
2,000
1,000
-
2007
Cement ProducedCement Sold
2008 2009 2010 2011
Clinker Produced
Figures in thousands of MTFigures in millions of Rupees
of Rs 1.98 billion. In order to have sustainablegrowth and to increase the market share, thecompany is focusing on operational efficienciesexpected from process improvements andexpanding its customer base, both in domesticand international market.
The company has continued its focus on sales anddistribution activities, product improvementtechniques and effective marketing and tradepromotion techniques during the period. Movingforward, the management is pushing hard to furthercapitalize on the opportunities of businessexpansion available in the international market.
D.G. Khan Cement Company Limited
07 20113rd QUARTER
profitable end to the current financial yearprovided the economic indicators of the countrycontinue moving in the positive direction.
Company's Staff and Customers
We wish to record our appreciation of continuedcommitment of our employees and patronage
of our customers.
For and on behalf of the Board
Mian Raza ManshaChief Executive Officer
Lahore: 25 April 2011
08 20113rd QUARTER
D.G. Khan Cement Company Limited
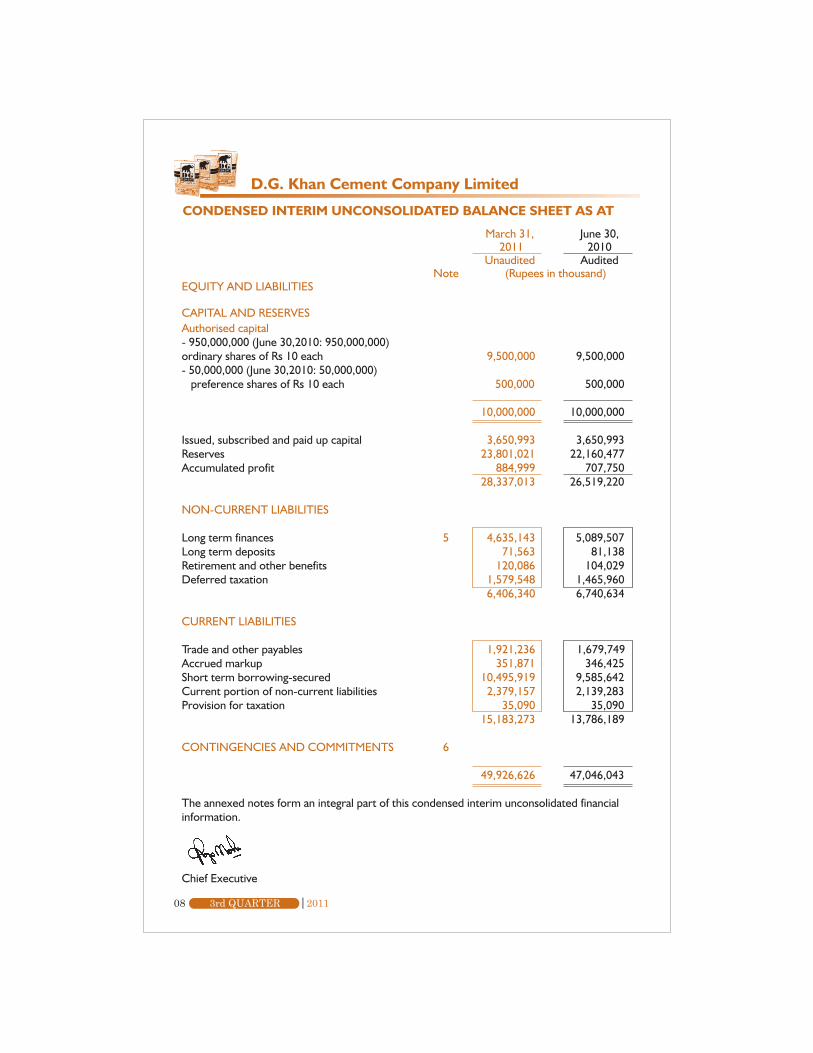
CONDENSED INTERIM UNCONSOLIDATED BALANCE SHEET AS AT
March 31, June 30, 2011 2010
Unaudited AuditedNote (Rupees in thousand)
EQUITY AND LIABILITIES
CAPITAL AND RESERVESAuthorised capital- 950,000,000 (June 30,2010: 950,000,000)ordinary shares of Rs 10 each 9,500,000 9,500,000- 50,000,000 (June 30,2010: 50,000,000) preference shares of Rs 10 each 500,000 500,000
10,000,000 10,000,000
Issued, subscribed and paid up capital 3,650,993 3,650,993Reserves 23,801,021 22,160,477Accumulated profit 884,999 707,750
28,337,013 26,519,220
NON-CURRENT LIABILITIES
Long term finances 5 4,635,143 5,089,507Long term deposits 71,563 81,138Retirement and other benefits 120,086 104,029Deferred taxation 1,579,548 1,465,960
6,406,340 6,740,634
CURRENT LIABILITIES
Trade and other payables 1,921,236 1,679,749Accrued markup 351,871 346,425Short term borrowing-secured 10,495,919 9,585,642Current portion of non-current liabilities 2,379,157 2,139,283Provision for taxation 35,090 35,090
15,183,273 13,786,189
CONTINGENCIES AND COMMITMENTS 6
49,926,626 47,046,043
The annexed notes form an integral part of this condensed interim unconsolidated financialinformation.
Chief Executive
D.G. Khan Cement Company Limited
09 20113rd QUARTER
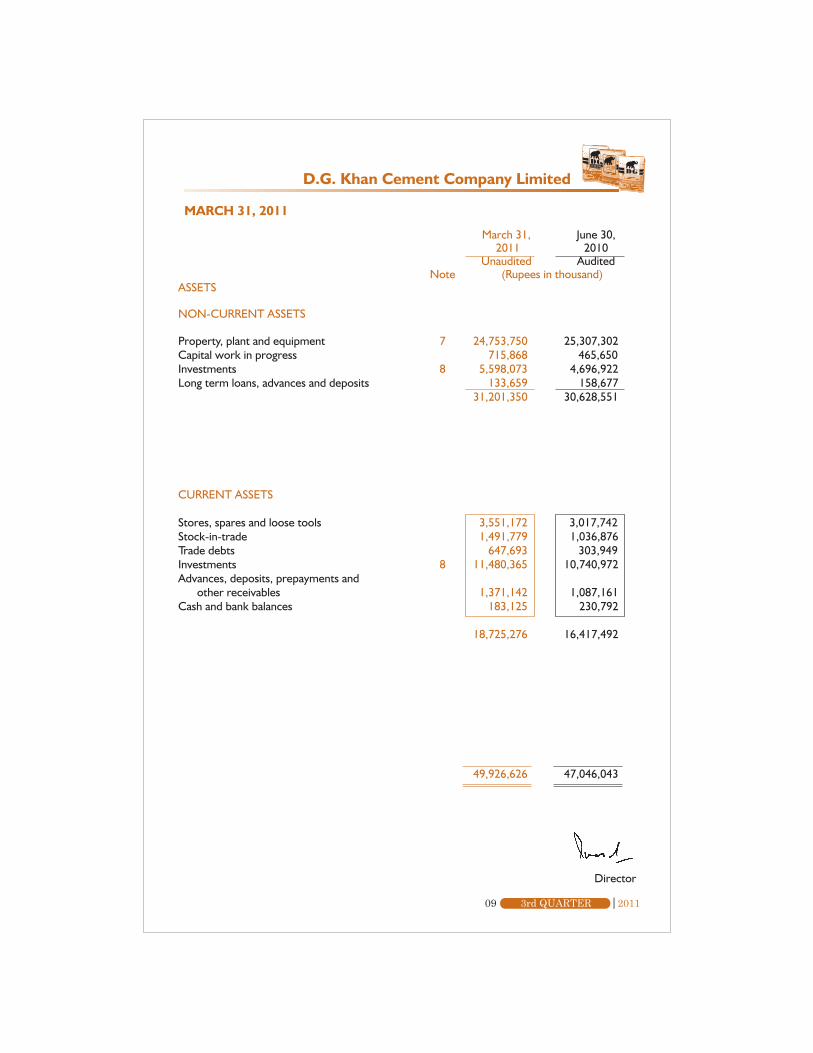
MARCH 31, 2011
March 31, June 30, 2011 2010
Unaudited AuditedNote (Rupees in thousand)
ASSETS
NON-CURRENT ASSETS
Property, plant and equipment 7 24,753,750 25,307,302Capital work in progress 715,868 465,650Investments 8 5,598,073 4,696,922Long term loans, advances and deposits 133,659 158,677
31,201,350 30,628,551
CURRENT ASSETS
Stores, spares and loose tools 3,551,172 3,017,742Stock-in-trade 1,491,779 1,036,876Trade debts 647,693 303,949Investments 8 11,480,365 10,740,972Advances, deposits, prepayments and
other receivables 1,371,142 1,087,161Cash and bank balances 183,125 230,792
18,725,276 16,417,492
49,926,626 47,046,043
Director
10 20113rd QUARTER
D.G. Khan Cement Company Limited
Chief Executive Director
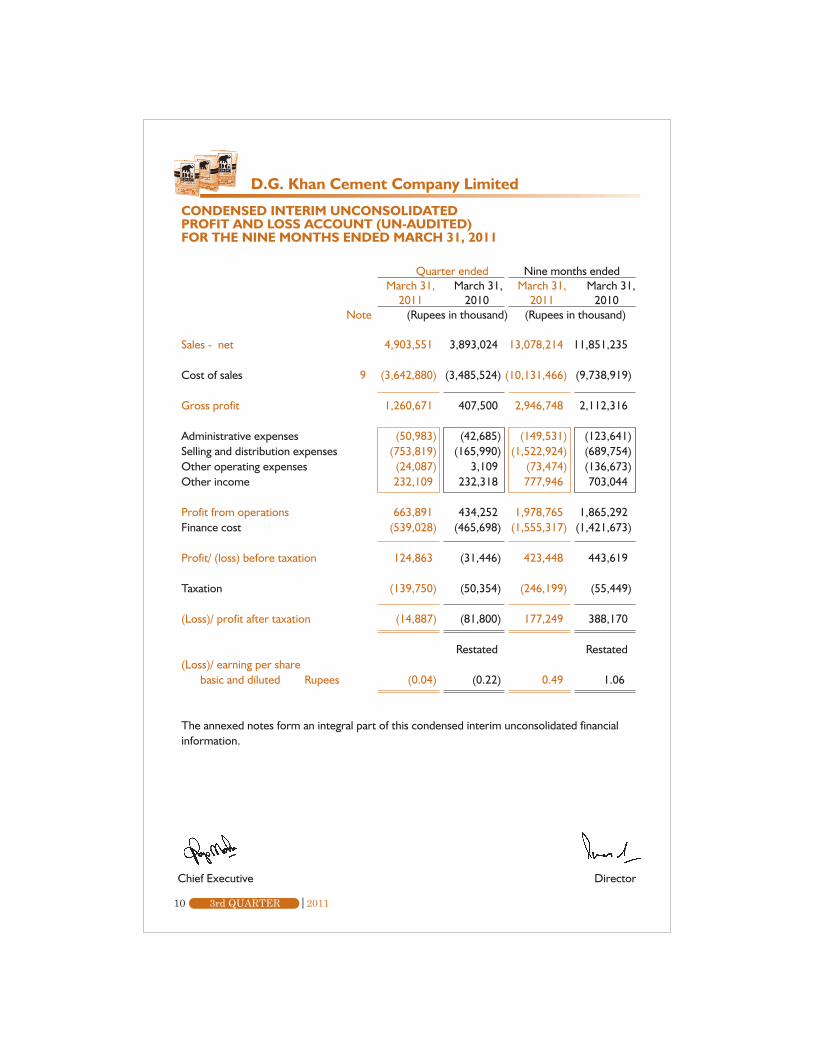
CONDENSED INTERIM UNCONSOLIDATEDPROFIT AND LOSS ACCOUNT (UN-AUDITED)FOR THE NINE MONTHS ENDED MARCH 31, 2011
Quarter ended Nine months ended March 31, March 31, March 31, March 31,
2011 2010 2011 2010Note (Rupees in thousand) (Rupees in thousand)
Sales - net 4,903,551 3,893,024 13,078,214 11,851,235
Cost of sales 9 (3,642,880) (3,485,524) (10,131,466) (9,738,919)
Gross profit 1,260,671 407,500 2,946,748 2,112,316
Administrative expenses (50,983) (42,685) (149,531) (123,641)Selling and distribution expenses (753,819) (165,990) (1,522,924) (689,754)Other operating expenses (24,087) 3,109 (73,474) (136,673)Other income 232,109 232,318 777,946 703,044
Profit from operations 663,891 434,252 1,978,765 1,865,292Finance cost (539,028) (465,698) (1,555,317) (1,421,673)
Profit/ (loss) before taxation 124,863 (31,446) 423,448 443,619
Taxation (139,750) (50,354) (246,199) (55,449)
(Loss)/ profit after taxation (14,887) (81,800) 177,249 388,170
Restated Restated(Loss)/ earning per share
basic and diluted Rupees (0.04) (0.22) 0.49 1.06
The annexed notes form an integral part of this condensed interim unconsolidated financialinformation.
11 20113rd QUARTER
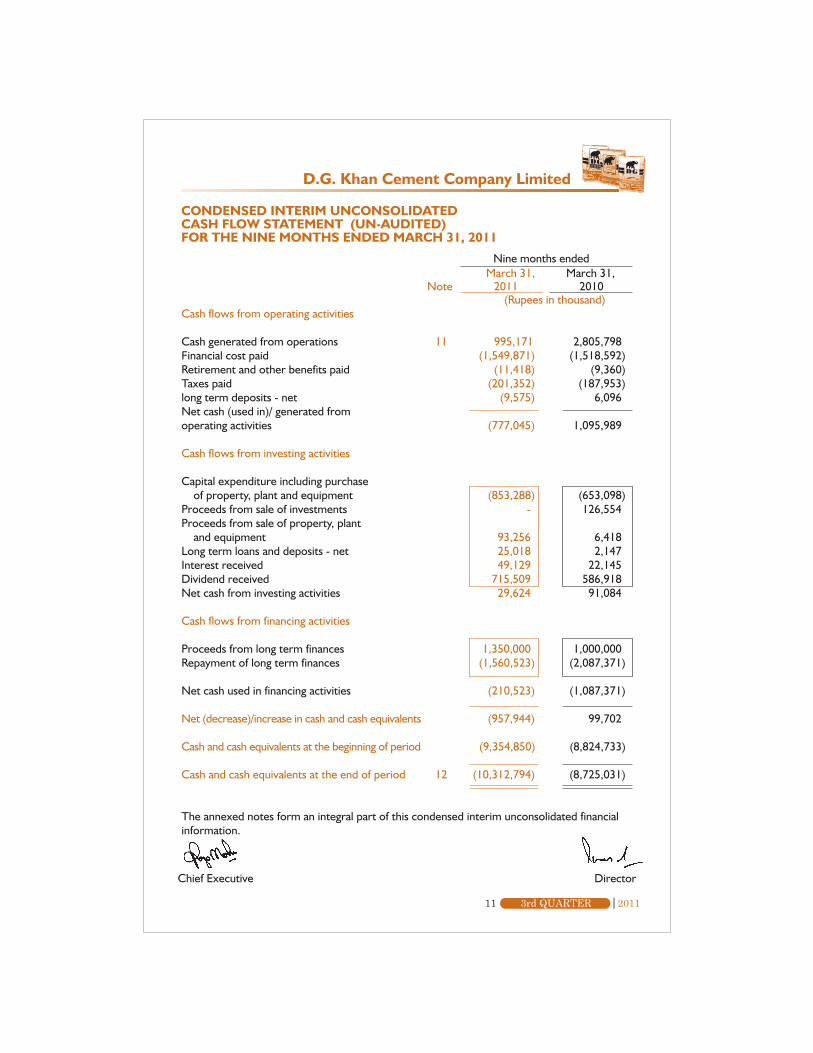
CONDENSED INTERIM UNCONSOLIDATEDCASH FLOW STATEMENT (UN-AUDITED)FOR THE NINE MONTHS ENDED MARCH 31, 2011
Nine months endedMarch 31, March 31,
Note 2011 2010(Rupees in thousand)
Cash flows from operating activities
Cash generated from operations 11 995,171 2,805,798Financial cost paid (1,549,871) (1,518,592)Retirement and other benefits paid (11,418) (9,360)Taxes paid (201,352) (187,953)long term deposits - net (9,575) 6,096Net cash (used in)/ generated fromoperating activities (777,045) 1,095,989
Cash flows from investing activities
Capital expenditure including purchase of property, plant and equipment (853,288) (653,098)Proceeds from sale of investments - 126,554Proceeds from sale of property, plant and equipment 93,256 6,418Long term loans and deposits - net 25,018 2,147Interest received 49,129 22,145Dividend received 715,509 586,918Net cash from investing activities 29,624 91,084
Cash flows from financing activities
Proceeds from long term finances 1,350,000 1,000,000Repayment of long term finances (1,560,523) (2,087,371)
Net cash used in financing activities (210,523) (1,087,371)
Net (decrease)/increase in cash and cash equivalents (957,944) 99,702
Cash and cash equivalents at the beginning of period (9,354,850) (8,824,733)
Cash and cash equivalents at the end of period 12 (10,312,794) (8,725,031)
The annexed notes form an integral part of this condensed interim unconsolidated financialinformation.
Chief Executive Director
D.G. Khan Cement Company Limited
12 20113rd QUARTER
D.G. Khan Cement Company Limited
Chief Executive Director
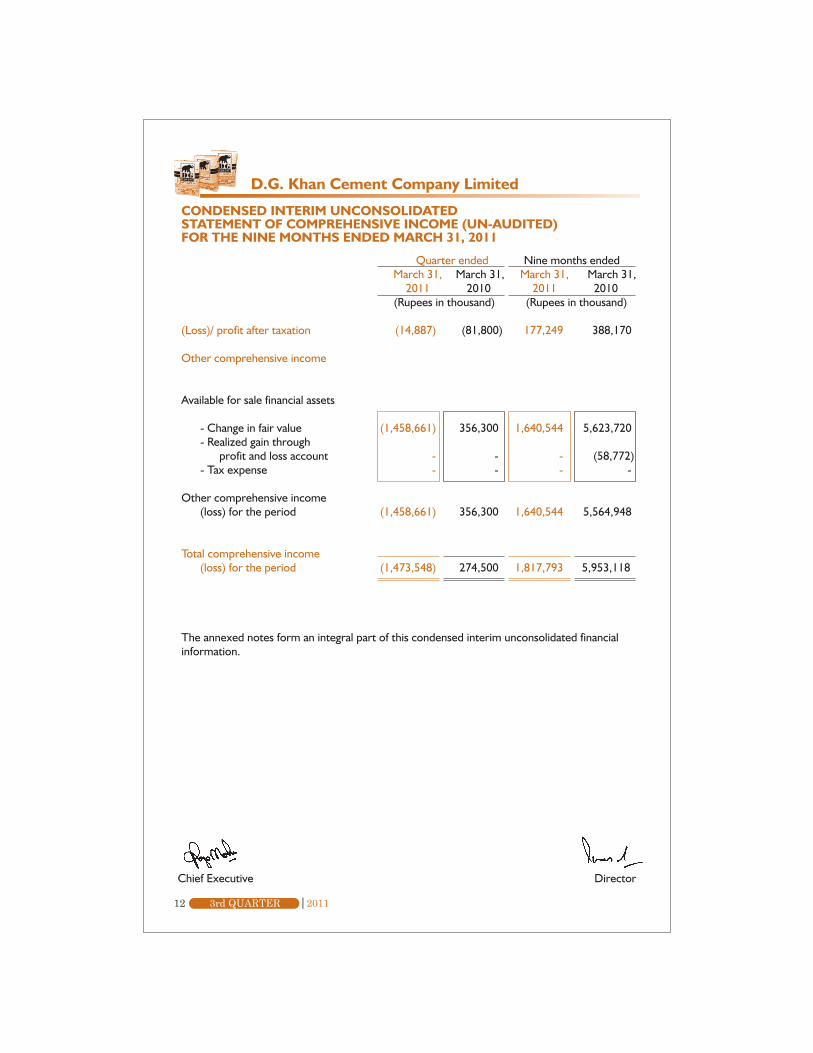
CONDENSED INTERIM UNCONSOLIDATEDSTATEMENT OF COMPREHENSIVE INCOME (UN-AUDITED)FOR THE NINE MONTHS ENDED MARCH 31, 2011
Quarter ended Nine months ended March 31, March 31, March 31, March 31,
2011 2010 2011 2010(Rupees in thousand) (Rupees in thousand)
(Loss)/ profit after taxation (14,887) (81,800) 177,249 388,170
Other comprehensive income
Available for sale financial assets
- Change in fair value (1,458,661) 356,300 1,640,544 5,623,720- Realized gain through
profit and loss account - - - (58,772)- Tax expense - - - -
Other comprehensive income(loss) for the period (1,458,661) 356,300 1,640,544 5,564,948
Total comprehensive income(loss) for the period (1,473,548) 274,500 1,817,793 5,953,118
The annexed notes form an integral part of this condensed interim unconsolidated financialinformation.
13 20113rd QUARTER
Chi
ef E
xecu
tive
Dire
ctor
Bala
nce
as a
t Jun
e 30
, 200
9 - A
udite
d3,
042,
494
3,21
8,46
68,
757,
417
353,
510
5,07
1,82
747
4,72
820
,918
,442
Tota
l com
preh
ensiv
e in
com
e fo
r th
e pe
riod
- Pro
fit fo
r th
e pe
riod
--
--
-38
8,17
038
8,17
0- O
ther
com
preh
ensiv
e in
com
e fo
r
the
perio
d-
-5,
564,
948
--
-5,
564,
948
Bala
nce
as a
t Mar
ch 3
1, 2
010
- Un-
audi
ted
3,04
2,49
43,
218,
466
14,3
22,3
6535
3,51
05,
071,
827
862,
898
26,8
71,5
60C
apita
l tra
nsac
tions
with
ow
ner
- Rig
ht is
sue
608,
499
608,
499
--
--
1,21
6,99
8To
tal c
ompr
ehen
sive
inco
me
for
the
perio
d- P
rofit
for
the
perio
d-
--
--
(155
,148
)(1
55,1
48)
- Oth
er c
ompr
ehen
sive
loss
for
th
e pe
riod
- -
(1,4
14,1
90)
--
-(1
,414
,190
)Ba
lanc
e as
at J
une
30, 2
010
- Aud
ited
3,65
0,99
33,
826,
965
12,9
08,1
7535
3,51
05,
071,
827
707,
750
26,5
19,2
20To
tal c
ompr
ehen
sive
inco
me
for
the
perio
d- P
rofit
for
the
perio
d-
--
--
177,
249
177,
249
- Oth
er c
ompr
ehen
sive
inco
me
for
the
perio
d-
-1,
640,
544
--
-1,
640,
544
Bala
nce
as a
t Mar
ch 3
1, 2
011
- Un-
audi
ted
3,65
0,99
33,
826,
965
14,5
48,7
1935
3,51
05,
071,
827
884,
999
28,3
37,0
13
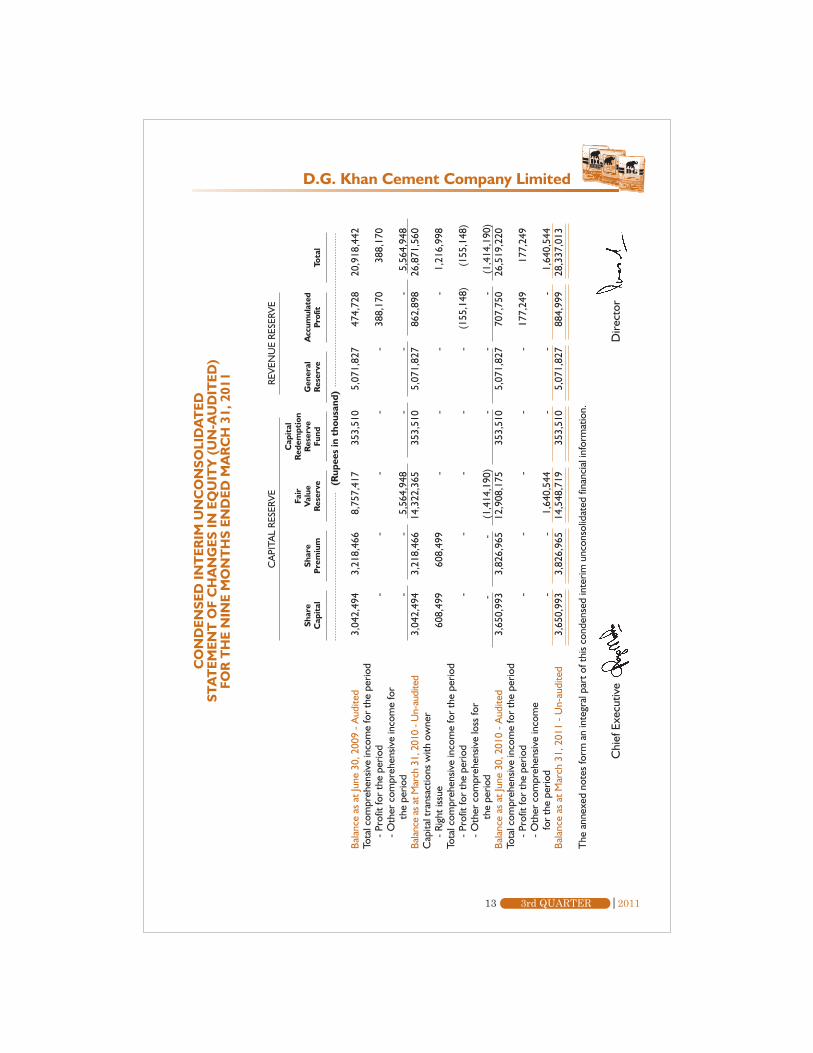
The
ann
exed
not
es fo
rm a
n in
tegr
al p
art o
f thi
s co
nden
sed
inte
rim u
ncon
solid
ated
fina
ncia
l inf
orm
atio
n.
CA
PITA
L RE
SERV
E
Shar
eC
apit
alSh
are
Pre
miu
m
Fair
Val
ueR
eser
ve
Cap
ital
Red
empt
ion
Res
erve
Fund
Gen
eral
Res
erve
Acc
umul
ated
Prof
itTo
tal
(Rup
ees
in t
hous
and)
REVE
NU
E RE
SERV
E
CO
ND
ENSE
D IN
TER
IM U
NC
ON
SOLI
DA
TED
STA
TEM
ENT
OF
CH
AN
GES
IN E
QU
ITY
(U
N-A
UD
ITED
)FO
R T
HE
NIN
E M
ON
TH
S EN
DED
MA
RC
H 3
1, 2
011
D.G. Khan Cement Company Limited

14 20113rd QUARTER
D.G. Khan Cement Company Limited
CONDENSED INTERIM UNCONSOLIDATEDNOTES TO THE FINANCIAL INFORMATION (UN-AUDITED)FOR THE NINE MONTHS ENDED MARCH 31, 2011
1. Status and nature of business
D. G. Khan Cement Company Limited ("the Company") is a public limited companyincorporated in Pakistan and is listed on Karachi, Lahore and Islamabad Stock Exchanges.It is principally engaged in production and sale of Clinker, Ordinary Portland and SulphateResistant Cement. The registered office of the Company is situated at 53-A LawrenceRoad, Lahore.
2. Basis of preparation
The condensed iterim financial statements have been prepared in accordance with approvedaccounting standards as applicable in Pakistan for interim financial reporting. The disclosuresin the condensed interim financial information do not include the information reported forfull annual financial statements and should therefore be read in conjunction with the financialstatements for the year ended 30 June 2010.
3. Estimates
The preparation of the condensed interim unconsolidated financial information requiresmanagement to make judgments, estimates and assumptions that affect the application ofaccounting policies and the reported amounts of assets and liabilities, income and expenses.Actual results may differ from these estimates. In preparing the condensed interimunconsolidated financial information the significant judgments made by the managementin applying accounting policies, key estimates and uncertainty includes:
- Residual value and useful life estimation of fixed assets
- Taxation
- Retirement and other benefits
- Provisions and Contingencies
- Fair value of derivatives
4. Significant accounting policies
4.1 The accounting policies and methods of computation adopted in the preparation ofthe interim financial information are generally based on the same policies and methodsas applied in preparation of the annual financial statements for the year ended June30, 2010.
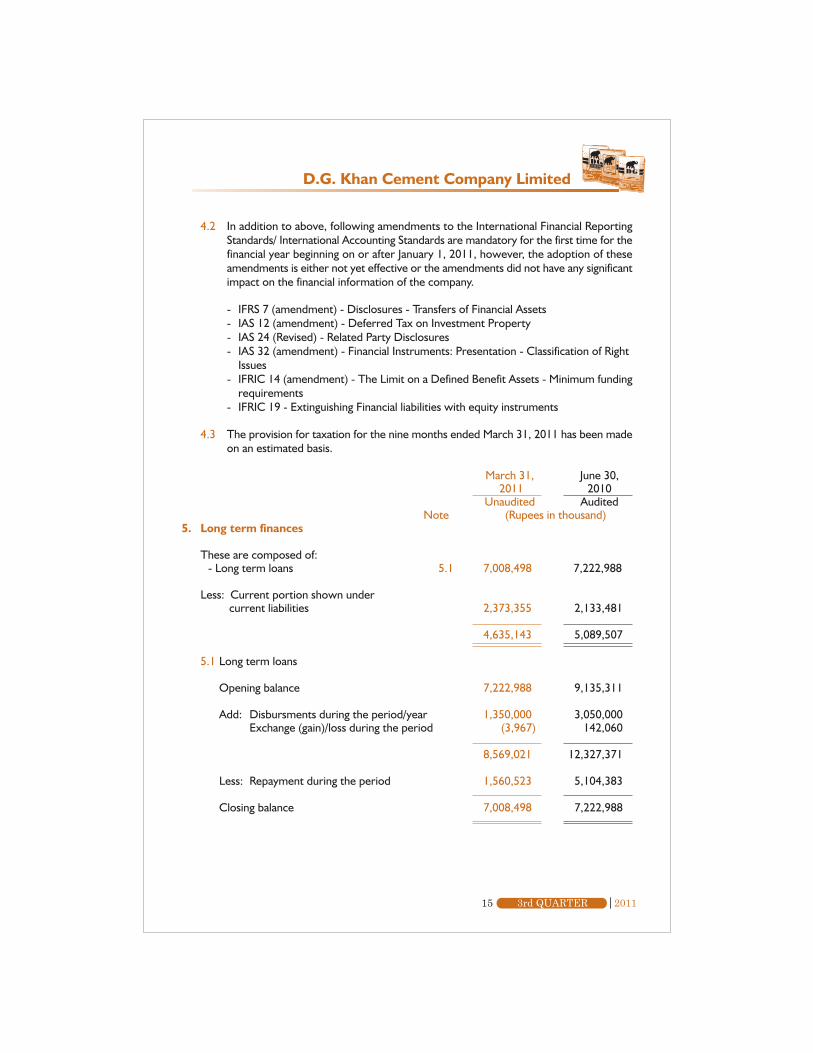
4.2 In addition to above, following amendments to the International Financial ReportingStandards/ International Accounting Standards are mandatory for the first time for thefinancial year beginning on or after January 1, 2011, however, the adoption of theseamendments is either not yet effective or the amendments did not have any significantimpact on the financial information of the company.
- IFRS 7 (amendment) - Disclosures - Transfers of Financial Assets- IAS 12 (amendment) - Deferred Tax on Investment Property- IAS 24 (Revised) - Related Party Disclosures- IAS 32 (amendment) - Financial Instruments: Presentation - Classification of Right
Issues- IFRIC 14 (amendment) - The Limit on a Defined Benefit Assets - Minimum funding
requirements- IFRIC 19 - Extinguishing Financial liabilities with equity instruments
4.3 The provision for taxation for the nine months ended March 31, 2011 has been madeon an estimated basis.
March 31, June 30, 2011 2010
Unaudited AuditedNote (Rupees in thousand)
5. Long term finances
These are composed of:- Long term loans 5.1 7,008,498 7,222,988
Less: Current portion shown under current liabilities 2,373,355 2,133,481
4,635,143 5,089,507
5.1 Long term loans
Opening balance 7,222,988 9,135,311
Add: Disbursments during the period/year 1,350,000 3,050,000Exchange (gain)/loss during the period (3,967) 142,060
8,569,021 12,327,371
Less: Repayment during the period 1,560,523 5,104,383
Closing balance 7,008,498 7,222,988
D.G. Khan Cement Company Limited
15 20113rd QUARTER
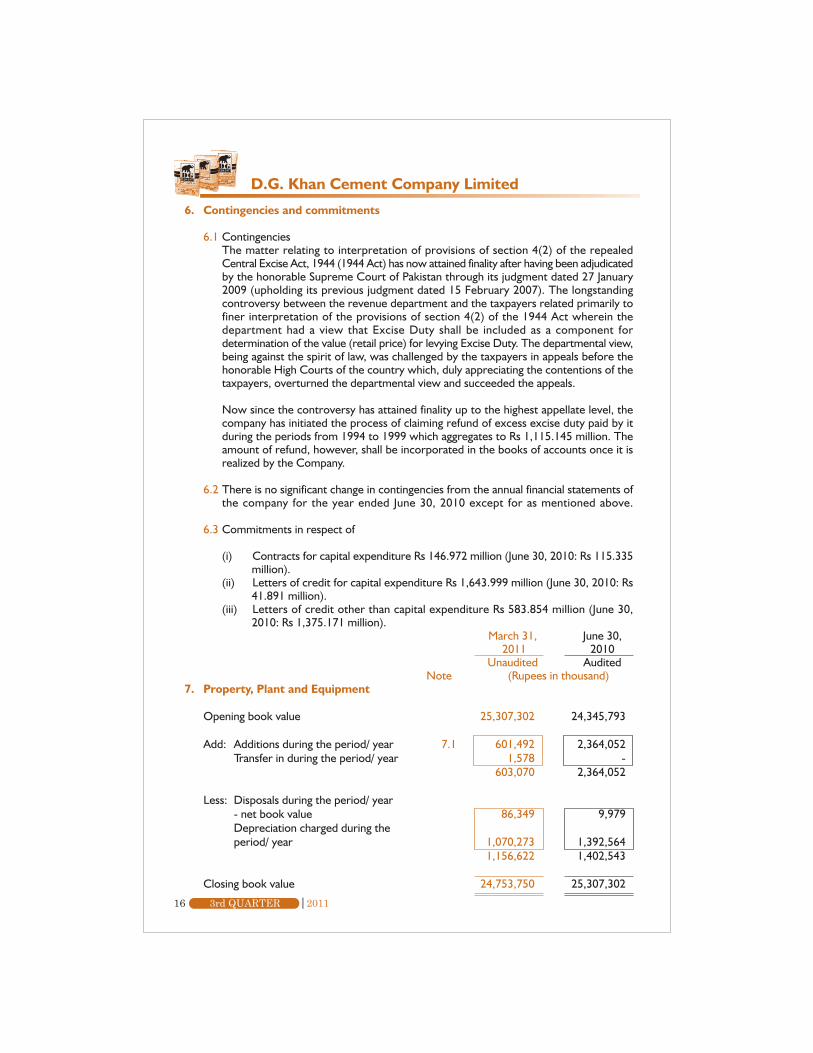
6. Contingencies and commitments
6.1 ContingenciesThe matter relating to interpretation of provisions of section 4(2) of the repealedCentral Excise Act, 1944 (1944 Act) has now attained finality after having been adjudicatedby the honorable Supreme Court of Pakistan through its judgment dated 27 January2009 (upholding its previous judgment dated 15 February 2007). The longstandingcontroversy between the revenue department and the taxpayers related primarily tofiner interpretation of the provisions of section 4(2) of the 1944 Act wherein thedepartment had a view that Excise Duty shall be included as a component fordetermination of the value (retail price) for levying Excise Duty. The departmental view,being against the spirit of law, was challenged by the taxpayers in appeals before thehonorable High Courts of the country which, duly appreciating the contentions of thetaxpayers, overturned the departmental view and succeeded the appeals.
Now since the controversy has attained finality up to the highest appellate level, thecompany has initiated the process of claiming refund of excess excise duty paid by itduring the periods from 1994 to 1999 which aggregates to Rs 1,115.145 million. Theamount of refund, however, shall be incorporated in the books of accounts once it isrealized by the Company.
6.2 There is no significant change in contingencies from the annual financial statements ofthe company for the year ended June 30, 2010 except for as mentioned above.
6.3 Commitments in respect of
(i) Contracts for capital expenditure Rs 146.972 million (June 30, 2010: Rs 115.335million).
(ii) Letters of credit for capital expenditure Rs 1,643.999 million (June 30, 2010: Rs41.891 million).
(iii) Letters of credit other than capital expenditure Rs 583.854 million (June 30,2010: Rs 1,375.171 million).
March 31, June 30, 2011 2010
Unaudited AuditedNote (Rupees in thousand)
7. Property, Plant and Equipment
Opening book value 25,307,302 24,345,793
Add: Additions during the period/ year 7.1 601,492 2,364,052Transfer in during the period/ year 1,578 -
603,070 2,364,052
Less: Disposals during the period/ year- net book value 86,349 9,979Depreciation charged during theperiod/ year 1,070,273 1,392,564
1,156,622 1,402,543
Closing book value 24,753,750 25,307,302
16 20113rd QUARTER
D.G. Khan Cement Company Limited
D.G. Khan Cement Company Limited
17 20113rd QUARTER
March 31, June 30, 2011 2010
Unaudited Audited(Rupees in thousand)
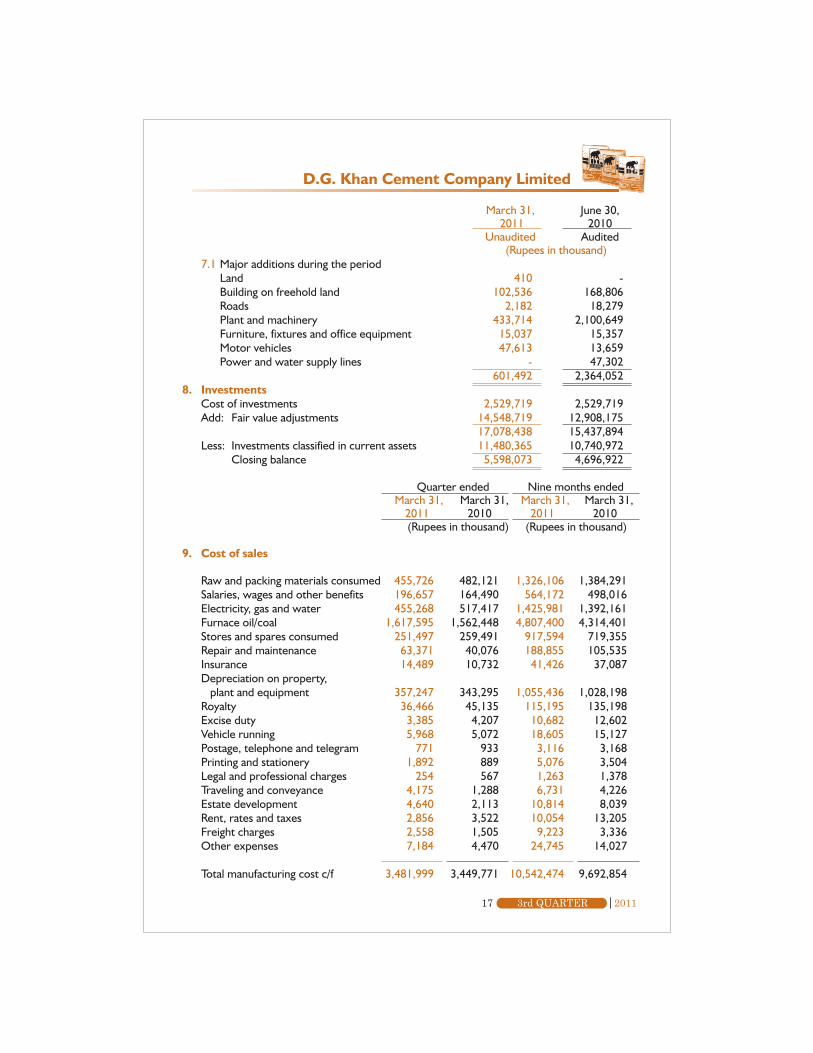
7.1 Major additions during the periodLand 410 -Building on freehold land 102,536 168,806Roads 2,182 18,279Plant and machinery 433,714 2,100,649Furniture, fixtures and office equipment 15,037 15,357Motor vehicles 47,613 13,659Power and water supply lines - 47,302
601,492 2,364,0528. Investments
Cost of investments 2,529,719 2,529,719Add: Fair value adjustments 14,548,719 12,908,175
17,078,438 15,437,894Less: Investments classified in current assets 11,480,365 10,740,972
Closing balance 5,598,073 4,696,922
Quarter ended Nine months ended March 31, March 31, March 31, March 31,
2011 2010 2011 2010(Rupees in thousand) (Rupees in thousand)
9. Cost of sales
Raw and packing materials consumed 455,726 482,121 1,326,106 1,384,291Salaries, wages and other benefits 196,657 164,490 564,172 498,016Electricity, gas and water 455,268 517,417 1,425,981 1,392,161Furnace oil/coal 1,617,595 1,562,448 4,807,400 4,314,401Stores and spares consumed 251,497 259,491 917,594 719,355Repair and maintenance 63,371 40,076 188,855 105,535Insurance 14,489 10,732 41,426 37,087Depreciation on property, plant and equipment 357,247 343,295 1,055,436 1,028,198Royalty 36,466 45,135 115,195 135,198Excise duty 3,385 4,207 10,682 12,602Vehicle running 5,968 5,072 18,605 15,127Postage, telephone and telegram 771 933 3,116 3,168Printing and stationery 1,892 889 5,076 3,504Legal and professional charges 254 567 1,263 1,378Traveling and conveyance 4,175 1,288 6,731 4,226Estate development 4,640 2,113 10,814 8,039Rent, rates and taxes 2,856 3,522 10,054 13,205Freight charges 2,558 1,505 9,223 3,336Other expenses 7,184 4,470 24,745 14,027
Total manufacturing cost c/f 3,481,999 3,449,771 10,542,474 9,692,854
18 20113rd QUARTER
D.G. Khan Cement Company Limited
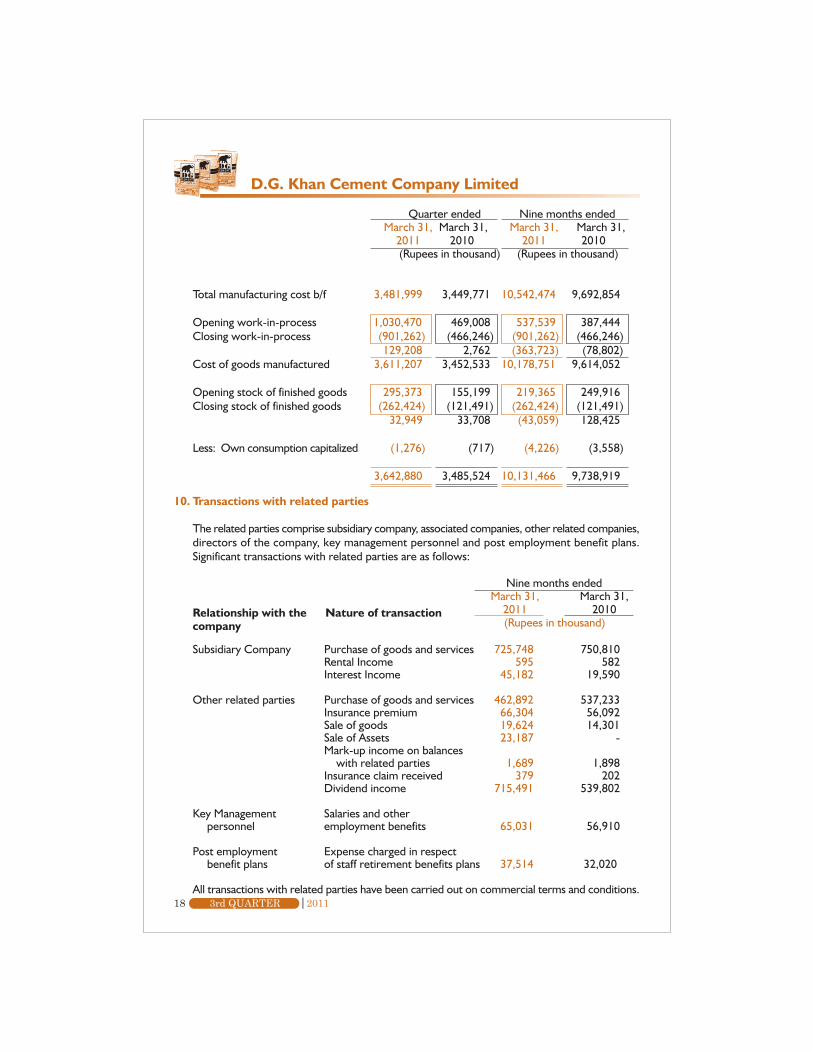
10. Transactions with related parties
The related parties comprise subsidiary company, associated companies, other related companies,directors of the company, key management personnel and post employment benefit plans.Significant transactions with related parties are as follows:
Nine months ended March 31, March 31,
2011 2010(Rupees in thousand)
Subsidiary Company Purchase of goods and services 725,748 750,810Rental Income 595 582Interest Income 45,182 19,590
Other related parties Purchase of goods and services 462,892 537,233Insurance premium 66,304 56,092Sale of goods 19,624 14,301Sale of Assets 23,187 -Mark-up income on balances with related parties 1,689 1,898Insurance claim received 379 202Dividend income 715,491 539,802
Key Management Salaries and other personnel employment benefits 65,031 56,910
Post employment Expense charged in respect benefit plans of staff retirement benefits plans 37,514 32,020
All transactions with related parties have been carried out on commercial terms and conditions.
Relationship with the Nature of transactioncompany
Quarter ended Nine months ended March 31, March 31, March 31, March 31,
2011 2010 2011 2010(Rupees in thousand) (Rupees in thousand)
Total manufacturing cost b/f 3,481,999 3,449,771 10,542,474 9,692,854
Opening work-in-process 1,030,470 469,008 537,539 387,444Closing work-in-process (901,262) (466,246) (901,262) (466,246)
129,208 2,762 (363,723) (78,802)Cost of goods manufactured 3,611,207 3,452,533 10,178,751 9,614,052
Opening stock of finished goods 295,373 155,199 219,365 249,916Closing stock of finished goods (262,424) (121,491) (262,424) (121,491)
32,949 33,708 (43,059) 128,425
Less: Own consumption capitalized (1,276) (717) (4,226) (3,558)
3,642,880 3,485,524 10,131,466 9,738,919
Nine months ended March 31, March 31,
2011 2010(Rupees in thousand)
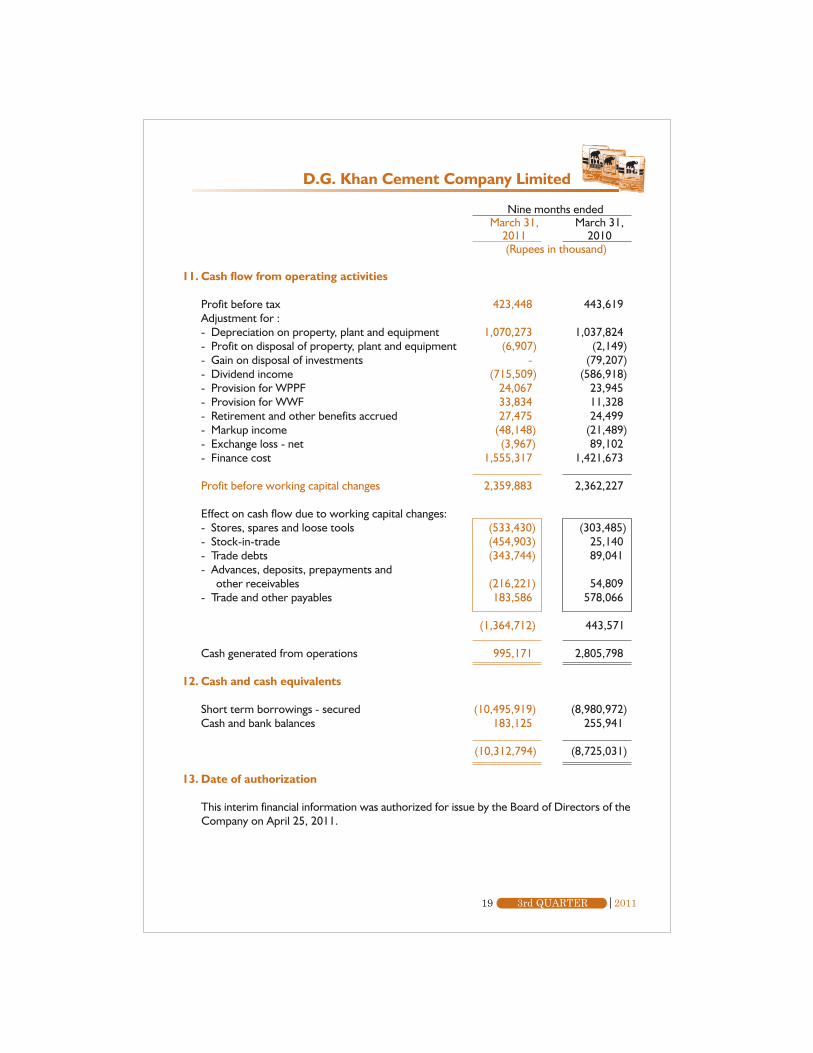
11. Cash flow from operating activities
Profit before tax 423,448 443,619Adjustment for :- Depreciation on property, plant and equipment 1,070,273 1,037,824- Profit on disposal of property, plant and equipment (6,907) (2,149)- Gain on disposal of investments - (79,207)- Dividend income (715,509) (586,918)- Provision for WPPF 24,067 23,945- Provision for WWF 33,834 11,328- Retirement and other benefits accrued 27,475 24,499- Markup income (48,148) (21,489)- Exchange loss - net (3,967) 89,102- Finance cost 1,555,317 1,421,673
Profit before working capital changes 2,359,883 2,362,227
Effect on cash flow due to working capital changes:- Stores, spares and loose tools (533,430) (303,485)- Stock-in-trade (454,903) 25,140- Trade debts (343,744) 89,041- Advances, deposits, prepayments and other receivables (216,221) 54,809- Trade and other payables 183,586 578,066
(1,364,712) 443,571
Cash generated from operations 995,171 2,805,798
12. Cash and cash equivalents
Short term borrowings - secured (10,495,919) (8,980,972)Cash and bank balances 183,125 255,941
(10,312,794) (8,725,031)
13. Date of authorization
This interim financial information was authorized for issue by the Board of Directors of theCompany on April 25, 2011.
D.G. Khan Cement Company Limited
19 20113rd QUARTER
20 20113rd QUARTER
D.G. Khan Cement Company Limited
14. Corresponding figures
In order to comply with the requirements of the International Accounting Standard 34: 'InterimFinancial Reporting', the condensed interim unconsolidated balance sheet and condensedinterim unconsolidated statement of changes in equity have been compared with the balancesof annual audited financial statements of preceding year, whereas, the condensed interimunconsolidated profit and loss account, condensed interim unconsolidated statement ofcomprehensive income and condensed interim unconsolidated cash flow statement have beencompared with the balances of comparable period of immediately preceding year.
Corresponding figures have been re-arranged wherever necessary for the purposes ofcomparison, however, no significant re-arrangements have been made.
Figures have been rounded off to the nearest thousand of Rupees.
Chief Executive Director
21 20113rd QUARTER
D.G. Khan Cement Company Limited and its Subsidiary
Condensed InterimConsolidated Financial Statements
23 20113rd QUARTER
DIRECTORS' REPORT
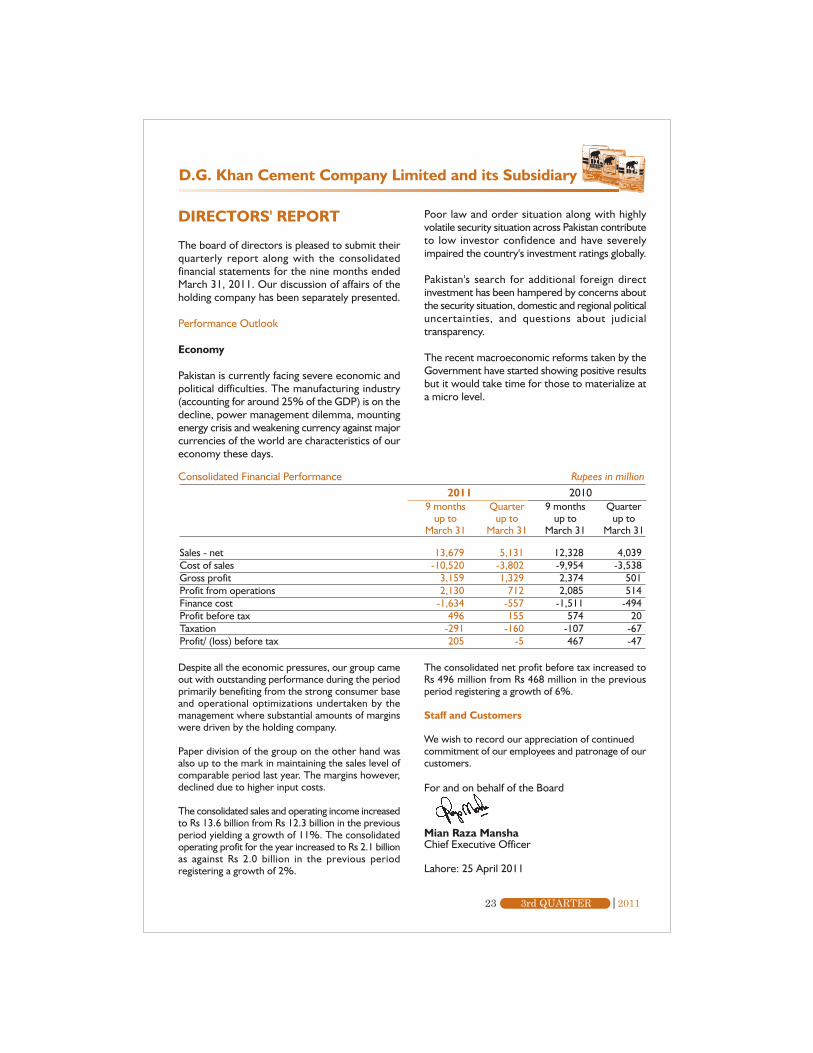
The board of directors is pleased to submit theirquarterly report along with the consolidatedfinancial statements for the nine months endedMarch 31, 2011. Our discussion of affairs of theholding company has been separately presented.
Performance Outlook
Economy
Pakistan is currently facing severe economic andpolitical difficulties. The manufacturing industry(accounting for around 25% of the GDP) is on thedecline, power management dilemma, mountingenergy crisis and weakening currency against majorcurrencies of the world are characteristics of oureconomy these days.
Poor law and order situation along with highlyvolatile security situation across Pakistan contributeto low investor confidence and have severelyimpaired the country's investment ratings globally.
Pakistan's search for additional foreign directinvestment has been hampered by concerns aboutthe security situation, domestic and regional politicaluncertainties, and questions about judicialtransparency.
The recent macroeconomic reforms taken by theGovernment have started showing positive resultsbut it would take time for those to materialize ata micro level.
20119 months
up toMarch 31
Sales - net 13,679 5,131 12,328 4,039Cost of sales -10,520 -3,802 -9,954 -3,538Gross profit 3,159 1,329 2,374 501Profit from operations 2,130 712 2,085 514Finance cost -1,634 -557 -1,511 -494Profit before tax 496 155 574 20Taxation -291 -160 -107 -67Profit/ (loss) before tax 205 -5 467 -47
Consolidated Financial Performance Rupees in million2010
Quarterup to
March 31
9 monthsup to
March 31
Quarterup to
March 31
Despite all the economic pressures, our group cameout with outstanding performance during the periodprimarily benefiting from the strong consumer baseand operational optimizations undertaken by themanagement where substantial amounts of marginswere driven by the holding company.
Paper division of the group on the other hand wasalso up to the mark in maintaining the sales level ofcomparable period last year. The margins however,declined due to higher input costs.
The consolidated sales and operating income increasedto Rs 13.6 billion from Rs 12.3 billion in the previousperiod yielding a growth of 11%. The consolidatedoperating profit for the year increased to Rs 2.1 billionas against Rs 2.0 billion in the previous periodregistering a growth of 2%.
The consolidated net profit before tax increased toRs 496 million from Rs 468 million in the previousperiod registering a growth of 6%.
Staff and Customers
We wish to record our appreciation of continuedcommitment of our employees and patronage of ourcustomers.
For and on behalf of the Board
Mian Raza ManshaChief Executive Officer
Lahore: 25 April 2011
D.G. Khan Cement Company Limited and its Subsidiary
24 20113rd QUARTER
D.G. Khan Cement Company Limited and its Subsidiary
March 31, June 30, 2011 2010
Unaudited AuditedNote (Rupees in thousand)
EQUITY AND LIABILITIES
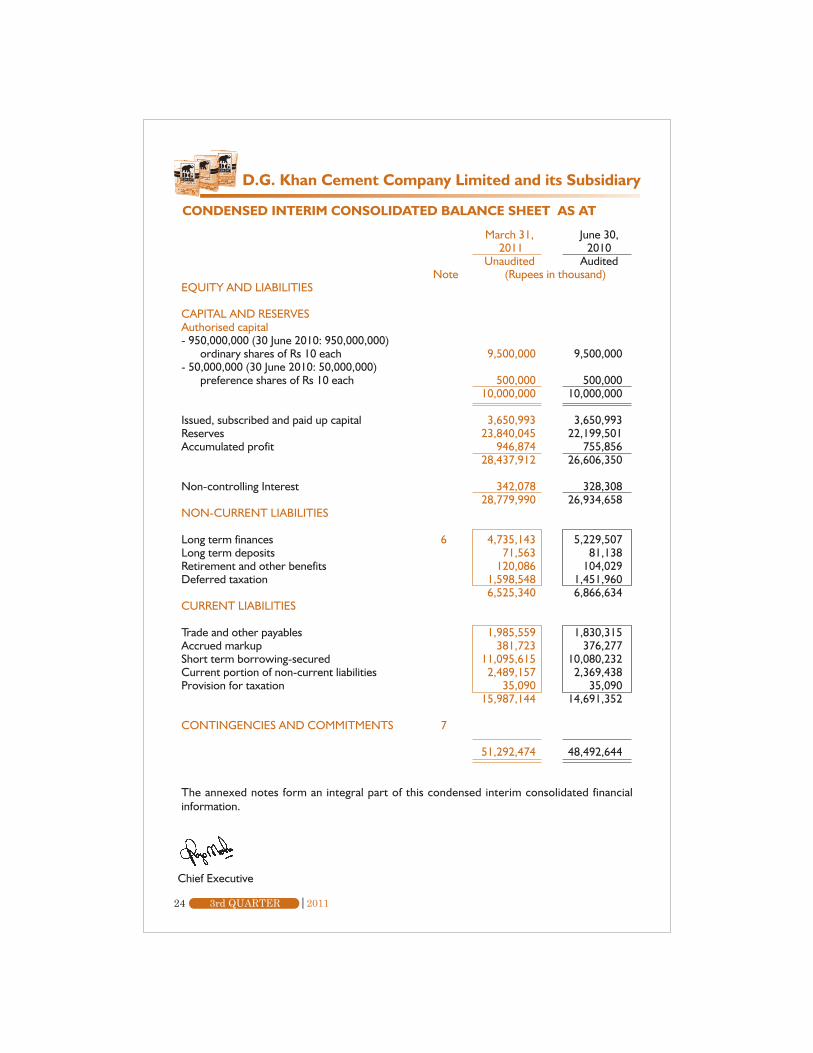
CAPITAL AND RESERVESAuthorised capital- 950,000,000 (30 June 2010: 950,000,000)
ordinary shares of Rs 10 each 9,500,000 9,500,000- 50,000,000 (30 June 2010: 50,000,000)
preference shares of Rs 10 each 500,000 500,00010,000,000 10,000,000
Issued, subscribed and paid up capital 3,650,993 3,650,993Reserves 23,840,045 22,199,501Accumulated profit 946,874 755,856
28,437,912 26,606,350
Non-controlling Interest 342,078 328,30828,779,990 26,934,658
NON-CURRENT LIABILITIES
Long term finances 6 4,735,143 5,229,507Long term deposits 71,563 81,138Retirement and other benefits 120,086 104,029Deferred taxation 1,598,548 1,451,960
6,525,340 6,866,634CURRENT LIABILITIES
Trade and other payables 1,985,559 1,830,315Accrued markup 381,723 376,277Short term borrowing-secured 11,095,615 10,080,232Current portion of non-current liabilities 2,489,157 2,369,438Provision for taxation 35,090 35,090
15,987,144 14,691,352
CONTINGENCIES AND COMMITMENTS 7
51,292,474 48,492,644
The annexed notes form an integral part of this condensed interim consolidated financialinformation.
CONDENSED INTERIM CONSOLIDATED BALANCE SHEET AS AT
Chief Executive
25 20113rd QUARTER
March 31, June 30, 2011 2010
Unaudited AuditedNote (Rupees in thousand)
ASSETS
NON-CURRENT ASSETS
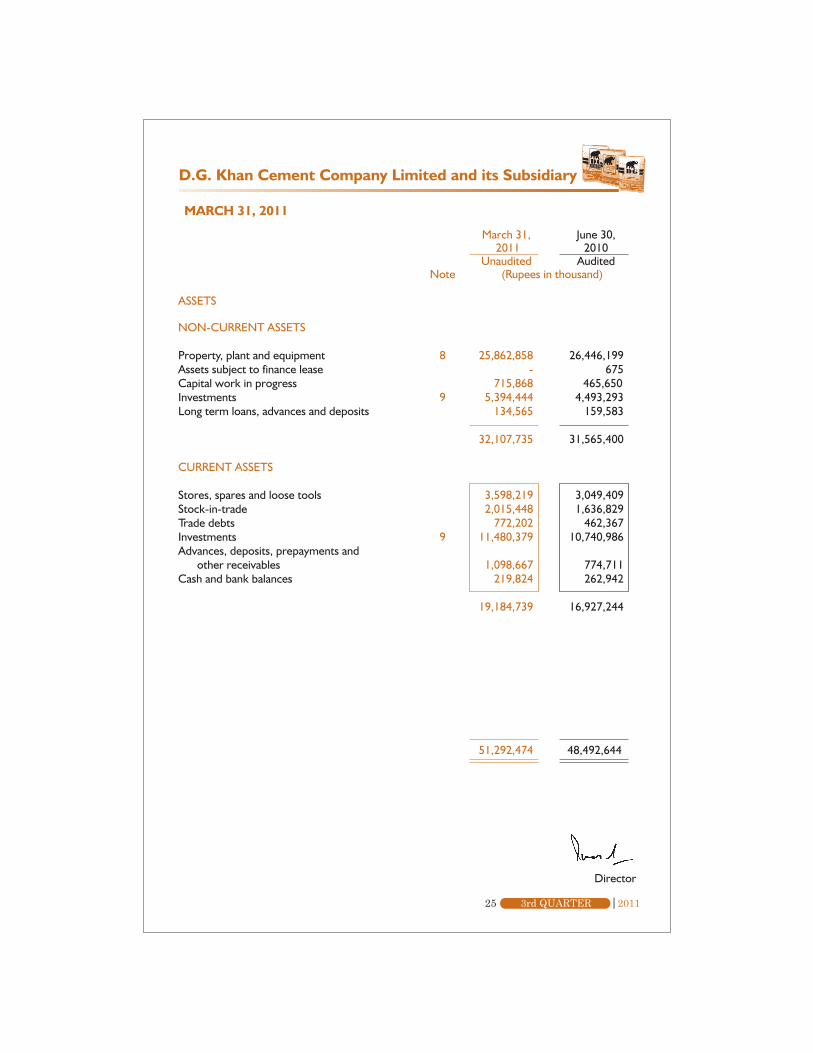
Property, plant and equipment 8 25,862,858 26,446,199Assets subject to finance lease - 675Capital work in progress 715,868 465,650Investments 9 5,394,444 4,493,293Long term loans, advances and deposits 134,565 159,583
32,107,735 31,565,400
CURRENT ASSETS
Stores, spares and loose tools 3,598,219 3,049,409Stock-in-trade 2,015,448 1,636,829Trade debts 772,202 462,367Investments 9 11,480,379 10,740,986Advances, deposits, prepayments and
other receivables 1,098,667 774,711Cash and bank balances 219,824 262,942
19,184,739 16,927,244
51,292,474 48,492,644
MARCH 31, 2011
Director
D.G. Khan Cement Company Limited and its Subsidiary
26 20113rd QUARTER
D.G. Khan Cement Company Limited and its Subsidiary
Chief Executive Director
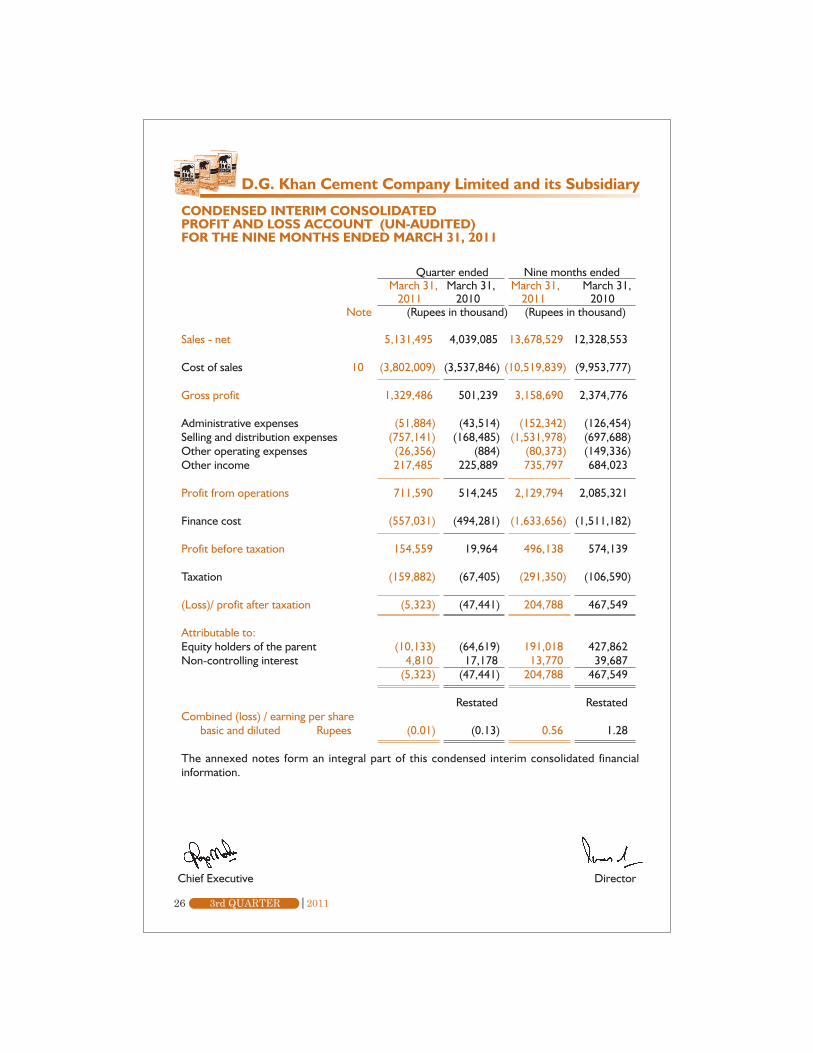
CONDENSED INTERIM CONSOLIDATEDPROFIT AND LOSS ACCOUNT (UN-AUDITED)FOR THE NINE MONTHS ENDED MARCH 31, 2011
Quarter ended Nine months ended March 31, March 31, March 31, March 31,
2011 2010 2011 2010Note (Rupees in thousand) (Rupees in thousand)
Sales - net 5,131,495 4,039,085 13,678,529 12,328,553
Cost of sales 10 (3,802,009) (3,537,846) (10,519,839) (9,953,777)
Gross profit 1,329,486 501,239 3,158,690 2,374,776
Administrative expenses (51,884) (43,514) (152,342) (126,454)Selling and distribution expenses (757,141) (168,485) (1,531,978) (697,688)Other operating expenses (26,356) (884) (80,373) (149,336)Other income 217,485 225,889 735,797 684,023
Profit from operations 711,590 514,245 2,129,794 2,085,321
Finance cost (557,031) (494,281) (1,633,656) (1,511,182)
Profit before taxation 154,559 19,964 496,138 574,139
Taxation (159,882) (67,405) (291,350) (106,590)
(Loss)/ profit after taxation (5,323) (47,441) 204,788 467,549
Attributable to:Equity holders of the parent (10,133) (64,619) 191,018 427,862Non-controlling interest 4,810 17,178 13,770 39,687
(5,323) (47,441) 204,788 467,549
Restated RestatedCombined (loss) / earning per share
basic and diluted Rupees (0.01) (0.13) 0.56 1.28
The annexed notes form an integral part of this condensed interim consolidated financialinformation.

27 20113rd QUARTER
CONDENSED INTERIM CONSOLIDATEDCASH FLOW STATEMENT (UN-AUDITED)FOR THE NINE MONTHS ENDED MARCH 31, 2011
Chief Executive Director
D.G. Khan Cement Company Limited and its Subsidiary
Nine months endedMarch 31, March 31,
2011 2010Note (Rupees in thousand)
Cash flows from operating activities
Cash generated from operations 12 1,148,786 2,958,768Financial cost paid (1,628,210) (1,645,658)Retirement and other benefits paid (11,418) (9,360)Taxes paid (213,503) (222,009)long term deposits - net (9,575) 6,096Net cash (used in)/ generated from operating activities (713,920) 1,087,837
Cash flows from investing activities
Capital expenditure including purchase of property, plant and equipment (854,715) (655,610)Proceeds from sale of investments - 126,554Proceeds from sale of property, plant and equipment 91,001 31,661Long term loans and deposits - net 25,018 2,147Interest received 49,129 20,370Dividend received 715,509 586,918Net cash from investing activities 25,942 112,040
Cash flows from financing activities
Proceeds from long term finances 1,350,000 1,000,000Repayment of long term finances (1,720,523) (2,177,371)Repayment of liabilities against assets subject to finance lease - (222)Net cash used in financing activities (370,523) (1,177,593)
Net (decrease)/ increase in cash and cash equivalents (1,058,501) 22,284
Cash and cash equivalents at the beginning of period (9,817,290) (9,185,842)
Cash and cash equivalents at the end of period 13 (10,875,791) (9,163,558)
The annexed notes form an integral part of this condensed interim consolidated financial information.

28 20113rd QUARTER
CONDENSED INTERIM CONSOLIDATEDSTATEMENT OF COMPREHENSIVE INCOME (UN-AUDITED)FOR THE NINE MONTHS ENDED MARCH 31, 2011
Chief Executive Director
D.G. Khan Cement Company Limited and its Subsidiary
Quarter ended Nine months ended March 31, March 31, March 31, March 31,
2011 2010 2011 2010(Rupees in thousand) (Rupees in thousand)
(Loss)/ profit after taxation (5,323) (47,441) 204,788 467,549
Other comprehensive income
Available for sale financial assets
- Change in fair value (1,458,661) 356,300 1,640,544 5,623,720- Realized gain through profit and loss account - - - (58,772)- Tax expense - - - -
Other comprehensive (loss)/ income for the period (1,458,661) 356,300 1,640,544 5,564,948
Total comprehensive (loss)/income for the period (1,463,984) 308,859 1,845,332 6,032,497
Attributable to:Equity holders of the parent (1,463,984) 308,859 1,845,332 6,032,497Non-controlling interest - - - -
(1,463,984) 308,859 1,845,332 6,032,497
The annexed notes form an integral part of this condensed interim consolidated financialinformation.
D.G. Khan Cement Company Limited and its Subsidiary
Chi
ef E
xecu
tive
Dire
ctor
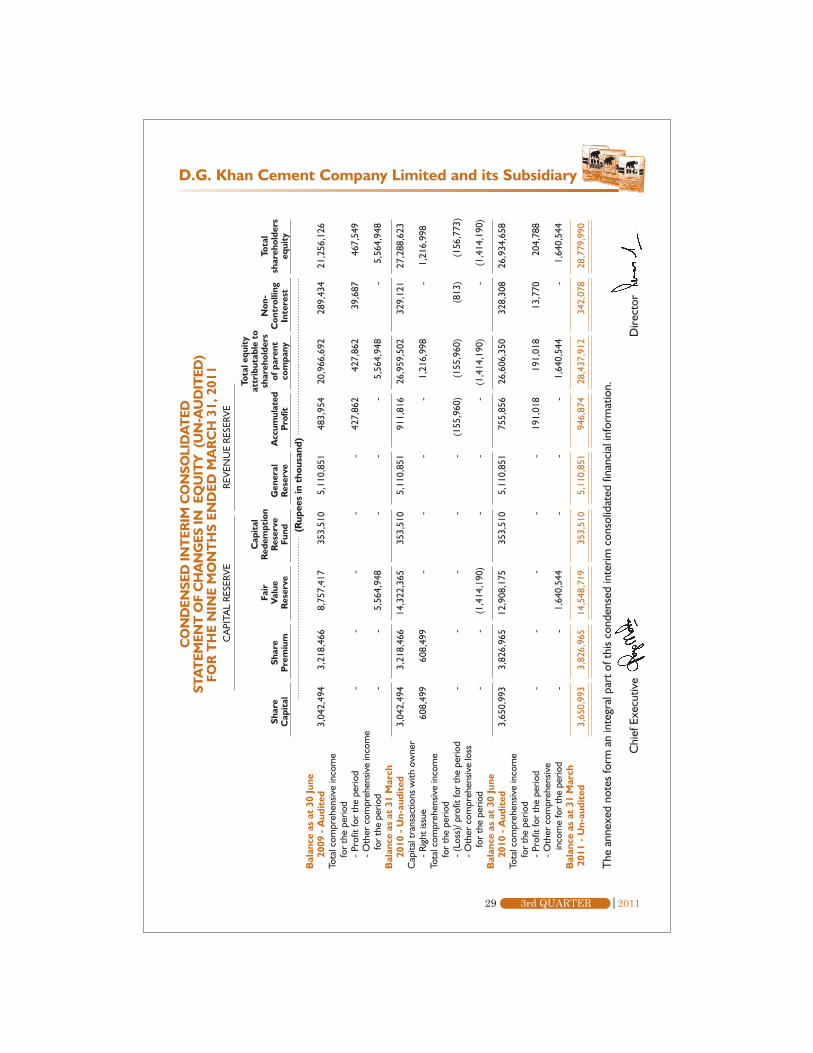
CO
ND
ENSE
D IN
TER
IM C
ON
SOLI
DA
TED
STA
TEM
ENT
OF
CH
AN
GES
IN E
QU
ITY
(U
N-A
UD
ITED
)FO
R T
HE
NIN
E M
ON
TH
S EN
DED
MA
RC
H 3
1, 2
011
Bal
ance
as
at 3
0 Ju
ne20
09 -
Aud
ited
3,04
2,49
43,
218,
466
8,75
7,41
735
3,51
05,
110,
851
483,
954
20,9
66,6
9228
9,43
421
,256
,126
Tota
l com
preh
ensiv
e in
com
efo
r th
e pe
riod
- Pro
fit fo
r th
e pe
riod
--
--
-42
7,86
242
7,86
239
,687
467,
549
- Oth
er c
ompr
ehen
sive
inco
me
fo
r th
e pe
riod
--
5,56
4,94
8-
--
5,56
4,94
8-
5,56
4,94
8B
alan
ce a
s at
31
Mar
ch20
10 -
Un-
audi
ted
3,04
2,49
43,
218,
466
14,3
22,3
6535
3,51
05,
110,
851
911,
816
26,9
59,5
0232
9,12
127
,288
,623
Cap
ital t
rans
actio
ns w
ith o
wne
r - R
ight
issu
e60
8,49
960
8,49
9-
--
-1,
216,
998
-1,
216,
998
Tota
l com
preh
ensiv
e in
com
efo
r th
e pe
riod
- (Lo
ss)/
pro
fit fo
r th
e pe
riod
--
--
-(1
55,9
60)
(155
,960
)(8
13)
(156
,773
)- O
ther
com
preh
ensiv
e lo
ss
for
the
perio
d-
-(1
,414
,190
)-
--
(1,4
14,1
90)
-(1
,414
,190
)B
alan
ce a
s at
30
June
2010
- A
udit
ed3,
650,
993
3,82
6,96
512
,908
,175
353,
510
5,11
0,85
175
5,85
626
,606
,350
328,
308
26,9
34,6
58To
tal c
ompr
ehen
sive
inco
me
for
the
perio
d- P
rofit
for
the
perio
d-
--
--
191,
018
191,
018
13,7
7020
4,78
8- O
ther
com
preh
ensiv
e
inco
me
for
the
perio
d-
-1,
640,
544
--
-1,
640,
544
-1,
640,
544
Bal
ance
as
at 3
1 M
arch
201
1 -
Un-
audi
ted
3,65
0,99
33,
826,
965
14,5
48,7
1935
3,51
05,
110,
851
946,
874
28,4
37,9
1234
2,07
828
,779
,990
The
ann
exed
not
es fo
rm a
n in
tegr
al p
art o
f thi
s co
nden
sed
inte
rim c
onso
lidat
ed fi
nanc
ial i
nfor
mat
ion.
CA
PITA
L RE
SERV
E
Shar
eC
apit
alSh
are
Pre
miu
m
Fair
Val
ueR
eser
ve
Cap
ital
Red
empt
ion
Res
erve
Fund
Gen
eral
Res
erve
Acc
umul
ated
Prof
it
Non
-C
ontr
ollin
gIn
tere
st
Tota
lsh
areh
olde
rseq
uity
(Rup
ees
in t
hous
and)
REVE
NU
E RE
SERV
E
29 20113rd QUARTER
Tota
l equ
ity
attr
ibut
able
to
shar
ehol
ders
of p
aren
tco
mpa
ny
1. Status and nature of business
The group comprises of:
- D. G. Khan Cement Company Limited, the parent company; and- Nishat Paper Products Company Limited, the subsidiary company.
The parent company is a public limited company incorporated in Pakistan and is listed onKarachi, Lahore and Islamabad Stock Exchanges. It is principally engaged in productionand sale of Clinker, Ordinary Portland and Sulphate Resistant Cement. The registeredoffice of the Company is situated at 53-A Lawrence Road, Lahore.
The subsidiary company is an unlisted public limited company incorporated in Pakistanunder the Companies Ordinance 1984 on July 23, 2004. It is principally engaged inmanufacture and sale of paper products and packaging material.
2. Basis of preparation
The condensed interim financial statements have been prepared in accordance withapproved accounting standards as applicable in Pakistan for interim financial reporting.The disclosures in the condensed interim financial information do not include the informationreported for full annual financial statements and sould therefore be read in conjunctionwith the financial statements for the year ended 30 June 2010.
3. Estimates
The preparation of the condensed interim financial information requires management tomake judgments, estimates and assumptions that affect the application of accountingpolicies and tge reported amounts of assets and liabilities, income and expensses. Actualresults may differ from these estimates. In preparing this financial information the significantjudgments made by the management in applying accounting policies, key estimates anduncertainty includes:
- Residual value and useful life estimation of fixed assets- Taxation- Retirement and other benefits- Provisions and contingencies- Fair value of derivatives
4. Significant accounting policies
4.1 The accounting policies and methods of computation adopted in the preparation ofthe interim financial information are generally based on the same policies and methodsas applied in preparation of the annual financial statements for the year ended 30 June2010.
CONDENSED INTERIM CONSOLIDATEDNOTES TO THE FINANCIAL INFORMATION (UN-AUDITED)FOR THE NINE MONTHS ENDED MARCH 31, 2011
30 20113rd QUARTER
D.G. Khan Cement Company Limited and its Subsidiary
4.2 In addition to above, following amendments to the International Financial ReportingStandards/ International Accounting Standards are mandatory for the first time for thefinancial year beginning on or after January 1, 2011, however, the adoption of theseamendments is either not yet effective of the amendments did not have any significantimpact on the financial information of the group.
- IFRS 7 (amendment) - Disclosures - Transfers of Financial Assets- IAS 12 (amendment) - Deferred Tax on Investment Property- IAS 24 (Revised) - Related Party Disclosures- IAS 32 (amendment) - Financial Instruments: Presentation - Classification of Right Issues- IFRIC 14 (amendment) - The Limit on a Defined Benefit Assets - Minimum Funding Requirements- IFRIC 19 (amendment) - Extinguishing financial liabilities with equity instruments
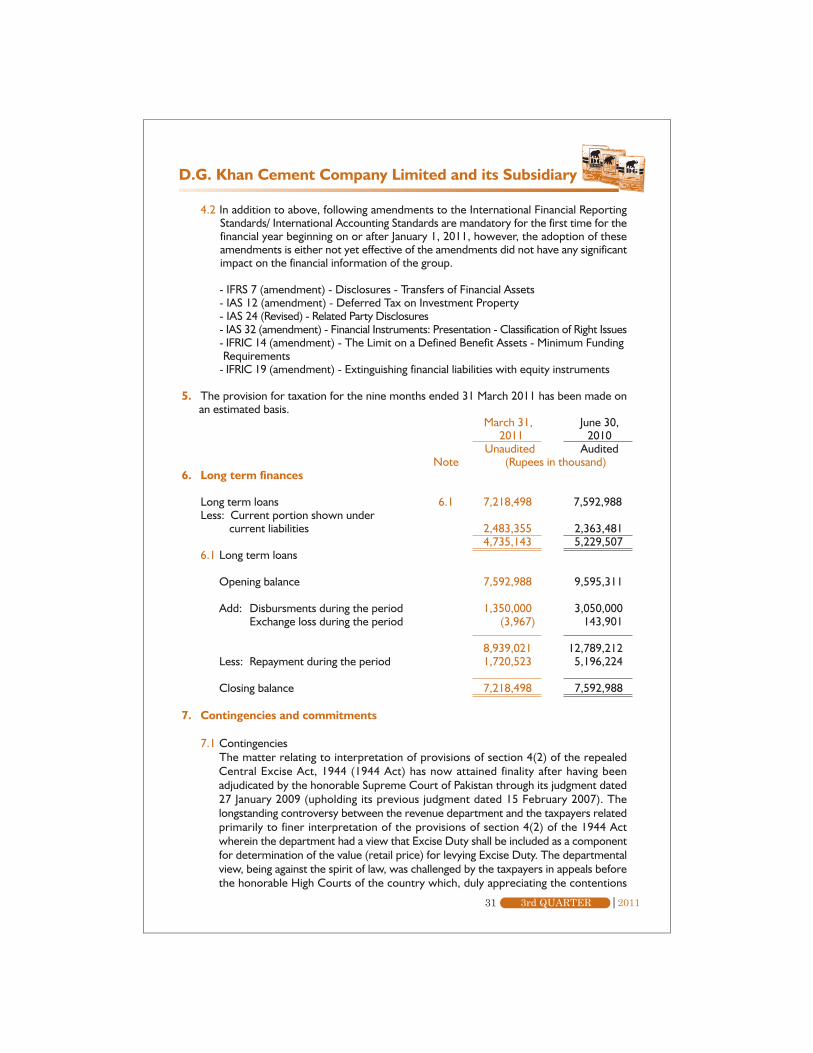
5. The provision for taxation for the nine months ended 31 March 2011 has been made onan estimated basis.
March 31, June 30, 2011 2010
Unaudited AuditedNote (Rupees in thousand)
6. Long term finances
Long term loans 6.1 7,218,498 7,592,988Less: Current portion shown under
current liabilities 2,483,355 2,363,4814,735,143 5,229,507
6.1 Long term loans
Opening balance 7,592,988 9,595,311
Add: Disbursments during the period 1,350,000 3,050,000Exchange loss during the period (3,967) 143,901
8,939,021 12,789,212Less: Repayment during the period 1,720,523 5,196,224
Closing balance 7,218,498 7,592,988
7. Contingencies and commitments
7.1 ContingenciesThe matter relating to interpretation of provisions of section 4(2) of the repealedCentral Excise Act, 1944 (1944 Act) has now attained finality after having beenadjudicated by the honorable Supreme Court of Pakistan through its judgment dated27 January 2009 (upholding its previous judgment dated 15 February 2007). Thelongstanding controversy between the revenue department and the taxpayers relatedprimarily to finer interpretation of the provisions of section 4(2) of the 1944 Actwherein the department had a view that Excise Duty shall be included as a componentfor determination of the value (retail price) for levying Excise Duty. The departmentalview, being against the spirit of law, was challenged by the taxpayers in appeals beforethe honorable High Courts of the country which, duly appreciating the contentions
31 20113rd QUARTER
D.G. Khan Cement Company Limited and its Subsidiary

32 20113rd QUARTER
D.G. Khan Cement Company Limited and its Subsidiary
of the taxpayers, overturned the departmental view and succeeded the appeals.
Now since the controversy has attained finality up to the highest appellate level, the parentcompany has initiated the process of claiming refund of excess excise duty paid by it duringthe periods from 1994 to 1999 which aggregates to Rs 1,115.145 million. The amount ofrefund, however, shall be incorporated in the books of accounts once it is realized by theparent company.
7.2 There is no significant change in contingencies from the annual financial statements of thegroup for the year ended 30 June 2010 except for as mentioned above.
7.3 Commitments in respect of
(i) Contracts for capital expenditure Rs 146.972 million (30 June 2010: Rs 115.335million).
(ii) Letters of credit for capital expenditure Rs1,643.999 million (30 June 2010: Rs 41.891million).
(iii) Letters of credit other than capital expenditure Rs 858.074 million (30 June 2010:Rs 1,547.811 million).
March 31, June 30, 2011 2010
Unaudited AuditedNote (Rupees in thousand)
8. Property, Plant and Equipment
Opening book value 26,446,199 25,550,453
Add: Additions during the period/year 8.1 602,919 2,367,462Transfer in during the period/year 1,578 -
604,497 2,367,462Less: Disposals during the
period /year - net book value 87,677 32,112Depreciation charged during the period/year 1,100,161 1,439,604
1,187,838 1,471,716Closing book value 25,862,858 26,446,199
8.1 Major additions during the periodLand 410 -Building on freehold land 103,140 168,806Roads 2,182 18,279Plant and machinery 434,209 2,102,688Furniture, fixtures and office equipment 15,365 15,364Motor vehicles 47,613 15,023Power and water supply lines - 47,302
602,919 2,367,462
March 31, June 30, 2011 2010
Unaudited Audited(Rupees in thousand)
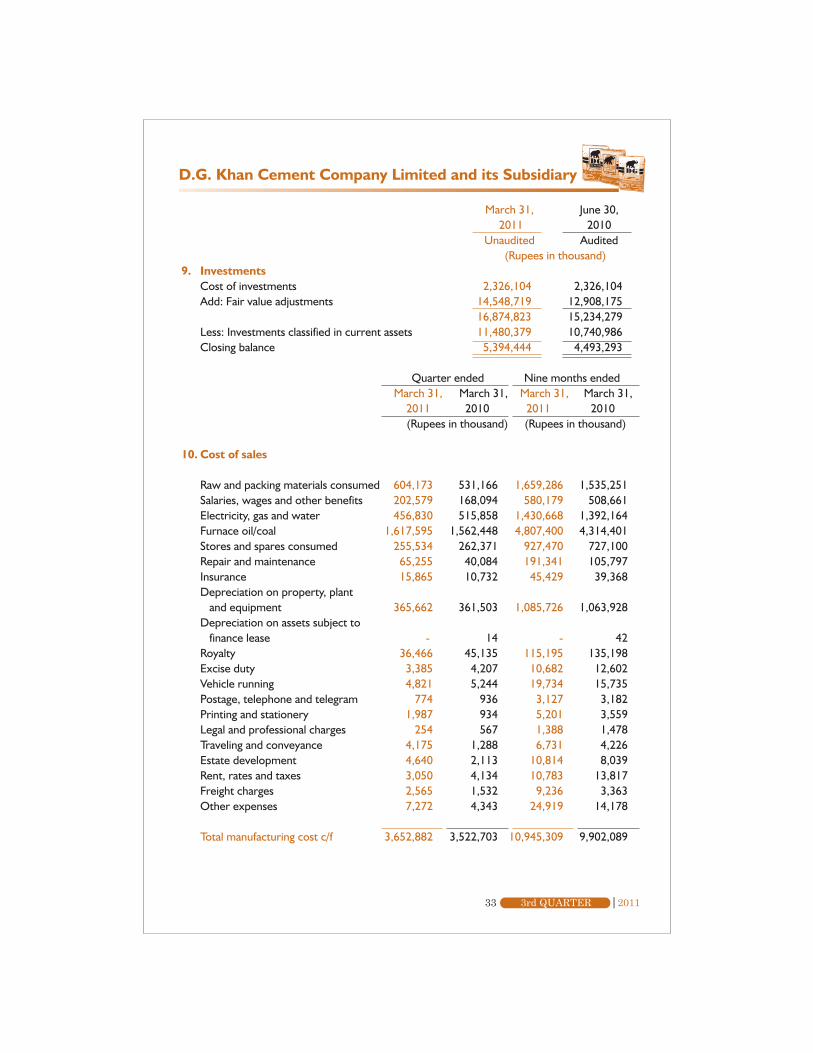
9. InvestmentsCost of investments 2,326,104 2,326,104Add: Fair value adjustments 14,548,719 12,908,175
16,874,823 15,234,279Less: Investments classified in current assets 11,480,379 10,740,986Closing balance 5,394,444 4,493,293
Quarter ended Nine months ended March 31, March 31, March 31, March 31,
2011 2010 2011 2010(Rupees in thousand) (Rupees in thousand)
10. Cost of sales
Raw and packing materials consumed 604,173 531,166 1,659,286 1,535,251Salaries, wages and other benefits 202,579 168,094 580,179 508,661Electricity, gas and water 456,830 515,858 1,430,668 1,392,164Furnace oil/coal 1,617,595 1,562,448 4,807,400 4,314,401Stores and spares consumed 255,534 262,371 927,470 727,100Repair and maintenance 65,255 40,084 191,341 105,797Insurance 15,865 10,732 45,429 39,368Depreciation on property, plant and equipment 365,662 361,503 1,085,726 1,063,928Depreciation on assets subject to finance lease - 14 - 42Royalty 36,466 45,135 115,195 135,198Excise duty 3,385 4,207 10,682 12,602Vehicle running 4,821 5,244 19,734 15,735Postage, telephone and telegram 774 936 3,127 3,182Printing and stationery 1,987 934 5,201 3,559Legal and professional charges 254 567 1,388 1,478Traveling and conveyance 4,175 1,288 6,731 4,226Estate development 4,640 2,113 10,814 8,039Rent, rates and taxes 3,050 4,134 10,783 13,817Freight charges 2,565 1,532 9,236 3,363Other expenses 7,272 4,343 24,919 14,178
Total manufacturing cost c/f 3,652,882 3,522,703 10,945,309 9,902,089
33 20113rd QUARTER
D.G. Khan Cement Company Limited and its Subsidiary
34 20113rd QUARTER
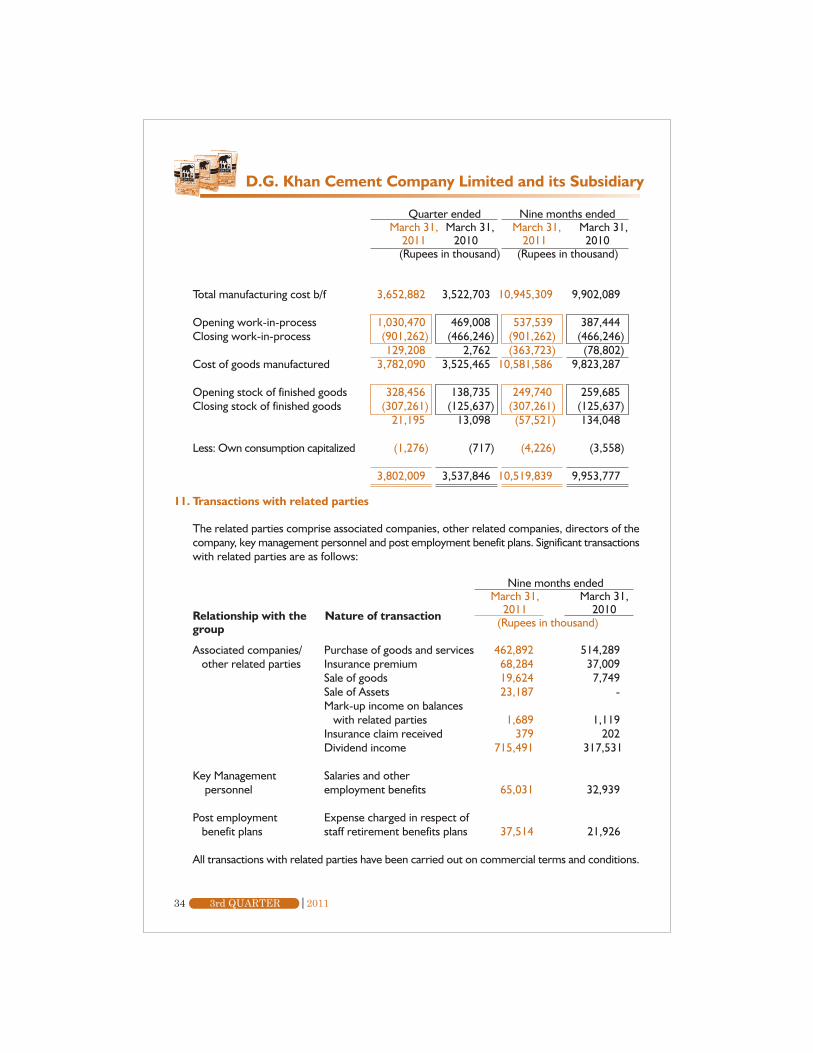
11. Transactions with related parties
The related parties comprise associated companies, other related companies, directors of thecompany, key management personnel and post employment benefit plans. Significant transactionswith related parties are as follows:
Nine months ended March 31, March 31,
2011 2010(Rupees in thousand)
Associated companies/ Purchase of goods and services 462,892 514,289 other related parties Insurance premium 68,284 37,009
Sale of goods 19,624 7,749Sale of Assets 23,187 -Mark-up income on balances with related parties 1,689 1,119Insurance claim received 379 202Dividend income 715,491 317,531
Key Management Salaries and other personnel employment benefits 65,031 32,939
Post employment Expense charged in respect of benefit plans staff retirement benefits plans 37,514 21,926
All transactions with related parties have been carried out on commercial terms and conditions.
Relationship with the Nature of transactiongroup
Quarter ended Nine months ended March 31, March 31, March 31, March 31,
2011 2010 2011 2010(Rupees in thousand) (Rupees in thousand)
Total manufacturing cost b/f 3,652,882 3,522,703 10,945,309 9,902,089
Opening work-in-process 1,030,470 469,008 537,539 387,444Closing work-in-process (901,262) (466,246) (901,262) (466,246)
129,208 2,762 (363,723) (78,802)Cost of goods manufactured 3,782,090 3,525,465 10,581,586 9,823,287
Opening stock of finished goods 328,456 138,735 249,740 259,685Closing stock of finished goods (307,261) (125,637) (307,261) (125,637)
21,195 13,098 (57,521) 134,048
Less: Own consumption capitalized (1,276) (717) (4,226) (3,558)
3,802,009 3,537,846 10,519,839 9,953,777
D.G. Khan Cement Company Limited and its Subsidiary
Nine months ended March 31, March 31,
2011 2010(Rupees in thousand)
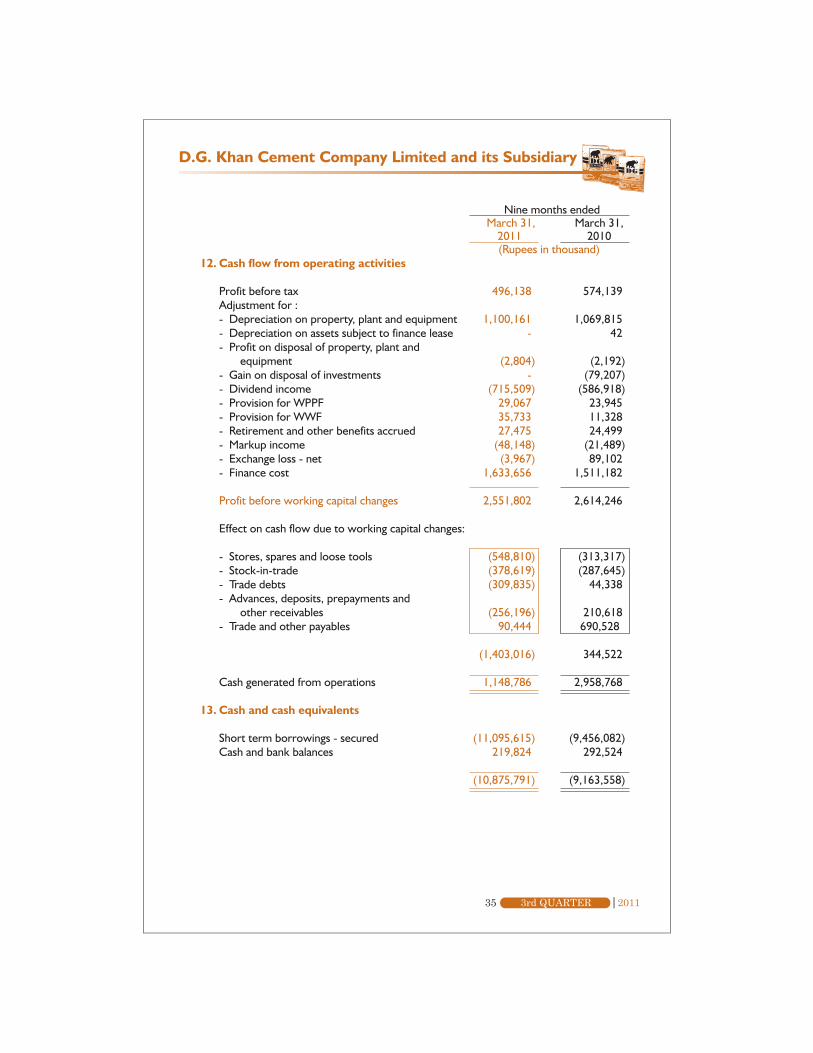
12. Cash flow from operating activities
Profit before tax 496,138 574,139Adjustment for :- Depreciation on property, plant and equipment 1,100,161 1,069,815- Depreciation on assets subject to finance lease - 42- Profit on disposal of property, plant and equipment (2,804) (2,192)- Gain on disposal of investments - (79,207)- Dividend income (715,509) (586,918)- Provision for WPPF 29,067 23,945- Provision for WWF 35,733 11,328- Retirement and other benefits accrued 27,475 24,499- Markup income (48,148) (21,489)- Exchange loss - net (3,967) 89,102- Finance cost 1,633,656 1,511,182
Profit before working capital changes 2,551,802 2,614,246
Effect on cash flow due to working capital changes:
- Stores, spares and loose tools (548,810) (313,317)- Stock-in-trade (378,619) (287,645)- Trade debts (309,835) 44,338- Advances, deposits, prepayments and other receivables (256,196) 210,618- Trade and other payables 90,444 690,528
(1,403,016) 344,522
Cash generated from operations 1,148,786 2,958,768
13. Cash and cash equivalents
Short term borrowings - secured (11,095,615) (9,456,082)Cash and bank balances 219,824 292,524
(10,875,791) (9,163,558)
35 20113rd QUARTER
D.G. Khan Cement Company Limited and its Subsidiary
36 20113rd QUARTER
D.G. Khan Cement Company Limited and its Subsidiary
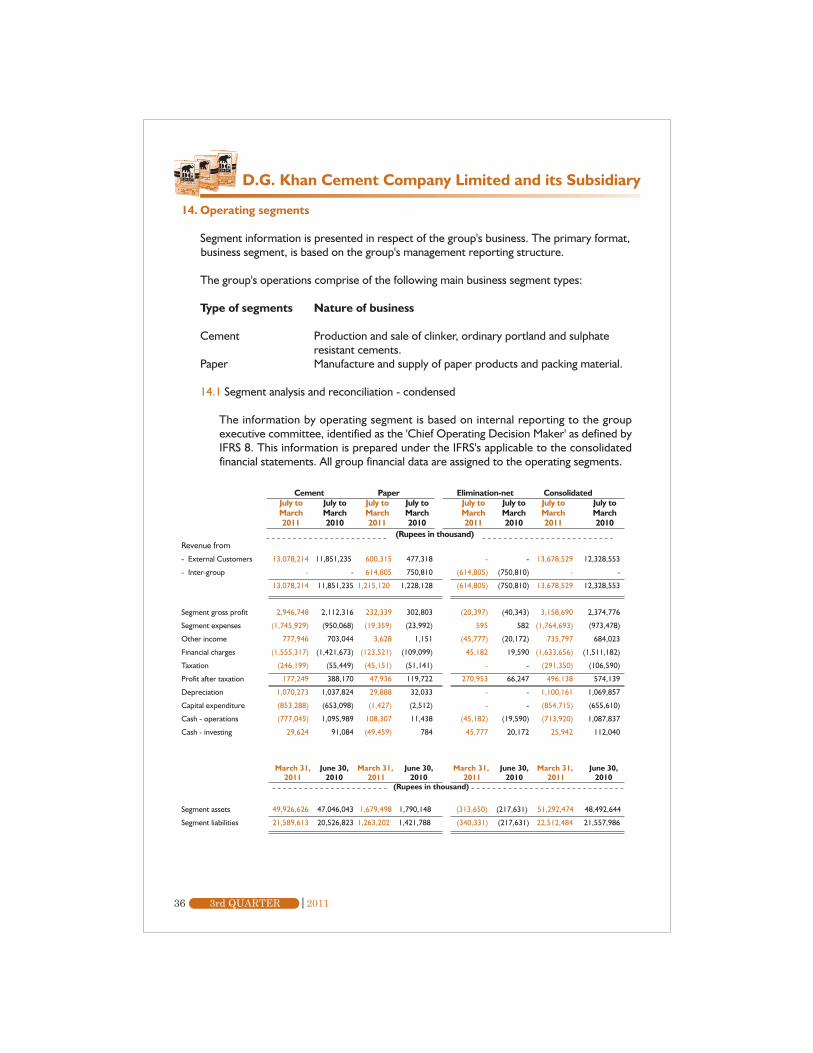
14. Operating segments
Segment information is presented in respect of the group's business. The primary format,business segment, is based on the group's management reporting structure.
The group's operations comprise of the following main business segment types:
Type of segments Nature of business
Cement Production and sale of clinker, ordinary portland and sulphateresistant cements.
Paper Manufacture and supply of paper products and packing material.
14.1 Segment analysis and reconciliation - condensed
The information by operating segment is based on internal reporting to the groupexecutive committee, identified as the 'Chief Operating Decision Maker' as defined byIFRS 8. This information is prepared under the IFRS's applicable to the consolidatedfinancial statements. All group financial data are assigned to the operating segments.
Cement Paper Elimination-net ConsolidatedJuly to July to July to July to July to July to July to July toMarch March March March March March March March2011 2010 2011 2010 2011 2010 2011 2010
(Rupees in thousand)Revenue from
- External Customers 13,078,214 11,851,235 600,315 477,318 - - 13,678,529 12,328,553
- Inter-group - - 614,805 750,810 (614,805) (750,810) - -
13,078,214 11,851,235 1,215,120 1,228,128 (614,805) (750,810) 13,678,529 12,328,553
Segment gross profit 2,946,748 2,112,316 232,339 302,803 (20,397) (40,343) 3,158,690 2,374,776
Segment expenses (1,745,929) (950,068) (19,359) (23,992) 595 582 (1,764,693) (973,478)
Other income 777,946 703,044 3,628 1,151 (45,777) (20,172) 735,797 684,023
Financial charges (1,555,317) (1,421,673) (123,521) (109,099) 45,182 19,590 (1,633,656) (1,511,182)
Taxation (246,199) (55,449) (45,151) (51,141) - - (291,350) (106,590)
Profit after taxation 177,249 388,170 47,936 119,722 270,953 66,247 496,138 574,139
Depreciation 1,070,273 1,037,824 29,888 32,033 - - 1,100,161 1,069,857
Capital expenditure (853,288) (653,098) (1,427) (2,512) - - (854,715) (655,610)
Cash - operations (777,045) 1,095,989 108,307 11,438 (45,182) (19,590) (713,920) 1,087,837
Cash - investing 29,624 91,084 (49,459) 784 45,777 20,172 25,942 112,040
March 31, June 30, March 31, June 30, March 31, June 30, March 31, June 30,2011 2010 2011 2010 2011 2010 2011 2010
(Rupees in thousand)
Segment assets 49,926,626 47,046,043 1,679,498 1,790,148 (313,650) (217,631) 51,292,474 48,492,644
Segment liabilities 21,589,613 20,526,823 1,263,202 1,421,788 (340,331) (217,631) 22,512,484 21,557,986
D.G. Khan Cement Company Limited and its Subsidiary
37 20113rd QUARTER
14.2 Geographical segments
All segments of the group are managed on nation-wide basis and operate manufacturing facilities and sales offices in Pakistan only.
15. Date of authorization
This interim financial information was authorized for issue by the Board of Directors of theparent company on 25 April 2011.
16. Corresponding figures
In order to comply with the requirements of the International Accounting Standard 34:'Interim Financial Reporting', the condensed interim consolidated balance sheet and condensedinterim consolidated statement of changes in equity have been compared with the balancesof annual audited financial statements of preceding year, whereas, the condensed interimconsolidated profit and loss account, condensed interim consolidated statement ofcomprehensive income and condensed interim consolidated cash flow statement have beencompared with the balances of comparable period of immediately preceding year.
Corresponding figures have been re-arranged wherever necessary for the purposes ofcomparison, however, no significant re-arrangements have been made.
Figures have been rounded off to the nearest thousand of rupees.
Chief Executive Director