Embed Size (px)
Citation preview
PT Panin Sekuri tas , Tbk.
6 November 2010
Net Asset Value:
10 ,093 Bio
NAV/Unit :
3,060.0699
Profil DF PANS Bandung
Strategy Trading
Margin Max 30% Yes
Management Fee 3% p.a.
Risk Very High
Report Bi Weekly
Redemption February
July
Administration PT Panin
Sekuritas,
Tbk.
Bandung
D ISCRETIONARY FUND
PANS BANDUNG
Fund Manager
Dr. Adrian Teja
Sunda No. 2A Bandung
Phone: 022-7321434
Fax: 022-7321435
The performance data shown represent past performance, which is not a guarantee of future results. Invest-
ment returns and principal value will fluctuate, when sold, may be worth more or less than their original cost.
Current performance may be lower or higher than the performance data cited.
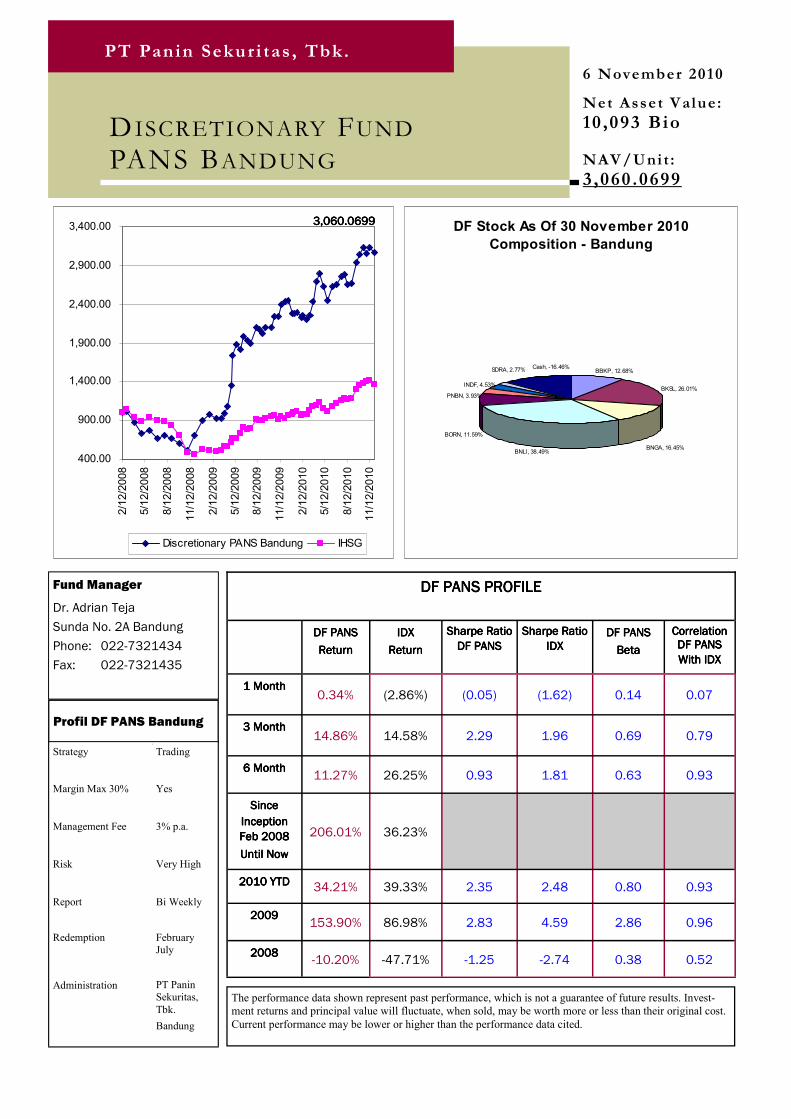
DF PANS PROFILEDF PANS PROFILEDF PANS PROFILEDF PANS PROFILE
DF PANSDF PANSDF PANSDF PANS
ReturnReturnReturnReturn
IDXIDXIDXIDX
ReturnReturnReturnReturn
6 Month6 Month6 Month6 Month 11.27% 26.25%
1 Month1 Month1 Month1 Month 0.34% (2.86%)
3 Month3 Month3 Month3 Month 14.86% 14.58%
Sharpe Ratio Sharpe Ratio Sharpe Ratio Sharpe Ratio
DF PANSDF PANSDF PANSDF PANS
(0.05)
2.29
0.93
Sharpe Ratio Sharpe Ratio Sharpe Ratio Sharpe Ratio
IDXIDXIDXIDX
(1.62)
1.96
1.81
DF PANSDF PANSDF PANSDF PANS
BetaBetaBetaBeta
0.14
0.69
0.63
Correlation Correlation Correlation Correlation DF PANS DF PANS DF PANS DF PANS
With IDXWith IDXWith IDXWith IDX
0.07
0.79
0.93
Since Since Since Since
Inception Inception Inception Inception
Feb 2008Feb 2008Feb 2008Feb 2008
Until NowUntil NowUntil NowUntil Now
206.01% 36.23%
2010 YTD2010 YTD2010 YTD2010 YTD 34.21% 39.33% 2.35 2.48 0.80 0.93
2009200920092009 153.90% 86.98% 2.83 4.59 2.86 0.96
2008200820082008 -10.20% -47.71% -1.25 -2.74 0.38 0.52
400.00
900.00
1,400.00
1,900.00
2,400.00
2,900.00
3,400.00
2/1
2/2
008
5/1
2/2
008
8/1
2/2
008
11/1
2/2
008
2/1
2/2
009
5/1
2/2
009
8/1
2/2
009
11/1
2/2
009
2/1
2/2
010
5/1
2/2
010
8/1
2/2
010
11/1
2/2
010
Discretionary PANS Bandung IHSG
3,060.06993,060.06993,060.06993,060.0699 DF Stock As Of 30 November 2010
Composition - Bandung
PNBN, 3.93%
SDRA, 2.77%Cash, -16.46%
BNGA, 16.45%
BORN, 11.59%
BNLI, 38.49%
BKSL, 26.01%
BBKP, 12.68%
INDF, 4.53%