Embed Size (px)
Citation preview
Lake Gage and Lime Lake Aquatic Vegetation Management Plan
Steuben County, Indiana
2012 – 2016
Prepared for:
The Lake Gage and Lime Lake Association, Inc. 6080 West Orland Road
Angola, Indiana
Prepared by:
Aquatic Weed Control P. O. Box 325
Syracuse, IN 46567
2 Executive Summary The following report outlines a long-term aquatic plant management strategy for Lake Gage and Lime Lake in Steuben County Indiana. Lake Gage has 327 surface acres with a maximum depth of 72 feet and an average depth of 30 feet. Lime Lake has 30 surface acres with a maximum depth of 26 feet and an average depth of 10.9 feet. Eurasian watermilfoil (Myriophyllum spicatum) has colonized areas of these lakes and is present mainly in areas with depths of 10 feet or less. Aquatic Weed Control was contracted to conduct aquatic vegetation surveys and propose a vegetation management plan based on the results of these surveys. Funding for this plan was provided by the Lake Gage and Lime Lake Association and the Indiana Department of Natural Resources (IDNR) through the Lake and River Enhancement (LARE) program. Based on the results of vegetation surveys, as well as interaction with association members, lake users, and IDNR biologists, the following plan outlines steps to help reach the three major management goals established by the IDNR for all Indiana public lakes, including those applying for LARE funding. These three goals are listed below.
1. Develop or maintain a stable, diverse aquatic plant community that supports a good balance of predator and prey fish and wildlife species and good water quality and is resistant to minor habitat disturbances and invasive species.
2. Direct efforts to preventing and/or controlling the negative impacts of aquatic invasive
species. 3. Provide reasonable public recreational access while minimizing the negative impacts on
plant and wildlife resources. In 2012, Aquatic Weed Control conducted two aquatic vegetation surveys to characterize the plant communities of Lake Gage and Lime Lake. An early season quantitative survey (Tier II) was conducted on June 8, 2012 and a late season Tier II survey was conducted on August 15, 2012. Each survey followed protocol established by the IDNR to evaluate the health of aquatic plant community The 2012 vegetation surveys of Lake Gage and Lime Lake found a plant community with above average species diversity (0.75 and 0.85) when compared to diversity in Pearson’s (2004) study of 21 northern Indiana lakes (0.66). Eight different plant species were collected in Lake Gage in the August 2012 survey while 11 species were found in Lime Lake. The invasive plant Eurasian watermilfoil (EWM) was found in both lakes, while the invasive plant curly-leaf pondweed (Potamogeton crispus) was found only in Lime Lake. Site frequency of EWM in Lake Gage was 8.6 percent in June and 11.4 percent in August. EWM frequency in Lime Lake was 26.7 percent in June and 30.0 percent in August. This plant species provides less than desirable fish habitat, can crowd out beneficial native plant species, and can impair recreation when present in great abundance. Given the fact that EWM levels are relatively low in Gage and Lime Lakes when compared to many Indiana lakes, it may not be necessary to treat areas of EWM if they are not expanding. For this reason, the association may choose to monitor the EWM population each year through vegetation surveys. If the EWM population remains stable without treatment, this would provide a cost savings to the association.
3 For 2013, the association could decide to move forward with EWM treatments or use standardized tier II vegetation surveys to monitor plant populations. Regardless of whether EWM treatments take place, a summer tier II vegetation survey is recommended for Gage and Lime Lakes in 2013. If the association decides to treat areas of EWM infestation, funding may be awarded by the LARE program in 2013 to help with the cost. Chemical treatment options for selective, root control of Eurasian watermilfoil include the following herbicides: Sonar (active ingredient: fluridone), Renovate (active ingredient: triclopyr), and DMA-4 (active ingredient 2, 4-D). Renovate and 2, 4-D, while very effective, are normally applied to the same areas on a yearly basis to provide control. Sonar provides very complete control for multiple years although the entire water column must be treated. Sonar herbicide is not effective if the entire lake’s volume is not treated. It is important to note that Eurasian watermilfoil will be the only plant species specifically targeted in this project, as LARE funds will only be awarded for the control of invasive plant species. The goal is not to eliminate vegetation but to improve the health of the plant community. Native vegetation will still be abundant in shallow areas after treatment, and control of natives (if needed) must be privately funded. The following specific measurable objectives are recommended to evaluate treatment success at Lake Gage and Lime Lake:
1. Reduce EWM site frequency to 10 percent or less each year in the summer (post treatment) tier II survey in Lime Lake.
2. Maintain EWM frequency below 10 percent each year in the summer tier II survey in Lake Gage.
3. Maintain at least 8 native plant species collected each year in Lime Lake and a native diversity of 0.79.
4. Maintain at least 6 native plant species collected each year in Lake Gage and a native diversity of 0.62.
EWM is not likely to be permanently eradicated from these lakes with this or any other treatment strategy. A reduction in EWM acreage from year to year has been observed in certain situations but should not be expected. EWM acreage will likely remain consistent from year to year, but if these measurable goals are met, it will be a good indication that treatments are successfully controlling EWM and providing better lake access without harming beneficial native vegetation. Treatment Specifications Total EWM acreage in Gage and Lime Lakes is estimated at 26 acres. It is recommended that these 26 acres be treated with a Diquat herbicide early in the season (April or early May) for selective EWM control. This treatment will take place before native plants are actively growing and should not harm them. Diquat will be applied at a rate of 2.0 gallons per surface acre. It is also recommended that funds be set aside to treat areas of EWM re-growth later in the summer of 2013. Areas of re-growth will be treated with liquid DMA-4. Liquid DMA-4 can achieve selective control or EWM even when native plants are actively growing, which would be the case later in summer. 2013 Budget Cost Estimate Treat up to 26 acres of EWM with Diquat (2 gal/ac) $ 7,800 Treat up to 10 acres of EWM re-growth with liquid DMA-4 (2ppm) $ 3,500 Spring visual survey, summer Tier II survey and AVMP update $ 5,000 Total Cost Estimate and Grant Request $ 16,300 LARE share (80%-subject to availability) $ 13,040 Associations share $ 3,260
4
Table of Contents
Executive Summary ........................................................................................................................ 2
Table of Contents ............................................................................................................................ 4
List of Figures ................................................................................................................................. 5
List of Tables ................................................................................................................................... 5
Watershed and Water Body Characteristics .................................................................................... 6
Water Quality Data ........................................................................................................................ 11
Existing Studies ............................................................................................................................. 12
Problem Statement ........................................................................................................................ 16
Vegetation Management History ................................................................................................... 16
Aquatic Plant Community Characterization .................................................................................. 16
Tier II Survey Methods ................................................................................................................. 16
Tier II Survey Results .................................................................................................................... 18
Secchi Depth and Historical Water Quality Trends ...................................................................... 19
Tier II Data by Depth Contour ...................................................................................................... 19
Threatened and Endangered Species ............................................................................................. 24
Discussion of Tier II Results ......................................................................................................... 29
Public Involvement ........................................................................................................................ 30
Objectives ...................................................................................................................................... 32
Action Plan .................................................................................................................................... 32
Permitting and Acceptability to Users ........................................................................................... 37
Project Budget ............................................................................................................................... 37
Project Monitoring and Evaluation ............................................................................................... 37
Sources for Future Funding ........................................................................................................... 38
5 References Cited ............................................................................................................................ 39
Appendix ....................................................................................................................................... 41
Potential Management Options ..................................................................................................... 44
Data Sheets .................................................................................................................................... 46
IDNR Vegetation Control Permit .................................................................................................. 56
List of Figures
Figure 1: Fawn River Watershed (Steuben County Soil and Water Conservation District) ..................... 6 Figure 2: Gage and Lime Lakes Watershed .............................................................................................. 7 Figure 3: Gage and Lime Land Use .......................................................................................................... 8 Figure 4: Lake Gage and Lime Lake - Lake Uses ................................................................................... 10 Figure 5: Lake Gage Dissolved Oxygen Profile- 2012 ........................................................................... 11 Figure 6: Lake Gage Temperature Profile - 2012 ................................................................................... 12 Figure 7: Lake Gage and Lime Lakes - Tier II Sample Locations .......................................................... 18 Figure 8: Lake Gage and Lime Lake- 2012 EWM Beds ......................................................................... 28 Figure 9: Lake Gage and Lime Lake Public Survey Results .................................................................. 31 Figure 10: EWM Herbicide Options ....................................................................................................... 34 Figure 11: Lake Gage and Lime Lake - 2013 Potential EWM Treatment Areas .................................... 36
List of Tables Table 1: Gage and Lime Land Use Table .................................................................................................. 9 Table 2: Lake Gage Fisheries Data - 1983 .............................................................................................. 14 Table 3: Lime Lake Fisheries Data - 1983 .............................................................................................. 15 Table 4: Lake Gage and Lime Lake Treatment History .......................................................................... 16 Table 5: Lake Gage Historical Secchi Depths (Indiana Clean Lakes Program, 2011) ........................... 19 Table 6: Lime Lake June 2012 Tier II Data ............................................................................................ 20 Table 7: Lime Lake August 2012 Tier II Data ........................................................................................ 21 Table 8: Lake Gage June 2012 Tier II Data ............................................................................................ 22 Table 9: Lake Gage August 2012 Tier II Data ........................................................................................ 23 Table 10: Lime Lake Multi-Year Data Presentation ............................................................................... 25 Table 11: Lake Gage Multi-Year Data Presentation ............................................................................... 26 Table 12: Lake Gage and Lime Lakes ..................................................................................................... 29 Table 13: Lake Gage and Lime Lake - 2013 Treatment Area Details .................................................... 36 Table 14: Lake Gage and Lime Lakes - Project Budget ......................................................................... 37 Table 15: LARE Program Dates and Deadlines ...................................................................................... 38
6 Watershed and Water Body Characteristics
Gage and Lime Lakes are located in Steuben County near Orland, Indiana. These lakes are both part of the Fawn River Watershed, which eventually drains into the St. Joe River and Lake Michigan. Lake Gage has 327 surface acres with a maximum depth of 72 feet and an average depth of 30 feet. Lime Lake has 30 surface acres with a maximum depth of 26 feet and an average depth of 10.9 feet. (Indiana Clean Lakes Program, 2011). Lake Gage is classified as an oligotrophic lake by the Indiana Department of Environmental Management (IDEM) while Lime Lake is classified as a mesotrophic lake. Bottom substrate in both lakes contains large areas of sand and gravel that are not conducive to plant growth.
Watershed Gage and Lime Lakes are part of the Fawn River Watershed. The following excerpt is taken directly from the Steuben County Soil and Water Conservation District website and summarizes the attributes of the Fawn River watershed. “Fawn River is located in the northwestern portion of the county. It is the second largest watershed in the county, accounting for 103 square miles of the county's drainage.
The main channel of Crooked Creek begins at the outlet of Jimmerson Lake and flows west northwest, passing north of Orland and into LaGrange County. Fawn River makes up part of the headwaters which flow into the St. Joe River, near Elkhart, Indiana, eventually out letting into Lake Michigan.
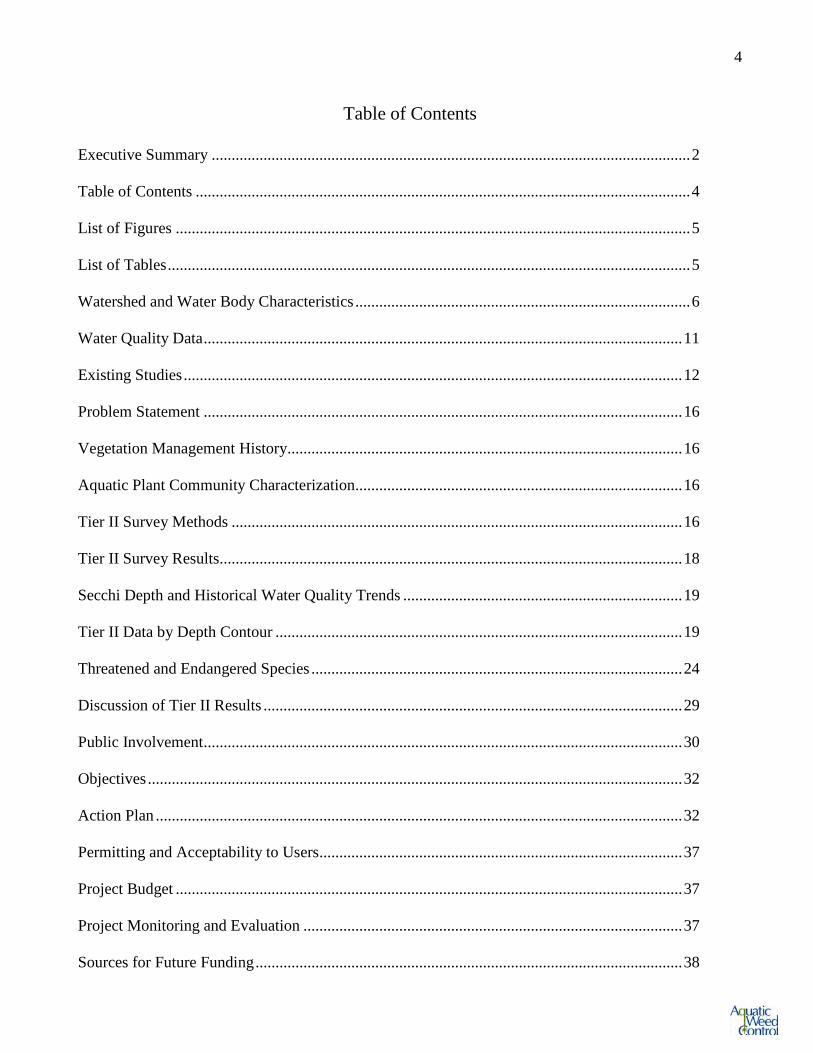
The Fawn River watershed contains the majority of lakes in the county including: Lake George, Snow Lake, Lake James, Jimmerson Lake, Crooked Lake, Lake Pleasant, and Lake Gage. The water quality of these lakes and the others in the watershed are important not only to the residents of Steuben County, but downstream as well.” Figure 1 is a map of the Steuben county portion of the Fawn River Watershed.
Figure 1: Fawn River Watershed (Steuben County Soil and Water Conservation District)
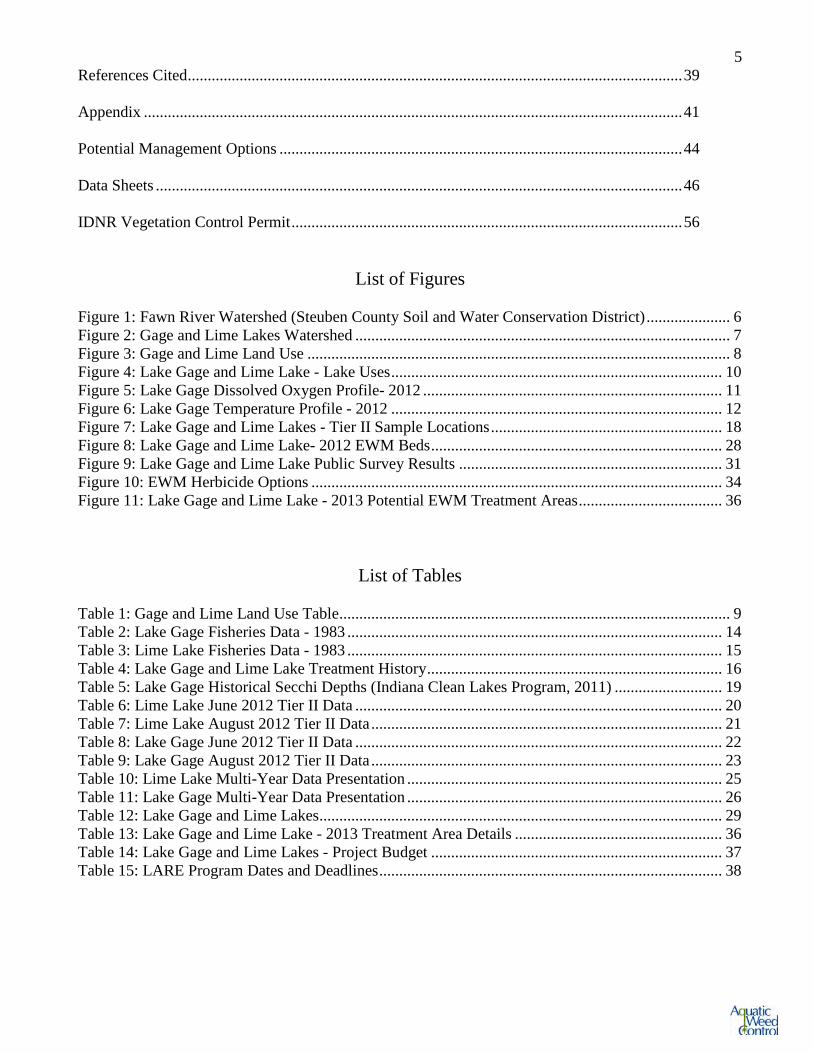
7 Figure 2 shows the more specific watershed associated with Gage and Lime Lakes. Crooked lake and several other smaller lakes are located within this watershed as well. This watershed is approximately 11, 215 acres. Figure 2: Gage and Lime Lakes Watershed
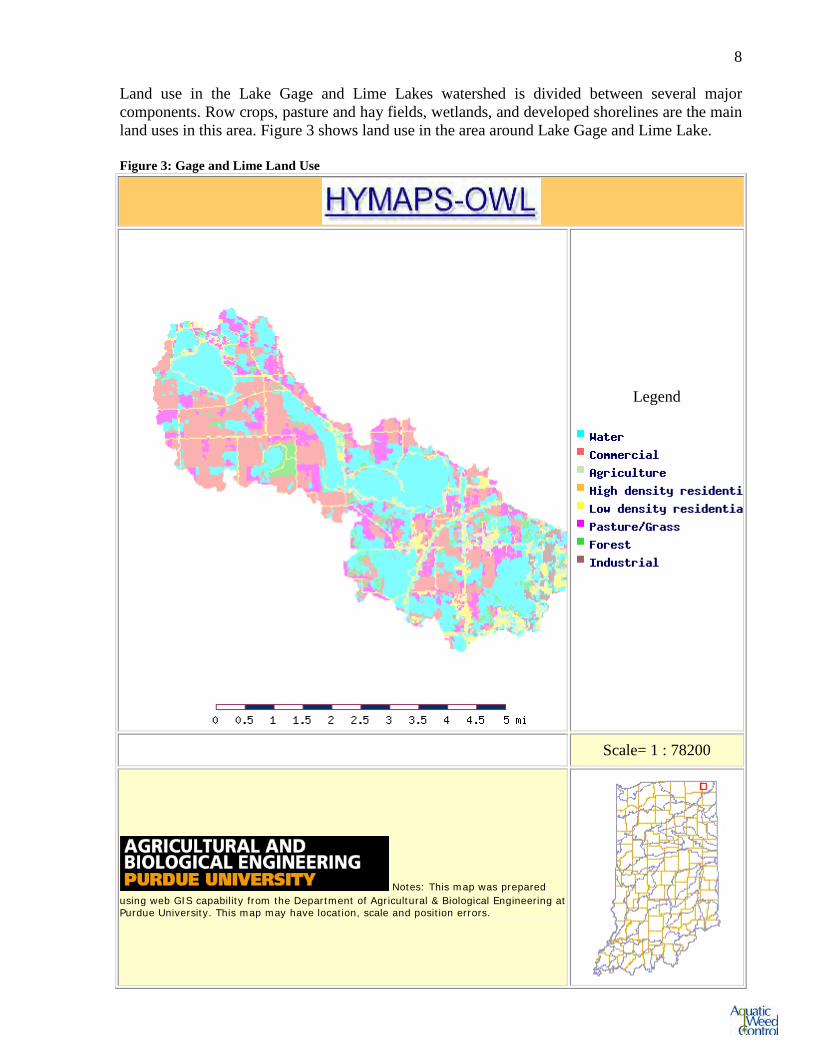
8 Land use in the Lake Gage and Lime Lakes watershed is divided between several major components. Row crops, pasture and hay fields, wetlands, and developed shorelines are the main land uses in this area. Figure 3 shows land use in the area around Lake Gage and Lime Lake. Figure 3: Gage and Lime Land Use
Legend
Scale= 1 : 78200
Notes: This map was prepared using web GIS capability from the Department of Agricultural & Biological Engineering at Purdue University. This map may have location, scale and position errors.
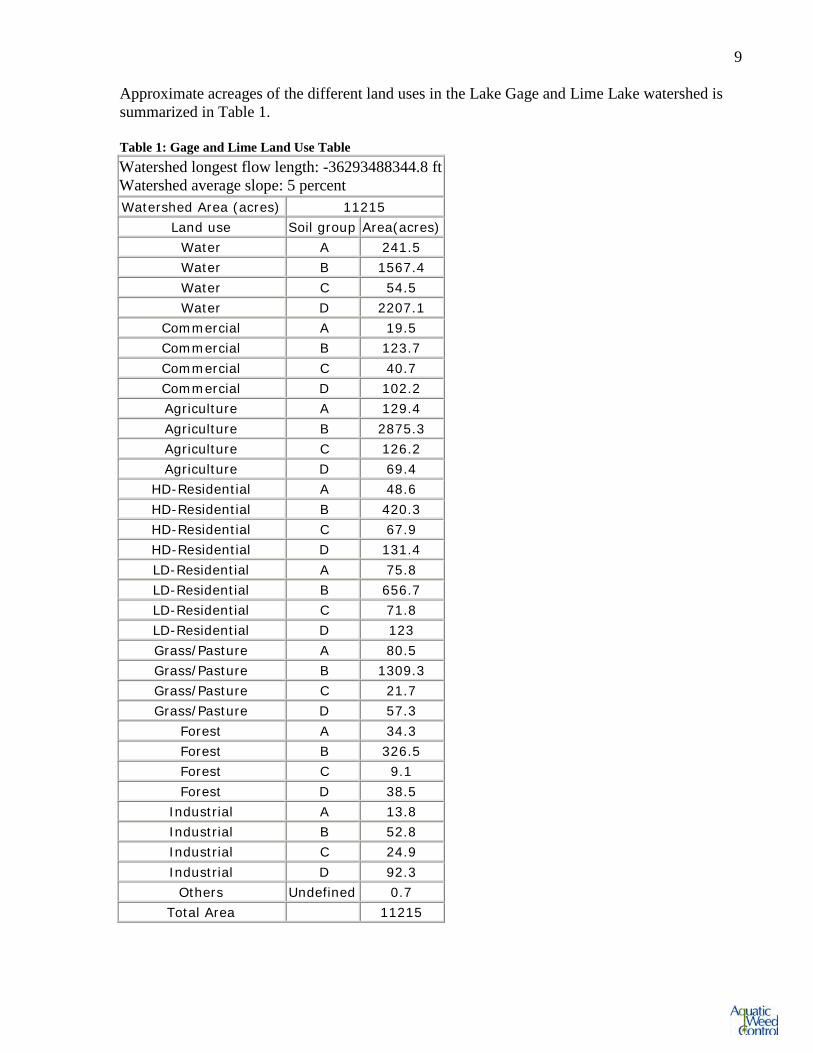
9 Approximate acreages of the different land uses in the Lake Gage and Lime Lake watershed is summarized in Table 1. Table 1: Gage and Lime Land Use Table Watershed longest flow length: -36293488344.8 ft Watershed average slope: 5 percent Watershed Area (acres) 11215
Land use Soil group Area(acres) Water A 241.5 Water B 1567.4 Water C 54.5 Water D 2207.1
Commercial A 19.5 Commercial B 123.7 Commercial C 40.7 Commercial D 102.2 Agriculture A 129.4 Agriculture B 2875.3 Agriculture C 126.2 Agriculture D 69.4
HD-Residential A 48.6 HD-Residential B 420.3 HD-Residential C 67.9 HD-Residential D 131.4 LD-Residential A 75.8 LD-Residential B 656.7 LD-Residential C 71.8 LD-Residential D 123 Grass/Pasture A 80.5 Grass/Pasture B 1309.3 Grass/Pasture C 21.7 Grass/Pasture D 57.3
Forest A 34.3 Forest B 326.5 Forest C 9.1 Forest D 38.5
Industrial A 13.8 Industrial B 52.8 Industrial C 24.9 Industrial D 92.3
Others Undefined 0.7 Total Area 11215
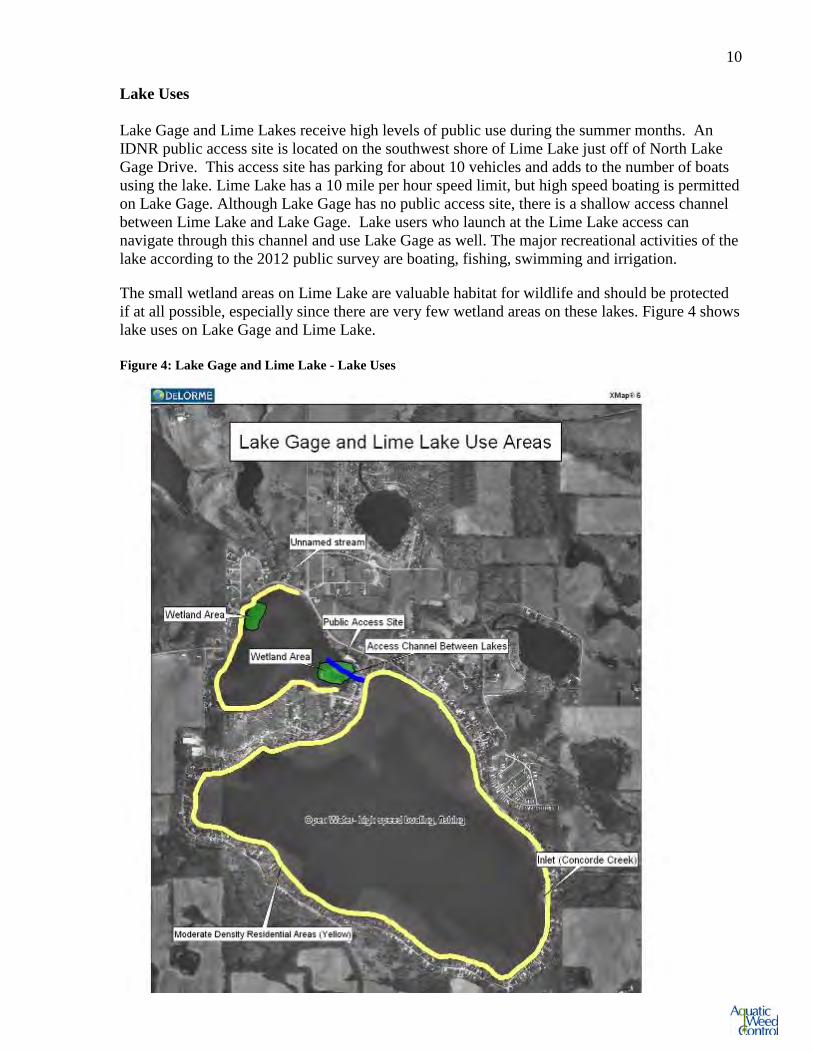
10 Lake Uses Lake Gage and Lime Lakes receive high levels of public use during the summer months. An IDNR public access site is located on the southwest shore of Lime Lake just off of North Lake Gage Drive. This access site has parking for about 10 vehicles and adds to the number of boats using the lake. Lime Lake has a 10 mile per hour speed limit, but high speed boating is permitted on Lake Gage. Although Lake Gage has no public access site, there is a shallow access channel between Lime Lake and Lake Gage. Lake users who launch at the Lime Lake access can navigate through this channel and use Lake Gage as well. The major recreational activities of the lake according to the 2012 public survey are boating, fishing, swimming and irrigation.
The small wetland areas on Lime Lake are valuable habitat for wildlife and should be protected if at all possible, especially since there are very few wetland areas on these lakes. Figure 4 shows lake uses on Lake Gage and Lime Lake. Figure 4: Lake Gage and Lime Lake - Lake Uses
11 Water Quality Data
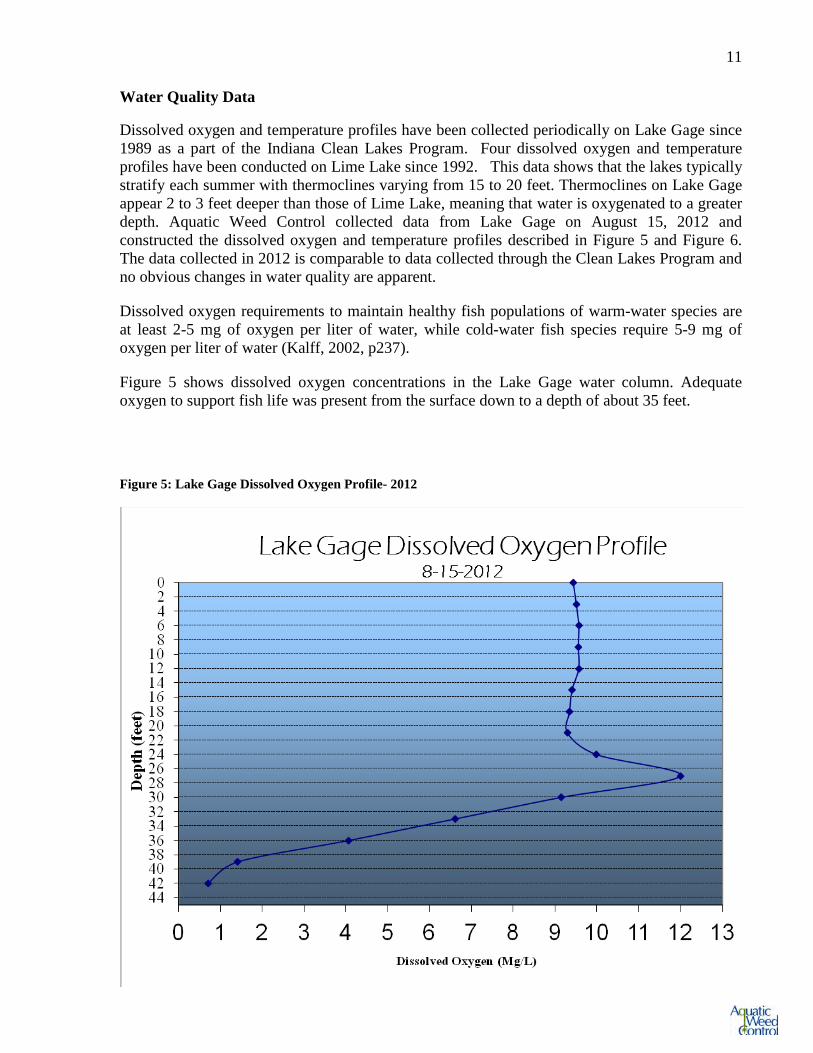
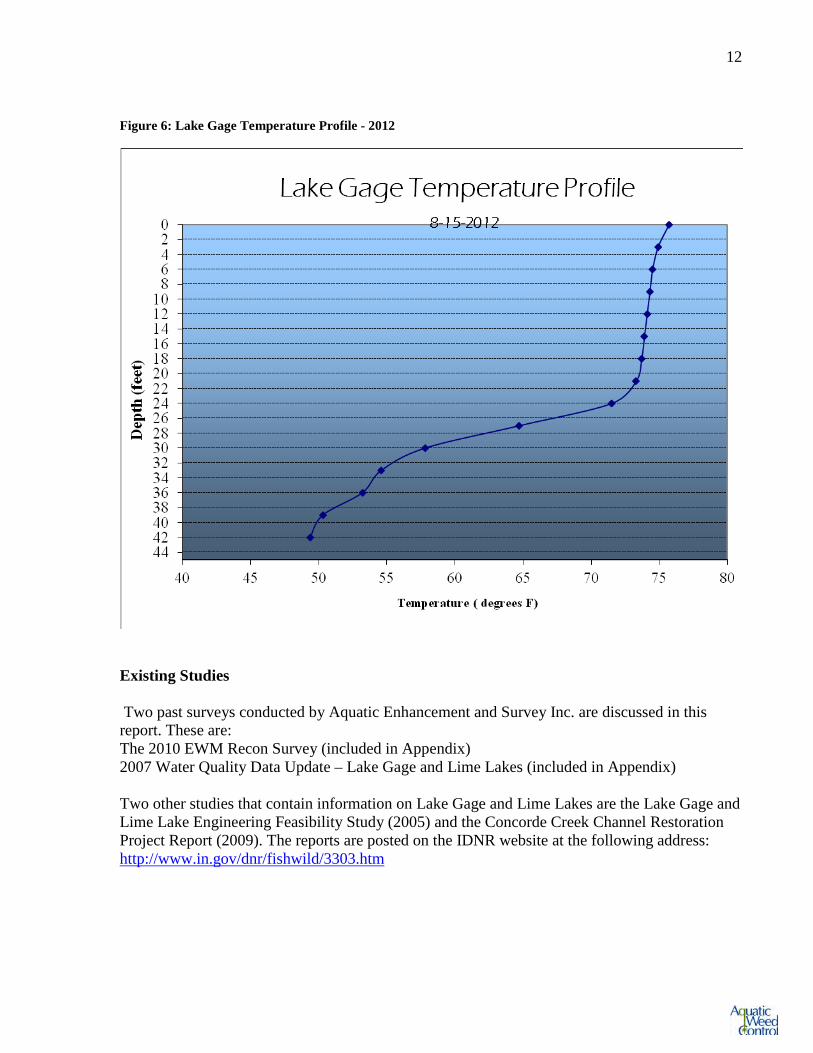
Dissolved oxygen and temperature profiles have been collected periodically on Lake Gage since 1989 as a part of the Indiana Clean Lakes Program. Four dissolved oxygen and temperature profiles have been conducted on Lime Lake since 1992. This data shows that the lakes typically stratify each summer with thermoclines varying from 15 to 20 feet. Thermoclines on Lake Gage appear 2 to 3 feet deeper than those of Lime Lake, meaning that water is oxygenated to a greater depth. Aquatic Weed Control collected data from Lake Gage on August 15, 2012 and constructed the dissolved oxygen and temperature profiles described in Figure 5 and Figure 6. The data collected in 2012 is comparable to data collected through the Clean Lakes Program and no obvious changes in water quality are apparent.
Dissolved oxygen requirements to maintain healthy fish populations of warm-water species are at least 2-5 mg of oxygen per liter of water, while cold-water fish species require 5-9 mg of oxygen per liter of water (Kalff, 2002, p237).
Figure 5 shows dissolved oxygen concentrations in the Lake Gage water column. Adequate oxygen to support fish life was present from the surface down to a depth of about 35 feet.
Figure 5: Lake Gage Dissolved Oxygen Profile- 2012
12
Figure 6: Lake Gage Temperature Profile - 2012
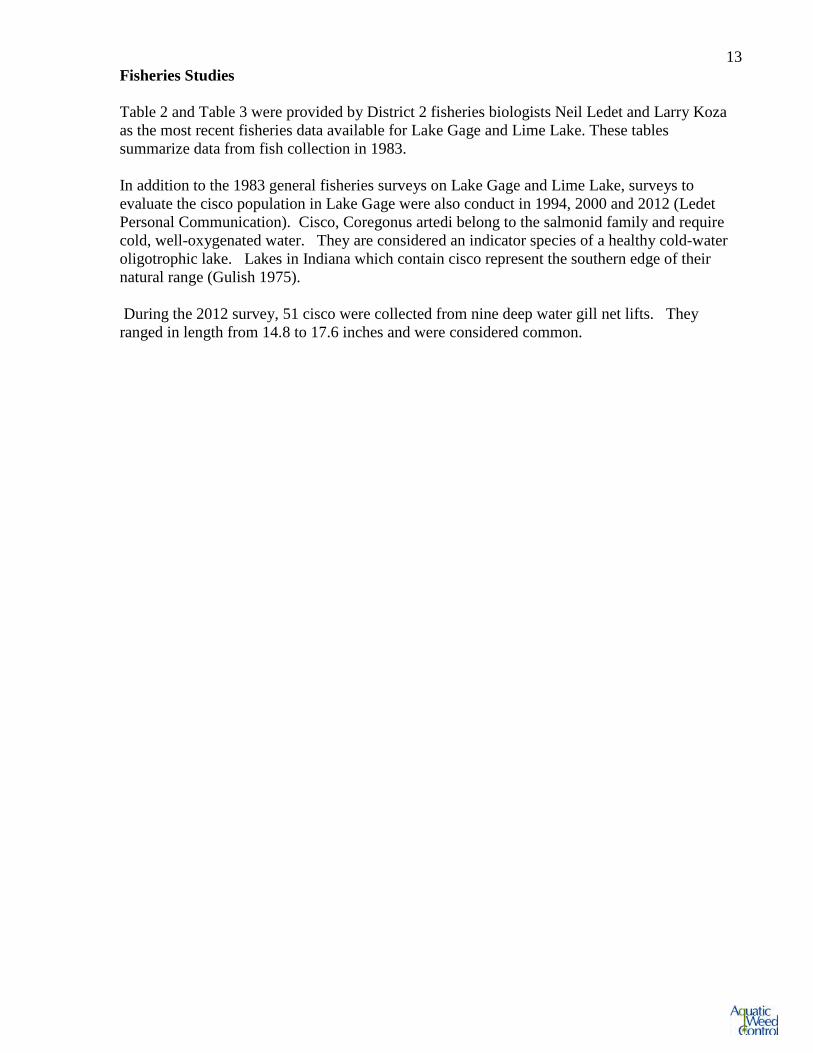
Existing Studies Two past surveys conducted by Aquatic Enhancement and Survey Inc. are discussed in this report. These are: The 2010 EWM Recon Survey (included in Appendix) 2007 Water Quality Data Update – Lake Gage and Lime Lakes (included in Appendix) Two other studies that contain information on Lake Gage and Lime Lakes are the Lake Gage and Lime Lake Engineering Feasibility Study (2005) and the Concorde Creek Channel Restoration Project Report (2009). The reports are posted on the IDNR website at the following address: http://www.in.gov/dnr/fishwild/3303.htm
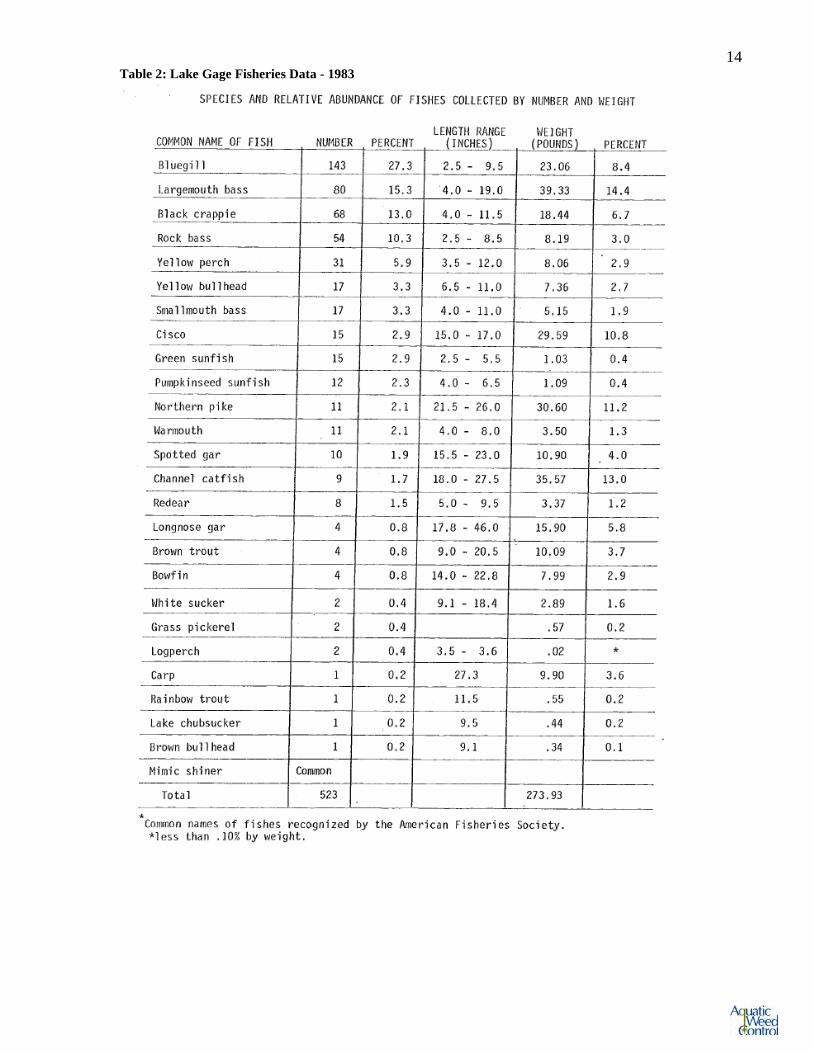
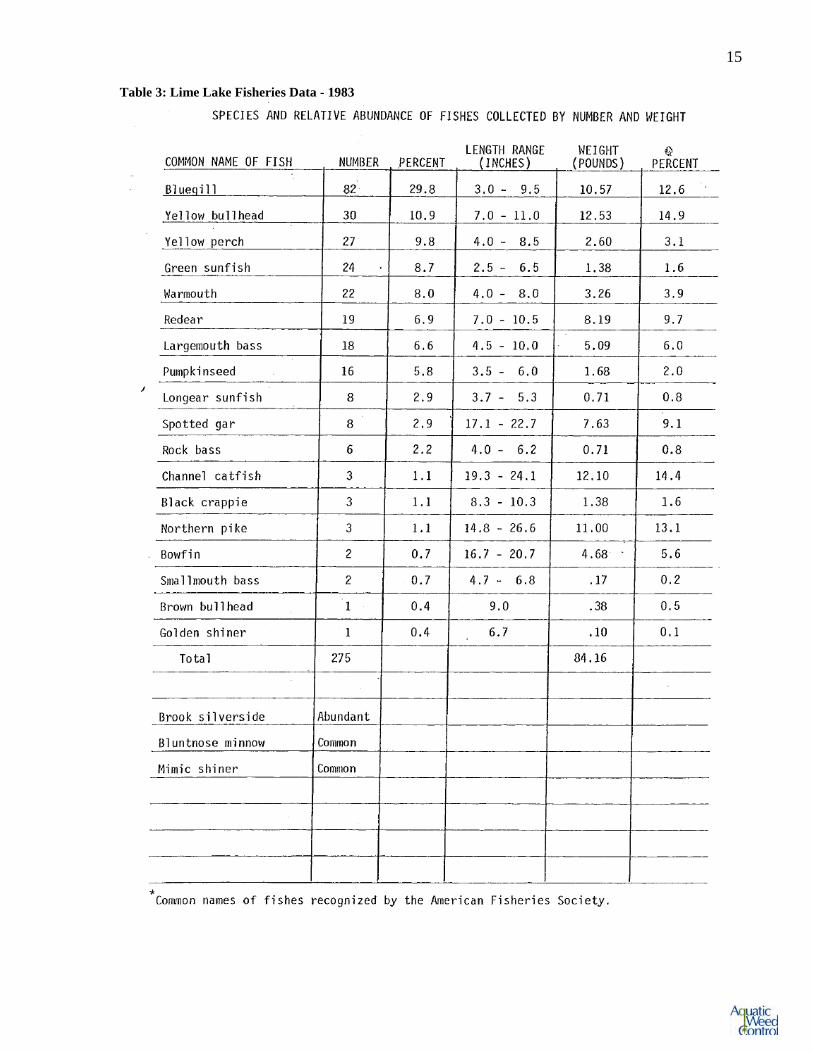
13 Fisheries Studies Table 2 and Table 3 were provided by District 2 fisheries biologists Neil Ledet and Larry Koza as the most recent fisheries data available for Lake Gage and Lime Lake. These tables summarize data from fish collection in 1983. In addition to the 1983 general fisheries surveys on Lake Gage and Lime Lake, surveys to evaluate the cisco population in Lake Gage were also conduct in 1994, 2000 and 2012 (Ledet Personal Communication). Cisco, Coregonus artedi belong to the salmonid family and require cold, well-oxygenated water. They are considered an indicator species of a healthy cold-water oligotrophic lake. Lakes in Indiana which contain cisco represent the southern edge of their natural range (Gulish 1975). During the 2012 survey, 51 cisco were collected from nine deep water gill net lifts. They ranged in length from 14.8 to 17.6 inches and were considered common.
14 Table 2: Lake Gage Fisheries Data - 1983
15 Table 3: Lime Lake Fisheries Data - 1983
16 Problem Statement An exotic aquatic plant species called Eurasian watermilfoil (EWM) has colonized areas of Lake Gage and Lime Lakes. This plant is estimated to be present in a total of 26 acres between these two lakes. When this plant species is present in great abundance it provides less than desirable fish habitat, can crowd out beneficial native plant species, and can impair recreation. Currently EWM is not considered a severe problem at either lake and negative impacts to both recreation and lake ecology are minimal. Much of Lake Gage is very deep and EWM is not expected to spread into deeper water. Also, many areas of Lake Gage have a hard, sandy, or gravel bottom which may not be conducive to EWM growth. Because of this, the overall acreage of EWM in Lake Gage is not expected to increase dramatically in the coming years. However, one main concern is that EWM could become a greater percentage of the overall plant community over time and cause more recreational and ecological interference. Vegetation Management History Vegetation control permit records and communication with the lake association indicate that herbicide treatments on Lake Gage and Lime Lakes have been extremely limited over the past ten years. There have been no widespread treatments, either for EWM or other native vegetation, either through the lake association or private property owners. Many areas of the lakes have a sandy bottom that is not conducive to plant growth, which makes herbicide treatments unnecessary in these areas. Table 4 will be used to track any herbicide treatments that occur in the years to come. Table 4: Lake Gage and Lime Lake Treatment History Year Species Acres Chemical Concentration 2002-2012 Mixed natives and EWM unknown Unknown Aquatic Plant Community Characterization Tier II Survey Methods Tier II survey protocols have been established by the IDNR to ensure that each lake is surveyed in the same manner (IDNR, 2006). These surveys reduce subjectivity and provide a consistent basis for the evaluation of a lake’s plant community from year to year, as well as a basis for comparing the plant communities of different lakes. They provide quantifiable results that are vital for monitoring the success of management programs. In short, these vegetation surveys are the foundation for describing an aquatic plant community and proposing an effective management strategy. Based on Lake Gage’s 327 surface acres and its classification as an oligotrophic lake by the Indiana Department of Environmental Management, 70 sample sites were distributed randomly throughout the littoral zone to a maximum depth of 25 feet. Based on Lime Lake’s 30 surface

17 acres and its classification as a mesotrophic lake, 30 sites were distributed randomly throughout the littoral zone to a maximum depth of 20 feet. At each site, a specialized sampling rake was lowered into the water to collect aquatic plants. More detailed information on tier II survey methods can be found in the 2010 IDNR Tier II Aquatic Vegetation Survey Protocol which is available online; http://www.in.gov/dnr/fishwild/files/fw-LARE_Tier_II_Procedure_Manual_Dec_2010.pdf.
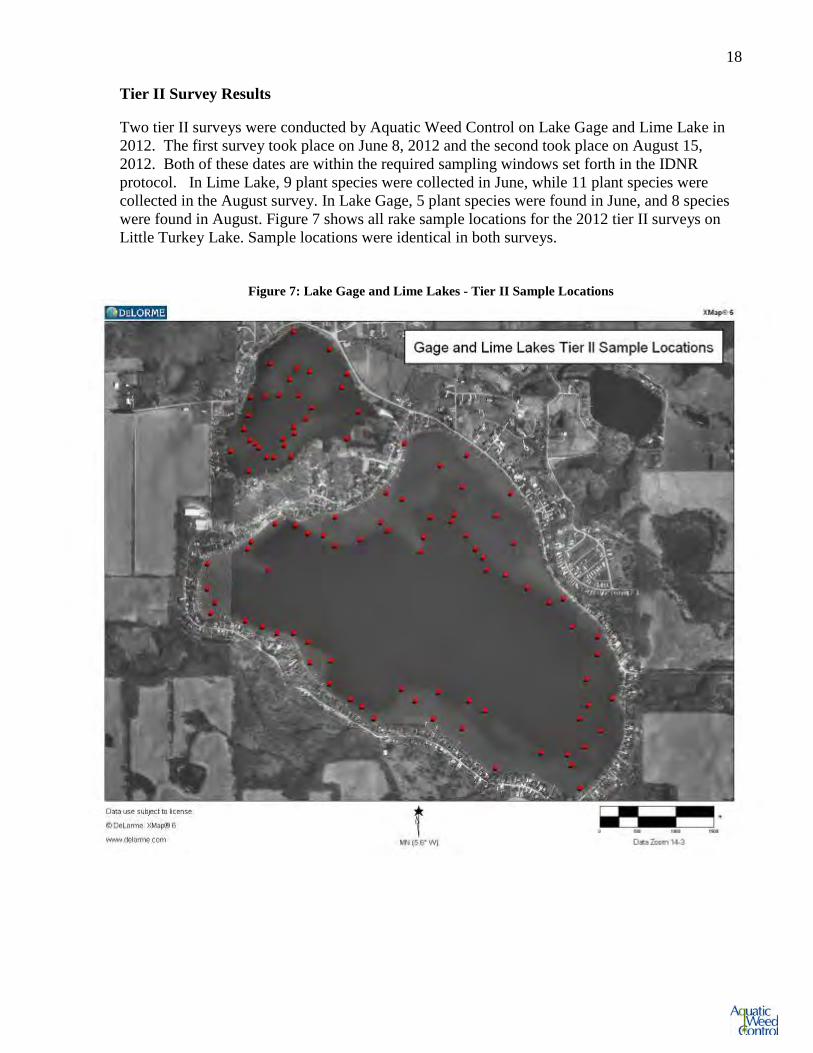
18 Tier II Survey Results Two tier II surveys were conducted by Aquatic Weed Control on Lake Gage and Lime Lake in 2012. The first survey took place on June 8, 2012 and the second took place on August 15, 2012. Both of these dates are within the required sampling windows set forth in the IDNR protocol. In Lime Lake, 9 plant species were collected in June, while 11 plant species were collected in the August survey. In Lake Gage, 5 plant species were found in June, and 8 species were found in August. Figure 7 shows all rake sample locations for the 2012 tier II surveys on Little Turkey Lake. Sample locations were identical in both surveys.
Figure 7: Lake Gage and Lime Lakes - Tier II Sample Locations
19 Secchi Depth and Historical Water Quality Trends Table 5 shows historical Secchi readings that have been observed at Lake Gage including the two Secchi readings recorded in the 2012 tier II surveys. Secchi depth is a standardized measurement of water clarity. Secchi depth can fluctuate with rain events, algal blooms, and weather patterns, but it appears as though water clarity has remained stable, at least over the past 15 years (Indiana Clean Lakes Program, 2011). Table 5: Lake Gage Historical Secchi Depths (Indiana Clean Lakes Program, 2011)
Year July 7-1989
July 21-1992
Aug 18-1997
July 2-2002
Aug 18-2007
June 30-2009
Aug 30-2010
June 27-2011
June 7- 2012
Aug 15- 2012
Secchi (ft) 17.1 14.1 10.8 6.0 11.4 10.8 12.2 6.3 12.0 10.5 Secchi depth on Lime Lake was measured at 8.2 feet in spring of 2012 and at 15.9 feet in summer of 2012. Tier II Data by Depth Contour Table 6 and Table 7 are data summaries for the 2012 tier II aquatic vegetation surveys on Lime Lake. Table 8 and Table 9 are data summaries for the surveys on Lake Gage. These tables help to describe the plant community and will help identify any changes that take place in the years to come. “Overall” data sets include every sample site in the survey, while the other data sets describe each five foot depth contour of the lake’s littoral zone (0-5 feet, 5-10 feet, etc). Calculations for these tables include null values for each sample site where no plants were collected.
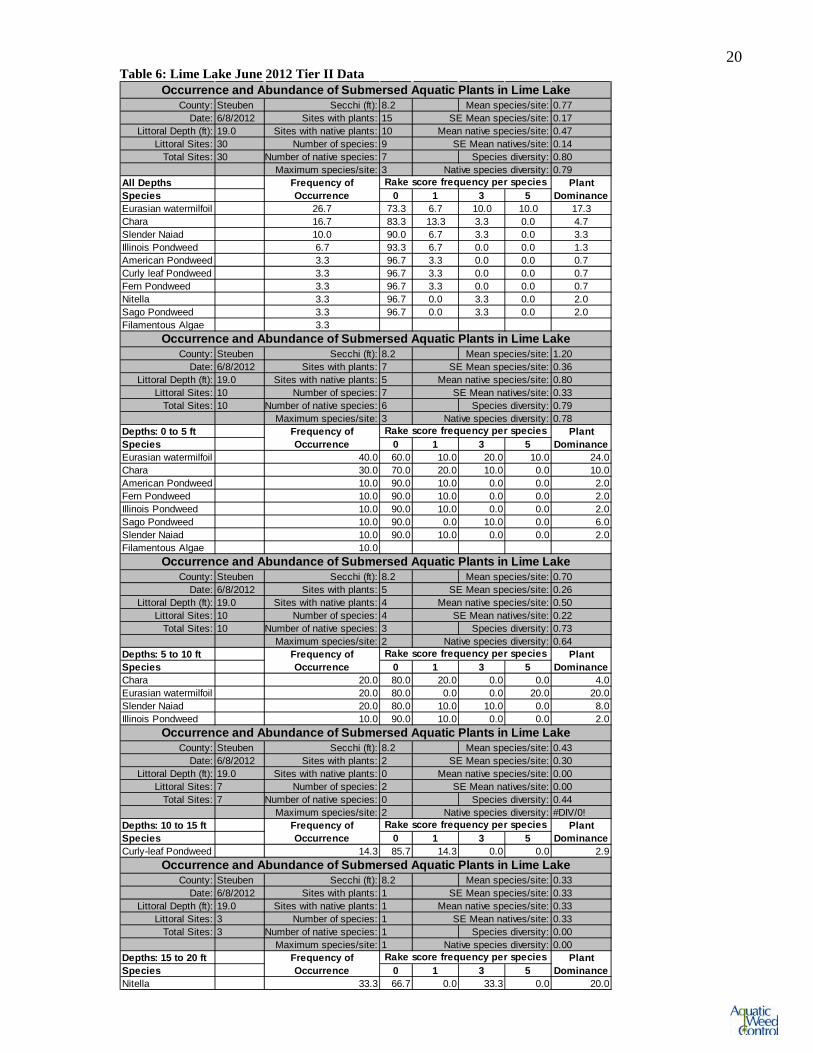
20 Table 6: Lime Lake June 2012 Tier II Data
County: Steuben Secchi (ft): 8.2 Mean species/site: 0.77Date: 6/8/2012 Sites with plants: 15 SE Mean species/site: 0.17
Littoral Depth (ft): 19.0 Sites with native plants: 10 Mean native species/site: 0.47Littoral Sites: 30 Number of species: 9 SE Mean natives/site: 0.14
Total Sites: 30 Number of native species: 7 Species diversity: 0.80Maximum species/site: 3 Native species diversity: 0.79
All DepthsSpecies 0 1 3 5Eurasian watermilfoil 26.7 73.3 6.7 10.0 10.0 17.3Chara 16.7 83.3 13.3 3.3 0.0 4.7Slender Naiad 10.0 90.0 6.7 3.3 0.0 3.3Illinois Pondweed 6.7 93.3 6.7 0.0 0.0 1.3American Pondweed 3.3 96.7 3.3 0.0 0.0 0.7Curly leaf Pondweed 3.3 96.7 3.3 0.0 0.0 0.7Fern Pondweed 3.3 96.7 3.3 0.0 0.0 0.7Nitella 3.3 96.7 0.0 3.3 0.0 2.0Sago Pondweed 3.3 96.7 0.0 3.3 0.0 2.0Filamentous Algae 3.3
County: Steuben Secchi (ft): 8.2 Mean species/site: 1.20Date: 6/8/2012 Sites with plants: 7 SE Mean species/site: 0.36
Littoral Depth (ft): 19.0 Sites with native plants: 5 Mean native species/site: 0.80Littoral Sites: 10 Number of species: 7 SE Mean natives/site: 0.33
Total Sites: 10 Number of native species: 6 Species diversity: 0.79Maximum species/site: 3 Native species diversity: 0.78
Depths: 0 to 5 ftSpecies 0 1 3 5Eurasian watermilfoil 40.0 60.0 10.0 20.0 10.0 24.0Chara 30.0 70.0 20.0 10.0 0.0 10.0American Pondweed 10.0 90.0 10.0 0.0 0.0 2.0Fern Pondweed 10.0 90.0 10.0 0.0 0.0 2.0Illinois Pondweed 10.0 90.0 10.0 0.0 0.0 2.0Sago Pondweed 10.0 90.0 0.0 10.0 0.0 6.0Slender Naiad 10.0 90.0 10.0 0.0 0.0 2.0Filamentous Algae 10.0
County: Steuben Secchi (ft): 8.2 Mean species/site: 0.70Date: 6/8/2012 Sites with plants: 5 SE Mean species/site: 0.26
Littoral Depth (ft): 19.0 Sites with native plants: 4 Mean native species/site: 0.50Littoral Sites: 10 Number of species: 4 SE Mean natives/site: 0.22
Total Sites: 10 Number of native species: 3 Species diversity: 0.73Maximum species/site: 2 Native species diversity: 0.64
Depths: 5 to 10 ftSpecies 0 1 3 5Chara 20.0 80.0 20.0 0.0 0.0 4.0Eurasian watermilfoil 20.0 80.0 0.0 0.0 20.0 20.0Slender Naiad 20.0 80.0 10.0 10.0 0.0 8.0Illinois Pondweed 10.0 90.0 10.0 0.0 0.0 2.0
County: Steuben Secchi (ft): 8.2 Mean species/site: 0.43Date: 6/8/2012 Sites with plants: 2 SE Mean species/site: 0.30
Littoral Depth (ft): 19.0 Sites with native plants: 0 Mean native species/site: 0.00Littoral Sites: 7 Number of species: 2 SE Mean natives/site: 0.00
Total Sites: 7 Number of native species: 0 Species diversity: 0.44Maximum species/site: 2 Native species diversity: #DIV/0!
Depths: 10 to 15 ftSpecies 0 1 3 5Curly-leaf Pondweed 14.3 85.7 14.3 0.0 0.0 2.9
County: Steuben Secchi (ft): 8.2 Mean species/site: 0.33Date: 6/8/2012 Sites with plants: 1 SE Mean species/site: 0.33
Littoral Depth (ft): 19.0 Sites with native plants: 1 Mean native species/site: 0.33Littoral Sites: 3 Number of species: 1 SE Mean natives/site: 0.33
Total Sites: 3 Number of native species: 1 Species diversity: 0.00Maximum species/site: 1 Native species diversity: 0.00
Depths: 15 to 20 ftSpecies 0 1 3 5Nitella 33.3 66.7 0.0 33.3 0.0 20.0
Occurrence and Abundance of Submersed Aquatic Plants in Lime Lake
Frequency of Occurrence
Rake score frequency per species Plant Dominance
Occurrence and Abundance of Submersed Aquatic Plants in Lime Lake
Frequency of Occurrence
Rake score frequency per species Plant Dominance
Occurrence and Abundance of Submersed Aquatic Plants in Lime Lake
Frequency of Occurrence
Rake score frequency per species Plant Dominance
Frequency of Occurrence
Rake score frequency per species Plant Dominance
Occurrence and Abundance of Submersed Aquatic Plants in Lime Lake
Frequency of Occurrence
Rake score frequency per species Plant Dominance
Occurrence and Abundance of Submersed Aquatic Plants in Lime Lake
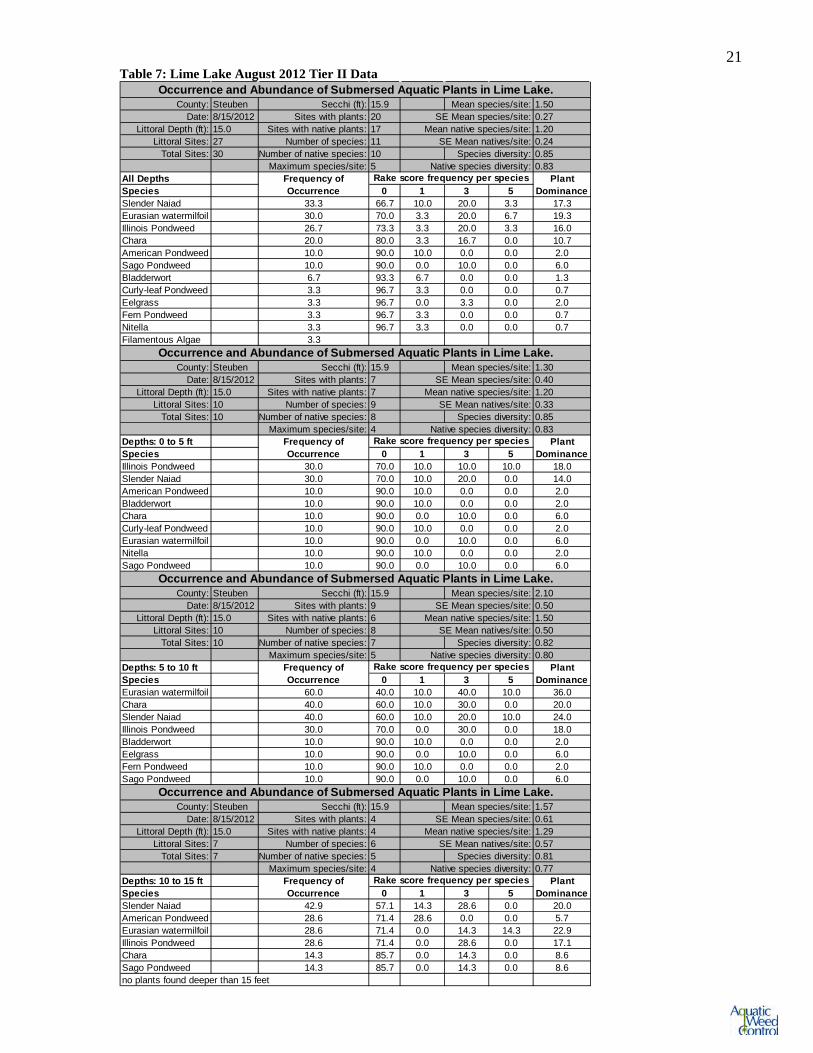
21 Table 7: Lime Lake August 2012 Tier II Data
County: Steuben Secchi (ft): 15.9 Mean species/site: 1.50Date: 8/15/2012 Sites with plants: 20 SE Mean species/site: 0.27
Littoral Depth (ft): 15.0 Sites with native plants: 17 Mean native species/site: 1.20Littoral Sites: 27 Number of species: 11 SE Mean natives/site: 0.24
Total Sites: 30 Number of native species: 10 Species diversity: 0.85Maximum species/site: 5 Native species diversity: 0.83
All DepthsSpecies 0 1 3 5Slender Naiad 33.3 66.7 10.0 20.0 3.3 17.3Eurasian watermilfoil 30.0 70.0 3.3 20.0 6.7 19.3Illinois Pondweed 26.7 73.3 3.3 20.0 3.3 16.0Chara 20.0 80.0 3.3 16.7 0.0 10.7American Pondweed 10.0 90.0 10.0 0.0 0.0 2.0Sago Pondweed 10.0 90.0 0.0 10.0 0.0 6.0Bladderwort 6.7 93.3 6.7 0.0 0.0 1.3Curly-leaf Pondweed 3.3 96.7 3.3 0.0 0.0 0.7Eelgrass 3.3 96.7 0.0 3.3 0.0 2.0Fern Pondweed 3.3 96.7 3.3 0.0 0.0 0.7Nitella 3.3 96.7 3.3 0.0 0.0 0.7Filamentous Algae 3.3
County: Steuben Secchi (ft): 15.9 Mean species/site: 1.30Date: 8/15/2012 Sites with plants: 7 SE Mean species/site: 0.40
Littoral Depth (ft): 15.0 Sites with native plants: 7 Mean native species/site: 1.20Littoral Sites: 10 Number of species: 9 SE Mean natives/site: 0.33
Total Sites: 10 Number of native species: 8 Species diversity: 0.85Maximum species/site: 4 Native species diversity: 0.83
Depths: 0 to 5 ftSpecies 0 1 3 5Illinois Pondweed 30.0 70.0 10.0 10.0 10.0 18.0Slender Naiad 30.0 70.0 10.0 20.0 0.0 14.0American Pondweed 10.0 90.0 10.0 0.0 0.0 2.0Bladderwort 10.0 90.0 10.0 0.0 0.0 2.0Chara 10.0 90.0 0.0 10.0 0.0 6.0Curly-leaf Pondweed 10.0 90.0 10.0 0.0 0.0 2.0Eurasian watermilfoil 10.0 90.0 0.0 10.0 0.0 6.0Nitella 10.0 90.0 10.0 0.0 0.0 2.0Sago Pondweed 10.0 90.0 0.0 10.0 0.0 6.0
County: Steuben Secchi (ft): 15.9 Mean species/site: 2.10Date: 8/15/2012 Sites with plants: 9 SE Mean species/site: 0.50
Littoral Depth (ft): 15.0 Sites with native plants: 6 Mean native species/site: 1.50Littoral Sites: 10 Number of species: 8 SE Mean natives/site: 0.50
Total Sites: 10 Number of native species: 7 Species diversity: 0.82Maximum species/site: 5 Native species diversity: 0.80
Depths: 5 to 10 ftSpecies 0 1 3 5Eurasian watermilfoil 60.0 40.0 10.0 40.0 10.0 36.0Chara 40.0 60.0 10.0 30.0 0.0 20.0Slender Naiad 40.0 60.0 10.0 20.0 10.0 24.0Illinois Pondweed 30.0 70.0 0.0 30.0 0.0 18.0Bladderwort 10.0 90.0 10.0 0.0 0.0 2.0Eelgrass 10.0 90.0 0.0 10.0 0.0 6.0Fern Pondweed 10.0 90.0 10.0 0.0 0.0 2.0Sago Pondweed 10.0 90.0 0.0 10.0 0.0 6.0
County: Steuben Secchi (ft): 15.9 Mean species/site: 1.57Date: 8/15/2012 Sites with plants: 4 SE Mean species/site: 0.61
Littoral Depth (ft): 15.0 Sites with native plants: 4 Mean native species/site: 1.29Littoral Sites: 7 Number of species: 6 SE Mean natives/site: 0.57
Total Sites: 7 Number of native species: 5 Species diversity: 0.81Maximum species/site: 4 Native species diversity: 0.77
Depths: 10 to 15 ftSpecies 0 1 3 5Slender Naiad 42.9 57.1 14.3 28.6 0.0 20.0American Pondweed 28.6 71.4 28.6 0.0 0.0 5.7Eurasian watermilfoil 28.6 71.4 0.0 14.3 14.3 22.9Illinois Pondweed 28.6 71.4 0.0 28.6 0.0 17.1Chara 14.3 85.7 0.0 14.3 0.0 8.6Sago Pondweed 14.3 85.7 0.0 14.3 0.0 8.6no plants found deeper than 15 feet
Occurrence and Abundance of Submersed Aquatic Plants in Lime Lake.
Frequency of Occurrence
Rake score frequency per species Plant Dominance
Occurrence and Abundance of Submersed Aquatic Plants in Lime Lake.
Frequency of Occurrence
Rake score frequency per species Plant Dominance
Occurrence and Abundance of Submersed Aquatic Plants in Lime Lake.
Frequency of Occurrence
Rake score frequency per species Plant Dominance
Frequency of Occurrence
Rake score frequency per species Plant Dominance
Occurrence and Abundance of Submersed Aquatic Plants in Lime Lake.
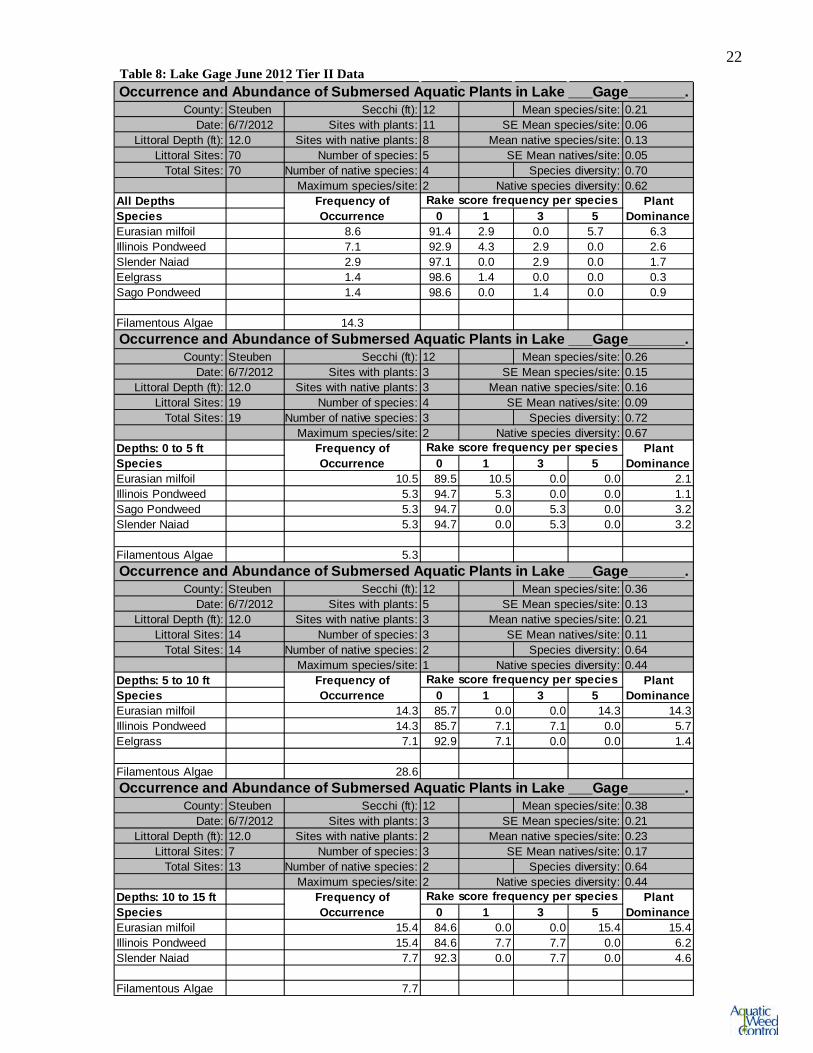
22 Table 8: Lake Gage June 2012 Tier II Data
County: Steuben Secchi (ft): 12 Mean species/site: 0.21Date: 6/7/2012 Sites with plants: 11 SE Mean species/site: 0.06
Littoral Depth (ft): 12.0 Sites with native plants: 8 Mean native species/site: 0.13Littoral Sites: 70 Number of species: 5 SE Mean natives/site: 0.05
Total Sites: 70 Number of native species: 4 Species diversity: 0.70Maximum species/site: 2 Native species diversity: 0.62
All DepthsSpecies 0 1 3 5Eurasian milfoil 8.6 91.4 2.9 0.0 5.7 6.3Illinois Pondweed 7.1 92.9 4.3 2.9 0.0 2.6Slender Naiad 2.9 97.1 0.0 2.9 0.0 1.7Eelgrass 1.4 98.6 1.4 0.0 0.0 0.3Sago Pondweed 1.4 98.6 0.0 1.4 0.0 0.9
Filamentous Algae 14.3
County: Steuben Secchi (ft): 12 Mean species/site: 0.26Date: 6/7/2012 Sites with plants: 3 SE Mean species/site: 0.15
Littoral Depth (ft): 12.0 Sites with native plants: 3 Mean native species/site: 0.16Littoral Sites: 19 Number of species: 4 SE Mean natives/site: 0.09
Total Sites: 19 Number of native species: 3 Species diversity: 0.72Maximum species/site: 2 Native species diversity: 0.67
Depths: 0 to 5 ftSpecies 0 1 3 5Eurasian milfoil 10.5 89.5 10.5 0.0 0.0 2.1Illinois Pondweed 5.3 94.7 5.3 0.0 0.0 1.1Sago Pondweed 5.3 94.7 0.0 5.3 0.0 3.2Slender Naiad 5.3 94.7 0.0 5.3 0.0 3.2
Filamentous Algae 5.3
County: Steuben Secchi (ft): 12 Mean species/site: 0.36Date: 6/7/2012 Sites with plants: 5 SE Mean species/site: 0.13
Littoral Depth (ft): 12.0 Sites with native plants: 3 Mean native species/site: 0.21Littoral Sites: 14 Number of species: 3 SE Mean natives/site: 0.11
Total Sites: 14 Number of native species: 2 Species diversity: 0.64Maximum species/site: 1 Native species diversity: 0.44
Depths: 5 to 10 ftSpecies 0 1 3 5Eurasian milfoil 14.3 85.7 0.0 0.0 14.3 14.3Illinois Pondweed 14.3 85.7 7.1 7.1 0.0 5.7Eelgrass 7.1 92.9 7.1 0.0 0.0 1.4
Filamentous Algae 28.6
County: Steuben Secchi (ft): 12 Mean species/site: 0.38Date: 6/7/2012 Sites with plants: 3 SE Mean species/site: 0.21
Littoral Depth (ft): 12.0 Sites with native plants: 2 Mean native species/site: 0.23Littoral Sites: 7 Number of species: 3 SE Mean natives/site: 0.17
Total Sites: 13 Number of native species: 2 Species diversity: 0.64Maximum species/site: 2 Native species diversity: 0.44
Depths: 10 to 15 ftSpecies 0 1 3 5Eurasian milfoil 15.4 84.6 0.0 0.0 15.4 15.4Illinois Pondweed 15.4 84.6 7.7 7.7 0.0 6.2Slender Naiad 7.7 92.3 0.0 7.7 0.0 4.6
Filamentous Algae 7.7
Occurrence and Abundance of Submersed Aquatic Plants in Lake ___Gage_______.
Frequency of Occurrence
Rake score frequency per species Plant Dominance
Occurrence and Abundance of Submersed Aquatic Plants in Lake ___Gage_______.
Frequency of Occurrence
Rake score frequency per species Plant Dominance
Occurrence and Abundance of Submersed Aquatic Plants in Lake ___Gage_______.
Frequency of Occurrence
Rake score frequency per species Plant Dominance
Occurrence and Abundance of Submersed Aquatic Plants in Lake ___Gage_______.
Frequency of Occurrence
Rake score frequency per species Plant Dominance
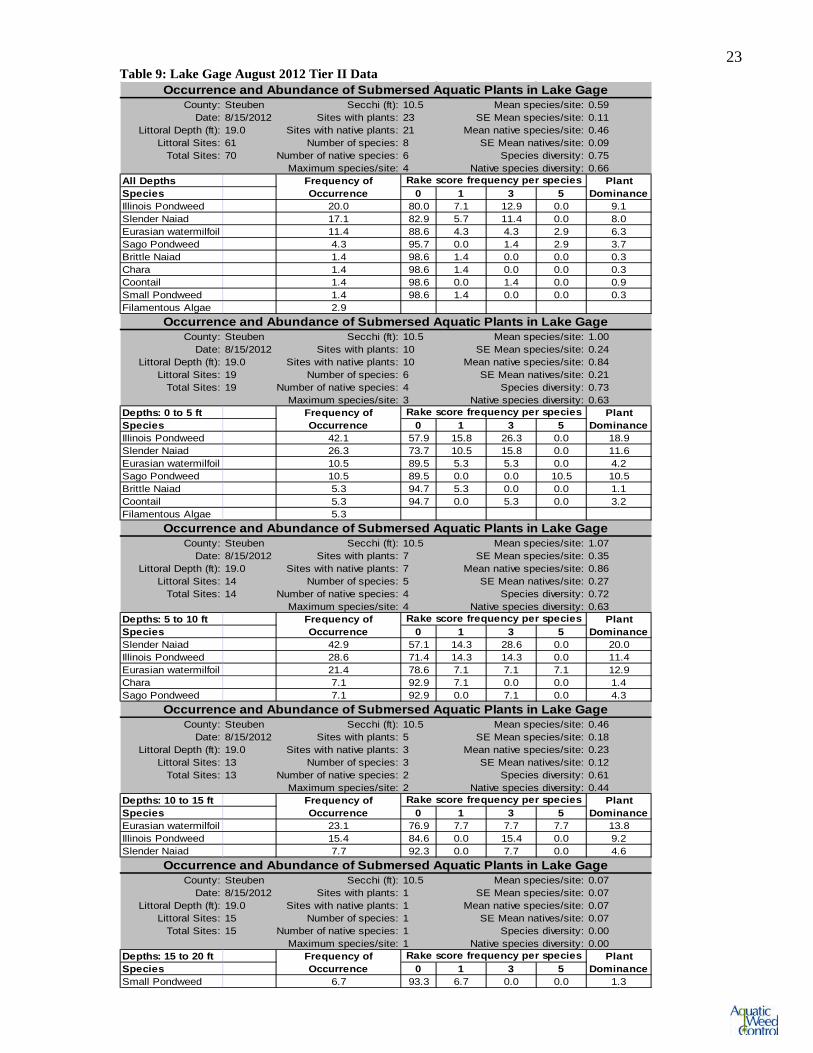
23 Table 9: Lake Gage August 2012 Tier II Data
County: Steuben Secchi (ft): 10.5 Mean species/site: 0.59Date: 8/15/2012 Sites with plants: 23 SE Mean species/site: 0.11
Littoral Depth (ft): 19.0 Sites with native plants: 21 Mean native species/site: 0.46Littoral Sites: 61 Number of species: 8 SE Mean natives/site: 0.09
Total Sites: 70 Number of native species: 6 Species diversity: 0.75Maximum species/site: 4 Native species diversity: 0.66
All DepthsSpecies 0 1 3 5Illinois Pondweed 20.0 80.0 7.1 12.9 0.0 9.1Slender Naiad 17.1 82.9 5.7 11.4 0.0 8.0Eurasian watermilfoil 11.4 88.6 4.3 4.3 2.9 6.3Sago Pondweed 4.3 95.7 0.0 1.4 2.9 3.7Brittle Naiad 1.4 98.6 1.4 0.0 0.0 0.3Chara 1.4 98.6 1.4 0.0 0.0 0.3Coontail 1.4 98.6 0.0 1.4 0.0 0.9Small Pondweed 1.4 98.6 1.4 0.0 0.0 0.3Filamentous Algae 2.9
County: Steuben Secchi (ft): 10.5 Mean species/site: 1.00Date: 8/15/2012 Sites with plants: 10 SE Mean species/site: 0.24
Littoral Depth (ft): 19.0 Sites with native plants: 10 Mean native species/site: 0.84Littoral Sites: 19 Number of species: 6 SE Mean natives/site: 0.21
Total Sites: 19 Number of native species: 4 Species diversity: 0.73Maximum species/site: 3 Native species diversity: 0.63
Depths: 0 to 5 ftSpecies 0 1 3 5Illinois Pondweed 42.1 57.9 15.8 26.3 0.0 18.9Slender Naiad 26.3 73.7 10.5 15.8 0.0 11.6Eurasian watermilfoil 10.5 89.5 5.3 5.3 0.0 4.2Sago Pondweed 10.5 89.5 0.0 0.0 10.5 10.5Brittle Naiad 5.3 94.7 5.3 0.0 0.0 1.1Coontail 5.3 94.7 0.0 5.3 0.0 3.2Filamentous Algae 5.3
County: Steuben Secchi (ft): 10.5 Mean species/site: 1.07Date: 8/15/2012 Sites with plants: 7 SE Mean species/site: 0.35
Littoral Depth (ft): 19.0 Sites with native plants: 7 Mean native species/site: 0.86Littoral Sites: 14 Number of species: 5 SE Mean natives/site: 0.27
Total Sites: 14 Number of native species: 4 Species diversity: 0.72Maximum species/site: 4 Native species diversity: 0.63
Depths: 5 to 10 ftSpecies 0 1 3 5Slender Naiad 42.9 57.1 14.3 28.6 0.0 20.0Illinois Pondweed 28.6 71.4 14.3 14.3 0.0 11.4Eurasian watermilfoil 21.4 78.6 7.1 7.1 7.1 12.9Chara 7.1 92.9 7.1 0.0 0.0 1.4Sago Pondweed 7.1 92.9 0.0 7.1 0.0 4.3
County: Steuben Secchi (ft): 10.5 Mean species/site: 0.46Date: 8/15/2012 Sites with plants: 5 SE Mean species/site: 0.18
Littoral Depth (ft): 19.0 Sites with native plants: 3 Mean native species/site: 0.23Littoral Sites: 13 Number of species: 3 SE Mean natives/site: 0.12
Total Sites: 13 Number of native species: 2 Species diversity: 0.61Maximum species/site: 2 Native species diversity: 0.44
Depths: 10 to 15 ftSpecies 0 1 3 5Eurasian watermilfoil 23.1 76.9 7.7 7.7 7.7 13.8Illinois Pondweed 15.4 84.6 0.0 15.4 0.0 9.2Slender Naiad 7.7 92.3 0.0 7.7 0.0 4.6
County: Steuben Secchi (ft): 10.5 Mean species/site: 0.07Date: 8/15/2012 Sites with plants: 1 SE Mean species/site: 0.07
Littoral Depth (ft): 19.0 Sites with native plants: 1 Mean native species/site: 0.07Littoral Sites: 15 Number of species: 1 SE Mean natives/site: 0.07
Total Sites: 15 Number of native species: 1 Species diversity: 0.00Maximum species/site: 1 Native species diversity: 0.00
Depths: 15 to 20 ftSpecies 0 1 3 5Small Pondweed 6.7 93.3 6.7 0.0 0.0 1.3
Occurrence and Abundance of Submersed Aquatic Plants in Lake Gage
Frequency of Occurrence
Rake score frequency per species Plant Dominance
Occurrence and Abundance of Submersed Aquatic Plants in Lake Gage
Frequency of Occurrence
Rake score frequency per species Plant Dominance
Occurrence and Abundance of Submersed Aquatic Plants in Lake Gage
Frequency of Occurrence
Rake score frequency per species Plant Dominance
Occurrence and Abundance of Submersed Aquatic Plants in Lake Gage
Frequency of Occurrence
Rake score frequency per species Plant Dominance
Frequency of Occurrence
Rake score frequency per species Plant Dominance
Occurrence and Abundance of Submersed Aquatic Plants in Lake Gage
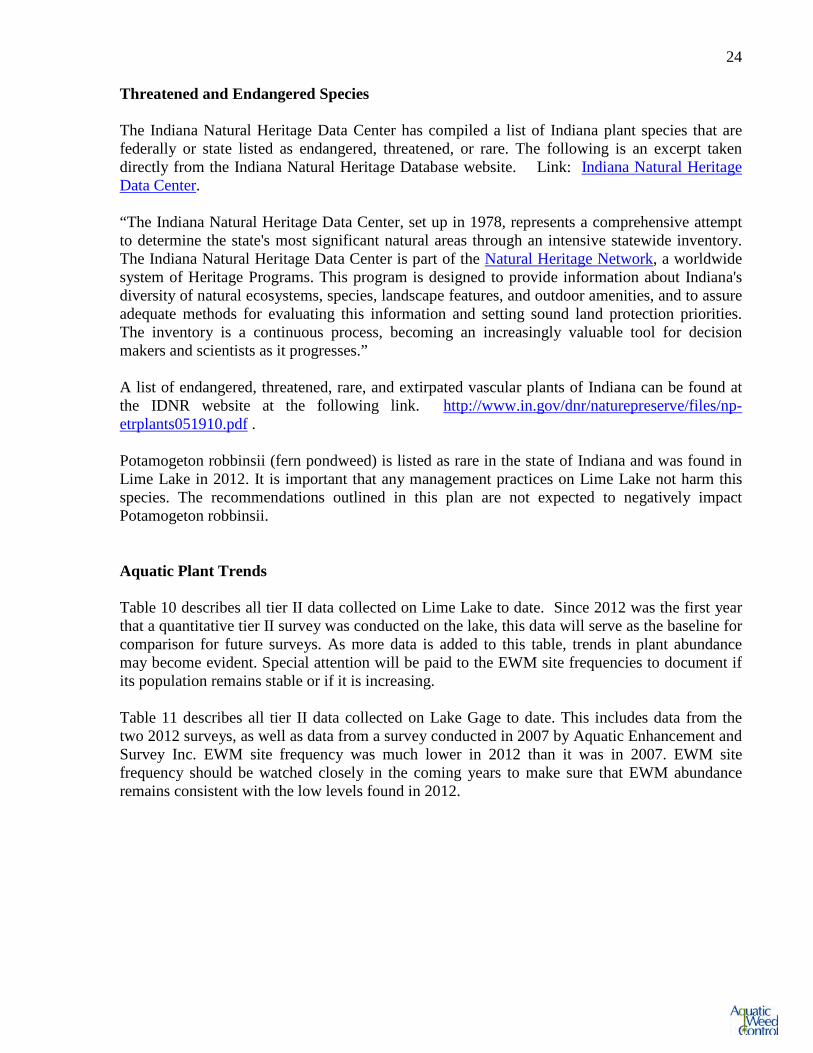
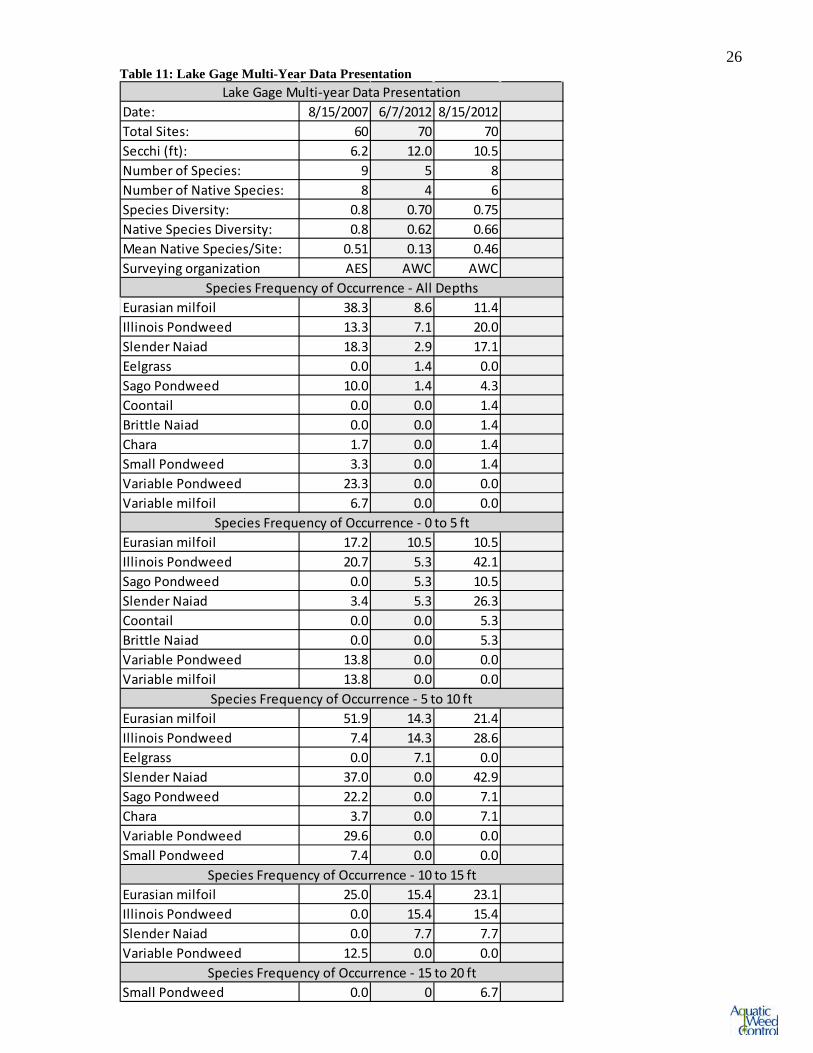
24 Threatened and Endangered Species The Indiana Natural Heritage Data Center has compiled a list of Indiana plant species that are federally or state listed as endangered, threatened, or rare. The following is an excerpt taken directly from the Indiana Natural Heritage Database website. Link: Indiana Natural Heritage Data Center. “The Indiana Natural Heritage Data Center, set up in 1978, represents a comprehensive attempt to determine the state's most significant natural areas through an intensive statewide inventory. The Indiana Natural Heritage Data Center is part of the Natural Heritage Network, a worldwide system of Heritage Programs. This program is designed to provide information about Indiana's diversity of natural ecosystems, species, landscape features, and outdoor amenities, and to assure adequate methods for evaluating this information and setting sound land protection priorities. The inventory is a continuous process, becoming an increasingly valuable tool for decision makers and scientists as it progresses.” A list of endangered, threatened, rare, and extirpated vascular plants of Indiana can be found at the IDNR website at the following link. http://www.in.gov/dnr/naturepreserve/files/np-etrplants051910.pdf . Potamogeton robbinsii (fern pondweed) is listed as rare in the state of Indiana and was found in Lime Lake in 2012. It is important that any management practices on Lime Lake not harm this species. The recommendations outlined in this plan are not expected to negatively impact Potamogeton robbinsii. Aquatic Plant Trends Table 10 describes all tier II data collected on Lime Lake to date. Since 2012 was the first year that a quantitative tier II survey was conducted on the lake, this data will serve as the baseline for comparison for future surveys. As more data is added to this table, trends in plant abundance may become evident. Special attention will be paid to the EWM site frequencies to document if its population remains stable or if it is increasing. Table 11 describes all tier II data collected on Lake Gage to date. This includes data from the two 2012 surveys, as well as data from a survey conducted in 2007 by Aquatic Enhancement and Survey Inc. EWM site frequency was much lower in 2012 than it was in 2007. EWM site frequency should be watched closely in the coming years to make sure that EWM abundance remains consistent with the low levels found in 2012.
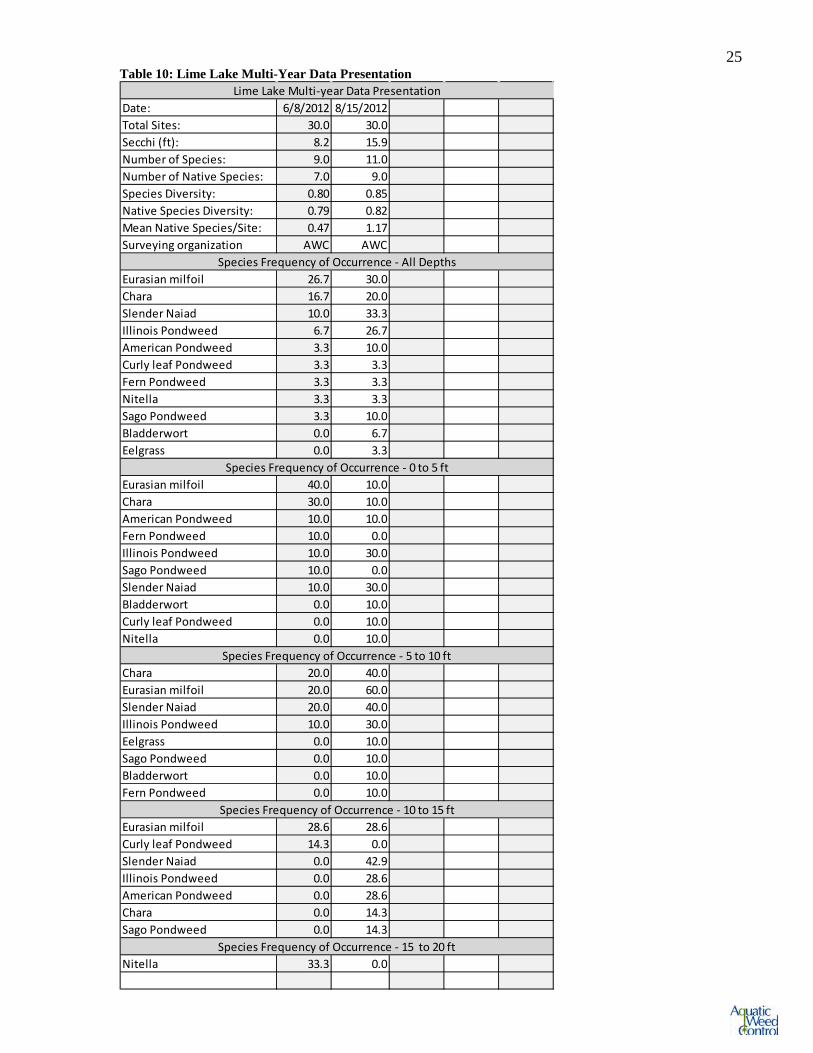
25 Table 10: Lime Lake Multi-Year Data Presentation
Date: 6/8/2012 8/15/2012Total Sites: 30.0 30.0Secchi (ft): 8.2 15.9Number of Species: 9.0 11.0Number of Native Species: 7.0 9.0Species Diversity: 0.80 0.85Native Species Diversity: 0.79 0.82Mean Native Species/Site: 0.47 1.17Surveying organization AWC AWC
Eurasian milfoil 26.7 30.0Chara 16.7 20.0Slender Naiad 10.0 33.3Illinois Pondweed 6.7 26.7American Pondweed 3.3 10.0Curly leaf Pondweed 3.3 3.3Fern Pondweed 3.3 3.3Nitella 3.3 3.3Sago Pondweed 3.3 10.0Bladderwort 0.0 6.7Eelgrass 0.0 3.3
Eurasian milfoil 40.0 10.0Chara 30.0 10.0American Pondweed 10.0 10.0Fern Pondweed 10.0 0.0Illinois Pondweed 10.0 30.0Sago Pondweed 10.0 0.0Slender Naiad 10.0 30.0Bladderwort 0.0 10.0Curly leaf Pondweed 0.0 10.0Nitella 0.0 10.0
Chara 20.0 40.0Eurasian milfoil 20.0 60.0Slender Naiad 20.0 40.0Illinois Pondweed 10.0 30.0Eelgrass 0.0 10.0Sago Pondweed 0.0 10.0Bladderwort 0.0 10.0Fern Pondweed 0.0 10.0
Eurasian milfoil 28.6 28.6Curly leaf Pondweed 14.3 0.0Slender Naiad 0.0 42.9Illinois Pondweed 0.0 28.6American Pondweed 0.0 28.6Chara 0.0 14.3Sago Pondweed 0.0 14.3
Nitella 33.3 0.0Species Frequency of Occurrence - 15 to 20 ft
Lime Lake Multi-year Data Presentation
Species Frequency of Occurrence - All Depths
Species Frequency of Occurrence - 0 to 5 ft
Species Frequency of Occurrence - 5 to 10 ft
Species Frequency of Occurrence - 10 to 15 ft
26 Table 11: Lake Gage Multi-Year Data Presentation
Date: 8/15/2007 6/7/2012 8/15/2012Total Sites: 60 70 70Secchi (ft): 6.2 12.0 10.5Number of Species: 9 5 8Number of Native Species: 8 4 6Species Diversity: 0.8 0.70 0.75Native Species Diversity: 0.8 0.62 0.66Mean Native Species/Site: 0.51 0.13 0.46Surveying organization AES AWC AWC
Eurasian milfoil 38.3 8.6 11.4Illinois Pondweed 13.3 7.1 20.0Slender Naiad 18.3 2.9 17.1Eelgrass 0.0 1.4 0.0Sago Pondweed 10.0 1.4 4.3Coontail 0.0 0.0 1.4Brittle Naiad 0.0 0.0 1.4Chara 1.7 0.0 1.4Small Pondweed 3.3 0.0 1.4Variable Pondweed 23.3 0.0 0.0Variable milfoil 6.7 0.0 0.0
Eurasian milfoil 17.2 10.5 10.5Illinois Pondweed 20.7 5.3 42.1Sago Pondweed 0.0 5.3 10.5Slender Naiad 3.4 5.3 26.3Coontail 0.0 0.0 5.3Brittle Naiad 0.0 0.0 5.3Variable Pondweed 13.8 0.0 0.0Variable milfoil 13.8 0.0 0.0
Eurasian milfoil 51.9 14.3 21.4Illinois Pondweed 7.4 14.3 28.6Eelgrass 0.0 7.1 0.0Slender Naiad 37.0 0.0 42.9Sago Pondweed 22.2 0.0 7.1Chara 3.7 0.0 7.1Variable Pondweed 29.6 0.0 0.0Small Pondweed 7.4 0.0 0.0
Eurasian milfoil 25.0 15.4 23.1Illinois Pondweed 0.0 15.4 15.4Slender Naiad 0.0 7.7 7.7Variable Pondweed 12.5 0.0 0.0
Small Pondweed 0.0 0 6.7Species Frequency of Occurrence - 15 to 20 ft
Lake Gage Multi-year Data Presentation
Species Frequency of Occurrence - All Depths
Species Frequency of Occurrence - 0 to 5 ft
Species Frequency of Occurrence - 5 to 10 ft
Species Frequency of Occurrence - 10 to 15 ft
27 Exotic Species
Figure 8 describes Eurasian watermilfoil distribution in Lake Gage and Lime Lake. EWM is more common in Lime Lake than in Lake Gage. Areas shaded red are places where Eurasian watermilfoil is the most dominant plant species. Numbered red dots indicate tier II sample locations where EWM was collected. The number beside each dot is the abundance score that EWM received at that site. Un-numbered small red dots were visual sightings of EWM marked with GPS. Site frequency of EWM in Lake Gage was 8.6 percent in June and 11.4 percent in August. EWM frequency in Lime Lake was 26.7 percent in June and 30.0 percent in August. The only other exotic species found in these lakes besides EWM was curly-leaf pondweed (CLP) and Brittle naiad (Najas minor). Curly-leaf pondweed was found at only one sample site in both spring and fall in Lime Lake. It was not collected in Lake Gage in 2012. Brittle naiad was also found in low abundance, and does not appear to be impacting the lakes native community or recreation.
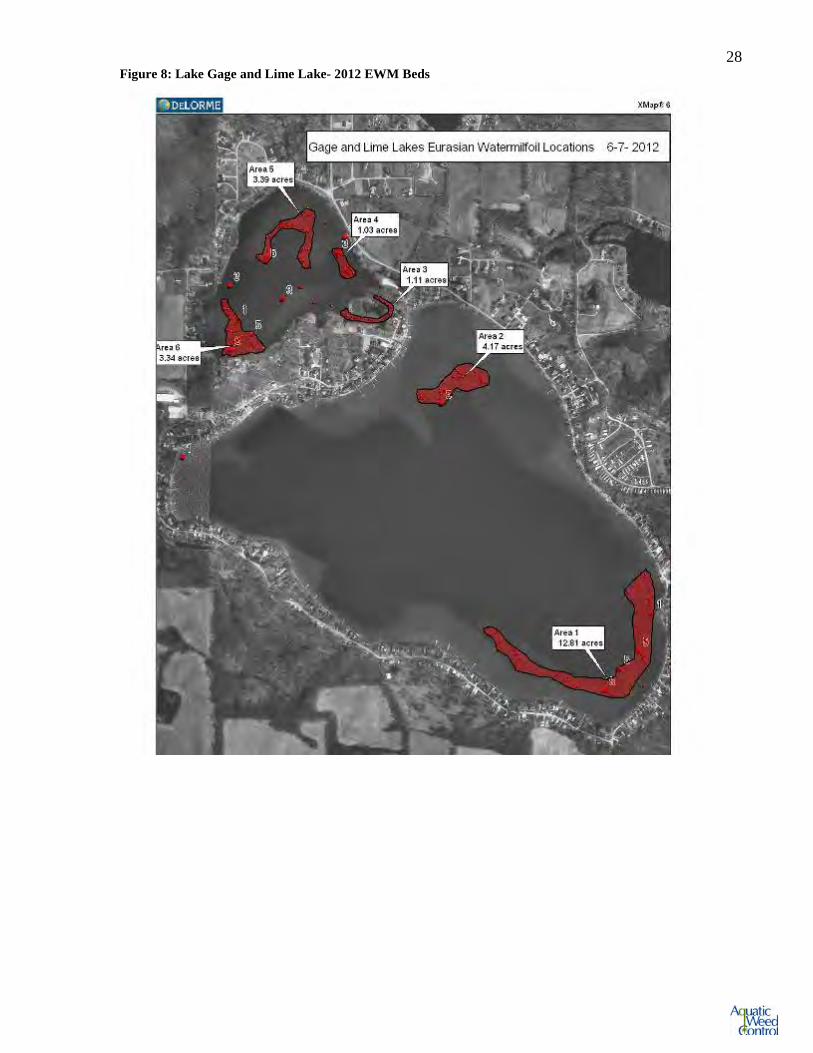
28 Figure 8: Lake Gage and Lime Lake- 2012 EWM Beds
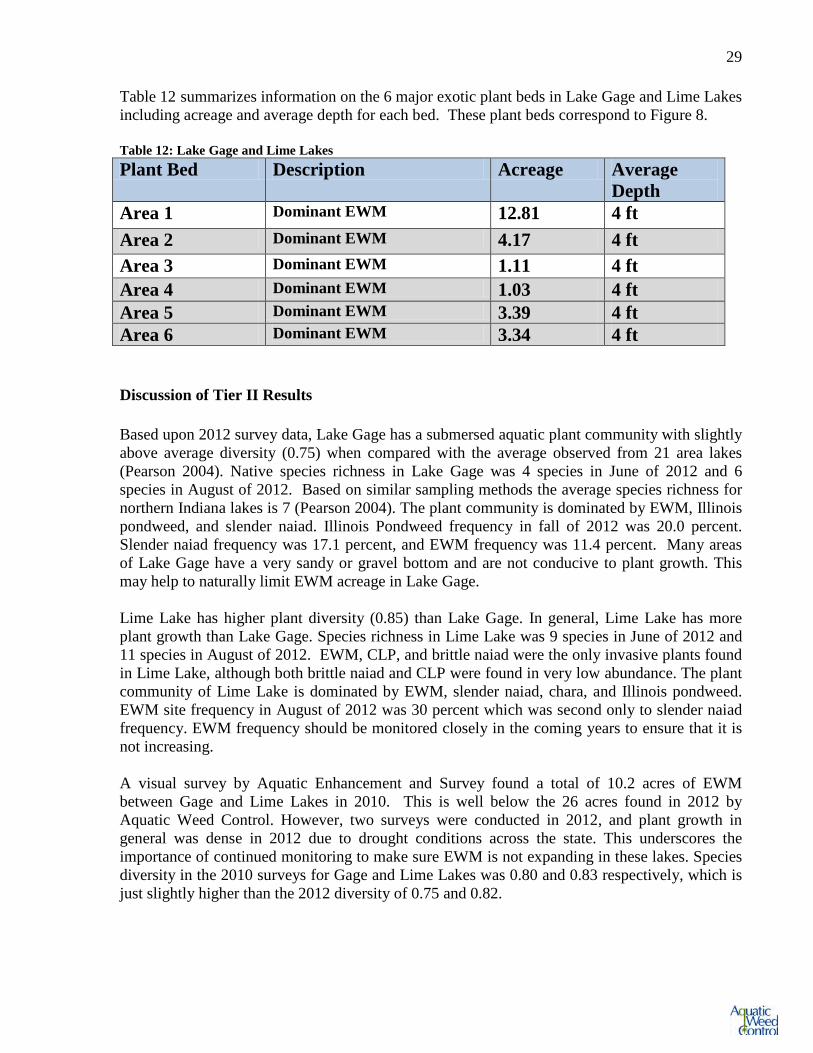
29 Table 12 summarizes information on the 6 major exotic plant beds in Lake Gage and Lime Lakes including acreage and average depth for each bed. These plant beds correspond to Figure 8. Table 12: Lake Gage and Lime Lakes Plant Bed Description Acreage Average
Depth Area 1 Dominant EWM 12.81 4 ft Area 2 Dominant EWM 4.17 4 ft Area 3 Dominant EWM 1.11 4 ft Area 4 Dominant EWM 1.03 4 ft Area 5 Dominant EWM 3.39 4 ft Area 6 Dominant EWM 3.34 4 ft Discussion of Tier II Results Based upon 2012 survey data, Lake Gage has a submersed aquatic plant community with slightly above average diversity (0.75) when compared with the average observed from 21 area lakes (Pearson 2004). Native species richness in Lake Gage was 4 species in June of 2012 and 6 species in August of 2012. Based on similar sampling methods the average species richness for northern Indiana lakes is 7 (Pearson 2004). The plant community is dominated by EWM, Illinois pondweed, and slender naiad. Illinois Pondweed frequency in fall of 2012 was 20.0 percent. Slender naiad frequency was 17.1 percent, and EWM frequency was 11.4 percent. Many areas of Lake Gage have a very sandy or gravel bottom and are not conducive to plant growth. This may help to naturally limit EWM acreage in Lake Gage. Lime Lake has higher plant diversity (0.85) than Lake Gage. In general, Lime Lake has more plant growth than Lake Gage. Species richness in Lime Lake was 9 species in June of 2012 and 11 species in August of 2012. EWM, CLP, and brittle naiad were the only invasive plants found in Lime Lake, although both brittle naiad and CLP were found in very low abundance. The plant community of Lime Lake is dominated by EWM, slender naiad, chara, and Illinois pondweed. EWM site frequency in August of 2012 was 30 percent which was second only to slender naiad frequency. EWM frequency should be monitored closely in the coming years to ensure that it is not increasing. A visual survey by Aquatic Enhancement and Survey found a total of 10.2 acres of EWM between Gage and Lime Lakes in 2010. This is well below the 26 acres found in 2012 by Aquatic Weed Control. However, two surveys were conducted in 2012, and plant growth in general was dense in 2012 due to drought conditions across the state. This underscores the importance of continued monitoring to make sure EWM is not expanding in these lakes. Species diversity in the 2010 surveys for Gage and Lime Lakes was 0.80 and 0.83 respectively, which is just slightly higher than the 2012 diversity of 0.75 and 0.82.
30 Public Involvement Parties interested in vegetation management activities include the Lake Gage and Lime Lake Association as well as lake users who access the lake via the DNR public access site on Lime Lake. District fisheries biologists, as well as LARE biologists, and Aquatic Weed Control work together to develop an acceptable management plan that will attempt to meet the goals of both the LARE program and the lake association. A public meeting was held by the Lake Gage and Lime Lake Association on August 25, 2012. Jim Donahoe of Aquatic Weed Control summarized LARE program goals and outlined the discussed management options available for the control of Eurasian watermilfoil. Thirty-six lake use surveys were returned. Figure 9 summarizes public survey results as well as written comments received at the August meeting. Residents were concerned about possible expansion of EWM in the lakes and were also concerned about the heavy amounts of public use affecting the lakes. A LARE meeting was held on October 30, 2012 to discuss issues pertaining to Lake Gage and Lime Lake with members of the lake association. District 2 Fisheries biologists Neil Ledet and Larry Koza, Jim Donahoe and Dave Keister of Aquatic Weed Control, and LARE Aquatic Biologist Rod Edgell were all present and discussed the plant community of Lake Gage and Lime Lake. Discussion at this meeting helped to develop the current EWM management strategy. The most common and often most effective methods for keeping the public informed about aquatic vegetation management practices are lake association meetings as well as periodical newsletters sent out by the associations. It is recommended that association members encourage neighbors and other lake users to attend lake association meetings so that interested parties are well informed about the LARE program. Making sure that meetings are well advertised and planned well in advance of the meeting dates are ways to help ensure good attendance. Carry-in dinners, door prizes, contests, guest speakers and discussion panels are all excellent ways to boost attendance, encourage involvement and keep association members informed about lake management activities.
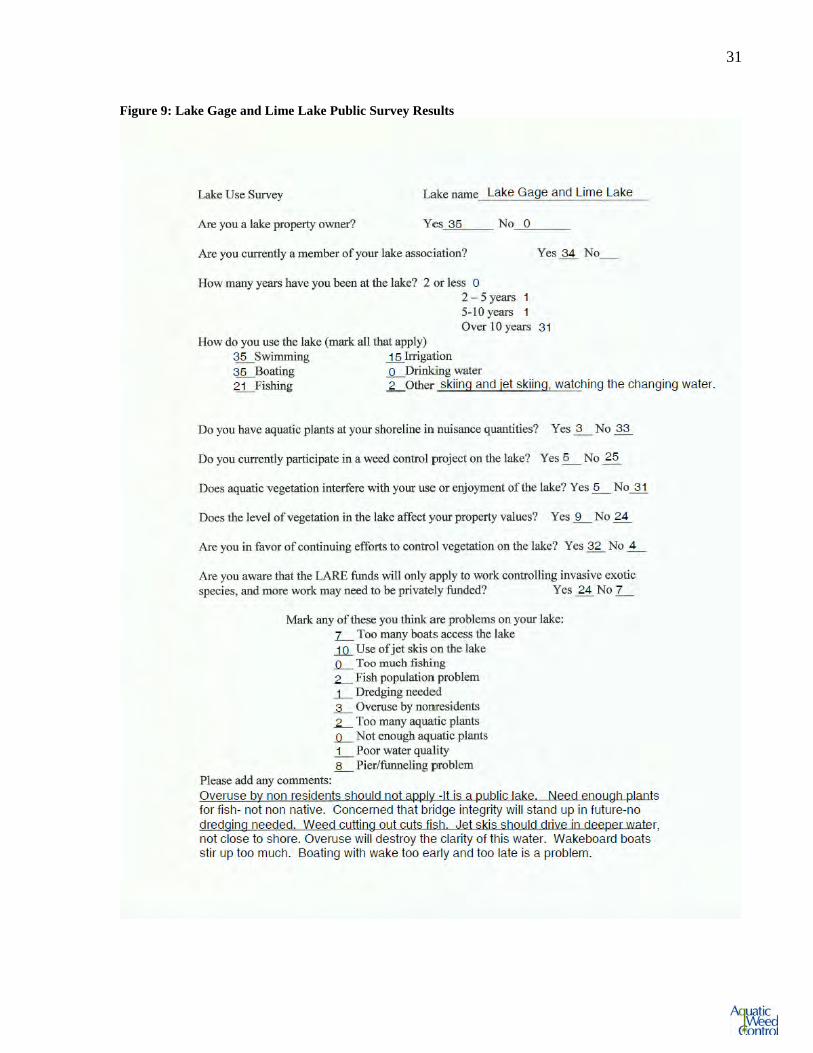
31 Figure 9: Lake Gage and Lime Lake Public Survey Results
32 Objectives The major objectives of this management strategy will be to enhance lake use and ecology by effectively controlling EWM without causing harm to the native plant community. Specific measurable objectives are helpful to determine the success of this EWM management strategy. They are as follows:
1. Reduce EWM site frequency to 10 percent or less each year in the summer (post treatment) tier II survey in Lime Lake.
2. Maintain EWM frequency below 10 percent each year in the summer tier II survey in Lake Gage.
3. Maintain at least 8 native plant species collected each year in Lime Lake and a native diversity of 0.79.
4. Maintain at least 6 native plant species collected each year in Lake Gage and a native diversity of 0.62.
These goals will be maintained throughout the full five years encompassed in this plan. Action Plan Lake Gage and Lime Lake currently have Eurasian watermilfoil established in various locations. Eurasian watermilfoil is believed to have arrived in North America in the mid 1940’s and has spread throughout the east coast to northern Florida and the Midwest. Eurasian watermilfoil spreads by fragmentation and seed dispersal, and it has the ability to over-winter from year to year. Once it is in a lake it can become the dominant plant species because it forms dense canopies which shade out the native, more beneficial plant species below. There is also evidence that mat forming species like Eurasian watermilfoil and curly-leaf pondweed exert significant negative impacts on a broad range of aquatic organisms (Pullman, 1998). Many management strategies have been used to control Eurasian watermilfoil in Indiana lakes. A management strategy should be chosen based on its selectivity of the pest in question, its long term effectiveness, and its environmental risks, The main goal of this plan is to choose a management option that can effectively control the Eurasian milfoil with little environmental risk, while causing no harm to native plant or fish species. Potential Management Options Detailed information on common forms of EWM control is included in the appendix to this report. These include nutrient reduction, mechanical harvesting, EWM weevils, grass carp, water level manipulation, hand pulling, and bottom barriers. No Action If no action is taken, the Eurasian watermilfoil abundance has the potential to increase in the littoral zone from year to year. Eurasian watermilfoil grows by fragmentation, meaning that if the plant is cut, the fragment has the ability to form an entirely new plant. Eurasian watermilfoil also over-winters as an adult plant so new generations are created in each growing season. These reproductive characteristics can cause milfoil beds to become denser over time. The morphology and the substrate of Lake Gage may help to naturally limit EWM acreage, but its dominance in
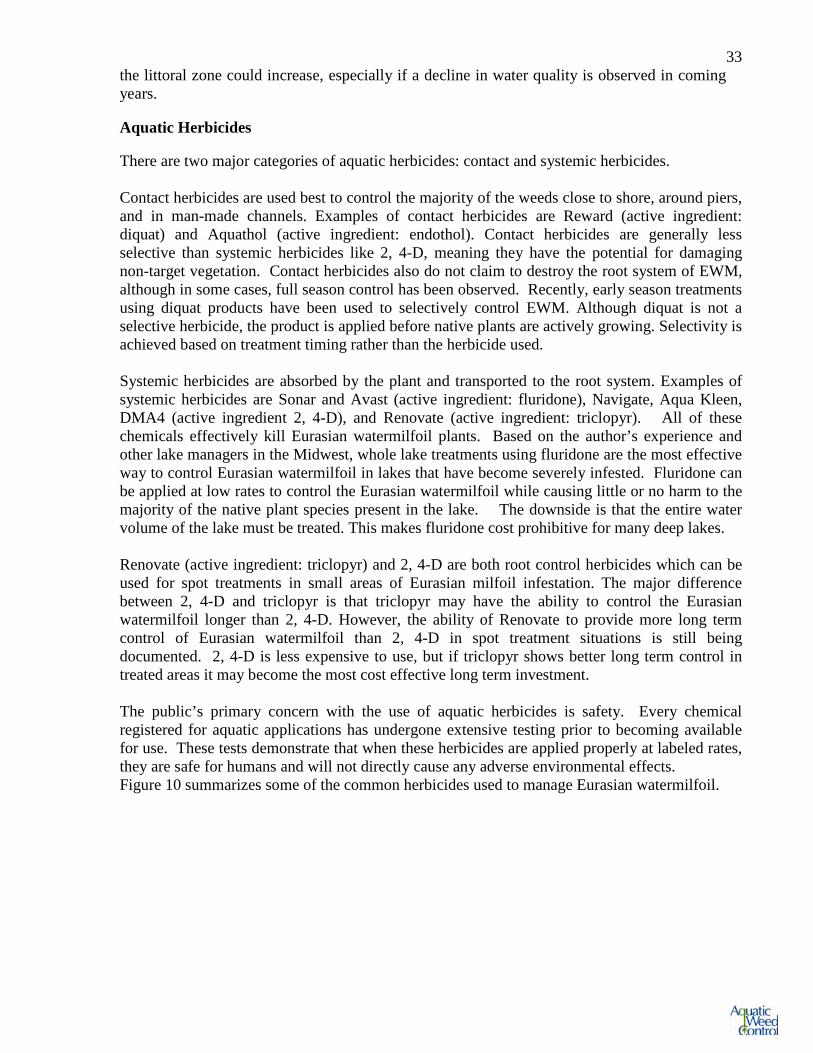
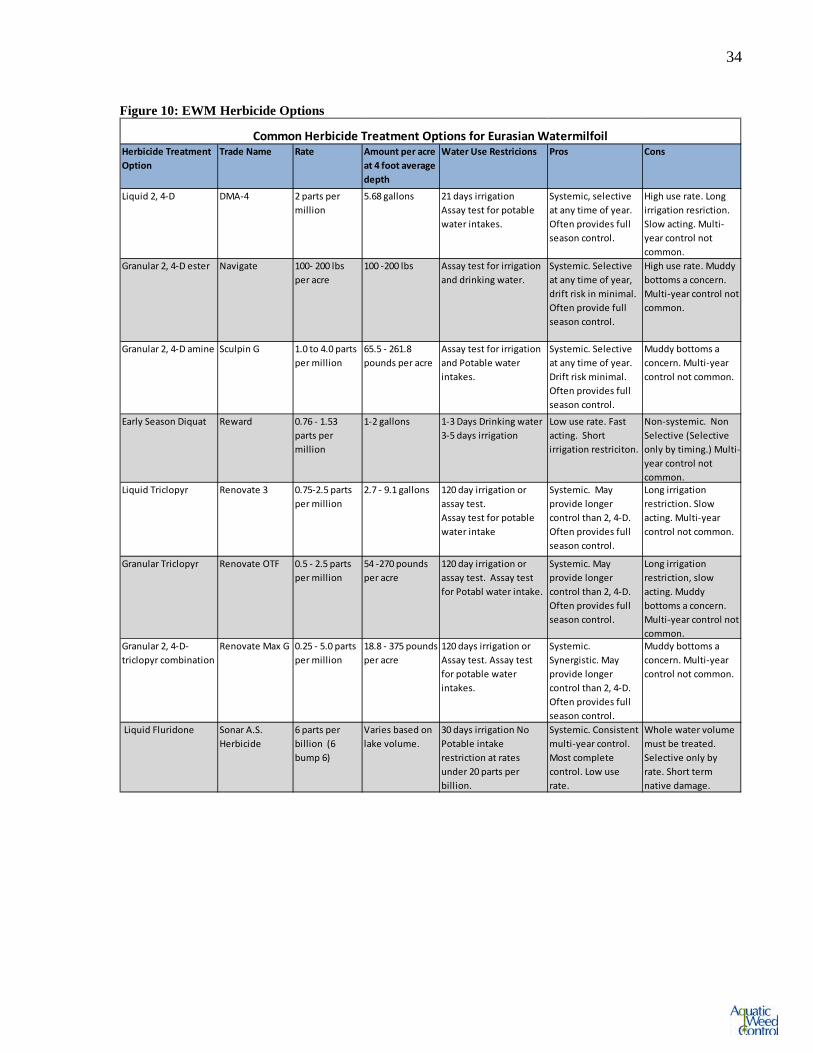
33 the littoral zone could increase, especially if a decline in water quality is observed in coming years. Aquatic Herbicides There are two major categories of aquatic herbicides: contact and systemic herbicides. Contact herbicides are used best to control the majority of the weeds close to shore, around piers, and in man-made channels. Examples of contact herbicides are Reward (active ingredient: diquat) and Aquathol (active ingredient: endothol). Contact herbicides are generally less selective than systemic herbicides like 2, 4-D, meaning they have the potential for damaging non-target vegetation. Contact herbicides also do not claim to destroy the root system of EWM, although in some cases, full season control has been observed. Recently, early season treatments using diquat products have been used to selectively control EWM. Although diquat is not a selective herbicide, the product is applied before native plants are actively growing. Selectivity is achieved based on treatment timing rather than the herbicide used. Systemic herbicides are absorbed by the plant and transported to the root system. Examples of systemic herbicides are Sonar and Avast (active ingredient: fluridone), Navigate, Aqua Kleen, DMA4 (active ingredient 2, 4-D), and Renovate (active ingredient: triclopyr). All of these chemicals effectively kill Eurasian watermilfoil plants. Based on the author’s experience and other lake managers in the Midwest, whole lake treatments using fluridone are the most effective way to control Eurasian watermilfoil in lakes that have become severely infested. Fluridone can be applied at low rates to control the Eurasian watermilfoil while causing little or no harm to the majority of the native plant species present in the lake. The downside is that the entire water volume of the lake must be treated. This makes fluridone cost prohibitive for many deep lakes. Renovate (active ingredient: triclopyr) and 2, 4-D are both root control herbicides which can be used for spot treatments in small areas of Eurasian milfoil infestation. The major difference between 2, 4-D and triclopyr is that triclopyr may have the ability to control the Eurasian watermilfoil longer than 2, 4-D. However, the ability of Renovate to provide more long term control of Eurasian watermilfoil than 2, 4-D in spot treatment situations is still being documented. 2, 4-D is less expensive to use, but if triclopyr shows better long term control in treated areas it may become the most cost effective long term investment. The public’s primary concern with the use of aquatic herbicides is safety. Every chemical registered for aquatic applications has undergone extensive testing prior to becoming available for use. These tests demonstrate that when these herbicides are applied properly at labeled rates, they are safe for humans and will not directly cause any adverse environmental effects. Figure 10 summarizes some of the common herbicides used to manage Eurasian watermilfoil.
34 Figure 10: EWM Herbicide Options
Herbicide Treatment Option
Trade Name Rate Amount per acre at 4 foot average depth
Water Use Restricions Pros Cons
Liquid 2, 4-D DMA-4 2 parts per million
5.68 gallons 21 days irrigation Assay test for potable water intakes.
Systemic, selective at any time of year. Often provides full season control.
High use rate. Long irrigation resriction. Slow acting. Multi-year control not common.
Granular 2, 4-D ester Navigate 100- 200 lbs per acre
100 -200 lbs Assay test for irrigation and drinking water.
Systemic. Selective at any time of year, drift risk in minimal. Often provide full season control.
High use rate. Muddy bottoms a concern. Multi-year control not common.
Granular 2, 4-D amine Sculpin G 1.0 to 4.0 parts per million
65.5 - 261.8 pounds per acre
Assay test for irrigation and Potable water intakes.
Systemic. Selective at any time of year. Drift risk minimal. Often provides full season control.
Muddy bottoms a concern. Multi-year control not common.
Early Season Diquat Reward 0.76 - 1.53 parts per million
1-2 gallons 1-3 Days Drinking water 3-5 days irrigation
Low use rate. Fast acting. Short irrigation restriciton.
Non-systemic. Non Selective (Selective only by timing.) Multi-year control not common.
Liquid Triclopyr Renovate 3 0.75-2.5 parts per million
2.7 - 9.1 gallons 120 day irrigation or assay test. Assay test for potable water intake
Systemic. May provide longer control than 2, 4-D. Often provides full season control.
Long irrigation restriction. Slow acting. Multi-year control not common.
Granular Triclopyr Renovate OTF 0.5 - 2.5 parts per million
54 -270 pounds per acre
120 day irrigation or assay test. Assay test for Potabl water intake.
Systemic. May provide longer control than 2, 4-D. Often provides full season control.
Long irrigation restriction, slow acting. Muddy bottoms a concern. Multi-year control not common.
Granular 2, 4-D-triclopyr combination
Renovate Max G 0.25 - 5.0 parts per million
18.8 - 375 pounds per acre
120 days irrigation or Assay test. Assay test for potable water intakes.
Systemic. Synergistic. May provide longer control than 2, 4-D. Often provides full season control.
Muddy bottoms a concern. Multi-year control not common.
Liquid Fluridone Sonar A.S. Herbicide
6 parts per billion (6 bump 6)
Varies based on lake volume.
30 days irrigation No Potable intake restriction at rates under 20 parts per billion.
Systemic. Consistent multi-year control. Most complete control. Low use rate.
Whole water volume must be treated. Selective only by rate. Short term native damage.
Common Herbicide Treatment Options for Eurasian Watermilfoil
35 Lake Gage and Lime Lake : 3-Year Treatment Plan If the lake association decides to proceed with treatment in 2013 it is recommended that all areas of EWM infestation in Lake Gage and Lime Lake be treated with liquid Diquat herbicide early in the season to selectively control milfoil without damaging native plants. Application should occur when water temperatures approach 50 degrees (warming trend) and are not higher than 60 degrees. Any areas of re-growth later in summer should be treated with 2.0 ppm of liquid DMA-4 herbicide. The main reasons for choosing this strategy are listed below.
1. Diquat has been shown to effectively control EWM. 2. Treating early in the season (April or early May) will not harm native vegetation because
it will not be actively growing. 3. Liquid DMA-4 is a good option for summer treatments because it is selective by mode of
action and will not harm native vegetation at any time of year.
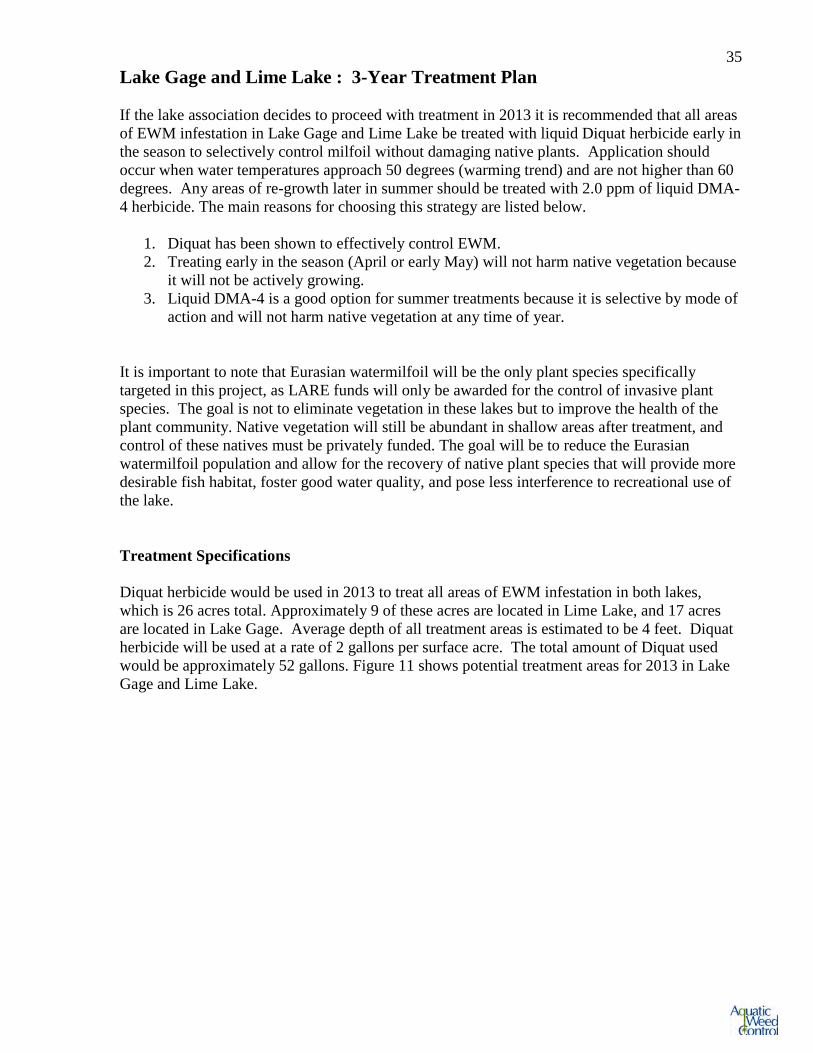
It is important to note that Eurasian watermilfoil will be the only plant species specifically targeted in this project, as LARE funds will only be awarded for the control of invasive plant species. The goal is not to eliminate vegetation in these lakes but to improve the health of the plant community. Native vegetation will still be abundant in shallow areas after treatment, and control of these natives must be privately funded. The goal will be to reduce the Eurasian watermilfoil population and allow for the recovery of native plant species that will provide more desirable fish habitat, foster good water quality, and pose less interference to recreational use of the lake. Treatment Specifications Diquat herbicide would be used in 2013 to treat all areas of EWM infestation in both lakes, which is 26 acres total. Approximately 9 of these acres are located in Lime Lake, and 17 acres are located in Lake Gage. Average depth of all treatment areas is estimated to be 4 feet. Diquat herbicide will be used at a rate of 2 gallons per surface acre. The total amount of Diquat used would be approximately 52 gallons. Figure 11 shows potential treatment areas for 2013 in Lake Gage and Lime Lake.
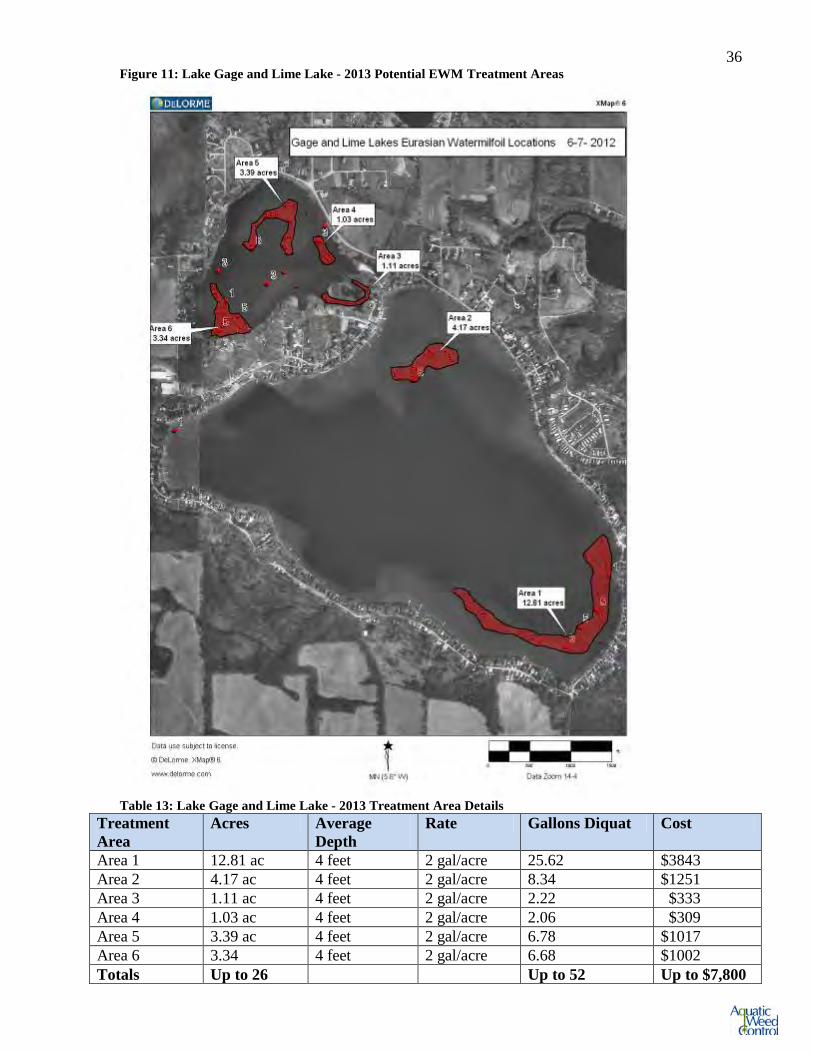
36 Figure 11: Lake Gage and Lime Lake - 2013 Potential EWM Treatment Areas
Table 13: Lake Gage and Lime Lake - 2013 Treatment Area Details
Treatment Area
Acres Average Depth
Rate Gallons Diquat Cost
Area 1 12.81 ac 4 feet 2 gal/acre 25.62 $3843 Area 2 4.17 ac 4 feet 2 gal/acre 8.34 $1251 Area 3 1.11 ac 4 feet 2 gal/acre 2.22 $333 Area 4 1.03 ac 4 feet 2 gal/acre 2.06 $309 Area 5 3.39 ac 4 feet 2 gal/acre 6.78 $1017 Area 6 3.34 4 feet 2 gal/acre 6.68 $1002 Totals Up to 26 Up to 52 Up to $7,800
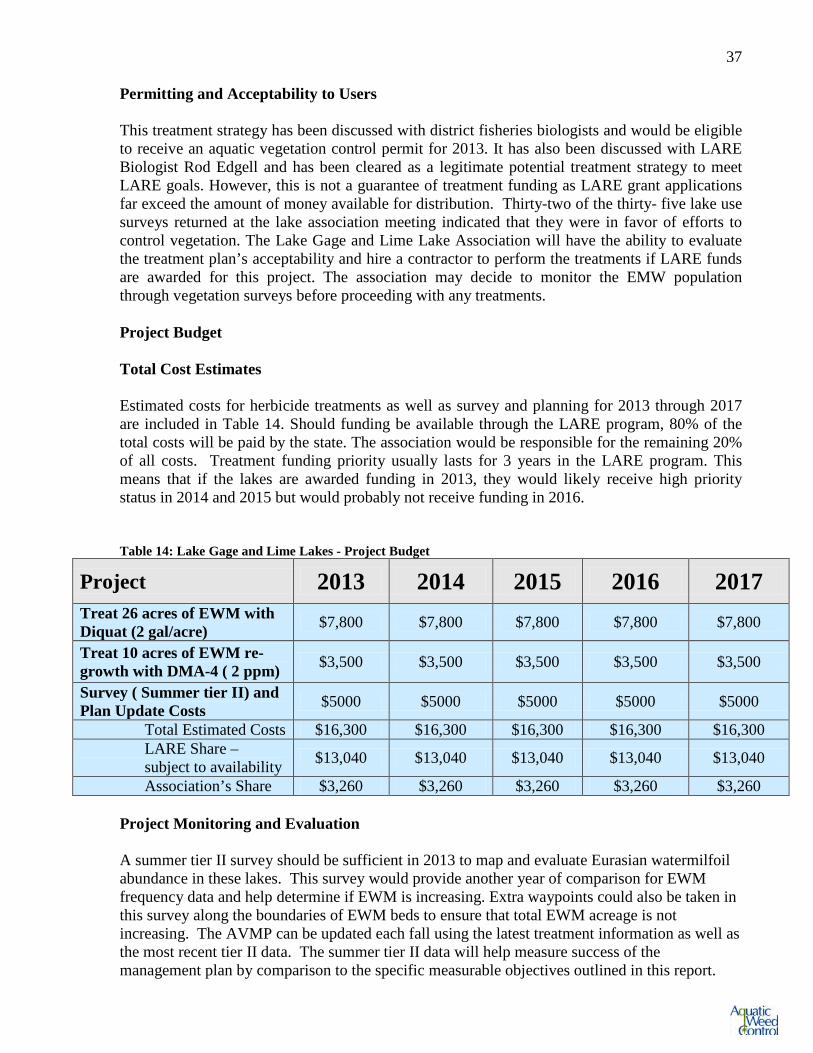
37 Permitting and Acceptability to Users This treatment strategy has been discussed with district fisheries biologists and would be eligible to receive an aquatic vegetation control permit for 2013. It has also been discussed with LARE Biologist Rod Edgell and has been cleared as a legitimate potential treatment strategy to meet LARE goals. However, this is not a guarantee of treatment funding as LARE grant applications far exceed the amount of money available for distribution. Thirty-two of the thirty- five lake use surveys returned at the lake association meeting indicated that they were in favor of efforts to control vegetation. The Lake Gage and Lime Lake Association will have the ability to evaluate the treatment plan’s acceptability and hire a contractor to perform the treatments if LARE funds are awarded for this project. The association may decide to monitor the EMW population through vegetation surveys before proceeding with any treatments. Project Budget Total Cost Estimates Estimated costs for herbicide treatments as well as survey and planning for 2013 through 2017 are included in Table 14. Should funding be available through the LARE program, 80% of the total costs will be paid by the state. The association would be responsible for the remaining 20% of all costs. Treatment funding priority usually lasts for 3 years in the LARE program. This means that if the lakes are awarded funding in 2013, they would likely receive high priority status in 2014 and 2015 but would probably not receive funding in 2016. Table 14: Lake Gage and Lime Lakes - Project Budget
Project 2013 2014 2015 2016 2017
Treat 26 acres of EWM with Diquat (2 gal/acre) $7,800 $7,800 $7,800 $7,800 $7,800
Treat 10 acres of EWM re-growth with DMA-4 ( 2 ppm) $3,500 $3,500 $3,500 $3,500 $3,500
Survey ( Summer tier II) and Plan Update Costs $5000 $5000 $5000 $5000 $5000
Total Estimated Costs $16,300 $16,300 $16,300 $16,300 $16,300 LARE Share – subject to availability $13,040 $13,040 $13,040 $13,040 $13,040
Association’s Share $3,260 $3,260 $3,260 $3,260 $3,260 Project Monitoring and Evaluation A summer tier II survey should be sufficient in 2013 to map and evaluate Eurasian watermilfoil abundance in these lakes. This survey would provide another year of comparison for EWM frequency data and help determine if EWM is increasing. Extra waypoints could also be taken in this survey along the boundaries of EWM beds to ensure that total EWM acreage is not increasing. The AVMP can be updated each fall using the latest treatment information as well as the most recent tier II data. The summer tier II data will help measure success of the management plan by comparison to the specific measurable objectives outlined in this report.
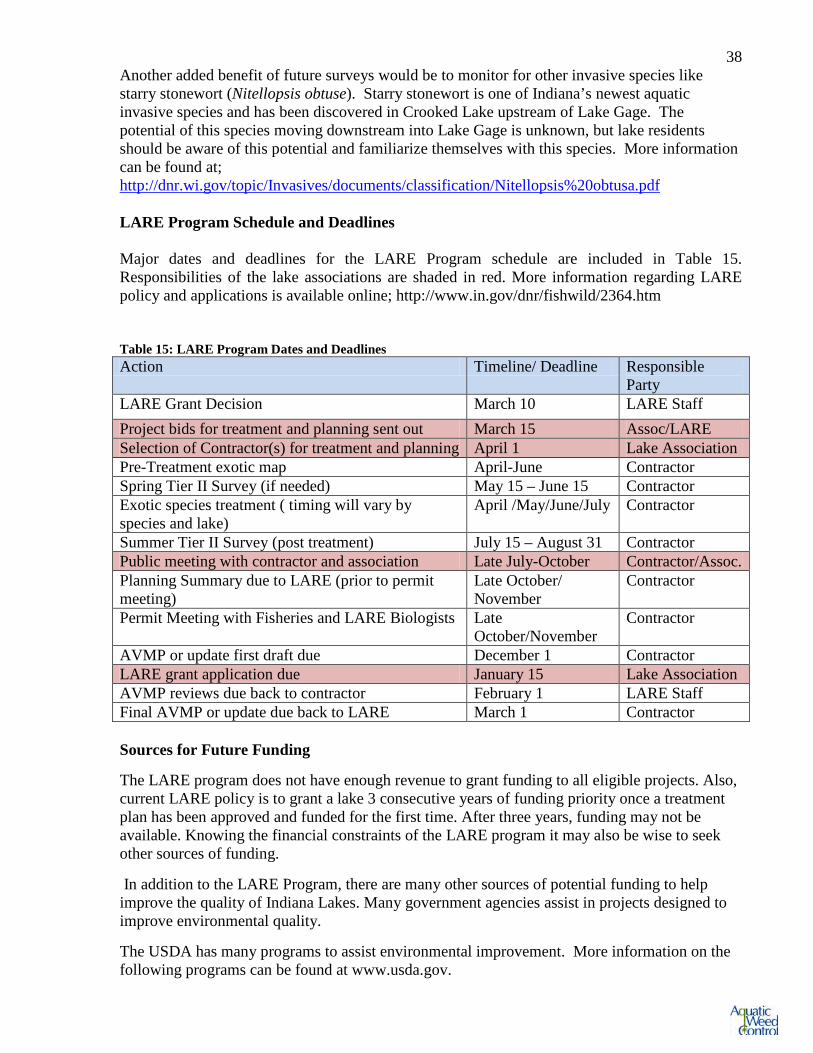
38 Another added benefit of future surveys would be to monitor for other invasive species like starry stonewort (Nitellopsis obtuse). Starry stonewort is one of Indiana’s newest aquatic invasive species and has been discovered in Crooked Lake upstream of Lake Gage. The potential of this species moving downstream into Lake Gage is unknown, but lake residents should be aware of this potential and familiarize themselves with this species. More information can be found at; http://dnr.wi.gov/topic/Invasives/documents/classification/Nitellopsis%20obtusa.pdf LARE Program Schedule and Deadlines Major dates and deadlines for the LARE Program schedule are included in Table 15. Responsibilities of the lake associations are shaded in red. More information regarding LARE policy and applications is available online; http://www.in.gov/dnr/fishwild/2364.htm Table 15: LARE Program Dates and Deadlines Action Timeline/ Deadline Responsible
Party LARE Grant Decision March 10 LARE Staff Project bids for treatment and planning sent out March 15 Assoc/LARE Selection of Contractor(s) for treatment and planning April 1 Lake Association Pre-Treatment exotic map April-June Contractor Spring Tier II Survey (if needed) May 15 – June 15 Contractor Exotic species treatment ( timing will vary by species and lake)
April /May/June/July Contractor
Summer Tier II Survey (post treatment) July 15 – August 31 Contractor Public meeting with contractor and association Late July-October Contractor/Assoc. Planning Summary due to LARE (prior to permit meeting)
Late October/ November
Contractor
Permit Meeting with Fisheries and LARE Biologists Late October/November
Contractor
AVMP or update first draft due December 1 Contractor LARE grant application due January 15 Lake Association AVMP reviews due back to contractor February 1 LARE Staff Final AVMP or update due back to LARE March 1 Contractor Sources for Future Funding The LARE program does not have enough revenue to grant funding to all eligible projects. Also, current LARE policy is to grant a lake 3 consecutive years of funding priority once a treatment plan has been approved and funded for the first time. After three years, funding may not be available. Knowing the financial constraints of the LARE program it may also be wise to seek other sources of funding. In addition to the LARE Program, there are many other sources of potential funding to help improve the quality of Indiana Lakes. Many government agencies assist in projects designed to improve environmental quality. The USDA has many programs to assist environmental improvement. More information on the following programs can be found at www.usda.gov.
39 Watershed Protection and Flood Prevention Program (USDA Conservation Reserve Program (USDA) Wetlands Reserve Program (USDA) Grassland Reserve Program (USDA) Wildlife Habitat Incentive Program (USDA) Small Watershed Rehabilitation Program (USDA)
The following programs are offered by the U.S. Fish and Wildlife Service. More information about the Fish and Wildlife service can be found at www.fws.gov
Partners for Fish and Wildlife Program (U.S. Fish and Wildlife Service) Bring Back the Natives Program (U.S. Fish and Wildlife Service) Native Plant Conservation Program (U.S. Fish and Wildlife Service)
The Environmental Protection Agency, the Indiana Department of Environmental Management, and the U.S. Forest Service also have numerous programs for funding. A few of these are listed below. More information can be found at www.in.gov/idem and www.fs.fed.us/ U.S. Environmental Protection Agency Environmental Education Program (EPA) NPDES Related State Program Grants (IDEM) Community Forestry Grant Program (U.S. Forest Service) References Cited Aquatic Enhancement and Survey Inc. 2007. Water Quality Update. P.O. Box 1036. Angola, Indiana 46703. Aquatic Enhancement and Survey Inc. 2010. Lake Gage and Lime Lake EWM Recon Survey. P.O. Box 1036. Angola, Indiana 46703. Creed, R. P., and S. P. Sheldon. 1993a. The effect of feeding by a North American weevil, Euhrychiopsis lecontei, on Eurasian watermilfoil (Myriophyllum spicatum). Aquatic Botany 45: 245-256. Creed, R. P., and S. P. Sheldon. 1992. Further investigations into the effect of herbivores on Eurasian watermilfoil (Myriophyllum spicatum). Pages 244-252 in Proc. 26 Annual Meeting of the Aquatic Plant Control Research Program. Misc. Paper A-92-2, Waterways Experiment Station, Vicksburg, MS. Gensic Engineering. 2005. Lake Gage and Lime Lake Engineering Feasibiltiy Sutdy. Gensic Engineering Inc. 311 Airport North Office Park. Fort Wayne Indiana 46825
40 Gulish, William J. 1975 A summary of Indiana Cisco Investigations, 1971-74 IDNR J.F. New 2009. Concorde Creek Channel Restoration Project Report. 708 Roosevelt Road Walkerton, Indiana 46574. IDNR. 2010. LARE Tier II Procedure Manual. IN Department of Natural Resources, Division of Fish and Wildlife. Indiana Clean Lakes Program. 2011. Lake Gage Data. http://www.indiana.edu/~clp/County%20pages/lake.php?Lake_ID=1152 Kalff, Jacob. 2002. Limnology: Inland Water Ecosystems. Prentice Hall. Upper Saddle River, New Jersey. 592 pp. Ledet, Neil and Koza, Larry. 1983 Lake Gage Fisheries Survey. Indiana Department of Natural Resources. Indianapolis, Indiana. Ledet, Neil. 2013. Personal Communication for Cisco Fisheries Information. Indiana Department of Natural Resources. Indianapolis, Indiana. Pullman, Douglas G. 1998. The Lake Association Leaders Aquatic Vegetation Management Guidance Manual. Pearson, 2004. A Study of 21 Northern Indiana Lakes. Indiana Department of Natural Resources. Indianapolis, Indiana. Steuben County Soil and Water Conservation District Website: http://steubenswcd.org/main/page_watersheds_what_is_a_watershed.php
41 Appendix Common and Scientific Aquatic Plant Names Common Name Scientific Name American Pondweed Potamogeton nodosus
Bladderwort Utricularia sp.
Brittle Naiad Najas minor
Cabomba Cabomba sp.
Chara Chara sp.
Coontail Ceratophyllum demersum
Curly leaf Pondweed Potamogeton crispus
Eelgrass Vallisneria americana
Elodea Elodea canadensis
Eurasian Watermilfoil Myriophyllum spicatum
Flat Stem Pondweed Potamogeton zosteriformis
Floating-leaf Pondweed Potamogeton natans
Forked or Star Duckweed Lemna trisulca
Illinois Pondweed Potamogeton illinoensis
Lake Cress Armoracia lacustris
Largeleaf Pondweed Potamogeton amplifolius
Leafy Pondweed Potamogeton foliosus
Nitella Nitella sp.
Northern Watermilfoil Myriophyllum sibiricum
Richardson's Pondweed Potamogeton richardsonii
Sago Pondweed Potamogeton pectinatus
Slender Arrowhead Saggitaria teres
Slender Naiad Najas flexilis
Small Pondweed Potamogeton pusillus
Variable Pondweed Potamogeton diversifolius
Warer Stargrass Heteranthera dubia
Water Buttercup sp. Ranunculus sp.
Whitestem Pondweed Potamogeton praelongus
Whorled Milfoil Myriophyllum verticillatum
42 Excerpt from Aquatic Enhancement and Survey 2010 EWM Recon Survey
Purpose and Procedure Lake Gage and Lime Lake are two glacial kettle lakes of 327 and 57 acres respectively. The Lime Lake and Lake Gage association requested a general reconnaissance survey to assess the extent of colonization by Eurasian watermilfoil Lime Lake and Lake Gage. This report summarizes that work. Eurasian watermilfoil is an invasive non-native aquatic plant. The purpose of this assessment is to determine whether the area of colonization is increasing, decreasing, or remaining relatively stable. Increasing Eurasian milfoil colonization could have significant recreational and ecological impacts on Lime Lake and Lake Gage and could provide an impetus for the implementation of a program of control. On August 30, 2010 Aquatic Enhancement & Survey, Inc. utilized a watercraft to run a zig zag pattern over the littoral zone of the lake to visually identify vegetative growth patterns and areas of dense milfoil growth. Multiple tosses and drags with an aquatic vegetation sampling rake were also used to recover and identify submersed aquatic vegetation growing in the lakes. Areas on both lakes where Eurasian watermilfoil was noted growing were marked with waypoints using a handheld GPS unit. These waypoints were downloaded to a computer using Geographic Information System (GIS) software and a digital map was created to delineate and quantify the approximate area of milfoil colonization. On September 10 a flight over the lake was completed in a small aircraft to note possible areas of milfoil growth not spotted during the boat survey. During the flight several areas bearing a dark signature against the light colored bottoms of the lakes were noted, marked on a map, and photographed. On September 16 another trip to the lake was performed in a boat to sample plants from the suspected areas of milfoil growth spotted during the flight. Milfoil growth was confirmed in these areas and they were added to the GIS map. Results Water clarity was relatively good on both lakes with a Secchi depth of 10.5 feet recorded at Lake Gage during the August 30 survey. A Secchi depth of 12.2 feet was recorded at Lime Lake. This enabled a relatively accurate visual assessment to be performed on both lakes. Milfoil growth patterns, densities, and total areas of growth were similar to those noted on these lakes during past surveys indicating a relatively stable level of colonization at this time. On Lake Gage the area of Eurasian milfoil colonization was approximately 6.7 acres. On Lime Lake approximately 3.5 acres of Eurasian watermilfoil was present (see maps pages 2 and 3). A significant growth of beneficial native pondweeds was present on both lakes, with pondweeds being especially common on Lime Lake. Recommendations Colonization by Eurasian watermilfoil on both lakes appears to be relatively stable. While treatment could be beneficial in allowing the growth of more beneficial native plants in areas currently colonized by Eurasian milfoil, an aggressive treatment program is not needed at this time to prevent serious ecological or recreational impacts to the lakes. A significant amount of Eurasian watermilfoil was present in the channel connecting the two lakes. Eurasian watermilfoil growth in this area appears to have increased in recent years with the growth of native milfoil decreasing. Treatment of this area with a selective granular broadleaf specific herbicide such as Navigate® 2,4-D or Renovate® OTF could be helpful in preventing passing watercraft from breaking up and mobilizing milfoil fragments that can potentially hasten spread. One drawback will be potential non-target affects on native milfoil that was noted also growing in this area. The total of this area is less than one acre, so treatment costs would be less than $500.00 annually. Beyond this, the Lake Gage and Lime Lake association is advised to initiate control only in areas where growth becomes a serious nuisance to boating or other recreational uses of the lakes. General surveys of invasive plant growth should be repeated on an annual or bi-annual basis to maintain awareness of colonization.

43 Excerpt from 2007 Water Quality Data Update – Lake Gage and Lime Lakes
2007 sampling included Secchi depth measurement, total phosphorus analysis, chlorophyll a analysis and temp. /oxygen profiles for both lakes on September 12, 2007. Temperature and oxygen profiles were again collected on October 11,2007. An aquatic plant survey utilizing IDNR Tier II protocol was performed for each lake on August 15, 2007. The Lake Gage cisco layer defined as the area of the water column with a temperature of 20 deg. or less C. and a dissolved oxygen level of 3 ppm or more was approximately eight feet thick during the September sampling.(see fig. 1) This was less than in 2005 when a 13 foot cisco layer was noted at the end ofAugust and similar to 2004 when a minimum thickness of 8 feet was also noted.
Phosphorus levels were very low for both lakes returning a measurement below a lab detection limit of .008 ppm for both Lake Gage and Lime Lake. The Lake Gage Secchi depth on 9/12/07 was 11.4 feet and Lime Lake's measurement was 8.6 feet. During the August 15,2007 plant survey the Lake Gage Secchi depth was 11 feet while the Lime Lake measurement was 7.8 feet. Chlorophyll-a, a pigment found in planktonic algae was also measured in 2007. This provides a rough measurement of algal biomass to reveal nutrient-induced productivity. This also allows placement of the lakes in Carlson's Trophic State Index. Carlson's utilizes Secchi depth, Total Phosphorus, and Chlorophylla measurements to produce a numeric score for the lake's water quality. Macrophyte Inventory Discussion Lake Gage During the 2007 survey aquatic plants were noted growing to a depth of II feet in Lake Gage. The tables below contain plant community descriptors for the survey. Descriptors from a set of 21 other Indiana Lakes (Pearson 2004) are provided to provide insights into how Lake Gage compares. Appendix A below shows the overall tier II data for Lake Gage including species specific data. With nine species noted in the survey Lake Gage was just above the 21 lake average of 8 species. The number of native species noted was eight, just over the 21 lake average of seven. The number of species per site was.76,wellbelowthe 21lakeaverage of1.61butthe species diversity index was .80 slightly above the 21 lake average of .66. Eurasian watermilfoil was the only non-native species noted. It was the species of the highest occurrence at 38.3% of sites showing that milfoil dominates the plant community. Variable pondweed Potamogeton gramineus was the second most common occurring at 23.3% of sampling sites. Overall diversity was good on Lake Gage but the occurrence of vegetation at only 53% of sites shows that Lake Gage has a relatively sparse plant community. While aquatic plants are not a major problem for users on Lake Gage, the lakes plant community is dominated by an invasive non-native species. The Lake Gage and Lime Lake Association may want to consider seeking funding from IDNR to establish an aquatic plant management plan for Lake Gage to help return the lake to dominance by native plants.
Macrophyte Inventory Discussion: Lime Lake- Plants were noted to be growing to a depth of 14.5 feet in Lime Lake. The tables below contain plant community descriptors for the survey. Descriptors from a set of 21 other Indiana Lakes (Pearson 2004) are provided to provide insights into how Lime Lake compares. Appendix A below shows the overall tier II data for Lime Lake including species specific data. With 11 species noted in the survey Lime Lake was above the 21 lake average of8 species. The number of native species noted was ten, higher than the 21 lake average of seven. The number of species per site was 1.4, close to the 21 lake average of 1.61. The species diversity index was .83, above the 21 lake average of .66. Eurasian watermilfoil was the only non-native species noted. It was the species of the highest occurrence at 47.5% of sites showing that Eurasian milfoil solidly dominates the plant community. Variable watermilfoil Myriophyllum heterophyllum was the second most common occurring at 17.5% of sampling sites. Overall plant diversity was good on Lime Lake and compares favorably with other Indiana lakes. Robbins fern, an Indiana Listed "rare" plant was noted in the survey and was recovered at 10% of sampling sites. While aquatic plants are only an occasional problem for users on Lime Lake, the lakes plant community is clearly dominated by an invasive non-native species. The Lake Gage and Lime Lake Association may want to consider seeking funding from IDNR to establish an aquatic plant management plan for Lime Lake to help return the lake to dominance by beneficial native plants.
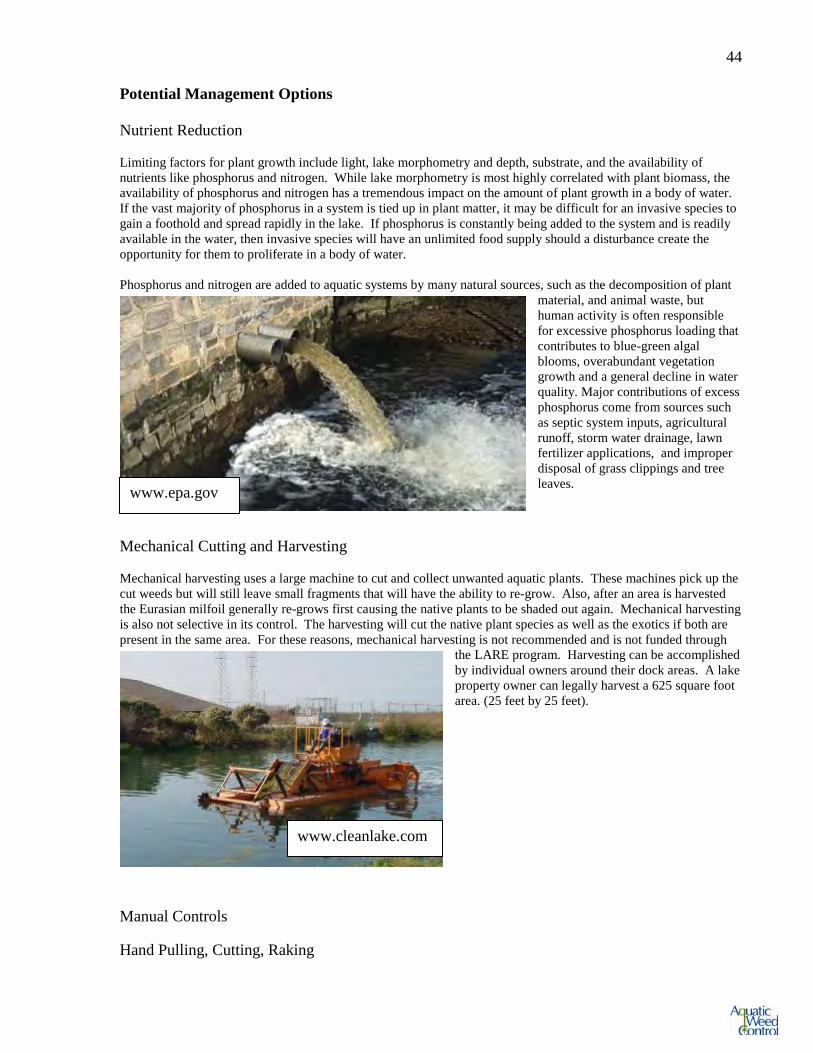
44 Potential Management Options Nutrient Reduction Limiting factors for plant growth include light, lake morphometry and depth, substrate, and the availability of nutrients like phosphorus and nitrogen. While lake morphometry is most highly correlated with plant biomass, the availability of phosphorus and nitrogen has a tremendous impact on the amount of plant growth in a body of water. If the vast majority of phosphorus in a system is tied up in plant matter, it may be difficult for an invasive species to gain a foothold and spread rapidly in the lake. If phosphorus is constantly being added to the system and is readily available in the water, then invasive species will have an unlimited food supply should a disturbance create the opportunity for them to proliferate in a body of water. Phosphorus and nitrogen are added to aquatic systems by many natural sources, such as the decomposition of plant
material, and animal waste, but human activity is often responsible for excessive phosphorus loading that contributes to blue-green algal blooms, overabundant vegetation growth and a general decline in water quality. Major contributions of excess phosphorus come from sources such as septic system inputs, agricultural runoff, storm water drainage, lawn fertilizer applications, and improper disposal of grass clippings and tree leaves.
Mechanical Cutting and Harvesting Mechanical harvesting uses a large machine to cut and collect unwanted aquatic plants. These machines pick up the cut weeds but will still leave small fragments that will have the ability to re-grow. Also, after an area is harvested the Eurasian milfoil generally re-grows first causing the native plants to be shaded out again. Mechanical harvesting is also not selective in its control. The harvesting will cut the native plant species as well as the exotics if both are present in the same area. For these reasons, mechanical harvesting is not recommended and is not funded through
the LARE program. Harvesting can be accomplished by individual owners around their dock areas. A lake property owner can legally harvest a 625 square foot area. (25 feet by 25 feet).
Manual Controls Hand Pulling, Cutting, Raking
www.epa.gov
www.cleanlake.com
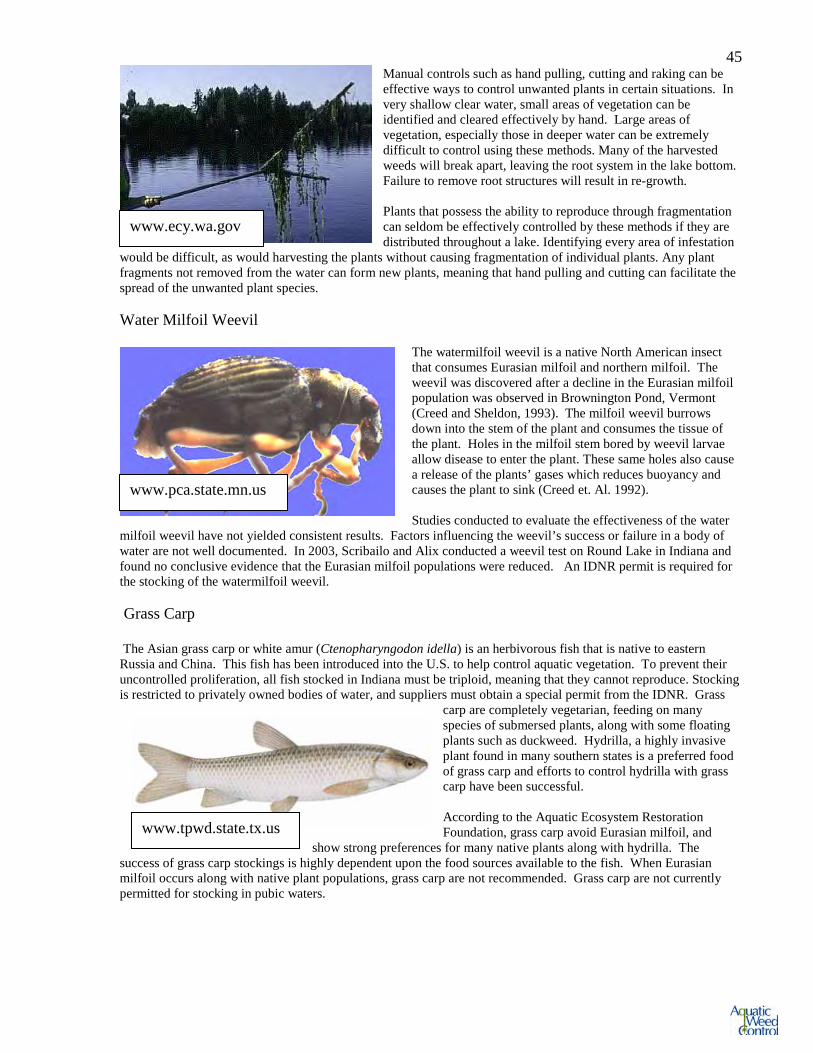
45 Manual controls such as hand pulling, cutting and raking can be effective ways to control unwanted plants in certain situations. In very shallow clear water, small areas of vegetation can be identified and cleared effectively by hand. Large areas of vegetation, especially those in deeper water can be extremely difficult to control using these methods. Many of the harvested weeds will break apart, leaving the root system in the lake bottom. Failure to remove root structures will result in re-growth. Plants that possess the ability to reproduce through fragmentation can seldom be effectively controlled by these methods if they are distributed throughout a lake. Identifying every area of infestation
would be difficult, as would harvesting the plants without causing fragmentation of individual plants. Any plant fragments not removed from the water can form new plants, meaning that hand pulling and cutting can facilitate the spread of the unwanted plant species. Water Milfoil Weevil
The watermilfoil weevil is a native North American insect that consumes Eurasian milfoil and northern milfoil. The weevil was discovered after a decline in the Eurasian milfoil population was observed in Brownington Pond, Vermont (Creed and Sheldon, 1993). The milfoil weevil burrows down into the stem of the plant and consumes the tissue of the plant. Holes in the milfoil stem bored by weevil larvae allow disease to enter the plant. These same holes also cause a release of the plants’ gases which reduces buoyancy and causes the plant to sink (Creed et. Al. 1992). Studies conducted to evaluate the effectiveness of the water
milfoil weevil have not yielded consistent results. Factors influencing the weevil’s success or failure in a body of water are not well documented. In 2003, Scribailo and Alix conducted a weevil test on Round Lake in Indiana and found no conclusive evidence that the Eurasian milfoil populations were reduced. An IDNR permit is required for the stocking of the watermilfoil weevil. Grass Carp The Asian grass carp or white amur (Ctenopharyngodon idella) is an herbivorous fish that is native to eastern Russia and China. This fish has been introduced into the U.S. to help control aquatic vegetation. To prevent their uncontrolled proliferation, all fish stocked in Indiana must be triploid, meaning that they cannot reproduce. Stocking is restricted to privately owned bodies of water, and suppliers must obtain a special permit from the IDNR. Grass
carp are completely vegetarian, feeding on many species of submersed plants, along with some floating plants such as duckweed. Hydrilla, a highly invasive plant found in many southern states is a preferred food of grass carp and efforts to control hydrilla with grass carp have been successful. According to the Aquatic Ecosystem Restoration Foundation, grass carp avoid Eurasian milfoil, and
show strong preferences for many native plants along with hydrilla. The success of grass carp stockings is highly dependent upon the food sources available to the fish. When Eurasian milfoil occurs along with native plant populations, grass carp are not recommended. Grass carp are not currently permitted for stocking in pubic waters.
www.ecy.wa.gov
www.pca.state.mn.us
www.tpwd.state.tx.us
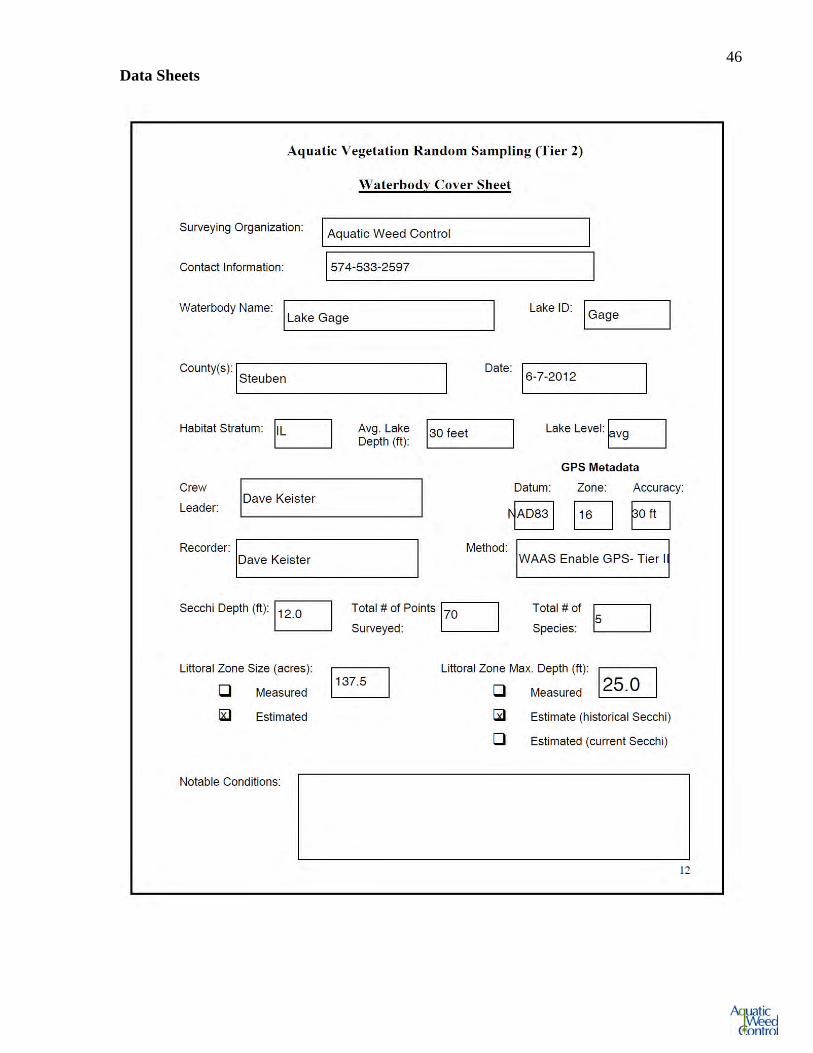
46 Data Sheets
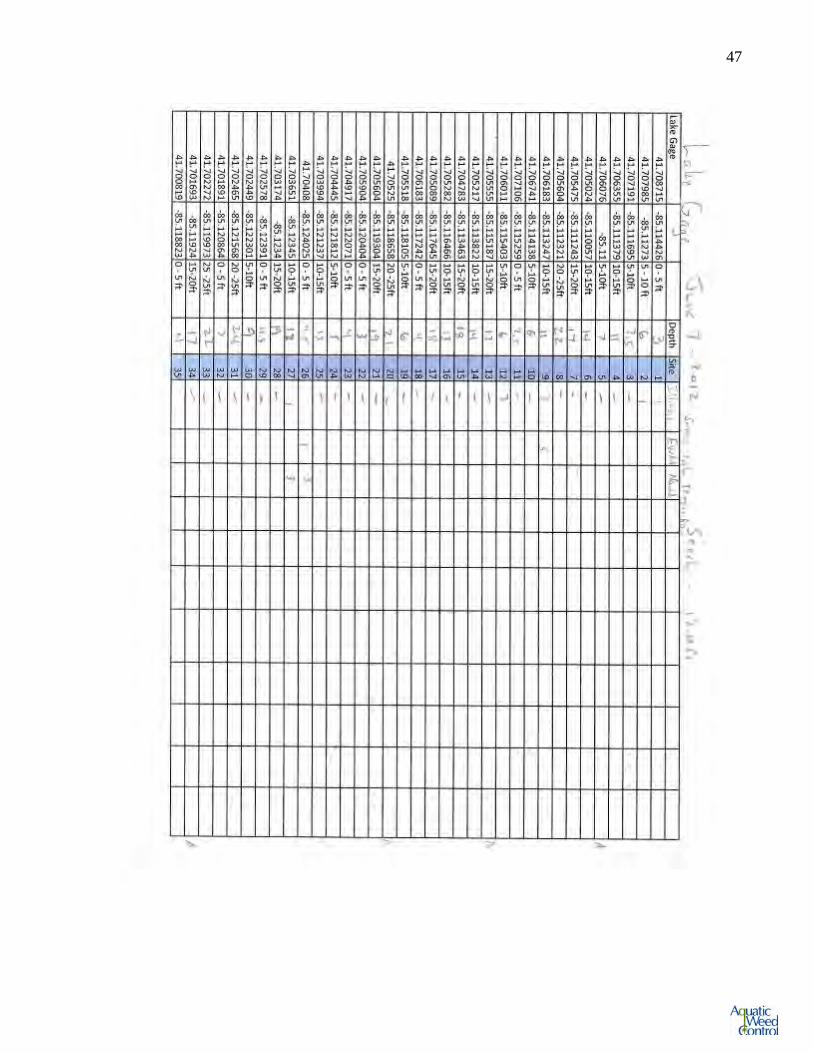
47
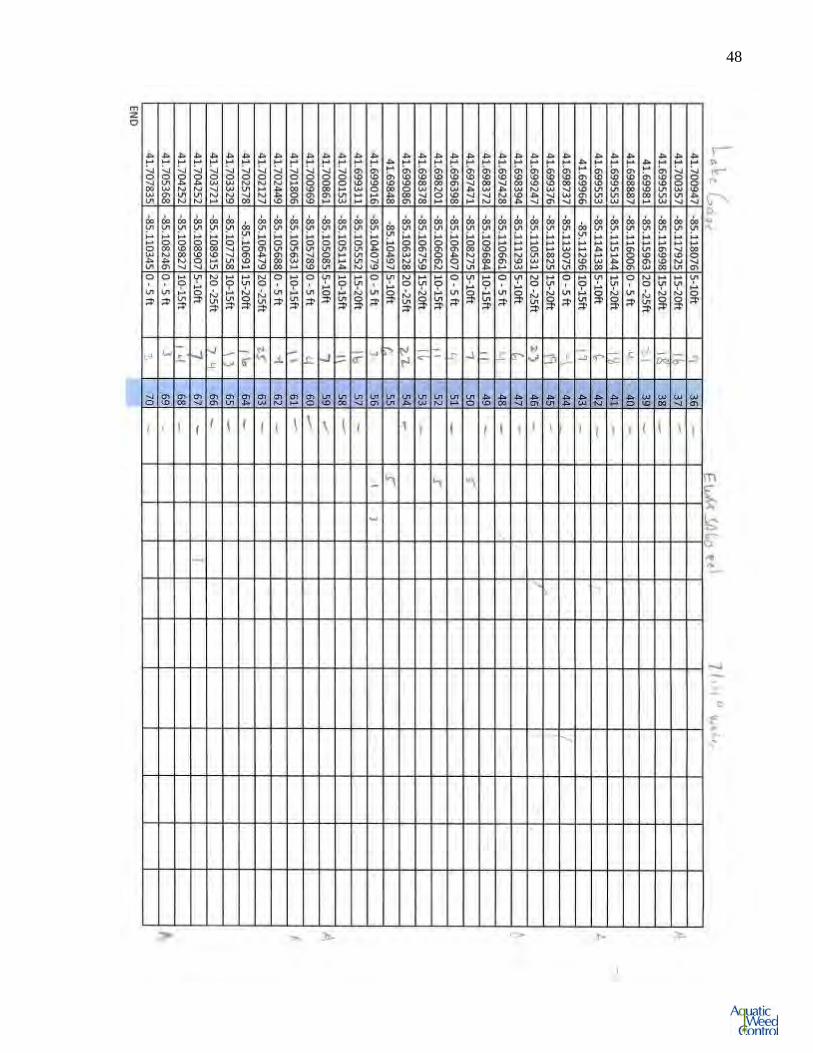
48
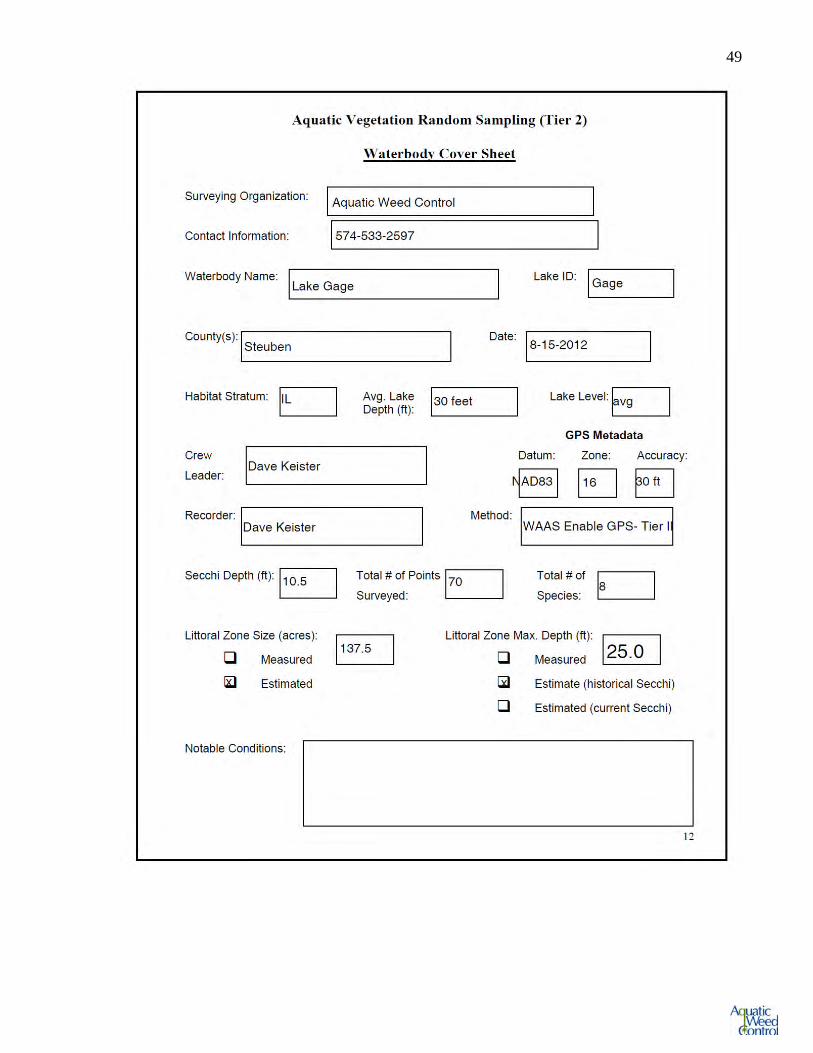
49
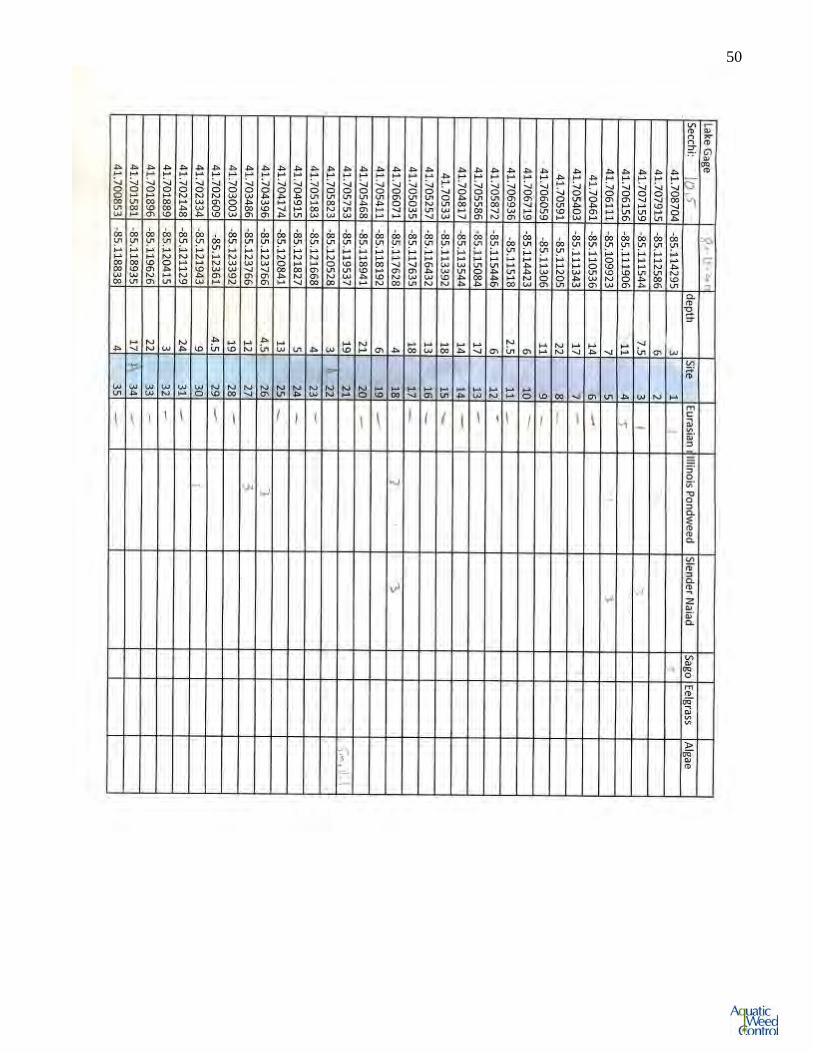
50
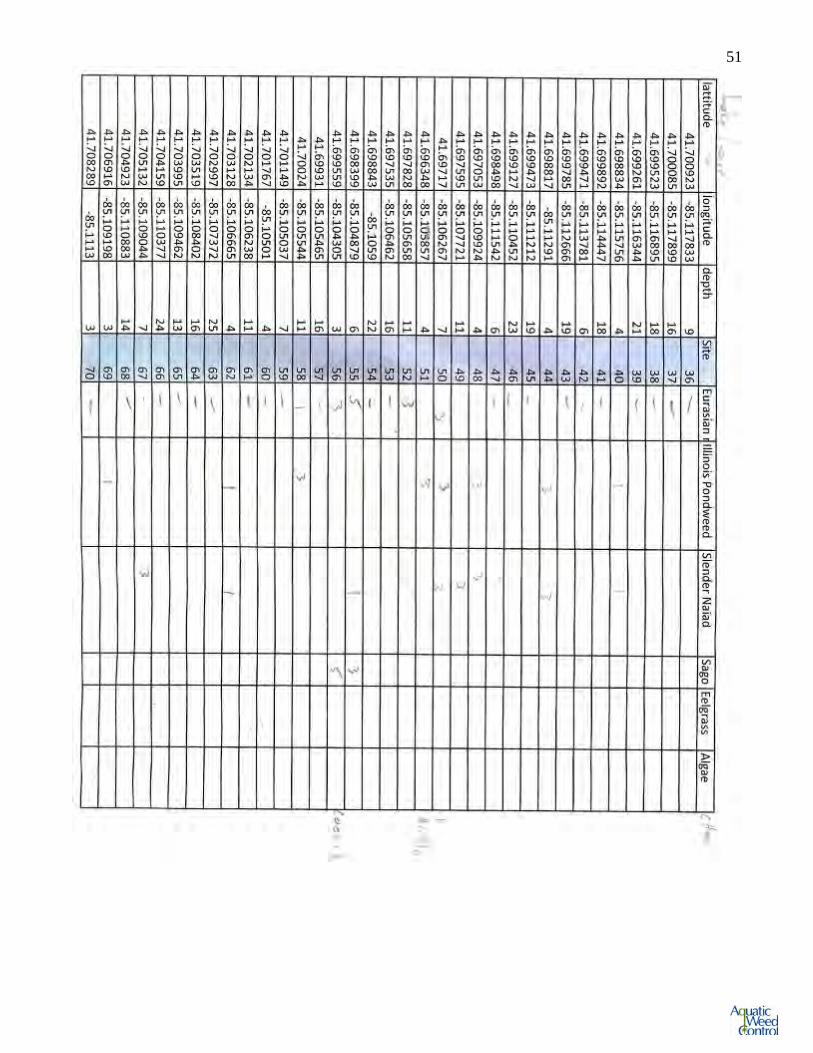
51
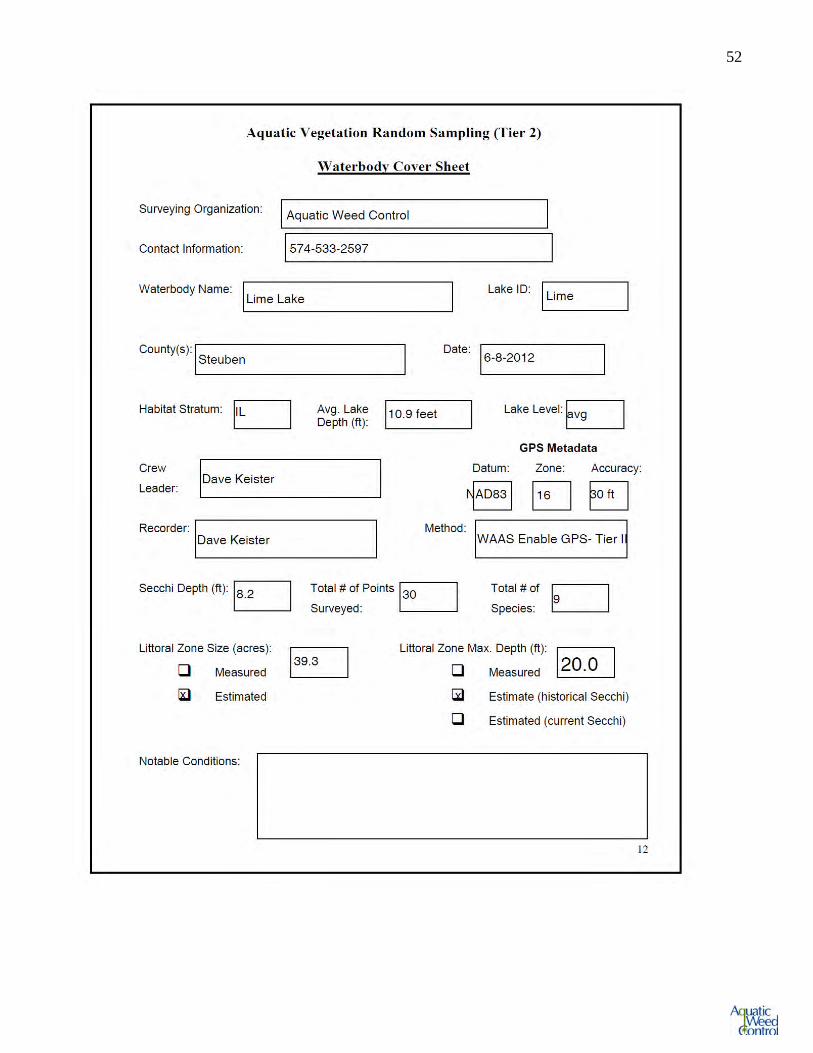
52
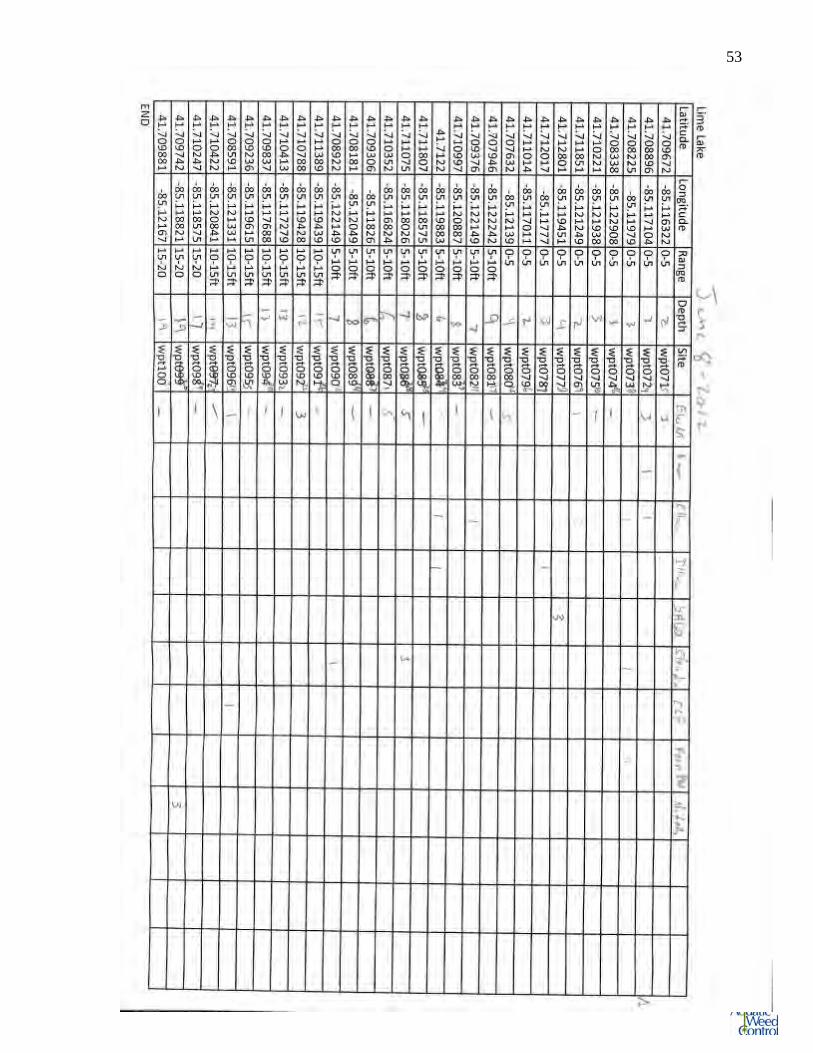
53
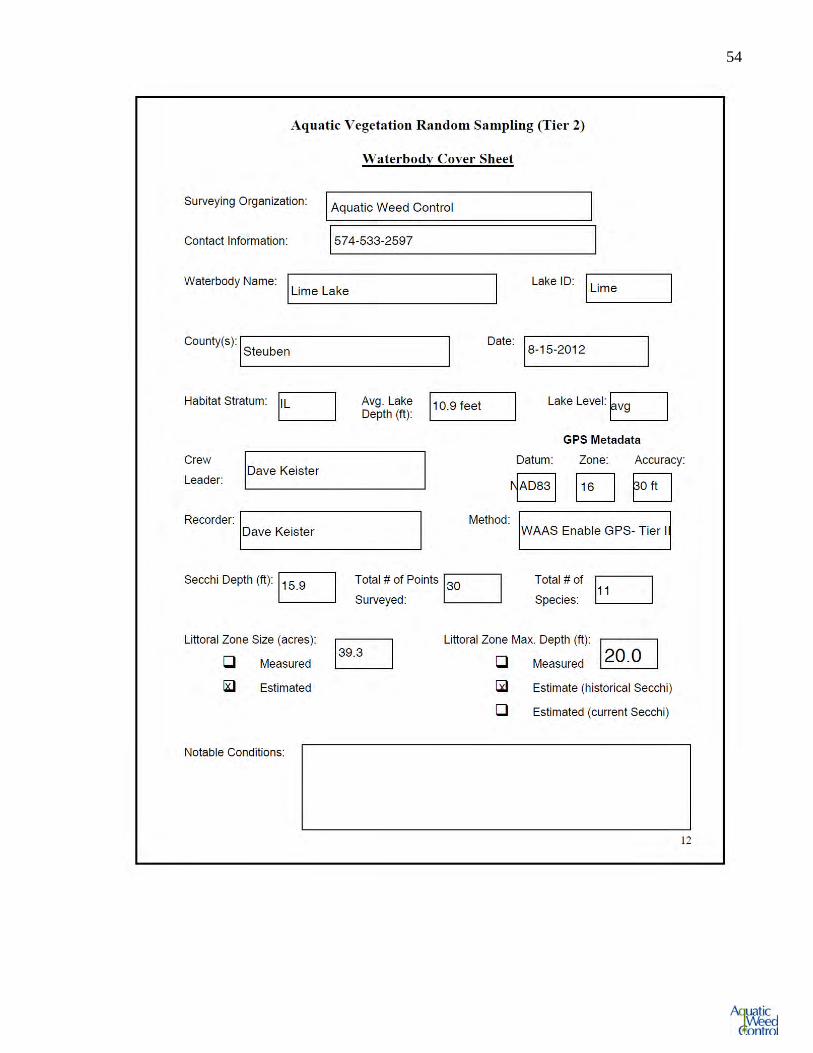
54
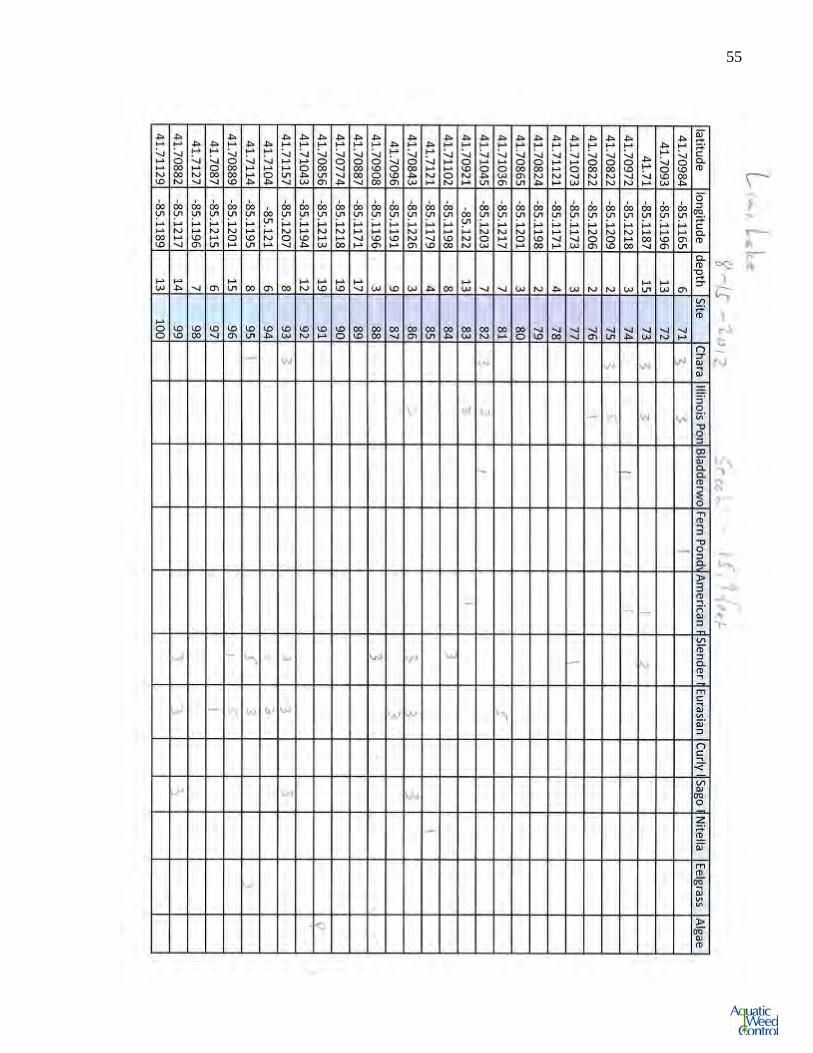
55
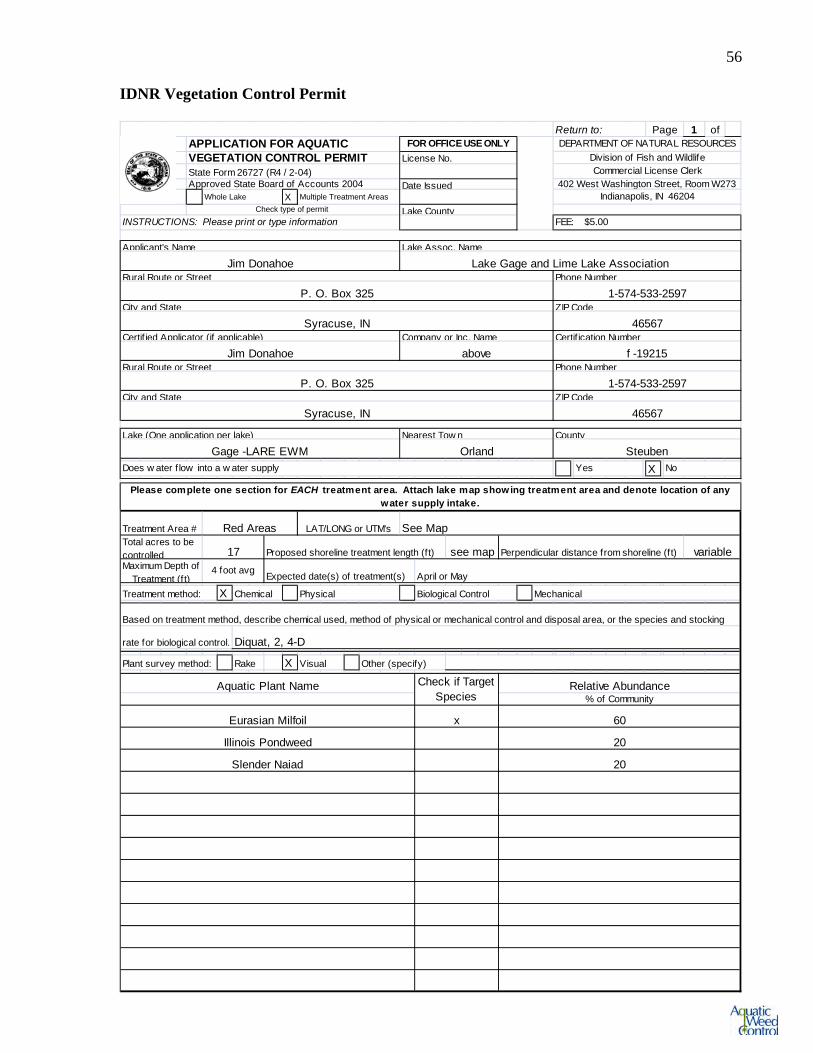
56 IDNR Vegetation Control Permit
1 of
X
X
Expected date(s) of treatment(s)
X
X
4 foot avg April or May
Mechanical
rate for biological control.
Gage -LARE EWMNearest Tow n
Orland
Please complete one section for EACH treatment area. Attach lake map showing treatment area and denote location of any water supply intake.
Based on treatment method, describe chemical used, method of physical or mechanical control and disposal area, or the species and stocking
Diquat, 2, 4-D
Physical
Maximum Depth of Treatment (ft)
SteubenNo
variable
FEE: $5.00
Certif ication Number
f -19215
INSTRUCTIONS: Please print or type informationCheck type of permit
Applicant's Name Lake Assoc. Name
Commercial License Clerk402 West Washington Street, Room W273
FOR OFFICE USE ONLYLicense No.
Date Issued
Lake County
DEPARTMENT OF NATURAL RESOURCES
Indianapolis, IN 46204
Jim Donahoe Lake Gage and Lime Lake AssociationRural Route or Street
P. O. Box 325Phone Number
1-574-533-2597
Phone Number
1-574-533-2597
City and State
Syracuse, INZIP Code
46567Certif ied Applicator (if applicable)
Jim DonahoeCompany or Inc. Name
aboveRural Route or Street
P. O. Box 325
Aquatic Plant Name
City and State
Syracuse, IN
Yes
ZIP Code
46567
County
LAT/LONG or UTM's
Plant survey method: Rake Visual Other (specify)
20
20
Eurasian Milfoil
Relative Abundance% of Community
60
Check if Target Species
x
Illinois Pondweed
Slender Naiad
Multiple Treatment Areas
APPLICATION FOR AQUATICVEGETATION CONTROL PERMITState Form 26727 (R4 / 2-04)Approved State Board of Accounts 2004
Division of Fish and Wildlife
Total acres to be controlled 17 Proposed shoreline treatment length (ft)
Red Areas See Map
Does w ater f low into a w ater supply
Lake (One application per lake)
Whole Lake
Return to: Page
Biological ControlTreatment method: Chemical
Treatment Area #
see map Perpendicular distance from shoreline (ft)
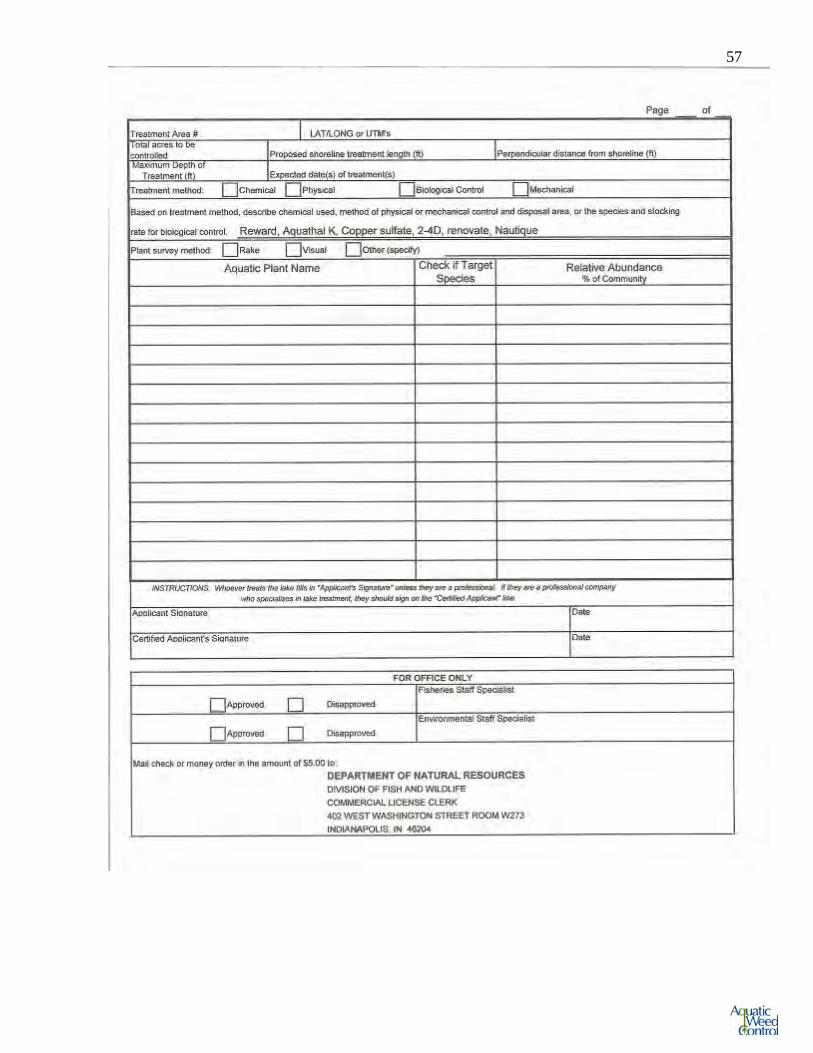
57
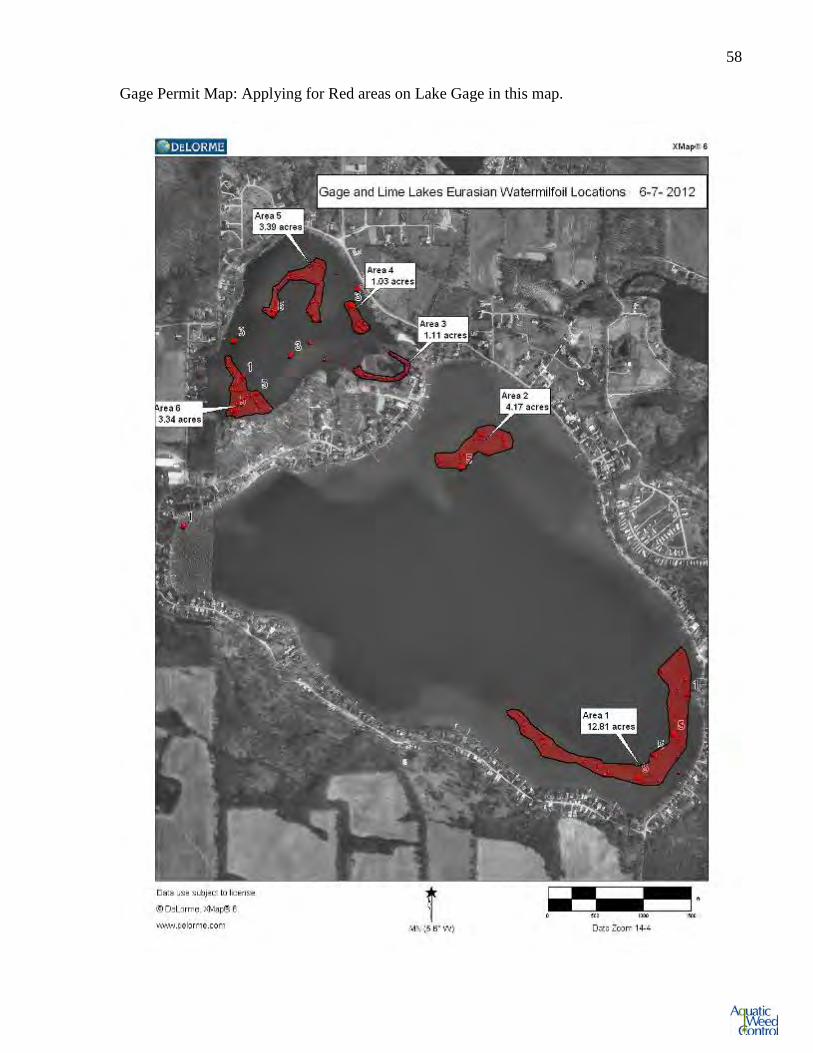
58 Gage Permit Map: Applying for Red areas on Lake Gage in this map.
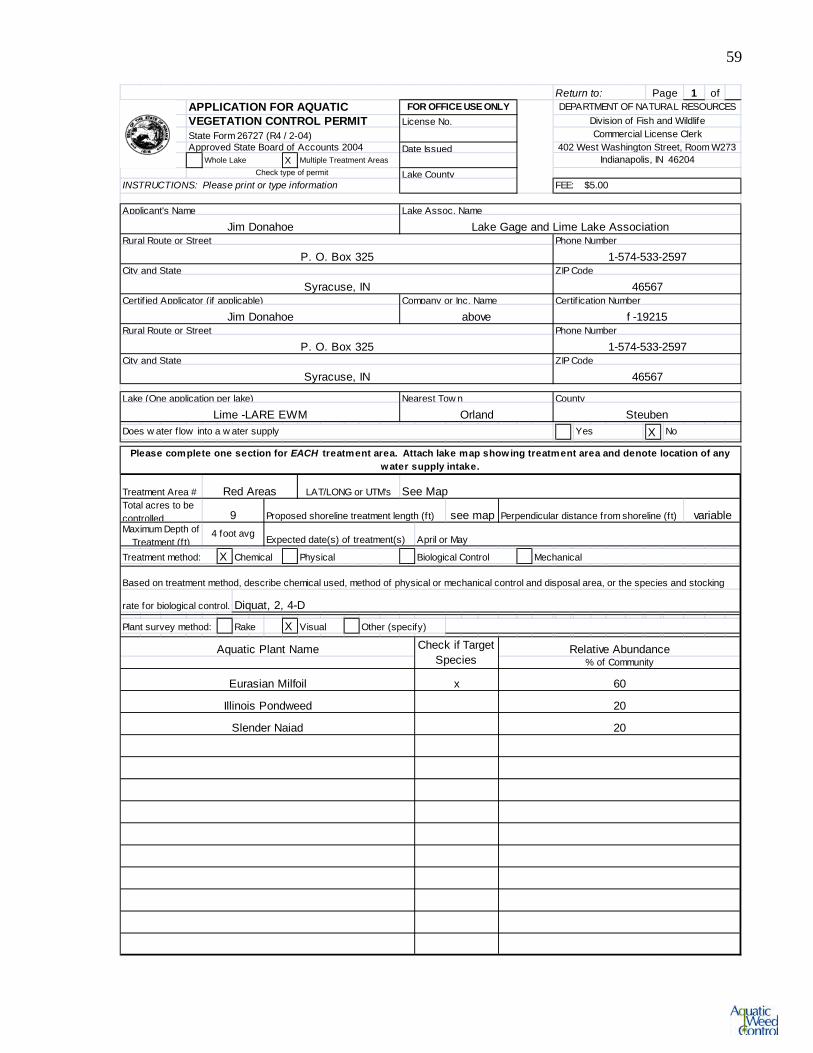
59
1 of
X
X
Expected date(s) of treatment(s)
X
X
Illinois Pondweed 20
Slender Naiad 20
Aquatic Plant Name Check if Target Species
Relative Abundance% of Community
Eurasian Milfoil x 60
Based on treatment method, describe chemical used, method of physical or mechanical control and disposal area, or the species and stocking
rate for biological control. Diquat, 2, 4-D
Plant survey method: Rake Visual Other (specify)
Maximum Depth of Treatment (ft)
4 foot avg April or May
Treatment method: Chemical Physical Biological Control Mechanical
Total acres to be controlled 9 Proposed shoreline treatment length (ft) see map Perpendicular distance from shoreline (ft) variable
Please complete one section for EACH treatment area. Attach lake map showing treatment area and denote location of any water supply intake.
Treatment Area # Red Areas LAT/LONG or UTM's See Map
Lime -LARE EWM Orland SteubenDoes w ater f low into a w ater supply Yes No
City and State ZIP Code
Syracuse, IN 46567
Lake (One application per lake) Nearest Tow n County
Jim Donahoe above f -19215Rural Route or Street Phone Number
P. O. Box 325 1-574-533-2597
City and State ZIP Code
Syracuse, IN 46567Certif ied Applicator (if applicable) Company or Inc. Name Certif ication Number
Jim Donahoe Lake Gage and Lime Lake AssociationRural Route or Street Phone Number
P. O. Box 325 1-574-533-2597
INSTRUCTIONS: Please print or type information FEE: $5.00
Applicant's Name Lake Assoc. Name
Whole Lake Multiple Treatment Areas Indianapolis, IN 46204Check type of permit Lake County
State Form 26727 (R4 / 2-04) Commercial License ClerkApproved State Board of Accounts 2004 Date Issued 402 West Washington Street, Room W273
Return to: PageAPPLICATION FOR AQUATIC FOR OFFICE USE ONLY DEPARTMENT OF NATURAL RESOURCESVEGETATION CONTROL PERMIT License No. Division of Fish and Wildlife
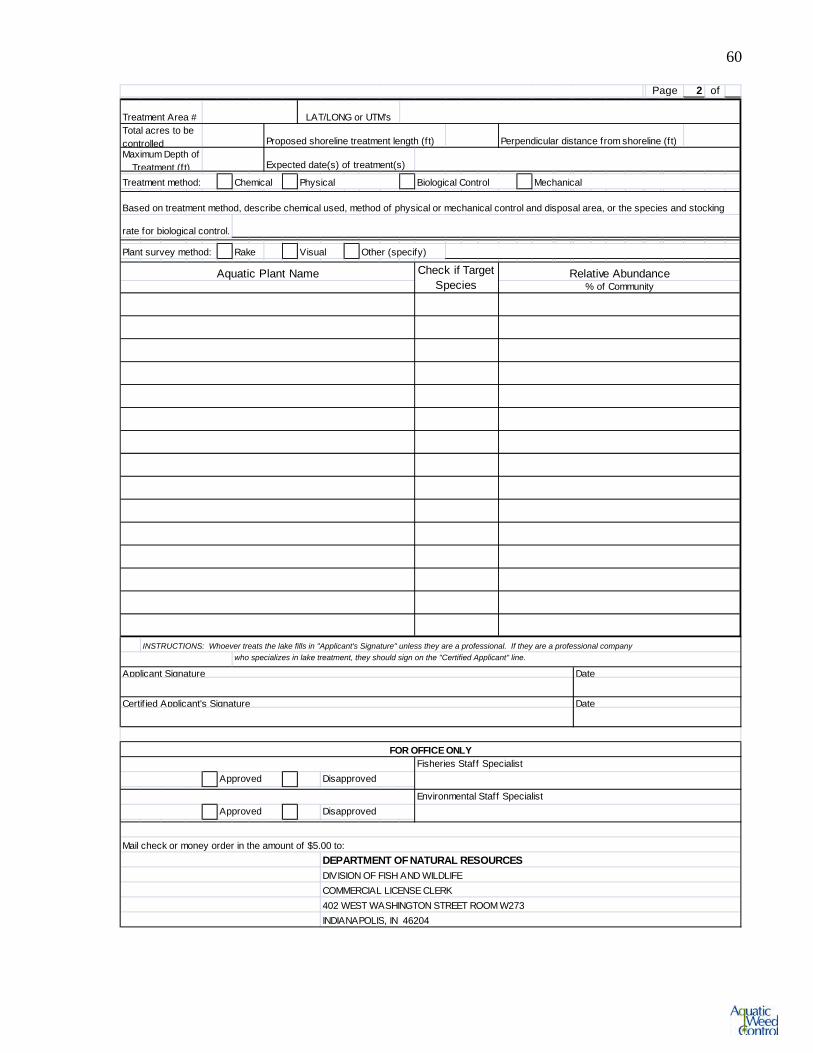
60
2 of
Expected date(s) of treatment(s)
COMMERCIAL LICENSE CLERK402 WEST WASHINGTON STREET ROOM W273INDIANAPOLIS, IN 46204
Mail check or money order in the amount of $5.00 to:DEPARTMENT OF NATURAL RESOURCESDIVISION OF FISH AND WILDLIFE
Environmental Staff SpecialistApproved Disapproved
Fisheries Staff SpecialistApproved Disapproved
Certif ied Applicant's Signature Date
FOR OFFICE ONLY
INSTRUCTIONS: Whoever treats the lake fills in "Applicant's Signature" unless they are a professional. If they are a professional companywho specializes in lake treatment, they should sign on the "Certified Applicant" line.
Applicant Signature Date
Aquatic Plant Name Check if Target Species
Relative Abundance% of Community
Based on treatment method, describe chemical used, method of physical or mechanical control and disposal area, or the species and stocking
rate for biological control.
Plant survey method: Rake Visual Other (specify)
Maximum Depth of Treatment (ft)
Treatment method: Chemical Physical Biological Control Mechanical
Total acres to be controlled Proposed shoreline treatment length (ft) Perpendicular distance from shoreline (ft)
Page
Treatment Area # LAT/LONG or UTM's
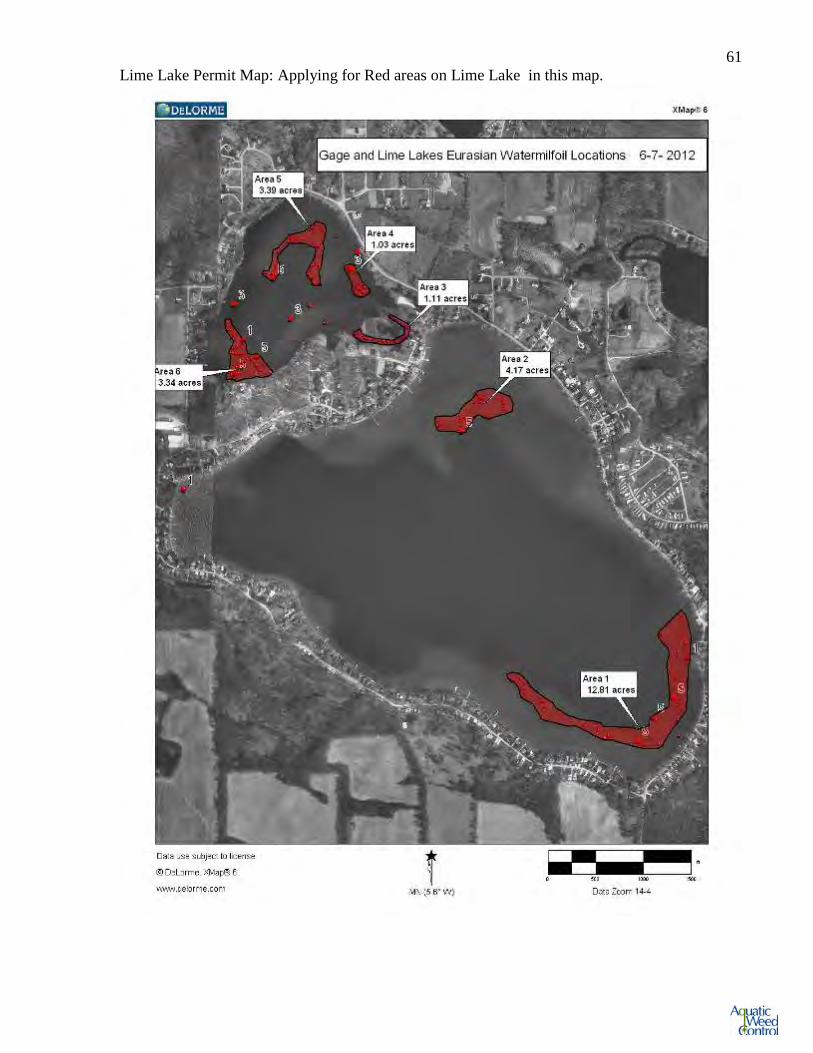
61 Lime Lake Permit Map: Applying for Red areas on Lime Lake in this map.