Embed Size (px)
Citation preview
Devolution and higher education:impact and future trends
Research report
43723 UniUK Devolution 12/11/08 13:04 Page i
This series of Research reports published byUniversities UK will present the results of researchwe have commissioned or undertaken in support ofour policy development function. The series aims todisseminate project results in an accessible formand there will normally be a discussion of policyoptions arising from the work.
This report has been prepared for Universities UKby Alan Trench, the Law School, University ofEdinburgh. The statistical annexe was produced byNigel Brown and Brian Ramsden. Universities UKalso acknowledges, with thanks, the valuablecontributions of Jim Gallacher, Jim Gallagher,John Fitz and Bob Osborne to this project.
Research reports
The copyright for this publication is held by Universities UK. The material may becopied or reproduced provided that the source is acknowledged and the material,wholly or in part, is not used for commercial gain. Use of the material forcommercial gain requires the prior written permission of Universities UK.
43723 UniUK Devolution 12/11/08 13:04 Page ii
5 Preface
7 Summary of key messages
Section 1
9 Introduction: devolution and the United Kingdom
1.1
9 The legal and administrative structure of devolution1.2
11 Devolution and the structure of government in Whitehall and Westminster1.3
13 The management of intergovernmental relations1.4
14 Devolution and public policy1.5
14 The 2007 elections Section 2
16 General trends in higher education policy
2.1
16 England2.2
16 Wales2.3
17 Scotland2.4
17 Northern Ireland2.5
18 The UK roleSection 3
19 Students
3.1
19 The student population3.2
20 Cross-border flows3.3
20 Participation rates and population figures3.4
21 International students 3.5
22 Student finance3.6
23 Cross-border movements of students and financial implications of different fees regimesSection 4
24 Degrees and qualifications
Contents
Universities UK Devolution and higher education 1
Devolution and higher education: impact andfuture trends
43723 UniUK Devolution 12/11/08 13:04 Page 1
2
Section 5
25 Institutions
5.1
25 The conferring of university status5.2
25 Reconfiguration and mergers of institutions Section 6
27 Research
6.1
27 The territorial allocation of research funding6.2
29 The Research Assessment Exercise6.3
30 Research collaboration in Scotland and Wales6.4
30 The Funders’ Forum6.5
31 The Science Research Investment Fund6.6
31 Implications of the way research funding is allocated Section 7
33 Funding, finance and fees
7.1
33 The distribution of teaching income 7.2
34 The funding gap in Wales7.3
35 Fee regimes and the implications of the territorial distribution of teaching income Section 8
37 Conclusions and recommendations
Annexe
39 Contextual data by Nigel Brown and Brian Ramsden
43723 UniUK Devolution 12/11/08 13:04 Page 2
Universities UK Devolution and higher education
47 Table 20 Research grants and contracts:EU sources
48 Table 21 Market share of researchstudentships in the four UKcountries
49 Table 22 Income (£) per full-time-equivalent student, 1999/2000
49 Table 23 Income(£) per full-time-equivalent student, 2005/06
50 Table 24 Relationship between full-timeundergraduate applicants andacceptances through UCAS bycountry, 1996 entry
51 Table 25 Relationship between full-timeundergraduate applicants andacceptances through UCAS bycountry, 1999 entry
51 Table 26 Relationship between full-timeundergraduate applicants andacceptances through UCAS bycountry, 2006 entry
52 Table 27 Relationship between places andapplicants in each country, 1996,1999 and 2006 entry
54 Table 28 Students by world region ofdomicile, 1996/97
54 Table 29 Students by world region ofdomicile, 1999/2000
55 Table 30 Students by world region ofdomicile, 2005/06
Index of charts
42 Chart 1 Percentage change in studentnumbers, 1996/97–2005/06
53 Chart 2 Percentage of young entrantsfrom state schools and colleges tofull-time undergraduate coursesthrough UCAS
53 Chart 3 Percentage of young entrantsfrom lower socio-economicgroups to full-time undergraduatecourses through UCAS
54 Chart 4 Percentage of young entrantsfrom ‘low participationneighbourhoods’ to full-timeundergraduate courses throughUCAS
39 Table 1 Population of England (thousands)and percentage change over time
39 Table 2 Population of Scotland(thousands) and percentagechange over time
40 Table 3 Population of Wales (thousands)and percentage change over time
40 Table 4 Population of Northern Ireland(thousands) and percentagechange over time
41 Table 5 Total higher education levelstudents in the UK 1996/97
41 Table 6 Total higher education levelstudents in the UK 1999/2000
42 Table 7 Total higher education levelstudents in the UK 2005/06
42 Table 8 Percentage change by mode andlevel, 1996/97–2005/06
43 Table 9 Percentage change1996/97–2005/06 among full-timepostgraduates in higher educationinstitutions, split betweenresearch and taught degree aims
43 Table 10 Percentage change1996/97–2005/06 among part-time postgraduates in highereducation institutions, splitbetween research and taughtdegree aims
44 Table 11 Cross-border flows: full-time UK-domiciled students, 1996/97
44 Table 12 Cross border flows: full-time UK-domiciled students, 1999/2000
44 Table 13 Cross-border flows: full-time UK-domiciled students, 2005/06
45 Table 14 Percentage of academic staff inmajor cost centres, 1996/97
45 Table 15 Percentage of academic staff inmajor cost centres, 1999/2000
46 Table 16 Percentage of academic staff inmajor cost centres, 2005/06
46 Table 17 Research grants and contracts:research councils
47 Table 18 Research grants and contracts:charities
47 Table 19 Research grants and contracts:UK industry and commerce
Index of tables and charts in the annexe
3
43723 UniUK Devolution 12/11/08 13:04 Page 3

4
43723 UniUK Devolution 12/11/08 13:04 Page 4
Universities UK Devolution and higher education 5
Section 6 looks in detail at how research fundingis allocated territorially, the ResearchAssessment Exercise (RAE), researchcollaboration and pooling, governancearrangements and the broader implications ofthese issues. Section 7 explores financial issues– particularly looking at the systems of studentfunding and their implications for institutionsand the higher education sector in each part ofthe UK. Section 8 draws conclusions for thedevelopment of higher education across the UKas a result of devolution.
Throughout, the aim has been to give acomparative picture of policy developments inthe four constituent parts of the United Kingdom,and to try to identify policy issues that arise,either from the different approaches pursued indifferent parts of the country or from theinteraction of the different policies eachgovernment is pursuing. In this sense, this is notan ‘academic’ piece of work. It does not seek tomake any contribution to theoretical debates,but it does seek to analyse and understandhigher education policy as it has developed overthe last eight years or so. In order to do this, ithas been necessary to summarise and compressa large body of material – including that frombackground papers prepared by Nigel Brown andBrian Ramsden of Nigel Brown Associates, JohnFitz of Cardiff University, Jim Gallacher ofGlasgow Caledonian University, Jim Gallagher ofthe University of Glasgow, and Bob Osborne ofthe University of Ulster. On any particular topic, itwould be possible to write a discussion itself thelength of this report, and inevitably this meansthat there has been a loss of detail and precisionin order to gain the broader perspective thatpolicy-makers will find most useful. I apologiseto anyone who feels that their territory or theirwork has been slighted or mistreated in thisprocess, and to readers who feel that the reportdoes not supply the level of detail they wouldwish. Such detail is usually available (and thepapers by the collaborators in this project supplymuch of it). My approach, however, does providea broader overview that has often been missingfrom discussions of specific issues, which in factinteract in significant ways.
Devolution to Scotland, Wales and(intermittently) Northern Ireland was one of themajor constitutional reforms initiated by the newLabour Government when it took office in 1997.This was largely a political project, and one ofdevolution’s key successes was largely to halt, atleast for a while, political debates about theposition of Scotland (and to a lesser degreeWales) in the Union, which had bedevilledConservative governments in the 1980s and1990s.
At an administrative level, devolution bedded inwith remarkable ease and remarkable speed.Consequently, the lack of obvious signs of atransition – and the lack of disputes aboutdevolution, particularly between the governmentof the UK and the devolved administrations –meant that the view spread that devolution was a‘done deal’, a reform that was completed leavingno further issues. Certainly, that was the view in10 Downing Street for much of last five years.
That view would not be shared by many involvedwith making or implementing public policy inalmost any domestic policy sector and in anypart of the UK. Devolution has created a range ofanomalies, discrepancies and complexities inalmost every sector.
This report will explore the implications ofdevolution for higher education. Section 1, theintroduction, summarises the institutionalframework of devolution, how intergovernmentalrelations work, discusses its implications andeffects for Westminster and Whitehall in generalterms, and discusses the political situation andits policy implications as it has developed during2007. Section 2 sketches, in broad and generalterms, the key features of higher educationpolicy in each of England, Scotland, Wales andNorthern Ireland. It aims to enable readers tocompare the systems and their overallapproaches, and to put into context some of themore specific policy issues discussed later.
Section 3 discusses issues relating to students,including the location and growth of the UK’sstudent population, cross-border flows,participation rates, international students andstudent fees and finance, to identify the differentsorts of polices pursued in each part of the UK.Section 4 is about issues relating to degrees andqualifications. Section 5 considers institutionalissues – the conferring of university status, andissues relating to institutional reconfigurationand mergers.
Preface
43723 UniUK Devolution 12/11/08 13:04 Page 5
6
I undertook work on this report while still at theConstitution Unit at University College London.As I cannot claim any specialist expertise in thefield of higher education, I am grateful toUniversities UK both for commissioning thereport and for arranging for help from experts inhigher education from Scotland (Jim Gallacher),Wales (John Fitz) and Northern Ireland (BobOsborne). The papers they prepared with greatcare have been invaluable to me in drafting thisreport, and I hope that they will be publishedshortly. I have also been helped by statisticalwork by Nigel Brown and Brian Ramsden (whichappears as an annexe to the report), and byassistance on financial matters from JimGallagher (then) of the University of Glasgow(and now back in government).
To map changes since devolution took effect, thereport uses data from 1996/97 as a baseline,predating both devolution and the change of UKGovernment in 1997. As well as an analysis ofpublished documents and official papers, mywork has also involved interviews with numerousofficials in the UK Government and devolvedadministrations who deal with aspects of highereducation, with officials in the funding bodies inGreat Britain and staff of Universities Scotlandand Higher Education Wales. These interviewswere mostly carried out in the summer of 2007,and in order to enable interviewees to speakfreely were unattributable; they have thereforenot been quoted directly, or used otherwise inways that enable interviewees to be identified. Iam most grateful to academic colleagues fortheir help, guidance and wise counsel and tointerviewees for their candour and assistance,and to staff from Universities UK, UniversitiesScotland and Higher Education Wales for theircomments on a draft of the report. Nonetheless,this report is my own work, and I am responsiblefor any faults, errors or inaccuracies that it maycontain.
Alan Trench
The Law School,
University of Edinburgh
September 2008
43723 UniUK Devolution 12/11/08 13:04 Page 6
Universities UK Devolution and higher education
Summary of key messages
7
Wales has announced special grants for poorerstudents, provided they study in Wales; it hasfavoured mergers, but not very much hasactually changed. It adopted a less selectiveapproach to research funding and initiallysupported departments with 4 and 3a ResearchAssessment Exercise ratings. There is concernthat higher education in Wales gets funded lessfavourably than in England – a funding gap.
Scotland has favoured widening participationwith improved student funding, co-locatinginstitutions of further and higher education, aswell as lifelong learning policies that do notfocus only on skills. Scotland had rejected highervariable fees in favour of a graduate endowment,but in 2008 the SNP abolished that. There hasalso been a policy aimed at boosting researchcapacity.
Northern Ireland has not operated as a devolvedadministration throughout the period underscrutiny. Efforts to give students more fundingsupport have been overruled by the UKGovernment, and the model is now based onEngland’s.
It is too early to say why changes in cross-borderflows of students are occurring and whethercontrasting policies on fees are a factor – theyclearly complicate students’ decisions aboutwhere to study.
Attempts to widen participation have not shownsignificant increases. The overall increase ininternational students has particularly favouredEngland, especially the south-east.
There has been little significant change in theawarding of degrees and qualifications – theEnglish foundation degree has not beenemulated in Wales or Scotland.
The longstanding complexities of researchfunding deepen with devolution. It is clearhowever that England’s share of research moneyis increasing at the expense of the otherterritories. EU funding bucks this trend. Fundingdecisions are sometimes taken by the UKGovernment without regard for their impact onhigher education in Scotland, Wales, or NorthernIreland. Attempts in Wales and Scotland to buildresearch capabilities are encouraging.
Current criteria for allocating research councils’funds overlook the economic impact of thisfinance on institutions that may have potentialbut cannot demonstrate past success – and ontheir localities.
This report looks at the effects of devolution onhigher education and compares the devolvedadministrations’ policies.
The powers of the Westminster Parliamentremain sovereign and in practice still legislatefor all parts of the UK, even where legislativepowers are devolved. Many ministerialdepartments still deal with both devolved andnon-devolved matters and the machinery forconsultation and coordination is very limited.
Higher education is a matter devolved toScotland and to Northern Ireland. In Walespowers over higher education are devolved to theWelsh executive body, the Welsh AssemblyGovernment, but not until now to the NationalAssembly for Wales, although this could happenin the future.
The funding of research, however remains amatter for the all-UK Government, through thefunding bodies and research councils.
Finance to the devolved administrations comesfrom the UK Government via a block grant. Whenspending in England on comparable functions –health, education and so on – is increased thenthe devolved administrations get more funding,but may spend the grant largely as they see fit.
Until 2007 disputes that arose between devolvedgovernments and the UK Government in Londonwere tackled with underlying political goodwillas Labour dominated the governments inLondon, Edinburgh and Cardiff. Election resultsin 2007 ended this consensus and nowcooperation requires more formality and there ispressure for reform of the financialarrangements of devolution.
The divergence of higher education policiespredates devolution, but has become moremarked since then. The need, however, tocompete for international students and to recruitstaff from across the UK has kept the devolvedadministrations from making changes that strayvery far from policy decisions made in DIUS forEngland. The Bologna process that aims tofacilitate student mobility within 46 Europeancountries is an influence favouring consistency.
In England higher education policy has favouredradical market-oriented mechanisms, such asintroducing deferred variable fees, competitionfor research money solely on merit, mergersbetween institutions and the creation of newdegree-awarding institutions. Lifelong learningfocuses strongly on improving skills in theworkforce.
43723 UniUK Devolution 12/11/08 13:04 Page 7
8
The impact of deferred variable fees in Englandwill increase the resources available toinstitutions in England, compared with the otherthree countries, particularly Scotland. IfScotland and Wales maintain their policies onfees their spending on higher education will bedisadvantaged.
The UK Government’s policymaking processoften considers devolved concerns late, or not atall, and liaison remains undeveloped. Greaterclarity in the UK Government about devolved andnon-devolved matters is needed, with moresystematic liaison and recognition of the impactof the financial systems and the anomalies theycan create.
Funding for higher education should be allocatedto the devolved administrations (and within UKGovernment) on a basis that either recogniseslevels of territorial need, or delivers equivalentfunding on a per capita basis.
There should be funds at UK level to support thedevelopment of research capacity in the fourcountries.
43723 UniUK Devolution 12/11/08 13:04 Page 8
Universities UK Devolution and higher education 9
This section will set out the institutionalframework of devolution in the UK, and discusshow it has operated since 1999. It draws on theextensive research that has been carried out,much of it funded by the Economic and SocialResearch Council’s Devolution andconstitutional change programme, or the twoprogrammes on Nations and regions: thedynamics of devolution, funded by theLeverhulme Trust and based at the ConstitutionUnit at University College London and theUniversity of Edinburgh.1
1.1 The legal and administrative structure ofdevolution
The way devolution works, in constitutionalterms is different in many respects for Scotland,Wales and for Northern Ireland.
In Scotland, under the Scotland Act 1998, theScottish Parliament has a wide range oflegislative powers, and can legislate for allmatters save those expressly reserved toWestminster. Reserved matters include defenceand foreign affairs, the macro-economy and thecurrency, and redistributive ones such as socialsecurity. They also include much regulation ofthe economy, including employment law,broadcasting, and also (important for highereducation) the research councils. Devolvedmatters are everything else – including health,housing, education, the criminal law andpolicing. Higher education, other than theresearch councils’ funding of research, istherefore a devolved matter.
In Northern Ireland, the constitutional fabric ofdevolution is rather more complicated – not leastbecause of the relationship between the devolvedinstitutions within Northern Ireland set up understrand 1 of the 1998 Belfast Agreement, thenorth-south institutions created by strand 2 ofthe Agreement and the ‘east-west’ ones (theBritish-Irish Council and intergovernmentalconference) set up by strand 3. Under strand 1,there are distinctions between ‘reserved’matters, ‘excepted’ matters and devolved ones.As in Scotland, all matters not specificallyreserved or excepted are devolved. ‘Reserved’matters are ones on which the Northern IrelandAssembly may legislate with the consent of theSecretary of State for Northern Ireland, andwhich may be devolved at some future date.‘Excepted’ matters include defence and foreignaffairs and economic matters. Reserved mattersinclude many aspects of economic regulation,policing and criminal justice (which there areplans to devolve in due course), and the researchcouncils. Slightly oddly (and for historic reasons),social security is devolved, but subject torequirements to ensure parity in benefits andentitlements between Northern Ireland andGreat Britain. Devolved matters therefore againinclude health, housing and education, includinghigher education.
Devolution to Wales has been in a state of fluxsince 1998. The Government of Wales Act 1998created a National Assembly for Wales that wasa single body corporate, combiningrepresentative and executive functions in asingle entity. Part of the story of Welshdevolution has been the differentiation betweenthe elected, representative (and now legislative)Assembly, and the executive Welsh AssemblyGovernment. These were each established asseparate formal entities by the Government ofWales Act 2006, with effect from May 2007.
The National Assembly’s powers were initiallylimited to executive matters, starting with those ofthe Welsh Office before 1999. Those powersincluded higher education institutions, and studentsupport was subsequently devolved as well, in2004. Its powers expanded and developed asWestminster passed legislation affecting areas inwhich the Assembly had functions between 1999and 2007. With the 2006 Act, the National Assemblycan acquire legislative powers relating to specificmatters in twenty fields, either directly byWestminster Act of Parliament or by a legislativecompetence order, an order in council sought bythe Assembly and approved at Westminster.2
Health, housing and education, including highereducation, are among those fields.
1Introduction: devolution and the United Kingdom
43723 UniUK Devolution 12/11/08 13:04 Page 9
10
Thus potentially the National Assembly for Walescan acquire legislative powers over highereducation, to go with the executive powers thathave been devolved since 1999. At present,higher education is not devolved for legislativepurposes, but depending on the Westminsterlegislative agenda and the wishes of the NationalAssembly, legislative powers in this field couldbe conferred over the next few years. (Post-16further education and vocational trainingmatters have been devolved to the Assembly as aresult of the Further Education and Training Act2007.) In any event, higher education remainsdevolved on the executive level. Ultimately, aftera referendum (which may happen as soon as2011), the Assembly may acquire ‘primarylegislative powers’ over the twenty fieldsspecified in the 2006 Act.
The overall picture is that a different pattern offunctions has been devolved to each part of theUK. Asymmetry is a key feature of the system.Higher education is in each case a devolvedfunction, but research funding distributed by theresearch councils is not.
The allocation of finance to the devolvedadministrations works rather differently. The UKGovernment funds the devolved administrationswith block grants, calculated by the widely-discussed (if often misunderstood) Barnettformula. The grants take no direct account ofneed. They are based on historic spending, as itapplied when the formula was first adopted in1978. The Barnett formula applies only tochanges in spending, whether made from year toyear (or spending review to spending review), orwithin a year.3 Such increases are allocated whenchanges are made in England to spending on‘comparable functions’, on a pro rata basis,according to the population of each territory inrelation to England (and according to the extentof devolution of the function involved).
The grant is an unconditional one, which thedevolved administrations are generally free tospend as they wish. However, the 2007Comprehensive Spending Review introducedobligations to spend part of the grant on capitalinvestment, although what functions it is spent onis a matter for the devolved administrations. Thus,there is no identifiable element of the grantrelating to education, health or any other function,and increases in grant that have been triggered bya growth in spending on a particular function inEngland do not have to be spent on that function.That said, there is often political pressure toincrease spending on a function if the UKGovernment allocates more for it in England.
The devolved administrations have very limitedborrowing powers (essentially only for cash-flowmanagement), and very limited tax-raisingpowers. The Northern Ireland Assembly and theNational Assembly for Wales have no powers tochange tax rates (other than local taxes), whilethe Scottish Parliament has a power, as yetunused, to vary the standard rate of income taxby up to 3p in the pound. If fully used, that powerwould raise about £1.1 billion (according to the2007 UK Budget report), in the context of totalScottish devolved spending of about £23 billion.
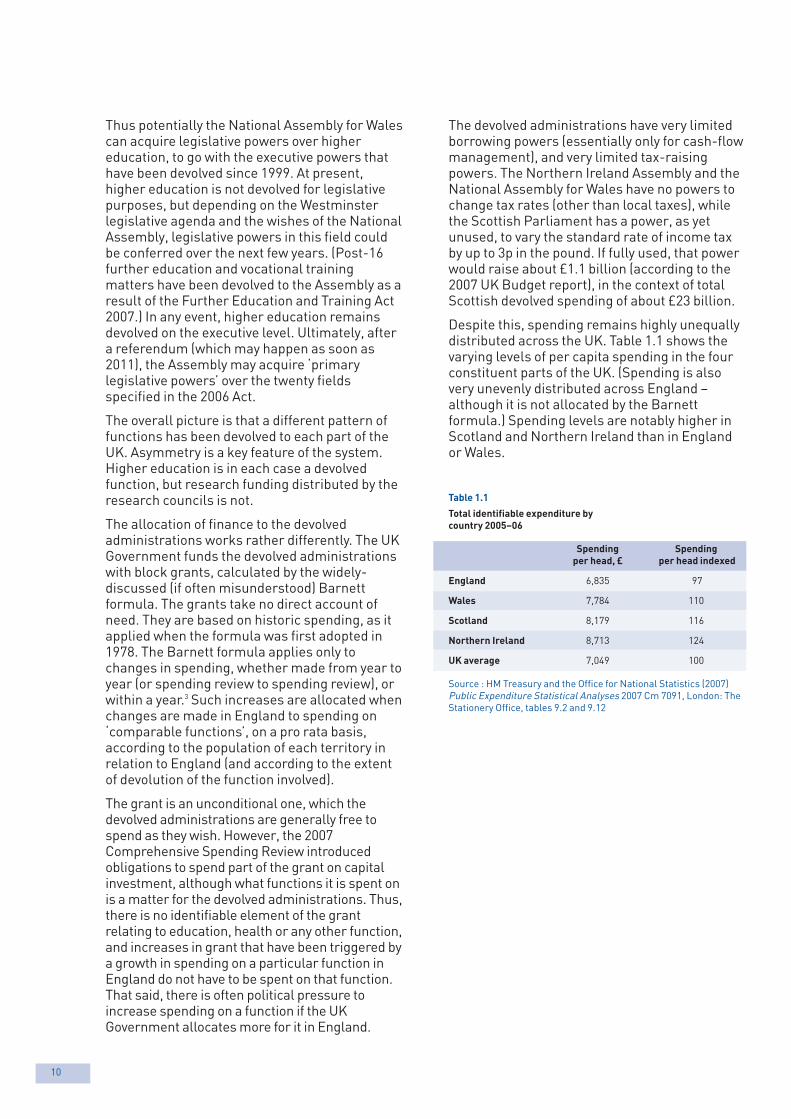
Despite this, spending remains highly unequallydistributed across the UK. Table 1.1 shows thevarying levels of per capita spending in the fourconstituent parts of the UK. (Spending is alsovery unevenly distributed across England –although it is not allocated by the Barnettformula.) Spending levels are notably higher inScotland and Northern Ireland than in Englandor Wales.
Table 1.1
Total identifiable expenditure by
country 2005–06
Spending Spending
per head, £ per head indexed
England 6,835 97
Wales 7,784 110
Scotland 8,179 116
Northern Ireland 8,713 124
UK average 7,049 100
Source : HM Treasury and the Office for National Statistics (2007)Public Expenditure Statistical Analyses 2007 Cm 7091, London: TheStationery Office, tables 9.2 and 9.12
43723 UniUK Devolution 12/11/08 13:04 Page 10
Universities UK Devolution and higher education 11
While there is considerable dispute about what‘need’ is and how it should be measured, there isa very common view that Scotland is over-fundedin relation to its needs, and that Wales is under-funded. By most indicators of need – measuressuch as per capita income (GDP or GVA), levels ofunemployment, and so forth – Wales is muchworse off than most of the rest of the UK. Bythese sorts of measures, Scotland has muchlower levels of need (although special factorssuch as sparse populations in largegeographical areas add to the costs of providingsome services there). Consequently, the formulais widely criticised, and has been repeatedlydisowned by Lord Barnett whose name it bears.The Welsh Assembly Government announced inJune 2007 its decision to establish a commissionto look at the Assembly’s financing and relatedpowers, which will begin work in the autumn2008.
England remains largely outside the map ofdevolution. Attempts to establish electedregional government were pursued in a ratherhalf-hearted way by the Labour Governmentbetween 1999 and 2004. In October 2004, areferendum in the north-east decisively rejectedproposals to establish an elected regionalassembly there. Since then, plans to set upelected regional assemblies elsewhere havebeen abandoned, and the UK Government hasmoved away from other aspects of the regionalgovernment scheme espoused by John Prescottas Secretary of State for the Environment,Transport and the Regions. In particular, it hasannounced that the present non-electedregional chambers (which often call themselves‘regional assemblies’) will be dismantled.Various aspects of the regional agenda remainunder discussion, such as whether ‘city regions’should be established and what institutionalform these might take. However, these debateshave reached no clear conclusion and are clearlynot the Brown Government’s top priority. Theresult is to leave London as the only part ofEngland with elected, regional-level government– and it is worth remembering that, with apopulation of 8 million, Greater London hasalmost as many people as Scotland and Walescombined.
1.2 Devolution and the structure of government inWhitehall and Westminster
Devolution has not affected the powers of the UKParliament at Westminster. Westminsterremains sovereign as a matter of law, and as amatter of practice is still active as a legislaturefor all parts of the UK even where legislativepowers have been devolved.4 In doing so, it actsin accordance with the so-called Sewelconvention (named after Lord Sewel, who firststated it when a Scottish Office Minister in 1998).The convention stated that Westminster ‘wouldnot normally legislate with regard to devolvedmatters except with the agreement of thedevolved legislature’. So far (thanks to Wales’slimited legislative powers and the protractedsuspensions of devolution in Northern Ireland)the convention has chiefly applied to Scotland,where it was extensively used between 1999 and2007. Part of the reason for this is thatWestminster legislation continues to deal with awide range of territorial issues, with limiteddifferentiation between the territorial scope ofthe various provisions contained in a single bill.Working out the actual (rather than formal)territorial extent of a bill is extremely difficult,not least because certain parts may apply inWales only while one or two clauses may have alimited effect in Scotland – and parallellegislation will often be made for NorthernIreland in the form of an order in council.
43723 UniUK Devolution 12/11/08 13:04 Page 11
12
A further part of the problem is that, in much ofWhitehall, there remains an extensive overlapbetween devolved and non-devolved matters.Most UK Government departments deal withboth sorts of matters, and make little structuralattempt to distinguish between the territorialimpact of their functions – so departments,divisions, branches and even units will combineEngland-only, England and Wales, Great Britain-wide and UK-wide functions. Few servicedepartments retain the devolution orconstitution desks that they ran between 1997and 2001. (Exceptions include the Foreign andCommonwealth Office and Ministry of Defence,which have minimal overlaps with devolvedfunctions, and the Home Office. The variousdepartments that have been responsible forhigher education have no such desks, althoughlike all Whitehall departments they havedevolution contact points, with only a limited rolein policymaking.) The only mechanisms that tryto distinguish between devolved and non-devolved matters are various internalprocedures, most notably those relating to thepreparation of legislation. These require variousforms of consultation with the devolvedadministrations, and have made life for officialsin service departments more complicated thanbefore 1999, but without radically changing it.Facilitating such cooperation is a key task for thescaled-down Scotland and Wales Offices, whichhandle bilateral relations between the UKGovernment and the devolved administrations.(The Northern Ireland Office is much less activein this respect, largely due to the greateradministrative distinctiveness of NorthernIreland.)
This situation has given rise to a majorconstitutional anomaly, the so-called ‘WestLothian question’. Scottish MPs sit atWestminster and vote on matters affectingEngland, but not on ones relating to Scotland.These votes have proved decisive on a number ofoccasions, when controversial proposals forEngland such as variable tuition fees andfoundation hospitals, needed those Scottishvotes to pass. There are in fact Scottish interestsin such matters, which are often overlooked; oneis that when a proposal for England has financialimplications, it will trigger consequentialpayments under the Barnett formula. Another isthat such matters may in fact extend to Scotland,if the Sewel convention means that the ScottishParliament has agreed to Westminsterlegislating on the matter. Nonetheless, this is asignificant constitutional anomaly, and onewhich the UK Government has so far not soughtto resolve. Although the number of Scottish MPshas been reduced (from 72 to 59), this onlymeans that Scotland is no longer over-represented compared to England – it isrepresented only on a similar basis to England.Indeed, as Wales acquires legislative powers andNorthern Ireland becomes more used toexercising its powers, the likelihood has to bethat the anomaly will become more evident andmore controversial. The Conservative Party isconsidering the possibility of moving to a systemof ‘English votes for English laws’ to address theissue, but this would present grave practicalproblems of implementation, and risk creatingtwo different majorities at Westminster, one formatters on which Scottish (and other devolved)MPs could vote and one for matters on whichthey could not. The result might well be to makethe UK ungovernable.
43723 UniUK Devolution 12/11/08 13:04 Page 12
Universities UK Devolution and higher education 13
Instead, most practical intergovernmentalrelations are dealt with bilaterally, between aline department in Whitehall and officialsdealing with the same policy area in the devolvedadministration. If matters become difficult, theScotland or Wales Offices may become involvedto help to resolve problems. Ministers arecomparatively seldom involved, except for theSecretaries of State for Scotland and Wales,whose role in liaising with the First Minister ofeach country has been more demanding.(Northern Ireland is an exception, due to atradition of greater administrativedistinctiveness dating back to devolution toStormont between 1922 and 1972 on one hand,and the importance of the political role of theSecretary of State for Northern Ireland inrelation to the peace process on the other.)
These arrangements have in turn beenunderpinned by the very substantial politicalconsensus that existed between 1999 and 2007,with Labour governments in London dealing withLabour or Labour-dominated ones in Edinburghand Cardiff. Labour’s dominance did not meanthat party interests over-rode governmentalones, and that there were no differences ordisputes. It did mean, however, that there was afundamental (and extensive) climate of mutualgoodwill between governments. For electoralreasons, the governments involved sought toresolve matters privately rather than in publicand were agreed on the need to find a solution,rather than taking disputes to public or formalsettings such as the JMC or the JudicialCommittee of the Privy Council.
1.3 The management of intergovernmentalrelations
A set of procedures was adopted in 1999 for themanagement of relations between the UKGovernment and devolved administrations inScotland, Wales and Northern Ireland. Thesewere set out in a memorandum of understandingbetween the various governments involved.5
Central to this was the creation of a jointministerial committee (JMC), consisting ofrepresentatives of all four governments. In itsplenary form, consisting of heads of government,it would meet at least once a year to resolve anydisputes that might arise, to discuss issuesarising from devolved policies in different parts ofthe UK, and the interaction of devolved and non-devolved policies. It would also generally keeprelations between the four governments underreview. However, the view has developed amongministers that its sole function was to resolvedisputes, and none was referred to it between1999 and 2002. It has not met since October 2002,despite the formal requirement to meet everyyear (and repeated requests from the SNPgovernment in Scotland for its revival since thatgovernment took office in May 2007). This lack ofengagement in intergovernmental matters at thehighest level of government may havecontributed to a sense in Whitehall that this wasnot a particularly important issue. It certainlymeans that there has been no body that couldactively manage intergovernmental relations.
In addition to the plenary JMC, what are known asfunctional meetings have taken place in variousspecific areas. These have included health,poverty, the knowledge economy and Europe.Most of these areas had ceased to be active by theend of 2001, however. The European formatremains active, and meets about four times a year;indeed, it appears to have supplanted a parallel UKCabinet committee. The only other areas in whichdevolved and UK ministers regularly meet areagriculture (about ten times a year, mainly toprepare EU business), and finance (twice a year).
As well as the JMC, arrangements were made aspart of the devolution legislation for specialprocedures to enable the courts to consider legalissues. These were to be designated asdevolution issues and referred to the JudicialCommittee of the Privy Council. In practice, theJudicial Committee has never dealt withlitigation between devolved governments orlegislatures and the UK institutions, and veryseldom with the key issue of whether devolvedlegislation is within the legal powers of the bodymaking it. Most of the (few) cases it hasconsidered have concerned human rights issuesarising from criminal prosecutions in Scotland.
43723 UniUK Devolution 12/11/08 13:04 Page 13
14
1.4 Devolution and public policy
Devolution has had a marked, if variable, effecton public policy. In some areas, it has led to verysubstantial differences in both how policy ismade and its outcomes. In health, for example ithas led to extreme variation.6 By contrast,divergence in an area such as local governmentamounts largely to ‘variations on a theme’ (thetheme being the UK/English one) rather than acompletely different tune. The reasons for thisare largely political, however – not just thecomplexion of the party in office but the broaderpolicymaking environment and the relativestrength of the various interest groups involved.There are no formal reasons why the NHS in allparts of the UK remains free at the point of useand funded by tax revenues (though if Englandwere to take a different approach it would causegreat difficulties for the devolvedadministrations); free access remains in placefor political reasons. Similarly, despite theunpopularity of the council tax as a basis forfinancing local government and electoralcommitments to replace it, it has remainedbecause no one can find a better system(although the Scottish Government is trying toput into effect an SNP manifesto commitment tointroduce a local income tax).
1.5 The 2007 elections
The elections of 2007 saw a significant change inthe political complexions of all the devolvedadministrations.The March elections in NorthernIreland produced strong showings for theDemocratic Unionist Party and Sinn Fein, which– after protracted negotiations – dominateministerial posts in the new Northern IrelandExecutive, as well as providing the First andDeputy First Ministers.
In Scotland, the Scottish National Party ledLabour by a single seat in the May elections tothe Scottish Parliament. Unable to persuade theLiberal Democrats to form a coalitiongovernment, it has since governed as a minority.In its first few months in office many of its policyactions have been symbolic, and involved little orno cost. Important among these are therenaming of the Scottish Executive as ‘TheScottish Government’, and publication of a whitepaper launching a ‘national conversation’ onindependence and other constitutional optionsfor Scotland.7 Another important early step wasto announce the abolition of the graduateendowment, which had been levied on Scottish-domiciled students who had graduated from aScottish higher education institution. The chargewas payable by graduates as a lump sum or bymeans of a public loan with income contingentrepayments. Its abolition was finally approved atHolyrood in February 2008. This is discussed inmore detail below.
In Wales, the elections produced a poor result forthe Labour Party, and created a number ofpossibilities for government. One option was areturn to the Labour-Liberal Democrat coalitionthat was in office between 2001 and 2003.Another was the formation of a ‘rainbowcoalition’ of the Conservatives, the LiberalDemocrats and Plaid Cymru. A third was acoalition between Labour and Plaid Cymru (the‘red-green’ coalition), which is what in fact wasformed after two and a half months ofnegotiations. Although Labour dominates thecoalition, the entry of the nationalist party intooffice significantly changes the dynamics ofWelsh politics. A key demand of Plaid Cymru inthe coalition negotiations was to work for areferendum on transferring primary legislativepowers from Westminster to the Assembly in2011, and for Labour to support that proposal atthe referendum.
43723 UniUK Devolution 12/11/08 13:04 Page 14
Universities UK Devolution and higher education 15
The UK Government’s response to thesechanges has been resolutely low-key. So far ithas not sought to merge the posts of Secretary ofState for Scotland or Wales, or to alter their roleor functions. The Scotland Office and the WalesOffice remain distinct entities in Whitehall andhave not been merged into a single ‘departmentof the nations and regions’ . A senior official hasbeen appointed as director-general, devolution,jointly in the Ministry of Justice and the CabinetOffice, to improve overall coordination ofdevolution matters, along with a director,devolution, in the Cabinet Office. There is now asmall team of officials (fewer than six) at thecentre of government working on devolutionissues.8 A cabinet committee on the constitution(CN) has also been revived, with devolutionaccounting for a substantial part of its workload.
However, the Ministry of Justice’s green paperon The governance of Britain, published in July2007, hardly mentioned devolution;constitutional or machinery of governmentmatters were notably absent.9 It contained noproposals on the West Lothian question. Itoffered a set of largely symbolic moves topromote ‘Britishness’, but these would appear tohave little substance in the context of devolutionand might even be counter-productive.
On the constitutional front, the UK Governmenthas responded to the Scottish Government’s‘national conversation’ by announcing itssupport for a Scottish ConstitutionalCommission, announced by Wendy Alexander(the then leader of Labour in the ScottishParliament) in December 2007 and supported bythe three unionist parties at Holyrood. Its termsof reference will include both the overall powersof the Scottish Parliament and financial matters,but will not consider the option of independence.An interim report is expected in the autumn of2008, and a final one in the spring of 2009.
The October 2007 Comprehensive SpendingReview (CSR) produced tight settlements for thedevolved administrations, with yearly increasesof around 2.4 per cent per annum in Wales and1.8 per cent in Scotland (although this isweighted toward later rather than earlier years,meaning that settlements are very tight in2008/09). This has not led to any more far-reaching review of the Barnett formula. The CSRhas, however, led to a tougher set of obligationsfor the devolved administrations to spend aproportion of their block grants on capitalinvestment rather than leaving them free tospend it as they wish. These factors, combinedwith others – including a commission on financein Wales, and demands for autonomy in fiscalmatters from various quarters in Scotland –suggest that a substantial revision of thedevolution financial system is likely in themedium term, or perhaps sooner.
43723 UniUK Devolution 12/11/08 13:04 Page 15
16
The development of higher education policyacross the UK has followed appreciably differenttrajectories since 1999. It is debatable howsignificant devolution has been in this process;some interviewees see it as an extension of apolicy that started with the establishment ofseparate territorial funding bodies for England,Scotland and Wales under the Further andHigher Education Act 1992. Regardless of whenthis trend started, however, it has continued andbecome more marked since 1999.
The purpose of this section is to outline brieflythe key characteristics of policy in each territoryand to show how the different systems compare,rather than to provide an exhaustive account ofpolicy in each system.
2.1 England
England’s approach to higher education hasbeen characterised by the following features:
p Greater differentiation of institutions, creatingcompetition between them to attract the beststudents, and competition among students toenter particular universities, and the use ofmarket-type mechanisms and incentives. Themost obvious manifestation of this is tuitionfees, but league tables and competitions forfunding (for example, for capital projects inhigher education institutions) also contributeto this trend.
p The transfer of an increasing share of thefinancial burden of higher education tostudents, or more accurately graduates,rather than the state. This has beenaccompanied by a weakening of the notionthat higher education is purely a public good,and a greater emphasis on it as somethingthat confers significant private benefits. Theintroduction of variable fees with deferredgraduate contributions in 2006 reinforces thisshift.
p A more active approach by government and itsagencies to institutional issues, including thegranting of degree-awarding powers anduniversity status to a number of newinstitutions, including teaching-onlyinstitutions.10 There has been some generalencouragement of mergers, with HEFCEproviding financial support (through itsstrategic development fund) but no taking-onby HEFCE of a strategic planning role in thisarea.
p An emphasis (shared in Scotland and Wales) onthe need for education to continue throughout aperson’s life, but (unlike in Scotland or Wales)primarily for economic reasons (developing andmaintaining the skills base in the workforce).This has affected the content and description ofdegree courses, the means of delivery ofteaching and attempts to reach non-traditionalstudents, for example through distancelearning or part-time courses.
2.2 Wales
At least between 1999 and 2007, Wales has soughtto shape a different approach to public servicesgenerally, emphasising the ‘clear red water’between Labour in Cardiff and in London. Waleshas tried to apply a doctrine of what an adviser toRhodri Morgan (First Minister for Wales) dubbed‘progressive universalism’. This approach hasemphasised partnerships between government,providers of services and services usersgenerally, rather than competition betweenproviders or privatisation of service delivery.
Looked at from the outside (though for differentreasons, and without conscious emulation)Wales’s higher education policy has in someways been similar to the Scottish. Key featureshave included:
p A sector with many ‘smaller but friendly’institutions, accompanied by political supportfor institutional reconfiguration although withonly limited achievement of that overall. Thishas been reflected in official policy statementsand funding council action to promotereconfiguration and collaboration.
p Concern within higher education about the‘funding gap’ (also called the investment gap)between what the higher education sector inWales receives and what it would receive if itwas funded on the same basis as in England.The existence of the gap is somewhatcontentious, its size much more so. Estimatesof its size in 2004/05 vary from £40 to £80million.
p Following reviews by Professor Teresa Rees(although not wholly following herrecommendations), a more generousapproach to student support, within theconstraints of the Assembly’s legal powers(and finances). This involves AssemblyLearning Grants to help poorer students,deferred flexible fees which are reduced (by anAssembly Fees Grant) for full-timeundergraduate students from Wales and EUstudents who choose to study in Wales, and asimplified structure for student support.
2General trends in higher education policy
43723 UniUK Devolution 12/11/08 13:04 Page 16
Universities UK Devolution and higher education 17
p An attempt to maximise researchperformance by developing researchcollaboration across a range of disciplines,particularly in the natural and appliedsciences, which seem so far to be broadlysuccessful.12
2.4 Northern Ireland
Northern Ireland has experienced only shortperiods of devolution since the BelfastAgreement was reached in 1998; devolvedgovernment was only able to operate between2000 and 2002, and since March 2007. For therest of the period, UK ministers rather thanlocally-elected ones have governed NorthernIreland. Long-standing institutional andstructural differences have played more of a rolethan changes in political direction.
Higher education institutions in Northern Irelandare directly funded by the Department forEmployment and Learning Northern Ireland(DELNI) rather than through an arms-lengthfunding body, partly because the establishmentof such a body would leave the Department withlittle to do.13 However, DELNI is advised by theNorthern Ireland Higher Education Council onsuch matters. The council was first establishedin 1993, at the same time as the higher educationfunding bodies in England, Wales and Scotland.It lacked their statutory powers under directrule, and when reconstituted in 2002 (underdevolution) its remit was extended to cover allhigher education in Northern Ireland, not justthat provided by the two universities there. Inaddition to its advisory role, the body also has arole in providing liaison not just between DELNIand the universities but with counterparts inGreat Britain and the Republic of Ireland.
One of comparatively few areas in which theNorthern Ireland Assembly sought to influencepolicymaking was the issue of student supportand tuition fees; a thorough enquiry by theformer Education and Learning Committeerecommended a rather different approach tostudent support and full-time undergraduatetuition fees than that adopted in England.However, the Employment and LearningMinister rejected the recommendations anddecided, in 2004, that a very different solution,largely following the English model, should beadopted under direct rule14. From September2008 the amounts of grants payable to NorthernIreland-domiciled students from low-incomefamilies have been increased, although thestructure of the policy continues to resemblethat in England.
p A resolve to enhance the use of the Welshlanguage as a medium for teaching in highereducation in line with the wider bilingualismpolicies of the Welsh Assembly Government.
p Despite the funding gap, a less selectiveapproach from the Higher Education FundingCouncil for Wales (HEFCW) to researchfunding, which initially included continuing toprovide significant research funding todepartments with 4 and 3a ratings in the 2001Research Assessment Exercise (RAE), as wellas 5 or 5* ones. There has also been anattempt also to develop collaborative researchnetworks supported by HEFCW’sreconfiguration and collaboration fund,although this has been somewhat later andmore tentative than in Scotland.11
2.3 Scotland
Scottish policy has been less market-orientedthan England’s, and concerned with incrementalrather than radical change in the highereducation sector. It has been characterised by:
p As in England, an emphasis on lifelonglearning, but giving as much weight to itssocial aspects – such as social inclusion andactive citizenship – as to skills.
p An attempt to link the various strands oflifelong learning, principally by merging theseparate funding bodies for further and highereducation into a single Scottish FundingCouncil, but also by stressing links betweenthe two sectors in other ways, including theco-location of institutions and the exchange ofstudents between the two.
p Following the report of Andrew Cubie, a moregenerous approach to student support, with arejection of higher variable fees, and theintroduction (from 2001) of the (now-abolished) graduate endowment as analternative. The endowment that the graduatewas required to pay back – as a lump sum orby means of a loan – was much smaller thanthe variable fee in England and had a numberof exemptions. One of the first things that theincoming SNP administration did in the earlysummer of 2007 was to announce the abolitionof the graduate endowment, from April 2008.
p A vigorous approach to the ‘wideningparticipation’ agenda, with a wide range ofinitiatives to encourage participation –through improved student funding, location ofcourses and institutions, and attempting todevelop links between higher education andfurther education courses.
43723 UniUK Devolution 12/11/08 13:04 Page 17
18
2.5 The UK role
Despite the devolution of policy over mostaspects of higher education, UK standardsremain important to policymakers andadministrators in all the devolvedadministrations. Interviewing suggests two keydrivers for this: the market for studentrecruitment, especially from overseas, and thelabour market for academic staff. The desire toensure that universities throughout Britain(Northern Ireland is a partial exception here) areattractive to international students serves aspowerful factor to ensure that they are clearlyBritish universities, offering degrees whichconform to the ‘gold standard’ (as one devolved-administration interviewee put it), which isrecognised internationally. That means thatdegree standards, and the measures of teachingand research quality, continue to be operatedwithin a UK-wide frame of reference.
Similar pressures influence the recruitment ofacademic staff, with universities in Scotland andWales eager to ensure that they can recruit thebest staff from the UK-wide labour market (orinternational ones), rather than limit themselvesto smaller, more local ones. This entails a needto comply, largely, with UK-wide standards – inpractice those set for England, whether(formerly) by the DfES or DTI and now by DIUS, orby HEFCE. These factors may be informal butthey are nonetheless powerful, and play a majorrole in the minds of policymakers in Edinburghor Cardiff. It is arguable, however, whether theyloom so large in the minds of policymakers inLondon. For this reason, the machinery ofmanaging intergovernmental liaison is animportant area of concern, addressed in moredetail in the conclusions of this report.
43723 UniUK Devolution 12/11/08 13:04 Page 18
Universities UK Devolution and higher education 19
The main focus of this section is quantitative. Itdiscusses some of the main issues for studentsfollowing devolution. It draws heavily on theannexe to this report, prepared by Nigel Brownand Brian Ramsden – using Office for NationalStatistics (ONS) and Higher Education StatisticsAgency (HESA) data, which provides more detailon what I have necessarily simplified in thissection.
3.1 The student population
Table 3.1:
Higher education students in
higher education institutions
1996/7–2005/6
3Students
Change
from
1996/7
1996/7 1999/2000 2005/6 to 2005/6
Students Country/ Students Country/ Students Country/ Overall As
as % of region’s as % of region’s as % of region’s percentage proportion
UK whole % of total UK whole % of total UK whole % of total change of total UK
UK UK UK student
population population population population
Country/Region
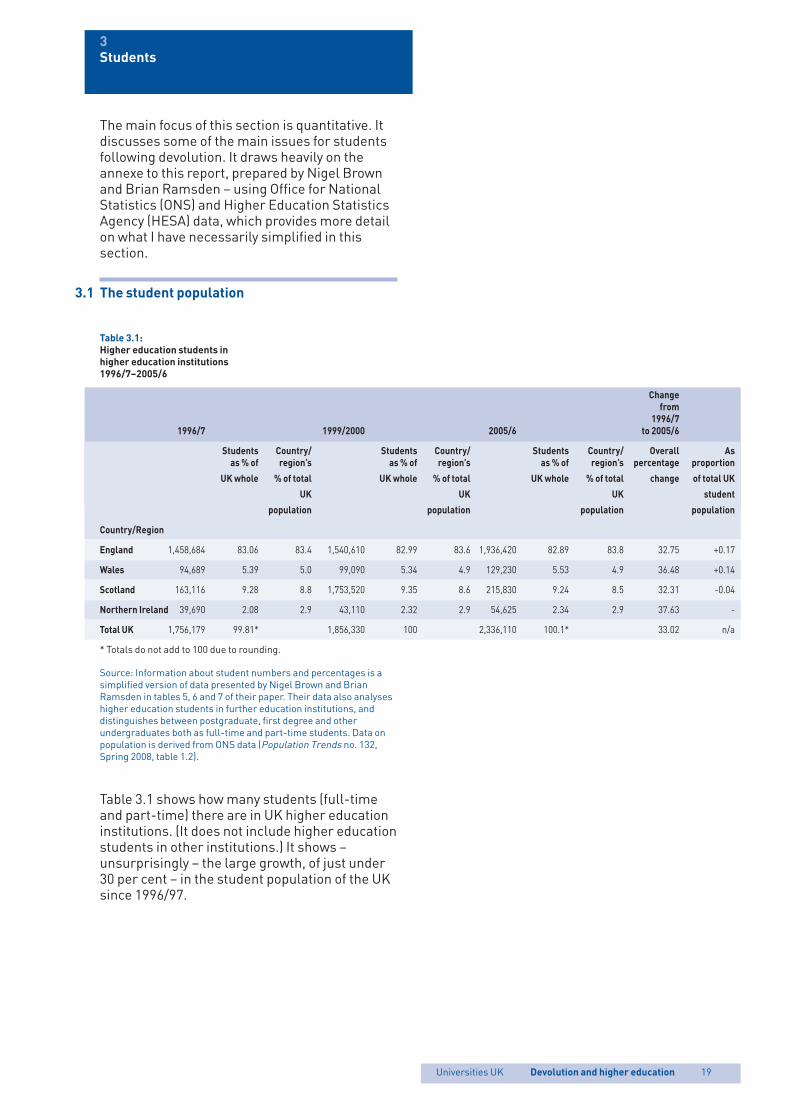
England 1,458,684 83.06 83.4 1,540,610 82.99 83.6 1,936,420 82.89 83.8 32.75 +0.17
Wales 94,689 5.39 5.0 99,090 5.34 4.9 129,230 5.53 4.9 36.48 +0.14
Scotland 163,116 9.28 8.8 1,753,520 9.35 8.6 215,830 9.24 8.5 32.31 -0.04
Northern Ireland 39,690 2.08 2.9 43,110 2.32 2.9 54,625 2.34 2.9 37.63 -
Total UK 1,756,179 99.81* 1,856,330 100 2,336,110 100.1* 33.02 n/a
* Totals do not add to 100 due to rounding.
Source: Information about student numbers and percentages is asimplified version of data presented by Nigel Brown and BrianRamsden in tables 5, 6 and 7 of their paper. Their data also analyseshigher education students in further education institutions, anddistinguishes between postgraduate, first degree and otherundergraduates both as full-time and part-time students. Data onpopulation is derived from ONS data (Population Trends no. 132,Spring 2008, table 1.2).
Table 3.1 shows how many students (full-timeand part-time) there are in UK higher educationinstitutions. (It does not include higher educationstudents in other institutions.) It shows –unsurprisingly – the large growth, of just under30 per cent – in the student population of the UKsince 1996/97.
43723 UniUK Devolution 12/11/08 13:04 Page 19
20
What is more interesting is the extent to whichgrowth in the number of students is relativelyevenly distributed across the four parts of the UK.The rates of growth in Scotland and England havebeen below the UK average, while growth in Walesand Northern Ireland has been above it (albeitonly slightly in the case of Wales). However, theNorthern Ireland figures reflect the inclusionsince 2000 of students attending the two teachertraining institutions in Northern Ireland, whichwere not included in the 1996/97 data, so are notstrictly comparable.
It is also notable that England’s share of thestudent population of the UK is (and remains)slightly smaller than its share of the generalpopulation, as does that of Northern Ireland.Those of Scotland and Wales are slightly higherthan their population shares would suggest. InNorthern Ireland this reflects the limitednumber of student places that are available andmeans that many students go elsewhere (mainlyto Great Britain) for their higher education.(Before the abolition of higher education fees inthe Republic of Ireland in 1997, substantialnumbers of students from the Republic studiedat higher education institutions in NorthernIreland but this is no longer the case.)
We do not have readily available comparable dataabout age participation rates – the number ofentrants under 21 to full-time undergraduatehigher education expressed as a percentage of the18 year-old population in the territory concerned.While this data is available for Scotland, and in aless refined manner for Northern Ireland, itappears to be unavailable for Wales or England.
3.2 Cross-border flows
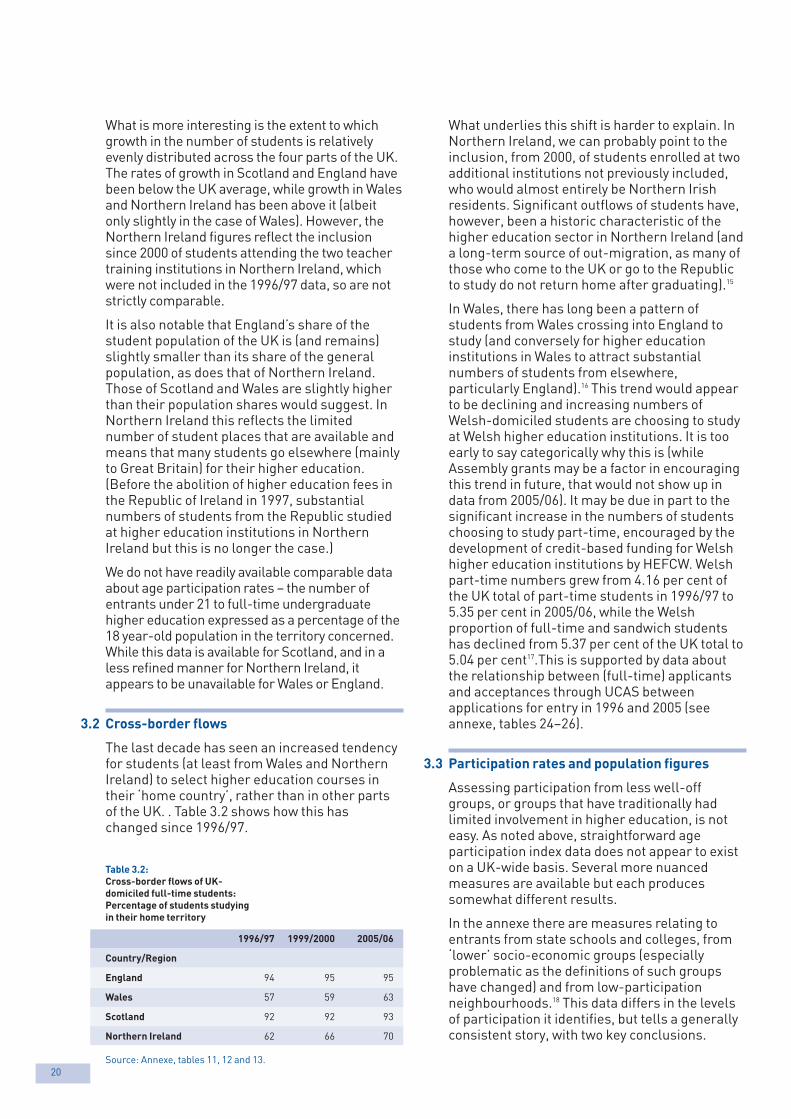
The last decade has seen an increased tendencyfor students (at least from Wales and NorthernIreland) to select higher education courses intheir ‘home country’, rather than in other partsof the UK. . Table 3.2 shows how this haschanged since 1996/97.
Table 3.2:
Cross-border flows of UK-
domiciled full-time students:
Percentage of students studying
in their home territory
1996/97 1999/2000 2005/06
Country/Region
England 94 95 95
Wales 57 59 63
Scotland 92 92 93
Northern Ireland 62 66 70
Source: Annexe, tables 11, 12 and 13.
What underlies this shift is harder to explain. InNorthern Ireland, we can probably point to theinclusion, from 2000, of students enrolled at twoadditional institutions not previously included,who would almost entirely be Northern Irishresidents. Significant outflows of students have,however, been a historic characteristic of thehigher education sector in Northern Ireland (anda long-term source of out-migration, as many ofthose who come to the UK or go to the Republicto study do not return home after graduating).15
In Wales, there has long been a pattern ofstudents from Wales crossing into England tostudy (and conversely for higher educationinstitutions in Wales to attract substantialnumbers of students from elsewhere,particularly England).16 This trend would appearto be declining and increasing numbers ofWelsh-domiciled students are choosing to studyat Welsh higher education institutions. It is tooearly to say categorically why this is (whileAssembly grants may be a factor in encouragingthis trend in future, that would not show up indata from 2005/06). It may be due in part to thesignificant increase in the numbers of studentschoosing to study part-time, encouraged by thedevelopment of credit-based funding for Welshhigher education institutions by HEFCW. Welshpart-time numbers grew from 4.16 per cent ofthe UK total of part-time students in 1996/97 to5.35 per cent in 2005/06, while the Welshproportion of full-time and sandwich studentshas declined from 5.37 per cent of the UK total to5.04 per cent17.This is supported by data aboutthe relationship between (full-time) applicantsand acceptances through UCAS betweenapplications for entry in 1996 and 2005 (seeannexe, tables 24–26).
3.3 Participation rates and population figures
Assessing participation from less well-offgroups, or groups that have traditionally hadlimited involvement in higher education, is noteasy. As noted above, straightforward ageparticipation index data does not appear to existon a UK-wide basis. Several more nuancedmeasures are available but each producessomewhat different results.
In the annexe there are measures relating toentrants from state schools and colleges, from‘lower’ socio-economic groups (especiallyproblematic as the definitions of such groupshave changed) and from low-participationneighbourhoods.18 This data differs in the levelsof participation it identifies, but tells a generallyconsistent story, with two key conclusions.
43723 UniUK Devolution 12/11/08 13:04 Page 20
Universities UK Devolution and higher education 21
Table 3.3
Percentage of non-UK students
by country of study
1996/97 1999/2000 2005/06
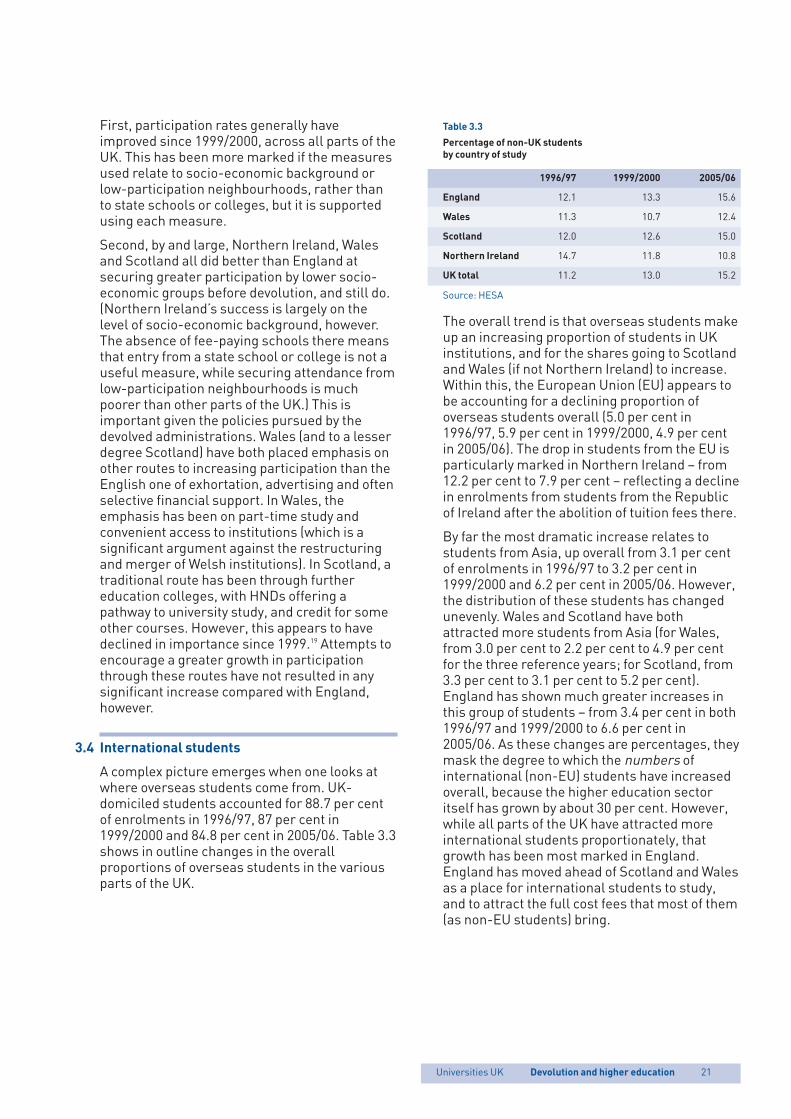
England 12.1 13.3 15.6
Wales 11.3 10.7 12.4
Scotland 12.0 12.6 15.0
Northern Ireland 14.7 11.8 10.8
UK total 11.2 13.0 15.2
Source: HESA
The overall trend is that overseas students makeup an increasing proportion of students in UKinstitutions, and for the shares going to Scotlandand Wales (if not Northern Ireland) to increase.Within this, the European Union (EU) appears tobe accounting for a declining proportion ofoverseas students overall (5.0 per cent in1996/97, 5.9 per cent in 1999/2000, 4.9 per centin 2005/06). The drop in students from the EU isparticularly marked in Northern Ireland – from12.2 per cent to 7.9 per cent – reflecting a declinein enrolments from students from the Republicof Ireland after the abolition of tuition fees there.
By far the most dramatic increase relates tostudents from Asia, up overall from 3.1 per centof enrolments in 1996/97 to 3.2 per cent in1999/2000 and 6.2 per cent in 2005/06. However,the distribution of these students has changedunevenly. Wales and Scotland have bothattracted more students from Asia (for Wales,from 3.0 per cent to 2.2 per cent to 4.9 per centfor the three reference years; for Scotland, from3.3 per cent to 3.1 per cent to 5.2 per cent).England has shown much greater increases inthis group of students – from 3.4 per cent in both1996/97 and 1999/2000 to 6.6 per cent in2005/06. As these changes are percentages, theymask the degree to which the numbers ofinternational (non-EU) students have increasedoverall, because the higher education sectoritself has grown by about 30 per cent. However,while all parts of the UK have attracted moreinternational students proportionately, thatgrowth has been most marked in England.England has moved ahead of Scotland and Walesas a place for international students to study,and to attract the full cost fees that most of them(as non-EU students) bring.
First, participation rates generally haveimproved since 1999/2000, across all parts of theUK. This has been more marked if the measuresused relate to socio-economic background orlow-participation neighbourhoods, rather thanto state schools or colleges, but it is supportedusing each measure.
Second, by and large, Northern Ireland, Walesand Scotland all did better than England atsecuring greater participation by lower socio-economic groups before devolution, and still do.(Northern Ireland’s success is largely on thelevel of socio-economic background, however.The absence of fee-paying schools there meansthat entry from a state school or college is not auseful measure, while securing attendance fromlow-participation neighbourhoods is muchpoorer than other parts of the UK.) This isimportant given the policies pursued by thedevolved administrations. Wales (and to a lesserdegree Scotland) have both placed emphasis onother routes to increasing participation than theEnglish one of exhortation, advertising and oftenselective financial support. In Wales, theemphasis has been on part-time study andconvenient access to institutions (which is asignificant argument against the restructuringand merger of Welsh institutions). In Scotland, atraditional route has been through furthereducation colleges, with HNDs offering apathway to university study, and credit for someother courses. However, this appears to havedeclined in importance since 1999.19 Attempts toencourage a greater growth in participationthrough these routes have not resulted in anysignificant increase compared with England,however.
3.4 International students
A complex picture emerges when one looks atwhere overseas students come from. UK-domiciled students accounted for 88.7 per centof enrolments in 1996/97, 87 per cent in1999/2000 and 84.8 per cent in 2005/06. Table 3.3shows in outline changes in the overallproportions of overseas students in the variousparts of the UK.
43723 UniUK Devolution 12/11/08 13:04 Page 21
22
3.5 Student finance
Each government in the UK has adopted adifferent approach to helping full-time studentsfund their undergraduate education. In additionto the fees regime discussed below, studentsupport through student loans is availablethroughout the UK.
In England, the approach adopted has been thedeferred variable fee, payable after graduationby means of a subsidised public loan. Thisapproach was proposed in the white paper onThe future of higher education, published in 2003with legislation enacted in 2004.20 The new feesregime has applied with effect from the 2006/07entry and replaced the previous fixed fee, whichwas an upfront charge paid by students and theirfamilies. Fees have been capped at the level of£3,000 per year in 2006 values, and virtually allhigher education institutions have set their fee atthat level, for practically all courses.21 To ensurethat institutions were making adequate efforts toattract and retain students from a range ofbackgrounds the introduction of variable feeswas tied to requirements to ensure ‘fair access’to higher education, such as a means-testedminimum bursary of £300 for students with lowfamily incomes entitled to a full higher educationmaintenance grant of £2,700. The fees cap is dueto be reviewed in 2009 and any proposal to raisethe cap will take some time to implement. Inpractice, the parliamentary procedures involvedand the lead times for funding decisions meanthat any increase in the fee cap would be unlikelyto take effect before 2011/12 at the earliest.
In Wales, deferred flexible fees of up to £3,000also apply (as from the 2007/08 entry), but theregime has been significantly tempered, with theintention of making higher education moreaccessible to Welsh-domiciled students studyingin Wales (and EU students).22 The main form ofsupport is the Assembly learning grant, a needs-related grant of up to £2,700 payable fromSeptember 2006 to those with a family incomebelow £37,435.23 In addition, from September2007, the Assembly fees grant has beenintroduced – up to £1,845 a year for full-timestudents; it is not repayable and not dependenton income. The grant is only available to Welsh-domiciled students who attend institutions inWales, so may serve to reduce the number ofstudents from Wales who go to England to studyas well as encouraging higher levels ofparticipation. The cost of this fee remission grantis due to increase dramatically from £22.3million in 2007/08 to £78 million in 2010/11.
In Scotland, the graduate endowment served asan alternative to upfront tuition fees as well asdeferred flexible fees. This was a one-off chargepayable from 1 April 2005 by graduates who hadenrolled in September 2001 or later. In otherwords, the endowment was normally payable on1 April in the year after the student graduated.The payment was set at £2,000 in 2001, and in2007, had increased to £2,289. Graduates couldopt to add the amount of the endowment to theirstudent loans rather than pay it as a lump sumwhen it became due, and most did. In return,higher education became free at the point ofentry for students domiciled in Scotland whostudied at Scottish higher education institutions.
As one of its first policy decisions, the new SNP-led Government announced in June 2007 that itintended to abolish the graduate endowment.Legislation received royal assent in April 2008;the SNP had parliamentary support from theLiberal Democrats and Greens, but oppositionfrom Labour and Conservatives. The policymemorandum that introduced the billemphasised the modest returns that theendowment had produced for the taxpayerbecause some two-thirds of graduates hadchosen to add the cost of the endowment to theirstudent loans rather than pay it as a lump sum. Itis estimated that the costs associated with theseloans are losing the taxpayer around a third ofthe income collected, and that loans take some13 years to be repaid. On this basis, theGovernment estimated that only £57,000 of theloan debt had been repaid while arguing that theendowment had acted as a substantialdisincentive to greater participation in highereducation. The SNP Government has alsosuggested that it will ensure minimum incomesfor students of £7,000, though plans to repaystudent debt from public funds have beenabandoned on cost grounds.
In Northern Ireland the fees regime is similar tothat in England, with a loan to cover the costs offees, not repayable until after graduation anduntil earnings exceed £15,000 a year. There arevarious funds to assist poorer students,including from September 2008, a non-repayablemaintenance grant for students from lower-income households of £3,145.
43723 UniUK Devolution 12/11/08 13:04 Page 22
Universities UK Devolution and higher education 23
p in Scotland, pay no fee if they are domiciled inScotland, but were liable to pay the graduateendowment (until its abolition came intoeffect). The same applies to students fromother EU member states. Students domiciledin other parts of the UK who are studying inScotland pay fees of £1,735 (£2,760 formedical undergraduates) for which they maybe eligible for loans.
This is, of course a simplification, which takes noaccount of special circumstances and need, orthe financial aid for students who study part-time, are older or have child-careresponsibilities, or are graduate students.
Such complexities make decisions about whereto study much harder than formerly. They alsomake the policymaking environment much morecomplex, in ways that politicians and officials(certainly in London) do not always appreciate.Anecdotes suggest this goes to the highestpolitical level; interviewing for this reportsuggests this is also the case for many highereducation officials in the UK Government.
Even if the financial advantages of studying aresignificant, resolving these issues may itselfdeter students from (in particular) studyingoutside the territory in which they live. That mayitself be a factor in the trend, discussed above, ofstudents attending a higher education institutionin their own territory rather than moving away.
The need to address such complexities may liebehind the announcement in June 2007, duringFirst Minister of Scotland Alex Salmond’s visit toBelfast that the Scottish Executive (as it still was)would seek to reduce fees payable by NorthernIreland students studying in Scotland. Whethersuch a reduction would be affordable, or indeedlegally possible, is not clear, however.
In England the Student Loans Company makesand underwrites loans to students. In Scotlandthe comparable agency is the Student AwardsAgency for Scotland (SAAS); in Wales it isStudent Finance Wales and in Northern Ireland itis Student Finance NI. SAAS is constituted as anexecutive agency of the Scottish Government;Student Finance Wales and Student Finance NIare parts of their respective governmentdepartments. Although the Student LoansCompany was established following GreatBritain-wide legislation, this now constitutes adevolved matter for Scotland and NorthernIreland – so the latest plans (recently approvedby the Westminster Parliament) for the sale ofthe Student Loans Company loan book onlyrelate to loans from England and Wales, notScotland or Northern Ireland.
3.6 Cross-border movements of students andfinancial implications of different fees regimes
The existence of such different fee regimesmeans that when students from one part of theUK go to study in another part things can gettricky. The situation is further complicated by EUlaw, and the need to treat students from othermember states in the same way as ‘home’students. The result is a convoluted patchwork ofprovisions, with
p different fee regimes applying to students in aterritory, according to where they aredomiciled; and
p different forms of means-tested grants orbursaries to mitigate the overall cost of highereducation applying, again depending on wherestudents are domiciled.
Thus, in 2007/08, full-time undergraduates:
p in England, must pay tuition fees of £3,070,subject to a loan to cover the cost and somaking it a deferred variable fee
p in Northern Ireland, the situation is similar tothat in England
p in Wales, must pay tuition of up to £3,070,subject to a loan to cover the cost and so makeit a deferred fee (as in England) – but Welsh-domiciled students studying in Wales will alsoreceive a £1,845 fee grant, meaning their netfees are £1,225
43723 UniUK Devolution 12/11/08 13:04 Page 23
24
The area of degrees and qualifications is the onethat has changed least following devolution. Theprincipal development of significance has beenthe emergence of ‘foundation degrees’, whichhave been embraced in England and have beenformally established in Northern Ireland, butwhich have attracted much less interestelsewhere. In Scotland, HND courses remainoffered, and recognised by employers, and canserve as a route into degree courses, in the waythey were originally intended.
Change has of course happened, principally dueto the Bologna process. This aims to make iteasier for students to study anywhere within the46 countries that have signed up to a EuropeanHigher Education Area (EHEA). There is littleevidence to suggest that implementation ofBologna standards has been different in the fourUK countries. The different structure of degreesin Scotland (four-year degrees, and the award ofMA degrees at the older universities) has createdsome difficulties in implementing the Bolognaprocess for the UK as a whole – though thiswould have arisen before devolution. If anything,it would appear that approaches across theconstituent parts of the UK to implementing theBologna process have been consistent.
In many ways, this lack of change is itselfremarkable. It indicates the powerful influencethat the traditional British degree exercises, andthe need to respond to the internationalenvironment that is now so important for highereducation. The traditional degree is seen as agold standard, important for establishing theinternational competitiveness of highereducation in each part of the UK, and there ismarked aversion at least from governmentofficials to undermine its value.
4Degrees and qualifications
43723 UniUK Devolution 12/11/08 13:04 Page 24
Universities UK Devolution and higher education 25
5Institutions
The prospect of each part of the UK determiningwhich institutions can award degrees raises thepossibility that they might use this power toexpand the scope of the higher education sectorwith, potentially, an effect on the perceived valueof a degree from a UK institution. At least for thedevolved territories, and as discussed in section2.5 above, there are at present powerfulpressures to prevent that happening – notablythe desire to maintain common standards acrossthe UK and to uphold the gold standard of UKdegrees. The system of external examiners is apowerful cohesive factor in this as well, as is themobility of academic staff, and the need toensure that institutions are, and remain,comparable with institutions elsewhere in theUK. But these convergent influences ariseinformally rather than for formal reasons – and ifcircumstances were to change, this couldchange too. If a UK government or UK agenciesand bodies, such as the Quality AssuranceAgency (QAA) or Privy Council, were to createwhat the devolved administrations regarded asundue difficulties in this area, there is a risk UK-wide standards would be seen as beingundermined and the devolved administrationsmight wish to establish their own arrangementsinstead.
5.2 Reconfiguration and mergers of institutions
Perhaps more important than the issue of formaluniversity status is the broader one of the sizeand nature of institutions. In Scotland there donot seem to be major concerns about thestructure of the sector and little interest in anyfurther reduction in the number of institutionsfollowing a period in which the number ofrelatively small institutions fell significantly.However, there has been a concern to ensurethat higher education is available in under-served areas, hence the attempt to establish theCrichton campus in Dumfries, offering coursesfrom the Universities of Glasgow and Paisley aswell as Bell College and Dumfries and GallowayCollege. In addition the UHI Millennium Institutehas been established to serve the dispersedcommunities in the north and north-west ofScotland, which is seeking university status inpartnership with a number of existinguniversities.
5.1 The conferring of university status
Different approaches to institutional issues inhigher education have clearly developed since1999. In England, differentiation and competitionhave been underway for some time, driven bymarket pressures and governmentencouragement. The current UK Governmenthas taken little serious interest in restructuringthe sector or the merger of institutions. As aresult HEFCE continues to emphasise that it isnot a planning body. It has, nevertheless,established a strategic development fund that isavailable to support all types of collaboration,including mergers.
The Westminster Government has taken broaderapproaches to degree-awarding powers inEngland as well, leading to the establishment ofa new wave of universities from former collegesof higher education that had been awardingother universities’ degrees. These universitiespresently only offer taught degrees, not researchones. More recently Parliament in Westminsterhas extended the opportunity to apply for degreeawarding powers to further education colleges inEngland that offer foundation degrees. Otherparts of the UK, however have not yet taken thispath.
In Scotland, the most difficult issues haverelated to new multi-site institutions formed bymergers. In the merger of the University ofPaisley and Bell College, obtaining Privy Councilapproval for the new institution and its title,University of the West of Scotland, has proved aprotracted affair, which may discourage use ofthe Privy Council to do this in future. (The powersof the Scottish Parliament and Northern IrelandAssembly would extend to creating new degreesor conferring degree-awarding status on highereducation institutions, although at present thisremains governed by pre-devolutionWestminster legislation, the Further and HigherEducation Act 1992 and the Further and HigherEducation (Scotland) Act 1992.24)
43723 UniUK Devolution 12/11/08 13:04 Page 25
26
In Wales there has been political pressure on theneed for some reconfiguration. The goal ofreconfiguration was discussed in ReachingHigher, but with no detailed plans set out there.25
The most notable area where action has not beentaken is in south-east Wales, where there arethree post-1992 institutions (University of WalesInstitute Cardiff, University of Wales, Newport,and the University of Glamorgan) but a need, it isbelieved, for no more than two distinctinstitutions. Reconfiguration has not beenachieved, although in other respects (such asmerger of the University of Wales College ofMedicine with Cardiff University, andrationalisation of subject provision in varioussubjects) it has taken place.
Both Scotland and Wales have sought to sheltertheir ‘middle-ranking’ institutions from some ofthe harsher environmental pressures thatsimilar institutions in England would face,notably in the area of research funding. At somecost (certainly financially if not otherwise),Scotland and Wales have preserved a systemthat, by being less differentiated, is more like thesystem as it was across Great Britain before1993.
However, limited changes have occurred. Therehas been no large-scale consolidation orfragmentation of institutions in Scotland, Walesor Northern Ireland, just a slower rate of changecompared with England. Again, there is no legalor formal reason for this, and it is possible toimagine circumstances in which policypressures might start to cause significantchanges in this area.
43723 UniUK Devolution 12/11/08 13:04 Page 26
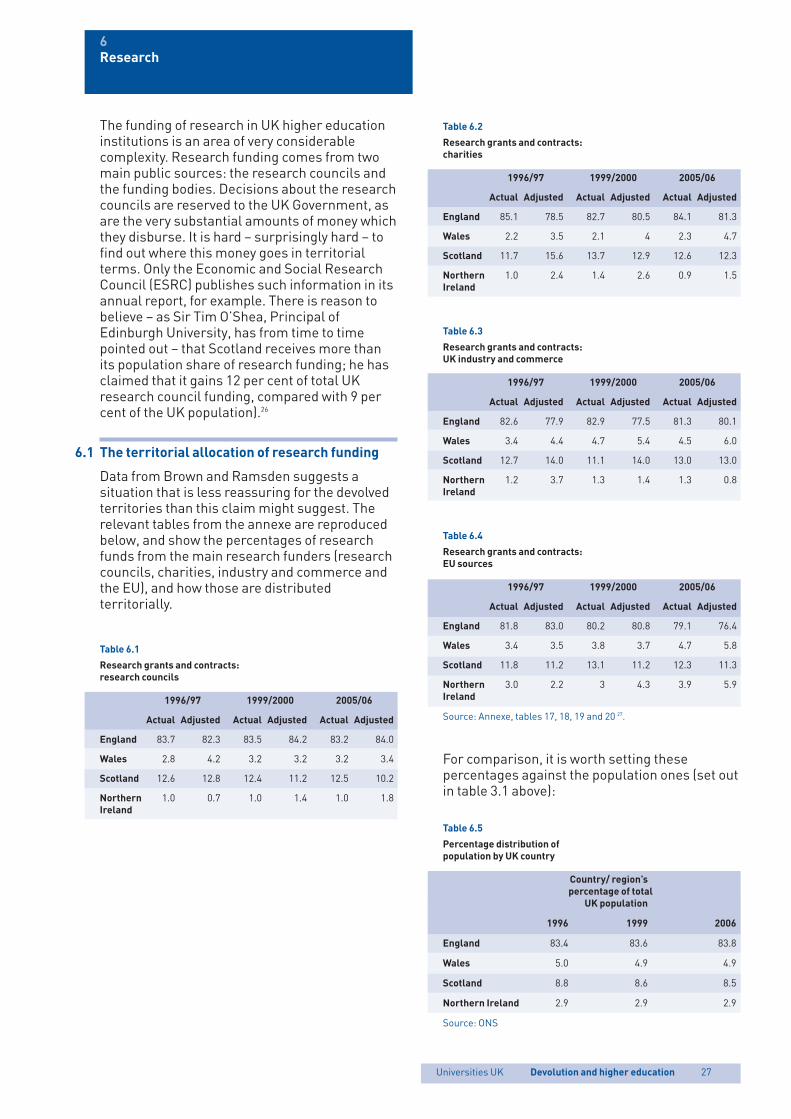
6Research
Universities UK Devolution and higher education 27
Table 6.2
Research grants and contracts:
charities
1996/97 1999/2000 2005/06
Actual Adjusted Actual Adjusted Actual Adjusted
England 85.1 78.5 82.7 80.5 84.1 81.3
Wales 2.2 3.5 2.1 4 2.3 4.7
Scotland 11.7 15.6 13.7 12.9 12.6 12.3
Northern 1.0 2.4 1.4 2.6 0.9 1.5Ireland
Table 6.3
Research grants and contracts:
UK industry and commerce
1996/97 1999/2000 2005/06
Actual Adjusted Actual Adjusted Actual Adjusted
England 82.6 77.9 82.9 77.5 81.3 80.1
Wales 3.4 4.4 4.7 5.4 4.5 6.0
Scotland 12.7 14.0 11.1 14.0 13.0 13.0
Northern 1.2 3.7 1.3 1.4 1.3 0.8Ireland
Table 6.4
Research grants and contracts:
EU sources
1996/97 1999/2000 2005/06
Actual Adjusted Actual Adjusted Actual Adjusted
England 81.8 83.0 80.2 80.8 79.1 76.4
Wales 3.4 3.5 3.8 3.7 4.7 5.8
Scotland 11.8 11.2 13.1 11.2 12.3 11.3
Northern 3.0 2.2 3 4.3 3.9 5.9Ireland
Source: Annexe, tables 17, 18, 19 and 20 27.
For comparison, it is worth setting thesepercentages against the population ones (set outin table 3.1 above):
Table 6.5
Percentage distribution of
population by UK country
Country/ region’s
percentage of total
UK population
1996 1999 2006
England 83.4 83.6 83.8
Wales 5.0 4.9 4.9
Scotland 8.8 8.6 8.5
Northern Ireland 2.9 2.9 2.9
Source: ONS
The funding of research in UK higher educationinstitutions is an area of very considerablecomplexity. Research funding comes from twomain public sources: the research councils andthe funding bodies. Decisions about the researchcouncils are reserved to the UK Government, asare the very substantial amounts of money whichthey disburse. It is hard – surprisingly hard – tofind out where this money goes in territorialterms. Only the Economic and Social ResearchCouncil (ESRC) publishes such information in itsannual report, for example. There is reason tobelieve – as Sir Tim O’Shea, Principal ofEdinburgh University, has from time to timepointed out – that Scotland receives more thanits population share of research funding; he hasclaimed that it gains 12 per cent of total UKresearch council funding, compared with 9 percent of the UK population).26
6.1 The territorial allocation of research funding
Data from Brown and Ramsden suggests asituation that is less reassuring for the devolvedterritories than this claim might suggest. Therelevant tables from the annexe are reproducedbelow, and show the percentages of researchfunds from the main research funders (researchcouncils, charities, industry and commerce andthe EU), and how those are distributedterritorially.
Table 6.1
Research grants and contracts:
research councils
1996/97 1999/2000 2005/06
Actual Adjusted Actual Adjusted Actual Adjusted
England 83.7 82.3 83.5 84.2 83.2 84.0
Wales 2.8 4.2 3.2 3.2 3.2 3.4
Scotland 12.6 12.8 12.4 11.2 12.5 10.2
Northern 1.0 0.7 1.0 1.4 1.0 1.8Ireland
43723 UniUK Devolution 12/11/08 13:04 Page 27
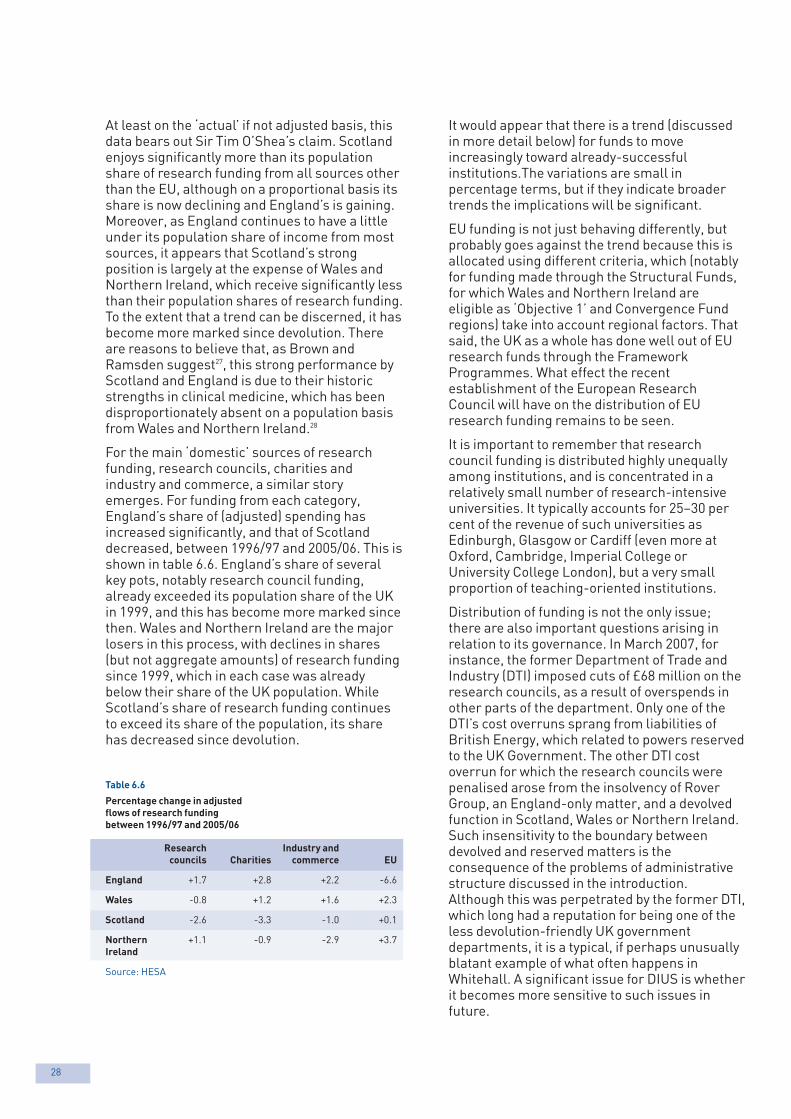
28
It would appear that there is a trend (discussedin more detail below) for funds to moveincreasingly toward already-successfulinstitutions.The variations are small inpercentage terms, but if they indicate broadertrends the implications will be significant.
EU funding is not just behaving differently, butprobably goes against the trend because this isallocated using different criteria, which (notablyfor funding made through the Structural Funds,for which Wales and Northern Ireland areeligible as ‘Objective 1’ and Convergence Fundregions) take into account regional factors. Thatsaid, the UK as a whole has done well out of EUresearch funds through the FrameworkProgrammes. What effect the recentestablishment of the European ResearchCouncil will have on the distribution of EUresearch funding remains to be seen.
It is important to remember that researchcouncil funding is distributed highly unequallyamong institutions, and is concentrated in arelatively small number of research-intensiveuniversities. It typically accounts for 25–30 percent of the revenue of such universities asEdinburgh, Glasgow or Cardiff (even more atOxford, Cambridge, Imperial College orUniversity College London), but a very smallproportion of teaching-oriented institutions.
Distribution of funding is not the only issue;there are also important questions arising inrelation to its governance. In March 2007, forinstance, the former Department of Trade andIndustry (DTI) imposed cuts of £68 million on theresearch councils, as a result of overspends inother parts of the department. Only one of theDTI’s cost overruns sprang from liabilities ofBritish Energy, which related to powers reservedto the UK Government. The other DTI costoverrun for which the research councils werepenalised arose from the insolvency of RoverGroup, an England-only matter, and a devolvedfunction in Scotland, Wales or Northern Ireland.Such insensitivity to the boundary betweendevolved and reserved matters is theconsequence of the problems of administrativestructure discussed in the introduction.Although this was perpetrated by the former DTI,which long had a reputation for being one of theless devolution-friendly UK governmentdepartments, it is a typical, if perhaps unusuallyblatant example of what often happens inWhitehall. A significant issue for DIUS is whetherit becomes more sensitive to such issues infuture.
At least on the ‘actual’ if not adjusted basis, thisdata bears out Sir Tim O’Shea’s claim. Scotlandenjoys significantly more than its populationshare of research funding from all sources otherthan the EU, although on a proportional basis itsshare is now declining and England’s is gaining.Moreover, as England continues to have a littleunder its population share of income from mostsources, it appears that Scotland’s strongposition is largely at the expense of Wales andNorthern Ireland, which receive significantly lessthan their population shares of research funding.To the extent that a trend can be discerned, it hasbecome more marked since devolution. Thereare reasons to believe that, as Brown andRamsden suggest27, this strong performance byScotland and England is due to their historicstrengths in clinical medicine, which has beendisproportionately absent on a population basisfrom Wales and Northern Ireland.28
For the main ‘domestic’ sources of researchfunding, research councils, charities andindustry and commerce, a similar storyemerges. For funding from each category,England’s share of (adjusted) spending hasincreased significantly, and that of Scotlanddecreased, between 1996/97 and 2005/06. This isshown in table 6.6. England’s share of severalkey pots, notably research council funding,already exceeded its population share of the UKin 1999, and this has become more marked sincethen. Wales and Northern Ireland are the majorlosers in this process, with declines in shares(but not aggregate amounts) of research fundingsince 1999, which in each case was alreadybelow their share of the UK population. WhileScotland’s share of research funding continuesto exceed its share of the population, its sharehas decreased since devolution.
Table 6.6
Percentage change in adjusted
flows of research funding
between 1996/97 and 2005/06
Research Industry and
councils Charities commerce EU
England +1.7 +2.8 +2.2 -6.6
Wales -0.8 +1.2 +1.6 +2.3
Scotland -2.6 -3.3 -1.0 +0.1
Northern +1.1 -0.9 -2.9 +3.7Ireland
Source: HESA
43723 UniUK Devolution 12/11/08 13:04 Page 28
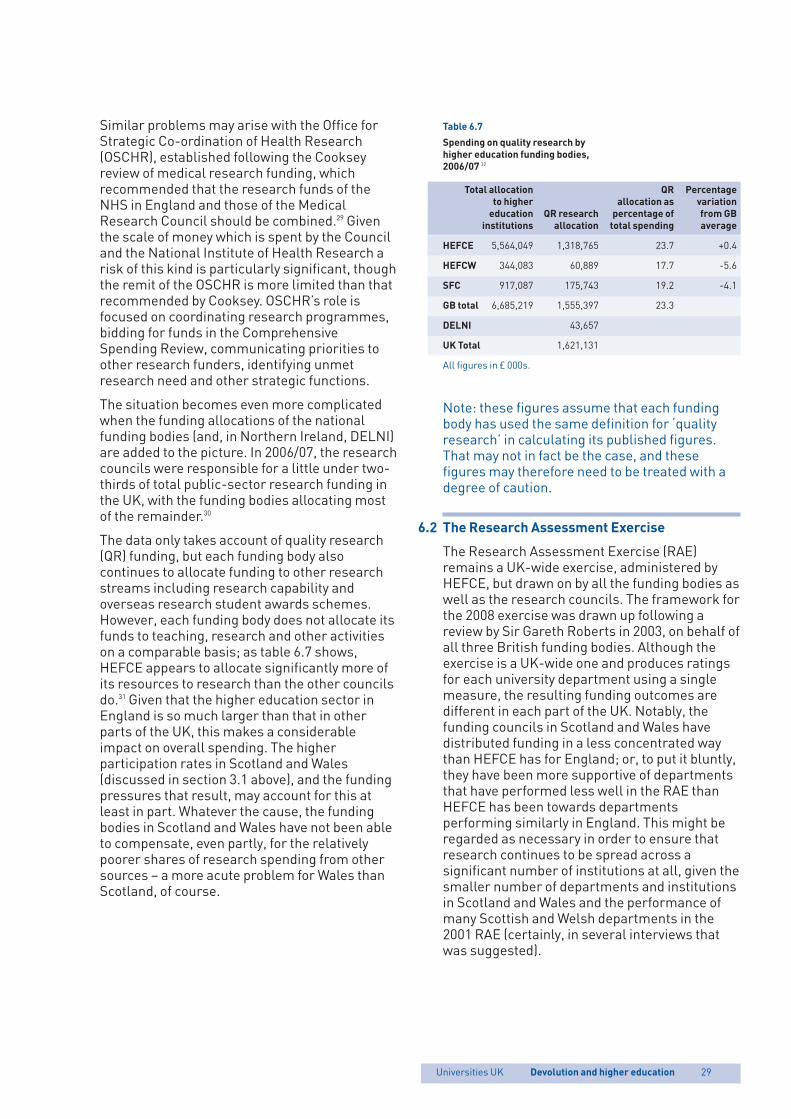
Universities UK Devolution and higher education
Table 6.7
Spending on quality research by
higher education funding bodies,
2006/07 32
Total allocation QR Percentage
to higher allocation as variation
education QR research percentage of from GB
institutions allocation total spending average
HEFCE 5,564,049 1,318,765 23.7 +0.4
HEFCW 344,083 60,889 17.7 -5.6
SFC 917,087 175,743 19.2 -4.1
GB total 6,685,219 1,555,397 23.3
DELNI 43,657
UK Total 1,621,131
All figures in £ 000s.
Note: these figures assume that each fundingbody has used the same definition for ‘qualityresearch’ in calculating its published figures.That may not in fact be the case, and thesefigures may therefore need to be treated with adegree of caution.
6.2 The Research Assessment Exercise
The Research Assessment Exercise (RAE)remains a UK-wide exercise, administered byHEFCE, but drawn on by all the funding bodies aswell as the research councils. The framework forthe 2008 exercise was drawn up following areview by Sir Gareth Roberts in 2003, on behalf ofall three British funding bodies. Although theexercise is a UK-wide one and produces ratingsfor each university department using a singlemeasure, the resulting funding outcomes aredifferent in each part of the UK. Notably, thefunding councils in Scotland and Wales havedistributed funding in a less concentrated waythan HEFCE has for England; or, to put it bluntly,they have been more supportive of departmentsthat have performed less well in the RAE thanHEFCE has been towards departmentsperforming similarly in England. This might beregarded as necessary in order to ensure thatresearch continues to be spread across asignificant number of institutions at all, given thesmaller number of departments and institutionsin Scotland and Wales and the performance ofmany Scottish and Welsh departments in the2001 RAE (certainly, in several interviews thatwas suggested).
Similar problems may arise with the Office forStrategic Co-ordination of Health Research(OSCHR), established following the Cookseyreview of medical research funding, whichrecommended that the research funds of theNHS in England and those of the MedicalResearch Council should be combined.29 Giventhe scale of money which is spent by the Counciland the National Institute of Health Research arisk of this kind is particularly significant, thoughthe remit of the OSCHR is more limited than thatrecommended by Cooksey. OSCHR’s role isfocused on coordinating research programmes,bidding for funds in the ComprehensiveSpending Review, communicating priorities toother research funders, identifying unmetresearch need and other strategic functions.
The situation becomes even more complicatedwhen the funding allocations of the nationalfunding bodies (and, in Northern Ireland, DELNI)are added to the picture. In 2006/07, the researchcouncils were responsible for a little under two-thirds of total public-sector research funding inthe UK, with the funding bodies allocating mostof the remainder.30
The data only takes account of quality research(QR) funding, but each funding body alsocontinues to allocate funding to other researchstreams including research capability andoverseas research student awards schemes.However, each funding body does not allocate itsfunds to teaching, research and other activitieson a comparable basis; as table 6.7 shows,HEFCE appears to allocate significantly more ofits resources to research than the other councilsdo.31 Given that the higher education sector inEngland is so much larger than that in otherparts of the UK, this makes a considerableimpact on overall spending. The higherparticipation rates in Scotland and Wales(discussed in section 3.1 above), and the fundingpressures that result, may account for this atleast in part. Whatever the cause, the fundingbodies in Scotland and Wales have not been ableto compensate, even partly, for the relativelypoorer shares of research spending from othersources – a more acute problem for Wales thanScotland, of course.
29
43723 UniUK Devolution 12/11/08 13:04 Page 29
30
In Scotland, research pooling was initiallyintended to operate in physics, economics, artsand creative design and biological and lifesciences. Other areas have subsequently beenadded including chemistry, civil engineering,plant sciences, ‘systems biology’ – includingsuch areas as bio-informatics and medicalimaging. The Scottish Funding Council’sstrategic research development grants gavethese initiatives financial support, although thisscheme does not exclusively support poolingarrangements.
The research pooling only started in 2003 andhas not been thoroughly evaluated yet. However,even at this early stage it is clear that in physicsat least, the scheme appears to be a success. Ithas greatly expanded research activity, enabledvery high-quality PhD applicants to be selected,and appears to have energised the disciplinemore generally. In other areas, however (such aseconomics), it appears to have had a less markedimpact so far.
Wales has followed a similar path, withcollaborative research an importantrecommendation, within the widerrecommendations of the higher educationstrategy document, Reaching Higher.33 Wales istaking these steps for domestic reasons, not toemulate Scotland. In contrast to Scotland –which has funded networks and collaboration,not institutions – Wales has supportedinstitutional entities, including the merger of theUniversity of Wales College of Medicine intoCardiff University, and setting up the WalesInstitute of Cognitive Neuroscience and theWales Institute of Mathematics andComputational Science. While the impact ofthese initiatives appears to have been moremodest up to 2007 than we have seen inScotland, more rapid progress is now beingmade – though it is too early to judge success.
6.4 The Funders’ Forum
The Funders’ Forum (officially the Research BaseFunders’ Forum) has members from UK-widebodies (government, research councils, charitableand business funders) as well as the highereducation divisions in the Scottish Government,Welsh Assembly Government and Department ofEducation and Learning Northern Ireland and thethree funding bodies. Formerly part of the Office ofScience and Innovation in the Department of Tradeand Industry, it has followed the rest of the(former) OSI to the new Department of Innovation,Universities and Skills (DIUS) following the June2007 reshuffle.
However, on at least one occasion this has putHEFCE in a difficult position. In running the RAE(at least the 2008 exercise), it accepted the policydirection of the then DfES and HM Treasury,following Gordon Brown’s announcement in the2006 budget that the 2008 RAE was to usemetrics-based assessment, rather than theestablished forms of peer assessment. Thisprovoked great protest, not least from thedevolved funding bodies, as it would dramaticallyalter their use of the RAE for their QR allocationsto higher education institutions and academicdepartments. Once again, it would appear thatthe new policy stemmed from a limitedawareness of how a decision connected withpolicy in England would impinge elsewhere, oreven an insensitivity to any such implications.Whatever HEFCE’s own views, it managed tobroker a compromise solution for the 2008 RAE,with the continued use of peer assessment but ashadow exercise based on metrics to runalongside.
The devolved departments and funding bodiesaccepted the compromise, although it was notsomething that they could strongly support, andit took a great deal of work to achieve. Thissituation simply would not have arisen had theChancellor taken into account the UK-widenature of RAE; it is hard not to regard the wholeproblem as an inadvertent mess from adevolution point of view. The incident exemplifiesthe problems that arise from the failure withingovernment at UK level to distinguish carefullybetween England-only and UK- or Great Britain-wide functions.
6.3 Research collaboration in Scotland and Wales
Since 1999 in Scotland and Wales deeper inter-institutional collaboration in research hasdeveloped. The idea behind the researchnetworks that have been formed has been theneed to build research capacity and avoid theproblems arising from relatively smallconcentrations of researchers (and researchequipment and infrastructure) in individualuniversities. Similar sorts of geographicalnetworks exist, at least for certain purposes, inEngland – for instance the White Rose universityconsortium in Yorkshire, or the M25arrangements in the London area.
43723 UniUK Devolution 12/11/08 13:04 Page 30
Universities UK Devolution and higher education
Secondly, research funding remains an area inwhich the UK level emphatically takes the lead, andwhere UK government influence on the devolvedgovernments is profound. This is partly because ofthe sheer size of the research sector in England,but more, as we have seen, because of the impactthat decisions – primarily made about Englishmatters – have for Scotland, Wales and NorthernIreland. This feature is aggravated by the tendencyfor UK departments to move from makingdecisions about ‘English matters’ to UK oneswithout making a clear distinction between the two.Administrative lines are often blurred, in contrastto relatively clear legal divisions between devolvedand non-devolved matters. The advent of DIUS has,if anything, made this blurring worse because itmeans a single department is responsible for(English) funding for higher education institutionsthrough HEFCE, and for (UK-wide) funding ofresearch through research councils. Englishconsiderations therefore impinge on UK-widematters much more than a purely formal or legalanalysis would suggest.
Thirdly, governance arrangements for researchfunding are confused, especially when it comesto funding streams and arrangements where UKand devolved funds are mixed, such as SRIF orthe OSCHR. Much is done through committeeson which the devolved funding bodies ordepartments are represented, but which havelittle decision-making authority. So far thesearrangements appear to have worked well; thedevolved institutions have been happy tocooperate with their English counterparts inthese forums, and appear not to have lost out toany significant degree through such bodies.
There are big question marks, however, aboutwhether such arrangements can continue. Theirworking has depended on substantial political andpolicy consensus between the UK Government anddevolved administrations. With the Labour orLabour-dominated administrations in officebetween 1999 and 2007, this was largely the case.There was sufficient similarity of policy andapproach and sufficient goodwill within the systemthat it was possible to overcome the differencesthat did exist. However, it would be difficult forthese kinds of arrangements to be able to functioneffectively if the politics and ideology of the UK anddevolved governments were markedly different, orif the practical policies applied by eachgovernment regarding higher education differedsignificantly. With the formation of SNP andLabour/Plaid Cymru governments in Scotland andWales after the May 2007 elections, such asituation could well soon materialise.
The devolved departments and funding bodiesvalue belonging to this forum as a way of beinginvolved in research funding and researchpolicymaking, and an important link to otherorganisations with similar interests. Quarterlymeetings also provide an opportunity fornetworking and important discussions often takeplace in the meetings’ margins. However, theforum’s remit is limited; it is essentially for theexchange of information about organisations’respective priorities and funding of research, tocontrol costs, manage overlaps or gaps inresearch, and the like.34 The value of theinvolvement, however, is hard to measure in anydirect sense. It is not a decision-making forum.The devolved departments or funding bodies findit hard to point to tangible outcomes, in whichthey have been able to exercise influence throughthe forum to the benefit of their country or region.Given the nature of the forum it is hard to see howit could work very differently, or that changes todevolved participation could be secured.
6.5 The Science Research Investment Fund (SRIF)
Like the Funders’ Forum, the Science ResearchInvestment Fund (SRIF) was a post- devolutiondevelopment dating from the early 2000s. Itoperated on a UK-wide basis, and wasadministered by DIUS (formerly by OSI in DTI).What was distinctive about it was the way itcombined UK-wide funding with contributionsfrom the funding bodies, as the devolved fundingbodies added to it their own capital funding forresearch infrastructure. SRIF therefore haddiscrete territorial (and indeed institutional)allocations carved out within it, although it was acompetitive programme for which individualinstitutions had to bid to obtain their notionalallocation. Although DIUS handled theadministration, decision-making appeared to bea mixed matter, with decisions about projects inthe devolved territories needing considerationand approval from both the research councilsand the relevant funding body.
6.6 Implications of the way research funding isallocated
There are three important points to make aboutthe way research funding is allocated. First,spending in England is growing while in Scotland,Wales and Northern Ireland it is relativelyshrinking. In comparative terms England ismoving appreciably ahead of the other parts ofthe UK. This is most marked for research fundsunder UK (rather than English) control – notablyspending by the research councils.
31
43723 UniUK Devolution 12/11/08 13:04 Page 31
32
A fourth issue relates to the priorities used inallocating research funding. At present, the UKsources of research funding (notably theresearch councils) are allocated solely on thecriterion of merit. Officials of the (former) OSI,when interviewed, were very proud of this, andregarded it both as a hallmark of the quality of UKresearch and a guarantor that the UK wouldcontinue to undertake high-quality research. Thisis understandable, indeed laudable, as a policyobjective. However, these allocations constitute asignificant use of public monies in themselvesand as such they have a significant economiceffect on the regions and localities where they arespent as well as the UK as a whole. As is shownabove, their overall territorial allocation alreadyon the whole favours England and Scotland, andshows an emergent trend toward England (andaway from Wales and Northern Ireland). A policythat has research excellence as the sole criterionfor their allocation will have the effect, over time,of rewarding the already-successful anddiverting funds away from those who havepotential but who may not have demonstratedsuccess in the past.
The trend of increasing funding for England andless for Scotland or Wales is rather less markedin funding from commerce and industry andcharities, which may be less concerned with themeasures of ‘merit’ applied by the researchcouncils. While HEFCW and DELNI have bothsought to support research capacity, there is alimit to the amount that devolved funding bodiescan spend in this way. The Economic and SocialResearch Council’s recent attempts to assessthe need to develop quantitative methodscapacity in social science in Scotland and Wales,and what that should involve, are notable butrare steps in this direction for a researchcouncil.35
Given the economic impact of researchspending, and the significantly lower GVA ofWales and Northern Ireland than the UKaverage, the question of whether additionalfunds should be made available from UK sourcesto support the development of research capacityin the devolved territories needs to beconsidered. Such funds could take the form of anallocation from the UK to support researchcapacity generally, or specific funds within thebudget of each of the research councils.
43723 UniUK Devolution 12/11/08 13:04 Page 32
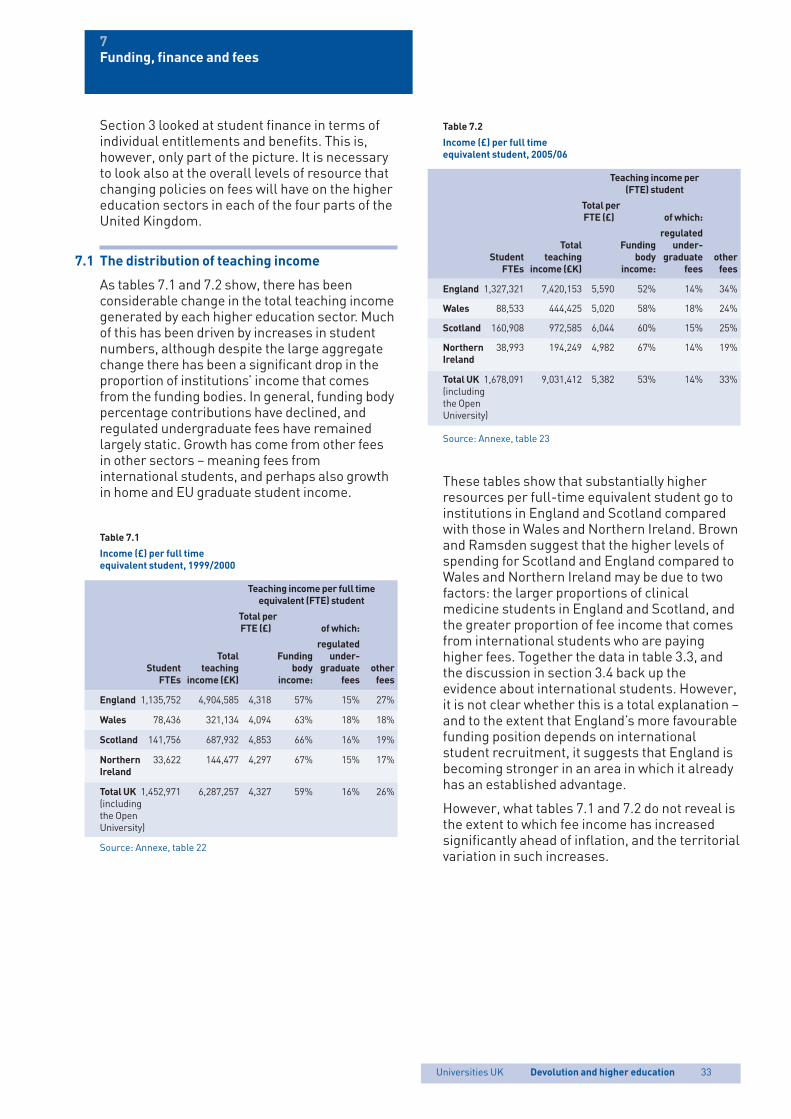
Universities UK Devolution and higher education
Table 7.2
Income (£) per full time
equivalent student, 2005/06
Teaching income per
(FTE) student
Total per
FTE (£) of which:
regulated
Total Funding under-
Student teaching body graduate other
FTEs income (£K) income: fees fees
England 1,327,321 7,420,153 5,590 52% 14% 34%
Wales 88,533 444,425 5,020 58% 18% 24%
Scotland 160,908 972,585 6,044 60% 15% 25%
Northern 38,993 194,249 4,982 67% 14% 19%Ireland
Total UK 1,678,091 9,031,412 5,382 53% 14% 33%(including the Open University)
Source: Annexe, table 23
These tables show that substantially higherresources per full-time equivalent student go toinstitutions in England and Scotland comparedwith those in Wales and Northern Ireland. Brownand Ramsden suggest that the higher levels ofspending for Scotland and England compared toWales and Northern Ireland may be due to twofactors: the larger proportions of clinicalmedicine students in England and Scotland, andthe greater proportion of fee income that comesfrom international students who are payinghigher fees. Together the data in table 3.3, andthe discussion in section 3.4 back up theevidence about international students. However,it is not clear whether this is a total explanation –and to the extent that England’s more favourablefunding position depends on internationalstudent recruitment, it suggests that England isbecoming stronger in an area in which it alreadyhas an established advantage.
However, what tables 7.1 and 7.2 do not reveal isthe extent to which fee income has increasedsignificantly ahead of inflation, and the territorialvariation in such increases.
Section 3 looked at student finance in terms ofindividual entitlements and benefits. This is,however, only part of the picture. It is necessaryto look also at the overall levels of resource thatchanging policies on fees will have on the highereducation sectors in each of the four parts of theUnited Kingdom.
7.1 The distribution of teaching income
As tables 7.1 and 7.2 show, there has beenconsiderable change in the total teaching incomegenerated by each higher education sector. Muchof this has been driven by increases in studentnumbers, although despite the large aggregatechange there has been a significant drop in theproportion of institutions’ income that comesfrom the funding bodies. In general, funding bodypercentage contributions have declined, andregulated undergraduate fees have remainedlargely static. Growth has come from other feesin other sectors – meaning fees frominternational students, and perhaps also growthin home and EU graduate student income.
Table 7.1
Income (£) per full time
equivalent student, 1999/2000
Teaching income per full time
equivalent (FTE) student
Total per
FTE (£) of which:
regulated
Total Funding under-
Student teaching body graduate other
FTEs income (£K) income: fees fees
England 1,135,752 4,904,585 4,318 57% 15% 27%
Wales 78,436 321,134 4,094 63% 18% 18%
Scotland 141,756 687,932 4,853 66% 16% 19%
Northern 33,622 144,477 4,297 67% 15% 17%Ireland
Total UK 1,452,971 6,287,257 4,327 59% 16% 26%(including the Open University)
Source: Annexe, table 22
7Funding, finance and fees
33
43723 UniUK Devolution 12/11/08 13:04 Page 33
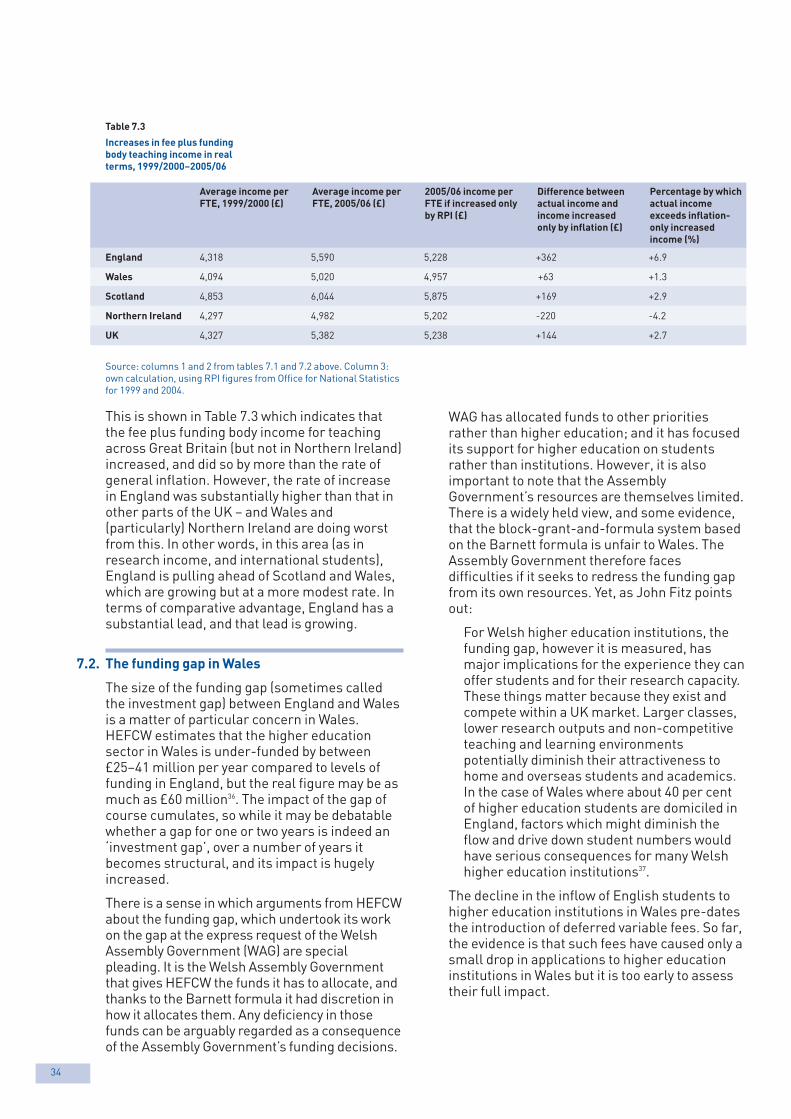
34
WAG has allocated funds to other prioritiesrather than higher education; and it has focusedits support for higher education on studentsrather than institutions. However, it is alsoimportant to note that the AssemblyGovernment’s resources are themselves limited.There is a widely held view, and some evidence,that the block-grant-and-formula system basedon the Barnett formula is unfair to Wales. TheAssembly Government therefore facesdifficulties if it seeks to redress the funding gapfrom its own resources. Yet, as John Fitz pointsout:
For Welsh higher education institutions, thefunding gap, however it is measured, hasmajor implications for the experience they canoffer students and for their research capacity.These things matter because they exist andcompete within a UK market. Larger classes,lower research outputs and non-competitiveteaching and learning environmentspotentially diminish their attractiveness tohome and overseas students and academics.In the case of Wales where about 40 per centof higher education students are domiciled inEngland, factors which might diminish theflow and drive down student numbers wouldhave serious consequences for many Welshhigher education institutions37.
The decline in the inflow of English students tohigher education institutions in Wales pre-datesthe introduction of deferred variable fees. So far,the evidence is that such fees have caused only asmall drop in applications to higher educationinstitutions in Wales but it is too early to assesstheir full impact.
Table 7.3
Increases in fee plus funding
body teaching income in real
terms, 1999/2000–2005/06
Average income per
FTE, 1999/2000 (£)
Average income per
FTE, 2005/06 (£)
2005/06 income per
FTE if increased only
by RPI (£)
Difference between
actual income and
income increased
only by inflation (£)
Percentage by which
actual income
exceeds inflation-
only increased
income (%)
England 4,318 5,590 5,228 +362 +6.9
Wales 4,094 5,020 4,957 +63 +1.3
Scotland 4,853 6,044 5,875 +169 +2.9
Northern Ireland 4,297 4,982 5,202 -220 -4.2
UK 4,327 5,382 5,238 +144 +2.7
Source: columns 1 and 2 from tables 7.1 and 7.2 above. Column 3:own calculation, using RPI figures from Office for National Statisticsfor 1999 and 2004.
This is shown in Table 7.3 which indicates thatthe fee plus funding body income for teachingacross Great Britain (but not in Northern Ireland)increased, and did so by more than the rate ofgeneral inflation. However, the rate of increasein England was substantially higher than that inother parts of the UK – and Wales and(particularly) Northern Ireland are doing worstfrom this. In other words, in this area (as inresearch income, and international students),England is pulling ahead of Scotland and Wales,which are growing but at a more modest rate. Interms of comparative advantage, England has asubstantial lead, and that lead is growing.
7.2. The funding gap in Wales
The size of the funding gap (sometimes calledthe investment gap) between England and Walesis a matter of particular concern in Wales.HEFCW estimates that the higher educationsector in Wales is under-funded by between£25–41 million per year compared to levels offunding in England, but the real figure may be asmuch as £60 million36. The impact of the gap ofcourse cumulates, so while it may be debatablewhether a gap for one or two years is indeed an‘investment gap’, over a number of years itbecomes structural, and its impact is hugelyincreased.
There is a sense in which arguments from HEFCWabout the funding gap, which undertook its workon the gap at the express request of the WelshAssembly Government (WAG) are specialpleading. It is the Welsh Assembly Governmentthat gives HEFCW the funds it has to allocate, andthanks to the Barnett formula it had discretion inhow it allocates them. Any deficiency in thosefunds can be arguably regarded as a consequenceof the Assembly Government’s funding decisions.
43723 UniUK Devolution 12/11/08 13:04 Page 34
Universities UK Devolution and higher education
On one hand, the Scottish Government says itwill continue to fund Scottish universities (andparticularly its research universities) wellenough for them to remain competitive, evenwithout the revenue that it has chosen to forgo byabolishing the graduate endowment.38 It sees thetwo issues, of financial support for highereducation institutions and of reducing the costsof studying in Scotland, as separate, and willmake resources available for each to beadvanced separately. Its view is that the fundingpressures from the UK Government’s approachin England will not be felt until after the nextScottish Spending Review (and election), in2011/12 – although the Education Secretary hasaccepted that it may not be possible to ensurethat Scottish universities remain competitivewith English ones beyond 2010.39
It remains to be seen whether this position willbe sustainable. However, in the short term theScottish Government has not been able to deliveron its promise to ensure that public funds wereused to ensure that universities were well-funded. The budget for 2008/09 proposed by theScottish Government in November 2007 gavehigher education a poor settlement, with highereducation gaining only an extra £30 million ayear (after Universities Scotland had sought£168 million). Subsequently the ScottishGovernment found extra money, eventuallytotalling £20 million. Beyond this it offered a‘concordat’ on funding with universities whichwould end ringfencing of higher educationbudgets, with universities undertaking to achievebroad objectives and outcomes instead. (TheScottish Government had used this approach toreshape its relations with local authorities in late2007 and early in 2008 as well.) It also undertookto make universities the first priority for anyextra funds that became available within itsbudget. Sir Muir Russell, the then Convenor ofUniversities Scotland, was quoted as saying that,‘this goes a very long way to addressing the costpressures the university sector will face in2008/09. It is also an encouraging signal of intentfrom the Scottish Government.’40
Wales already faces serious consequences as aresult of the funding gap. The Welsh AssemblyGovernment will need to meet the continuingcost of the fee grant for Welsh-domiciledstudents studying in Wales and EU students,which will substantially constrain its ability tomake new investment in the sector.
7.3 Fee regimes and the implications of theterritorial distribution of teaching income
The effect of the introduction of deferred variablefees will be to increase substantially theresources available to institutions in Englandcompared with Scotland and, to a lesser extent,with Wales. (In Wales, the fee grant for Welsh-domiciled students studying in Wales will be acharge on public funds and will affect theAssembly Government’s ability to invest inhigher education.) As a result of the fee income,English institutions will become betterresourced, more able to attract better students(particularly at graduate level) and staff, andgenerally more successful. What underlies thisis the UK Government’s decision to fund the feeincome by a mechanism that is outside theBarnett formula. The extra revenues available toinstitutions through fee income provided bypublic loans will not attract any additionalfunding under the Barnett formula. As a resultthe higher education sectors in England (andWales and Northern Ireland if they do not seek oruse powers to opt out of it) will have access toresources that are not available to Scotland. If orwhen the cap on fees is raised or liftedaltogether, the resources flowing into at leastsome English universities will be verysubstantial. There is no reason to believe thatthis was intentional, but it is the effect of thepolicy. The impact might take time to show up,but it will certainly do so in time.
The choices that will be open to policymakers inScotland will be as follows:
p To provide funding for higher education fromits block grants, at the expense of other policyareas such as healthcare or schools. This maynot be electorally attractive – more people usehospitals or schools than attend, or sendchildren to university.
p To introduce deferred variable fees. This ispolitically unattractive and would conflict withScottish priorities to widen participation.
p To maintain higher education spending at itspresent levels, which will mean the relativedecline of that territory’s higher educationinstitutions compared with other parts of theUK.
None of these options is particularly attractive.So far, thanks to the fact that these are trendsand the relative amounts of money are stilllimited, the impact of this has been limited. Butalready one can see the strains that arise fromtrying to fund higher education from the devolvedadministrations’ limited resources.
35
43723 UniUK Devolution 12/11/08 13:04 Page 35
36
The problems are already perceptible, and theevidence suggests that they will only bemagnified as time passes. Given the size ofEngland, and its pursuit of a policy based onstratification among institutions and competitionbetween them, other devolved administrationsall face a similar challenge.41
The difficulties also reflect the consequences oftwo characteristics of policymaking in Whitehallgenerally (not just relating to higher education).First, such policymaking is driven by relativelyshort-term political pressures, even when thepolicies under consideration will have long-termeffects. The constitutional and policyimplications of devolution are at best asecondary consideration in that process, and areoften merely an afterthought. Second,policymaking at working level often pays limitedattention to devolution issues, and officials (letalone politicians) can be insensitive to theimplications of devolution, and the impact theirdecisions can have on the devolvedadministrations. If the institutional frameworkensured that such issues were built intopolicymaking, this might be less of an issue; butthe attenuated nature of the institutionalarrangements, the lack of formal or high-levelliaison between administrations, and thereliance on day-to-day practice and ad hoccontacts instead make this much harder toachieve.
43723 UniUK Devolution 12/11/08 13:04 Page 36
Universities UK Devolution and higher education
p The four UK administrations’ efforts to widenparticipation have met with only limitedsuccess despite differences in approach.Participation in higher education across theUK has expanded at a largely even rate, andexisting differences in participation rates haveremained in place.
p The institutional framework for discussingand resolving interactions between devolvedand non-devolved policy, or the impact ofpolicy in England on Scotland, Wales orNorthern Ireland, remains attenuated andunderdeveloped. Liaison is often informal, orhandled through committees founded on anassumed consensus that may no longer exist.The result is that devolved concerns are oftenconsidered late in the UK government’spolicymaking process, in ways which lead tothem being given relatively little weight, andsometimes not at all. Higher education is notalone in enduring this and the system was notdesigned to cope with the sorts of politicaldifferences that have now emerged, and willbecome greater as time goes by.
p Resolving these issues will not bestraightforward, but the following might besteps toward a more structured approach tothe conduct of intergovernmental relations,which would imply:
p Periodic meetings of ministers responsiblefor higher education from the fourgovernments, to ensure each governmentunderstood each other’s political positionand policies, and provide a means foridentifying and resolving differences whichneed action at ministerial level.
p Similar meetings of senior officials(certainly at the equivalent of director levelin DIUS, perhaps even at director generallevel), to resolve more technical andadministrative issues, and prepare forministerial meetings.
p Adequate arrangements for more routinecoordination at official level that ensureeach government is aware of each others’possible initiatives and takes account oftheir implications, rather than relying oninformal liaison or ad hoc coordination.
The key conclusions of this report are that:
p Although there appears to be a clear divisionof competences in higher education betweenthe UK and devolved authorities, this is muchless clear in practice. This is because of theway in which two factors affect the devolvedadministrations: first, the interaction betweendevolved aspects of higher education(teaching, institutions, and QR funding) andreserved ones (research councils), andsecondly, the impact of policy decisions madefor England. Decisions made at UK level(whether for England only or forreserved/non-devolved matters across theUK) will have a profound impact on thedevolved administrations in the medium term,even if that is not apparent at the moment.
p Despite this, devolution gives the devolvedadministrations very considerable scope todepart from UK policies or frameworks. Sofar, they have used those powers surprisinglylittle – even the Scottish decision to set up thegraduate endowment and not to have deferredvariable fees differed from the policy forEngland more in detail than in overallstructure. (The implications of the abolition ofthe graduate endowment are wider, but notyet clear.) The constraints on the use of thesepowers are practical or political: thedifficulties of doing something different toEngland, possible implications (departingfrom the gold standard of British universitydegrees), and external factors (such as theBologna process). How long these constraintswill continue is an open question, especially ifthe UK/English standard either loses itslustre, or becomes unaffordable for thedevolved administrations.
p A clear trend is already visible, with the highereducation sector in England becoming largerand better funded than that in Scotland, Walesor Northern Ireland. Although highereducation is growing in all four parts of theUnited Kingdom, England is starting to movemarkedly ahead in key areas, includingresearch funding, student numbers andinternational student income.
p England’s advantages are likely to becomemore marked, especially if the fee cap is lifted.
8Conclusions and recommendations
37
43723 UniUK Devolution 12/11/08 13:04 Page 37
38
p It is beyond the scope of this report torecommend operational ways to resolve theseproblems. Structural steps are needed, as theproblems are considerable and tackling themwill require considerable ingenuity andimagination, as well patience and goodwill.However, there are two approaches which maybe worth consideration:
p Funding for higher education should beallocated to the devolved administrations(and within UK Government) on a basis thateither recognises levels of territorial need,or delivers equivalent funding on a percapita basis. This would take into accountthe extra resources higher educationreceives in England, which attract noadditional funding under the Barnettformula. Such a grant would need to beunconditional so that (as with the presentsystem of funding) the devolvedadministrations could allocate it as theysaw fit. But even on such a basis, therewould be greater public expectation thathigher education would receive thatfunding, and it would therefore create amore level playing field.
p There should be funds at UK level tosupport the development of researchcapacity in the four countries. Initiatives byother funding bodies similar to that alreadyundertaken by the Economic and SocialResearch Council (the most devolution-sensitive of the research councils) would bea first step.
p Greater clarity within the UK Governmentabout the difference between devolved andnon-devolved matters, and attempts toseparate the two in organisational terms orat least ensure that officials were consciousof the territorial implications of policyinitiatives at a very early stage. Even in abenign political climate, the presentarrangements have caused serious politicaland practical problems on a number ofoccasions. That climate is now much lessbenign, and the extent to which ‘English’concerns have taken over UK-wide mattersmay aggravate this.
p Recognition that, in higher education morethan in many other sectors, the interactionof finance systems (both as regards studentfinance and research funding) createsserious anomalies. This is likely to result inthe UK’s most successful universities beingin England with all the economic benefitsthat will bring, which risks undermining anysense that higher education is a public goodthat governments have collectively soughtto distribute across the whole of the UK inan equitable way. The main driver here isthe revenue stream that comes withdeferred flexible fees, but also becauseresearch funding is increasingly allocatedto the already-successful. What makessense in policy terms in this sector maytherefore undermine broader politicalobjectives – of which politicians need to beaware in formulating policy.
43723 UniUK Devolution 12/11/08 13:04 Page 38
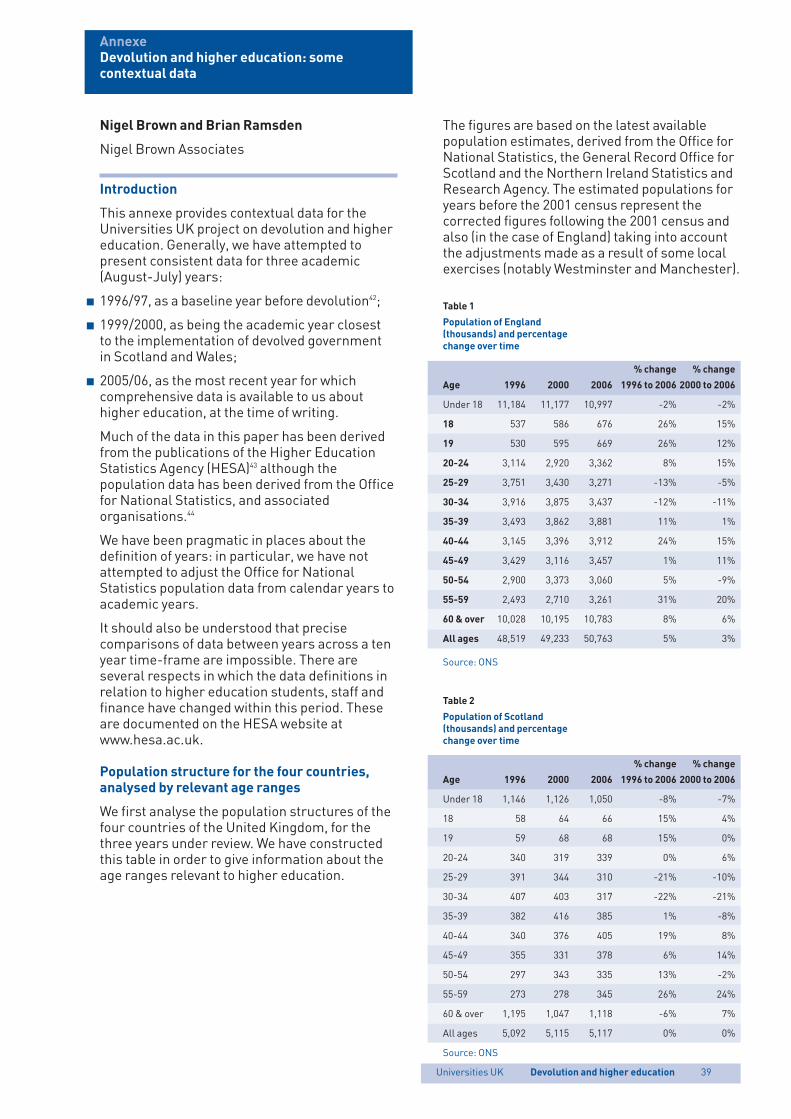
Nigel Brown and Brian Ramsden
Nigel Brown Associates
Introduction
This annexe provides contextual data for theUniversities UK project on devolution and highereducation. Generally, we have attempted topresent consistent data for three academic(August-July) years:
p 1996/97, as a baseline year before devolution42;
p 1999/2000, as being the academic year closestto the implementation of devolved governmentin Scotland and Wales;
p 2005/06, as the most recent year for whichcomprehensive data is available to us abouthigher education, at the time of writing.
Much of the data in this paper has been derivedfrom the publications of the Higher EducationStatistics Agency (HESA)43 although thepopulation data has been derived from the Officefor National Statistics, and associatedorganisations.44
We have been pragmatic in places about thedefinition of years: in particular, we have notattempted to adjust the Office for NationalStatistics population data from calendar years toacademic years.
It should also be understood that precisecomparisons of data between years across a tenyear time-frame are impossible. There areseveral respects in which the data definitions inrelation to higher education students, staff andfinance have changed within this period. Theseare documented on the HESA website atwww.hesa.ac.uk.
Population structure for the four countries,analysed by relevant age ranges
We first analyse the population structures of thefour countries of the United Kingdom, for thethree years under review. We have constructedthis table in order to give information about theage ranges relevant to higher education.
Universities UK Devolution and higher education
AnnexeDevolution and higher education: somecontextual data
39
The figures are based on the latest availablepopulation estimates, derived from the Office forNational Statistics, the General Record Office forScotland and the Northern Ireland Statistics andResearch Agency. The estimated populations foryears before the 2001 census represent thecorrected figures following the 2001 census andalso (in the case of England) taking into accountthe adjustments made as a result of some localexercises (notably Westminster and Manchester).
Table 1
Population of England
(thousands) and percentage
change over time
% change % change
Age 1996 2000 2006 1996 to 2006 2000 to 2006
Under 18 11,184 11,177 10,997 -2% -2%
18 537 586 676 26% 15%
19 530 595 669 26% 12%
20-24 3,114 2,920 3,362 8% 15%
25-29 3,751 3,430 3,271 -13% -5%
30-34 3,916 3,875 3,437 -12% -11%
35-39 3,493 3,862 3,881 11% 1%
40-44 3,145 3,396 3,912 24% 15%
45-49 3,429 3,116 3,457 1% 11%
50-54 2,900 3,373 3,060 5% -9%
55-59 2,493 2,710 3,261 31% 20%
60 & over 10,028 10,195 10,783 8% 6%
All ages 48,519 49,233 50,763 5% 3%
Source: ONS
Table 2
Population of Scotland
(thousands) and percentage
change over time
% change % change
Age 1996 2000 2006 1996 to 2006 2000 to 2006
Under 18 1,146 1,126 1,050 -8% -7%
18 58 64 66 15% 4%
19 59 68 68 15% 0%
20-24 340 319 339 0% 6%
25-29 391 344 310 -21% -10%
30-34 407 403 317 -22% -21%
35-39 382 416 385 1% -8%
40-44 340 376 405 19% 8%
45-49 355 331 378 6% 14%
50-54 297 343 335 13% -2%
55-59 273 278 345 26% 24%
60 & over 1,195 1,047 1,118 -6% 7%
All ages 5,092 5,115 5,117 0% 0%
Source: ONS
43723 UniUK Devolution 12/11/08 13:04 Page 39
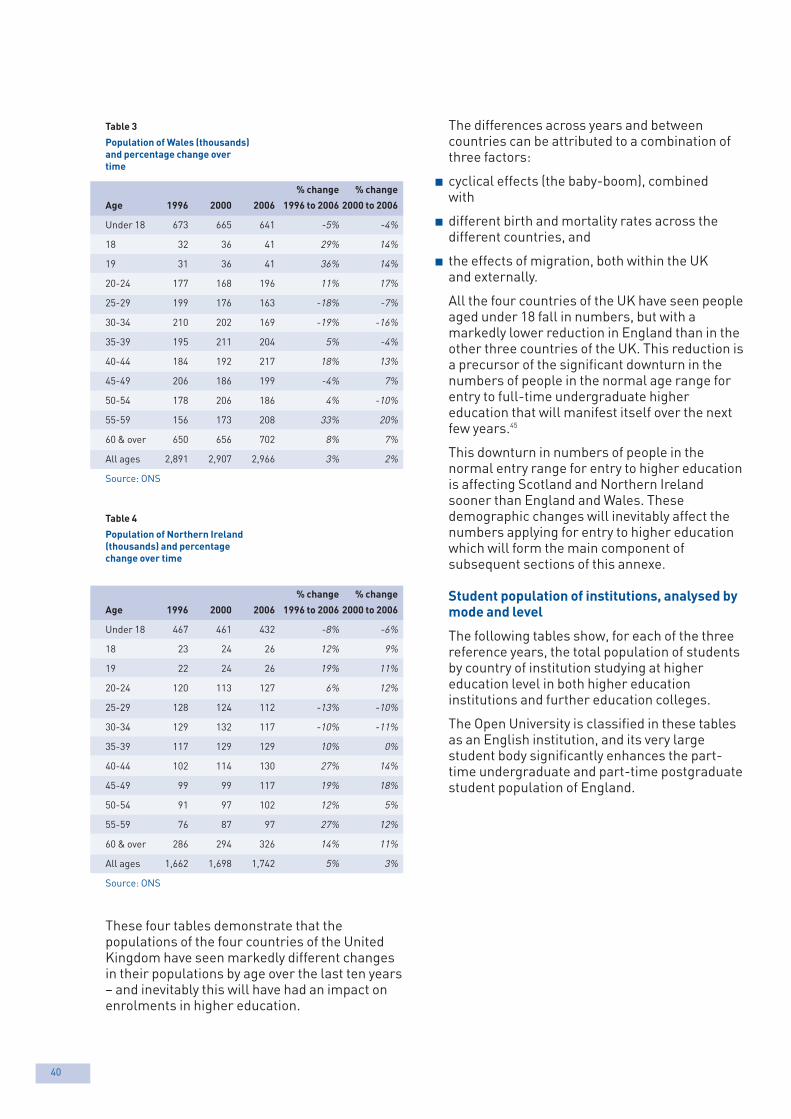
Table 3
Population of Wales (thousands)
and percentage change over
time
% change % change
Age 1996 2000 2006 1996 to 2006 2000 to 2006
Under 18 673 665 641 -5% -4%
18 32 36 41 29% 14%
19 31 36 41 36% 14%
20-24 177 168 196 11% 17%
25-29 199 176 163 -18% -7%
30-34 210 202 169 -19% -16%
35-39 195 211 204 5% -4%
40-44 184 192 217 18% 13%
45-49 206 186 199 -4% 7%
50-54 178 206 186 4% -10%
55-59 156 173 208 33% 20%
60 & over 650 656 702 8% 7%
All ages 2,891 2,907 2,966 3% 2%
Source: ONS
Table 4
Population of Northern Ireland
(thousands) and percentage
change over time
% change % change
Age 1996 2000 2006 1996 to 2006 2000 to 2006
Under 18 467 461 432 -8% -6%
18 23 24 26 12% 9%
19 22 24 26 19% 11%
20-24 120 113 127 6% 12%
25-29 128 124 112 -13% -10%
30-34 129 132 117 -10% -11%
35-39 117 129 129 10% 0%
40-44 102 114 130 27% 14%
45-49 99 99 117 19% 18%
50-54 91 97 102 12% 5%
55-59 76 87 97 27% 12%
60 & over 286 294 326 14% 11%
All ages 1,662 1,698 1,742 5% 3%
Source: ONS
These four tables demonstrate that thepopulations of the four countries of the UnitedKingdom have seen markedly different changesin their populations by age over the last ten years– and inevitably this will have had an impact onenrolments in higher education.
40
The differences across years and betweencountries can be attributed to a combination ofthree factors:
p cyclical effects (the baby-boom), combinedwith
p different birth and mortality rates across thedifferent countries, and
p the effects of migration, both within the UKand externally.
All the four countries of the UK have seen peopleaged under 18 fall in numbers, but with amarkedly lower reduction in England than in theother three countries of the UK. This reduction isa precursor of the significant downturn in thenumbers of people in the normal age range forentry to full-time undergraduate highereducation that will manifest itself over the nextfew years.45
This downturn in numbers of people in thenormal entry range for entry to higher educationis affecting Scotland and Northern Irelandsooner than England and Wales. Thesedemographic changes will inevitably affect thenumbers applying for entry to higher educationwhich will form the main component ofsubsequent sections of this annexe.
Student population of institutions, analysed bymode and level
The following tables show, for each of the threereference years, the total population of studentsby country of institution studying at highereducation level in both higher educationinstitutions and further education colleges.
The Open University is classified in these tablesas an English institution, and its very largestudent body significantly enhances the part-time undergraduate and part-time postgraduatestudent population of England.
43723 UniUK Devolution 12/11/08 13:04 Page 40
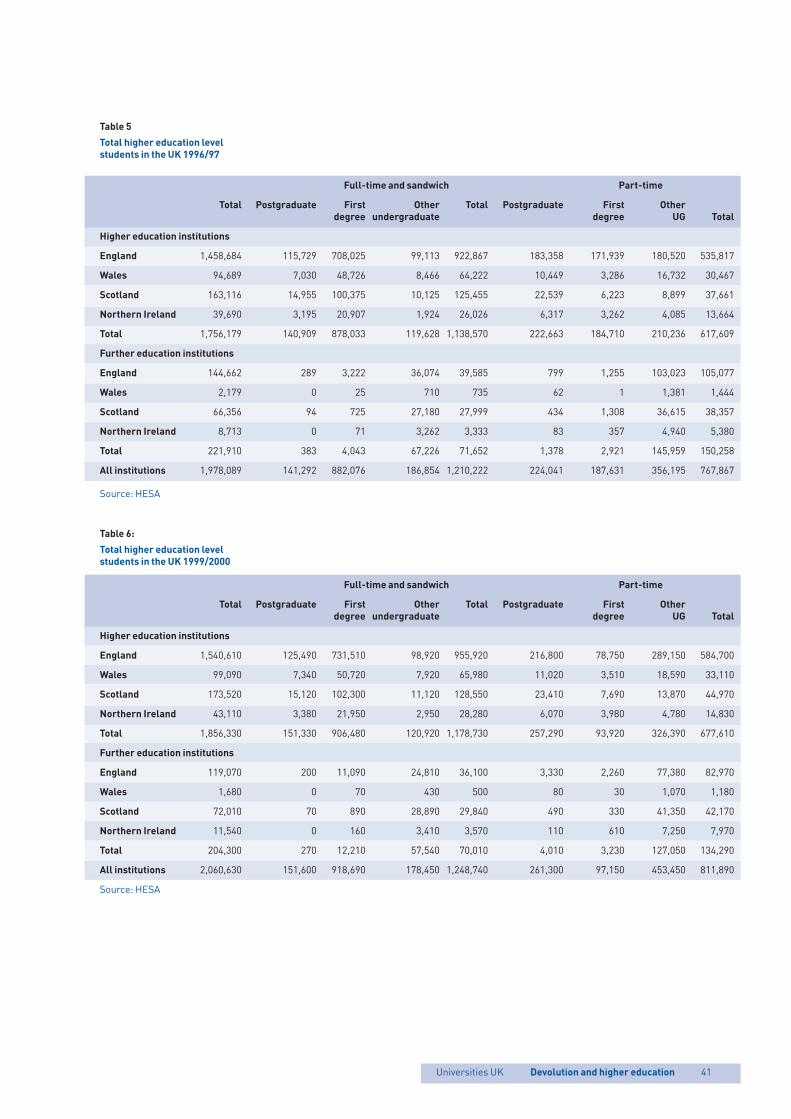
Universities UK Devolution and higher education
Table 5
Total higher education level
students in the UK 1996/97
41
Full-time and sandwich Part-time
Total Postgraduate First Other Total Postgraduate First Other
degree undergraduate degree UG Total
Higher education institutions
England 1,458,684 115,729 708,025 99,113 922,867 183,358 171,939 180,520 535,817
Wales 94,689 7,030 48,726 8,466 64,222 10,449 3,286 16,732 30,467
Scotland 163,116 14,955 100,375 10,125 125,455 22,539 6,223 8,899 37,661
Northern Ireland 39,690 3,195 20,907 1,924 26,026 6,317 3,262 4,085 13,664
Total 1,756,179 140,909 878,033 119,628 1,138,570 222,663 184,710 210,236 617,609
Further education institutions
England 144,662 289 3,222 36,074 39,585 799 1,255 103,023 105,077
Wales 2,179 0 25 710 735 62 1 1,381 1,444
Scotland 66,356 94 725 27,180 27,999 434 1,308 36,615 38,357
Northern Ireland 8,713 0 71 3,262 3,333 83 357 4,940 5,380
Total 221,910 383 4,043 67,226 71,652 1,378 2,921 145,959 150,258
All institutions 1,978,089 141,292 882,076 186,854 1,210,222 224,041 187,631 356,195 767,867
Source: HESA
Table 6:
Total higher education level
students in the UK 1999/2000
Full-time and sandwich Part-time
Total Postgraduate First Other Total Postgraduate First Other
degree undergraduate degree UG Total
Higher education institutions
England 1,540,610 125,490 731,510 98,920 955,920 216,800 78,750 289,150 584,700
Wales 99,090 7,340 50,720 7,920 65,980 11,020 3,510 18,590 33,110
Scotland 173,520 15,120 102,300 11,120 128,550 23,410 7,690 13,870 44,970
Northern Ireland 43,110 3,380 21,950 2,950 28,280 6,070 3,980 4,780 14,830
Total 1,856,330 151,330 906,480 120,920 1,178,730 257,290 93,920 326,390 677,610
Further education institutions
England 119,070 200 11,090 24,810 36,100 3,330 2,260 77,380 82,970
Wales 1,680 0 70 430 500 80 30 1,070 1,180
Scotland 72,010 70 890 28,890 29,840 490 330 41,350 42,170
Northern Ireland 11,540 0 160 3,410 3,570 110 610 7,250 7,970
Total 204,300 270 12,210 57,540 70,010 4,010 3,230 127,050 134,290
All institutions 2,060,630 151,600 918,690 178,450 1,248,740 261,300 97,150 453,450 811,890
Source: HESA
43723 UniUK Devolution 12/11/08 13:04 Page 41
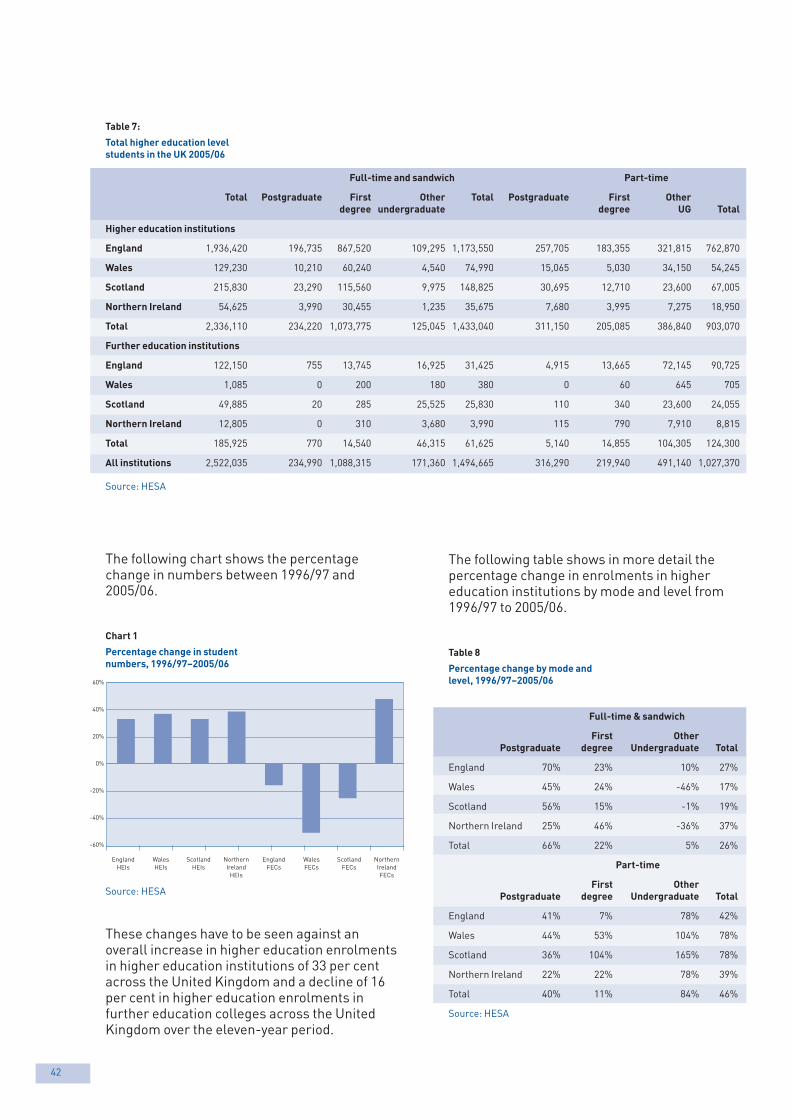
42
The following table shows in more detail thepercentage change in enrolments in highereducation institutions by mode and level from1996/97 to 2005/06.
Table 8
Percentage change by mode and
level, 1996/97–2005/06
Full-time & sandwich
First Other
Postgraduate degree Undergraduate Total
England 70% 23% 10% 27%
Wales 45% 24% -46% 17%
Scotland 56% 15% -1% 19%
Northern Ireland 25% 46% -36% 37%
Total 66% 22% 5% 26%
Part-time
First Other
Postgraduate degree Undergraduate Total
England 41% 7% 78% 42%
Wales 44% 53% 104% 78%
Scotland 36% 104% 165% 78%
Northern Ireland 22% 22% 78% 39%
Total 40% 11% 84% 46%
Source: HESA
Table 7:
Total higher education level
students in the UK 2005/06
Full-time and sandwich Part-time
Total Postgraduate First Other Total Postgraduate First Other
degree undergraduate degree UG Total
Higher education institutions
England 1,936,420 196,735 867,520 109,295 1,173,550 257,705 183,355 321,815 762,870
Wales 129,230 10,210 60,240 4,540 74,990 15,065 5,030 34,150 54,245
Scotland 215,830 23,290 115,560 9,975 148,825 30,695 12,710 23,600 67,005
Northern Ireland 54,625 3,990 30,455 1,235 35,675 7,680 3,995 7,275 18,950
Total 2,336,110 234,220 1,073,775 125,045 1,433,040 311,150 205,085 386,840 903,070
Further education institutions
England 122,150 755 13,745 16,925 31,425 4,915 13,665 72,145 90,725
Wales 1,085 0 200 180 380 0 60 645 705
Scotland 49,885 20 285 25,525 25,830 110 340 23,600 24,055
Northern Ireland 12,805 0 310 3,680 3,990 115 790 7,910 8,815
Total 185,925 770 14,540 46,315 61,625 5,140 14,855 104,305 124,300
All institutions 2,522,035 234,990 1,088,315 171,360 1,494,665 316,290 219,940 491,140 1,027,370
Source: HESA
The following chart shows the percentagechange in numbers between 1996/97 and2005/06.
Chart 1
Percentage change in student
numbers, 1996/97–2005/06
Source: HESA
These changes have to be seen against anoverall increase in higher education enrolmentsin higher education institutions of 33 per centacross the United Kingdom and a decline of 16per cent in higher education enrolments infurther education colleges across the UnitedKingdom over the eleven-year period.
60%
40%
20%
0%
-20%
-40%
-60%
EnglandHEIs
WalesHEIs
ScotlandHEIs
NorthernIrelandHEIs
EnglandFECs
WalesFECs
ScotlandFECs
NorthernIrelandFECs
43723 UniUK Devolution 12/11/08 13:04 Page 42
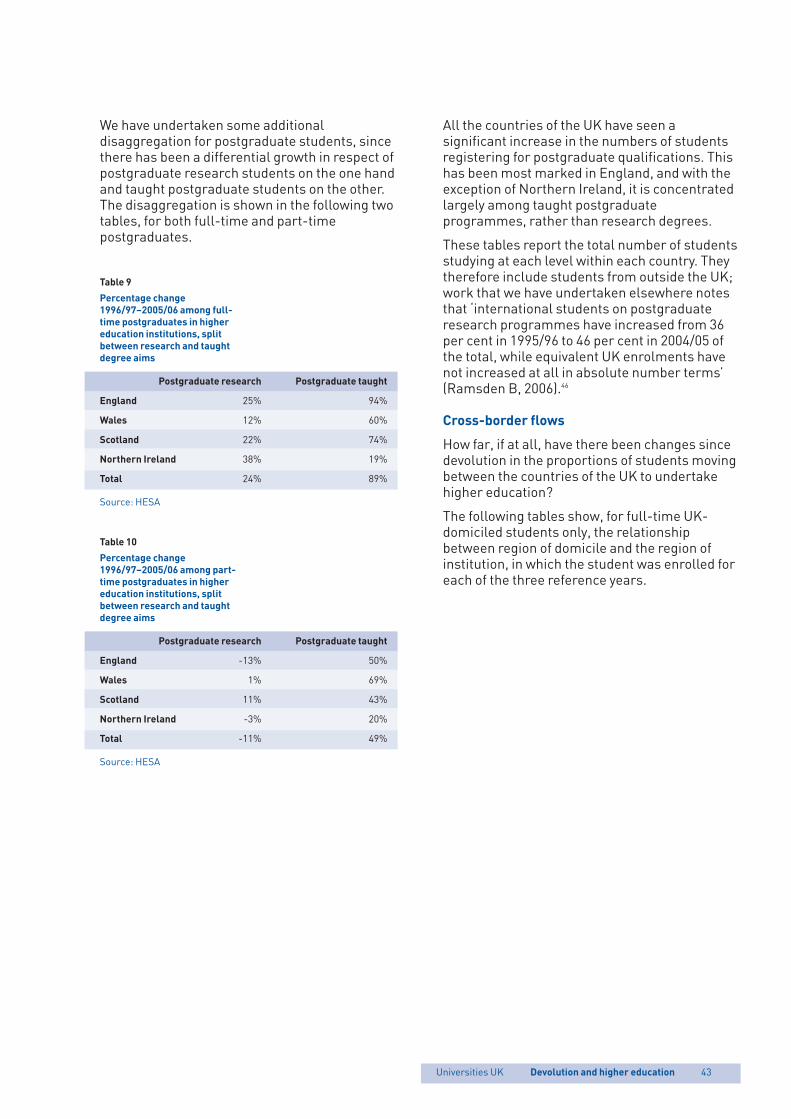
Universities UK Devolution and higher education
All the countries of the UK have seen asignificant increase in the numbers of studentsregistering for postgraduate qualifications. Thishas been most marked in England, and with theexception of Northern Ireland, it is concentratedlargely among taught postgraduateprogrammes, rather than research degrees.
These tables report the total number of studentsstudying at each level within each country. Theytherefore include students from outside the UK;work that we have undertaken elsewhere notesthat ‘international students on postgraduateresearch programmes have increased from 36per cent in 1995/96 to 46 per cent in 2004/05 ofthe total, while equivalent UK enrolments havenot increased at all in absolute number terms’(Ramsden B, 2006).46
Cross-border flows
How far, if at all, have there been changes sincedevolution in the proportions of students movingbetween the countries of the UK to undertakehigher education?
The following tables show, for full-time UK-domiciled students only, the relationshipbetween region of domicile and the region ofinstitution, in which the student was enrolled foreach of the three reference years.
43
We have undertaken some additionaldisaggregation for postgraduate students, sincethere has been a differential growth in respect ofpostgraduate research students on the one handand taught postgraduate students on the other.The disaggregation is shown in the following twotables, for both full-time and part-timepostgraduates.
Table 9
Percentage change
1996/97–2005/06 among full-
time postgraduates in higher
education institutions, split
between research and taught
degree aims
Postgraduate research Postgraduate taught
England 25% 94%
Wales 12% 60%
Scotland 22% 74%
Northern Ireland 38% 19%
Total 24% 89%
Source: HESA
Table 10
Percentage change
1996/97–2005/06 among part-
time postgraduates in higher
education institutions, split
between research and taught
degree aims
Postgraduate research Postgraduate taught
England -13% 50%
Wales 1% 69%
Scotland 11% 43%
Northern Ireland -3% 20%
Total -11% 49%
Source: HESA
43723 UniUK Devolution 12/11/08 13:04 Page 43
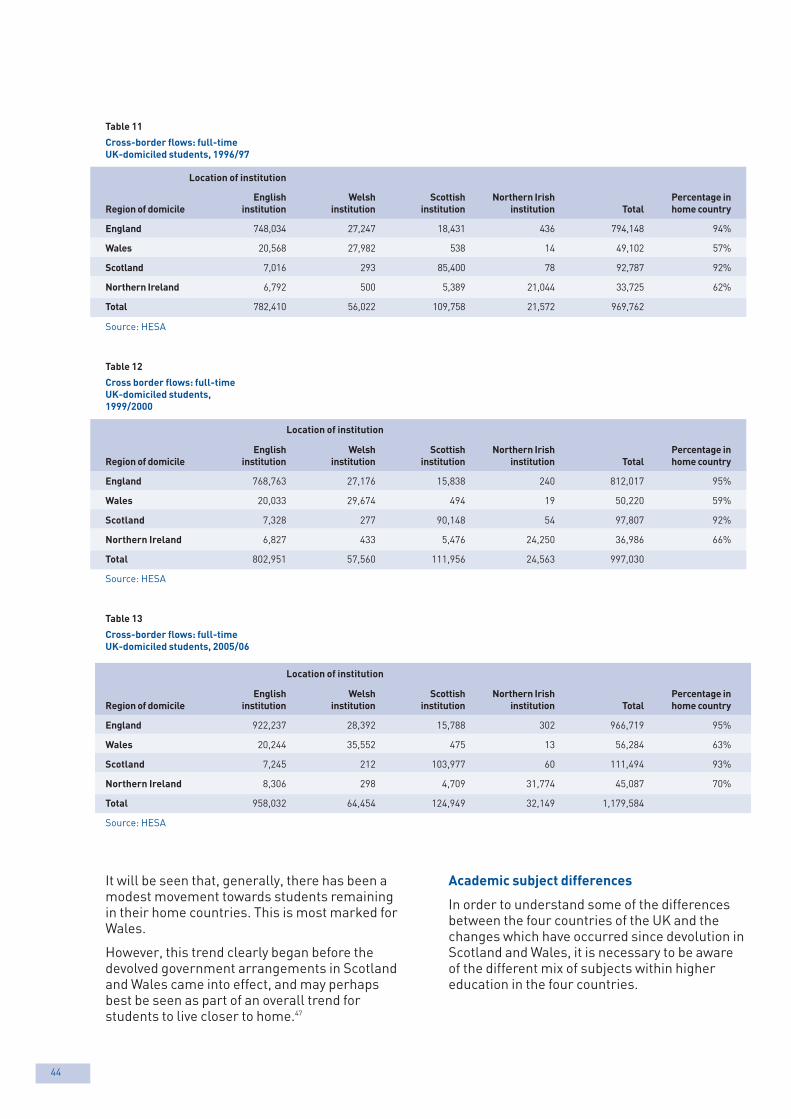
44
Academic subject differences
In order to understand some of the differencesbetween the four countries of the UK and thechanges which have occurred since devolution inScotland and Wales, it is necessary to be awareof the different mix of subjects within highereducation in the four countries.
It will be seen that, generally, there has been amodest movement towards students remainingin their home countries. This is most marked forWales.
However, this trend clearly began before thedevolved government arrangements in Scotlandand Wales came into effect, and may perhapsbest be seen as part of an overall trend forstudents to live closer to home.47
Table 11
Cross-border flows: full-time
UK-domiciled students, 1996/97
Location of institution
English Welsh Scottish Northern Irish Percentage in
Region of domicile institution institution institution institution Total home country
England 748,034 27,247 18,431 436 794,148 94%
Wales 20,568 27,982 538 14 49,102 57%
Scotland 7,016 293 85,400 78 92,787 92%
Northern Ireland 6,792 500 5,389 21,044 33,725 62%
Total 782,410 56,022 109,758 21,572 969,762
Source: HESA
Table 12
Cross border flows: full-time
UK-domiciled students,
1999/2000
Location of institution
English Welsh Scottish Northern Irish Percentage in
Region of domicile institution institution institution institution Total home country
England 768,763 27,176 15,838 240 812,017 95%
Wales 20,033 29,674 494 19 50,220 59%
Scotland 7,328 277 90,148 54 97,807 92%
Northern Ireland 6,827 433 5,476 24,250 36,986 66%
Total 802,951 57,560 111,956 24,563 997,030
Source: HESA
Table 13
Cross-border flows: full-time
UK-domiciled students, 2005/06
Location of institution
English Welsh Scottish Northern Irish Percentage in
Region of domicile institution institution institution institution Total home country
England 922,237 28,392 15,788 302 966,719 95%
Wales 20,244 35,552 475 13 56,284 63%
Scotland 7,245 212 103,977 60 111,494 93%
Northern Ireland 8,306 298 4,709 31,774 45,087 70%
Total 958,032 64,454 124,949 32,149 1,179,584
Source: HESA
43723 UniUK Devolution 12/11/08 13:04 Page 44
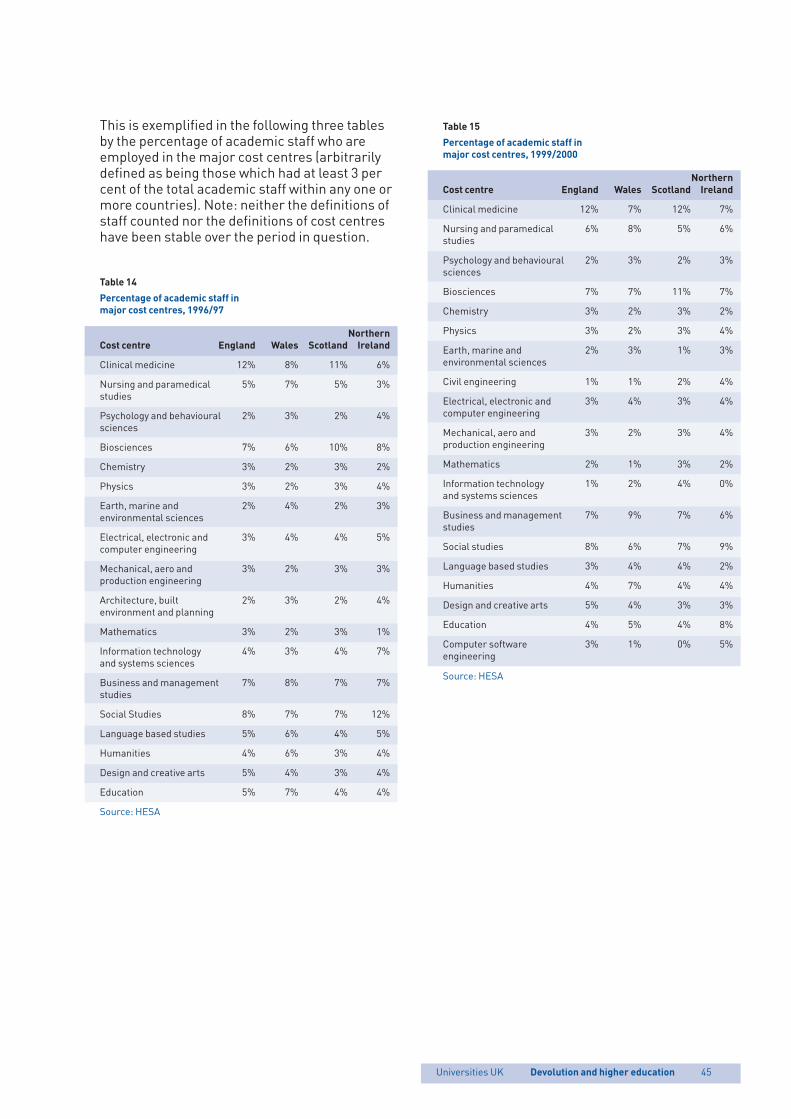
Universities UK Devolution and higher education
Table 15
Percentage of academic staff in
major cost centres, 1999/2000
Northern
Cost centre England Wales Scotland Ireland
Clinical medicine 12% 7% 12% 7%
Nursing and paramedical 6% 8% 5% 6%studies
Psychology and behavioural 2% 3% 2% 3%sciences
Biosciences 7% 7% 11% 7%
Chemistry 3% 2% 3% 2%
Physics 3% 2% 3% 4%
Earth, marine and 2% 3% 1% 3%environmental sciences
Civil engineering 1% 1% 2% 4%
Electrical, electronic and 3% 4% 3% 4%computer engineering
Mechanical, aero and 3% 2% 3% 4%production engineering
Mathematics 2% 1% 3% 2%
Information technology 1% 2% 4% 0%and systems sciences
Business and management 7% 9% 7% 6%studies
Social studies 8% 6% 7% 9%
Language based studies 3% 4% 4% 2%
Humanities 4% 7% 4% 4%
Design and creative arts 5% 4% 3% 3%
Education 4% 5% 4% 8%
Computer software 3% 1% 0% 5%engineering
Source: HESA
This is exemplified in the following three tablesby the percentage of academic staff who areemployed in the major cost centres (arbitrarilydefined as being those which had at least 3 percent of the total academic staff within any one ormore countries). Note: neither the definitions ofstaff counted nor the definitions of cost centreshave been stable over the period in question.
Table 14
Percentage of academic staff in
major cost centres, 1996/97
Northern
Cost centre England Wales Scotland Ireland
Clinical medicine 12% 8% 11% 6%
Nursing and paramedical 5% 7% 5% 3%studies
Psychology and behavioural 2% 3% 2% 4%sciences
Biosciences 7% 6% 10% 8%
Chemistry 3% 2% 3% 2%
Physics 3% 2% 3% 4%
Earth, marine and 2% 4% 2% 3%environmental sciences
Electrical, electronic and 3% 4% 4% 5%computer engineering
Mechanical, aero and 3% 2% 3% 3%production engineering
Architecture, built 2% 3% 2% 4%environment and planning
Mathematics 3% 2% 3% 1%
Information technology 4% 3% 4% 7%and systems sciences
Business and management 7% 8% 7% 7%studies
Social Studies 8% 7% 7% 12%
Language based studies 5% 6% 4% 5%
Humanities 4% 6% 3% 4%
Design and creative arts 5% 4% 3% 4%
Education 5% 7% 4% 4%
Source: HESA
45
43723 UniUK Devolution 12/11/08 13:04 Page 45
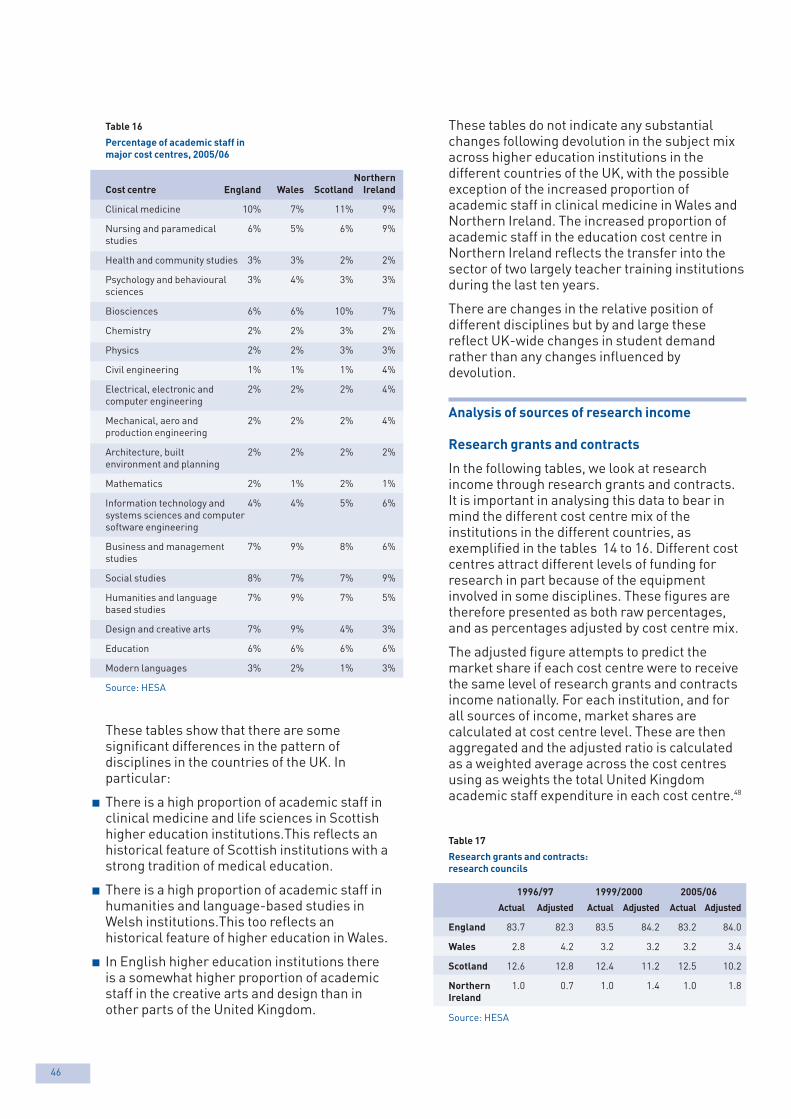
46
These tables do not indicate any substantialchanges following devolution in the subject mixacross higher education institutions in thedifferent countries of the UK, with the possibleexception of the increased proportion ofacademic staff in clinical medicine in Wales andNorthern Ireland. The increased proportion ofacademic staff in the education cost centre inNorthern Ireland reflects the transfer into thesector of two largely teacher training institutionsduring the last ten years.
There are changes in the relative position ofdifferent disciplines but by and large thesereflect UK-wide changes in student demandrather than any changes influenced bydevolution.
Analysis of sources of research income
Research grants and contracts
In the following tables, we look at researchincome through research grants and contracts.It is important in analysing this data to bear inmind the different cost centre mix of theinstitutions in the different countries, asexemplified in the tables 14 to 16. Different costcentres attract different levels of funding forresearch in part because of the equipmentinvolved in some disciplines. These figures aretherefore presented as both raw percentages,and as percentages adjusted by cost centre mix.
The adjusted figure attempts to predict themarket share if each cost centre were to receivethe same level of research grants and contractsincome nationally. For each institution, and forall sources of income, market shares arecalculated at cost centre level. These are thenaggregated and the adjusted ratio is calculatedas a weighted average across the cost centresusing as weights the total United Kingdomacademic staff expenditure in each cost centre.48
Table 17
Research grants and contracts:
research councils
1996/97 1999/2000 2005/06
Actual Adjusted Actual Adjusted Actual Adjusted
England 83.7 82.3 83.5 84.2 83.2 84.0
Wales 2.8 4.2 3.2 3.2 3.2 3.4
Scotland 12.6 12.8 12.4 11.2 12.5 10.2
Northern 1.0 0.7 1.0 1.4 1.0 1.8Ireland
Source: HESA
Table 16
Percentage of academic staff in
major cost centres, 2005/06
Northern
Cost centre England Wales Scotland Ireland
Clinical medicine 10% 7% 11% 9%
Nursing and paramedical 6% 5% 6% 9%studies
Health and community studies 3% 3% 2% 2%
Psychology and behavioural 3% 4% 3% 3%sciences
Biosciences 6% 6% 10% 7%
Chemistry 2% 2% 3% 2%
Physics 2% 2% 3% 3%
Civil engineering 1% 1% 1% 4%
Electrical, electronic and 2% 2% 2% 4%computer engineering
Mechanical, aero and 2% 2% 2% 4%production engineering
Architecture, built 2% 2% 2% 2%environment and planning
Mathematics 2% 1% 2% 1%
Information technology and 4% 4% 5% 6%systems sciences and computer software engineering
Business and management 7% 9% 8% 6%studies
Social studies 8% 7% 7% 9%
Humanities and language 7% 9% 7% 5%based studies
Design and creative arts 7% 9% 4% 3%
Education 6% 6% 6% 6%
Modern languages 3% 2% 1% 3%
Source: HESA
These tables show that there are somesignificant differences in the pattern ofdisciplines in the countries of the UK. Inparticular:
p There is a high proportion of academic staff inclinical medicine and life sciences in Scottishhigher education institutions.This reflects anhistorical feature of Scottish institutions with astrong tradition of medical education.
p There is a high proportion of academic staff inhumanities and language-based studies inWelsh institutions.This too reflects anhistorical feature of higher education in Wales.
p In English higher education institutions thereis a somewhat higher proportion of academicstaff in the creative arts and design than inother parts of the United Kingdom.
43723 UniUK Devolution 12/11/08 13:04 Page 46
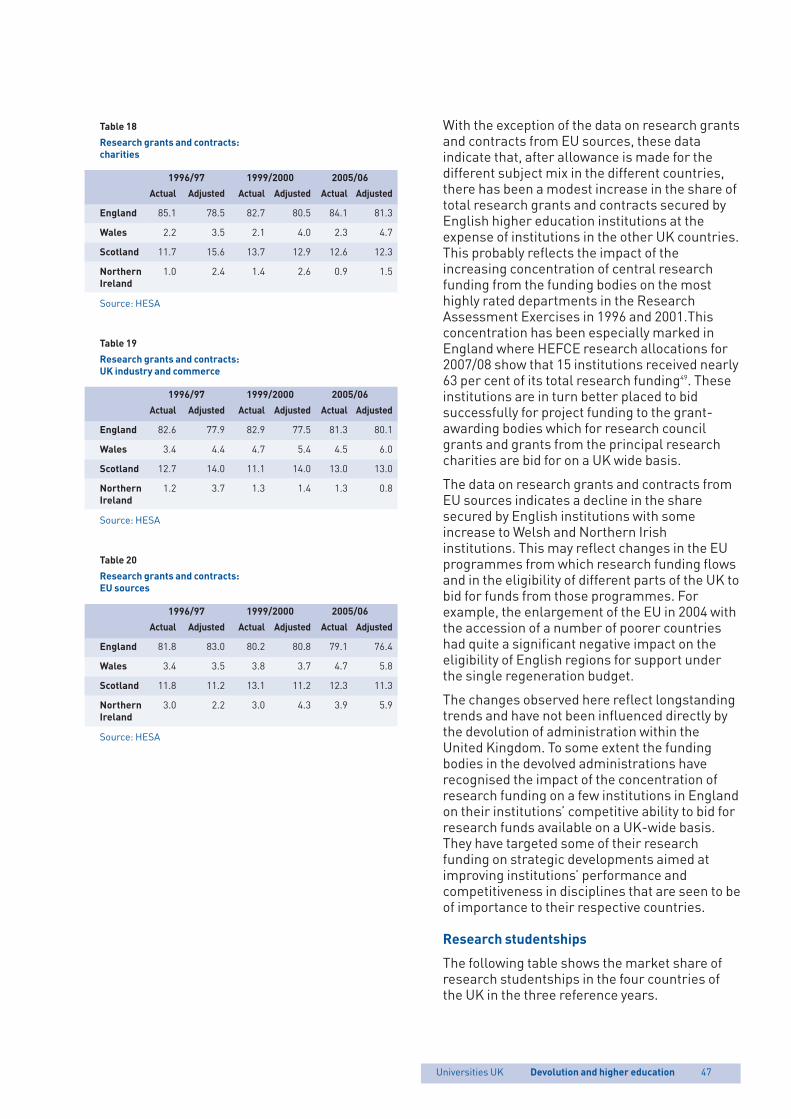
Universities UK Devolution and higher education
With the exception of the data on research grantsand contracts from EU sources, these dataindicate that, after allowance is made for thedifferent subject mix in the different countries,there has been a modest increase in the share oftotal research grants and contracts secured byEnglish higher education institutions at theexpense of institutions in the other UK countries.This probably reflects the impact of theincreasing concentration of central researchfunding from the funding bodies on the mosthighly rated departments in the ResearchAssessment Exercises in 1996 and 2001.Thisconcentration has been especially marked inEngland where HEFCE research allocations for2007/08 show that 15 institutions received nearly63 per cent of its total research funding49. Theseinstitutions are in turn better placed to bidsuccessfully for project funding to the grant-awarding bodies which for research councilgrants and grants from the principal researchcharities are bid for on a UK wide basis.
The data on research grants and contracts fromEU sources indicates a decline in the sharesecured by English institutions with someincrease to Welsh and Northern Irishinstitutions. This may reflect changes in the EUprogrammes from which research funding flowsand in the eligibility of different parts of the UK tobid for funds from those programmes. Forexample, the enlargement of the EU in 2004 withthe accession of a number of poorer countrieshad quite a significant negative impact on theeligibility of English regions for support underthe single regeneration budget.
The changes observed here reflect longstandingtrends and have not been influenced directly bythe devolution of administration within theUnited Kingdom. To some extent the fundingbodies in the devolved administrations haverecognised the impact of the concentration ofresearch funding on a few institutions in Englandon their institutions’ competitive ability to bid forresearch funds available on a UK-wide basis.They have targeted some of their researchfunding on strategic developments aimed atimproving institutions’ performance andcompetitiveness in disciplines that are seen to beof importance to their respective countries.
Research studentships
The following table shows the market share ofresearch studentships in the four countries ofthe UK in the three reference years.
Table 18
Research grants and contracts:
charities
1996/97 1999/2000 2005/06
Actual Adjusted Actual Adjusted Actual Adjusted
England 85.1 78.5 82.7 80.5 84.1 81.3
Wales 2.2 3.5 2.1 4.0 2.3 4.7
Scotland 11.7 15.6 13.7 12.9 12.6 12.3
Northern 1.0 2.4 1.4 2.6 0.9 1.5Ireland
Source: HESA
Table 19
Research grants and contracts:
UK industry and commerce
1996/97 1999/2000 2005/06
Actual Adjusted Actual Adjusted Actual Adjusted
England 82.6 77.9 82.9 77.5 81.3 80.1
Wales 3.4 4.4 4.7 5.4 4.5 6.0
Scotland 12.7 14.0 11.1 14.0 13.0 13.0
Northern 1.2 3.7 1.3 1.4 1.3 0.8Ireland
Source: HESA
Table 20
Research grants and contracts:
EU sources
1996/97 1999/2000 2005/06
Actual Adjusted Actual Adjusted Actual Adjusted
England 81.8 83.0 80.2 80.8 79.1 76.4
Wales 3.4 3.5 3.8 3.7 4.7 5.8
Scotland 11.8 11.2 13.1 11.2 12.3 11.3
Northern 3.0 2.2 3.0 4.3 3.9 5.9Ireland
Source: HESA
47
43723 UniUK Devolution 12/11/08 13:04 Page 47
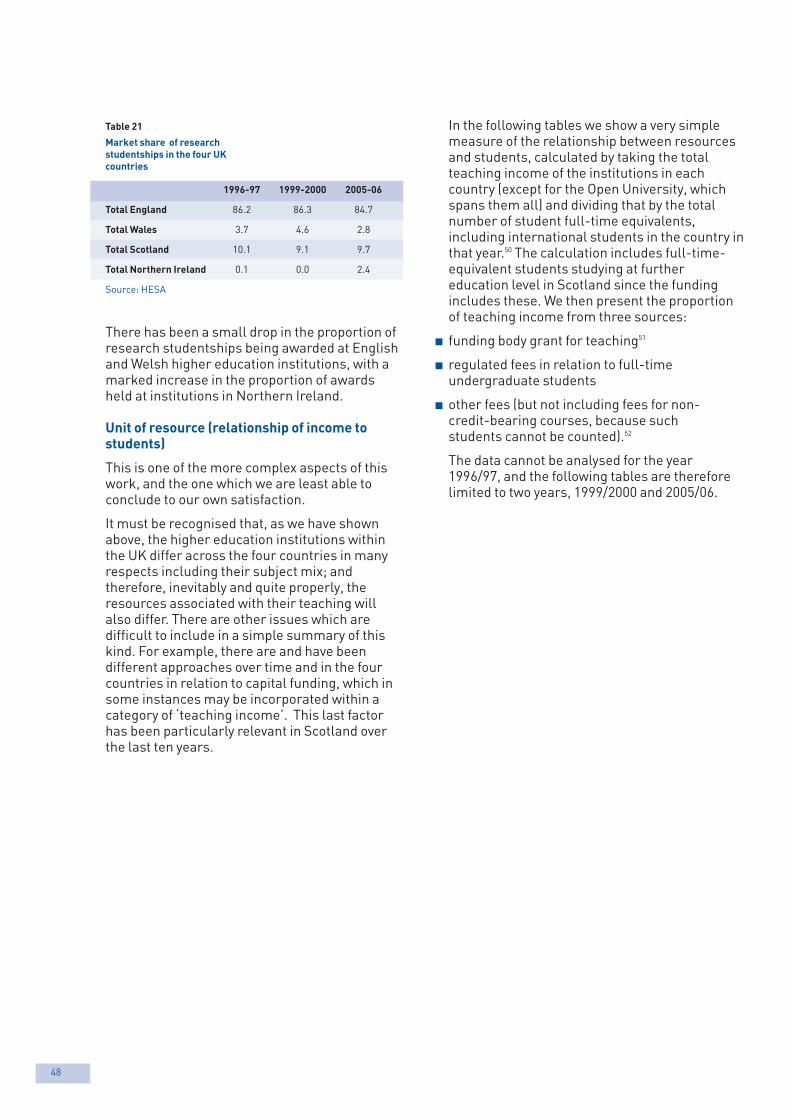
48
In the following tables we show a very simplemeasure of the relationship between resourcesand students, calculated by taking the totalteaching income of the institutions in eachcountry (except for the Open University, whichspans them all) and dividing that by the totalnumber of student full-time equivalents,including international students in the country inthat year.50 The calculation includes full-time-equivalent students studying at furthereducation level in Scotland since the fundingincludes these. We then present the proportionof teaching income from three sources:
p funding body grant for teaching51
p regulated fees in relation to full-timeundergraduate students
p other fees (but not including fees for non-credit-bearing courses, because suchstudents cannot be counted).52
The data cannot be analysed for the year1996/97, and the following tables are thereforelimited to two years, 1999/2000 and 2005/06.
Table 21
Market share of research
studentships in the four UK
countries
1996-97 1999-2000 2005-06
Total England 86.2 86.3 84.7
Total Wales 3.7 4.6 2.8
Total Scotland 10.1 9.1 9.7
Total Northern Ireland 0.1 0.0 2.4
Source: HESA
There has been a small drop in the proportion ofresearch studentships being awarded at Englishand Welsh higher education institutions, with amarked increase in the proportion of awardsheld at institutions in Northern Ireland.
Unit of resource (relationship of income tostudents)
This is one of the more complex aspects of thiswork, and the one which we are least able toconclude to our own satisfaction.
It must be recognised that, as we have shownabove, the higher education institutions withinthe UK differ across the four countries in manyrespects including their subject mix; andtherefore, inevitably and quite properly, theresources associated with their teaching willalso differ. There are other issues which aredifficult to include in a simple summary of thiskind. For example, there are and have beendifferent approaches over time and in the fourcountries in relation to capital funding, which insome instances may be incorporated within acategory of ‘teaching income’. This last factorhas been particularly relevant in Scotland overthe last ten years.
43723 UniUK Devolution 12/11/08 13:04 Page 48
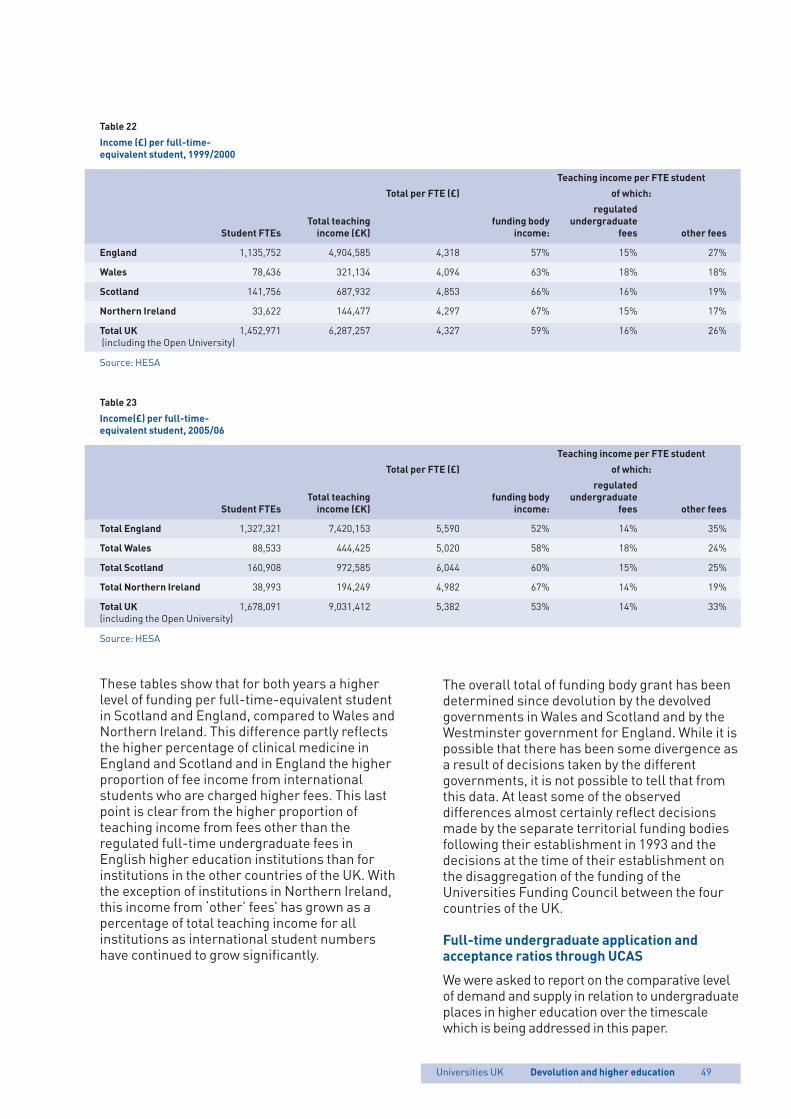
Universities UK Devolution and higher education
The overall total of funding body grant has beendetermined since devolution by the devolvedgovernments in Wales and Scotland and by theWestminster government for England. While it ispossible that there has been some divergence asa result of decisions taken by the differentgovernments, it is not possible to tell that fromthis data. At least some of the observeddifferences almost certainly reflect decisionsmade by the separate territorial funding bodiesfollowing their establishment in 1993 and thedecisions at the time of their establishment onthe disaggregation of the funding of theUniversities Funding Council between the fourcountries of the UK.
Full-time undergraduate application andacceptance ratios through UCAS
We were asked to report on the comparative levelof demand and supply in relation to undergraduateplaces in higher education over the timescalewhich is being addressed in this paper.
Table 22
Income (£) per full-time-
equivalent student, 1999/2000
Teaching income per FTE student
Total per FTE (£) of which:
regulated
Total teaching funding body undergraduate
Student FTEs income (£K) income: fees other fees
England 1,135,752 4,904,585 4,318 57% 15% 27%
Wales 78,436 321,134 4,094 63% 18% 18%
Scotland 141,756 687,932 4,853 66% 16% 19%
Northern Ireland 33,622 144,477 4,297 67% 15% 17%
Total UK 1,452,971 6,287,257 4,327 59% 16% 26%(including the Open University)
Source: HESA
Table 23
Income(£) per full-time-
equivalent student, 2005/06
Teaching income per FTE student
Total per FTE (£) of which:
regulated
Total teaching funding body undergraduate
Student FTEs income (£K) income: fees other fees
Total England 1,327,321 7,420,153 5,590 52% 14% 35%
Total Wales 88,533 444,425 5,020 58% 18% 24%
Total Scotland 160,908 972,585 6,044 60% 15% 25%
Total Northern Ireland 38,993 194,249 4,982 67% 14% 19%
Total UK 1,678,091 9,031,412 5,382 53% 14% 33%(including the Open University)
Source: HESA
49
These tables show that for both years a higherlevel of funding per full-time-equivalent studentin Scotland and England, compared to Wales andNorthern Ireland. This difference partly reflectsthe higher percentage of clinical medicine inEngland and Scotland and in England the higherproportion of fee income from internationalstudents who are charged higher fees. This lastpoint is clear from the higher proportion ofteaching income from fees other than theregulated full-time undergraduate fees inEnglish higher education institutions than forinstitutions in the other countries of the UK. Withthe exception of institutions in Northern Ireland,this income from ‘other’ fees’ has grown as apercentage of total teaching income for allinstitutions as international student numbershave continued to grow significantly.
43723 UniUK Devolution 12/11/08 13:04 Page 49
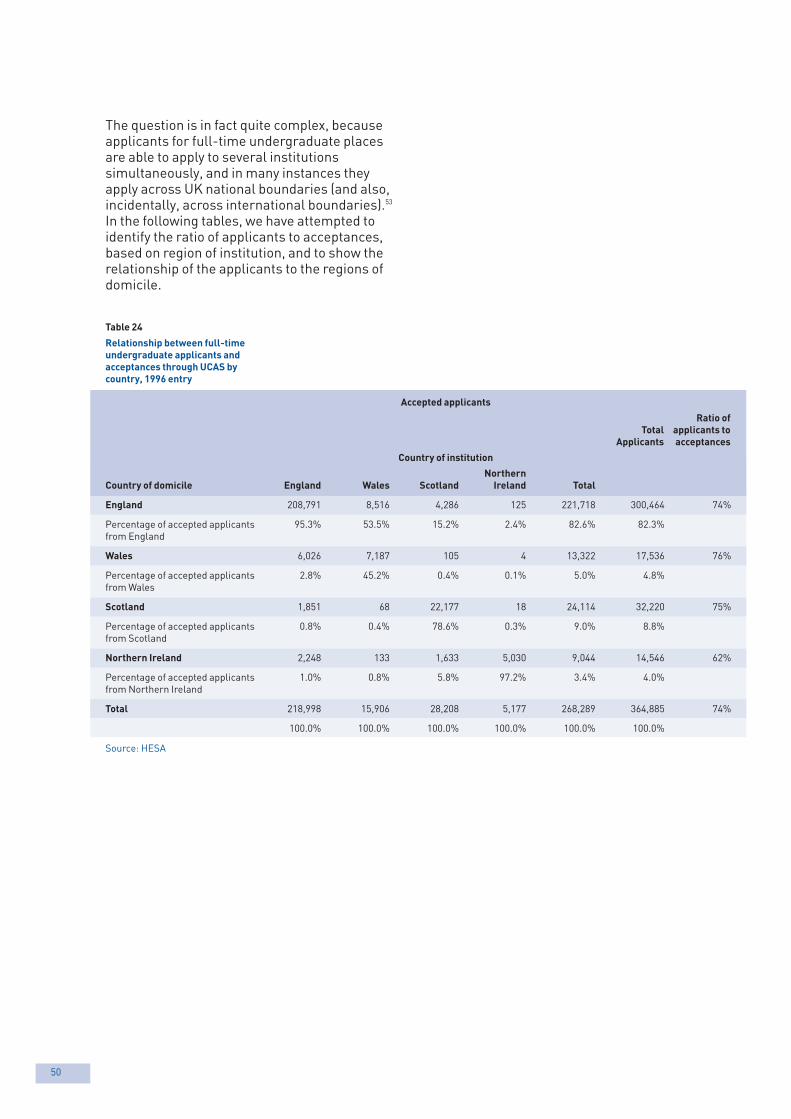
50
The question is in fact quite complex, becauseapplicants for full-time undergraduate placesare able to apply to several institutionssimultaneously, and in many instances theyapply across UK national boundaries (and also,incidentally, across international boundaries).53
In the following tables, we have attempted toidentify the ratio of applicants to acceptances,based on region of institution, and to show therelationship of the applicants to the regions ofdomicile.
Table 24
Relationship between full-time
undergraduate applicants and
acceptances through UCAS by
country, 1996 entry
Accepted applicants
Ratio of
Total applicants to
Applicants acceptances
Country of institution
Northern
Country of domicile England Wales Scotland Ireland Total
England 208,791 8,516 4,286 125 221,718 300,464 74%
Percentage of accepted applicants 95.3% 53.5% 15.2% 2.4% 82.6% 82.3%from England
Wales 6,026 7,187 105 4 13,322 17,536 76%
Percentage of accepted applicants 2.8% 45.2% 0.4% 0.1% 5.0% 4.8%from Wales
Scotland 1,851 68 22,177 18 24,114 32,220 75%
Percentage of accepted applicants 0.8% 0.4% 78.6% 0.3% 9.0% 8.8%from Scotland
Northern Ireland 2,248 133 1,633 5,030 9,044 14,546 62%
Percentage of accepted applicants 1.0% 0.8% 5.8% 97.2% 3.4% 4.0%from Northern Ireland
Total 218,998 15,906 28,208 5,177 268,289 364,885 74%
100.0% 100.0% 100.0% 100.0% 100.0% 100.0%
Source: HESA
43723 UniUK Devolution 12/11/08 13:04 Page 50
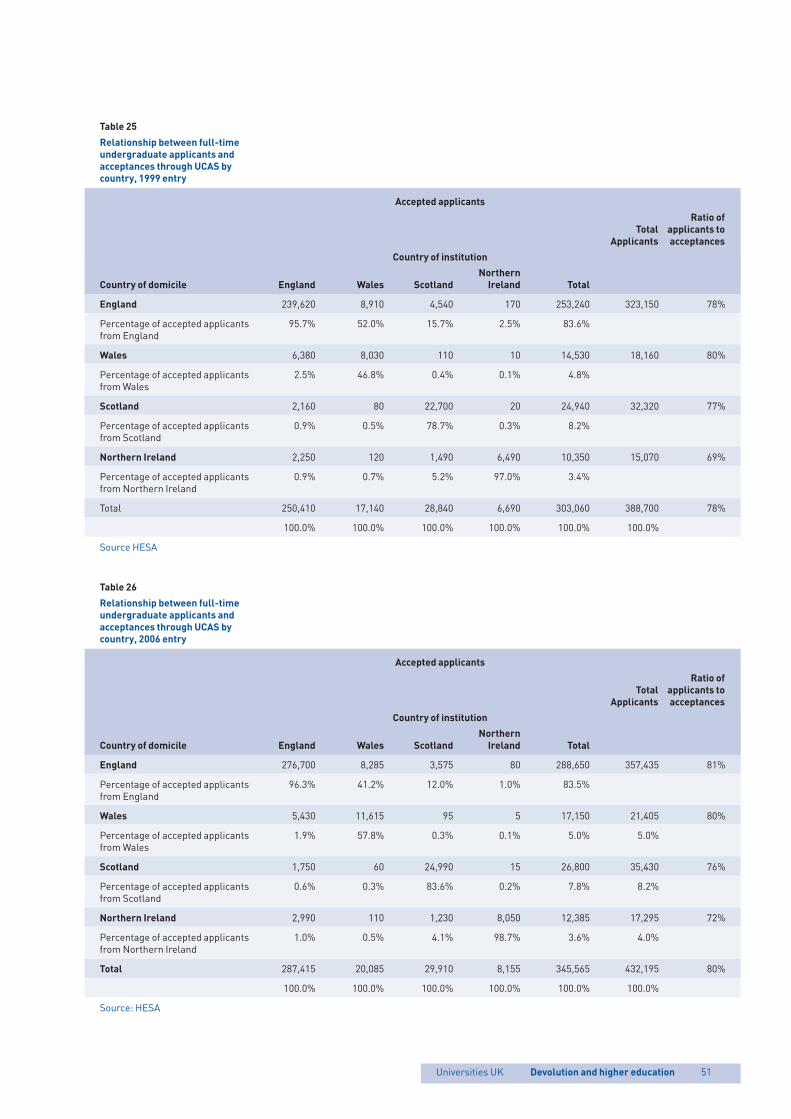
Universities UK Devolution and higher education
Table 25
Relationship between full-time
undergraduate applicants and
acceptances through UCAS by
country, 1999 entry
Accepted applicants
Ratio of
Total applicants to
Applicants acceptances
Country of institution
Northern
Country of domicile England Wales Scotland Ireland Total
England 239,620 8,910 4,540 170 253,240 323,150 78%
Percentage of accepted applicants 95.7% 52.0% 15.7% 2.5% 83.6%from England
Wales 6,380 8,030 110 10 14,530 18,160 80%
Percentage of accepted applicants 2.5% 46.8% 0.4% 0.1% 4.8%from Wales
Scotland 2,160 80 22,700 20 24,940 32,320 77%
Percentage of accepted applicants 0.9% 0.5% 78.7% 0.3% 8.2%from Scotland
Northern Ireland 2,250 120 1,490 6,490 10,350 15,070 69%
Percentage of accepted applicants 0.9% 0.7% 5.2% 97.0% 3.4%from Northern Ireland
Total 250,410 17,140 28,840 6,690 303,060 388,700 78%
100.0% 100.0% 100.0% 100.0% 100.0% 100.0%
Source HESA
Table 26
Relationship between full-time
undergraduate applicants and
acceptances through UCAS by
country, 2006 entry
Accepted applicants
Ratio of
Total applicants to
Applicants acceptances
Country of institution
Northern
Country of domicile England Wales Scotland Ireland Total
England 276,700 8,285 3,575 80 288,650 357,435 81%
Percentage of accepted applicants 96.3% 41.2% 12.0% 1.0% 83.5%from England
Wales 5,430 11,615 95 5 17,150 21,405 80%
Percentage of accepted applicants 1.9% 57.8% 0.3% 0.1% 5.0% 5.0%from Wales
Scotland 1,750 60 24,990 15 26,800 35,430 76%
Percentage of accepted applicants 0.6% 0.3% 83.6% 0.2% 7.8% 8.2%from Scotland
Northern Ireland 2,990 110 1,230 8,050 12,385 17,295 72%
Percentage of accepted applicants 1.0% 0.5% 4.1% 98.7% 3.6% 4.0%from Northern Ireland
Total 287,415 20,085 29,910 8,155 345,565 432,195 80%
100.0% 100.0% 100.0% 100.0% 100.0% 100.0%
Source: HESA
51
43723 UniUK Devolution 12/11/08 13:04 Page 51
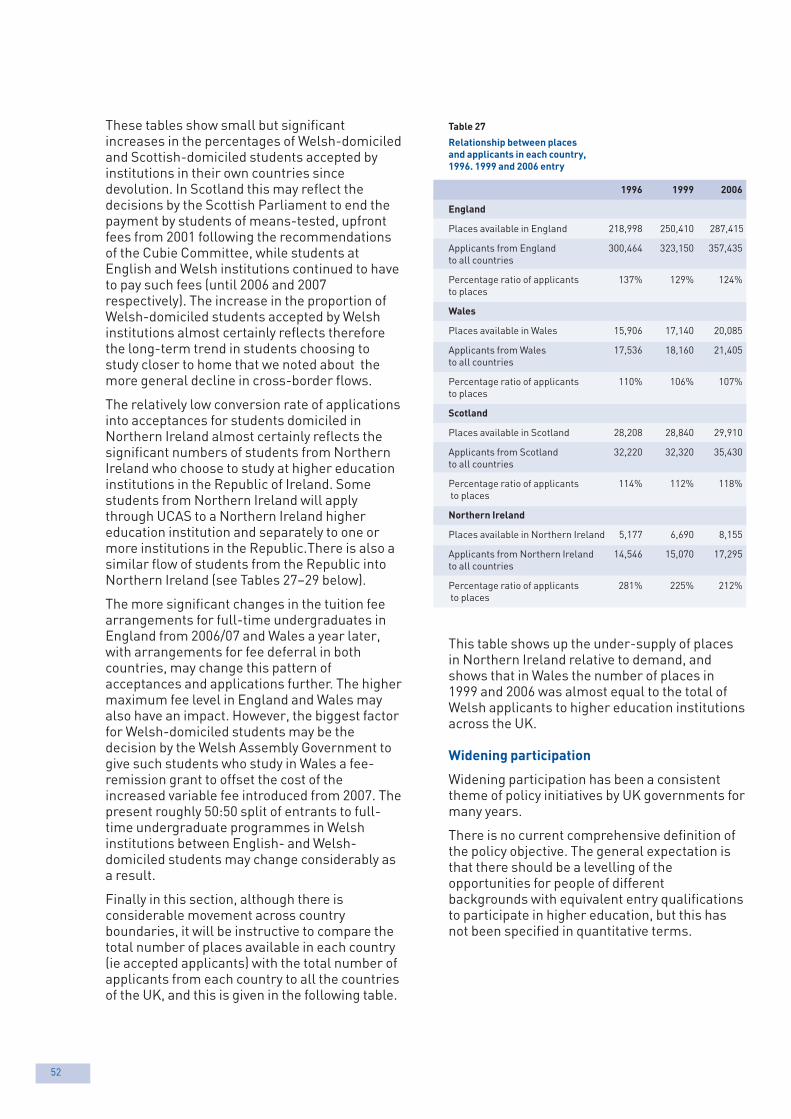
52
These tables show small but significantincreases in the percentages of Welsh-domiciledand Scottish-domiciled students accepted byinstitutions in their own countries sincedevolution. In Scotland this may reflect thedecisions by the Scottish Parliament to end thepayment by students of means-tested, upfrontfees from 2001 following the recommendationsof the Cubie Committee, while students atEnglish and Welsh institutions continued to haveto pay such fees (until 2006 and 2007respectively). The increase in the proportion ofWelsh-domiciled students accepted by Welshinstitutions almost certainly reflects thereforethe long-term trend in students choosing tostudy closer to home that we noted about themore general decline in cross-border flows.
The relatively low conversion rate of applicationsinto acceptances for students domiciled inNorthern Ireland almost certainly reflects thesignificant numbers of students from NorthernIreland who choose to study at higher educationinstitutions in the Republic of Ireland. Somestudents from Northern Ireland will applythrough UCAS to a Northern Ireland highereducation institution and separately to one ormore institutions in the Republic.There is also asimilar flow of students from the Republic intoNorthern Ireland (see Tables 27–29 below).
The more significant changes in the tuition feearrangements for full-time undergraduates inEngland from 2006/07 and Wales a year later,with arrangements for fee deferral in bothcountries, may change this pattern ofacceptances and applications further. The highermaximum fee level in England and Wales mayalso have an impact. However, the biggest factorfor Welsh-domiciled students may be thedecision by the Welsh Assembly Government togive such students who study in Wales a fee-remission grant to offset the cost of theincreased variable fee introduced from 2007. Thepresent roughly 50:50 split of entrants to full-time undergraduate programmes in Welshinstitutions between English- and Welsh-domiciled students may change considerably asa result.
Finally in this section, although there isconsiderable movement across countryboundaries, it will be instructive to compare thetotal number of places available in each country(ie accepted applicants) with the total number ofapplicants from each country to all the countriesof the UK, and this is given in the following table.
Table 27
Relationship between places
and applicants in each country,
1996. 1999 and 2006 entry
1996 1999 2006
England
Places available in England 218,998 250,410 287,415
Applicants from England 300,464 323,150 357,435to all countries
Percentage ratio of applicants 137% 129% 124%to places
Wales
Places available in Wales 15,906 17,140 20,085
Applicants from Wales 17,536 18,160 21,405to all countries
Percentage ratio of applicants 110% 106% 107%to places
Scotland
Places available in Scotland 28,208 28,840 29,910
Applicants from Scotland 32,220 32,320 35,430to all countries
Percentage ratio of applicants 114% 112% 118%to places
Northern Ireland
Places available in Northern Ireland 5,177 6,690 8,155
Applicants from Northern Ireland 14,546 15,070 17,295to all countries
Percentage ratio of applicants 281% 225% 212%to places
This table shows up the under-supply of placesin Northern Ireland relative to demand, andshows that in Wales the number of places in1999 and 2006 was almost equal to the total ofWelsh applicants to higher education institutionsacross the UK.
Widening participation
Widening participation has been a consistenttheme of policy initiatives by UK governments formany years.
There is no current comprehensive definition ofthe policy objective. The general expectation isthat there should be a levelling of theopportunities for people of differentbackgrounds with equivalent entry qualificationsto participate in higher education, but this hasnot been specified in quantitative terms.
43723 UniUK Devolution 12/11/08 13:04 Page 52
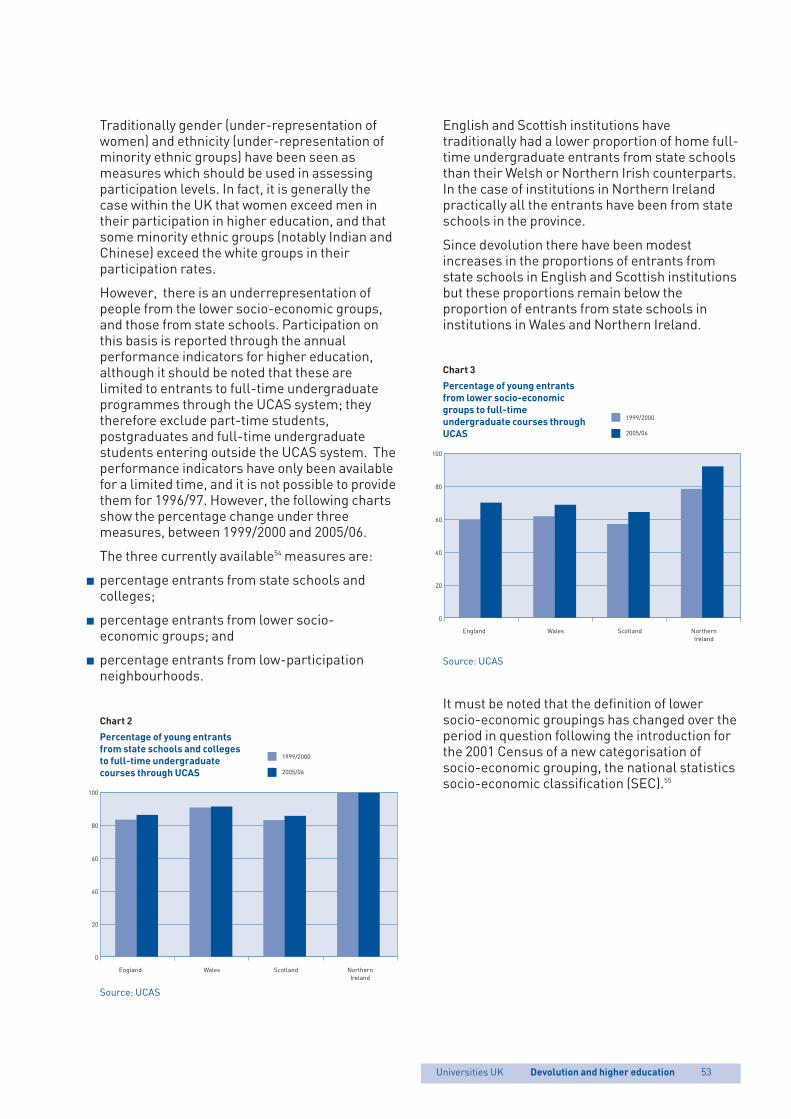
Universities UK Devolution and higher education 53
Traditionally gender (under-representation ofwomen) and ethnicity (under-representation ofminority ethnic groups) have been seen asmeasures which should be used in assessingparticipation levels. In fact, it is generally thecase within the UK that women exceed men intheir participation in higher education, and thatsome minority ethnic groups (notably Indian andChinese) exceed the white groups in theirparticipation rates.
However, there is an underrepresentation ofpeople from the lower socio-economic groups,and those from state schools. Participation onthis basis is reported through the annualperformance indicators for higher education,although it should be noted that these arelimited to entrants to full-time undergraduateprogrammes through the UCAS system; theytherefore exclude part-time students,postgraduates and full-time undergraduatestudents entering outside the UCAS system. Theperformance indicators have only been availablefor a limited time, and it is not possible to providethem for 1996/97. However, the following chartsshow the percentage change under threemeasures, between 1999/2000 and 2005/06.
The three currently available54 measures are:
p percentage entrants from state schools andcolleges;
p percentage entrants from lower socio-economic groups; and
p percentage entrants from low-participationneighbourhoods.
Chart 2
Percentage of young entrants
from state schools and colleges
to full-time undergraduate
courses through UCAS
Source: UCAS
English and Scottish institutions havetraditionally had a lower proportion of home full-time undergraduate entrants from state schoolsthan their Welsh or Northern Irish counterparts.In the case of institutions in Northern Irelandpractically all the entrants have been from stateschools in the province.
Since devolution there have been modestincreases in the proportions of entrants fromstate schools in English and Scottish institutionsbut these proportions remain below theproportion of entrants from state schools ininstitutions in Wales and Northern Ireland.
Chart 3
Percentage of young entrants
from lower socio-economic
groups to full-time
undergraduate courses through
UCAS
Source: UCAS
It must be noted that the definition of lowersocio-economic groupings has changed over theperiod in question following the introduction forthe 2001 Census of a new categorisation ofsocio-economic grouping, the national statisticssocio-economic classification (SEC).55
100
80
60
40
20
0
England Wales Scotland NorthernIreland
1999/2000
2005/06
100
80
60
40
20
0
England Wales Scotland NorthernIreland
1999/2000
2005/06
43723 UniUK Devolution 12/11/08 13:04 Page 53
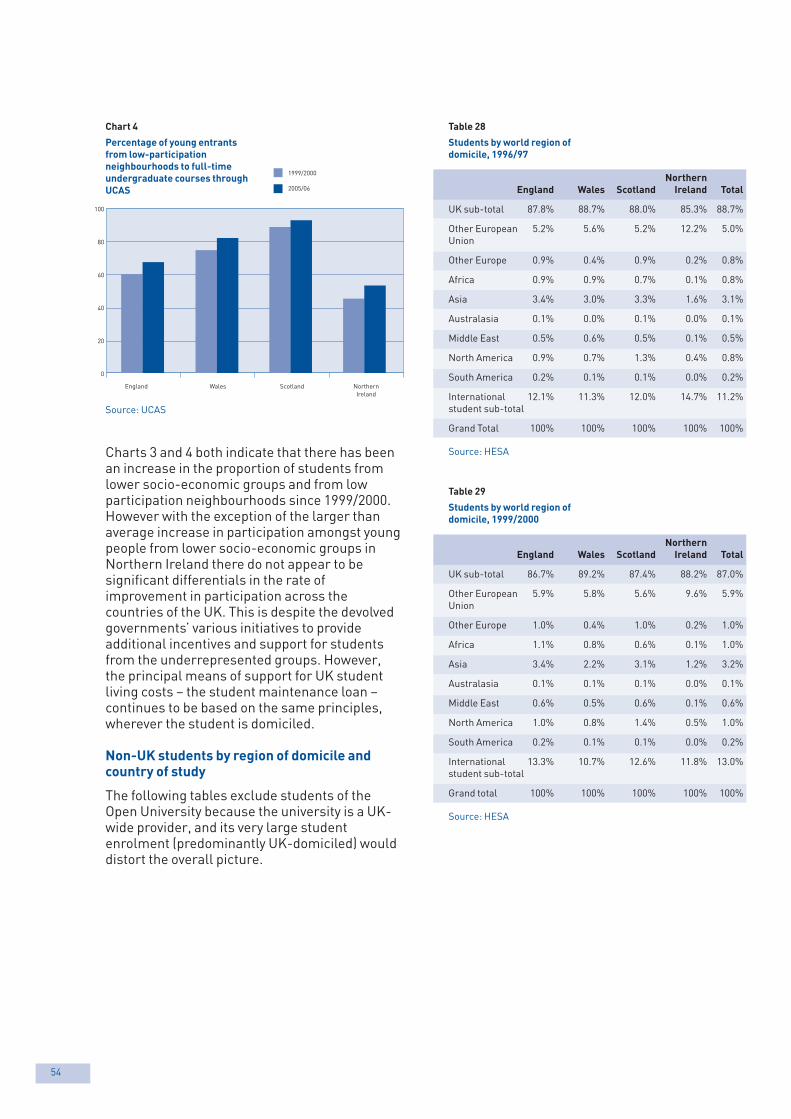
54
Chart 4
Percentage of young entrants
from low-participation
neighbourhoods to full-time
undergraduate courses through
UCAS
Source: UCAS
Charts 3 and 4 both indicate that there has beenan increase in the proportion of students fromlower socio-economic groups and from lowparticipation neighbourhoods since 1999/2000.However with the exception of the larger thanaverage increase in participation amongst youngpeople from lower socio-economic groups inNorthern Ireland there do not appear to besignificant differentials in the rate ofimprovement in participation across thecountries of the UK. This is despite the devolvedgovernments’ various initiatives to provideadditional incentives and support for studentsfrom the underrepresented groups. However,the principal means of support for UK studentliving costs – the student maintenance loan –continues to be based on the same principles,wherever the student is domiciled.
Non-UK students by region of domicile andcountry of study
The following tables exclude students of theOpen University because the university is a UK-wide provider, and its very large studentenrolment (predominantly UK-domiciled) woulddistort the overall picture.
Table 28
Students by world region of
domicile, 1996/97
Northern
England Wales Scotland Ireland Total
UK sub-total 87.8% 88.7% 88.0% 85.3% 88.7%
Other European 5.2% 5.6% 5.2% 12.2% 5.0%Union
Other Europe 0.9% 0.4% 0.9% 0.2% 0.8%
Africa 0.9% 0.9% 0.7% 0.1% 0.8%
Asia 3.4% 3.0% 3.3% 1.6% 3.1%
Australasia 0.1% 0.0% 0.1% 0.0% 0.1%
Middle East 0.5% 0.6% 0.5% 0.1% 0.5%
North America 0.9% 0.7% 1.3% 0.4% 0.8%
South America 0.2% 0.1% 0.1% 0.0% 0.2%
International 12.1% 11.3% 12.0% 14.7% 11.2%student sub-total
Grand Total 100% 100% 100% 100% 100%
Source: HESA
Table 29
Students by world region of
domicile, 1999/2000
Northern
England Wales Scotland Ireland Total
UK sub-total 86.7% 89.2% 87.4% 88.2% 87.0%
Other European 5.9% 5.8% 5.6% 9.6% 5.9%Union
Other Europe 1.0% 0.4% 1.0% 0.2% 1.0%
Africa 1.1% 0.8% 0.6% 0.1% 1.0%
Asia 3.4% 2.2% 3.1% 1.2% 3.2%
Australasia 0.1% 0.1% 0.1% 0.0% 0.1%
Middle East 0.6% 0.5% 0.6% 0.1% 0.6%
North America 1.0% 0.8% 1.4% 0.5% 1.0%
South America 0.2% 0.1% 0.1% 0.0% 0.2%
International 13.3% 10.7% 12.6% 11.8% 13.0%student sub-total
Grand total 100% 100% 100% 100% 100%
Source: HESA
100
80
60
40
20
0
England Wales Scotland NorthernIreland
1999/2000
2005/06
43723 UniUK Devolution 12/11/08 13:04 Page 54
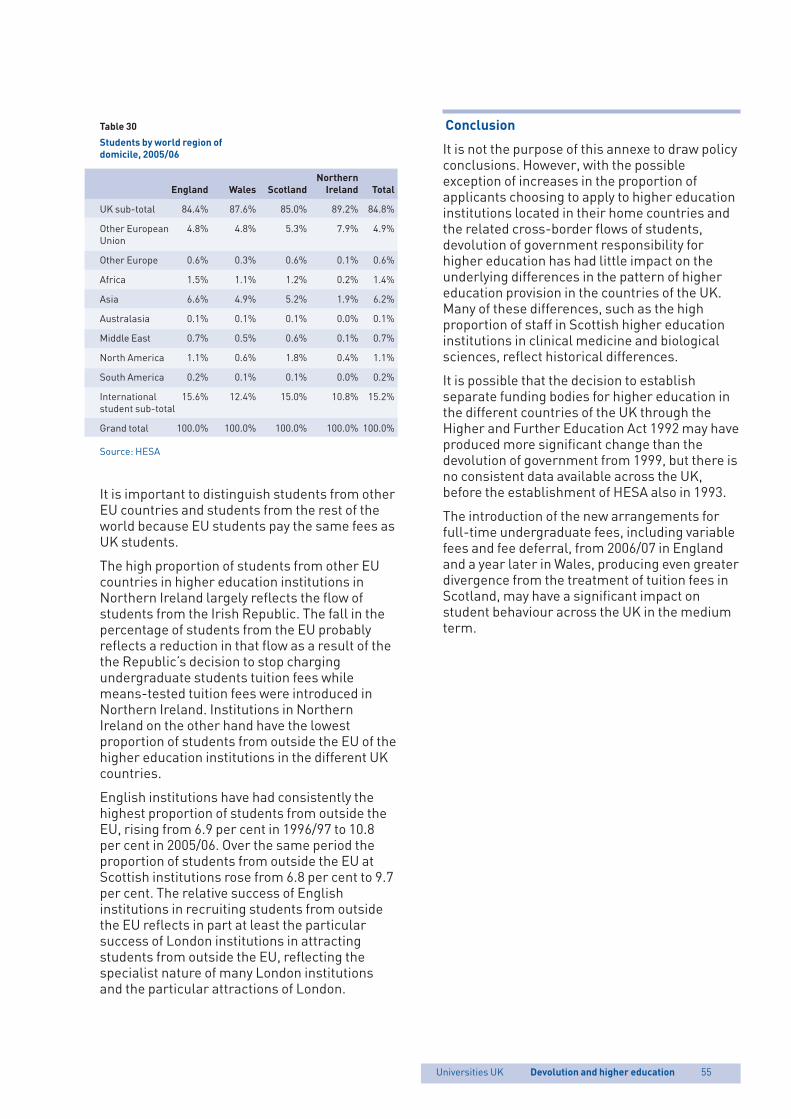
Universities UK Devolution and higher education 55
Table 30
Students by world region of
domicile, 2005/06
Northern
England Wales Scotland Ireland Total
UK sub-total 84.4% 87.6% 85.0% 89.2% 84.8%
Other European 4.8% 4.8% 5.3% 7.9% 4.9%Union
Other Europe 0.6% 0.3% 0.6% 0.1% 0.6%
Africa 1.5% 1.1% 1.2% 0.2% 1.4%
Asia 6.6% 4.9% 5.2% 1.9% 6.2%
Australasia 0.1% 0.1% 0.1% 0.0% 0.1%
Middle East 0.7% 0.5% 0.6% 0.1% 0.7%
North America 1.1% 0.6% 1.8% 0.4% 1.1%
South America 0.2% 0.1% 0.1% 0.0% 0.2%
International 15.6% 12.4% 15.0% 10.8% 15.2%student sub-total
Grand total 100.0% 100.0% 100.0% 100.0% 100.0%
Source: HESA
It is important to distinguish students from otherEU countries and students from the rest of theworld because EU students pay the same fees asUK students.
The high proportion of students from other EUcountries in higher education institutions inNorthern Ireland largely reflects the flow ofstudents from the Irish Republic. The fall in thepercentage of students from the EU probablyreflects a reduction in that flow as a result of thethe Republic’s decision to stop chargingundergraduate students tuition fees whilemeans-tested tuition fees were introduced inNorthern Ireland. Institutions in NorthernIreland on the other hand have the lowestproportion of students from outside the EU of thehigher education institutions in the different UKcountries.
English institutions have had consistently thehighest proportion of students from outside theEU, rising from 6.9 per cent in 1996/97 to 10.8per cent in 2005/06. Over the same period theproportion of students from outside the EU atScottish institutions rose from 6.8 per cent to 9.7per cent. The relative success of Englishinstitutions in recruiting students from outsidethe EU reflects in part at least the particularsuccess of London institutions in attractingstudents from outside the EU, reflecting thespecialist nature of many London institutionsand the particular attractions of London.
Conclusion
It is not the purpose of this annexe to draw policyconclusions. However, with the possibleexception of increases in the proportion ofapplicants choosing to apply to higher educationinstitutions located in their home countries andthe related cross-border flows of students,devolution of government responsibility forhigher education has had little impact on theunderlying differences in the pattern of highereducation provision in the countries of the UK.Many of these differences, such as the highproportion of staff in Scottish higher educationinstitutions in clinical medicine and biologicalsciences, reflect historical differences.
It is possible that the decision to establishseparate funding bodies for higher education inthe different countries of the UK through theHigher and Further Education Act 1992 may haveproduced more significant change than thedevolution of government from 1999, but there isno consistent data available across the UK,before the establishment of HESA also in 1993.
The introduction of the new arrangements forfull-time undergraduate fees, including variablefees and fee deferral, from 2006/07 in Englandand a year later in Wales, producing even greaterdivergence from the treatment of tuition fees inScotland, may have a significant impact onstudent behaviour across the UK in the mediumterm.
43723 UniUK Devolution 12/11/08 13:04 Page 55
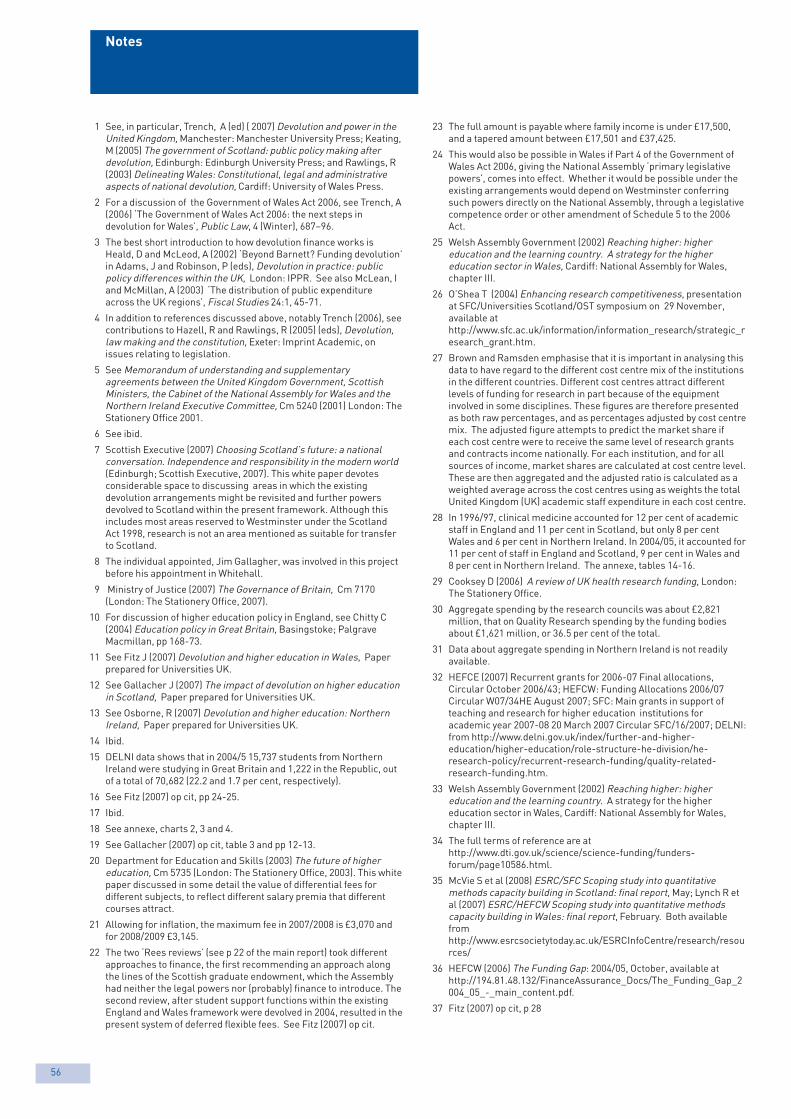
Notes
56
1 See, in particular, Trench, A (ed) ( 2007) Devolution and power in theUnited Kingdom, Manchester: Manchester University Press; Keating,M (2005) The government of Scotland: public policy making afterdevolution, Edinburgh: Edinburgh University Press; and Rawlings, R(2003) Delineating Wales: Constitutional, legal and administrativeaspects of national devolution, Cardiff: University of Wales Press.
2 For a discussion of the Government of Wales Act 2006, see Trench, A(2006) ‘The Government of Wales Act 2006: the next steps indevolution for Wales’, Public Law, 4 (Winter), 687–96.
3 The best short introduction to how devolution finance works isHeald, D and McLeod, A (2002) ‘Beyond Barnett? Funding devolution’in Adams, J and Robinson, P (eds), Devolution in practice: publicpolicy differences within the UK, London: IPPR. See also McLean, Iand McMillan, A (2003) ‘The distribution of public expenditureacross the UK regions’, Fiscal Studies 24:1, 45-71.
4 In addition to references discussed above, notably Trench (2006), seecontributions to Hazell, R and Rawlings, R (2005) (eds), Devolution,law making and the constitution, Exeter: Imprint Academic, onissues relating to legislation.
5 See Memorandum of understanding and supplementaryagreements between the United Kingdom Government, ScottishMinisters, the Cabinet of the National Assembly for Wales and theNorthern Ireland Executive Committee, Cm 5240 (2001) London: TheStationery Office 2001.
6 See ibid.
7 Scottish Executive (2007) Choosing Scotland’s future: a nationalconversation. Independence and responsibility in the modern world(Edinburgh; Scottish Executive, 2007). This white paper devotesconsiderable space to discussing areas in which the existingdevolution arrangements might be revisited and further powersdevolved to Scotland within the present framework. Although thisincludes most areas reserved to Westminster under the ScotlandAct 1998, research is not an area mentioned as suitable for transferto Scotland.
8 The individual appointed, Jim Gallagher, was involved in this projectbefore his appointment in Whitehall.
9 Ministry of Justice (2007) The Governance of Britain, Cm 7170(London: The Stationery Office, 2007).
10 For discussion of higher education policy in England, see Chitty C(2004) Education policy in Great Britain, Basingstoke; PalgraveMacmillan, pp 168-73.
11 See Fitz J (2007) Devolution and higher education in Wales, Paperprepared for Universities UK.
12 See Gallacher J (2007) The impact of devolution on higher educationin Scotland, Paper prepared for Universities UK.
13 See Osborne, R (2007) Devolution and higher education: NorthernIreland, Paper prepared for Universities UK.
14 Ibid.
15 DELNI data shows that in 2004/5 15,737 students from NorthernIreland were studying in Great Britain and 1,222 in the Republic, outof a total of 70,682 (22.2 and 1.7 per cent, respectively).
16 See Fitz (2007) op cit, pp 24-25.
17 Ibid.
18 See annexe, charts 2, 3 and 4.
19 See Gallacher (2007) op cit, table 3 and pp 12-13.
20 Department for Education and Skills (2003) The future of highereducation, Cm 5735 (London: The Stationery Office, 2003). This whitepaper discussed in some detail the value of differential fees fordifferent subjects, to reflect different salary premia that differentcourses attract.
21 Allowing for inflation, the maximum fee in 2007/2008 is £3,070 andfor 2008/2009 £3,145.
22 The two ‘Rees reviews’ (see p 22 of the main report) took differentapproaches to finance, the first recommending an approach alongthe lines of the Scottish graduate endowment, which the Assemblyhad neither the legal powers nor (probably) finance to introduce. Thesecond review, after student support functions within the existingEngland and Wales framework were devolved in 2004, resulted in thepresent system of deferred flexible fees. See Fitz (2007) op cit.
23 The full amount is payable where family income is under £17,500,and a tapered amount between £17,501 and £37,425.
24 This would also be possible in Wales if Part 4 of the Government ofWales Act 2006, giving the National Assembly ‘primary legislativepowers’, comes into effect. Whether it would be possible under theexisting arrangements would depend on Westminster conferringsuch powers directly on the National Assembly, through a legislativecompetence order or other amendment of Schedule 5 to the 2006Act.
25 Welsh Assembly Government (2002) Reaching higher: highereducation and the learning country. A strategy for the highereducation sector in Wales, Cardiff: National Assembly for Wales,chapter III.
26 O’Shea T (2004) Enhancing research competitiveness, presentationat SFC/Universities Scotland/OST symposium on 29 November,available athttp://www.sfc.ac.uk/information/information_research/strategic_research_grant.htm.
27 Brown and Ramsden emphasise that it is important in analysing thisdata to have regard to the different cost centre mix of the institutionsin the different countries. Different cost centres attract differentlevels of funding for research in part because of the equipmentinvolved in some disciplines. These figures are therefore presentedas both raw percentages, and as percentages adjusted by cost centremix. The adjusted figure attempts to predict the market share ifeach cost centre were to receive the same level of research grantsand contracts income nationally. For each institution, and for allsources of income, market shares are calculated at cost centre level.These are then aggregated and the adjusted ratio is calculated as aweighted average across the cost centres using as weights the totalUnited Kingdom (UK) academic staff expenditure in each cost centre.
28 In 1996/97, clinical medicine accounted for 12 per cent of academicstaff in England and 11 per cent in Scotland, but only 8 per centWales and 6 per cent in Northern Ireland. In 2004/05, it accounted for11 per cent of staff in England and Scotland, 9 per cent in Wales and8 per cent in Northern Ireland. The annexe, tables 14-16.
29 Cooksey D (2006) A review of UK health research funding, London:The Stationery Office.
30 Aggregate spending by the research councils was about £2,821million, that on Quality Research spending by the funding bodiesabout £1,621 million, or 36.5 per cent of the total.
31 Data about aggregate spending in Northern Ireland is not readilyavailable.
32 HEFCE (2007) Recurrent grants for 2006-07 Final allocations,Circular October 2006/43; HEFCW: Funding Allocations 2006/07Circular W07/34HE August 2007; SFC: Main grants in support ofteaching and research for higher education institutions foracademic year 2007-08 20 March 2007 Circular SFC/16/2007; DELNI:from http://www.delni.gov.uk/index/further-and-higher-education/higher-education/role-structure-he-division/he-research-policy/recurrent-research-funding/quality-related-research-funding.htm.
33 Welsh Assembly Government (2002) Reaching higher: highereducation and the learning country. A strategy for the highereducation sector in Wales, Cardiff: National Assembly for Wales,chapter III.
34 The full terms of reference are athttp://www.dti.gov.uk/science/science-funding/funders-forum/page10586.html.
35 McVie S et al (2008) ESRC/SFC Scoping study into quantitativemethods capacity building in Scotland: final report, May; Lynch R etal (2007) ESRC/HEFCW Scoping study into quantitative methodscapacity building in Wales: final report, February. Both availablefromhttp://www.esrcsocietytoday.ac.uk/ESRCInfoCentre/research/resources/
36 HEFCW (2006) The Funding Gap: 2004/05, October, available athttp://194.81.48.132/FinanceAssurance_Docs/The_Funding_Gap_2004_05_-_main_content.pdf.
37 Fitz (2007) op cit, p 28
43723 UniUK Devolution 12/11/08 13:04 Page 56
100%
This product has been manufactured on paper fromwell managed forests and other controlled sources.It is manufactured using the FSC Chain of Custodyand by a company employing the ISO14001environmental standard.
38 On 23 October 2007 the Scottish Government announced an extra£100 million for capital investment in further and higher education.This was not linked to either the Scottish or UK ComprehensiveSpending Reviews, although the funds used derived from the use ofEnd-Year Flexibility balances held by the Treasury – and increasingcapital investment generally was the condition imposed by theTreasury for releasing such balances.
39 ‘Hyslop admits universities may fall behind’ (2007) The Scotsman 6December.
40 ‘Universities receive £20m cash injection’ (2007) The Herald 10March.
41 This is a characteristic approach of policymaking for England by theUK Government, and can be found in a variety of sectors. See Greer Sand Jarman H ‘Policy styles and devolution’ in Trench A (ed) (2008)The State of the Nations 2008: Into the third term of devolution in theUnited Kingdom (Exeter: Imprint Academic)
42 Although responsibility for the allocation of public funding of highereducation was devolved to separate national funding bodies from1993.
43 HESA cannot accept responsibility for any inferences or conclusionsderived from the data by third parties.
44 Some data is limited to entrants through the UCAS system, ie itrelates only to full-time undergraduate entrants through the centraladmissions system, excluding direct entry to institutions. There istherefore an element of under-estimation here.
45 A more detailed analysis of the potential impact of demographicchange on the higher education sector is given in Universities UK(March 2008) The future size and shape of the higher educationsector in the United Kingdom: demographic projections.
46 Ramsden B, (2006) Patterns of higher education institutions in theUK, Sixth Report, London: Universities UK, , available athttp://bookshop.universitiesuk.ac.uk/downloads/patterns6.pdf.
47 See for example Ramsden B (2006), op.cit, p 65.
48 The adjusted figure attempts to predict the market share if each costcentre were to receive the same level of research grants andcontracts income nationally. For each institution, and for all sourcesof income, market shares are calculated at cost centre level. Theseare then aggregated and the adjusted ratio is calculated as aweighted average across the cost centres using as weights the totalUnited Kingdom academic staff expenditure in each cost centre.
49 See HEFCE 2007/07 available at www.hefce.ac.uk/pubs.
50 Including fulltime equivalent students studying at further educationlevel in Scotland since the funding includes these.
51 Including grant for further education provision in the case ofScotland, where this component is not disaggregated.
52 But including further education fee income in Scotland.
53 This is particularly notable in relation to students domiciled inNorthern Ireland, who may apply to universities in both the Provinceand the Republic. However, it is also now a relevant issue in relationto other students, in view of the increase in enrolments of UKstudents in universities elsewhere in the EU and also in the UnitedStates.
54 Some work is in progress with a view to developing a more robustand more diverse set of indicators for the widening participationagenda.
55 In place of the six categories used in the earlier definition of socialclass, the new classification has seven categories as follows: 1Higher managerial and professional occupations; 2 Lowermanagerial and professional occupations; 3 Intermediateoccupations; 4 Small employers and own account workers; 5 Lowersupervisory and technical occupations; 6 Semi-routine occupations;and 7 Routine occupations.
43723 UniUK Devolution 12/11/08 13:04 Page 57
About Universities UK
This publication has beenproduced by Universities UK,which is the representative bodyfor the executive heads of UKuniversities and is recognised asthe umbrella group for theuniversity sector. It works toadvance the interests ofuniversities and to spread goodpractice throughout the highereducation sector.
Universities UKWoburn House20 Tavistock SquareLondonWC1H 9HQ
telephone+44 (0)20 7419 4111
fax+44 (0)20 7388 8649
webwww.UniversitiesUK.ac.uk
© Universities UKISBN 978 1 84036 191 9December 2008
43723 UniUK Devolution 12/11/08 13:04 Page 58