Embed Size (px)
Citation preview
Deviations from Covered Interest Rate Parity∗
Wenxin Du †
Federal Reserve Board
Alexander Tepper ‡
Columbia University
Adrien Verdelhan §
MIT Sloan and NBER
November 2016
Abstract
We �nd that deviations from the covered interest rate parity condition (CIP) imply large,
persistent, and systematic arbitrage opportunities in one of the largest asset markets in the
world. Contrary to the common view, these deviations for major currencies are not explained
away by credit risk or transaction costs. They are particularly strong for forward contracts
that appear on the banks' balance sheets at the end of the quarter, pointing to a causal
e�ect of banking regulation on asset prices. The CIP deviations also appear signi�cantly
correlated with other �xed-income spreads and much lower after proxying for banks' balance
sheet costs.
Keywords: exchange rates, currency swaps, dollar funding.
JEL Classi�cations: E43, F31, G15.
∗First Draft: November 2, 2015. The views in this paper are solely the responsibility of the authors and should not be
interpreted as re�ecting the views of the Board of Governors of the Federal Reserve System or any other person associated with
the Federal Reserve System. We thank Claudio Borio, Francois Cocquemas, Xavier Gabaix, Benjamin Hebert, Arvind Krish-
namurthy, Robert McCauley, Charles Engel, Hanno Lustig, Matteo Maggiori, Warren Naphtal, Brent Neiman, Jonathan Parker,
Thomas Philippon, Arvind Rajan, Adriano Rampini, Hyun Song Shin, and seminar participants at the Bank for International
Settlements, the Federal Reserve Board, MIT Sloan, the Federal Reserve Bank at Dallas � University of Houston Conference
on International Economics, the Federal Reserve Bank of Philadelphia, the Federal Reserve Bank of San Francisco, the Bank
of Canada, Harvard, the NBER Summer Institute, the MIT Sloan Finance Advisory Board, the International Monetary Fund,
the Third International Macro-Finance Conference at Chicago Booth, Vanderbilt, and Washington University for comments
and suggestions. All remaining errors are our own. The paper previously circulated under the title "Cross-currency Basis."†Du: Federal Reserve Board, 20th and C Streets NW, Washington, D.C. 20551. Email: [email protected].‡Tepper: Columbia Graduate School of Architecture, Planning and Preservation, 1172 Amsterdam Ave, New York, NY
10027. Email: [email protected]. A large part of the research was conducted while Tepper was working at the Federal
Reserve Bank of New York.§Verdelhan: MIT Sloan School of Management, 100 Main Street, E62-621, Cambridge, MA 02139. Email: [email protected].

1 Introduction
The foreign exchange forward and swap market is one of the largest and most liquid derivative
markets in the world with a total notional amount outstanding equal to $61 trillion and an
average daily turnover equal to $3 trillion (Bank of International Settlements, 2013, 2014).
The cornerstone of currency forward and swap pricing, presented in all economics and �nance
textbooks and taught in every class in international �nance, is the covered interest rate parity
(CIP) condition. In this paper, we document deviations from CIP post crisis and investigate
their causes.
We show that the CIP condition is systematically and persistently violated among G10
currencies, leading to signi�cant arbitrage opportunities in currency and �xed income mar-
kets since the global �nancial crisis. Our �ndings are a puzzle for all no-arbitrage models in
macroeconomics and �nance. Since the arbitrage opportunities exist at one-week horizons,
our �ndings are also a puzzle for the classic limits-of-arbitrage models that rely on long-term
market risk. The systematic patterns of the CIP violations point to the key interaction
between costly �nancial intermediation and global imbalances in funding supply and invest-
ment demand across currencies. Using a simple di�erence-in-di�erence approach, we show
that banking regulation is a key driver of the CIP deviations.
The intuition for the CIP condition relies on a simple no-arbitrage condition. For ex-
ample, an investor with U.S. dollars in hand today may deposit the dollars for one month,
earning the dollar deposit rate. Alternatively, the investor may also exchange her U.S. dollars
for some foreign currency, deposit the foreign currency and earn the foreign currency deposit
rate for one month. At the same time, the investor can enter into a one-month currency
forward contract today, which would convert the foreign currency earned at the end of the
month into U.S. dollars. If both U.S. and foreign currency deposit rates are default-free and
the forward contract has no counterparty risk, the two investment strategies are equivalent
and should thus deliver the same payo�s. Therefore, the di�erence between U.S. dollar and
foreign currency deposit rates should be exactly equal to the cost of entering the forward
1
contract, i.e. the log di�erence between the forward and the spot exchange rates, with all
rates observed at the same date.
The cross-currency basis measures the deviation from the CIP condition. It is the di�er-
ence between the direct dollar interest rate and the synthetic dollar interest rate obtained
by swapping the foreign currency into U.S. dollars. A positive (negative) currency basis
means that the direct dollar interest rate is higher (lower) than the synthetic dollar interest
rate. When the basis is zero, CIP holds. Before the global �nancial crisis, the log di�erence
between the forward and the spot rate was approximately equal to the di�erence in London
interbank o�er rates (Libor) across countries (Frenkel and Levich, 1975; Akram, Rime, and
Sarno, 2008). In other words, the Libor cross-currency basis was very close to zero. As is
by now well-known, large bases appeared during the height of the global �nancial crisis and
the European debt crisis, as the interbank markets became impaired and arbitrage capital
was limited.
We show that Libor bases persist after the global �nancial crisis among G10 currencies
and remain large in magnitude. Our sample includes the most liquid currencies, with a total
daily turnover above $2 trillion (Bank of International Settlements, 2013): the Australian
dollar, the Canadian dollar, the Swiss franc, the Danish krone, the euro, the British pound,
the Japanese yen, the Norwegian krone, the New Zealand dollar, and the Swedish krona. The
average annualized absolute value of the basis is 24 basis points at the three-month horizon
and 26 basis points at the �ve-year horizon over the 2010�2015 sample. These averages hide
large variations both across currencies and across time. In the current economic environment,
the cross-currency basis can be of the same order of magnitude as the interest rate di�erential.
For example, the �ve-year basis for the Japanese yen was close to −90 basis points at the
end of 2015, which was even greater in magnitude than the di�erence (of about −70 basis
points) between the �ve-year Libor interest rate in Japan and in the U.S.
We show that credit risk in the Libor market and the indicative nature of Libor cannot
explain away the persistence of the cross-currency basis. A common explanation for CIP
2
deviations is that Libor panels have di�erent levels of credit worthiness (e.g., Tuckman and
Por�rio, 2004). If, for example, interbank lending in yen entails a higher credit risk (due to
the average lower credit quality of yen Libor banks) than interbank lending in U.S. dollars,
the lender should be compensated for the credit risk di�erential between yen Libor and
dollar Libor, and thus the cross-currency basis needs not be zero.1 Studying the credit
default spreads of banks on interbank panels in di�erent currencies, we do not �nd much
support for this explanation of the CIP deviations.
More crucially, we document that the currency basis exists even in the absence of any
credit risk di�erence across countries and for actual interest rate quotes. To do so, we
turn �rst to general collateral repurchase agreements (repo) and then to Kreditanstalt für
Wiederaufbau (KfW) bonds issued in di�erent currencies. Repo contracts are fully collater-
alized and thus do not exhibit any credit risk. KfW bonds are fully backed by the German
government and thus exhibit very minimal credit risk, without di�erences in credit risk across
currencies. Repo and forward contracts highlight the CIP deviations at the short-end of the
yield curves, while KfW bonds and swaps focus on longer maturities. We �nd that the repo
currency basis is persistently and signi�cantly negative for the Japanese yen, the Swiss franc
and the Danish krone, and that the KfW basis is also signi�cantly di�erent from zero for
the euro, the Swiss Franc and the Japanese yen, even after taking into account transaction
costs.
The CIP deviations thus lead to persistent arbitrage opportunities free from exchange
rate and credit risks. A long-short arbitrageur may for example borrow at the U.S. dollar
repo rate or short U.S. dollar-denominated KfW bonds and then earn risk-free positive pro�ts
by investing in repo rates or KfW bonds denominated in low interest rate currencies, such
as the euro, the Swiss franc, the Danish krone or the yen, while hedging the foreign currency
risk using foreign exchange forwards or swaps. The net arbitrage pro�ts range from 6 to 19
1�Libor� rates are supposed to measure the interest rates at which banks borrow from each other. We usethe term �Libor� loosely to refer to unsecured interbank borrowing rate, which can be determined by localinterbank panels rather than the British Banker Association (now Intercontinental Exchange) Libor panels.
3
basis points on average in annualized values. The averages may appear small, but again they
hide large time variations: the standard deviation of the net arbitrage pro�ts range from
4 to 23 basis points. Moreover, the conditional volatility of each investment opportunity
is naturally zero and Sharpe ratios are thus in�nite for the �xed investment horizon of the
strategy.
After documenting the persistence of CIP deviations and the corresponding arbitrage
opportunities across a constellation of interest rates, we turn to their potential explanations.
We hypothesize that persistent CIP deviations can be explained by the combination of
increased cost of �nancial intermediation post-crisis and persistent global imbalances in
investment demand and funding supply across currencies. If �nancial intermediaries were
unconstrained, the supply of currency hedging should be perfectly elastic, and any CIP
deviations would be arbitraged away. Similarly, if the global funding and investment demand
were balanced across currencies, there would be no client demand for FX swaps to transform
funding liquidity or investment opportunities across currencies, and thus the cross-currency
basis would also be zero regardless of the supply of currency hedging. Costly �nancial
intermediation can explain why the basis is not arbitraged away post-crisis. The imbalances
in savings and investment across currencies can explain the systematic relationship between
the basis and nominal interest rates.
Consistent with our two-factor hypothesis, we �nd that the CIP deviations exhibit four
main characteristics.
First, the magnitude of the CIP deviation is particularly large for forward contracts that
are not settled before the quarter ends and thus appear on the banks' quarterly reporting.
U.S. banks report their average positions over the quarter, as well as their positions at quarter
ends, while European banks only report the latter. Our simple di�erence-in-di�erence exper-
iments exploits di�erent lags before the quarter ends and di�erent horizons of the forward
contracts. For example, one month before the end of the quarter, the CIP deviation implied
by one-month forward contracts tends to become larger than the CIP deviation implied by
4
one-week forward contracts, which at this point would not appear on the banks' quarterly
snapshots. In this example, the one-month forward contract is the �treated� asset, subject
to the European regulation, while the one-month forward contract is the �non-treated� asset.
Thus CIP deviations tend to be higher at the end of the quarter in the post-crisis sample,
and especially so for contracts that appear in the banks' balance sheets, suggesting that
banks can have a causal impact on asset prices.
Second, the spread between the interest rates on excess reserves (IOER) and the Fed
fund or U.S. Libor interest rates is a proxy for the U.S. banks' balance sheet costs. We show
that these balance sheet costs can o�set more than half of short-term CIP deviations.
Third, the cross-currency basis is correlated with other liquidity risk premia, especially
the KfW over German bund basis and the U.S. Libor tenor basis, the price of swapping the
one-month in exchange of the three-month U.S. Libor rates. The co-movement in bases meas-
ured in di�erent markets supports the role of �nancial intermediaries and likely correlated
demand shocks for dollar funding and other forms of liquidity.
Fourth, in the cross section and time series, the cross-currency basis is positively cor-
related with the level of nominal interest rates. In the cross section, high interest rate
currencies tend to exhibit positive basis while low interest rate currencies tend to exhibit
negative ones. An arbitrageur should thus borrow in high interest rate currencies and lend
in low interest currencies while hedging the currency risk � this is the opposite allocation
to the classic currency carry trade. In time-series, the currency basis tends to increase with
interest rate shocks, as measured in an event study of yield changes around monetary policy
announcements of the European Central Bank.
5
Our work is closely related to a large literature that departs from the frictionless asset
pricing benchmark and could thus provide convincing explanations of the CIP deviations.2
We �rst review the theoretical contributions and then turn to the empirical work.
On the theory side, very few papers speci�cally address the CIP deviations. Garleanu and
Pedersen (2011) build a margin-based asset pricing model and use it to study the deviations
from CIP during the crisis. Gabaix and Maggiori (2015) provide a tractable and elegant
model of exchange rate determination in the presence of moral hazard. A variant of their
model, presented in their Appendix, encompasses CIP deviations. In on-going work, Liao
(2016) models the impact of corporate issuance decisions on CIP deviations and Amador,
Bianchi, Bocola, and Perri (2016) link exchange rates and CIP deviations to central banks'
balance sheets. Our evidence on the impact of banking regulation points towards models
of intermediary-based asset pricing, as those of He and Krishnamurthy (2012, 2013) and
Brunnermeier and Sannikov (2014) in the tradition of Bernanke and Gertler (1989) and
Holmstrom and Tirole (1997). But many other friction-based models could potentially be
2An early exposition of the CIP condition appears in Lotz (1889) and much more clearly in Keynes(1923). A large literature in the 70s and 80s tests the CIP condition, notably Frenkel and Levich (1975,1977), Deardor� (1979), Dooley and Isard (1980), Callier (1981), Mohsen Bahmani-Oskooee (1985) andClinton (1988). Up to the recent global �nancial crisis, the consensus was that the CIP condition holds inthe data. Several papers study the failure of the CIP condition during the global �nancial crisis and theEuropean debt crisis (see, e.g., Baba, Packer, and Nagano, 2008; Baba, McCauley, and Ramaswamy, 2009;Co�ey, Hrung, and Sarkar, 2009; Gri�olli and Ranaldo, 2011; Bottazzi, Luque, Pascoa, and Sundaresan,2012; and Ivashina, Scharfstein, and Stein, 2015). All these papers focus on CIP deviations based on short-term money market instruments. The large cross-currency basis during the crisis appears to be linked to asevere dollar funding shortage in the presence of limits to arbitrage. The establishment of the Fed swap lineswith various foreign central banks, which alleviated the dollar shortage, signi�cantly reduced the magnitudeof the cross-currency basis (Baba and Packer, 2009; Goldberg, Kennedy, and Miu, 2011; and McGuire andvon Peter, 2012). We contribute to this literature by formally establishing secured arbitrage opportunitiesbased on persistent and systematic CIP deviations post-crisis. Building on our work, Borio, McCauley,McGuire, and Sushko (2016) link the estimated dollar hedging demand (quantities) for major currencies tothe variation in the cross-currency bases (prices).
6
relevant.3 To the best of our knowledge, however, there is no model so far that can replicate
our four main facts on CIP deviations.
On the empirical side, Adrian, Etula, and Muir (2014) and He, Kelly, and Manela (2015)
show that shocks to the equity capital ratio of �nancial intermediaries account for a large
share of the cross-sectional variation in expected returns in di�erent asset classes. Siriward-
ane (2016) shows that limited investment capital impacts pricing in the credit default swap
market. Our triple di�erence-in-di�erence tests o�er the �rst causal evidence of the e�ect of
banking regulation on asset prices and arbitrage opportunities.4
The paper is organized as follows. Section 2 de�nes and documents precisely the CIP
condition and its deviations at the short- and long-end of the yield curves. Section 3 shows
that the currency basis also exists in the absence of credit risk for repo rates and KfW bonds,
leading to clear arbitrage opportunities. Section 4 sketches a potential explanation of the
CIP deviations centered on the capital constraints of �nancial intermediaries and global im-
balances. Consistent with such potential explanation, Section 5 presents four characteristics
of the currency basis: its surge at the end of the quarters post-crisis, its high correlation
with other liquidity-based strategies in di�erent �xed-income markets, its relationship with
the IOER, and �nally its cross-sectional and time-series links with interest rates. Section 6
concludes.3The large theoretical literature on limits-to-arbitrage, surveyed in Grombs and Vayanos (2011), provides
useful frameworks, with the caveat that CIP arbitrages exist over very short time horizons over which marketrisk and collateral constraints are very limited. Focusing on the U.S. swap market, Jermann (2016) proposesa novel and attractive limits-to-arbitrage model based on the regulation-induced increased cost of holdingTreasuries. Likewise, models of market and funding liquidity, as in Brunnermeier and Pedersen (2009), ormodels of preferred habitat, as in Vayanos and Vila (2009) and Greenwood or Vayanos (2014), are potentialtheoretical frameworks to account for the CIP deviations. Our �ndings are also related to models of theglobal imbalances in safe assets, as studied in the pioneer work of Caballero, Farhi, and Gourinchas (2008,2016).
4In future research, the characteristics of the currency basis may be related to the geography of risk capitalas documented in Buraschi, Menguturk, and Sener (2015), liquidity premia, as in the work of Fontaine andGarcia (2011), Hu, Pan, and Wang (2013), and Drechsler, Savov, and Schnabl (2016), as well as the geographyof global liquidity and the role of global banks in the transmission of funding shocks across countries (e.g.,Cetorelli and Goldberg, 2011, 2012; Correa, Sapriza, and Zlate, 2012; Shin, 2012; and Bruno and Shin, 2015).
7
2 CIP Condition and Cross-Currency Basis
In this section, we review the CIP condition and de�ne the cross-currency basis as the
deviation from the CIP condition. We then document the persistent failure of the textbook
CIP condition based on Libor.
2.1 Covered Interest Rate Parity
Let y$t,t+n and yt,t+n denote the n-year risk-free interest rates in U.S. dollars and foreign
currency, respectively. The spot exchange St rate is expressed in units of foreign currency
per U.S. dollar: an increase in St thus denotes a depreciation of the foreign currency and an
appreciation of the U.S. dollar. Likewise, Ft,t+n denotes the n-year outright forward exchange
rate in foreign currency per U.S. dollar at time t. The CIP condition states that the forward
rate should satisfy:
(1 + y$t,t+n)n = (1 + yt,t+n)nSt
Ft,t+n(1)
In logs, the forward premium, ρt,t+n, is equal to the interest rate di�erence between interest
rates in the two currencies:
ρt,t+n ≡1
n(ft,t+n − st) = yt,t+n − y$t,t+n. (2)
The intuition behind the CIP condition is simple: an investor with one U.S. dollar in hand
today would own (1+y$t,t+n)n U.S. dollars n years from now by investing in U.S. dollars. But
the investor may also exchange her U.S. dollar for St units of foreign currency and invest
in foreign currency to receive (1 + yt,t+n)nSt units of foreign currency n years from now.
A currency forward contract signed today would convert the foreign currency earned into
(1+yt,t+n)nSt/Ft,t+n U.S. dollars. If both domestic and foreign notes are risk-free aside from
the currency risk and the forward contract has no counterparty risk, the two investment
8

strategies are equivalent and should thus deliver the same payo�s. All contracts are signed
today. The CIP condition is thus a simple no-arbitrage condition.5
2.2 De�nition of the Cross-Currency Basis
We de�ne the cross-currency basis, denoted xt,t+n, as the deviation from the CIP condition:
(1 + y$t,t+n)n = (1 + yt,t+n + xt,t+n)nSt
Ft,t+n. (3)
Equivalently, in logs, the currency basis is equal to:
xt,t+n = y$t,t+n − (yt,t+n − ρt,t+n). (4)
When CIP holds, the comparison of Equations (1) and (3) immediately implies that the cur-
rency basis is zero. The cross-currency basis measures the di�erence between the direct U.S.
dollar interest rate, y$t,t+n, and the synthetic dollar interest rate, yt,t+n − ρt,t+n, obtained by
converting the foreign currency interest rate in U.S. dollars using currency forward contracts.
A negative currency basis suggests that the direct U.S. dollar interest rate is lower than the
synthetic dollar interest rate by swapping the foreign currency interest rate into dollars.
As already noted, CIP holds in the absence of arbitrage. As soon as the basis is not zero,
arbitrage opportunities theoretically appear. The cash �ow diagram of this CIP arbitrage
strategy is summarized in Figure 1. In the case of a negative basis, x < 0, the dollar
arbitrageur can earn risk-free pro�ts equal to an annualized |x| percent of the trade notional
by borrowing at the direct dollar risk-free rate, investing at the foreign currency risk-free
5In the presence of transaction costs, the absence of arbitrage is characterized by two inequalities: ar-bitrage must be impossible either by borrowing the domestic currency and lending the foreign currency,or doing the opposite, hedging the currency risk with the forward contract in both cases (see Bekaert andHodrick, 2012, for a textbook exposition). As a result, the bid and ask forward rates satisfy:
F askt,t+n
Sbidt
≥(1 + ybidt,t+n)
n
(1 + y$,askt,t+n)nand
F bidt,t+n
Saskt
≤(1 + yaskt,t+n)
n
(1 + y$,bidt,t+n)n.
9
rate and signing a forward contract to convert back the foreign currency into U.S dollars. In
the case of a positive basis, the opposite arbitrage strategy of funding in the synthetic dollar
risk-free rate and investing in the direct dollar risk-free rate would also yield an annualized
risk-free pro�t equal to x percent of the trade notional. With these de�nitions in mind, we
turn now to a preliminary look at the data.
2.3 Failure of Textbook Libor-Based Covered Interest Parity
Textbook tests of the CIP condition usually rely on Libor rates.6 We document persistent
failure of Libor-based CIP after 2007 for G10 currencies at short and long maturities. As
we just saw, at short maturities less than one year, CIP violations can be computed using
Libor rates and currency forward and spot rates. At the longer maturities (typically one
year or greater), CIP violations based on Libor are directly quoted as spreads on Libor
cross-currency basis swaps.
2.3.1 Short-Term Libor Cross-Currency Basis
We de�ne the Libor basis as equal to:
xLibort,t+n ≡ y$,Libort,t+n − (yLibort,t+n − ρt,t+n), (5)
where the generic dollar and foreign currency interest rates of Equation (4) are replaced
with Libor rates. We obtain daily spot exchange rates and forward points from Bloomberg
using London closing rates for G10 currencies.7 Mid-rates (average of bid and ask rates) are
used for benchmark basis calculations. Daily Libor/interbank �xing rates are also obtained
6Eurocurrency deposit rates based in London have long been used as benchmark interest rates to testthe CIP condition, starting with the work of Frenkel and Levich (1975), because eurocurrency deposits arehighly fungible and avoid many barriers to the free �ow of capital, such as di�erential domestic interest rateregulations, tax treatments, and reserve regulations. Akram, Rime, and Sarno (2008) con�rm the high-degreeof validity of the CIP condition using bank deposit rates in the early 2000s sample.
7In practice, since forward points are often quoted with a higher level of precision that outright forwards,we compute the forward premium ρt,t+n directly from forward points, de�ned as F t,t+n = St + FPt,t+n.Thus, the forward premium is: ρt,t+n ≈ (1/n)FPt,t+n/St.
10

from Bloomberg. Figure 4 presents the three-month Libor basis for G10 currencies between
January 2000 and February 2016.
The three-month Libor basis was very close to zero for all G10 currencies before 2007.
As is well-known, during the global �nancial crisis (2007�2009), there were large deviations
from Libor CIP, especially around the Lehman bankruptcy announcement, with some bases
reaching −200 basis points. But the deviations from Libor CIP did not disappear when
the crisis abated. In the aftermath of the crisis, since 2010, the three-month Libor basis
has been persistently di�erent from zero. Panel A of Table 1 summarizes the mean and
standard deviation of the Libor currency basis across three di�erent periods: 2000�2006,
2007�2009, and 2010�2016. Pre-crisis, the Libor basis was not signi�cantly di�erent from
zero; post-crisis, it is. Moreover, a clear cross-sectional dispersion in the level of the basis
appears among G10 currencies. The Australian dollar (AUD) and the New Zealand dollar
(NZD) exhibit on average a positive basis of 25 and 33 basis points, while the Swiss franc
(CHF), Danish krone (DKK), euro (EUR), Japanese yen (JPY), Norwegian krone (NOK),
and Swedish krona (SEK) exhibit on average negative bases all below −20 basis points.
Among the G10 currencies, the Danish krone has the most negative three-month Libor basis
post crisis, with an average of −61 basis points, a stark contrast to its pre-crisis average of
1 basis point.
2.3.2 Long-Term Libor Cross-Currency Basis
At long maturities, the long-term CIP deviation based on Libor is given by the spread on the
cross-currency basis swap. A cross-currency basis swap involves an exchange of cash �ows
linked to �oating interest rates referenced to interbank rates in two di�erent currencies, as
well as an exchange of principal in two di�erent currencies at the inception and the maturity
of the swap. Let us take a simple example. Figure 2 describes the cash �ow diagram for
the yen/U.S. dollar cross-currency swap on $1 notional between Bank A and Bank B. At
the inception of the swap, Bank A receives $1 from Bank B in exchange of USt. At the
11
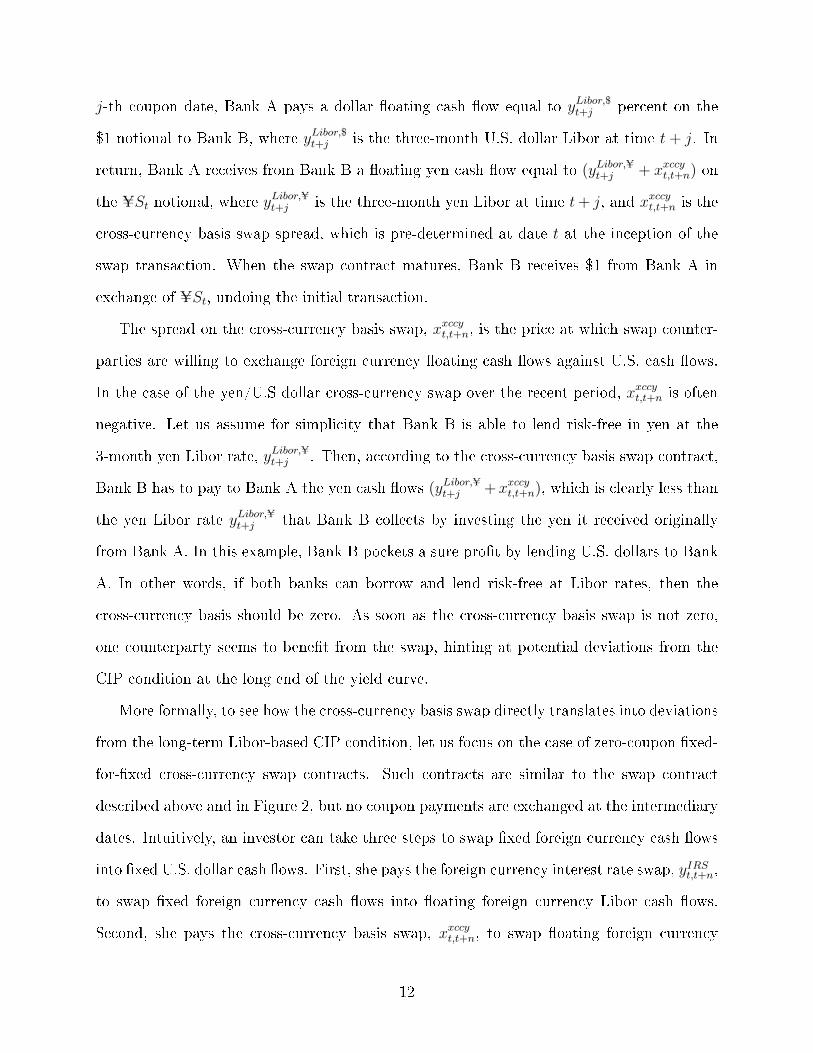
j-th coupon date, Bank A pays a dollar �oating cash �ow equal to yLibor,$t+j percent on the
$1 notional to Bank B, where yLibor,$t+j is the three-month U.S. dollar Libor at time t + j. In
return, Bank A receives from Bank B a �oating yen cash �ow equal to (yLibor,Ut+j + xxccyt,t+n) on
the USt notional, where yLibor,Ut+j is the three-month yen Libor at time t+ j, and xxccyt,t+n is the
cross-currency basis swap spread, which is pre-determined at date t at the inception of the
swap transaction. When the swap contract matures, Bank B receives $1 from Bank A in
exchange of USt, undoing the initial transaction.
The spread on the cross-currency basis swap, xxccyt,t+n, is the price at which swap counter-
parties are willing to exchange foreign currency �oating cash �ows against U.S. cash �ows.
In the case of the yen/U.S dollar cross-currency swap over the recent period, xxccyt,t+n is often
negative. Let us assume for simplicity that Bank B is able to lend risk-free in yen at the
3-month yen Libor rate, yLibor,Ut+j . Then, according to the cross-currency basis swap contract,
Bank B has to pay to Bank A the yen cash �ows (yLibor,Ut+j +xxccyt,t+n), which is clearly less than
the yen Libor rate yLibor,Ut+j that Bank B collects by investing the yen it received originally
from Bank A. In this example, Bank B pockets a sure pro�t by lending U.S. dollars to Bank
A. In other words, if both banks can borrow and lend risk-free at Libor rates, then the
cross-currency basis should be zero. As soon as the cross-currency basis swap is not zero,
one counterparty seems to bene�t from the swap, hinting at potential deviations from the
CIP condition at the long end of the yield curve.
More formally, to see how the cross-currency basis swap directly translates into deviations
from the long-term Libor-based CIP condition, let us focus on the case of zero-coupon �xed-
for-�xed cross-currency swap contracts. Such contracts are similar to the swap contract
described above and in Figure 2, but no coupon payments are exchanged at the intermediary
dates. Intuitively, an investor can take three steps to swap �xed foreign currency cash �ows
into �xed U.S. dollar cash �ows. First, she pays the foreign currency interest rate swap, yIRSt,t+n,
to swap �xed foreign currency cash �ows into �oating foreign currency Libor cash �ows.
Second, she pays the cross-currency basis swap, xxccyt,t+n, to swap �oating foreign currency
12
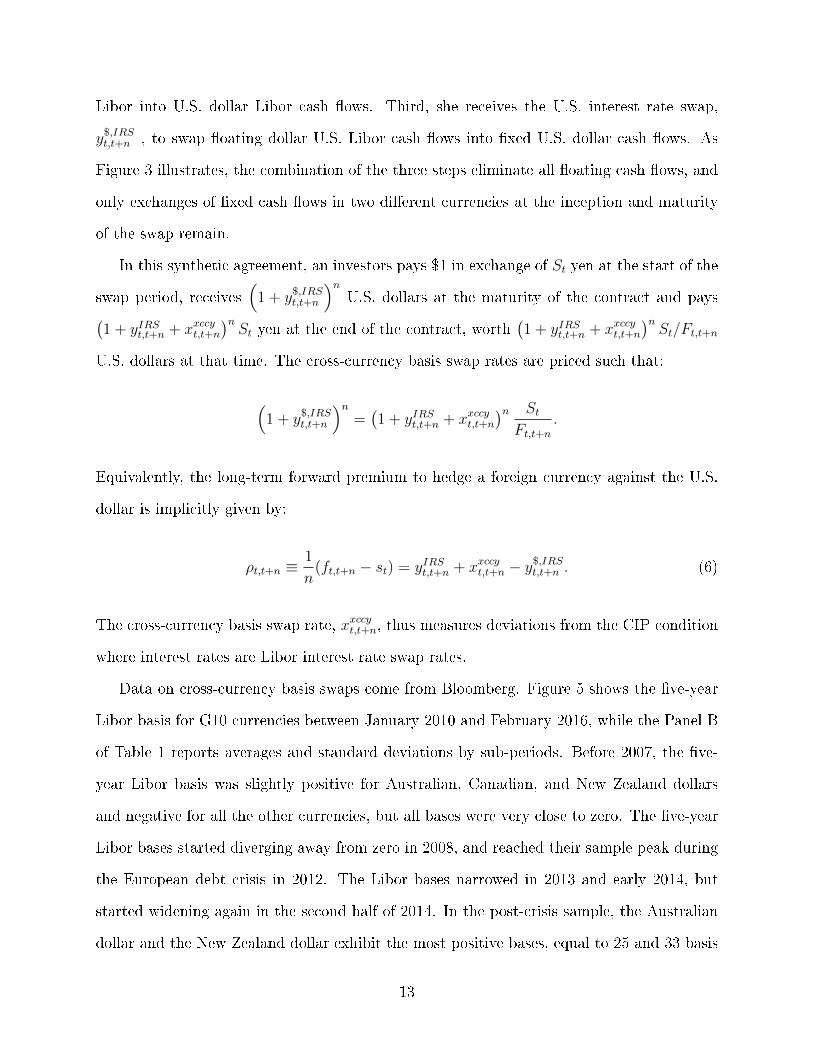
Libor into U.S. dollar Libor cash �ows. Third, she receives the U.S. interest rate swap,
y$,IRSt,t+n , to swap �oating dollar U.S. Libor cash �ows into �xed U.S. dollar cash �ows. As
Figure 3 illustrates, the combination of the three steps eliminate all �oating cash �ows, and
only exchanges of �xed cash �ows in two di�erent currencies at the inception and maturity
of the swap remain.
In this synthetic agreement, an investors pays $1 in exchange of St yen at the start of the
swap period, receives(
1 + y$,IRSt,t+n
)nU.S. dollars at the maturity of the contract and pays(
1 + yIRSt,t+n + xxccyt,t+n
)nSt yen at the end of the contract, worth
(1 + yIRSt,t+n + xxccyt,t+n
)nSt/Ft,t+n
U.S. dollars at that time. The cross-currency basis swap rates are priced such that:
(1 + y$,IRSt,t+n
)n=(1 + yIRSt,t+n + xxccyt,t+n
)n StFt,t+n
.
Equivalently, the long-term forward premium to hedge a foreign currency against the U.S.
dollar is implicitly given by:
ρt,t+n ≡1
n(ft,t+n − st) = yIRSt,t+n + xxccyt,t+n − y
$,IRSt,t+n . (6)
The cross-currency basis swap rate, xxccyt,t+n, thus measures deviations from the CIP condition
where interest rates are Libor interest rate swap rates.
Data on cross-currency basis swaps come from Bloomberg. Figure 5 shows the �ve-year
Libor basis for G10 currencies between January 2010 and February 2016, while the Panel B
of Table 1 reports averages and standard deviations by sub-periods. Before 2007, the �ve-
year Libor basis was slightly positive for Australian, Canadian, and New Zealand dollars
and negative for all the other currencies, but all bases were very close to zero. The �ve-year
Libor bases started diverging away from zero in 2008, and reached their sample peak during
the European debt crisis in 2012. The Libor bases narrowed in 2013 and early 2014, but
started widening again in the second half of 2014. In the post-crisis sample, the Australian
dollar and the New Zealand dollar exhibit the most positive bases, equal to 25 and 33 basis
13
points on average, while the Japanese yen and the Danish krone exhibit the most negative
bases, equal to −56 and −42 basis points on average. The Swiss franc and the euro also
experience very negative bases, with average values less than −25 basis points.
At short and long horizons, CIP deviations abound post-crisis. But the textbook treat-
ment of these deviations point to potential transaction costs and default risk, not necessarily
to arbitrage opportunities.
3 CIP-Based Arbitrage Opportunities
In this section, we start with a short description of the main issues of a Libor-based in-
vestment strategy and then address those issues using repo contracts and bonds issued by
KfW and other multi-currency issuers. We demonstrate that the existence of the repo and
KfW basis implies CIP arbitrage opportunities free from currency and credit risk, even after
taking into account transaction costs.
3.1 Credit Risk in the Libor CIP Arbitrage
A potential arbitrageur, noticing for example a negative Libor CIP basis on the yen/dollar
market, would need to borrow in U.S. dollars at the dollar Libor rate, invest in yen at the
yen Libor rate and enter a forward contract to convert back yen into U.S dollars at the end
of her investment period. The investment strategy raises immediately three questions. First,
can the arbitrageur really borrow and lend at the Libor rates? Libor rates are only indicative
and do not correspond to actual transactions. The actual borrowing rate in U.S. dollars of
the arbitrageur may thus be higher than the indicative Libor rate, even in the absence of any
manipulation. More generally, transaction costs exist for both spot and derivative contracts
and may lower the actual returns. Second, is the arbitrageur taking on credit risk when
lending at the yen Libor rate? Libor rates are unsecured: if the arbitrageur faces a risk
of default on her loan, she should be compensated by a default risk premium, which may
14
then account for the CIP deviations. Third, is the arbitrageur taking on counterparty risk
when entering an exchange rate forward contract? This last concern can be ruled out, as the
impact of counterparty risk on the pricing of forwards and swaps is negligible due to the high
degree of collateralization. As speci�ed in the Credit Support Annex of the International
Swap and Derivative Association, the common market practice is to post variation margins
in cash with the amount equal to the mark-to-market value of the swap. Initial margins are
also posted to cover the gap risk not covered by the variation margins. In the event of a
counterparty default, the collateral is seized by the other counterparty to cover the default
cost.8
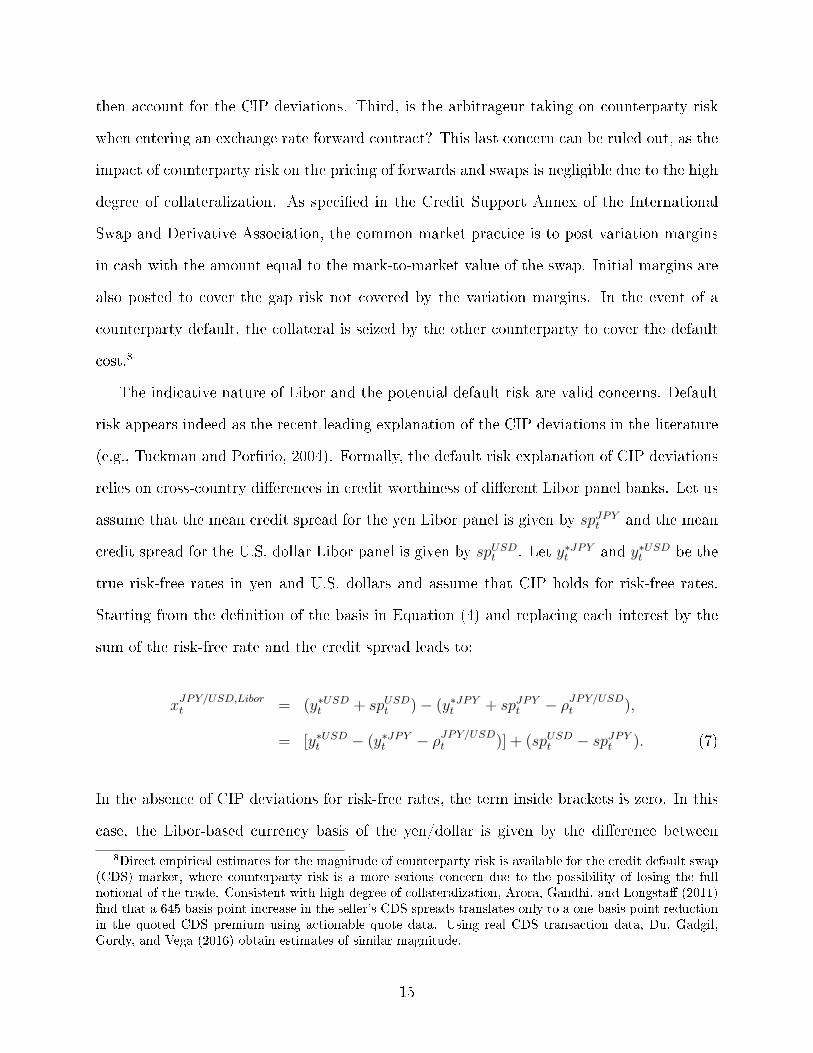
The indicative nature of Libor and the potential default risk are valid concerns. Default
risk appears indeed as the recent leading explanation of the CIP deviations in the literature
(e.g., Tuckman and Por�rio, 2004). Formally, the default risk explanation of CIP deviations
relies on cross-country di�erences in credit worthiness of di�erent Libor panel banks. Let us
assume that the mean credit spread for the yen Libor panel is given by spJPYt and the mean
credit spread for the U.S. dollar Libor panel is given by spUSDt . Let y∗JPYt and y∗USDt be the
true risk-free rates in yen and U.S. dollars and assume that CIP holds for risk-free rates.
Starting from the de�nition of the basis in Equation (4) and replacing each interest by the
sum of the risk-free rate and the credit spread leads to:
xJPY/USD,Libort = (y∗USDt + spUSDt )− (y∗JPYt + spJPYt − ρJPY/USDt ),
= [y∗USDt − (y∗JPYt − ρJPY/USDt )] + (spUSDt − spJPYt ). (7)
In the absence of CIP deviations for risk-free rates, the term inside brackets is zero. In this
case, the Libor-based currency basis of the yen/dollar is given by the di�erence between
8Direct empirical estimates for the magnitude of counterparty risk is available for the credit default swap(CDS) market, where counterparty risk is a more serious concern due to the possibility of losing the fullnotional of the trade. Consistent with high degree of collateralization, Arora, Gandhi, and Longsta� (2011)�nd that a 645 basis point increase in the seller's CDS spreads translates only to a one basis point reductionin the quoted CDS premium using actionable quote data. Using real CDS transaction data, Du, Gadgil,Gordy, and Vega (2016) obtain estimates of similar magnitude.
15
credit risk in dollar and yen Libor panels:
xJPY/USD,Libort = spUSDt − spJPYt . (8)
Therefore, the yen basis can be negative if the yen Libor panel is riskier than the U.S. Libor
panel. We test this hypothesis by regressing changes in the Libor basis ∆xi,Libort for currency
i on changes in the mean credit default swap spreads (CDS) between banks on the interbank
panel of currency i and the dollar panel:
∆xi,Libort = αi + β∆(cdsit − cdsUSDt ) + εit. (9)
We use weekly changes in �ve-year Libor cross-currency basis swaps and �ve-year CDS
of banks since 2007. The list of banks on the interbank panels included in our study is
in Appendix A. If CDS measure credit spreads perfectly, Equation (8) suggests a slope
coe�cient of −1 and an R2 of 1. Table 2 reports the regression results from January 2007
to January 2016. In the pooled panel regression with currency �xed e�ects reported in
the �rst column, the coe�cient on the CDS spread di�erential is negligible and statistically
insigni�cant from zero. Results based on individual currencies in the following columns show
that the slope coe�cient is only signi�cantly negative for the Swiss franc and euro. In all
the other cases, the slope coe�cient are either insigni�cant or positive. Even in the case
of the Swiss franc and the euro, the negative coe�cients on the CDS di�erential are far
from being equal to −1. In all cases, R2 are tiny. Assuming that bank CDS proxy for the
credit risk of potential CIP arbitrageurs, there is therefore some doubt that the credit spread
di�erential is the most important driver for the Libor cross-currency basis of G10 currencies
in the post-crisis period.9 We rule out credit risk by turning to repo contracts.
9The credit spread di�erential, however, has a much more signi�cant e�ect on the currency basis ofemerging market currencies.
16
3.2 Repo Basis
At short maturities, one way to eliminate the credit risk associated with Libor-based CIP
is to use secured borrowing and lending rates from the repo markets. We thus use general
collateral (GC) repo rates in U.S. dollars and foreign currencies to construct an alternative
currency basis measure.
A GC repo is a repurchase agreement in which the cash lender is willing to accept a
variety of Treasury and agency securities as collateral. Since GC assets are of high quality
and very liquid, GC repo rates are driven by the supply and demand of cash, as opposed to
the supply and demand of individual collateral assets.
Given the U.S. dollar GC repo rate y$,Repot,t+n and the foreign currency GC repo rate yRepot,t+n,
the general de�nition of the basis in Equation (4) leads to the following repo basis:
xRepot,t+n = y$,Repot,t+n − (yRepot,t+n − ρt,t+n). (10)
Since the bulk of repo transactions are concentrated at very short maturities, we focus on
the repo basis at the one-week horizon. Our data cover the Swiss, Danish, Euro, Japanese,
and U.S. repo markets.10
Figure 6 reports the one-week Libor and repo basis for these markets since 2009. The
repo basis tracks the Libor basis very closely for the Swiss Franc and the yen, and remains
negative throughout the sample. For the Danish krone and the euro, the repo basis was
closer to zero than the Libor basis during the peak of the European debt crisis, but it tracks
10U.S. bid and ask repo rates come from the Thomson Reuters Tick History database. The mid rates arevery close to the daily GC repo quotes from JP Morgan (obtained from Morgan Markets), one of the onlytwo clearing banks to settle tri-party U.S. repo markets. The euro mid repo data based on German bunds ascollateral are obtained from Bloomberg. Similar series from JP Morgan are very close the Bloomberg series,but shorter. Swiss franc mid repo and Danish krone bid and ask repo rates also come from Bloomberg. TheJapanese repo rates come from the Bank of Japan and the Japan Securities and Dealer Association. Bid andask rates on euro repos are available from Thomson Reuters Eikon. We do not use the Thomson ReutersEikon GC euro rates in our baseline calculation because eligible collateral also includes sovereign bonds inother European countries besides the German bunds. Thomson Reuters Eikon GC repo rates are persistentlyhigher than the Bloomberg rates, and thus imply larger arbitrage pro�ts than the reported results.
17
the Libor basis very closely overall. Most of the time, the Libor- and repo-based deviations
from CIP are undistinguishable from each other.
The �rst two columns of Table 3 report the annualized mean and standard deviation of
Libor- and repo-based bases during the January 2009 to February 2016 period. The Danish
krone exhibits the most negative mean repo basis, equal to −43 basis points if Libor-based
and −34 basis points if repo-based. The euro exhibits the least negative mean repo basis
equal to −10 basis points with repo rates and −19 with Libor rates. For the Swiss franc,
the Libor and repo rates deliver similar basis: −20 and −23 basis points. For the yen, the
repo basis is larger for repo than for Libor rates: −22 vs −17 basis points. Clearly, CIP
deviations exist even for interest rates that are free of credit risk. The third column of Table
3 reports the same summary statistics but conditional on a negative basis. The repo basis is
negative 99% of the days for the swiss franc, 96% for the Danish krone and 100% for the yen;
it is negative 84% of the time for the euro. As a result, the conditional and unconditional
average basis are close, ranging from −13 basis points for the euro to −35 basis points for
the Danish krone.
A negative basis entices the arbitrageur to borrow at the U.S. dollar GC repo rate and
invest in the foreign currency GC repo rate, while paying the forward premium to hedge
the foreign currency exposure. A positive basis suggests the opposite strategy, borrowing at
the foreign currency rate, receiving the forward premium, and investing in the U.S. dollar
rate. The arbitrage pro�ts under the negative and positive arbitrage strategies, denoted by
πRepo−and πRepo+, are thus:
πRepo−t,t+n ≡ [yRepot,t+n,Bid − (1/n)× FPt,t+n,Ask/St,Bid]− y$,Repot,t+n,Ask, (11)
πRepo+t,t+n ≡ y$,Repot,t+n,Bid − [yRepot,Ask − (1/n)× FPt,t+n,Bid/St,t+n,Ask]. (12)
We assume that the transaction cost for each step of the arbitrage strategy is equal to one
half of the posted bid-ask spread. We take into account bid-ask spreads on all forward and
18
spot contracts and a conservative bid-ask spread for the U.S. dollar repo. The average bid-
ask spread for U.S. repo used in our calculation is about 9 basis points, which is signi�cantly
higher than the 4 basis points bid-ask spread quoted on Tullett Prebon. Transaction costs
for Danish repos are also taken into account with signi�cantly wider average bid-ask spreads
equal to 19 basis points. The Bloomberg series used in our repo basis calculations do not
contain bid-ask spreads for the euro, Swiss franc and yen. In the case of euro repos, data
from Thomson Reuters Eikon suggest that the average bid-ask spread is about 6 basis points.
We do not have bid-ask spreads information available for the Swiss franc and the yen.
The fourth column of Table 3 reports the net pro�ts obtained from the negative basis
arbitrage strategy, which is implemented provided that the ex-ante pro�ts are positive. The
average annualized pro�ts range from 9 to 18 basis points after taking into transaction costs.
The pro�ts vary over time, with standard deviations ranging from 8 basis points to 23 basis
points. The arbitrage pro�ts are positive for the majority of the sample window. The
conditional volatility of each arbitrage strategy is again naturally zero, and the conditional
Sharpe ratio is in�nite.
The magnitude of the arbitrage pro�ts is signi�cant given the sheer size of repo markets
in the United States, Europe and Japan. In 2015, the total size of the U.S. repo market
is estimated to be around $2.2 trillion with $1.5 trillion of repos based on GC collateral.
(Baklanova, Copeland, and McCaughrin, 2015). In Japan, the total size of the repo market
is about $1 trillion with $0.5 trillion GC repos (Sato, 2015). Survey results reported by the
International Capital Markets Association (ICMA, 2016) suggest that the total size of the
repo market in Europe is about $3 trillion, of which the euro accounts for about $1.8 trillion
of the cash currency and government securities account for about $2.1 billion of collaterals.
On the other hand, the Danish krone and Swiss franc repo markets are much smaller, with
a combined size of less than $75 billion.
Repo contracts are generally characterized by their lending rates and the haircut rates
applied to the collateral. Yet, for three out of our �ve repo markets (Japan, Switzerland, and
19
U.S.), no haircuts are customary for GC repo contracts involving Treasuries. In the U.S.,
such repo contracts account for more than half of the inter-dealer transactions involving
some Treasury collateral. The large CIP deviations between the Japanese and U.S. repo
markets thus cannot be due to haircut rates. Haircuts exist on U.S. tri-party repo contracts
and euro GC repo contracts, but they appear stable and similar across countries.11 We do
not have haircut rates for the Danish Krone, but for the other markets, the short-term CIP
deviations do not appear linked to variations in haircut rates.
3.3 KfW Basis
We turn now to CIP deviations at the long end of the yield curves. GC repo contracts
do not exist for long maturities but we construct an alternative long-term currency basis by
comparing direct dollar yields on dollar denominated debt and synthetic dollar yields on debt
denominated in other currencies for the same risk-free issuer and the same maturity in years.
To do so, we focus on bonds issued by KfW, a German government-owned development bank,
with all its liabilities fully backed by the German government. KfW is a very large multi-
currency issuer, with an annual issuance of around $70 billion and $370 billion of bonds
outstanding. Schwartz (2015) provides more details on the KfW bonds, comparing them
to German government bonds to study their liquidity premium. Instead, we compare KfW
bonds of similar maturity issued in di�erent currencies.12
For the simplicity of exposition, we consider a world with zero-coupon yield curves and
swap rates. Detailed calculations involving coupon bearing bonds are in Appendix B.1.
11In the U.S. tri-party repo market, haircuts have been very stable at 2% for any Treasury collateral. Inthe case of the euro GC repo market, the leading electronic trading platform EUREX applies haircuts set bythe ECB in its re�nancing operations. The ECB haircuts vary with the credit quality and maturity of thecollateral. Throughout our sample period, the haircuts on German bund collateral changed only slightly oncein 2013. Early in the sample, haircuts on German Treasury collateral for the remaining maturity bracketsare 0.5% (0�1 years), 1.5% (1�3 years), 2.5% (3�5 years), 3% (5�7 years), 4% (7�10 years) and 5.5% (>10years). On July 17, 2013, the ECB changed haircuts on German Treasury collateral to 0.5% (0-1 years),1 (1-3 years), 1.5% (3�5 years), 2% (5�7 years), 3% (7�10 years) and 5% (>10 years). Haircuts exist onGerman bunds with remaining maturities of 5 to 7 years are thus comparable to the 2% haircut rate in theU.S. tri-party repo market.
12Very similar results can be obtained for the European Investment Bank, a AAA-rated supranationalagency.
20

Following the general de�nition of the basis in Equation (2), the KfW cross-currency basis
is the di�erence between the direct borrowing cost of KfW in U.S. dollars and the synthetic
borrowing cost of KfW in a foreign currency j:
xKfWt,t+n = y$,KfWt,t+n −(yj,KfWt,t+n − ρ
jt,t+n
), (13)
where y$,KfWt,t+n and yj,KfWt,t+n denote the zero-coupon yields on KfW bonds denominated in U.S.
dollars and foreign currency j.
The �rst column of Table 4 reports summary statistics on the KfW basis during the
January 2009 to June 2015 period. The mean post-crisis KfW basis is very close to zero
for the Australian dollar (0.8 basis points) but is signi�cantly negative for the other three
currencies: −21 basis points for the Swiss franc, −15 basis points for the euro, and −35 basis
points for the yen. The second column of Table 4 reports similar summary statistics for the
basis conditional on a positive basis for the Australian dollar and a negative basis for the
other three currencies: while the Australian dollar basis is only positive 59% of the time,
the other bases are negative at least 94% of the sample. As a result, the average conditional
basis is 9 basis points for the Australian dollar, and close to their unconditional values for
the other currencies: −23 basis points for the Swiss franc, −16 basis points for the euro, and
−35 basis points for the yen. These bases point to potential arbitrage strategies.
When the KfW basis is negative, a potential arbitrage strategy would be to invest in the
KfW bond denominated in foreign currency, pay the cross-currency swap to swap foreign
currency cash �ows into U.S. dollars, and short-sell the KfW bond denominated in U.S.
dollars. When the KfW basis is positive, the arbitrage strategy would be the opposite.
Arbitrage pro�ts under the negative and positive strategies, denoted by πKfW−t,t+n and πKfW+t,t+n ,
21
are:
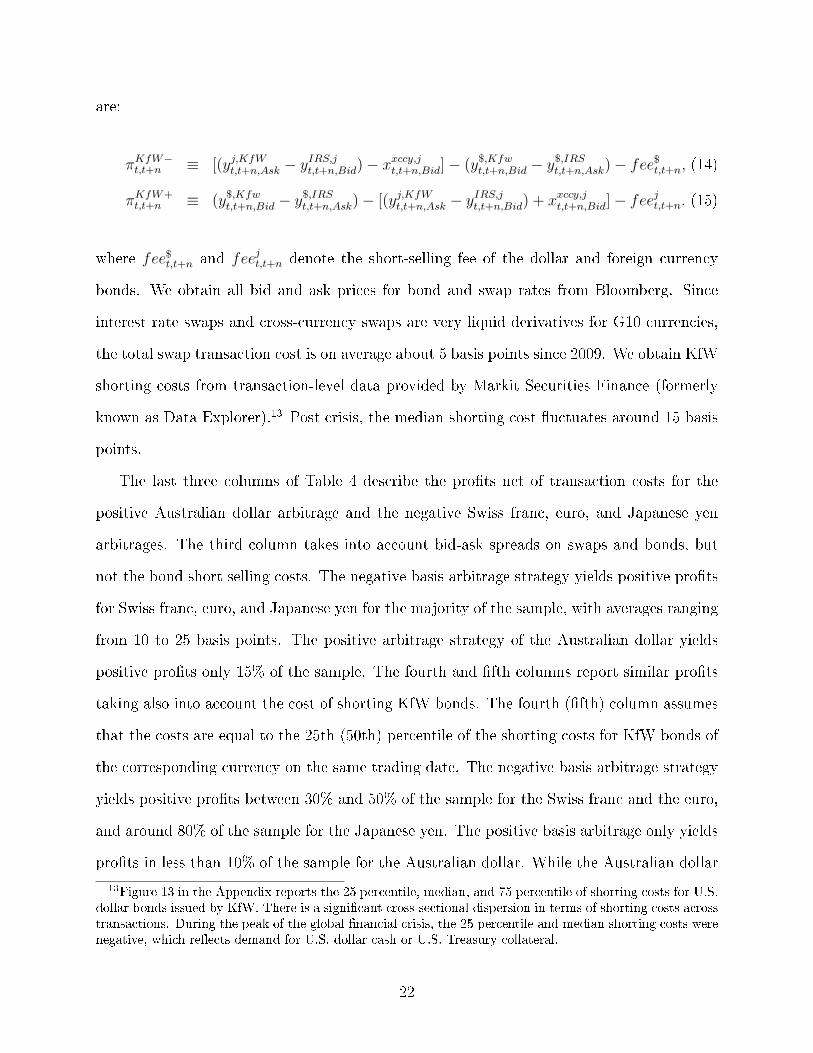
πKfW−t,t+n ≡ [(yj,KfWt,t+n,Ask − yIRS,jt,t+n,Bid)− x
xccy,jt,t+n,Bid]− (y$,Kfwt,t+n,Bid − y
$,IRSt,t+n,Ask)− fee
$t,t+n, (14)
πKfW+t,t+n ≡ (y$,Kfwt,t+n,Bid − y
$,IRSt,t+n,Ask)− [(yj,KfWt,t+n,Ask − y
IRS,jt,t+n,Bid) + xxccy,jt,t+n,Bid]− fee
jt,t+n. (15)
where fee$t,t+n and feejt,t+n denote the short-selling fee of the dollar and foreign currency
bonds. We obtain all bid and ask prices for bond and swap rates from Bloomberg. Since
interest rate swaps and cross-currency swaps are very liquid derivatives for G10 currencies,
the total swap transaction cost is on average about 5 basis points since 2009. We obtain KfW
shorting costs from transaction-level data provided by Markit Securities Finance (formerly
known as Data Explorer).13 Post crisis, the median shorting cost �uctuates around 15 basis
points.
The last three columns of Table 4 describe the pro�ts net of transaction costs for the
positive Australian dollar arbitrage and the negative Swiss franc, euro, and Japanese yen
arbitrages. The third column takes into account bid-ask spreads on swaps and bonds, but
not the bond short selling costs. The negative basis arbitrage strategy yields positive pro�ts
for Swiss franc, euro, and Japanese yen for the majority of the sample, with averages ranging
from 10 to 25 basis points. The positive arbitrage strategy of the Australian dollar yields
positive pro�ts only 15% of the sample. The fourth and �fth columns report similar pro�ts
taking also into account the cost of shorting KfW bonds. The fourth (�fth) column assumes
that the costs are equal to the 25th (50th) percentile of the shorting costs for KfW bonds of
the corresponding currency on the same trading date. The negative basis arbitrage strategy
yields positive pro�ts between 30% and 50% of the sample for the Swiss franc and the euro,
and around 80% of the sample for the Japanese yen. The positive basis arbitrage only yields
pro�ts in less than 10% of the sample for the Australian dollar. While the Australian dollar
13Figure 13 in the Appendix reports the 25 percentile, median, and 75 percentile of shorting costs for U.S.dollar bonds issued by KfW. There is a signi�cant cross-sectional dispersion in terms of shorting costs acrosstransactions. During the peak of the global �nancial crisis, the 25 percentile and median shorting costs werenegative, which re�ects demand for U.S. dollar cash or U.S. Treasury collateral.
22
does not exhibit signi�cant arbitrage opportunities net of transaction costs, the Swiss franc,
euro, and Japanese yen clearly do. Assuming that arbitrageurs incur the median shorting
fees prevalent on the day of their transaction, average pro�ts range from 6 to 18 basis points,
with standard deviations ranging from 5 to 11 basis points. Again, the conditional volatility
of such strategies is zero and the conditional Sharpe ratio is in�nite for the �xed investment
horizon of the bonds.
Can cross-country di�erences in the liquidity of KfW bonds explain the CIP deviations?
The answer depends on the currencies. The euro and the U.S. dollar are the most important
funding currencies for KfW, followed by the British pound and the Australian dollar. Cur-
rently, there are about $170 billion euro-denominated KfW bonds outstanding and $130 bil-
lion dollar-denominated bonds outstanding. The liquidity of euro-denominated KfW bonds
is at least comparable, if not better than the liquidity of dollar-denominated bonds. In
addition, the Australian dollar market, with the amount outstanding around $21 billion, is
signi�cantly less liquid than the U.S. dollar market. Therefore, on the one hand, liquidity
di�erential across currencies can neither explain the positive arbitrage pro�ts of going long
in the euro bonds and shorting the U.S. dollar bonds, nor can it explain the positive pro�ts
of going long the U.S. dollar bonds and shorting the Australian dollar bonds. On the other
hand, the Swiss franc and the Japanese yen markets are comparatively small with total
amounts outstanding of less than $5 billion. Thus liquidity di�erential can be a potential
factor in explaining the positive pro�ts of going long in the more illiquid yen and Swiss
franc KfW bonds and shorting the more liquid dollar KfW bonds. The similarities between
the CIP deviations across interest rates (Libor, repo, and overnight interest rate swaps),
however, suggest that liquidity di�erences in KfW is not the main culprit.
Overall, deviations from CIP are present in many currency and �xed income markets, of-
ten leading to signi�cant arbitrage opportunities. In the next section, we review the potential
causes of such arbitrage opportunities.
23
4 Potential Explanations
Deviations from CIP are at odds with a frictionless �nancial market. In this section, we hypo-
thesize that the persistent and systematic CIP deviations can be explained by a combination
of two factors: (1) costly �nancial intermediation, which a�ects the supply of exchange rate
forwards and swaps, and (2) international imbalances in investment demand and funding
supply across currencies, which a�ect the demand for exchange rate forwards and swaps.
The absolute value of the basis measures the cost of hedging subject to supply and demand
side shocks.
4.1 Costly Financial Intermediation
Before the global �nancial crisis, global banks actively arbitraged funding costs in the in-
terbank markets across currencies and enforced the CIP condition. Since the crisis, a wide
range of regulatory reforms has signi�cantly increased the banks' balance sheet costs as-
sociated with arbitrage and market making activities. Bank regulations likely a�ect other
non-regulated entities, such as hedge funds, increasing the cost of leverage for the overall
�nancial market. We consider more speci�cally how the following regulation a�ects the CIP
arbitrages: (i) risk-weighted capital requirements, (ii) non-risk weighted capital requirements
(for example, the leverage ratio), and (iii) other �nancial regulations, such as the restrictions
on proprietary trading.
Risk-weighted Capital Requirements First, from the perspective of risk-weighted cap-
ital, global banks face signi�cantly higher capital requirements since the global �nancial
crisis. For example, for the eight U.S. globally systematically important banks (G-SIBs), the
Tier 1 capital ratio increased from 4% pre-crisis to the 9.5%�13% range under Basel III, and
the total capital ratio increased from 8% to the 11.5%�15% range.14 In addition to higher
14The breakdown of the capital ratio under the U.S. implementation of Basel III is as follows: 4.5%minimum common equity Tier 1 (CET1) capital, 1.5% additional Tier 1 capital, 2% Tier 2 capital, 2.5%CET1 capital conservation bu�er and 1% to 4.5% CET1 G-SIB surcharge.
24
capital ratios against the risk-weighted assets (RWA), the estimation of the RWA itself also
increased signi�cantly due to more stringent capital rules and the higher volatility of the
cross-currency basis.
The central component of the RWA calculation for a CIP trade is the 99% Value-at-Risk
(VaR) measure based on the 10-business-day holding period returns, typically calculated
over a sample window that corresponds to the past calendar year. Since one-week arbitrage
opportunities exhibit zero VaR, constraints about RWA only matter for long-term CIP ar-
bitrages. Basel II.5 (e�ective January 2013 in the United States) introduced an additional
�stress-VaR� (SVaR) calibrated for the stress period. As Figure 5 shows, the cross-currency
basis became signi�cantly more volatile after the crisis, thus increasing the VaR on the CIP
trade.
Table 5 illustrates the increase in capital charges against a �ve-year Libor CIP trade in
recent years. For simplicity, we assume that only VaR and SVaR matter for RWA, while
ignoring all other add-on risk charges. The �rst column reports the 99% VaR measure for
the trade based on the 10-business-day holding period; the VaR is annualized (multiplied by
26). The VaR measure was below 5% before the crisis, but increased to 20% during the peak
of the crisis and remained elevated after the crisis. The second column reports the SVaR,
implemented in January 2013 in the United States under Basel II.5, which equals the VaR
in 2009. The third column reports the minimum total capital ratio for U.S. banks. Finally,
the fourth column presents the total capital charges against the CIP trade. It is obtained
by multiplying the sum of VaR and SVaR by the minimum capital ratio and scaling by a
factor of 12.5 times 3, as speci�ed by the Basel rules. Capital charges against the �ve-year
CIP trade increase dramatically from less than 0.4% before the crisis to more than 4% of
the trade notional after both Basel II.5 and Basel III went into e�ect. In other words, banks
engaging in CIP arbitrages could trade a volume equal to 250 times their equity before the
crisis; now, they can only trade a volume equal to 25 times their equity. While the RWA is
25
likely to be very small for short-term CIP arbitrage, it appears as a signi�cant concern for
long-term CIP arbitrage.
Non-risk-weighted Capital Requirements Second, the leverage ratio requires banks to
hold a minimum amount of capital against all on-balance-sheet assets and o�-balance-sheet
exposure, regardless of their risk. Short-term CIP trades have very little market risk, but
but still expand bank balance sheets and thus increase the leverage ratio. For foreign banks,
the leverage ratio did not exist before the crisis; it is now equal to 3% under Basel III. For
U.S. banks, even though the leverage ratio existed before the crisis, the ratio became more
stringent after the crisis with the introduction of the supplementary leverage ratio, which
equals 6% for systematically important �nancial institutions. The leverage ratio requirement
is likely to be acting as the constraint on the bank balance sheet (Du�e, 2016). If the leverage
ratio is equal to 3% and binds, a simple back of the envelope approximation illustrates its
impact: if we assume that banks need to hold 3% of their capital against the CIP arbitrage
trades and that their overall objective in terms of rates of return on capital is around 10%,
then banks need at least a 3% × 10% = 30 basis point cross-currency basis to engage in
the trade. In a nutshell, many of the arbitrage opportunities that we document may not be
attractive enough for banks: CIP arbitrage has become balance sheet-intensive post crisis.
As a result, banks may shy away from this activity.15
Other Financial Regulations Third, a host of other �nancial regulations have also re-
duced banks' willingness to engage in CIP arbitrage. For example, the Volcker Rule as a
part of the Dodd-Frank act forbids banks to actively engage in proprietary trading activities.
Proprietary trading in spot exchange rates is allowed, but not in exchange rate forwards and
swaps. As a result, banks can only engage in market making or facilitate arbitrage activities
15In addition to risk-weighted capital requirements and the leverage ratio, the Basel III also introducestwo liquidity requirements: the liquidity coverage ratio and the net stable funding ratio. Since the CIP tradegoes long and short in funding of the same tenor, it has neutral e�ect on the liquidity ratios.
26
of their clients in the exchange rate derivative markets.16 In addition, the over-the-counter
derivatives' reform sets higher capital and minimum margin requirements for cross-currency
swaps, which are generally uncleared, further increasing the capital necessary to implement
the CIP trade.
The regulatory reforms on banks certainly have some spillover e�ects on the cost of
leverage faced by non-regulated entities, such as hedge funds. This is because hedge funds
need to obtain funding from their prime brokers, which are regulated entities. In order
to sell the CIP arbitrage strategy to their clients, hedge funds would need to lever up the
arbitrage strategy ten or twenty times to make it attractive. When borrowing large amounts,
their borrowing costs may increase signi�cantly as their positions show up in their prime
brokers' balance sheets (increasing the prime brokers' leverage ratios). In the absence of
costly leverage, it seems di�cult to understand why hedge funds do not replace banks in
arbitraging the CIP deviations.
Costly �nancial intermediation is a likely driver of the overall increase in CIP deviations
post-crisis. Yet, in the absence of currency-speci�c trading costs, banking regulation would
likely a�ect all currencies similarly. Yet, large cross-currency di�erences exist, pointing to
potential global imbalances in funding and investment opportunities.
4.2 International Imbalances
The CIP deviations suggest a large demand for investments in high interest rate curren-
cies, such as the Australian and New Zealand dollars, and a large supply of savings in low
interest rate currencies, such as the Japanese yen, the Swiss franc, and more recently, the
euro. This imbalance can be driven by search-for-yield and carry-trade motives. Consistent
with this imbalance, countries with high nominal interest rates (Australia and New Zeal-
and) exhibit negative net international investment positions and are importers of capital,
16In practice, however, the distinction between arbitrage and market making may be di�cult to draw.As an example of such di�culty, the �nal version of the Dodd-Frank rule on proprietary trading, entitled�Prohibitions and Restrictions on Proprietary Trading and Certain Interests In, and Relationships With,Hedge Funds and Private Equity Funds� contains 1089 pages.
27
whereas countries with low nominal interest rates (Japan and Switzerland) exhibit positive
net international investment positions and are exporters of capital (Lane and Milesi-Ferretti,
2007).
Financial intermediaries, such as foreign exchange swap market makers, trade against
this imbalance by swapping low interest rate funding into high interest rates, but do not
want to bear the currency risk. To do so, the �nancial intermediaries can hedge the currency
exposure in the cash market by going long in high interest rate currencies, and short in low
interest rate currencies. The pro�t per unit of notional is equal to the absolute value of the
cross-currency basis, which justi�es for the cost of capital associated with the trade.
4.3 Predictions
The combination of costly �nancial intermediation and global imbalances generate the fol-
lowing simple predictions.
Prediction #1: The cross-currency basis is wider when the banks' balance sheet costs are
higher. The average basis should be of the same order of magnitude as the banks
balance sheet costs. It should be correlated with other �xed income arbitrage bases.
The key role of the banks' balance sheet costs is behind these predictions. We should expect
quarter-end e�ects on the cross-currency basis as the cost of balance sheet is particularly
high near quarter-end reporting dates. Capital constraints faced by �nancial intermediaries
are likely to a�ect other types of arbitrage as well beyond the currency markets. It is of
course possible that banks balance sheets are now more important than they were before the
crisis independently from any bank regulation, but simply because investors pay now more
attention to banks' health and that relevant information is disseminated at the quarterly
frequency.
Prediction #2: The cross-currency basis is increasing in the nominal interest rate di�er-
ential between the foreign currency and the dollar.
28
The intuition behind the prediction is that the lower the interest rate, the higher the excess
demand to swap foreign currency funding into the U.S. dollar funding. A capital-constrained
arbitrageur charges higher excess returns for taking the opposite of the trade due to dimin-
ishing returns to investment, which corresponds to a more negative basis.
With these hypotheses in mind, we turn now to additional empirical evidence on CIP
deviations.
5 Characteristics of the Basis
In this section, we characterize the systematic nature of the basis and test the two predictions
outlined in the previous section. First, in a simple di�erence-in-di�erence experiment, we
show that the basis is particularly high at the end of the quarter since the crisis. Second, we
show that the average CIP deviations is of the same order of magnitude as an independent
proxy for the cost of dollar funding. Third, we show that the currency basis is highly
correlated with other liquidity premia in �xed-income markets. Fourth, we show that the
basis increases with the level of interest rates in the cross-section and in the time-series.
5.1 Quarter-End Dynamics
Financial intermediaries typically face greater balance sheet constraints at the end of quarters
ahead of quarterly regulatory �lings, as key balance sheet variables, risk metrics, and leverage
ratios are reported at the quarterly frequency and scrutinized by regulators and investors.
Increased banking regulation, and perhaps investors' attention, since the global �nancial
crisis allegedly makes quarter-end balance sheet constraints more prevalent than before.
In particular, as discussed in Section 4.1, the short-term CIP arbitrage has very little
mark-to-market risk and the leverage ratio requirement is one important regulatory con-
straint. The Basel Committee recommends the leverage ratio to be disclosed on the quarter-
end basis, at minimum. The actual calculation method of the leverage ratio di�ers across
29
jurisdictions. E�ective in January 2015, the European Leverage Ratio Delegated Act switches
the de�nition of this ratio for European banks from the average of the month-ends over a
quarter to the point-in-time quarter-end ratio.17 Since European banks play an important
role intermediating U.S. dollars o�shore, we expect the quarter-end dynamics to be partic-
ularly pronounced since January 2015 in the post-crisis period.
In this section, we examine the e�ects of quarter ends on the level and term structure of
CIP deviations. Since the crisis, we �nd that one-week and one-month CIP deviations tend to
increase at the quarter ends for contracts that would cross quarter-end reporting dates. The
quarter-end anomalies become more exacerbated since January 2015, which coincides with
the change in the leverage ratio calculation method for European banks. These �ndings are
consistent with the view that tightened balance sheet constraints at quarter ends translates
into wider CIP deviations in the post-crisis period.
5.1.1 Quarter-end E�ects on the Level of CIP Deviations
We test whether CIP deviations are more pronounced at the end of the quarters vs. any
other point in time, and especially so since the global �nancial crisis and since 2015. Our
simple di�erence-in-di�erence test for the one-week contract takes the following form:
|x1w,it| = αi + β1QendWt + β2QendWt × Post07t + β3QendWt × Post15t
+ γ1Post07t + γ2Post15t + εit, (16)
where |x1w,it| is the absolute value of the one-week basis for currency i at time t, αi is a
currency �xed e�ect. POST07t is an indicator variable equal to one after January 1, 2007
and zero otherwise, and POST15t is an indicator variable equal to one after January 1, 2015
and zero otherwise. The variable QendWt is an indicator variable that equals one if the
settlement date for the contract traded at t is within the last week of the current quarter
17On the other hand, the U.S. supplementary leverage ratio is calculated based on the daily averagebalances of the quarter.
30
and the maturity date is within the following quarter.18 These one-week contracts crossing
the quarter ends would show up on the bank balance sheet on quarter-end reporting dates.
The regression is estimated on the daily sample from 01/01/2000 to 09/15/2016 on one-
week Libor, OIS and repo bases. The coe�cients β2 and β3 are of main interest, where β2
captures the change in the quarter-end e�ect in the post-crisis 2007-2016 sample compared
to the quarter-end e�ect in the 2000�2006 pre-crisis sample, and β3 captures the additional
changes in the quarter-end e�ect during the past two years relative to the post-crisis average
e�ect. Similarly, we also test the quarter-end e�ect for the monthly CIP deviation as follows:
|x1m,it| = αi + β1QendMt + β2QendMt × Post07t + β3QendMt × Post15t
+ γ1Post07t + γ2Post15t + εit, (17)
where QendMt is a binary variable indicating if the settlement date and maturity date of
the monthly contract spans two quarters.
Table 6 reports the regression results. Columns 1 to 3, pertain to the one-week CIP
deviations based on Libor, OIS, and repos. The slope coe�cients β2 and β3 are positive and
statistically signi�cant across all three instruments. The quarter-end CIP deviation relative
to the mean deviation in the rest of the quarter is on average 10 to 22 basis points higher
in the post-2007 sample than over the pre-2007 sample for the one-week contracts. Further-
more, compared to the post-2007 sample, the quarter-end weekly CIP deviation increases
by another 30-40 basis points on average since January 2015. Columns 4 to 6 pertain to
the one-month CIP deviations. Again, we �nd that β2 and β3 are all signi�cantly positive
except in one case. For CIP deviation based on Libor and OIS rates, the month-end devi-
ation relative to the rest of the quarter is on average 4 to 5 basis point higher post-crisis
than the level pre-crisis and increases by another 8 basis point in the post-2015 sample. For
one-month repo, even though β3 is not signi�cant, β2 is highly signi�cant and equals 13 basis
18FX forwards follow the T + 2 settlement convention.
31
points. Furthermore, we note that coe�cients on QendWt and QendMt are very small and
largely insigni�cant, which suggests that there is very little quarter end e�ect before 2007.
5.1.2 Quarter-end E�ects on the Term Structure of CIP Deviations
The quarter-end balance sheet constraints are also re�ected in the term structure of the
basis. We have seen that the one-week basis widens signi�cantly as the one-week contract
crosses quarter ends and one-month basis widens signi�cantly as the one-month contract
crosses quarter ends. On the other hand, since a three-month contract always shows up
in one quarterly report regardless of when it is executed within the quarter, we should not
expect discrete price movement one week or one month prior to the quarter end. Therefore,
the quarter-end balance sheet constraint has implications on the term structure of the basis.
In particular, we expect the di�erence between three-month and one-month CIP deviation
(tst,3M−1M ≡ |xt,3M | − |xt,1M | ) to drop signi�cantly once the one-month contract crosses
the quarter-end. Meanwhile, the di�erence between one-month and one-week CIP deviation
(tst,1M−1W ≡ |xt,1M | − |xt,1W | ) should �rst increase signi�cantly as the one-month contract
crosses the quarter end and then decreases signi�cantly once the one-week contract crosses
the quarter end.
Figure 7 illustrates the case for the yen starting in 2015. The blue shaded area denotes
the dates for which one-week contracts cross quarter-end reporting dates. The grey area
denotes the dates for which the one-month contract crosses quarter-end reporting dates,
but one-week contracts stay within the quarter. The top �gure plots one-week, one-month
and three-month CIP deviations in levels, and the bottom �gure plots the term spreads
tst,3M−1M and tst,1M−1W . We can see that once the one-month contract crosses the quarter
end, tst,3M−1M decreases sharply and tst,1M−1W increases sharply due to spikes in the one-
month deviation. Once the one-week contract crosses the quarter end, tst,1M−1W drops
signi�cantly due to spikes in the one-week deviation.
32
Table 7 con�rms these observations in panel regressions. Columns 1 to 3 report regression
results using tst,3M−1M based on Libor, OIS and repo as follows, similar to Equation 17:
tst,3M−1M = αi + β1QendMt + β2QendMt × Post07t + β3QendMt × Post15t
+ γ1Post07t + γ2Post15t + εit. (18)
We �nd that β1 is small and insigni�cant, and β2 and β3 are both signi�cantly negative.
Compared to the pre-crisis sample, tst,3M−1M is 2.4 basis point lower relative to its mean in
the rest of the quarter when the one-month contract crosses the quarter ends in the post-
crisis sample. In the post-2015 sample, the quarter-end e�ect corresponds to another 9.5
basis point reduction in tst,3M−1M compared to its post-crisis mean. Columns 4 to 6 report
similar tests for tss,1M−1W :
tst,1M−1W = αi + β1IQendMt=1,QendWt=0 + β2IQendMt=1,QendWt=0 × Post07t
+β3IQendMt=1,QendWt=0 × Post15t + β4QendWt + β5QendWt × Post07t
+β6QendWt × Post15t + γ1Post07t + γ2Post15t + εit,
where IQendMt=1,QendWt=0 is an indicator variable that equals 1 if a one-month contract traded
at t crosses the quarter end, but the one-week contract traded at t does not cross the quarter
end. As expected, we �nd signi�cantly positive β2 and β3 coe�cients and signi�cantly
negative β5 and β6 coe�cients, which suggests that the di�erence between one-month and
one-week CIP deviation �rst increases as the once-month contract crosses the quarter end,
but the one-week contract does not, and then decreases as the one-week contract crosses
the quarter end. These quarter-end e�ects are again larger in the post-crisis period and
especially since 2015.
In summary, consistent with the key role of banks' balance sheets on quarter-end reporting
dates, we �nd that CIP deviations are systematically higher for contracts that cross quarter-
33
end reporting dates post the crisis. We compare now a proxy to the banks balance sheet
costs to the CIP deviations.
5.2 CIP Arbitrage Based on Excess Reserves at Central Banks
Under unconventional monetary policies implemented by major central banks since the global
�nancial crisis, global depositary institutions have held large amounts of excess reserves at
major central banks, currently including $2.4 trillion at the Fed and $0.5 trillion at the ECB.
Excess reserves are remunerated at an interest rate set by the central bank, which is referred
to as the interest rate on excess reserves (IOER).
One interesting feature of the IOER at the Fed is that it is often above interest rates
paid on private money market instruments, for example, the Fed Fund rate. The main
reason that the Fed fund rate stays persistently below the IOER in the United States is
that government-sponsored enterprises (GSEs), such as Federal Home Loan Banks, do not
have access to the IOER deposit facility and are willing to lend at rates below the IOER in
the Fed Fund market. This creates the well-known IOER-Fed Fund arbitrage for depositary
institutions with access to the IOER deposit facility, in which banks borrow in the Fed Fund
market from the GSEs and deposit the proceeds in the forms of excess reserves at the Fed,
earning the IOER-Fed Fund spread. The trade is risk-less as central bank cash is risk-free
and dominates private money market instruments in terms of liquidity and fungibility.
Figure 8 shows the one-week IOER, OIS and Libor rates for the U.S. dollar since 2009.
The IOER is always greater than the one-week OIS rate over the entire sample and is also
greater than the one-week Libor rate starting in 2011. If borrowing funds at the Fed fund or
Libor rate did not carry additional costs, banks would amass even more reserves at the Fed
in order to pro�t from this arbitrage opportunity, and the interest rate gap between IOER
and OIS would disappear.
The spread earned on the IOER-OIS (Libor) arbitrage thus gives us a concrete measure of
the cost of balance sheets for depositary institutions that engage in arbitrage opportunities.
34
This cost includes at least two components. For U.S. and foreign banks, the cost of leverage,
summarized in leverage ratios, is likely to be the most important factor since the trade is
risk-free. For U.S. banks, an additional cost matters: the deposit insurance fees paid on
wholesale funding. In 2011, the Federal Deposit Insurance Corporation (FDIC) widened the
assessment base for deposit insurance fees in 2011 to include wholesale funding.
Therefore, instead of using the Libor and OIS rates as the direct U.S. dollar funding costs
when computing the cross-currency basis, we turn to the IOER as a proxy for the U.S. dollar
�funding� cost after taking into account balance sheet constraints and regulatory costs for
wholesale funding. Table 8 shows the results for the alternative basis calculation. Compared
to the standard Libor basis reported in the �rst column, �funding� at the IOER reduces the
magnitude of the Libor basis by 6 basis points on average, as shown in the second column.
Similarly, compared to the standard OIS basis reported in the third column, the basis is 12
basis point narrower when using the IOER instead of the OIS as the direct dollar funding
cost, as shown in the fourth column. Therefore, the gap between the IOER and OIS/Libor in
the U.S. can explain about one-third to one-half of the one-week CIP deviations. Summary
statistics for the IOER basis based on �funding� in USD IOER and investing in foreign IOER
are reported in the last column. The average IOER basis is −6 basis points, much closer to
zero than the Libor and OIS basis at −22 basis points.
The bases based on the IOER can be positive, while the Libor basis is always negative.
A positive IOER basis would lead U.S. banks to park excess reserves at the Fed, as opposed
to lending out in U.S. dollars as suggested by a negative Libor basis. Increasing reserves at
the Fed further reduces the bank �ows to arbitrage the Libor basis. As a result, the banks'
balance sheet and regulation costs, as proxied by the IOER-Libor spread, appear as a key
determinant of the CIP deviations.
35
5.3 Correlated Spreads in Other Markets
Intermediary constraints, if present, would likely a�ect other asset classes beyond exchange
rates. We thus compare the dynamics of the currency bases to other types of near-arbitrage
�xed-income strategies, focusing on (1) the KfW-German Bund basis, (2) the one-versus
three-month U.S. Libor tenor swap basis, (3) the CDS-CDX basis, and (4) the CDS and
corporate bond (CDS-bond) basis.19
Figure 9 plots the average of the absolute value of the �ve-year Libor currency basis for
G10 currencies and the four other types of bases in four di�erent panels. The currency basis
appears highly correlated with the two liquidity-based bases, the KfW-German bund basis
and the Libor tenor basis. They all increased during the recent global �nancial crisis and
during the European debt crisis. Although there is no mechanical link between the CIP
deviations and the KfW-bund and Libor tenor swap bases, their co-movement is striking.
The currency basis appears less correlated with the two credit bases, the CDS-CDX basis
and the bond-CDS basis. The credit bases both increased signi�cantly during the recent
global �nancial crisis, together with the cross-currency basis, but they narrowed signi�cantly
after the crisis between 2010 and 2014, whereas the currency basis did not. In the past two
years again, the credit and currency bases appear to move in sync.
19We review these four spreads rapidly.The KfW-German bund basis is the spread of a �ve-year euro-denominated bond issued by KfW over the
�ve-year German Bund yield, obtained from Bloomberg. The �ve-year KfW bond yield is estimated by theNelson-Siegel methodology on individual KfW bond prices also obtained from Bloomberg. Since the KfWbonds are fully guaranteed by the German government, the KfW-German Bund spread should not containany credit risk component. As previously noted, Schwartz (2015) uses that spread to measure the liquiditypremium.The Libor tenor swap basis measures the premium that one party has to pay in order to receive the
one-month �oating U.S. Libor in exchange of the three-month �oating U.S. Libor for the �ve-year durationof the contract. The tenor swap basis re�ects a premium for more frequent payments or a higher desirabilityof short-term liquidity.The CDS-CDX basis measures the di�erence between the average �ve-year CDS spreads on the 125 con-
stituent names of the North America investment grade credit default swap index (NA.IG.CDX) and thespread on the corresponding aggregate NA.IG.CDX index. All data on CDS and CDX spreads are obtainedfrom Markit.The CDS-bond basis measures the di�erence between the asset swap spread on a corporate bond over
the CDS spread on the same reference entity. We use the CDS-bond basis provided by Morgan Markets forinvestment-grade bonds. Both the CDS-CDX basis and CDS-bond basis lead to popular credit arbitragestrategies.
36
We test the link across asset classes with a simple regression of the G10 average changes
in the cross-currency bases on changes in the four other liquidity and credit bases for the
2005�2015 and the 2010�2015 samples. Table 9 reports the monthly regression results. In the
full sample that includes the global �nancial crisis, CIP deviations co-move signi�cantly with
the four other spreads. In the post-crisis sample, CIP deviations still co-move signi�cantly
with the two liquidity spreads. The correlation with the two credit spreads remains positive
but is no longer signi�cant. Overall, the correlation between the CIP deviations and other
near-arbitrage strategies, especially the KfW-German bund basis and the Libor tenor basis,
is consistent with a key role for liquidity-providing intermediaries.
5.4 Cross-Currency Basis and Nominal Interest Rates
CIP deviations appear linked to nominal interest rates in the cross-section and in the time-
series.
5.4.1 Cross Section of CIP Deviations and Interest Rates
We �rst document a robust cross-sectional relationship between nominal interest rates and
various types of cross-currency basis. We �nd that low interest rate currencies tend to have
most negative bases and high interest rate currencies tend to have less negative bases or pos-
itive bases. The cross-sectional pattern holds across Libor, OIS, Treasuries, KfW and other
multinational bonds. Therefore, for a long-short arbitrageur, there exist arbitrage opportun-
ities for going long in low interest rate currencies, short in high interest rate currencies with
the currency risk hedged using exchange rate swaps. The direction of the arbitrage trade is
exactly the opposite of the conventional unhedged carry trade of going long in high interest
rate currencies and short in low interest rate currencies. For multinational issuers, the cross-
sectional pattern has a robust funding cost implication that on the currency-hedged basis,
currencies with high nominal interest rates are cheaper funding currencies, and currencies
with higher nominal interest rates are more expensive funding currencies.
37

Figure 10 reports the mean cross-currency basis on the vertical axis as a function of the
average nominal interest rates between 2010 and 2015 on the horizontal axis. The �rst two
panels show that the Libor cross-currency basis is positively correlated with Libor rates at
short and long maturities. The relationship is particularly strong at long maturities, with
the correlation between �ve-year Libor bases and Libor rates equal to 89 percent for G10
currencies. By contrast, the mean CDS spread of the interbank panel exhibits a correlation
of −33 percent with the �ve-year Libor basis. Similarly, as shown in Figure and described in
details in the Appendix, we obtain a very high correlation between the average level of interest
rates and the CIP deviations measured on bonds issued by KfW and other multinationals.
We �nd evidence that supranational organizations do take advantage of this funding cost
arbitrage. Figure 11 plots the ratio of total issuance by KfW and supranational issuers over
total issuance by other non-�nancial issuers during the sample 2010�2015 period against
the mean Libor cross-currency basis. Data come from Dealogic. Relative to the universe
of non-�nancial issuers, supranational issuers issue more in high-basis and high-interest-rate
currencies, such as the Australian and New Zealand dollars, and issue less in low-basis and
low-interest-rate currencies, such as the Swiss franc, the Danish Krone, and the Japanese
yen.20
5.4.2 Time Series of CIP Deviations and Interest Rates
Consistent with the cross-sectional pattern, the nominal interest rate di�erential between
two currencies is also a signi�cant driver of the cross-currency basis in the time series. We
establish the time series relationship between the basis and the nominal interest rate with a
regression analysis and a high-frequency event study using a narrow window around monetary
policy announcements by the ECB.
We �rst perform panel and time series regressions of weekly changes in the �ve-year
Libor cross-currency basis on changes in the interest rate di�erential based on the �ve-year
20Issuances in U.S. dollars and in euros are excluded from Figure 11 because some benchmark issues oftenneed to be maintained even though it might be economically costly to do so.
38
Libor interest rate swap rate, controlling for the changes in the CDS spreads across credit
panels. The sample window runs from January 2007 to January 2016. To save space, the
regression results are reported in the Appendix. Similar to the results reported in Table 2,
the credit spread does not appear signi�cantly in the pooled regression with currency �xed
e�ects. In contrast, the interest rate di�erential between country i and the U.S. exhibits
a signi�cant slope coe�cient equal to 0.04. At the individual currency level, the interest
rate di�erential enters with a signi�cantly positive coe�cient for eight out of ten currencies.
These regression results provide suggestive evidence on the time-series relationship between
the cross-currency basis and the interest rate di�erential.
We then use an event-study approach to study the e�ect of unexpected shocks to the
interest rate di�erential on the cross-currency basis during the narrow window around mon-
etary policy announcements. Assuming that the monetary policy is exogenous to the basis
� a reasonable assumption prior to our work, this event-study measures the causal impact
of monetary policy on the cross-currency basis.
Our event study focuses on changes in the dollar/euro basis and changes in the yield
di�erential between German Bunds and U.S. Treasuries around the European Central Bank
(ECB)'s monthly releases of monetary policy decisions of the Governing Council and the
following press conferences hosted by the ECB president since 2010. The event window starts
�ve minutes before the release of the monetary decision, usually at 1:45 pm Central European
Time (CET), and ends 105 minutes after the release of the statement, thus including the one-
hour press conference that usually takes place between 2:30 pm CET and 3:30 pm CET. By
choosing such a narrow event window, the movements in the currency basis and government
yields can be attributed to monetary policy shocks from the ECB. Intraday data come from
the Thomson Reuters Tick History database. The currency basis corresponds to OTC quotes,
from a major European bank, for an Euribor/U.S. Libor one-year maturity basis contract.21
21Cross-currency bases at tenors longer than one year are not quoted frequently enough for our eventstudy. The three-month cross-currency basis was not actively traded as a separate derivative product until2012. Our results, however, are robust to using the three-month basis since it became separately quoted.
39
The event-study focuses on the ECB announcements because quotes on the currency basis
are available at high frequency for the euro.
We regress the changes in the currency basis around the i-th monetary policy announce-
ment (∆xi) on the changes in the German bund and U.S. Treasury two-year benchmark
yield di�erentials around the same event window (∆yGEi −∆yUSi ):
∆xi = α + β(∆yGEi −∆yUSi ) + εi. (19)
In the cross-section, as we saw, the currency basis tends to increase with the interest rate
di�erential. A similar behavior would imply a positive slope coe�cient, β > 0. As Figure
12 shows, this is clearly the case: in the time-series too, the currency basis tends to increase
with the interest rate di�erential. The slope coe�cient on the interest rate di�erential in
Equation (19) is equal to 0.15 with a t-statistic equal to 5.88. Therefore, a 10 basis point
reduction in the German/U.S. Treasury two-year yield di�erential due to an accommodative
ECB monetary policy shock leads to 1.5 basis point reduction in the one-year euro/dollar
Libor CIP deviations. In summary, results from the high-frequency event study suggest
that the nominal interest rate is an important time-series driver for variations in the basis.
More accommodative-than-expected monetary policy by the ECB results in a more negative
cross-currency-basis for the euro.
More generally, monetary policy has a potential role to correct the imbalance in invest-
ment demand and savings supply across currencies. Higher interest rates in Japan may lead
to higher domestic investment by domestic households and �rms, and lower borrowing in yen
by carry traders. Similarly, lower interest rates in Australia may curtail carry traders with
long positions in the Australian dollar and encourage borrowing by Australian household
and �rms. The CIP deviations would narrow as the monetary policy stances across central
banks converge. The similar monetary stances between the U.S. and the U.K. help narrow
the pound cross-currency basis. However, rather than a convergence in monetary policy, the
40
uneven pace in economic recovery causes monetary policy to diverge signi�cantly in recent
years. As the U.S. starts a monetary policy normalization, the cross-currency basis become
larger in magnitude in countries with very accommodative policies.
6 Conclusion
In this paper, we show that the failure of the CIP condition cannot be explained away
by default risk or transaction costs. The CIP deviations lead to persistent and systematic
arbitrage opportunities in one of the largest asset markets in the world.
We �nd that the CIP deviations (1) increase at quarter ends post-crisis, suggesting a
causal link to banks' balance sheet costs; (2) are correlated with several other �xed-income
arbitrage spreads; and (3) are highly correlated with nominal interest rate levels in the
cross-section and in the time series.
41
References
Adrian, T., E. Etula, and T. Muir (2014): �Financial Intermediaries and the Cross-Section of Asset Returns,� Journal of Finance, 69(6), 2557�2596.
Akram, Q. F., D. Rime, and L. Sarno (2008): �Arbitrage in the Foreign ExchangeMarket: Turning on the Microscope,� Journal of International Economics, 76, 237�253.
Amador, M., J. Bianchi, L. Bocola, and F. Perri (2016): �Exchange Rates and theCentral Bank Balance Sheet,� Discussion paper, University of Minnesota.
Arora, N., P. Gandhi, and F. A. Longstaff (2011): �Counterparty credit risk and thecredit default swap market,� Journal of Financial Economics, 103(280-293).
Baba, N., R. N. McCauley, and S. Ramaswamy (2009): �US Dollar Money MarketFunds and Non-US Banks,� BIS Quarterly Review, pp. 65�81.
Baba, N., and F. Packer (2009): �Interpreting Deviations from Covered Interest ParityDuring the Financial Market Turmoil of 2007-08,� Journal of Banking and Finance, 33,1953�1962.
Baba, N., F. Packer, and T. Nagano (2008): �The Spillover of Money Market Turbu-lence to FX Swap and Cross-Currency Swap Markets,� BIS Quarterly Review, pp. 73�86.
Baklanova, V., A. Copeland, and R. McCaughrin (2015): �Reference Guide to U.S.Repo and Securities Lending Markets,� Federal Reserve Bank of New York Sta� ReportNo. 740.
Bekaert, G., and R. J. Hodrick (2012): International �nancial management. PearsonPrentice Hall Upper Saddle River, New Jersey, NJ.
Bernanke, B., and M. Gertler (1989): �Agency Costs, Net Worth, and Business Fluc-tuations,� American Economic Review, pp. 14�31.
BIS (2013): �Triennial Central Bank Survey of Foreign Exchange and Derivatives MarketActivity in 2013,� Discussion paper, Bank for International Settlements.
(2014): �Detailed Tables on Semiannual OTC Derivatives Statistics at End-December 2014,� Discussion paper, Bank for International Settlements.
Borio, C., R. N. McCauley, P. McGuire, and V. Sushko (2016): �Covered interestparity lost: understanding the cross-currency basis,� BIS Quarterly Review.
Bottazzi, J.-M., J. Luque, M. Pascoa, and S. M. Sundaresan (2012): �Dollar Short-age, Central Bank Actions, and the Cross Currency Basis,� Working Paper.
Brunnermeier, M. K., and L. H. Pedersen (2009): �Market Liquidity and FundingLiquidity,� Review of Financial studies, 22(6), 2201�2238.
42
Brunnermeier, M. K., and Y. Sannikov (2014): �A Macroeconomic Model with aFinancial Sector,� American Economic Review, 104(2), 379�421.
Bruno, V., and H. S. Shin (2015): �Cross-Border Banking and Global Liquidity,� Reviewof Economic Studies, 82, 535�564.
Buraschi, A., M. Menguturk, and E. Sener (2015): �The Geography of Risk Capital,�Review of Financial Studies, 28, 1103�1152.
Caballero, R. J., E. Farhi, and P.-O. Gourinchas (2008): �An Equilibrium Modelof �Global Imbalances� and Low Interest Rates,� The American Economic Review, 98(1),358�393.
(2016): �Global Imbalances and Currency Wars at the ZLB,� Working Paper,Harvard University.
Callier, P. (1981): �One Way Arbitrage, Foreign Exchange and Securities Markets: ANote,� The Journal of Finance, 36(5), 1177�1186.
Cetorelli, N., and L. S. Goldberg (2011): �Global Banks and International ShockTransmission: Evidence from the Crisis,� IMF Economic Review, 59, 41�76.
(2012): �Liquidity Management of U.S. Global Banks: Internal Capital Markets inthe Great Recession,� Journal of International Economics, 88(2012), 299�311.
Clinton, K. (1988): �Transactions Costs and Covered Interest Arbitrage: Theory andEvidence,� Journal of Political Economy, 96(2), 358�370.
Coffey, N., W. B. Hrung, and A. Sarkar (2009): �Capital Constraints, CounterpartyRisk, and Deviations from Covered Interest Rate Parity,� Federal Reserve Bank of NewYork Sta� Report 393.
Correa, R., H. Sapriza, and A. Zlate (2012): �Liquidity Shocks, Dollar Funding Costsand the Bank Lending Channel during the European Sovereign Crisis,� International Fin-ance No.1509.
Deardorff, A. V. (1979): �One-Way Arbitrage and Its Implications for the Foreign Ex-change Markets,� Journal of Political Economy, 87(2), 351�364.
Dooley, M. P., and P. Isard (1980): �Capital Controls, Political Risk, and Deviationsfrom Interest-Rate Parity,� Journal of Political Economy, pp. 370�384.
Drechsler, I., A. Savov, and P. Schnabl (2016): �The deposits channel of monetarypolicy,� Discussion paper, National Bureau of Economic Research.
Du, W., S. Gadgil, M. B. Gordy, and C. Vega (2016): �Counterparty risk and coun-terparty choice in the credit default swap market,� Working Paper, Federal Reserve Board.
Du, W., and J. Schreger (Forthcoming): �Local Currency Sovereign Risk,� Journal ofFinance.
43
Duffie, D. (2016): �Why Are Big Banks O�ering Less Liquidity To Bond Markets?,� Forbes,March.
Fontaine, J.-S., and R. Garcia (2012): �Bond liquidity premia,� Review of FinancialStudies, 25(4), 1207�1254.
Frenkel, J. A., and R. M. Levich (1975): �Covered Interest Arbitrage: UnexploitedPro�ts?,� Journal of Political Economy, 83, 325�338.
Gabaix, X., and M. Maggiori (2015): �International Liquidity and Exchange Rate Dy-namics,� Quarterly Journal of Economics, 130(3), 1369�1420.
Garleanu, N., and L. Pedersen (2011): �Margin-Based Asset Pricing and Deviationsfrom the Law of One Price,� Review of Financial Studies, 24, 1980�2022.
Goldberg, L. S., C. Kennedy, and J. Miu (2011): �Central Bank Dollar Swap Linesand Overseas Dollar Funding Costs,� Federal Reserve Bank of New York Economic PolicyReview, May.
Greenwood, R., and D. Vayanos (2014): �Bond Supply and Excess Bond Returns,�Review of Financial Studies, 27, 663�713.
Griffolli, M. T., and A. Ranaldo (2011): �Limits to Arbitrage during the Crisis:Funding Liquidity Constraints and Covered Interest Parity,� Working Paper.
Gromb, D., and D. Vayanos (2010): �Limits of arbitrage,� Annual Review of FinancialEconomics, 2(1), 251�275.
He, Z., B. T. Kelly, and A. Manela (2015): �Intermediary Asset Pricing: New Evidencefrom Many Asset Classes,� Working Paper, University of Chicago.
He, Z., and A. Krishnamurthy (2012): �A Model of Capital and Crises,� The Review ofEconomic Studies, 79(2), 735�777.
He, Z., and A. Krishnamurthy (2013): �Intermediary Asset Pricing,� American Eco-nomic Review, 103(2), 732�770.
Holmstrom, B., and J. Tirole (1997): �Financial Intermediation, Loanable Funds, andthe Real Sector,� Quarterly Journal of economics, pp. 663�691.
Hu, G. X., J. Pan, and J. Wang (2013): �Noise as information for illiquidity,� The Journalof Finance, 68(6), 2341�2382.
ICMA (2016): �European Repo Market Survey Number 30,� International Capital MarketAssociation.
Ivashina, V., D. S. Scharfstein, and J. C. Stein. (2015): �Dollar Funding and theLending Behavior of Global Banks,� Quarterly Journal of Economics, 130(3), 1241�1281.
44
Jacob A. Frenkel, R. M. L. (1977): �Transaction Costs and Interest Arbitrage: Tranquilversus Turbulent Periods,� Journal of Political Economy, 85(6), 1209�1226.
Jermann, U. J. (2016): �Negative Swap Spreads and Limited Arbitrage,� Available atSSRN.
Keynes, J. M. (1923): A Tract on Monetary Reform. Macmillan.
Lane, P. R., and G. M. Milesi-Ferretti (2007): �The External Wealth of Nations MarkII: Revised and Extended Estimates of Foreign Assets and Liabilities, 1970�2004,� Journalof International Economics, 73, 223�250.
Liao, G. Y. (2016): �Credit Migration and Covered Interest Rate Parity,� Working Paper,Harvard Business School.
Lotz, W. (1889): Die Währungsfrage in Österreich-Ungarn und ihre wirtschaftliche undpolitische Bedeutung. Duncker & Humblot.
McGuire, P., and G. von Peter (2012): �The Dollar Shortage in Global Banking andthe International Policy Response,� International Finance, 15(2), 155�178.
Mohsen Bahmani-Oskooee, S. P. D. (1985): �Transaction Costs and the Interest ParityTheorem,� Journal of Political Economy, 93(4), 793�799.
Sato, T. (2015): �Toward Further Development of the Tokyo Financial Market: Issueson Repo Market Reform,� Keynote Speech at the Futures Industry Association JapanFinancial Market Conference 2015 in Tokyo.
Schwartz, K. (2015): �Mind the Gap: Disengtangling Credit and Liquidity in RiskSpreads,� Working Paper.
Shin, H. S. (2012): �Global Banking Glut and Loan Risk Premium,� IMF Economic Review,60, 155�192.
Siriwardane, E. N. (2016): �Concentrated Capital Losses and the Pricing of CorporateCredit Risk,� Harvard Business School Working Paper.
Tuckman, B., and P. Porfirio (2004): �Interest Rate Parity, Money Market Basis Swaps,and Cross-Currency Basis Swaps,� Lehman Brothers Fixed Income Liquid Markets Re-search.
Vayanos, D., and J.-L. Vila (2009): �A Preferred-Habitat Model of the Term Structureof Interest Rates,� Working Paper.
45
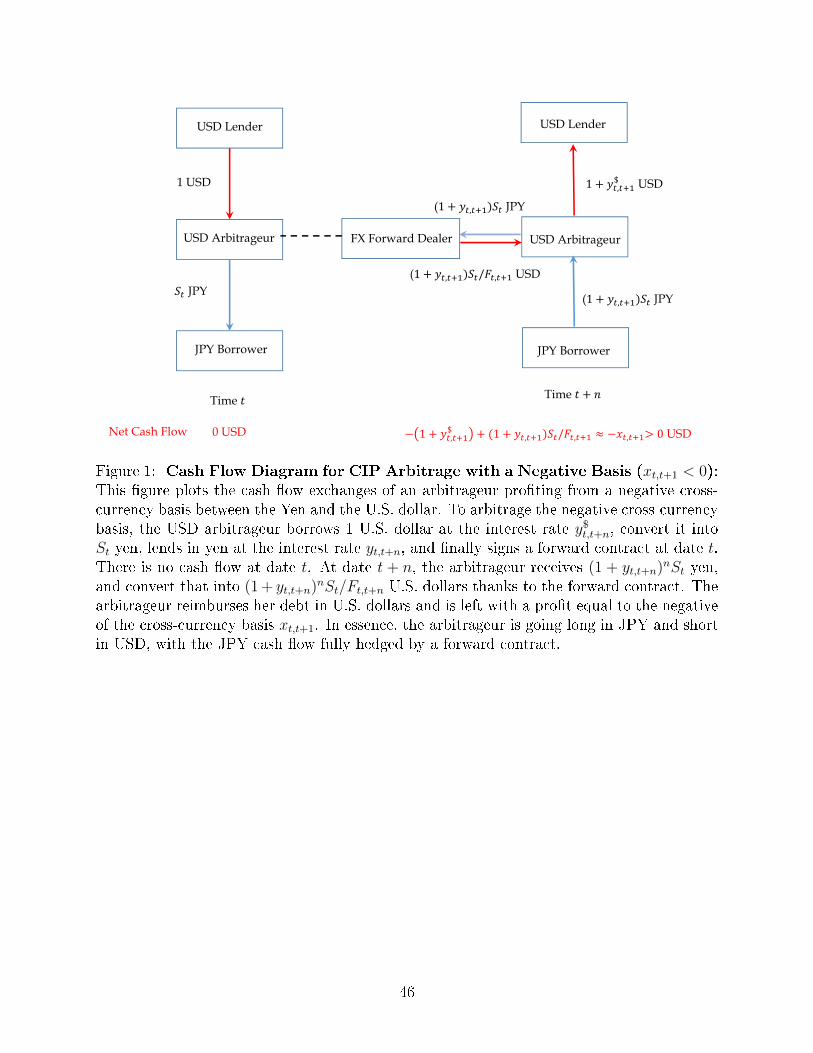
USD Lender USD Lender
JPY Borrower JPY Borrower
USD Arbitrageur USD Arbitrageur
1 USD
JPY
1 ,$ USD
(1 , JPY
FX Forward Dealer
(1 , JPY
(1 , / , USD
Time Time
0 USD 1 ,$ 1 ,
/ , , 0 USDNet Cash Flow
Figure 1: Cash Flow Diagram for CIP Arbitrage with a Negative Basis (xt,t+1 < 0):This �gure plots the cash �ow exchanges of an arbitrageur pro�ting from a negative cross-currency basis between the Yen and the U.S. dollar. To arbitrage the negative cross-currencybasis, the USD arbitrageur borrows 1 U.S. dollar at the interest rate y$t,t+n, convert it intoSt yen, lends in yen at the interest rate yt,t+n, and �nally signs a forward contract at date t.There is no cash �ow at date t. At date t + n, the arbitrageur receives (1 + yt,t+n)nSt yen,and convert that into (1 + yt,t+n)nSt/Ft,t+n U.S. dollars thanks to the forward contract. Thearbitrageur reimburses her debt in U.S. dollars and is left with a pro�t equal to the negativeof the cross-currency basis xt,t+1. In essence, the arbitrageur is going long in JPY and shortin USD, with the JPY cash �ow fully hedged by a forward contract.
46
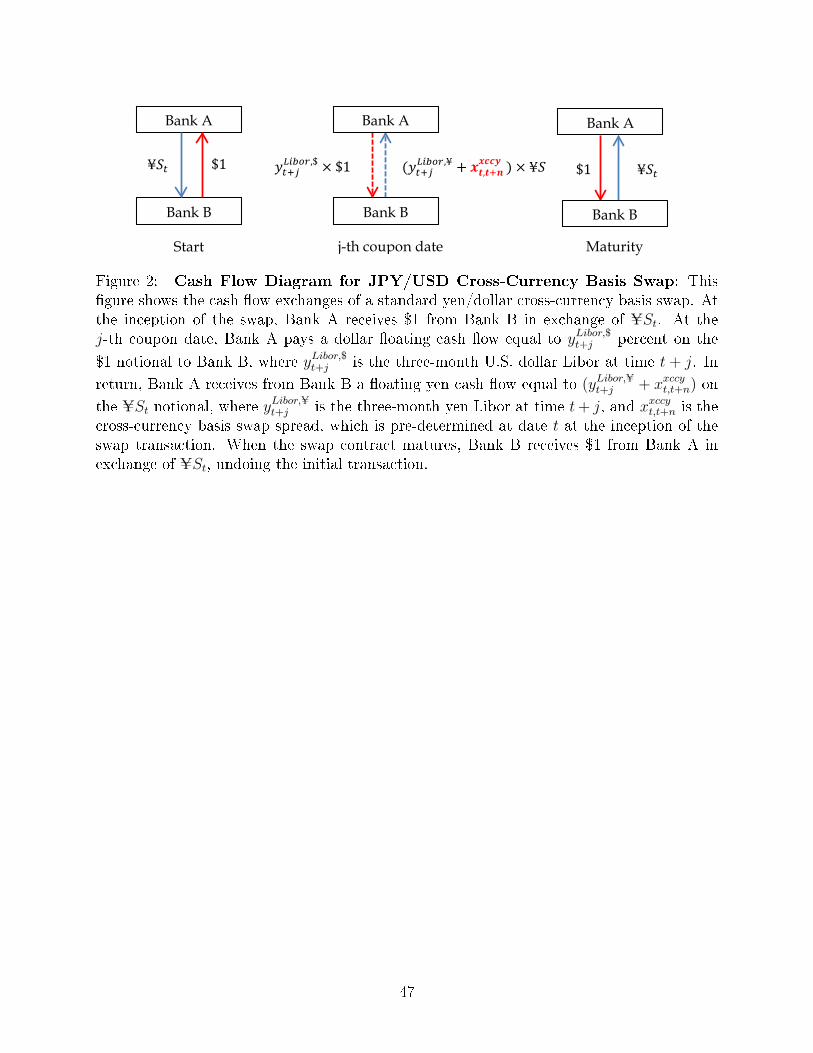
Bank A
Bank B
Bank A
Bank B
Start
j-th coupon date
Maturity
(𝑦𝑦𝑡𝑡+𝑗𝑗𝐿𝐿𝐿𝐿𝐿𝐿𝐿𝐿𝐿𝐿,¥ + 𝒙𝒙𝒕𝒕,𝒕𝒕+𝒏𝒏
𝒙𝒙𝒙𝒙𝒙𝒙𝒙𝒙 ) × ¥𝑆𝑆 𝑦𝑦𝑡𝑡+𝑗𝑗𝐿𝐿𝐿𝐿𝐿𝐿𝐿𝐿𝐿𝐿,$ × $1 $1 ¥𝑆𝑆𝑡𝑡
Bank A
Bank B
$1 ¥𝑆𝑆𝑡𝑡
Figure 2: Cash Flow Diagram for JPY/USD Cross-Currency Basis Swap: This�gure shows the cash �ow exchanges of a standard yen/dollar cross-currency basis swap. Atthe inception of the swap, Bank A receives $1 from Bank B in exchange of USt. At thej-th coupon date, Bank A pays a dollar �oating cash �ow equal to yLibor,$t+j percent on the
$1 notional to Bank B, where yLibor,$t+j is the three-month U.S. dollar Libor at time t + j. In
return, Bank A receives from Bank B a �oating yen cash �ow equal to (yLibor,Ut+j + xxccyt,t+n) on
the USt notional, where yLibor,Ut+j is the three-month yen Libor at time t+ j, and xxccyt,t+n is the
cross-currency basis swap spread, which is pre-determined at date t at the inception of theswap transaction. When the swap contract matures, Bank B receives $1 from Bank A inexchange of USt, undoing the initial transaction.
47
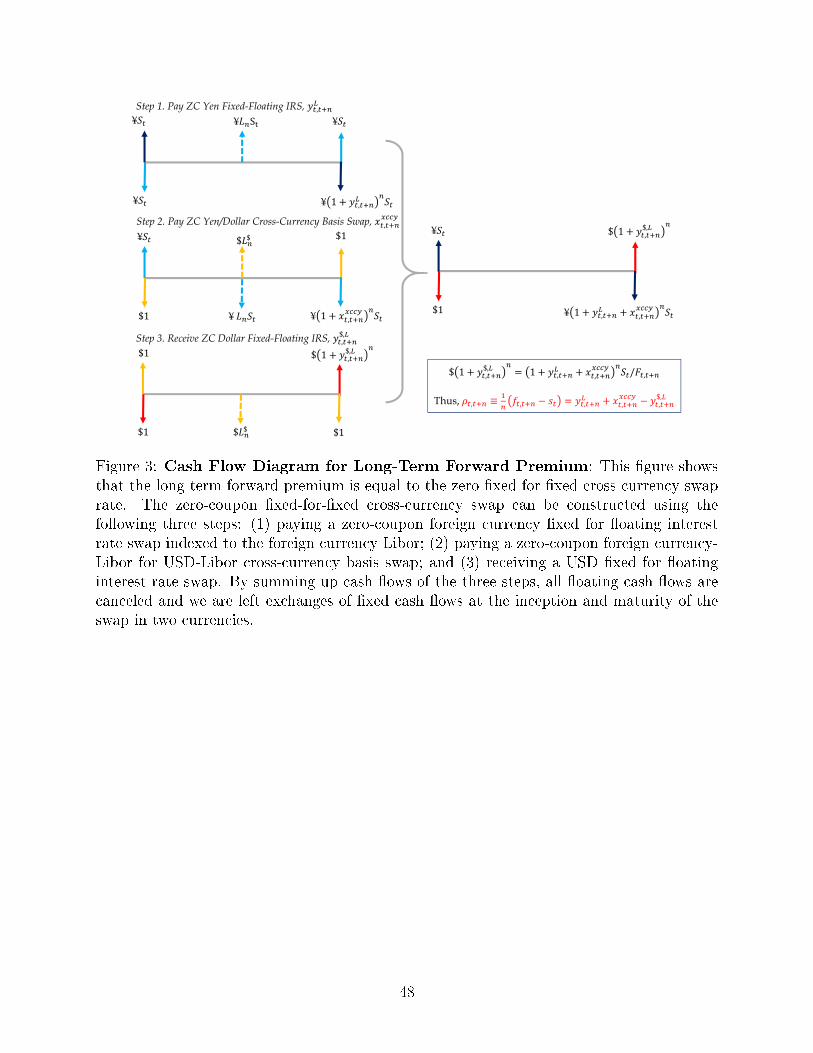
¥
¥
¥ 1 ,
¥ S ¥
$1
¥
¥ 1 ,
$ $
$1
$1
$1 $ 1 ,$,
¥
$1
$ $
Step 1. Pay ZC Yen Fixed-Floating IRS, ,
Step 2. Pay ZC Yen/Dollar Cross-Currency Basis Swap, ,
Step 3. Receive ZC Dollar Fixed-Floating IRS, ,$,
$1
¥
¥ 1 , ,
$ 1 ,$,
$ 1 ,$, 1 , , / ,
Thus, , ≡ , , , ,$,
Figure 3: Cash Flow Diagram for Long-Term Forward Premium: This �gure showsthat the long-term forward premium is equal to the zero �xed-for-�xed cross-currency swaprate. The zero-coupon �xed-for-�xed cross-currency swap can be constructed using thefollowing three steps: (1) paying a zero-coupon foreign currency �xed for �oating interestrate swap indexed to the foreign currency Libor; (2) paying a zero-coupon foreign currency-Libor for USD-Libor cross-currency basis swap; and (3) receiving a USD �xed for �oatinginterest rate swap. By summing up cash �ows of the three steps, all �oating cash �ows arecanceled and we are left exchanges of �xed cash �ows at the inception and maturity of theswap in two currencies.
48
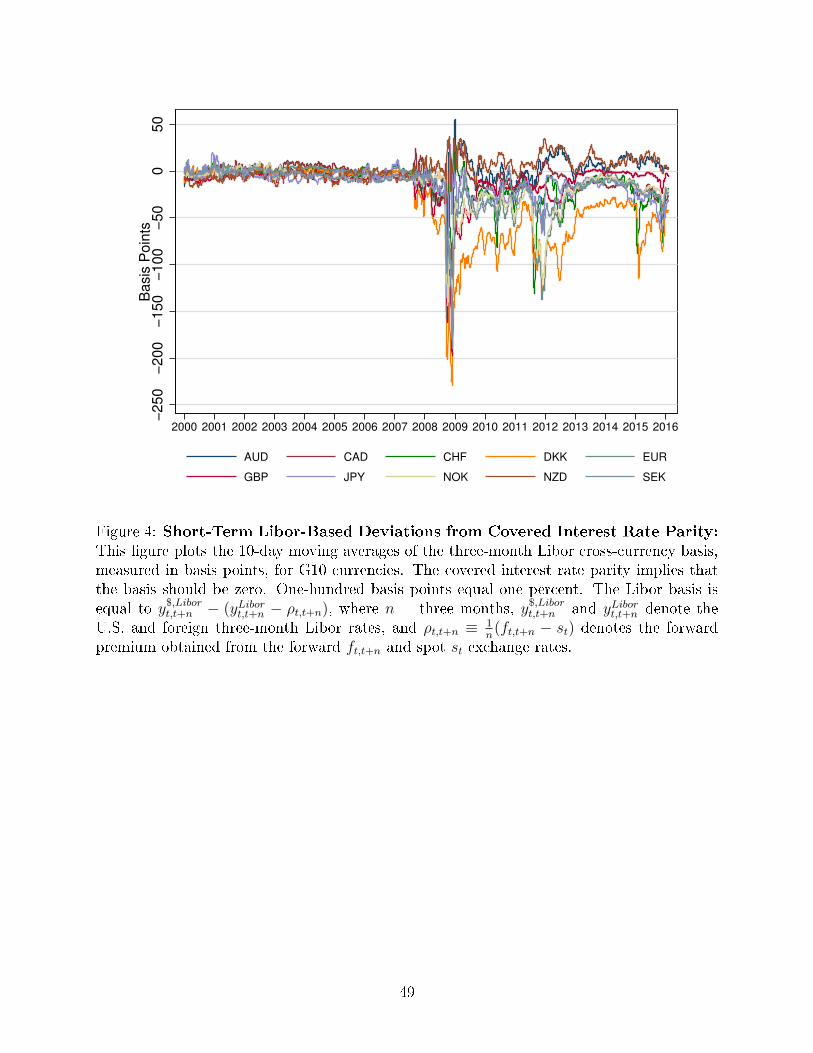
−2
50
−2
00
−1
50
−1
00
−5
00
50
Ba
sis
Po
ints
2000 2001 2002 2003 2004 2005 2006 2007 2008 2009 2010 2011 2012 2013 2014 2015 2016
AUD CAD CHF DKK EUR
GBP JPY NOK NZD SEK
Figure 4: Short-Term Libor-Based Deviations from Covered Interest Rate Parity:This �gure plots the 10-day moving averages of the three-month Libor cross-currency basis,measured in basis points, for G10 currencies. The covered interest rate parity implies thatthe basis should be zero. One-hundred basis points equal one percent. The Libor basis isequal to y$,Libort,t+n − (yLibort,t+n − ρt,t+n), where n = three months, y$,Libort,t+n and yLibort,t+n denote theU.S. and foreign three-month Libor rates, and ρt,t+n ≡ 1
n(ft,t+n − st) denotes the forward
premium obtained from the forward ft,t+n and spot st exchange rates.
49
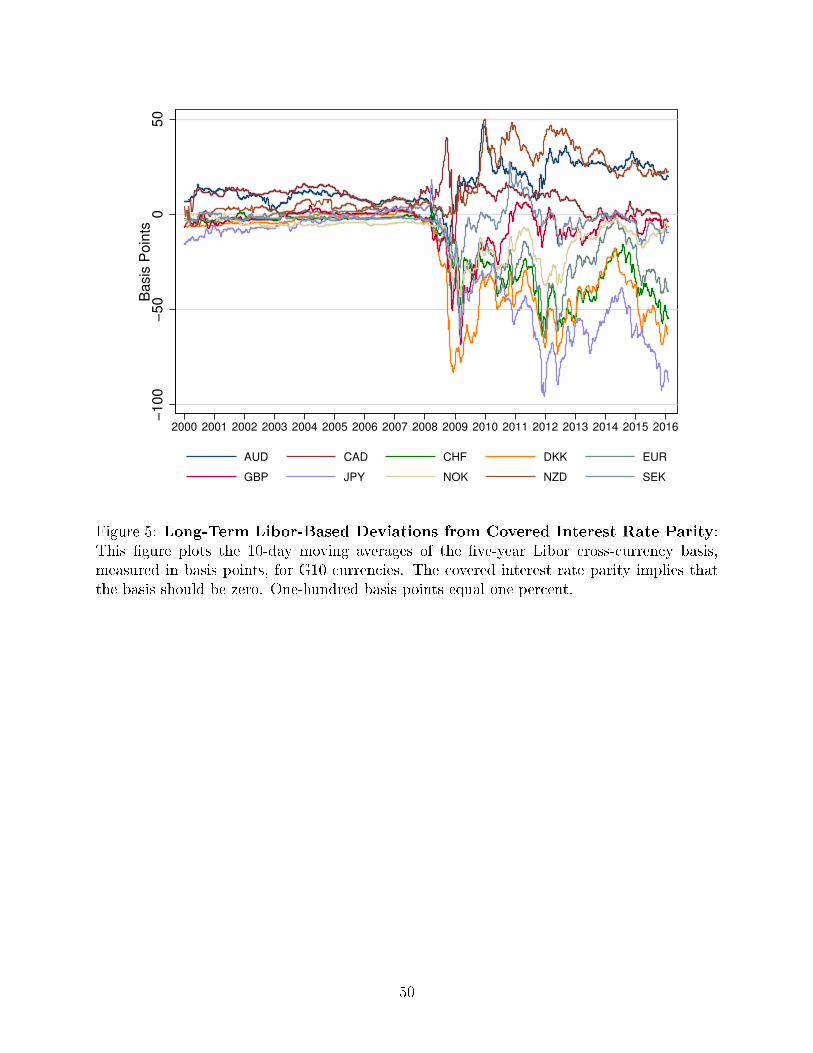
−1
00
−5
00
50
Ba
sis
Po
ints
2000 2001 2002 2003 2004 2005 2006 2007 2008 2009 2010 2011 2012 2013 2014 2015 2016
AUD CAD CHF DKK EUR
GBP JPY NOK NZD SEK
Figure 5: Long-Term Libor-Based Deviations from Covered Interest Rate Parity:This �gure plots the 10-day moving averages of the �ve-year Libor cross-currency basis,measured in basis points, for G10 currencies. The covered interest rate parity implies thatthe basis should be zero. One-hundred basis points equal one percent.
50
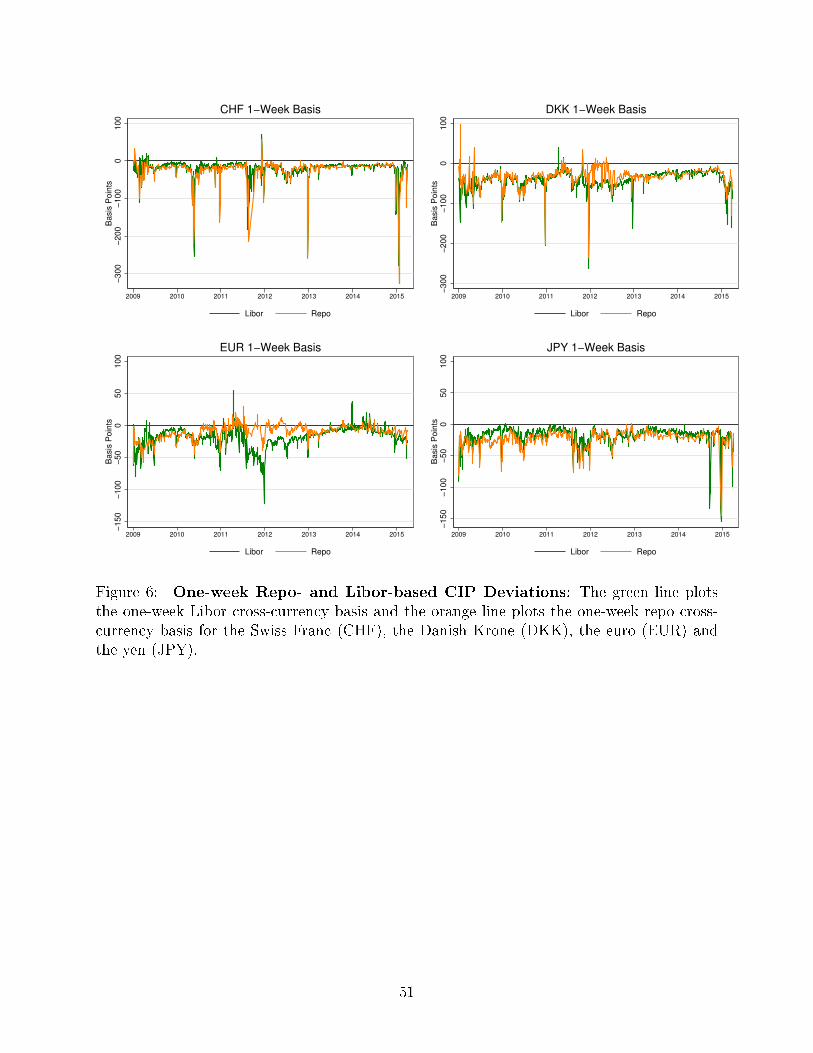
−300
−200
−100
0100
Basis
Poin
ts
2009 2010 2011 2012 2013 2014 2015
Libor Repo
CHF 1−Week Basis
−300
−200
−100
0100
Basis
Poin
ts
2009 2010 2011 2012 2013 2014 2015
Libor Repo
DKK 1−Week Basis−
150
−100
−50
050
100
Basis
Poin
ts
2009 2010 2011 2012 2013 2014 2015
Libor Repo
EUR 1−Week Basis
−150
−100
−50
050
100
Basis
Poin
ts
2009 2010 2011 2012 2013 2014 2015
Libor Repo
JPY 1−Week Basis
Figure 6: One-week Repo- and Libor-based CIP Deviations: The green line plotsthe one-week Libor cross-currency basis and the orange line plots the one-week repo cross-currency basis for the Swiss Franc (CHF), the Danish Krone (DKK), the euro (EUR) andthe yen (JPY).
51
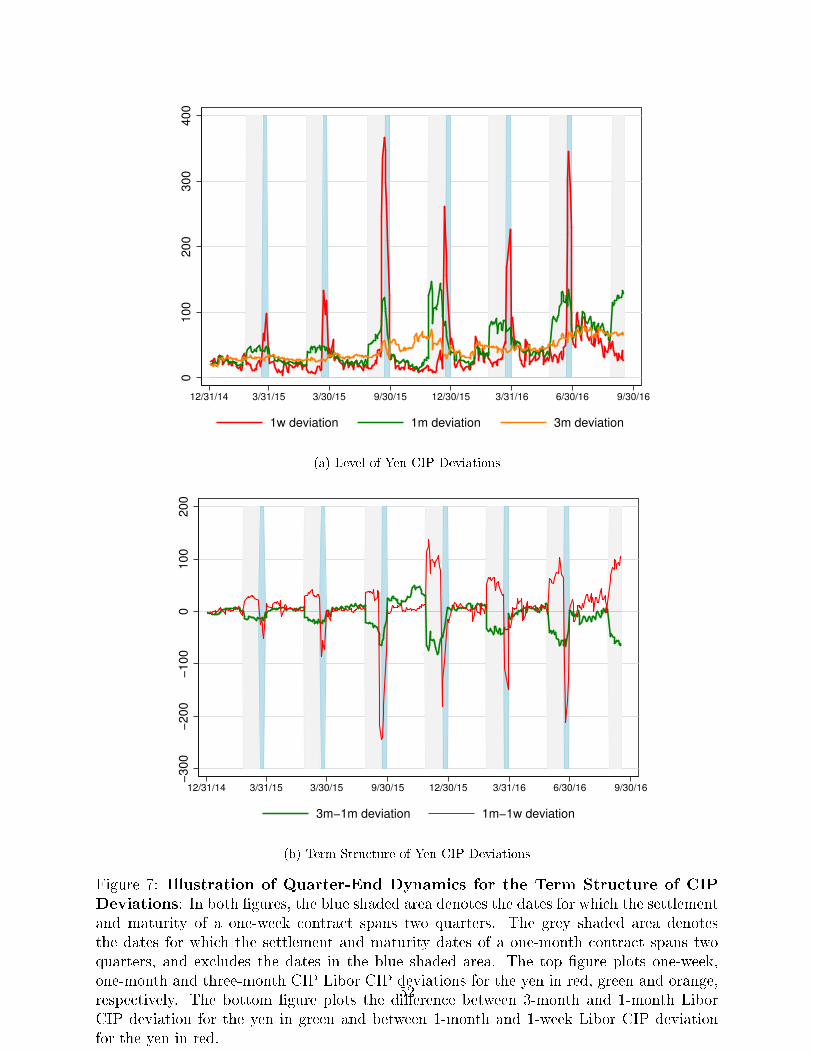
01
00
20
03
00
40
0
12/31/14 3/31/15 3/30/15 9/30/15 12/30/15 3/31/16 6/30/16 9/30/16
1w deviation 1m deviation 3m deviation
(a) Level of Yen CIP Deviations
−3
00
−2
00
−1
00
01
00
20
0
12/31/14 3/31/15 3/30/15 9/30/15 12/30/15 3/31/16 6/30/16 9/30/16
3m−1m deviation 1m−1w deviation
(b) Term Structure of Yen CIP Deviations
Figure 7: Illustration of Quarter-End Dynamics for the Term Structure of CIPDeviations: In both �gures, the blue shaded area denotes the dates for which the settlementand maturity of a one-week contract spans two quarters. The grey shaded area denotesthe dates for which the settlement and maturity dates of a one-month contract spans twoquarters, and excludes the dates in the blue shaded area. The top �gure plots one-week,one-month and three-month CIP Libor CIP deviations for the yen in red, green and orange,respectively. The bottom �gure plots the di�erence between 3-month and 1-month LiborCIP deviation for the yen in green and between 1-month and 1-week Libor CIP deviationfor the yen in red.
52
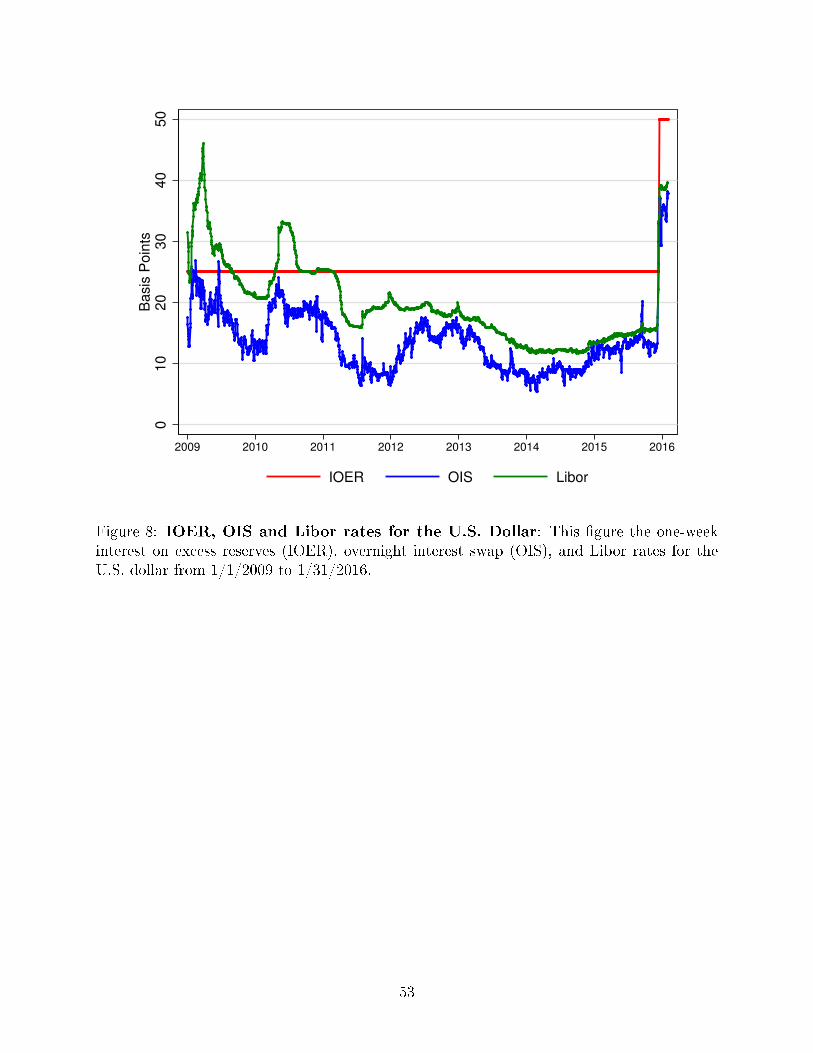
01
02
03
04
05
0
Ba
sis
Po
ints
2009 2010 2011 2012 2013 2014 2015 2016
IOER OIS Libor
Figure 8: IOER, OIS and Libor rates for the U.S. Dollar: This �gure the one-weekinterest on excess reserves (IOER), overnight interest swap (OIS), and Libor rates for theU.S. dollar from 1/1/2009 to 1/31/2016.
53
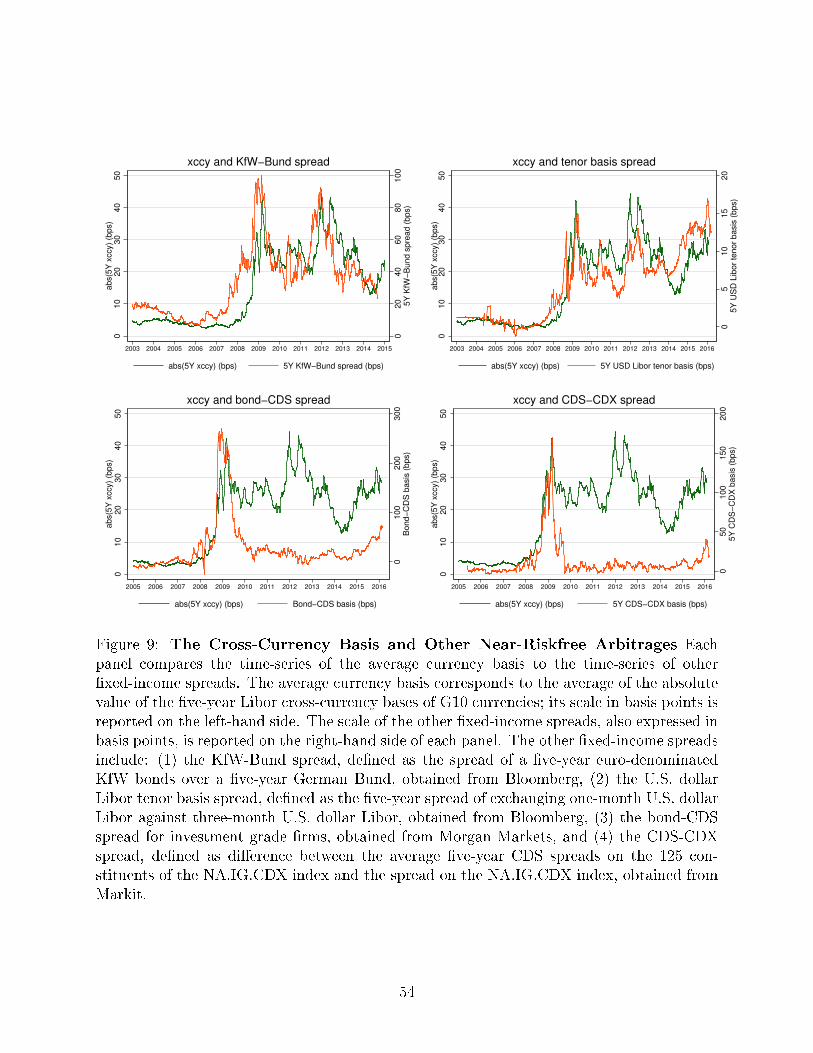
020
40
60
80
100
5Y
KfW
−B
und s
pre
ad (
bps)
010
20
30
40
50
abs(5
Y x
ccy)
(bps)
2003 2004 2005 2006 2007 2008 2009 2010 2011 2012 2013 2014 2015
abs(5Y xccy) (bps) 5Y KfW−Bund spread (bps)
xccy and KfW−Bund spread
05
10
15
20
5Y
US
D L
ibor
tenor
basis
(bps)
010
20
30
40
50
abs(5
Y x
ccy)
(bps)
2003 2004 2005 2006 2007 2008 2009 2010 2011 2012 2013 2014 2015 2016
abs(5Y xccy) (bps) 5Y USD Libor tenor basis (bps)
xccy and tenor basis spread
0100
200
300
Bond−
CD
S b
asis
(bps)
010
20
30
40
50
abs(5
Y x
ccy)
(bps)
2005 2006 2007 2008 2009 2010 2011 2012 2013 2014 2015 2016
abs(5Y xccy) (bps) Bond−CDS basis (bps)
xccy and bond−CDS spread
050
100
150
200
5Y
CD
S−
CD
X b
asis
(bps)
010
20
30
40
50
abs(5
Y x
ccy)
(bps)
2005 2006 2007 2008 2009 2010 2011 2012 2013 2014 2015 2016
abs(5Y xccy) (bps) 5Y CDS−CDX basis (bps)
xccy and CDS−CDX spread
Figure 9: The Cross-Currency Basis and Other Near-Riskfree Arbitrages Eachpanel compares the time-series of the average currency basis to the time-series of other�xed-income spreads. The average currency basis corresponds to the average of the absolutevalue of the �ve-year Libor cross-currency bases of G10 currencies; its scale in basis points isreported on the left-hand side. The scale of the other �xed-income spreads, also expressed inbasis points, is reported on the right-hand side of each panel. The other �xed-income spreadsinclude: (1) the KfW-Bund spread, de�ned as the spread of a �ve-year euro-denominatedKfW bonds over a �ve-year German Bund, obtained from Bloomberg, (2) the U.S. dollarLibor tenor basis spread, de�ned as the �ve-year spread of exchanging one-month U.S. dollarLibor against three-month U.S. dollar Libor, obtained from Bloomberg, (3) the bond-CDSspread for investment grade �rms, obtained from Morgan Markets, and (4) the CDS-CDXspread, de�ned as di�erence between the average �ve-year CDS spreads on the 125 con-stituents of the NA.IG.CDX index and the spread on the NA.IG.CDX index, obtained fromMarkit.
54
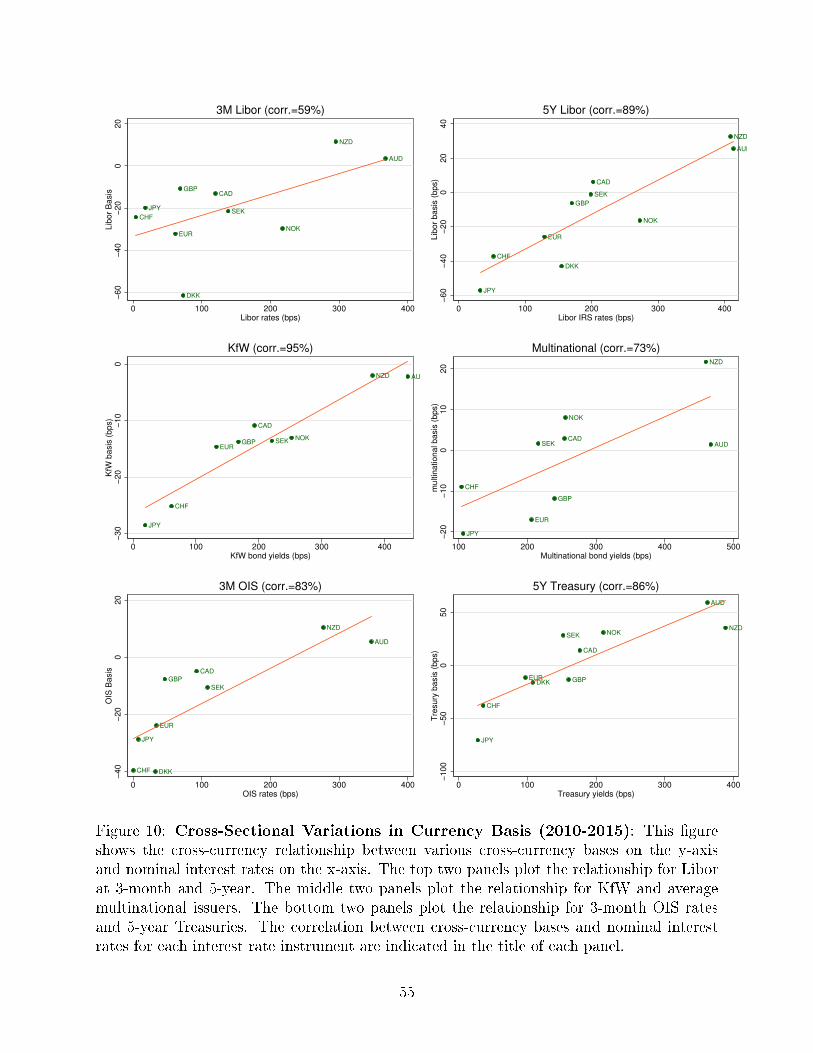
AUD
CAD
CHF
DKK
EUR
GBP
JPY
NOK
NZD
SEK
−60
−40
−20
020
Lib
or
Basis
0 100 200 300 400Libor rates (bps)
3M Libor (corr.=59%)
AUD
CAD
CHF
DKK
EUR
GBP
JPY
NOK
NZD
SEK
−60
−40
−20
020
40
Lib
or
basis
(bps)
0 100 200 300 400Libor IRS rates (bps)
5Y Libor (corr.=89%)
AUD
CAD
CHF
EURGBP
JPY
NOK
NZD
SEK
−30
−20
−10
0K
fW b
asis
(bps)
0 100 200 300 400KfW bond yields (bps)
KfW (corr.=95%)
AUDCAD
CHF
EUR
GBP
JPY
NOK
NZD
SEK−
20
−10
010
20
multin
ational basis
(bps)
100 200 300 400 500Multinational bond yields (bps)
Multinational (corr.=73%)
AUD
CAD
CHF DKK
EUR
GBP
JPY
NZD
SEK
−40
−20
020
OIS
Basis
0 100 200 300 400OIS rates (bps)
3M OIS (corr.=83%)
AUD
CAD
CHF
DKKEUR GBP
JPY
NOKNZD
SEK
−100
−50
050
Tre
sury
basis
(bps)
0 100 200 300 400Treasury yields (bps)
5Y Treasury (corr.=86%)
Figure 10: Cross-Sectional Variations in Currency Basis (2010-2015): This �gureshows the cross-currency relationship between various cross-currency bases on the y-axisand nominal interest rates on the x-axis. The top two panels plot the relationship for Liborat 3-month and 5-year. The middle two panels plot the relationship for KfW and averagemultinational issuers. The bottom two panels plot the relationship for 3-month OIS ratesand 5-year Treasuries. The correlation between cross-currency bases and nominal interestrates for each interest rate instrument are indicated in the title of each panel.
55
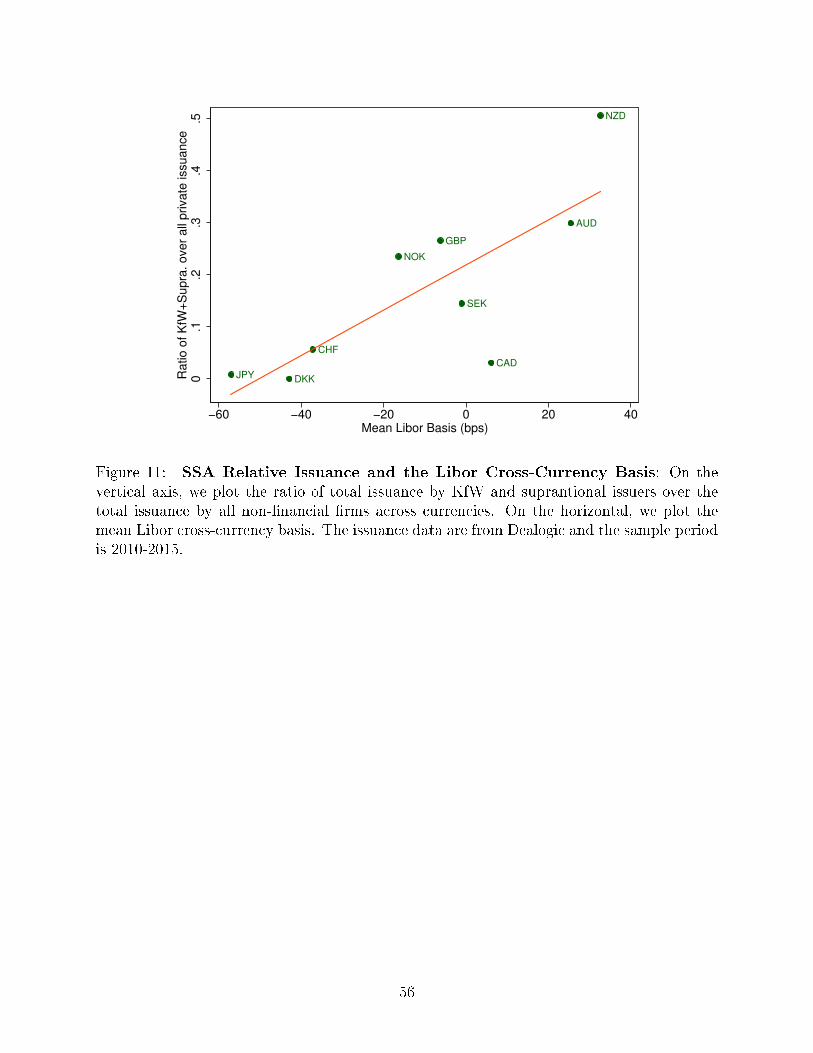
AUD
CAD
CHF
DKK
GBP
JPY
NOK
NZD
SEK
0.1
.2.3
.4.5
Ra
tio
of
KfW
+S
up
ra.
ove
r a
ll p
riva
te issu
an
ce
−60 −40 −20 0 20 40Mean Libor Basis (bps)
Figure 11: SSA Relative Issuance and the Libor Cross-Currency Basis: On thevertical axis, we plot the ratio of total issuance by KfW and suprantional issuers over thetotal issuance by all non-�nancial �rms across currencies. On the horizontal, we plot themean Libor cross-currency basis. The issuance data are from Dealogic and the sample periodis 2010-2015.
56
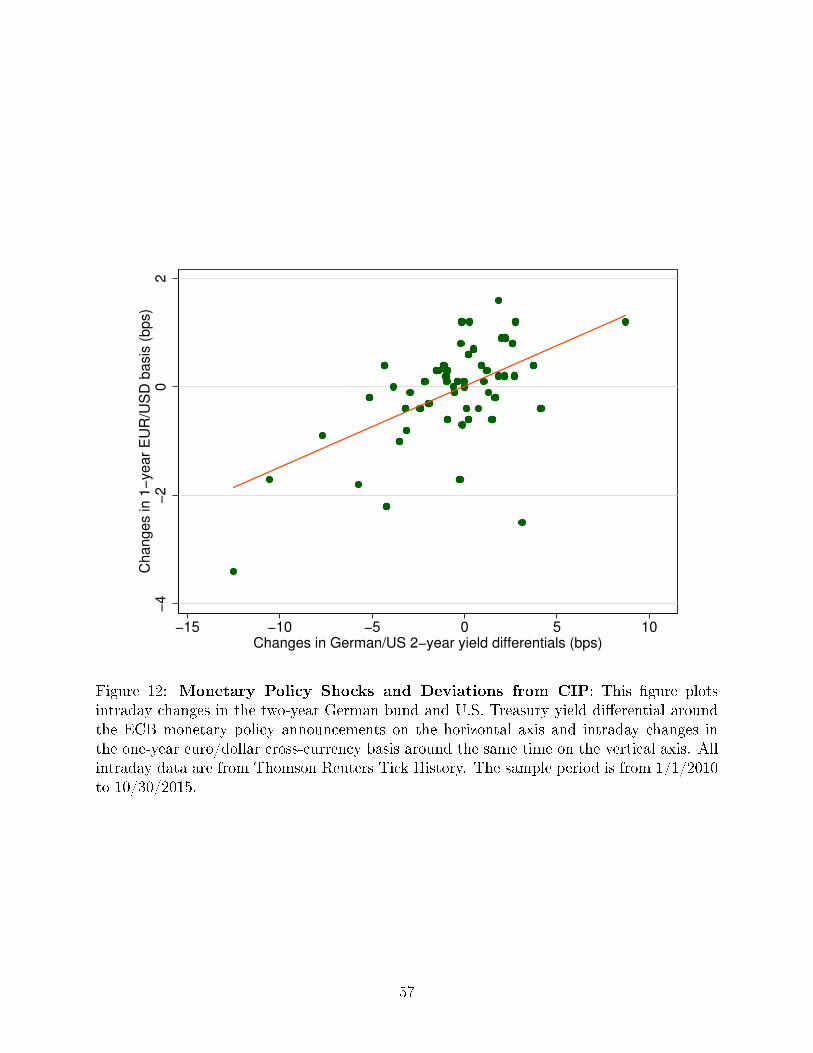
−4
−2
02
Ch
an
ge
s in
1−
ye
ar
EU
R/U
SD
ba
sis
(b
ps)
−15 −10 −5 0 5 10Changes in German/US 2−year yield differentials (bps)
Figure 12: Monetary Policy Shocks and Deviations from CIP: This �gure plotsintraday changes in the two-year German bund and U.S. Treasury yield di�erential aroundthe ECB monetary policy announcements on the horizontal axis and intraday changes inthe one-year euro/dollar cross-currency basis around the same time on the vertical axis. Allintraday data are from Thomson Reuters Tick History. The sample period is from 1/1/2010to 10/30/2015.
57

Table 1: Summary Statistics for Libor-based Covered Interest Parity Deviations
Panel A: 3-month Panel B: 5-year
Currency Benchmark 2000-06 2007-09 2010-15 2000-06 2007-09 2010-15
AUD BBSW -3.7 -2.7 3.5 9.5 9.3 25.4
(4.8) (21.2) (11.7) (2.8) (11.8) (5.8)
CAD CDOR 1.7 -3.8 -13.1 10.7 10.8 6.3
(5.2) (16.6) (7.9) (3.7) (9.5) (5.5)
CHF Libor -0.4 -18.0 -24.2 -2.2 -12.8 -37.0
(4.5) (28.4) (20.9) (0.9) (12.8) (11.6)
DKK Cibor -1.0 -62.7 -61.4 -2.6 -30.2 -42.2
(4.6) (54.4) (25.5) (2.4) (30.1) (11.9)
EUR Euribor 1.8 -27.8 -32.2 0.0 -15.0 -25.7
(3.9) (32.4) (28.0) (2.0) (16.2) (13.4)
GBP Libor -6.7 -35.3 -10.8 -0.9 -17.1 -6.3
(3.8) (38.1) (9.9) (2.3) (18.1) (7.0)
JPY Libor -3.7 -15.6 -19.9 -5.3 -13.5 -56.4
(7.0) (23.9) (11.3) (4.2) (20.1) (14.6)
NOK Nibor -4.1 -29.1 -29.7 -4.7 -14.8 -16.5
(6.5) (33.6) (23.8) (1.9) (12.3) (9.6)
NZD BKBM -5.3 4.5 11.5 3.7 7.9 33.1
(6.8) (15.1) (9.0) (2.9) (8.7) (7.8)
SEK Stibor -3.8 -26.5 -21.4 -1.8 -7.2 -0.5
(5.7) (33.6) (12.9) (1.0) (7.9) (8.1)
Average -2.5 -21.7 -19.7 0.6 -8.2 -11.6
(6.0) (36.6) (26.0) (6.0) (20.5) (29.4)Notes: This table reports the mean Libor basis for G10 currencies for three di�erent peri-ods in basis points. The periods are 1/1/2000�12/31/2006, 1/1/2007�12/31/2009, and1/1/2010�12/31/2015. Standard deviations are shown in the parentheses. Panel A focuseson the three-month currency basis, while Panel B focuses on the �ve-year currency basis.The three-month Libor basis is equal to: y$,Libort,t+n − (yLibort,t+n − ρt,t+n), where y$,Libort,t+n and yLibort,t+n
denote the U.S. and foreign three-month Libor rates and ρt,t+n ≡ 1n(ft,t+n − st) denotes
the forward premium obtained from the forward ft,t+n and spot st exchange rates. The�ve-year currency basis is obtained from cross-currency basis swap contracts. The countriesand currencies are denoted by their usual abbreviations: Australia (AUD), Canada (CAD),Switzerland (CHF), Denmark (DKK), euro area (EUR), U.K. (GBP), Japan (JPY), Norway(NOK), New Zealand (NZD) and Sweden (SEK). For each currency, the table reports theprecise benchmark interest rates used to compute the basis.
58
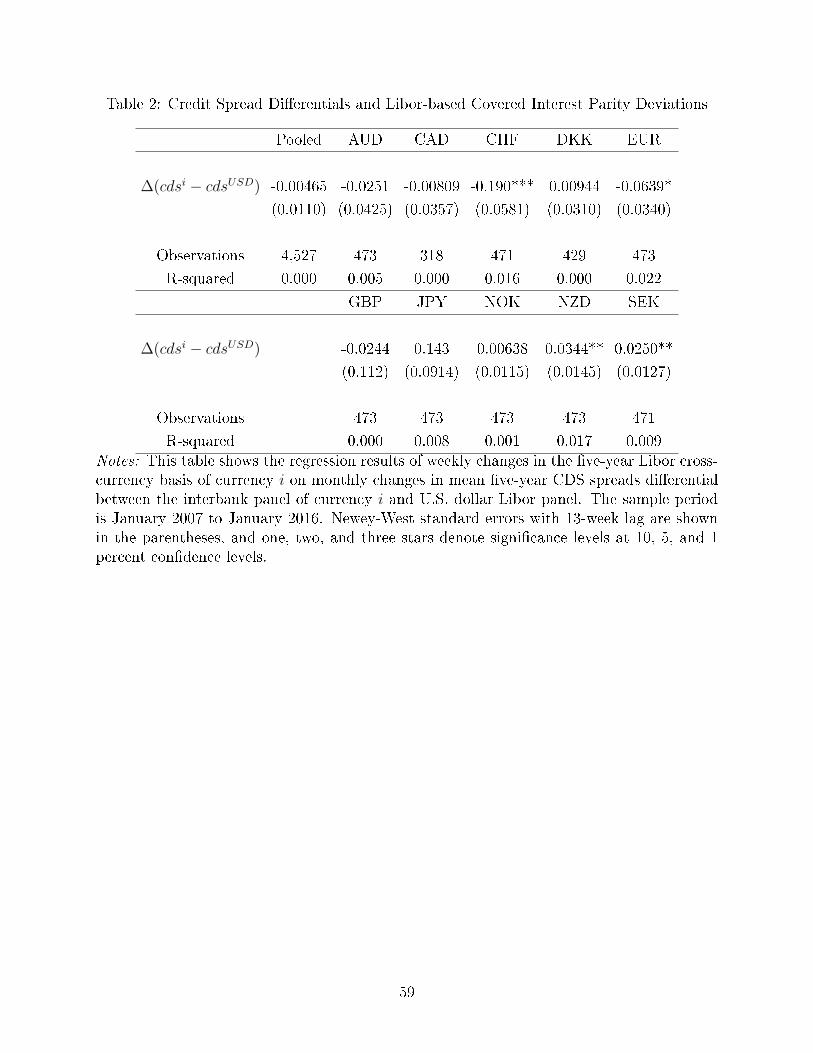
Table 2: Credit Spread Di�erentials and Libor-based Covered Interest Parity Deviations
Pooled AUD CAD CHF DKK EUR
∆(cdsi − cdsUSD) -0.00465 -0.0251 -0.00809 -0.190*** 0.00944 -0.0639*
(0.0110) (0.0425) (0.0357) (0.0581) (0.0310) (0.0340)
Observations 4,527 473 318 471 429 473
R-squared 0.000 0.005 0.000 0.016 0.000 0.022
GBP JPY NOK NZD SEK
∆(cdsi − cdsUSD) -0.0244 0.143 0.00638 0.0344** 0.0250**
(0.112) (0.0914) (0.0115) (0.0145) (0.0127)
Observations 473 473 473 473 471
R-squared 0.000 0.008 0.001 0.017 0.009Notes: This table shows the regression results of weekly changes in the �ve-year Libor cross-currency basis of currency i on monthly changes in mean �ve-year CDS spreads di�erentialbetween the interbank panel of currency i and U.S. dollar Libor panel. The sample periodis January 2007 to January 2016. Newey-West standard errors with 13-week lag are shownin the parentheses, and one, two, and three stars denote signi�cance levels at 10, 5, and 1percent con�dence levels.
59
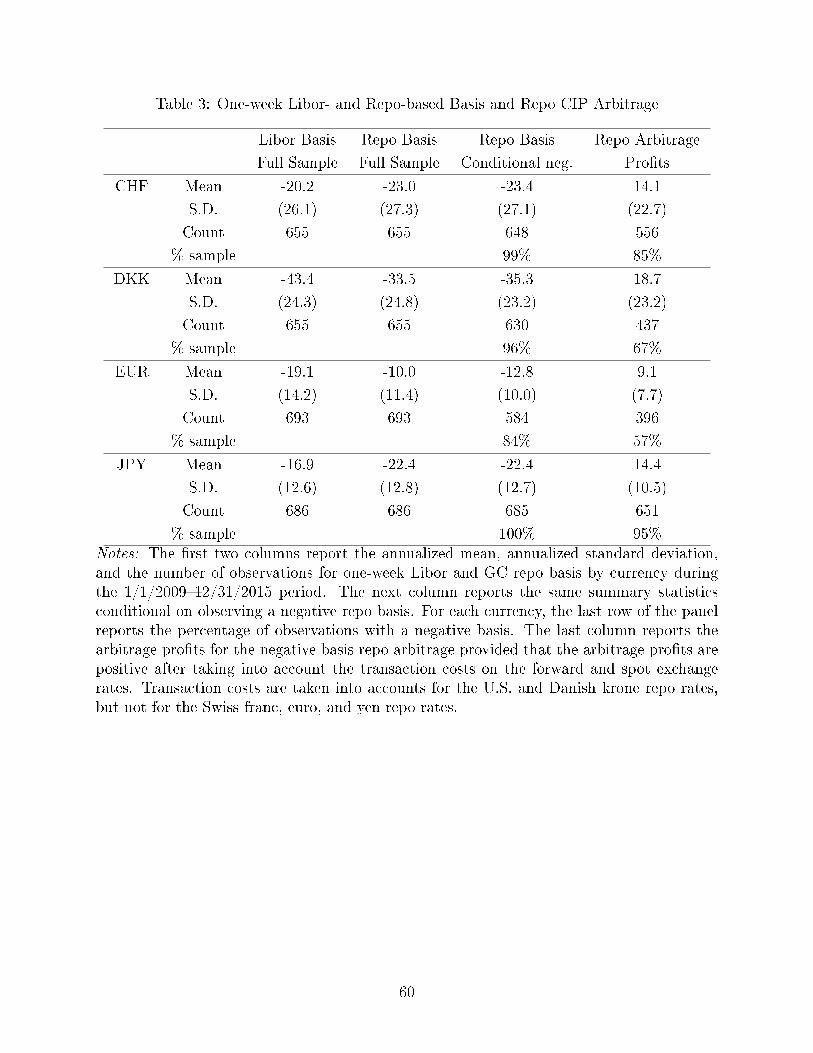
Table 3: One-week Libor- and Repo-based Basis and Repo CIP Arbitrage
Libor Basis Repo Basis Repo Basis Repo Arbitrage
Full Sample Full Sample Conditional neg. Pro�ts
CHF Mean -20.2 -23.0 -23.4 14.1
S.D. (26.1) (27.3) (27.1) (22.7)
Count 655 655 648 556
% sample 99% 85%
DKK Mean -43.4 -33.5 -35.3 18.7
S.D. (24.3) (24.8) (23.2) (23.2)
Count 655 655 630 437
% sample 96% 67%
EUR Mean -19.1 -10.0 -12.8 9.1
S.D. (14.2) (11.4) (10.0) (7.7)
Count 693 693 584 396
% sample 84% 57%
JPY Mean -16.9 -22.4 -22.4 14.4
S.D. (12.6) (12.8) (12.7) (10.5)
Count 686 686 685 651
% sample 100% 95%Notes: The �rst two columns report the annualized mean, annualized standard deviation,and the number of observations for one-week Libor and GC repo basis by currency duringthe 1/1/2009�12/31/2015 period. The next column reports the same summary statisticsconditional on observing a negative repo basis. For each currency, the last row of the panelreports the percentage of observations with a negative basis. The last column reports thearbitrage pro�ts for the negative basis repo arbitrage provided that the arbitrage pro�ts arepositive after taking into account the transaction costs on the forward and spot exchangerates. Transaction costs are taken into accounts for the U.S. and Danish krone repo rates,but not for the Swiss franc, euro, and yen repo rates.
60
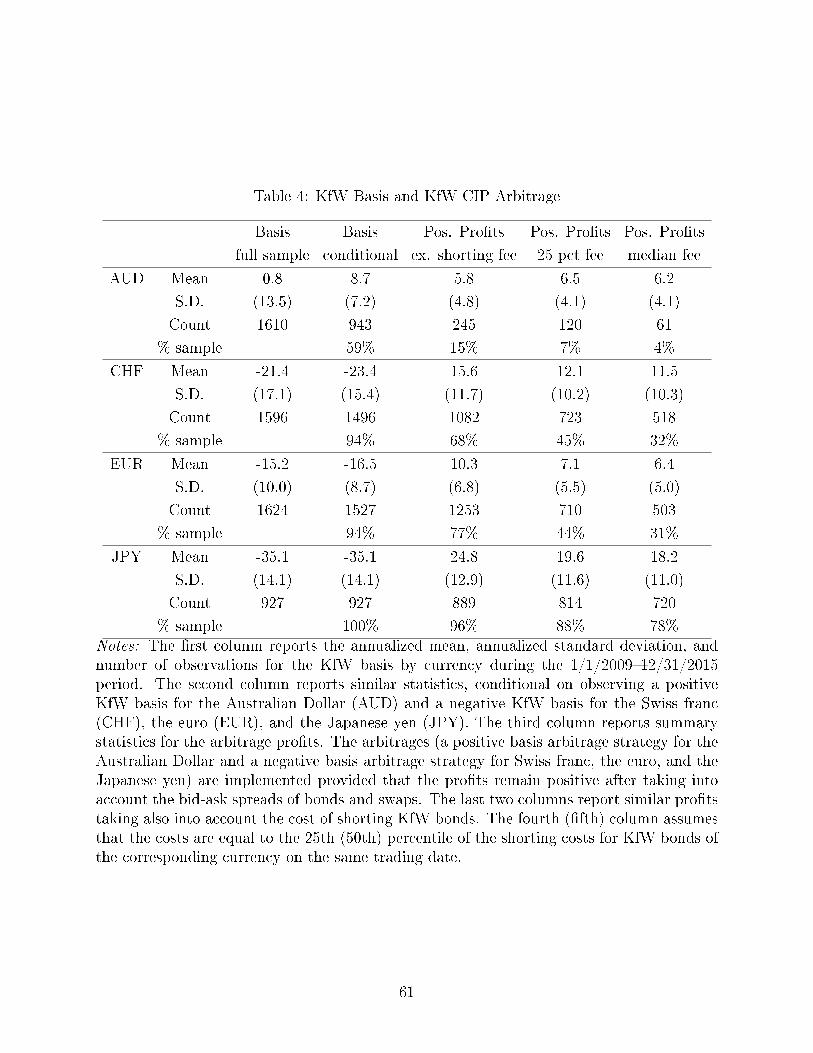
Table 4: KfW Basis and KfW CIP Arbitrage
Basis Basis Pos. Pro�ts Pos. Pro�ts Pos. Pro�ts
full sample conditional ex. shorting fee 25 pct fee median fee
AUD Mean 0.8 8.7 5.8 6.5 6.2
S.D. (13.5) (7.2) (4.8) (4.1) (4.1)
Count 1610 943 245 120 61
% sample 59% 15% 7% 4%
CHF Mean -21.4 -23.4 15.6 12.1 11.5
S.D. (17.1) (15.4) (11.7) (10.2) (10.3)
Count 1596 1496 1082 723 518
% sample 94% 68% 45% 32%
EUR Mean -15.2 -16.5 10.3 7.1 6.4
S.D. (10.0) (8.7) (6.8) (5.5) (5.0)
Count 1624 1527 1253 710 503
% sample 94% 77% 44% 31%
JPY Mean -35.1 -35.1 24.8 19.6 18.2
S.D. (14.1) (14.1) (12.9) (11.6) (11.0)
Count 927 927 889 814 720
% sample 100% 96% 88% 78%Notes: The �rst column reports the annualized mean, annualized standard deviation, andnumber of observations for the KfW basis by currency during the 1/1/2009�12/31/2015period. The second column reports similar statistics, conditional on observing a positiveKfW basis for the Australian Dollar (AUD) and a negative KfW basis for the Swiss franc(CHF), the euro (EUR), and the Japanese yen (JPY). The third column reports summarystatistics for the arbitrage pro�ts. The arbitrages (a positive basis arbitrage strategy for theAustralian Dollar and a negative basis arbitrage strategy for Swiss franc, the euro, and theJapanese yen) are implemented provided that the pro�ts remain positive after taking intoaccount the bid-ask spreads of bonds and swaps. The last two columns report similar pro�tstaking also into account the cost of shorting KfW bonds. The fourth (�fth) column assumesthat the costs are equal to the 25th (50th) percentile of the shorting costs for KfW bonds ofthe corresponding currency on the same trading date.
61
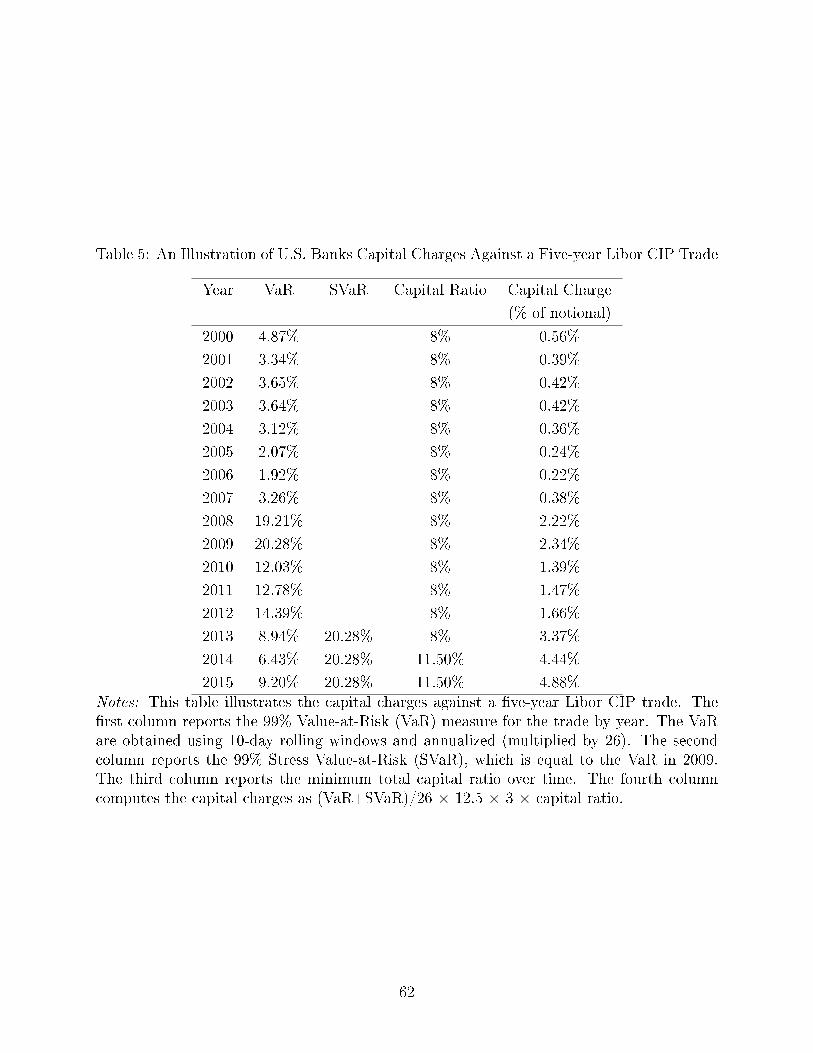
Table 5: An Illustration of U.S. Banks Capital Charges Against a Five-year Libor CIP Trade
Year VaR SVaR Capital Ratio Capital Charge
(% of notional)
2000 4.87% 8% 0.56%
2001 3.34% 8% 0.39%
2002 3.65% 8% 0.42%
2003 3.64% 8% 0.42%
2004 3.12% 8% 0.36%
2005 2.07% 8% 0.24%
2006 1.92% 8% 0.22%
2007 3.26% 8% 0.38%
2008 19.21% 8% 2.22%
2009 20.28% 8% 2.34%
2010 12.03% 8% 1.39%
2011 12.78% 8% 1.47%
2012 14.39% 8% 1.66%
2013 8.94% 20.28% 8% 3.37%
2014 6.43% 20.28% 11.50% 4.44%
2015 9.20% 20.28% 11.50% 4.88%Notes: This table illustrates the capital charges against a �ve-year Libor CIP trade. The�rst column reports the 99% Value-at-Risk (VaR) measure for the trade by year. The VaRare obtained using 10-day rolling windows and annualized (multiplied by 26). The secondcolumn reports the 99% Stress Value-at-Risk (SVaR), which is equal to the VaR in 2009.The third column reports the minimum total capital ratio over time. The fourth columncomputes the capital charges as (VaR+SVaR)/26 × 12.5 × 3 × capital ratio.
62
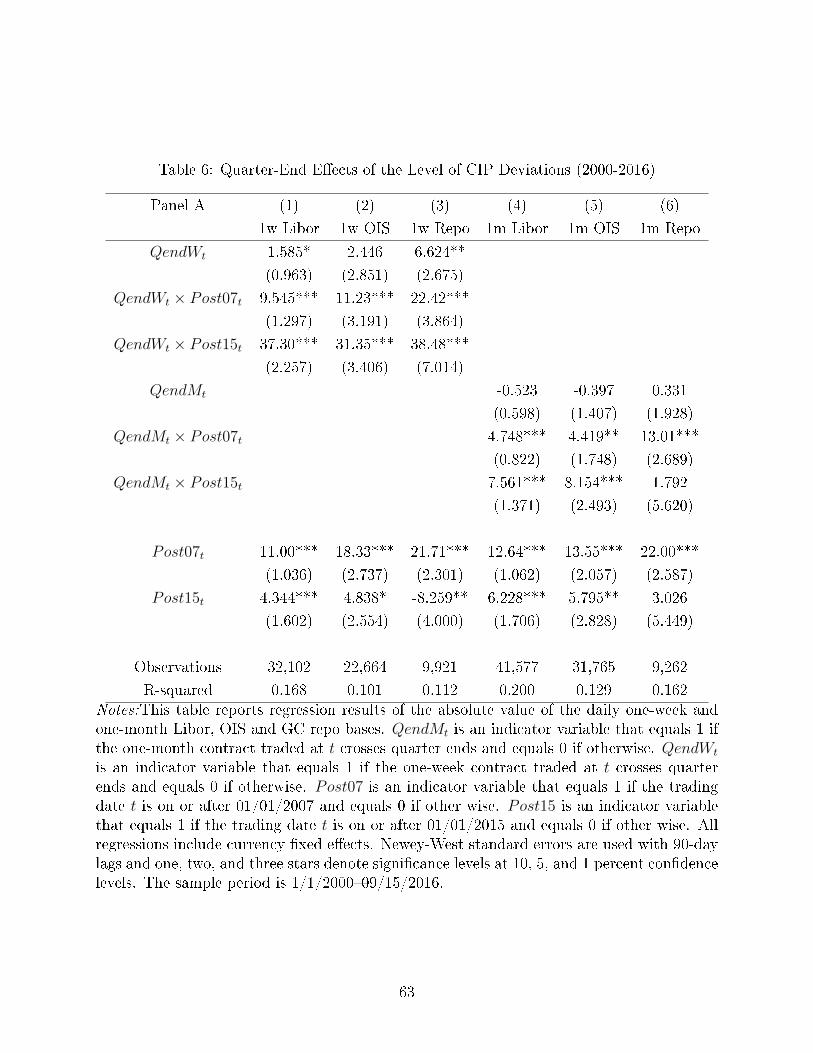
Table 6: Quarter-End E�ects of the Level of CIP Deviations (2000-2016)
Panel A (1) (2) (3) (4) (5) (6)
1w Libor 1w OIS 1w Repo 1m Libor 1m OIS 1m Repo
QendWt 1.585* 2.446 6.624**
(0.963) (2.851) (2.675)
QendWt × Post07t 9.545*** 11.23*** 22.42***
(1.297) (3.191) (3.864)
QendWt × Post15t 37.30*** 31.35*** 38.48***
(2.257) (3.406) (7.014)
QendMt -0.523 -0.397 0.331
(0.598) (1.407) (1.928)
QendMt × Post07t 4.748*** 4.419** 13.01***
(0.822) (1.748) (2.689)
QendMt × Post15t 7.561*** 8.154*** 1.792
(1.371) (2.493) (5.620)
Post07t 11.00*** 18.33*** 21.71*** 12.64*** 13.55*** 22.00***
(1.036) (2.737) (2.301) (1.062) (2.057) (2.587)
Post15t 4.344*** 4.838* -8.259** 6.228*** 5.795** 3.026
(1.602) (2.554) (4.000) (1.706) (2.828) (5.449)
Observations 32,102 22,664 9,921 41,577 31,765 9,262
R-squared 0.168 0.101 0.112 0.200 0.129 0.162Notes:This table reports regression results of the absolute value of the daily one-week andone-month Libor, OIS and GC repo bases. QendMt is an indicator variable that equals 1 ifthe one-month contract traded at t crosses quarter ends and equals 0 if otherwise. QendWt
is an indicator variable that equals 1 if the one-week contract traded at t crosses quarterends and equals 0 if otherwise. Post07 is an indicator variable that equals 1 if the tradingdate t is on or after 01/01/2007 and equals 0 if other wise. Post15 is an indicator variablethat equals 1 if the trading date t is on or after 01/01/2015 and equals 0 if other wise. Allregressions include currency �xed e�ects. Newey-West standard errors are used with 90-daylags and one, two, and three stars denote signi�cance levels at 10, 5, and 1 percent con�dencelevels. The sample period is 1/1/2000�09/15/2016.
63

Table 7: Quarter-End E�ects on the Term Structure of CIP Deviations (2007-2016)
(1) (2) (3) (4) (5) (6)
tsLibor3M−1M tsOIS3M−1M tsRepo3M−1M tsLibor1M−1W tsOIS1M−1W tsRepo1M−1W
QendMt 0.565 0.565 0.565
(0.414) (0.414) (0.414)
QendMt × Post07t -2.390*** -2.390*** -2.390***
(0.567) (0.567) (0.567)
QendMt × Post15t -9.476*** -9.476*** -9.476***
(0.934) (0.934) (0.934)
IQendMt=1,QendWt=0 -0.625 0.543 0.827
(0.577) (1.315) (1.020)
IQendMt=1,QendWt=0 × Post07t 4.242*** 2.392 8.270***
(0.773) (1.466) (1.505)
IQendMt=1,QendWt=0 × Post15t 12.76*** 11.05*** 19.84***
(1.226) (1.426) (3.635)
QendWt -3.217*** -3.782** -5.618***
(0.809) (1.743) (1.525)
QendWt × Post07t -1.404 -5.725*** -8.307***
(1.085) (1.950) (2.353)
QendWt × Post15t -33.39*** -25.22*** -77.10***
(1.849) (2.057) (6.177)
Post07t 5.925*** 5.925*** 5.925*** 0.843 -0.524 1.087
(0.553) (0.553) (0.553) (0.657) (1.097) (0.912)
Post15t -2.591*** -2.591*** -2.591*** 0.444 1.594 5.516**
(0.890) (0.890) (0.890) (1.022) (1.030) (2.160)
Observations 41,553 41,553 41,553 32,045 22,491 7,337
R-squared 0.104 0.104 0.104 0.095 0.091 0.131Notes:This table reports regression results of the absolute value of the daily one-week andone-month Libor, OIS and GC repo bases. QendMt is an indicator variable that equals 1 ifthe one-month contract traded at t crosses quarter ends and equals 0 if otherwise. QendWt
is an indicator variable that equals 1 if the one-week contract traded at t crosses quarterends and equals 0 if otherwise. IQendMt=1,QendWt=0 is an indicator variable that equals 1 ifQendMt = 1 and QendWt = 0 and equals 0 if otherwise. Post07 is an indicator variable thatequals 1 if the trading date t is on or after 01/01/2007 and equals 0 if other wise. Post15 isan indicator variable that equals 1 if the trading date t is on or after 01/01/2015 and equals0 if other wise. All regressions include currency �xed e�ects. Newey-West standard errorsare used with 90-day lags and one, two, and three stars denote signi�cance levels at 10, 5,and 1 percent con�dence levels. The sample period is 1/1/2000�09/15/2016.
64
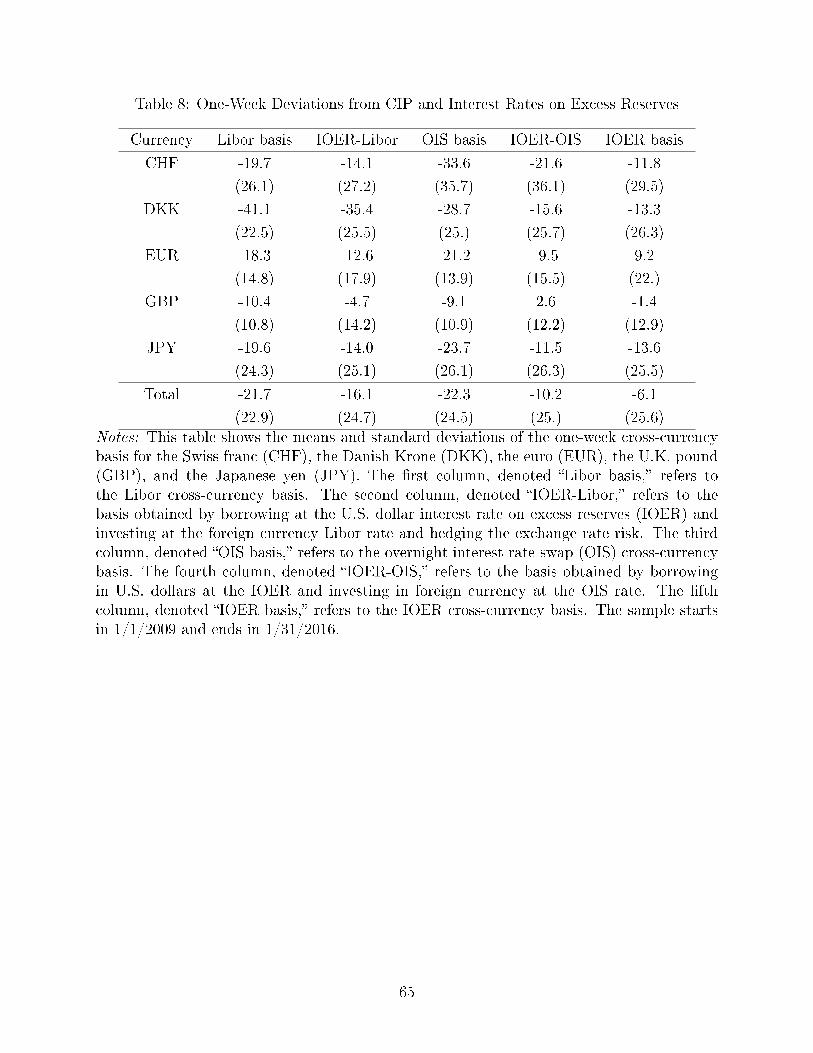
Table 8: One-Week Deviations from CIP and Interest Rates on Excess Reserves
Currency Libor basis IOER-Libor OIS basis IOER-OIS IOER basis
CHF -19.7 -14.1 -33.6 -21.6 -11.8
(26.1) (27.2) (35.7) (36.1) (29.5)
DKK -41.1 -35.4 -28.7 -15.6 -13.3
(22.5) (25.5) (25.) (25.7) (26.3)
EUR -18.3 -12.6 -21.2 -9.5 9.2
(14.8) (17.9) (13.9) (15.5) (22.)
GBP -10.4 -4.7 -9.1 2.6 -1.4
(10.8) (14.2) (10.9) (12.2) (12.9)
JPY -19.6 -14.0 -23.7 -11.5 -13.6
(24.3) (25.1) (26.1) (26.3) (25.5)
Total -21.7 -16.1 -22.3 -10.2 -6.1
(22.9) (24.7) (24.5) (25.) (25.6)Notes: This table shows the means and standard deviations of the one-week cross-currencybasis for the Swiss franc (CHF), the Danish Krone (DKK), the euro (EUR), the U.K. pound(GBP), and the Japanese yen (JPY). The �rst column, denoted �Libor basis,� refers tothe Libor cross-currency basis. The second column, denoted �IOER-Libor,� refers to thebasis obtained by borrowing at the U.S. dollar interest rate on excess reserves (IOER) andinvesting at the foreign currency Libor rate and hedging the exchange rate risk. The thirdcolumn, denoted �OIS basis,� refers to the overnight interest rate swap (OIS) cross-currencybasis. The fourth column, denoted �IOER-OIS,� refers to the basis obtained by borrowingin U.S. dollars at the IOER and investing in foreign currency at the OIS rate. The �fthcolumn, denoted �IOER basis,� refers to the IOER cross-currency basis. The sample startsin 1/1/2009 and ends in 1/31/2016.
65
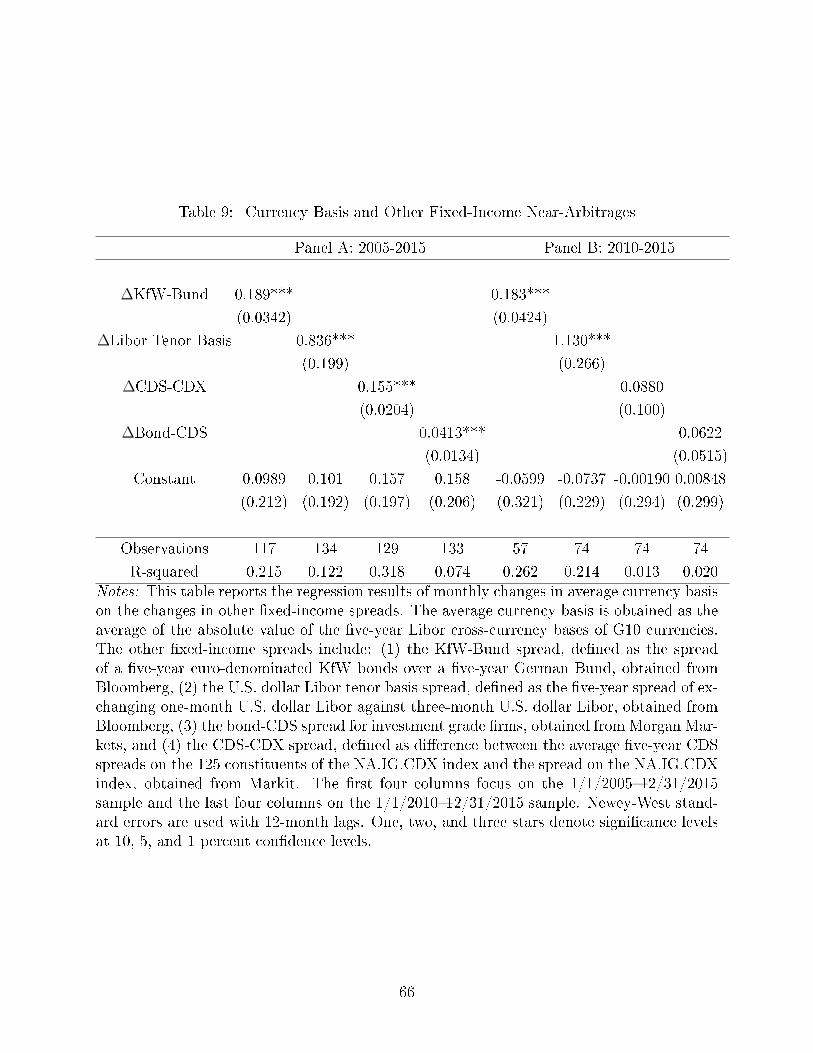
Table 9: Currency Basis and Other Fixed-Income Near-Arbitrages
Panel A: 2005-2015 Panel B: 2010-2015
∆KfW-Bund 0.189*** 0.183***
(0.0342) (0.0424)
∆Libor Tenor Basis 0.836*** 1.130***
(0.199) (0.266)
∆CDS-CDX 0.155*** 0.0880
(0.0204) (0.100)
∆Bond-CDS 0.0413*** 0.0622
(0.0134) (0.0515)
Constant 0.0989 0.101 0.157 0.158 -0.0599 -0.0737 -0.00190 0.00848
(0.212) (0.192) (0.197) (0.206) (0.321) (0.229) (0.294) (0.299)
Observations 117 134 129 133 57 74 74 74
R-squared 0.215 0.122 0.318 0.074 0.262 0.214 0.013 0.020Notes: This table reports the regression results of monthly changes in average currency basison the changes in other �xed-income spreads. The average currency basis is obtained as theaverage of the absolute value of the �ve-year Libor cross-currency bases of G10 currencies.The other �xed-income spreads include: (1) the KfW-Bund spread, de�ned as the spreadof a �ve-year euro-denominated KfW bonds over a �ve-year German Bund, obtained fromBloomberg, (2) the U.S. dollar Libor tenor basis spread, de�ned as the �ve-year spread of ex-changing one-month U.S. dollar Libor against three-month U.S. dollar Libor, obtained fromBloomberg, (3) the bond-CDS spread for investment grade �rms, obtained fromMorgan Mar-kets, and (4) the CDS-CDX spread, de�ned as di�erence between the average �ve-year CDSspreads on the 125 constituents of the NA.IG.CDX index and the spread on the NA.IG.CDXindex, obtained from Markit. The �rst four columns focus on the 1/1/2005�12/31/2015sample and the last four columns on the 1/1/2010�12/31/2015 sample. Newey-West stand-ard errors are used with 12-month lags. One, two, and three stars denote signi�cance levelsat 10, 5, and 1 percent con�dence levels.
66