Embed Size (px)
Citation preview
DPCE
Bt
Mida
Rsrahca
Ca
Ks
Awrsadspwoeitvo
pncaca
F
A
R
0d
eviant Functional Magnetic Resonance Imagingatterns of Brain Activity to Speech in 2–3-Year-Oldhildren with Autism Spectrum Disorder
lizabeth Redcay and Eric Courchesne
ackground: A failure to develop normal language is one of the most common first signs that a toddler might be at risk for autism. Currentlyhe neural bases underlying this failure to develop language are unknown.
ethods: In this study, functional magnetic resonance imaging (fMRI) was used to identify the brain regions involved in speech perceptionn 12 2–3-year-old children with autism spectrum disorder (ASD) during natural sleep. We also recorded fMRI data from two typicallyeveloping control groups: a mental age-matched (MA) (n � 11) and a chronological age-matched (CA) (n � 12) group. During fMRI datacquisition, forward and backward speech stimuli were presented with intervening periods of no sound presentation.
esults: Direct statistical comparison between groups revealed significant differences in regions recruited to process speech. In compari-on with their MA-matched control subjects, the ASD group showed reduced activity in an extended network of brain regions, which areecruited in typical early language acquisition. In comparison with their CA-matched control subjects, ASD participants showed greaterctivation primarily within right and medial frontal regions. Laterality analyses revealed a trend toward greater recruitment of rightemisphere regions in the ASD group and left hemisphere regions in the CA group during the forward speech condition. Furthermore,orrelation analyses revealed a significant positive relationship between right hemisphere frontal and temporal activity to forward speechnd receptive language skill.
onclusions: These findings suggest that at 2–3 years, children with ASD might be on a deviant developmental trajectory characterized by
greater recruitment of right hemisphere regions during speech perception.ey Words: Development, fMRI, language, laterality, pediatric,leep
striking disparity in language development between au-tistic and typical children is seen by the second year of life(1). In fact, a delay in language is often one of the first
arning signs to parents and clinicians that a child might be atisk for autism (2,3). Language impairments in autism can beevere with approximately 50% percent of individuals nevercquiring functional language (4). Those autistic children who doevelop functional language commonly show impairments inemantic and pragmatic aspects of language, such as use ofrosody, pronoun, or inferring intentions of the speaker,hereas structural aspects, such as syntax and grammar, moreften seem relatively less impaired (5), although more recentvidence suggests some children with autism do show structuralmpairments as well (6). Although much research has elucidatedhe behavioral characteristics of language impairments (for re-iew see [7]), remarkably little is known about the neural basesf language abnormalities in autism, particularly at young ages.
The extant functional magnetic resonance imaging (fMRI) andositron emission tomography (PET) studies examining theeural bases of language processing in autism have all beenonducted with relatively high-functioning older children anddults (8–13), except one in which sedation was used withhildren 4 –10 years of age (14). In general, these studies revealn abnormal frontal and/or temporal response during language
rom the Department of Psychology (ER); Department of Neurosciences(EC), University of California; and the Center for Autism Research (EC),Rady Children’s Hospital Research Center, San Diego, California.
ddress reprint requests to Elizabeth Redcay, M.A., 8110 La Jolla ShoresDrive, La Jolla, CA 92037; E-mail: [email protected].
eceived September 10, 2007; revised May 1, 2008; accepted May 24, 2008
006-3223/08/$34.00oi:10.1016/j.biopsych.2008.05.020
processing in autism, and some show a pattern of reduced orreversed laterality in frontal cortex (8 –11). Although these stud-ies have advanced our understanding of brain abnormalitiesunderlying language processing at a middle or end point ofdevelopment, the findings might not reflect the initial brainabnormalities at the time of the emergence of the disorder orbrain abnormalities of children on the lower-functioning end ofthe autism spectrum. Much evidence suggests that deviant pat-terns of brain structure are not only greater at younger ages butmight also be different than at older ages in autism (15–21). Forexample, whereas amygdala volume and neuron number isnormal or reduced at older ages, amygdala volume is increasedat younger ages (19,22–26), suggesting neurobiological pro-cesses in the initial phase of autism might be unique.
Only one study has examined the neural correlates of linguis-tic processing in children as young as 3 years of age with autismspectrum disorder (ASD) (27). In that study, presentation ofdeviant phonemes failed to elicit an event-related potential (ERP)index of sound discrimination, the mismatch negativity (MMN),in children with autism. Interestingly, studies of older childrenwith autism revealed an intact MMN response to phonemes butreduced P3a amplitude as compared with typical children (28–30). In sum, limited functional evidence from very young chil-dren with ASD also suggests that the neural bases of autism needto be addressed from a developmental perspective, becausebrain activation patterns from the older child and adult withautism might not necessarily reflect those of the younger child.Electrophysiological studies lack the whole brain resolutionafforded by fMRI methods. Thus, a critical question remains:what are the specific neural structures underlying languageimpairments in autism at the time the disorder is first reliablyidentified and diagnosed, namely at 2–3 years of age?
The paucity of functional neuroimaging from very young
children with autism is likely due to the difficulty in acquiringBIOL PSYCHIATRY 2008;64:589–598© 2008 Society of Biological Psychiatry
s(ptiDdsp
T
I
AAAAAAAAAAAA
n
MMMMMMMMMMM
n
CCCCCCCCCCCC
n
Ls
acqui
590 BIOL PSYCHIATRY 2008;64:589–598 E. Redcay and E. Courchesne
w
uch data. Previous work by our group (31,32) and others33–35) have identified reliable fMRI activation patterns duringresentation of auditory stimuli during natural sleep in infants,oddlers, and very young children. In a previous fMRI study wedentified age-related changes in the Blood Oxygenated Levelependent (BOLD) response between typically developing tod-lers and 3-year-old children during presentation of text pas-ages in sleep (31). In that study, the 3-year-old group used
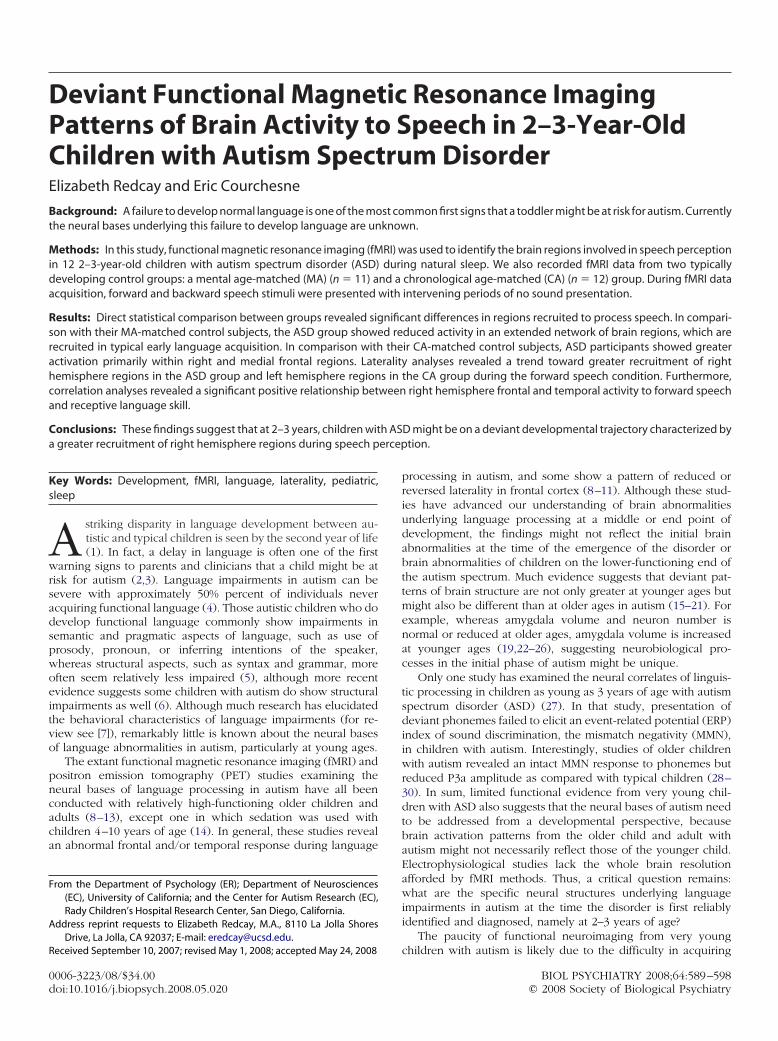
able 1. Participant Information
D Gender Age (mo)Receptive Language
Age EquivalentVisual ReAge Eq
ASD
SD1 M 25.7 10 13SD2 M 26.5 10 17SD3 M 29.7 18 25SD4 M 30.3 14 23SD5 M 30.3 5 18SD6 M 31.8 6 15SD7 M 32.1 10 15SD8 M 36.2 9 17SD9 M 41.0 18 25SD10 M 41.9 23 21SD11 M 46.5 25 25SD12 M 46.9 36 33
� 12 12M 34.9 (7.4) 15.3 (9.1) 20.6
MA
A1 M 13.1 9 12A2 M 14.5 8 12A3 M 14.3 23 26A4 M 16.3 24 18A5 F 20.3 14 19A6 M 21.2 23 16A7 M 22.5 28 24A8 M 22.9 25 21A9 F 22.9 28 31A10 M 23.8 18 27A11 M 23.9 23 21
� 11 9M 2F 19.6 (4.2) 20.3 (7.1) 20.
CA
A1 F 24.8 30 21A2 F 30.5 30 26A3 M 31.1 31 39A4 M 34.0 39 52A5 M 35.2 39 41A6 M 36.4 47 39A7 M 35.4 39 46A8 M 36.9 36 27A9 F 38.0 44 43A10 M 38.9 36 45A11 M 41.5 62 50A12 F 44.7 a a
� 12 8M 4F 35.7 (5.3) 39.4 (9.3) 39.0
Mean and SD are given for each of the three groups separately. T-scoreearning. Composite score reflects the composite of the four subtests of thtandardized mean is 100.
ASD, autism spectrum disorder; MA-matched, mental age-matched conaBehavioral testing was not available from CA12 with 2 months of fMRI
rimarily bilateral superior temporal and parietal regions to
ww.sobp.org/journal
process forward speech as compared with no sound presenta-tion, whereas the toddler group recruited a large number ofcortical and subcortical brain regions. We suggest that theseregions might be part of an extended network of brain activationhere and in our previous paper (31), although the extent towhich these regions are functioning as a network has not beendirectly tested. We raised the possibility that this hypothesizednetwork of regions in toddlers might reflect the state of a young
ionnt Composite Score
Receptive LanguageT-Score
Visual ReceptionT-Score
up
54 20 2054 20 2775 29 4368 20 3445 �20 2054 �20 2030 �20 2044 �20 2060 �20 2051 20 2454 �20 2068 35 27
54.8 (12.2) 24.0 (6.5) 24.6 (7.3)
p
89 35 4680 31 4690 47 56
134 72 57107 54 53
87 56 36124 65 56105 58 47110 59 65
85 32 5591 47 43
) 100.2 (17.3) 50.6 (13.5) 50.9 (8.1)
p
105 63 4392 49 42
103 49 63121 56 77111 56 60123 68 56118 56 67
82 47 29121 58 58125 57 72132 76 63
a a a
) 112.1 (15.2) 57.3 (14.2) 55.3 (13.3)
Age equivalent scores are taken from the subscales Mullen Scales of Earlylen: Visual Reception, Fine Motor, Receptive and Expressive Language. The
A-matched, chronological age-matched control.sition.
ceptuivale
Gro
(5.8)
Grou
6 (6.1
Grou
(10.2
s ande Mul
trol; C
brain that has not yet become specialized for language but rather
ia
tpb(lcopwpor
M
P
pCCtD
Fstrvmm
E. Redcay and E. Courchesne BIOL PSYCHIATRY 2008;64:589–598 591
s poised and ready to acquire language through social, attention,nd other systems that are available.
In this study, we presented the same speech paradigm used inhe Redcay et al. study (31) to 2–3-year-old children with arovisional diagnosis of ASD during sleep. The design containedoth a mental age-matched typically developing control groupMA) to control for the effects of language skill and a chrono-ogical age-matched (CA) typically developing control group toontrol for the effects of maturation. These control groups largelyverlapped with the toddler and 3-year old groups in ourrevious report (31). The goal of the study was to determinehether the ASD group would show an extended networkattern of brain activation like their MA-matched control subjectsr whether activity would be specialized to superior temporalegions like that seen in the CA-matched control subjects.
ethods and Materials
articipantsTwenty-three children between 2 and 3 years of age with a
rovisional diagnosis of ASD participated in the current study.hildren with ASD were recruited from the San Diego Regionalenter, Rady Children’s Hospital toddler school, online adver-
isements and parent groups, the University of California at San
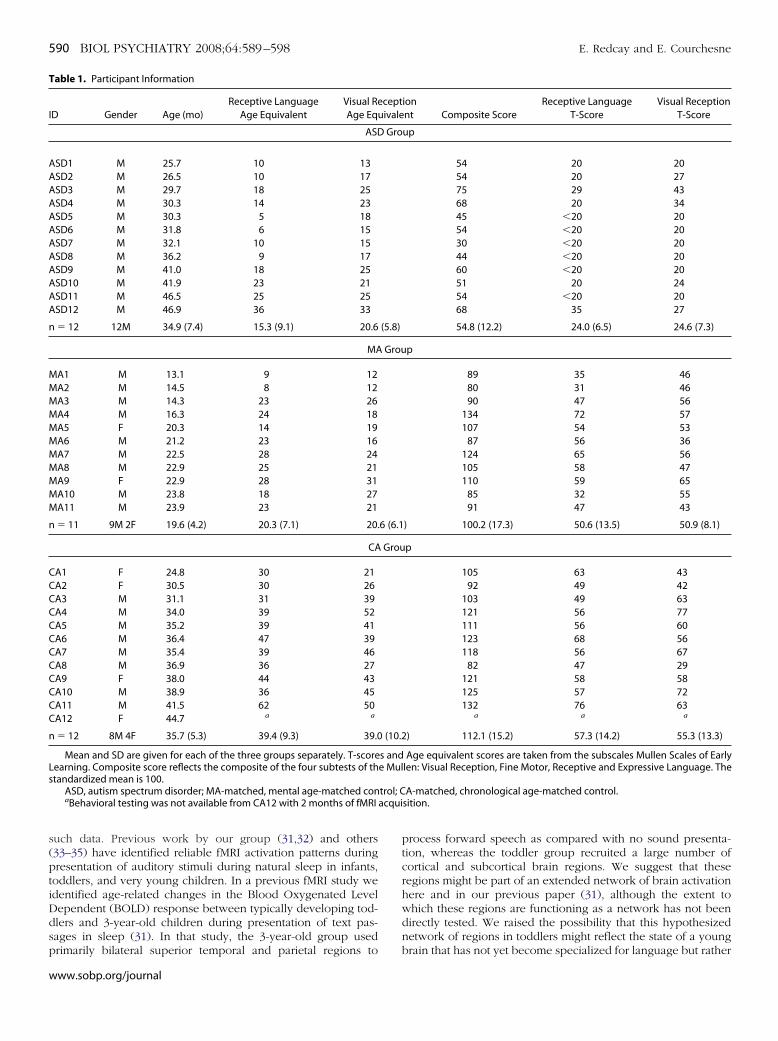
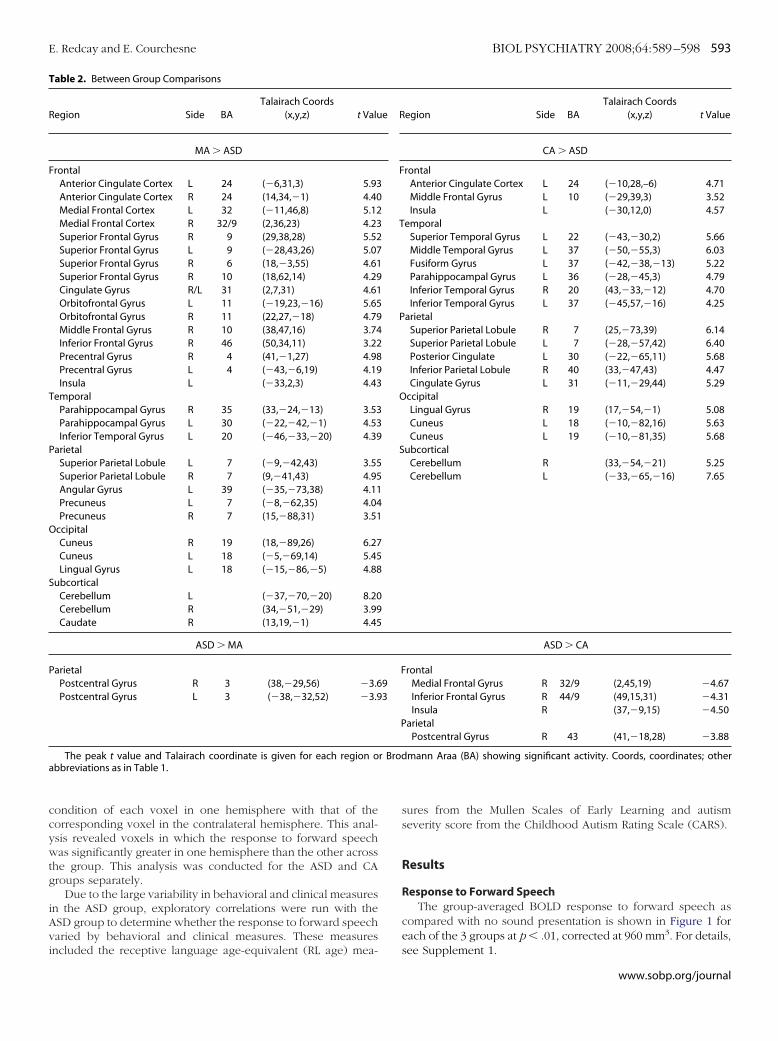
igure 1. Forward speech versus rest. Group activation maps for the forwardpeech as compared with rest conditions are shown for each group. Activa-ion maps are projected onto the surface of a rendered brain from a singleepresentative subject. Data are presented at an intensity of p � .01 andoxel-wise cluster correction of 960 mm3. CA-matched, chronological age-atched; ASD, autism spectrum disorder; MA-matched, mental age-atched; R, right; L, left.
iego (UCSD) autism research program, and flyers. For details on
diagnostic information for the ASD group see text and Table 1 inSupplement 1.
Of the 23 children, 8 were unable to fall or stay asleep in thescanner, even after 3 separate nights of repeated attempts. Thus,functional and structural MRI data were acquired from 15 chil-dren with provisional ASD. Of these 15, 1 child’s data werediscarded due to motion artifacts and 2 children did not meetcriteria for autistic disorder or ASD on the Autism DiagnosticInterview–Revised on follow-up assessments at 3 years of age. Insum, reliable fMRI data were acquired from a total of 12participants with ASD (11 autism disorder, 1 ASD) (Table 1).
Two control groups of typically developing children wererecruited: a chronological age-matched group (CA) and a mentalage-matched group (MA). The chronological age-matched groupwas matched to the autism group on the basis of mean chrono-logical age. The mental age-matched group was younger thanthe ASD group. In this way, the mean mental age, as determinedby the receptive language (RL) age equivalent score from theMullen Scales of Early Learning, was similar in both groups(Table 1). Mental age-matching was done as the best approxi-mation of language level, because the very low language skill ofone-half the autism group (T score � 20) makes the measure ofreceptive language age-equivalent less reliable. For both controlgroups, a portion of the subjects were included in our priorpublication examining speech perception in typical developmentwith the same paradigm and protocol as the current study (31).Data from six additional control participants were included in thepresent study to provide closer matching in chronological ageand mental age for the CA and MA groups, respectively.
All participants received behavioral assessments including theMullen Scales of Early Learning and the Vineland Adaptive BehaviorScales. Additionally, several parent-report questionnaires were ob-tained, including the MacArthur-Bates Communicative Develop-mental Inventory (CDI) and a family medical history questionnaire.The Institutional Review Board of Children’s Hospital and theUniversity of California, San Diego approved this study. Informedwritten consent was obtained from the parents, and they werecompensated monetarily for participation.
Stimuli and DesignParticipants were presented with the same auditory stimuli in
the same design as in our previous study (31). These stimuliconsisted of three stimulus conditions: 1) Forward speech,simple (F:s); 2) Forward speech, complex (F:c); and 3) Backwardspeech (B). For details see text in Supplement 1. Stimuli werepresented in a block design in which each condition waspresented for 20 sec and followed by 20 sec of “rest” (no auditorystimulus presented).
Data AcquisitionImages were acquired on a 1.5 Siemens Symphony scanner at
the UCSD Hillcrest Medical center. Whole brain axial slices werecollected with a gradient recalled echo planar sequence (EPI)(repetition time � 2500 msec; echo time � 35 msec; flip angle �90°; field of view � 25.6 mm; 64 � 64 matrix [4 � 4 mm in-planeresolution], number of slices � 30; slice thickness � 4 mm; 154volumes acquired). A T1-weighted anatomical image in thecoronal plane with an magnetization-prepared rapid gradient-echo sequence was collected before fMRI scanning for co-registration with the functional images (field-of-view � 22.8 mm;matrix � 256 � 256; 128 slices; .89 � .89 mm in-plane resolution;
slice thickness � 1.5 mm).www.sobp.org/journal

D
NwEvausvmcsw
itrcntwwmlsta
FggawMA
592 BIOL PSYCHIATRY 2008;64:589–598 E. Redcay and E. Courchesne
w
ata AnalysesAll analyses were performed with the Analysis of Functional
euroImages (AFNI) software (36). Several pre-processing stepsere performed before individual general linear model analyses.ach dataset was time shifted to account for slice time-offsets inolume acquisitions. Motion correction was performed with anutomated volume alignment program that registered each vol-me to a specified volume in the time series with an iterative timeeries. The middle volume of the run was chosen as the referenceolume unless signal outliers or motion were detected within theiddle volume. Data points not correctable by head motion were
ensored from the analyses (see Supplement 1). Images werepatially smoothed with a smoothing kernel of 6 mm at full-idth-at-half-maximal (FWHM).A general linear model analyses was conducted to fit the
ndividual time series to an ideal hemodynamic response func-ion (� variate). The first two volumes in each data series wereemoved to compensate for T1 equilibration effects. Motionovariates were included in the general linear model to modeloise due to movement in three rotational (x, y, z) and threeranslational (roll, pitch, yaw) planes. The mean and linear trendsere included in the general linear model. A general linear testas included to obtain a main effect of forward speech (F) byodeling the amplitude response to both F:s and F:c. A general
inear test was also included to contrast forward and backwardpeech. For this report, discussion of forward speech will refer tohe collapsed “F” condition rather than the separate F:s and F:c
igure 2. Between-group comparison of forward speech versus rest. Signroup and the two control groups (MA-matched and CA-matched) are shoreater activity than either the CA (A) or MA (B) control groups. Conversely, rctivation than the ASD group. In comparison with the CA-matched grouphereas the CA-matched group recruited greater left frontal, temporal,A-matched group, the ASD group showed reduced activity in a numberbbreviations as in Figure 1.
nalyses. The linear contrast coefficient for each condition was
ww.sobp.org/journal
converted to percent signal change by calculating the percentdifference from the baseline model.
Before group analyses, each individual’s data from the gen-eral linear model analyses were registered into standard Ta-lairach space through a 6-parameter affine transformation basedon landmarks identified from the high-resolution anatomicalimage. Because brain anatomy differs in young children from anadult template, we conducted pilot studies to determine thefidelity of anatomical co-registration for two anatomical land-marks in a group of typical toddlers, 3-year-old children, andadults as well as autistic 2–3-year-old children. See Supplement 1for discussion.
Group analyses were conducted both within group andbetween groups with repeated measures analyses of variance(ANOVAs). For within-subject group analyses, a one-wayANOVA was run for each group separately with condition as therepeated measure. For the between-group analyses, a repeated-measure ANOVA was run with the ANOVA program in the AFNIMatlab package. Contrasts were run within each group (ASD, CA,MA) to contrast percent signal change values between theforward (F) and backward (B) speech conditions. Additionally,contrasts were run to identify differences between the ASD groupand the two control groups (MA and CA) separately for both theforward and backward speech conditions.
To directly test whether hemispheric asymmetries werepresent during processing of forward speech, a whole-brain,voxel-wise, paired t test was performed within each group. The
t differences in activation to forward speech versus rest between the ASDegions in blue depict regions in which the ASD group showed significantlys shown in red are ones in which either the MA or CA group showed greaterASD group recruited medial and right frontal regions to a greater extent,
bilateral posterior regions than the ASD group. In comparison with theain regions. Data are represented on a brain image from a single subject.
ificanwn. Region, theandof br
t test compared percent signal value in the forward speech
ccywtg
iAvi
T
R
F
T
P
O
S
P
r Broda
E. Redcay and E. Courchesne BIOL PSYCHIATRY 2008;64:589–598 593
ondition of each voxel in one hemisphere with that of theorresponding voxel in the contralateral hemisphere. This anal-sis revealed voxels in which the response to forward speechas significantly greater in one hemisphere than the other across
he group. This analysis was conducted for the ASD and CAroups separately.
Due to the large variability in behavioral and clinical measuresn the ASD group, exploratory correlations were run with theSD group to determine whether the response to forward speecharied by behavioral and clinical measures. These measures
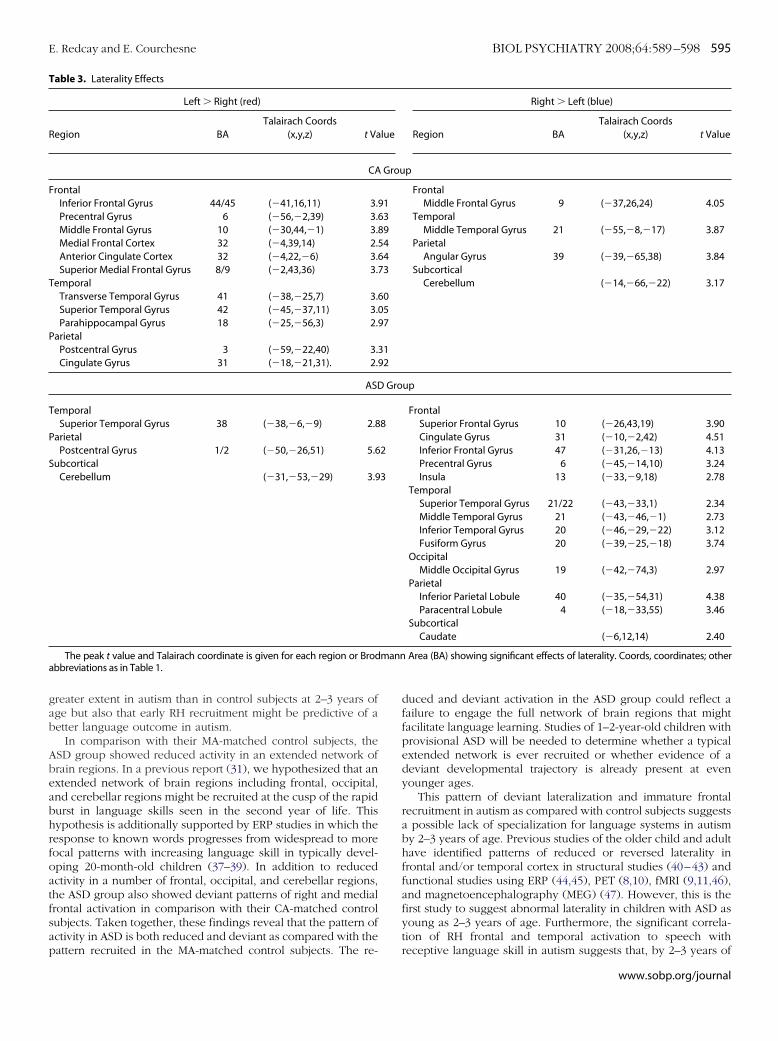
able 2. Between Group Comparisons
egion Side BATalairach Coords
(x,y,z) t Valu
MA � ASD
rontalAnterior Cingulate Cortex L 24 (�6,31,3) 5.93Anterior Cingulate Cortex R 24 (14,34,�1) 4.40Medial Frontal Cortex L 32 (�11,46,8) 5.12Medial Frontal Cortex R 32/9 (2,36,23) 4.23Superior Frontal Gyrus R 9 (29,38,28) 5.52Superior Frontal Gyrus L 9 (�28,43,26) 5.07Superior Frontal Gyrus R 6 (18,�3,55) 4.61Superior Frontal Gyrus R 10 (18,62,14) 4.29Cingulate Gyrus R/L 31 (2,7,31) 4.61Orbitofrontal Gyrus L 11 (�19,23,�16) 5.65Orbitofrontal Gyrus R 11 (22,27,�18) 4.79Middle Frontal Gyrus R 10 (38,47,16) 3.74Inferior Frontal Gyrus R 46 (50,34,11) 3.22Precentral Gyrus R 4 (41,�1,27) 4.98Precentral Gyrus L 4 (�43,�6,19) 4.19Insula L (�33,2,3) 4.43
emporalParahippocampal Gyrus R 35 (33,�24,�13) 3.53Parahippocampal Gyrus L 30 (�22,�42,�1) 4.53Inferior Temporal Gyrus L 20 (�46,�33,�20) 4.39
arietalSuperior Parietal Lobule L 7 (�9,�42,43) 3.55Superior Parietal Lobule R 7 (9,�41,43) 4.95Angular Gyrus L 39 (�35,�73,38) 4.11Precuneus L 7 (�8,�62,35) 4.04Precuneus R 7 (15,�88,31) 3.51
ccipitalCuneus R 19 (18,�89,26) 6.27Cuneus L 18 (�5,�69,14) 5.45Lingual Gyrus L 18 (�15,�86,�5) 4.88
ubcorticalCerebellum L (�37,�70,�20) 8.20Cerebellum R (34,�51,�29) 3.99Caudate R (13,19,�1) 4.45
ASD � MA
arietalPostcentral Gyrus R 3 (38,�29,56) �3.6Postcentral Gyrus L 3 (�38,�32,52) �3.9
The peak t value and Talairach coordinate is given for each region obbreviations as in Table 1.
ncluded the receptive language age-equivalent (RL age) mea-
sures from the Mullen Scales of Early Learning and autismseverity score from the Childhood Autism Rating Scale (CARS).
Results
Response to Forward SpeechThe group-averaged BOLD response to forward speech as
compared with no sound presentation is shown in Figure 1 foreach of the 3 groups at p � .01, corrected at 960 mm3. For details,
egion Side BATalairach Coords
(x,y,z) t Value
CA � ASD
rontalAnterior Cingulate Cortex L 24 (�10,28,–6) 4.71Middle Frontal Gyrus L 10 (�29,39,3) 3.52Insula L (�30,12,0) 4.57
emporalSuperior Temporal Gyrus L 22 (�43,�30,2) 5.66Middle Temporal Gyrus L 37 (�50,�55,3) 6.03Fusiform Gyrus L 37 (�42,�38,�13) 5.22Parahippocampal Gyrus L 36 (�28,�45,3) 4.79Inferior Temporal Gyrus R 20 (43,�33,�12) 4.70Inferior Temporal Gyrus L 37 (�45,57,�16) 4.25
arietalSuperior Parietal Lobule R 7 (25,�73,39) 6.14Superior Parietal Lobule L 7 (�28,�57,42) 6.40Posterior Cingulate L 30 (�22,�65,11) 5.68Inferior Parietal Lobule R 40 (33,�47,43) 4.47Cingulate Gyrus L 31 (�11,�29,44) 5.29
ccipitalLingual Gyrus R 19 (17,�54,�1) 5.08Cuneus L 18 (�10,�82,16) 5.63Cuneus L 19 (�10,�81,35) 5.68
ubcorticalCerebellum R (33,�54,�21) 5.25Cerebellum L (�33,�65,�16) 7.65
ASD � CA
rontalMedial Frontal Gyrus R 32/9 (2,45,19) �4.67Inferior Frontal Gyrus R 44/9 (49,15,31) �4.31Insula R (37,�9,15) �4.50
arietalPostcentral Gyrus R 43 (41,�18,28) �3.88
mann Araa (BA) showing significant activity. Coords, coordinates; other
e R
F
T
P
O
S
F93
P
see Supplement 1.
www.sobp.org/journal
A
gbrcrb
A
rpirwgrf55ec
L
whfstapfw
S
cpTgwtcrr
r
594 BIOL PSYCHIATRY 2008;64:589–598 E. Redcay and E. Courchesne
w
SD Versus MA-Matched Response to Forward SpeechIn direct statistical comparison with the MA group, the ASD
roup showed reduced activity within an extended number ofrain regions, including regions within bilateral frontal, tempo-al, parietal, and occipital lobes, cerebellar cortex, and rightaudate (Figure 2, Table 2). The only regions showing a greateresponse to forward speech in the ASD than the MA group wereilateral postcentral gyri.
SD Versus CA-Matched Response to Forward SpeechIn comparison with the CA-matched group, the ASD group
ecruited a greater number of right hemisphere (RH) frontal andarietal regions [frontal: right medial frontal gyrus, t � 4.67; rightnferior frontal gyrus, t � 4.31; right insula, t � �4.5; parietal:ight postcentral gyrus, t � 3.88]. In direct statistical comparisonith the ASD group, the CA-matched control group recruited areater number of both left hemisphere (LH) frontal and tempo-al regions [frontal: left anterior cingulate, t � 4.71; left middlerontal gyrus, t � 3.52; temporal: left superior temporal gyrus, t �.66; left middle temporal gyrus, t � 6.03; left fusiform gyrus, t �.22]. The CA-matched group additionally recruited greater bilat-ral posterior regions within parietal, extrastriate, and cerebellarortices (Figure 2, Table 2) in comparison with the ASD group.
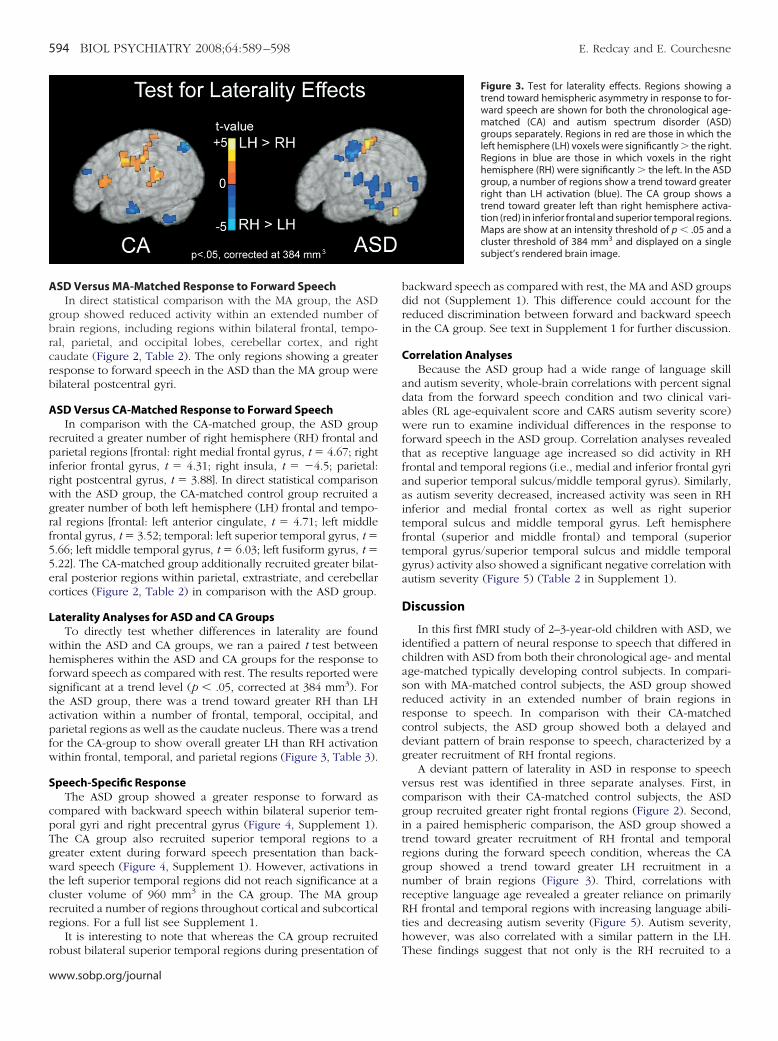
aterality Analyses for ASD and CA GroupsTo directly test whether differences in laterality are found
ithin the ASD and CA groups, we ran a paired t test betweenemispheres within the ASD and CA groups for the response toorward speech as compared with rest. The results reported wereignificant at a trend level (p � .05, corrected at 384 mm3). Forhe ASD group, there was a trend toward greater RH than LHctivation within a number of frontal, temporal, occipital, andarietal regions as well as the caudate nucleus. There was a trendor the CA-group to show overall greater LH than RH activationithin frontal, temporal, and parietal regions (Figure 3, Table 3).
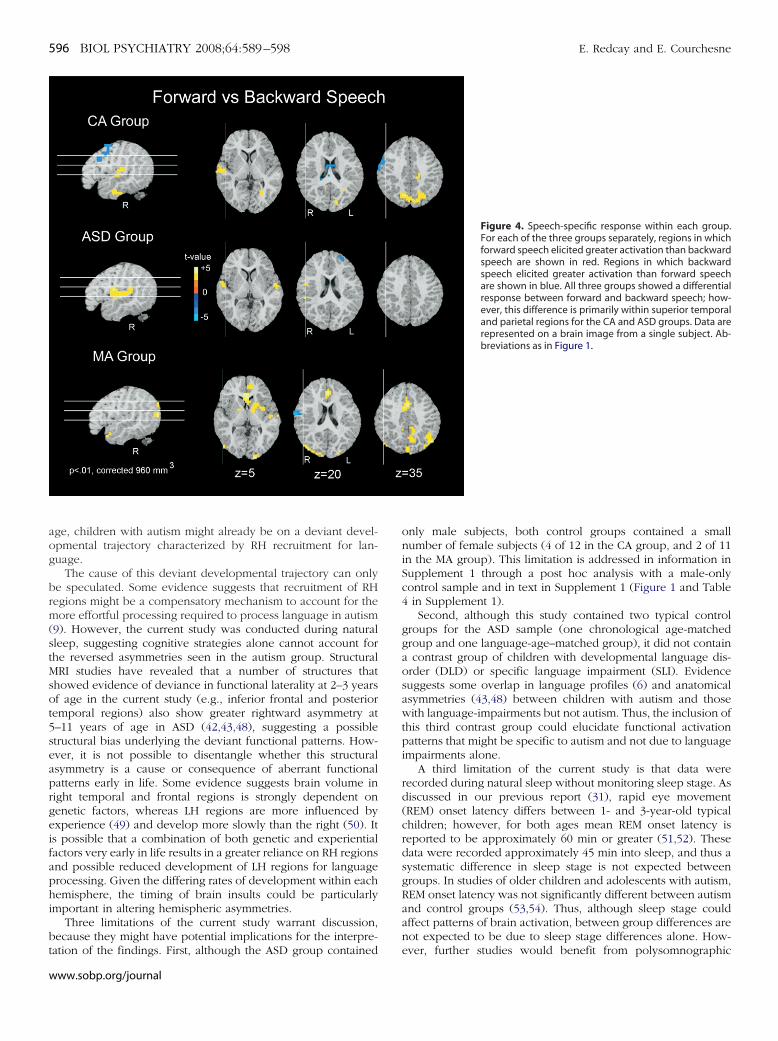
peech-Specific ResponseThe ASD group showed a greater response to forward as
ompared with backward speech within bilateral superior tem-oral gyri and right precentral gyrus (Figure 4, Supplement 1).he CA group also recruited superior temporal regions to areater extent during forward speech presentation than back-ard speech (Figure 4, Supplement 1). However, activations in
he left superior temporal regions did not reach significance at aluster volume of 960 mm3 in the CA group. The MA groupecruited a number of regions throughout cortical and subcorticalegions. For a full list see Supplement 1.
It is interesting to note that whereas the CA group recruited
obust bilateral superior temporal regions during presentation ofww.sobp.org/journal
backward speech as compared with rest, the MA and ASD groupsdid not (Supplement 1). This difference could account for thereduced discrimination between forward and backward speechin the CA group. See text in Supplement 1 for further discussion.
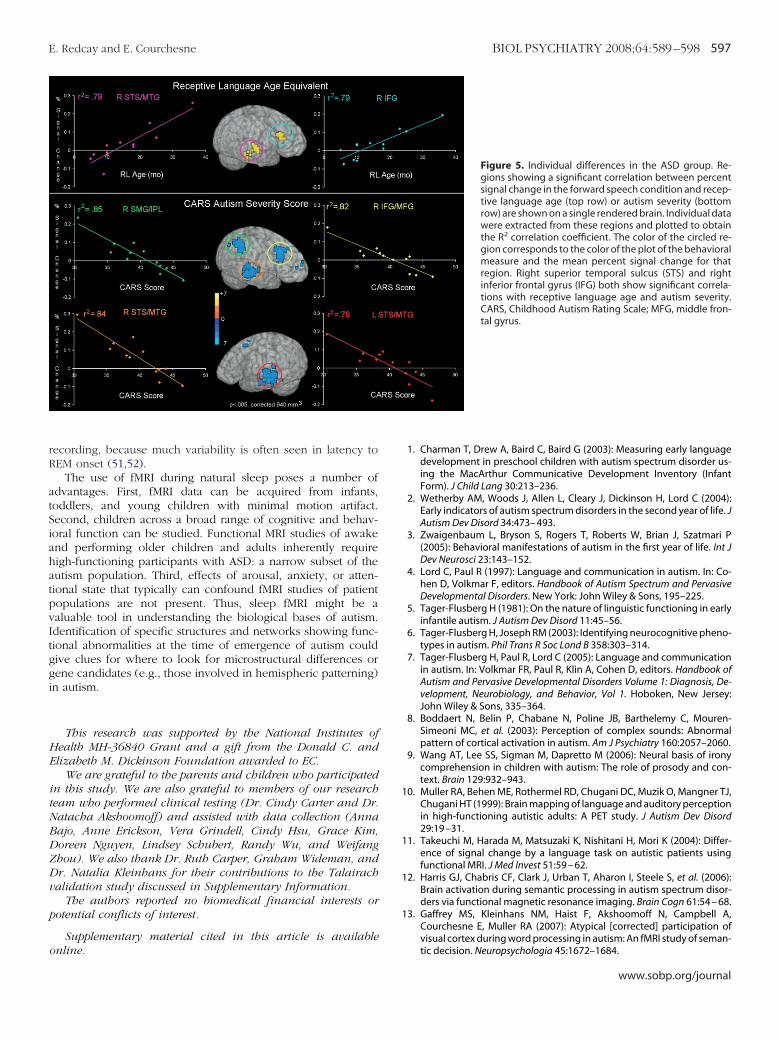
Correlation AnalysesBecause the ASD group had a wide range of language skill
and autism severity, whole-brain correlations with percent signaldata from the forward speech condition and two clinical vari-ables (RL age-equivalent score and CARS autism severity score)were run to examine individual differences in the response toforward speech in the ASD group. Correlation analyses revealedthat as receptive language age increased so did activity in RHfrontal and temporal regions (i.e., medial and inferior frontal gyriand superior temporal sulcus/middle temporal gyrus). Similarly,as autism severity decreased, increased activity was seen in RHinferior and medial frontal cortex as well as right superiortemporal sulcus and middle temporal gyrus. Left hemispherefrontal (superior and middle frontal) and temporal (superiortemporal gyrus/superior temporal sulcus and middle temporalgyrus) activity also showed a significant negative correlation withautism severity (Figure 5) (Table 2 in Supplement 1).
Discussion
In this first fMRI study of 2–3-year-old children with ASD, weidentified a pattern of neural response to speech that differed inchildren with ASD from both their chronological age- and mentalage-matched typically developing control subjects. In compari-son with MA-matched control subjects, the ASD group showedreduced activity in an extended number of brain regions inresponse to speech. In comparison with their CA-matchedcontrol subjects, the ASD group showed both a delayed anddeviant pattern of brain response to speech, characterized by agreater recruitment of RH frontal regions.
A deviant pattern of laterality in ASD in response to speechversus rest was identified in three separate analyses. First, incomparison with their CA-matched control subjects, the ASDgroup recruited greater right frontal regions (Figure 2). Second,in a paired hemispheric comparison, the ASD group showed atrend toward greater recruitment of RH frontal and temporalregions during the forward speech condition, whereas the CAgroup showed a trend toward greater LH recruitment in anumber of brain regions (Figure 3). Third, correlations withreceptive language age revealed a greater reliance on primarilyRH frontal and temporal regions with increasing language abili-ties and decreasing autism severity (Figure 5). Autism severity,however, was also correlated with a similar pattern in the LH.
Figure 3. Test for laterality effects. Regions showing atrend toward hemispheric asymmetry in response to for-ward speech are shown for both the chronological age-matched (CA) and autism spectrum disorder (ASD)groups separately. Regions in red are those in which theleft hemisphere (LH) voxels were significantly � the right.Regions in blue are those in which voxels in the righthemisphere (RH) were significantly � the left. In the ASDgroup, a number of regions show a trend toward greaterright than LH activation (blue). The CA group shows atrend toward greater left than right hemisphere activa-tion (red) in inferior frontal and superior temporal regions.Maps are show at an intensity threshold of p � .05 and acluster threshold of 384 mm3 and displayed on a singlesubject’s rendered brain image.
These findings suggest that not only is the RH recruited to a
gab
Abeabhrfoatfsap
T
R
F
T
P
T
P
S
a
E. Redcay and E. Courchesne BIOL PSYCHIATRY 2008;64:589–598 595
reater extent in autism than in control subjects at 2–3 years ofge but also that early RH recruitment might be predictive of aetter language outcome in autism.
In comparison with their MA-matched control subjects, theSD group showed reduced activity in an extended network ofrain regions. In a previous report (31), we hypothesized that anxtended network of brain regions including frontal, occipital,nd cerebellar regions might be recruited at the cusp of the rapidurst in language skills seen in the second year of life. Thisypothesis is additionally supported by ERP studies in which theesponse to known words progresses from widespread to moreocal patterns with increasing language skill in typically devel-ping 20-month-old children (37–39). In addition to reducedctivity in a number of frontal, occipital, and cerebellar regions,he ASD group also showed deviant patterns of right and medialrontal activation in comparison with their CA-matched controlubjects. Taken together, these findings reveal that the pattern ofctivity in ASD is both reduced and deviant as compared with the
able 3. Laterality Effects
Left � Right (red)
egion BATalairach Coords
(x,y,z) t Va
CA
rontalInferior Frontal Gyrus 44/45 (�41,16,11) 3.Precentral Gyrus 6 (�56,�2,39) 3.Middle Frontal Gyrus 10 (�30,44,�1) 3.Medial Frontal Cortex 32 (�4,39,14) 2.Anterior Cingulate Cortex 32 (�4,22,�6) 3.Superior Medial Frontal Gyrus 8/9 (�2,43,36) 3.
emporalTransverse Temporal Gyrus 41 (�38,�25,7) 3.Superior Temporal Gyrus 42 (�45,�37,11) 3.Parahippocampal Gyrus 18 (�25,�56,3) 2.
arietalPostcentral Gyrus 3 (�59,�22,40) 3.Cingulate Gyrus 31 (�18,�21,31). 2.
ASD
emporalSuperior Temporal Gyrus 38 (�38,�6,�9) 2.8
arietalPostcentral Gyrus 1/2 (�50,�26,51) 5.6
ubcorticalCerebellum (�31,�53,�29) 3.9
The peak t value and Talairach coordinate is given for each region or Brodbbreviations as in Table 1.
attern recruited in the MA-matched control subjects. The re-
duced and deviant activation in the ASD group could reflect afailure to engage the full network of brain regions that mightfacilitate language learning. Studies of 1–2-year-old children withprovisional ASD will be needed to determine whether a typicalextended network is ever recruited or whether evidence of adeviant developmental trajectory is already present at evenyounger ages.
This pattern of deviant lateralization and immature frontalrecruitment in autism as compared with control subjects suggestsa possible lack of specialization for language systems in autismby 2–3 years of age. Previous studies of the older child and adulthave identified patterns of reduced or reversed laterality infrontal and/or temporal cortex in structural studies (40–43) andfunctional studies using ERP (44,45), PET (8,10), fMRI (9,11,46),and magnetoencephalography (MEG) (47). However, this is thefirst study to suggest abnormal laterality in children with ASD asyoung as 2–3 years of age. Furthermore, the significant correla-tion of RH frontal and temporal activation to speech with
Right � Left (blue)
Region BATalairach Coords
(x,y,z) t Value
p
FrontalMiddle Frontal Gyrus 9 (�37,26,24) 4.05
TemporalMiddle Temporal Gyrus 21 (�55,�8,�17) 3.87
ParietalAngular Gyrus 39 (�39,�65,38) 3.84
SubcorticalCerebellum (�14,�66,�22) 3.17
up
FrontalSuperior Frontal Gyrus 10 (�26,43,19) 3.90Cingulate Gyrus 31 (�10,�2,42) 4.51Inferior Frontal Gyrus 47 (�31,26,�13) 4.13Precentral Gyrus 6 (�45,�14,10) 3.24Insula 13 (�33,�9,18) 2.78
TemporalSuperior Temporal Gyrus 21/22 (�43,�33,1) 2.34Middle Temporal Gyrus 21 (�43,�46,�1) 2.73Inferior Temporal Gyrus 20 (�46,�29,�22) 3.12Fusiform Gyrus 20 (�39,�25,�18) 3.74
OccipitalMiddle Occipital Gyrus 19 (�42,�74,3) 2.97
ParietalInferior Parietal Lobule 40 (�35,�54,31) 4.38Paracentral Lobule 4 (�18,�33,55) 3.46
SubcorticalCaudate (�6,12,14) 2.40
Area (BA) showing significant effects of laterality. Coords, coordinates; other
lue
Grou
916389546473
600597
3192
Gro
8
2
3
mann
receptive language skill in autism suggests that, by 2–3 years of
www.sobp.org/journal
aog
brm(stMsot5seaprgeifaphi
bt
596 BIOL PSYCHIATRY 2008;64:589–598 E. Redcay and E. Courchesne
w
ge, children with autism might already be on a deviant devel-pmental trajectory characterized by RH recruitment for lan-uage.
The cause of this deviant developmental trajectory can onlye speculated. Some evidence suggests that recruitment of RHegions might be a compensatory mechanism to account for theore effortful processing required to process language in autism
9). However, the current study was conducted during naturalleep, suggesting cognitive strategies alone cannot account forhe reversed asymmetries seen in the autism group. StructuralRI studies have revealed that a number of structures that
howed evidence of deviance in functional laterality at 2–3 yearsf age in the current study (e.g., inferior frontal and posterioremporal regions) also show greater rightward asymmetry at–11 years of age in ASD (42,43,48), suggesting a possibletructural bias underlying the deviant functional patterns. How-ver, it is not possible to disentangle whether this structuralsymmetry is a cause or consequence of aberrant functionalatterns early in life. Some evidence suggests brain volume inight temporal and frontal regions is strongly dependent onenetic factors, whereas LH regions are more influenced byxperience (49) and develop more slowly than the right (50). Its possible that a combination of both genetic and experientialactors very early in life results in a greater reliance on RH regionsnd possible reduced development of LH regions for languagerocessing. Given the differing rates of development within eachemisphere, the timing of brain insults could be particularlymportant in altering hemispheric asymmetries.
Three limitations of the current study warrant discussion,ecause they might have potential implications for the interpre-
ation of the findings. First, although the ASD group containedww.sobp.org/journal
only male subjects, both control groups contained a smallnumber of female subjects (4 of 12 in the CA group, and 2 of 11in the MA group). This limitation is addressed in information inSupplement 1 through a post hoc analysis with a male-onlycontrol sample and in text in Supplement 1 (Figure 1 and Table4 in Supplement 1).
Second, although this study contained two typical controlgroups for the ASD sample (one chronological age-matchedgroup and one language-age–matched group), it did not containa contrast group of children with developmental language dis-order (DLD) or specific language impairment (SLI). Evidencesuggests some overlap in language profiles (6) and anatomicalasymmetries (43,48) between children with autism and thosewith language-impairments but not autism. Thus, the inclusion ofthis third contrast group could elucidate functional activationpatterns that might be specific to autism and not due to languageimpairments alone.
A third limitation of the current study is that data wererecorded during natural sleep without monitoring sleep stage. Asdiscussed in our previous report (31), rapid eye movement(REM) onset latency differs between 1- and 3-year-old typicalchildren; however, for both ages mean REM onset latency isreported to be approximately 60 min or greater (51,52). Thesedata were recorded approximately 45 min into sleep, and thus asystematic difference in sleep stage is not expected betweengroups. In studies of older children and adolescents with autism,REM onset latency was not significantly different between autismand control groups (53,54). Thus, although sleep stage couldaffect patterns of brain activation, between group differences arenot expected to be due to sleep stage differences alone. How-
Figure 4. Speech-specific response within each group.For each of the three groups separately, regions in whichforward speech elicited greater activation than backwardspeech are shown in red. Regions in which backwardspeech elicited greater activation than forward speechare shown in blue. All three groups showed a differentialresponse between forward and backward speech; how-ever, this difference is primarily within superior temporaland parietal regions for the CA and ASD groups. Data arerepresented on a brain image from a single subject. Ab-breviations as in Figure 1.
ever, further studies would benefit from polysomnographic
rR
atSiahatpvItggi
HE
itNBDZDv
p
o
E. Redcay and E. Courchesne BIOL PSYCHIATRY 2008;64:589–598 597
ecording, because much variability is often seen in latency toEM onset (51,52).
The use of fMRI during natural sleep poses a number ofdvantages. First, fMRI data can be acquired from infants,oddlers, and young children with minimal motion artifact.econd, children across a broad range of cognitive and behav-oral function can be studied. Functional MRI studies of awakend performing older children and adults inherently requireigh-functioning participants with ASD: a narrow subset of theutism population. Third, effects of arousal, anxiety, or atten-ional state that typically can confound fMRI studies of patientopulations are not present. Thus, sleep fMRI might be aaluable tool in understanding the biological bases of autism.dentification of specific structures and networks showing func-ional abnormalities at the time of emergence of autism couldive clues for where to look for microstructural differences orene candidates (e.g., those involved in hemispheric patterning)n autism.
This research was supported by the National Institutes ofealth MH-36840 Grant and a gift from the Donald C. andlizabeth M. Dickinson Foundation awarded to EC.
We are grateful to the parents and children who participatedn this study. We are also grateful to members of our researcheam who performed clinical testing (Dr. Cindy Carter and Dr.atacha Akshoomoff) and assisted with data collection (Annaajo, Anne Erickson, Vera Grindell, Cindy Hsu, Grace Kim,oreen Nguyen, Lindsey Schubert, Randy Wu, and Weifanghou). We also thank Dr. Ruth Carper, Graham Wideman, andr. Natalia Kleinhans for their contributions to the Talairachalidation study discussed in Supplementary Information.
The authors reported no biomedical financial interests orotential conflicts of interest.
Supplementary material cited in this article is available
nline.1. Charman T, Drew A, Baird C, Baird G (2003): Measuring early languagedevelopment in preschool children with autism spectrum disorder us-ing the MacArthur Communicative Development Inventory (InfantForm). J Child Lang 30:213–236.
2. Wetherby AM, Woods J, Allen L, Cleary J, Dickinson H, Lord C (2004):Early indicators of autism spectrum disorders in the second year of life. JAutism Dev Disord 34:473– 493.
3. Zwaigenbaum L, Bryson S, Rogers T, Roberts W, Brian J, Szatmari P(2005): Behavioral manifestations of autism in the first year of life. Int JDev Neurosci 23:143–152.
4. Lord C, Paul R (1997): Language and communication in autism. In: Co-hen D, Volkmar F, editors. Handbook of Autism Spectrum and PervasiveDevelopmental Disorders. New York: John Wiley & Sons, 195–225.
5. Tager-Flusberg H (1981): On the nature of linguistic functioning in earlyinfantile autism. J Autism Dev Disord 11:45–56.
6. Tager-Flusberg H, Joseph RM (2003): Identifying neurocognitive pheno-types in autism. Phil Trans R Soc Lond B 358:303–314.
7. Tager-Flusberg H, Paul R, Lord C (2005): Language and communicationin autism. In: Volkmar FR, Paul R, Klin A, Cohen D, editors. Handbook ofAutism and Pervasive Developmental Disorders Volume 1: Diagnosis, De-velopment, Neurobiology, and Behavior, Vol 1. Hoboken, New Jersey:John Wiley & Sons, 335–364.
8. Boddaert N, Belin P, Chabane N, Poline JB, Barthelemy C, Mouren-Simeoni MC, et al. (2003): Perception of complex sounds: Abnormalpattern of cortical activation in autism. Am J Psychiatry 160:2057–2060.
9. Wang AT, Lee SS, Sigman M, Dapretto M (2006): Neural basis of ironycomprehension in children with autism: The role of prosody and con-text. Brain 129:932–943.
10. Muller RA, Behen ME, Rothermel RD, Chugani DC, Muzik O, Mangner TJ,Chugani HT (1999): Brain mapping of language and auditory perceptionin high-functioning autistic adults: A PET study. J Autism Dev Disord29:19 –31.
11. Takeuchi M, Harada M, Matsuzaki K, Nishitani H, Mori K (2004): Differ-ence of signal change by a language task on autistic patients usingfunctional MRI. J Med Invest 51:59 – 62.
12. Harris GJ, Chabris CF, Clark J, Urban T, Aharon I, Steele S, et al. (2006):Brain activation during semantic processing in autism spectrum disor-ders via functional magnetic resonance imaging. Brain Cogn 61:54 – 68.
13. Gaffrey MS, Kleinhans NM, Haist F, Akshoomoff N, Campbell A,Courchesne E, Muller RA (2007): Atypical [corrected] participation ofvisual cortex during word processing in autism: An fMRI study of seman-
Figure 5. Individual differences in the ASD group. Re-gions showing a significant correlation between percentsignal change in the forward speech condition and recep-tive language age (top row) or autism severity (bottomrow) are shown on a single rendered brain. Individual datawere extracted from these regions and plotted to obtainthe R2 correlation coefficient. The color of the circled re-gion corresponds to the color of the plot of the behavioralmeasure and the mean percent signal change for thatregion. Right superior temporal sulcus (STS) and rightinferior frontal gyrus (IFG) both show significant correla-tions with receptive language age and autism severity.CARS, Childhood Autism Rating Scale; MFG, middle fron-tal gyrus.
tic decision. Neuropsychologia 45:1672–1684.
www.sobp.org/journal

1
1
1
1
1
1
2
2
2
2
2
2
2
2
2
2
3
3
3
3
598 BIOL PSYCHIATRY 2008;64:589–598 E. Redcay and E. Courchesne
w
4. Boddaert N, Chabane N, Belin P, Bourgeois M, Royer V, Barthelemy C, etal. (2004): Perception of complex sounds in autism: Abnormal auditorycortical processing in children. Am J Psychiatry 161:2117–2120.
5. Redcay E, Courchesne E (2005): When is the brain enlarged in autism? Ameta-analysis of all brain size reports. Biol Psychiatry 58:1–9.
6. Courchesne E, Karns C, Davis HR, Ziccardi R, Carper R, Tigue Z, et al.(2001): Unusual brain growth patterns in early life in patients withautistic disorder: An MRI study. Neurology 57:245–254.
7. Courchesne E, Pierce K (2005): Why the frontal cortex in autism might betalking only to itself: Local over-connectivity but long-distance discon-nection. Curr Opin Neurobiol 15:225–230.
8. Aylward EH, Minshew NJ, Field K, Sparks BF, Singh N (2002): Effects ofage on brain volume and head circumference in autism. Neurology59:175–183.
9. Schumann CM, Hamstra J, Goodlin-Jones BL, Lotspeich LJ, Kwon H,Buonocore MH, et al. (2004): The amygdala is enlarged in children butnot adolescents with autism; the hippocampus is enlarged at all ages.J Neurosci 24:6392– 6401.
0. Courchesne E, Carper R, Akshoomoff N (2003): Evidence of brain over-growth in the first year of life in autism. JAMA 290:337–344.
1. Carper RA, Moses P, Tigue ZD, Courchesne E (2002): Cerebral lobes inautism: Early hyperplasia and abnormal age effects. Neuroimage 16:1038 –1051.
2. Sparks BF, Friedman SD, Shaw DW, Aylward E, Echelard D, Artru AA, et al.(2002): Brain structural abnormalities in young children with autismspectrum disorder. Neurology 59:184 –192.
3. Pierce K, Müller R-A, Ambrose J, Allen G, Courchesne E (2001): Faceprocessing occurs outside the fusiform ‘face area’ in autism: Evidencefrom fMRI. Brain 124:2059 –2073.
4. Haznedar MM, Buchsbaum MS, Wei T-C, Hof PR, Cartwright C, BienstockCA, Hollander E (2000): Limbic circuitry in patients with autism spectrumdisorders studied with positron emission tomography and magneticresonance imaging. Am J Psychiatry 157:1994 –2001.
5. Aylward E, Minshew N, Goldstein G, Honeycutt N, Augustine A, Yates K,et al. (1999): MRI volumes of amygdala and hippocampus in non-men-tally retarded autistic adolescents and adults. Neurology 53:2145–2150.
6. Schumann CM, Amaral DG (2006): Stereological analysis of amygdalaneuron number in autism. J Neurosci 26:7674 –7679.
7. Kuhl PK, Coffey-Corina S, Padden D, Dawson G (2005): Links betweensocial and linguistic processing of speech in preschool children withautism: Behavioral and electrophysiological measures. Dev Sci 8:F1–F12.
8. Ceponiene R, Lepisto T, Shestakova A, Vanhala R, Alku P, Naatanen R,Yaguchi K (2003): Speech-sound-selective auditory impairment in chil-dren with autism: They can perceive but do not attend. Proc Natl AcadSci U S A 100:5567–5572.
9. Lepisto T, Kujala T, Vanhala R, Alku P, Huotilainen M, Naatanen R (2005):The discrimination of and orienting to speech and non-speech soundsin children with autism. Brain Res 1066:147–157.
0. Courchesne E, Kilman BA, Galambos R, Lincoln AJ (1984): Autism: Pro-cessing of novel auditory information assessed by event-related brainpotentials. Electroencephalogr Clin Neurophysiol 59:238 –248.
1. Redcay E, Haist F, Courchesne E (2008): Functional neuroimaging ofspeech perception during a pivotal period in language acquisition. DevSci 11:237–252.
2. Redcay E, Kennedy DP, Courchesne E (2007): fMRI during natural sleepas a method to study brain function during early childhood. Neuroimage38:696 –707.
3. Dehaene-Lambertz G, Dehaene S, Hertz-Pannier L (2002): Functional
neuroimaging of speech perception in infants. Science 298:2013–2015.ww.sobp.org/journal
34. Dehaene-Lambertz G, Hertz-Pannier L, Dubois J, Meriaux S, Roche A,Sigman M, Dehaene S (2006): Functional organization of perisylvianactivation during presentation of sentences in preverbal infants. ProcNatl Acad Sci U S A 103:14240 –14245.
35. Anderson AW, Marois R, Colson ER, Peterson BS, Duncan CC, EhrenkranzRA, et al. (2001): Neonatal auditory activation detected by functionalmagnetic resonance imaging. Magn Reson Imaging 19:1–5.
36. Cox RW (1996): AFNI: Software for analysis and visualization of functionalmagnetic resonance neuroimages. Comput Biomed Res 29:162–173.
37. Mills DL, Neville HJ (1997): Electrophysiological studies of language andlanguage impairment. Semin Pediatr Neurol 4:125–134.
38. Conboy BT, Mills DL (2006): Two languages, one developing brain:Event-related potentials to words in bilingual toddlers. Dev Sci 9:F1–12.
39. Mills DL, Plunkett K, Prat C, Schafer G (2005): Watching the infant brainlearn words: Effects of vocabulary size and experience. Cognit Develop-ment 20:19 –31.
40. Rojas DC, Bawn SD, Benkers TL, Reite ML, Rogers SJ (2002): Smaller lefthemisphere planum temporale in adults with autistic disorder. NeurosciLett 328:237–240.
41. Rojas DC, Camou SL, Reite ML, Rogers SJ (2005): Planum temporalevolume in children and adolescents with autism. J Autism Dev Disord35:479 – 486.
42. Herbert MR, Harris GJ, Adrien KT, Ziegler DA, Makris N, Kennedy DN, et al.(2002): Abnormal asymmetry in language association cortex in autism.Ann Neurol 52:588 –596.
43. De Fosse L, Hodge SM, Makris N, Kennedy DN, Caviness VS Jr, McGrath L,et al. (2004): Language-association cortex asymmetry in autism andspecific language impairment. Ann Neurol 56:757–766.
44. Dawson G, Finley C, Phillips S, Galpert L (1986): Hemispheric specializa-tion and the language abilities of autistic children. Child Dev 57:1440 –1453.
45. Dawson G, Finley C, Phillips S, Lewy A (1989): A comparison of hemi-spheric asymmetries in speech-related brain potentials of autistic anddysphasic children. Brain and Lang 37:26 – 41.
46. Kleinhans NM, Muller RA, Cohen DN, Courchesne E (2008): Atypicalfunctional lateralization of language in autism spectrum disorder. BrainResearch 1221:115–125.
47. Gage NM, Siegel B, Roberts TP (2003): Cortical auditory system matura-tional abnormalities in children with autism disorder: An MEG investi-gation. Brain Res Dev Brain Res 144:201–209.
48. Herbert MR, Ziegler DA, Deutsch CK, O’Brien LM, Kennedy DN, FilipekPA, et al. (2005): Brain asymmetries in autism and developmental lan-guage disorder: A nested whole-brain analysis. Brain 128:213–226.
49. Geschwind DH, Miller BL, DeCarli C, Carmelli D (2002): Heritability oflobar brain volumes in twins supports genetic models of cerebral later-ality and handedness. Proc Natl Acad Sci U S A 99:3176 –3181.
50. Chi JG, Dooling EC, Gilles FH (1977): Gyral development of the humanbrain. Ann Neurol 1:86 –93.
51. Montgomery-Downs HE, O’Brien LM, Gulliver TE, Gozal D (2006): Poly-somnographic characteristics in normal preschool and early school-aged children. Pediatrics 117:741–753.
52. Louis J, Cannard C, Bastuji H, Challamel MJ (1997): Sleep ontogenesisrevisited: A longitudinal 24-hour home polygraphic study on 15 normalinfants during the first two years of life. Sleep 20:323–333.
53. Elia M, Ferri R, Musumeci SA, Del Gracco S, Bottitta M, Scuderi C, et al.(2000): Sleep in subjects with autistic disorder: A neurophysiologicaland psychological study. Brain Dev 22:88 –92.
54. Limoges E, Mottron L, Bolduc C, Berthiaume C, Godbout R (2005):
Atypical sleep architecture and the autism phenotype. Brain 128:1049 –1061.