Embed Size (px)
Citation preview
Slowing economic growth and mountingconcerns about corporate earnings andhigh corporate leverage initially caused asharp decline in equity prices and widen-
ing credit spreads in late 2000. The fall in equityprices was especially pronounced among tech-nology stocks, which experienced virtually simul-taneous dramatic declines in all the majoreconomies. Fixed-income markets deterioratedin response to concerns about credit risk. In thehigh-yield market, in particular, flows dried upand spreads peaked at the highest levels sincethe 1990–91 recession. Markets revived in early2001 following significant easing in U.S. mone-tary policy, with a particularly pronounced re-bound in the high-yield market. Nevertheless, onbalance, equity prices were lower and creditspreads generally higher at end-May 2001 than ayear earlier. Despite the sharp repricing in U.S.financial markets, the record U.S. current ac-count deficit, and substantially more monetarypolicy easing in the United States than abroad,the dollar continued to strengthen, as interna-tional investors showed a sustained strong ap-petite for private U.S. assets. Deteriorating mar-ket conditions weighed on bank earnings but,except in Japan, no concerns arose about thestability of any major banking system.
Global Capital Flows and Developmentsin Foreign Exchange Markets
Global Capital Flows
With the globalization of finance, interna-tional capital flows have grown dramatically inthe 1990s. Between 1990 and 1998, assets man-aged by mature market institutional investorsmore than doubled to over $30 trillion, about
equal to world gross domestic product (GDP).Amid widespread capital account liberalizationand increased reliance on securities markets,these investable funds became increasingly re-sponsive to changing opportunities and risks in awidening set of regions and countries. Becauseglobal investment portfolios are large, propor-tionally small portfolio adjustments can be asso-ciated with large and volatile swings in capitalflows. In 1997, for example, gross financing toemerging markets (which peaked in that year)and net foreign purchases of U.S. long-term se-curities were each equivalent to an adjustment ofonly about 1 percent in institutionally managedassets. Nevertheless, these adjustments some-times had a significant impact on financial con-ditions in the recipient countries both when theyflowed in and when they flowed out. This under-scores the powerful impact that portfolio rebal-ancing by global investors can have on the vol-ume, pricing, and direction of internationalcapital flows and on conditions in both domesticand international markets. The period under re-view was no exception.
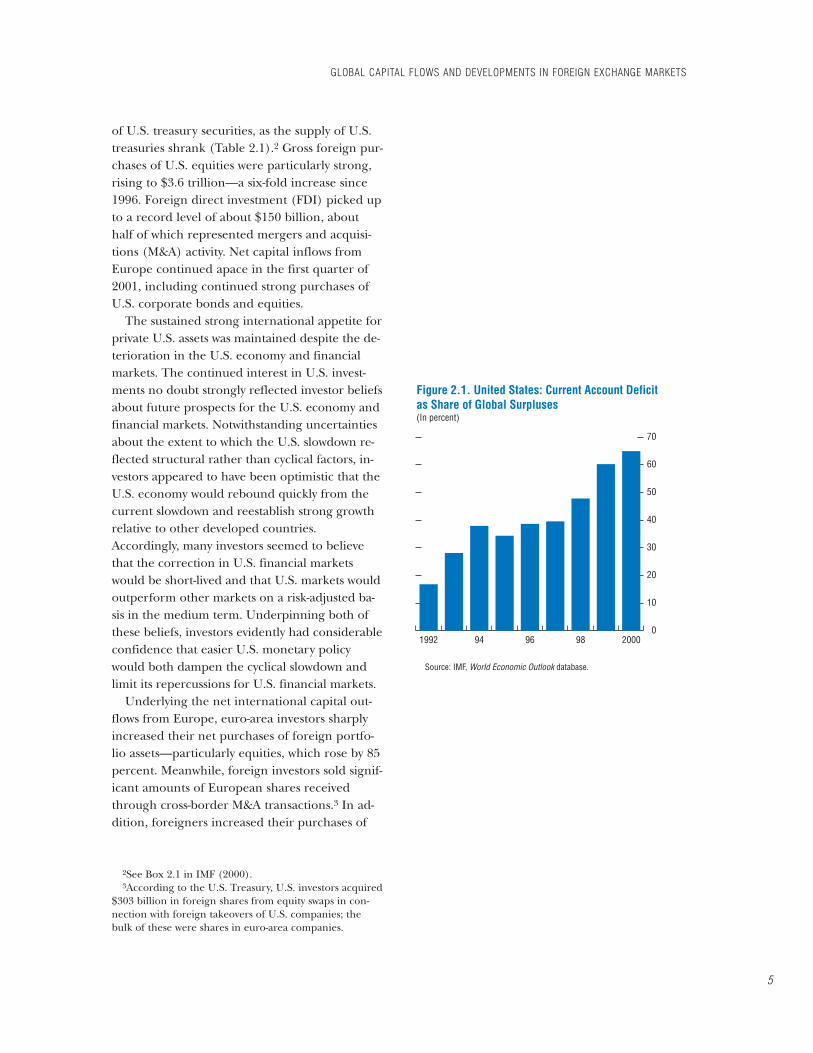
In 2000, the United States continued to ab-sorb the lion’s share of global capital flows, at-tracting 64 percent of world net capital exports(as measured by the U.S. current account deficitrelative to the sum of current accounts of sur-plus countries), compared with 60 percent in1999, and an average of about 35 percent during1992–97 (Figure 2.1). Net inflows to the UnitedStates exceeded $400 billion (Figure 2.2), in-cluding a record level of foreign portfolio invest-ment that nearly could have financed the U.S.current account deficit on its own.1 As in previ-ous years, overseas investors (particularly inEurope) bought large quantities of U.S. equitiesand corporate bonds and cut back net purchases
4
CHAPTER IIDEVELOPMENTS AND TRENDS IN MATURE CAPITAL MARKETS
1Figures for total net capital flows exclude errors and omissions, and therefore differ from current account balances.
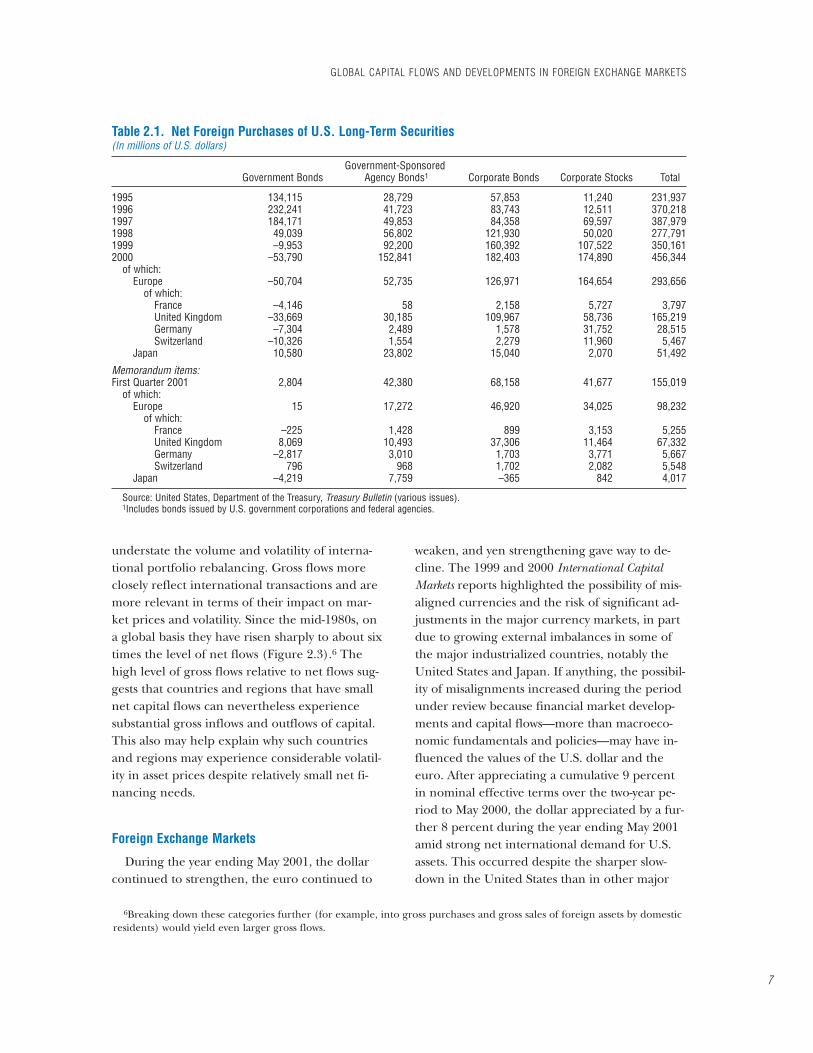
of U.S. treasury securities, as the supply of U.S.treasuries shrank (Table 2.1).2 Gross foreign pur-chases of U.S. equities were particularly strong,rising to $3.6 trillion—a six-fold increase since1996. Foreign direct investment (FDI) picked upto a record level of about $150 billion, abouthalf of which represented mergers and acquisi-tions (M&A) activity. Net capital inflows fromEurope continued apace in the first quarter of2001, including continued strong purchases ofU.S. corporate bonds and equities.
The sustained strong international appetite forprivate U.S. assets was maintained despite the de-terioration in the U.S. economy and financialmarkets. The continued interest in U.S. invest-ments no doubt strongly reflected investor beliefsabout future prospects for the U.S. economy andfinancial markets. Notwithstanding uncertaintiesabout the extent to which the U.S. slowdown re-flected structural rather than cyclical factors, in-vestors appeared to have been optimistic that theU.S. economy would rebound quickly from thecurrent slowdown and reestablish strong growthrelative to other developed countries.Accordingly, many investors seemed to believethat the correction in U.S. financial marketswould be short-lived and that U.S. markets wouldoutperform other markets on a risk-adjusted ba-sis in the medium term. Underpinning both ofthese beliefs, investors evidently had considerableconfidence that easier U.S. monetary policywould both dampen the cyclical slowdown andlimit its repercussions for U.S. financial markets.
Underlying the net international capital out-flows from Europe, euro-area investors sharplyincreased their net purchases of foreign portfo-lio assets—particularly equities, which rose by 85percent. Meanwhile, foreign investors sold signif-icant amounts of European shares receivedthrough cross-border M&A transactions.3 In ad-dition, foreigners increased their purchases of
GLOBAL CAPITAL FLOWS AND DEVELOPMENTS IN FOREIGN EXCHANGE MARKETS
5
0
10
20
30
40
50
60
70
20009896941992
Figure 2.1. United States: Current Account Deficit as Share of Global Surpluses(In percent)
Source: IMF, World Economic Outlook database.
2See Box 2.1 in IMF (2000).3According to the U.S. Treasury, U.S. investors acquired
$303 billion in foreign shares from equity swaps in con-nection with foreign takeovers of U.S. companies; thebulk of these were shares in euro-area companies.
euro-area debt securities as the differential be-tween U.S. and euro-area bond yields narrowed.Both inward and outward FDI rose, as bothEuropean and foreign corporations diversifiedtheir operations internationally.
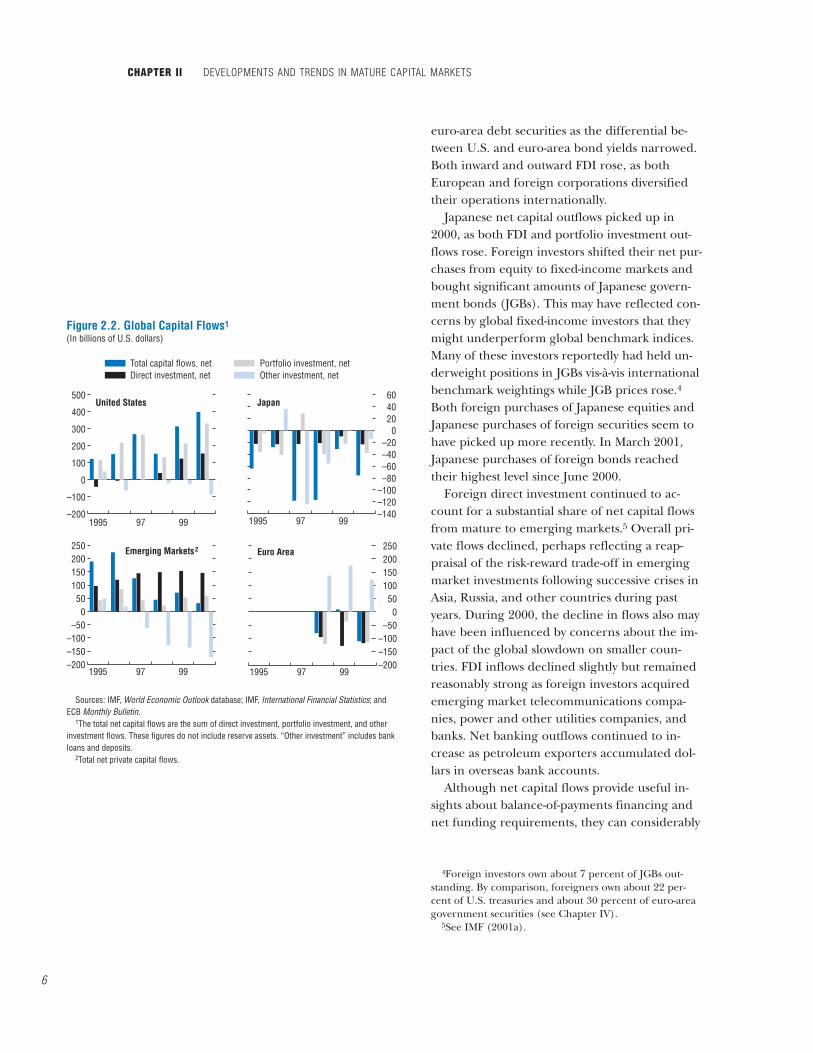
Japanese net capital outflows picked up in2000, as both FDI and portfolio investment out-flows rose. Foreign investors shifted their net pur-chases from equity to fixed-income markets andbought significant amounts of Japanese govern-ment bonds (JGBs). This may have reflected con-cerns by global fixed-income investors that theymight underperform global benchmark indices.Many of these investors reportedly had held un-derweight positions in JGBs vis-à-vis internationalbenchmark weightings while JGB prices rose.4
Both foreign purchases of Japanese equities andJapanese purchases of foreign securities seem tohave picked up more recently. In March 2001,Japanese purchases of foreign bonds reachedtheir highest level since June 2000.
Foreign direct investment continued to ac-count for a substantial share of net capital flowsfrom mature to emerging markets.5 Overall pri-vate flows declined, perhaps reflecting a reap-praisal of the risk-reward trade-off in emergingmarket investments following successive crises inAsia, Russia, and other countries during pastyears. During 2000, the decline in flows also mayhave been influenced by concerns about the im-pact of the global slowdown on smaller coun-tries. FDI inflows declined slightly but remainedreasonably strong as foreign investors acquiredemerging market telecommunications compa-nies, power and other utilities companies, andbanks. Net banking outflows continued to in-crease as petroleum exporters accumulated dol-lars in overseas bank accounts.
Although net capital flows provide useful in-sights about balance-of-payments financing andnet funding requirements, they can considerably
CHAPTER II DEVELOPMENTS AND TRENDS IN MATURE CAPITAL MARKETS
6
–200
–100
0
100
200
300
400
500
99971995–140–120–100–80–60–40–20
0204060
99971995
–200–150–100–50
050
100150200250
99971995–200–150–100–50
050
100150200250
99971995
United States Japan
Euro AreaEmerging Markets2
Total capital flows, netDirect investment, net
Portfolio investment, netOther investment, net
Figure 2.2. Global Capital Flows1
(In billions of U.S. dollars)
Sources: IMF, World Economic Outlook database; IMF, International Financial Statistics; and ECB Monthly Bulletin.
1The total net capital flows are the sum of direct investment, portfolio investment, and other investment flows. These figures do not include reserve assets. “Other investment” includes bank loans and deposits.
2Total net private capital flows.
4Foreign investors own about 7 percent of JGBs out-standing. By comparison, foreigners own about 22 per-cent of U.S. treasuries and about 30 percent of euro-areagovernment securities (see Chapter IV).
5See IMF (2001a).
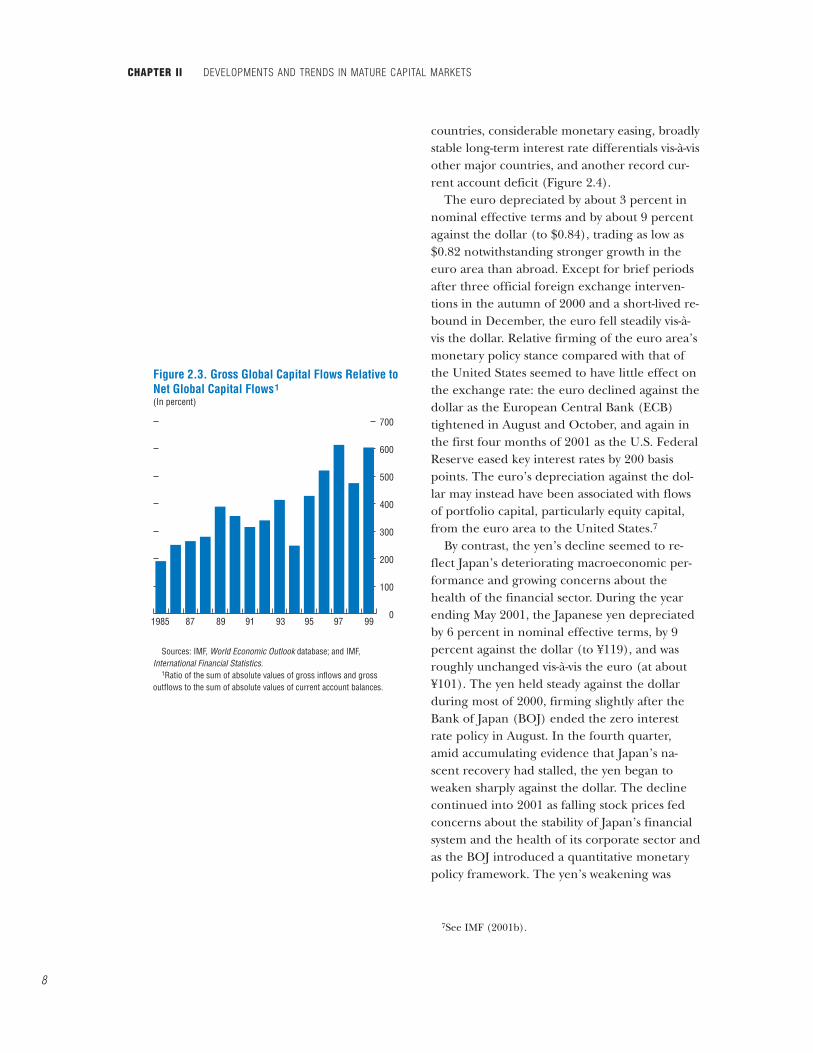
understate the volume and volatility of interna-tional portfolio rebalancing. Gross flows moreclosely reflect international transactions and aremore relevant in terms of their impact on mar-ket prices and volatility. Since the mid-1980s, ona global basis they have risen sharply to about sixtimes the level of net flows (Figure 2.3).6 Thehigh level of gross flows relative to net flows sug-gests that countries and regions that have smallnet capital flows can nevertheless experiencesubstantial gross inflows and outflows of capital.This also may help explain why such countriesand regions may experience considerable volatil-ity in asset prices despite relatively small net fi-nancing needs.
Foreign Exchange Markets
During the year ending May 2001, the dollarcontinued to strengthen, the euro continued to
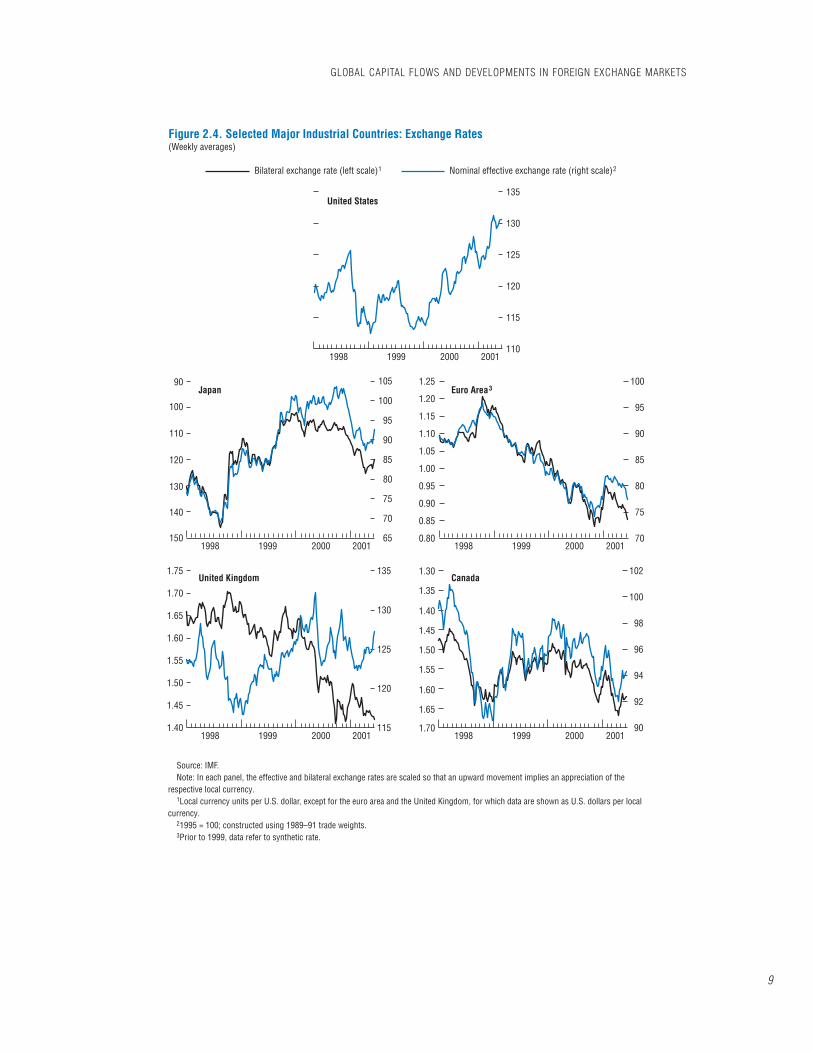
weaken, and yen strengthening gave way to de-cline. The 1999 and 2000 International CapitalMarkets reports highlighted the possibility of mis-aligned currencies and the risk of significant ad-justments in the major currency markets, in partdue to growing external imbalances in some ofthe major industrialized countries, notably theUnited States and Japan. If anything, the possibil-ity of misalignments increased during the periodunder review because financial market develop-ments and capital flows—more than macroeco-nomic fundamentals and policies—may have in-fluenced the values of the U.S. dollar and theeuro. After appreciating a cumulative 9 percentin nominal effective terms over the two-year pe-riod to May 2000, the dollar appreciated by a fur-ther 8 percent during the year ending May 2001amid strong net international demand for U.S.assets. This occurred despite the sharper slow-down in the United States than in other major
GLOBAL CAPITAL FLOWS AND DEVELOPMENTS IN FOREIGN EXCHANGE MARKETS
7
Table 2.1. Net Foreign Purchases of U.S. Long-Term Securities(In millions of U.S. dollars)
Government-SponsoredGovernment Bonds Agency Bonds1 Corporate Bonds Corporate Stocks Total
1995 134,115 28,729 57,853 11,240 231,9371996 232,241 41,723 83,743 12,511 370,2181997 184,171 49,853 84,358 69,597 387,9791998 49,039 56,802 121,930 50,020 277,7911999 –9,953 92,200 160,392 107,522 350,1612000 –53,790 152,841 182,403 174,890 456,344
of which:Europe –50,704 52,735 126,971 164,654 293,656
of which:France –4,146 58 2,158 5,727 3,797United Kingdom –33,669 30,185 109,967 58,736 165,219Germany –7,304 2,489 1,578 31,752 28,515Switzerland –10,326 1,554 2,279 11,960 5,467
Japan 10,580 23,802 15,040 2,070 51,492
Memorandum items:First Quarter 2001 2,804 42,380 68,158 41,677 155,019
of which:Europe 15 17,272 46,920 34,025 98,232
of which:France –225 1,428 899 3,153 5,255United Kingdom 8,069 10,493 37,306 11,464 67,332Germany –2,817 3,010 1,703 3,771 5,667Switzerland 796 968 1,702 2,082 5,548
Japan –4,219 7,759 –365 842 4,017
Source: United States, Department of the Treasury, Treasury Bulletin (various issues).1Includes bonds issued by U.S. government corporations and federal agencies.
6Breaking down these categories further (for example, into gross purchases and gross sales of foreign assets by domesticresidents) would yield even larger gross flows.
countries, considerable monetary easing, broadlystable long-term interest rate differentials vis-à-visother major countries, and another record cur-rent account deficit (Figure 2.4).
The euro depreciated by about 3 percent innominal effective terms and by about 9 percentagainst the dollar (to $0.84), trading as low as$0.82 notwithstanding stronger growth in theeuro area than abroad. Except for brief periodsafter three official foreign exchange interven-tions in the autumn of 2000 and a short-lived re-bound in December, the euro fell steadily vis-à-vis the dollar. Relative firming of the euro area’smonetary policy stance compared with that ofthe United States seemed to have little effect onthe exchange rate: the euro declined against thedollar as the European Central Bank (ECB)tightened in August and October, and again inthe first four months of 2001 as the U.S. FederalReserve eased key interest rates by 200 basispoints. The euro’s depreciation against the dol-lar may instead have been associated with flowsof portfolio capital, particularly equity capital,from the euro area to the United States.7
By contrast, the yen’s decline seemed to re-flect Japan’s deteriorating macroeconomic per-formance and growing concerns about thehealth of the financial sector. During the yearending May 2001, the Japanese yen depreciatedby 6 percent in nominal effective terms, by 9percent against the dollar (to ¥119), and wasroughly unchanged vis-à-vis the euro (at about¥101). The yen held steady against the dollarduring most of 2000, firming slightly after theBank of Japan (BOJ) ended the zero interestrate policy in August. In the fourth quarter,amid accumulating evidence that Japan’s na-scent recovery had stalled, the yen began toweaken sharply against the dollar. The declinecontinued into 2001 as falling stock prices fedconcerns about the stability of Japan’s financialsystem and the health of its corporate sector andas the BOJ introduced a quantitative monetarypolicy framework. The yen’s weakening was
CHAPTER II DEVELOPMENTS AND TRENDS IN MATURE CAPITAL MARKETS
8
0
100
200
300
400
500
600
700
1985 87 89 91 93 95 97 99
Figure 2.3. Gross Global Capital Flows Relative to Net Global Capital Flows1
(In percent)
Sources: IMF, World Economic Outlook database; and IMF, International Financial Statistics.
1Ratio of the sum of absolute values of gross inflows and gross outflows to the sum of absolute values of current account balances.
7See IMF (2001b).
GLOBAL CAPITAL FLOWS AND DEVELOPMENTS IN FOREIGN EXCHANGE MARKETS
9
110
115
120
125
130
135
65
70
75
80
85
90
95
100
105
0.80
1.30
1.35
1.40
1.45
1.50
1.55
1.60
1.65
1.70
0.85
0.90
0.95
1.00
1.05
1.10
1.15
1.20
1.25
70
75
80
85
90
95
100
1.40
1.45
1.50
1.55
1.60
1.65
1.70
1.75
90
100
110
120
130
140
150
115
120
125
130
135
90
92
94
96
98
100
102
1998
Bilateral exchange rate (left scale)1
1999 2000 2001
1998 1999 2000 2001 1998 1999 2000 2001
1998 1999 2000 2001 1998 1999 2000 2001
Nominal effective exchange rate (right scale)2
United States
Japan
United Kingdom
Euro Area3
Canada
Figure 2.4. Selected Major Industrial Countries: Exchange Rates(Weekly averages)
Source: IMF.Note: In each panel, the effective and bilateral exchange rates are scaled so that an upward movement implies an appreciation of the
respective local currency.1Local currency units per U.S. dollar, except for the euro area and the United Kingdom, for which data are shown as U.S. dollars per local
currency.21995 = 100; constructed using 1989–91 trade weights.3Prior to 1999, data refer to synthetic rate.
briefly interrupted by capital reflows in the run-up to the March fiscal year-end.
Equity MarketsLast year’s International Capital Markets report
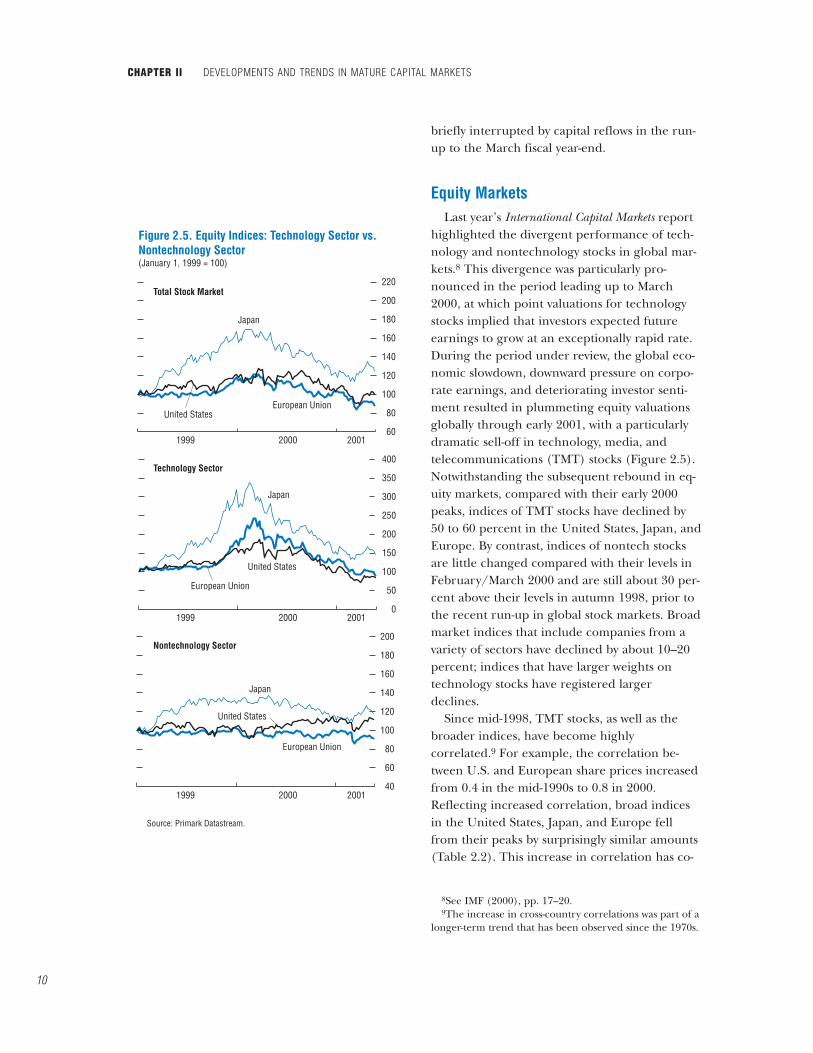
highlighted the divergent performance of tech-nology and nontechnology stocks in global mar-kets.8 This divergence was particularly pro-nounced in the period leading up to March2000, at which point valuations for technologystocks implied that investors expected futureearnings to grow at an exceptionally rapid rate.During the period under review, the global eco-nomic slowdown, downward pressure on corpo-rate earnings, and deteriorating investor senti-ment resulted in plummeting equity valuationsglobally through early 2001, with a particularlydramatic sell-off in technology, media, andtelecommunications (TMT) stocks (Figure 2.5).Notwithstanding the subsequent rebound in eq-uity markets, compared with their early 2000peaks, indices of TMT stocks have declined by50 to 60 percent in the United States, Japan, andEurope. By contrast, indices of nontech stocksare little changed compared with their levels inFebruary/March 2000 and are still about 30 per-cent above their levels in autumn 1998, prior tothe recent run-up in global stock markets. Broadmarket indices that include companies from avariety of sectors have declined by about 10–20percent; indices that have larger weights ontechnology stocks have registered largerdeclines.
Since mid-1998, TMT stocks, as well as thebroader indices, have become highlycorrelated.9 For example, the correlation be-tween U.S. and European share prices increasedfrom 0.4 in the mid-1990s to 0.8 in 2000.Reflecting increased correlation, broad indicesin the United States, Japan, and Europe fellfrom their peaks by surprisingly similar amounts(Table 2.2). This increase in correlation has co-
CHAPTER II DEVELOPMENTS AND TRENDS IN MATURE CAPITAL MARKETS
10
60
80
100
120
140
160
180
200
220
50
0
100
150
200
250
300
350
400
40
60
80
100
120
140
160
180
200
1999 2000 2001
1999 2000 2001
1999 2000 2001
Figure 2.5. Equity Indices: Technology Sector vs. Nontechnology Sector(January 1, 1999 = 100)
Source: Primark Datastream.
Japan
Japan
Japan
European Union
European Union
European Union
United States
United States
United States
Total Stock Market
Technology Sector
Nontechnology Sector
8See IMF (2000), pp. 17–20.9The increase in cross-country correlations was part of a
longer-term trend that has been observed since the 1970s.
incided with a number of important structuraltrends. First, financial and economic globaliza-tion and the worldwide information technologyboom appear to have increased the importanceof global industry factors in determining equityprices.10 For instance, with the introduction ofthe euro and the elimination of foreign ex-change risk in the euro area, international eq-uity portfolios are increasingly managed from asectoral rather than geographic perspective. Inaddition, an increasing number of companiesare listed on more than one national exchange,and the exchanges themselves increasingly haveoverlapping trading hours. Second, portfoliomanagers tend to rely on similar portfolio- andrisk-management rules and models. When equityvolatility rises, as it has from time to time in thelast year, a variety of such models and rules maysignal portfolio managers to reduce overall eq-uity exposure by selling shares in many nationalmarkets simultaneously.11
Broad price movements in the major equitymarkets reflected this increased correlation, as
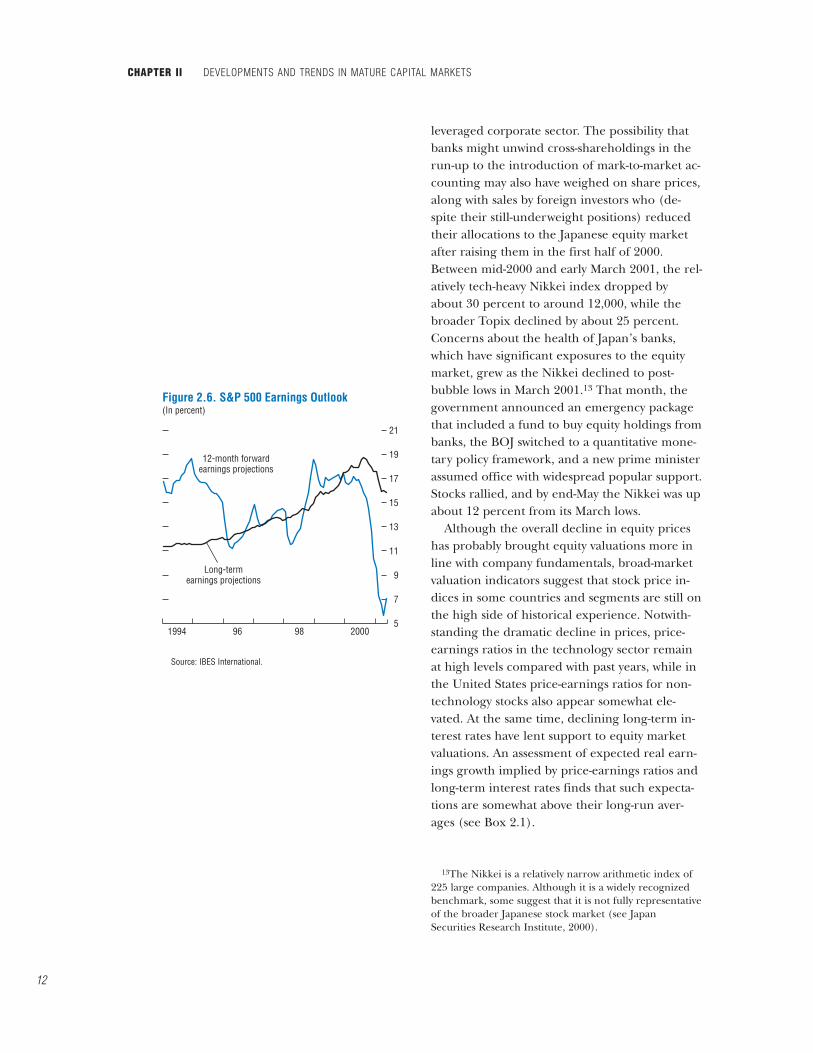
the major equity markets generally peaked to-gether in the second and third quarters of 2000.U.S. equity prices stabilized after the spring sell-off in technology stocks, and broad market in-dices recovered some losses as interest rates de-clined and earnings growth strengthened. Stockprices resumed their decline in September, ledby the technology sector, amid profit warnings,ratings downgrades, and reduced short-termearnings forecasts (although long-run earningsforecasts remained at high levels—see Figure2.6). In January 2001, U.S. equity prices recov-ered following monetary easing by the FederalReserve, but the rally was cut short by corporateearnings disappointments in February andMarch. Tech stocks declined, then broader in-dices followed amid growing concerns about theU.S. economic outlook. Equity prices reboundedagain in April after an inter-meeting cut in inter-est rates, but failed to recover the losses sus-tained since mid-2000. At end-May 2001, theS&P500 and Nasdaq indices stood about 12 per-cent and 40 percent, respectively, below the lev-els they had attained a year earlier.
By May 2001, broad indices of European shareprices had declined by 15 percent from theirSeptember 2000 peaks.12 This drop occurredroughly in line with the U.S. markets, notwith-standing the relatively favorable economic out-look in Europe compared with the UnitedStates. Linkages of major European corporationsto the U.S. economy may explain some of thisco-movement: many large European companiesare heavily exposed to U.S. demand conditions,particularly through their U.S.-based affiliates.
Japanese equity prices also fell substantially inresponse to deteriorating macroeconomic funda-mentals, growing concern about the weak finan-cial and corporate sectors, and technical factors.Starting in the second half of 2000, the outlookfor corporate profits dimmed as the recoverystalled, adding to concerns about the highly
GLOBAL CAPITAL FLOWS AND DEVELOPMENTS IN FOREIGN EXCHANGE MARKETS
11
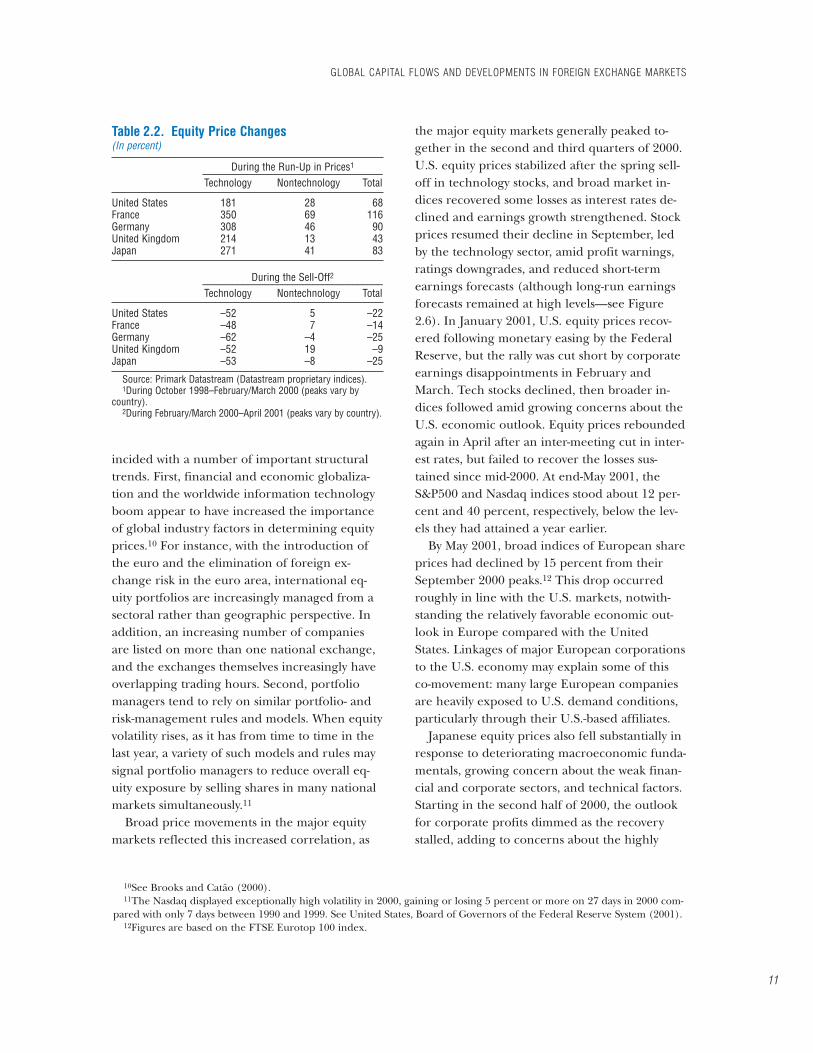
Table 2.2. Equity Price Changes(In percent)
During the Run-Up in Prices1____________________________________Technology Nontechnology Total
United States 181 28 68France 350 69 116Germany 308 46 90United Kingdom 214 13 43Japan 271 41 83
During the Sell-Off2____________________________________Technology Nontechnology Total
United States –52 5 –22France –48 7 –14Germany –62 –4 –25United Kingdom –52 19 –9Japan –53 –8 –25
Source: Primark Datastream (Datastream proprietary indices).1During October 1998–February/March 2000 (peaks vary by
country).2During February/March 2000–April 2001 (peaks vary by country).
10See Brooks and Catão (2000).11The Nasdaq displayed exceptionally high volatility in 2000, gaining or losing 5 percent or more on 27 days in 2000 com-
pared with only 7 days between 1990 and 1999. See United States, Board of Governors of the Federal Reserve System (2001).12Figures are based on the FTSE Eurotop 100 index.
leveraged corporate sector. The possibility thatbanks might unwind cross-shareholdings in therun-up to the introduction of mark-to-market ac-counting may also have weighed on share prices,along with sales by foreign investors who (de-spite their still-underweight positions) reducedtheir allocations to the Japanese equity marketafter raising them in the first half of 2000.Between mid-2000 and early March 2001, the rel-atively tech-heavy Nikkei index dropped byabout 30 percent to around 12,000, while thebroader Topix declined by about 25 percent.Concerns about the health of Japan’s banks,which have significant exposures to the equitymarket, grew as the Nikkei declined to post-bubble lows in March 2001.13 That month, thegovernment announced an emergency packagethat included a fund to buy equity holdings frombanks, the BOJ switched to a quantitative mone-tary policy framework, and a new prime ministerassumed office with widespread popular support.Stocks rallied, and by end-May the Nikkei was upabout 12 percent from its March lows.
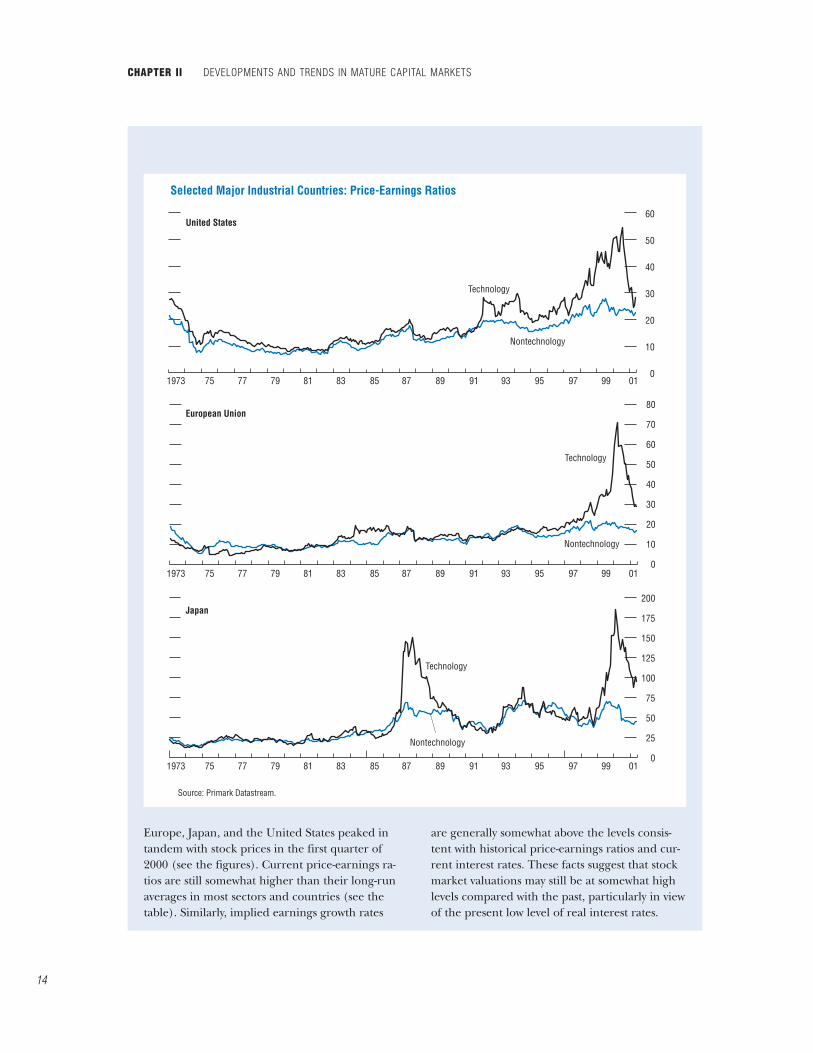
Although the overall decline in equity priceshas probably brought equity valuations more inline with company fundamentals, broad-marketvaluation indicators suggest that stock price in-dices in some countries and segments are still onthe high side of historical experience. Notwith-standing the dramatic decline in prices, price-earnings ratios in the technology sector remainat high levels compared with past years, while inthe United States price-earnings ratios for non-technology stocks also appear somewhat ele-vated. At the same time, declining long-term in-terest rates have lent support to equity marketvaluations. An assessment of expected real earn-ings growth implied by price-earnings ratios andlong-term interest rates finds that such expecta-tions are somewhat above their long-run aver-ages (see Box 2.1).
CHAPTER II DEVELOPMENTS AND TRENDS IN MATURE CAPITAL MARKETS
12
5
7
9
11
13
15
17
19
21
12-month forwardearnings projections
1994 96 98 2000
Long-termearnings projections
Figure 2.6. S&P 500 Earnings Outlook(In percent)
Source: IBES International.
13The Nikkei is a relatively narrow arithmetic index of225 large companies. Although it is a widely recognizedbenchmark, some suggest that it is not fully representativeof the broader Japanese stock market (see JapanSecurities Research Institute, 2000).
GLOBAL CAPITAL FLOWS AND DEVELOPMENTS IN FOREIGN EXCHANGE MARKETS
13
This box examines the expected real earningsgrowth rates that are implied by the current lev-els of price-earnings ratios and long-term realinterest rates in the United States, the EuropeanUnion, and Japan, with a view to assessingwhether stock prices currently reflect realisticexpectations about earnings prospects.
Under the assumption that the dividend pay-out ratio is constant and equal to one, the cur-rent equity price, Pt, can be expressed as the dis-counted present value of future earningsexpected at time t, Ee
t+i (i ≥ 1),1
Eet+iPt = ∑∞
i=1 –––––––– , (1)(1 + ρt )i
where ρt denotes the expected real cost of equitycapital. If future earnings are expected to growat a constant real rate ge
t , equation (1) becomes
Pt 1 + get––– = –––––– . (2)
Et ρt – get
Based on equation (2), the implied real earningsgrowth rate, ge
t , can be estimated by setting thecost of capital equal to the sum of the real 10-year government bond yield, rt, and the equitypremium, e, assumed to equal 6 percent.2
The implied rate of earnings growth in thetechnology and nontechnology sectors in
Box 2.1. Price-Earnings Ratios and Implied Real Earnings Growth in Major Stock Markets
3
4
5
6
7
8
9
1
2
3
4
5
6
7
8
1998 99 2000 01
1998 99 2000 01
Implied Real Earnings Growth(In percent)
Europe
Japan
United States
United States
Japan
Europe
Technology Sector
Nontechnology Sector
Sources: Primark Datastream; and IMF staff calculations.
NontechnologyTechnology Sector Sector________________ ________________
Implied ImpliedPrice- Real Price- Real
Earnings Earnings Earnings EarningsRatio Growth Ratio Growth
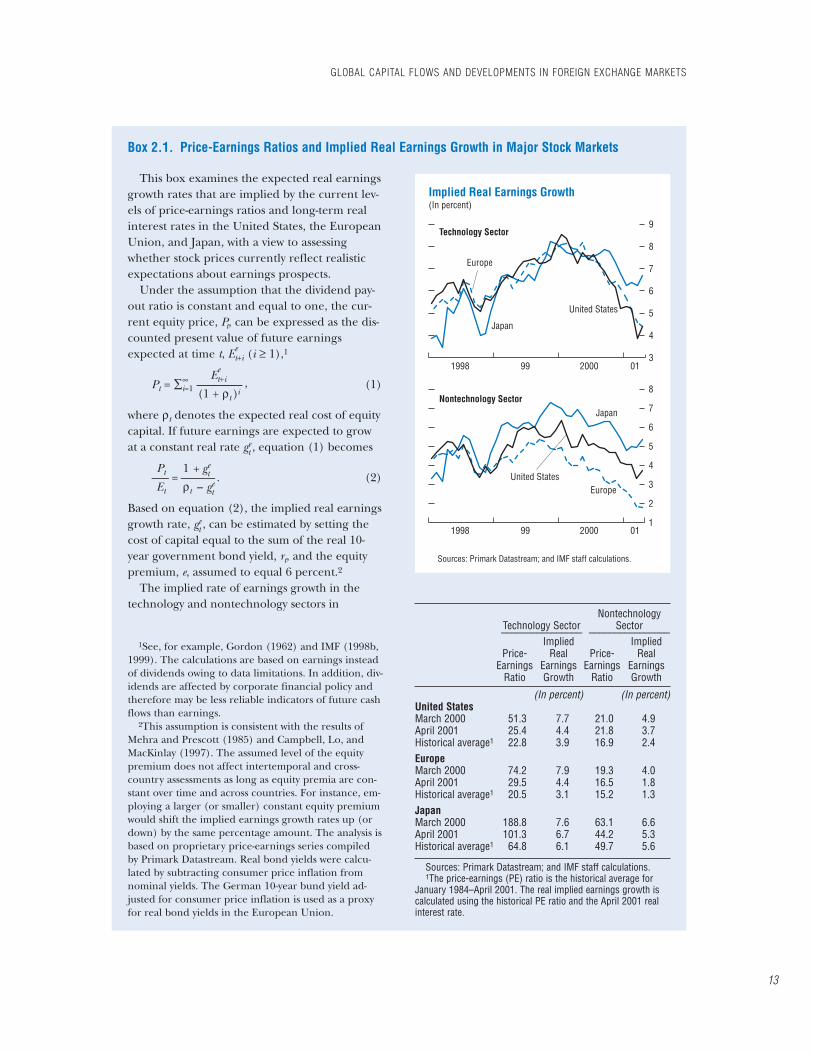
(In percent) (In percent)United StatesMarch 2000 51.3 7.7 21.0 4.9April 2001 25.4 4.4 21.8 3.7Historical average1 22.8 3.9 16.9 2.4EuropeMarch 2000 74.2 7.9 19.3 4.0April 2001 29.5 4.4 16.5 1.8Historical average1 20.5 3.1 15.2 1.3JapanMarch 2000 188.8 7.6 63.1 6.6April 2001 101.3 6.7 44.2 5.3Historical average1 64.8 6.1 49.7 5.6
Sources: Primark Datastream; and IMF staff calculations.1The price-earnings (PE) ratio is the historical average for
January 1984–April 2001. The real implied earnings growth iscalculated using the historical PE ratio and the April 2001 realinterest rate.
1See, for example, Gordon (1962) and IMF (1998b,1999). The calculations are based on earnings insteadof dividends owing to data limitations. In addition, div-idends are affected by corporate financial policy andtherefore may be less reliable indicators of future cashflows than earnings.
2This assumption is consistent with the results ofMehra and Prescott (1985) and Campbell, Lo, andMacKinlay (1997). The assumed level of the equitypremium does not affect intertemporal and cross-country assessments as long as equity premia are con-stant over time and across countries. For instance, em-ploying a larger (or smaller) constant equity premiumwould shift the implied earnings growth rates up (ordown) by the same percentage amount. The analysis isbased on proprietary price-earnings series compiledby Primark Datastream. Real bond yields were calcu-lated by subtracting consumer price inflation fromnominal yields. The German 10-year bund yield ad-justed for consumer price inflation is used as a proxyfor real bond yields in the European Union.
CHAPTER II DEVELOPMENTS AND TRENDS IN MATURE CAPITAL MARKETS
14
Europe, Japan, and the United States peaked intandem with stock prices in the first quarter of2000 (see the figures). Current price-earnings ra-tios are still somewhat higher than their long-runaverages in most sectors and countries (see thetable). Similarly, implied earnings growth rates
are generally somewhat above the levels consis-tent with historical price-earnings ratios and cur-rent interest rates. These facts suggest that stockmarket valuations may still be at somewhat highlevels compared with the past, particularly in viewof the present low level of real interest rates.
0
10
20
30
40
50
60
0
10
20
30
40
50
60
70
80
0
25
50
75
100
125
150
175
200
Technology
Technology
Technology
United States
European Union
Japan
Nontechnology
Nontechnology
Nontechnology
1973 75 77 79 81 83 85 87 89 91 93 95 97 99 01
1973 75 77 79 81 83 85 87 89 91 93 95 97 99 01
1973 75 77 79 81 83 85 87 89 91 93 95 97 99 01
Source: Primark Datastream.
Selected Major Industrial Countries: Price-Earnings Ratios
National and International Credit Markets
Credit Markets in the United States, Europe and Japan
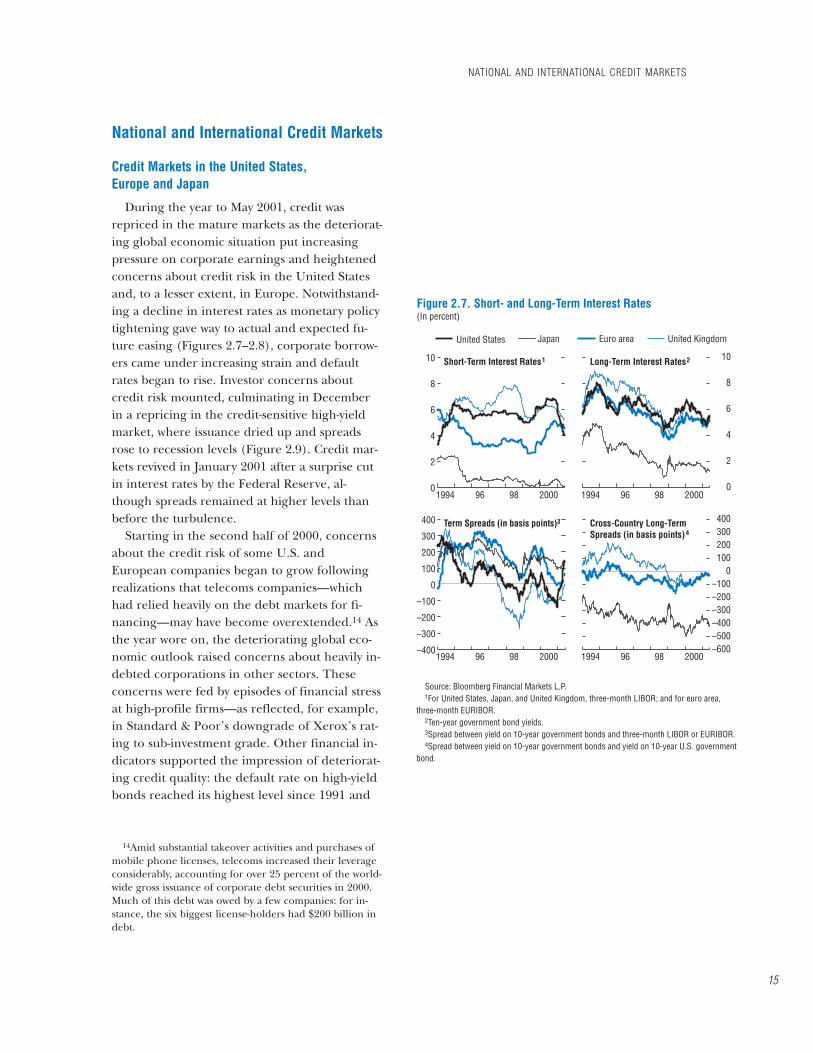
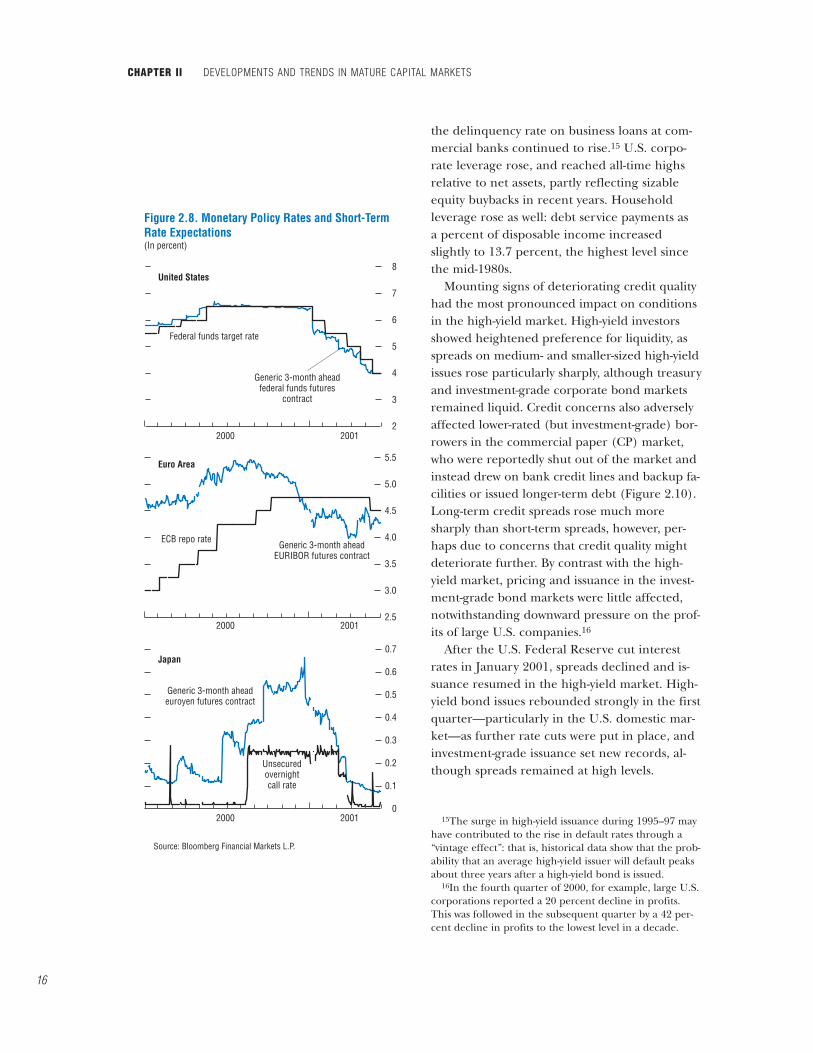
During the year to May 2001, credit wasrepriced in the mature markets as the deteriorat-ing global economic situation put increasingpressure on corporate earnings and heightenedconcerns about credit risk in the United Statesand, to a lesser extent, in Europe. Notwithstand-ing a decline in interest rates as monetary policytightening gave way to actual and expected fu-ture easing (Figures 2.7–2.8), corporate borrow-ers came under increasing strain and defaultrates began to rise. Investor concerns aboutcredit risk mounted, culminating in Decemberin a repricing in the credit-sensitive high-yieldmarket, where issuance dried up and spreadsrose to recession levels (Figure 2.9). Credit mar-kets revived in January 2001 after a surprise cutin interest rates by the Federal Reserve, al-though spreads remained at higher levels thanbefore the turbulence.
Starting in the second half of 2000, concernsabout the credit risk of some U.S. andEuropean companies began to grow followingrealizations that telecoms companies—whichhad relied heavily on the debt markets for fi-nancing—may have become overextended.14 Asthe year wore on, the deteriorating global eco-nomic outlook raised concerns about heavily in-debted corporations in other sectors. Theseconcerns were fed by episodes of financial stressat high-profile firms—as reflected, for example,in Standard & Poor’s downgrade of Xerox’s rat-ing to sub-investment grade. Other financial in-dicators supported the impression of deteriorat-ing credit quality: the default rate on high-yieldbonds reached its highest level since 1991 and
NATIONAL AND INTERNATIONAL CREDIT MARKETS
15
0
2
4
6
8
10
0
2
4
6
8
10
–400
–300
–200
–100
0
100
200
300
400
–600–500–400–300–200–100
0100200300400
1994 96 98 2000
1994 96 98 2000
1994 96 98 2000
1994 96 98 2000
Short-Term Interest Rates1
Term Spreads (in basis points)3
Long-Term Interest Rates2
Cross-Country Long-Term Spreads (in basis points)4
United KingdomUnited States Euro areaJapan
Figure 2.7. Short- and Long-Term Interest Rates(In percent)
Source: Bloomberg Financial Markets L.P.1For United States, Japan, and United Kingdom, three-month LIBOR; and for euro area,
three-month EURIBOR.2Ten-year government bond yields.3Spread between yield on 10-year government bonds and three-month LIBOR or EURIBOR.4Spread between yield on 10-year government bonds and yield on 10-year U.S. government
bond.
14Amid substantial takeover activities and purchases ofmobile phone licenses, telecoms increased their leverageconsiderably, accounting for over 25 percent of the world-wide gross issuance of corporate debt securities in 2000.Much of this debt was owed by a few companies: for in-stance, the six biggest license-holders had $200 billion indebt.
the delinquency rate on business loans at com-mercial banks continued to rise.15 U.S. corpo-rate leverage rose, and reached all-time highsrelative to net assets, partly reflecting sizableequity buybacks in recent years. Householdleverage rose as well: debt service payments asa percent of disposable income increasedslightly to 13.7 percent, the highest level sincethe mid-1980s.
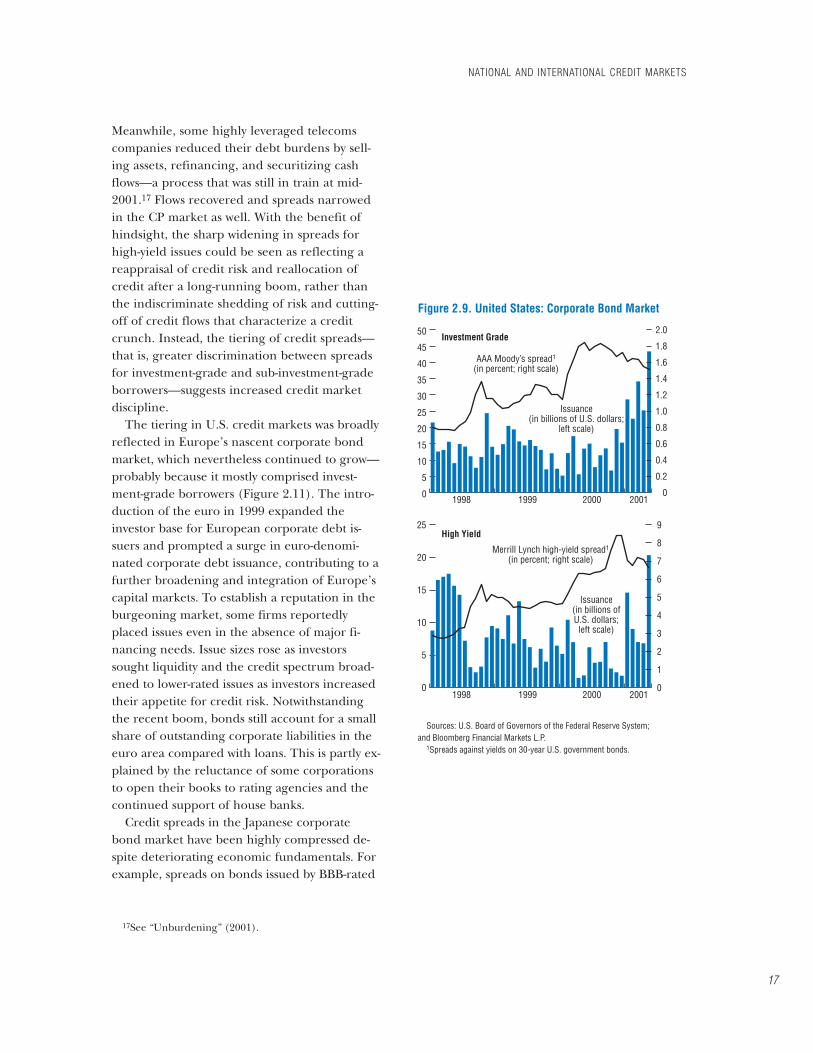
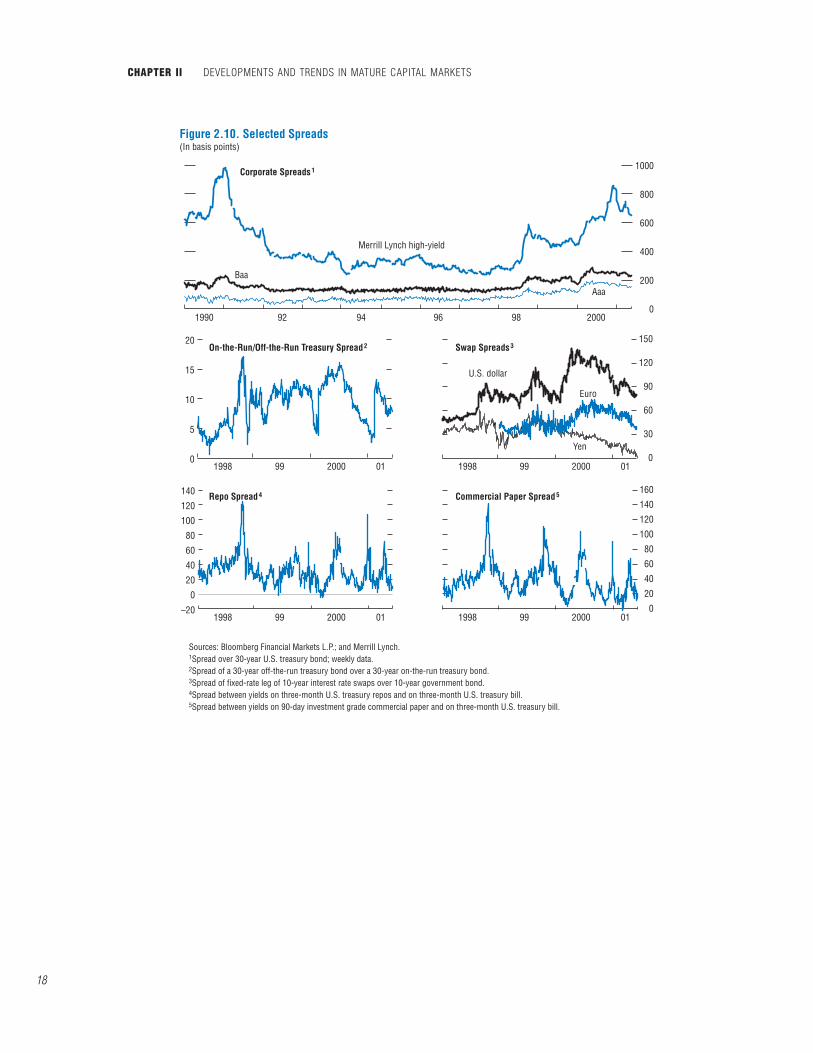
Mounting signs of deteriorating credit qualityhad the most pronounced impact on conditionsin the high-yield market. High-yield investorsshowed heightened preference for liquidity, asspreads on medium- and smaller-sized high-yieldissues rose particularly sharply, although treasuryand investment-grade corporate bond marketsremained liquid. Credit concerns also adverselyaffected lower-rated (but investment-grade) bor-rowers in the commercial paper (CP) market,who were reportedly shut out of the market andinstead drew on bank credit lines and backup fa-cilities or issued longer-term debt (Figure 2.10).Long-term credit spreads rose much moresharply than short-term spreads, however, per-haps due to concerns that credit quality mightdeteriorate further. By contrast with the high-yield market, pricing and issuance in the invest-ment-grade bond markets were little affected,notwithstanding downward pressure on the prof-its of large U.S. companies.16
After the U.S. Federal Reserve cut interestrates in January 2001, spreads declined and is-suance resumed in the high-yield market. High-yield bond issues rebounded strongly in the firstquarter—particularly in the U.S. domestic mar-ket—as further rate cuts were put in place, andinvestment-grade issuance set new records, al-though spreads remained at high levels.
CHAPTER II DEVELOPMENTS AND TRENDS IN MATURE CAPITAL MARKETS
16
2
3
4
5
6
7
8
2.5
3.0
3.5
4.0
4.5
5.0
5.5
0
0.1
0.2
0.3
0.4
0.5
0.6
0.7
2000 2001
2000 2001
2000 2001
Figure 2.8. Monetary Policy Rates and Short-Term Rate Expectations(In percent)
Source: Bloomberg Financial Markets L.P.
United States
Euro Area
Japan
Federal funds target rate
ECB repo rate
Unsecuredovernightcall rate
Generic 3-month aheadfederal funds futures
contract
Generic 3-month aheadEURIBOR futures contract
Generic 3-month aheadeuroyen futures contract
15The surge in high-yield issuance during 1995–97 mayhave contributed to the rise in default rates through a“vintage effect”: that is, historical data show that the prob-ability that an average high-yield issuer will default peaksabout three years after a high-yield bond is issued.
16In the fourth quarter of 2000, for example, large U.S.corporations reported a 20 percent decline in profits.This was followed in the subsequent quarter by a 42 per-cent decline in profits to the lowest level in a decade.
Meanwhile, some highly leveraged telecomscompanies reduced their debt burdens by sell-ing assets, refinancing, and securitizing cashflows—a process that was still in train at mid-2001.17 Flows recovered and spreads narrowedin the CP market as well. With the benefit ofhindsight, the sharp widening in spreads forhigh-yield issues could be seen as reflecting areappraisal of credit risk and reallocation ofcredit after a long-running boom, rather thanthe indiscriminate shedding of risk and cutting-off of credit flows that characterize a creditcrunch. Instead, the tiering of credit spreads—that is, greater discrimination between spreadsfor investment-grade and sub-investment-gradeborrowers—suggests increased credit marketdiscipline.
The tiering in U.S. credit markets was broadlyreflected in Europe’s nascent corporate bondmarket, which nevertheless continued to grow—probably because it mostly comprised invest-ment-grade borrowers (Figure 2.11). The intro-duction of the euro in 1999 expanded theinvestor base for European corporate debt is-suers and prompted a surge in euro-denomi-nated corporate debt issuance, contributing to afurther broadening and integration of Europe’scapital markets. To establish a reputation in theburgeoning market, some firms reportedlyplaced issues even in the absence of major fi-nancing needs. Issue sizes rose as investorssought liquidity and the credit spectrum broad-ened to lower-rated issues as investors increasedtheir appetite for credit risk. Notwithstandingthe recent boom, bonds still account for a smallshare of outstanding corporate liabilities in theeuro area compared with loans. This is partly ex-plained by the reluctance of some corporationsto open their books to rating agencies and thecontinued support of house banks.
Credit spreads in the Japanese corporatebond market have been highly compressed de-spite deteriorating economic fundamentals. Forexample, spreads on bonds issued by BBB-rated
NATIONAL AND INTERNATIONAL CREDIT MARKETS
17
0
5
10
15
20
25
30
35
40
45
50
0
0.2
0.4
0.6
0.8
1.0
1.2
1.4
1.6
1.8
2.0
0
5
10
15
20
25
0
1
2
3
4
5
6
7
8
9
1998
AAA Moody’s spread1
(in percent; right scale)
Merrill Lynch high-yield spread1
(in percent; right scale)
Issuance(in billions of U.S. dollars;
left scale)
Issuance(in billions ofU.S. dollars;
left scale)
1999 2000 2001
1998 1999 2000 2001
Figure 2.9. United States: Corporate Bond Market
Sources: U.S. Board of Governors of the Federal Reserve System; and Bloomberg Financial Markets L.P.
1Spreads against yields on 30-year U.S. government bonds.
Investment Grade
High Yield
17See “Unburdening” (2001).
CHAPTER II DEVELOPMENTS AND TRENDS IN MATURE CAPITAL MARKETS
18
0
200
400
600
800
1000
0
5
10
15
20
0
30
60
90
120
150
0
–20
20
40
60
80
100
120
140
0
20
40
60
80
100
120
140
160
1990
1998 99 2000 01 1998 99 2000 01
1998 99 2000 01 1998 99 2000 01
92 94 96 98 2000
Corporate Spreads1
On-the-Run/Off-the-Run Treasury Spread2
Repo Spread4
Swap Spreads3
Commercial Paper Spread5
Merrill Lynch high-yield
Baa
U.S. dollar
Euro
Yen
Aaa
Figure 2.10. Selected Spreads(In basis points)
Sources: Bloomberg Financial Markets L.P.; and Merrill Lynch.1Spread over 30-year U.S. treasury bond; weekly data.2Spread of a 30-year off-the-run treasury bond over a 30-year on-the-run treasury bond.3Spread of fixed-rate leg of 10-year interest rate swaps over 10-year government bond.4Spread between yields on three-month U.S. treasury repos and on three-month U.S. treasury bill.5Spread between yields on 90-day investment grade commercial paper and on three-month U.S. treasury bill.
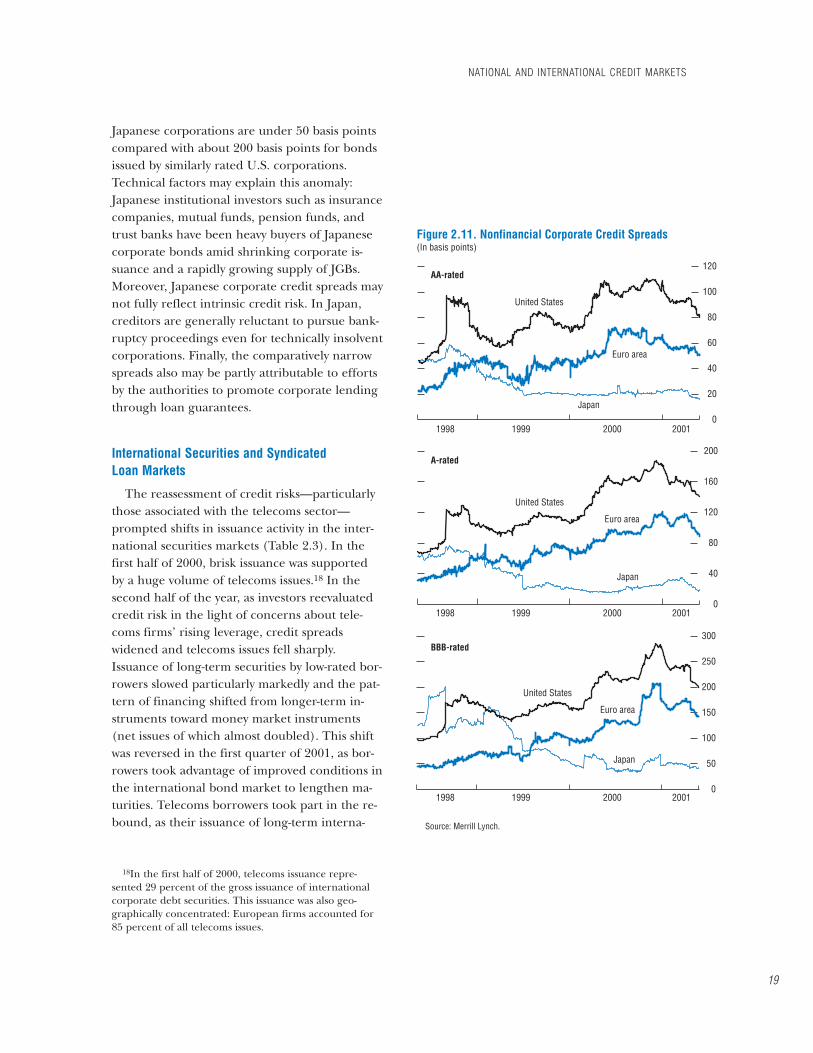
Japanese corporations are under 50 basis pointscompared with about 200 basis points for bondsissued by similarly rated U.S. corporations.Technical factors may explain this anomaly:Japanese institutional investors such as insurancecompanies, mutual funds, pension funds, andtrust banks have been heavy buyers of Japanesecorporate bonds amid shrinking corporate is-suance and a rapidly growing supply of JGBs.Moreover, Japanese corporate credit spreads maynot fully reflect intrinsic credit risk. In Japan,creditors are generally reluctant to pursue bank-ruptcy proceedings even for technically insolventcorporations. Finally, the comparatively narrowspreads also may be partly attributable to effortsby the authorities to promote corporate lendingthrough loan guarantees.
International Securities and SyndicatedLoan Markets
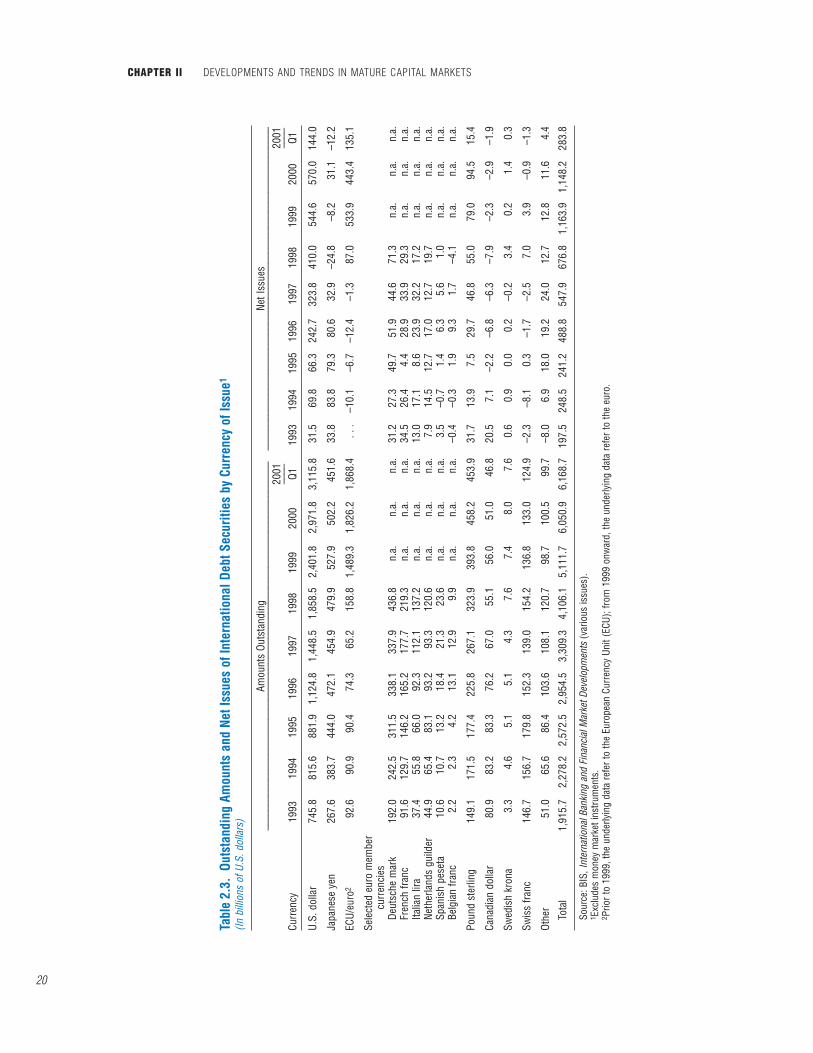
The reassessment of credit risks—particularlythose associated with the telecoms sector—prompted shifts in issuance activity in the inter-national securities markets (Table 2.3). In thefirst half of 2000, brisk issuance was supportedby a huge volume of telecoms issues.18 In thesecond half of the year, as investors reevaluatedcredit risk in the light of concerns about tele-coms firms’ rising leverage, credit spreadswidened and telecoms issues fell sharply.Issuance of long-term securities by low-rated bor-rowers slowed particularly markedly and the pat-tern of financing shifted from longer-term in-struments toward money market instruments(net issues of which almost doubled). This shiftwas reversed in the first quarter of 2001, as bor-rowers took advantage of improved conditions inthe international bond market to lengthen ma-turities. Telecoms borrowers took part in the re-bound, as their issuance of long-term interna-
NATIONAL AND INTERNATIONAL CREDIT MARKETS
19
0
20
40
60
80
100
120
0
40
80
120
160
200
0
50
100
150
200
250
300
1998 1999 2000 2001
1998 1999 2000 2001
1998 1999 2000 2001
AA-rated
A-rated
BBB-rated
United States
United States
United States
Euro area
Euro area
Euro area
Japan
Japan
Japan
Figure 2.11. Nonfinancial Corporate Credit Spreads(In basis points)
Source: Merrill Lynch.
18In the first half of 2000, telecoms issuance repre-sented 29 percent of the gross issuance of internationalcorporate debt securities. This issuance was also geo-graphically concentrated: European firms accounted for85 percent of all telecoms issues.
CHAPTER II DEVELOPMENTS AND TRENDS IN MATURE CAPITAL MARKETS
20
Tabl
e 2.
3.Ou
tsta
ndin
g Am
ount
s an
d Ne
t Iss
ues
of In
tern
atio
nal D
ebt S
ecur
ities
by
Curr
ency
of I
ssue
1
(In b
illio
ns o
f U.S
. dol
lars
)
Amou
nts
Outs
tand
ing
Net I
ssue
s__
____
____
____
____
____
____
____
____
____
____
____
____
____
____
____
____
____
___
____
____
____
____
____
____
____
____
____
____
____
____
____
____
____
____
2001
2001
____
____
Curr
ency
1993
1994
1995
1996
1997
1998
1999
2000
Q119
9319
9419
9519
9619
9719
9819
9920
00Q1
U.S.
dol
lar
745.
881
5.6
881.
91,
124.
81,
448.
51,
858.
52,
401.
82,
971.
83,
115.
831
.569
.866
.324
2.7
323.
841
0.0
544.
657
0.0
144.
0
Japa
nese
yen
267.
638
3.7
444.
047
2.1
454.
947
9.9
527.
950
2.2
451.
633
.883
.879
.380
.632
.9–2
4.8
–8.2
31.1
–12.
2
ECU/
euro
292
.690
.990
.474
.365
.215
8.8
1,48
9.3
1,82
6.2
1,86
8.4
. . .
–10.
1–6
.7–1
2.4
–1.3
87.0
533.
944
3.4
135.
1
Sele
cted
eur
o m
embe
r cu
rren
cies
Deut
sche
mar
k19
2.0
242.
531
1.5
338.
133
7.9
436.
8n.
a.n.
a.n.
a.31
.227
.349
.751
.944
.671
.3n.
a.n.
a.n.
a.Fr
ench
fran
c91
.612
9.7
146.
216
5.2
177.
721
9.3
n.a.
n.a.
n.a.
34.5
26.4
4.4
28.9
33.9
29.3
n.a.
n.a.
n.a.
Italia
n lir
a37
.455
.866
.092
.311
2.1
137.
2n.
a.n.
a.n.
a.13
.017
.18.
623
.932
.217
.2n.
a.n.
a.n.
a.Ne
ther
land
s gu
ilder
44.9
65.4
83.1
93.2
93.3
120.
6n.
a.n.
a.n.
a.7.
914
.512
.717
.012
.719
.7n.
a.n.
a.n.
a.Sp
anis
h pe
seta
10.6
10.7
13.2
18.4
21.3
23.6
n.a.
n.a.
n.a.
3.5
–0.7
1.4
6.3
5.6
1.0
n.a.
n.a.
n.a.
Belg
ian
franc
2.2
2.3
4.2
13.1
12.9
9.9
n.a.
n.a.
n.a.
–0.4
–0.3
1.9
9.3
1.7
–4.1
n.a.
n.a.
n.a.
Poun
d st
erlin
g14
9.1
171.
517
7.4
225.
826
7.1
323.
939
3.8
458.
245
3.9
31.7
13.9
7.5
29.7
46.8
55.0
79.0
94.5
15.4
Cana
dian
dol
lar
80.9
83.2
83.3
76.2
67.0
55.1
56.0
51.0
46.8
20.5
7.1
–2.2
–6.8
–6.3
–7.9
–2.3
–2.9
–1.9
Swed
ish
kron
a3.
34.
65.
15.
14.
37.
67.
48.
07.
60.
60.
90.
00.
2–0
.23.
40.
21.
40.
3
Swis
s fra
nc14
6.7
156.
717
9.8
152.
313
9.0
154.
213
6.8
133.
012
4.9
–2.3
–8.1
0.3
–1.7
–2.5
7.0
3.9
–0.9
–1.3
Othe
r51
.065
.686
.410
3.6
108.
112
0.7
98.7
100.
599
.7–8
.06.
918
.019
.224
.012
.712
.811
.64.
4
Tota
l 1,
915.
72,
278.
22,
572.
52,
954.
53,
309.
34,
106.
15,
111.
76,
050.
96,
168.
719
7.5
248.
524
1.2
488.
854
7.9
676.
81,
163.
91,
148.
228
3.8
Sour
ce: B
IS, I
nter
natio
nal B
anki
ng a
nd F
inan
cial
Mar
ket D
evel
opm
ents
(var
ious
issu
es).
1 Exc
lude
s m
oney
mar
ket i
nstru
men
ts.
2 Prio
r to
1999
, the
und
erly
ing
data
refe
r to
the
Euro
pean
Cur
renc
y Un
it (E
CU);
from
199
9 on
war
d, th
e un
derly
ing
data
refe
r to
the
euro
.
tional securities rose to a record of nearly $50billion. Average deal sizes in the dollar and eurosegments rose significantly in 2000, reflecting is-suers’ increasing needs for capital, a broadeningglobal investor base, and demand for secondarymarket liquidity. Following the 1999 surge ofeuro-denominated issues, issuers increasingly fa-vored the U.S. dollar.
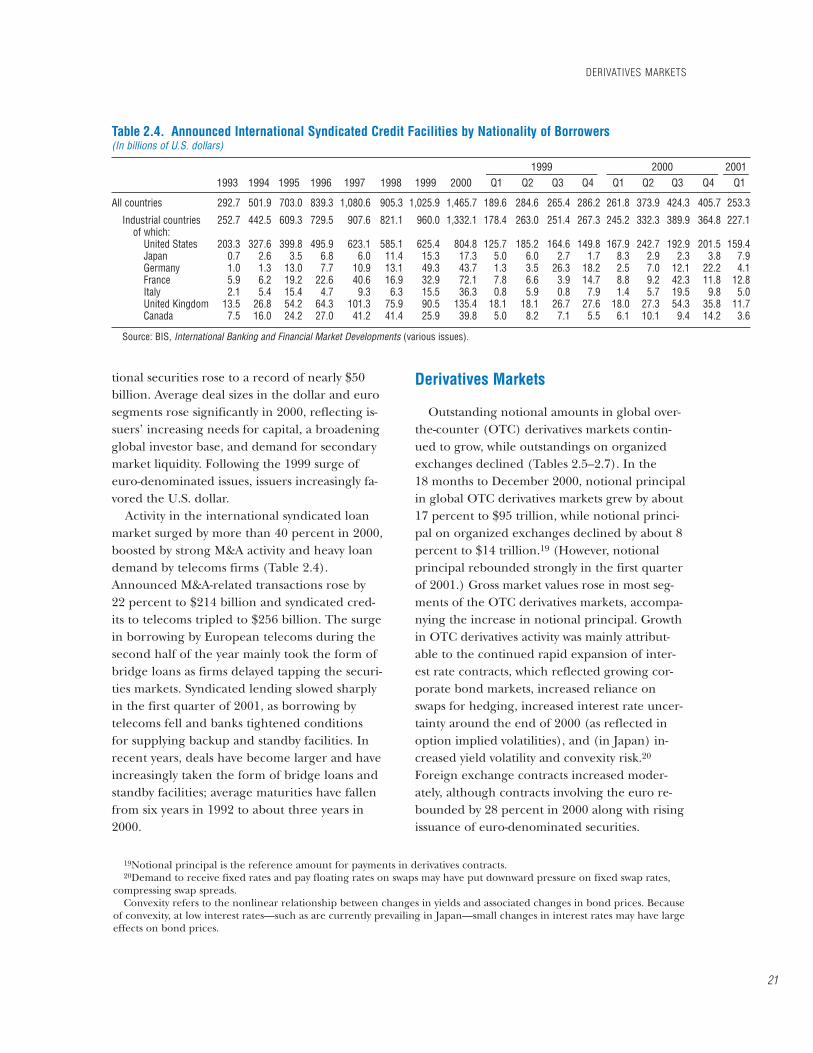
Activity in the international syndicated loanmarket surged by more than 40 percent in 2000,boosted by strong M&A activity and heavy loandemand by telecoms firms (Table 2.4).Announced M&A-related transactions rose by22 percent to $214 billion and syndicated cred-its to telecoms tripled to $256 billion. The surgein borrowing by European telecoms during thesecond half of the year mainly took the form ofbridge loans as firms delayed tapping the securi-ties markets. Syndicated lending slowed sharplyin the first quarter of 2001, as borrowing bytelecoms fell and banks tightened conditionsfor supplying backup and standby facilities. Inrecent years, deals have become larger and haveincreasingly taken the form of bridge loans andstandby facilities; average maturities have fallenfrom six years in 1992 to about three years in2000.
Derivatives Markets
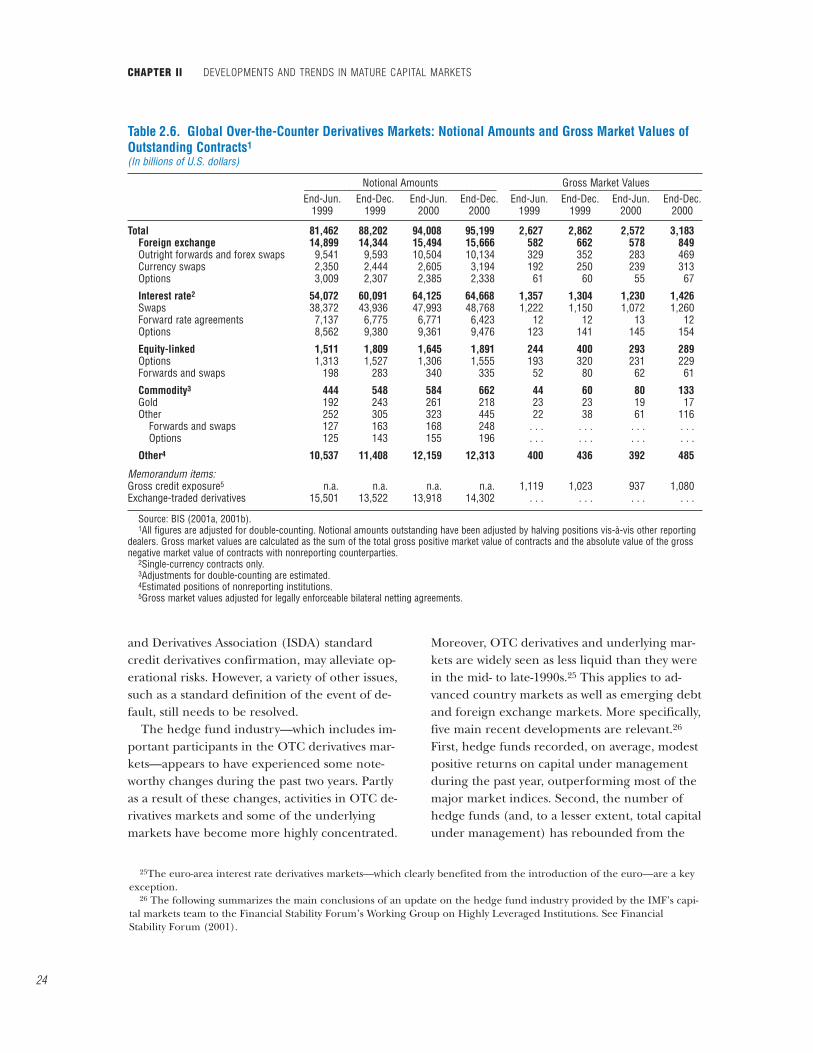
Outstanding notional amounts in global over-the-counter (OTC) derivatives markets contin-ued to grow, while outstandings on organizedexchanges declined (Tables 2.5–2.7). In the18 months to December 2000, notional principalin global OTC derivatives markets grew by about17 percent to $95 trillion, while notional princi-pal on organized exchanges declined by about 8percent to $14 trillion.19 (However, notionalprincipal rebounded strongly in the first quarterof 2001.) Gross market values rose in most seg-ments of the OTC derivatives markets, accompa-nying the increase in notional principal. Growthin OTC derivatives activity was mainly attribut-able to the continued rapid expansion of inter-est rate contracts, which reflected growing cor-porate bond markets, increased reliance onswaps for hedging, increased interest rate uncer-tainty around the end of 2000 (as reflected inoption implied volatilities), and (in Japan) in-creased yield volatility and convexity risk.20
Foreign exchange contracts increased moder-ately, although contracts involving the euro re-bounded by 28 percent in 2000 along with risingissuance of euro-denominated securities.
DERIVATIVES MARKETS
21
Table 2.4. Announced International Syndicated Credit Facilities by Nationality of Borrowers(In billions of U.S. dollars)
1999 2000 2001______________________ ______________________ _____1993 1994 1995 1996 1997 1998 1999 2000 Q1 Q2 Q3 Q4 Q1 Q2 Q3 Q4 Q1
All countries 292.7 501.9 703.0 839.3 1,080.6 905.3 1,025.9 1,465.7 189.6 284.6 265.4 286.2 261.8 373.9 424.3 405.7 253.3
Industrial countries 252.7 442.5 609.3 729.5 907.6 821.1 960.0 1,332.1 178.4 263.0 251.4 267.3 245.2 332.3 389.9 364.8 227.1of which:
United States 203.3 327.6 399.8 495.9 623.1 585.1 625.4 804.8 125.7 185.2 164.6 149.8 167.9 242.7 192.9 201.5 159.4Japan 0.7 2.6 3.5 6.8 6.0 11.4 15.3 17.3 5.0 6.0 2.7 1.7 8.3 2.9 2.3 3.8 7.9Germany 1.0 1.3 13.0 7.7 10.9 13.1 49.3 43.7 1.3 3.5 26.3 18.2 2.5 7.0 12.1 22.2 4.1France 5.9 6.2 19.2 22.6 40.6 16.9 32.9 72.1 7.8 6.6 3.9 14.7 8.8 9.2 42.3 11.8 12.8Italy 2.1 5.4 15.4 4.7 9.3 6.3 15.5 36.3 0.8 5.9 0.8 7.9 1.4 5.7 19.5 9.8 5.0United Kingdom 13.5 26.8 54.2 64.3 101.3 75.9 90.5 135.4 18.1 18.1 26.7 27.6 18.0 27.3 54.3 35.8 11.7Canada 7.5 16.0 24.2 27.0 41.2 41.4 25.9 39.8 5.0 8.2 7.1 5.5 6.1 10.1 9.4 14.2 3.6
Source: BIS, International Banking and Financial Market Developments (various issues).
19Notional principal is the reference amount for payments in derivatives contracts.20Demand to receive fixed rates and pay floating rates on swaps may have put downward pressure on fixed swap rates,
compressing swap spreads.Convexity refers to the nonlinear relationship between changes in yields and associated changes in bond prices. Because
of convexity, at low interest rates—such as are currently prevailing in Japan—small changes in interest rates may have largeeffects on bond prices.
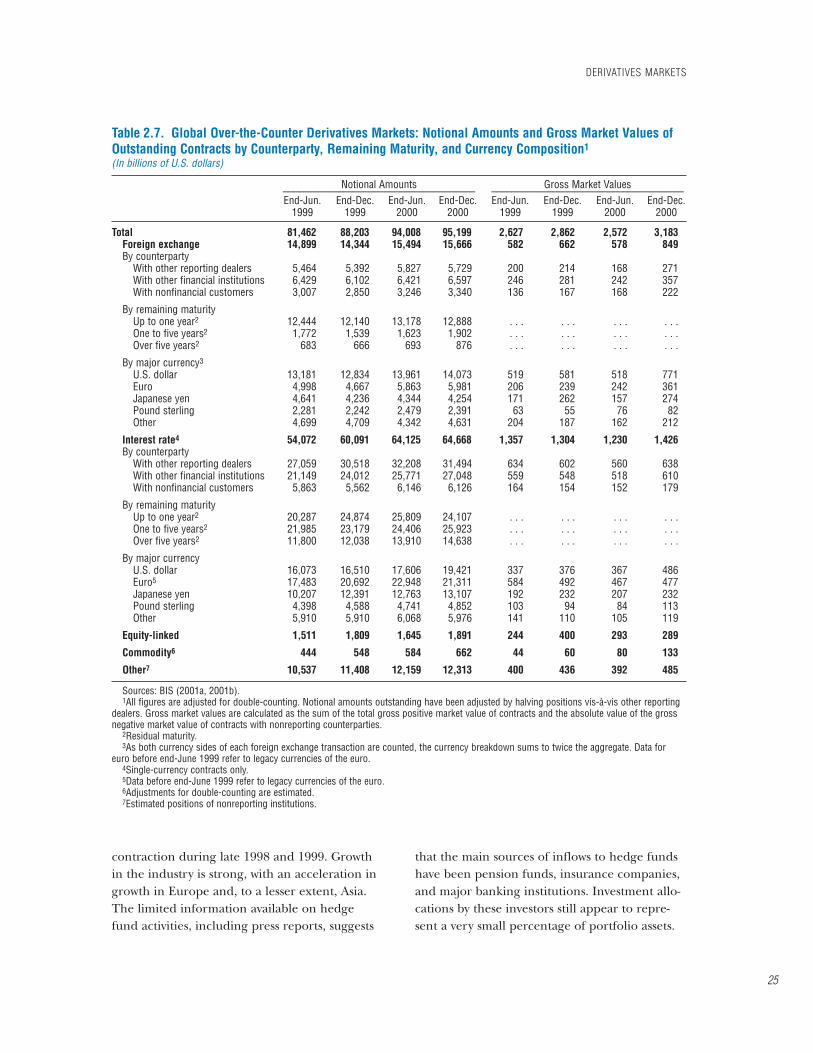
In Europe, the introduction of the euro and ashift of organized exchange trading of long-terminterest rate derivatives from London toFrankfurt have brought increased reliance onthe German government securities market forhedging interest rate risk. The 1998 merger ofDeutsche Termin Börse and the Swiss Optionsand Financial Futures Exchange into Eurex pre-ceded the creation of Europe’s most activelytraded interest rate contracts—the euro-bundand euro-bobl futures—and made Eurex theworld’s largest derivatives exchange. Trading ofthe futures contracts has increased to the pointwhere open interest often exceeds the amount
of outstanding underlying bonds, which, alongwith shortcomings in the repurchase agreement(repo) market, provides conditions conducive tosqueezes. For example, prior to the expiration ofthe March 2001 bobl contract, open interest wasalmost twice as large as the deliverable basket ofunderlying securities, which led to a significantsqueeze (see Box 4.5 in Chapter IV).21
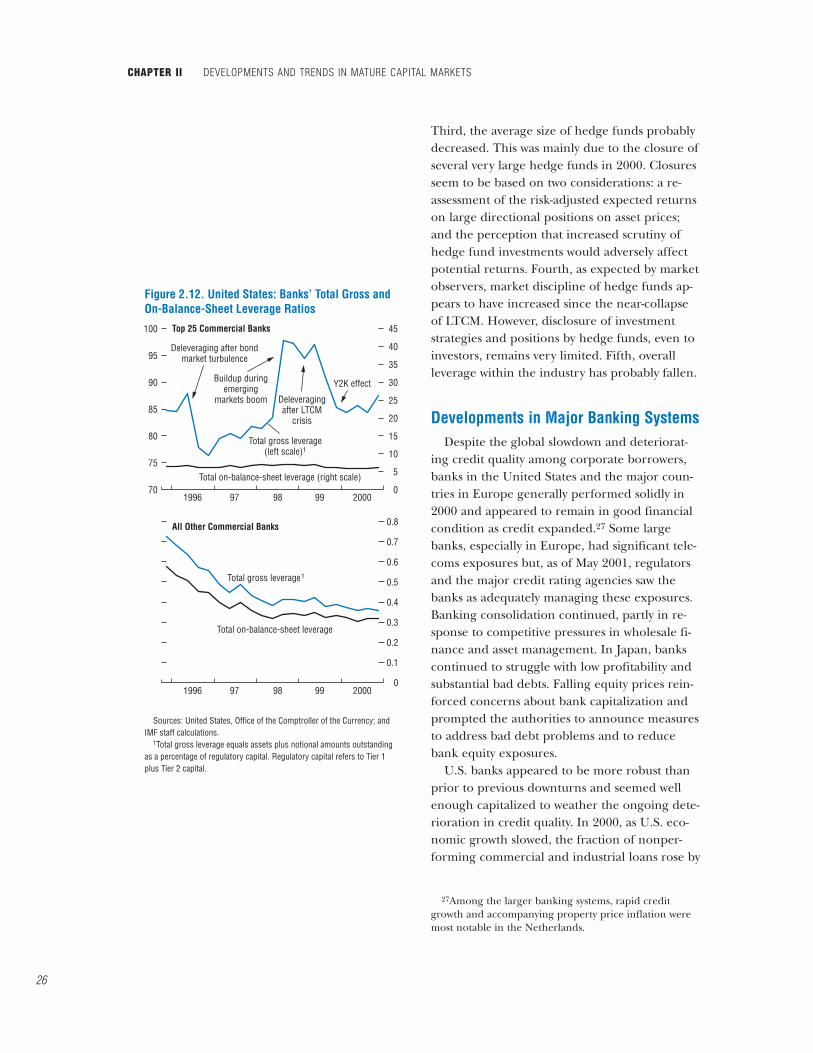
Recent fluctuations in a gross leverage indica-tor for the top 25 U.S. commercial banks areconsistent with anecdotal evidence about lever-aging activities of market participants in the de-rivatives markets (Figure 2.12).22 For example,the indicator tracks the buildup of leverage in
CHAPTER II DEVELOPMENTS AND TRENDS IN MATURE CAPITAL MARKETS
22
Table 2.5. Exchange-Traded Derivatives: Notional Principal Amounts Outstanding and Annual Turnover
1987 1988 1989 1990 1991 1992 1993 1994
(In billions of U.S. dollars)Notional principal amounts
outstandingInterest rate futures 487.7 895.4 1,200.8 1,454.5 2,156.7 2,913.0 4,960.4 5,807.6Interest rate options 122.6 279.2 387.9 599.5 1,072.6 1,385.4 2,362.4 2,623.6Currency futures 14.6 12.1 16.0 17.0 18.3 26.5 34.7 40.4Currency options 59.5 48.0 50.2 56.5 62.9 71.1 75.6 55.6Stock market index futures 17.8 27.1 41.3 69.1 76.0 79.8 110.0 127.7Stock market index options 27.7 42.9 70.7 93.7 132.8 158.6 232.5 242.8
Total 729.9 1,304.8 1,767.1 2,290.7 3,520.1 4,634.5 7,775.7 8,897.7North America 578.1 951.7 1,155.8 1,268.5 2,151.8 2,694.7 4,361.4 4,823.9Europe 13.3 177.7 251.2 461.5 710.8 1,114.4 1,778.0 1,831.8Asia-Pacific 138.5 175.4 360.0 560.5 657.0 823.5 1,606.0 2,171.8Other 0.0 0.0 0.1 0.2 0.5 1.9 30.3 70.3
(In millions of contracts traded)Annual turnoverInterest rate futures 145.7 156.4 201.0 219.1 230.9 330.1 427.0 628.6Interest rate options 29.3 30.5 39.5 52.0 50.8 64.8 82.9 116.6Currency futures 21.2 22.5 28.2 29.7 30.0 31.3 39.0 69.7Currency options 18.3 18.2 20.7 18.9 22.9 23.4 23.8 21.3Stock market index futures 36.1 29.6 30.1 39.4 54.6 52.0 71.2 109.0Stock market index options 139.1 79.1 101.7 119.1 121.4 133.9 144.1 197.5
Total 389.6 336.3 421.2 478.3 510.5 635.6 788.0 1,142.9North America 318.3 252.2 287.9 312.3 302.7 341.4 382.3 513.5Europe 35.9 40.8 64.4 83.0 110.5 185.0 263.5 398.0Asia-Pacific 30.0 34.4 63.6 79.1 85.8 82.8 98.4 131.9Other 5.5 8.9 5.3 3.9 11.6 26.3 43.7 99.4
Source: BIS, International Banking and Financial Market Developments (various issues).
21A delivery obligation arising out of a short position in a euro-bobl futures contract may only be satisfied by the deliv-ery of specific debt securities—namely, German federal bonds (Bundesanleihen) and German federal debt obligations(Bundesobligationen)—with a remaining term upon delivery of 4!/2 to 5!/2 years. The debt securities must have a minimumissue amount of €2 billion.
22The indicator is equal to the ratio of balance-sheet assets and notional amounts of outstanding derivatives contracts toregulatory capital (see Breuer, 2000). Because relevant data are scarce, aggregate off-balance-sheet leverage of majorbanks can only be approximated for select countries.
early 1998 and the reduction in leverage afterthe near-collapse of the major hedge fund Long-Term Capital Management (LTCM) in October1998.23 According to the indicator, leverage roseagain in the fourth quarter of 2000.
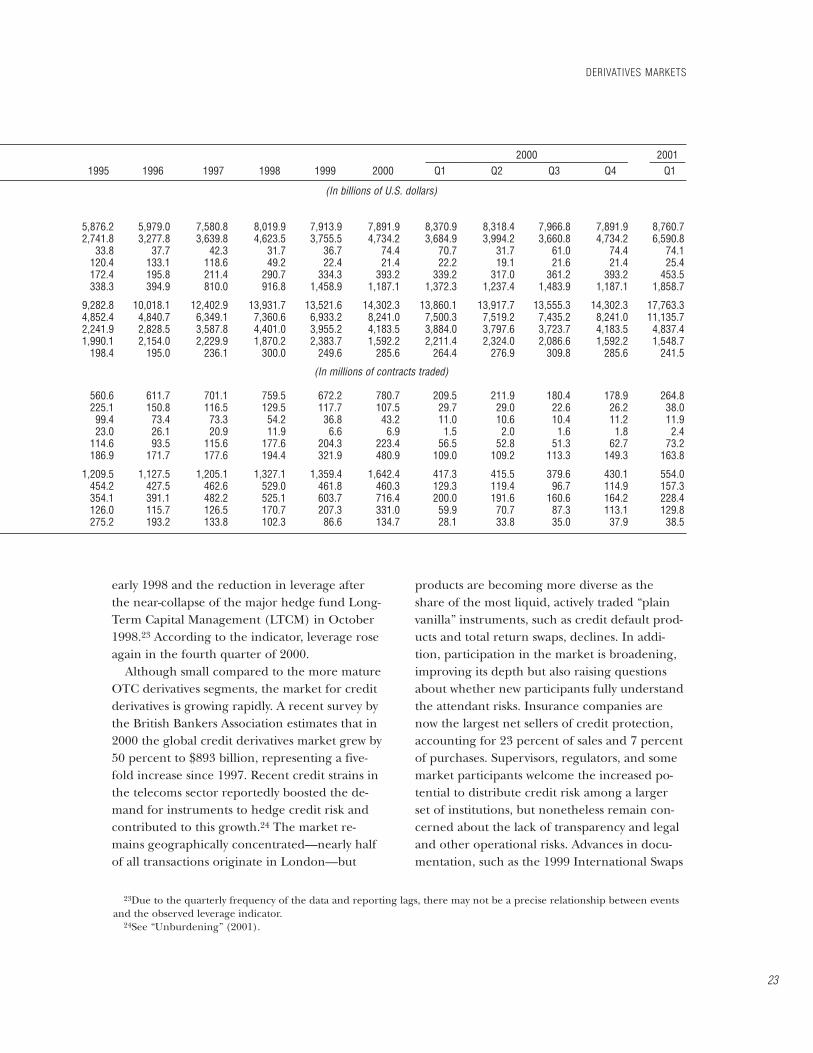
Although small compared to the more matureOTC derivatives segments, the market for creditderivatives is growing rapidly. A recent survey bythe British Bankers Association estimates that in2000 the global credit derivatives market grew by50 percent to $893 billion, representing a five-fold increase since 1997. Recent credit strains inthe telecoms sector reportedly boosted the de-mand for instruments to hedge credit risk andcontributed to this growth.24 The market re-mains geographically concentrated—nearly halfof all transactions originate in London—but
products are becoming more diverse as theshare of the most liquid, actively traded “plainvanilla” instruments, such as credit default prod-ucts and total return swaps, declines. In addi-tion, participation in the market is broadening,improving its depth but also raising questionsabout whether new participants fully understandthe attendant risks. Insurance companies arenow the largest net sellers of credit protection,accounting for 23 percent of sales and 7 percentof purchases. Supervisors, regulators, and somemarket participants welcome the increased po-tential to distribute credit risk among a largerset of institutions, but nonetheless remain con-cerned about the lack of transparency and legaland other operational risks. Advances in docu-mentation, such as the 1999 International Swaps
DERIVATIVES MARKETS
23
23Due to the quarterly frequency of the data and reporting lags, there may not be a precise relationship between eventsand the observed leverage indicator.
24See “Unburdening” (2001).
2000 2001________________________________________ _______1995 1996 1997 1998 1999 2000 Q1 Q2 Q3 Q4 Q1
(In billions of U.S. dollars)
5,876.2 5,979.0 7,580.8 8,019.9 7,913.9 7,891.9 8,370.9 8,318.4 7,966.8 7,891.9 8,760.72,741.8 3,277.8 3,639.8 4,623.5 3,755.5 4,734.2 3,684.9 3,994.2 3,660.8 4,734.2 6,590.8
33.8 37.7 42.3 31.7 36.7 74.4 70.7 31.7 61.0 74.4 74.1120.4 133.1 118.6 49.2 22.4 21.4 22.2 19.1 21.6 21.4 25.4172.4 195.8 211.4 290.7 334.3 393.2 339.2 317.0 361.2 393.2 453.5338.3 394.9 810.0 916.8 1,458.9 1,187.1 1,372.3 1,237.4 1,483.9 1,187.1 1,858.7
9,282.8 10,018.1 12,402.9 13,931.7 13,521.6 14,302.3 13,860.1 13,917.7 13,555.3 14,302.3 17,763.34,852.4 4,840.7 6,349.1 7,360.6 6,933.2 8,241.0 7,500.3 7,519.2 7,435.2 8,241.0 11,135.72,241.9 2,828.5 3,587.8 4,401.0 3,955.2 4,183.5 3,884.0 3,797.6 3,723.7 4,183.5 4,837.41,990.1 2,154.0 2,229.9 1,870.2 2,383.7 1,592.2 2,211.4 2,324.0 2,086.6 1,592.2 1,548.7
198.4 195.0 236.1 300.0 249.6 285.6 264.4 276.9 309.8 285.6 241.5
(In millions of contracts traded)
560.6 611.7 701.1 759.5 672.2 780.7 209.5 211.9 180.4 178.9 264.8225.1 150.8 116.5 129.5 117.7 107.5 29.7 29.0 22.6 26.2 38.099.4 73.4 73.3 54.2 36.8 43.2 11.0 10.6 10.4 11.2 11.923.0 26.1 20.9 11.9 6.6 6.9 1.5 2.0 1.6 1.8 2.4
114.6 93.5 115.6 177.6 204.3 223.4 56.5 52.8 51.3 62.7 73.2186.9 171.7 177.6 194.4 321.9 480.9 109.0 109.2 113.3 149.3 163.8
1,209.5 1,127.5 1,205.1 1,327.1 1,359.4 1,642.4 417.3 415.5 379.6 430.1 554.0454.2 427.5 462.6 529.0 461.8 460.3 129.3 119.4 96.7 114.9 157.3354.1 391.1 482.2 525.1 603.7 716.4 200.0 191.6 160.6 164.2 228.4126.0 115.7 126.5 170.7 207.3 331.0 59.9 70.7 87.3 113.1 129.8275.2 193.2 133.8 102.3 86.6 134.7 28.1 33.8 35.0 37.9 38.5
and Derivatives Association (ISDA) standardcredit derivatives confirmation, may alleviate op-erational risks. However, a variety of other issues,such as a standard definition of the event of de-fault, still needs to be resolved.
The hedge fund industry—which includes im-portant participants in the OTC derivatives mar-kets—appears to have experienced some note-worthy changes during the past two years. Partlyas a result of these changes, activities in OTC de-rivatives markets and some of the underlyingmarkets have become more highly concentrated.
Moreover, OTC derivatives and underlying mar-kets are widely seen as less liquid than they werein the mid- to late-1990s.25 This applies to ad-vanced country markets as well as emerging debtand foreign exchange markets. More specifically,five main recent developments are relevant.26
First, hedge funds recorded, on average, modestpositive returns on capital under managementduring the past year, outperforming most of themajor market indices. Second, the number ofhedge funds (and, to a lesser extent, total capitalunder management) has rebounded from the
CHAPTER II DEVELOPMENTS AND TRENDS IN MATURE CAPITAL MARKETS
24
Table 2.6. Global Over-the-Counter Derivatives Markets: Notional Amounts and Gross Market Values ofOutstanding Contracts1
(In billions of U.S. dollars)
Notional Amounts Gross Market Values______________________________________ ______________________________________End-Jun. End-Dec. End-Jun. End-Dec. End-Jun. End-Dec. End-Jun. End-Dec.
1999 1999 2000 2000 1999 1999 2000 2000
Total 81,462 88,202 94,008 95,199 2,627 2,862 2,572 3,183Foreign exchange 14,899 14,344 15,494 15,666 582 662 578 849Outright forwards and forex swaps 9,541 9,593 10,504 10,134 329 352 283 469Currency swaps 2,350 2,444 2,605 3,194 192 250 239 313Options 3,009 2,307 2,385 2,338 61 60 55 67
Interest rate2 54,072 60,091 64,125 64,668 1,357 1,304 1,230 1,426Swaps 38,372 43,936 47,993 48,768 1,222 1,150 1,072 1,260Forward rate agreements 7,137 6,775 6,771 6,423 12 12 13 12Options 8,562 9,380 9,361 9,476 123 141 145 154
Equity-linked 1,511 1,809 1,645 1,891 244 400 293 289Options 1,313 1,527 1,306 1,555 193 320 231 229Forwards and swaps 198 283 340 335 52 80 62 61
Commodity3 444 548 584 662 44 60 80 133Gold 192 243 261 218 23 23 19 17Other 252 305 323 445 22 38 61 116
Forwards and swaps 127 163 168 248 . . . . . . . . . . . .Options 125 143 155 196 . . . . . . . . . . . .
Other4 10,537 11,408 12,159 12,313 400 436 392 485
Memorandum items:Gross credit exposure5 n.a. n.a. n.a. n.a. 1,119 1,023 937 1,080Exchange-traded derivatives 15,501 13,522 13,918 14,302 . . . . . . . . . . . .
Source: BIS (2001a, 2001b).1All figures are adjusted for double-counting. Notional amounts outstanding have been adjusted by halving positions vis-à-vis other reporting
dealers. Gross market values are calculated as the sum of the total gross positive market value of contracts and the absolute value of the grossnegative market value of contracts with nonreporting counterparties.
2Single-currency contracts only.3Adjustments for double-counting are estimated.4Estimated positions of nonreporting institutions.5Gross market values adjusted for legally enforceable bilateral netting agreements.
25The euro-area interest rate derivatives markets—which clearly benefited from the introduction of the euro—are a keyexception.
26 The following summarizes the main conclusions of an update on the hedge fund industry provided by the IMF’s capi-tal markets team to the Financial Stability Forum’s Working Group on Highly Leveraged Institutions. See FinancialStability Forum (2001).
contraction during late 1998 and 1999. Growthin the industry is strong, with an acceleration ingrowth in Europe and, to a lesser extent, Asia.The limited information available on hedgefund activities, including press reports, suggests
that the main sources of inflows to hedge fundshave been pension funds, insurance companies,and major banking institutions. Investment allo-cations by these investors still appear to repre-sent a very small percentage of portfolio assets.
DERIVATIVES MARKETS
25
Table 2.7. Global Over-the-Counter Derivatives Markets: Notional Amounts and Gross Market Values ofOutstanding Contracts by Counterparty, Remaining Maturity, and Currency Composition1
(In billions of U.S. dollars)
Notional Amounts Gross Market Values______________________________________ ______________________________________End-Jun. End-Dec. End-Jun. End-Dec. End-Jun. End-Dec. End-Jun. End-Dec.
1999 1999 2000 2000 1999 1999 2000 2000
Total 81,462 88,203 94,008 95,199 2,627 2,862 2,572 3,183Foreign exchange 14,899 14,344 15,494 15,666 582 662 578 849By counterparty
With other reporting dealers 5,464 5,392 5,827 5,729 200 214 168 271With other financial institutions 6,429 6,102 6,421 6,597 246 281 242 357With nonfinancial customers 3,007 2,850 3,246 3,340 136 167 168 222
By remaining maturityUp to one year2 12,444 12,140 13,178 12,888 . . . . . . . . . . . .One to five years2 1,772 1,539 1,623 1,902 . . . . . . . . . . . .Over five years2 683 666 693 876 . . . . . . . . . . . .
By major currency3
U.S. dollar 13,181 12,834 13,961 14,073 519 581 518 771Euro 4,998 4,667 5,863 5,981 206 239 242 361Japanese yen 4,641 4,236 4,344 4,254 171 262 157 274Pound sterling 2,281 2,242 2,479 2,391 63 55 76 82Other 4,699 4,709 4,342 4,631 204 187 162 212
Interest rate4 54,072 60,091 64,125 64,668 1,357 1,304 1,230 1,426By counterparty
With other reporting dealers 27,059 30,518 32,208 31,494 634 602 560 638With other financial institutions 21,149 24,012 25,771 27,048 559 548 518 610With nonfinancial customers 5,863 5,562 6,146 6,126 164 154 152 179
By remaining maturityUp to one year2 20,287 24,874 25,809 24,107 . . . . . . . . . . . .One to five years2 21,985 23,179 24,406 25,923 . . . . . . . . . . . .Over five years2 11,800 12,038 13,910 14,638 . . . . . . . . . . . .
By major currencyU.S. dollar 16,073 16,510 17,606 19,421 337 376 367 486Euro5 17,483 20,692 22,948 21,311 584 492 467 477Japanese yen 10,207 12,391 12,763 13,107 192 232 207 232Pound sterling 4,398 4,588 4,741 4,852 103 94 84 113Other 5,910 5,910 6,068 5,976 141 110 105 119
Equity-linked 1,511 1,809 1,645 1,891 244 400 293 289
Commodity6 444 548 584 662 44 60 80 133
Other7 10,537 11,408 12,159 12,313 400 436 392 485
Sources: BIS (2001a, 2001b).1All figures are adjusted for double-counting. Notional amounts outstanding have been adjusted by halving positions vis-à-vis other reporting
dealers. Gross market values are calculated as the sum of the total gross positive market value of contracts and the absolute value of the grossnegative market value of contracts with nonreporting counterparties.
2Residual maturity.3As both currency sides of each foreign exchange transaction are counted, the currency breakdown sums to twice the aggregate. Data for
euro before end-June 1999 refer to legacy currencies of the euro.4Single-currency contracts only.5Data before end-June 1999 refer to legacy currencies of the euro.6Adjustments for double-counting are estimated.7Estimated positions of nonreporting institutions.
Third, the average size of hedge funds probablydecreased. This was mainly due to the closure ofseveral very large hedge funds in 2000. Closuresseem to be based on two considerations: a re-assessment of the risk-adjusted expected returnson large directional positions on asset prices;and the perception that increased scrutiny ofhedge fund investments would adversely affectpotential returns. Fourth, as expected by marketobservers, market discipline of hedge funds ap-pears to have increased since the near-collapseof LTCM. However, disclosure of investmentstrategies and positions by hedge funds, even toinvestors, remains very limited. Fifth, overallleverage within the industry has probably fallen.
Developments in Major Banking SystemsDespite the global slowdown and deteriorat-
ing credit quality among corporate borrowers,banks in the United States and the major coun-tries in Europe generally performed solidly in2000 and appeared to remain in good financialcondition as credit expanded.27 Some largebanks, especially in Europe, had significant tele-coms exposures but, as of May 2001, regulatorsand the major credit rating agencies saw thebanks as adequately managing these exposures.Banking consolidation continued, partly in re-sponse to competitive pressures in wholesale fi-nance and asset management. In Japan, bankscontinued to struggle with low profitability andsubstantial bad debts. Falling equity prices rein-forced concerns about bank capitalization andprompted the authorities to announce measuresto address bad debt problems and to reducebank equity exposures.
U.S. banks appeared to be more robust thanprior to previous downturns and seemed wellenough capitalized to weather the ongoing dete-rioration in credit quality. In 2000, as U.S. eco-nomic growth slowed, the fraction of nonper-forming commercial and industrial loans rose by
CHAPTER II DEVELOPMENTS AND TRENDS IN MATURE CAPITAL MARKETS
26
70
75
80
85
90
95
100
0
5
10
15
20
25
30
35
40
45
0
0.1
0.2
0.3
0.4
0.5
0.6
0.7
0.8
1996 97 98 99 2000
1996 97 98 99 2000
Deleveraging after bondmarket turbulence
Buildup duringemerging
markets boom
Total gross leverage(left scale)1
Total gross leverage1
Total on-balance-sheet leverage (right scale)
Total on-balance-sheet leverage
Y2K effect
Deleveragingafter LTCM
crisis
Figure 2.12. United States: Banks’ Total Gross and On-Balance-Sheet Leverage Ratios
Sources: United States, Office of the Comptroller of the Currency; and IMF staff calculations.
1Total gross leverage equals assets plus notional amounts outstanding as a percentage of regulatory capital. Regulatory capital refers to Tier 1 plus Tier 2 capital.
Top 25 Commercial Banks
All Other Commercial Banks
27Among the larger banking systems, rapid creditgrowth and accompanying property price inflation weremost notable in the Netherlands.
50 percent to 1.7 percent (well below the 4.3percent recorded in 1991, at the end of the lastrecession). In response, banks increased provi-sions and sharply tightened lending standards.28
Lending continued to expand and the growth ofconsumer lending picked up. U.S. commercialbanks’ return on equity (ROE) declined from15.6 percent to 13.7 percent as growth in non-interest income slowed sharply. Rating agenciesand supervisors view the U.S. banking system asfinancially strong. In 2000, for example, com-mercial banks had an average risk-based capitalratio of 12 percent and supervisors classified 98percent of the banks as “well capitalized.”
European banks generally reported higher orstable profits and remained well capitalized.Banks have acquired significant telecoms expo-sures by financing roughly $400 billion in tele-coms-related M&A activity and $125 billion inpurchases of “third generation” telecoms li-censes. As of end-April 2001, total syndicatedloan commitments (drawn and undrawn) of allinternational banks to European telecoms opera-tors and equipment manufacturers totaled about$180 billion. Official concerns about the size oftelecoms exposures were reflected in publicstatements by regulatory authorities includingthe U.K. Financial Services Authority (FSA) andthe French Banking Commission. Nevertheless,as of mid-2001 rating agencies, supervisors, andbank analysts generally believed that Europeanbanks were managing these exposures effectivelyand did not see them as a major risk for two rea-sons. First, the bulk of exposures are to highlyrated national telecoms companies that havesolid fundamentals. Second, banks have beenable to reduce and diversify these exposures bysecuritizing and selling telecoms loans and byencouraging telecoms firms to substitute marketfunding for loans.
French banks performed well in 2000, as sev-eral large banks reaped considerable profitsfrom wholesale finance and asset management.Average ROE for the five largest private banks
rose from about 13 percent to 15 percent andwas higher for banks with strong wholesale fran-chises. ROE was also boosted by low provisions,which reflected very low nonperforming loan(NPL) ratios—a legacy of more cautious lendingfollowing France’s real estate crisis in the mid-1990s. At the same time, the French BankingCommission became concerned that banksmight be underprovisioning to increase profits.The major French banks were well capitalized,with capital ratios stable in the 11 to 13 percentrange. Consolidation among French bankspaused, although one large French bank was ac-quired by a major foreign bank in a friendlytakeover.
Top German banks’ average ROE in 2000 wasbroadly unchanged at about 8 percent after ad-justing for one-time capital gains from sales ofcross-shareholdings. However, the best-perform-ing banks recorded adjusted ROEs of about 12percent. Rating agencies and German supervi-sors regard the German banking system—withfew exceptions—as sound. The top four bankshad capital ratios of 10–13 percent and NPL ra-tios of 2–3 percent. Faced with strong competi-tion in retail banking from the many smaller sav-ings banks and cooperative banks, large bankscontinued to refocus on wholesale finance andasset management. This shift in focus was facili-tated by tax law changes that reduced the taxburden of unwinding cross-shareholdings amongfinancial institutions and helped to move theGerman banking system toward the bancassur-ance model. One top-four bank merged with thelargest German insurance company, and anotherbank strengthened its ties with an insurancecompany.
ROE for the six major private banks in Italyrose by over 2 percentage points to about 15 per-cent in 2000, reflecting strong retail, asset man-agement, and corporate lending franchises.Some individual banks achieved especiallystrong performances by successfully focusing ondeveloping strong franchises and reducing non-performing loans, including through securitiza-tion. Between 1998 and 2000, the six majorbanks cut NPL ratios nearly in half to 4 percent
DEVELOPMENTS IN MAJOR BANKING SYSTEMS
27
28See United States, Board of Governors of the FederalReserve System (2000).
and raised their capital ratios modestly toaround 10 percent.
Spanish banks were strongly profitable in2000, as ROE for Spanish credit institutions rosefrom 19 percent to 22 percent. Spanish banksalso had robust asset quality. The NPL ratiostood at 1.1 percent at the end of 2000; in addi-tion, provisions covered 166 percent of impairedassets. They were also well capitalized. The over-all capital ratio stood at 11.1 percent, of which9.1 percent corresponded to Tier 1 capital.
Average ROE for the five largest U.K. banksheld constant at about 19 percent in 2000, re-flecting highly profitable retail banking activities.In addition, loan credit quality remained solid aseconomic growth picked up, permitting a lowlevel of provisioning. The top banks’ averageNPL ratio declined moderately to about 2 per-cent. U.K. banks remained well capitalized, withthe average capital ratio for the five largestbanks stable in 2000 at just above 12 percent.
In both the United States and Europe, largerinternationally active banks have sought to diver-sify into higher-margin, fee-generating activitiesin an effort to raise ROE. At the same time, com-petition in wholesale finance is eroding margins.Competitive pressures may also have drivenbanking consolidation as banks have sought tocapture economies of scale and scope. The op-portunities presented by the rapid expansion ofeuro-area corporate securities markets have ac-celerated the shift by euro-area banks intowholesale finance. European corporations stillrely much more heavily on loans than on securi-ties for financing needs, however, and euro-areabanks that underwrite market financing oftenalso continue to function as the client’s“Hausbank”—for example, by maintaining along-term lending relationship and providingbackup financing. Meanwhile, European bankshave relied more heavily on credit-risk transfer
vehicles (such as asset-backed securitization andcollateralized loan obligations) to manage theircredit and balance-sheet risks. The shift fromlending to market finance may also have influ-enced the balance of risks in the U.S. andEuropean financial systems. For example, whilethe distribution of financial risk may be diversi-fied, it may also be less transparent.
Japanese bank performance remained weak in2000.29 Based on fiscal year 2000 interim results,ROE for Japanese city banks was broadly un-changed at about 3 percent, reflecting high pro-visioning and narrow interest margins.30 Profitsat regional banks were also adversely affected byprovisioning. Major Japanese banks reported anaverage capital ratio of 12.3 percent inSeptember 2000, but more than half of Tier 1capital consisted of public capital, deferredtaxes, and preferred equity instruments. In addi-tion, some private analysts estimated that uncov-ered exposure to future losses remained largerelative to capital—for major banks, equivalentto roughly half of aggregate Tier 1 capital, andfor regional banks, over 100 percent of Tier 1capital. In March 2001, as the stock market slideheightened market concerns about the stabilityof the Japanese banking system, the Japanese au-thorities announced a package of measures in-tended to stabilize and revive the banking sector.This package included measures to acceleratethe disposal of bad loans and to reduce bank eq-uity market exposure through government pur-chases of bank equity holdings. Market partici-pants viewed the measures as falling short ofaddressing the banking system’s fundamentalweaknesses.
The consolidated cross-border exposures ofmature market banks to emerging market coun-tries is large but fairly well-diversified acrosscountries and regions (Table 2.8).31 Banking sys-tems in two countries—Germany and Spain—
CHAPTER II DEVELOPMENTS AND TRENDS IN MATURE CAPITAL MARKETS
28
29Annex I discusses the challenges facing Japan’s banking and corporate sectors.30Interest income accounts for 40 percent of Japanese banks’ total income.31These figures exclude local-currency exposure of local subsidiaries, which may be significant for some banks.Cross-border exposures to other mature markets have also been highlighted as a potential concern from time to time.
For instance, the FSA has registered concerns about the exposure of U.K. banks to U.S. corporations, particularly in thehigh-tech sector.
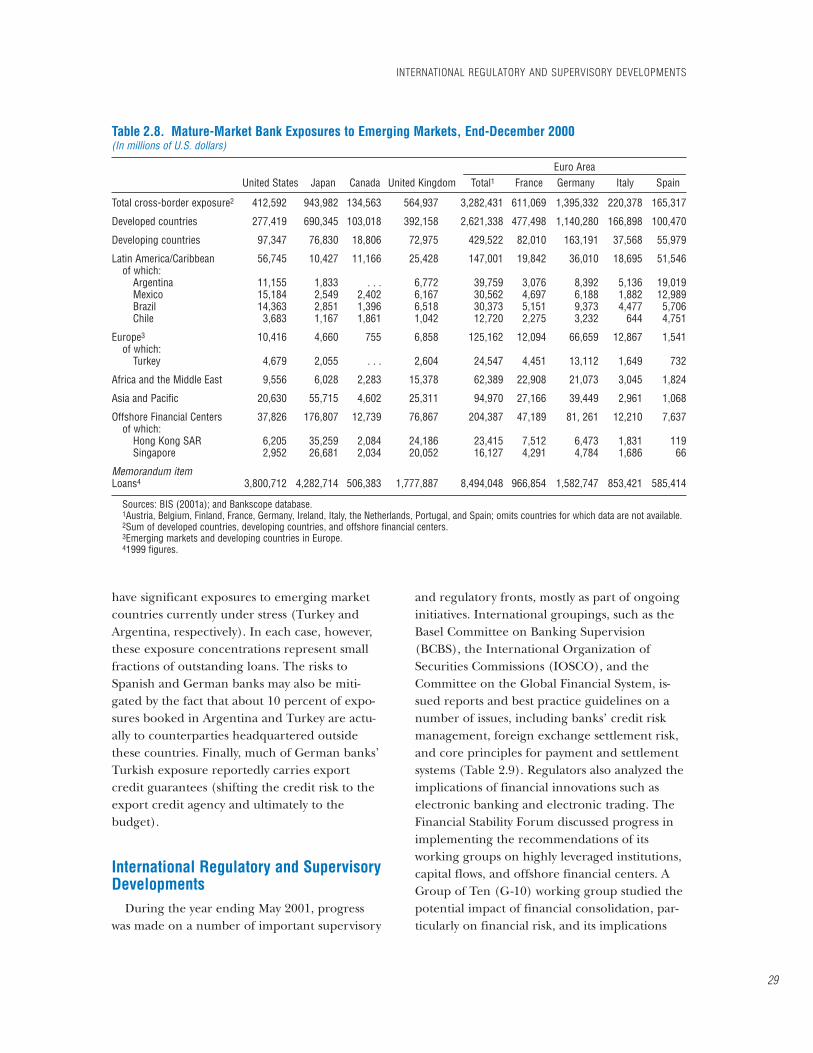
have significant exposures to emerging marketcountries currently under stress (Turkey andArgentina, respectively). In each case, however,these exposure concentrations represent smallfractions of outstanding loans. The risks toSpanish and German banks may also be miti-gated by the fact that about 10 percent of expo-sures booked in Argentina and Turkey are actu-ally to counterparties headquartered outsidethese countries. Finally, much of German banks’Turkish exposure reportedly carries exportcredit guarantees (shifting the credit risk to theexport credit agency and ultimately to thebudget).
International Regulatory and SupervisoryDevelopments
During the year ending May 2001, progresswas made on a number of important supervisory
and regulatory fronts, mostly as part of ongoinginitiatives. International groupings, such as theBasel Committee on Banking Supervision(BCBS), the International Organization ofSecurities Commissions (IOSCO), and theCommittee on the Global Financial System, is-sued reports and best practice guidelines on anumber of issues, including banks’ credit riskmanagement, foreign exchange settlement risk,and core principles for payment and settlementsystems (Table 2.9). Regulators also analyzed theimplications of financial innovations such aselectronic banking and electronic trading. TheFinancial Stability Forum discussed progress inimplementing the recommendations of itsworking groups on highly leveraged institutions,capital flows, and offshore financial centers. AGroup of Ten (G-10) working group studied thepotential impact of financial consolidation, par-ticularly on financial risk, and its implications
INTERNATIONAL REGULATORY AND SUPERVISORY DEVELOPMENTS
29
Table 2.8. Mature-Market Bank Exposures to Emerging Markets, End-December 2000(In millions of U.S. dollars)
Euro Area____________________________________________United States Japan Canada United Kingdom Total1 France Germany Italy Spain
Total cross-border exposure2 412,592 943,982 134,563 564,937 3,282,431 611,069 1,395,332 220,378 165,317
Developed countries 277,419 690,345 103,018 392,158 2,621,338 477,498 1,140,280 166,898 100,470
Developing countries 97,347 76,830 18,806 72,975 429,522 82,010 163,191 37,568 55,979
Latin America/Caribbean 56,745 10,427 11,166 25,428 147,001 19,842 36,010 18,695 51,546of which:
Argentina 11,155 1,833 . . . 6,772 39,759 3,076 8,392 5,136 19,019Mexico 15,184 2,549 2,402 6,167 30,562 4,697 6,188 1,882 12,989Brazil 14,363 2,851 1,396 6,518 30,373 5,151 9,373 4,477 5,706Chile 3,683 1,167 1,861 1,042 12,720 2,275 3,232 644 4,751
Europe3 10,416 4,660 755 6,858 125,162 12,094 66,659 12,867 1,541of which:
Turkey 4,679 2,055 . . . 2,604 24,547 4,451 13,112 1,649 732
Africa and the Middle East 9,556 6,028 2,283 15,378 62,389 22,908 21,073 3,045 1,824
Asia and Pacific 20,630 55,715 4,602 25,311 94,970 27,166 39,449 2,961 1,068
Offshore Financial Centers 37,826 176,807 12,739 76,867 204,387 47,189 81, 261 12,210 7,637of which:
Hong Kong SAR 6,205 35,259 2,084 24,186 23,415 7,512 6,473 1,831 119Singapore 2,952 26,681 2,034 20,052 16,127 4,291 4,784 1,686 66
Memorandum itemLoans4 3,800,712 4,282,714 506,383 1,777,887 8,494,048 966,854 1,582,747 853,421 585,414
Sources: BIS (2001a); and Bankscope database.1Austria, Belgium, Finland, France, Germany, Ireland, Italy, the Netherlands, Portugal, and Spain; omits countries for which data are not available.2Sum of developed countries, developing countries, and offshore financial centers.3Emerging markets and developing countries in Europe.41999 figures.
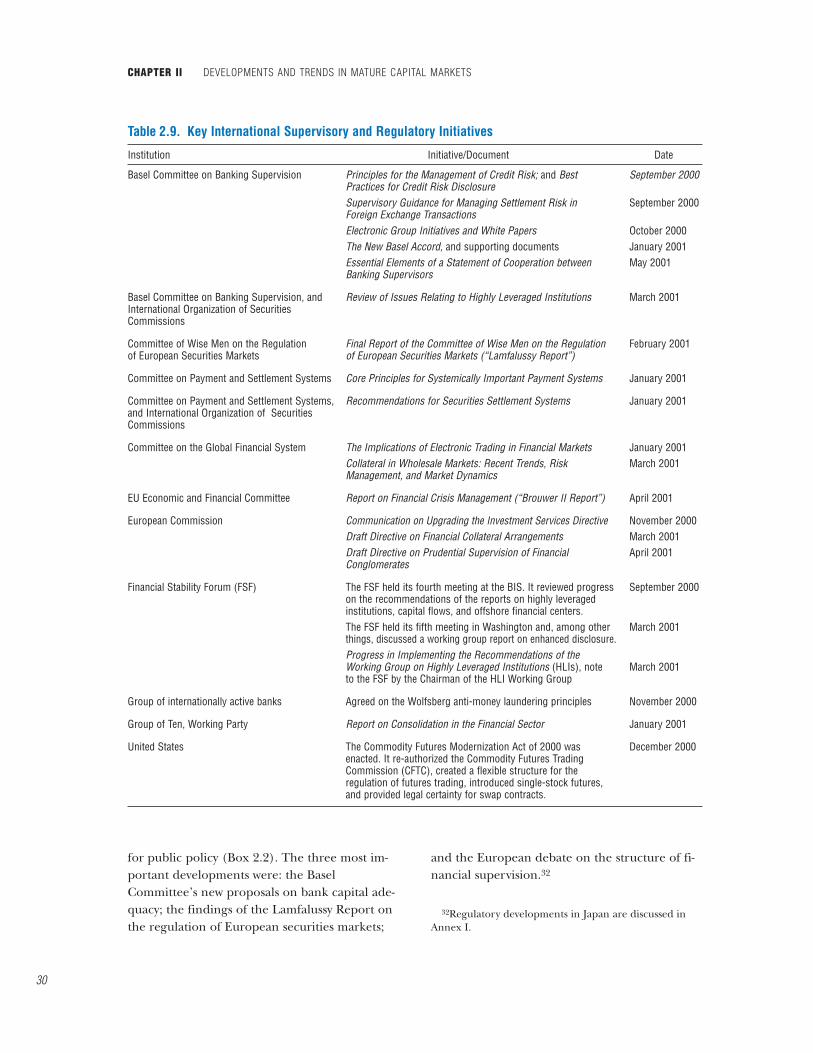
for public policy (Box 2.2). The three most im-portant developments were: the BaselCommittee’s new proposals on bank capital ade-quacy; the findings of the Lamfalussy Report onthe regulation of European securities markets;
and the European debate on the structure of fi-nancial supervision.32
CHAPTER II DEVELOPMENTS AND TRENDS IN MATURE CAPITAL MARKETS
30
Table 2.9. Key International Supervisory and Regulatory Initiatives
Institution Initiative/Document Date
Basel Committee on Banking Supervision Principles for the Management of Credit Risk; and Best September 2000Practices for Credit Risk DisclosureSupervisory Guidance for Managing Settlement Risk in September 2000Foreign Exchange TransactionsElectronic Group Initiatives and White Papers October 2000The New Basel Accord, and supporting documents January 2001Essential Elements of a Statement of Cooperation between May 2001Banking Supervisors
Basel Committee on Banking Supervision, and Review of Issues Relating to Highly Leveraged Institutions March 2001International Organization of Securities Commissions
Committee of Wise Men on the Regulation Final Report of the Committee of Wise Men on the Regulation February 2001of European Securities Markets of European Securities Markets (“Lamfalussy Report”)
Committee on Payment and Settlement Systems Core Principles for Systemically Important Payment Systems January 2001
Committee on Payment and Settlement Systems, Recommendations for Securities Settlement Systems January 2001and International Organization of Securities Commissions
Committee on the Global Financial System The Implications of Electronic Trading in Financial Markets January 2001Collateral in Wholesale Markets: Recent Trends, Risk March 2001Management, and Market Dynamics
EU Economic and Financial Committee Report on Financial Crisis Management (“Brouwer II Report”) April 2001
European Commission Communication on Upgrading the Investment Services Directive November 2000Draft Directive on Financial Collateral Arrangements March 2001Draft Directive on Prudential Supervision of Financial April 2001Conglomerates
Financial Stability Forum (FSF) The FSF held its fourth meeting at the BIS. It reviewed progress September 2000on the recommendations of the reports on highly leveraged institutions, capital flows, and offshore financial centers. The FSF held its fifth meeting in Washington and, among other March 2001things, discussed a working group report on enhanced disclosure.Progress in Implementing the Recommendations of the Working Group on Highly Leveraged Institutions (HLIs), note March 2001to the FSF by the Chairman of the HLI Working Group
Group of internationally active banks Agreed on the Wolfsberg anti-money laundering principles November 2000
Group of Ten, Working Party Report on Consolidation in the Financial Sector January 2001
United States The Commodity Futures Modernization Act of 2000 was December 2000 enacted. It re-authorized the Commodity Futures Trading Commission (CFTC), created a flexible structure for the regulation of futures trading, introduced single-stock futures, and provided legal certainty for swap contracts.
32Regulatory developments in Japan are discussed inAnnex I.
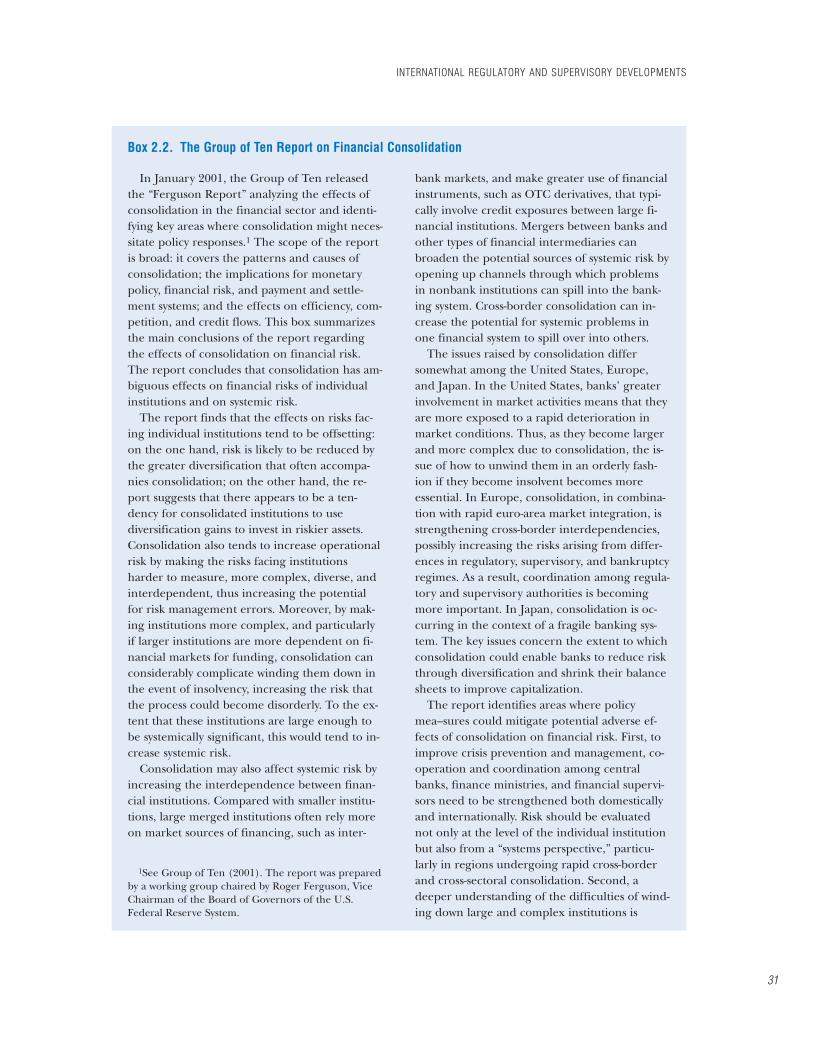
INTERNATIONAL REGULATORY AND SUPERVISORY DEVELOPMENTS
31
In January 2001, the Group of Ten releasedthe “Ferguson Report” analyzing the effects ofconsolidation in the financial sector and identi-fying key areas where consolidation might neces-sitate policy responses.1 The scope of the reportis broad: it covers the patterns and causes ofconsolidation; the implications for monetarypolicy, financial risk, and payment and settle-ment systems; and the effects on efficiency, com-petition, and credit flows. This box summarizesthe main conclusions of the report regardingthe effects of consolidation on financial risk.The report concludes that consolidation has am-biguous effects on financial risks of individualinstitutions and on systemic risk.
The report finds that the effects on risks fac-ing individual institutions tend to be offsetting:on the one hand, risk is likely to be reduced bythe greater diversification that often accompa-nies consolidation; on the other hand, the re-port suggests that there appears to be a ten-dency for consolidated institutions to usediversification gains to invest in riskier assets.Consolidation also tends to increase operationalrisk by making the risks facing institutionsharder to measure, more complex, diverse, andinterdependent, thus increasing the potentialfor risk management errors. Moreover, by mak-ing institutions more complex, and particularlyif larger institutions are more dependent on fi-nancial markets for funding, consolidation canconsiderably complicate winding them down inthe event of insolvency, increasing the risk thatthe process could become disorderly. To the ex-tent that these institutions are large enough tobe systemically significant, this would tend to in-crease systemic risk.
Consolidation may also affect systemic risk byincreasing the interdependence between finan-cial institutions. Compared with smaller institu-tions, large merged institutions often rely moreon market sources of financing, such as inter-
bank markets, and make greater use of financialinstruments, such as OTC derivatives, that typi-cally involve credit exposures between large fi-nancial institutions. Mergers between banks andother types of financial intermediaries canbroaden the potential sources of systemic risk byopening up channels through which problemsin nonbank institutions can spill into the bank-ing system. Cross-border consolidation can in-crease the potential for systemic problems inone financial system to spill over into others.
The issues raised by consolidation differsomewhat among the United States, Europe,and Japan. In the United States, banks’ greaterinvolvement in market activities means that theyare more exposed to a rapid deterioration inmarket conditions. Thus, as they become largerand more complex due to consolidation, the is-sue of how to unwind them in an orderly fash-ion if they become insolvent becomes moreessential. In Europe, consolidation, in combina-tion with rapid euro-area market integration, isstrengthening cross-border interdependencies,possibly increasing the risks arising from differ-ences in regulatory, supervisory, and bankruptcyregimes. As a result, coordination among regula-tory and supervisory authorities is becomingmore important. In Japan, consolidation is oc-curring in the context of a fragile banking sys-tem. The key issues concern the extent to whichconsolidation could enable banks to reduce riskthrough diversification and shrink their balancesheets to improve capitalization.
The report identifies areas where policymea–sures could mitigate potential adverse ef-fects of consolidation on financial risk. First, toimprove crisis prevention and management, co-operation and coordination among centralbanks, finance ministries, and financial supervi-sors need to be strengthened both domesticallyand internationally. Risk should be evaluatednot only at the level of the individual institutionbut also from a “systems perspective,” particu-larly in regions undergoing rapid cross-borderand cross-sectoral consolidation. Second, adeeper understanding of the difficulties of wind-ing down large and complex institutions is
Box 2.2. The Group of Ten Report on Financial Consolidation
1See Group of Ten (2001). The report was preparedby a working group chaired by Roger Ferguson, ViceChairman of the Board of Governors of the U.S.Federal Reserve System.
The Proposed New Basel Accord for BankCapital Adequacy
On January 16, 2001, the BCBS issued a con-sultative document for comment with the inten-tion of finalizing the new rules on capital ade-quacy by the end of the year and implementingthem in 2004.33 The document proposes signifi-cant adjustments to the 1988 Basel Accord’streatment of credit risk and operational risk.The new Basel Accord (“Basel II”) would be ap-plicable to “significant banks” and would rest onthree pillars: pillar 1 is designed to link capitalrequirements more closely to banking risks; pil-lar 2 strengthens the supervisory process overcapital standards; and pillar 3 seeks to enhancemarket discipline by improving disclosure stan-dards (Box 2.3).
The new framework is designed to align capi-tal requirements more closely with banks’ riskprofiles. It puts more responsibility on banks,more emphasis on the supervisory process, andmore reliance on market discipline, and, for thefirst time, introduces capital requirements foroperational risk. By providing banks and super-visors with several options for assessing capitaladequacy, Basel II would be much more com-plex than the current capital rules. The new
rules would apply, on a fully consolidated basis,to holding companies of banking groups andare designed to at least maintain the currentoverall level of regulatory capital in the bankingsystem.
Regulators expect that the new capital ade-quacy rules will reduce opportunities for regula-tory arbitrage. While under the 1988 Accordbanks have incentives to sell their high-qualitycredit exposures, the new rules should reducethese incentives because they raise the risk sensi-tivity of capital requirements and comprehen-sively recognize risk mitigation techniques. Atthe margin, however, Basel II may encouragebanks to keep higher quality credit exposures ontheir balance sheets and securitize lower qualitycredits. The new proposals will have importantimplications for some sovereign borrowers—inparticular, the risk weight of highly rated non-Organization for Economic Cooperation andDevelopment (OECD) countries would bemarkedly reduced. The proposed reliance onrating agencies, and particularly the use of inter-nal ratings, could reinforce the procyclicality ofcapital requirements to the extent that ratings-are based on borrowers’ current conditions. Butmore rigorous forward-looking assessments and
CHAPTER II DEVELOPMENTS AND TRENDS IN MATURE CAPITAL MARKETS
32
needed, including the potential consequencesof cross-border differences in bankruptcy, legal,and regulatory regimes. Contingency plans forunwinding complex institutions in an orderlyway could help improve crisis management.Third, as institutions become more complexand opaque, greater reliance on risk-based su-pervision is desirable to strengthen risk manage-ment and reduce incentives for excessive risktaking. Fourth, a consensus is needed on how to
deal with potential systemic effects that can arisefrom problems at non-bank financial institu-tions, including those that are part of financialconglomerates that contain banks, without exac-erbating moral hazard. Finally, to improve mar-ket discipline, disclosure needs to be strength-ened to make increasingly complex financialinstitutions more transparent—for example, bydeveloping accounting measures that better re-veal the actual risks facing institutions.
Box 2.2 (concluded)
33See Basel Committee on Banking Supervision (2001). The first consultative paper, Basel Committee on BankingSupervision (1999), was released in June 1999 (see Box 4.1 in IMF, 1999). In view of the numerous comments the BaselCommittee received and the range of specifics that still needed to be addressed, on June 25, 2001, the Committee modi-fied the timetable for completion and implementation of the new Accord. The Committee plans to finalize the new rulesin 2002 following another round of consultations, with implementation envisaged for 2005.

INTERNATIONAL REGULATORY AND SUPERVISORY DEVELOPMENTS
33
The proposals for a new Basel Accord thatwere released by the Basel Committee onBanking Supervision (BCBS) deal with creditand operational risk.1 The proposals rest onthree pillars: minimum capital requirements, en-hanced supervisory processes, and better marketdiscipline through more disclosure. TheCommittee views the principles of the three-pil-lar approach as applicable to all banks, but ex-pects the new Basel Accord to apply explicitlyonly to “significant banks.”
Pillar 1—minimum capital requirements. The BCBSproposed two approaches to assessing capital re-quirements for credit risk: a standardized ap-proach and an internal ratings-based (IRB) ap-proach. Under the new standardized approach,banks assign assets into risk-weighting bandsbased on ratings from eligible external credit as-sessment institutions, such as rating agenciesand export credit agencies (see table).2 For as-signing risk weights to claims on banks, nationalsupervisors have two options.3 Under optionone, claims on banks would receive risk weightsthat are one category less favorable than thoseof the banks’ home country sovereigns, with therisk weight capped at 100 percent for banks incountries that are unrated or rated BB+ to B–.Under option two, the risk weights would be de-termined by the banks’ own external credit rat-ings.
The current credit conversion factors for off-balance-sheet items would remain unchanged,but the 50 percent ceiling on risk weights of
OTC derivatives would be dropped and the riskweight on business commitments with a maturityof up to one year would be raised from zero to20 percent. The new approach also substantiallyrefines the treatment of risk mitigation tech-niques, such as credit derivatives and on-bal-ance-sheet netting, and extends the range ofrecognized collateral. The treatment of asset se-curitizations, a key area of regulatory arbitrage,has also been improved.
Banks with advanced risk measurement capa-bilities, given supervisory approval, can use oneof two IRB approaches. In the foundation ap-proach, a bank estimates the probability of de-fault for each of its different internal assetgrades, while estimates for other risk compo-nents, such as loss given default, are derivedfrom simple standardized supervisory rules. Inthe advanced approach, banks use their internalestimates for all risk components, including lossgiven default. These risk components aremapped into risk weights by a formula providedby the Basel Committee. In the foundation ap-proach, all exposures are assumed to have athree-year maturity, while the advanced ap-proach contains a maturity adjustment. A “gran-ularity adjustment” decreases or increases thecapital charge depending on whether a bank’sasset portfolio is more or less diversified thanaverage.
The Basel Committee proposes a separate capi-tal charge for operational risk. Proposed ap-proaches range in complexity from a basic indi-cator approach, in which a single variable such asgross income would serve as a proxy for a bank’srisk exposure, and a standardized approach, inwhich each business line of a bank would have aseparate operational risk indicator, to an internalmeasurement approach that would allow banks,subject to supervisory approval, to use internalmeasures of operational risk.
Pillar 2—enhanced supervisory processes. Intensifiedsupervisory reviews are intended to ensure thatbanks have sound internal processes to deter-mine capital adequacy based on careful risk as-sessments. Reviews would be guided by four
Box 2.3. Key Elements of the Proposed New Basel Accord for Bank Capital Adequacy
1See Basel Committee on Banking Supervision(2001). The 1996 Market Risk Amendment to the1988 Basel Accord would continue to apply, essentiallyunchanged.
2Under the 1988 Accord, risk weights on sovereignclaims are determined by membership in the Organi-zation for Economic Cooperation and Development(OECD)—zero risk weight for members, 100 percentweight for nonmembers.
3Currently, all short-term claims on banks (andlong-term claims on OECD-incorporated banks) areassigned a 20 percent risk weight, while long-termclaims on banks incorporated outside the OECD areweighted at 100 percent.
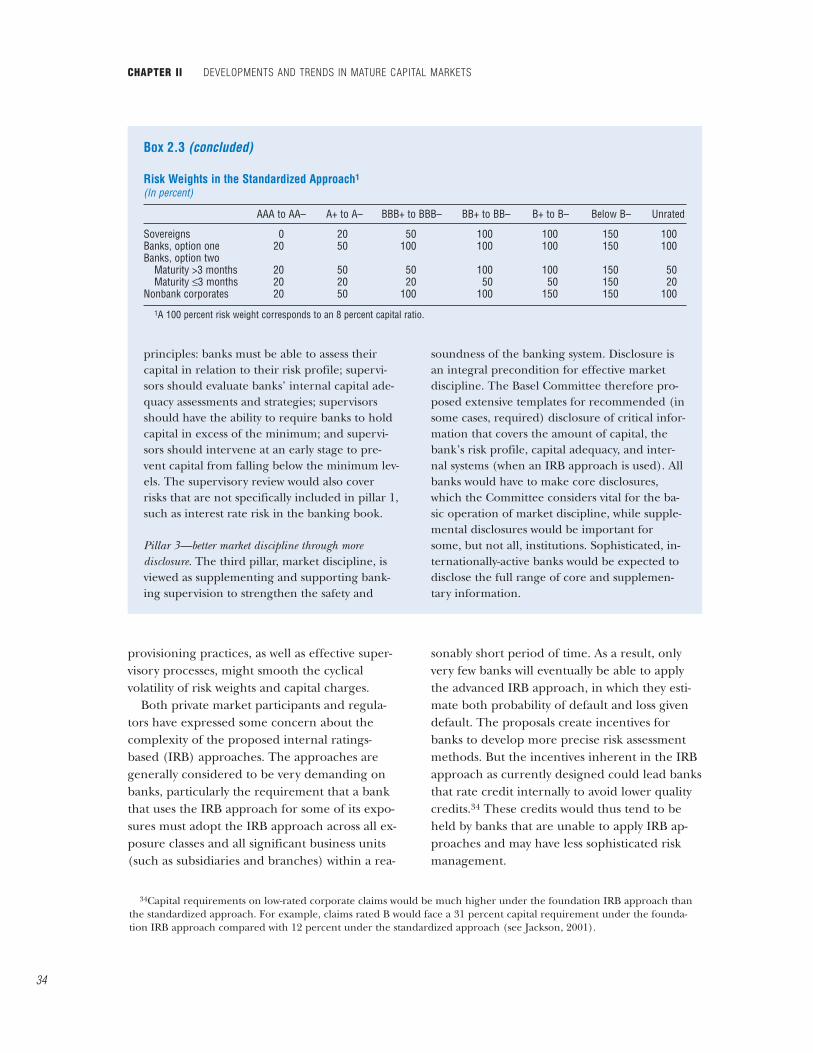
provisioning practices, as well as effective super-visory processes, might smooth the cyclicalvolatility of risk weights and capital charges.
Both private market participants and regula-tors have expressed some concern about thecomplexity of the proposed internal ratings-based (IRB) approaches. The approaches aregenerally considered to be very demanding onbanks, particularly the requirement that a bankthat uses the IRB approach for some of its expo-sures must adopt the IRB approach across all ex-posure classes and all significant business units(such as subsidiaries and branches) within a rea-
sonably short period of time. As a result, onlyvery few banks will eventually be able to applythe advanced IRB approach, in which they esti-mate both probability of default and loss givendefault. The proposals create incentives forbanks to develop more precise risk assessmentmethods. But the incentives inherent in the IRBapproach as currently designed could lead banksthat rate credit internally to avoid lower qualitycredits.34 These credits would thus tend to beheld by banks that are unable to apply IRB ap-proaches and may have less sophisticated riskmanagement.
CHAPTER II DEVELOPMENTS AND TRENDS IN MATURE CAPITAL MARKETS
34
principles: banks must be able to assess theircapital in relation to their risk profile; supervi-sors should evaluate banks’ internal capital ade-quacy assessments and strategies; supervisorsshould have the ability to require banks to holdcapital in excess of the minimum; and supervi-sors should intervene at an early stage to pre-vent capital from falling below the minimum lev-els. The supervisory review would also coverrisks that are not specifically included in pillar 1,such as interest rate risk in the banking book.
Pillar 3—better market discipline through moredisclosure. The third pillar, market discipline, isviewed as supplementing and supporting bank-ing supervision to strengthen the safety and
soundness of the banking system. Disclosure isan integral precondition for effective marketdiscipline. The Basel Committee therefore pro-posed extensive templates for recommended (insome cases, required) disclosure of critical infor-mation that covers the amount of capital, thebank’s risk profile, capital adequacy, and inter-nal systems (when an IRB approach is used). Allbanks would have to make core disclosures,which the Committee considers vital for the ba-sic operation of market discipline, while supple-mental disclosures would be important forsome, but not all, institutions. Sophisticated, in-ternationally-active banks would be expected todisclose the full range of core and supplemen-tary information.
Risk Weights in the Standardized Approach1
(In percent)
AAA to AA– A+ to A– BBB+ to BBB– BB+ to BB– B+ to B– Below B– Unrated
Sovereigns 0 20 50 100 100 150 100Banks, option one 20 50 100 100 100 150 100Banks, option two
Maturity >3 months 20 50 50 100 100 150 50Maturity ≤3 months 20 20 20 50 50 150 20
Nonbank corporates 20 50 100 100 150 150 100
1A 100 percent risk weight corresponds to an 8 percent capital ratio.
Box 2.3 (concluded)
34Capital requirements on low-rated corporate claims would be much higher under the foundation IRB approach thanthe standardized approach. For example, claims rated B would face a 31 percent capital requirement under the founda-tion IRB approach compared with 12 percent under the standardized approach (see Jackson, 2001).
A separate capital charge for operational riskwould be introduced for the first time. The capi-tal requirement for operational risk is not in-tended to raise the current overall level of regu-latory capital; instead, it is designed to broadlyoffset the reduction in capital allocated to creditrisk that might result from the new rules. TheCommittee envisages that about 20 percent ofthe total required capital may need to be held tocover operational risks. But the proposed meth-ods designed to capture operational risk, whichvary from a basic indicator approach (based ongross income as a proxy for operational risk) toan internal measurement approach, are some ofthe least developed parts of the proposed revi-sions. The Committee therefore intends to con-duct further studies to improve the risk sensitiv-ity of the operational risk framework and to findways to permit the recognition of operationalrisk mitigation techniques.
Pillar 2—enhanced supervisory review—hastwo important objectives: to ensure that a bank’scapital is consistent with its risk profile and over-all strategy, and to facilitate early intervention bysupervisors if capital does not provide a suffi-cient buffer in case a bank experiences financialstress. Enhanced supervision will place substan-tial demands on bank supervisors, particularly inassessing the banks’ internal models and ensur-ing their consistent implementation, since theproposed rules leave ample scope for supervi-sory discretion.
Pillar 3—disclosure and market discipline—ismeant to support supervisors in two respects.Market data can be useful for supervisory assess-ments; and market discipline might provide di-rect incentives to banks to maintain capital atlevels consistent with their risk profiles and over-all business strategies. Meaningful disclosure is akey precondition for market discipline, and stan-dard loan classifications, provisioning, and ac-counting rules may be required to ensure inter-national comparability.
Many elements of the latest proposals by theBasel Committee, such as the calibration of the
IRB approaches and the operational risk propos-als, reliable impact studies, and harmonized pro-visioning rules, are still work in progress. Thescope of the applicability of Basel II may yet beextended to all banks in all countries by design-ing a simplified version of the standardizedapproach.
The Lamfalussy Report: Modernizing EUSecurities Markets Regulation
While the integration of financial markets inthe European Union (EU) is progressing, key as-pects of the regulation of securities markets re-main fragmented. Recognizing the potentialbenefits of a single market for financial services,in July 2000, the EU’s Economic and FinanceMinisters (ECOFIN Council) established aCommittee of Wise Men on the Regulation ofEuropean Securities Markets, chaired byAlexandre Lamfalussy. The Committee’s report(the Lamfalussy Report), issued in February2001, concludes that the process of EU decisionmaking constitutes the main obstacle to a singlemarket for financial services.35 The current deci-sion-making framework is viewed as too slow, toorigid, too complex, and ill-adapted to the paceof global financial market developments.
The Lamfalussy Report proposed an acceler-ated decision-making and implementationprocess for European securities regulations thatwould separate political from technical deci-sions. At the top level (Level 1), only broad prin-ciples (“framework legislation”) would be en-acted—through the normal EU legislativeprocess that involves co-decisions by theEuropean Commission, the EU Council, and theEuropean Parliament. At the next level (Level2), a new high-level EU Securities Committeewould vote on regulatory rules proposed by theCommission based on these broad principlesand would decide on the technical implementa-tion. It would be supported by a new EUSecurities Regulators Committee. The extent oftechnical implementation powers delegated to
INTERNATIONAL REGULATORY AND SUPERVISORY DEVELOPMENTS
35
35See Committee of Wise Men (2001).
the Level 2 procedure (the so-called comitologypowers36) would be decided on a case-by-case ba-sis by the Council of Ministers and the EuropeanParliament. At Level 3, cooperation between na-tional regulators would be intensified to ensureconsistent transposition of the Level 1 and 2 de-cisions into national legislation and regulation.At Level 4, the enforcement of EU rules by theEuropean Commission would be strengthened.
The Lamfalussy Committee stopped short ofrecommending a pan-European securities regu-lator, because basic rules are not harmonizedacross countries. But the Committee urgedstrengthened cooperation between European fi-nancial market regulators and the institutions incharge of micro- and macro-prudential supervi-sion. It emphasized that there is a cost to themultitude of clearing and settlement systems inEurope but that, for the moment, any solutionshould be left to market forces.
The report also recommended advancingfrom 2005 to 2004 the completion of key ele-ments of the European Commission’s FinancialServices Action Plan, focusing on the followingpriority areas:• introducing a single passport for issuers and
modernizing listing requirements;• applying the home country principle (mutual
recognition) for wholesale markets and clearlydefining codes of conduct for professional in-vestors;
• modernizing rules for investment funds andpension funds;
• adopting international accounting standards;and
• introducing a single passport for recognizedstock exchanges.The Committee’s proposals face considerable
hurdles. The European Parliament is concernedthat the new legislative process could dilute itsright of co-decision making. The report ad-dresses these concerns by emphasizing opencommunication between the European Commis-sion and the European Parliament at every level
of the new legislative process. The StockholmEU summit in March 2001 approved a revisionto the procedural rules that would allow a major-ity of member states to ask the Commission toreconsider technical regulations drafted for con-sideration by the new committees.
The Evolving Framework for FinancialSupervision in Europe
Financial globalization, the blurring distinc-tions between different types of financial activi-ties, and the trend toward financial conglomer-ates that span commercial banking, investmentbanking, and insurance has ignited a debateabout how to most effectively organize financialsupervision. In Europe, the debate centers onthree questions. Should national central banksbe involved in financial supervision? At the na-tional level, should supervision remain with sep-arate agencies or be consolidated into a singlenational regulator? Should responsibilities for fi-nancial supervision remain national or becomepan-European?
The question about the involvement of centralbanks rests on the relative weights attached tothe three key functions of supervision: investorprotection, micro-prudential supervision, andmacro-prudential oversight. While stand-alonesupervisory agencies generally tend to empha-size investor protection and the soundness of in-dividual institutions (micro-prudential supervi-sion), central banks give high priority to systemicstability.
Proponents of independent supervisory au-thorities see potential conflicts between the ob-jectives of financial stability and monetary policy.The emergence of financial conglomerates thatinclude banks, securities firms, and insurancecompanies may also argue for separate agenciesbecause the central bank, whose traditional rolehas been in banking supervision, might not bethe best candidate for a single regulator. Assign-ing supervisory tasks that cover the entire finan-
CHAPTER II DEVELOPMENTS AND TRENDS IN MATURE CAPITAL MARKETS
36
36“Comitology” refers to the delegation of implementing powers by the Council to the Commission for the execution ofEU legislation (see Annex 5 in Committee of Wise Men, 2001).
cial system to the central bank, it is argued, couldalso lead to an undue concentration of power.
Nevertheless, the importance of financial sur-veillance by central banks is increasing becausethe nature of financial crises is changing: sys-temic risks may now be as likely to emerge in fi-nancial markets as they are to emerge within fi-nancial institutions. In the United Kingdom, theFinancial Services Authority (FSA) is the regula-tor of individual financial institutions, althoughone of its four statutory objectives is maintainingconfidence in the financial system. The Bank ofEngland (BoE) meanwhile is responsible for thestability of the financial system as a whole, al-though it has an interest in information on indi-vidual institutions when they raise systemic con-cerns.37 Given that its financial stability rolerequires surveillance of both domestic and inter-national markets, including the links between in-dividual institutions and financial markets, theBoE has devoted more resources to, andstrengthened, its surveillance of the financial sys-tem and its work on financial stability. Centralbanks have reason to claim that they require in-dependent access to prudential information tofulfill their mandates in the area of financial sta-bility. In particular, central banks may regard in-dependent access to information on systemicallyrelevant institutions as essential for crisis preven-tion and crisis management.38 For example, dur-ing financial crises it is critical that authoritieshave the necessary information to assess quicklywhether a financial institution that requiresemergency liquidity assistance is solvent.
For these reasons, euro-area national centralbanks (NCBs) and the ECB strongly supportplacing supervisory responsibilities with na-tional central banks. A recent paper by the ECBstates that “viewed from a Eurosystem perspec-tive, the attribution of extensive supervisory re-
sponsibilities to national central banks is likelyto prove beneficial.”39 The ECB advocates thatthe NCBs’ involvement also extend beyond thebanking sector since systemic concerns may in-creasingly stem from large financial conglomer-ates. To the extent that NCBs would be grantedwide-ranging operational involvement in pru-dential supervision, solutions other than the as-signment of direct responsibilities to NCBscould also be effective, in the ECB’s view.Conflict of interest concerns have been allevi-ated in the euro area by the transfer of mone-tary jurisdiction from NCBs to the ECB. TheECB also points out that NCBs, which are bothnational institutions and part of the Eurosystem,might be better positioned to address euro-areasupervisory issues than stand-alone nationalsupervisors.
On the second question—whether supervi-sion should remain with separate national agen-cies or be combined into one agency—the ap-propriate structure of supervision depends to alarge extent on the individual circumstances ineach country, including its legal traditions, thestructure of the financial sector, and the sizeand complexity of the markets involved. At thesame time, more and more countries are begin-ning to consider the single-regulator model,which already has been adopted in someScandinavian countries, Japan, and some othercountries. The adoption of the single-regulatorframework in the United Kingdom seems tohave raised interest in the model, although rele-vant secondary legislation has not yet been ap-proved and the system has not been tested attimes of distress.40
If the plans to reorganize financial supervisionin Germany proceed as envisaged, the balance ofthinking on the continent could shift further infavor of consolidated national supervision. The
INTERNATIONAL REGULATORY AND SUPERVISORY DEVELOPMENTS
37
37In addition, a Tripartite Standing Committee comprising the FSA, the Bank of England, and the Treasury monitorssystemic threats and meets at least monthly.
38In 10 of the 12 euro-area countries, national central banks are either directly responsible for, or heavily involved in,prudential supervision (see European Central Bank, 2001).
39See European Central Bank (2001).40See IMF (1998a), Box 5.9, p. 142. The U.K. FSA is expected to have all the powers of a unified financial services regu-
lator conferred on it, effective November 2001.
German government plans to merge the federalsupervisory offices for banking, insurance, andsecurities. The plan, however, would not strictlyfollow the single-regulator model. Moreover, ow-ing to features of the German legal system, thenew regulatory agency would have less extensivepowers than the U.K. FSA. Although the newagency would integrate supervision of banks, se-curities firms, and insurance companies, the frag-mented oversight of stock exchanges by the localstate regulators would remain, largely for politi-cal reasons. Importantly, the close relationshipbetween the Federal Banking Supervisory Officeand the Bundesbank (German central bank) willlikely remain a key part of the reorganizedframework, although exact arrangements are notyet clear. It is also unresolved whether theBundesbank’s consent in banking policy matterswould continue to be required.
As to the question of whether responsibilitiesfor financial supervision should remain nationalor become pan-European, national central banksand regulators generally oppose a central super-visor at the EU or euro-area level. By its very na-ture, they point out, supervision is deeply rootedin the diverse national legal and regulatory sys-tems. Therefore, decision making should remaindecentralized to reflect the financial architecturein each country. Even European-wide supervi-sion of the largest financial institutions is consid-ered unlikely in the near term because a num-ber of preconditions might need to be metbefore an international regulator could be con-sidered. For instance, pan-European bankswould need to exist and Europe might need tomove closer to a federalist structure. However, asa recent report by the EU Economic andFinancial Committee (the “Brouwer II Report”)indicated, close cross-border coordination mightbe required, particularly during a crisis at a ma-jor financial institution.41
A hybrid system akin to the arrangements forsupervision of financial holding companies inthe United States might be conceivable at theeuro-area level. Although the U.S. FederalReserve, as umbrella supervisor, is expected torely as much as possible on the examinations byfunctional regulators (such as other banking reg-ulators or securities regulators), it has the author-ity under specific circumstances to examine affili-ates of a financial holding company.42 Similarly,in cooperation with national supervisors, theECB could supervise the largest financial institu-tions that comprise the core of the euro-area pay-ments system. But such an arrangement wouldrequire unanimous EU Treaty amendments thatare unlikely any time soon. It would also raisequestions about whether the ECB would needmore—or less—authority over euro-area banks inthis role than the Federal Reserve currently hasover functionally regulated institutions in its roleas umbrella supervisor.
ReferencesBank for International Settlements, 2001a,
International Banking and Financial Market
Developments (Basel, June).
———, 2001b, Press Release: Slowdown of the OTC
Derivatives Market in the Second Half of 2000 (Basel,
May).
Basel Committee on Banking Supervision, 1999, A
New Capital Adequacy Framework (Basel: Bank for
International Settlements).
———, 2001, The New Basel Capital Accord (Basel: Bank
for International Settlements).
Breuer, Peter, 2000, “Measuring Off-Balance-Sheet
Leverage,” IMF Working Paper 00/202
(Washington: International Monetary Fund).
Brooks, Robin, and Luis Catão, 2000, “The New Econ-
omy and Global Stock Returns,” IMF Working Paper
00/216 (Washington: International Monetary Fund).
CHAPTER II DEVELOPMENTS AND TRENDS IN MATURE CAPITAL MARKETS
38
41See European Union, Economic and Financial Committee (2001), p. 13. Cross-border cooperation may be difficult,since, as the report notes, “[t]he relevant EU directives do not impose an obligation for sharing information in crisis situa-tions” and “certain supervisory authorities do not consider themselves as being entitled to share information on major fi-nancial institutions on a regular basis in a multilateral context solely for the purpose of monitoring financial stability.”
42The Gramm-Leach-Bliley Act, the basis for the U.S. Federal Reserve’s role as umbrella supervisor, is described in Box2.2 in IMF (2000).

Campbell, John Y., Andrew W. Lo, and A. Craig
MacKinlay, 1997, The Econometrics of Financial Markets
(Princeton, New Jersey: Princeton University Press).
Committee of Wise Men, 2001, Final Report of the
Committee of Wise Men on the Regulation of European
Securities Markets (Brussels).
European Central Bank, 2001, The Role of Central Banks
in Prudential Supervision (Frankfurt).
European Union, Economic and Financial Committee,
2001, Report on Financial Crisis Management (Brussels).
Financial Stability Forum, 2001, “Progress in
Implementing the Recommendations of the
Working Group on Highly Leveraged Institutions
(HLIs),” note to the FSF by the Chairman of the
HLI Working Group (Basel, March). Available via
the Internet: http://www.fsforum.org/Reports/
RepHLIprog.html
Gordon, Myron, 1962, The Investment, Financing, and
Valuation of the Corporation (Homewood, Illinois:
Irwin).
Group of Ten, 2001, Report on Consolidation in the
Financial Sector (Basel: Bank for International
Settlements).
International Monetary Fund, 1998a, International
Capital Markets: Developments, Prospects, and Key Policy
Issues, World Economic and Financial Surveys
(Washington).
———, 1998b, World Economic Outlook and International
Capital Markets: Interim Assessment, World Economic
and Financial Surveys (Washington).
———, 1999, International Capital Markets:
Developments, Prospects, and Key Policy Issues, World
Economic and Financial Surveys (Washington).
———, 2000, International Capital Markets:
Developments, Prospects, and Key Policy Issues, World
Economic and Financial Surveys (Washington).
———, 2001a, Emerging Market Financing: Quarterly
Report on Developments and Prospects, Second Quarter
2001 (Washington).
———, 2001b, World Economic Outlook, May 2001: A
Survey by the Staff of the International Monetary Fund,
World Economic and Financial Surveys
(Washington).
Jackson, Patricia, 2001, “Bank Capital Standards: The
New Basel Accord,” Bank of England Quarterly
Bulletin (Spring), pp. 55–63.
Japan Securities Research Institute, 2000, Securities
Market in Japan 2001 (Tokyo).
Mehra, Rajnish, and Edward C. Prescott, 1985, “The
Equity Premium: A Puzzle,” Journal of Monetary
Economics, Vol. 15, No. 2 (March), pp. 145–61.
“Unburdening,” 2001, The Economist (London), May
12, pp. 71–72.
United States, Board of Governors of the Federal
Reserve System, 2000, Senior Loan Officer Opinion
Survey on Lending Practices (Washington).
———, 2001, “Monetary Policy Report to the
Congress,” report submitted to the Congress on
February 13, Federal Reserve Bulletin (Washington,
March), p. 103–31.
REFERENCES
39