Embed Size (px)
Citation preview

Developmental PharmacologyDevelopmental PharmacologyScaling adult doses to infants based on body weight Scaling adult doses to infants based on body weight or surface area does not account for developmental or surface area does not account for developmental changes that affect drug disposition or tissue/organ changes that affect drug disposition or tissue/organ
sensitivity.sensitivity.
Frank Balis, M.D.Frank Balis, M.D.February 19, 2009February 19, 2009

ChloramphenicolChloramphenicol
•• Natural product of Natural product of StreptomycesStreptomyces (1947)(1947)
•• Inhibits protein synthesis (Inhibits protein synthesis (bacteriostaticbacteriostatic))
•• Eliminated by Eliminated by glucuronideglucuronide
conjugation (90%) conjugation (90%) and renal excretion (<10%)and renal excretion (<10%)
•• Nursery infections treated with high dosesNursery infections treated with high doses
O2N
NCl
Cl
O
OHH
HOH
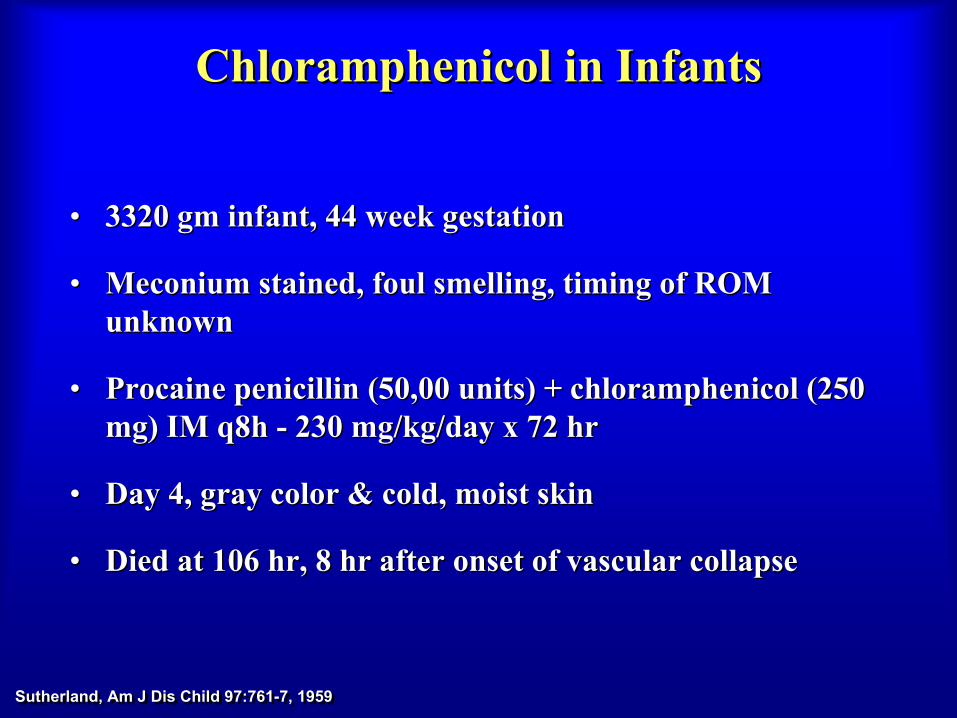
ChloramphenicolChloramphenicol
in Infantsin Infants
•• 3320 gm infant, 44 week gestation3320 gm infant, 44 week gestation
•• MeconiumMeconium
stained, foul smelling, timing of ROM stained, foul smelling, timing of ROM unknownunknown
•• Procaine penicillin (50,00 units) + Procaine penicillin (50,00 units) + chloramphenicolchloramphenicol
(250 (250 mg) IM q8h mg) IM q8h --
230 mg/kg/day x 72 hr230 mg/kg/day x 72 hr
•• Day 4, gray color & cold, moist skinDay 4, gray color & cold, moist skin
•• Died at 106 hr, 8 hr after onset of vascular collapseDied at 106 hr, 8 hr after onset of vascular collapse
Sutherland, Am J Dis
Child 97:761-7, 1959Sutherland, Am J Dis
Child 97:761-7, 1959

ChloramphenicolChloramphenicol
in Premature Infantsin Premature Infants
All Infants 2001-2500 gmn Deaths n Deaths
No antibiotics 32 6 17 1Pen + strep 33 6 24 0
Chloramphenicol 30 19 16 8Pen + strep +
chloramphenicol 31 21 15 6
Burns et al., NEJM 261:1318Burns et al., NEJM 261:1318--21, 195921, 1959
Premature infants born Premature infants born ≥≥24 hrs after ROM24 hrs after ROM

Gray Baby SyndromeGray Baby Syndrome
0 10 20 30 40 50 60 70 80
No AntibioticsPen + StrepChloramphenicol
% of Infants% of Infants
JaundiceJaundiceVomitingVomiting
AnorexiaAnorexia
Resp. distressResp. distressAbdAbd. distention. distention
CyanosisCyanosis
Green stoolsGreen stools
LethargyLethargy
Ashen colorAshen color
DeathDeath
44
4.14.1
4.34.3
4.54.5
4.64.6
4.74.7
55
5.35.3
5.75.7
Burns et al., NEJM 261:1318Burns et al., NEJM 261:1318--21, 195921, 1959

ChloramphenicolChloramphenicol
Blood LevelsBlood Levels
0
50
100
150
200
0 1 2 3 4Day of LifeDay of Life
Total Nitro Total Nitro Compounds Compounds
[[µµg/ml]g/ml]
Therapeutic rangeTherapeutic range
ChloramphenicolChloramphenicol
dosesdoses
Burns et al., NEJM 261:1318-21, 1959Burns et al., NEJM 261:1318-21, 1959

ChloramphenicolChloramphenicol
PharmacokineticsPharmacokinetics
Weiss et al., NEJM 262:787-94, 1960Weiss et al., NEJM 262:787-94, 1960
4
6
810
30
50
0 12 24 36 48 60
Time [hr]Time [hr]
Total Nitro Total Nitro Compounds Compounds
[[µµg/ml]g/ml]
44--5 yrs. (n=3)5 yrs. (n=3)
11--2 days (n=5)2 days (n=5)
1010--16 days (n=3)16 days (n=3) tt1/21/2
--
26 hrs26 hrs
tt1/21/2
--
4 hrs4 hrs
tt1/21/2
--
10 hrs10 hrs

Repeated AdministrationRepeated Administration
0
5
10
15
20
25
30
0 5 10 15 20 25 30
Weiss et al., NEJM 262:787-94, 1960Weiss et al., NEJM 262:787-94, 1960Day of LifeDay of Life
Total Nitro Total Nitro Compounds Compounds
[[µµg/ml]g/ml]

Drug Use in Infants and ChildrenDrug Use in Infants and Children
•• Scaling adult doses based on body weight or surface Scaling adult doses based on body weight or surface area does not account for developmental changes that area does not account for developmental changes that affect drug disposition or tissue/organ sensitivity.affect drug disposition or tissue/organ sensitivity.
•• Pharmacologic impact of developmental changes are Pharmacologic impact of developmental changes are often discovered when unexpected or severe toxicity in often discovered when unexpected or severe toxicity in infants and children leads to detailed pharmacologic infants and children leads to detailed pharmacologic studies.studies.
•• Therapeutic tragedies could be avoided by performing Therapeutic tragedies could be avoided by performing pediatric pharmacologic studies during the drug pediatric pharmacologic studies during the drug development process (before widedevelopment process (before wide--spread use of agents spread use of agents in infants and children).in infants and children).

ZidovudineZidovudine
•• Synthetic nucleoside analogSynthetic nucleoside analog
•• Inhibits HIV reverse transcriptaseInhibits HIV reverse transcriptase
•• Eliminated by Eliminated by glucuronideglucuronide
conjugation (67%) and conjugation (67%) and renal excretion (33%)renal excretion (33%)
•• PerinatalPerinatal
therapy to prevent HIV transmissiontherapy to prevent HIV transmission
O
O
O
CH3HN
NHOCH2
N3

ZidovudineZidovudine
in the Newbornin the Newborn
0
1
2
3
4
5
6
7
0.1 1 10
Age [weeks]Age [weeks]
ZDV AUC ZDV AUC [[µµgg••hr/ml]hr/ml]
Boucher et al., J Boucher et al., J PediatrPediatr
122:137122:137--44, 199344, 1993

ZidovudineZidovudine
in Newbornsin Newborns
GroupAge
(days)Clearance(ml/min/kg)
t1/2(hr)
F(%)
Preterm 5.5 2.5 7.217.7 4.4 4.4
Term ² 14 10.9 3.1>14 19.0 1.9
Age GroupClearance(ml/min/kg)
t1/2(hr)
F(%)
1-13 yrs 24 1.5 68Adults 21 1.1 63
Boucher et al., J Boucher et al., J PediatrPediatr
125:642125:642--9, 19949, 1994MirochnickMirochnick
et al., et al., AntimicrobAntimicrob
Agents Agents ChemotherChemother
42:80842:808--12, 199812, 1998Balis et al., J Balis et al., J PediatrPediatr
114:880114:880--4, 19894, 1989KleckerKlecker
et al., Clin et al., Clin PharmacolPharmacol
TherTher
41: 40741: 407--12, 198712, 1987

Prevention of Vertical TransmissionPrevention of Vertical Transmission
•• Randomized, doubleRandomized, double--blind, placebo controlled blind, placebo controlled trialtrial
•• Rate of vertical transmission was the primary Rate of vertical transmission was the primary endpointendpoint
•• ZidovudineZidovudine/placebo regimen/placebo regimen–– Mothers: 100 mg of ZDV Mothers: 100 mg of ZDV antepartumantepartum
orally, 5 orally, 5
times daily, and then continuous infusion of 1 times daily, and then continuous infusion of 1 mg/kg/hr during labor and deliverymg/kg/hr during labor and delivery
–– Infants: 2 mg/kg orally every 6 hours for 6 weeks, Infants: 2 mg/kg orally every 6 hours for 6 weeks, beginning 8beginning 8--12 hours after birth.12 hours after birth.

Prevention of HIV TransmissionPrevention of HIV Transmission
Zidovudine Placebo
AGE >32 WEEKS
Number 121 127HIV-infected 9 31
Rate (%) 7.4 24.4AGE ³ 1 YEAR
Number 83 89HIV-infected 7 20
Rate (%) 8.4 22.50 3 6 9 12 15 18
0
1
2
3
6
12
Hemoglobin [g/dl]Hemoglobin [g/dl]
Age Age [weeks][weeks]
ZidovudineZidovudinePlaceboPlacebo
Connor et al., NEJM 331:1173Connor et al., NEJM 331:1173--80, 199480, 1994

Ontogeny and PharmacologyOntogeny and Pharmacology
•• Excretory organ (liver and kidneys) Excretory organ (liver and kidneys) development has the greatest impact on drug development has the greatest impact on drug disposition (pharmacokinetics)disposition (pharmacokinetics)
•• The most dramatic changes occur during the The most dramatic changes occur during the first days to months of lifefirst days to months of life
•• Anticipate ageAnticipate age--related differences in drug related differences in drug disposition based on knowledge of ontogenydisposition based on knowledge of ontogeny
•• Effect of ontogeny on tissue/organ sensitivity to Effect of ontogeny on tissue/organ sensitivity to drugs (drugs (pharmacodynamicspharmacodynamics) is poorly studied) is poorly studied
•• Disease states may alter a drugDisease states may alter a drug’’s PK/PDs PK/PD

•• GlomerularGlomerular
filtration ratefiltration rate–– Low at birthLow at birth
••
Full term newborn Full term newborn --
1010--15 ml/min/m15 ml/min/m22
••
Premature Premature --
55--10 ml/min/m10 ml/min/m22
–– GFR doubles by 1 week of ageGFR doubles by 1 week of age–– Adult values by 6Adult values by 6--12 months of age12 months of age
•• Tubular functionTubular function–– SecretorySecretory
function impaired at birthfunction impaired at birth
–– GlomerulotubularGlomerulotubular
imbalanceimbalance–– Adult values by 1 year of ageAdult values by 1 year of age
Renal OntogenyRenal Ontogeny

GlomerularGlomerular
Filtration RateFiltration Rate
0
20
40
60
80
100
120
140
160
0 2 4 6 8 10 12 14
GFR GFR [ml/min/1.73 m[ml/min/1.73 m22]]
Age [months]Age [months]Aperia, Acta
Pædiatr
Scand 64:393-8, 1975Aperia, Acta
Pædiatr
Scand 64:393-8, 1975

0
10
20
30
40
50
60
0 5 10 15 20 25
GFR in InfantsGFR in Infants
GFR GFR [ml/min/1.73 m[ml/min/1.73 m22]]
Age [days]Age [days]GuignardGuignard, J , J PediatrPediatr
87:26887:268--72, 197572, 1975

0.04 0.06 0.08 0.1 0.12
0-2 days
3-7 days
�8 days
GentamicinGentamicin
ClearanceClearance
Postnatal Postnatal AgeAge
GentamicinGentamicin
Clearance [L/kgClearance [L/kg••hr]hr]
Premature (<37 weeks)Premature (<37 weeks)
Full termFull term
Pons, Ther
Drug Monit
10:421-7, 1988Pons, Ther
Drug Monit
10:421-7, 1988

•• Phase 1 Phase 1 (oxidation, hydrolysis, reduction, (oxidation, hydrolysis, reduction, demethylationdemethylation))
–– Activity low at birthActivity low at birth–– Mature at variable ratesMature at variable rates
••
Oxidative metabolism increases rapidly after birthOxidative metabolism increases rapidly after birth••
Alcohol Alcohol dehydrogenasedehydrogenase
reaches adult levels at 5 yrsreaches adult levels at 5 yrs
–– Activity in young children exceeds adult levelsActivity in young children exceeds adult levels
•• Phase 2Phase 2
(conjugation, (conjugation, acetylationacetylation, , methylationmethylation))
–– Conjugation:Conjugation:••
GlucuronidationGlucuronidation
↓↓
at birthat birth••
SulfatationSulfatation
↑↑
at birthat birth
–– AcetylationAcetylation
↓↓
at birth, at birth, ““fastfast””
or or ““slowslow”” phenotype by 12phenotype by 12--15 mo.15 mo.
Hepatic OntogenyHepatic Ontogeny

CytochromeCytochrome
P450 (CYP) EnzymesP450 (CYP) Enzymes
•• SuperfamilySuperfamily
of Phase 1 enzymes (oxidation, of Phase 1 enzymes (oxidation, demethylationdemethylation))
•• Nomenclature:Nomenclature:
•• 17 Families and 39 subfamilies in humans17 Families and 39 subfamilies in humans
•• CYP1, CYP2, CYP3 are primary drug metabolizing CYP1, CYP2, CYP3 are primary drug metabolizing enzymesenzymes
•• Half of all drugs metabolized by CYP3A subfamilyHalf of all drugs metabolized by CYP3A subfamily
•• CYP3A4 is most abundant hepatic P450 enzyme and CYP3A4 is most abundant hepatic P450 enzyme and metabolizes at least 50 drugsmetabolizes at least 50 drugs
CYP3A4CYP3A4Family (>40%)Family (>40%) Subfamily (>55%)Subfamily (>55%)
IsoformIsoform

CYP OntogenyCYP Ontogeny
0
30
60
90
120
150
180
<24
hr
1-7
days
8-28
day
s
1-3
mo
3-12
mo
1-10
yr
Ontogeny of CYP Enzymes
CYP3A4CYP1A2CYP2D6UGT2B7
Perc
ent A
dult
Act
ivity
Kearns GL et al. NEJM 349: 1157, 2003Kearns GL et al. NEJM 349: 1157, 2003

CYP2E1 OntogenyCYP2E1 Ontogeny
0
20
40
60
80
100
3rd
trim
este
r
0-30
day
s
31-9
0 da
ys
91 d
-18
yr
CYP2E1 Ontogeny
CY
P2E
1 [%
Adu
lt L
evel
]

CYP3A OntogenyCYP3A Ontogeny
0
0.5
1
1.5
0
0.05
0.1
0.15
<3
0w
<3
0w
>3
0w
>3
0w
<2
4h
<2
4h
11--
7d
7d
88--
28
d2
8d
11--
3m
o3
mo
33--
12
mo
12
mo
>1
yr
>1
yr
Ad
ul
tA
du
lt
FetusFetusPostnatal AgePostnatal Age
CYP3A7 CYP3A7 ActivityActivity
CYP3A4 CYP3A4 ActivityActivity
LaCroixLaCroix
D et al. D et al. EurEur
J J BiochemBiochem
247:625, 1997247:625, 1997

0.30.3
0.750.75
1.61.6
1.81.8
G:SG:S
Acetaminophen MetabolismAcetaminophen Metabolism
0 20 40 60 80 100
Newborn
3-9 years
12 years
Adults
AcetaminophenGlucuronideSulfate
Miller et al., Clin Pharmacol
Ther
19:284-94, 1976Miller et al., Clin Pharmacol
Ther
19:284-94, 1976
0.150.15
0.170.17
0.190.19
0.180.18
kkelel
% of Dose% of Dose

TheophyllineTheophylline
Urinary MetabolitesUrinary Metabolites
0 20 40 60 80 100
28-32 weeks
40-50 weeks
2-3 years
4-9 years
10-16 years
TheophyllineCaffiene3-MeX1-MeUA1,3-diMeUA
% Recovered in Urine% Recovered in Urine
PostPost--
conception conception
AgeAge
Age Age RangeRange
Clearance Clearance [ml/min/kg][ml/min/kg]
2020
7070
100100

Factors Affecting Drug DistributionFactors Affecting Drug Distribution
•• Physicochemical properties of the drugPhysicochemical properties of the drug
•• Cardiac output/Regional blood flowCardiac output/Regional blood flow
•• Degree of protein/tissue bindingDegree of protein/tissue binding
•• Body compositionBody composition–– Extracellular waterExtracellular water
–– Adipose tissueAdipose tissue

Ontogeny of Body CompositionOntogeny of Body Composition
% of Total Body Weight% of Total Body Weight
EC HEC H22
OO IC HIC H22
OOProteinProtein OtherOther
FatFat
0 20 40 60 80 100
Premature
Newborn
4 mo
12 mo
24 mo
36 mo
Adult
Kaufman, Pediatric Pharmacology (Kaufman, Pediatric Pharmacology (YaffeYaffe
& & ArandaAranda, , edseds) pp. 212) pp. 212--9, 19929, 1992

Volume of Distribution of SulfaVolume of Distribution of Sulfa
0 0.1 0.2 0.3 0.4 0.5
Newborn
Infant
Children
Adults
Elderly
Volume of Distribution [L/kg]Volume of Distribution [L/kg]Routledge, J Antimicrob
Chemother
34 Suppl
A:19-24, 1994Routledge, J Antimicrob
Chemother
34 Suppl
A:19-24, 1994

Tissue and Organ WeightTissue and Organ Weight
% of Total Body WeightFetus Newborn Adult
Skeletal muscle 25 25 40Skin 13 4 6
Skeleton 22 18 14Heart 0.6 0.5 0.4Liver 4 5 2
Kidneys 0.7 1 0.5Brain 13 12 2
% of Total Body WeightFetus Newborn Adult
Skeletal muscle 25 25 40Skin 13 4 6
Skeleton 22 18 14Heart 0.6 0.5 0.4Liver 4 5 2
Kidneys 0.7 1 0.5Brain 13 12 2

Plasma ProteinsPlasma Proteins
Change from Adult ValuesNewborn Infant Child
Total protein ↓ ↓ =
Albumin ↓ = =
α1-Acid glycoprotein ↓ =
Fetal albumin Present Absent AbsentGlobulin ↓ ↓ =

Protein Binding in Cord and Adult PlasmaProtein Binding in Cord and Adult Plasma
Plasma Protein Binding (%)Cord Adult
Acetominophen 36.8 47.5Chloramphenicol 31 42
Morphine 46 66Phenobarbital 32.4 50.7
Phenytoin 74.4 85.8Promethazine 69.8 82.7
Kurz
et al., Europ
J Clin Pharmacol
II:463-7, 1977Kurz
et al., Europ
J Clin Pharmacol
II:463-7, 1977
30.230.2 17.317.3

CSF MTX and AgeCSF MTX and Age
0.001
0.01
0.1
1
10
1 2 3 4 5 6 7 8 9
AdultsAdolescentsChildren
Time [days]Time [days]
CSF Methotrexate
[µM]
CSF Methotrexate
[µM]
Bleyer, Cancer Treat Rep 61:1419-25, 1977Bleyer, Cancer Treat Rep 61:1419-25, 1977

CNS Growth and DevelopmentCNS Growth and Development
Birth 4 8 12 16 20 24
20
40
60
80
100
Age [yrs]Age [yrs]
Adult Value
[%]
Adult Value
[%]
CNS VolumeCNS Volume
Body Surface AreaBody Surface Area
Bleyer, Cancer Treat Rep 61:1419-25, 1977Bleyer, Cancer Treat Rep 61:1419-25, 1977

Adaptive IT MTX Dosing RegimenAdaptive IT MTX Dosing Regimen
AGE [YRS] MTX DOSE [MG]<1 61 82 10³ 3 12
Bleyer, Cancer Treat Rep 61:1419-25, 1977Bleyer, Cancer Treat Rep 61:1419-25, 1977

Dose Change with Adaptive RegimenDose Change with Adaptive Regimen
0
-25
+25
+50
+75
1.5 4 7 10 13
Age [yrs]Age [yrs]
% Change in Dose
% Change in Dose
Adaptive dose12 mg/m2
dose X 100
Bleyer, J Clin Oncol
1:317-25, 1983Bleyer, J Clin Oncol
1:317-25, 1983

Effect of Adaptive IT Dosing on OutcomeEffect of Adaptive IT Dosing on Outcome
Incidence ofCNS Relapse
[%]
MTX Dose Based on BSA
MTX Dose Based on Age
Age [months]
Concurrent
Isolated
0
10
0
10
20
<18 18-
35
36-
83
84-
119
≥12
Bleyer, J Clin Oncol
1:317-25, 1983Bleyer, J Clin Oncol
1:317-25, 1983

Dosing Based on Body Surface AreaDosing Based on Body Surface Area•• BSA = 2BSA = 2--dimensional surface area of the skindimensional surface area of the skin
•• Estimated from formulas using weight & heightEstimated from formulas using weight & height
•• Correlation between BSA and kidney/liver Correlation between BSA and kidney/liver function is weakfunction is weak
•• BSA dosing evolved from scaling doses from BSA dosing evolved from scaling doses from animals to humans (toxicology)animals to humans (toxicology)
SpeciesSpecies Wt [kg]Wt [kg] BSA [mBSA [m22]] Dose [mg]Dose [mg] Dose [mg/kg]Dose [mg/kg] Dose [mg/mDose [mg/m22]]MouseMouse 0.0180.018 0.00750.0075 0.0270.027 1.51.5 3.63.6
RatRat 0.250.25 0.0450.045 0.1250.125 0.50.5 2.82.8
InfantInfant 88 0.40.4 1.251.25 0.150.15 3.13.1
ChildChild 2020 0.80.8 2.52.5 0.120.12 3.13.1
AdultAdult 7070 1.851.85 5.05.0 0.070.07 2.72.7
PinkelPinkel, Cancer Res 18:853, 1958, Cancer Res 18:853, 1958

Liver Function (Children)Liver Function (Children)
MurryMurry
et al. Drug et al. Drug MetabMetab
DispDisp
23:1110, 199523:1110, 1995
400
600
800
1000
1200
1400
1600
1800
0.5 1 1.5 2
BSA [mBSA [m22]]
Liver Liver VolVol
[ml][ml]
rr22=0.75=0.750
10
20
30
40
50
0.5 1 1.5 2
AntipyrineAntipyrine
CL CL [ml/min][ml/min]
rr22=0.04=0.04

Excretory Organ GrowthExcretory Organ Growth
Age [yr]Age [yr]
Liver Liver [g][g]
Kidney Kidney [g/m[g/m22]]
Kidney Kidney [g/kg][g/kg]
Kidney Kidney [g][g]
Liver Liver [g/m[g/m22]]
Liver Liver [g/kg][g/kg]
0
500
1000
1500
0
50
100
150
200
250
300
0 3 6 9 12 15 18400
500
600
700
800
900
115
120
125
130
135
140
145
150
155
0 3 6 9 12 15 1820
25
30
35
3
4
5
6
7
0 3 6 9 12 15 18

Body Weight:Surface AreaBody Weight:Surface Area
0
5
10
15
20
25
30
35
40
0 5 10 15 20 25Age [yrs]Age [yrs]
WeightWeightBSABSA
AdultAdult1 mg/kg = 40 mg/m1 mg/kg = 40 mg/m22
Dose = 70 mgDose = 70 mg
1 y.o.1 y.o.1 mg/kg = 10 mg1 mg/kg = 10 mg
40 mg/m40 mg/m22
= 18 mg= 18 mg

Anticancer Drug ClearanceAnticancer Drug Clearance
McLeod et al., Br J Cancer 66 (Suppl. 18):S23McLeod et al., Br J Cancer 66 (Suppl. 18):S23--S29, 1992S29, 1992
DRUGROUTE OF
ELIMINATIONCLINFANTS VSCLCHILDREN DOSING
Methotrexate R ↓ (15%) No adjustmentsMercaptopurine M ND No adjustments
Vincristine M ↓ (/m2) <1 yo, dose/kgVM26/VP16 M ND (/m2) No adjustments (/m2)
Doxorubicin B, M ↓ (/m2) <2 yo, dose/kg or↓Źdose/m2
Cytarabine M ND No adjustment

VincristineVincristine
ClearanceClearance
0 100 200 300 400 500
Infants
Children
Adolescents
0 5 10 15 20 25
Infants
Children
Adolescents
VincristineVincristine
Clearance Clearance [ml/min/[ml/min/mm22]]
VincristineVincristine
Clearance Clearance [ml/min/[ml/min/kgkg]]
CromCrom
et al., J et al., J PediatrPediatr
125:642125:642--9, 19949, 1994

EtoposideEtoposide
ClearanceClearance
0
5
10
15
20
25
30p = 0.5
<1 yr(n=5)
>1 yr(n=25)
<1 yr(n=5)
>1 yr(n=25)
p = 0.004
0
1.2
0.8
0.4
EtoposideEtoposideClearanceClearance
[ml/min/[ml/min/mm22]]
EtoposideEtoposideClearanceClearance[ml/min/[ml/min/kgkg]]

Doxorubicin ClearanceDoxorubicin Clearance
10
20
30
40
50
60
70
80
90
<2 yr(n=8)
>2 yr(n=52)
p = 0.39
0
500
1000
1500
2000
2500
<2 yr(n=8)
>2 yr(n=52)
p = 0.015
DoxorubicinDoxorubicinClearanceClearance
[ml/min/[ml/min/mm22]]
DoxorubicinDoxorubicinClearanceClearance[ml/min/[ml/min/kgkg]]

Oral Oral BusulfanBusulfan
(16(16--30 mg/kg)30 mg/kg)
0
200
400
600
800
1000
1200
1400
0 10 20 30 40 50 60
EngraftmentEngraftment
Graft rejectionGraft rejection
Age [yrs]Age [yrs]
BusulfanBusulfan
CCssss
[[ngng/ml]/ml]
Slattery et al., Bone Marrow Transplant 16:31, 1995Bone Marrow Transplant 16:31, 1995

Drug Clearance in Cystic FibrosisDrug Clearance in Cystic Fibrosis
0 20 40 60 80 100 120 140
Gentamycin
Ticarcillin
Ceftazidime
Cloxacillin (NR)
Theophylline
Furosemide (NR)
Ibuprofen
Clearance [ml/min•m2]
Renal
Hepatic
Rey, Clin Pharmacokinet
35:313-29, 1998Rey, Clin Pharmacokinet
35:313-29, 1998
Cystic FibrosisControls

RetinoidsRetinoids
≤≤12 Yr.12 Yr. >12 Yr>12 Yr AdultAdult
ATRAATRAMTDMTD 60 mg/m60 mg/m22/d/d 90 mg/m90 mg/m22/d/d 150 mg/m150 mg/m22/d/d
DLTDLT PseudotumorPseudotumor cerebricerebriHA and PCHA and PC DermatologicDermatologic
99--ciscis--RARAMTDMTD 35 mg/m35 mg/m22/d/d 85 mg/m85 mg/m22/d/d 140 mg/m140 mg/m22/d/d
DLTDLT PseudotumorPseudotumor cerebricerebriHA and PCHA and PC HA, diarrhea, HA, diarrhea,
dermatologicdermatologic

ConclusionsConclusions
•• Infants (esp. newborns) may have reduced Infants (esp. newborns) may have reduced capacity to eliminate drugscapacity to eliminate drugs
•• Anticipate the effects of ontogeny on drug Anticipate the effects of ontogeny on drug disposition based on route of eliminationdisposition based on route of elimination
•• More systematic pharmacokinetic studies of More systematic pharmacokinetic studies of drugs in infants are neededdrugs in infants are needed
•• Tissue sensitivity to the toxic effects of drugs Tissue sensitivity to the toxic effects of drugs may be agemay be age--dependentdependent


CytochromeCytochrome
P450 EnzymesP450 Enzymes
PRESENT IN FETUSAPPEAR AFTER
BIRTHAPPEAR 3-4
MONTHS OF AGE
CYP3A7* CYP2D6 CYP1A2CYP1A1 CYP3A4*CYP3A5 CYP2C9
CYP2C18/19CYP2E1
* Most abundant form
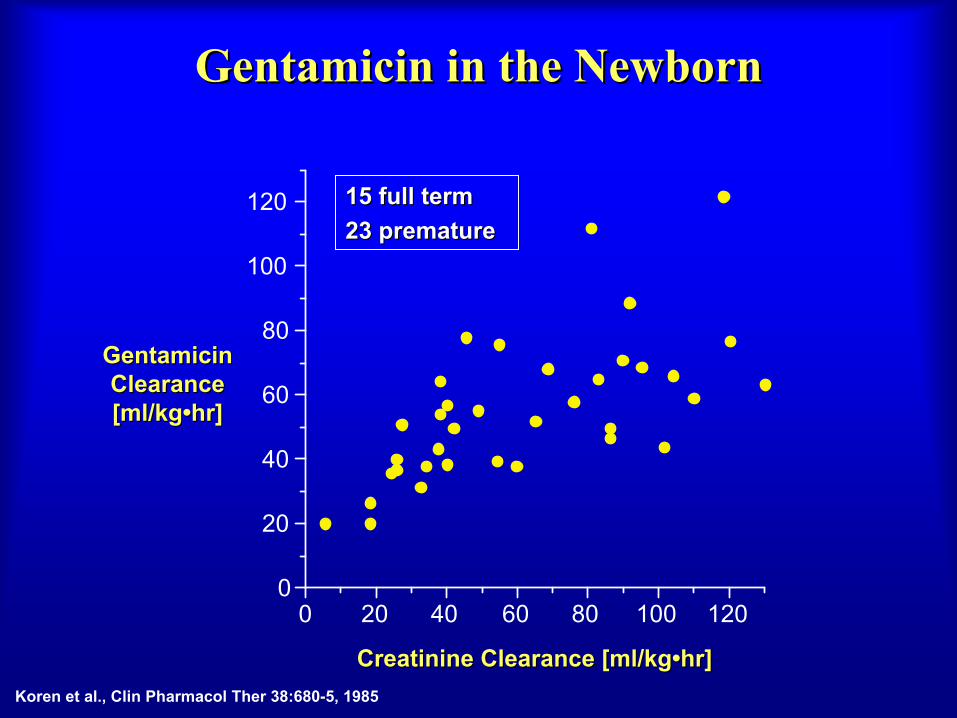
GentamicinGentamicin
in the Newbornin the Newborn
0
20
40
60
80
100
120
0 20 40 60 80 100 120
GentamicinGentamicin
Clearance Clearance [ml/kg[ml/kg••hr]hr]
CreatinineCreatinine
Clearance [ml/kgClearance [ml/kg••hr]hr]
15 full term15 full term23 premature23 premature
Koren
et al., Clin Pharmacol
Ther
38:680-5, 1985