Embed Size (px)
Citation preview
Developmental Cell
Short Article
Morgana/chp-1, a ROCK Inhibitor Involvedin Centrosome Duplication and TumorigenesisRoberta Ferretti,1,6 Valeria Palumbo,2,6 Augusta Di Savino,1 Silvia Velasco,1 Mauro Sbroggio,1 Paolo Sportoletti,3
Lucia Micale,4 Emilia Turco,1 Lorenzo Silengo,1 Gioacchino Palumbo,4 Emilio Hirsch,1 Julie Teruya-Feldstein,5
Silvia Bonaccorsi,2 Pier Paolo Pandolfi,1,3 Maurizio Gatti,2 Guido Tarone,1 and Mara Brancaccio1,*1Dipartimento di Genetica, Biologia e Biochimica, Universita di Torino, 10126 Torino, Italy2Dipartimento di Genetica e Biologia Molecolare and IBPM/CNR, Sapienza, Universita di Roma, 00185 Roma, Italy3Cancer Genetics Program, Beth Israel Deaconess Cancer Center, Department of Medicine and Pathology, Harvard Medical School, Boston,
MA 02215, USA4Dipartimento di Genetica e Microbiologia, Universita di Bari, Bari, Italy5Department of Pathology, Sloan-Kettering Institute, Memorial Sloan-Kettering Cancer Center, New York, NY 10021, USA6These authors contributed equally to this work
*Correspondence: [email protected]
DOI 10.1016/j.devcel.2009.12.020
SUMMARY
Centrosome abnormalities lead to genomic insta-bility and are a common feature of many cancer cells.Here we show that mutations in morgana/chp-1result in centrosome amplification and lethality inboth Drosophila and mouse, and that the fly centro-some phenotype is fully rescued by the human ortho-log of morgana. In mouse cells, morgana formsa complex with Hsp90 and ROCK I and II, and directlybinds ROCK II. Morgana downregulation promotesthe interaction between ROCK II and nucleophosmin(NPM), leading to an increased ROCK II kinaseactivity, which results in centrosome amplification.morgana+/� primary cells and mice display an in-creased susceptibility to neoplastic transformation.In addition, tumor tissue array histochemical analysisrevealed that morgana is underexpressed in a largefraction of breast and lung human cancers. Thus,morgana/chp-1 appears to prevent both centrosomeamplification and tumorigenesis.
INTRODUCTION
Centrosomes are the major microtubule organizing centers in
most animal cells. They comprise a pair of centrioles surrounded
by pericentriolar material (PCM), which nucleates and organizes
microtubules (MTs), contributing to the formation of a bipolar
spindle (Bettencourt-Dias and Glover, 2007; Bornens, 2002). In
normal cells, centrosome duplication is tightly regulated and
occurs only once in every cell cycle. When this regulatory mech-
anism is eluded, multiple rounds of centrosome duplication
within the same cell cycle can result in diploid cells with supernu-
merary centrosomes, a phenomenon known as centrosome
amplification. Cells with supernumerary centrosomes can form
aberrant spindles that are unable to mediate proper chromo-
some segregation, leading to aneuploid and polyploid cells
that are thought to promote tumor progression (Fukasawa,
486 Developmental Cell 18, 486–495, March 16, 2010 ª2010 Elsevier
2007; Nigg, 2006; Ganem et al., 2009). Consistent with these
results, having supernumerary centrosomes is one of the most
common phenotypes associated with solid human tumors
(Fukasawa, 2007; Nigg, 2006). Recent work has shown that
centrosome amplification can lead to tumors also in Drosophila,
suggesting a conserved mechanism for centrosome-related
carcinogenesis (Basto et al., 2008).
Factors controlling proper centrosome duplication include
several proteins implicated in tumor onset and progression,
such as p53, the protein kinases PLK1, Aurora A, Nek2, ROCK
I and II, the polo-like kinases PLK2 and PLK4, the E7 oncoprotein
of the papilloma virus, nucleophosmin (NPM), and BRCA1
(Fukasawa, 2007; Nigg, 2006). In this report, we show that the
CHORD-containing (Shirasu et al., 1999) protein chp-1 regulates
centrosome duplication. Here, we rename chp-1 ‘‘morgana’’
to avoid confusion with the chromodomain protein Chp1
(NP_593666). While nonvertebrate genomes contain a single
chp-coding gene, vertebrates harbor two chp genes, morgana/
chp-1 and melusin (Brancaccio et al., 2003b). Melusin is exclu-
sively expressed in muscle and heart (Brancaccio et al., 1999)
and is involved in triggering cardiomyocyte hypertrophy in
response to mechanical stress (Brancaccio et al., 2003a; De
Acetis et al., 2005; Sbroggio et al., 2008). Morgana/chp-1 has
also been described as a stress protein (Hahn, 2005; Wu et al.,
2005), and its function, as an essential component of the innate
immune resistance to pathogens, has been investigated in detail
in barley and Arabidopsis (Shirasu et al., 1999). In this report, we
demonstrate that morgana/chp-1 is required for both Drosophila
and mouse development and to repress centrosome overdupli-
cation in both organisms. In addition, our results suggest that
morgana downregulation promotes carcinogenesis both in
mice and humans.
RESULTS
Morgana/chp-1 Is an Essential ProteinMorgana function was first investigated by targeted disruption
of the morgana gene in mouse (see Figures S1A and S1B avail-
able online). morgana+/� mice were fertile and did not exhibit
developmental problems or visible pathology. At 3.5 days pc,
Inc.
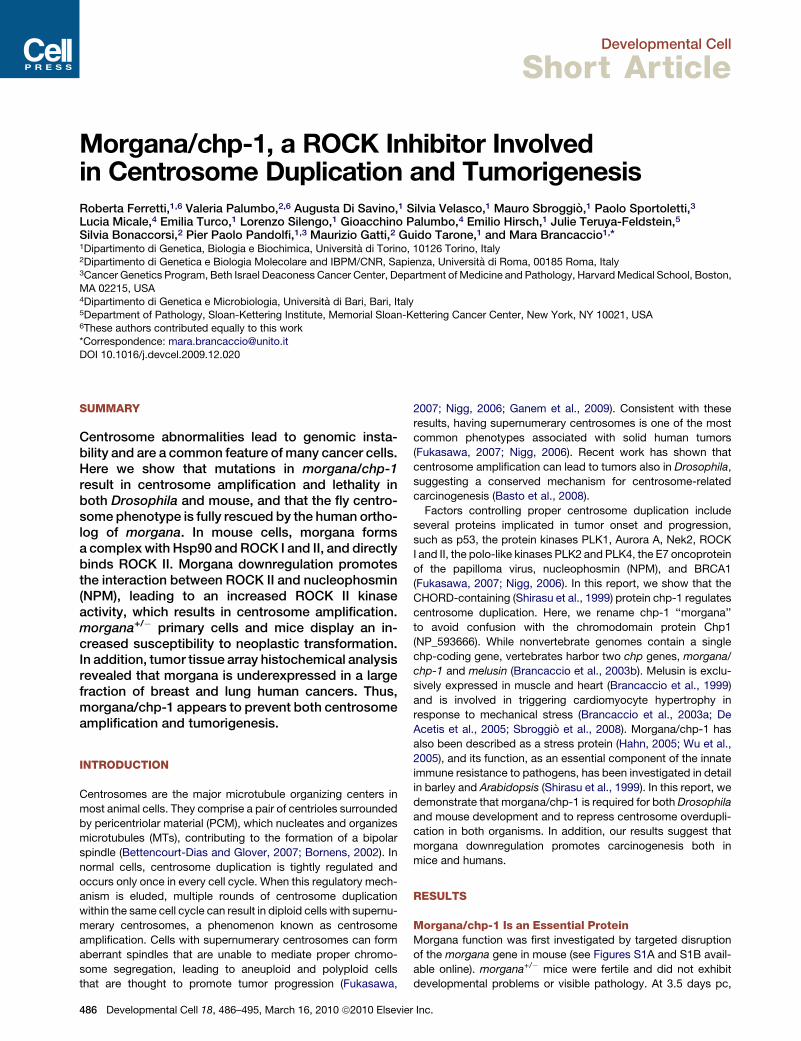
Figure 1. Morgana/chp-1 Is Required for Mouse Embryogenesis and Mitotic Division
(A) Offspring from morgana+/� intercrosses.
(B) morgana+/+ and morgana�/� blastocysts collected at 3.5 days of gestation and cultured in vitro for 3 days. Bars, 100 mm.
(C) The TUNEL assay reveals apoptotic cells in morgana�/� blastocysts cultured in vitro for 3 days. Bars, 100 mm.
(D) Western blots showing that the morgana level in morgana+/+ MEFs is approximately twice than in morgana+/�MEFs. Cells were at the second in vitro passage
(P2). Loading control, vinculin.
(E) morgana+/� MEFs (P2) exhibit higher frequencies of polyploid cells than wild-type MEFs (four MEF preparations per genotype; p < 0.005).
(F) Percentages of diploid cells with more than two centrosomes in morgana+/+ and morgana+/� MEFs at P2 (data from five preparations per genotype).
Only interphase cells with a nuclear DNA content not exceeding 4C were analyzed (see Experimental Procedures). MEFs were stained for g-tubulin (red), a-tubulin
(green), and DAPI (blue). Inserts show enlargements of the centrosomes. Bar, 10 mm.
(G and H) A centrosome duplication assay in HU-treated NIH 3T3 (G) and U2OS (H) cells. Cells were infected with a morgana RNAi construct (black column),
or a nonsilencing RNAi construct (gray column), or were noninfected (NT). Bars in graphs represent standard errors. (**p < 0.01; ***p < 0.001).
Developmental Cell
Role of Morgana in Centrosome Duplication and Cancer
morphologically normal morgana�/� embryos were present at
a normal Mendelian frequency, but after this stage embryos
were no longer detectable (Figure 1A). Strikingly, after 3 days
in culture, the inner cell mass of morgana�/� blastocysts iso-
lated from morgana+/� intercrosses stopped proliferating and
Develo
died by apoptosis (Figures 1B and 1C). Interestingly, tropho-
blastic cells, which undergo DNA endoreplication without cell
division, survived in the absence of the wild-type morgana
function (data not shown), suggesting a mitotic role for this
protein.
pmental Cell 18, 486–495, March 16, 2010 ª2010 Elsevier Inc. 487
Developmental Cell
Role of Morgana in Centrosome Duplication and Cancer
To determine the possible mitotic function of morgana, we
took advantage of the Drosophila model system. In this
organism, embryos homozygous for a mitotic mutation usually
survive until late larval stages, exploiting the material stored
into the egg by their heterozygous mothers. The brains of these
larvae undergo progressive depletion of the maternal product,
allowing phenotypic characterization of the mitotic mutation
(Gatti and Goldberg, 1991). We have previously shown that the
Drosophila genome harbors a single gene encoding a CHORD-
containing protein (Brancaccio et al., 2003b): the CHORD/
CG6198 gene that here we rename morgana (mora). We identi-
fied a putative mora mutant allele, mora1, in the Exelixis’ collec-
tion of PiggyBac element insertions (Thibault et al., 2004).
Sequencing of mora1 revealed that it carries a PiggyBac insertion
in the second exon of CG6198 (Figure 2A). The mutant pheno-
type elicited by mora1 was rescued by a wild-type mora/
CG6198 transgene (see below).
While flies heterozygous for mora1 were fully viable and
morphologically normal, mora1 homozygotes died as third
instar larvae. Mutant larvae were devoid of imaginal discs
and displayed strongly reduced testes and salivary glands,
suggesting an underlying defect in cell proliferation (Gatti and
Goldberg, 1991). Examination of brain preparations from
mora1 mutant larvae revealed that in 95% of dividing cells
the chromosomes are elongated and irregularly condensed
(Figure 2B). In many of these cells, the chromosomes were
so poorly condensed that they were difficult to be recognized
as such. However, mitotic figures could be unambiguously
identified by immunostaining with an anti-phospho histone H3
antibody that marks mitotic chromatin (Wei et al., 1999)
(Figure 2C; Figure S2A). The mitotic index (MI) in mora1 mutant
brains (3.95%; n = 1579) was approximately twice the control
MI (2.07%; n = 3809) (see also Figure S2B), indicating that
mutant cells spend more time in mitosis than their wild-type
counterparts. Imaging of dividing larval neuroblasts expressing
the GFP-tagged histone H2AV (Clarkson and Saint, 1999) re-
vealed that wild-type cells (n = 10) complete cell division within
18 min of the chromosomes becoming detectable within the
nucleus (Figure 2D; Movie S1). In contrast, mora1 mutant cells
(n = 10) remained arrested in a prophase/prometaphase-like
state for the duration of imaging (60 min) (Figure 2D; Movie
S2). However, the analysis of fixed preparations revealed that
a few cells manage to escape the prophase/prometaphase
block. In control cells, the frequency of anaphases relative to
all mitotic figures was approximately 20% (n = 400). In mora1
mutant brains anaphase frequencies ranged from 0.5 to 1.6%
(n = 800), and all mutant anaphases displayed strong defects
in chromosome segregation (Figure 2E; Figure S2C). Examina-
tion of mitotic figures in which at least the heterochromatic
regions of the chromosomes were clearly recognizable (Fig-
ure 2B) revealed that 30% (n = 400) of mora neuroblasts
are polyploid; in control brains the frequency of polyploid
cells is approximately 0.2% (n = 800) (see also Figure S2D).
In addition, mora brains displayed 7.7% (n = 1828) apoptotic
cells, while the frequency of these cells in control brains
was only 0.5% (n = 1730) (Figure S2E and data not shown).
These results suggest that cells unable to undergo anaphase
either revert to interphase, becoming polyploid, or undergo
apoptosis.
488 Developmental Cell 18, 486–495, March 16, 2010 ª2010 Elsevier
morgana/chp-1 Mutations Cause CentrosomeAmplificationExamination of mora1 brain preparations stained for DNA,
tubulin, and the centrosomal marker centrosomin (Cnn; Megraw
et al., 1999) revealed a striking centrosome amplification pheno-
type (Figure 2E; Figure S2F). Cells that were unambiguously
diploid (n = 57) displayed a number of centrosomes ranging
from 2 to 18, with an average of 5.9 centrosomes per cell. Immu-
nostaining for both g-tubulin and the centriole marker DSas-4
(Basto et al., 2006) showed that the two proteins colocalize
(Figure S2G). This suggests that the supernumerary centro-
somes do not result from PCM fragmentation but are instead
generated by multiple rounds of centrosome duplication.
Drosophila Mora shows 42% identity and 63% similarity with
its human ortholog, and it exhibits a similar domain organization
(Figure 2A). We constructed flies homozygous for mora1 and
simultaneously expressing a human morgana transgene (Fig-
ure 2F). Third instar larvae of this genetic constitution showed
imaginal discs and testes of normal appearance, and most
mitotic divisions observed in their brains were completely normal
(Figure 2G). For example, none of the observed mitotic figures
was polyploid and 98% of dividing cells displayed two centro-
somes (n = 200). However, neither the human morgana nor the
Drosophila mora+ transgene rescued the lethal phenotype of
mora1 mutants, which died during metamorphosis (data not
shown). This may be attributable to the fact that both the human
and the Drosophila transgenes were expressed under the control
of an actin promoter rather than the endogenous promoter.
Thus, we conclude that human morgana fully rescues the mitotic
phenotype of Drosophila mora mutants; our results do not permit
us to assess whether the human gene can substitute its fly ortho-
log during metamorphosis.
We next analyzed cultured mouse embryonic fibroblasts
(MEFs) from morgana+/� mice to disclose possible phenotypes
caused by haploinsufficiency. Using an antibody raised against
morgana, we found that heterozygous MEFs display the ex-
pected reduction of morgana to 50% of the wild-type level
(Figure 1D). Analysis of metaphase spreads revealed that the
frequency of polyploid metaphases was significantly higher in
morgana+/� than in morgana+/+ MEFs (Figure 1E). In interphase
cells with a nuclear DNA content not exceeding 4C (G1, S, and
G2 nuclei of diploid cells, and G1 nuclei of tetraploid cells), im-
munostaining for g-tubulin revealed that the frequency of cells
with supernumerary centrosomes (R3 centrosomes/cell) is
significantly higher in morgana+/� than in morgana+/+ MEFs
(9.3% versus 3.5%; p < 0.005) (Figure 1F).
To determine whether the supernumerary g-tubulin signals
observed in morgana+/� MEFs are centriole-containing centro-
somes or acentriolar PCM aggregates, we immunostained these
cells for centriolar markers such as centrin, Nap-1, or Sas-6.
Centrin is enriched in the distal lumen of all centrioles (Paoletti
et al., 1996), Nap1 associates with the free proximal ends of
both engaged and disengaged centrioles (Mayor et al., 2000),
while Sas-6 marks the growing procentriole (Strnad et al.,
2007). In cells containing multiple g-tubulin signals, all of them
colocalized with both centrin (Figures S1C–S1E) and Nap1
(Figures S1F–S1H). In addition, when Sas-6 signals were clearly
visible, they invariably colocalized with those of g-tubulin
(Figure S1I–S1M). These results indicate that all supernumerary
Inc.
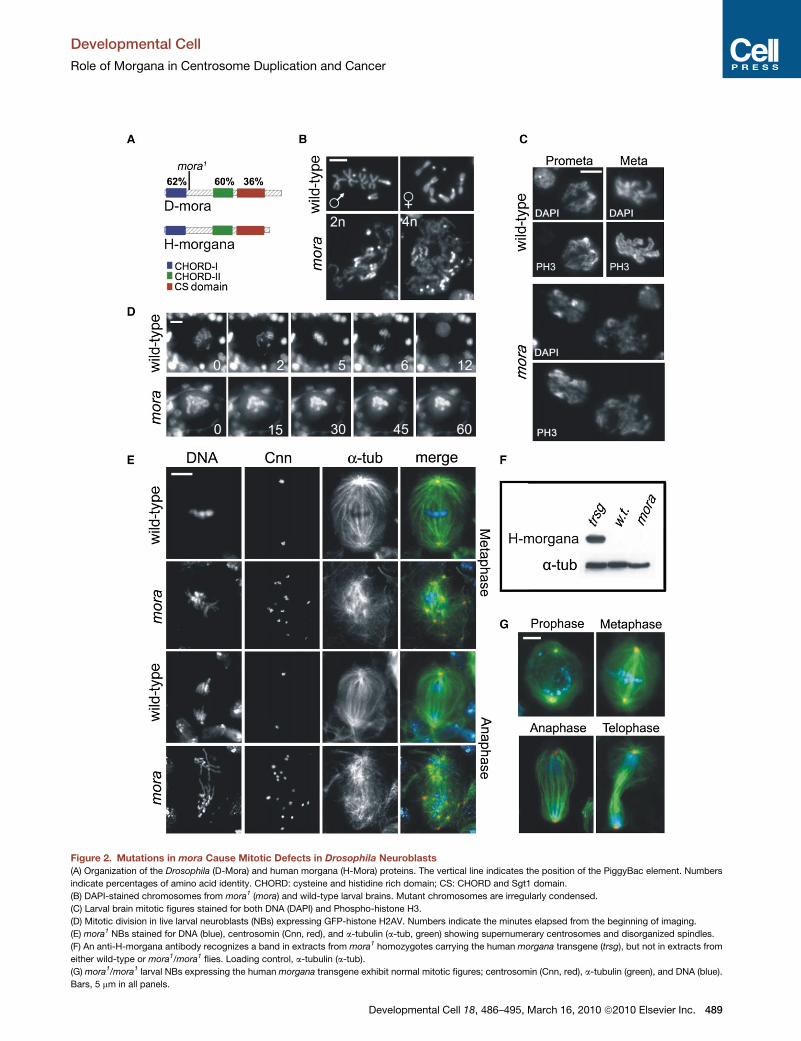
Figure 2. Mutations in mora Cause Mitotic Defects in Drosophila Neuroblasts
(A) Organization of the Drosophila (D-Mora) and human morgana (H-Mora) proteins. The vertical line indicates the position of the PiggyBac element. Numbers
indicate percentages of amino acid identity. CHORD: cysteine and histidine rich domain; CS: CHORD and Sgt1 domain.
(B) DAPI-stained chromosomes from mora1 (mora) and wild-type larval brains. Mutant chromosomes are irregularly condensed.
(C) Larval brain mitotic figures stained for both DNA (DAPI) and Phospho-histone H3.
(D) Mitotic division in live larval neuroblasts (NBs) expressing GFP-histone H2AV. Numbers indicate the minutes elapsed from the beginning of imaging.
(E) mora1 NBs stained for DNA (blue), centrosomin (Cnn, red), and a-tubulin (a-tub, green) showing supernumerary centrosomes and disorganized spindles.
(F) An anti-H-morgana antibody recognizes a band in extracts from mora1 homozygotes carrying the human morgana transgene (trsg), but not in extracts from
either wild-type or mora1/mora1 flies. Loading control, a-tubulin (a-tub).
(G) mora1/mora1 larval NBs expressing the human morgana transgene exhibit normal mitotic figures; centrosomin (Cnn, red), a-tubulin (green), and DNA (blue).
Bars, 5 mm in all panels.
Developmental Cell
Role of Morgana in Centrosome Duplication and Cancer
Developmental Cell 18, 486–495, March 16, 2010 ª2010 Elsevier Inc. 489
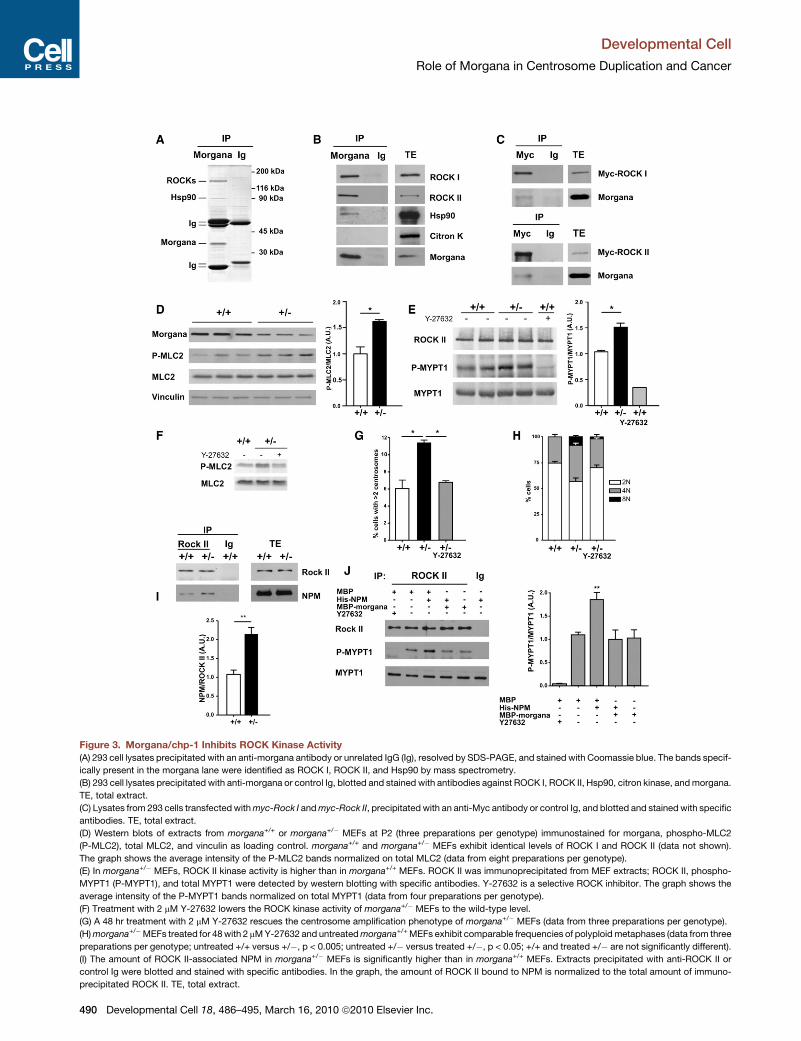
Figure 3. Morgana/chp-1 Inhibits ROCK Kinase Activity
(A) 293 cell lysates precipitated with an anti-morgana antibody or unrelated IgG (Ig), resolved by SDS-PAGE, and stained with Coomassie blue. The bands specif-
ically present in the morgana lane were identified as ROCK I, ROCK II, and Hsp90 by mass spectrometry.
(B) 293 cell lysates precipitated with anti-morgana or control Ig, blotted and stained with antibodies against ROCK I, ROCK II, Hsp90, citron kinase, and morgana.
TE, total extract.
(C) Lysates from 293 cells transfected with myc-Rock I and myc-Rock II, precipitated with an anti-Myc antibody or control Ig, and blotted and stained with specific
antibodies. TE, total extract.
(D) Western blots of extracts from morgana+/+ or morgana+/� MEFs at P2 (three preparations per genotype) immunostained for morgana, phospho-MLC2
(P-MLC2), total MLC2, and vinculin as loading control. morgana+/+ and morgana+/� MEFs exhibit identical levels of ROCK I and ROCK II (data not shown).
The graph shows the average intensity of the P-MLC2 bands normalized on total MLC2 (data from eight preparations per genotype).
(E) In morgana+/� MEFs, ROCK II kinase activity is higher than in morgana+/+ MEFs. ROCK II was immunoprecipitated from MEF extracts; ROCK II, phospho-
MYPT1 (P-MYPT1), and total MYPT1 were detected by western blotting with specific antibodies. Y-27632 is a selective ROCK inhibitor. The graph shows the
average intensity of the P-MYPT1 bands normalized on total MYPT1 (data from four preparations per genotype).
(F) Treatment with 2 mM Y-27632 lowers the ROCK kinase activity of morgana+/� MEFs to the wild-type level.
(G) A 48 hr treatment with 2 mM Y-27632 rescues the centrosome amplification phenotype of morgana+/� MEFs (data from three preparations per genotype).
(H) morgana+/�MEFs treated for 48 with 2 mM Y-27632 and untreated morgana+/+ MEFs exhibit comparable frequencies of polyploid metaphases (data from three
preparations per genotype; untreated +/+ versus +/�, p < 0.005; untreated +/� versus treated +/�, p < 0.05; +/+ and treated +/� are not significantly different).
(I) The amount of ROCK II-associated NPM in morgana+/� MEFs is significantly higher than in morgana+/+ MEFs. Extracts precipitated with anti-ROCK II or
control Ig were blotted and stained with specific antibodies. In the graph, the amount of ROCK II bound to NPM is normalized to the total amount of immuno-
precipitated ROCK II. TE, total extract.
Developmental Cell
Role of Morgana in Centrosome Duplication and Cancer
490 Developmental Cell 18, 486–495, March 16, 2010 ª2010 Elsevier Inc.
Developmental Cell
Role of Morgana in Centrosome Duplication and Cancer
centrosomes of morgana+/� diploid cells contain either a pair of
engaged centrioles or a single nonengaged centriole, and are
thus genuine centrosomes. The colocalization of g-tubulin and
Sas-6 signals further suggests that the centrioles of supernu-
merary centrosomes duplicate synchronously.
To ascertain whether centrosome amplification observed in
morgana+/� cells is the consequence of multiple rounds of cen-
triole duplication during interphase, we performed a centrosome
duplication assay (Meraldi et al., 1999) in both NIH 3T3 mouse
fibroblasts and U2OS human osteosarcoma cells. Cells infected
with lentivirus carrying either a morgana or a nonsilencing inter-
fering sequence were arrested in S phase by hydroxyurea (HU).
Following 48 hr HU treatment, cells were fixed, immunostained
for g-tubulin, and then examined for centrosome number. Both
NIH and U2OS morgana RNAi cultures, in which morgana
expression was reduced to 20% of the control level (data not
shown), showed a significant increase in cells with more than
two centrosomes compared to controls (Figures 1G and 1H).
We thus conclude that morgana downregulation results in
centriole overduplication in S phase arrested cells.
Morgana/chp-1 Interacts with Hsp90 and ROCK I and II,and Inhibits ROCK Kinase ActivityTo define the role of morgana in the control of centrosome
duplication, we searched for morgana binding partners in
mammals by coimmunoprecipitation analysis followed by
mass spectrometry. Two major bands of 160 and 90 kDa copre-
cipitated with morgana (Figure 3A). MALDI-TOF and LC-nano-
spray-IT analysis showed that the 160 kDa band contains Rho
kinase I and II (ROCK I and ROCK II), while the 90 kDa band is
Hsp90, which has been previously shown to interact with mor-
gana (Hahn, 2005; Wu et al., 2005). Identities of ROCK I, ROCK
II, and Hsp90 in coimmunoprecipitates were confirmed by
western blotting with specific antibodies (Figure 3B). Citron
kinase, another Rho-activated kinase related to ROCK, was
not present in the complex, demonstrating the specificity of
the interactions (Figure 3B). Association of morgana with Rho
kinases was further confirmed by immunoprecipitation experi-
ments from cells transfected with Myc-tagged ROCK I and
ROCK II (Figure 3C).
To detect possible functional relationships between morgana
and its interacting partners, we measured ROCK kinase activity
on a well-known substrate, myosin light chain 2 (MLC2). Western
blotting with an anti-phospho-MLC2 antibody revealed that the
MLC2 phosphorylation level is significantly higher in morgana+/�
MEFs than in wild-type MEFs (Figure 3D). Since ROCK II has
been implicated in the control of centrosome duplication
(Ma et al., 2006), we focused on this kinase. We first asked
whether morgana directly binds ROCK II. We performed a far
western blotting assay using ROCK II immunoprecipitated from
293 cell extracts and different morgana fragments fused to the
maltose binding protein (MBP). Full-length morgana and its
CHORD domains, but not its CS domain or MPB alone, reacted
with immobilized ROCK II (Figures S3A–S3C), suggesting a direct
(J) Morgana inhibits NPM-dependent ROCK II activation. The kinase assay was p
as a substrate; precipitation with unrelated IgG is a negative control (Ig). MBP, H
reactions as indicated. The graph shows the average intensities of P-MYPT1 lev
represent standard errors. (*p < 0.05; **p < 0.01).
Develo
morgana-ROCK II interaction. We next immunoprecipitated
ROCK II from morgana+/� and morgana+/+ MEFs and determined
kinase activity in vitro using myosin phosphatase targeting
subunit 1 (MYPT1) as a ROCK substrate (Figure 3E). Western
blotting with an anti-phospho-MYPT1 antibody showed that
ROCK II from morgana+/� MEFs has a higher kinase activity
than ROCK II from wild-type cells (Figure 3E). We thus conclude
that morgana binds ROCK II and inhibits its kinase activity.
To ascertain whether ROCK kinase activity correlates with
centrosome amplification, we used the ROCK kinase inhibitor
Y-27632. morgana+/� MEFs were incubated for 48 hr with
2 mM Y-27632, an inhibitor concentration that lowers MLC2
phosphorylation to the wild-type level (Figure 3F; Figure S3D).
A comparison between treated and untreated morgana+/�
MEFs revealed that the inhibitor rescues the mitotic phenotypes
elicited by morgana haploinsufficiency: the frequency of cells
(with a nuclear DNA content %4C) showing more than two
centrosomes went back to the wild-type frequency (Figure 3G),
and the frequency of polyploid metaphases was significantly
reduced (Figure 3H). These results strongly suggest that the
increased ROCK kinase activity observed in morgana+/� MEFs
is responsible for centrosome amplification and polyploidy.
Morgana/chp-1 Downregulates ROCK II Kinase Activityby Inhibiting ROCK-NPM InteractionTo investigate the mechanism of morgana-mediated downregu-
lation of ROCK kinase activity, we asked whether morgana
directly inhibits ROCK II. A kinase assay on ROCK II immunopre-
cipitated from 293 cell extracts showed that addition of recombi-
nant morgana does not affect ROCK kinase activity (data not
shown and Figure 3L). We thus investigated whether morgana
affects the ability of ROCK II to bind proteins that modulate its
activity. We focused on nucleophosmin (NPM), a protein that
binds and activates ROCK II and positively regulates centro-
some duplication (Ma et al., 2006). We found that in morgana+/�
MEFs the amount of NPM bound to ROCK II is significantly
higher than in controls (Figure 3I). Moreover, the ability of
recombinant NPM to activate ROCK II precipitated from 293
cell extracts (Figure 3L) was abolished by the addition of
recombinant morgana (Figure 3L). Collectively, these experi-
ments indicate that morgana inhibits ROCK II kinase activity by
interfering with NPM-mediated ROCK activation.
Morgana/chp-1 Reduction Predisposes Cellsto Oncogenic Transformation and EnhancesTumor SusceptibilityWe next asked whether morgana plays roles in cell proliferation
and tumorigenesis. We found that morgana+/� MEFs grow
slightly slower than their wild-type counterparts at early in vitro
passages (P2–P5) (Figure 4A). However, at later in vitro pas-
sages, morgana+/� MEFs showed a higher doubling rate than
morgana+/+ MEFs (Figure 4B). The enhanced growth potential
of morgana+/�MEFs was confirmed by a colony formation assay
at low density seeding. As shown in Figure 4C, morgana+/�MEFs
erformed on ROCK II immunoprecipitated from 293 cell extracts using MYPT1
is-tagged NPM, MBP-tagged morgana, or Y-27632 was added to the kinase
els normalized to total MYPT1 from two different experiments. Bars in graphs
pmental Cell 18, 486–495, March 16, 2010 ª2010 Elsevier Inc. 491
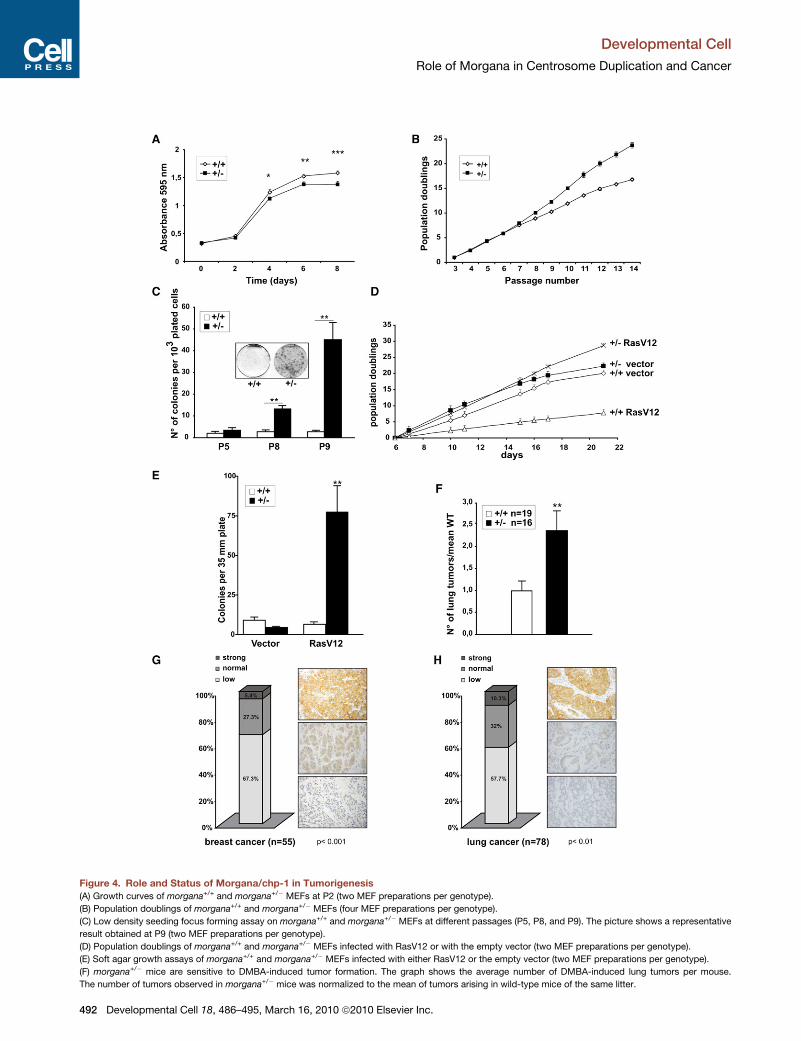
Figure 4. Role and Status of Morgana/chp-1 in Tumorigenesis
(A) Growth curves of morgana+/+ and morgana+/� MEFs at P2 (two MEF preparations per genotype).
(B) Population doublings of morgana+/+ and morgana+/� MEFs (four MEF preparations per genotype).
(C) Low density seeding focus forming assay on morgana+/+ and morgana+/� MEFs at different passages (P5, P8, and P9). The picture shows a representative
result obtained at P9 (two MEF preparations per genotype).
(D) Population doublings of morgana+/+ and morgana+/� MEFs infected with RasV12 or with the empty vector (two MEF preparations per genotype).
(E) Soft agar growth assays of morgana+/+ and morgana+/� MEFs infected with either RasV12 or the empty vector (two MEF preparations per genotype).
(F) morgana+/� mice are sensitive to DMBA-induced tumor formation. The graph shows the average number of DMBA-induced lung tumors per mouse.
The number of tumors observed in morgana+/� mice was normalized to the mean of tumors arising in wild-type mice of the same litter.
Developmental Cell
Role of Morgana in Centrosome Duplication and Cancer
492 Developmental Cell 18, 486–495, March 16, 2010 ª2010 Elsevier Inc.
Developmental Cell
Role of Morgana in Centrosome Duplication and Cancer
at P9 displayed a strikingly increased ability to form colonies
compared to wild-type. When we infected morgana+/� and
wild-type MEFs with oncogenic Ras (Ras V12), we found that
RasV12 led to growth arrest and premature senescence in
wild-type MEFs, whereas Ras-infected morgana+/� cells were
able to proliferate at high rate (Figure 4D) and formed colonies
in both low seeding (data not shown) and soft agar assays
(Figure 4E).
To extend these observations to an in vivo model, we tested
the susceptibility of morgana+/� mice to tumor development in
response to chemical mutagens. morgana+/� and morgana+/+
newborn mice were exposed to the carcinogen 7,12-dimethyl-
benz[a]anthracene (DMBA) and examined 5 months later for
the presence of lung tumors (Serrano et al., 1996). morgana+/�
mice displayed a 2.5-fold increase in the frequency of lung
tumors compared to their wild-type littermates exposed to the
same treatment (Figure 4F). Thus, morgana downregulation
results in an increased MEF proliferation rate, predisposes cells
to Ras-driven oncogenic transformation, and increases suscep-
tibility to the chemical induction of lung tumors.
Morgana/chp-1 Expression Is Reducedin Most Human CancersWe finally investigated morgana expression in two prevalent
human cancers. We generated an anti-morgana monoclonal
antibody (P1/PP0), which recognizes a single band of the ex-
pected size (37 kDa) in western blots from both human and
mouse cell extracts (Figure 1D and data not shown). This anti-
body decorates control cells but not cells in which morgana
was silenced by siRNA (Figure S4A). Immunostaining of tumor
tissue arrays with P1/PP0 showed that morgana expression is
strongly reduced in 67.3% (37/55) of breast and 57.7% (45/78)
of lung cancer samples compared with control tissues (Figures
4G and 4H; Figures S4B and S4C). Interestingly we also found
that morgana is overexpressed in a minority of breast (5.4%)
and lung (10.3%) cancer samples. This latter finding may reflect
a phenomenon, called genomic convergence, that tends to
counteract genetic instability in advanced cancer cells, allowing
clonal expansion of cells with chromosome compositions that
confer a proliferative advantage (Heim et al., 1988) (Chiba
et al., 2000). Morgana overexpression might be one of the mech-
anisms through which some tumors achieve genetic stabilization
via suppression of centrosome amplification.
DISCUSSION
We have shown that impairment of the morgana function causes
centrosome amplification in both Drosophila and mice, and that
the activity of the human morgana gene rescues the centrosome
phenotype elicited by mutations in Drosophila mora. We found
that morgana forms a complex with Hsp90, ROCK I, and
ROCK II, three proteins that have been implicated in centrosome
behavior (Chevrier et al., 2002; Du and Hannon, 2004; Lange
et al., 2000; Ma et al., 2006). In particular, previous studies
(G and H) Bar graphs showing levels of morgana expression in tumor tissue array
breast and lung cancer samples compared with control tissues (p < 0.001 and p <
positive, normal or low for morgana expression are also shown. Bars in graphs r
Develo
showed that ROCK II kinase activity promotes centrosome dupli-
cation and is enhanced by NPM binding (Ma et al., 2006). We
found that morgana binds ROCK II, inhibits the association of
ROCK II with its activator NPM, and abolishes NPM-dependent
ROCK II activation. We thus propose that morgana is a highly
conserved suppressor of centrosome overduplication that acts
by interfering with ROCK II-NPM binding. Our results suggest
that morgana and NPM might compete for ROCK II binding;
however, a precise definition of morgana-ROCK II-NPM interac-
tions will require further studies.
We found that the doubling rate of morgana+/� MEFs at early
in vitro passages is lower than that of wild-type MEFs. In
contrast, morgana+/� MEFs at late passages display doubling
rates that are much higher than those observed in wild-type
MEFs. The growth pattern of the morgana+/� MEFs is strikingly
similar to the growth pattern of nucleophosmin+/� MEFs, which
also exhibit centrosome amplification (Grisendi et al., 2005).
These findings are consistent with the hypothesis that the
genomic instability caused by centrosome amplification initially
hampers cell proliferation, while favoring, over time, the emer-
gence of overgrowing clones. It is also conceivable that the
emergence of overgrowing clones from morgana+/� cells would
promote both Ras-mediated oncogenic transformation and
development of DMBA-induced lung tumors.
Our results indicate that morgana downregulation leads to
centrosome amplification and promotes tumorigenesis in mice.
Moreover, we have shown that morgana expression is lost in a
large fraction of human breast and lung cancers. Together, these
results suggest that morgana might be an important factor in
human tumor etiology and progression, and they encourage
further studies on the biological role of this protein.
EXPERIMENTAL PROCEDURES
Targeted Disruption of the Mouse Morgana/chp-1 Gene
The morgana gene (chordc1) was inactivated by homologous recombination in
mouse ES cells. The knockout construct consisted of a 50 arm (a 3.5 kb
genomic fragment), a b-galactosidase gene with a neomycin resistance
cassette (6 kb), and a 30 arm (a 6.3 kb genomic fragment). ES recombinant
clones lacking 30 bp including the morgana ATG translation start site (see
Figure S1A) were identified by Southern blot analysis and injected into
C57BL/6 blastocysts to generate chimeras.
Drosophila Genetics and Cytology
The PBac{PB}CHORDc02881 (mora1) allele, the lines expressing the
GFP-tagged histone H2AV, genetic markers, and special chromosomes are
described in FlyBase (http://www.flybase.org/). Germline transformation
experiments with full-length cDNAs cloned into a pP[UAST] vector were
performed by standard methods. Human and Drosophila transgenes were
induced by the P{Act5C-GAL4}25FO1 insertion (FlyBase). Chromosome
preparations were obtained as previously described (Gatti and Goldberg,
1991). For immunofluorescence, brains were fixed and stained according to
Bonaccorsi et al. (2000). Time-lapse imaging of living neuroblasts was carried
out as described (Savoian and Rieder, 2002).
Mouse Blastocyst Isolation
Mouse embryos from morgana+/� intercrosses were collected at E3.5 by
flushing the uterus with HEPES-buffered medium 2 (M2; Sigma). After 3 days
s of breast (G) and lung (H) cancers. Morgana expression is strongly reduced in
0.01, respectively). Representative pictures of samples that are either strongly
epresent standard errors (*p < 0.05; **p < 0.01; ***p < 0.001).
pmental Cell 18, 486–495, March 16, 2010 ª2010 Elsevier Inc. 493
Developmental Cell
Role of Morgana in Centrosome Duplication and Cancer
of culture, blastocysts were photographed and then genotyped by nested
PCR. TUNEL assays were performed with the Roche detection kit, according
to manufacturer’s instructions.
MEF Preparation and Analysis
MEFs were prepared from E13.5 embryos and passaged every 3 days (3T9
protocol). Growth curves and plating efficiency at low seeding density were
determined as described in Supplemental Information. Metaphase prepara-
tions from exponentially growing MEFs were prepared as described (Babu
et al., 2003). For immunostaining, cells were fixed and stained using standard
methods. To identify MEFs with a nuclear DNA content %4C, the intensity of
DAPI fluorescence was quantified using the AxioVision (Zeiss) image analysis
software. We tuned the system by examining wild-type MEFs and identifying
two DAPI intensity ranges associated with G1 and G2 DNA contents.
Antibody Preparation, Coimmunoprecipitation, Far Western,
and ROCK Kinase Assay
The P1/PP0 monoclonal antibody was obtained by immunizing mice with a
GST-mouse morgana fusion protein. Antibody purification, western blotting,
immunoprecipitation, and mass spectrometry were performed by standard
methods (Brancaccio et al., 1999; Supplemental Information). Far western blot-
ting and ROCK kinase assay were performed as described by Wu et al. (2007)
and Rubenstein et al. (2007), respectively (see Supplemental Information).
Carcinogen Treatment
DMBA treatments were performed as described in Serrano et al. (1996). Five
months after DMBA treatment, mice were sacrificed and screened for tumors
formation.
Human Tumor Histochemistry
Tumor tissue arrays were stained with our P1/PP0 anti-morgana monoclonal
antibody, after a pretreatment with 10 mM citrate buffer (pH 6.0) and micro-
wave (see Supplemental Information).
Statistical Analysis
In statistical analyses, significance was tested using a two-tailed Student’s
t test or, when required, one-way ANOVA followed by Newman Kleus’ test.
SUPPLEMENTAL INFORMATION
Supplemental Information includes four figures, two movies, Supplemental
Experimental Procedures, and Supplemental References and can be found
with this article online at doi:10.1016/j.devcel.2009.12.020.
ACKNOWLEDGMENTS
We thank F. Fusella, F. Damilano, M. Asher, P. Scaravaglio, O. Azzolino, and
T. Cravero for skillful technical assistance; F. Di Cunto, K. Kaibuchi, S. Naru-
miya, T. Megraw, and J. Raff for clones and antibodies, and R. Srinivasan
for comments on the manuscript. This work was supported by PRIN grants
2005 to G.T. and 2006 to M.B., Progetto di Ricerca Sanitaria Finalizzata
2007 and 2008 to M.B., AIRC 2008 to M.B., Centro di Eccellenza di Biologia
e Medicina Molecolare (BEMM) and AIRC 2008 to M.G., and an NIH grant
to P.P.P.
Received: May 29, 2009
Revised: November 4, 2009
Accepted: December 28, 2009
Published: March 15, 2010
REFERENCES
Babu, J.R., Jeganathan, K.B., Baker, D.J., Wu, X., Kang-Decker, N., and
van Deursen, J.M. (2003). Rae1 is an essential mitotic checkpoint regulator
that cooperates with Bub3 to prevent chromosome missegregation. J. Cell
Biol. 160, 341–353.
494 Developmental Cell 18, 486–495, March 16, 2010 ª2010 Elsevier
Basto, R., Lau, J., Vinogradova, T., Gardiol, A., Woods, C.G., Khodjakov, A.,
and Raff, J.W. (2006). Flies without centrioles. Cell 125, 1375–1386.
Basto, R., Brunk, K., Vinadogrova, T., Peel, N., Franz, A., Khodjakov, A., and
Raff, J.W. (2008). Centrosome amplification can initiate tumorigenesis in flies.
Cell 133, 1032–1042.
Bettencourt-Dias, M., and Glover, D.M. (2007). Centrosome biogenesis and
function: centrosomics brings new understanding. Nat. Rev. Mol. Cell Biol.
8, 451–463.
Bonaccorsi, S., Giansanti, M.G., and Gatti, M. (2000). Spindle assembly in
Drosophila neuroblasts and ganglion mother cells. Nat. Cell Biol. 2, 54–56.
Bornens, M. (2002). Centrosome composition and microtubule anchoring
mechanisms. Curr. Opin. Cell Biol. 14, 25–34.
Brancaccio, M., Guazzone, S., Menini, N., Sibona, E., Hirsch, E., De Andrea,
M., Rocchi, M., Altruda, F., Tarone, G., and Silengo, L. (1999). Melusin is a
new muscle-specific interactor for beta(1) integrin cytoplasmic domain.
J. Biol. Chem. 274, 29282–29288.
Brancaccio, M., Fratta, L., Notte, A., Hirsch, E., Poulet, R., Guazzone, S.,
De Acetis, M., Vecchione, C., Marino, G., Altruda, F., et al. (2003a). Melusin,
a muscle-specific integrin beta1-interacting protein, is required to prevent
cardiac failure in response to chronic pressure overload. Nat. Med. 9, 68–75.
Brancaccio, M., Menini, N., Bongioanni, D., Ferretti, R., De Acetis, M., Silengo,
L., and Tarone, G. (2003b). Chp-1 and melusin, two CHORD containing
proteins in vertebrates. FEBS Lett. 551, 47–52.
Chevrier, V., Piel, M., Collomb, N., Saoudi, Y., Frank, R., Paintrand, M.,
Narumiya, S., Bornens, M., and Job, D. (2002). The Rho-associated protein
kinase p160ROCK is required for centrosome positioning. J. Cell Biol. 157,
807–817.
Chiba, S., Okuda, M., Mussman, J.G., and Fukasawa, K. (2000). Genomic
convergence and suppression of centrosome hyperamplification in primary
p53�/� cells in prolonged culture. Exp. Cell Res. 258, 310–321.
Clarkson, M., and Saint, R. (1999). A His2AvDGFP fusion gene complements
a lethal His2AvD mutant allele and provides an in vivo marker for Drosophila
chromosome behavior. DNA Cell Biol. 18, 457–462.
De Acetis, M., Notte, A., Accornero, F., Selvetella, G., Brancaccio, M.,
Vecchione, C., Sbroggio, M., Collino, F., Pacchioni, B., Lanfranchi, G., et al.
(2005). Cardiac overexpression of melusin protects from dilated cardiomyop-
athy due to long-standing pressure overload. Circ. Res. 96, 1087–1094.
Du, J., and Hannon, G.J. (2004). Suppression of p160ROCK bypasses cell
cycle arrest after Aurora-A/STK15 depletion. Proc. Natl. Acad. Sci. USA 101,
8975–8980.
Fukasawa, K. (2007). Oncogenes and tumour suppressors take on centro-
somes. Nat. Rev. Cancer 7, 911–924.
Ganem, N.J., Godinho, S.A., and Pellman, D. (2009). A mechanism linking
extra centrosomes to chromosomal instability. Nature 460, 278–282.
Gatti, M., and Goldberg, M.L. (1991). Mutations affecting cell division in
Drosophila. Methods Cell Biol. 35, 543–586.
Grisendi, S., Bernardi, R., Rossi, M., Cheng, K., Khandker, L., Manova, K., and
Pandolfi, P.P. (2005). Role of nucleophosmin in embryonic development and
tumorigenesis. Nature 437, 147–153.
Hahn, J.S. (2005). Regulation of Nod1 by Hsp90 chaperone complex. FEBS
Lett. 579, 4513–4519.
Heim, S., Mandahl, N., and Mitelman, F. (1988). Genetic convergence and
divergence in tumor progression. Cancer Res. 48, 5911–5916.
Lange, B.M., Bachi, A., Wilm, M., and Gonzalez, C. (2000). Hsp90 is a core
centrosomal component and is required at different stages of the centrosome
cycle in Drosophila and vertebrates. EMBO J. 19, 1252–1262.
Ma, Z., Kanai, M., Kawamura, K., Kaibuchi, K., Ye, K., and Fukasawa, K.
(2006). Interaction between ROCK II and nucleophosmin/B23 in the regulation
of centrosome duplication. Mol. Cell. Biol. 26, 9016–9034.
Mayor, T., Stierhof, Y.D., Tanaka, K., Fry, A.M., and Nigg, E.A. (2000). The
centrosomal protein C-Nap1 is required for cell cycle-regulated centrosome
cohesion. J. Cell Biol. 151, 837–846.
Inc.
Developmental Cell
Role of Morgana in Centrosome Duplication and Cancer
Megraw, T.L., Li, K., Kao, L.R., and Kaufman, T.C. (1999). The centrosomin
protein is required for centrosome assembly and function during cleavage in
Drosophila. Development 126, 2829–2839.
Meraldi, P., Lukas, J., Fry, A.M., Bartek, J., and Nigg, E.A. (1999). Centrosome
duplication in mammalian somatic cells requires E2F and Cdk2-cyclin A. Nat.
Cell Biol. 1, 88–93.
Nigg, E.A. (2006). Origins and consequences of centrosome aberrations in
human cancers. Int. J. Cancer 119, 2717–2723.
Paoletti, A., Moudjou, M., Paintrand, M., Salisbury, J.L., and Bornens, M.
(1996). Most of centrin in animal cells is not centrosome-associated and
centrosomal centrin is confined to the distal lumen of centrioles. J. Cell Sci.
109, 3089–3102.
Rubenstein, N.M., Callahan, J.A., Lo, D.H., and Firestone, G.L. (2007).
Selective glucocorticoid control of Rho kinase isoforms regulate cell-cell
interactions. Biochem. Biophys. Res. Commun. 354, 603–607.
Savoian, M.S., and Rieder, C.L. (2002). Mitosis in primary cultures of
Drosophila melanogaster larval neuroblasts. J. Cell Sci. 115, 3061–3072.
Sbroggio, M., Ferretti, R., Percivalle, E., Gutkowska, M., Zylicz, A., Michowski,
W., Kuznicki, J., Accornero, F., Pacchioni, B., Lanfranchi, G., et al. (2008). The
mammalian CHORD-containing protein melusin is a stress response protein
interacting with Hsp90 and Sgt1. FEBS Lett. 582, 1788–1794.
Develo
Serrano, M., Lee, H., Chin, L., Cordon-Cardo, C., Beach, D., and DePinho, R.A.
(1996). Role of the INK4a locus in tumor suppression and cell mortality. Cell 85,
27–37.
Shirasu, K., Lahaye, T., Tan, M.W., Zhou, F., Azevedo, C., and Schulze-Lefert,
P. (1999). A novel class of eukaryotic zinc-binding proteins is required for
disease resistance signaling in barley and development in C. elegans. Cell
99, 355–366.
Strnad, P., Leidel, S., Vinogradova, T., Euteneuer, U., Khodjakov, A., and
Gonczy, P. (2007). Regulated HsSAS-6 levels ensure formation of a single
procentriole per centriole during the centrosome duplication cycle. Dev. Cell
13, 203–213.
Thibault, S.T., Singer, M.A., Miyazaki, W.Y., Milash, B., Dompe, N.A., Singh,
C.M., Buchholz, R., Demsky, M., Fawcett, R., Francis-Lang, H.L., et al.
(2004). A complementary transposon tool kit for Drosophila melanogaster
using P and piggyBac. Nat. Genet. 36, 283–287.
Wei, Y., Yu, L., Bowen, J., Gorovsky, M.A., and Allis, C.D. (1999). Phosphory-
lation of histone H3 is required for proper chromosome condensation and
segregation. Cell 97, 99–109.
Wu, J., Luo, S., Jiang, H., and Li, H. (2005). Mammalian CHORD-containing
protein 1 is a novel heat shock protein 90-interacting protein. FEBS Lett.
579, 421–426.
Wu, Y., Li, Q., and Chen, X.Z. (2007). Detecting protein-protein interactions by
far western blotting. Nat. Protoc. 2, 3278–3284.
pmental Cell 18, 486–495, March 16, 2010 ª2010 Elsevier Inc. 495