Embed Size (px)
Citation preview

Toward a Sustainability Appraisal Framework for Transport
Adrien Véron-Okamoto and Ko SakamotoNo. 31 | January 2014
Toward a Sustainability Appraisal Framework for Transport
Transport sector support at the Asian Development Bank (ADB) is changing to meet the new challenges facing its developing member countries. In 2010, ADB adopted its Sustainable Transport Initiative Operational Plan (STI–OP), which recognizes the need to support transport that is accessible, affordable, environment–friendly, and safe. At the Rio+20 United Nations Conference on Sustainable Development, ADB joined seven other multilateral development banks in committing to financing more sustainable transport projects and reporting annually on the sustainability of their portfolio. A working group on sustainable transport was set up, tasked with developing a common assessment framework. The proposed Sustainable Transport Appraisal Rating (STAR) is a tool for assessing the sustainability of ADB’s transport projects and monitoring changes in the portfolio. It is intended to serve as a tool to design more sustainable transport projects in line with the STI–OP. It is also developed as a contribution to the emerging common assessment framework of the eight multilateral development banks.
About the Asian Development Bank
ADB’s vision is an Asia and Pacific region free of poverty. Its mission is to help its developing member countries reduce poverty and improve the quality of life of their people. Despite the region’s many successes, it remains home to two-thirds of the world’s poor: 1.8 billion people who live on less than $2 a day, with 903 million struggling on less than $1.25 a day. ADB is committed to reducing poverty through inclusive economic growth, environmentally sustainable growth, and regional integration.
Based in Manila, ADB is owned by 67 members, including 48 from the region. Its main instruments for helping its developing member countries are policy dialogue, loans, equity investments, guarantees, grants, and technical assistance.
Asian Development Bank6 ADB Avenue, Mandaluyong City1550 Metro Manila, Philippineswww.adb.org/povertyPublication Stock No. WPS146304
Printed in the Philippines
ADB Sustainable Development
Working Paper Series
Printed on recycled paper

ADB S
Towafor Tr Adrien VNo. 31 |
ustainable
ard a Suranspo
éron-Okamo January 20
e Develop
ustainart
oto and Ko S014
pment Wo
ability A
Sakamoto
orking Pap
Apprais
Adrien Specialof the AKo SakRegionDepartmcommeand ksa
per Series
sal Fram
Véron-Okamlist in the Sou
Asian Developkamoto is a Tral and Sustaiment of ADB.
ents should beakamoto@ad
s
mework
oto is a Transutheast Asia Dpment Bank (ransport Econinable Develo. Suggestionse sent to aver
db.org.
k
sport Department (ADB). nomist in the opment s and [email protected]

Asian Deve6 ADB Ave1550 Metrowww.adb.o © 2014 by January 20Publication The views of the Asiainstitutions ADB does consequen By makingin this docu Unless oth Acknowle The work Division coJames LeaAlexandra Appraisal Scomments
This workiworking papublicationwork in propresentatio
Printed on
elopment Bankenue, Mandaluyo Manila, Philiporg
Asian Develop014 n Stock No. WP
expressed in an Developme at which the a
not guaranteence of their use
any designatioument, ADB do
erwise noted, “
dgments
benefited fromoncurrently Praather, Principa
Pamela ChiaServices contrito earlier versi
ng paper serieaper series ares can be founogress to encoon of the work i
n recycled paper.
k yong City ppines
pment Bank
PS146304
this paper areent Bank (ADBauthor works.
e the accuracy e.
on of or refereoes not intend t
“$” refers to US
m strong suppoactice Leader l Transport Spng, Sarosh Kbuted to this reions of this rep
es is maintaine on economid at www.adb.ourage the excis less than full
e those of theB) or its Board
of the data in
nce to a particto make any ju
S dollars.
ort at managem(Transport); G
pecialist, SouthKhan, Geneviev
eport. Numeroort.
ed by the Regcs, regional co.org/Publicationchange of ideay polished.
e author and dd of Governors
cluded in this
cular territory odgments as to
ment level fromGil-Hong Kim, D
East Asia Trave O’Farrell, us other staff
Lloyd Wright, from across A
gional and Suooperation, anns/. The purpoas. The empha
do not necessas or the gove
publication an
r geographic athe legal or ot
m Tyrrell DuncDirector, Sustaansport Divisio
D
stainable Devend the ADBI Wose of the serieasis is on getti
arily reflect thernments they
d accepts no r
area, or by usinher status of a
can, Director, ainable Infrastron. A group of
as well as PDB provided in
elopment DepWorking Paperes is to disseming findings ou
e views and prepresent, or
responsibility f
ng the term “cony territory or a
East Asia Traructure DivisionADB staff, inc
Phil Sayeg of nvaluable advic
artment. Other Series. Othe
minate the findiut quickly even
policies of the
for any
ountry” area.
ansport n; and cluding Policy
ce and
r ADB r ADB ngs of
n if the

Contents
Figures and Tables iv Abbreviations v Executive Summary vi 1. How to Assess the Sustainability of Transport Projects 1
1.1 The Need for a New Sustainability Assessment Framework 1 1.2 The Experience of Multilateral Development Banks with Evaluation Harmonization 2 1.3 What Would Be a “Good” Transport Sustainability Rating System? 3 1.4 Creating the Sustainable Transport Appraisal Rating 3
2. Putting the Sustainable Transport Appraisal Rating into Practice 4 2.1 What Is Measured? 4 2.2 How Is the Rating Constructed? 7 2.3 What Is a Sustainable Transport Project? 8 2.4 Who Prepares the Rating? 8
3. Using the Ratings 9 3.1 Usage in the Project Cycle 9 3.2 Corporate-Level Portfolio Reporting 10
4. Worked Examples 10 4.1 Worked Example 1: Patusan Expressway Project (Concept Stage) 11 4.2 Worked Example 2: Sulaco Bus Rapid Transit Project (Appraisal Stage) 14 4.3 Worked Example 3: Costaguana Rural Road Development Project (Simplified
Rating Methodology) 17 5. Pilot-Test on Transport Projects Approved by ADB 19 6. Next steps 21 Codebook 23
Overall Rating Scale and Table 24 Calculation Rules: Core Criteria Ratings 25 Calculation Rules: Subcriteria Ratings 27 Score Book 28
Appendix: Potential Alternative Scales 57

Figures and Tables Figures 1 Rating Composition ............................................................................................................... 7 2 Worked Example 1—Rating Overview ................................................................................ 12 3 Worked Example 2—Rating Overview ................................................................................ 15 4 Number of Projects by Overall Rating and Sector ............................................................... 20 5 Amount of Financing by Overall Rating and Subsector ....................................................... 20 6 Number of Projects by Core Criteria Rating ........................................................................ 20
Tables
1 Rating Criteria ........................................................................................................................ 6 2 Distribution of Projects Evaluated and ADB Financing ........................................................ 19

Abbreviations ADB Asian Development Bank BRT bus rapid transit CBD central business district CCTV closed circuit television EIRR economic internal rate of return FIDIC International Federation of Consulting Engineers FOREX foreign exchange GDB gross domestic product GHG greenhouse gas HDM-4 Highway Development and Management Model IRAP International Road Assessment Programme LEED Leadership in Energy and Environmental Design LRT light rail transit MDB multilateral development bank NOx nitrogen oxide NPV net present value OECD Organisation for Economic Co-operation and Development PM particulate matter STAR Sustainable Transport Appraisal Rating STI-OP Sustainable Transport Initiative Operational Plan SOx sulfur oxide TEU twenty-foot equivalent unit UK United Kingdom UNCSD United Nations Conference on Sustainable Development US United States WGST Working Group on Sustainable Transport WHO World Health Organization

Executive Summary
Transport—the movement of people and goods from one place to another—is a basic requirement for the functioning of human society and is intrinsic to the production and use of goods and services. By helping to expand economic opportunities and services, and providing people with access and mobility, transport contributes to poverty reduction and inclusive growth and is a key enabler for attainment of the Millennium Development Goals (MDGs). Yet, transport also consumes resources and often has negative side effects. These include congestion and various environmental and health-related problems arising from vehicle emissions and traffic accidents. Transport sector support at the Asian Development Bank (ADB) is changing to meet the new challenges facing its developing member countries. In 2010, ADB adopted the Sustainable Transport Initiative Operational Plan (STI-OP), which recognizes the need to support transport that is accessible, affordable, environment-friendly, and safe. At Rio+20, the United Nations Conference on Sustainable Development, ADB joined seven other multilateral development banks (MDBs) in committing to financing more sustainable transport projects and reporting annually on the sustainability of their portfolio. They set up a Working Group on Sustainable Transport (WGST), tasked with developing a common assessment framework. The proposed Sustainable Transport Appraisal Rating (STAR) is a tool for assessing the sustainability of ADB transport projects and monitoring changes in the portfolio. It is intended to serve as a tool to design more sustainable transport projects, in line with the STI-OP. It was also developed as a contribution to the emerging common assessment framework of the eight MDBs. The following are the main features of STAR: Project-based: It measures the contribution of a project or group of projects to improving (or
worsening) the sustainability of a transport system, compared to a base case. Objective-driven: It measures project performance against a set of sustainable transport
objectives, organized under the three pillars of economic, social, and environmental sustainability. Ex ante/ex post: It primarily seeks to inform project selection, design, and appraisal; it can also
be used for evaluation purposes. Qualitative: The assessment method relies on the judgment of the evaluator, supported by
quantitative performance indicators, which combined produces a rating according to fixed weightings.
Unified: The rating applies potentially to all transport projects financed by ADB, and ratings can be aggregated.
Transparent: The rating methodology is summarized in an appraisal matrix that can be shared with third parties.
This working paper reflects the experience from a limited piloting of the tool on ADB projects, and the comments received from internal review as well as an external consultation with selected partners. To some extent, it also integrates perspectives from the ongoing exchanges within the MDBs’ WGST. The framework, as presented in this paper, is still a work in progress. It is not meant to be a final version, nor the actual tool that ADB may (or may not) adopt. Still, we believe that this intermediate version of STAR is sufficiently operational to be more widely shared and that the views of a wider audience will enrich the discussion on how to measure the sustainability of transport projects.
1. How to Assess the Sustainability of Transport Projects The Asian Development Bank’s (ADB) transport operations are changing to meet the emerging challenges faced by developing member countries (DMCs). In 2010, ADB adopted the Sustainable Transport Initiative Operational Plan (STI-OP), which recognizes the need to support transport that is accessible, affordable, environment-friendly, and safe. At the Rio+20 United Nations Conference on Sustainable Development, ADB joined seven other multilateral development banks (MDBs) in committing to financing more sustainable transport projects. The eight MDBs also committed to introducing annual reporting on sustainable transport–related lending and to developing common arrangements for this purpose. A Working Group on Sustainable Transport (WGST) has been set up for this purpose. The work on defining what is “sustainable transport” has been progressing in the international transport community. However, whether definitions are “safe, clean and affordable” (World Bank Transport Business Strategy for 2008–2012),1 “accessible, safe, environmentally friendly, and affordable” (ADB Sustainable Transport Initiative Operational Plan),2 or the longer version of the European Union,3 none is “operational,” i.e., they do not indicate whether a particular project is a “sustainable transport project.” It is our view that operationalizing the Rio+20 commitment requires MDBs to define a common understanding of what is meant by “sustainability” in the context of their transport operations, and to define criteria and methodologies to measure and report their performance in this regard. 1.1 The Need for a New Sustainability Assessment Framework Operationalizing ADB’s Sustainable Transport Initiative and the Rio+20 commitment will be complex. Sustainability is a multidimensional concept with different meanings and sometimes conflicting aspects. There is generally a consensus that sustainability has economic, social, and environmental dimensions, which together form a “triple bottom line.” However, the application of sustainability applied to the transport sector is especially challenging. The concept has been applied in different ways to transport systems (do they support sustainable development?) and to transport projects (will their benefits last?). Fundamentally, the role of transport in sustainable development remains somewhat ambiguous. Transport enables other activities but is not an end in itself. On the one hand, as any economic activity, transport systems make direct and immediate contributions to economic and social activity and produce measurable impacts on the environment. On the other hand, transport projects also change the structure of the economy. In doing so, they bring about broad and often long-lasting economic, social, and environmental impacts. Both contributions—the direct and immediate one, and the indirect and long-term one—matter to decision-makers. The second contribution is generally assumed to be the most important, but it is also the hardest to measure. An assessment method therefore needs to strike a balance between breadth and precision. The Rio+20 commitment calls for concrete indicators to help form a general consensus among the MDBs about the sustainability of transport operations within each bank. Sustainability however does not lend itself easily to measurement. There is a risk that MDBs might rely mainly on indicators that are easy to
1 World Bank. 2008. Safe, Clean, and Affordable… Transport for Development: The World Bank Group’s Transport
Business Strategy 2008–2012. Washington, DC. 2 ADB. 2010. Sustainable Transport Initiative Operational Plan. Manila. 3 The European Union Council defined in 2001 a sustainable transport system as one that “(i) allows the basic
access and development needs of individuals, companies, and society to be met safely and in a manner consistent with human and ecosystem health, and promotes equity within and between successive generations; (ii) is affordable, operates fairly and efficiently, offers a choice of transport mode, and supports a competitive economy, as well as balanced regional development; and (iii) limits emissions and waste within the planet’s ability to absorb them, uses renewable resources at or below their rates of generation, and uses non-renewable resources at or below the rates of development of renewable substitutes, while minimizing the impact on the use of land and the generation of noise.” European Union, European Council. 2001. Strategy for Integrating Environment and Sustainable Development into the Transport Policy – Council Resolution. Luxembourg
2 | ADB Sustainable Development Working Paper Series No. 31
measure in a consistent and objective manner, but that do not demonstrate whether progress is being made and do not provide sufficiently positive operational incentives for more sustainable types of transport interventions. Off-the-shelf indicators, which are generally applied at present, have different strengths and weaknesses, as described later. Portfolio composition indicators are based on a classification of projects by type or transport mode, and a subjective judgment on the sustainability of each category. Measuring portfolio composition simply by transport modes assumes implicitly that some transport modes are by nature more sustainable than others, which may be overly simplistic. Measuring the share of financing going to “low-carbon” transport modes or to “rural transport” projects may give some indication of the contribution to climate change or poverty alleviation of an MDB. Any subjective assessment, however, is rough (there are many shades of gray in each mode of transport) and incomplete (there is no definite association between sustainability objectives and modes of transport). Efficiency or process indicators measure to what extent sustainability issues are considered when carrying out a project. This is usually with reference to benchmarks, or to “best practice” standards. A process indicator may, for instance, measure whether the planning process, design standards, and implementation methods meet minimal sustainability criteria, or rate efficiency in optimizing sustainability considerations. For instance, the Leadership in Energy and Environmental Design (LEED) 4 rating evaluates the environmental footprint of a building, based on design specifications, energy and water efficiency, the use of materials and resources, etc. The International Road Assessment Programme (iRAP)5 rating measures the degree of safety of a built road or of the design of a project. These approaches have value, but they do not question the sustainability of the project itself and may be hard to generalize across all countries served by ADB and other MDBs. Outcome indicators measure the extent to which a project’s likely short- to long-term effects on beneficiaries, systems, and institutions contribute to the various dimensions of “sustainable transport.” These indicators are preferably evaluated over the life cycle of the project and in comparison with a hypothetical base case. Net carbon emissions, pollutant emissions, avoided road crashes, or time savings are some examples. Outcome indicators have a greater intrinsic interest than process indicators because they relate to the contribution of transport to sustainable development. They are, however, operationally difficult to handle: their analytical computation comes late in the project cycle, there are no benchmarks to guide project selection or design, and the number of indicators needed to reflect sustainability may blur the messages. Overall, using a set of easily available portfolio, process, and outcome indicators would give a sense of how the MDBs are adjusting to the agenda of sustainable transport, and this may be the best approach to take within the first few years of reporting and monitoring. Still, the sustainability assessment would be patchy, and comparisons would be hard. It is difficult to see how this set of indicators would encourage operational changes or provide a common direction for work. There is a need for a new common language for talking about the sustainability of transport operations. 1.2 The Experience of Multilateral Development Banks with Evaluation
Harmonization It is useful to review how the MDBs succeeded in defining common performance reporting principles and methodologies. Evaluation mechanisms related to MDBs’ individual public sector projects and corporate reporting were harmonized in the late 1990s. Following a first commitment in 1998 by MDB heads to harmonize their evaluation criteria and processes, eight MDBs created a joint working group to share their experiences and compare their standards, with support from the Organisation for Economic Co-operation and Development (OECD). The standards and references on good practice that resulted have since
4 LEED is an internationally recognized green building certification program. See http://new.usgbc.org/leed 5 iRAP, with whom ADB has convened a memorandum of understanding, provides rating tools and methods for road
safety. See http://www.irap.net/
Toward a Sustainability Appraisal Framework for Transport | 3
unified evaluation methods and governance, while leaving sufficient scope for each MDB to adapt them to their individual goals and contexts. This common performance evaluation framework6 provides answers to the following questions:
Purpose: Why evaluate? Scope and timing: What to evaluate? When to evaluate? Methodology: What dimensions to evaluate? Which criteria to apply? How to deal with multiple
dimensions? Transparency: What information to disclose at the project level? What indicators to report at the
corporate level? How to disseminate? Governance: How independent is the evaluator? What is the role for self-evaluation?
There is much that can be replicated from this successful experience. The above list of questions provides insights for creating a common reporting framework for the sustainability of MDB transport projects. There is indeed only a small conceptual step from the question “What is the performance of a project and/or portfolio?” to “What is the sustainability of a project and/or portfolio?” This paper is based on the assumption that it is possible to replicate this experience and create a sustainable transport assessment and rating system that contributes to operationalizing the Rio+20 commitment.
1.3 What Would Be a “Good” Transport Sustainability Rating System? Before considering the proposed rating system, it is necessary to analyze which benchmarks can be used to evaluate sustainability. The experience of the MDB Evaluation Cooperation Group suggests that the appropriate benchmarks are validity, credibility, transparency, and comparability. Another consideration which we propose to add is operationality. These dimensions may be described in our context as follows:
Validity: A rating system should determine accurately whether the MDB projects are delivering core transport sustainability outcomes. It should also be able to establish a clear hierarchy between projects from the most to the least sustainable ones.
Comparability: A rating system should have enough flexibility to be applied across all MDBs but allow for comparisons between projects on a like-for-like basis, not differentiating the size, nature (e.g., service versus infrastructure), or context of the project.
Transparency: Methods, evaluations, and sustainability reports should be publicly disclosed. A third party should be able to scrutinize the results and reconstruct the rating based on the information provided.
Credibility: Natural conflicts of interest arising from incentives to justify projects that receive financing and to assess them fairly at the same time should be carefully managed.
Operationality: A rating system should provide the right incentives to government officials and MDB officers to select and compare potential projects (do the “right” projects), as well as to improve design and promote sustainability objectives (do projects “right”). It should also be simple and predictable, thus easy to understand and explain, and low-cost to determine. Its implementation should build upon the MDBs’ existing appraisal systems.
1.4 Creating the Sustainable Transport Appraisal Rating The proposed Sustainable Transport Appraisal Rating (STAR) has been designed by a working group within ADB’s Transport Community of Practice. It has been conceived as the first step in developing a broader appraisal framework, intended to promote sustainability considerations in ADB transport operations. The version presented in this paper is a beta version, for use during pilot-testing of the approach and to facilitate consultations with stakeholders.
6 Multilateral Development Bank Evaluation Cooperation Group (ECG). 2000. Good Practice Standards for
Evaluation of MDB-Supported Public Sector Operations. Washington, DC.

4 | ADB Sustainable Development Working Paper Series No. 31
STAR is intended to qualitatively measure the performance of a project or investment program against sustainable transport objectives. It has been inspired by the MDBs’ common performance rating principles and ADB’s practice in project performance evaluations. Some of its features also derive from the United Kingdom Department for Transport’s Transport Analysis Guidance (WebTAG) and similar appraisal frameworks found in countries such as New Zealand and Australia. The following are the main considerations made in the structure of the rating system:
It is project-based. The rating is based on the evaluation of a transport operation, which can be a transport project or a coherent set of projects, financed by an MDB. Individual project ratings can be aggregated to enable corporate-level reporting.
It is objective-driven. The rating primarily assesses the extent to which each project brings positive changes (which are results or outcomes) to transport systems. The desired directions of change are given by sustainable transport policy objectives, in economic, social, and environmental terms. The rating is mainly concerned with the outcomes of the project.
It is primarily an ex ante appraisal tool. The rating seeks to inform project selection, design, and appraisal, by helping answer key questions for a project being considered: How does the project contribute to sustainable development objectives? Are there alternative options that would maximize beneficial outcomes on all dimensions of sustainability? Are the project outcomes sustainable in the long term? The project rating can be computed in the concept stage and before project approval. Slightly different versions of the rating would have to be created to enable post facto assessment or investment program assessment (in the planning stage).
It is qualitative. The outputs of the assessment are a set of ratings: one overall rating and one rating for each core criterion of the assessment (core criteria are economic, social, environmental, and risk). They result from an informed judgment by the rater, based on qualitative or quantitative indicators. The rating levels are associated with a predefined set of ranked value terms and symmetrical rating scales.
It is unified. The rating system relies on the same criteria and weighting scales for all types of operations. It applies to all modes of transport. Implicitly, this means that all (or most) transport projects financed by MDBs could be assessed in terms of their contribution to economic, social, and environmental sustainability.
It is transparent. The ratings, as well as the qualitative and quantitative indicators that underpin them, are summarized in an appraisal matrix, which provides a bird’s eye view of the project strengths and weaknesses. Decision makers and third parties may make their own judgments of the project based on the summary matrix.
2. Putting the Sustainable Transport Appraisal Rating into
Practice 2.1 What Is Measured?
STAR is primarily concerned with the changes to a transport system brought about by a project. These changes are the project’s outcomes or impacts, defined here as the likely short-, medium-, or long-term effects of a project on a transport system, institutions, beneficiaries, and context. Transport systems are dynamic, so the evaluation should be forward-looking. The changes that a project will bring are defined with reference to a base case, or “business as usual” case. This situation is defined as the most likely and politically realistic situation in the absence of the project and any alternative major investment. The base case is usually different from the baseline. It includes the effects of time, particularly on demand growth. Short-term effects may differ from long-term ones.

Toward a Sustainability Appraisal Framework for Transport | 5
The rating measures the extent to which a project advances ADB’s strategic sustainable development objective, in its economic, social, and environmental dimensions. STAR translates this strategic objective into a set of “sustainable transport objectives.” Economic objectives refer to a project’s contribution to economic development, including productivity, incomes, property development, and tax revenues. Social objectives refer to a project’s contribution to social sustainability, including accessibility, employment, affordability, inclusion, social cohesion, safety, security, and health. Environmental objectives refer to a project’s contribution to environmental sustainability, including transport-related emissions and pollution, natural and built environment, and climate resilience. The extent to which a project contributes to the sustainable transport objectives provides criteria for evaluating project performance. STAR adds a fourth dimension: the risk to the sustainability of a project’s outcomes. This dimension is very much linked to the soundness of a project, and the capacity of the local institutions to implement the project and sustain its benefits. It refers to the risk that expected outcomes may not be realized or sustained. This may be because of weak institutions or a lack of financing. It may also relate to the uncertainty of the evaluation itself, as STAR is meant to be carried out before a project is implemented. The risk to sustainability comprises three subcriteria: design and evaluation risk, implementation risk, and operational risk. The definition of the objectives and criteria is in Table 1. Their selection has sought to comprehensively cover the benefits or negative impacts of projects, many of which are often unquantified, while avoiding double counting.

6 | ADB Sustainable Development Working Paper Series No. 31
Table 1: Rating Criteria Dimension/ Core Criteria
Area Objective/Subcriteria
Sustainable Transport Objectives
Economic
Efficiency: people Improve people’s mobility and accessibility, by reducing their perceived transport costs
Efficiency: businesses Reduce the costs of transporting goods and the operating costs of transport systems
Quality and reliability Improve the quality and reliability of transport systems and services
Fiscal burden Reduce the cost of transport systems for the taxpayer
Wider economic benefits: – regional integration – urban agglomeration – agricultural
development
Facilitate the cross-border movement of goods and people in the region Foster economies of scale in urban areas Enable rural agricultural development and increased food security
Poverty and Social
Basic accessibility Improve people’s access to basic needs and social services, particularly health care and education
Employment Generate or provide access to quality employment opportunities for the poor
Affordability Provide transport opportunities that are affordable to the greatest number of people
Safety Improve the safety and security of transport users and local communities
Inclusion and social cohesion
Provide transport opportunities that are accessible to all groups of society, including women, ethnic minorities, and people with disabilities Foster social cohesion and interaction, and minimize severance of communities and resettlement
Environmental
Greenhouse gas emissions
Reduce the contribution of transport systems to greenhouse gas emissions
Transport-related emissions and pollution
Reduce transport-related emissions of air pollutants, noise, vibration, and light, as well as pollution of surface water, groundwater, and soil
Resource efficiency Minimize use of natural resources, materials, energy, water, and land in transport, and limit waste
Climate resilience Improve the resilience of the transport system to impacts of climate change, including climate variability and extreme weather events
Natural and built environment
Preserve the natural environment and maintain the integrity of ecosystems, biodiversity, and the services they provide Enhance the built environment, landscape, townscape, physical cultural resources, and their settings
Risk to Sustainability
Risk to Sustainability
Design and evaluation risk
Risk of cost overruns and below-expectation traffic demand, risks that negative impacts are above expectations, or risks that positive outcomes are below expectations, because of evaluation uncertainty
Implementation risk Risk that the project is delayed, cancelled, or fails to fully perform, or that negative impacts are not mitigated
Operational risk Risk that the level of service provided by the project cannot be sustained at its expected level

2.2 H The rating
Insura(ofoanof
InanthnojuAus
In
cosuunis(Fan
Pwsupe
The code
How Is the
g construction
n the first steustainable traating on a sevor not applicaollows a threend, wheneverf the project.
n the second nd social, env
he individual sot simply a w
udgment. AgaA score betwe
sed for the ris
n the third somparing theustainable, nsustainable,
s given to ecoFigure 1). To nd sustainablresentation o
weak points upporting infoerformance in
ebook at the e
Rating Co
n follows three
ep, the rater aansport objecven-point scalble), moderate-point scale,r possible, by
step, the ratevironmental, subcriteria ra
weighted averain, a seven-peen –3 and 3sk rating, asso
step, the ovee total with pmoderately to highly unsonomic, envirfurther emph
le cannot be gof the rating and areas formation (inclndicators; and
end of this pa
nstructed?
e steps:
assesses proctives and riskle: very strongtely negative,, from low to
y a quantitativ
er rates the pand risk to su
atings, using sage of subcri
point scale is 3 is now assoociated with a
Figure 1: R
erall rating ispredefined th
sustainable, sustainable. Tronmental, anhasize the trigiven to projeinvolves (i) a
for improvemuding costs, d (iii) a diagra
aper describes
Toward a Sus
?
oject performk areas. The gly positive, s, strongly neghigh. Rating
e performanc
project accordustainability. Tset rules for ateria ratings: used for the e
ociated with ea score betwe
Rating Comp
s derived by resholds. The
marginally The ratings cond social criteple bottom lin
ects with negaa narrative a
ments; (ii) analternatives,
am displaying
s with details
stainability App
ance againstrater’s opinio
strongly positigative, very sts are informe
ce indicator. T
ding to four cThe rating ofaggregating tthe rater is a
economic, soeach of theseeen –1 and 1.
osition
aggregatinge ratings ran
sustainableomposition is eria, while thne, the higheative ratings oassessment, n appraisal mand options ssubcriteria ra
the rating cri
praisal Framew
t each of theon is expressive, moderatetrongly negated by a qualThey take into
core criteria: f these core cthem. Aggregasked to deveocial, and enve ratings. A t.
g the core cnge is from he, moderate such that an
he risk criterioest ratings of on any criterioincluding a bmatrix, whichstudied), econatings (option
teria and ben
work for Transp
e 18 subcritered as a qual
ely positive, ntive. The risk itative assess
o account the
economic, pocriteria drawsgation, howevelop a profesvironmental crhree-point sc
criteria scoreshighly sustain
ely unsustainn equal 30% won counts forhighly sustai
on. brief descripth includes fnomic returns
nal).
nchmarks app
port | 7
ria for itative
neutral rating sment scale
overty upon ver, is sional riteria. cale is
s and nable, nable, weight r 10% inable
ion of further s, and
plied.

8 | ADB Sustainable Development Working Paper Series No. 31
2.3 What Is a Sustainable Transport Project? This rating framework implicitly defines “sustainable transport projects” as having positive net economic, social, and environmental impacts. They make efficient use of resources, and are within or strengthen the financial and institutional capacity of the local institutions to deliver such projects. Such projects may have limited and acceptable trade-offs between the dimensions of sustainability. 2.4 Who Prepares the Rating? Various procedures for constructing the rating can be conceived. Their applicability depends on the institutional context and the point within the project cycle at which the framework is applied. In particular, there will be a difference between those MDBs in which the rating is informal and those in which it becomes an integral part of the normal business processes. Sources of information and individuals that can be drawn upon include project documents, project officer(s), the project’s peer reviewer, the head/secretariat of the transport community of practice, the internal departments or divisions in charge of economic evaluation, risk and safeguard compliance, and the independent evaluation office. The following are possible procedures and their advantages and/or requirements:
Informal/self-rating: The project officer prepares a draft rating, which is confirmed by a peer reviewer (a transport professional from a different department of the MDB) and/or debated during a project review meeting that includes transport, social development, and environmental specialists, and economists. The rating can then be reviewed and revised by a coordination team within the MDB or an independent auditor, and endorsed by the head of the transport community of practice. Because it needs to run in parallel to the standard appraisal cycle of the MDB, there is a risk that this rating may become contentious. It may be most appropriate as an informal exercise carried out early in the preparation of the project, rather than during its appraisal.
Informal/post facto: A team of raters prepares the rating. The team preferably includes a transport specialist, an economist, a social development specialist, and an environmental specialist. The raters meet to aggregate their scores and/or ensure consistency in the approach. This rating should be carried out after the project has already been approved, on the basis of available information. This arrangement is best suited in contexts where the rating is informal and needs to avoid conflicts with the normal business processes of the MDB.
Official/decentralized: The rating is prepared by the project team and included in the documentation submitted to the MDB’s board or management. Ratings for each core criterion are confirmed by the departments or divisions in charge of economic analysis, risk, and safeguard compliance. Some of these ratings may even be directly provided to the project officer by these departments or divisions. The project officer then prepares the aggregate rating and narrative and includes it in the project documentation. Approval of the project by the MDB’s board or management implies validation of the rating. To work well, this arrangement needs to be mandated by the MDB management.
Official/centralized: The rating is prepared by a rating committee. Each member of the rating committee prepares a rating. A committee meeting is held to reconcile ratings in case of major discrepancies between raters and to reach a consensus. It may also be possible to ask a secretariat to the committee to prepare the rating (in the same way as a credit risk evaluation would be carried out). The committee may consider several projects at a time (e.g., if meetings are held on a regular schedule) or meet each time a project is appraised (in which case the project officer may be present at the committee meeting). If this process is mandated by the MDB management, it may be possible to ask the project officer for specific information; otherwise, committee members should work on the basis of available project documentation.
When designing the rating procedure(s), two key questions arise: The first involves how to ensure consistency between assessments. Within an MDB, a similar group of people should be involved in helping prepare or endorse the assessments until the rating process is well established. A periodic review of procedures between MDBs may help ensure consistency between MDBs. The second question is how to avoid conflicts of interest. The project officer, the operations department, and potentially the MDB as a

Toward a Sustainability Appraisal Framework for Transport | 9
whole cannot guarantee impartiality when rating projects that have received or will receive financing. There may be a role for involving “compliance” divisions and independent evaluation offices, or making the information available to the public online. It may also be possible to involve both clients and nongovernment organizations interested in transport sustainability in the evaluation process.
3. Using the Ratings 3.1 Usage in the Project Cycle The rating process can be carried out in parallel and as an integral part of the standard MDB project cycle. In ADB, this includes the country partnership strategy (programming), project preparation (concept development), project approval (appraisal), project implementation, and completion/evaluation. In the programming stage, the framework can serve as a checklist, to initially screen project proposals against the criteria. In later stages, the framework can be applied with more rigor, based on data collected during project preparation. Country partnership strategy (programming stage). To achieve high operational efficiency, the rating can be used during project and sector programming, as part or in parallel to discussions with clients of country programs. It would give early indications on the type of transport projects that are the most “sustainable” (i.e., help achieve the sustainable transport objectives), while still being consistent with the governments’ priorities. The criteria and subcriteria in STAR can in a way be used as a checklist to see which projects may yield best opportunities to improve the sustainability of the transport sector in a specific country. Individual projects should be rated separately. While information available may be very basic at this stage, this would help prioritize alternative projects competing for inclusion in the country program. It could be possible to rate the program as a whole, the underlying question being “Will the program of investments contribute to advancing MDB sustainable transport objectives?” Project preparation (concept stage). To maximize the usefulness of the rating system, draft ratings of a project could be prepared during project concept development. This would enable project pipeline reporting. The discussion of the draft ratings between internal stakeholders would also help identify project options or features that can maximize the project’s sustainability. The following would be some of the questions to ask: Is it possible to enhance the project’s contribution to sustainable transport objectives? Is it possible to increase participation by stakeholders? Can risks be minimized or mitigated? This process would best be conducted as a collaborative multidisciplinary exercise where stakeholders, engineers, economists, and social and environmental specialists are tasked to collectively propose measures to enhance the project. Selected opportunities to enhance the project’s positive outcomes should be developed during project preparation by the project team or consultants, in consultation with the borrower. This process would help improve the project design and final project and portfolio ratings. Project approval (appraisal stage). As a minimum, the rating should be carried out at the same time or shortly after the appraisal of the project. This is to provide the information arising from the rating to the project approvers, give incentives to design the project in a way that maximizes its sustainability, and provide a common reference point for evaluating the sustainability of projects designed by the MDB. In addition, this is also when the information about the project is most fresh in the memory of the project officer, when the possibility to involve other institutional actors (e.g., peer reviewer, compliance departments, transport community of practice) in the assessment exists, and when synergies with other processes involved during project preparation are the greatest. Specifically, indicators used in the construction of the rating could also be used in the results framework of the project (i.e., ADB’s design and monitoring framework) or in the social and environmental assessments. Portfolio monitoring (post-appraisal). Aggregated project ratings will inform the MDB’s internal business management. Tracking over time-aggregated ratings by year of approval, countries, or region will help inform MDBs which parts of their transport operations are best supporting their sustainable transport objectives, and how other parts could be adjusted in future.

10 | ADB Sustainable Development Working Paper Series No. 31
Evaluation stage. The evaluation could also be repeated after project completion, in parallel with the preparation of the project completion report. Because of the project implementation time frame, the information would come about 4–6 years after projects have been approved. This suggests that post facto assessments should primarily aim at improving assessment methods rather than at enabling portfolio monitoring. It could be done on a sample basis to avoid confusion with the standard evaluation of project performance. As only operational risks remain at that stage, the risk to sustainability criteria and weightings would need to be adjusted. 3.2 Corporate-Level Portfolio Reporting Results of ratings conducted at the project level can be aggregated to support corporate-level portfolio reporting. This could rely on the following indicators:
% of newly approved transport projects with sustainability ratings % of new transport project concepts with sustainability ratings % of new country strategies with a sustainability rating of the transport investment program % of approved projects by rating categories annually and since 2013 % of project concepts by rating categories annually and since 2013 % of projects with high ratings under social and environmental dimensions
MDBs could also opt to include in their report other portfolio, efficiency, and outcome indicators as outlined in 1.1.
4. Worked Examples
Three worked examples are presented in this paper to illustrate the STAR methodology. The first one deals with an expressway project, the second considers a bus rapid transit project, and the last a rural road project. All are hypothetical projects, even though their features draw from actual project cases. The first two examples involve the full application of the rating framework—at the project concept stage and the appraisal stage. The third example is a case study used for training purposes. It relies on a simplified version of the framework, purely qualitative, that can be applied in a short time (from 10 minutes to 1 hour). This simplified rating can be used during the early phase of a project for brainstorming. It can also be used for preparing desk-based ratings of approved projects, using the information contained in the project documents.

Uns
Highly
sustainable
4.1 W
Narrative
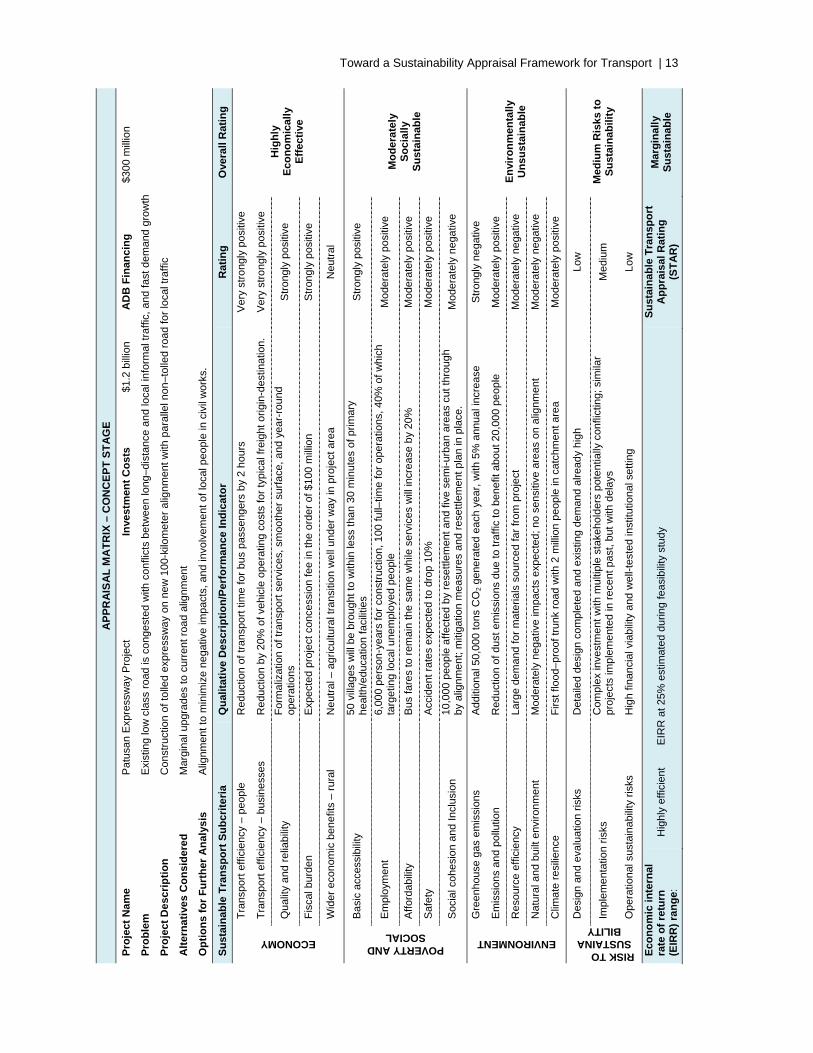
The projea poor anThe projebillion. Tharea, and
Economipositive improject coexpected reliability benefits a
Social suimpacts olow in comwill have employmecreated focohesion,strongly pfast and s
Environmdemands will makeConverseresource limited benonsensitproviding
Risk to sdetailed don the coframeworconcessio Rating Co
Worked Exa PatusanRating:
e Evaluation ct will upgradd densely poct includes a
he current trafmost of the e
c effectivenmpacts on moorridor is high
to be aroundimprovement
are expected.
ustainability:on rural peoplmparison to o
a moderateent, with moror maintenan because of
positive impacslow traffic an
mental sustafor land, ma
e large contriely, it will havefficiency ha
ecause the chtive. The proa more flood-
sustainabilitdesign has beorridor. Similak is tested. Gonaires. The p
onstruction
–10 to –5
ample 1: P
n ExpresswMarginally
de 100 kilomepulated rural parallel non-tffic level is aexisting road
ess: The proobility by red
h. It will have d $100 milliots are expecThese outco
: The project le’s accessibi
operational coely positive imre than 2,000nce and operresettlement ct on road sad with the inc
ainability: Thaterials, transbutions to em
ve a moderats been made
hanges to aligoject will hav-resilient trun
ty: The projeeen completear concessioGovernment project has a
Core CriteHighly econModeratelyEnvironmeMedium ris
–4 to –2
T
Patusan Ex
way Projecy Sustainab
eters of low-carea of a lowtolled road to bove 6,000 vcorridor can b
oject is rateducing transpostrong positivn and mainte
cted due to tmes match th
is rated modility to basic sost savings anmpact on aff people empration. The pneeds and a
afety by cuttincorporation of
he project is port, and mamission loadstely positive ie. Additional ignment of theve a moderatk access road
ect is rated med. Market risn projects haprocedures hhigh financia
eria Ratingsnomically effey socially sustntally unsusta
sks to sustaina
–1 to 0 S
Toward a Sust
xpressway
t ble (2)
lass road to ewer middle-inc
be used by svehicles per dbe reused.
d highly econort time by mve impacts onenance will bthe all-weathhe project sca
derately sociaservices in thnd because thfordability. It loyed on con
project will has the road wng accident rf road safety m
rated enviroachinery durins of greenhoimpact on duimpacts on th
e road will betely positive d to a large p
medium risk.k is limited bave been imhave often lel viability.
ective tainable ainable ability
Tot
Marginally
Sustainable
tainability Appr
Project (C
expressway scome countryslow, local traday. The proj
nomically effemore than 2 h
n fiscal burdebe financed ber design, b
ale: the intern
ally sustainabhe vicinity of there is a parawill have m
nstruction for ave moderateill cut across rates by aboumeasures bas
onmentally unng constructioouse gases, aust emissionshe natural an minimal andimpact on topulation.
There are ecause there
mplemented ined to delays
Sco31
–20
tal 2
3 to 4
raisal Framewo
Concept Sta
standard. They. The expressaffic. Total project is located
fective. It will ours, and tra
en, as the tollby the tolls. Mut no specifial rate of retu
ble. It will havthe road. Becallel non-tolle
moderately po3 years, and
ely negative peri-urban a
ut 20%, throused on best p
nsustainable.on and duringair pollutantss. No specificnd built envirod the environmransport syst
limited cost e is already an the past, aand difficult
ore 3
2
0 2
5 to 6
ork for Transpo
age)
e road is locasway will be t
oject costs ared in a flat hig
have very savel demand l concession
Moderately poic wider econurn is 25%.
ve strongly pocause bus toled road, the positive impacd 100 full-time
impacts on reas. It will hugh segregatpractice.
. It will haveg operation,
s, noise, and c consideratioonment will rement is consitem resilienc
risks becausan existing deand the regu
relationships
7 to 10
ort | 11
Highly
Sustainable
ated in tolled. e $1.2 ghland
strong in the fee is
ositive nomic
ositive lls are project cts on e jobs social ave a
tion of
e high and it light. on for emain dered
ce, by
se the emand ulatory s with
e

12 | ADB S
Rating Ov
The projein CO2 em
Key pros:
H M Lo La In
flo Areas with
Fuin
Em
Rw
Sustainable Dev
verview
ct as a wholemissions can b
igh economic rMajor reduction ower fares exparge increase increased resiliood risk
h potential forurther reducincreasing revenmployment p
maintenance, paRural accessibilwith agricultural
velopment Wo
e is rated marbe contained
Figure 2
rates of return in transport tim
pected for bus tn road safety ience of trans
r further strengng governmenues otential for carticularly womlity to public sdevelopment
rking Paper Se
rginally sustaior offset thro
2: Worked Ex
mes transport
sport network
gthening ent support a
construction amen
ervices, and li
eries No. 31
inable, and wugh strong en
xample 1—R
Key con
k to
Areas fo
and
and
nks
with potential fnvironmental
Rating Overv
ns: Construction-of greenhous
or improvemeNo considera
Punctual seresettlement nLand take hanatural enviroNo considerawill benefit fro
for upsides if managemen
view
- and operatioe gases, pollut
ent/mitigation:ation for resourc
everance of needs
as moderately onment and bioation on how tom the project
forecast incret.
on-related emitants and noise
: ce efficiency
communities
negative impaodiversity he poor and w
eases
ssions e
and
acts on
women
Toward a Sustainability Appraisal Framework for Transport | 13
AP
PR
AIS
AL
MA
TR
IX –
CO
NC
EP
T S
TA
GE
Pro
ject
Na
me
P
atus
an E
xpre
ssw
ay
Pro
ject
In
vest
men
t C
os
ts
$1.2
bill
ion
AD
B F
inan
cin
g
$300
mill
ion
Pro
ble
m
Exi
stin
g lo
w c
lass
roa
d is
con
gest
ed w
ith c
onfli
cts
betw
een
long
–dis
tanc
e an
d lo
cal i
nfo
rmal
traf
fic, a
nd fa
st d
eman
d gr
ow
th
Pro
ject
De
scri
pti
on
C
onst
ruct
ion
of t
olle
d ex
pres
swa
y on
ne
w 1
00-k
ilom
eter
alig
nmen
t w
ith p
ara
llel n
on–t
olle
d ro
ad fo
r lo
cal t
raffi
c
Alt
ern
ati
ves
Co
nsi
der
ed
M
argi
nal u
pgra
des
to c
urre
nt r
oad
alig
nmen
t
Op
tio
ns
for
Fu
rth
er A
nal
ysis
A
lignm
ent t
o m
inim
ize
nega
tive
impa
cts,
and
invo
lvem
ent o
f loc
al p
eopl
e in
civ
il w
orks
.
Su
stai
nab
le T
ran
spo
rt S
ub
crit
eri
a
Qu
alit
ativ
e D
escr
ipti
on
/Per
form
ance
In
dic
ato
r R
atin
g
Ove
rall
Rat
ing
ECONOMY
Tra
nspo
rt e
ffici
ency
– p
eopl
e
Red
uctio
n of
tran
spor
t tim
e fo
r bu
s pa
ssen
gers
by
2 ho
urs
Ver
y st
rong
ly p
osi
tive
Hig
hly
E
con
om
ical
ly
Eff
ecti
ve
Tra
nspo
rt e
ffici
ency
– b
usin
esse
s R
educ
tion
by
20
% o
f veh
icle
ope
ratin
g co
sts
for
typi
cal f
reig
ht o
rigin
-des
tinat
ion.
V
ery
stro
ngly
po
sitiv
e
Qua
lity
and
relia
bilit
y F
orm
aliz
atio
n of
tra
nspo
rt s
ervi
ces,
sm
ooth
er s
urfa
ce, a
nd y
ear-
rou
nd
oper
atio
ns
Str
ongl
y po
sitiv
e
Fis
cal b
urde
n E
xpec
ted
proj
ect c
once
ssio
n fe
e in
the
orde
r of
$1
00 m
illio
n
Str
ongl
y po
sitiv
e
Wid
er e
cono
mic
ben
efits
– r
ural
N
eutr
al –
ag
ricul
tura
l tra
nsiti
on w
ell
unde
r w
ay
in p
roje
ct a
rea
N
eutr
al
POVERTY AND SOCIAL
Ba
sic
acc
essi
bilit
y
50 v
illag
es w
ill b
e br
ough
t to
with
in le
ss th
an 3
0 m
inut
es o
f prim
ary
heal
th/e
duca
tion
faci
litie
s
Str
ongl
y po
sitiv
e
Mo
der
ate
ly
So
cial
ly
Su
stai
nab
le
Em
plo
ymen
t 6,
000
pers
on-y
ear
s fo
r co
nstr
uctio
n, 1
00 fu
ll–tim
e fo
r op
erat
ions
, 40%
of
whi
ch
targ
etin
g lo
cal u
nem
plo
yed
peop
le
Mod
erat
ely
posi
tive
Aff
orda
bilit
y
Bus
fare
s to
rem
ain
the
sam
e w
hile
ser
vice
s w
ill in
crea
se b
y 20
%
Mod
erat
ely
posi
tive
Saf
ety
Acc
iden
t rat
es e
xpec
ted
to d
rop
10%
M
oder
atel
y po
sitiv
e
Soc
ial c
ohes
ion
and
Incl
usio
n
10,0
00 p
eopl
e af
fect
ed b
y re
settl
emen
t and
five
sem
i-urb
an a
reas
cut
thro
ugh
by
alig
nmen
t; m
itiga
tion
mea
sure
s an
d re
settl
emen
t pla
n in
pla
ce.
Mod
erat
ely
nega
tive
ENVIRONMENT
Gre
enh
ouse
gas
em
issi
ons
Add
ition
al 5
0,00
0 to
ns C
O2
gene
rate
d ea
ch y
ear,
with
5%
ann
ual
incr
ease
S
tron
gly
nega
tive
En
viro
nm
enta
lly
Un
sus
tain
able
Em
issi
ons
and
pollu
tion
Red
uctio
n of
dus
t em
issi
ons
due
to tr
affic
to b
enef
it ab
out 2
0,00
0 pe
ople
M
oder
atel
y po
sitiv
e
Res
ourc
e ef
ficie
ncy
Larg
e de
man
d fo
r m
ater
ials
sou
rced
far
from
pro
ject
M
oder
atel
y ne
gativ
e
Nat
ural
and
bui
lt en
viro
nmen
t M
oder
atel
y ne
gativ
e im
pact
s ex
pect
ed; n
o se
nsiti
ve a
reas
on
alig
nmen
t M
oder
atel
y ne
gativ
e
Clim
ate
resi
lienc
e F
irst f
lood
–pro
of t
runk
roa
d w
ith 2
mill
ion
peop
le in
cat
chm
ent a
rea
M
oder
atel
y po
sitiv
e
RISK TO SUSTAINA
BILITY
Des
ign
and
eval
uatio
n ris
ks
Det
aile
d de
sign
co
mpl
eted
and
exi
stin
g de
man
d al
read
y hi
gh
Low
Med
ium
Ris
ks
to
Su
stai
nab
ility
Im
plem
enta
tion
risk
s C
ompl
ex in
vest
men
t w
ith m
ultip
le s
take
hold
ers
pote
ntia
lly c
onfli
ctin
g; s
imila
r pr
ojec
ts im
plem
ente
d in
rec
ent p
ast
, but
with
del
ays
M
ediu
m
Ope
ratio
nal s
usta
inab
ility
ris
ks
Hig
h fin
anci
al v
iabi
lity
and
wel
l-tes
ted
inst
itutio
nal s
ettin
g Lo
w
Eco
no
mic
in
tern
al
rate
of
retu
rn
(EIR
R)
ran
ge:
H
ighl
y ef
ficie
nt
EIR
R a
t 25
% e
stim
ated
dur
ing
fea
sibi
lity
stud
y S
ust
ain
able
Tra
nsp
ort
A
pp
rais
al R
atin
g
(ST
AR
)
Mar
gin
ally
S
ust
ain
able

Uns
14 | ADB S
Highly
sustainable
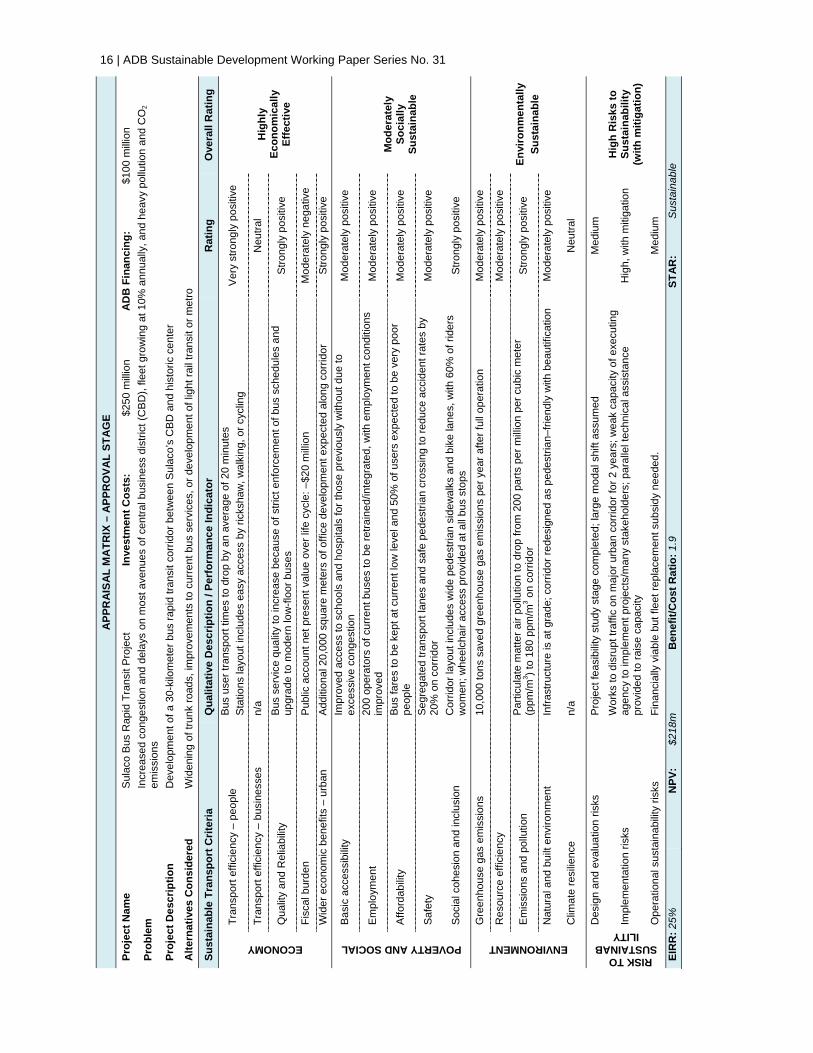
4.2 W SummaryThe projethe businetraffic is e
Economiis 25%. particularlreliability long run, SignificanBRT corri
Social subasic accefare will employmepotential parts in–cstations wsecurity wcorridor bMinimal rsafety for
Environmpositive imgas–baseshare by constructifeatures,
Risk to slimited sudisrupt roregulatoryconflictingFinancial
Rating Co
Sustainable Dev
Worked Exa
SulacRatin
y Appraisal ect will create ess district w
expected to be
c effectiveneIt will have ly at bus stopimprovement but the gov
nt wider econodor.
ustainability:essibility is exbe applied,
ent are expecfor reemploycountry is unwill be universwill be enhanbeautification,resettlement all road users
mental sustampact on air ed one as welan estimatedon emissionsit will improve
ustainabilityurveys, and thoad traffic on y authority hg interests. Tviability is en
onstruction
CHMEH
–10 to –5
velopment Wo
ample 2: S
co Bus Rapng: Su
three new buwith the histore about 500,0
ess: The projhighly positi
ps. The shift tcompared w
vernment is romic benefits
The project xpected. The while previo
cted to be posyment/retrainincertain. The sally accessibnced. The pr public spaceis expected. s, including p
ainability: Thpollution emill as the optim 10%. Overas offset aftere the urban bu
y: The projecthe basis for da busy arteras a poor reThe project sured during
Criterion Ratiighly econom
Moderately socnvironmentaligh risks to su
–4 to –2
rking Paper Se
Sulaco Bus
pid Transitustainable
us rapid transic center of th
000 passenge
ject is rated hve impacts to regular busith current infready to prov are expected
is rated modproject will h
ously people sitive, with 1,0ng of all infoproject will
ble, while currroject will have creation arBetter road
pedestrians.
he project is ssions throug
mization of roll, CO2 emissr 3 years onuilt environme
t risks are ratedesigning statial road. Theeputation. Prprovides a lthe first 10 ye
ng mically effectivcially sustainaly sustainableustainability (
–1 to 0
eries No. 31
s Rapid Tra
t Project (5.0)
sit (BRT) linehe town. Tota
er-trips per da
highly economon mobility, s operations formal systemvide a moded, as the proj
derately sociaave a modera
had to pay000 person-yormal drivers/have a modrent stationsve a large pound the stadesign will h
rated environgh the retiremoutes. Quality sions reductioly. As the prent. Stations a
ed high, with mtion size mayconcession
roject implemlarge technicears, but a su
ve able e with mitigatio
1 to 2
ansit Proje
es of total lengal project cos
ay. The projec
mically effectias projectedand high com
m. The systemest annual suect will foster
ally sustainabately positive y each time years of emplo/mechanics aerately positare not, and
positive impacations, and emhave a mode
nmentally susment of the ol
bus service on is estimateroject is at gare designed
mitigation. Thy be too wearegulatory fra
mentation invcal assistancubsidy is need
on) Total
3 to 4
ect (Apprais
gth of 30 kilosts are $250 ct is at grade.
ive. The exped corridor comfort bus is am is unlikely toubsidy for car urban densi
ble. A moderaimpact on affthey transfe
oyment for coand productioive impact oaccess for wct on social mphasis on perately positiv
stainable. It ld diesel bus will limit the l
ed at 10,000 tgrade and co to limit energ
he demand ank. BRT statioamework is nvolves many ce to facilitatded for fleet re
Score 3 1 2
–1 5
Sustainable
sal Stage)
ometers connemillion. Pass
ected rate of ongestion is a major qualito break even apital replacefication aroun
ate improvemfordability, aserred. Impaconstruction, bon of buses/
on inclusion, women and ge
cohesion, thpedestrian acve impact on
will have a sfleet and use
long-run car mtons annuallyontains aesthgy use.
nalysis is bason constructionot tested, an
stakeholderste implementenewal.
7 to 10 Highly
Sustainable
ecting enger
return high,
ty and in the
ement. nd the
ment in s a flat cts on but the /spare as all eneral rough ccess. n road
strong e of a modal y, with hetical
sed on on will nd the s with tation.
e

Rating Ov
Overall, thsocial ben
Key pros: H Lo M
an M
pu R
ju C
w
Areas with E
Af
verview he project is nefits enhance
igh economic rower fares exp
Major reduction nd moderate im
Major improvemublic transport
Road safety imnctions areful conside
women and peo
h potential formployment pot
ffordability for l
rated sustained.
Figure 3
rates of return pected for door-
in transport timmprovement forments in quality
mprovements a
eration on impople with limited
r further strengtential for curre
low-income peo
T
nable, with p
3: Worked Ex
-to-door trips mes for bus ridr car drivers y and reliability
at crossings a
roving access d mobility
gthening:ent bus drivers
ople
Toward a Sust
otential for u
xample 2—R
Key con
ders
y of
and
for
Areas fo
tainability Appr
psides if risk
Rating Overv
ns:n/a
or improvemeRisky impleminstitutional seUncertainties bus/station loOperating sfinancing
raisal Framewo
ks can be fur
view
ent/mitigation:mentation due etup and limite
in traffic oading ubsidy/future
ork for Transpo
rther mitigated
: to complex/un
ed local capacitprojections
bus fleet re
ort | 15
d and
ntested ty
and
enewal
AP
PR
AIS
AL
MA
TR
IX –
AP
PR
OV
AL
ST
AG
E
Pro
ject
Na
me
S
ulac
o B
us R
apid
Tra
nsit
Pro
ject
In
vest
men
t C
os
ts:
$250
mill
ion
AD
B F
inan
cin
g:
$1
00 m
illio
n
Pro
ble
m
Incr
ease
d co
nge
stio
n an
d de
lays
on
mos
t ave
nues
of c
entr
al b
usin
ess
dist
rict (
CB
D),
flee
t gro
win
g at
10%
ann
ual
ly, a
nd
heav
y po
llutio
n a
nd C
O2
emis
sion
s
Pro
ject
De
scri
pti
on
D
evel
opm
ent o
f a
30-k
ilom
eter
bus
rap
id tr
ansi
t co
rrid
or b
etw
een
Sul
aco’
s C
BD
and
his
toric
cen
ter
Alt
ern
ati
ves
Co
nsi
der
ed
W
iden
ing
of tr
unk
road
s, im
prov
em
ents
to c
urre
nt b
us s
ervi
ces,
or
deve
lopm
ent o
f lig
ht r
ail t
rans
it or
met
ro
Su
stai
nab
le T
ran
spo
rt C
rite
ria
Q
ual
itat
ive
Des
crip
tio
n /
Per
form
ance
In
dic
ato
r R
atin
g
Ove
rall
Rat
ing
ECONOMY
Tra
nspo
rt e
ffici
ency
– p
eopl
e
Bus
use
r tr
ansp
ort
tim
es to
dro
p b
y an
ave
rage
of
20 m
inut
es
Sta
tions
layo
ut in
clud
es e
asy
acce
ss b
y ric
ksha
w,
wal
king
, or
cycl
ing
Ve
ry s
tro
ng
ly p
osi
tive
Hig
hly
E
con
om
ical
ly
Eff
ecti
ve
Tra
nspo
rt e
ffici
ency
– b
usin
esse
s n/
a N
eutr
al
Qua
lity
and
Rel
iabi
lity
Bus
ser
vice
qua
lity
to in
crea
se b
eca
use
of s
tric
t enf
orce
men
t of b
us s
ched
ules
and
up
grad
e to
mod
ern
low
-flo
or b
use
s
Str
ongl
y po
sitiv
e
Fis
cal b
urde
n P
ublic
acc
ount
net
pre
sent
val
ue o
ver
life
cycl
e: –
$20
mill
ion
Mod
erat
ely
nega
tive
Wid
er e
cono
mic
ben
efits
– u
rban
A
dditi
onal
20,
000
squa
re m
ete
rs o
f offi
ce d
evel
opm
ent
exp
ecte
d al
ong
corr
idor
S
tron
gly
posi
tive
POVERTY AND SOCIAL
Ba
sic
acc
essi
bilit
y
Impr
oved
acc
ess
to s
choo
ls a
nd h
ospi
tals
for
thos
e pr
evio
usly
with
out
due
to
exce
ssiv
e co
nges
tion
Mod
erat
ely
posi
tive
Mo
der
ate
ly
So
cial
ly
Su
stai
nab
le
Em
plo
ymen
t
200
oper
ato
rs o
f cu
rren
t bus
es to
be
retr
aine
d/in
tegr
ated
, w
ith e
mpl
oym
ent c
ondi
tion
s im
prov
ed
Mod
erat
ely
posi
tive
Aff
orda
bili
ty
Bus
fare
s to
be
kept
at c
urre
nt lo
w le
vel a
nd 5
0% o
f us
ers
expe
cted
to
be v
ery
poor
pe
ople
M
oder
atel
y po
sitiv
e
Saf
ety
S
egre
gate
d tr
ansp
ort l
anes
and
sa
fe p
edes
tria
n cr
oss
ing
to r
educ
e ac
cide
nt r
ates
by
20%
on
corr
idor
M
oder
atel
y po
sitiv
e
Soc
ial c
ohes
ion
and
incl
usio
n
Cor
rido
r la
yout
incl
udes
wid
e pe
des
tria
n si
dew
alks
and
bik
e la
nes,
with
60
% o
f rid
ers
wom
en;
whe
elch
air
acce
ss p
rovi
ded
at a
ll bu
s st
ops
Str
ongl
y po
sitiv
e
ENVIRONMENT
Gre
enh
ouse
gas
em
issi
ons
10,0
00 to
ns s
ave
d gr
eenh
ous
e ga
s em
issi
ons
per
year
afte
r fu
ll op
erat
ion
M
oder
atel
y po
sitiv
e
En
viro
nm
enta
lly
Su
stai
nab
le
Res
ourc
e ef
ficie
ncy
M
oder
atel
y po
sitiv
e
Em
issi
ons
and
pollu
tion
Par
ticul
ate
mat
ter
air
pollu
tion
to d
rop
from
200
pa
rts
per
mill
ion
per
cubi
c m
eter
(p
pm/m
3)
to 1
80 p
pm/m
3 on
corr
idor
S
tron
gly
posi
tive
Nat
ural
and
bui
lt en
viro
nmen
t In
fras
truc
ture
is a
t gra
de; c
orr
idor
red
esig
ned
as p
edes
tria
n–fr
iend
ly w
ith b
eaut
ifica
tion
Mod
era
tely
pos
itive
Clim
ate
resi
lienc
e n/
a N
eutr
al
RISK TO SUSTAINAB
ILITY
Des
ign
and
eval
uatio
n ris
ks
Pro
ject
feas
ibili
ty s
tud
y st
age
com
plet
ed; l
arge
mo
dal s
hift
assu
med
M
ediu
m
Hig
h R
isks
to
S
ust
ain
abili
ty
(wit
h m
itig
atio
n)
Impl
emen
tatio
n ri
sks
Wor
ks to
dis
rupt
traf
fic o
n m
ajor
urb
an c
orrid
or fo
r 2
yea
rs;
wea
k ca
paci
ty o
f exe
cutin
g ag
ency
to im
ple
men
t pro
ject
s/m
an
y st
akeh
olde
rs;
para
llel t
echn
ical
ass
ista
nce
prov
ided
to r
aise
cap
acity
H
igh,
with
miti
gatio
n
Ope
ratio
nal s
usta
inab
ility
ris
ks
Fin
anci
ally
via
ble
but f
leet
rep
lace
men
t sub
sid
y ne
eded
.
Med
ium
EIR
R:
25%
NP
V:
$2
18m
Ben
efit
/Co
st R
ati
o:
1.9
ST
AR
:
Sus
tain
able
16 | ADB Sustainable Development Working Paper Series No. 31

4.3 W(S
Summary Backgrouis among that muchThe goveinvestmentwo provinhave all-wkilometersmarkets, f The projeall-weatheworks willestimatednumber ohas been lack apprbudgetingcontracts for road mbe used to Project bThese roarough rideexpected vehicle opfreight rattravel timeis estimat Social implace in hattendanctravel aloprogramszones of increase, opportunit Environmto rise by motor veh
Worked ESimplified
CostaRatin
y of Project D
und: Costaguthe main und
h of the rural ernment has nt and has asnces of Costaweather road s (km) from fertilizer or pe
ect: The projeer road acces consist gene
d at $300 milliof people in th
a major issueropriate skillsg and planninafter the road
maintenance. o prepare gui
benefits: The ads become ie during the rto (i) increas
perating coststes by 20% ie to the neareed at 14% for
mpacts: Shorhealth facilitiece and reduceone on buses. The project unrest. Becadespite mitigties in the sho
mental impacabout 50% o
hicles. No dire
xample 3Rating Me
aguana Ru
ng: Modera
Documentati
uana is a denderlying causpopulation lividentified mo
sked ADB to aguana whereaccess, and subhealth ce
esticide shops
ect will financss to 1,000 verally in blackon, of which A
he area, curree in the past, , and funding
ng systems fods are built. TA road safetydelines to ap
villages targempassable arest of the yese speeds frs of cars and n real terms,
est town may r the entire pr
rter travel times. The shorte dropout rats or bicyclesis also expec
ause of the eation efforts. ort run but like
cts: The projeon the roads, ect adverse im
3: Costagethodology
ural Road Dately Susta
ion
sely populatees of poverty
ves in areas thore than 15,0help fund pae the poverty22% have acenters and ws, or veterinar
ce the constrvillages—with
ktopping curreADB will finan
ent access coas there are
g has been sor maintenancThe provinciay audit will beply to the res
eted are currebout 2 month
ear. The projerom average jeeps by 50%, and (iv) incdrop from typ
rogram.
mes to health ter access timtes. Women w to towns, acted to improvexpected incOutward migely also deter
ect will increaand as trave
mpact from th
guana Ruy)
Developmeainable (4.0
ed lower middy in Costaguahat are cut of000 villages trt of the cost
y rate is abovccess to bus sweekly markery services.
uction of aboh a combinedent earth tracknce $200 millonditions, and
few qualifiedscarce. To mce of the prol government
e carried out ot of the projec
ently only acchs of the year ect will impro20–30 kilom
% and of busecrease bus frpically 3 hour
facilities alsomes to schoowill benefit fr
and have betve basic secu
crease in trafgration is experiorating the s
ase greenhouselers will shifthe works is ex
ural Road
ent Project0)
dle-income coana. Past negff from the ecthat require mts. The goverve 40%. In theservices. Theets, and 10
out 5,000 km d population ks and addinglion. The roadd poverty incid contractors a
mitigate theseoject roads ants have also con 10% of thect.
cessible throuduring the ra
ove the road smeters per hoes by 40%, (iirequency by rs to 20 minut
o mean that ols are anticirom the projetter access turity, as the pffic, there is ected to occusocial fabric in
se gas emisst from low-carxpected, but t
Develop
t
ountry. Lack oglect of the roconomic and smedium-termrnment has pese areas, one villages are km away fro
of rural roadsof about 5 m
g infrastructurds will be seledence. Rural available, gov
e risks, the pnd procure 5-committed to e project road
ugh dirt tracksainy season asurface and a
our (kph) to 6ii) reduce bus50%. During tes. The econ
most child dpated to help
ect as they wto informationpolice will hava risk that r
ur, providing imn the long run
sions, as roadrbon modes (there is a risk
pment Pro
of road conneoad network msocial mainst
m road connearticularly tarnly 45% of vitypically loca
om schools,
s. This will prmillion peoplere. The total cected based oroad mainten
vernment ageproject will de-year maintenincreasing fu
ds, and lesson
s or earthen rand allow for aalignments. T60 kph, (ii) res fares by 10%
the rainy senomic rate of
deliveries canp increase teill be more an and governve easier acceroad accidentmproved livel
n.
d traffic is exp(bullocks, bik that illegal lo
oject
ectivity means tream. ectivity rgeted llages ated 5 larger
rovide e. The cost is on the nance encies evelop nance unding ns will
roads. a very This is educe % and eason, return
n take eacher ble to nment ess to ts will lihood
pected kes) to ogging

18 | ADB Sustainable Development Working Paper Series No. 31
will occur. Better drainage will improve water flows in the area, and blacktopping the roads will reduce fugitive dust emissions. No particular attention has been given to ensure that the design of the roads minimizes energy or water use, but established practices generally rely on use of local, durable materials. Project implementation: The project will be implemented in phases over 4 years. The rural road departments of the provinces will be the implementing agencies for the project. The project implementation team will consist of a project management consultant and five groups of project implementation consultants. They will carry out public consultations through meetings with communities before road works start. The works will be procured to local contractors in small packages. Rater’s Narrative Comments and Simplified Rating Table Economics: The project supports the paving of mainly low-volume roads. The average economic rate of return, at 14%, is moderate, but the transport benefits for the population served will be very significant. A very positive economic benefit will also derive from the improved quality and reliability of the road. Agricultural impacts are likely positive, but project documentation does not estimate this benefit. Social: The project scores highly for social impact, due to the basic accessibility afforded to the population. The risk of road crashes may be heightened due to higher traffic speeds, but countermeasures are carefully designed into the project. Environment: The roads will use the current right of way, and, given that traffic volumes will remain low, emissions will also be limited. Even though greenhouse gas emissions will necessarily increase, dust emissions will be reduced. Climate resilience will also marginally increase because of better drainage. Risks: Risks are high, despite the efforts from the project team to mitigate them. Implementation rests on a complex decentralized structure, and there is a poor track record on maintenance. Because the roads still need to be identified, estimates of their costs and benefits derive from proxy information only. Overall: The project is rated moderately sustainable. Project Name: Costaguana Rural Road Development Project
Project Description: Construction or paving of 5,000 kilometers of rural roads ADB Financing: $200 million
Sustainable Transport Objectives Contribution to Each
Objective Rating by
Dimension Score
EC
ON
OM
Y Transport efficiency – people Very strongly positive
Economically Effective
2
Transport efficiency – businesses Moderately positive
Quality and reliability Strongly positive
Fiscal burden Neutral
Wider economic benefits – agriculture Moderately positive
PO
VE
RT
Y
AN
D
SO
CIA
L
Basic accessibility Very strongly positive
Socially Sustainable 2
Employment Moderately positive
Affordability Strongly positive
Safety Neutral
Social cohesion and inclusion Neutral
EN
VIR
ON
ME
NT
Greenhouse gas emissions Moderately negative
Moderately environmentally
sustainable 1
Emissions and pollution Moderately positive
Resource efficiency Neutral
Natural and built environment Moderately positive
Climate resilience Moderately positive
RIS
K
TO
S
US
T Design and evaluation risks Medium
High,
with Mitigation –1 Implementation risks High, with mitigation
Operational sustainability risks High, with mitigation
Overall Rating: Moderately Sustainable 4

Toward a Sustainability Appraisal Framework for Transport | 19
5. Pilot-Test on Transport Projects Approved by ADB How does STAR perform on actual projects? To answer that question, an ADB working group pilot-tested STAR on transport projects approved by ADB in 2012. The following process was taken:
Working group composition: Two transport economists, two transport specialists, and one environmental specialist, all from ADB and with experience in preparing or supervising projects.
Projects selected: All investments projects with sovereign guarantee approved in 2012 by ADB’s board. Technical assistance projects and policy reform projects were not included as it was believed their nature prevented a clear attribution of impacts. Nonsovereign projects were not included. This was mainly because, while it was felt that STAR had to be adapted to their specificities, their small number did not make it cost-efficient to do so. Altogether, 24 projects were selected, worth $3.76 billion in ADB financing (or managed cofinancing). The year 2012 was not a fully representative year as no interurban rail project was financed. Projects mostly financed infrastructure construction or rehabilitation; a few of them also financed service provision, equipment, and capacity building. The distribution of projects evaluated is in Table 2.
Table 2: Distribution of Projects Evaluated and ADB Financing
Road Transport
WaterTransport
AirTransport
Urban Transport
Total
Region No. $(’000) No $(’000) No $(‘000) No. $(‘000) No. $(’000)
Central Asia 8 1,432 0 0 0 0 1 80 9 1,512
East Asia 0 0 1 150 0 0 2 161 3 311
Pacific 2 42 2 46 0 0 0 0 4 88
South Asia 5 1,178 0 0 1 7 1 164 7 1,350
Southeast Asia 0 0 0 0 0 0 1 500 1 500
Total 15 2,652 3 196 1 7 5 905 24 3,761
ADB = Asian Development Bank. Note: The projects evaluated represent only part of all transport projects approved by ADB in 2012.
Project rating: The rating was carried out initially by one designated working group member for each project. The rater used publicly available project documentation (including sector, economic, environmental, and social assessments) and did not interact with the project officer. To improve objectivity, the rater reviewed projects from regions of ADB other than his or her own. The rater was asked to refer to the codebook at this end of this report for precise benchmarks. The rater then prepared a summary assessment and a narrative analysis (see worked example on Costaguana Rural Road Development Project). Both were shared with the working group and discussions led to adjustments. A group meeting then helped bring coherence among the raters and answer methodological questions.
The results of the assessment are presented in the following figures. The key results include the following:
While most projects perform adequately well (62.5% of projects rated moderately sustainable or better), very few are rated at the maximum level (only one project rated highly sustainable).
Only a few projects do not pass the minimum rating (8.3% of projects rated moderately unsustainable), and none carry very negative ratings—which is reassuring as such projects would preferably not be approved.
Road projects are generally rated lower than the average, even though some score well. These projects score generally high on economic and risk criteria, moderate on social criteria, and neutral or negative on environmental criteria.

20 | ADB Sustainable Development Working Paper Series No. 31
Conversely, urban transport projects (mainly mass transit) generally score higher than average, even though some score low. Economic ratings vary widely. Social and environmental ratings are generally good, while risk levels are higher.
Economic effectiveness is generally an area of strength and environment one of weakness.
Figure 4: Number of Projects by Overall Rating and Sector
Figure 5: Amount of Financing by Overall Rating and Subsector ($)
Figure 6: Number of Projects by Core Criteria Rating
Note for figures 4–6: H-U: Highly Unsustainable, U: Unsustainable, Mo-U: Moderately Unsustainable, Ma-S: Marginally Sustainable, Mo-S: Moderately Sustainable, S: Sustainable, H-S: Highly Sustainable.
0
2
4
6
8
10
H-U U Mo-U Ma-S Mo-S S H-S
Urban Transport
Air Transport
Water Transport
Rail Transport
Road Transport
0200,000400,000600,000800,000
1,000,0001,200,0001,400,0001,600,0001,800,000
H-U U Mo-U Ma-S Mo-S S H-S
Urban Transport
Air Transport
Water Transport
Rail Transport
Road Transport
02468
1012141618
H-U U Mo-U Ma-S Mo-S S H-S
Economic
Social
Environment
Overall
Toward a Sustainability Appraisal Framework for Transport | 21
6. Next steps
A key objective of this working paper is to demonstrate the feasibility of a rating system for measuring the sustainability of MDBs’ transport projects and portfolios. The sample ratings and the codebook in the appendix show the following:
It is possible to meaningfully define and assess the sustainability of MDBs’ transport projects, despite the complexity of the issue.
The rating system can be made user-friendly via the appraisal matrix, the narrative, and optionally the rating diagrams, and by breaking the rating into conceptually simple components (economic, social, environmental, and risk criteria).
A sustainability rating system can be applied throughout the project cycle to develop more sustainable transport projects.
By relying on existing MDB business processes that parallel the project cycle, it is possible to design a sustainability rating system that is low-cost, informative, and has a reasonable level of governance.
The way ahead. STAR, or a revised version thereof, has the potential to become an important part of the way ADB and other MDBs assess and report their transport projects. Discussions on the wider use of STAR are under way within the joint working group of MDBs. A key task is to agree on a common conceptual framework and good practice criteria for evaluating the sustainability of MDBs’ transport portfolios. Exact standards, procedures, and reporting formats should be left for each MDB to decide, based on their institutional context and mandate, in a way similar to the process that led to the development of the common MDB evaluation standards. As the practice of assessing and reporting the sustainability of transport projects develops, the experience gained and feedback from the public will help in further improving and refining STAR. To kick-start discussions, we acknowledge that STAR, as proposed in this paper, is still a work in progress, not the final rating system. The definition of the sustainable transport objectives and criteria need to benefit from a wider view. As we were designing STAR, several other questions were debated internally. While the present version of STAR takes positions on many of these options, it is believed that these debates could benefit from the views of external readers:
Additionality. STAR reflects the projects’ expected outcomes. The system only rewards efforts to make a project better inasmuch as they enable the project’s overall rating to increase from the programming to the appraisal stage. This may miss valuable efforts to improve the sustainability of projects during their preparation. Initial consultations with ADB partners suggest that such additionality of the MDB role is considered important. Additionality reflects, among others, the significance of the role of the MDB in helping plan or design sustainable transport projects. Our preliminary view is that it may also be useful to measure MDB additionality, but this should be assessed separately from the sustainability of the project.
Best in class. STAR is based on fixed weightings for each of the dimensions of sustainability. This acknowledges that not all types of projects provide sustainable transport solutions across all dimensions, and that some have a narrow purpose (e.g., road safety or vehicle emission reduction projects). Should different weighting systems be created instead for major types of projects, i.e., to reward “best in class”?
No-go features. STAR allows for trade-offs between sustainability dimensions and criteria.
These trade-offs are limited by the weightings, the rules guiding the rating of core criteria, and the prerequisites for sustainable and highly sustainable ratings. Are these criteria sufficiently discriminating to reward really good projects and question those that have one of more relatively unsustainable aspects? Should “no-go” features, e.g., a very negative contribution to climate change or road safety, prevent the award of any positive rating? Should the system give more

22 | ADB Sustainable Development Working Paper Series No. 31
flexibility to raters to accept larger trade-offs, e.g., accept that higher CO2 emissions can be compensated by a high poverty reduction impact?
Managing different views. STAR’s construction assumes that there can be a consensus
between raters. Should the rating rely instead on the average of the scores given by members of a rating committee?
Rating scale. The overall rating is based on a seven-point sale. This is because projects can
have symmetrical positive or negative outcomes for each dimension of sustainability, particularly the social and environmental ones, and there is a preference for unifying rating scales across each dimension. However, it is unlikely that very negative overall ratings (unsustainable and highly unsustainable) will actually be given to projects being considered, partly because it may be difficult to manage internally negative ratings before a project is approved. Alternative rating scales can be imagined. For instance, a rating scale centered on the desired outcome—“sustainable” projects—may give stronger incentives to perform. Finally, raters may find it difficult to differentiate finely between marginal, moderate, strong, or very strong outcome ratings. Should the overall rating scale then be revised? Some alternative rating scales and descriptors considered are presented in appendix.
Project scale. The rater is invited to take into account the scale of projects when rating an outcome moderate, strong, or very strong. Should additional guidance be provided, e.g., recommending scaled indicators (i.e., CO2 emissions saved per dollar spent) or requiring consistency with economic evaluation?
Toward a results framework. In the longer run, the STAR framework—i.e., its sustainability objectives and the performance indicators and measures presented in the codebook at the end of this report—could be improved and turned into a formal results framework for ADB’s transport sector activities. The concept and framework underpinning STAR could also easily be applied to other infrastructure sectors, even though specific criteria and indicators would have to be conceived. Prior to this, a number of conceptual difficulties will have to be resolved, particularly the definition of indicators and measurement methods that are robust enough to guide planning and enable a consistent reporting and aggregation of results.

CODEBOOK

24 | ADB Sustainable Development Working Paper Series No. 31
OVERALL RATING SCALE AND TABLE The overall rating is a descriptor, using a seven-point scale. Each rating level is associated with a measure of how sustainable the project is overall. The overall rating is primarily based on fixed thresholds for the total of the core criterion ratings. The thresholds are fixed and cannot be changed. In addition, to obtain sustainable and highly sustainable ratings, it is proposed that projects cannot have a negative rating under any criterion. Evaluators are encouraged to carefully review the ratings for internal consistency. For example, it is unlikely that a project can be highly economically effective while also being highly socially and environmentally unsustainable.
Total Score
Descriptor Measure
7 to 10 Highly Sustainable
This rating is given to projects or programs that bring very stronglypositive impacts across every dimension and a large number ofsustainable transport objectives, where it is very likely that these positive impacts will actually be delivered and sustained over the life of the project, and where no significant unmitigated negative impactwill occur.
5 and 6 Sustainable
This rating is given to projects or programs that bring positive impactsacross several dimensions and several sustainable transport objectives, where there are no negative impacts, or when they arenegligible in relation to the gains, and the expected benefits are likely to be delivered and sustained.
3 and 4 Moderately Sustainable
This rating is given to projects or programs that have overall positive impacts, but these impacts are either concentrated in only onedimension of sustainability or are of a moderate magnitude, there are some negative unmitigated impacts, or there is a significant risk thatthe benefits do not get delivered and sustained.
1 and 2 Marginally
Sustainable
This rating is given to projects or programs where positive impactsare offset by almost equally negative impacts or when the risks arehigh that the few positive impacts may not get delivered or sustained.
–1 to 0 Not So
Sustainable
This rating is given to projects or programs that have overall negative impacts, but these impacts are either moderate or partly offset bypositive impacts. It is also given to projects that have no obvious positive impacts and when the net positive impacts do not get delivered and sustained due to some risks. Some limited changes to the project or program may be sufficient to transform the project into one with a positive rating.
–2 to –4 Unsustainable
This rating is given to projects or programs where positive impacts are significantly outweighed by negative impacts, or it is highly unlikely that any net benefit can be sustained over the life of the project. Only large changes to the project or program design couldtransform the project into one with a positive rating.
–5 to –10 Highly Unsustainable This rating is given to projects or programs that have multiple stronglynegative unmitigated impacts. A full rethink of the project isnecessary.

Toward a Sustainability Appraisal Framework for Transport | 25
CALCULATION RULES: CORE CRITERIA RATINGS Core criteria ratings are descriptors, using the seven-point rating scale, for economic effectiveness, social sustainability, and environmental sustainability criteria, and using a three-point scale for the risk to effectiveness criterion. Each core criterion rating level is associated with a description.
Core Criterion Economic
Effectiveness Poverty and Social
Sustainability Environmental Sustainability
Risk to Sustainability
Definition
Economic effectiveness refers to both the significance of the expected economic impacts over the life cycle of a project or program, and the efficiency with which economic resources are used to deliver them.
Poverty and social sustainability describes the extent to which project impacts will accrue to the poor, and those vulnerable and discriminated against, and will be used to strengthen social cohesion and safety, and the degree of stakeholder participation.
Environmental sustainability describes the net contribution to reducing transport emissions and pollution, conserving the natural and built environment, minimizing wasteful use of natural resources, and increasing the resilience to climate effects.
Risk to sustainability measures the risks that expected impacts may not be realized or maintained because of weak institutions, lack of financing, or simply uncertainty in the forecasts.
Rating Values and Levels
3 Highly economically effective
Highly socially sustainable
Highly environmentally sustainable
2 Economically effective Socially sustainable Environmentally sustainable
1 Moderately economically effective
Moderately socially sustainable
Moderately environmentally sustainable
Low
0 Marginally economically effective
Neutral / Marginally socially sustainable
Neutral/marginally environmentally sustainable
Moderate
–1 Not economically ineffective
Moderately socially unsustainable
Moderately environmentally unsustainable
High, with mitigation
–2 Economically ineffective Socially unsustainable Environmentally unsustainable
High
–3 Highly economically ineffective
Highly socially unsustainable
Highly environmentally unsustainable
Core criteria ratings are the product of a judgment call by the rater. The benchmark for determining the core criteria ratings are their descriptions, which are detailed in the codebook (see following appendixes). They should be consistent with subcriteria ratings but are not directly derived through fixed weighting systems. In complex cases with negative and positive effects, the following principles derived from WebTAG Unit 3.3.6 (United Kingdom Department for Transport, 2003) may be used by the rater:
Most adverse category (negative impacts). A criterion should be assessed according to the most adverse assessment, in case it has strongly or very strongly negative outcomes, and unless there is a clear compensation effect at work. For example, if a project scores negatively under, three subcriteria, of which one is in the strongly negative category and the remaining are moderately negative, then the overall assessment score should be unsustainable. Very strongly

26 | ADB Sustainable Development Working Paper Series No. 31
or strongly negative impacts should not be diluted or masked by less negative or moderate beneficial impacts.
Cumulative effects. The principle here is that where it is clear that there is a cumulative effect across a range of subcriteria, the project as a whole should be scored in a higher category than each subcriterion in isolation. For example, a project may affect a number of subcriteria, each of which is assessed moderately positive. Where it is clear that there is a cumulative effect, the option as a whole would be assessed as sustainable for that core criterion. The existence of cumulative positive or negative effects should not always be assumed.
Balancing negative and beneficial effects. The principle here is that where there is a genuine
compensatory effect, negative impacts on some subcriteria may be balanced by beneficial impacts on others. The key issue is whether there are genuine compensatory effects. In most cases, there is great uncertainty about the scope for substitution, thus balancing should err on the side of caution. In particular, balancing should be restricted to moderately strong or, exceptionally, very strong impacts. A strongly negative unmitigated impact would always make the criterion’s rating negative.

Toward a Sustainability Appraisal Framework for Transport | 27
CALCULATION RULES: SUBCRITERIA RATINGS The rating for each subcriterion is the answer to the question: To what extent will the project enable/enhance/reduce/contribute to [the objective related to the criteria]? The subcriterion rating is also set on a seven-point scale, following the general principles in the table below. Specific aspects to each subcriterion are indicated in the codebook.
Score Descriptor Measure
3 Very strongly positive
Major positive impacts on a large population or environment resulting in substantial and long-term improvements from the base case.
2 Strongly positive Strongly positive impact, possibly of short-, medium-, or long-term duration. Impact may not be absolute but only perceived in comparison to the base case.
1 Moderately positive Moderately positive impact, possibly only lasting over the short term. May be confined to a limited area.
0 Neutral/Marginally positive No discernible or predicted positive or negative impacts.
–1 Moderately negative Moderately negative impact, probably short-term, able to be managed or mitigated and will not cause substantial detrimental effects. May be confined to a small area.
–2 Strongly negative Strongly negative impacts. May be short-, medium-, or long-term impacts and will most likely respond to management actions.
–3 Very strongly negative
Very strongly negative impacts with serious, long-term, and possibly irreversible effects leading to serious damage, degradation, or deterioration of the physical, economic, or social environment. May require a major re-scope of concept, design, location, or justification, or require a major commitment to extensive management strategies.
Ratings are generally determined with reference to the magnitude and significance of the effect they measure, as described in the table below.
Relating Magnitude and Significance of Impacts Magnitude
(e.g., journey time changes)
Significance (e.g., travelers affected) Few Moderate Many
Small Neutral Neutral Moderate Moderate Neutral Moderate Strong
Large Moderate Strong Very strong The scope of the effect needs also to be appreciated in relation to the overall scale of the project. For instance, a $200 million road construction project that includes a $1 million component of road safety black-spot removal may have a moderate beneficial impact on safety. If the entire project scope is devoted to the road safety program, its impact may be found very strong. The rater is invited to compare the benefits identified with the total cost of the project. The economic internal rate of return provides a proxy for whether benefits that can be quantified economically are commensurate with costs. Finally, ratings are qualitative but need to be reasonably grounded in evidence or expert judgment. Generally, the evaluator needs to make a judgment call. Consulting with stakeholders and brainstorming ratings with experts from various disciplines is useful. Quantitative indicators should be used to illustrate the performance of the project or program in each of the sustainable transport areas, provide a basis for the qualitative rating, and enable performance monitoring and evaluation. Ultimately, some people may have a different opinion about the rating.

28 | ADB Sustainable Development Working Paper Series No. 31
SCORE BOOK Step 1: In your opinion, to what extent does/will the project…
SUBCRITERIA: ECONOMIC EFFECTIVENESS Score ECO-1: Transport efficiency – people
… enable efficient people mobility? –3 –2 –1 0 1 2 3
ECO-2: Transport efficiency – businesses
… enable efficient goods mobility and operation of transport services?
–3 –2 –1 0 1 2 3
ECO-3: Quality and reliability
… improve the quality and reliability of transport systems?
–3 –2 –1 0 1 2 3
ECO-4: Fiscal burden
… reduce or increase the cost of transport systems for the taxpayer?
–3 –2 –1 0 1 2 3
ECO-5: Wider economic benefits
… enable concentration of economic activity in urban centers? … foster rural agricultural development?
–3 –2 –1 0 1 2 3
SUBCRITERIA: POVERTY AND SOCIAL SUSTAINABILITY Score SOC-1: Basic accessibility
… enhance access to basic social services, including hospitals, schools, community centers, and leisure facilities?
–3 –2 –1 0 1 2 3
SOC-2: Employment … create quality employment opportunities for the poor?
–3 –2 –1 0 1 2 3
SOC-3: Transport affordability
… make transport services more affordable to the poor?
–3 –2 –1 0 1 2 3
SOC-4: Safety … make transport safer and more secure for users and communities?
–3 –2 –1 0 1 2 3
SOC-5: Inclusion and social cohesion
… enhance the mobility of all members of society, particularly vulnerable groups, and contribute to the development of cohesive and livable communities?
–3 –2 –1 0 1 2 3
SUBCRITERIA: ENVIRONMENTAL SUSTAINABILITY ENV-1: Greenhouse gas emissions
… reduce transport-related emissions of greenhouse gases?
–3 –2 –1 0 1 2 3
ENV-2: Pollution and nuisances
… reduce transport-related emissions of air pollutants, noise, vibration, and light, and pollution of surface water, groundwater, and soil?
–3 –2 –1 0 1 2 3
ENV-3: Resource efficiency
… minimize use of natural resources, materials, energy, water, and land, and limit waste generation and disposal?
–3 –2 –1 0 1 2 3
ENV-4: Natural and built environment
… preserve the natural environment and maintain integrity of ecosystems, biodiversity, and the services they provide, and enhance the built environment, landscape, townscape, physical cultural resources, and their settings?
–3 –2 –1 0 1 2 3
ENV-5: Climate resilience
… improve the climate resilience of the transport system?
–3 –2 –1 0 1 2 3
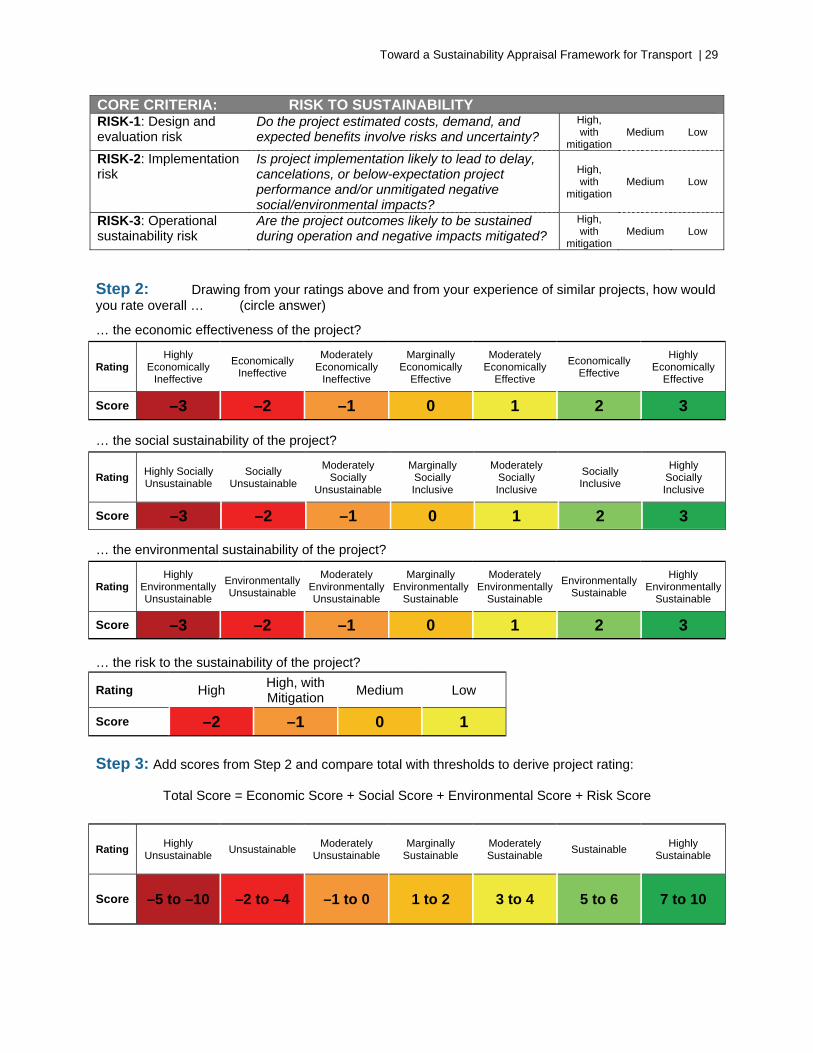
Toward a Sustainability Appraisal Framework for Transport | 29
CORE CRITERIA: RISK TO SUSTAINABILITY RISK-1: Design and evaluation risk
Do the project estimated costs, demand, and expected benefits involve risks and uncertainty?
High, with
mitigation Medium Low
RISK-2: Implementation risk
Is project implementation likely to lead to delay, cancelations, or below-expectation project performance and/or unmitigated negative social/environmental impacts?
High, with
mitigation Medium Low
RISK-3: Operational sustainability risk
Are the project outcomes likely to be sustained during operation and negative impacts mitigated?
High, with
mitigation Medium Low
Step 2: Drawing from your ratings above and from your experience of similar projects, how would you rate overall … (circle answer)
… the economic effectiveness of the project?
… the social sustainability of the project?
… the environmental sustainability of the project?
… the risk to the sustainability of the project?
Step 3: Add scores from Step 2 and compare total with thresholds to derive project rating:
Total Score = Economic Score + Social Score + Environmental Score + Risk Score
Rating Highly
Economically Ineffective
Economically Ineffective
Moderately Economically
Ineffective
Marginally Economically
Effective
Moderately Economically
Effective
Economically Effective
Highly Economically
Effective
Score –3 –2 –1 0 1 2 3
Rating Highly Socially Unsustainable
Socially Unsustainable
Moderately Socially
Unsustainable
Marginally Socially Inclusive
Moderately Socially Inclusive
Socially Inclusive
Highly Socially Inclusive
Score –3 –2 –1 0 1 2 3
Rating Highly
Environmentally Unsustainable
Environmentally Unsustainable
Moderately Environmentally Unsustainable
Marginally Environmentally
Sustainable
Moderately Environmentally
Sustainable
Environmentally Sustainable
Highly Environmentally
Sustainable
Score –3 –2 –1 0 1 2 3
Rating High High, with Mitigation
Medium Low
Score –2 –1 0 1
Rating Highly
Unsustainable Unsustainable
Moderately Unsustainable
Marginally Sustainable
Moderately Sustainable
Sustainable Highly
Sustainable
Score –5 to –10 –2 to –4 –1 to 0 1 to 2 3 to 4 5 to 6 7 to 10

30 | ADB Sustainable Development Working Paper Series No. 31
ECONOMIC EFFECTIVENESS CODEBOOK Economic effectiveness refers to the significance of the expected economic impacts over the life cycle of a project or program. Subdimensions of economic effectiveness include the impacts on transport system efficiency, differentiated by who perceives them—people or businesses—on quality and reliability of transport, the fiscal burden on the government, and wider economic benefits on urban economies of scale, rural development, and cross-border transport. The rating scale for the economic effectiveness core criterion and the associated qualitative measures are as follows:
Score Descriptor Measure
3 Highly economically effective There will be major positive economic impacts; economic rate of return significantly exceeds established benchmarks
2 Economically effective There will be strongly positive economic impacts; economic rate of return is above established benchmarks
1 Moderately economically effective
There will be moderately positive economic impacts; some scope for improvement in economic rate of return
0 Marginally economically effective
No significant economic impacts; economic rate of return is likely to be below benchmarks
–1 Moderately economically ineffective
Economic rate of return is well below benchmarks
2 Economically ineffective Money wasted; similar results could have been obtained with much smaller costs
3 Highly economically ineffective
White elephant
The rater should use his or her judgment to derive the economic effectiveness rating. To substantiate his or her judgment, the rater should use a narrative description. No mandatory weighting between subcriteria is recommended. The economic effectiveness rating (and subcriteria ratings) should reflect the efficiency in which economic resources are used to deliver these outcomes, primarily measured by the economic internal rate of return (EIRR) of the project. Put differently, a project with a low EIRR should only get a high economic effectiveness rating if there are large economic benefits that cannot be quantified. The following benchmarks for economic efficiency are used commonly by ADB:
Descriptor Measure
Highly efficient EIRR >18% or Benefit/Cost>2, and/or best practice standards for costs/demand exceeded
Efficient EIRR >12%, and/or best practice standards for costs/demand met
Moderately efficient EIRR between 10% and 12%, and/or somewhat below best practice standards for costs/demand
Less efficient EIRR likely to be below but close to 10%, or below best practice standards for costs/demand
Inefficient EIRR likely to be well below 10%, or well below best practice standards for costs/demand; project cannot be approved by ADB

Toward a Sustainability Appraisal Framework for Transport | 31
ECO-1 Transport System Efficiency – People
To what extent will the project enable efficient people mobility? The question seeks to assess
the extent to which people’s mobility will be enhanced, and the number of people benefiting from the project.
Transport systems enable people to access places of interest. The utility that people obtain from traveling to such places is reduced by the price and time it takes to travel. The transport efficiency impact considers how transport projects generate benefits that directly accrue to all individual transport users—bus riders, rail passengers, car drivers, pedestrians, bikers, etc. To assess the extent of the benefits for people, the evaluator needs to understand the size of the change in people’s transport times or out-of-pocket costs. This needs to be based on actual door-to-door trips, rather than on a link basis. For instance, a road-widening project that saves 5 minutes may have a strongly positive impact if most trips take less than 10 minutes, but a moderate impact if trips take more than 2 hours. Some aspects to consider are
changes to user fees (e.g., tolls, bus fares) that directly affect people; nonmotorized transport users may be indirectly affected; long-term impacts, such as habitat sprawl and generated traffic, that may lead to longer trips and
congestion, and in the end reduce actual benefits to people; and temporary negative impacts during construction, if they are expected to be large.
Recommended potential quantitative indicators are
average daily commuting time within urban area, average transport-related share of urban household expenditures, door-to-door transport time between key origin destinations by public transport, door-to-door transport fares or vehicle operating costs between key origin destinations, share of car trips performed on road network in good condition, and predicted ridership on new infrastructure.
Score Descriptor Measure
3 Very strongly positive
The project makes long-lasting strongly positive changes in the transport conditions of many people.
2 Strongly positive Between moderately positive and very strongly positive
1 Moderately positive
The project’s positive impacts are limited in magnitude and number of people benefiting, or are short-lived. Positive impacts may be partly offset by fare increases or induced traffic congestion. The project benefits users of a mode of transport at the detriment of those of other transport modes.
0 Neutral/Marginally positive
Neutral or between moderately positive and moderately negative
–1 Moderately negative
Altogether, the project reduces to a moderate extent the mobility of people, the quality of their access to places from interest or increases their transport costs. While short-term impacts are positive, long-term impacts may be negative. Impacts during construction may be severe.
–2 Strongly negative Between moderately negative and very strongly negative
–3
Very strongly negative
The project brings major net reductions to the mobility of people or the quality of their access to places of interest, or brings large increases to their transport costs. Long-term impacts may be large and negative.

32 | ADB Sustainable Development Working Paper Series No. 31
ECO-2 Transport System Efficiency – Businesses
To what extent will the project enable efficient movement of goods and operation of transport services?
The question seeks to assess
the extent to which freight transport costs (as perceived by operators or shippers) will be reduced, and
the extent to which the transport infrastructure or service operation costs will be made more efficient.
Businesses are direct beneficiaries of transport improvement projects, through changes in the operating costs, time costs, and user charges of the freight haulage or passenger transport services. The transport efficiency impact considers how transport projects generate benefits that directly accrue to transport service providers—truck operators, freight shippers, rail or bus operators, etc. It discounts benefits that are passed to users through predicted reductions in fares. To assess transport efficiency impacts on freight operators, the rater should relate the volumes of freight transported with the size of the change in unit vehicle operating costs, net of any change in taxes or fares. This needs to be based on complete trips between an origin and a destination. Impacts on rail or bus operators (e.g., of a bus fleet renewal project) is assessed based on changes in their total operating costs. Recommended quantitative indicators are
haulage cost of moving a 20-foot equivalent unit between key origin destinations, haulage cost of moving a ton of a commodity between key origin destinations, door-to-door freight transport time between key origin destinations, and average vehicle operating costs per ton between key origin destinations.
Score Descriptor Measure
3 Very strongly positive
The project creates a structural change in the local economy as it leads to large net reductions in firms’ transport and logistics costs benefiting a large share of the economy.
2 Strongly positive Between moderately positive and very strongly positive
1 Moderately positive
The project’s positive impacts on freight and transport managers and operators are real but limited in magnitude and number of businesses benefiting. Optimization of asset management and transport services operations may lead to moderate net cost reductions in the long run.
0 Neutral/Marginally positive
Neutral or between moderately positive and moderately negative
–1 Moderately negative Altogether, the project increases to a moderate extent firms’ transport and logistics costs. Asset management costs or transport service operations costs may also increase.
–2 Strongly negative Between moderately negative and very strongly negative
–3
Very strongly negative
The project severely hampers the development of the local economy, as it leads to wide and large increases in firms’ transport and logistics costs.

Toward a Sustainability Appraisal Framework for Transport | 33
ECO-3 Quality and Reliability
To what extent will the project improve the quality and reliability of transport systems? This question considers two different—but linked—factors:
Transport quality refers to the perceived quality of the journey experienced by users. Perceived quality is linked to infrastructure factors (e.g., road condition, cleanliness of stations), vehicle factors (e.g., seating comfort, air conditioning), and user factors (e.g., negative perception of waiting times, crowding, interchanges).
Transport reliability refers to variations in journey time that users are unable to predict. Causes of unreliability may include (i) climate events causing temporary loss of road, air, or water access, or reducing the passability of a road with a motor vehicle; (ii) poor road condition causing mechanical failures; and (iii) road or rail congestion causing variability in travel times, particularly during incident situations. For public transport projects, reliability refers to the degree of variance between actual users’ arrival times and set schedules, or the lack of a fixed schedule.
Factors that affect the quality and reliability of transport services perceived by the users include
road condition; frequency of road closures due to flooding, snow blocks, or other environmental factors; road congestion; service frequency and transfer times; demand shifts toward more comfortable/reliable modes of transport; quality and comfort of public transport vehicles; and station quality (e.g., access, waiting area condition and size), ticketing ease, information about
service, security (e.g., lighting, CCTV). Recommended quantitative indicators are
number of people who are living within 2 kilometers of an all-weather road, proportion of users satisfied with public transport quality, number of minutes per person lost to road congestion , number of days in the year when road is blocked, length of roads with service level D or E as defined in the 6-point scale Level-of-Service used in
transport planning, and frequency of delays or breakdowns of rail or public transport services.
Score Descriptor Measure
3 Very strongly positive
The project will lead to a scale improvement in the quality and reliability of essential transport systems and services, benefitting many users.
2 Strongly positive Between moderately positive and very strongly positive
1 Moderately positive Transport users will perceive a step increase in the quality and reliability of transport systems and services. Improvements may be short-lived. Some users may experience a major improvement, but they are few.
0 Neutral/Marginally positive
Neutral or between moderately positive and moderately negative
–1 Moderately negative
The quality and reliability of transport for some users, potentially on other modes of transport or in the long term because of congestion, will worsen due to the project.
–2 Strongly negative Between moderately negative and very strongly negative
–3
Very strongly negative
The project will let users rely on much less reliable or quality transport systems and services (this could be a post facto judgment on a failed project).

34 | ADB Sustainable Development Working Paper Series No. 31
ECO-4 Fiscal Burden To what extent will the project reduce or increase the cost of transport systems for the taxpayer?
This question refers to the explicit or implicit public subsidies required for the construction and operation of transport infrastructure and services. It acknowledges that government financing through tax or debt comes as a cost to the economy, which does not appear in privately financed interventions or is reduced under public–private partnerships. This is because of the need to raise distortive taxes to finance the government. This question considers the long-term balance between government contributions to investments, loan repayments, subsidies to operation and maintenance, and any additional direct taxes, or revenues from project equity contributions received. The assessment is preferably based on a financial evaluation of the project impact on public finances. Some considerations can help make an assessment at an early stage of development. For projects that generate revenues (expressways, railways, buses), the evaluator should consider whether the project will pay back its capital costs and generate dividends for the government, pay back only part of its capital costs, require subsidies for capital renewal, or even require subsidies for operation. For projects (e.g., non-tolled roads) that do not create revenues, the evaluator should consider whether the taxes on transport (e.g., fuel tax or vehicle tax) cover part or all of the maintenance costs. Note that projects that reduce road usage often also reduce fuel tax revenues. For projects that require operating subsidies, the magnitude of their long-term fiscal impact should be compared with current transport investment budgets. Business-restructuring projects, asset management projects, needed railways, and expressways may lead to positive impacts. Recommended quantitative indicators are
share of transport system operating costs not financed by users, profitability of public rail or bus companies, and revenue/operation and maintenance costs coverage ratio.
Score Descriptor Measure
3 Very strongly positive
The project will lead to large reductions in running subsidies, or it is a great business opportunity for the taxpayer, as it brings high rates of returns, or large one-off license payments by business operators.
2 Strongly positive Between moderately positive and very strongly positive
1 Moderately positive The project will moderately reduce the amount of subsidies required by the transport sector, or lead in the long term to a small net fiscal surplus for the government.
0 Neutral/Marginally positive
Neutral or between moderately positive and moderately negative
–1 Moderately negative
The project is largely financed by the taxpayer and may require a moderate lasting operating subsidy, a subsidy during demand ramp-up, or a one-off capital subsidy for fleet replacement later in the future.
–2 Strongly negative Between moderately negative and very strongly negative
–3
Very strongly negative
Financing the government’s share of the investment will hamper its capacity to invest in other needed public projects for many years. The project may require a large operating subsidy from the general budget to run, which may be beyond the reasonable means of the local government.

Toward a Sustainability Appraisal Framework for Transport | 35
ECO-5 Wider Economic Benefits Wider economic benefits are understood in this context as actual positive impacts of transport projects that cannot be fully explained by the traditional cost–benefit evaluations based on transport costs and travel time. Three categories of wider economic benefits are proposed for consideration for urban projects, rural projects, and regional projects, respectively: agglomeration benefits, agricultural benefits, and cross-border benefits. The chosen category should relate to the location of the project. Wider economic benefits are significant only when the project introduces major changes to a transport system, which deeply change the local economic structure. ECO-5a Agglomeration Benefits (Urban areas)
To what extent will the project enable concentration of economic activity in urban centers? This question refers to the higher productivity associated with the concentration of economic activity enabled by a project. Transport enables concentration of economic activity by increasing the accessibility of an existing large economic or employment center to workers. An improvement in accessibility may result in bringing a lot more people “closer” to each other. It may also result in actual land use changes—real estate development, taller buildings, etc. which leads to physical densification. Agglomeration impacts are likely to be large in areas located close to an economic or employment center. This is typically the central business district of a city of more than 1 million inhabitants. No agglomeration impact should be considered in smaller towns. Projects with likely positive impacts include mass transit projects. Conversely, highway projects leading to urban sprawl or congestion may have a negative impact. Recommended quantitative indicators are
predicted productivity per worker in the central business district, additional office space in square meters in a 200-meter band along the project corridor, and effective density of the metropolitan area.
Score Descriptor Measure
3 Very strongly positive
The project will lead to a major improvement in the accessibility of a thriving central business district of a metropolis.
2 Strongly positive Between moderately positive and very strongly positive
1 Moderately positive The project will lead to a step improvement in the accessibility to the central business district of a medium city (above 1 million).
0 Neutral/Marginally positive
Neutral or between moderately positive and moderately negative
–1 Moderately negative
The project will moderately increase urban sprawl or congestion in the long term, to the effect that it reduces accessibility to the central business district of a medium city (above 1 million).
–2 Strongly negative Between moderately negative and very strongly negative
–3
Very strongly negative
The project will create in large urban sprawl or congestion the long term, which reduces accessibility to the central business district and other centers of economic activity within a metropolis.

36 | ADB Sustainable Development Working Paper Series No. 31
ECO-5b Agricultural Development Benefits (Rural areas)
To what extent will the project enable rural agricultural development? This question seeks to grasp non-marginal project impacts on agricultural production including
changes in types of crops, particularly from subsidence crops to cash crops, increases in farm yields linked to changes in agricultural techniques, increases in surface cultivated crops, and reductions in losses during transport from farms to markets.
Agricultural impacts translate into higher economic productivity, more integrated markets, and increased household cash income. The question is interested in non-marginal project impacts, i.e., benefits from structurally transforming agricultural economies in a way that exceeds the direct consequences of lower transport costs. Projects with large agricultural impacts are rural road projects, particularly when coupled with an agricultural extension program. An interurban transport project that would “open up” a new area for agricultural development may also have a very strong impact. In evaluating the size of impact, it is necessary to consider
the agricultural potential of the project’s zone of influence or area, the size of the project impact on total transport costs and therefore on farm–gate prices, the efficiency and competitiveness of rural transport and distribution systems and the sufficiency
of demand to generate competition—these factors being necessary for transport cost reductions to be passed to farmers, and
the likelihood that people are going actually switch to more efficient transport modes (e.g., from walking to an intermediate mode of transport, or from a small truck to a large truck).
Recommended quantitative indicators are
changes to quantities of agricultural products sold on markets in tons per year, changes to farm–gate prices for selected types of cash crops, and share of lower cost transport modes (the exact mode would depend on the baseline situation; it
could refer to intermediary modes of transport, from wheelbarrows up to motorcycles, small trucks, or large trucks).
Score Descriptor Measure
3 Very strongly positive
The project will open up rural areas that currently lack paved road access and where a large number of people largely live on subsitence farming, prompting a major decrease in actual transport costs and a change in agricultural practices.
2 Strongly positive Between moderately positive and very strongly positive
1 Moderately positive
The project will lead to a large improvement in road access for a few people, or to a moderate improvement in road access (e.g., from gravel to paved road). It is uncertain whether changes in transport costs will actually lead to changes in agricultural practices, e.g., because of limited transport services access or other agricultural bottlenecks (e.g., access to credit or knowledge).
0 Neutral/Marginally positive
Neutral or impact limited to marginal changes in agricultural production
–1 to
–3 Moderately to very strongly negative
n/a

Toward a Sustainability Appraisal Framework for Transport | 37
ECO-5c Cross-Border Transport Benefits (Regional projects)
To what extent will the project enable cross-border trade? This question seeks to capture the extent to which the projects’ impacts on cross-border transport costs will lead to increases in trade between the countries concerned. Reduction in cross-border transport and logistics costs act in the same way as a drop in trade tariffs. Cross-border transport projects foster the integration of markets, e.g., better specialization and competition, as well as economies of scale. Because of those effects that may go beyond traditional transport user benefits, cross-border transport improvements may deserve specific treatment. When assessing the benefits, the following should be considered:
Gains are the largest when (i) the project results in a significant fall in total door-to-door transport costs and time on a corridor; (ii) the transport corridor is vital to the local economy, e.g., carries a large share of trade and there is no good alternative; (iii) there are complementarities in the economies of the two countries targeted; and/or (iv) one of the countries is landlocked.
Overall impacts on trade costs and time are what really matters. Projects that address both physical and nonphysical bottlenecks to cross-border transport will result in larger time and cost impacts. Bottlenecks include transport infrastructure, border-point facilities, trade and inspection procedures, logistic networks, etc.
Recommended quantitative indicators are
average speed (including waiting times) for a 20-foot equivalent unit (TEU) (by rail) or a 20-ton load (by road) to travel 500 kilometers (km) along the corridor,
average speed (not including waiting times) for a TEU (by rail) or a 20-ton load (by road) to travel 500 km along the corridor,
average transport cost of a TEU or a 20-ton load per 500 km (transport cost includes the vehicle operating costs plus cost or fees of all activities at stops and border crossings),
changes in cross-border freight traffic level in tons (against a base case), and vehicle operating costs between key origin destinations on each side of the border.
Score Descriptor Measure
3 Very strongly positive
The project will lead to major reduction in actual transport costs and delays along a cross-border corridor that carries a large share of the countries’ foreign trade.
2 Strongly positive Between moderately positive and very strongly positive
1 Moderately positive
The project will lead to a limited improvement to the total transport costs and delays along an important international transport corridor. Alternatively, the improvement may be significant, but the corridor only carries a small share of each country’s foreign trade or there are comparable alternatives available.
0 Neutral/Marginally positive
Neutral or impact limited to marginal changes in cross-border transport conditions
–1 to
–3 Moderately to very strongly negative
n/a

38 | ADB Sustainable Development Working Paper Series No. 31
POVERTY AND SOCIAL SUSTAINABILITY CODEBOOK Poverty and social sustainability describes the extent to which project impacts will accrue to the poor, and those vulnerable and discriminated against, and will strengthen social cohesion and people’s safety and security. Social impacts of transport projects can be measured in terms of their impact on basic accessibility, employment, affordability, inclusion, social cohesion, and safety and security. These impacts are particularly important to measure in the way they affect vulnerable groups—whereby vulnerabilities can arise on grounds of age, income, gender, race, religion, and disability. The rating scale for the social inclusion core criterion and the associated qualitative measures are as follows:
Score Descriptor Measure
3 Highly socially sustainable Social impacts are expected to be highly positive.
2 Socially sustainable Social impacts are expected to be large and positive; any negative social impacts are expected to small.
1 Moderately socially sustainable Social impacts are expected to be moderately positive; they may be partly offset by some negative impacts.
0 Neutral / Marginally socially sustainable
There will not be any significant social impact, or a mix of moderately positive and negative impacts result in a negligible impact.
–1 Moderately socially sustainable Social impacts are expected to be moderately negative, or positive impacts are offset by slightly more significant negative impacts.
2 Socially unsustainable There will be some large negative social impacts.
3 Highly socially unsustainable There will be some major negative social impacts or multiple large negative ones.
The rater should use judgment to derive the social sustainability rating. A narrative description should be provided to substantiate the judgment. No mandatory weighting between subcriteria is recommended.

Toward a Sustainability Appraisal Framework for Transport | 39
SOC-1 Basic Accessibility
To what extent will the project enhance access to basic social services, including hospitals, schools, community centers, and leisure facilities?
This question seeks to capture
the changes brought by the project in accessibility to basic services, and the extent to which these changes will benefit the poor, and vulnerable or excluded groups.
All transport projects have the potential to improve access to basic social services and facilities, both in rural and urban contexts. Rural areas are often deprived of all-weather access roads that hinder the community from having timely access to hospitals, schools, and so forth. Urban slums are “isolated with very poor access to attractive job opportunities, social services, clinics, and schools.” The impact of a transport project on basic accessibility is likely to be highest for those that are targeted at areas (both urban and rural) where transport infrastructure is severely constrained, and where trips to access basic social services are currently suppressed. These projects include, for example, rural roads and urban interventions that directly target areas where transport infrastructure and services are severely limited (e.g., slums). In contrast, interventions that provide high-speed intercity travel (either road or rail) or those that cater only to relatively wealthy users (e.g., exclusively for private motorized vehicles) are unlikely to deliver on this objective. Furthermore, care needs to be taken to ensure that a transport project does not reduce basic accessibility. For example, a high-volume road dissecting a community, with no provision for safe crossing points for pedestrians and cyclists, is likely to undermine basic accessibility. Recommended quantitative indicators are
proportion of children attending primary and secondary education; number of people attending regular checkups at hospitals; number of people who can walk, bike, or take public transport to access primary and secondary
school and health centers in less than 30 minutes; and average time to access hospitals, schools, and shopping and leisure facilities measured in
minutes, disaggregated by vulnerable group categories including gender.
Score Descriptor Measure
3 Very strongly positive
The project will lead to a major improvement in the accessibility of a large number of poor, vulnerable, or excluded people to basic services.
2 Strongly positive Between moderately positive and very strongly positive
1 Moderately positive
Transport users will perceive a step increase in the accessibility to basic services. The improvement is moderately positive because either (i) few people benefit, (ii) the poor (poorest) will not benefit directly, (iii) the reduction in actual transport costs/times may be moderate, or (iv) accessibility is improved for secondary levels of services (e.g., higher education, large market etc.) but access to primary services is unchanged.
0 Neutral/Marginally positive
Neutral or between moderately positive and moderately negative
–1 Moderately negative
A significant number of poor, vulnerable, or excluded people will have somewhat lesser quality access to basic services.
–2 Strongly negative Between moderately negative and very strongly negative
–3
Very strongly negative
Accessibility to basic services for a large number of poor, vulnerable, or excluded people will be severely impaired.

40 | ADB Sustainable Development Working Paper Series No. 31
SOC-2 Employment
To what extent will the project create quality employment opportunities for the poor? This question measures both the project’s direct impact on employment of the poor, and the increased opportunities available to them to access jobs. Three categories of direct employment impacts (short-term job creation) can be considered: (i) direct jobs supported on-site through construction, maintenance, or operation activities; (ii) indirect jobs supported offsite, e.g., for suppliers preparing materials; and (iii) induced jobs supported elsewhere in the economy, corresponding to the additional activity created by the income of workers (e.g., food, housing, entertainment, transport provision). Direct employment impacts exclude employment generation arising from the project impacts on the general economy through the reduction in transport costs, because those effects are already covered by the transport efficiency criteria. If the job market is functioning efficiently (no undesired unemployment or underemployment, except structural), there may be no net job creation. Direct employment impacts bring positive net economic benefits (or rather a net reduced economic cost) when they accrue to people who would otherwise have been unemployed or underemployed in the informal or agriculture sectors. These people are most likely to be poor. Direct employment impacts may be strong when (i) the works rely on labor-based methods (rather than equipment-based ones), (ii) the project sources materials locally, and (iii) there is persistent unemployment in the area. Employment impacts may also be very strongly positive when the project’s civil works incorporate a large share of labor, and jobs are targeted for unemployed or underemployed women, ethnic minorities, or former soldiers in post-conflict countries. Moderate employment impacts may arise from maintenance and operation jobs. Negative impacts may result from a downsizing of a government agency or the formalization of bus services. The quality of the jobs provided matters, particularly the difference between informal and formal jobs. As for the basic access criteria (SOC-1), all transport projects have the potential to improve access to job markets, both in rural and urban contexts. Similar considerations apply. Recommended quantitative indicators are
number of annualized jobs directly, indirectly supported, or induced by project construction; number of annualized direct jobs created for project operation and maintenance; and average time to access nearby job centers (measured in minutes).
Score Descriptor Measure
3 Very strongly positive
The project will lead to a large reduction in local unemployment or underemployment (preferably long-lasting or countercyclical) or to a major improvement in the accessibility of a large number of poor to jobs.
2 Strongly positive Between moderately positive and very strongly positive
1 Moderately positive The project will likely moderately reduce local unemployment and underemployment during construction and maintenance. Transport users will perceive a step increase in the accessibility to job markets.
0 Neutral/Marginally positive
Neutral or between moderately positive and moderately negative
–1 Moderately negative
The project will lead directly or indirectly to net job number reductions or shifts to lower quality jobs, or a significant number of poor will have somewhat lower quality access to jobs.
–2 Strongly negative Between moderately negative and very strongly negative
–3
Very strongly negative
The project will result in massive layoffs, in a context of large unemployment or underemployment, potentially compounding with an already depressed economy; or accessibility to job markets for a large number of poor will be severely impaired.

Toward a Sustainability Appraisal Framework for Transport | 41
SOC-3 Transport Affordability
To what extent will the project make transport services more affordable? This question seeks to capture affordability changes through the combination of
the direct impact of the project on the costs of transport services in the project area, and the share of project beneficiaries who are poor or very poor.
Access of the poor to transport services can often be constrained due to their high cost. The poor already utilize a significant part of their disposable income, up to 30% based on some studies, directly competing with other essential goods such as food and housing. A project may have positive impacts (if it reduces costs), neutral impacts (if it does not target the poor), or negative impacts (if it leads to worsening transport conditions for the poor). The threshold for the very poor and poor can use the standard $1.25 and $2-a-day poverty lines. When assessing affordability changes, the following should be considered:
The additional number of trips by the poor is a good proxy of the impact on affordability. All transport projects which directly provide a service (e.g., public transport projects) need to
consider the affordability of the transport services that result from the project. This is also necessary for infrastructure projects that strongly impact the basic needs of the beneficiaries (see preceding section on basic accessibility), particularly rural road projects.
Infrastructure projects that induce changes to the mixture of services offered on the transport network also require consideration of affordability impact. For example, the development of an urban highway may rule out the use of paratransit services (such as rickshaws, two-wheeler taxis, pedicabs, etc.). which may have been the transport mode of choice for the poor, and thereby negatively affect affordability.
Recommended quantitative indicators are
share of the daily income (in relative and absolute terms) spent on transport by the local population, and especially the lowest 20% income group;
number of people being able to afford the transport service (typically measured as less than 20% of household income for low- and middle-income households); and
changes to the financial cost of the transport services provided.
Score Descriptor Measure
3 Very strongly positive
The project will lead to a major reduction in actual prices paid by a large number of the poor for routine transport needs.
2 Strongly positive Between moderately positive and very strongly positive
1 Moderately positive The project will moderately reduce transport prices for services used by the poor. Only a small share of the project beneficiaries may be poor.
0 Neutral/Marginally positive
Neutral or between moderately positive and moderately negative
–1 Moderately negative
The project will moderately increase transport prices for services used by the poor, potentially compensated by an improvement in transport quality that the poor do not value strongly. The transport services used by the poor may be negatively affected by the project, making them more expensive.
–2 Strongly negative Between moderately negative and very strongly negative
–3
Very strongly negative
Affordability of vital transport services used by many poor will be severely reduced, without proper mitigation/compensation.
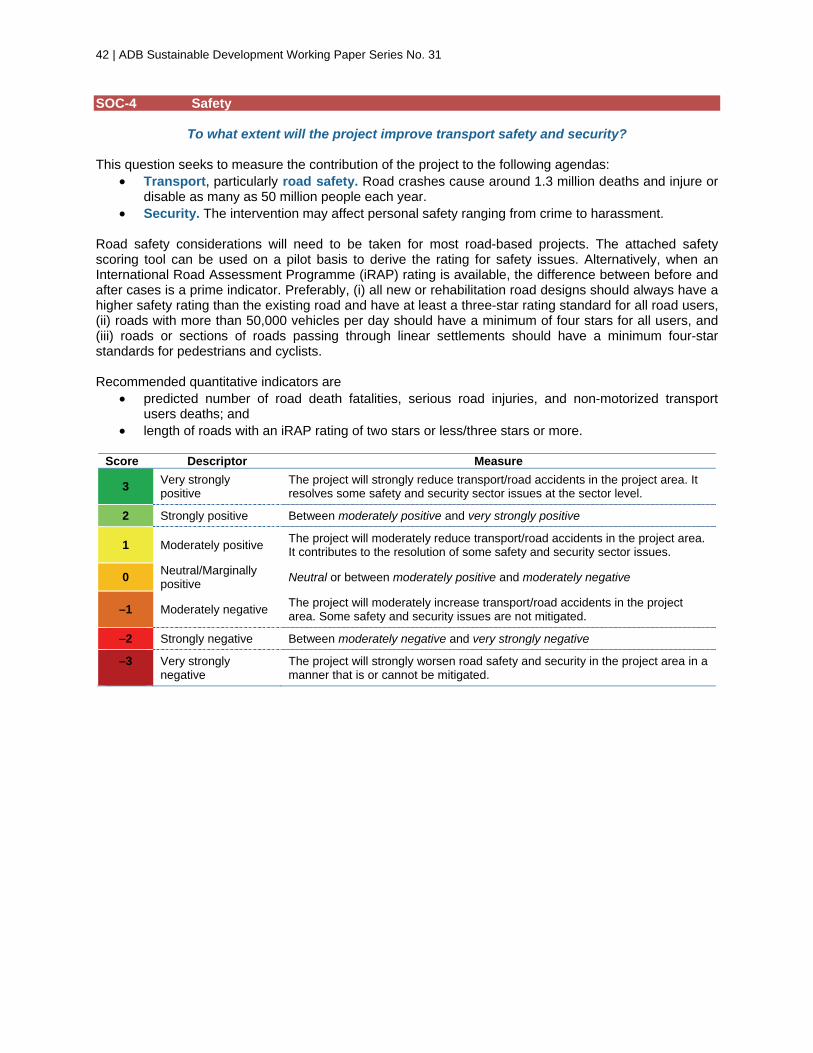
42 | ADB Sustainable Development Working Paper Series No. 31
SOC-4 Safety
To what extent will the project improve transport safety and security? This question seeks to measure the contribution of the project to the following agendas:
Transport, particularly road safety. Road crashes cause around 1.3 million deaths and injure or disable as many as 50 million people each year.
Security. The intervention may affect personal safety ranging from crime to harassment. Road safety considerations will need to be taken for most road-based projects. The attached safety scoring tool can be used on a pilot basis to derive the rating for safety issues. Alternatively, when an International Road Assessment Programme (iRAP) rating is available, the difference between before and after cases is a prime indicator. Preferably, (i) all new or rehabilitation road designs should always have a higher safety rating than the existing road and have at least a three-star rating standard for all road users, (ii) roads with more than 50,000 vehicles per day should have a minimum of four stars for all users, and (iii) roads or sections of roads passing through linear settlements should have a minimum four-star standards for pedestrians and cyclists. Recommended quantitative indicators are
predicted number of road death fatalities, serious road injuries, and non-motorized transport users deaths; and
length of roads with an iRAP rating of two stars or less/three stars or more.
Score Descriptor Measure
3 Very strongly positive
The project will strongly reduce transport/road accidents in the project area. It resolves some safety and security sector issues at the sector level.
2 Strongly positive Between moderately positive and very strongly positive
1 Moderately positive The project will moderately reduce transport/road accidents in the project area. It contributes to the resolution of some safety and security sector issues.
0 Neutral/Marginally positive
Neutral or between moderately positive and moderately negative
–1 Moderately negative The project will moderately increase transport/road accidents in the project area. Some safety and security issues are not mitigated.
–2 Strongly negative Between moderately negative and very strongly negative
–3
Very strongly negative
The project will strongly worsen road safety and security in the project area in a manner that is or cannot be mitigated.

Toward a Sustainability Appraisal Framework for Transport | 43
SOC-5 Inclusion and Social Cohesion SOC-5a Inclusion
To what extent will the project enhance the mobility of all members of society, including vulnerable groups?
This question seeks to capture the combination of
whether the project will improve transport services that are the most used by vulnerable groups, and
whether project design allows universal access. Vulnerable groups in question particularly relate to women, children, the elderly, or people with physical or mental impairments, and ethnic and/or religious minority groups. When assessing inclusion, the following should be considered:
Vulnerable users have specific travel patterns. Particularly, women’s needs differ from working-age men’s needs. Transport services need to match the travel patterns of vulnerable users.
Physical design features can allow or prevent vulnerable users to benefit from the project. For example, without adequate provision for pedestrians and cyclists, a road would not provide access to the users of such non-motorized vehicles. Likewise, public transport vehicles built with narrow and heightened entrances may exclude use by children, the elderly, and people with physical impairments.
Universal design allows transport systems to be accessed by all users, regardless of their age, physical ability, or status. In public transport, this may include features such as low floors, high-contrast coloring, handrails, wheelchair ramps/lifts, and so forth, which allow all users to take advantage of the transport service.
Recommended quantitative indicators are average number of trips made per day by vulnerable groups, including women, children, the
elderly, people with physical impairments, and ethnic/religious minorities; number of users who previously were mobility-restricted; share of users who are from vulnerable group categories (e.g., women); and percentage of public transport vehicle (bus fleet, train carriages, etc.) stations and terminals that
are accessible to all vulnerable users.
To supplement these indicators, equality impact assessments (EqIA) can be conducted to map out the likely impacts (both positive and negative) of the transport project to vulnerable groups. For physical dimensions of road projects, iRAP scores for pedestrians, and dedicated tools to measure pedestrian and cyclist environment quality (Global Walkability Index, Streetaudit, etc.) can be used. For public transport systems and vehicles, checklists on inclusiveness can be utilized to assess routes, vehicles, and stations.
Score Descriptor Measure
3 Very strongly positive
The project will very strongly improve the mobility of vulnerable groups.
2 Strongly positive Between moderately positive and very strongly positive
1 Moderately positive The project will lead to a moderate improvement in the mobility of vulnerable groups. The project may not meet their most pressing needs.
0 Neutral/Marginally positive
Neutral or between moderately positive and moderately negative
–1 Moderately negative The project will indirectly hamper the mobility of vulnerable groups.
–2 Strongly negative Between moderately negative and very strongly negative
–3
Very strongly negative
The project will very strongly negatively affect the availability of transport services used by vulnerable groups.

44 | ADB Sustainable Development Working Paper Series No. 31
SOC-5b Social Cohesion
To what extent will the project contribute to the development of cohesive and livable communities?
Transport infrastructure is a key determinant of community livability, which is determined by a composition of elements including safety, health, environment, and social cohesion. Focusing on social cohesion, well-designed streets meant for people rather than simply the movement of vehicles can help enhance interactions between local citizens. When rating social cohesion impacts, the different dimensions of social cohesion should be considered:
Social cohesion refers to the enhancement of street and community sociability realized through increased interactions between citizens. This aspect is related to the elimination of physical barriers that create a severance within the local environment. A pedestrian project may reduce severance and increase sociability, while a road project may have the reverse effect.
Social cohesion also refers to the extent that different economic classes or different social groupings (e.g., divisions by race, religion, nationality, etc.) are encouraged to come in contact due to the intervention. Social interaction between different societal groupings breaks down tensions within a society and leads to greater sensitivity between groups. For example, a high-quality public transport system may be the only forum within a city where low- and high-income individuals will interact. Likewise, such a system may be the only place where individuals come in contact with people with disabilities or the elderly. By contrast, projects that induce further individual motorized transport may reduce social interactions of this type.
The impact is relevant for all projects that target built-up areas. For urban transport projects, they should be assessed on how they are designed so as to increase social interaction, e.g., through designing streets/corridors that allow for social activities to take place and link to surrounding land use policy to maximize opportunities for shopping, recreation, and other social interactions. Recommended quantitative indicators are
share of people in the area of influence who consider the project as having a positive impact on social cohesion and quality of life;
areas of new active spaces created for relaxation, recreation, and social interaction; and percentage of people from each economic grouping and/or by age who will utilize the new
infrastructure and can interact.
Score Descriptor Measure
3 Very strongly positive
The project aims at alleviating tensions within strained communities, through a major improvement of common spaces and elimination of physical barriers to increase social interactions.
2 Strongly positive Between moderately positive and very strongly positive
1 Moderately positive The project will moderately enable stronger social cohesion, through creation of public spaces, and encouragement of social interactions.
0 Neutral/Marginally positive
Neutral or between moderately positive and moderately negative
–1 Moderately negative The project will create or increase separation between social groups. It may sever communities, deteriorate the quality of common spaces, or target only the wealthiest.
–2 Strongly negative Between moderately negative and very strongly negative
–3
Very strongly negative
The project will strongly exacerbate existing strained relations within and between social groups and exclusion of vulnerable groups.

Toward a Sustainability Appraisal Framework for Transport | 45
ENVIRONMENTAL SUSTAINABILITY CODEBOOK The construction, maintenance, and operation of transport systems makes significant demands on land, material, energy, and water resources and can be a major source of emissions, pollution, and environmental degradation. Resilience of transport infrastructure to the long-term risks from climate change is also of increasing concern. Transport projects have a range of adverse and beneficial effects. With integrated planning and design and good practice during construction and operation, the environmental sustainability of projects can be significantly improved. Environmental outcomes of the project will be measured in terms of contribution to emission loads (greenhouse gases, pollutants, noise, and light), impacts on the natural and built environment, and resilience to climate change. The rating scale for the environmental sustainability core criterion and the associated qualitative measures are as follows:
Score Descriptor Measure
3 Highly environmentally sustainable
Environmental impacts are expected to be very strongly positive.
2 Environmentally sustainable Environmental impacts are expected to be strong and positive; any negative impacts are expected to be minor.
1 Moderately environmentally sustainable
Environmental impacts are expected to be moderately positive or partly offset by negative impacts.
0 Neutral/Marginally environmentally sustainable
There will not be any significant environmental impact, or a mix of minor positive and minor negative impacts result in a negligible impact.
–1 Moderately environmentally unsustainable
Environmental impacts are expected to be moderately negative, or positive impacts are offset by slightly more negative impacts.
2 Environmentally unsustainable There will be some strongly negative environmental impacts.
3 Highly environmentally unsustainable
There will be some very strongly negative environmental impacts or multiple strongly negative ones.
The rater should use his or her judgment to derive the environmental sustainability rating. A narrative description should be provided to substantiate the judgment. No mandatory weighting between subcriteria is recommended.

46 | ADB Sustainable Development Working Paper Series No. 31
ENV-1 GHG Emissions
To what extent will the project reduce transport sector emissions of greenhouse gases?
This question seeks to measure the net cumulated long-term impact of the project on transport sector greenhouse gas emissions from the project area. The transport sector accounts for about 13% of global anthropogenic greenhouse gas emissions. Carbon dioxide (CO2) emissions from transport, which are a major contributor to climate change, are expected to grow 300% by 2050 with most of this growth coming from the developing world. To rate this subcriterion, both impacts during construction and during operation should be considered. Impacts embedded in materials and energy used on-site should preferably be considered. Project impacts are obtained by comparing the project situation to a base case scenario, which is usually not the baseline. In the early stages of preparation, the qualitative assessment can be based on typical impacts arising from similar types of projects. In the appraisal stage, it is recommended to base it on the full quantification of project emissions during the life cycle. A sense of the efficiency of the project can be obtained by comparing the cost per ton of CO2 equivalent savings with international benchmarks. A project may have a positive impact by
avoiding or reducing the volume or distance of travel, e.g., integrated transit and land-use planning and travel demand management;
encouraging the shift to lower or zero-carbon modes, e.g., by providing rail alternatives, public transport, pedestrian and cycling networks, or facilitating intermodal interchange; and
improving the efficiency of existing modes of transport. A project may have a negative impact by
encouraging a modal shift to less efficient transport modes and/or inducing unnecessary traffic, particularly when it reinforces the “lock-in” of transport systems in high-carbon transport modes; and
involving major earthworks or steel/concrete superstructures, such as tunnels/bridges.
Recommended quantitative indicators are quantity of CO2 emissions per unit of travel (tons/pkm or tkm) emitted by the transport system,
compared to the base case; quantity of CO2 emissions (tons) emitted during the project life, compared to base case; and change in the percentage of the modal share of lower and zero-emission modes.
Score Descriptor Measure
3 Very strongly positive
Massive long-term reduction in transport sector greenhouse gas (GHG) emissions expected
2 Strongly positive Between moderately positive and very strongly positive
1 Moderately positive Limited reduction in transport sector GHG emissions expected when related to the size of the project; step improvement in shifting transport systems toward low-carbon modes
0 Neutral/Marginally positive
Neutral or between moderately positive and moderately negative
–1 Moderately negative
Moderate increase in transport sector GHG expected; marginally reinforces role of high-carbon transport modes
–2 Strongly negative Between moderately negative and very strongly negative
–3 Very strongly negative
Massive increase in transport sector GHG expected; project will lock in transport system development in a negative direction, while better alternatives are available

Toward a Sustainability Appraisal Framework for Transport | 47
ENV-2 Transport-Related Pollution and Nuisances
To what extent will the project reduce transport-related emissions of air pollutants, noise,
vibration, and light, and pollution of surface water, groundwater, and soil? This question seeks to assess
the net contribution of the project to increasing/reducing the amount of air and other pollutants emitted by the transport sector in the project area; and
the net impact of infrastructure construction and operation on air, water, soil, noise, and light pollution, after mitigation.
In cities of the developing world, transportation can be the source of up to 80% of harmful air pollutants, including fine particulate matter (PM), carbon monoxide, volatile organic compounds, lead, nitrous and sulfur oxides, and dust. These pollutants cause adverse health effects and other negative impacts, such as reduced visibility and physical damage. Noise and vibration generated by transport can be detrimental to health and well-being, particularly if it disturbs sleep, and it can also reduce the value of properties. Transport infrastructure is a major source of artificial light, which, if poorly designed, can cause a nuisance to people and disrupt the behavioral patterns of plants and animals. Emissions from construction activities and traffic can be a major contributor to environmental degradation. Earthworks modify surface relief; may intersect drainage basins, resulting in loss of productive topsoils and increased risk of erosion and landslides; and result in deterioration of soil, groundwater, and surface water quality. To assess the contribution, particular consideration should be given to the following:
For urban projects, the net project impact on particulate matter (PM), and NOx and SOx emissions should preferably be established quantitatively. Higher impacts are associated with higher population densities in the immediate project area.
For rural road projects, the increase/decrease of dust emissions associated with unpaved roads should be measured.
The net contribution of the project to air, water, soil, noise, and light pollution recorded in the project’s area of influence should be established.
Recommended quantitative indicators are
number of annual exceedances of PM10 standards along key corridors*; number of people exposed to traffic noise levels affecting well-being**; number of annual exceedances of water quality standards along key corridors; and net quantity of PM10 (or PM2.5) and NOx (tons) emitted during the project life, compared to the
base case. * suggested default: WHO daily 24-hour average PM10 standard of 50µg/m3 ** suggested default: 60 dB(A) during the day and 50 dB(A) during nighttime
Score Descriptor Measure
3 Very strongly positive
Major long-term reduction in transport sector air pollution/noise expected in a dense urban area
2 Strongly positive Between moderately positive and very strongly positive
1 Moderately positive Moderate reduction in transport sector air pollution/noise expected; project works’ negative impacts satisfactorily mitigated/compensated
0 Neutral/Marginally positive
Neutral or between moderately positive and moderately negative
–1 Moderately negative
Moderate increase in air pollution/noise expected; project works carry minor negative impacts after mitigation/compensation
–2 Strongly negative Between moderately negative and very strongly negative
–3 Very strongly negative
Major increase in transport sector air pollution/noise emissions expected; project works have major unmitigated negative impacts

48 | ADB Sustainable Development Working Paper Series No. 31
ENV-3 Resource Efficiency To what extent does the project minimize transport’s use of natural resources, materials, energy,
water, and land, and limit waste generation and disposal? This question seeks to measure whether, when compared with relevant benchmarks of similar projects, the project does the following:
Energy: minimizes consumption of energy resources and uses renewable sources of energy Land: minimizes use of land and maximizes reuse of land Water: conserves water and/or minimizes the use of water resources, and maximizes reuse and
recycling of wastewater Materials: optimizes material procurement, taking opportunities to use future-proof design and
technologies, specifying durable, climate-responsive materials, and materials with lower environmental impact
Waste: minimizes construction and operational waste and considers life-cycle analyses to inform sensitive and/or complex investment decisions.
Recommended quantitative indicators are
percentage of energy efficiency savings when compared with relevant benchmarks, percentage of water consumption savings when compared with relevant benchmarks, share (by value) of recycled content of materials, share of materials locally/regionally sourced, and share of construction and operational waste diverted from landfill.
Score Descriptor Measure
3 Highly resource- efficient
High rates of energy and water savings (20% and over), most waste diverted from landfill, opportunities to save land taken during the planning stage; explicit resource efficiency strategy, potentially rewarded with highest or second highest certificates from established environmental rating entity
2 Resource-efficient Between moderately resource-efficient and highly resource-efficient
1 Moderately resource-efficient
Systematic approach to resource efficiency in some fields; innovations in design or implementation introduced, leading to proven improvements from standard practices in area/sector
0 Less resource-efficient
Neutral or between moderately positive and moderately negative
–1 Moderately resource-inefficient
No particular consideration for resource efficiency; project aligned with common practices in sector/area which are perceived to be moderately inefficient
–2 Resource-inefficient Between moderately resource-inefficient and highly resource-inefficient
–3 Highly resource-inefficient
Massive waste of natural resources; design/building practices aligned or below common practices in sector/area which are perceived to be highly inefficient

Toward a Sustainability Appraisal Framework for Transport | 49
ENV-4 Natural and Built Environment
To what extent will the project preserve the natural environment and maintain integrity of ecosystems, biodiversity, and the services they provide, and enhance the built environment,
landscape, townscape, physical cultural resources, and their settings? Transport projects can have a range of positive and negative effects on the natural and built environment. Development of new transport infrastructure may require considerable land take and materials resulting in loss and degradation of natural and built assets. Linear corridors can fragment the environment and facilitate the spread of invasive species. Conversely, they can provide connectivity between landscapes, create new “green infrastructure” such as urban greenways and sustainable stormwater drainage systems and provide undisturbed habitat refuges within and adjacent to the right of way. The extent to which an intervention is compatible with existing land use, scale, form, and appearance, and is responsive to local values and needs plays a strong role in determining whether it will create a positive or negative change. To assess the impact, the following should be considered:
Whether the effects of an intervention will result in an increase or a decrease of “natural capital” in the project area. A net loss would occur in the event of irreversible effects on valuable habitats, species, and/or key natural processes that cannot be avoided, mitigated, or offset across the life cycle of the project. A net gain would involve enhancing existing valuable habitats, species, and/or key natural processes, or providing equivalent offsets, and creating new areas of habitat and/or features of value for biodiversity. Gains may be in terms of an area of habitat created or enhanced, or number of features of value created. Gains may also be achieved through an intervention that mitigates an existing adverse environmental effect.
Whether characteristic features of the landscape, cultural heritage resources, and other built assets can be maintained.
Whether the proposed design, technology, and material specifications are appropriate for the local setting, culture, and climate, and the positive contributions that will be make up the value and character of the project area.
Recommended quantitative indicators are area of valuable, natural, modified, and productive habitats converted for development; damage to or degradation of resources that provide key ecosystem services; net gain/loss of biodiversity within the project area of influence; net gain/loss of productive land within the project area of influence; and net gain/loss of ecosystem services within the project area of influence.
Score Descriptor Measure
3 Very strongly positive
The project will strongly improve the value of a cultural site of high national interest, or have a large positive impact on the biodiversity of a nationally designated site or other area of significant value.
2 Strongly positive Between moderately positive and very strongly positive
1 Moderately positive The project will help enhance a site of some local cultural interest or have a clear net minor positive impact on local biodiversity.
0 Neutral/Marginally positive
Neutral or between moderately positive and moderately negative
–1 Moderately negative
The project will have evident minor negative impact on a regionally designated site or will affect the ecological objectives of an undesignated site of some local biodiversity interest, or will adversely impact a site of some local cultural interest.
–2 Strongly negative Between moderately negative and very strongly negative
–3 Very strongly negative
The project will adversely affect the integrity of a national site or a local one with limited potential for substitution, or a national cultural heritage site.

50 | ADB Sustainable Development Working Paper Series No. 31
ENV-5 Climate Resilience
To what extent will the project’s design and construction contribute to the resilience of the
transport system against climatic risks? This question seeks to assess primarily the extent to which the project will enhance the transport system in a way that makes the local economy more resilient to climate effects. The long-term climate resilience itself of the project is a condition for durably delivering these outcomes. The project’s contribution to local climate resilience primarily comes from the function that the enhanced transport system plays in changing the level of vulnerability of the local population. For example, a new transport route may reduce vulnerabilities by providing an additional route in case the existing route becomes flooded. In the long term, transport infrastructure can change settlement patterns in ways which, for example, shift the population to less flood-prone areas. The converse may also occur. Changes in temperature and rainfall patterns (including more intense and frequent floods and droughts), sea-level rise, and storm surges will have wide-ranging impacts on the design, construction, and maintenance of different components (e.g., road, pavement, drain, bridge, culvert, protection structure) of transport projects. Unless impacts of these changes on project components are assessed and appropriate options for improving the resilience of project components to such impacts have been identified, prioritized, and integrated into the project design, it should be assumed that expected outcomes of the project will be undermined through the malfunctioning or total failure of the project. The following considerations should be made:
the extent to which local design standards are appropriate to the current climatic conditions and the degree of climate resilience they imply;
the likely changes in temperature, rainfall patterns, sea level, and storm surge in the project area that may pose risks to the performance of project components; and
the extent to which the project incorporates cost-effective climate-resilient design and construction options appropriate to the current and changing climate: adjustments to the design parameters for at-risk structures (e.g., to increase the freeboard of bridges, heighten the embankment), selection of construction material (e.g., to withstand higher temperature and/or larger winter/summer, day/night temperature contrast), and provision of maintenance.
Recommended quantitative indicators are number of days within a year with closure of transport services due to extreme weather; number of days within a year with disrupted transport services due to severe weather conditions;
and ratio of project cost to cost incurred for climate-resilient project design and construction in line
with good practices.
Score Descriptor Measure
3 Very strongly Positive
The project will lead to a major overall improvement in the climate resilience of the local transport services benefitting a large number of people. The project is itself highly climate resilient.
2 Strongly positive Between moderately positive and very strongly positive
1 Moderately positive The project will moderately improve the overall climate resilience of the local transport systems. The results of a climate change resilience assessment have been included in the project design.
0 Neutral/Marginally positive
Neutral or between moderately positive and moderately negative
–1 Moderately negative
The project’s functionality is likely to be lastingly impaired by climate events that are likely to occur in the long run.
–2 Strongly negative Between moderately negative and very strongly negative
–3 Very strongly negative
The project is critically vulnerable to climate events that are very likely to occur in the medium term, when the economy will strongly depend on it.

Toward a Sustainability Appraisal Framework for Transport | 51
RISK TO SUSTAINABILITY CODEBOOK Risk to sustainability measures the risk that expected outcomes and impacts may not be realized or sustained because of weak institutions, lack of financing, or simply because of the uncertainty of the evaluation. When rating risk to sustainability, the following should be taken into account:
Design and evaluation risks: risk of cost overruns, of inferior demand, of having less-than-expected positive impacts, or more-than-expected negative impacts, because of the limited quality of the data and studies that substantiate the evaluation or because of external economic, social, environmental, or political risks
Implementation risks: risks that the project is delayed, cancelled, or fails to perform because of weak contractor performance, nonavailability of counterpart financing, poor project management capacity, or limited local acceptability
Operational sustainability risks: risks that the project’s level of service is not sustained at the expected level because of inferior financial sustainability, lack of adequate maintenance, poor governance/corruption, or other limited institutional capacity risks.
When assessing design, implementation, and operation risks, the evaluator should first consider how those risks have affected projects of a similar nature in the past. Unless new specific mitigation measures are taken, it is prudent to consider that those risks will remain. Mitigation measures included in the project or program may reduce those risks. Positive impacts of institutional strengthening activities at the sector level may also count as positive impacts, which reduce the overall risk level. The rating scale for the risk to sustainability core criterion, and the associated qualitative measures are as follows. It follows a 4-point scale, as low, medium, high with mitigation, and high. While these are qualitatively determined, the following benchmarks may apply: In a category with a high risk rating, an event that has a moderate chance of occurrence may change the value of costs or benefits by more than 20% or lead to delay of more than 1 year. A medium risk rating may imply a 10%–20% range, or a delay of 3–12 months. A low risk rating implies a range below 10% or a delay of less than 3 months.
Score Descriptor Measure
1 Low Residual risks are low; there are moderate chances that they happen and their consequence would remain minor, or there are minor chances that they happen and their consequence would remain moderate.
0 Medium Residual risks are moderate; the chances that they happen and their consequences are moderate; any risk that would have a severe consequence has rare chances of occurring.
–1 High with mitigation Residual risks are high; there are significant chances that some risk with a severe consequence occurs; appropriate mitigation measures are in place.
–2 High Risks are high and are or cannot be mitigated.

52 | ADB Sustainable Development Working Paper Series No. 31
RISK-1 Design and Evaluation Risks
To what extent do the project costs, demand, and expected benefits involve risks and uncertainty?
This question reflects that the evaluation happens before the project is implemented, potentially at an early stage of preparation. It includes the risk of cost overruns, of inferior demand, of having less-than-expected positive impacts, and/or more-than-expected negative impacts, because of the limited quality of the data and studies that substantiate the evaluation or because of external economic, social, or political risks. Uncertainty surrounding the project’s costs, demand, and benefits is generally high in the early stages of project preparation and reduces gradually until project completion. The risk analysis proposed in this score book can be complemented by analysis of whether project contingencies reflect the common optimism bias found in early stages of projects. The following table provides standard uplifts that can be applied to engineering estimates. They are based on guidelines from New Zealand and the United Kingdom.
Stage of Project preparationType of Project
Prefeasibility Feasibility Study
Detailed Design
Maintenance projects 15% 10% 5% Road projects 40% 20% 5% Rail projects, including bus rapid transit 50% 30% 5% Bridge/tunnel projects 50% 30% 5% Building projects (stations, logistic centers) 40% 20% 5%
To assess this risk as low, medium, or high, the rater may use the following checklist, which identifies high and low risk factors: Risk Category Rating Risk Factors1. Cost risks
Earthworks
Low risk
- Good knowledge of ground conditions: high density of sampling and good exposure of conditions
- Simple conditions: previously engineered ground, nonplastic materials to excavate, etc.
- Simple design form: small slope cuts, no bridge or tunnels - Flat terrain with considerable mapping - Materials can be sourced locally
High risk
- Poor knowledge of ground conditions: little or no subsurface investigations - Difficult geological conditions: swamps, marine sediments, permafrost,
etc. - Complex design form: high cuts, tunnels or bridges - Mountainous terrain, heavily vegetated, no topographical data - High volume of materials to be sourced, uncertain sources
Engineering complexity Low risk - Simple engineering, using long-established principles and methods High risk - Complex solutions, difficult engineering issues
Utilities
Low risk - Complete certainty of utility network location and condition - Good site flexibility - Single authority in charge of utilities with good track record
High risk - Location of utility networks unknown, data unreliable - Constrained urban corridor - Several authorities to be coordinated, poor track record
Land acquisition and resettlement
Low risk
- All land owned by road authority and clear - Recent market valuations and official compensation guidance - Well-defined corridor, reliable and recent property survey - No illegal land occupancy
High risk - Most property to be acquired - No official procedure and guidance - Important uncertainty on infrastructure alignment, and quick changes in

Toward a Sustainability Appraisal Framework for Transport | 53
Risk Category Rating Risk Factorsland use possible
- High illegal land occupancy
Environment
Low risk
- Limited environmental impacts (category B or C) - Environmental surveys done - Consultations expected to go smoothly/already completed - No natural hazards, such as earthquake or flood expected - Limited climate change impacts expected
High risk
- Large environmental impacts (category A) - No environmental survey done - Consultations expected to be difficult or cannot be predicted - Frequent natural hazards in area - High climate change sensitivity
Prices Low risk
- History or low, well-predictable inflation rates nationally and in sector - Large market available from which to procure works and goods - Low share of foreign costs or with history of limited variations of US dollar
foreign exchange (FOREX)
High risk - High inflation, high variability of FOREX - Very limited market available with existing tensions
2. Demand risks
Base travel demand
Low risk
- Data less than 2 years old - Comprehensive quality data, e.g. covering corridor, parallel itineraries and
modes, with full origin-destination surveys, annual traffic count program, and household traffic surveys on more than 3% of the population or 5,000 people available
- Historic data of more than 5 years with regular trends - Close fit between traffic matrix and counts - Knowledge of traffic composition based on annual classified vehicle
counts
High risk
- Data more than 5 years old - Traffic count and O/D surveys far from activity corridor - 3-day or less traffic counts and no knowledge of seasonality, no
household surveys - Weak fit of traffic matrix and counts - No historic data or unreliable trends - Traffic composition based on standard values
Growth forecasts
Low risk
- Projected traffic growth rate less than 3% annually - Generated or induced traffic less than 10% of traffic using the facility - Projection is based on 10 years or more of count data; forecasting
equation uses multiple explanatory variables with close historic fit
High risk
- Projected traffic growth rate more than 6% annually - Generated or induced traffic less than 20% of total flows - Projection is based on gross domestic product multiplied by a standard or
weakly reliable traffic elasticity relationship - Large changes in vehicle composition predicted
Route assignments
Low risk
- Less than 10% of traffic expected to divert to facility - No closely competing route, because route is significantly shorter or of
higher standard than others - No toll or additional surcharge charged - Network uncongested
High risk
- Number of competing alternative routes - Project route provides better service but is of longer length - Some competing alternative routes have smaller out-of-pocket
expenditures - No tolling experience in area/country - Parts of the network are (or are predicted to be) highly congested
Mode shift Low risk
- Mode shift is mainly between similar kinds of transport modes - Competitive reaction of competing transport modes is well-understood and
taken into account, e.g. because they are regulated or state-owned High risk - Fully new transport mode in city/area

54 | ADB Sustainable Development Working Paper Series No. 31
Risk Category Rating Risk Factors- Competing transport modes likely to compete harder in reaction to new
project, by cutting fares/restructuring services - Modal shift from individual transport (e.g., car, taxi, road freight) to mass
transport modes (e.g., bus, rail) accounting for more than 20% of traffic expected
3. Benefit risks
Transport system costs
Low risk
- Data on vehicle operating costs derived from less than 3-year-old economic data
- Value of time estimates derived from less than 3-year-old survey data undertaken in the project area
- Rail operating costs based on specific operation forecasting and recent analysis of fixed/variable costs
- For interurban road projects, road user costs based on Highway Development and Management (HDM-4) modeling of road condition calibrated on local data
High risk
- Data on vehicle operating costs, railway costs, and user value of time is based on standard values
- For interurban road projects, road user costs not computed on road condition modeling
Road accidents
Low risk
- Less than 10% of benefits accounted for by road crash reductions, or: - If more, specific crash reduction study performed for the project corridor,
using a database of more than 100 crashes occurred on the project corridor
High risk
- More than 20% of benefits accounted for by road accident reductions, or: - In case a specific analysis is conducted, analysis based on less than 40
crashes on the project corridor, with weak knowledge of impact of chosen countermeasures in country
Vehicle emissions impacts
Low risk - Less than 10% of benefits accounted for by vehicle emission reductions - If more, vehicle emissions reductions based on a recent on-the-road
survey of vehicle emission factors and detailed classified vehicle counts
High risk
- More than 20% of benefits accounted for by vehicle emission reductions, or:
- In case a specific analysis was conducted, analysis based on more than 3-year-old on-the-road survey of vehicle emission factors, or no survey available
Any other monetized impacts
Low risk - Other beneficial monetized impacts account for less than 10% of total
benefits - Other adverse monetized impacts account for less than 10% of total costs
High risk
- Other beneficial monetized impacts account for more than 20% of total benefits
- Other adverse monetized impacts account for more than 20% of total costs

Toward a Sustainability Appraisal Framework for Transport | 55
RISK-2 Implementation Risks To what extent implementation risks are likely to lead to delay, cancelations, or below-expectation
performance and/or unmitigated negative social/environmental impacts? This question reflects the complexity of the implementation of transport projects in a developing country. Implementation risks include risks that the project is delayed, cancelled, or fails to perform because of weak contractor performance, nonavailability of counterpart financing, poor project management capacity, or limited local acceptability. Measures taken to mitigate this risk—the use of project management consultants, the institutional arrangements, and the capacity building built in the project—should be reflected in the assessment. To assess this risk as low, medium, or high, the rater may use the following checklist, which identifies high and low risk factors:
Risk Category Rating Risk Factors4. Implementation
Contractor performance
Low risk
- Large pool of qualified contractors potentially interested - Sound track record of contractors in delivering quality works within time - Sound track record of contractors and implementing agency with
International Federation of Consulting Engineers (FIDIC) contracts
High risk
- Few contractors potentially interested - Remote area - Track record of contractors delivering works with poor quality and delays - Weak track record or contractors and implementing agency with FIDIC
contracts, language barriers
Availability of counterpart financing
Low risk - Capacity of government to decide quickly to mobilize up to 50% more
financial resources than initially predicted - Sound track record of providing counterpart financing in time
High risk
- Counterpart financing either highly constrained or with payment delays - Government difficulties to extend quickly counterpart financing as needed - Most financing coming from donors so that any cost overruns would
require additional donor resources
Project management capacity
Low risk
- Sound track record in implementing similar externally financed projects within time and budget
- Unique, well-staffed, and efficient implementation structure with sufficient power delegation
High risk - Multiple agencies involved with poor track record in coordination - Poor track record of implementing agency - Understaffed implementation structure with limited decision powers
Local acceptability
Low risk - Low density area/limited disruption caused - Quality traffic management plan prepared - Strong local acceptability of project shown in consultations
High risk
- Project in densely populated urban area or causing significant disruptions during construction
- Weak track record of implementing agency and contractors in managing communications with stakeholders
- Consultations show strong local opposition to the project by some groups

56 | ADB Sustainable Development Working Paper Series No. 31
RISK-3 Operational Sustainability Risks
To what extent are the project’s outcomes likely to be sustained during operation and negative impacts efficiently mitigated?
This question seeks to consider the risks that the project’s benefits may be short-lived. Operational risks include risks that the project’s level of service is not sustained in the long run at their expected level because of inferior financial sustainability, lack of adequate maintenance, poor governance/corruption, or other limited institutional capacity risks. Weak institutional capacity can also reduce the longevity and efficiency of the various project features that are designed to mitigate social or environmental risks. Measures taken to mitigate this risk—e.g., to increase social acceptance, political support, institutional capacity, financial viability, and ensure long-term maintenance financing—should be reflected in the assessment. To assess this risk as low, medium, or high, the rater may use the following checklist, which identifies high and low risk factors:
Risk Category Rating Risk Factors5. Operational sustainability
Financial sustainability Low risk
- Revenues fully cover operating and maintenance and capital renewal costs
- Operating entity is profitable and has a sustainable business model
High risk - Revenues do not fully cover operating and maintenance costs - Operating entity runs a deficit, requires constant government subsidies
Maintenance
Low risk
- Less than 10% of national or local road network is in poor condition (e.g., roughness index more than 6)
- Maintenance budgets cover at least 80% of budgets requested by road agency or periodic maintenance on more than 10% of total network length annually
- Efficient overloading control program in place with evidence that overloading is limited in size
- Design based on the results of a specific axle load survey
High risk
- Evidence that more than 30% of comparable national or local road network is in poor condition (e.g., roughness index more than 6), or latest road condition survey data available is more than 3 years old
- Maintenance budgets cover less than 50% of requested budgets by road agency, or periodic maintenance program on less than 5% of total network length annually
- No overloading control or evidence that overloading is frequent and severe
Other institutional capacity and governance
Low risk
- For transit or rail projects: proven capacity of operating entity to run efficiently operations
- For private concessions: well-established regulatory and legal environment
- Corruption risks assessed by independent party as limited
High risk
- For transit or rail projects: weak capacity of operating entity to run efficiently operations
- For private concessions: new regulatory domain (e.g., first public–private partnerships) or high perceived regulatory cost
- Corruption risk assessed as significant by independent party

Toward a Sustainability Appraisal Framework for Transport | 57
APPENDIX: POTENTIAL ALTERNATIVE SCALES The rating scale and the associated descriptors influence subjectively the rating. As such a rating scale is likely to perform best in a given institutional and project context. Among the many alternative scales reviewed when designing the Sustainable Transport Appraisal Rating (STAR) are
5-point scales instead of 7-point scales (e.g., unsustainable, moderately unsustainable, marginally sustainable, moderately sustainable, and sustainable); similarly for the impact ratings: strongly negative, moderately negative, neutral, moderately positive, and strongly positive
Unbalanced scales where all negative core criterion ratings are combined together in a single “unsustainable” rating: unsustainable, moderately sustainable, sustainable, and highly sustainable
Positive scoring scales ranging from 0 to 6 instead of –3 to +3 for the individual ratings, which are then combined in a 0 to 20 overall scale (presented in the table below)
Alternative wording, particularly as some raters were reluctant to use “negative” descriptors. Some examples are given in the table below:
Alternative Score
Scales Alternative Descriptor
Scales
10 20 AAA
A+ Highly
Sustainable
Outstanding9 19 AA+
8 18 AA Excellent
7 17 A+
6 16 A A Sustainable
Very Good
5 15 BBB+ Good
4 14 BBB B+
Moderately Sustainable
Fair 3 13 BBB–
2 12 BB B
Marginally Sustainable
Pass 1 11 B
0 10 CC C
Moderately Unsustainable
Close to Fail–1 9 C
–2 8 DDD
D Unsustainable Fail –3 7 DD
–4 6 D
–5 to –10 0 to 5 E E Highly
UnsustainableCatastrophic

Toward a Sustainability Appraisal Framework for Transport
Adrien Véron-Okamoto and Ko SakamotoNo. 31 | January 2014
Toward a Sustainability Appraisal Framework for Transport
Transport sector support at the Asian Development Bank (ADB) is changing to meet the new challenges facing its developing member countries. In 2010, ADB adopted its Sustainable Transport Initiative Operational Plan (STI–OP), which recognizes the need to support transport that is accessible, affordable, environment–friendly, and safe. At the Rio+20 United Nations Conference on Sustainable Development, ADB joined seven other multilateral development banks in committing to financing more sustainable transport projects and reporting annually on the sustainability of their portfolio. A working group on sustainable transport was set up, tasked with developing a common assessment framework. The proposed Sustainable Transport Appraisal Rating (STAR) is a tool for assessing the sustainability of ADB’s transport projects and monitoring changes in the portfolio. It is intended to serve as a tool to design more sustainable transport projects in line with the STI–OP. It is also developed as a contribution to the emerging common assessment framework of the eight multilateral development banks.
About the Asian Development Bank
ADB’s vision is an Asia and Pacific region free of poverty. Its mission is to help its developing member countries reduce poverty and improve the quality of life of their people. Despite the region’s many successes, it remains home to two-thirds of the world’s poor: 1.8 billion people who live on less than $2 a day, with 903 million struggling on less than $1.25 a day. ADB is committed to reducing poverty through inclusive economic growth, environmentally sustainable growth, and regional integration.
Based in Manila, ADB is owned by 67 members, including 48 from the region. Its main instruments for helping its developing member countries are policy dialogue, loans, equity investments, guarantees, grants, and technical assistance.
Asian Development Bank6 ADB Avenue, Mandaluyong City1550 Metro Manila, Philippineswww.adb.org/povertyPublication Stock No. WPS146304
Printed in the Philippines
ADB Sustainable Development
Working Paper Series
Printed on recycled paper