Embed Size (px)
Citation preview
Session VIII. Passive Infrared Technology N93-14849
Development of the Advance Warning Airborne System (AWAS)
Pat Adamson, Turbulence Prediction Systems
PRECEDING P_E BLANK r,!OT F.ILM£D 687
https://ntrs.nasa.gov/search.jsp?R=19930005660 2018-07-03T07:48:12+00:00Z

ABSTRACT
DEVELOPMENT OF THE ADVANCE WARNING AIRBORNE SYSTEM (AWAS)
H. PATRICK ADAMSON
TURBULENCE PREDICTION SYSTEMS
BOULDER, COLORADO 80301
The thermal characteristics of microbursts are utilized by the
AWAS IR and OAT features to provide predictive warning of
hazardous microbursts ahead of the aircraft during landing or
take off. The AWAS was evaluated satisfactorily in 1990 on a
Cessna Citation that was intentionally flown into a number of
wind shear events. The events were detected, and both the IR and
OAT thermal features were shown to be effective. In 1991, AWAS
units were flown on three American Airlines MD-80s and three
Northwest Airlines DC-9s to study and to decrease the nuisance
alert response of the system. The AWAS was also flown on the
NASA B737 during the summer of 1991. The results of these
flights were inconclusive and disappointing. The results were
not as promising as before because NASA conducted research
flights which were outside of the normal operating envelope for
which the AWAS is designed to operate. In an attempt to
compensate for these differences in airspeed and mounting
location, the automatic features of the system were sometimes
overridden by NASA personnel during the flight. Each of these
critical factors is discussed in detail. The effect of rain on
the OAT signals is presented as a function of the air speed. Use
of a 4 pole 1/20 Hertz filter is demonstrated for both the IR and
thermal data. Participation in the NASA 1992 program was
discussed. FAA direction in the continuing Certification program
requires the addition of a reactive feature to the AWAS
predictive system. This combined system will not require flight
guidance on newer aircraft. The features of AWAS-IV, with the
NASA algorithm included, were presented. Expected completion of
the FAA Certification plan was also described.
689

I
I
I 0
Z
Z0I
I
Z
6_

Over the past five years, Turbulence Prediction Systems (TPS), in Boulder,
Colorado has combined the concepts of the thermal properties of microbursts
with the behavior of infrared OR) in the atmosphere, and OAT (Outside Air
Temperature) response on the aircraft flying into such events. From these
studies, TPS has established an Advance Warning Airborne System (AWAS)
that has proceeded through its third version, AWAS-III, and is in process of
FAA certification.
691

00")
i-<r,
<
(I)Z
<r,
0
O0
O0rr
00
O0I--
U_
692

During the summer of 1990, AWAS-III was flown on the Cessna Citation
research aircraft operated by the University of North Dakota (UND) in
conjunction with the FAA study of the MIT Terminal Doppler Weather Radar
(TDWR) in the detection of microbursts. This provided unique opportunity
for AWAS-III to predict and enter a number of wet microbursts in Orlando,
Florida, and several dry microbursts in Denver, Colorado.
6_

AWAS-III, with software version 2.0, was installed in the Citation in June of
1990. It was located in the luggage compartment in front of the pilot, and
the IR from ahead of the aircraft was reflected into AWAS-III via a 2" gold
coated mirror mounted outside, just below the windshield, where it did not
interfere with the pilot's view. Sixty-six flights were flown in attempts to
make wind shear contacts.

E
Co III
ii
0
Im
rl
ciii
n
imi--
I--
, •C _ rl
Q
J
I
I,D
"I0
0
IT-
/\
mmm J
J
lU
m
C
I3. O.
695
The received IR power is separated into appropriate wavelengths by a
spectrometer. The IR power in these wavelengths is then registered by two
IR detectors. AWAS processes the difference between far and near IR
indicated temperatures to generate a "Predictive Hazard Index" that relates to
the microburst's hazard. Airspeed, pitch, radio and pressure altitudes are
also used. The OAT data is also used to create a "Thermal Hazard Index"
relating to microbursts. For research purposes, 47 AWAS in flight and
aircraft data parameters are recorded. These parameters were used for the
post-flight analyses.
6_

i
<[n"I--LLiZIiiQ..
O03
¢-.-
c;II
n,"
!--It
.I-J
¢..,.,,
r_¢,,,.,-
c;II
Z©i
I--
I--i
v
LL
LO¢..,=
c;II
A
03<1:
LL
O3O3
Z<i:"3
<I:Or),<Z
ILlZrn
0L.)"0,i.._
03
LLIL.)Zilln--UJLLUJ
69'7

One of the most important microburst penetrations was on July 7th, 1990.
The aircraft airspeed during approach was 180 knots, and the aircraft entered
the center of the microburst. The IR created a warning at 55, and 35 seconds
before that which would have been provided using a hazard index calculated
from the winds recorded by the inertial system, i.e., inertial warning. The
Thermal Hazard Index provided a warning 15 seconds before the inertial
warning. The TDWR measured the event a few seconds before the aircraft
entered the microburs]. The hazard value calculated by the TDWR was
0.155, inertial hazard index was 0.17, and the AWAS IR hazard index was
0.15. This data was presented at the 3rd Combined NASA meeting in
January 1991.
6_

O0
Zz'_0rj----l--rr',_w_
LL
k-rr"LL!0
0
I.-COZi
Cb_I..12
n-.0II
Z00
0COCi
B_

Another important aspect of the certification program was to determine the
level of nuisance alerts which might occur in revenue service. American Air
Lines cooperated with TPS in this phase of the program. An AWAS-III with
a recorder was installed, starting in February of 1991, on 3 MD-80 aircraft.
Many thousand flights have been conducted with these units on board.
700

ORrGINAL PAGE
BLACK AI,_D WHITE Pi_OTOGRAPH
701
AWAS was installed in the front wheel-well of the MD-80. The mirror,
which is seen lower right in the picture, has the red alignment laser beam
centered on it. The laser is used in the installation to guarantee that AWAS
looks out the flight line of the aircraft.
7O2

n
a
ZOm
F-
_J_.J
I--U']Zm
I--
Zm
._J
Z
(Dm
P
J
(D00I
n
w
M
IDO..Zi
Z
(.D
O
wI
W
R
v
I--DQ.F.-:::3O
c,4
i,, (D
OO m
O
X
O
?03

The AWAS uses 28 VDC and the mirror is also heated with 28 VDC. The
AWAS receives the necessary aircraft data via ARINC. This aircraft data
and the AWAS generated data is transmitted to the recorder. A lap-top
computer was used as the recorder.
7o4
,<rY-E90r,r"Q_
LL
LL
LUI--,<a
LO03o3,¢.,,..-
I
_'- 0"30"3_0
,¢-.-.
r,,,,,.d-0
,¢.=.-
_'-- ILl
0 w
II
705

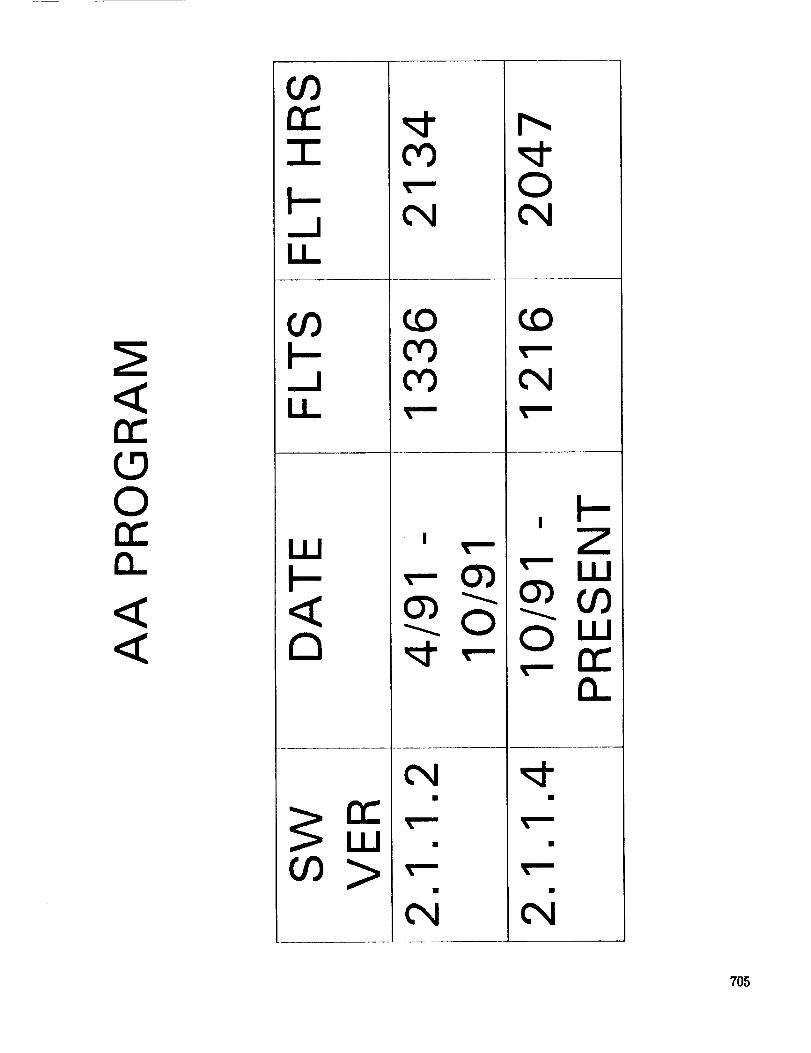
From an analysis of the early data the software version was changed in
October, 1991. Over a thousand flights have been recorded since these minor
software changes were installed.
7O6

Z0I
oo'_n f_I-.0_0
O9!.1.1
rr"0Z
I--
ZI
I
I
ZI
0n
?07

A second commercial airlines program involved the installation of AWAS-III
with a Honeywell Windshcar Computer on three DC9 aircraft. Northwest
Air Lines installed these units from June to December of 1991.
This installation was also in the front wheel well, on the port side, but at a
somewhat higher level.
708

m,
r"l
Z0I--
_.1
(/';Z
(/'1
0'1WZmm
__1
1--09W
-I-I--
0Z
J
¢D
I0r-l
/
O0
WF-
V
ELZ
¢D0
0r-l>
00¢N
O0
13:/
oWO0WrYr'h t.--
ZO0
00
mI--
if')eq
I--D13_!--
0
O0<
I.--D13-00
Wor-ZE: o_v
n-OrYrY
WI
nlWr-_ -J
nl
O_
o
_J_JW
0I
x
O_
o
J7_

In this program, both an AWAS and a Honeywell WindShear Computer
(WSC) were installed. The AWAS received three inputs from analog
connections with the aircraft instruments, and five from ARINC through the
WSC. These 8 input items plus 17 AWAS generated items were passed
through the WSC to the recorder.
711)

<rY"(.50rY"I_.
<
Z
03rY"
LL
I.I_
l.UI--
>
CNI.C)0
CO0I",,
O")
0
I",,
0O')
O")
(D
O')
(N LUO')00
I.I.I00 rY"
13_
711

The AWAS-III software was updated twice in this program. The major
changes were to prevent AWAS nuisancc response to non-hazardous weather
conditions.
712

O3
W1.1..IIW
Wn,-<
IJ_OO3
Z
m
OC F-w ,<jZ_
m
>UJ
l--_JIi
_JU_
OC
O oO ..c
o_01_I __I•O
EC
O3
_J_J
713

NWA3.2 represents the latest software upgrade. These changes were to
reduce nuisance from inversions, and to incorporate improved pitch
correction equations.
714

Z
Z0
m
II
0
I
0
ZI
0
>Z
Z
Z0
I
>Z
_5
The operation of the AWAS has been exceptionally free of failure over more
than 2 years. The IR window and the gold coated, heated mirror have been
inspected regularly. While the mirrors have not required any replacement,
the windows have bccn cleaned every 4 to 6 weeks--to eliminate these
cleanings, a protective coating has been applied to one window on American
Air Lines, and to all 3 windows on Northwest Air Lines. The coating, while
still under study, appears to solve the problem of window degradation.
Because both of the airlines testing these AWAS units have flights through a
wide variety of weather conditions, it is believed that these tests are effective
for establishing response to a large environmental envelope.
716

0
ill
ZI
I
I
I
Z0I
n_
0
7"!.7

While passive IR power mz_y be diminished somewhat in rain, this has not
appeared to be a problem during any commercial test flight. Heating the
mirror within a pre-sct range of temperatures is important for the proper
function of the AWAS, and to prevent icing.
718

<rr'
0IIn
IILLI
O0
O0nI--
<O0<Z
<<0,1
II
0
TI9

In the summer of 1991, NASA included AWAS-III in its tests of radar in
penetrations of microbursts. The AWAS unit operated in these flights used a
software configuration comparable to the early version used in the American
Air Lines flights.
720

m
z0m
I--
_.1
I--
Zm
Q_I--
Z
S_
B
1.0
/
Or)
W
¢g
I--
a_Zm
rOZ O0
Or)
W
V
I--
I--
0
o,I
O0r_
W 0a 15.
00 mW ._,
Wr_
0Z 0
W
r_ w-i _ Z
z o n
_g
\ J'/21

r'r"0LI_re'_LL!13_
F-0Z
CO
W
F-
I
ILl"1-"F-
!11
Z
LLIF-0IllnXill
00"_0"_
Z
ill0Z
rr"0IIrr"illa_
00C_

Normal Flight Mode:
The AWAS is programmed to operate in a normal flight pattern and not
in a research mode. Consequently, the AWAS changes from one mode to
another automatically as the aircraft takes off, cruises and then enters the
landing phase of flight. During these phases the AWAS collects and stores
data necessary for different phases of the flight. If the AWAS is rebooted
(restarted), or if the modes are changed by means other than that
automatically prescribed by the internal software of the AWAS, valuable data
necessary for the proper functioning of the AWAS may be lost, or not be
collectable again in time to provide an adequate warning. In normal flight, if
the system is rebooted, the failure light is illuminated until the AWAS is
again operating properly.
7'23

09ILl
0
I.L
09<
<
LLI
0
_._1
<
IT"0Z
!..1.1
0
C9
<!._U)I..LIrr"
724
Research Flight Mode:
It was discovered that NASA, in an effort to assure accurate data for
research purposes, overrode the automatic mode functions of the AWAS.
Unfortunately, if this switching occurred shortly before an encounter with a
microburst, all of the data banks would be zeroed, with the result that some
of the information, e.g., lapse rate, required for the AWAS to operate
properly would be lost. To date, NASA has been unable to provide TPS
with the time of occurrence when the five manual overrides occurred. If this
information becomes available, it may be possible to determine what effect, if
any, these overrides would have had on the performance of the AWAS.
In conclusion, the 1991 test flights of the AWAS by NASA were not as
successful as anticipated because the AWAS was flown in an inappropriate
flight envelope.
7_

The factors, either individually or combined, that contributed to this poor
performance were:
1. The ability of NASA to override on command the AWAS
automatic mode selection routine;
2. The undesirable location and method of mounting the mirror and the
infrared window assembly;
3. Airspeed in excess of that which is encountered in normal landings
and take offs.
The first of these, mode selection, has been discussed, and the problems
with the periscope location and design, and airspeed factors, will now be
discussed.
7_

Ill_J
_am_m o
_L r_
0
Zc_Z
727

The effect on the performance of the AWAS duc to the loc:llion and metho0 of
mounting of the mirror and window assembly became very apparent during the
NASA 1991 summer flights. While there had been no impairment of the infrared
line of sight in the earlicr installations on the UND Citation II, American Airlines
MD-80's, or Northwest Airlines DC9's, it became apparent when TPS analyzed the
flight data received from NASA that the look distance of the AWAS was often
seriously impaired.
The exact cause of this impairment has not yet been determined. In some cases
it appears that it may be due to rain collecting in the periscope. Yet, in other cases
where rain existed, the look distance did not appear to be affected. It was
determined in the very earliest flights that extensive damage was occurring to the
mirror. The damage over the summer was sufficient tO require that the mirror be
replaced twice. No significant damage has occurred on any of the other
installations. This includes over 10,000 hours of flight in revenue service.
The effect of reduced look distance will, of course, reduce the ability of the
AWAS to sense the microburst within an adequate time, and/or to measure the
intensity of the event accurately.
Consequently, the impairment of the look distance during these summer ]991
flights certainly contributed to the apparent poor performance of the AWAS.
728

I
I
ZI
Z
Z0
0
Z0
0
Z
0Z0

d d d d
730

The aircraft airspeed has, as is indicated in the previous graph, a
significant effect on the amount of warning time provided. This relationship
is quite apparent when it is noted that the AWAS will sense the event from a
given distance, but that distance will be traversed by the aircraft in less time
due to the greater airspeed. Because of safety reasons, the NASA B 737 flew
at airspeeds from 230 to 260 knots rather than the 130 to 160 knots flown in
normal revenue service by jet aircraft. The airspeed factor was not as
significant when the UND Citation II encountered microbursts during the
summer of 1990 because the Citation was able to approach and penetrate the
events at a much slower airspeed, e.g., 160 to 190 knots.
The distribution of landing speeds from 972 flights is depicted in the
following graph.
731

i
UJ
Z
.... J
¥YYYY
_wx--x-
K
C
[
oCZIZIZ_Z
C_CZ2_Z_Z
,. ___-__INANAAAAAA'AAAA_i
I _rlrr-F_. r x Y x r _ x x v x x._ _v ¥_¥_ _, :_x__Y_.v_x_Y.._x._
_V.___At________'.___M___M__V__V__Z_Y_V__V. _
rv_
E_ZSZ._Z_X_
_ t_AA A,
vvvvvs,
_LSLSLSLSL_
_A A A_A_
__!_L_SLZ/__Sk_J/_kSkSk__'V V VV V'_/VV-,_ V V
__V._L _LV__V_..V_3,L_[_:\I\I\I_ 2\ISI',,ISI\I
L_l__Ix/x zx # \/\ k\ ix /\ Ix
FXAAA/_AAAAA /
_k _, _ AAAAAF
F_t_T"9-3
0
r,i
t',
0[,,
,,J
I,(,,-I,
0
Z
0
,.,-I
-,1
0
732

U..IU.I
O0rr"I
<
XId.l
ZI
I.I..
DLLILIJ
O0rr"
<O0>XLUaZ
U_
O0<
<
733

The AWAS-III was designed to estimate the hazard or F factor for use
with aircraft operating at a normal landing, or take off speed of
approximately 140 knots. For example, the MD-80's data shown in the
previous graph indicates a central value of about 140 knots with a maximum
value of 171 knots. The F factor as measured at approach speeds of up to
260 knots in the NASA research flights are not comparable with the F factor
computed at the lower normal airspeeds. The effect of these differences can
be understood by an analysis of the following equations.
The hazard index, F, is based upon the vertical and horizontal winds.
These F factors can be appreciated more completely relative to the airspeeds
if we look at the nature of the equations and the measurements.
73,1
DEFINITION OF TASS
PAGE 1
USING THE TASS DATABASE
F MODEL
AS INPUT :
Fw__ = F_ + F w
WHERE F_
du
dtG
WHERE dt = 1 second
WHERE F w : - w/ AIRSPEED
du
dtFWIND = ( G ) +
(-w/AIRSPEED)
• duIf--_.>0 then u - tailwind / decreasing headwind -w is a downdzaft
dt
735

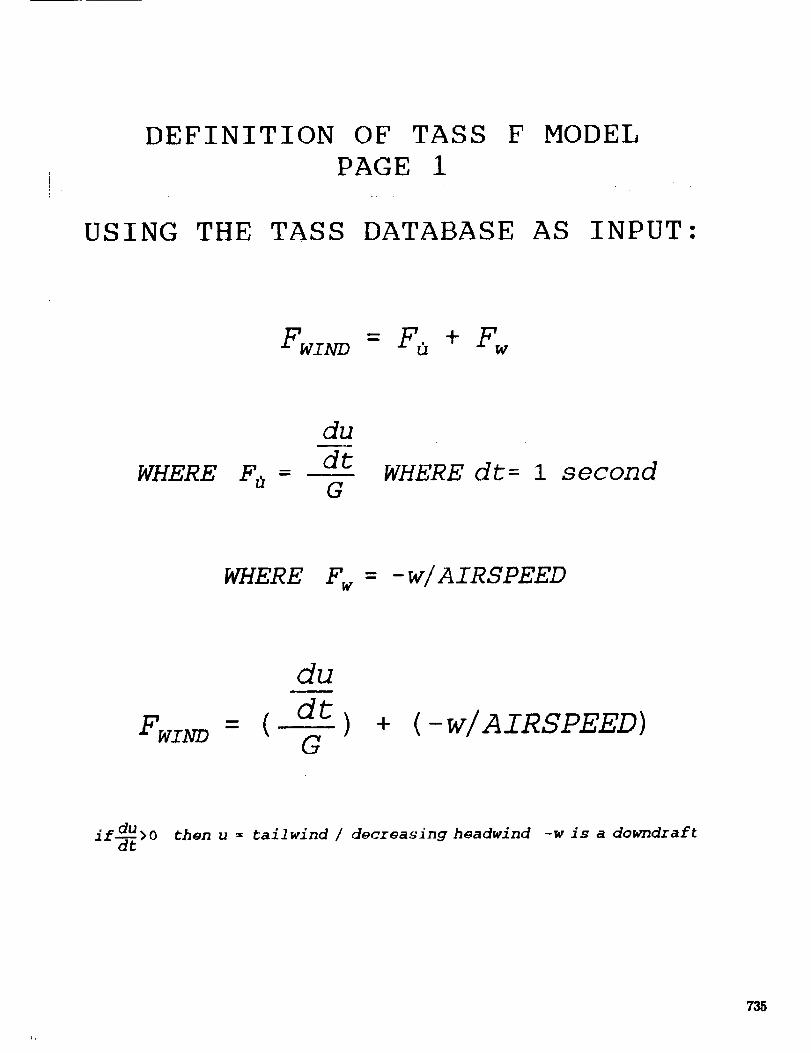
The TASS F model represents a hazard index that is separated into two
terms, one related to the acceleration of horizontal winds, and the other
related to the velocity of vertical winds. The acceleration of the horizontal
winds are shown as a time derivative of the horizontal windvelocity. This is
divided by G, which is the acceleration of gravity. This provides a first term
which is independent of the dimensions. The second term contains the
vertical wind velocity divided by the airspeed. This again provides a term
that is dimensionless. It is important to apply the directional senses shown,
in order for the F values to be of the signs anticipated. An important aspect
of the TASS database used in conjunction with these equations is the
continuity of time, t. This does not mean that data is present for all possible
time values. It means that the data is generated from equations that could
provide meaningful wind values at all possible time values, without
"exploding" anywhere between time values. Values for study are provided
by the instrumentation only once each second. Thus, dt is one second.
?36

DEFINITION OF TASS
PAGE 2
F MODEL
USING THE TASS DATABASE AS INPUT:
t IS CONTINUOUS FOR THE FOLLOWING EQUATIONS
WHERE SINTEGE R =1 0 0 0 METERS
|| i
A IRSPEEDM/s
1 KMFTwIND =
S INTEGER
FWIN D1
S INTEGER
TASS IS THE TERMINAl° AREA SIMIlLATION ,_YHTEM WET MICROBURST STUDY
NASA W]NDSHEAR MODEl, (PROCTOR 1987 )
called nasaiv.dat
737
v..
In order to obtain an average value of F over a kilometer of flight, we
first establish the number of seconds (S) required to proceed 1000 meters.
Because the data comes only each second, we choose the closest integer value
for S. The lower equation shows the use of this integer, S, and the F values
obtained at each second from 1 to S. This provides us with the average F
value over that 1 km distance.
7_

£
pu!_:lIA,Cyl[ _lp.Od

Peak F Index versus Altitude at Different Airspeeds:
As can be observed from this graph, the computed peak F factor is not a
constant in relationship to either altitude or airspeed. These calculations are from a
NASA microburst model. The effect of airspeed on the F calculation can be seen
as separate curves for 140 and 240 knots. The F values for these two airspeeds are
the same only at one altitude, e.i., 350 meters AGL. At altitudes below 350 meters
the two airspeeds have changes in F values that are reverse to the anticipated
dangers. That is, the higher airspeed has the larger F value, implying the greater
danger to the aircraft. The aircraft is actually in greater danger at 140 knots,
however, for it cannot counter the tailwind and climb against the downdraft as
effectively at this lower airspeed. Thus, the F index values computed here are in
error relative to the aircraft situation.
It is apparent from the data presented in the graph that the calculation of the F
factor over a wide range of airspeeds may not provide values that are consistent
with the danger to the aircraft, especially at altitudes of below approximately 350
meters AGL. This should be considered a notable limitation on using the F factor
outside the normal flight envelope, i.e., landing and take off at airspeeds above
about 160 knots.
74O

Thus, the importance of this graph is to show that the magnitude of the F
peak value will be a significant function of the altitude of approach and the
airspeed.
741

7_12
c_Z
_d_I

When using the AWAS-III algorithm which takes advantage of thermal
measurements, we obtain a rather different situation. Here, the lower the
airspeed, the greater the peak value of the AWAS F index. This seems quite
reasonable, for the lower the airspeed, the greater the danger to the aircraft.
When the aircraft is flying fast enough, the danger is sufficiently low that a
warning is not required. Also, we see that the lower the airspeed, the earlier
the warning will be given. This also seems quite appropriate. Thus, we see
that there is a very fundamental difference between the NASA F index, and
the AWAS F index in character. These differences make it very difficult to
directly compare the NASA and the TPS warning systems on a truly
meaningful basis.
743

O
im
0
l,,I,J
|111
u_
e,i
I|ll ! ! '! ! t I U _1 r I | U I ! I I
,,-- u'} 0
c_/
0'd"%,,-
c
Im
e-mm
Q_dPQ.
mu
744
The additional concern related to the airspeed is that of the response of
the OAT transducer when operating in the presence of rain. The airspeed
effect on the output of the OAT is related to the presence of rain which can
evaporate and provide cooling for the gauge. The amount of cooling is a
direct function of the airspeed. There is very often rain associated with the
microbursts, thus there can be quite different response to these events with
different airspeeds. It is possible at these considerably higher than normal
landing and take off speeds to obtain temperature indications that can cause
nuisance alarms when there are no microbursts present. Here we see that
between 2 and 3 degrees Celsius temperature change can occur due to the
difference in airspeed from 140 to 240 knots when flying into one inch per
hour of rain. As a result, the higher airspeed can cause a warning to be
given even when there is no actual change in air temperature. This is of
considerable concern, for it keeps the OAT indicated temperature from being
an accurate sensor of windshear when the airspeed is significantly greater
than 140 knots. The problem of evaporate cooling has not presented a
serious problem on other flights at normal landing speeds.
745

746

During the NASA penetration (BI43), the IR sensor was not significantly
blocked, and the IR performed as expected, when the data was adjusted for
airspeed. After the data was adjusted to 140 knots, good agreement was
provided among AWAS, the TDWR, and the NASA algorithm using inertial
(wind) data. Noise level in the NASA algorithm is plus or minus 0.02.
747

m
i..- Lt_z
(D
z,£
_z
IT
×._I(1NI ,'t
Z00
(/)
2:
I--i
H
gt_,
+gt..,
<
Z0
0(D
_qLq
0Z
7413

Several post-flight tests were perfi_rmed by computer on the data from this
NASA test run. One was the use of a 4 pole 1/20 Hz filter on the raw data
before entering it in the TPS algorithm. In addition, the NASA algorithm
output was adjusted to 140 knots, even though the actual airspeed was about
235 knots average. This data is shown for the AWAS IR detector that looks
up (LU) from the aircraft waterline by approximately 3 degrees. The
predictive F indication from AWAS was considerably lower in magnitude
than the inertial NASA F indication, which could be a result of the window
still not being very clear. However, since the IR sensed the event about 34
seconds ahead of the inertial response, it appears that the IR was able to
perform from a considerable distance in this case.
749

03
F--LT.,Z
CO
Z
,£
0
z
-I"
¢q
r'---
0
I I.. I
0
<
0Z
×_(INl :i
An identical treatment was given to the AWAS IR detector that was looking
up from the waterline by only about I degree (LF). In this case the AWAS
provided an F value of almost 0.12, and the airspeed corrected NASA
algorithm provided a little over 0.15 for its F factor. The peak provided by
the AWAS system preceded the NASA peak by about 34 seconds.
751

t_
rn_
Z t,.,_W_
<£z
,1!
I
-e--t
I
_:,I(INI .,I
<
Z t_
<Z0
00ID
.<
0Z
752

The OAT based AWAS signal was also run through the 4 pole 1/20 Hz filter.
This provided an F value of 0.18, and proceeded the NASA algorithm to the
trigger point of 0.15 by 48 seconds. This F value for the thermal system was
larger than anticipated, and responded sooner than would normally have been
anticipated. Both of these effects could well have resulted from high airspeed
through rain on the approach to the event. The smaller AWAS IR F values
than the NASA values were in good agreement with the TDWR
measurements.

O0
0 >I--(JLLI
LLLLIrr"
Z
<rr"
IID
Ib
Z
COLLI

The TDWR reflectivity data indicate 2 miles of flight in l"/hour rain prior to
contact with the event. This could account for the OAT response that was
very early and large at this 235 knot airspeed. This would provide a signal
that was about 26 seconds early.
?,5$

756
<rr"r,D0n"
r_
Or)
!--
<O0<Z
u
u
O0<
<
<
II
_1

If the AWAS is flown in the 1992 summer NASA B737 test program, the
AWAS software will be upgraded to that presently being flown by Northwest
Air Lines.
757

H
U.!C)Z<!---O0
00
O0Z0l--C)U.Irr"rr"0C)
LULL!n
rr"
<
LLi
rr"rr"LM>0
0I--C)
LL!
0

There are a number o1" tcchnicai, as wcll as Ilight profile issues that must be
resolved before further test flights into microbursts for the purpose of
evaluating the AWAS in comparison with the NASA systems can be
conducted. These are:
1. Change in the mirror/window installation.
2. Adjustment of airspeed effects in cxcess of the normal
landing and take off airspeeds.
3. Overriding the AWAS automatic modes by NASA personnel.
759

0
I
Z©
Z
0
©
Z

>I
ZC)i
I
Z
>I
>I
I
D
761

The most recent FAA direction with respect to certification of AWAS is the
development of AWAS-IV. This would combine the present predictive IR
and OAT features with a reactive inertial system utilizing the NASA
algorithm. The new combined system will provide prediction with the 100%
detection (not protection) that is presently required.
762

ill>.w
I--rj
LI..Ir_
I!---
ILl>.m
I--rj
i,IrYlm
i
O0
._1
t.--r'Fi,IZ
0
n,-0
r'm
r'F
F
_ X
7_

The block diagram for AWAS-IV shows the added inertial data input to the
NASA algorithm for LLWS. It also shows the IR sensor input at altitudes of
15,000 feet, and above, being used for the prediction of CAT (Clear Air
Turbulence) events. The cockpit interface provides for aural warnings and
lamps. The lamps would provide LLWS and CAT warnings. In addition,
there would be a lamp to warn of inoperation of the AWAS system. It is
critical for safety purposes that the pilot know if the AWAS is not operating.
76,1

I
W
wZ
Z
I
r'r
7_

I--rjLLi
n09
U)n
<
09Z0
i--rr"LU_.1<O_©Z
766

Another aspect of the communication with the pilot is the providing of
"cautions" when there is high probability of danger due to atmospheric
conditions, but no specific event has been detected.
767

D
<_ _
_-<_Owm
Dw(f)rr_
m
D
O0
0 z
D
rrXw

Z0m
m
LL
rr"U.J
or)or)LU
0rr"
I--Orj
769

_.C9,_z
IIIIIIiii
wrhZ
rr ,-T-
_>.-I'--1.12
(ALLrn,_Zooi
Z
_wZ<EO>m
l
Zw
Ill
Z<_C)
-F
W
w>>----I--I---_
l.u n"n"
II
O9
770

I
<
I
I
>
I
Z
Z
<
<
I
<
Z
<
I

The predictive certification will use flight data from the UND and NASA
flights to determine the ability of the AWAS to predict events. The flight
data from American and Northwest Air Lines flights will be used to
determine the level of nuisance alerts.
77'2

ZI
0
00
0
I
0
Z0
0
I
0
Z
0
0
0

O0Z0
Z)_J(.9Z0C)
LL]C)ZLU
LL.Z0(.9
rr"0U_
LL!_.J_dLU
0
<
<
774

O9p-ZI.l.I
I.I.I
0n"
I--
Z
0
I.I_
O9
U.I
ZooWl--
I.I.II.I_
CC oZO(DO
Lf)
Z A
0 U.!J_
I
u__CO rr"
LI_
0azU.I
Z0I
L)I
LI_I
rr"U.!

LU
m rn
m
CY_Zc_ml Oi_
776

Development of the Advance Warning Airborne System (AWAS)
Questions and Answers
Q: Roland Bowles (NASA Langley) - You talked about designing to a 140 knot target
airspeed. That means you have a design methodology because in fact you designed it for 140.
Why can't we repeat that methodology and design it for 2107
A: Pat Adamson (Turbulence Prediction Systems) - i think it could be done. I don't think it
could be done in time for this deployment. I also have a problem with spending a lot of energy
designing something that we are not intended to use. Airplanes don't operate in that regime.
Q: Roland Bowles (NASA Langley) - We are showing on charts that we are taking data
measured under one set of conditions and as you point out scaling it back to another. So it seems
to me that you must have your own scaling relationship. 1 think it would be important to this
audience for you to discuss what you think is the technical basis for reladng an IR measurement to
an airp!ane energy change?
A: Pat Adamson (Turbulence Prediction Systems) - I think it comes down to the forcing
function of the event. A downdraft is cold air falling. If you look at the accident/incident data
you see a sustained temperature drop over about thirty seconds as the aircraft penetrates the
encounter. Now we don't use the actual aircraft temperature data, but we use the temperature
gradient data as the forcing function for our algorithm. That is really the basis for it.
Q: John llansman (MIT) - 1 was it little confused by your nuisance alert chart. On the
American Airlines data, was that 20% of all the flight hours or flights you received some sort ofnuisance alert?
A: Pat Adamson (Turbulence Prediction Systems) - That is correct.
John Hansman (MIT) - I am a little concerned from a display and human factors standpoint. If
you have nuisance alerts at any significant level and you alert with a simple light in the cockpit,
then you are going to run into fidelity or trust problems with the crew. Do you want to commenton that?
Pat Adamson (Turbulence Prediction Systems) - I totally agree with you. I think that it is an
unacceptable alerting ratio. We decided to get at least 3,000 flights in our database before we
made any significant software revision. So that we could look at the data. Right now on 3-2 we
have one alert in 135 flights. We do not anticipate an alert any more often than the recommended
nuisance alerting in the reactive systems. We have to get down to nuisance alerts of less than one
per 2,500 flights or .so, and that is where we think we are going.
Q: Jim Evans (MIT) - i low do you discriminate between gust fronts, which are going to
produce a gain in energy state, versus microbursts? They both have pools of cool air.
A: Pat Adamson (Turbulence Prediction Systems) - What we are looking at is a temperature
gradient and a specific signature. I guess that is the best answer that I can give you.
777

Q: Jim Evans (MIT) - Have ygu attempted to fly through a lot of gust fronts and demonstrate
that you are not generating an incorrect alert or do you view it as a correct alert?
A: Pat Adamson (Turbulence Prediction Systems) - I guessif the shear is high enough, even if
it is a negative shear, I would be considering it a dangerous event.
Jim Evans (MIT) - When you go into a gust front you usually get a headwind increase but you
do not have a tailwind, so you actually have an increase in energy state. It maybe a controllability
issue, or a long landing, but it is not like the plane is going to get smashed out of the sky.
Pat Adamson (Turbulence Prediction Systems) - That's true. Looking at the work that
Marilyn Wolfson did in your organization, her concern was that the dangerous events were
associated with pre-existing gust fronts or thunderstorm outflows. Several of the gust front data
show very high turbulence or vorticity associated with them. As it is right now, what we are
trying to do is to use the temperature gradient and the signature to discriminate between severeevents and non-severe events.
Q: Gerry Aubrey (United Airlines) - Do you have a threshold for what is the significant clear
air turbulence you want to indicate?
A: Pat Adamson (Turbulence Prediction Systems) - We are working on that. The data that
we are using for indication of severity is the vertical acceleration of the aircraft. We have been
using 0.2 G or greater. But, the airlines do not seem to be interested in this small of a threats
They are much more interested in the larger one. We do not have much data where there is a
severe event, even in some 5,000 flights.
Q: Kim Elmore (NCAR) - I would like to follow up on something that Jim Evans was talking
about, and that is di_rimination between a gust front event and a microburst event. Specifically
in the Denver area, because that is where 1 have most of my experience, we find that the gust
fronts tend to be colder events generally than the microburst. As I understand it, that would setoff even a louder bell?
A: Pat Adamson (Turbulence Prediction Systems) - It depends, we look at not only the
temperature drop but the signature that as we would encounter that event at 140 knots. If the
temperature gradient is too high or too short in time it would discriminate against it.
Q: Kim Elmore (NCAR) - O.K. so if it is too high or too short or too big a gradient then youtend to throw that out?
A: Pat Adamson (Turbulence Prediction Systems) - That is correct.
Q: Pete Sinclair (Colorado State University) - i think the answer to that question is going to
end up in the scanning procedure that will come out later on. We will be able to scan across the
gust front and see quite a different configuration than a small microburst. My question is how do
you keep the system clean and abrasion free? How do you keep it clean without a sealed system
where the mirror and the whole system is internally sealed?
778

A: Pat Adamson (Turbulence Prediction Systems) - Actually, that has been sort of a
revelation. When we first put this on we were worried about that. The mirror is heated. It has
120 watts of heat, with heavy gold plate on it, and the window is flush against the skin. The
natural cleansing action of the rain and the warm mirror seems to be very effective. On AmericanAirlines we have a coated window, we went to material that was supplied to us by Ball Brothers
Aerospace and we now have five months on that installation without having to clean it or touch it.
So, the natural cleaning action and the rain with the warm mirror seems to be very effective. We
have been very surprised at how well that has worked.
Q: Paul Robinson (Lockheed) - You say an IR measurement is based on the detection of coldair in descent and this terminal effect is the driver of the microburst. However, the structure of
the microburst requires the presence of the ground causing added divergence. This is an inertiai
effect. How can a purely thermal measurement detect this danger?
A: Pat Adamson (Turbulence Prediction Systems) - Essentially what we do is we assume that
a sustained cold air downdraft, as sensed by an aircraft platform, is going to do one of two things:
first, if it is above the outflow it is going to detect the core of the event. When I say sustained, I
am expecting that temperature change that I derived to exist over about thirty seconds. I am not
looking for a single little pulse of cold air, I am looking for a sustained temperature drop that I
calculate as I traverse say a mile and a half at normal aircraft speed. That cold air is going to hit
the ground and diverge. The second condition is if in fact I am in the outflow, I expected the
outflow as I move through this mile and a half spatial realm is cold. That is basically how I do it.
Q: Paul Robinson (Lockheed) - By inferring the wind from the temperature you can possibly
detect a microburst type hazardous shear. Can you ever get a hazardous shear without that
temperature change?
A: Pat Adamson (Turbulence Prediction Systems) - Can you ever? Probably.
Q: Paul Robinson (Lockheed) - It is the shear that is going to effect the aircraft, so if your
instrument won't pick up the temperature change, but the shear is still there, then it would not
work as a predictive system.
A: Pat Adamson (Turbulence Prediction Systems) - The way I went at that, Paul, was I
actually took aircraft incident data and I used the algorithm that I have against each and every
event that I could get my hands on. I got the data from the NTSB. For example, yesterday Ilooked at the data from event 143, Fred Proctor was good enough to share his model as well as
the actual aircraft data. In every case that I have found so far, and that is probably about sixty
cases including the JAWS actual airborne penetrations, if I use the algorithm I could calculate the
shear from the temperature drop. I assume that the cold air that is falling is going to flow out inthe outflow over a sustained time, not a single little pulse, but over time. That is how I do it.
Q: Paul Robinson (Lockheed) - Using NASA's In Situ algorithm do you alter the systems
properties based on the output of this algorithm?
779
A: Pat Adamson (Turbulence Prediction Systems) - We axe certainly looking at that. I think
there is some real benefit in taking advantage of a combined system. If you axe going to have a
reactive algorithm on board with a predictive system, I think you should look at the system as a
combined system. We have not really sorted out all the details on that. When you look at the
operational aspects, and that is a lot of what we have been trying to do with the airlines, the
nuisance issue is equally as important as being able to predict the event. If you have high nuisance
obviously it is useless to be able to predict the event, because the pilot won't believe it. We do
not want to repeat that particular lesson. So yes we are trying to best understand how to combine
these systems and make it a better system between the two.
780