Embed Size (px)
Citation preview

Gross 1
Elizabeth Gross
Professor Duvanova
IR 323 – Political Economy of Industrialization and Development
27 March 2015
Foreign Aid with a Catch: A Study on the Effects of Aid Tying and their Unexpected Results
Giving countries economic aid with self-interested motives is certainly a morally
questionable practice, but what are its effects on the recipient? While developing countries’
economic losses due to tied aid’s inflated import prices are well-documented, other
consequences, such as the recipient country’s corruption level are poorly researched. This paper
addresses this gap in literature by comparing the recipient country’s percentage of tied aid with
corresponding corruption levels using the most similar comparative case design methods. In
considering these two statistics and their five-year lag effect, I find a weak positive correlation
between tied aid proportions and freedom from corruption, but make another unexpected
discovery – corruption improvements proved to be strongly correlated with total aid amount
changes. This insight furthers the debate on foreign aid giving by demonstrating that corruption
is a result of a lack of tight requirements and also recipient countries’ weak capacity to combat
it, and provides clear solutions to overcoming the issue.
Introduction
Since the beginning of the new millennium, there has been “a flourish of rhetorical
commitment to development” (Baker 135) on humanitarian grounds. Indeed, in the context of
the UN’s Millennium Declaration and MDGs, foreign aid usually has positive connotations. But
Baker is also quick to point out the less altruistic, realist beginnings of foreign aid. Beginning in

Gross 2
1945, aid was used as a tool to bring countries into the Western or Soviet sphere of influence.
More recently, the U.S. has used foreign aid in its war on terrorism. In a less sinister light, Baker
notes that “tied aid” is used extensively, but not exclusively, by Japan to require recipients to
purchase Japanese goods or services (Baker 139).
However, tied aid does not necessarily have to be pernicious. Catrinus Jepma in The Tying
of Aid broadens the definition of tied aid to include any requirements such as specific
development projects or programs, specific commodities or services to be procured, or specific
countries from which procurement must take place (Jepma 11). Specific development projects
or programs could include attempts to improve education, healthcare, or even overall
government institutions. In this way, tying aid could actually be beneficial.
This paper seeks to address the effects of tied aid on recipient countries’ development.
Does tying aid necessarily have negative effects? In Jepma’s article, he extensively researches
the economic effects of tied aid, providing detailed estimates on the increased import costs on
aid recipient countries. This, the argument goes, is essentially due to a decrease in competition
that necessarily comes with restricting imports to one country – the aid donor. While economic
costs of tied aid have clearly been addressed in past literature, other development factors have
been ignored, such as government institutions and corruption levels. Therefore, the objective of
this paper is to address this research gap – to determine the effect of tied aid on recipient
countries’ corruption levels.
I argue that tied aid will increase an aid recipient’s corruption levels. Much like giving aid
for geostrategic reasons, tied aid should, in theory, create similar perverse incentives at the
international and domestic level. At the international level, there’s an implicit incentive for

Gross 3
achieving economic gains in a form of export-industry protectionism at the expense of promoting
aid recipients’ developmental improvement. Essentially, tied aid donors are so focused on their
own gains that they do not concern themselves with enforcing developmental objectives such as
corruption. This aspect of the theory rests on one key assumption – that aid donors mostly do
not pursue developmental objectives, or at the very least do not make them a priority, and thus
the majority of tied aid is for the purpose of export promotion. On the other hand, at the
domestic level tied aid can create additional perverse incentives. At significant monetary
amounts, tied aid can be a type of rent that switches the recipient government’s accountability
from its own citizenry to the tied aid donor government. By placing requirements on the large
sums of money donor nations give, recipient governments are motivated not to appease their
citizenry, but to appease their donors, who presumably do not have as much inherent interest in
the recipient country’s welfare. Essentially, tied aid gives recipient governments incentives
towards agency slippage, pursuing goals their publics would not endorse. In fact, recipient
governments might even have incentives to conceal their aid deals with foreign nations if they
think the requirements won’t be met with enthusiasm domestically. In these ways, tied aid could
directly contribute to increased corruption.
The importance of this research cannot be stressed enough. Corruption leads to unequal
economic and political opportunities, with a sizeable portion of the population left marginalized
by the socioeconomic elites. In the best case, this marginalized population serves as untapped
economic potential for a country, but in the worst case, it can serve as fuel for economic protest
and civil strife. And, as mentioned briefly before, this research’s theoretical underpinnings are
highly generalizable to other aid-giving scenarios, such as those with geostrategic motivations.

Gross 4
Both scenarios generate similar perverse institutional incentives that can lead to the same effect
– increased corruption.
Case Design
If my hypothesis is correct, a country’s corruption should increase as the percentage of
tied aid out of total bilateral aid increases. Likewise, if the percentage of tied aid decreases,
corruption should decrease. My hypothesis will be falsified if corruption decrease as the
percentage tied aid increases or if corruption increases as the percentage tied aid decreases. It
should be noted that I will be observing the effects on corruption 5 years after the change in
percentage of tied aid. And, as mentioned before, my scope is limited to bilateral aid flows, which
means a country-to-country unit of analysis. This is partially out of practicality, as OECD does not
list total tied aid amounts for recipients, but for donors. In addition, the premise of this research
limits the study to bilateral aid flow, as self-interested aid-tying is not as evident in the case of
international organizations such as the World Bank or IMF. Cases will also be limited to those
receiving a highly significant amount of aid, to enhance the effects of tied aid for study.
In testing this hypothesis, I utilize a most similar case design. I seek cases that are nearly
identical in every respect but the independent variable, holding constant country size
(determined by population and gross domestic product), amount of aid donated, and
development level (determined by average income and percentage rural population). These
variables are important to hold constant, as the proportion of aid given to country size will alter
its effects on corruption levels, and the development level will determine how that aid is filtered
through the country’s economy. However, as it will soon become evident, maintaining all of these
conditions is rather difficult. Indeed, the limitations of available data preclude finding a perfect
Gross 5
match. This obstacle is compensated for by measuring percentage changes in corruption, which
are less vulnerable to uneven initial explanatory variables. Keeping these preconditions in mind,
the total aid and percentage tied aid will be derived from OECD iLibrary statistics. Average
income, percentage of rural population, and total population will be extracted from World Bank
development statistics. Corruption will be measured by Transparency International corruption
perception index. For these specific corruption statistics, higher values mean less corruption, or
a more favorable “perception” of that country’s corruption.
Case Analysis
The two cases chosen for study are the U.S.’s bilateral aid to Egypt and Japan’s bilateral
aid to the Philippines. They are closely similar in many respects. At the starting year of this study
– 1995 – Egypt’s GDP stood at US$60,159,244,485.2, while the Philippines was
$74,119,868,201.9. The average Egyptian made about $983.5 annually while the average
Philippino made $1,064.8 annually. Egypt in total is made up of 61,168,397.0 individuals whereas
the Philippines total 69,606,539.0 people. 57% of Egypt’s population was involved in agriculture,
while 52% of the Philippines did the same. Overall, the Philippines is slightly larger and more
prosperous, but not by much.
A cursory look at the data lends some confirmation to my theory. On average, the U.S.
tied its aid to Egypt much more extensively than Japan did to the Philippines. Consequently,
Egypt’s resulting average percent change in corruption levels is 6 percentage points lower than
that of the Philippines. It’s important to observe the percent change in corruption indices
because Egypt and the Philippines did not start on equal footing with respect to corruption levels.
However, with an average tied aid percentage of 68%, why did Egypt’s corruption index improve

Gross 6
at all? One would think that at that level that corruption shouldn’t have increased, but
decreased.
A-1. EGYPT TIED AID (MILLIONS)
TOTAL AID % TIED AID % CHANGE TIED AID
1995 900.175 900.175 100 2000 0 960.806 0 -1 2005 41.116 54.499 75.44358612
2010 62.272842 62.801242 99.15861537 0.314341225 AVERAGE 250.8909605 494.5703105 68.65055037 -0.342829388
A-2. PHILIPPINES TIED AID (MILLIONS)
TOTAL AID % TIED AID % CHANGE TIED AID
1995 0.9989 1166.2914 0.085647549 2000 505.1482 756.14275 66.80593049 779.0098329 2005 0 7.2766 0 -1 2010 0 586.81188 0 0 AVERAGE 126.536775 629.1306575 16.72289451 259.336611
B. CORRUPTION INDEX
EGYPT % CHANGE PHILIPPINES % CHANGE
2000 3.1 2.8 2005 3.4 9.6774194 2.5 -10.7142857 2010 3.1 -8.8235294 2.4 -4.0 2014 3.8 22.5806452 3.7 54.1666667 AVERAGE 3.35 7.8115117 2.85 13.1507937
C. COMPARISON % CHANGE TIED AID % CHANGE CORRUPTION
EGYPT
-100 9.6774194
-8.8235294 31.4341225 22.5806452
PHILIPPINES
77900.98329 -10.7142857 -100 -4.0
0 54.1666667

Gross 7
0
100
200
300
400
500
600
700
800
900
1000
1995 2000 2005 2010 2014
D-1. Egypt Statistics
Total Aid (millions) Percentage Tied Aid Corruption Index
0
200
400
600
800
1000
1200
1400
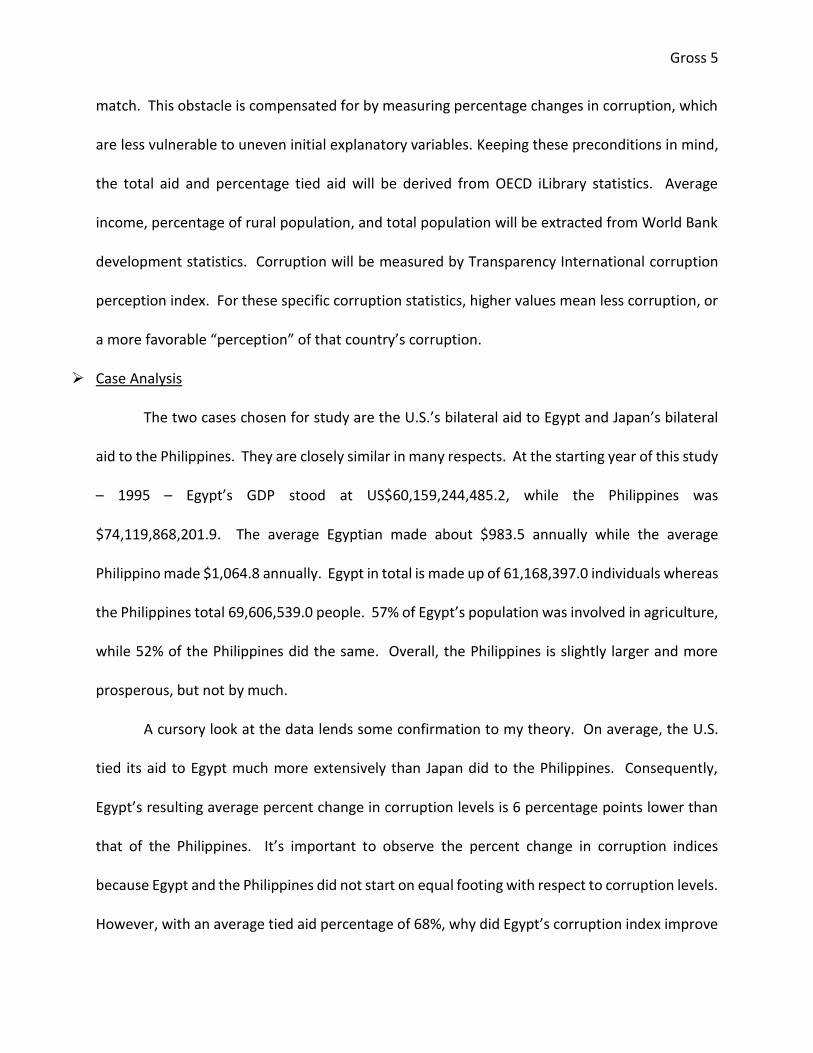
1995 2000 2005 2010 2014
D-2. Philippines Statistics
Total Aid (millions) Percentage Tied Aid (out of 1000) Corruption Index (out of 1000)

Gross 8
A closer look at the trends is equally ambiguous. A side-by-side analysis of percentage
change in tied aid versus percentage change in corruption (figure C) shows that in most cases an
increase in tied aid results in a decrease in a country’s corruption status. However the last data
point for Egypt shows a strong positive correlation between the two factors, and the second data
point for the Philippines shows a mild decrease in corruption status in response to a large
decrease in tied aid. If there is a correlation, it isn’t a strong one, or else there is some other
factor at work that’s affecting the results.
In fact, as has been previously mentioned, it’s rather difficult to ensure all the explanatory
variables remain relatively equal. One weakness with this data is that the total bilateral aid varies
dramatically in some instances, and not in the same way for both cases. Upon analyzing the
overall trends in the figure D graphs, however, is where the determinant for corruption becomes
more apparent. While there appears to be no obvious correlation between percentage tied aid
and corruption indices, the latter seems to follow total bilateral aid more so than the former.
Indeed, after each 5-year window, corruption follows total bilateral aid’s rise or fall. It should be
noted that this observation is not without its own drawbacks, as the magnitude of changes in
corruption indices is not always reflected in the magnitude in total bilateral aid increases or
decreases.
Assuming total bilateral aid has impacted the data, is there any way to account for it, and
still determine if tied aid has any appreciable effect on corruption? To achieve these ends, I
utilized an “adjustment coefficient” to adjust the given corruption indices for total aid changes.
I define the adjustment coefficient as:
𝐾𝑎𝑑𝑗 = 𝑃𝑒𝑟𝑐𝑒𝑛𝑡 ∆ 𝐶𝑜𝑟𝑟𝑢𝑝𝑡𝑖𝑜𝑛𝑛
𝑃𝑒𝑟𝑐𝑒𝑛𝑡 ∆ 𝑇𝑜𝑡𝑎𝑙 𝐴𝑖𝑑𝑛−1
Gross 9
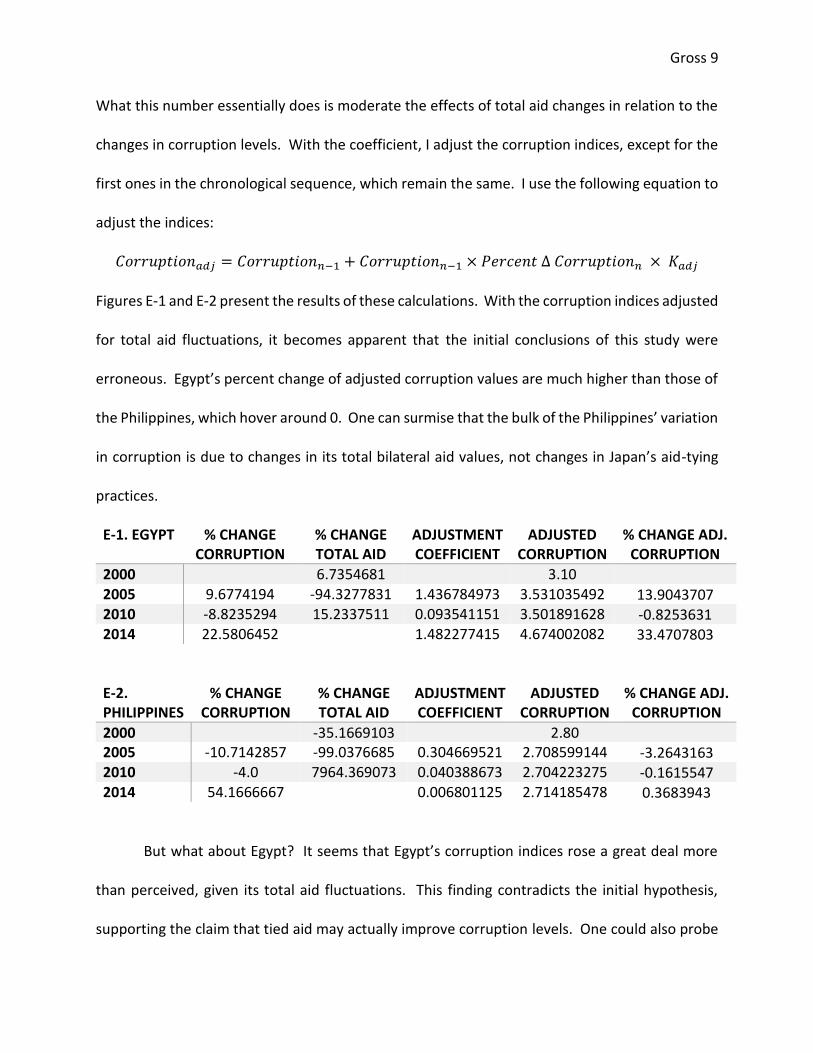
What this number essentially does is moderate the effects of total aid changes in relation to the
changes in corruption levels. With the coefficient, I adjust the corruption indices, except for the
first ones in the chronological sequence, which remain the same. I use the following equation to
adjust the indices:
𝐶𝑜𝑟𝑟𝑢𝑝𝑡𝑖𝑜𝑛𝑎𝑑𝑗 = 𝐶𝑜𝑟𝑟𝑢𝑝𝑡𝑖𝑜𝑛𝑛−1 + 𝐶𝑜𝑟𝑟𝑢𝑝𝑡𝑖𝑜𝑛𝑛−1 × 𝑃𝑒𝑟𝑐𝑒𝑛𝑡 ∆ 𝐶𝑜𝑟𝑟𝑢𝑝𝑡𝑖𝑜𝑛𝑛 × 𝐾𝑎𝑑𝑗
Figures E-1 and E-2 present the results of these calculations. With the corruption indices adjusted
for total aid fluctuations, it becomes apparent that the initial conclusions of this study were
erroneous. Egypt’s percent change of adjusted corruption values are much higher than those of
the Philippines, which hover around 0. One can surmise that the bulk of the Philippines’ variation
in corruption is due to changes in its total bilateral aid values, not changes in Japan’s aid-tying
practices.
E-1. EGYPT % CHANGE CORRUPTION
% CHANGE TOTAL AID
ADJUSTMENT COEFFICIENT
ADJUSTED CORRUPTION
% CHANGE ADJ. CORRUPTION
2000 6.7354681 3.10 2005 9.6774194 -94.3277831 1.436784973 3.531035492 13.9043707 2010 -8.8235294 15.2337511 0.093541151 3.501891628 -0.8253631 2014 22.5806452 1.482277415 4.674002082 33.4707803
E-2. PHILIPPINES
% CHANGE CORRUPTION
% CHANGE TOTAL AID
ADJUSTMENT COEFFICIENT
ADJUSTED CORRUPTION
% CHANGE ADJ. CORRUPTION
2000 -35.1669103 2.80 2005 -10.7142857 -99.0376685 0.304669521 2.708599144 -3.2643163 2010 -4.0 7964.369073 0.040388673 2.704223275 -0.1615547 2014 54.1666667 0.006801125 2.714185478 0.3683943
But what about Egypt? It seems that Egypt’s corruption indices rose a great deal more
than perceived, given its total aid fluctuations. This finding contradicts the initial hypothesis,
supporting the claim that tied aid may actually improve corruption levels. One could also probe
Gross 10
further as to why the magnitude of the Philippines corruption index decline was so slight whereas
Egypt’s was so large. To answer this question, I return to the OECD data tables to determine the
proportion of developmental versus export promotion goals for each country. This can be done
because with every aid entry on the OECD website, there comes a short description as to the
purpose of that grant. Upon further inspection, the evidence is weakly convincing. Of the total
US tied aid for 2005, $6.39 million, or approximately 15%, was devoted towards the area of
government and civic society, with an aim of promoting electoral reform and respect for human
rights. That number sunk to $.0145 million in 2010, or .02% of total US tied to Egypt. Less than
one percent is better than nothing, however, which is exactly what Japan designated in the case
of its aid towards government and civic society in the Philippines. Instead, when Japan did tie
aid, it focused on infrastructure (58%) and agriculture (8.8%) for the year 2000. Overall, the fact
that there is no mention of export-promotion intent in any of the entries is surprising, and may
in fact be a cause for some skepticism – the lofty official purposes of improving education,
infrastructure, or creating a competitive environment for investment may be masking more self-
interested export-promoting intent.
One last check is required to resolve the question of total aid impact on country
corruption levels. If the impact of aid is partially dependent on the total size of that country, as
the case design preconditions assume in requiring similar GDP, then it follows that the proportion
of total aid to GDP would have to remain constant or increase to have a significant impact on the
country’s domestic economy, and consequently, their interest or ability in corruption
improvements.

Gross 11
F-1. EGYPT GDP TOTAL AID/GDP
1995 60159244485 1.49632E-08 2000 99838540997 9.6236E-09 2005 89685724897 6.07666E-10 2010 2.18888E+11 2.86911E-10
F-2. PHILIPPINES GDP TOTAL AID/GDP
1995 74119868202 1.57352E-08 2000 81026294682 9.33207E-09 2005 1.03066E+11 7.06014E-11 2010 1.99589E+11 2.94009E-09
Figures F-1 and F-2 demonstrate the ratios of total aid to GDP over time. Overall, total
aid did not keep pace with GDP, as the ratios dwindle as time progresses. The rare exception is
for the Philippines in 2010, when the ratio rebounded two magnitudes. However, even
considering that one data point, the ratio’s overall trend of the Philippines is still negative. This
finding weakens the claim for greater total aid resulting in reduced corruption. Total aid should
be having an increasingly weaker effect on governments’ responses to corruption as time
progresses. This may indicate that the adjustment coefficient’s effect should be relaxed as time
progresses, and that the changes in corruption for Egypt and the Philippines were not as
disparate as initially believed.
Discussion
To summarize, the data indicates that the initial hypothesis was false. Tied aid actually
improves a country’s corruption levels. An additional unforeseen observation shows that
corruption is negatively correlated with total aid increases. These conclusions should not be
readily accepted as truth, however, due to some weakness with the data. A primary cause for
skepticism is that even though the two cases studied did have varying levels of tied aid, any

Gross 12
evidence of export promotion was absent. This is important because an underlying assumption
of this study was that the majority of tied aid is used for the goal of export promotion – variation
in terms of export promotion was an important piece that was missing. However, the fact that
Egypt included some aid designated for government and civic society improvements may prove
its converse – aid given with the goal of improving recipient institutions can be beneficial. Future
research should seek cases that focus on the variation between export promotion and institution-
building designations.
These findings indicate that one of the key assumptions of my hypothesis was wrong:
developed countries, (or at least the US and Japan in these specific cases,) are more invested in
developing poor countries than initially believed. By tying aid to certain development programs,
more affluent countries are bringing accountability to developing country governments, ensuring
that they pursue policies that improve their institutions and corruption levels. On the other hand,
these findings could indicate a refusal of donor nations to give aid to corrupt recipients because
of fear that recipients will simply misuse it, which generates similar incentives towards
accountability. In light of this newfound knowledge, it becomes clear that the assumption that
the majority of tied aid is dedicated towards export promotion was erroneous.
Another weakness in my initial assumptions was in how bargaining over aid packages
functions. Bargaining power does not seem to rest as much with aid recipients as much as initially
thought. Because there are so many incremental aid amounts given for widely varied purposes,
bargaining is much less an all-or-nothing interaction that demands the donor conform to
recipient expectations, and more an arena for give and take. This feature is why donors are able
to apply certain costly requirements such as probity on recipients in some moderate ways –

Gross 13
because they defer to recipient wishes in other areas of negotiation. Conversely, the presence
of civic reform goals in Egyptian aid packages may indicate underlying an Egyptian preference for
freedom from corruption, or at least less resistance to reform than the theoretical underpinnings
of this study suggest. The root of the issue is that bargaining outcomes do not clearly reveal
preferences – was aid tied to civic reform due to US pressure for reform or due to Egypt’s mutual
acceptance of corruption as an issue? Indeed, some interesting future research could focus on
how exactly aid bargaining situations such as these play out, and determine which actors usually
promote what issues in aid negotiation.
That the nature of aid given with developmental motives lacks unilateral demands on
either side is a point of distinction from aid given for security realpolitik reasons. Usually in
realpolitik cases preferences are intense and both parties are keenly aware of the donor’s
overriding concerns. Moreover, the recipient has time on its side in contrast to the donor, which
motivates the recipient to dig their heels in in a traditional “war of attrition”. Given these
advantages, power clearly rests with the recipient, who can acquire aid moneys simply due to
the donor’s lack of alternatives. Ultimately negotiation shifts away from Pareto-improving
problem-solving as seen with development-oriented aid towards zero-sum competition among
conflicting goals. This insight explains why development-oriented aid results in vastly different
bargaining outcomes than realpolitik aid, and why it is in fact poorly generalizable to realpolitik
bargaining situations – the nature of what donors and recipients are bargaining over is inherently
different.
In addition, the findings of this study also warn against providing foreign aid without
certain restrictions, or as William Easterly advocates in his book The elusive quest for growth, to

Gross 14
give aid recipients the right incentives. Here, it should be emphasized that right incentives are
what really matters – because the data is unclear about whether export promotion was involved
in Egypt and the Philippines, one should not be too quick to surmise any type of tied aid is
beneficial. Instead, this study confirms that tied aid aimed at reducing corruption is effective at
doing so. This is why it’s important that further study pay attention to selecting cases that not
only have tied aid, but export promotion more specifically.
Overall, the cases of Egypt and the Philippines also demonstrate the benefits of increased
aid-giving, regardless of whether it’s tied or not. Indeed, instead of increased total aid resulting
in greater corruption, as some aid skeptics would anticipate, in both cases increased total aid
actually resulted in greater probity. Far from being a stereotypically corrupt government that
will use aid fungibility to divert funds towards unscrupulous ends, Egypt and the Philippines
demonstrate a lacking in financial capacity to combat corruption by their own means – and the
effectiveness of what aid advocates call the “big push”.
This optimism should be tempered with some caution, however. The fact still remains
that tied aid has negative economic consequences on the recipient’s development. In light of
this fact, tied aid should only be used in exceptionally necessary or targeted circumstances –
where corruption is the key bottleneck preventing further economic growth or is a severe
problem otherwise. Regarding the benefits of total aid increases, this finding could easily be
morally hazardous – as a product of case selection standards, these two countries received some
of the highest amounts of aid from two of the largest economic powerhouses. It begs the
question: how much aid is enough? And would that amount be in danger of causing dependency?
From the opposing perspective, it could call into question the magnitude of existing foreign aid

Gross 15
practices, underscoring aid critics’ arguments that current total aid giving is a pittance in
comparison to what it should be.
Further research could investigate why developed nations choose to give aid with goals
of development versus export protection. What domestic factors or international pressures
cause developed countries to choose certain foreign aid strategies? Do domestic interest groups
or lobbyists impact donors’ aid packages in any appreciable way? Could donors decide to give
more untied aid for matters of prestige or inclusion in an internationally-accepted “in-group”?
What immediate security concerns result in increased aid-giving to certain countries, and why do
donors choose those specific recipients in those cases? Following that train of thought, are there
are any overall characteristics of recipients that seem to attract more aid giving than others? Do
the neediest receive aid, or only the ones with greatest predicted amount of success? With those
two cases, what are the typical ratios of tied versus untied, and how do needs-based giving versus
predicted success impact those ratios? As suggested earlier, are there any economic, social, or
security characteristics of recipients that attract more overall aid?
Understanding the “why” may be more important than understanding the “what”. With
this knowledge, one could potentially predict or even learn how to mitigate and manage those
factors towards greater aid recipient development and prosperity. This research has humbly
established the baseline “what,” or the impact of tied aid on developing countries corruption
levels. But there are so many more questions to probe, avenues of research to pursue in order
to fully grasp the intricacies of international development’s aid-giving practices. It will require an
immense amount of patience and determination to fully unlock all of the mysteries that this
research has modestly began.

Gross 16
Bibliography
Baker, Andy. Shaping the Developing World. Washington DC: CQ Press, 2014. Print.
Easterly, William. The elusive quest for growth. MIT Press, 2002. Web. 23 Feb. 2015.
Jepma, Catrinus. The Tying of Aid. Paris: OECD, 1991. Web. 28 Feb. 2015.
The OECD iLibrary. Paris: OECD. Web. 28 Feb. 2015.
The World Bank. The World Bank Group, 2015. Web. 28 Feb. 2015.
Transparency International. Transparency International, 2015. Web. 28 Feb. 2015.