Embed Size (px)
Citation preview

1
Development Proposal
3228 Prospect Street, NW Washington, DC
John Camera M.S. Real Estate Johns Hopkins University December 10, 2009

2
I. Executive Summary 3 II. Site Analysis 4 III. Market and Feasibility Analysis 6
Methodology 6 Office 7 Multifamily 10 Hotel 13 Summary 22
IV. Site Planning and Building Design 23 Land Use Regulations and Public Approvals 23 Preliminary Site Plan and Building Design 23
V. Financial Analysis 27 Development Costs 27 Income Statement Analysis 29 Discounted Cash Flow Analysis 29 Debt Financing 32 Equity Financing 33 Sensitivity Analysis 35 Additional Project Scenarios 35
VI. Development Plan 37 Timeline 37 Project Risks 39
VII. Conclusion 42 VIII. Bibliography 43 IX. Appendices 46 Development Cost Summary 46 Income Statement Analysis 47 Discounted Cash Flow Analysis 48 Project Financing 49 Before Tax Equity Cash Flow Analysis 50 Potential Equity Partnership Structures 51 Sensitivity Analysis 52 After Tax Equity Cash Flow Analysis 53 Additional Land Scenario Development Cost Summary 54 Additional Land Scenario Discounted Cash Flow Analysis 55 Additional Parking Scenario Development Cost Summary 56 Additional Parking Scenario Discounted Cash Flow Analysis 57
Development Schedule 58

3
Executive Summary
This proposal examines the development potential of a site located at 3228 Prospect Street, NW in the
Georgetown submarket of Washington, DC. The proposal considers the profitability of three primary
uses for the site: office, multifamily and hotel. The proposal determines that the highest and best use
for the site is as a select-service hotel. It offers a preliminary design, investment analysis and
development plan for the project.
The proposal begins with a site analysis, in which location, zoning regulations, demographics and other
site characteristics are evaluated.
A market and feasibility analysis is then performed for each of the three proposed uses, revealing that a
select-service hotel will generate the highest risk-adjusted return on investment and is consequently the
highest and best use for the site.
The proposal then examines the site planning and building design of a select-service hotel on the
property. Land use regulations and public approval processes are addressed in detail and a preliminary
design is proposed.
Next, the proposal provides a comprehensive financial analysis of the development costs and operating
costs for the select-service hotel. Potential sources of debt and equity to finance the project are
examined, and an appropriate capital structure is suggested. A discounted cash flow analysis of the
investment demonstrates the expected rate of return to investors.
Finally, the proposal examines the development plan for the select-service hotel. This section details
the issues and risks in all phases of the development process, including entitlement, brand selection,
financing, design, construction and property management. The proposal lays out a development
management plan and timeline for the execution of the project.

4
Site Analysis
The site is located in the heart of historic Georgetown in Washington, DC, less than two blocks from the
busy intersection of Wisconsin Ave. and M St., NW. The site includes 18,210 sq. ft. or .42 acres, has 160
ft. of frontage on Prospect St., and is visible from Wisconsin Ave., a main thoroughfare for pedestrian
and vehicular traffic. The site is currently controlled by a single owner, the Weaver Family, and is
operated as a surface valet parking lot under the name Doggett’s. The land is zoned “C-2-A”, which
allows for a variety of uses, including those which will be evaluated in this report: retail, office,
multifamily and hotel. The maximum allowable FAR is 2.5, which translates into a maximum buildable
gross floor area of 45,525 sq. ft. The site also falls within the Georgetown Historic District.
The site consists of 6 neighboring lots of varying size and shape, all of which are owned by the Weaver
Family. The property is bordered on the east by 3214 Prospect St, a small lot also operated as a surface
parking lot in conjunction with the current Doggett’s operation. Further to the east is 1222 Wisconsin
Ave., a 2-story building occupied by Restoration Hardware. To the west is 3232 Prospect St., a small 2-
story commercial office property. To the north, across Prospect Street, is a large 5-story office and
condominium building with ground floor retail and restaurants. To the south, at a significantly lower
grade, are multiple retail properties with frontage on M Street. The 6 lots which make up the site have a
combined assessed value of $4,640,800.
Figure 1: Satellite Image of Site

5
Figure 2: Zoning Map of Site
Figure 3: Map of Georgetown Historic District
6
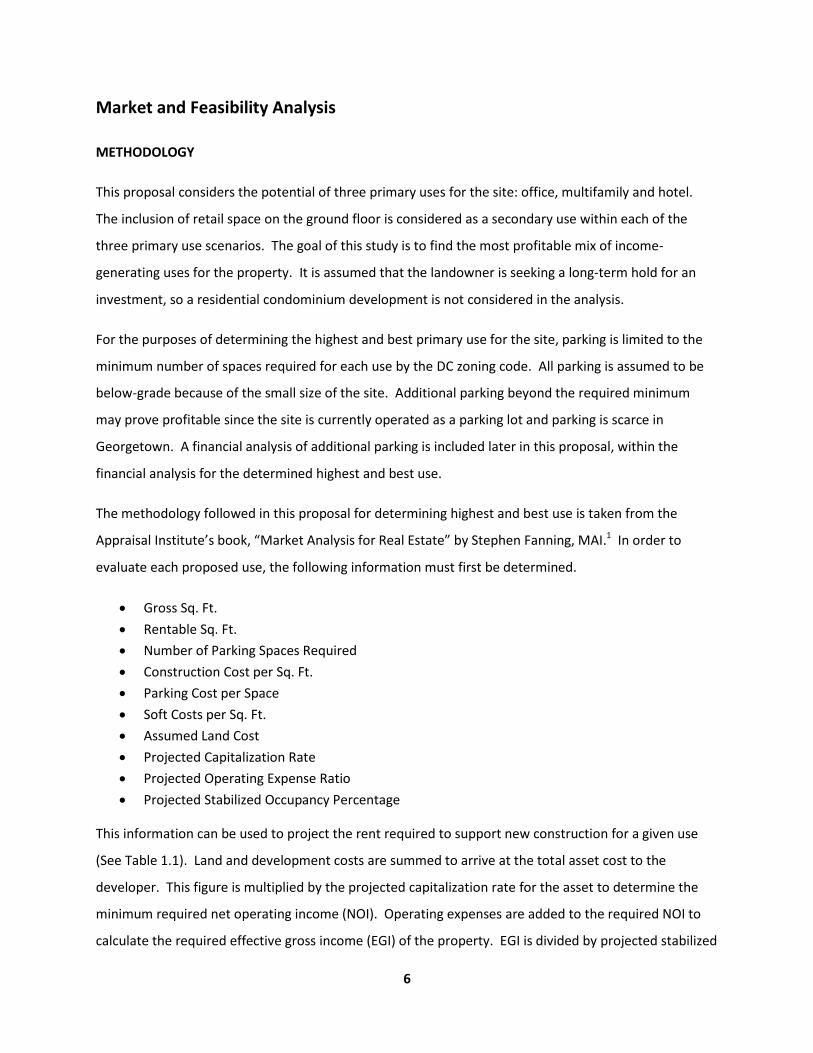
Market and Feasibility Analysis
METHODOLOGY
This proposal considers the potential of three primary uses for the site: office, multifamily and hotel.
The inclusion of retail space on the ground floor is considered as a secondary use within each of the
three primary use scenarios. The goal of this study is to find the most profitable mix of income-
generating uses for the property. It is assumed that the landowner is seeking a long-term hold for an
investment, so a residential condominium development is not considered in the analysis.
For the purposes of determining the highest and best primary use for the site, parking is limited to the
minimum number of spaces required for each use by the DC zoning code. All parking is assumed to be
below-grade because of the small size of the site. Additional parking beyond the required minimum
may prove profitable since the site is currently operated as a parking lot and parking is scarce in
Georgetown. A financial analysis of additional parking is included later in this proposal, within the
financial analysis for the determined highest and best use.
The methodology followed in this proposal for determining highest and best use is taken from the
Appraisal Institute’s book, “Market Analysis for Real Estate” by Stephen Fanning, MAI.1 In order to
evaluate each proposed use, the following information must first be determined.
Gross Sq. Ft.
Rentable Sq. Ft.
Number of Parking Spaces Required
Construction Cost per Sq. Ft.
Parking Cost per Space
Soft Costs per Sq. Ft.
Assumed Land Cost
Projected Capitalization Rate
Projected Operating Expense Ratio
Projected Stabilized Occupancy Percentage
This information can be used to project the rent required to support new construction for a given use
(See Table 1.1). Land and development costs are summed to arrive at the total asset cost to the
developer. This figure is multiplied by the projected capitalization rate for the asset to determine the
minimum required net operating income (NOI). Operating expenses are added to the required NOI to
calculate the required effective gross income (EGI) of the property. EGI is divided by projected stabilized

7
occupancy percentage to determine the required potential gross income (PGI). PGI is divided by
rentable sq. ft. to determine the minimum required rent to support the asset’s value at cost. If the
required rent is above the projected market rent for the property, the use is considered unfeasible. If
the required rent is below market rent, it is considered feasible. Of the uses determined to be feasible,
the one with the highest projected NOI is considered to be the highest and best use for the site.
Table 1.1: Methodology of Rent Required for New Construction Land Cost + Hard Costs + Soft Costs = Total Cost of Asset Total Cost x Capitalization Rate = Required Net Operating Income (NOI) NOI / (1 – Operating Expense Ratio) = Required Effective Gross Income (EGI) EGI / Stabilized Occupancy % = Required Potential Gross Income (PGI) PGI / Rentable Sq. Ft. = Annual Rent per Sq. Ft. Required for New Construction Rent Required for New Construction > or < Market Rent for Comparable Property For the purposes of this analysis, land cost is assumed to be the current assessed value of the land.
Projected gross square footage and required parking spaces are determined for each use in accordance
with local land use regulations. Rentable square footage is determined for each use by evaluating the
area needed for vertical penetrations (stairs, elevators and mechanical shafts), corridors, lobbies, and
other common or back-of-house areas. Estimates for development costs, capitalization rates, operating
expense ratios, stabilized occupancy percentages, and market rents vary from one use to another and
are derived from available market data and industry sources.
OFFICE MARKET AND FEASIBILITY ANALYSIS
The first step in analyzing the feasibility of a Class-A office building on the site is to determine the
projected gross square footage of the building. DC land use regulations allow for a 2.5 maximum FAR, a
60% maximum lot coverage, and a 50 ft. maximum building height in Zone C-2-A. Since the site totals
18,210 sq. ft., the maximum allowable gross square footage would be 45,525 sq. ft. and the maximum
allowable floor area would be 10,926 sq. ft. Given these figures, a five-story building would be required
to maximize the allowable FAR. Assuming a slab-to-slab height of 12 ft. for the first floor and 9.5 ft for a
typical floor, a five-story building would comply with the 50 ft. maximum allowable building height.
Having determined that a five-story office building on the site would conform to the land use regulations
and yield the maximum allowable gross square footage, the next step is to estimate rentable square
footage. In a typical office building, rentable square footage is calculated by summing the tenants’
usable square footage with the total square footage of lobbies, corridors, and other common or back-of-
house areas. Rentable square footage is inclusive of these shared areas because in a typical office lease,

8
tenants pay rent not only on their usable square footage, but also on their pro-rata share of common
areas in the building. Another way to think of rentable square footage is gross square footage less
vertical penetrations, which include stairs, elevators, and mechanical shafts. Assuming the building will
need two stairways (400 sq. ft. per floor), two elevator shafts (250 sq ft. per floor) and 100 sq ft. per
floor of mechanical shafts, we are left with a total of 3750 sq. ft., or 750 sq. ft. per floor, of vertical
penetrations. Subtracting this amount from the building’s gross square footage, we arrive at a total of
41,775 rentable sq. ft.
The next step in the analysis is to calculate the minimum required parking spaces for the office building.
Under the DC Zoning Code, parking requirements are determined by gross square footage and use. For
the purposes of this analysis, we assume that the ground floor of the building will contain 5,000 gross
sq. ft. of retail space. For retail use in Zone C-2-A, one parking space is required for each 300 gross sq. ft
in excess of 3,000 sq. ft. This translates into 7 spots required by the retail portion of the building. For
office use in Zone C-2-A, one space is required for each 600 gross sq. ft. in excess of 2,000 sq. ft. This
translates into 64 parking spots required by the office portion of the building. The building will require a
total of 71 parking spots at a minimum.
With gross square footage and required parking spaces determined, we can now project the total cost of
the office building. Land cost is assumed to be the current assessed value of $4,640,800, or $255 per sq.
ft. of land. Core-and-shell construction costs for a Class-A office building in Washington, DC are
projected to total $125 per gross sq. ft., and landlord contributions to tenant improvements are
projected at $25 per gross sq. ft.2 Below-grade parking is estimated to cost $35,000 per space, and soft
costs are estimated at $50 per gross sq. ft.3 The total cost of the asset is estimated to be $16,230,800
(See Table 1.2).
TABLE 1.2: TOTAL COST OF CLASS A OFFICE BUILDING
TOTAL GSF 45,525
PARKING SPACES 71
COST COST PER BUILDING GSF NOTES
LAND COSTS 4,640,800 101.94 254.85 per sf of land
CORE AND SHELL CONSTRUCTION 5,690,625 125.00
TENANT IMPROVEMENTS 1,138,125 25.00
PARKING 2,485,000 54.59 35,000 per space
SOFT COSTS 2,276,250 50.00
TOTAL COSTS 16,230,800 356.52

9
The next step in the analysis is to project a capitalization rate for the asset. The Korpacz Investor Survey
for the Q3 2009 reports current cap rates for office properties in Washington, DC range from 5% to
8.5%, with an average of 6.98%.4 Based on that data, we assume a cap rate of 7% for the subject office
building. Multiplying the assumed cap rate by the total cost of the asset, we arrive at the minimum
required net operating income to support the value of the asset at cost. Assuming an operating expense
ratio of 45%1, we can then calculate the required effective gross income of the property.5 Dividing the
EGI by an estimated stabilized occupancy of 90%, we arrive at the required potential gross income.
Dividing PGI by rentable sq. ft., we determine that the annual rent required for new construction is
$54.94 per sq. ft. (See Table 1.3).
Having determined the rent required for new construction, we can now compare this estimate to the
current market rents of comparable properties. The CoStar Office Report for Washington, DC, mid-year
2009 reveals that the average quoted full-service Class-A office rent in the Georgetown submarket is
$45.13 per sq. ft.6 Meanwhile, the CoStar Retail Report for Washington, DC, mid-year 2009 shows that
the average quoted full service retail rent in the Georgetown submarket is $60.54 per sq. ft.7 While the
subject property may have a slight advantage over competing properties in Georgetown because it
would be entirely new construction, this advantage would likely be negated for the retail portion by the
fact that the property is not located on a main retail strip like Wisconsin Ave. or M St. Similarly, any age
advantage of a new office product would likely be canceled out by the fact that subject property is
farther from the central business district than other large Georgetown office buildings found south of M
St. and east of Wisconsin Ave. Given this analysis, it can be assumed that the both the retail and office
portions of the subject property would attain average rents for the submarket. With 5,000 rentable sq.
ft. of retail and 36,775 rentable sq. ft. of office, the building would have a blended rental rate of $46.97
1 Operating expense ratios for office buildings typically range between 40% and 50% of gross income. The Institute
of Real Estate Management reported that the 2008 median operating expense ratio for downtown office properties was 47%. For the purposes of this analysis, a 45% operating expense ratio is used.
TABLE 1.3: RENT REQUIRED FOR NEW CONSTRUCTION OF CLASS A OFFICE BUILDING
TOTAL ASSET COST 16,230,800
PROJECTED CAP RATE 7.00%
REQUIRED NOI 1,136,156
PROJECTED OPERATING EXPENSE RATIO 45%
REQUIRED EGI 2,065,738
PROJECTED STABILIZED OCCUPANCY 90%
REQUIRED PGI 2,295,265
RENTABLE SQ. FT. 41,775
REQUIRED ANNUAL RENT PER SQ. FT. 54.94

10
per sq. ft., well below the rent required for new construction. Consequently, the construction of a Class-
A office building with ground floor retail on the subject property is deemed unfeasible at this time (See
Table 1.4).
MULTIFAMILY MARKET AND FEASIBILITY ANALYSIS
The previous analysis of an office building on the subject property has shown that a five-story building
will comply with land use regulations and yield the maximum allowable gross square footage for the
site. This holds true for a multifamily building as well, but the determination of rentable square footage
will require a different type of analysis for multifamily use. Since lobbies, corridors and back-of-house
and common areas will not be considered as rentable square feet in a multifamily building, they must be
accurately accounted for. Individual unit sizes and unit mix must also be projected to determine the
total rental income the building can generate.
For the purposes of this analysis, we assume that the five-story multifamily building will have five equal
floors of 9,105 sq. ft. for a total of 45,525 gross sq. ft., the maximum allowed by the zoning code. We
assume the first floor will have 6,000 sq. ft. of retail, 750 sq. ft. of vertical penetrations (stairs, elevators,
and mechanical shafts) , a 1,000 sq. ft. main lobby, a 625 sq. ft. fitness center, a 500 sq. ft. leasing office,
and 230 sq. ft. of miscellaneous space (electrical room, janitorial closet, etc.). Apartment units will be
located on the second thru fifth floors. Each of these floors will have 750 sq. ft. of vertical penetrations,
650 sq. ft. of corridor, a 55 sq. ft. electrical room, and a 150 sq. ft. elevator lobby. Deducting these areas
from the floor area leaves 7,500 gross sq. ft. per floor for units. We assume that each floor will have five
one-bedroom apartments at 700 sq. ft. per unit and four two-bedroom units at 1,000 sq. ft. per unit.
The building will yield 20 one-bedroom units and 16 two-bedroom units, for a total of 36 units overall.
TABLE 1.4: SUMMARY OF ANALYSIS FOR CLASS A OFFICE BUILDING
PROJECTED ANNUAL OFFICE RENT 45.13
PROJECTED ANNUAL RETAIL RENT 60.54
OFFICE RENTABLE SQ. FT. 36,775
RETAIL RENTABLE SQ. FT. 5,000
POTENTIAL GROSS INCOME 1,962,356
STABILIZED OCCUPANCY 90%
EFFECTIVE GROSS INCOME 1,766,120
OPERATING EXPENSE RATIO 45%
NET OPERATING INCOME 971,366
COST 16,230,800
IMPLIED CAP RATE 5.98%
VALUE AT PROJECTED 7% CAP RATE 13,876,659

11
Retail rentable square footage will be 6,000 sq. ft. and residential rentable square footage will be 36,000
sq. ft., for a total of 42,000 rentable sq. ft.
With our unit mix determined, we can now estimate the number of parking spaces required. DC Code
requires one parking space for every two residential dwelling units in zone C-2-A. For retail use, one
space is required for each 300 gross sq. ft. in excess of 3,000 sq. ft. This leaves us with 18 required
spaces for residential use and 10 required spaces for retail use, a total of 28 spaces.
The next step in the analysis is to estimate the total cost of the asset. Land cost is assumed to be the
current assessed value of $4,640,800, or $255 per sq. ft of land. Construction costs for a multifamily
apartment building in Washington, DC are projected to total $185 per gross sq. ft.8 Construction costs
for the retail portion of the building are estimated at $150 per gross sq. ft. ($125 per sq. ft. for core-and-
shell, and $25 per sq. ft. for tenant improvements).9 Below-grade parking is estimated to cost $35,000
per space, and soft costs are estimated at $50 per gross sq. ft.10 The total cost of the asset is estimated
to be $16,109,175 (See Table 1.5).
The next step in the analysis is to project a capitalization rate for the asset. The Korpacz Investor Survey
for the Q3 2009 reports current cap rates for apartment building nationwide range from 5.75% to 10%,
with an average of 7.84%.11 A 2009 survey of local DC brokers by the Apartment and Office Building
Association of Metropolitan Washington found that investors in new Class A Luxury Apartments in
Northwest, DC sought going-in cap rates ranging from 6.3% to 7.3%, with a median desired cap rate of
6.6%.12 Based on this data, we adjust the national average downward and assume a cap rate of 6.6%.
Multiplying the assumed cap rate by the total cost of the asset, we arrive at the minimum required net
operating income to support the value of the asset at cost. Assuming an operating expense ratio of
TABLE 1.5: TOTAL COST OF APARTMENT BUILDING
TOTAL GSF 45,525
APARTMENTS GSF 39,525
RETAIL GSF 6,000
PARKING SPACES 28
COST COST PER BUILDING GSF NOTES
LAND COSTS 4,640,800 101.94 254.85 per sf of land
APARTMENT CONSTRUCTION 7,312,125 185.00
RETAIL CONSTRUCTION 900,000 150.00
PARKING 980,000 21.53 35,000 per space
SOFT COSTS 2,276,250 50.00
TOTAL COSTS 16,109,175 353.85

12
40%2, we can then calculate the required effective gross income of the property.13 Dividing the EGI by
an estimated stabilized occupancy of 95%, we arrive at the required potential gross income. Dividing
PGI by rentable sq. ft., we determine that the annual rent required for new construction is $44.41 per
sq. ft. The resulting required monthly rent is $2,591 for a one-bedroom unit and $3,701 for a two-
bedroom unit (See Table 1.6).
Having determined the rent required for new construction, we can now compare this estimate to the
current market rents of comparable properties. As mentioned in the previous analysis, the CoStar Retail
Report for Washington, DC, mid-year 2009 shows that the average quoted full-service retail rent in the
Georgetown submarket is $60.54 per sq. ft.14 For an analysis of comparable apartment rentals, we look
at active MLS listings in the submarket. As of October 6, 2009, there were seven one-bedroom and two-
bedroom apartments rentals listed in the Georgetown submarket. Unit sizes ranged from 720 to 1,454
sq. ft., and monthly rents ranged from $2,230 to $3,900. Monthly rent per sq. ft. ranged from $2.32 to
$3.18, with an average of $2.79. These rents are well below the required rent of the subject property.
To confirm our analysis, we look at active listings from a nearby 40-unit luxury apartment building
located just outside the Georgetown submarket at 2401 Pennsylvania Ave., NW. As of October 6, 2009,
there were seven one-bedroom and two-bedroom rental units listed at this address. Unit sizes ranged
from 900 sq. ft. to 2,600 sq. ft., and monthly rents ranged from $2,900 to $6,790. Monthly rent per sq.
ft. ranged from $2.61 to $3.23, with an average of $2.92. Since the subject property would be entirely
new construction, one could assume it would command a monthly rent per sq. ft. at the top of the range
for the Georgetown submarket. However, at a monthly rent of $3.30 per sq. ft., a one bedroom
2 Operating expense ratios for apartment buildings generally range from 35% to 45% of gross income. A 2009
survey of market rent apartment buildings by the National Apartment Association found that the average operating expense ratio was 40.2%. For the purposes of this analysis, a 40% operating expense ratio is assumed.
TABLE 1.6: RENT REQUIRED FOR NEW CONSTRUCTION OF APARTMENT BUILDING
TOTAL ASSET COST 16,109,175
PROJECTED CAP RATE 6.60%
REQUIRED NOI 1,063,206
PROJECTED OPERATING EXPENSE RATIO 40%
REQUIRED EGI 1,772,009
PROJECTED STABILIZED OCCUPANCY 95%
REQUIRED PGI 1,865,273
RETAIL RENTABLE SQ. FT. 6,000
REQUIRED RETAIL ANNUAL RENT PER SQ. FT. 44.41
APARTMENT RENTABLE SQ. FT. 36,000
REQUIRED APT MONTHLY RENT PER SQ. FT. 3.70
REQUIRED MONTHLY RENT 1-BR APT 2,591
REQUIRED MONTHLY RENT 2-BR APT 3,701
13
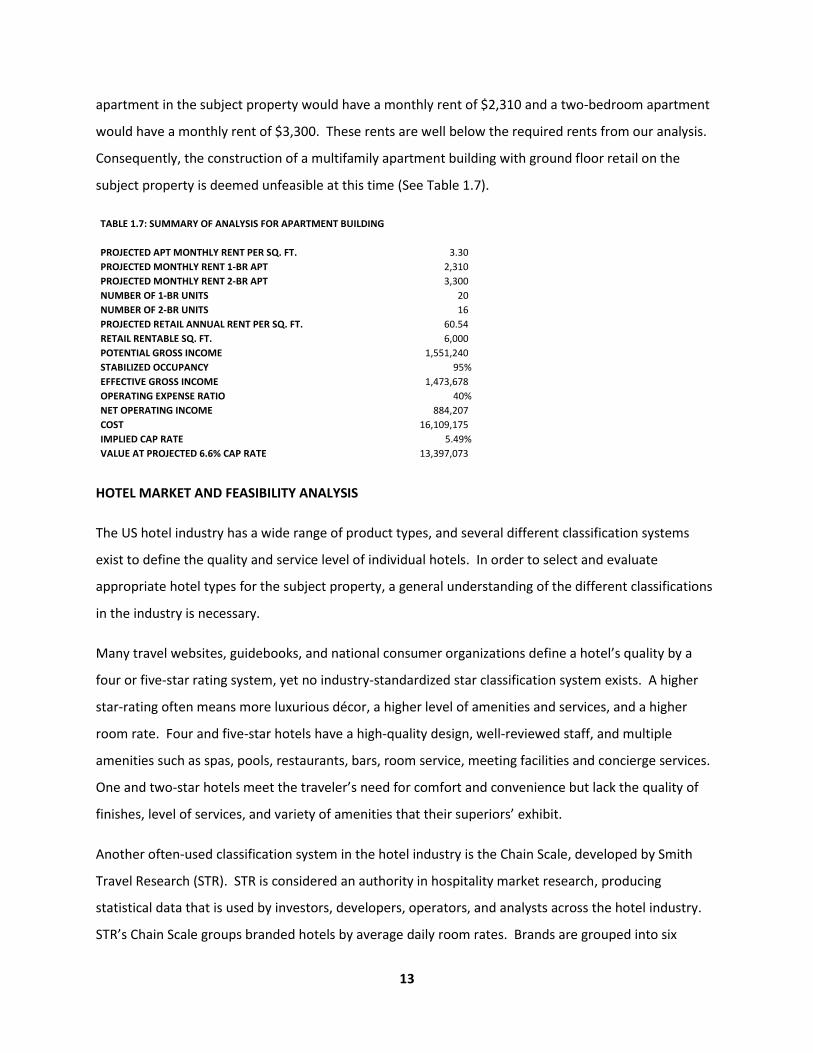
apartment in the subject property would have a monthly rent of $2,310 and a two-bedroom apartment
would have a monthly rent of $3,300. These rents are well below the required rents from our analysis.
Consequently, the construction of a multifamily apartment building with ground floor retail on the
subject property is deemed unfeasible at this time (See Table 1.7).
HOTEL MARKET AND FEASIBILITY ANALYSIS
The US hotel industry has a wide range of product types, and several different classification systems
exist to define the quality and service level of individual hotels. In order to select and evaluate
appropriate hotel types for the subject property, a general understanding of the different classifications
in the industry is necessary.
Many travel websites, guidebooks, and national consumer organizations define a hotel’s quality by a
four or five-star rating system, yet no industry-standardized star classification system exists. A higher
star-rating often means more luxurious décor, a higher level of amenities and services, and a higher
room rate. Four and five-star hotels have a high-quality design, well-reviewed staff, and multiple
amenities such as spas, pools, restaurants, bars, room service, meeting facilities and concierge services.
One and two-star hotels meet the traveler’s need for comfort and convenience but lack the quality of
finishes, level of services, and variety of amenities that their superiors’ exhibit.
Another often-used classification system in the hotel industry is the Chain Scale, developed by Smith
Travel Research (STR). STR is considered an authority in hospitality market research, producing
statistical data that is used by investors, developers, operators, and analysts across the hotel industry.
STR’s Chain Scale groups branded hotels by average daily room rates. Brands are grouped into six
TABLE 1.7: SUMMARY OF ANALYSIS FOR APARTMENT BUILDING
PROJECTED APT MONTHLY RENT PER SQ. FT. 3.30
PROJECTED MONTHLY RENT 1-BR APT 2,310
PROJECTED MONTHLY RENT 2-BR APT 3,300
NUMBER OF 1-BR UNITS 20
NUMBER OF 2-BR UNITS 16
PROJECTED RETAIL ANNUAL RENT PER SQ. FT. 60.54
RETAIL RENTABLE SQ. FT. 6,000
POTENTIAL GROSS INCOME 1,551,240
STABILIZED OCCUPANCY 95%
EFFECTIVE GROSS INCOME 1,473,678
OPERATING EXPENSE RATIO 40%
NET OPERATING INCOME 884,207
COST 16,109,175
IMPLIED CAP RATE 5.49%
VALUE AT PROJECTED 6.6% CAP RATE 13,397,073

14
categories: Luxury, Upper Upscale, Upscale, Midscale with Food and Beverage, Midscale without Food
and Beverage, and Economy. Independent hotels are grouped into a single class, regardless of room
rate. A sampling of brands within the STR Chain Scale is included below in Table 1.8.
Table 1.8: Hotel Brands within the Smith Travel Research Chain Scale Luxury Upper Upscale Upscale Four Seasons Doubletree Aloft Park Hyatt Embassy Suites Courtyard Inter-Continental Hilton Crowne Plaza Mandarin Oriental Hyatt Four Points Ritz Carlton Kimpton Hilton Garden Inn W Hotel Marriott Radisson Sheraton Residence Inn Westin Wyndham Midscale with F & B Midscale without F & B Economy Best Western Comfort Inn Days Inn Clarion Fairfield Inn Motel 6 Holiday Inn Hampton Inn Red Roof Inn Quality Inn La Quinta Inn Travelodge Ramada
In addition to the Chain Scale, STR defines numerous terms used to classify hotel types. Specific hotel
types include All-Suite, Boutique, Conference, Convention, Destination Resort, Gaming/Casino, Golf, Ski,
Spa, and Waterpark. Hotels are defined as either full-service or limited-service. Full-service hotels,
according to STR, are “generally mid-price, upscale, or luxury hotels with a restaurant, lounge facilities
and meeting space as well as minimum service levels often including bell service and room service.”
Limited-service hotels, on the other hand, “have rooms-only operations, (i.e without food and beverage
service) or offer a bedroom and bathroom for the night, but very few other services and amenities.
These hotels are often in the budget or economy group and do not report food and beverage
revenue.”15 While not defined by STR, a third industry classification for hotels is “select-service.”
Select-service hotels fall between full-service and limited-service and are often mid-price or upscale.
They offer limited amenities compared to a full-service hotel, such as a scaled-down food and beverage
operation or smaller meeting and lounge spaces. A fourth category of hotels are extended-stay hotels,
which cater to travelers with longer trip-lengths by offering larger rooms or “suites” with kitchen
facilities. Table 1.9 offers examples of different brands classified by service type.

15
Table 1.9: Hotel Brands by Service Type
Full-Service Select-Service Extended-Stay Limited-Service Four Seasons Aloft Embassy Suites Days Inn Ritz Carlton Courtyard Residence Inn Motel 6 W Hotel Four Points Red Roof Inn Hyatt Hilton Garden Inn Travelodge Kimpton Hyatt Place Comfort Inn Marriott Fairfield Inn Westin Hampton Inn
With an understanding of how hotels are classified, we can now analyze the Washington, DC and
Georgetown hotel supply. Table 1.10 shows the distribution of rooms by STR Chain Scale classification
in these areas. Upper upscale hotels account for the largest share of rooms in the city, while
independent hotels are the most prevalent in Georgetown.
Table 1.10: Market Hotel Room Distribution By Chain Scale Chain Scale Type Washington, DC % Share Georgetown % Share Rooms Rooms Luxury 4,351 16% 308 23% Upper Upscale 11,682 43% 0 0% Upscale 2,513 9% 0 0% Midscale with F & B 1,586 6% 285 21% Midscale without F & B 713 3% 0 0% Economy 702 3% 0 0% Independent 5,814 21% 748 56% TOTAL 27,361 1,341
A closer look at hotel types in Georgetown shows that independent hotels in the submarket consist of
two full-service boutique hotels, one full-service conference hotel, and three all-suites hotels. A third
full-service boutique is in the pipeline. Only three brand hotels exist in the submarket: two full-service
luxury hotels and one full-service midscale with food and beverage hotel.

16
Table 1.11: Georgetown Hotels Luxury Rooms Hotel Type Four Seasons Hotel Washington 222 Full Service Ritz Carlton Georgetown 86 Full Service Midscale with F & B Holiday Inn Georgetown 285 Full Service Independent Washington Suites Georgetown 124 All-Suites Georgetown Inn 90 Full Service, Boutique Latham Hotel Georgetown 133 Full Service, Boutique Hotel Monticello 38 All-Suites Georgetown Univ, Hotel and Conf. Ctr. 146 Full Service, Conference Georgetown Suites 217 All-Suites Pipeline Unnamed Boutique Hotel 48 Full Service, Boutique
This proposal will evaluate two hotel types on the subject property: an upscale, select-service brand
hotel and an upper-upscale, full-service boutique brand hotel. These two hotel types have been
selected for evaluation because they work best given the size constraints of the subject property and
the current make-up of the Georgetown hotel market. Since the site is expected to yield less than 100
rooms and will have limited room for common areas and meeting space, a typical full-service brand
hotel will not be a viable option. Similarly, an “all-suites” hotel will prove difficult because suites will
require much larger rooms. A boutique hotel would have competition from other boutique product in
Georgetown, but no boutique brands (i.e.— Kimpton) are currently found in the submarket. Similarly,
an upscale select-service brand hotel (i.e.— Courtyard, Aloft) would be the only hotel of its kind in
Georgetown.
Smith Travel Research defines boutique hotels as “appealing to their guests because of their unusual
amenity and room configurations.” They are “normally independent, with less than 200 rooms and a
high rack rate.”16 A few chains, such as W Hotels and Kimpton, are also classified as boutique by STR. A
boutique hotel does not necessarily have larger than average rooms, but it will have a unique, high-
quality room design with expensive finishes. Amenities at a boutique chain hotel like Kimpton usually
include an upscale restaurant and bar, a small meeting space for business travelers, a spa, a fitness
center, and perhaps even a pool. Services include bell service, concierge service and 24-hour room
service.

17
The first step in analyzing a full-service boutique hotel on the subject property is to determine the total
rooms or “keys” the site will produce. Using the same five-story building from the multifamily scenario,
we assume the hotel will have five equal floors of 9,105 sq. ft. for a total of 45,525 gross sq. ft., the
maximum allowed by the zoning code. We assume the first floor will have a 4,000 sq. ft. restaurant and
bar, 750 sq. ft. of vertical penetrations (stairs, elevators, and mechanical shafts), a 1,000 sq. ft. main
lobby, a 1,000 sq. ft. meeting room, a 1,125 sq. ft. fitness center and spa, a 500 sq. ft. management
office, 500 sq. ft. other back-of-house, and 230 sq. ft. of miscellaneous space (electrical room, janitorial
closet, etc.). Hotel rooms will be located on the second thru fifth floors. Each of these floors will have
750 sq. ft. of vertical penetrations, 750 sq. ft. of corridor, a 55 sq. ft. electrical room, a 50 sq. ft.
housekeeping closet, and a 150 sq. ft. elevator lobby. Deducting these areas from the floor area leaves
7,350 gross sq. ft. per floor for rooms. We assume rooms will average 350 gross sq. ft. The building will
yield 21 rooms per typical floor for a total of 84 rooms.
Having estimated the key count, we can now determine the number of parking spaces required for the
hotel. DC Code requires one parking space for every two hotel rooms in zone C-2-A, plus one space for
each 150 sq. ft. of space in the largest function room of the hotel (in this case, the 1,000 sq. ft. meeting
room). The hotel restaurant will be considered as retail use, which requires one space for each 300
gross sq. ft. in excess of 3,000 sq. ft. This leaves us with 47 required spaces for hotel use and 3 required
spaces for retail use, a total of 50 spaces.
The next step in the analysis is to estimate the total cost of the asset. Land cost is assumed to be the
current assessed value of $4,640,800, or $255 per sq. ft of land. Construction costs (including restaurant
fitout and all furniture, fixtures, and equipment) for a boutique hotel in Washington, DC are projected to
total $350 per gross sq. ft.17 Below-grade parking is estimated to cost $35,000 per space, and soft costs
are estimated at $50 per gross sq. ft.18 The total cost of the asset is estimated to be $24,600,800 (See
Table 1.5).

18
Cost per key for our hotel, not including land and structured parking, is estimated to be $216,786. This
estimate is further supported by data from U.S.-based hotel consultant, HVS. In its 2008 “Hotel
Development Cost Survey,” HVS estimated the average development costs of a full-service hotel to be
$239,500.19 According to the 2007 “U.S. Hotel Franchise Development Cost Guide” by HVS, the cost per
key of the subject hotel would fall within the range of such brands as Marriott, Renaissance, and
Sheraton (See Table 1.13).20
Table 1.13: 2007 U.S. Hotel Development Cost Guide from HVS (not including land costs) Cost Per Key Cost Per Key Cost Per Key Hotel Chain Low High Average Marriott 141,000 222,000 182,000 Renaissance 141,000 227,000 184,000 Sheraton 103,000 245,000 174,000 Westin 126,000 296,000 211,000
Having estimated the cost of the hotel, the next step in the analysis is to project a capitalization rate for
the asset. The Korpacz Investor Survey for the Q3 2009 reports current cap rates for full-service hotels
nationwide range from 6.5% to 14%, with an average of 9.84%.21 PKF Consulting, in its 2008 publication
“Trends in the Hotel Industry”, projected hotel cap rates to average 9.5% in 2010 and remain below the
long term average cap rate of 10.3%.22 Based on this data, we assume a cap rate of 9.5% for the subject
hotel. Multiplying the assumed cap rate by the total cost of the asset, we arrive at the minimum
required net operating income to support the value of the asset at cost. We assume an operating
expense ratio of 70% (based on data for full-service hotels from PKF Consulting’s 2008 “Trends in the
Hotel Industry”), and we calculate the required effective gross income of the property. Dividing the EGI
TABLE 1.12: TOTAL COST OF FULL SERVICE HOTEL
TOTAL GSF 45,525
TOTAL KEYS 84
PARKING SPACES 50
COST COST PER BUILDING GSF NOTES
LAND COSTS 4,640,800 101.94 254.85 per sf of land
HOTEL CONSTRUCTION 15,933,750 350.00
PARKING 1,750,000 38.44 35,000 per space
SOFT COSTS 2,276,250 50.00
TOTAL COSTS 24,600,800 540.38
COST PER KEY 292,867
COST PER KEY W/O LAND OR PARKING 216,786

19
by an estimated stabilized occupancy of 75% (slightly above the 2008 DC central business district
average hotel occupancy of 73.8%23), we arrive at the required potential gross income. Dividing PGI by
room count and days per year, we determine that the average daily rate required for new construction
is $338.78 (See Table 1.14).
Having determined the average daily rate (ADR) required for new construction, we can now compare
this estimate to current ADRs of comparable hotels. The subject hotel would likely have an ADR on par
with other Kimpton Hotels in the Washington, DC market. Current quoted rates for Kimpton’s Madera
Hotel and Palomar Hotel in Dupont Circle range between $250 and $290. Current quoted rates at the
Georgetown Inn and Hotel Latham range from $125 to $300 per night. It is hard to imagine the subject
hotel having any higher than a $300 ADR, well below the required ADR from our analysis. Consequently,
the construction of a full-service boutique hotel on the subject property is deemed unfeasible at this
time.
Having completed our analysis of a full-service boutique hotel, we can now turn our attention to the
feasibility of a select-service brand hotel. This analysis will require a new set of assumptions for space
needs, construction cost and operating expense ratio. Envisioning the same five-story building we used
in the full-service hotel scenario, we assume the select-service hotel will have a smaller restaurant and
bar (3000 sq. ft.) and a smaller fitness room (625 sq. ft.), resulting in an additional 1,500 gross sq. ft.
TABLE 1.14: AVERAGE DAILY RATE REQUIRED FOR NEW CONSTRUCTION OF FULL SERVICE HOTEL
TOTAL ASSET COST 24,600,800
PROJECTED CAP RATE 9.50%
REQUIRED NOI 2,337,076
PROJECTED OPERATING EXPENSE RATIO 70%
REQUIRED EGI 7,790,253
PROJECTED STABILIZED OCCUPANCY 75%
REQUIRED PGI 10,387,004
ROOM COUNT 84
REQUIRED AVERAGE DAILY RATE 338.78
TABLE 1.15: SUMMARY OF ANALYSIS FOR FULL SERVICE HOTEL
PROJECTED AVERAGE DAILY RATE 300.00
ROOM COUNT 84
POTENTIAL GROSS INCOME 9,198,000
STABILIZED OCCUPANCY 75%
EFFECTIVE GROSS INCOME 6,898,500
OPERATING EXPENSE RATIO 70%
NET OPERATING INCOME 2,069,550
COST 24,600,800
IMPLIED CAP RATE 8.41%
VALUE AT PROJECTED 7% CAP RATE 21,784,737

20
available for additional rooms. Because these rooms would also require hallway access, we estimate
that an additional 3 keys could be added to our previous room tally, leaving us with a final key count of
87 for the select-service hotel. The zoning code will require a minimum of 44 parking spaces for the
hotel rooms and 5 spaces for the largest function room. Since the restaurant will not be more than
3,000 sq. ft., no parking will be required for retail use. Thus, a minimum of 49 spaces will be required.
The next step in the analysis is to estimate the total cost of the asset. Land cost is assumed to be the
current assessed value of $4,640,800, or $255 per sq. ft. of land. Construction costs (including
restaurant fitout and all furniture, fixtures, and equipment) for a select-service hotel in Washington, DC
are projected to total $220 per gross sq. ft.24 Below-grade parking is estimated to cost $35,000 per
space, and soft costs are estimated at $50 per gross sq. ft.25 The total cost of the asset is estimated to
be $18,647,550 (See Table 1.16).
Cost per key for our select-service hotel, not including land and structured parking, is estimated to be
$141,284. This estimate is supported by data from the 2007 “U.S. Hotel Franchise Development Cost
Guide” by HVS. The cost per key of the subject hotel would fall just above or within the range of other
select-service brands such as Aloft, Courtyard, Four Points and Hilton Garden Inn (See Table 1.17).26
Table 1.17: 2007 U.S. Hotel Development Cost Guide from HVS (not including land costs) Cost Per Key Cost Per Key Cost Per Key Hotel Chain Low High Average Aloft 76,000 158,000 117,000 Courtyard (80 to 110 rooms) 81,000 130,000 106,000 Courtyard (110 to 150 rooms) 77,000 115,000 96,000 Four Points 85,000 176,000 131,000 Hilton Garden Inn 72,000 121,000 97,000
TABLE 1.16: TOTAL COST OF SELECT SERVICE HOTEL
TOTAL GSF 45,525
TOTAL KEYS 87
PARKING SPACES 49
COST COST PER BUILDING GSF NOTES
LAND COSTS 4,640,800 101.94 254.85 per sf of land
HOTEL CONSTRUCTION 10,015,500 220.00
PARKING 1,715,000 37.67 35,000 per space
SOFT COSTS 2,276,250 50.00
TOTAL COSTS 18,647,550 409.61
COST PER KEY 214,340
COST PER KEY W/O LAND OR PARKING 141,284
21
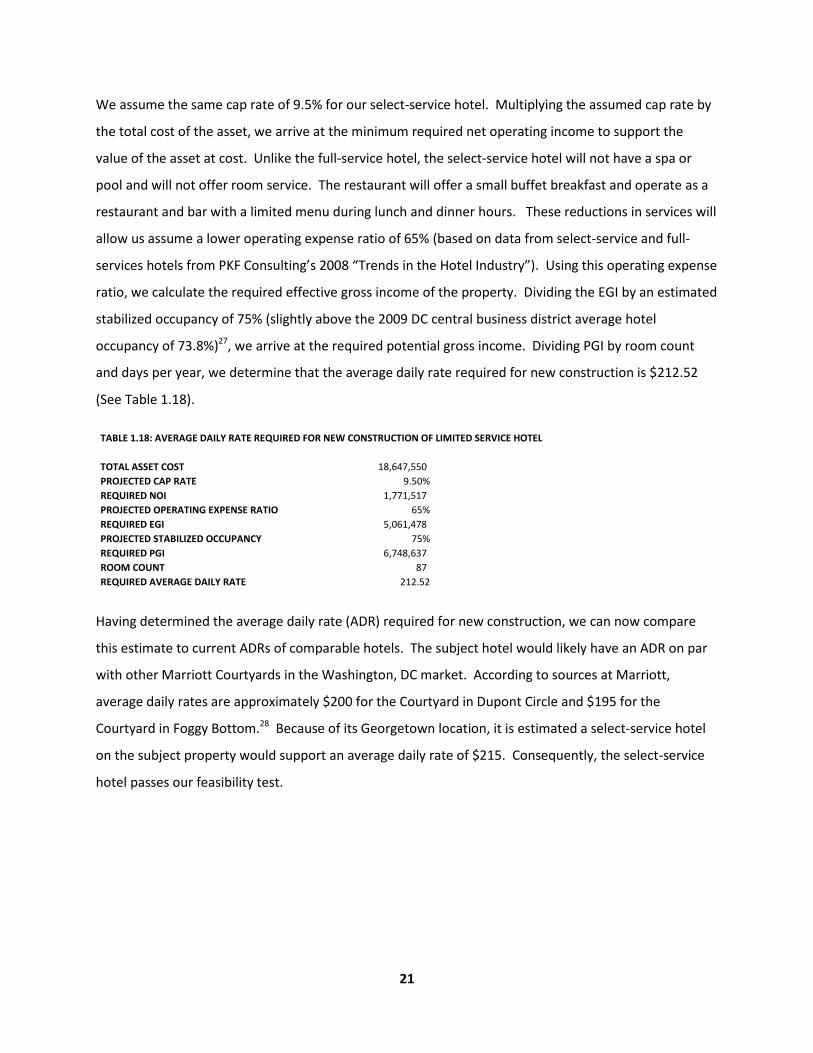
We assume the same cap rate of 9.5% for our select-service hotel. Multiplying the assumed cap rate by
the total cost of the asset, we arrive at the minimum required net operating income to support the
value of the asset at cost. Unlike the full-service hotel, the select-service hotel will not have a spa or
pool and will not offer room service. The restaurant will offer a small buffet breakfast and operate as a
restaurant and bar with a limited menu during lunch and dinner hours. These reductions in services will
allow us assume a lower operating expense ratio of 65% (based on data from select-service and full-
services hotels from PKF Consulting’s 2008 “Trends in the Hotel Industry”). Using this operating expense
ratio, we calculate the required effective gross income of the property. Dividing the EGI by an estimated
stabilized occupancy of 75% (slightly above the 2009 DC central business district average hotel
occupancy of 73.8%)27, we arrive at the required potential gross income. Dividing PGI by room count
and days per year, we determine that the average daily rate required for new construction is $212.52
(See Table 1.18).
Having determined the average daily rate (ADR) required for new construction, we can now compare
this estimate to current ADRs of comparable hotels. The subject hotel would likely have an ADR on par
with other Marriott Courtyards in the Washington, DC market. According to sources at Marriott,
average daily rates are approximately $200 for the Courtyard in Dupont Circle and $195 for the
Courtyard in Foggy Bottom.28 Because of its Georgetown location, it is estimated a select-service hotel
on the subject property would support an average daily rate of $215. Consequently, the select-service
hotel passes our feasibility test.
TABLE 1.18: AVERAGE DAILY RATE REQUIRED FOR NEW CONSTRUCTION OF LIMITED SERVICE HOTEL
TOTAL ASSET COST 18,647,550
PROJECTED CAP RATE 9.50%
REQUIRED NOI 1,771,517
PROJECTED OPERATING EXPENSE RATIO 65%
REQUIRED EGI 5,061,478
PROJECTED STABILIZED OCCUPANCY 75%
REQUIRED PGI 6,748,637
ROOM COUNT 87
REQUIRED AVERAGE DAILY RATE 212.52

22
SUMMARY OF FEASIBILITY ANALYSIS
Having completed our feasibility analysis for each proposed use on the subject property, we can now
compare the results. Office and Multifamily uses are the least costly, but they also generate the lowest
NOIs, with implied cap rates falling short of market cap rates for comparable properties. A full-service
hotel generates the highest NOI, but a select-service hotel shows the highest implied cap rate and best
risk-adjusted return. A full-service hotel fails to meet the market cap rate, with a return-on-assets of
8.41%. A select-service hotel, on the other hand, is projected to exceed the market cap rate, with a
return-on-assets of 9.61%. Of the four uses evaluated, the select-service hotel is the only use which
succeeds in creating value for the subject property. While other uses result in current market values
that fall short of costs by over $2 million, a select-service hotel should command a value that is $217,427
more than the cost of the asset (See Table 1.20). With this analysis, we determine that a select-service
hotel is the highest and best use for the site.
TABLE 1.19: SUMMARY OF ANALYSIS FOR SELECT SERVICE HOTEL
PROJECTED AVERAGE DAILY RATE 215.00
ROOM COUNT 87
POTENTIAL GROSS INCOME 6,827,325
STABILIZED OCCUPANCY 75%
EFFECTIVE GROSS INCOME 5,120,494
OPERATING EXPENSE RATIO 65%
NET OPERATING INCOME 1,792,173
COST 18,647,550
IMPLIED CAP RATE 9.61%
VALUE AT PROJECTED 7% CAP RATE 18,864,977
TABLE 1.20: SUMMARY OF PROPOSED USES
OFFICE MULTIFAMILY FULL SERVICE HOTEL SELECT SERVICE HOTEL
STABILIZED NOI 971,366 884,207 2,069,550 1,792,173
ASSET COST 16,230,800 16,109,175 24,600,800 18,647,550
IMPLIED CAP RATE 5.98% 5.49% 8.41% 9.61%
MARKET CAP RATE 7.00% 6.60% 9.50% 9.50%
MARKET VALUE 13,876,659 13,397,073 21,784,737 18,864,977
MARKET VALUE - COST (2,354,141) (2,712,102) (2,816,063) 217,427

23
Site Planning and Building Design
Having determined the highest and best use for the site, we can now begin to look closer at how land
use regulations, public approval processes and functional needs will shape the site planning and building
design of a select-service hotel on the subject property.
LAND USE REGULATIONS AND PUBLIC APPROVALS
As mentioned previously, the site is located in Zone C-2-A of Washington, DC. The maximum building
height in Zone C-2-A is 50 ft., with no specified limit on the number of stories allowed. The maximum
floor area ratio (FAR) is 2.5, meaning that the maximum gross square footage allowed is 2.5 times the
site area. The maximum lot coverage is 60%. A 15 ft. rear-yard set back is required in Zone C-2-A, but
no front-yard or side-yard setbacks are required. DC zoning regulations also stipulate parking and
loading requirements. For hotel use in Zone C-2-A, one parking space will be required for each two
rooms usable for sleeping. One parking space will also be required for each 150 sq. ft. in the largest
function room of the hotel. For hotels with 30 to 200 rooms, one “loading berth” and one “loading
space” will be required. The loading berth must be 30 ft. deep and 12 ft. wide with a minimum vertical
clearance of 14 ft. The loading space must be 20 ft. deep and 10 ft. wide with a minimum vertical
clearance of 10 ft.
In addition to having to comply with the generic regulations set forth by the zoning code, a new
development on the site would also be subject to a lengthy review and approval process due to the fact
that it is located within the Georgetown historic district. To apply for a building permit in this district,
architectural and site plans must be submitted to the both the Historic Preservation Review Board and
the DC Commission of Fine Arts. The Commission of Fine Arts directs the case to a body called the Old
Georgetown Board for review. The Old Georgetown Board reviews the building permit application in a
public hearing where it considers whether the proposed building is compatible with its historic
surroundings. The Old Georgetown Board makes a recommendation to the Commission of Fine Arts for
approval or denial of the permit. The Commission of Fine Arts may hold another public hearing if the
case warrants more review, but usually it will make a final recommendation based on the review of the
Old Georgetown Board and pass this along to the Mayor’s Agent for final approval. The Historic
Preservation Review Board will usually not duplicate the review of the Old Georgetown Board, but it
must conduct an independent review of the application if requested by the local Advisory Neighborhood

24
Commission. The final recommendation of the Historic Preservation Review Board, if requested, would
then also be passed along to the Mayor’s Agent for a final decision on the application.
In order to gain the approval of the Old Georgetown Board and the Historic Preservation Review Board,
the design of the proposed development should respect the historic character of the neighborhood and
be compatible with neighboring buildings. The DC Historic Preservation Office offers published
guidelines for new construction in historic districts. “Compatibility”, as defined by these guidelines, is
achieved through attention to the following design principles: setback, orientation, scale, proportion,
rhythm, massing, height, materials, color, roof shape, details and ornamentation, and landscape
features. “Perhaps the best way to think about a compatible new building,” the guidelines state, “is that
it should be a good neighbor, enhancing the character of the district and respecting the context, rather
than an exact clone.”29
The Historic Preservation Review Board also offers conceptual design review to help coordinate projects
prior to permit application. The Georgetown historic district review and approval process poses a risk to
the developer of the subject property because design concessions may be necessary to gain final
approval of the project. These changes could impact the financial feasibility of the development due to
higher construction costs or a lower buildable gross square footage than originally planned.
PRELIMINARY SITE PLAN AND BUILDING DESIGN
The preliminary site plan and building design offered in this proposal attempts to efficiently meet the
functional needs of a select-service hotel while maximizing the allowable gross square footage on the
site. The design adheres to the zoning code and incorporates several characteristics which are aimed at
making the project compatible with its surrounding historic neighborhood. The major components of
the proposed design are summarized below.
Orientation: The site lends itself well to an offset slab configuration for a footprint. This layout creates
visibility by placing the building façade close to street on the east side of the lot nearest Wisconsin Ave.
It also allows for the building to be setback on the west side of the lot even with the adjacent 2-story
commercial building. Finally, this layout allows for an efficient central core to the building.
Façade: The building would have a historic brick façade with glass storefront at the restaurant and
lobby on the first floor. The entrance to the loading dock and parking garage would have historic
articulation similar to the Car Barn on M. St to make them blend in with the streetscape.

25
Height: The building would be 50 ft. tall, the maximum allowed for the zone. The first floor would have
a slab-to-slab height of 14 ft., while the typical floor slab-to-slab height would be 9 ft.
Interior: Rooms would average 350 gross sq. ft. The first floor would include a 1,000 sq. ft. lobby, and
1,000 sq. ft. meeting room and a 3,000 sq. ft. restaurant/lounge/bar.
Landscaping: Sidewalk areas on Prospect St. would be paved with historic brick. Behind the hotel
would be patio areas and a garden.
Figure 4: Example of Hotel Façade with Historic/Contemporary Design
Figure 5: Typical Room Layout for Subject Hotel
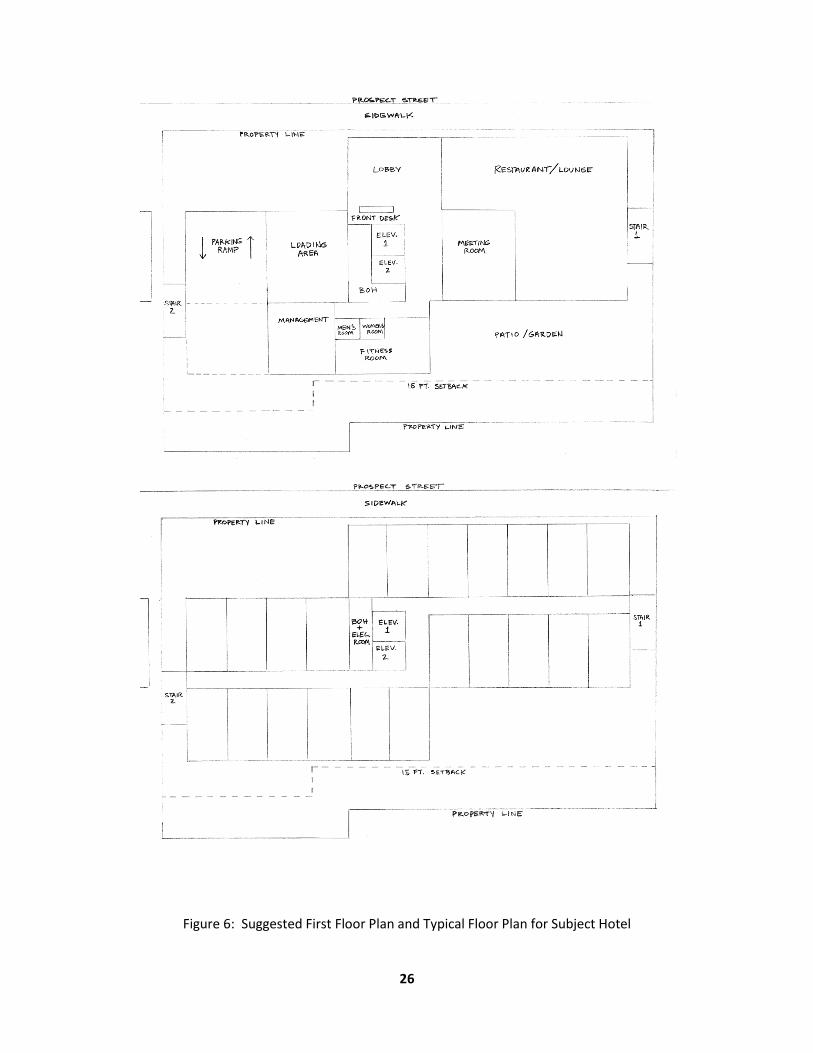
26
Figure 6: Suggested First Floor Plan and Typical Floor Plan for Subject Hotel

27
Financial Analysis
DEVELOPMENT COSTS
The financial analysis of the project starts with a detailed review of development costs. Line items from
Appendix I, “Development Cost Summary” are explained and supported below.
SITE ACQUISTION COSTS
Land Cost: Land cost is estimated to be the current assessed value of the land. It is assumed that the
current landowner, the Weaver family, will maintain ownership of the property through development.
Consequently, total site acquisition costs do not include transactional or financing costs associated with
purchasing the property.
HARD COSTS
Building Construction: Base building construction costs are estimated at $155 per gross sq. ft. Parking
costs are estimated at $35,000 per space. General conditions, or the general contractor’s overhead, is
calculated at 4% of base building and parking costs. The general contractor fee is projected to be 3.5%
of base building, parking, and general conditions costs. A contingency to pay for design changes and
cost overruns is held at 5% of all other building construction costs. Total building construction is
therefore projected to cost $9,913,583. Not including parking, construction costs are $180.09 per gross
sq. ft. The 2009 RS Means estimate for construction of a 4 to 7 story hotel in Washington, D.C. is
$155.56 per sq. ft.30 Projected construction costs for the subject property are 15% higher than the RS
Means data, primarily due to the fact that the subject hotel will be more upscale than the average hotel.
Construction estimates for the proposed hotel have been reviewed and confirmed by the estimating
team of local general contractor, John Moriarty and Associates, of Alexandria, VA.
Furniture, Fixtures and Equipment (FF&E): FF&E costs are divided among six categories: guestrooms,
corridors, public areas, kitchen equipment, laundry equipment, and information technology. Guestroom
FF&E costs are projected to be just over $4,600 per key. This covers the cost of a bed frame, nightstand,
bureau, desk, chair, sofa chair, television, safe, mini-bar refrigerator, and two freestanding light fixtures
for each room. Corridor FF&E costs are projected to be $40,000. Public area FF&E costs, which will
cover equipment in the fitness room and furniture in the lobby, business room and lounge/restaurant
area, are projected to be $150,000. Kitchen and laundry equipment are each projected to cost $50,000.

28
Information technology, which covers the costs of the hotel’s telephone system, computer reservation
system and wireless internet service, is projected to cost $200,000. A 3% purchasing fee and 8% freight
and warehousing fee are applied to all FF&E costs. Total FF&E costs are projected to be $982,400, or
$11,292 per key. This estimate is consistent with the 2007 HVS “U.S. Hotel Franchise Development
Guide,” which states that FF&E cost per key for a Marriott Courtyard hotel ranges from $8,900 to
$10,400.31 A vice president of development at Marriott has reviewed the FF&E cost estimates for the
proposed hotel and confirmed them as appropriate for a Marriott Courtyard.
Operating Supplies and Equipment (OS&E): OS&E costs are divided into three categories: guestrooms,
public areas and back of house, and food and beverage. Guestroom OS&E costs are estimated to be
$1,724 per key. This covers the cost of a mattress, bed linens, towels, and a shower curtain for each
room, as well as the cost of stocking the mini-bar and supplying the hotel with an adequate inventory of
fresh linens, towels, soaps, shampoos, and welcoming packages for guests. Public area and back of
house OS&E costs are estimated to total $150,000. This covers cleaning and janitorial equipment, office
equipment, employee uniforms and other back of house start-up costs. Food and beverage OS&E costs
are estimated to be $50,000, which covers the cost of stocking the restaurant’s food and beverage
inventory, creating menus, and providing dinnerware (i.e.—utensils, plates, glassware, linens). A 3%
purchasing fee and 8% freight and warehousing fee are applied to all OS&E costs. Total OS&E costs are
projected to be $388,500, or $4,466 per key. A vice president of development at Marriott has reviewed
the OS&E cost estimates for the proposed hotel and confirmed them as appropriate for a Marriott
Courtyard.
SOFT COSTS
Professional Fees and Services: $10,000 is budgeted for a formal, independent market study to verify
the projected average daily rates and occupancy rates assumed for the subject hotel in this analysis.
Architectural and engineering costs are projected to be $450,000, or just under $10.00 per gross sq. ft.
Testing, inspections and appraisal are estimated at $50,000. Builder’s risk insurance is calculated at $.65
per $100 of total hard costs, amounting to just under $75,000. Legal and accounting fees are projected
at $100,000. Municipal and utility fees and permit fees are each estimated to cost $50,000. Total costs
for professional services and fees are $783,349, or $17.21 per gross sq. ft.
Project Management: This proposal assumes the landowner will develop the subject property in
partnership with a professional real estate developer. The salaries and wages of the developer’s staff
29
are estimated to cost $200,000, and an additional $25,000 is budgeted for travel and expenses. The
developer’s fee is calculated at 3% of total hard costs, for a total of approximately $338,000.
Other Soft Costs: Property taxes during development are calculated using the current DC tax rate on
commercial property of $1.85 per $100 of assessed value. This amount is calculated over a 16 month
construction period using the current assessed value of the land. Construction loan interest is calculated
assuming equal draws of the loan amount over the 16 month construction schedule. Loan fees are
projected to be 1% of the construction loan and 2% of the permanent loan. Developer equity carrying
costs are calculated using a 9.5% cost of funds. Marketing and pre-opening costs are projected at
$250,000. Finally, a project contingency is included at $400,000, slightly more than 2% of total
development costs.
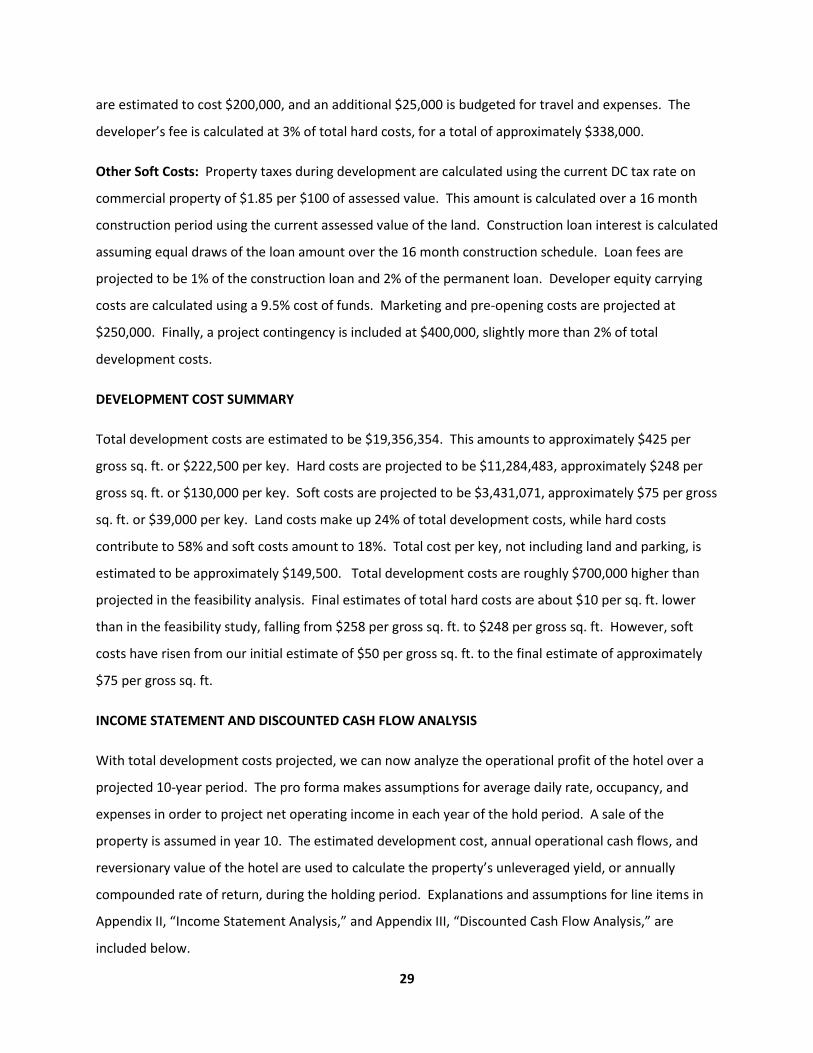
DEVELOPMENT COST SUMMARY
Total development costs are estimated to be $19,356,354. This amounts to approximately $425 per
gross sq. ft. or $222,500 per key. Hard costs are projected to be $11,284,483, approximately $248 per
gross sq. ft. or $130,000 per key. Soft costs are projected to be $3,431,071, approximately $75 per gross
sq. ft. or $39,000 per key. Land costs make up 24% of total development costs, while hard costs
contribute to 58% and soft costs amount to 18%. Total cost per key, not including land and parking, is
estimated to be approximately $149,500. Total development costs are roughly $700,000 higher than
projected in the feasibility analysis. Final estimates of total hard costs are about $10 per sq. ft. lower
than in the feasibility study, falling from $258 per gross sq. ft. to $248 per gross sq. ft. However, soft
costs have risen from our initial estimate of $50 per gross sq. ft. to the final estimate of approximately
$75 per gross sq. ft.
INCOME STATEMENT AND DISCOUNTED CASH FLOW ANALYSIS
With total development costs projected, we can now analyze the operational profit of the hotel over a
projected 10-year period. The pro forma makes assumptions for average daily rate, occupancy, and
expenses in order to project net operating income in each year of the hold period. A sale of the
property is assumed in year 10. The estimated development cost, annual operational cash flows, and
reversionary value of the hotel are used to calculate the property’s unleveraged yield, or annually
compounded rate of return, during the holding period. Explanations and assumptions for line items in
Appendix II, “Income Statement Analysis,” and Appendix III, “Discounted Cash Flow Analysis,” are
included below.

30
Average Daily Rate (ADR): ADR is projected to be $215 in year 1, with 3% escalation each year
thereafter. This rate is approximately 5% higher than the ADR projected for the Marriott Courtyard in
Foggy Bottom in 2012.32 This premium is supported primarily by the subject hotel’s prime location in
Georgetown. The annual 3% escalation in ADR is consistent with projections by Marriott for similar
select-service hotels in Washington, DC over the next decade.33
Occupancy: Occupancy is projected to be 69% in year 1 and 74% in year 2 before stabilizing in year 3 at
78%. Stabilized occupancy is 3% higher than the 75% rate projected in the feasibility study. Sources at
both Marriott and Host Hotels believe 78% stabilized occupancy is appropriate for the subject hotel due
to the small key count and premium location of the hotel.34
Revenue: Rooms revenue is calculated by multiplying ADR by the key count and the number of days in
the year. Food and beverage revenue are each projected to be $125,000 in year 1 and grow annually at
3%. Hotel parking revenue, projected to be approximately $215,000, is based on the assumption that
60% of parking spaces will be occupied at a daily rate of $20.35 Other income (such as guest laundry and
outsourced dry cleaning services) is projected to be $100,000. Both are also projected to grow at 3%
annually. A vice president of development at Marriott has reviewed these revenue estimates for the
proposed hotel and confirmed them as appropriate for a Marriott Courtyard.
Departmental Expenses: Departmental expenses are calculated as a percentage of departmental
revenue. Rooms expenses are projected to be 20% of rooms revenue. Food expenses are projected to
be 90% of food revenue. Beverage expenses are projected to be 70% of beverage revenue. Hotel
parking expenses are projected to be 35% of parking revenue. Other income expenses are projected to
be 65% of other income. A vice president of development at Marriott has reviewed these expense
estimates for the proposed hotel and confirmed them as appropriate for a Marriott Courtyard.
Undistributed Operating Expenses: Undistributed operating expenses are calculated as a percentage of
total revenue. Administrative and general expenses are estimated to be 9% of total revenue. Sales and
marketing expenses are estimated to be 5% of total revenue. Operations and maintenance expenses
are estimated to be 4% of total revenue. Utilities are projected at 3.5% of total revenue. A vice
president of development at Marriott has reviewed these expense estimates for the proposed hotel and
confirmed them as appropriate for a Marriott Courtyard.
31
Management/Franchise Fees: Management fees are projected at 3% of total revenue. Franchise fees
are projected at 5.5% of total revenue. These estimates are consistent with hotel industry averages for
these fees. 36
Fixed Charges: Property taxes are calculated using the current DC tax rate on commercial property of
$1.85 per $100 of assessed value. This amount is calculated in year 1 using the total development cost,
and is projected to increase annually at 3%. Insurance is calculated in year 1 at $50,000, or $1.10 per
gross sq. ft., and is projected to grow annually at 3%.
Replacement Reserves: Replacement reserves are held at 5% of total revenue. This is slightly higher
than industry averages of about 4.5%.
Net Operating Income (NOI): NOI is projected to be approximately $1.7 million in year 1. Due to the
projected increases in occupancy rate in the first three years of operation, NOI is expected to grow
approximately 11% in year 2 and 9% in year 3 before stabilizing in year 4 at a 3% growth rate.
Operating Expense Ratio: The expense ratio is projected to be 67% in year 1 and stabilize in year 3 at
66%. This is consistent with the estimate of a 65% expense ratio used in the feasibility analysis for a
select-service hotel.
Reversion Value Calculation: The projected sale price of the hotel at the end of year 10 is calculated by
applying a terminal cap rate of 10% to the hotel’s projected NOI in year 11. The 50 basis point spread
between the going-in cap rate of 9.5% and the terminal cap rate is appropriate because the building will
have aged 10 years. The projected sale price of the hotel under the current assumptions is
approximately $27 million. The reversion value is calculated by deducting 2% from the projected sale
price to account for selling costs.
Unleveraged Cash Flow Summary: The unleveraged cash flow summary shows the total cash flow for
the property assuming the property was an all-equity investment. The initial negative cash flow at time
zero is equal to the total development cost. Yearly cash flows thereafter are equal to the annual NOI,
with year 10 cash flow including both the NOI and the property’s reversion value. Under the baseline
assumptions, annual unleveraged return on assets is projected to be 8.98% in year 1, increasing to
11.72% in year 5 and 13.23% by year 9. The projected unleveraged IRR is 13.25%, slightly higher than
the average unleveraged discount rate currently used by U.S. hotel investors. According to the Korpacz
Investor Survey for Q3 2009, investors in full-service hotels applied unleveraged discount rates of 10% to

32
14% to potential investments, using an average rate of 11.69%. Meanwhile, investors in limited service
hotels used unleveraged discount rates from 10% to 18%, with an average rate of 13.19%.37 The project
exhibits an implied cap rate of 11.04%, calculated by dividing stabilized NOI in year 3 by total
development costs. The 11.04% implied cap rate also compares favorably to the latest Korpacz data,
which shows average overall cap rates currently sought by full service and limited hotel investors to be
9.85% and 10.85% respectively.38
DEBT FINANCING
Having projected returns at the property-level, we can now explore debt financing for the subject
development and examine the leveraged returns of the project. Unfortunately, the real estate capital
markets are currently in disarray. In the past 16 months, the value of U.S. commercial real estate has
plummeted and lending for new projects has dried up. Commercial lenders who made loans at the
height of the market with high loan-to-value (LTV) ratios are foreclosing on borrowers unable to meet
debt service due to higher than expected vacancy. The collapse of the commercial mortgage backed
securities (CMBS) market has left many banks unable to sell their inventory of loans. Rather than
focusing on new loans, many banks are closely watching their current loans and holding onto their real
estate owned, hoping they can avoid a giant loss by waiting for the market to begin to recover before
they sell.
Maximum LTV ratios currently offered by commercial lenders have dipped to 50% to 65%, far less than
the 75% to 90% ratios offered several years ago. Interest rate spreads for hotel loans are currently
between 450 and 600 basis points over 10-year Treasuries. Today’s spreads are far higher than the 100
to 150 basis point spread enjoyed in recent years, and also higher than the 300 to 400 basis point spread
seen in the 1990’s.39 With 10-year Treasuries yields at 3% to 3.5%, the quoted interest rates on hotel
loans currently range from 8% to 9.5%. Many lenders are also requiring full recourse to the borrower’s
assets in the case of default.
Due to the subject development’s prime urban location and relatively small size, it may stand a better
chance than others of finding a willing lender in the current capital markets. However, it is more than
likely that any construction lender would require permanent financing in place before agreeing to a
loan. The development team would likely need to enter into a tri-party agreement with the
construction lender and the permanent lender, and would also likely need to pledge assets as recourse
for the loans.

33
This proposal assumes the subject development will be financed by a 10-year loan from an insurance
company (See Appendix IV: Project Financing). The loan will have a fixed interest rate of 8.5%, a 25-year
amortization, a required debt service coverage ratio of 1.35, and a maximum LTV ratio of 60%. The
insurance company is also expected to charge a 2% upfront fee for the loan. The insurance company
will value the asset for LTV purposes by applying a 9.5% capitalization rate to the year 1 NOI.40 The
resulting maximum loan amount is just under $11 million, or 57% of total development costs. Annual
debt service payments will total $1,061,076. The balloon payment on the loan’s remaining principal in
year 10 will be approximately $9 million.
The construction loan for the subject development will be the same amount as the insurance company
loan, with a 9% interest only rate.41 Construction draws are projected evenly over a 16 month
construction schedule. Construction loan interest payments will total approximately $700,000. The
construction lender will also charge a 1% upfront fee for the loan. Total loan fees for the subject
development will be approximately $330,000.
EQUITY FINANCING
Given the above assumptions for debt financing, the subject development is projected to have a
leveraged IRR of 17.74% (See Appendix V: Before Tax Equity Cash Flow Analysis). This may fall short of
the minimum return required by an equity investor since hotel investors have historically sought equity
yields above 19%.42 The low equity yield of the subject development can primarily be attributed to the
60% LTV ratio of the permanent financing. If the project was able to achieve permanent financing at a
typical 75% LTV ratio, the leveraged IRR would increase to 20.18%. The lower leverage provided by a
loan with a 60% LTV will mean less risk to equity investors, so theoretically their minimum required
return should be adjusted downward. If equity investors are willing to accept a minimum return of 17%
due to the reduced leverage, the project would exhibit a positive net present value of $378,078 and
should be pursued.
Equity financing of the subject development could be structured in one of several different ways. Given
that the permanent loan will only cover 57% of the total development costs, the total amount of equity
required will be approximately $8.4 million. Since the Weaver Family already owns the land (valued at
approximately $4.6 million), if they have the available cash, they could fund the remaining $3.8 million
of equity on their own and hire a fee developer to manage the development. In this scenario, the
Weavers would be the sole equity owner of the development. Under the baseline assumptions for the

34
project, they would see a 17.74% IRR on their equity investment. Annual return on equity would be
8.09% in year 1 and 12.86% in year 3, rising to 17.91% in year 9. The before tax reversion value of the
equity investment in year 10 would be approximately $17.5 million.
If the Weavers did not want to contribute additional cash to the project, they could partner with a
developer who would bring in the remaining equity. In this type of partnership, the Weavers would
maintain an equity interest in the deal equal to the agreed upon value of their land. Assuming the
Weavers’ equity interest was agreed to be the land’s assessed value, the developer would contribute
the additional $3.8 million in equity needed to fund the project.
An equity partnership between the Weaver Family and a developer could take several forms (See
Appendix VI: Potential Equity Partnership Structures). In one scenario, the Weavers and the developer
might agree to split returns “pari-passu,” with each investor receiving their pro-rata share of cash flow
based on their percentage of equity ownership. Given this form of partnership, under the baseline
assumptions the Weavers and the developer would both see a before tax IRR of 17.74% on their equity
investment. Annual percentage return on equity for both investors would also be identical to the single
equity ownership structure.
In another possible equity partnership structure, the Weavers could negotiate a preferred equity
position. In this scenario, the developer would offer the Weavers a 12% annual preferred return on
equity along with a 15% IRR lookback. For the Weavers, this type of agreement would result in a lower
IRR than the “pari-passu” structure, but it would also be less risky. The developer would accept lower
returns in the early years of the investment in order to satisfy the 12% preferred return due to the
Weavers. In the investment’s latter years, the developer would enjoy the upside of the growth in NOI
and the reversion value. In this form of partnership, under the baseline assumptions, the Weavers’
equity investment would have a before tax IRR of 15% and a fixed 12% annual return on equity. The
family would receive approximately $557,000 annually for 10 years, with a payout of approximately $8
million upon sale in year 10. The developer, under the baseline assumptions, would have a before tax
IRR of 20.33%. Annual return on equity would be 3.23% in year 1, but would rise to 17.41% in year 5
and 25.25% in year 9. Negotiating a preferred return with an IRR lookback allows the Weavers to take a
safer position in the capital structure by accepting lower returns. This structure may be necessary in
order to entice a developer who is seeking a higher equity yield and is willing to take more risk in order
to achieve higher returns than those offered by a “pari-passu” partnership.

35
Partnership negotiations between the Weaver family and a developer will be affected by several factors.
If the permanent lender has recourse to the borrowers, the equity partner who is liable for the recourse
will have greater pull in the negotiations. If the developer must pledge all the assets necessary to satisfy
the recourse provisions of the loan, they may attempt to increase their percentage of ownership in the
deal by limiting the value of the Weavers’ land as their equity contribution. Recourse aside, the value
assigned to the Weaver’s land will be a large point of negotiations for the developer. Even if no
recourse is required or if the two partners shoulder the recourse “pari-passu,” the developer may still
try to increase their percentage of equity ownership by saying the land is not worth the assessed value.
SENSITIVITY ANALYSIS
Appendix VII provides a sensitivity analysis, illustrating how specific changes to the baseline assumptions
will affect unleveraged and leveraged IRRs. Four scenarios result in leveraged IRRs falling below 16%.
1.) If Occupancy stabilizes at in year 3 at 73% (as opposed to 78%)
2.) If ADR is escalated at 2% (as opposed to 3%)
3.) If year 1 ADR is $205 (as opposed to $215)
4.) If development costs are exceeded by $1 million
The sensitivity analysis makes clear that the most crucial assumptions in the discounted cash flow
analysis are the subject hotel’s occupancy, ADR and development costs. While no specific scenario in
the sensitivity analysis leads to leveraged returns falling below 15%, a combination of two or three
negative scenarios would have a greater effect on IRRs. Development costs should be closely
scrutinized, and estimates for occupancy and ADR should be confirmed and supported with further
market study before proceeding with the investment. The sensitivity analysis also shows how a
partnership structure with a preferred return and IRR lookback would favor the Weavers if the
investment underperforms. In all scenarios tested, the Weavers’ investment would maintain a 15% IRR
if they agreed to this partnership. However, if the project exceeds the baseline expectations, it is the
developer who will enjoy the upside benefit.
ADDITIONAL PROJECT SCENARIOS
Acquisition of Burruss Lot: The development team should seriously investigate the possibility of
acquiring the adjacent 2,360 sq. ft. lot owned by J. Burruss, Jr. This land has frontage on Prospect St.

36
and is currently used for surface parking in conjunction with the Doggett’s operation on the Weavers’
land. Combining the Burruss lot with the Weavers’ land would allow for an additional 5,900 sq. ft. in the
hotel, an addition of 11 keys. According to a Phase I Environmental Site Assessment for the Weavers’
land, the Burruss lot is listed on a national database as having an underground storage tank. This makes
acquisition of the Burruss lot risky, since clean-up of contaminated soils could be costly. Still, the
acquisition should be thoroughly investigated because it could increase returns for the project. The
Burruss lot is currently assessed at $601,450. Appendix IX and Appendix X assume a scenario where the
development team acquires this land at the assessed value and spends $50,000 in acquisition costs and
environmental due diligence. The project’s unleveraged IRR increases from 13.25% to 13.48%, while the
leveraged IRR jumps from 17.74% to 18.30%.
Additional Parking: In addition to the acquisition of the Burruss lot, the development team should also
investigate the possibility of providing more than the minimum required parking as an additional source
of income. Appendix XI and Appendix XII assume a scenario where 50 additional below-grade parking
spaces are included in the development at a cost of $35,000 per space. Based on conversations with a
local parking operator, the 50 spaces are projected to have an average daily turnover of 1.5, meaning an
average of 75 cars will park in the garage each day. The average rate per car is projected to be $12.43
Since the parking operator would manage both the hotel parking and the additional parking, expenses
previously associated with hotel parking are rolled into the parking operation as a whole. Expenses are
projected at $1000 per space, based on the total spaces provided in the development.44 This scenario
results in an increase in the project’s unleveraged IRR from 13.25% to 13.52% and an increase in the
leveraged IRR from 17.74% to 18.57%. The development team should commission a formal market
study to investigate whether additional parking would achieve the rates and occupancy projected in this
proposal.
37
Development Plan
TIMELINE
The development schedule in Appendix XIII lays out the timeline for the project. Scheduled tasks are
organized into five categories: partnership formation, design, permits and approvals, financing, and
construction.
Partnership Formation: The first step in the development process is for the Weaver Family to solicit a
developer by putting out a request for proposal (RFP) to develop a select-service hotel on the site.
Among other things, the RFP will ask interested developers to provide:
1.) An estimate of all hard and soft costs of the development, including the developer’s fee
2.) A 10-year pro forma of the hotel with a discounted cash flow analysis
3.) A proposed form of equity partnership between the landowner and the developer
The Weavers can decide to: 1.) partner with a developer who will contribute equity to the project, or 2.)
fund the remaining equity for the project on their own and hire a developer for a fee. The Weavers will
have several factors to evaluate when they review proposals from competing developers. It is
recommended that the Weavers commission an independent market study as a “second opinion” to
ADR and occupancy projections in the developers’ pro formas. The Weavers will also need to consider
the developers’ ability to find debt financing for the project, as developers who have good working
relationships with lenders will be more likely to secure a loan. Finally, the Weavers will need to closely
scrutinize the various proposed equity partnership structures.
The process of distributing an RFP and reviewing developer proposals should take two months. After
the Weavers choose a developer, the two will enter into a partnership agreement, or the Weavers will
contract the developer for a fee. The development team will then turn its focus toward carrying out the
project. The first step for the development team will be to evaluate potential brand possibilities for the
hotel. Selecting a hotel chain early in the planning process is crucial for several reasons. First, a chain
will require specific design standards for the hotel, so getting them involved early in the planning
process will save time and money on design. Second, securing a chain will lend credibility to the project
in the eyes of a lender. The schedule for the subject hotel assumes the development team will
formalize a franchise agreement with a chain within two months of starting the search.

38
Design: The development team should be prepared to contract an architect immediately after being
contracted by the Weavers. The developer should propose an architect in his response to the RFP. The
development team should ensure that the chosen architect is qualified to do the job. The architect
should have experience in hotel design and should be familiar with the DC historic review process. The
architect’s first task will be to complete schematic drawings, which should take one month. The
development team will present the schematic drawings to the Historic Preservation Review Board for
conceptual design review. Schematic drawings will also be given to the selected hotel brand and to a
general contractor for initial estimating. The architect’s second milestone will be the completion of
design development drawings. These drawings are projected to take an additional three months to
produce after receiving feedback from the Historic Review Board, the brand, and the GC. The
development team will submit the design development drawings to the Old Georgetown Board for
historic approval. The final design task of the architect is to complete construction documents. The
development schedule anticipates that 80% construction documents will be completed by 10/1/2010,
nine months into the project. 100% construction documents will take an additional two months to
complete.
Permits and Approvals: The schedule assumes that the development team will be prepared to sit for
conceptual design review with the Historic Preservation Review Board by 5/1/2010, four months into
the project. A public hearing before the Old Georgetown Board would occur three months later, upon
completion of design development drawings. Approval from the necessary historic boards is anticipated
10/1/2010, two months after the public hearing. At this time, the 80% construction documents will be
submitted to the city for building permit review and approval. An approved building permit along with
all other necessary city approvals is expected by 1/1/2011, 10 months after the selection of a developer.
Financing: The development schedule anticipates that permanent financing will be secured by
11/1/2010. By this date, the project will have hopefully received approval from the historic boards. The
80% construction documents will have been priced by the GC, and estimates for the cost of construction
will be fine-tuned. With permanent financing in place, the developer will look secure a construction
lender so that construction can begin by 1/1/2011, the date when city approval of the building permit is
expected.
Construction: The development team should involve a general contractor early in the design process.
The development schedule assumes that a GC will be chosen to provide pre-construction services by
5/1/2010, when schematic drawings are completed by the architect. The GC selected for pre-

39
construction consulting could be one of several GCs who are given the opportunity to price the job once
design development drawings are completed. The development team must decide whether it will
negotiate a guaranteed maximum price (GMP) contract or bid the project out once construction
documents are sufficient. If the development team waits until construction documents are 100%
completed before bidding out the job, construction will be delayed by two months from the current
schedule. On the other hand, bidding out the project at 80% construction documents is risky for the
development team, since the contractor will not be liable for design omissions when presenting a lump
sum bid. Given these risks and time constraints, a negotiated GMP will likely be the best form of
contract with the GC. The schedule assumes that a GC will be chosen and a tentative GMP will be
reached on 11/1/2010, one month after 80% construction documents. The selected GC should be able
to work with the design team and the development team to fill in any missing costs not shown on the
80% construction drawings. The GC and the development team should be able to come to a final
agreement on a GMP by 12/1/2010, one month before the building permit is anticipated and
construction can begin. The construction schedule is for the hotel is estimated to be 16 months. A
certificate of occupancy is anticipated on 5/1/2012. Pre-opening preparation is estimated to take an
additional month. The grand opening of the hotel would be 6/1/2012.
PROJECT RISKS
Entitlement Risk: The project faces entitlement risk because of the historic district approval process.
This process poses significant risk to the project because it could end up limiting the hotel’s key count.
The Old Georgetown Board may push for a design which is inefficient as a hotel floor plan but
aesthetically pleasing to the street front or more compatible with the historic surroundings. Design
suggestions from the Old Georgetown Board could add cost to the project and prevent the project from
achieving the maximum FAR allowed. The development team will need to keep close tabs on
construction costs and key count if design changes are made in the historic district review process.
Construction Cost Risk: Hard costs account for 58% of total development costs, so construction costs
must be accurately estimated and updated as the development takes shape. All design changes should
be priced by the GC as soon as possible. Materials and labor costs fluctuate and should be monitored by
the GC in the preconstruction phase. FF&E and OS&E estimates should be reviewed and confirmed by
representatives from the selected hotel brand. Failure to accurately estimate construction, FF&E and
OS&E costs could result in cost overruns that negatively impact project returns.

40
Construction costs offered in the pro forma assume that LEED certification of the project will not be
required. The DC Green Building Act of 2006 requires all new non-residential projects over 50,000 sq. ft.
be built to LEED “silver” certification standards. At 45,525 sq. ft., the hotel would not be subject to the
requirements of the Green Building Act. However, historic board members may push for the
development to adhere to the Act in order to gain final approval. Many green building design principles
make sense financially and should be included in the hotel regardless of whether LEED certification is
pursued. Many of these design features can be incorporated at little or no cost premium and will
reduce utility costs, paying for themselves within several years. Other major green improvements may
still make sense financially due to long term utilities savings, but will result in larger upfront increases in
construction costs. Complying with the Green Building Act could increase building construction costs
anywhere from 0 to 4%. The development team should be prepared to build the building to LEED
standards if required for final building permit approval. The selected architect and general contractor
should be made aware early in the design process of the potential need to build to LEED standards. If
required, the development team should work closely with the design team to ensure that the majority
of green building principles used to achieve LEED certification will reduce building utilities costs and
result in an increase in NOI.
Financing Risk: Finding a willing lender in today’s market will be one of the development team’s
toughest tasks. If the team is unable to secure both a construction loan and a permanent loan, the
project could be significantly delayed. The developer and other equity partners could experience
diminished returns or be forced to shelf the project if a suitable loan is not found in a timely manner.
The pro forma assumes that the project is financed by a 10-year loan from an insurance company. If a 3,
5, or 7-year loan is considered, the pro forma must be updated to take into account refinancing risk.
Equity partnership agreements and contracts with architects, general contractors, and brands should
include termination clauses in the event that project financing cannot be secured.
Interest Rate Risk: Interest rates assumed in the pro forma for the construction loan and permanent
loan reflect current market rates, but are subject to change. Interest rates should be closely tracked by
the development team throughout the planning and construction phases of the development. The
project’s construction loan will be a floating rate loan pegged a spread over to 30-day LIBOR, so interest
rate change during construction could lead to an increase in construction interest paid.
Market Risk: Projections for ADR and occupancy in the 10-year pro forma are based on comparable
properties, current market assessment, and input from hotel industry professionals. To mitigate the risk
41
that these assumptions are inflated, the development team should commission a formal and
independent market study for the hotel prior to moving forward with the development. Hotels are
generally more immediately affected than other income properties by downturns and upswings in the
economy. Although the pro forma assumes 3% growth in ADR, in reality the hotel may experience a 6%
increase in one year and 2% decrease the next. The same could be true for occupancy. Even in good
economic times, rates and occupancy should be expected to vary from one month to the next due to
seasonal fluctuations in demand, meaning monthly cash flows will be unstable. The development team
should carefully estimate projections for ADR and occupancy using reliable sources of market data.
Operating Risk: Operating a hotel is a management-intensive business. The project could see
diminished returns if the selected hotel management company is inexperienced or inefficient. The
development team should be very selective in the choice of a management company and should choose
a seasoned hotel operator with a successful track record. Selecting a management company based
solely on fee is not recommended, since management underperformance could easily result in a net
reduction in NOI despite the savings in fees. Even with a fully capable management company in place,
the hotel operation will still be subject to fluctuations in labor costs, utilities costs, and property taxes,
all of which could affect profit margins and result in diminished returns to the equity partners.
Brand Risk: The development team may find itself unable to execute a franchise agreement with a
suitable brand. Some brands may feel that the size of the hotel, at 87 rooms, is too small to be
appropriate for the brand. Others may be willing to accept the small size but may charge higher than
expected franchise fees that would diminish returns to equity investors. Finding an appropriate brand is
a key component to the overall success of the project. Brand recognition will contribute to the
profitability of the hotel by through marketing, reservation systems, and an established customer base.
The development team must carefully evaluate the terms of franchise agreements offered by competing
brands. The length of the franchise agreement will likely be ten years or more, so choosing a well-
established select-service brand is recommended. Selecting a newly-launched brand could prove to be
both suitable for the site and profitable, but the risks of such a move should be adequately vetted by the
development team.

42
Conclusion
This proposal has demonstrated that a select-service hotel is the highest and best use for the 3228
Prospect Street site. The subject development presents a unique investment opportunity for both the
landowner and a potential developer partner. Under the baseline assumptions in this proposal, the
development is projected to have an unleveraged IRR of 13.25% and a leveraged IRR of 17.74%. Despite
the current tough economic conditions and the scarce market for commercial real estate financing, the
project should be pursued, especially since partnership formation, planning, approvals, and permitting
could take more than a year to complete.

43
Bibliography
1 Fanning, Stephen F. (2005). Market Analysis for Real Estate: Concepts and Applications in Valuation and Highest
and Best Use. Chicago: Appraisal Institute. 2 Blake, Brooks. (2009). Class # 2 Lecture: Development Costs. PowerPoint document retrieved from JHU
Blackboard site for Real Estate Investments, Spring 2009. 3 Blake, Brooks. (2009). Class # 2 Lecture: Development Costs. PowerPoint document retrieved from JHU
Blackboard site for Real Estate Investments, Spring 2009. 4 “Washington, DC Office Market”. (2009). Korpacz Real Estate Investor Survey: Third Quarter 2009. (p. 41). Price
Waterhouse Coopers. 5 Income/Expense Analysis: Office Buildings. (2009). Institute of Real Estate Management. Retrieved from
www.irem.org. 6 The CoStar Office Report: Mid-Year 2009 Washington, D.C. Office Market. (2009). Bethesda: CoStar Group, Inc.
7 The CoStar Retail Report: Mid-Year 2009 Washington, D.C. Retail Market. (2009). Bethesda: CoStar Group, Inc.
8 Blake, Brooks. (2009). Class # 2 Lecture: Development Costs. PowerPoint document retrieved from JHU
Blackboard site for Real Estate Investments, Spring 2009. 9 Blake, Brooks. (2009). Class # 2 Lecture: Development Costs. PowerPoint document retrieved from JHU
Blackboard site for Real Estate Investments, Spring 2009. 10
Blake, Brooks. (2009). Class # 2 Lecture: Development Costs. PowerPoint document retrieved from JHU Blackboard site for Real Estate Investments, Spring 2009. 11
“National Apartment Market”. (2009). Korpacz Real Estate Investor Survey: Third Quarter 2009. (p. 44). Price Waterhouse Coopers. 12
Apartment Values and Cap Rates: A Tale of Two Quarters. (2009). Washington, DC: Apartment and Office Building Association. Retrieved from http://aoba-metro.org/uploads/newsletters/misc/Apartment%20Values%20 and%20Cap%20Rates-AOBA%20Special%20Edition%20May%202009.pdf. 13
Lee, Christopher. (2009). 2009 Survey of Operating Income and Expenses in Rental Apartment Properties. National Apartment Association. Retrieved from http://www.naahq.org/SiteCollectionDocuments/Industry%20 Resources/2009%20Income%20and%20Expenses%20Executive%20Summary.pdf 14
The CoStar Retail Report: Mid-Year 2009 Washington, D.C. Retail Market. (2009). Bethesda: CoStar Group, Inc. 15
“Glossary.” (2009). Smith Travel Research. Retrieved from http://www.strglobal.com/Resources/Glossary.aspx. 16
“Glossary.” (2009). Smith Travel Research. Retrieved from http://www.strglobal.com/Resources/Glossary.aspx. 17
Conversations with Mike Smith, construction estimator for John Moriarty and Associates of Virginia, who completed a 107-key Kimpton hotel in Alexandria in the Spring of 2009.

44
18
Blake, Brooks. (2009). Class # 2 Lecture: Development Costs. PowerPoint document retrieved from JHU Blackboard site for Real Estate Investments, Spring 2009. 19
Sahlins, Elaine. (2008). Hotel Development Cost Survey 2008. San Francisco: HVS. Retrieved from http://www.tourismroi.com/Content_Attachments/28470/File_633571556061538256.pdf. 20
Carlos, Rodolfo S. and Smith, Emily U. (2007). HVS U.S. Hotel Franchise Development Cost Guide. New York: HVS. Retrieved at http://www.hotelnewsresource.com/pdf/HVS_U.S._Hotel_Franchise_Development_ Cost_Guide.pdf 21
“National Full Service Lodging Segment”. (2009). Korpacz Real Estate Investor Survey: Third Quarter 2009. (p. 49). Price Waterhouse Coopers. 22
Trends in the Hotel Industry. (2008) Atlanta: PKF Hospitality Research. 23
“Washington, DC (CBD): January 2003 to August 2009”. (2009) Tennessee: Smith Travel Research. 24
Blake, Brooks. (2009). Class # 2 Lecture: Development Costs. PowerPoint document retrieved from JHU Blackboard site for Real Estate Investments, Spring 2009. 25
Blake, Brooks. (2009). Class # 2 Lecture: Development Costs. PowerPoint document retrieved from JHU Blackboard site for Real Estate Investments, Spring 2009. 26
Carlos, Rodolfo S. and Smith, Emily U. (2007). HVS U.S. Hotel Franchise Development Cost Guide. New York: HVS. Retrieved at http://www.hotelnewsresource.com/pdf/HVS_U.S._Hotel_Franchise_Development_ Cost_Guide.pdf 27
“Washington, DC (CBD): January 2003 to August 2009”. (2009) Tennessee: Smith Travel Research. 28
Conversations with Tom Galle, Vice President of Development with Marriott International, Inc., Jennifer Connell, Director of Development Asset Management at Marriott International, Inc. 29
District of Columbia Historic Preservation Guidelines: New Construction in Historic Districts. (2009). Washington, DC: Historic Preservation Office. Retrieved at http://planning.dc.gov/planning/frames.asp?doc=/planning/lib /planning/preservation/design_guides/dc_new_construction1.pdf 30
“Construction Cost Estimate for a Hotel (4 to 7 Story) in Washington, District of Columbia.” (2009) Reed Constrcution Data, Inc. Retrieved from http://www.reedconstructiondata.com/rsmeans/models/hotel/district-of-columbia/washington/STD/145510/. 31
Carlos, Rodolfo S. and Smith, Emily U. (2007). HVS U.S. Hotel Franchise Development Cost Guide. New York: HVS. Retrieved at http://www.hotelnewsresource.com/pdf/HVS_U.S._Hotel_Franchise_Development_ Cost_Guide.pdf 32
Conversations with Tom Galle, Vice President of Development with Marriott International, Inc. 33
Conversations with Tom Galle, Vice President of Development with Marriott International, Inc. 34
Conversations with Tom Galle, Vice President of Development with Marriott International, Inc., Jennifer Connell, Director of Development Asset Management at Marriott International, Inc., and Zachary Schwartz, Associate at Host Hotels and Resorts. 35
Conversations with Stephano Dubuc, Executive Vice President at Unipark, Inc.

45
36
Conversations with Tom Galle, Vice President of Development with Marriott International, Inc. 37
“National Full Service Lodging Segment” and “National Limited Service Lodging Segment”. (2009). Korpacz Real Estate Investor Survey: Third Quarter 2009. (p. 49). Price Waterhouse Coopers. 38
“National Full Service Lodging Segment” and “National Limited Service Lodging Segment”. (2009). Korpacz Real Estate Investor Survey: Third Quarter 2009. (p. 49). Price Waterhouse Coopers. 39
Mellen, Suzanne R. (2009). Hotel Capitalization Rates on the Rise. San Francisco: HVS. Retrieved at http://www.hvs.com/article/4081/hotel-capitalization-rates-on-the-rise/ 40
Conversations with Chris Hew, Commercial Real Estate Lender with GE Capital. 41
Conversations with Matt Nader, Construction Lender with Amalgamated Bank. 42
Mellen, Suzanne R. (2009). Hotel Capitalization Rates on the Rise. San Francisco: HVS. Retrieved at http://www.hvs.com/article/4081/hotel-capitalization-rates-on-the-rise/ 43
Conversations with Stephano Dubuc, Executive Vice President at Unipark, Inc. 44
Conversations with Stephano Dubuc, Executive Vice President at Unipark, Inc.