Embed Size (px)
Citation preview
Development Proposal
and
Environmental Management Plan
for the IMP Environmental Longford Anaerobic Digester Facility
August 2010
IMP Environmental 2/145 Flinders Lane Melbourne, VIC 3000 T +61 3 9018 2233 [email protected] www.impenvironmental.com.au

Table of Contents
Executive Summary 1
1 Introduction 3
1.1 Title 3
1.2 Proponent 3
1.3 Proposal Summary 3
1.4 Related proposals 4
1.5 Applicable environmental legislation, standards and guidelines and Government policies 4
1.6 Public Consultation 4
2 Proposal Description 5
2.1 Proposal Overview 5
2.2 Site Plan 10
2.3 General Location 10
2.4 Off-site Infrastructure 10
2.5 Technical and Management Alternatives 11
3 Existing Environment 12
3.1 Planning Aspects 12
3.2 Environmental Aspects 13
3.3 Socio-Economic Aspects 17
3.4 Alternative Sites 17
IMP Environmental - DPEMP

4 Potential Effects and Their Management 18
4.1 Air Emissions 18
4.2 Liquid Waste 25
4.3 Groundwater 26
4.4 Noise Emissions 27
4.5 Solid and Controlled Waste Management 28
4.6 Dangerous Goods 29
4.7 Biodiversity and Nature Conservation Values 30
4.8 Marine and Coastal 31
4.9 Greenhouse Gases and Ozone Depleting Substances 31
4.10 Heritage 32
4.11 Land Use and Development 32
4.12 Visual Effects 33
4.13 Socio-Economic Issues 33
4.14 Health and Safety Issues 35
4.15 Hazard Analysis and Risk Assessment 35
4.16 Fire Risk 36
4.17 Infrastructure and Off-Site Ancillary Facilities 36
4.18 Environmental Management Systems 37
4.19 Cumulative and Interactive Effects 38
5 Monitoring and Review 39
6 Decommissioning and Rehabilitation 40
Commitments 41
Conclusion 42
IMP Environmental - DPEMP

References 43
Drawing G02 Proposed Plant Layout 45
Drawing G03 Digester Facility Layout 47
Drawing G04 Fertiliser Batching Facility Layout 49
Appendix A Classification of Project 51
Appendix B DPEMP Project Specific Guidelines 54
Appendix C Assurance of Process Viability 58
Appendix D Title Information 61
Appendix E Ecological Assessment 64
Appendix F Air Dispersion Modelling Report 104
Appendix G Longford WWTP: EPN No. 7407/2 132
Appendix H Greenhouse Gas Calculations 159
Appendix I Visual Amenity Photos 161
Appendix J Risk Assessment 166
IMP Environmental - DPEMP

Executive Summary
Introduction
This DPEMP has been prepared by IMP Environmental (IMP) in support of their application for a permit to construct and
operate an anaerobic digester and fertiliser batching facility in Longford in Tasmania. The facility will process organic material,
which is otherwise disposed of as waste, to produce high quality biological soil conditioner and renewable energy.
Proposal Description
IMP propose to establish the facility at the Longford Waste Water Treatment Plant (WWTP). A ready source of organic
material is available from the Swift abattoir in Longford approximately 1km from the site. The proposed facility will treat the
organic material to produce three outputs - renewable energy in the form of biogas, as well as liquid and solid soil
conditioner. The renewable energy will be used onsite, while the liquid and solid digestate will be enhanced with agricultural
microbes and trace minerals to create biological soil conditioner; these products will be sold into the Tasmanian agricultural
sector and to wholesalers.
The facility will address a number of local environmental concerns, in particular the current problems with odours and the
diversion of organic material from the existing WWTP and disposal to landfill.
The facility is being designed to accommodate a throughput of 50 tons of material per day, however it will be initially
constructed to process 30 tons of material per day, which will produce 26,400 litres of liquid fertiliser, 1.5 tons of solid
fertiliser and 4,800m3 of biogas per day.
The proposed development includes (illustrated in Drawing G03) an anaerobic digestion facility comprising staff amenities, a
warehouse, three horizontal fermentation 240m3 tanks, two 50m3 tanks and one 600m3 tank; a fertiliser batching facility
comprising a large warehouse containing a series of tanks, amenities and office space; and paving for access and various
storage and operational areas.
The implementation of the facility will serve to benefit a number of stakeholders, including the abattoir and other producers of
organic material by decreasing their environmental disposal compliance and associated costs (increased viability); Ben
Lomond Water (Water Authority) by decreasing the load on the WWTP; the Northern Midlands Council by decreasing the
number of community complaints to be handled; Local residents by decreasing environmental nuisance factors (odour,
outfall); and lastly the local farmers by providing access to high quality agricultural products.
Existing Environment
From a planning perspective, the site is approximately 1km north-west of Longford, and is included on the Ben Lomond
Water WWTP, however the zoning classification is Rural Intensive. The Northern Midlands Planning Scheme 1995 does not
preclude the development based on the zoning overlay. The land surrounding the site and the WWTP is used for primary
production, the nearest property within a residential zone is approximately 1.3km south east of the WWTP.
From an environmental perspective, the topography of the area is characterised by gently undulating valleys, due to the
underlying geology being comprised of undifferentiated sediments and alluvial gravels, and accordingly the major
geomorphological feature of the area is the South Esk River. The soils in and around the site are characterized by a thin
topsoil with an extensive clay substrata. An ecological assessment of the site found an absence of threatened flora, fauna
and vegetation types from the proposed disturbance footprint. Groundwater in the area can be characterised as Category A
for Environmental Value and Use, while the predominant surface water bodies in the vicinity of the site are Back Creek, the
IMP Environmental - DPEMP
1

South Esk River and the Macquarie River. The site is not anticipated to be inundated by up to a flood event with an Annual
Exceedence Probability of 1:100, only 16 seismic events have occurred in an area within a 25km radius of the site since
1900, and the area surrounding the site is developed agricultural land, which while not precluding the risk of fire, mitigates
the possibility of severe bushfire affecting the site and immediate surrounds. One private reserve exists within 1km of the site,
a small conservation zone approximately 750m north west of the site, however no areas of high quality wilderness are
located within 25km of the site.
Socio-economically, Longford is a regional centre within the Northern Midlands Council Municipality. The land surrounding
Longford is considered to be rich pasture land, and agriculture is the main industry of the area, along with manufacturing.
The population of Longford as of 2006 was 4,265 people, with an average age of 40. The key stakeholders for the proposed
development play an important role in the socio-economic context of the Longford area. The WWTP has long had problems
managing the flow of organic material from the Swift abattoir in Longford, resulting in environmental impacts relating to air
and water emissions. A number of measures have been implemented to manage these issues, to varying degrees of
success. Underpinning this history is the importance the abattoir plays in terms of the local economy – it is the largest
employer in the Longford area, plays a key role in the meat industry in northern Tasmania in terms of farmers and
consumers, and provides many secondary economic benefits to the town and immediate area. If the proposed development
is successful, all stakeholders will benefit.
At the project feasibility stage, IMP met with representatives from the NMC to discuss the project. Council was strongly
encouraging and recommended the site location. IMP approached BLW who were equally encouraging and subsequently
made arrangements for the leasehold. No other sites were considered more appropriate.
Potential Effects and Their Management
Assessments have been made of the potential for the construction and operation of the proposed facility to effect many
aspects of the environment. Where a potential effect is identified and evaluated as having a potentially negative impact,
mitigation measures have been tabled. Potential effects identified during the construction phase will in the main be
addressed in a Construction Environmental Management Plan. Some of the potential effects identified for the operational
phase, and subsequent mitigation measures proposed include generation of odour emissions in the crushing process, which
will be mitigated by the design and construction of a biofilter to treat the air in the crusher void; the potential loss of liquid
material in the event of failure of process equipment has been mitigated by the design of bunding around the site to contain
spills and leaks; new noise sources have been housed inside facilities to mitigate potential effects; small volumes of inorganic
waste will be generated when it is removed from the organic material, this waste will be contained and disposed of to an
approved facility.
Monitoring and Review
On-going monitoring of the efficacy of mitigation measures and potential impacts of the facility is required to determine if the
project is meeting obligations stated in the DPEMP, and subsequent permit conditions. The key aspects requiring monitoring
will be noise and odour emissions.
Decommissioning and Rehabilitation
There is no plan for the decommissioning of the proposed facility in the foreseeable future. In the event that the facility
becomes redundant a decommissioning and rehabilitation plan will be produced.
IMP Environmental - DPEMP
2

1 Introduction
1.1 TitleIMP Environmental - Anaerobic Digestion and Fertiliser Batching Facility
1.2 ProponentThe proponent of the proposed development is IMP Environmental.
IMP Environmental (ABN: 36 073 892 636)
Level 2, 145 Flinders Lane
Melbourne
VIC 3000
The contact for this project is:
Ned Halliday
Phone: +61 409 102 399
Email: [email protected]
1.3 Proposal SummaryIMP Environmental (IMP) propose to establish an anaerobic digestion and fertiliser batching facility at the Longford Waste
Water Treatment Plant (WWTP), 2080 Bishopsbourne Rd, Longford, Tasmania.
The key objective of the proposed facility is to process high volumes of organic material from local sources in Longford. The
proposed facility will process the organic material to produce three outputs - renewable energy in the form of biogas, as well
as liquid and solid soil conditioner. The renewable energy will be used onsite, while the liquid and solid digestate will be
enhanced with agricultural microbes and trace minerals to create biological soil conditioner; these products will be sold into
the Tasmanian agricultural sector and to wholesalers.
The facility will address a number of local environmental concerns, in particular the current problems with odours and the
diversion of organic material from the existing WWTP and disposal to landfill.
The facility is estimated to cost approximately $7.5 million to construct.
The facility has been designed to accommodate a total throughput of 50 tons of material per day, however initial
construction of process equipment will be to accommodate 30 tons of material per day. When the capacity upgrade
eventuates, IMP are confident of satisfying the environmental commitments made in this application and expected permit
conditions.
IMP Environmental - DPEMP
3

1.4 Related proposalsTo IMP’s knowledge, no related developments are proposed in the region.
1.5 Applicable environmental legislation, standards and guidelines and
Government policiesThis proposal was referred to the Environmental Protection Agency (EPA) Board in the form of a Notice of Intent (NOI) in
November 2009. The Director of Environmental Management responded to the NOI declaring the proposal to be a Level 2
activity under the Environmental Management and Pollution Control Act 1994 (EMPCA) (see Appendix A).
As a Level 2 activity the proposal requires approval from the EPA Board. Approval is also required from Northern Midlands
Council under the Land Use Planning and Approvals Act 1993 (LUPAA). These two tiers of assessment are undertaken
concurrently and relate to different aspects of the project. The Board assessment is in accordance with the land use
planning considerations under the Northern Midlands Planning Scheme 1995. Council is not required to assess any matter
already addressed in the Board’s assessment.
No matters of National Environmental Significance have been identified as relevant to this project and hence a Referral under
the Commonwealth’s Environment Protection and Biodiversity Conservation Act 1999 (EPBCA) is not considered to be
required.
In addition to the standard approval process, the proposed development will also have to comply with a broad range of
environmental and planning legislation, guidelines, standards and policies. The details of such documents are outlined
through the relevant sections of this DPEMP. The Project Specific Guidelines (PSGs) issued for this DPEMP are included in
Appendix B.
1.6 Public ConsultationComprehensive public consultation is planned during the project implementation, specifically relating to the adjacent
landholders. An information pack explaining the project will be sent to adjacent landholders and property owners along the
section of Bishopsbourne Rd from the plant entrance to Illawarra Rd. This information will also serve as an invitation to a
meeting at the Northern Midlands Council chambers or another suitable venue, where representatives of IMP will be
available to answer questions and explain specific aspects of the project. A public notice will be listed in the local paper
summarizing the proposed project.
A project launch involving key stakeholders is planned for the second half of 2010, therefore these public consultation
activities will be timed to coincide with this launch date. [Commitment 1]
IMP Environmental - DPEMP
4

2 Proposal Description
2.1 Proposal Overview
2.1.1 GeneralThis DPEMP addresses IMP’s intention to construct and operate an anaerobic digestion and fertiliser batching facility at the
Longford WWTP.
The proposed works consist of an anaerobic digester plant capable of treating 30 tons per day of organic material, a fertiliser
batching facility, and various infrastructure to support the enterprise, namely tanks and warehouses.
The purpose of the plant is to treat organic material that is otherwise disposed of in an unsatisfactory manner, thereby
dealing with issues such as odour emissions, effluent outfall into the local river and impact to associated ecosystems, and
long term landfill issues such as leachate generation and methane emissions. The facility will produce renewable energy in
the form of biogas, and liquid and solid soil conditioner which will be sold as commercial products.
2.1.2 Major Equipment and Facilities
Figure 1 Major Process Equipment
Crushing AcidicDigestion
Anaerobic DigestionAerobic Digestion Storage (Gas
& Liquid)
Filtration Inoculation
Fermentation
Storage (Fertiliser)
Input Storage
IMP Environmental - DPEMP
5

2.1.3 ProcessThe anaerobic digestion equipment and expertise will be provided by Dongmun, a company with a long history in organic
material processing. A letter addressing the viability of the proposed process, noted as a key issue in the PSGs, is included
in Appendix C.
Table 1 Mass Balance - Process Flow
Process
Equipment
Description Drawing
Reference
Time Temperature Material
Quantity
(Daily)
Input Storage
Organic material is pumped into the 50m3
enclosed input storage tank storage tank from
delivery truck. A proprietary screw-type mass
separator system uses the principle of inorganic
material being heavier than organic material to
remove the inorganics. Small amounts of
inorganic waste are generated and managed.
Drawing G03
P1
30 tons
organic
material
CrushingOrganic material is crushed to uniform size to
increase surface area.
Drawing G03
P2
Bio-scrubber
Wet scrubber type filter captures air emissions
from crusher. Water used is re-circulated to
digestion process.
Drawing G03
P3
AcidicDigestion
Two 50m3 tanks where material undergoes early
stages of digestion in naturally occurring acidic
conditions which reduces the pH of the
material. Inorganic removal is also undertaken
as per the input storage tank.
Drawing G03
P4, P5
2 to 4
days30 to 45°C
Anaerobic Digestion
Three horizontal plug flow modular units of
240m3. Each unit has a screw auger running its
length to move material through the digester.
The digestion process begins with bacterial
hydrolysis of the input materials in order to
break down insoluble organic polymers such as
carbohydrates and make them available for
other bacteria. Acidogenic bacteria then convert
the sugars and amino acids into carbon dioxide,
hydrogen, ammonia, and organic acids. Ace-
togenic bacteria then convert these resulting
organic acids into acetic acid, along with addi-
tional ammonia, hydrogen, and carbon dioxide.
Methanogens finally are able to convert these
products to methane and carbon dioxide.
Drawing G03
P6, P7, P8
20 to 25
days45 to 55°C
IMP Environmental - DPEMP
6

Process
Equipment
Description Drawing
Reference
Time Temperature Material
Quantity
(Daily)
Storage (Gas & Liquid)
600m3 tank holding digestate, with void in cone
headspace for biogas, piping work to extract
biogas and piping work to feed digestate into
aerobic digester. Generation of biogas contin-
ues during this storage.
Drawing G03
P9
4,800m3
biogas
Biogas Engines
Biogas powered generators to produce
electricity and heat. Biogas is piped off from the
gas buffer to the biogas engine generator room.
It is anticipated that when the facility operates at
maximum throughput, 6000 kWh of power will
be generated per day. The biogas engines
represent significant cogeneration opportunities,
as elements of the facility require direct heating.
Drawing G03
P10Up to 180°C
6000 kWh
electricity
Aerobic Digestion
High pressure, high temperature, fully enclosed
unit. Digestate and compressed air undergoes
aerobic digestion and odourous gas is recircu-
lated to accelerate process. This is the “de-
odourising” aspect of the plant, serving to re-
move pathogens and odour from the digestate.
Drawing G03
P11
2 to 5
days60 to 70°C
Filtration
Proprietary system for separation of solid
digestate from liquid digestate comprising
organic coagulant dosing / mixing / settling /
filter media / tanks. The solid digestate is
produced at 1.5 tons per day.
Drawing G03
P12
24,000 litres
liquid
digestate
1.5 tons solid
digestate
Fermentation
The fertiliser batching facility brews agricultural
microbes for the inoculation of the liquid
digestate. The mother culture is brewed with a
molasses nutrient source in 10m3 tanks.
Drawing G04
P13 - P1835 to 40°C
Inoculation
The filtered liquid is pumped to the fertiliser
facility at a rate of 1000 litres per hour (24,000
L/day). The digestate is inoculated with the
brewed mother culture and trace minerals at a
ratio of 1:10. This mix is retained in 25m3 tanks.
Drawing G04
P19 - P26
7 to 10
days
+ 2,400 litres
microbes &
trace minerals
= 26,400 litres
liquid fertiliser
Storage (Fertiliser)
The biological soil conditioner is held in a 50m3
storage tank for filling of tankers and 1000 litre
Intermediate Bulk Containers (IBCs).
Drawing G04
P27
IMP Environmental - DPEMP
7

2.1.4 Raw MaterialsThe input for the facility is 30 tons of organic material per day sourced from local producers. The bulk of the material is likely
to be supplied by the Swift abattoir in Longford being comprised of approximately 12 tons of sludge and 17 tons of paunch
per day.
2.1.5 Energy RequirementsThe facility has a number of energy requirements, energy sources and cogeneration opportunities. General power
requirements include pump operation, lighting and process equipment.
In terms of heating requirements, the fertiliser facility requires a constant temperature of 37°C for the fermentation of
agricultural microbes mixed with the digestate. The digester facility has two pieces of process equipment requiring heating,
the acidic tanks (30 to 45°C) and the digesters themselves (45 to 55°C). The digester facility has two heat producing pieces
of process equipment, the aerobic digester (60 to 70°C) and the biogas engine producing upwards of 180°C in waste heat.
The intent is for the site to become self sufficient for energy; this will depend on the efficiencies of cogeneration design and
the energy potential of the organic material feedstock.
2.1.6 Waste SourcesThe key source of waste identified is inorganic material separated from the feedstock before and after the crusher. The
amount of this waste generated is contingent on the nature of the organic material supplied. It is anticipated that the material
emanating from the abattoir would have only minor amounts of inorganic material such as sand from animal hooves or
fragments from animal coats. These solid inorganic wastes separated from the feedstock will be immediately transferred to
sealed storage vessels, located within bunded areas, to minimise odour emissions and prevent and liquid emissions. If
necessary, the bins could be maintained under a slight negative pressure and air (with potential odour contamination)
transferred to the bio-scrubber. It is anticipated that the accumulation of solid waste will be relatively small, with transfer to
off-site disposal likely to occur at an approximate weekly frequency.
2.1.7 Waste TreatmentThe inorganic waste will be disposed of to a licensed disposal facility in accordance with local regulations.
2.1.8 Wastewater Discharge PointsWastewater discharge is limited to domestic sewer for staff amenities.
2.1.9 Atmospheric Discharge PointsBiogas engines installed inside the digester plant warehouse structure, in a generator room, with an emission stack design of
20m height. Minor emissions to atmosphere are anticipated from biogas engine exhaust. Atmospheric discharge modeling
has undertaken according to the relevant Tasmanian EPA guidelines.
Potential odour emissions from the crusher will be managed with a positive displacement air pump and a bio-scrubber.
2.1.10 Noise SourcesThe proposed facility will be low noise, given the nature of the key elements of the process relying on biological processes as
opposed to mechanical processes. The biogas engines will generate noise, however the generator room will be constructed
with noise dampening baffling. Other noise sources are limited to pump operation and general operational works.
IMP Environmental - DPEMP
8

2.1.11 Production CapacityThe proposed facility will have a processing design capacity of 30 tons of organic material per day, which is estimated to
generate 26,400 litres of liquid fertiliser, 1.5 tons of solid fertiliser and 4,800m3 of biogas per day.
Table 2 Production Capacity
Production Daily Capacity Annual Capacity
Processing of organic material 30 tons 10,800 tons
Liquid fertiliser production 26,400 litres 9,504,000 litres
Solid fertiliser production 1.5 tons 540 tons
Biogas production 4,800m3 1,728,000m3
2.1.12 Hours of OperationThe proposed facility will operate on a continuous basis, 24 hours a day, 7 days per week. The main activities such as
delivery of organic material and despatch of fertiliser will be limited to regular work hours, 7am to 6pm Monday to Friday.
[Commitment 2].
2.1.13 Vehicle MovementsIt is anticipated that truck movements will be between 3 to 5 10-ton trucks per day, both inward and outward. Truck
movements would likely be limited to weekdays, during the hours of 7am to 5pm.
2.1.14 ConstructionSite works to include ground preparation, foundation construction, assembly of plant and construction of infrastructure,
paving and finishing.
The main elements of the anaerobic digestion facility are pre-fabricated in Korea at the Dongmun facility. These will be
shipped to the site and will only require assembly.
Construction works will include the following:
• Minor vegetation clearing
• Site grading / ground preparation
• Foundation construction
• Establishment of hard stand and paving of designated areas with bunding
• Installation of site drainage network including stormwater management and sumps
• Establishment of roadway
• Installation / Construction of tanks for fertiliser facility
• Construction of warehouses
• Installation of anaerobic digestion plant
2.1.15 CommissioningExpected period of 1 to 3 months of trialing the plant operation will be undertaken by Dongmun and IMP. Commissioning will
involve bringing the anaerobic digesters online one at a time, with a capacity of 10 tons per day each.
IMP Environmental - DPEMP
9

2.2 Site PlanSite plan attached as Drawing G02.
2.3 General LocationThe WWTP is located at 2080 Bishopsbourne Road, west of Longford.
Figure 2 General Location Plan
2.4 Off-site InfrastructureThe proposed development is not expected to require any upgrade of offsite features such as roads, power supply, water
supply, sewer or stormwater.
IMP Environmental - DPEMP
10

2.5 Technical and Management AlternativesThe dynamic nature of the generation, disposal and treatment of organic material in and around Longford when set against
the socio-economic aspects of the region have combined to create a pressing environmental issue, based on odour
problems and downstream disposal of liquid waste.
The implementation of an anaerobic digestion facility is perhaps the only solution that serves to benefit all stakeholders, as
follows:
• Abattoir and other producers of organic material – decreased environmental disposal compliance, costs
(increased viability)
• BLW Water Authority – decreased load on WWTP
• NMC – decreased handling of complaints
• Local residents – decreased environmental nuisance factors (odour, outfall)
• Local farmers – access to high quality agricultural products
The high temperature of the digestion process (55°C in the anaerobic digesters, 70°C in the aerobic digester) eliminates
pathogens.
IMP Environmental - DPEMP
11

3 Existing Environment
3.1 Planning Aspects
3.1.1 Location and Associated InfrastructureThe location of the site is provided in Section 2.3. The key elements from a planning perspective include:
• The site is approximately 1km north-west of Longford
• The site is included on the BLW WWTP, however the zoning classification is Rural Intensive
• Proposed infrastructure includes (illustrated in Drawing G03):
- An anaerobic digestion facility comprising staff amenities, a warehouse, three horizontal fermentation
240m3 tanks, two 50m3 tanks and one 600m3 tank
- A fertiliser batching facility comprising a large warehouse containing a series of tanks, amenities and
office space
- Paving for access and various storage and operational areas
3.1.2 Land Tenure and Title DetailsThe WWTP at 2080 Bishopsbourne Rd is owned and operated by BLW. The specific project site is leased by IMP from BLW.
The specific site area is formally contained in the following title:
Certificate of Title (CT) Volume (Vol.) 132421 Folio (Fol.) 1.
This title is provided in Appendix D.
3.1.3 Planning ControlsThe site is subject to the provisions of the Northern Midlands Planning Scheme 1995, both general and specific, and in
particular Part 9 ‘Rural Zone Provisions’.
3.1.4 Rights of wayThere are no rights of way on the title.
3.1.5 Land use and planning historyThe specific landholding has been part of the WWTP since the plant was constructed. Anecdotal evidence exists of the site
being utilised for spreading and drying of sludge when desludging lagoons.
3.1.6 Adjacent land useThe land surrounding the site and the WWTP is used for primary production, predominantly grazing and cropping on land
classified as being within the Rural Agricultural Zone, on comparatively large landholdings. The nearest property within a
residential zone is approximately 1.3km south east of the WWTP.
IMP Environmental - DPEMP
12

3.2 Environmental Aspects
3.2.1 General Physical Characteristics
Figure 3 Plan showing GW bores, conservation areas, Back Creek, flood mapping
The site is located on Bishopsbourne Rd 1km west of the Longford township. The land in this region is predominantly
agricultural, serviced by the Longford-Cressy irrigation system.
Topography
The general topography of the area in which the site is located falls towards Back Creek east of the site at a gradient of
approximately 0.01. More broadly the area is comprised of gently undulating valleys resulting from outcrops of older
volcanics and deposition of alluvial gravel, sands and till.
Geology
The underlying geology is comprised of undifferentiated Cainozoic and Quaternary sediments, and Tertiary alluvial gravels,
with poorly consolidated clays, sands and silts of the Launceston Tertiary Basin.
Geomorphology
The South Esk River is the major feature of the area, with the main geomorphic features of the area being fluvial in nature.
The South Esk River above Perth has a catchment of approximately 3,350km2 while the Macquarie River drains an additional
3,800 km to the south of Longford.
IMP Environmental - DPEMP
13

Soils
The soils in and around the site are characterized by a thin topsoil with an extensive clay substrata. The site has been
mapped as comprising the Brickendon soil type – “Deeply weathered brown textured contrast soils with a sandy topsoil
containing water worn quartz gravels overlying a clayey subsoil, found between the Brumby and Woodstock surfaces of the
Launceston Basin.“1
Fauna and Flora
Impact to flora and fauna was identified as a key issue in the PSGs. Accordingly, an ecological assessment of flora and fauna
at the site was undertaken on 12th February 2010 by ECOtas (Appendix E). The assessment found that the absence of
threatened flora, fauna and vegetation types from the proposed disturbance footprint means that permits and specific
approvals relating to these natural values would not be required. The findings are summarized in Section 4.7.
Groundwater
The Mineral Resources Tasmania lists 5 registered groundwater bores within 1km of the site (Figure 3), details of which are
provided below in Table 3.
Table 3 Groundwater Bore Details
Bore ID Depth Standing
Water Level
Depth Water
Struck
Yield Total
Dissolved
Solids
3777 152.4 m 2 m (30/09/68) N/A N/A 341 mg/L
3840 29.9 m N/A 27.4 m 0.38 L/s 545 mg/L
3939 21.3 m N/A 17.1 m 0.07 L/s 480 mg/L
3779 26.0 m N/A 23.8 m 0.32 L/s 900 mg/L
3778 25.9 m N/A 24.4 m 0.25 L/s N/A
Surface Water
The predominant water bodies in the vicinity of the site are Back Creek, the South Esk River and the Macquarie River. Back
Creek starts below West Base at an elevation of 162m and ends at an elevation of 132m flowing 18.7km into the South Esk
River. The South Esk River starts near Mathinna Plains at an elevation of 810m and ends near Trevallyn dropping
approximately 811m over its 255km length, featuring 37 creeks and rivers flowing into it. The Macquarie River starts below
Hobgoblin at an elevation of 606m and drops approximately 472m over its 189km length, ultimately merging with the South
Esk River.
IMP Environmental - DPEMP
1 Brickendon SPC
14

Climate Data
The following is a summary of data from the Cressy Research Station (Main Office) of the Bureau of Meteorology.
Table 4 Climate Data
Climate Parameter Climate Average
Mean Maximum Temperature 23.6°C (January & February)
Annual Mean Maximum Temperature 17.2°C
Mean Minimum Temperature 0.9°C (July)
Annual Mean Minimum Temperature 5.1°C
Mean Annual Rainfall 627mm
Mean Monthly Rainfall 52.5mm
Figure 4 Climate Data
3.2.2 Natural Processes and Hazards
Flooding
The Macquarie River flows into the South Esk River at Longford. Longford is within the upper part of the large flood plain
known as the Hadspen Retarding Basin and when river levels are high water backs up considerably into the Macquarie River
as well as spreading out down stream at Longford. As illustrated in Figure 3, the confluence of these water bodies makes the
Longford area susceptible to flood events. Figure 3 also illustrates that the site is not anticipated to be inundated by up to a
flood event with an Annual Exceedence Probability of 1:100.
0
7.5
15.0
22.5
30.0
January April July October
0
17.5
35.0
52.5
70.0
Tempe
rature (°C)
Rainfall (m
m)
Mean Maximum Temperature Mean Minimum Temperature Mean Rainfall
IMP Environmental - DPEMP
15

Seismic
An output from the Geoscience Australia Database indicates 16 seismic events have occurred in an area within a 25km
radius of the site since 1900, the maximum magnitude event measured 2.7 on the Richter scale, in September 1977 (Figure
5).
Figure 5 Seismic Events Within 25km of Site Since 1900
Fire
The area surrounding the site is developed agricultural land, which while not precluding the risk of fire, mitigates the
possibility of severe bushfire affecting the site and immediate surrounds.
3.2.3 Conservation Reserves and Areas of Special Conservation SignificanceOne private reserve within 1km of the site, a small conservation zone (Reserve ID 10031) approximately 750m north west of
the site, on the opposite side of Bishopsbourne Road. It is not expected that this reserve will be impacted by the proposed
development (Figure 3). A Natural Values Atlas Report is included with the ecological assessment in Appendix E
3.2.4 High Quality Wilderness Areas No areas of high quality wilderness are located within 25km of the site.
IMP Environmental - DPEMP
16

3.3 Socio-Economic AspectsLongford is a regional centre within the NMC Municipality which was first settled by Europeans in 1808. The land
surrounding Longford is considered to be rich pasture land, and agriculture is the main industry of the area, along with
manufacturing. Other key industries include retail, healthcare and social assistance. The population of Longford as of 2006
was 4,265 people, with an average age of 40.
The key stakeholders for the proposed development play an important role in the socio-economic context of the Longford
area. The WWTP has long had problems managing the flow of organic material from the Swift abattoir in Longford, resulting
in environmental impacts relating to air and water emissions. A number of measures have been implemented to manage
these issues, to varying degrees of success. Underpinning this history is the importance the abattoir plays in terms of the
local economy – it is the largest employer in the Longford area, plays a key role in the meat industry in northern Tasmania in
terms of farmers and consumers, and provides many secondary economic benefits to the town and immediate area. If the
proposed development is successful, all stakeholders will benefit.
3.4 Alternative SitesAt the project feasibility stage, IMP met with representatives from the NMC to discuss the project. Council was strongly
encouraging and recommended the site location. IMP approached BLW who were equally encouraging and subsequently
made arrangements for the leasehold.
IMP Environmental - DPEMP
17

4 Potential Effects and Their Management
4.1 Air Emissions
4.1.1 Existing ConditionsThe air quality at the site is greatly impacted by the WWTP operations, in particular the aerators operating in Lagoon 2.
Anecdotal evidence gathered through communication with stakeholders suggests that the air quality in the Longford area is
greatly impacted by the WWTP.
4.1.2 Performance RequirementsThe facility is to operate in a manner in which the environmental values tabled in 4.1.1 are protected or improved, by
identifying and mitigating fugitive odour emissions. Schedule 2 (Design Criteria) and Schedule 3 (Odour Criteria) from the
Tasmanian Environment Protection Policy (Air Quality) 2004 detail the maximum concentrations of specific pollutants.
The environmental values to be protected under the Tasmanian Environment Protection Policy (Air Quality) 2004 are:
• the life, health and well-being of humans
• the life, health and well-being of other forms of life
• visual amenity
• the useful life and aesthetic appearance of buildings, property and materials.
IMP Environmental - DPEMP
18

4.1.3 Potential EffectsThe facility is a sealed, closed loop process. The delivery of organic material will be in enclosed trucks certified for the
movement of organic material. The local producers will be required to adhere to the relevant storage and transport
requirements.
Table 5 Assessment of Potential Odour Sources
Potential Odour
Source
Assessment Mitigation
Key Process
Equipment Odour
Generation Potential:Input Storage Tank (P1) Closed vessel – release of odourous
emissions prevented by sealing of tank
outlets.
Depending on interface design between delivery vehicle
and tank, contingency planning to accommodate
venting displaced air to bio-scrubber (P3).
In case of failure, contingency planning to maintain
atmospheric pressure by venting of gases to bio-
scrubber.Crusher (P2) Potential source of odour emissions
during the loading sequence and
crushing phase, most likely emanating
from volatile organics and inorganics
such as ammonia.
Crusher is located inside the digester plant warehouse
structure, fitted with a positive displacement pump to
draw clean air into the void space, while the potentially
odourous air is forced through the bio-scrubber (P3).
Acidic digestion tanks
(P4 & P5)
Closed pressure vessels – release of
odourous emissions prevented as tank
outlets do not release to atmosphere.
In the event of process failure, maintenance or other,
design provision made for ventilation of potentially
odourous air downstream to fermentation tanks or to
bio-scrubber.
Fermenters (P6-P8) Closed pressure vessels – release of
odourous emissions prevented as tank
outlets do not release to atmosphere.
In the event of process failure, maintenance or other,
design provision be made for ventilation of potentially
odourous air to flare. bio-scrubber. Lower explosion limit
(LEL) of methane at 20 oC is 5.1%. Suggest that
fermenter and storage tank emergency venting be sent
to a flare.Storage Tank (P9) Closed pressure vessels – release of
odourous emissions prevented as tank
outlets do not release to atmosphere.
In the event of process failure, maintenance or other,
design provision made for combustion of bio-gas via a
flare.
Generation System
(P10)
Exhaust from generation system
considered in Ausplume Model
(Appendix F).
Design of exhaust stack based on Ausplume model
outputs. Stand-by flare for combustion of biogas if
engine unavailable. Aerobic Digester (P11) Closed pressure vessels– release of
odourous emissions prevented as tank
outlets do not release to atmosphere.
Aerobic digestion acts as a deodourising
phase of the process. Presence of
oxygen in a mixed environment prevents
creation of biogas.
In the event of process failure, maintenance or other,
design provision be made for ventilation of potentially
odourous air to bio-scrubber.
IMP Environmental - DPEMP
19

Potential Odour
Source
Assessment Mitigation
Filter (P12) Process liquid stripped of offensive
Odours in P11.
None
Fermentation Tanks
(P13-P18)
Process includes degassing period,
vented through an “S” bend. Airlock for
over-pressure regulation producing a
very slight sweet molasses Odour.
None
Inoculation Tanks (P19-
P26)
Process liquid stripped of offensive
Odours in P11.
None
Storage Tank (P27) Process liquid stripped of offensive
Odours in P11.
None
Process liquid
transfer pointsA. Feedstock to final
product:Delivery Tanker into
Input Tank (P1)
Potential for odourous air to be
generated during transfer of feedstock
into tank.
Depending on interface design between delivery vehicle
and tank, contingency planning to accommodate
venting displaced air to bio-scrubber (P3).
Input Tank (P1) to
Crusher (P2)
Closed piping system – sealed pressure
rated piping prevents emissions to
atmosphere.
In the event of process failure, maintenance or other,
design provision be made for ventilation of potentially
odourous air to bio-scrubber via tank downstream of
piping.
Crusher (P2) to Acid
Tanks (P4 & P5)
Closed piping system – sealed pressure
rated piping prevents emissions to
atmosphere.
In the event of process failure, maintenance or other,
design provision be made for ventilation of potentially
odourous air to bio-scrubber via tank downstream of
piping.
Acid Tanks (P4 & P5) to
Fermenters (P6-P8)
Closed piping system – sealed pressure
rated piping prevents emissions to
atmosphere.
In the event of process failure, maintenance or other,
design provision be made for ventilation of potentially
odourous air to bio-scrubber via tank downstream of
piping.
Fermenters (P6-P8) to
Storage Tank (P9)
Closed piping system – sealed pressure
rated piping prevents emissions to
atmosphere.
In the event of process failure, maintenance or other,
design provision be made for ventilation of potentially
odourous air to bio-scrubber via tank downstream of
piping.
Storage Tank (P9) to
Aerobic Digester (P11)
Closed piping system – sealed pressure
rated piping prevents emissions to
atmosphere.
In the event of process failure, maintenance or other,
design provision be made for ventilation of potentially
odourous air to bio-scrubber or flare (if methane
present).
Aerobic Digester (P11)
to Filter (P12)
Process liquid stripped of offensive
odours in P11.
In the event of process failure, maintenance or other,
design provision be made for ventilation of potentially
odourous air to bio-scrubber.
IMP Environmental - DPEMP
20

Potential Odour
Source
Assessment Mitigation
Filter (P12) to
Inoculation (P19-P26)
Process liquid stripped of offensive
odours in P11.
In the event of process failure, maintenance or other,
design provision be made for ventilation of potentially
odourous air to bio-scrubber.
Inoculation (P19-P26)
to Storage (P27)
Process liquid stripped of offensive
odours in P11.
In the event of process failure, maintenance or other,
design provision be made for ventilation of potentially
odourous air to bio-scrubber.
Storage (P27) into IBCs
or Tanker
Process liquid stripped of offensive
odours in P11.
In the event of process failure, maintenance or other,
design provision be made for ventilation of potentially
odourous air to bio-scrubber.
B. Additional Process
Liquid Inputs:Molasses delivery and
movement into mixing
tank
Potential for production of a very slight
sweet molasses odour.
None
Movement of soil
conditioner additives
(molasses, fulvic acid,
Aqualan Q, agricultural
microbes, yeast) from
mixing tank into
Fermentation Tanks
(P13-P18)
Process liquid does not contain offensive
odours.
None
Fermentation Tanks
(P13-P18) to
Inoculation (P19-P26)
Process liquid does not contain offensive
odours.
None.
Biogas management:
Biogas generation in
Fermenters (P6-P8)
Closed pressure vessels– release of
odourous emissions prevented as tank
outlets do not release to atmosphere.
Design to relevant Australian Standards
Transfer of biogas and
liquid from Fermenters
(P6-P8) to Storage (P9)
Closed pressure vessels– release of
odourous emissions prevented as tank
outlets do not release to atmosphere.
Design to relevant Australian Standards
Transfer of biogas from
Storage (P9) to Gas
Buffer in Generation
System (P10)
Closed pressure vessels– release of
odourous emissions prevented as tank
outlets do not release to atmosphere.
Design to relevant Australian Standards
IMP Environmental - DPEMP
21
Potential Odour
Source
Assessment Mitigation
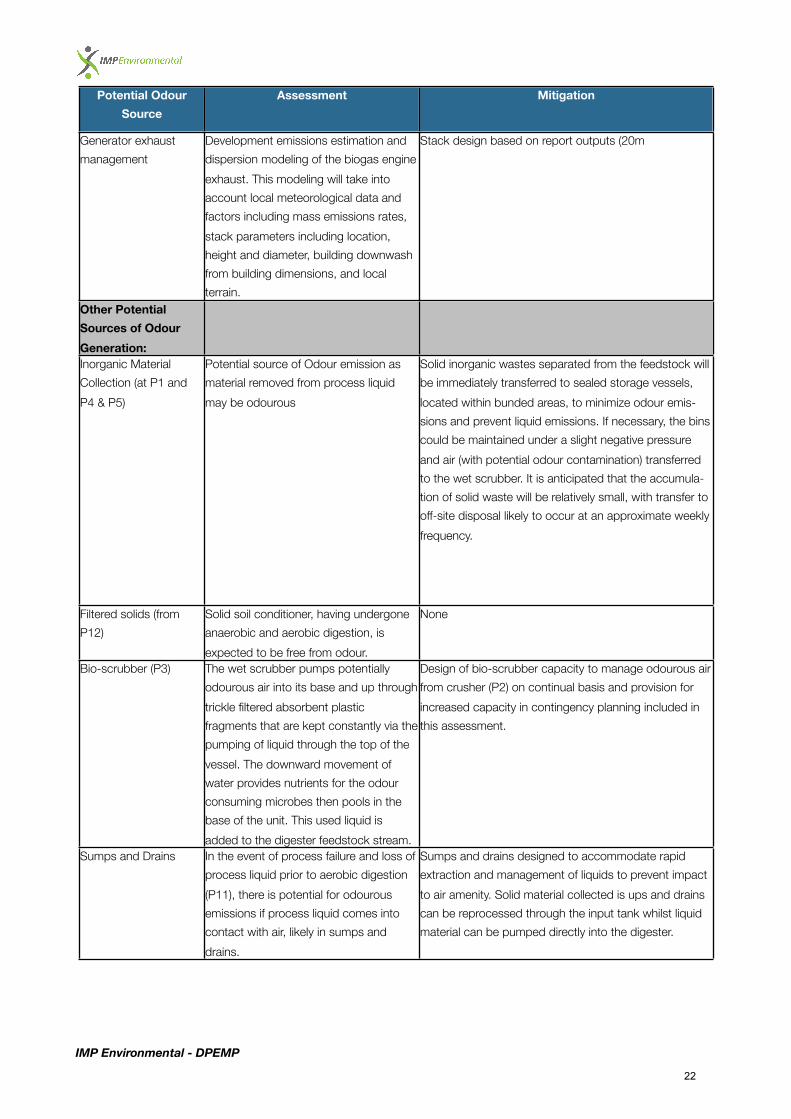
Generator exhaust
management
Development emissions estimation and
dispersion modeling of the biogas engine
exhaust. This modeling will take into
account local meteorological data and
factors including mass emissions rates,
stack parameters including location,
height and diameter, building downwash
from building dimensions, and local
terrain.
Stack design based on report outputs (20m
Other Potential
Sources of Odour
Generation:Inorganic Material
Collection (at P1 and
P4 & P5)
Potential source of Odour emission as
material removed from process liquid
may be odourous
Solid inorganic wastes separated from the feedstock will
be immediately transferred to sealed storage vessels,
located within bunded areas, to minimize odour emis-
sions and prevent liquid emissions. If necessary, the bins
could be maintained under a slight negative pressure
and air (with potential odour contamination) transferred
to the wet scrubber. It is anticipated that the accumula-
tion of solid waste will be relatively small, with transfer to
off-site disposal likely to occur at an approximate weekly
frequency.
Filtered solids (from
P12)
Solid soil conditioner, having undergone
anaerobic and aerobic digestion, is
expected to be free from odour.
None
Bio-scrubber (P3) The wet scrubber pumps potentially
odourous air into its base and up through
trickle filtered absorbent plastic
fragments that are kept constantly via the
pumping of liquid through the top of the
vessel. The downward movement of
water provides nutrients for the odour
consuming microbes then pools in the
base of the unit. This used liquid is
added to the digester feedstock stream.
Design of bio-scrubber capacity to manage odourous air
from crusher (P2) on continual basis and provision for
increased capacity in contingency planning included in
this assessment.
Sumps and Drains In the event of process failure and loss of
process liquid prior to aerobic digestion
(P11), there is potential for odourous
emissions if process liquid comes into
contact with air, likely in sumps and
drains.
Sumps and drains designed to accommodate rapid
extraction and management of liquids to prevent impact
to air amenity. Solid material collected is ups and drains
can be reprocessed through the input tank whilst liquid
material can be pumped directly into the digester.
IMP Environmental - DPEMP
22

Potential Odour
Source
Assessment Mitigation
H2S scrubber Closed pressure vessels– release of
odourous emissions prevented as tank
outlets do not release to atmosphere.
Depending on the final configuration of
the generator system (P10), a H2S
scrubber may be required to treat the
biogas prior to combustion in order to
reduce the H2S concentration to 400
ppm.
H2S scrubbers are comprised of a caustic buffer tank, a
biogas blower, the desulferizer vessel, buffer pump and
electronic control cabinet. Often two desulferizer vessels
are used to provide a redundant system when the other
is being maintained or inoperable, or can be used in
parallel if required. The buffer is replace every 2000
hours of operation. A scrubber operating as designed
should have minimal odour, however in the event of
release of odours through seals, opening for
maintenance, process failure, or other, design provision
be made for ventilation of potentially odourous air to bio-
scrubber. Storage, transfer and
transport of soil
conditioner
Solid soil conditioner, having undergone
anaerobic and aerobic digestion, is
expected to be free from odour.
None
Returned pallets Pallets to be cleaned after use and
before return to facility.
Depending on quality of pallet cleaning, contingency
planning to accommodate venting displaced air to bio-
scrubber (P3).
The biogas from the digester plant will be combusted in generators to produce combined heat and power. IMP
commissioned Hodson & Associates to undertake emissions estimation and dispersion modeling of the biogas engine
exhaust (Appendix F). This modeling took into account local meteorological data and factors including mass emissions rates,
stack parameters including location, height and diameter, building downwash from building dimensions, and local terrain.
The findings are summarized below:
• The Ausplume Air Dispersion modelling reveals that the predicted concentrations of the majority of the air
contaminants are well below their respective Design Criteria. The predicted H2S content is 68% of the EPA
Design Criteria limit. Based on the emission data, the modelling and the conservative assumptions made
concerning the emission of H2S (assuming the maximum sulphur level in fuel, and that 0.25% of the sulphur is
converted to H2S), it is concluded that the emissions from a 20m stack will comply with the Tasmanian EPA
Air Policy ground level Criteria and the in-stack limits.
All other pieces of process equipment have been assessed and not determined to be likely further sources of odour
emission or potential impact to air during normal operations. In the event of process failure, there is a risk of odour impact to
air. When considered against the proposed best practice operation guidelines, spill containment and contingency planning
and the existing environment, this risk can be considered minimal, however the design of the plant will incorporate response
measures to mitigate odour impact to air that can be implemented within 24 hours [Commitment 3].
There is potential for air emissions during construction, namely from construction vehicles and dust generation from
earthworks.
4.1.4 Mitigation MeasuresTo mitigate the potential emission source at inlet and crushing, the crusher is located inside the digester plant warehouse
structure. The crusher is fitted with a positive displacement pump to draw clean air into the space, while the potentially
odourous air is forced through a bio-scrubber (Drawing G03 Reference P3). The bio-scrubber pumps potentially odourous
air into its base and up through trickle filtered absorbent plastic fragments that are constantly kept wet. The downward
movement of water collects the odourous pollutants and pools in the base of the unit. This water is added to the digester
feedstock stream.
IMP Environmental - DPEMP
23

To mitigate the potential emission sources during construction, all vehicles will be maintained to an acceptable standard,
dust will be managed in accordance with a Construction Environmental Management Plan (CEMP) [Commitment 4].
Following construction during the commissioning phase, an assessment of air emissions from sources identified in 4.1.3 will
be undertaken, and a measure of the effectiveness of the mitigation measures undertaken. This measure will take into
account occupational exposure and impact to adjacent land users.
IMP Environmental - DPEMP
24

4.2 Liquid Waste
4.2.1 Existing ConditionsThe site is located on the existing Longford WWTP, which accepts Longford town sewerage and trade waste from the Swift
abattoir. It is understood the WWTP currently discharges to Back Creek.
4.2.2 Performance RequirementsThe objectives of the State Policy on Water Quality Management 1997 are to:
• focus water quality management on the achievement of water quality objectives which will maintain or
enhance water quality and further the objectives of Tasmania's Resource Management and Planning System;
• ensure that diffuse source and point source pollution does not prejudice the achievement of water quality
objectives and that pollutants discharged to waterways are reduced as far as is reasonable and practical by
the use of best practice environmental management;
• ensure that efficient and effective water quality monitoring programs are carried out and that the responsibility
for monitoring is shared by those who use and benefit from the resource, including polluters, who should bear
an appropriate share of the costs arising from their activities, water resource managers and the community;
4.2.3 Potential EffectsDisposal of effluent from the digester process was identified as a key issue in the PSGs, however given the nature of the
proposed development, whereby the generation of liquid fertiliser is a key platform of the business, the generation of liquid
waste is limited. Liquid flows within the facility are all enclosed, measured and monitored as part of the manufacturing
process. Loss of material is not anticipated, given the concept of the liquid being a key commodity in the process. For
contingency planning, if the need to drain a liquid holding element arises, the liquid material will be retained to be reinstated
into the process when the element is brought back on line.
4.2.4 Mitigation Measures
Liquid Flows
The mitigation for generation of liquid waste is driven by the concept of the liquid flows as a high value resource. The optimal
performance of the facility is based on the material passing through the various items of enclosed process equipment
described in Section 2. There is no chance for the liquid to come into contact with the environment, other than in the event
of a failure of some nature. In the event of a failure, the bunding design is such that the total capacity of the plant will be
retained within the bunded area. The material will be recovered and reintroduced to the facility. The loss of material is not
economic.
Stormwater Management
Stormwater capture from the roofs of facilities is part of the site design (Drawing G02). This captured water will be used for
onsite purposes, i.e. toilets, amenities, cleaning etc. Stormwater design for a 1 in 100 year event has been accommodated.
Given the enclosed nature of the facility, the operational requirement to maintain good housekeeping within the bunded area
in the event that liquid recovery is required means that stormwater will not come into contact with any of the process
material. The design of the interception pits within the bunded area will accommodate stormwater flows through manually
operated valves. The release of stormwater will be to natural surface drainage immediately surrounding the facilities.
Discharge to municipal sewerage system
Discharge to sewer will be limited to plumbing facilities for the 6 to 8 staff onsite, and to wastewater generated during
maintenance of facility elements.
IMP Environmental - DPEMP
25

4.3 Groundwater
4.3.1 Existing ConditionsAs tabled in Section 3.2.1, there is no data available for groundwater at the site. Nearby groundwater bores (Figure 3) have
published TDS measurements ranging from 341 to 900 mg/L, which defines the groundwater as being in Category A for
Environmental Value and Use according to the SPWQM; therefore the beneficial uses to be protected include drinking water
(Where groundwaters have TDS levels below 500 mg/L, TDS levels should be maintained below these levels wherever
practicable), irrigation, industry, stock and ecosystem protection.
4.3.2 Performance RequirementsIn relation to groundwater, the requirements to be met are detailed in the following legislation and policy:
• Water Management Act 1999
• State Policy on Water Quality Management 1997
• Australian and New Zealand Environment Conservation Council (ANZECC) and Agriculture and Resource
Management Council of Australia and New Zealand (ARMCANZ) Australian and New Zealand Guidelines for
Fresh and Marine Water Quality, Volume 1 October 2000
• ANZECC and ARMCANZ National Water Quality Management Strategy, Guidelines for Groundwater
Protection in Australia September 1995
The key performance requirement for the proposed development is the protection of beneficial use of groundwater, defined
in the SPWQM as being based on total dissolved solids (TDS).
4.3.3 Mitigation MeasuresIt is not anticipated that groundwater will be impacted during construction. Excavation and foundation design will be
undertaken upon the completion of a pre-construction geotechnical survey of the site, which will include consideration of the
intersection of groundwater. If shallow groundwater is detected, the likely result will be modification of engineering design to
avoid the need for groundwater management by raising design depths. The other potential hazard identified is the use of fuel
and hydraulic oil for construction equipment. These substances will be managed according to the requirements tabled in
Section 4.6.
The risk of groundwater impact during operation is considered to be very low. As stated in Section 4.2, the liquid involved in
the process is considered a valuable resource, and the facility is designed to efficiently and effectively manage liquid flows.
Design has also accounted for the capture and reclamation of material in the event of a failure or spill.
IMP Environmental - DPEMP
26

4.4 Noise Emissions
4.4.1 Existing ConditionsThe WWTP currently operates under the conditions tabled in Environment Protection Notice 7407/2 (Appendix G). Noise
emissions are limited depending on three time periods during the day (the time interval over which noise levels are averaged
is established at 10 minutes) 40 dB between 10pm and 8am (Night), 45 dB between 8am and 6pm (Day) and 50 dB
between 8am and 6pm (Evening).
There are no other fixed sources of noise in the immediate vicinity of the site. Other dynamic sources of noise in the
immediate vicinity may include farm machinery and vehicular traffic on Bishopsbourne Road.
4.4.2 Performance RequirementsThe key legislation relating to noise emissions in Tasmania is the Environmental Pollutions Control Act 1994 (Section 53),
which contains minor provision for the management of environmental noise in accordance with National Environmental
Protection Measures. Other policies to be considered include:
• Environment Protection Policy (Noise) 2006
• Workplace Health and Safety Act 1995
4.4.4 Potential Effects and Mitigation MeasuresIt is anticipated that noise emissions will increase during the construction phase of the development, with likely sources
including construction equipment and machinery and general construction activities. Given the existing conditions outlined in
4.4.1, the impact of this extra noise generation is considered to be low. Mitigation will include public consultation as outlined
in Section 1.6, in conjunction with limiting construction activities to normal work hours.
The operation of the facility will be below the limits tabled in EPN 7407/2 for the WWTP. The new sources of noise are
identified as follows:
Table 6 New Noise Sources
Process
Equipment
Drawing Reference Expected outside
noise level
Crusher Drawing G03 Reference P2 < 20 dB
Pumps Drawing G03 from Reference P2 < 20 dB
Biogas Engines Drawing G03 Reference P10 < 20 dB
Mitigation measures have been included in the design of the facility; whereby those elements of the facility with the potential
to generate the most noise have been moved inside and in the case of the biogas engines, design of a sound dampening
generator room.
IMP Environmental - DPEMP
27

4.5 Solid and Controlled Waste Management
4.5.1 Existing ConditionsThe existing waste management situation involving the Longford Swift abattoir and the WWTP involves the disposal of
controlled waste via Dissolved Air Flotation (DAF) treatment, pumping to the WWTP’s Covered Anaerobic Lagoon (CAL) and
introduction into the WWTP lagoon system. At the time of writing, this situation has proved unsatisfactory for the
management of the waste, for a number of reasons.
4.5.2 Performance RequirementsThe key legislation and policy relating to solid and controlled waste management for the proposed development is
• Environmental Management and Pollution Control Act 1994
• Environmental Management and Pollution Control (Waste Management) Regulations 2000
• Movement of Controlled Waste Between States and Territories – National Environment Protection Measure
(NEPM)
• Environmental Management and Pollution Control (Controlled Waste Tracking) Regulations 2010
4.5.3 Potential Effects and Mitigation MeasuresDuring the construction phase, it is anticipated that waste construction materials, packaging and putrescible waste will be
generated. These materials will be stored in designated zones or in covered bins in appropriate areas and disposed of
according to regulations to recycling or approved waste disposal facilities. Opportunities for the minimization of waste
generation and recycling will be identified in the CEMP.
During operation it is anticipated that solid waste will be generated when inorganic material is separated from the feedstock
before and after the crusher. The amount of this waste generated is contingent on the nature of the organic material
supplied. It is anticipated that the material emanating from the abattoir would have only minor amounts of inorganic material
such as sand from animal hooves or fragments from animal coats. This waste will be contained in covered bins for removal
to an approved solid waste disposal facility [Commitment 5]. It is noted that controlled waste will be transported to the site
when organic material is delivered from the abattoir. The approved waste transport trucks that make these deliveries will
operate under the Controlled Waste Tracking System.
IMP Environmental - DPEMP
28
4.6 Dangerous Goods
4.6.1 Performance RequirementsConstruction and operation of the facility must adhere to the requirements of the following legislation and policy in relation to
dangerous goods:
• Australian Code for the Transport of Dangerous Goods by Road and Rail
• Dangerous Goods Act 1998
• Australian Dangerous Goods Code
• Australian Standards 1940 – “The storage and handling of flammable and combustible liquids” and 3780 –
“The storage and handling of corrosive substances”
4.6.2 Potential Effects and Mitigation MeasuresDuring construction, the management of fuel, lubricants and other chemicals will be in accordance with the relevant
standards and legislative requirements, and follow the storage and handling procedures tabled in the CEMP. The CEMP will
document the nature of these dangerous goods in detail.
During operation of the proposed facility, Material Safety and Data Sheets (MSDSs) for all dangerous goods will be
maintained onsite at all times. Emergency procedures will be documented and emergency equipment will be available in all
storage areas. Spill management will be documented and spill management equipment will be available in all areas where
hazardous substances and dangerous goods are stored. All dangerous goods will be stored in appropriate containers in
designated areas. Containers will be clearly and correctly labelled so the contents are easily identified. [Commitment 6]
IMP Environmental - DPEMP
29

4.7 Biodiversity and Nature Conservation Values
4.7.1 Existing ConditionsAn ecological assessment of flora and fauna at the site was undertaken on 12th February 2010 by ECOtas (Appendix E).
The assessment found that the absence of threatened flora, fauna and vegetation types from the proposed disturbance
footprint means that permits and specific approvals relating to these natural values would not be required. The findings are
summarized below:
Vegetation Types
The study area supports the following TASVEG mapping units, namely: “Extra-urban miscellaneous” (FUM) and “Permanent
easement” (FPE). These mapping units are not classified as threatened under Schedule 3A of the Tasmanian Nature
Conservation Act 2002.
Flora Species
No flora species, listed on the Commonwealth Environment Protection and Biodiversity Conservation Act 1999 or the
Tasmanian Threatened Species Protection Act 1995, were recorded from the study area.
Fauna Species
No fauna species, listed as threatened on the Tasmanian Threatened Species Protection Act 1995 or the Commonwealth
Environment Protection and Biodiversity Conservation Act 1999, are known from within or near the study area. Species listed
as “protected wildlife” on the schedules of the Wildlife Regulations 1999 were not detected and no products of such species
(e.g. nests, den sites, etc.) were recorded such that additional permits under these regulations will not be required. There is
likely to be marginal potential foraging habitat for several species including the wedge-tailed eagle, spotted-tailed quoll,
masked owl, tasmanian devil and eastern barred bandicoot. Given the existing high level of anthropogenic disturbance within
and surrounding the study area, the additional installation of the anaerobic digester facility is unlikely to deleteriously impact
further on the potential habitat of these species.
Weed Species
Four species, classified as “declared weeds” within the meaning of the Tasmanian Weed Management Act 1999 were
detected from the study area: Ulex europaeus (gorse), Rubus fruticosus .agg (blackberry), Amaranthus albus (tumble
pigweed) and Foeniculum vulgare (fennel). The species have already been quite effectively managed through a slashing
regime. Post-construction follow up management (e.g. hand-spraying of weed outbreaks) should be considered for these
species to inhibit invasion to surrounding properties. A more complex site-specific weed management plan is not considered
warranted.
4.7.2 Performance RequirementsThe key legislation and policy relating to biodiversity and nature conservation values for the proposed development is:
• Environment Protection and Biodiversity Conservation Act 1999
• Tasmanian Threatened Species Protection Act 1995
• Weed Management Act 1999
• Nature Conservation Act 2002
• Wildlife Regulations 1999
• Forest Practices Act 1985
4.7.3 Mitigation MeasuresThe assessment of the proposed development against the relevant flora and fauna management legislation has indicated
that the only specific mitigation measures recommended relate to weed management. The main concern is to minimise the
IMP Environmental - DPEMP
30

risk of invasive exotic species becoming more widely established in the municipality. It is recommended that any debris,
including topsoil and cut vegetation (both of which may contain propagules of weed species), created from development
works be removed from the site and disposed of at a recognised municipal refuse management facility (in accordance with
any local government regulations). [Commitment 7]
4.8 Marine and CoastalN/A
4.9 Greenhouse Gases and Ozone Depleting Substances
4.9.1 Existing ConditionsThe disposal of the equivalent throughput of the proposed facility, namely 30 tons per day or 10,800 tons per year, in terms
of landfill GHG emissions is 11,880 t CO2-e per year (calculation provided in Appendix H)
4.9.2 Performance RequirementsGreenhouse Gas (GHG) emissions have been estimated using the National Greenhouse Accounts (NGA) Factors, prepared
by the Department of Climate Change for use by companies and individuals to estimate greenhouse gas emissions for
reporting under various government programs and for their own purposes.
The methods for calculating emissions derived from the National Greenhouse and Energy Reporting (Measurement)
Determination 2008 and the National Greenhouse and Energy Reporting (Measurement) Technical Guidelines June 2009,
designed to support reporting under the National Greenhouse and Energy Reporting Act 2007.
The default emission factors listed have been estimated by the Department of Climate Change using the Australian
Greenhouse Emissions Information System (AGEIS).
4.9.3 Potential Effects and Mitigation MeasuresDuring construction of the proposed development, GHG emissions will be minimal, including construction machinery,
associated transport to and from the site, and energy use during construction. IMP will undertake to ensure that machinery
and equipment is maintained in good working order, unnecessary transport is minimised and energy is utilised efficiently, in
order to limit GHG emissions.
During operation of the proposed facility, GHG emissions are estimated at 489.5 t CO2-e per year (calculation provided in
Appendix H). This calculation was derived from the NGA Factors. The estimated emissions are generated from trucking
transport movements and the combustion of biogas to produce electricity. Conversely, the combustion of biogas will enable
the proposed development to be self sufficient for electricity, which reduces the need for electricity supply and the
associated indirect GHG emissions.). Measured against the existing GHG emissions calculated in 4.9.1, this represents a
reduction of approximately 11,000 t CO2-e per yea
IMP Environmental - DPEMP
31
4.10 Heritage
4.10.1 Existing ConditionsA number of assessments of cultural and indigenous heritage have been undertaken for the site and its surrounds. There are
no listed sites of either Aboriginal heritage or cultural significance within the extent of the proposed development.
4.10.2 Performance RequirementsThe key legislation and policy relating to heritage values in the context of the proposed development are:
• The Historic Cultural Heritage Act 1995,
• The Northern Midlands Planning Scheme 1995
4.10.3 Potential Effects and Mitigation MeasuresGiven the intrusive works associated with excavation of foundations, the CEMP will detail provision that if material of potential
cultural significance is encountered, works will cease and Aboriginal Heritage Tasmania will be contacted immediately for
further advice. [Commitment 8]
4.11 Land Use and Development
4.11.1 Existing ConditionsThe existing Longford WWTP is located within an “Attenuation Special Area”, defined in Clause 15 of the Northern Midlands
Planning Scheme 1995. This area is delineated based on the Standard Recommended Attenuation Distance (SRAD) set
down by the Division of Environmental Management, Department of Environment and Land Management (1996). The
nearest property zoned as residential is approximately 1.4km south-east of the WWTP, outside the attenuation area.
As tabled in Section 3.2.3, a small conservation zone is located approximately 750m north-west of the site, on the opposite
side of Bishopsbourne Road. It is not anticipated that this reserve will be impacted by the proposed development.
Adjacent land uses and their zoning primarily support rural and agricultural activities.
4.11.2 Performance RequirementsThe key legislation and policy relating to land use in the context of the proposed development are:
• Land Use Planning and Approvals Act 1993
• Northern Midlands Planning Scheme 1995
• Environmental Management and Pollution Control Act 1994
4.11.3 Potential Impacts and Mitigation MeasuresIt is anticipated that the proposed development is unlikely to have an impact on current or future use of this land.
The proposed development is considered to be consistent with the relevant provisions of the Northern Midlands Planning
Scheme 1995 and LUPAA.
IMP Environmental - DPEMP
32

4.12 Visual Effects
4.12.1 Existing ConditionsThe visual landscape of the site of the proposed development is characterized by the existing WWTP, built up treatment
lagoons, surrounded by open pastures.
There are no obvious vantage points in the vicinity of the site where tourists or recreational land users will have their view of
the landscape impacted by the proposed development. Consideration has been given to the view of the landscape from the
Longford township looking west from the Longford Football Ground, Bulwer St, High St, Malcombe St and Hay St (Appendix
I).
The site is hidden from view from Bishopsbourne Rd.
4.12.2 Performance RequirementsThe key legislation and policy relating to visual amenity in the context of the proposed development are:
• Land Use Planning and Approvals Act 1993
• Northern Midlands Planning Scheme 1995
4.12.3 Potential Impacts and Mitigation MeasuresThe maximum height of the proposed development is designed at 8m, which will be a warehouse structure. The design of
the development has taken visual impact into consideration, and accordingly the exterior of large warehouse structures will
be a natural green colour to reduce visual impact, with non-reflective material used where possible. The site is part of the
WWTP, which periodically has plant and associated equipment onsite to perform maintenance such as desludging lagoons.
4.13 Socio-Economic Issues
4.13.1 Total Capital InvestmentThe total capital investment for the proposed development is approximately $7.5 million.
4.13.2 Impacts on Local and State Labour MarketsDuring the construction of the development, it is anticipated that local contractors will be engaged where needed to assist
with the construction.
During the operation phase, it is anticipated by IMP that the proposed development will employ five people on a full time
basis, with a sixth person required on an ad-hoc basis.
4.13.3 Impacts on Upstream and Downstream IndustriesProducers of organic material, namely in this instance, the Swift abattoir in Longford, will benefit from a cost effective and
drastically improved environmental method of disposal.
The agricultural industry in Tasmania will benefit from the availability of a high quality biological fertiliser, and the concept of
‘nutrient cycling’, whereby the potential of material is unlocked rather than disposed of will be introduced.
Another benefit to local and statewide industries is the substitution of imported product for locally produced fertiliser which
will have positive net economic benefit for Tasmania.
IMP Environmental - DPEMP
33
4.13.4 Local Raw MaterialsThe main components of the digester facility will be purchased partly assembled, however the warehouse and the fertiliser
facility will be manufactured and constructed from locally sourced materials utilizing local expertise. These materials will
include tanks, warehousing, pipes, pumps.
The organic material feedstock will all be sourced locally from Northern Tasmania.
4.13.5 Infrastructure EffectsIt is not anticipated that the proposed development will impact on recreational, cultural, health or sporting facilities and
services.
4.13.6 Community Demographic ImpactsThe proposed development is not expected to result in significant community impacts. The proposed facility is considered to
be relatively small in scale. However it should be noted that there will be a number of Korean technicians employed to install
the plant. These technicians will live locally for a period of time.
4.13.7 Impacts on Land ValuesGiven the site’s location within an existing utility services zone, the projected impact upon land values is not considered to be
significant. Air and noise impacts will be mitigated through a number of engineering measures as discussed in Sections 4.1
and 4.4 respectively, with the likely result an overall positive impact (improvement) in air quality. Increased heavy vehicle
movement is unlikely to have an impact on the surrounding properties due to the site’s proximity to Illawarra Rd, which
already carries heavy vehicle traffic .
4.13.8 Economic ImpactThe proposed development will have a positive impact on the local, regional and state economies.
On a local level, the producers of organic material will benefit from reduced costs for disposal and environmental compliance
– which in turn increases the viability of their respective operations, maintaining or increasing their ability to participate in the
local economy as employers and business users of utilities and local services.
From an energy perspective the IMP project will be self sufficient for its own energy requirements. Thus not adding to the
drain on local electricity supply.
On a regional level, the agricultural industry in Northern Tasmania will benefit from access to high quality, locally produced
biological fertiliser, and by using this product they can close the loop and become part of the nutrient cycle.
On a state level, Tasmania will become the first state to host a commercially independent anaerobic digestion facility
producing high quality biological fertiliser.
IMP Environmental - DPEMP
34

4.14 Health and Safety Issues
4.14.1 Performance RequirementsThe key legislation and policy relating to health and safety in the context of the proposed development are:
• Workplace Health and Safety Act 1995
• Workplace Health and Safety Regulations 1998
• Australian Standard 4804 Occupational Health and Safety Systems
• Northern Midlands Council Policy 12 Occupational Health and Safety
• Northern Midlands Council Policy 13 Occupational Health and Safety Requirements for Contractors
4.14.2 Potential Impacts and Mitigation MeasuresHealth and safety management during the construction phase of the proposed development will adhere to the requirements
of the Northern Midlands Council Policy 13 Occupational Health and Safety Requirements for Contractors.
The development of an Environmental Management Plan (EMP) [Commitment 9] for the operation of the proposed
development will incorporate the health and safety requirements of Northern Midlands Council Policy 12 Occupational Health
and Safety, the Workplace Health and Safety Act 1995 and the Workplace Health and Safety Regulations 1998. Issues that
the EMP will address include the identification of safety hazards and controls, procedures for operational control of
equipment, specific training requirements, emergency response procedures and incident management.
4.15 Hazard Analysis and Risk Assessment
4.15.1 Performance RequirementsThe key document relating to hazard analysis and risk assessment in the context of the proposed development is Standards
Australia HB 203:2006 Environmental risk management - Principles and process
4.15.2 Potential Effects and Mitigation MeasuresA preliminary risk assessment has been undertaken for the proposed project (see Appendix J). The risk assessment process
identified a number of potential hazards with serious consequences, however the application of mitigation measures using
the hierarchy of control (elimination, substitution, engineering, administration and protection) has served to minimise the risk
of each.
IMP Environmental - DPEMP
35
4.16 Fire Risk
4.16.1 Existing ConditionsThe location of the proposed facility is adjacent to a utility services zone, not prone to bushfire. It is considered unlikely that
bushfire would reach the proposed facility as it is surrounded by areas of agricultural land.
4.16.2 Performance RequirementsThe key legislation and policy relating to fire risk in the context of the proposed development are:
• Fire Services Act 1979; and
• Workplace Health and Safety Act 1995
4.16.3 Potential Effects and Mitigation MeasuresThe construction of the proposed facility will involve the use of some flammable materials, such as fuels for construction
equipment. These materials will be used, stored and transported in accordance with the Dangerous Goods Act 1998. The
risk of fire during construction is considered to be low, however appropriate fire fighting equipment (such as fire
extinguishers) will be available on site.
The design and operation of the proposed facility will demonstrate compliance with both the Fire Services Act 1979 and the
Workplace Health and Safety Act 1995, as well as all relevant Australian Standards. In particular the generation, storage and
use of biogas will adhere strictly to these performance requirements, and will include emergency response measures
incorporated into the design of all biogas-related process equipment.
All management measures relating to prevention and response to fire at the proposed facility will be incorporated into an
Emergency Response Plan, which will be developed prior to commissioning [Commitment 10]. The proposed facility will also
be supplied with appropriate fire equipment including fire extinguishers, fire blankets, water pumps and fire alarms.
All electrical infrastructure will be constructed in full compliance with the Tasmanian Electricity Code to minimise risk of
electrical faults that may act as ignition sources.
4.17 Infrastructure and Off-Site Ancillary Facilities
4.17.1 Performance RequirementsThe key performance requirements are for the construction and operation of the proposed facility not to significantly impact
upon the local road networks, power or water supply. The upgrade to the site access will comply with the relevant Austroad
Guidelines, NMC regulations and relevant Australian Standards.
4.17.2 Potential Effects and Mitigation MeasuresThe operation of the facility is anticipated to lead to a minor increase in trucking movements (approximately 3 to 5 trucks per
day) within the vicinity of the facility. The power and water requirements for the development are considered minimal and are
not anticipated to have a significant affect on local supplies.
IMP Environmental - DPEMP
36
4.18 Environmental Management SystemsBoth the construction and operational phases of the proposed project have the potential to result in environmental impacts.
The framework for addressing environmental performance and continual improvement will be addressed in an EMP that will
be prepared for the operational phase of the project.
4.18.1 Construction Environmental Management PlanThe construction of the facility will be undertaken in accordance with a CEMP that will account for all construction impact
mitigation measures discussed throughout Section 4 of this document.
4.18.2 Operational Environmental Management Plan (EMP)Following construction it will be the responsibility of IMP to prepare and implement an Operational EMP prior to
commissioning. This EMP will reviewed and updated within 24 months of operation.
It is expected that the EMP will encompass the relevant issues identified in Section 4, and include, but not be limited to the
following key elements:
Site Management
Development and implementation of a system to manage entry and exit from the site. The site management procedures will
include:
• Development and implementation of an induction program to be provided to all employees
• Identification of areas requiring restricted access and methods for ensuring this occurs
• Installation and maintenance of appropriate signage
Odour Management
Development and implementation of a system to minimise odour generation during operation.
The odour management procedures will include:
• Identification of areas within the site that may be prone to odour emissions
• Development of odour control systems to minimise potential odour emissions
• Development of processes to ensure odour emissions are minimised from vehicles delivering material to the
facility
• Development of a system to document complaints relating to odour
Water Management
Development and implementation of a water management system. The water management procedures will include:
• Identification of final site drainage design
• Maintenance of bunding and associated release valves
• Development of procedures to manage spills of hazardous materials and deal with their removal
Noise Management
Development and implementation of a system to manage and control noise emissions.
All equipment and machinery will be operated in accordance with the requirements of Part 3, Division 3, “The exposure
standard for noise”, of the Tasmanian Workplace Health and Safety Regulations
IMP Environmental - DPEMP
37

Fire Management
Development and implementation of a system to prevent and control the escape of fire during operation.
The fire management procedures will include:
• Identification of all processes that may create a potential fire hazard
• Minimisation of potential fuel on site (including natural fuels)
• Development of fire fighting and emergency notification procedures
• Provision of fire fighting equipment such as extinguishers, blankets and water pumps
• A procedure for management of plant in the event of fire ingress to site from surrounding areas
Waste Management
Development and implementation of a system to manage the storage and disposal of all waste materials created during the
works. The waste disposal procedures will include:
• Identification of potential waste materials generated during operation
• Identification of statutory requirements and a waste tracking procedure
• Provision of storage facilities and procedures for waste generated
• Identification of suitable off site disposal for waste generated
4.19 Cumulative and Interactive EffectsThe proposed development is not anticipated to create any significant cumulative impacts associated with other existing or
known developments in the area.
IMP Environmental - DPEMP
38
5 Monitoring and Review
On-going monitoring of the efficacy of mitigation measures and potential impacts of the facility is required to determine if the
project is meeting obligations stated in the DPEMP, and subsequent permit conditions. The key aspects requiring
monitoring, include:
• Noise Emissions; and
• Odour Emissions.
As the quantity of water to be discharged in to the municipal sewer is minimal, monitoring of water discharges is not
considered necessary.
5.1 Noise MonitoringNoise survey design will be developed in consultation with the EPA Division. Noise monitoring will be undertaken within 2
months of commissioning of the facility and, assuming compliance, on an as needs basis there-after. [Commitment 11]
5.2 Odour EmissionsTo monitor odour, and other potential impacts not considered suitable for on-going monitoring, a complaints and incidents
register will be developed and maintained.
Any complaints received from neighboring residents, motorists and any other members of the general public will be recorded
in the register.
Any accidents, or incidents resulting in the potential for personal or environmental harm or nuisance will be reported to the
appropriate authority as soon as practicable. [Commitment 12]
5.3 Post Commissioning ReviewA review of operations and associated management plans will be undertaken 12 months after commissioning of the facility
(and at three-yearly intervals thereafter) and will include all results of the regular monitoring programs. [Commitment 13]
IMP Environmental - DPEMP
39

6 Decommissioning and Reha-bil itation
There is no plan for the decommissioning of the proposed facility in the foreseeable future and as such it is not expected that
a detailed decommissioning and rehabilitation plan will be required for some time. In the event that the facility becomes
redundant a decommissioning and rehabilitation plan will be produced and provided to the Director, Environment Protection
Authority at least three months prior to decommissioning. [Commitment 14]
IMP Environmental - DPEMP
40

Commitments
Table 7 Commitments
Number Details DPEMP
Reference
Responsible
Party
1 IMP commit to undertake public consultation regarding the proposed development,
including a commitment to make information available directly from the proponent.
1.6 IMP
2 IMP commit to limit main work activities to 7am to 6pm Monday to Friday. 2.1.12 IMP
3 IMP commit to implementing odour control response measures within 24 hours of
complaint being received.
4.1.3 IMP
4 IMP commit to maintaining all construction vehicles to an acceptable standard, and
manage dust in accordance with a Construction Environmental Management Plan
(CEMP)
4.1.4 IMP
5 IMP commit to disposing of inorganic material to an approved facility. 4.5.3 IMP
6 IMP commit to the handling of dangerous goods handling according to appropriate
regulations.
4.6.2 IMP
7 IMP commit to disposing of debris created from development works be removed
from the site and disposed of at a recognised municipal refuse management facility.
4.7.3 IMP
8 IMP commit to ceasing construction work if material of potential cultural significance
is encountered, and contacting Aboriginal Heritage Tasmania immediately for further
advice.
4.10.3 IMP
9 IMP commit to the development of an Environmental Management Plan (EMP) prior
to commissioning.
4.14.4 IMP
10 IMP commit to the development of an Emergency Response Plan prior to commis-
sioning.
4.16.3 IMP
11 IMP commit to undertaking noise monitoring within 2 months of commissioning of
the facility and, assuming compliance, on an as needs basis thereafter.
5.1 IMP
12 IMP commit to maintenance of a complaints and incidents register, particularly for
odour emissions.
5.2 IMP
13 IMP commit to undertake a review of operations and associated management plans
12 months after commissioning of the facility (and at three-yearly intervals thereafter)
5.3 IMP
14 In the event that the facility becomes redundant, IMP commit to producing a
decommissioning and rehabilitation plan and providing it to EPA at least three
months prior to decommissioning.
6 IMP
IMP Environmental - DPEMP
41
Conclusion
IMP Environmental’s proposed anaerobic digestion and fertiliser batching facility is a project in which, through careful
management, a very broad number of stakeholders will benefit from its success.
First and foremost, the project is a commercial enterprise that is endeavoring to convert a waste into a resource, and sell the
resource in the Tasmanian marketplace. However, the project neatly fills a gap in the nutrient cycle, completing the loop
between agriculture and industry.
The proposed facility will have a net positive environmental impact, ranging from improvements to local odour conditions,
reduced GHG emissions, minimisation of traditional waste disposal and prevention of nutrient loss in agriculture. The
potential negative effects to environment including failure of process equipment that may lead to spills or loss of material
have been assessed and mitigation measures have been incorporated into the design and operational procedure of the
facility.
The proposed facility represents an opportunity for Tasmania to position itself at the leading edge of waste minimisation,
renewable energy production and regenerative agricultural practice; an opportunity to strengthen the state’s enviable
environmental landscape.
IMP Environmental - DPEMP
42

References
Environmental Management and Pollution Control Act 1994
Land Use Planning and Approvals Act 1993
Northern Midlands Planning Scheme 1995
Environment Protection and Biodiversity Conservation Act 1999
Tasmanian Environment Protection Policy (Air Quality) 2004
State Policy on Water Quality Management 1997
Water Management Act 1999
Australian and New Zealand Environment Conservation Council (ANZECC) and Agriculture and Resource Management
Council of Australia and New Zealand (ARMCANZ) Australian and New Zealand Guidelines for Fresh and Marine Water
Quality, Volume 1 October 2000
ANZECC and ARMCANZ National Water Quality Management Strategy, Guidelines for Groundwater Protection in Australia
September 1995
Environmental Pollutions Control Act 1994
Draft Environment Protection Policy (Noise) 2006
Workplace Health and Safety Act 1995
Environmental Management and Pollution Control (Waste Management) Regulations 2000
Movement of Controlled Waste Between States and Territories – National Environment Protection Measure (NEPM)
Environmental Management and Pollution Control (Controlled Waste Tracking) Regulations 2010
Australian Code for the Transport of Dangerous Goods by Road and Rail
Dangerous Goods Act 1998
Australian Dangerous Goods Code
Australian Standards 1940 – “The storage and handling of flammable and combustible liquids” and 3780 – “The storage and
handling of corrosive substances”
Environment Protection and Biodiversity Conservation Act 1999
Tasmanian Threatened Species Protection Act 1995
Weed Management Act 1999
IMP Environmental - DPEMP
43

Nature Conservation Act 2002
Wildlife Regulations 1999
Forest Practices Act 1985
National Greenhouse and Energy Reporting (Measurement) Determination 2008
National Greenhouse and Energy Reporting (Measurement) Technical Guidelines June 2009
National Greenhouse and Energy Reporting Act 2007
The Historic Cultural Heritage Act 1995,
Workplace Health and Safety Regulations 1998
Australian Standard 4804 Occupational Health and Safety Systems
Northern Midlands Council Policy 12 Occupational Health and Safety
Northern Midlands Council Policy 13 Occupational Health and Safety Requirements for Contractors
Standards Australia HB 203:2006 Environmental risk management - Principles and process
Fire Services Act 1979
Brickendon Soil Profile Class
IMP Environmental - DPEMP
44

Drawing G02: Proposed Plant Layout
IMP Environmental - DPEMP
45

46
Drawing G03: Digester Facil ity Layout
IMP Environmental - DPEMP
47

48

Drawing G04: Ferti l iser Batching Facil ity Layout
IMP Environmental - DPEMP
49

50

Appendix A: Classif ication of Project
IMP Environmental - DPEMP
51

52
53

Appendix B: DPEMP Project Specif ic Guidelines
IMP Environmental - DPEMP
54
55

56

57

Appendix C: Assurance of Process Viabil ity
IMP Environmental - DPEMP
58

Dongmun I.R.S Co.LTD #1106,#803,110,Haksan Blfg,Kwangjang-dong Kwangin-Gu,143-802,Seoul,Korea/ Tel:822-3437-6602 FAX:822-3437-6601
To the Director, Environment Protection Authority,
I am writing to you as President and Technical Manager of Dongmun I.R.S., a
Korean company that designs, manufactures, and operates anaerobic digestion
plants to treat organic waste. We will provide the plant for the Dongmun / IMP
digester project at Longford in Tasmania. I have over 27 years experience in
the wastewater and waste treatment industry. The Korean Ministry of
Environment has certified the Dongmun technology, because the Dongmun
organic waste treatment system was developed with close cooperation by The
Korean Ministry of Environment and Dongmun I.R.S.
Viability of proposed process
We have examined the data from the waste (feedstock) sources coming from
the Swift Longford abattoir, and can report that we are very pleased that the
results show a high BOD and COD, both good indicators of suitability of
material for our process. The presence of oil and grease will mean that our
process will need to be tailored to accommodate these elements by anaerobic
microbes such as hydrolytic bacteria, acidogenic bacteria (Clostridium),
acetogenic bacteria (acetate and H2-producing bacteria, such as Syntobacter
wolini and Syntrophomonas wolfei) and methanogenic bacteria (Methanosarcia
and Methanothrix).
Given my experience of treating a variety organic waste, I can firmly
vouch for the ability of the Dongmun technology to treat the waste stream
from the Longford abattoir.
The Dongmun digester plant handles any organic waste stream by bacterial
hydrolysis of the input materials in order to break down insoluble organic
polymers such as carbohydrates and make them available for other bacteria.
Acidogenic bacteria then convert the sugars and amino acids into carbon
dioxide, hydrogen, ammonia, and organic acids. Acetogenic bacteria then
convert these resulting organic acids into acetic acid, along with additional
59

ammonia, hydrogen, and carbon dioxide. Methanogens finally are able to
convert these products to methane and carbon dioxide. The remaining outputs
are liquid and solid fertiliser.
Dongmun I.R.S. has successfully installed 4 anaerobic digestion plants in
South Korea treating a variety of organic waste streams.
Process controls and contingencies
The plant will be fully computer controlled – every processing unit has
several sensors installed and connected to the monitoring room, all treatment
processes will be monitored and controlled semi-automatically.
A contingency plan for the case of digester failure is of utmost importance to
plant operation. To avoid the failure of the plant, we will install three
digester units - the capacity of two digesters are designed for such an
emergency case to cover the entire treatment capacity, so that during the
maintenance of one unit or bacterial re-seeding of one unit, we can operate
the system with two digesters and sustain the normal operation of the plant.
The site master plan will include the appropriate grading, interception pits,
bunding and emergency storage to contain any spills.
Lastly, I am strongly committed to the principles of sustainability, and I see an
ideal fit for the Dongmun technology in the Australian, and particularly the
Tasmanian context. Dongmun and IMP are committing significant capital
towards this project, and we have the utmost confidence that our plant will
deliver results that will benefit both us and the community.
Yours sincerely,
SH Joo
60

Appendix D: Tit le Information
IMP Environmental - DPEMP
61

RESULT OF SEARCHRECORDER OF TITLES, TASMANIAIssued pursuant to the Land Titles Act 1980
SEARCH OF TORRENS TITLE
VOLUME
132421FOLIO
1
EDITION
1DATE OF ISSUE
26-Jul-1999
SEARCH DATE : 30-Apr-2010SEARCH TIME : 03.53 pm
DESCRIPTION OF LAND
Parish of LONGFORD, Land District of WESTMORLAND Lot 1 on Plan 132421 Derivation : Part of 445A.1R.0P. Granted to M L Smith Prior CT 131591/1
SCHEDULE 1
C180241 TRANSFER to NORTHERN MIDLANDS COUNCIL Registered 26-Jul-1999 at 12:00 pm (MF:2562o/473)
SCHEDULE 2
Reservations and conditions in the Crown Grant if any
UNREGISTERED DEALINGS AND NOTATIONS
No unregistered dealings or other notationsEND OF SEARCH.
Warning: The information appearing under Unregistered Dealings and Notations has not been formally recorded in the Register.
62
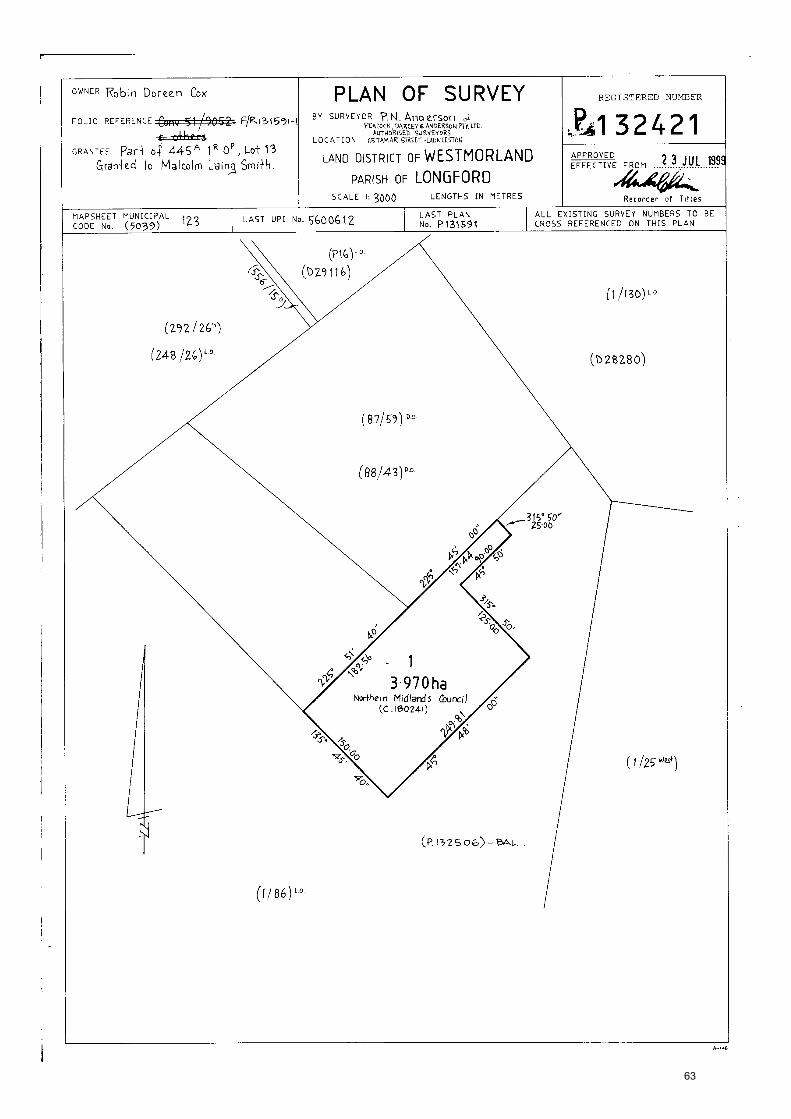
63

Appendix E: Ecological Assessment
IMP Environmental - DPEMP
64
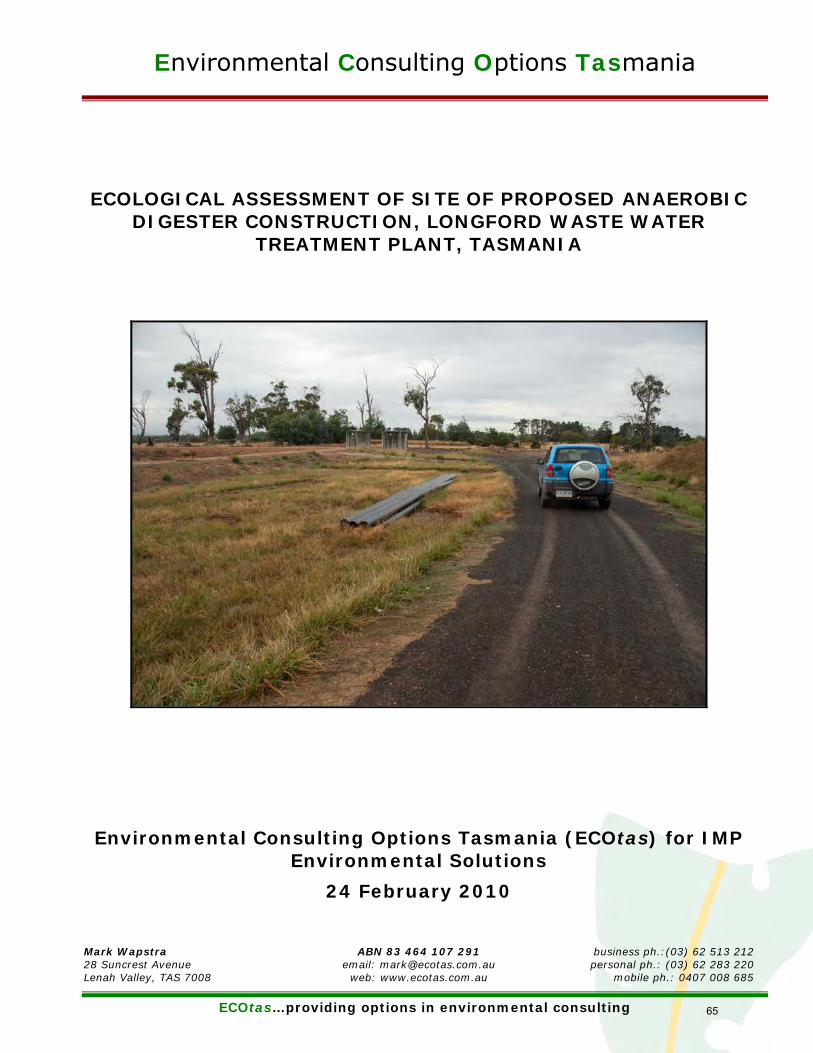
Environmental Consulting Options Tasmania
Mark Wapstra ABN 83 464 107 291 business ph.:(03) 62 513 212 28 Suncrest Avenue email: [email protected] personal ph.: (03) 62 283 220 Lenah Valley, TAS 7008 web: www.ecotas.com.au mobile ph.: 0407 008 685
ECOtas…providing options in environmental consulting
ECOLOGICAL ASSESSMENT OF SITE OF PROPOSED ANAEROBIC DIGESTER CONSTRUCTION, LONGFORD WASTE WATER
TREATMENT PLANT, TASMANIA
Environmental Consulting Options Tasmania (ECOtas) for IMP Environmental Solutions
24 February 2010
65

ECOtas…providing options in environmental consulting
Ecological Assessment of Longford Waste Water Treatment Plant (Anaerobic Digester Site) i
CITATION
This report can be cited as: ECOtas (2010). Ecological Assessment of Site of Proposed Anaerobic Digester Construction, Longford Waste Water Treatment Plant, Tasmania. Report by Environmental Consulting Options Tasmania (ECOtas) for IMP Environmental Solutions, 24 February 2010.
ACKNOWLEDGEMENTS
Ned Halliday (IMP Environmental Solutions) provided background documentation. John Stebbing (Ben Lomond Water) facilitated access and further on-site background site information.
AUTHORSHIP
Field Assessment: Brian French
Report Production: Brian French, Mark Wapstra
Vegetation Mapping: Brian French
Base Data for Mapping and Aerial Photography: TasMap, DPIPWE & Google Earth
Photography and Other Digital Imagery: Brian French
Cover illustration: View southeast along the existing treatment ponds.
66
ECOtas…providing options in environmental consulting
Ecological Assessment of Longford Waste Water Treatment Plant (Anaerobic Digester Site) ii
CONTENTS
SUMMARY .........................................................................................................................3
PURPOSE, SCOPE AND LIMITATIONS OF THE ASSESSMENT......................................................4
Purpose .....................................................................................................................4
Scope........................................................................................................................4
Limitations .................................................................................................................4
Qualifications..............................................................................................................4
Permit .......................................................................................................................4
THE STUDY AREA ...............................................................................................................5
METHODS .........................................................................................................................6
Nomenclature.............................................................................................................6
Database analysis .......................................................................................................6
Botanical survey .........................................................................................................6
Zoological survey ........................................................................................................6
RESULTS...........................................................................................................................7
Vegetation types.........................................................................................................7
Comments on TASVEG mapping ...............................................................................7
Vegetation types recorded as part of the present study ...............................................7
Priority plant species ...................................................................................................9
Weed species ........................................................................................................... 11
Disease management ................................................................................................ 12
Priority fauna ........................................................................................................... 12
RECOMMENDATIONS (including a discussion of legislative and policy implications)..................... 15
REFERENCES ................................................................................................................... 16
67

ECOtas…providing options in environmental consulting
Ecological Assessment of Longford Waste Water Treatment Plant (Anaerobic Digester Site) 3
SUMMARY
General
Ned Halliday (IMP Environmental Solutions) engaged ECOtas (via Mark Wapstra) to conduct an ecological assessment to support a DPEMP for the construction of an anaerobic digester at the Longford Waste Water Treatment Plant, Longford.
Ecological assessment of the area took place on 12 February 2010 by Brian French (ECOtas).
Vegetation Types
The study area supports the following TASVEG mapping units, namely: “Extra-urban miscellaneous” (FUM) and “Permanent easement” (FPE). These mapping units are not classified as threatened under Schedule 3A of the Tasmanian Nature Conservation Act 2002.
Flora Species
No flora species, listed on the Commonwealth Environment Protection and Biodiversity Conservation Act 1999 or the Tasmanian Threatened Species Protection Act 1995, were recorded from the study area.
Fauna Species
No fauna species, listed as threatened on the Tasmanian Threatened Species Protection Act 1995 or the Commonwealth Environment Protection and Biodiversity Conservation Act 1999, are known from within or near the study area.
Species listed as “protected wildlife” on the schedules of the Wildlife Regulations 1999 were not detected and no products of such species (e.g. nests, den sites, etc.) were recorded such that additional permits under these regulations will not be required.
There is likely to be marginal potential foraging habitat for several species including the wedge-tailed eagle, spotted-tailed quoll, masked owl, tasmanian devil and eastern barred bandicoot. Given the existing high level of anthropogenic disturbance within and surrounding the study area, the additional installation of the anaerobic digester facility is unlikely to deleteriously impact further on the potential habitat of these species.
Weed Species
Four species, classified as “declared weeds” within the meaning of the Tasmanian Weed Management Act 1999 were detected from the study area: Ulex europaeus (gorse), Rubus fruticosus .agg (blackberry), Amaranthus albus (tumble pigweed) and Foeniculum vulgare (fennel). The species have already been quite effectively managed through a slashing regime. Post-construction follow up management (e.g. hand-spraying of weed outbreaks) should be considered for these species to inhibit invasion to surrounding properties. A more complex site-specific weed management plan is not considered warranted.
Plant Disease
No evidence of plant disease was noted.
Recommendations
The absence of threatened flora, fauna and vegetation types from the proposed disturbance footprint means that permits and other approvals under the legislative mechanisms applicable to these values will not be required. Minor management recommendations are provided in relation to the presence of “declared weeds”.
68
ECOtas…providing options in environmental consulting
Ecological Assessment of Longford Waste Water Treatment Plant (Anaerobic Digester Site) 4
PURPOSE, SCOPE AND LIMITATIONS OF THE ASSESSMENT
Purpose
Ned Halliday (IMP Environmental Solutions) engaged ECOtas (via Mark Wapstra) to conduct an ecological assessment to support a DPEMP for the construction of an anaerobic digester at the Longford Waste Water Treatment Plant, Longford.
Scope
This report relates to:
flora and fauna species of conservation significance, including a discussion of listed threatened species potentially present, and other species of conservation significance/interest;
vegetation types (forest and non-forest, native and exotic) present, including a discussion of the distribution, condition, extent, composition and conservation significance of each community;
plant disease and weed management issues.
This report follows, in a general sense, the government-produced Guidelines for Natural Values Assessments (DPIPWE 2009) in anticipation that the report (or extracts of it) may be used as part of various approval processes that may be required for activities on the site.
Limitations
In the case of the present assessment, there were no limitations with respect to access to the study area. Access was from an existing access road, and through easily traversed vegetation types.
The flora and fauna survey was undertaken on the 12 February 2010. Many plant species have ephemeral or seasonal growth or flowering habits, or patchy distributions (at varying scales), and it is possible that some species were not recorded for this reason (especially late spring-summer flowering grasses, herbs and lilies). However, every effort was made to sample the range of habitats present in the survey area to maximise the opportunity of recording the majority of species present (particular those of conservation significance). The authors are satisfied that the timing of the survey is appropriate to detect the majority of threatened flora species potentially present, based on several assessments of many parts of the Northern Midlands region in recent years. The survey was also limited to vascular species: species of mosses, lichens and liverworts were not recorded. However, a consideration is made of species (vascular and non-vascular) likely to be present (based on habitat information and database records) and reasons presented for their apparent absence.
Qualifications
Except where otherwise stated, the opinions and interpretations of legislation and policy expressed in this report are made by the authors and do not necessarily reflect those of the relevant agency. The client should confirm management prescriptions with the relevant agency before acting on the content of this report.
Permit
All plant material was collected under DPIPWE permit TFL08070 (in the name of Brian French). Relevant data will be entered into DPIPWE’s Natural Values Atlas database by the authors. Some plant material may be lodged at the Tasmanian Herbarium by the authors.
69

ECOtas…providing options in environmental consulting
Ecological Assessment of Longford Waste Water Treatment Plant (Anaerobic Digester Site) 5
THE STUDY AREA
The study area (Figure 1) comprises UPIs 5600607, 5600606, GEW31 and 5600611.
The study area is surrounded by private property that is predominantly productive agricultural land with a reserved forest remnant to the east of the study area.
There is no native vegetation within the proposed study area as the site is a modified environment for waste water treatment purposes and prior to this was agricultural land. Elevation varies from 150 to 155 m a.s.l.
The study area is underlain by Tertiary sediments (non-marine sequences of gravels, sands, silt, clay and regolith).
Land tenure and other categorisations of the study area are as follows:
Private property (Ben Lomond Water, ex Northern Midlands Council);
Northern Midlands municipality;
Midlands Bioregion (according to the description of IBRA 4 boundaries in the Forest Botany Manual);
Northern Midlands Bioregion (according to the IBRA 5 boundaries used by several government agencies).
Figure 1. Location of the study area.
70
ECOtas…providing options in environmental consulting
Ecological Assessment of Longford Waste Water Treatment Plant (Anaerobic Digester Site) 6
METHODS
Nomenclature
All grid references in this report are in GDA94, except where otherwise stated. Vascular species nomenclature follows Buchanan (2009) for scientific names and Wapstra et al. (2005) for common names. Fauna species scientific and common names follow the listings in the cited Natural Values Atlas reports (DPIPWE 2010).
Database analysis
Two databases holding ecological values information were interrogated, namely:
the Department of Primary Industries, Parks, Water & Environment’s Natural Values Atlas, accessed through the online Natural Values Report feature, producing a report titled 38467_Longford Waste Water Treatment Plant (DPIPWE 2010) – appended to this report for reference;
the Forest Practices Authority’s online version of the Threatened Fauna Manual (now referred to as the Fauna Values Database) accessed through FPA’s website (Longford 5039 1:25000 mapsheet report accessed 24 February 2010).
Botanical survey
Ecological assessment of the area took place on 12 February 2010 by Brian French (ECOtas). The primary purpose of the botanical assessment was to enable the production of a vegetation map showing the extent, condition and classification of each of the forest vegetation types present. Detection and confirmation of sites for threatened flora was also an objective of the assessment.
The survey aimed to assess the range of habitat types present in the study area (at the broad scale e.g. vegetation type, altitude variation, and at the finer scale e.g. microhabitats such as open grassy areas, drainage depressions, disturbed sites, etc.).
Reference to topographic maps (Longford 5039 1:25 000 scale TASMAP), vegetation maps (i.e. TASVEG) and aerial photography (Google Earth) established the approximate range and distribution of topographic and habitat variation present in the study area.
Detailed plots recording all vascular species, vegetation structure and site characteristics were undertaken in representative vegetation types. Running species lists, and additional species associated with specific vegetation types, habitat features or sites (e.g. drainage depressions etc.), were also recorded on the route through the study area. Plot data and species lists can be supplied on request (but note that relevant information is included in the report text).
Zoological survey
Potential habitat for threatened fauna (as listed on databases referred to above) was assessed by reference to the vegetation types and site characteristics present. The presence of mammals, birds, frogs and reptiles was determined by opportunistic discovery (e.g. sightings and calls) during the main botanical assessment, and evidence such as tracks, scats and other signs.
71

ECOtas…providing options in environmental consulting
Ecological Assessment of Longford Waste Water Treatment Plant (Anaerobic Digester Site) 7
RESULTS
Vegetation types
Comments on TASVEG mapping
TASVEG mapping (as shown in the cited Natural Values Atlas report) maps the area as “Agricultural land” (FAG) and “Water” (OAQ). Ground-truthing indicated that the study area would be better described “Extra-urban miscellaneous” (FUM) because it a highly modified environment that has a considerable amount of disturbance and infrastructure associated with the treatment plant. Note that the “Water” (OAQ) mapping represents the settling ponds associated with the waste water treatment facility.
Vegetation types recorded as part of the present study
Vegetation types have been classified according to Harris & Kitchener (2005) From Forest to Fjaeldmark: Descriptions of Tasmania’s Vegetation. Conservation priorities alluded to in Table 1 are taken from Schedule 3A of the Nature Conservation Act 2002 (DPIPWE 2010). Table 1 provides information on the vegetation type identified from the study area with notes provided on condition.
Figure 2 indicates the existing vegetation within the study area (as per TASVEG mapping) and Figure 3 indicates the revised vegetation mapping of the study area.
Figure 2. Existing vegetation within the proposed sand mining area.
72
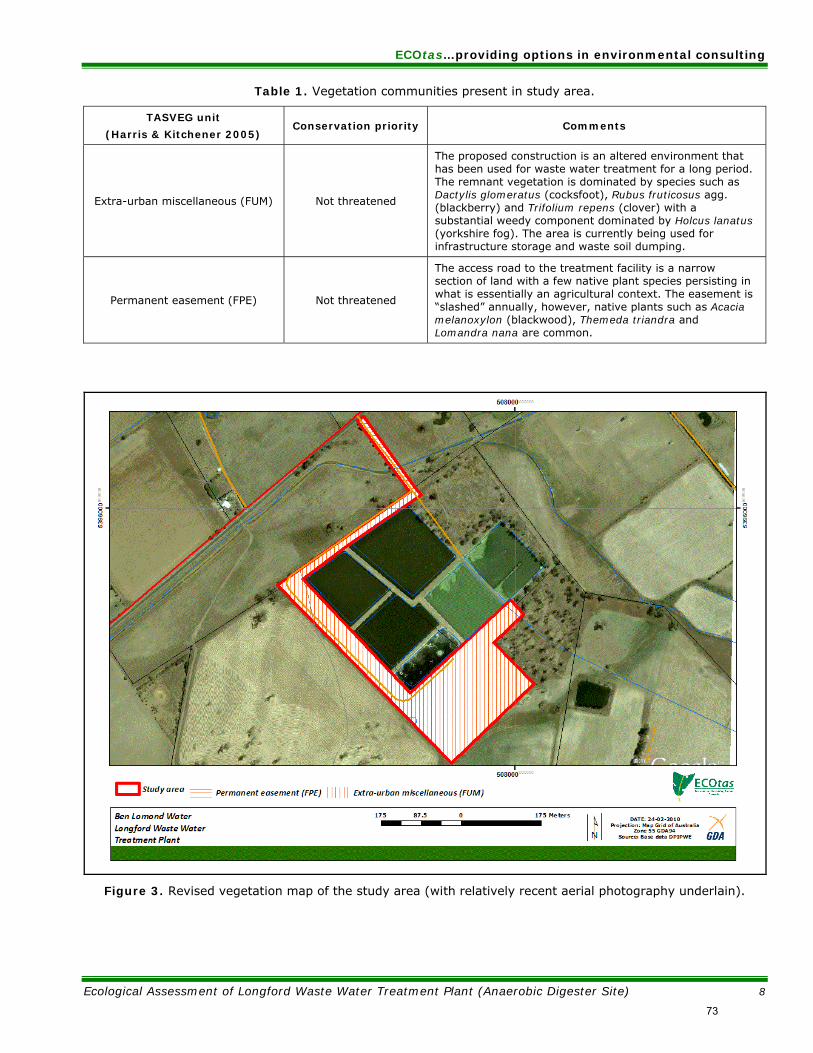
ECOtas…providing options in environmental consulting
Ecological Assessment of Longford Waste Water Treatment Plant (Anaerobic Digester Site) 8
Table 1. Vegetation communities present in study area.
TASVEG unit
(Harris & Kitchener 2005) Conservation priority Comments
Extra-urban miscellaneous (FUM) Not threatened
The proposed construction is an altered environment that has been used for waste water treatment for a long period. The remnant vegetation is dominated by species such as Dactylis glomeratus (cocksfoot), Rubus fruticosus agg. (blackberry) and Trifolium repens (clover) with a substantial weedy component dominated by Holcus lanatus (yorkshire fog). The area is currently being used for infrastructure storage and waste soil dumping.
Permanent easement (FPE) Not threatened
The access road to the treatment facility is a narrow section of land with a few native plant species persisting in what is essentially an agricultural context. The easement is “slashed” annually, however, native plants such as Acacia melanoxylon (blackwood), Themeda triandra and Lomandra nana are common.
Figure 3. Revised vegetation map of the study area (with relatively recent aerial photography underlain).
73
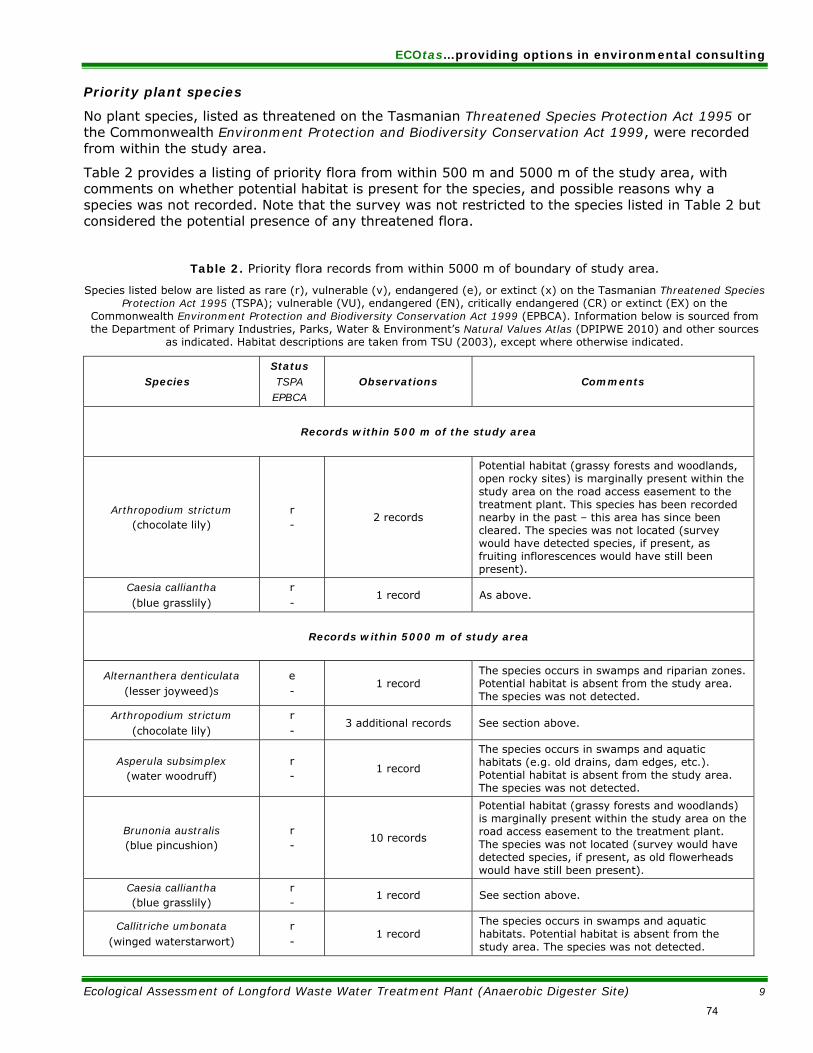
ECOtas…providing options in environmental consulting
Ecological Assessment of Longford Waste Water Treatment Plant (Anaerobic Digester Site) 9
Priority plant species
No plant species, listed as threatened on the Tasmanian Threatened Species Protection Act 1995 or the Commonwealth Environment Protection and Biodiversity Conservation Act 1999, were recorded from within the study area.
Table 2 provides a listing of priority flora from within 500 m and 5000 m of the study area, with comments on whether potential habitat is present for the species, and possible reasons why a species was not recorded. Note that the survey was not restricted to the species listed in Table 2 but considered the potential presence of any threatened flora.
Table 2. Priority flora records from within 5000 m of boundary of study area.
Species listed below are listed as rare (r), vulnerable (v), endangered (e), or extinct (x) on the Tasmanian Threatened Species Protection Act 1995 (TSPA); vulnerable (VU), endangered (EN), critically endangered (CR) or extinct (EX) on the
Commonwealth Environment Protection and Biodiversity Conservation Act 1999 (EPBCA). Information below is sourced from the Department of Primary Industries, Parks, Water & Environment’s Natural Values Atlas (DPIPWE 2010) and other sources
as indicated. Habitat descriptions are taken from TSU (2003), except where otherwise indicated.
Species Status TSPA
EPBCA Observations Comments
Records within 500 m of the study area
Arthropodium strictum (chocolate lily)
r -
2 records
Potential habitat (grassy forests and woodlands, open rocky sites) is marginally present within the study area on the road access easement to the treatment plant. This species has been recorded nearby in the past – this area has since been cleared. The species was not located (survey would have detected species, if present, as fruiting inflorescences would have still been present).
Caesia calliantha (blue grasslily)
r -
1 record As above.
Records within 5000 m of study area
Alternanthera denticulata (lesser joyweed)s
e -
1 record The species occurs in swamps and riparian zones. Potential habitat is absent from the study area. The species was not detected.
Arthropodium strictum (chocolate lily)
r -
3 additional records See section above.
Asperula subsimplex (water woodruff)
r -
1 record
The species occurs in swamps and aquatic habitats (e.g. old drains, dam edges, etc.). Potential habitat is absent from the study area. The species was not detected.
Brunonia australis (blue pincushion)
r -
10 records
Potential habitat (grassy forests and woodlands) is marginally present within the study area on the road access easement to the treatment plant. The species was not located (survey would have detected species, if present, as old flowerheads would have still been present).
Caesia calliantha (blue grasslily)
r -
1 record See section above.
Callitriche umbonata (winged waterstarwort)
r -
1 record The species occurs in swamps and aquatic habitats. Potential habitat is absent from the study area. The species was not detected.
74
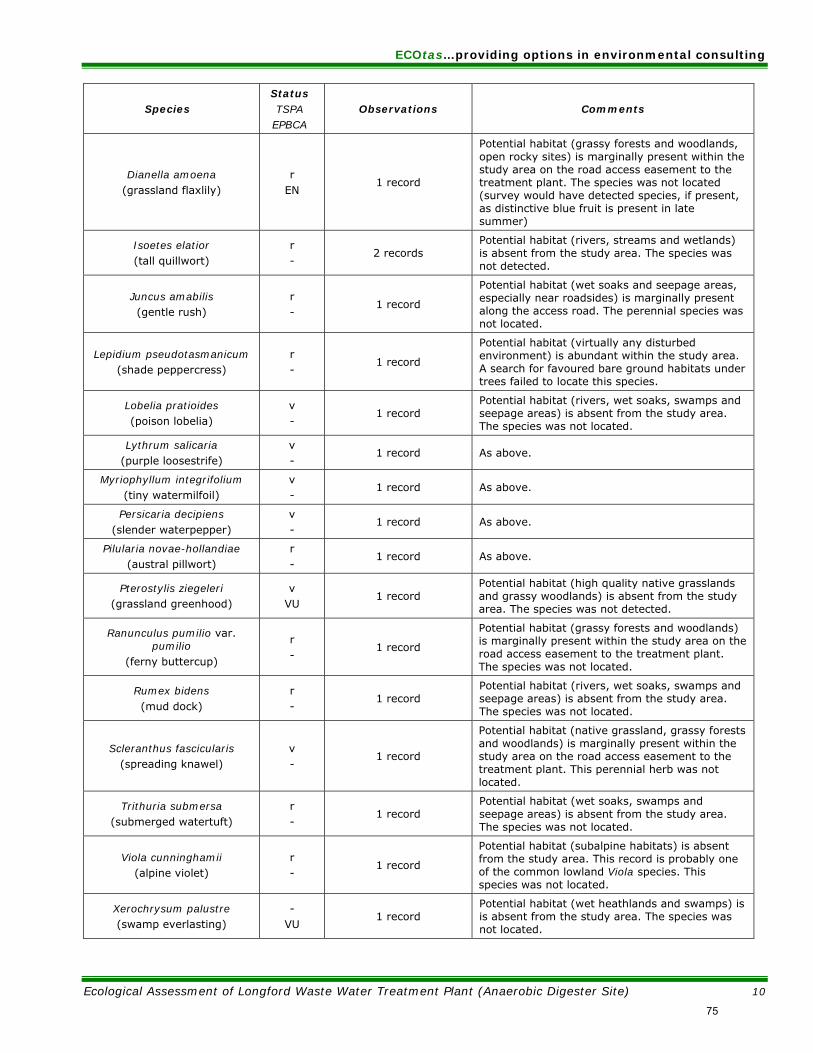
ECOtas…providing options in environmental consulting
Ecological Assessment of Longford Waste Water Treatment Plant (Anaerobic Digester Site) 10
Species Status TSPA
EPBCA Observations Comments
Dianella amoena (grassland flaxlily)
r EN
1 record
Potential habitat (grassy forests and woodlands, open rocky sites) is marginally present within the study area on the road access easement to the treatment plant. The species was not located (survey would have detected species, if present, as distinctive blue fruit is present in late summer)
Isoetes elatior (tall quillwort)
r -
2 records Potential habitat (rivers, streams and wetlands) is absent from the study area. The species was not detected.
Juncus amabilis (gentle rush)
r -
1 record
Potential habitat (wet soaks and seepage areas, especially near roadsides) is marginally present along the access road. The perennial species was not located.
Lepidium pseudotasmanicum (shade peppercress)
r -
1 record
Potential habitat (virtually any disturbed environment) is abundant within the study area. A search for favoured bare ground habitats under trees failed to locate this species.
Lobelia pratioides (poison lobelia)
v -
1 record Potential habitat (rivers, wet soaks, swamps and seepage areas) is absent from the study area. The species was not located.
Lythrum salicaria (purple loosestrife)
v -
1 record As above.
Myriophyllum integrifolium (tiny watermilfoil)
v -
1 record As above.
Persicaria decipiens (slender waterpepper)
v -
1 record As above.
Pilularia novae-hollandiae (austral pillwort)
r -
1 record As above.
Pterostylis ziegeleri (grassland greenhood)
v VU
1 record Potential habitat (high quality native grasslands and grassy woodlands) is absent from the study area. The species was not detected.
Ranunculus pumilio var. pumilio
(ferny buttercup)
r -
1 record
Potential habitat (grassy forests and woodlands) is marginally present within the study area on the road access easement to the treatment plant. The species was not located.
Rumex bidens (mud dock)
r -
1 record Potential habitat (rivers, wet soaks, swamps and seepage areas) is absent from the study area. The species was not located.
Scleranthus fascicularis (spreading knawel)
v -
1 record
Potential habitat (native grassland, grassy forests and woodlands) is marginally present within the study area on the road access easement to the treatment plant. This perennial herb was not located.
Trithuria submersa (submerged watertuft)
r -
1 record Potential habitat (wet soaks, swamps and seepage areas) is absent from the study area. The species was not located.
Viola cunninghamii (alpine violet)
r -
1 record
Potential habitat (subalpine habitats) is absent from the study area. This record is probably one of the common lowland Viola species. This species was not located.
Xerochrysum palustre (swamp everlasting)
- VU
1 record Potential habitat (wet heathlands and swamps) is is absent from the study area. The species was not located.
75

ECOtas…providing options in environmental consulting
Ecological Assessment of Longford Waste Water Treatment Plant (Anaerobic Digester Site) 11
Weed species
The study area supports areas of altered vegetation that has had a long history of disturbance. The study area has been used for agriculture pasture for grazing and in recent years, as a waste water treatment plant. As such, introduced and “weedy” species dominate the vegetation within the study area. Figure 4 indicates the location of “declared” weed species recorded during the current study.
Four species classified as “declared weeds” within the meaning of the Tasmanian Weed Management Act 1999 were recorded: Ulex europaeus (gorse), Rubus fruticosus .agg (blackberry), Amaranthus albus (tumble pigweed) and Foeniculum vulgare (fennel). These species were scattered across much of the study area and have largely been contained due to regular maintenance such as mowing of the facility.
Figure 4. Location of declared weed species recorded during the current study.
The study area falls within the Northern Midlands municipality, for which the following criteria apply to the detected species:
Amaranthus albus (tumble pigweed): Zone A (“isolated occurrences);
Ulex europaeus (gorse) and Foeniculum vulgare (fennel): Zone B (“widespread occurrences”);
Rubus fruticosus (blackberry): Zone B (“localised infestations”).
76

ECOtas…providing options in environmental consulting
Ecological Assessment of Longford Waste Water Treatment Plant (Anaerobic Digester Site) 12
In relation to “Zone A” species, “eradication” is the most appropriate management objective for municipalities that have isolated occurrences only. The ultimate management outcome for these municipalities is achieving and maintaining the total absence of the species from within municipal boundaries.
In relation to “Zone B” species, “containment”, within the meaning of the Weed Management Act 1999, is the most appropriate management objective for municipalities who have problematic infestations but no plan and/or resources to undertake control actions at a level required for eradication. The management outcome for these municipalities is ongoing prevention of the spread of declared weeds from existing infestations to areas free or in the process of becoming free of these weeds.
In this case, any significant development will largely eliminate the exotic species mentioned above due to their location within the proposed construction zone. Any construction activities have the potential to introduce additional weeds on to the property but the risk of this is relatively low given the well-defined (and sealed) access route to the title boundary and the well-defined title area. However, it is recommended that any debris, including topsoil and cut vegetation (both of which may contain propagules of weed species), created from development works be removed from the site and disposed of at a recognised municipal refuse management facility (in accordance with any local government regulations) or buried/burnt on site (if this is in accordance with local government regulations). The main concern is to minimise the risk of invasive exotic species becoming more widely established in the municipality. The four species detected from the study area have already been quite effectively managed through a slashing regime. Post-construction follow up management (e.g. hand-spraying of weed outbreaks) should be considered for these species to inhibit invasion to surrounding properties. A more complex site-specific weed management plan is not considered warranted.
Disease management
The Forest Botany Manual (FPA 2005) and Rudman (2005) indicate that none of the vegetation types present within the study area are susceptible to the root-rot pathogen Phytophthora cinnamomi. No evidence of the pathogen was noted.
Priority fauna
Table 3 lists threatened fauna species recorded from within 5 km of the study area and discusses the potential of these species to be present on the site, based on the predicted vegetation types, site characteristics derived from mapping, and knowledge of the species in the wider area.
Table 3. Priority fauna records from within 5000 m of boundary of study area.
Species listed below are listed as rare (r), vulnerable (v), endangered (e), or extinct (x) on the Tasmanian Threatened Species Protection Act 1995 (TSPA); vulnerable (VU), endangered (EN), critically endangered (CR) or extinct (EX) on the
Commonwealth Environment Protection and Biodiversity Conservation Act 1999 (EPBCA). Information below is sourced from the DPIW’s Natural Values Atlas (DPIPWE 2010) and FPA (2010).
Species Status TSPA
EPBCA Observations Comments
Records within the study area
There are no records within the study area
77

ECOtas…providing options in environmental consulting
Ecological Assessment of Longford Waste Water Treatment Plant (Anaerobic Digester Site) 13
Species Status TSPA
EPBCA Observations Comments
Records within 5000 m of study area
Accipiter novaehollandiae (grey goshawk)
e -
No database records
The Natural Values Atlas report (DPIPWE 2010) indicates the potential for this species to occur in the area. FPA (2010) describes potential habitat (for other 1:25000 mapsheets) as “wet eucalypt forest with blackwood/myrtle understorey, blackwood swamp, E. brookeriana wet forest, melaleuca and leptospermum forest”. These habitat elements are entirely absent from the study area. No grey goshawks were sighted during the surveys. No grey goshawk nests were detected.
Aquila audax subsp. fleayi (wedge-tailed eagle)
e EN
1 record (nest #1692) within 5000 m of the
study area.
There is one known nest relatively close to the study area (3.5 km to the west). Potential habitat is described as “large tracts (more than 10 ha) of eucalypt or mixed forest” (FPA 2010). This habitat is absent from within the study area and from within 1000 m of the study area (any nearby forest is remnant in nature and open in structure). virtually absent from near the study area.
Catadromus lacordairei (catadromus carabid
beetle)
v -
1 record
Potential habitat is described as “dry native woodlands with cracking clay soils on basalt” (FPA 2010). This record is from between Woodstock Lagoon Conservation Area and Bishopsbourne Road, 2.5 km to the southwest of the study area. Potential habitat is absent from the study area.
Dasyurus maculatus subsp. maculatus
(spotted-tailed quoll)
r VU
1 record
Potential habitat is described (for both the eastern and spotted-tailed quolls) as “all wetter forest types, coastal heath and bush-pasture interfaces” (FPA (2010). The study area marginally meets this broad habitat description records from the wider area indicate that the study area is likely to form part of the home range of one or more individuals or pairs. No evidence of this species was observed (such as scats or dens).
Galaxias fontanus (Swan galaxias)
e EN
No database records
Potential habitat is described as “in catchment upstream of sites listed” (FPA 2010). Both of the records are in tributaries of Brumbys Creek. The study area is not upstream of the listed sites. There is no potential habitat present.
Hydroptila scamandra (caddisfly)
r -
No database records
Potential habitat is described as “immediate vicinity (within 500 m) of the known site” (FPA 2009). The record is 12 km to the east on the South Esk River. The study area is not near the listed site. There is no potential habitat present.
Lathamus discolor (swift parrot)
e EN
1 record
Potential habitat is described as “Breeding range (comprising foraging and nesting habitat) is within 10 km of the coastline (nearest coast including shores, bays, inlets or peninsulas). Foraging habitat: all Eucalyptus ovata – E. viminalis shrubby forest (OV), grassy E. globulus forest (GG) and E. globulus wet forest floristic communities (subsumed into R) or any forest type with >10% E. globulus canopy cover. Nesting habitat: Eucalyptus trees present > 70cm dbh, with hollows present” (FPA 2010). These habitat elements are entirely absent from the study area (the database record would indicate a miscellaneous sighting only).
78

ECOtas…providing options in environmental consulting
Ecological Assessment of Longford Waste Water Treatment Plant (Anaerobic Digester Site) 14
Species Status TSPA
EPBCA Observations Comments
Litoria raniformis (green and gold frog)
v VU
7 records
Potential habitat is described as “permanent and temporary water bodies (streams, ponds, dams) with vegetation in and around them” (FPA 2008). There is no potential habitat present.
Oecetis gilva (caddisfly)
r -
No database records
Potential habitat is described as “immediate vicinity (within 500 m) of the known site” (FPA 2010). The record is 12 km to the east on the South Esk River. The study area is not near the listed site. There is no potential habitat present.
Pasmaditta jungermanniae (snail – cataract gorge)
v -
No database records
Potential habitat is described as “wet forest with mossy/rocky sites” (FPA 2010). These habitat components are absent from the study area.
Perameles gunnii subsp. gunnii
(eastern barred bandicoot)
- VU
3 records
The records listed probably represent roadkill or spotlight records. Potential habitat is described as “grassy woodlands, native grasslands, mosaics of pasture and ground cover, including shrubby weeds” (FPA 2010). These habitat components are present throughout the study area, and it is reasonable to assume that the species will be present in the wider area and the study area itself. No evidence of this species was noted (such as distinctive diggings).
Prototroctes maraena (australian grayling)
v VU
No records
Potential habitat is described as “middle and lower reaches of coastal rivers including the Rubicon River” (FPA 2010). This habitat is entirely absent from within or near the study area.
Sarcophilus harrisii (tasmanian devil)
e EN
2 records
Potential habitat (which is virtually any vegetation type) is present within the study area. There are no opportunities for den sites throughout the study area as there is no woody debris, old wombat burrows ot rocky outcrops present. No distinctive scats of this species were recorded.
Tyto novaehollandiae subsp. castanops
(tasmanian masked owl)
e -
3 records
The records are likely to be sightings because FPA (2010) does not list any known nest sites. Potential habitat is described as “lowland dry sclerophyll forest with old growth components” (FPA 2010). FPA’s Known Threatened Species Range Boundaries map for the species indicates that the study area falls within the “core range” of the species. Potential foraging habitat for this species is marginally present within the study area but no suitable nesting trees were observed near the area.
No fauna species, listed as threatened on the Tasmanian Threatened Species Protection Act 1995 or the Commonwealth Environment Protection and Biodiversity Conservation Act 1999, are known from within or near the study area.
There is likely to be marginal potential foraging habitat for several species including the wedge-tailed eagle, spotted-tailed quoll, masked owl, tasmanian devil and eastern barred bandicoot. Given the existing high level of anthropogenic disturbance within and surrounding the study area, the additional installation of the anaerobic digester facility is unlikely to deleteriously impact further on the potential habitat of these species.
79

ECOtas…providing options in environmental consulting
Ecological Assessment of Longford Waste Water Treatment Plant (Anaerobic Digester Site) 15
RECOMMENDATIONS (including a discussion of legislative and policy implications)
Some commentary is provided below with respect to the key threatened species and vegetation management legislation and polices. Note that there may be other relevant policy instruments in addition to those discussed.
Tasmanian Threatened Species Protection Act 1995
A permit will not be required under Section 51 of this Act because no threatened species listed on the Act will be disturbed.
Commonwealth Environment Protection and Biodiversity Conservation Act 1999
There is potential habitat for three species listed on this Act, namely Perameles gunnii subsp. gunnii (eastern barred bandicoot), Sarcophilus harrisii (Tasmanian devil), and Dasyurus maculatus subsp. maculatus (spotted-tailed quoll), although habitat for the latter two species is highly marginal.
The Commonwealth Department of Environment, Water, Heritage & the Arts provides a Significant Impact Guidelines policy statement (CofA 2006) to determine if referral to the department is required. In our opinion, the installation of the anaerobic digester facility within existing highly modified land will not constitute a “significant impact” with respect to the Tasmanian devil, eastern barred bandicoot and spotted-tailed quoll because while there will be a loss of some marginal potential habitat of these species, the loss is not such that it is likely to lead to a long-term decrease in the size of an important population of a species, reduce the area of occupancy of an important population, fragment an existing important population into two or more populations, adversely affect habitat critical to the survival of a species, disrupt the breeding cycle of an important population, modify, destroy, remove or isolate or decrease the availability or quality of habitat to the extent that the species is likely to decline, result in invasive species that are harmful to a threatened species becoming established in the threatened species’ habitat, introduce disease that may cause the species to decline, or interfere substantially with the recovery of the species.
Tasmanian Weed Management Act 1999
Four species located within the study area are subject to statutory Weed Management Plans under the Weed Management Act 1999 (see information on weed section of DPIPWE’s web site). The study area falls within the Northern Midlands municipality, which for the management of three species is classified as a “Zone B” municipality and for one as a “Zone A” municipality.
In relation to “Zone A” species, “eradication” is the most appropriate management objective for municipalities that have isolated occurrences only. The ultimate management outcome for these municipalities is achieving and maintaining the total absence of the species from within municipal boundaries.
In relation to “Zone B” species, “containment”, within the meaning of the Weed Management Act 1999, is the most appropriate management objective for municipalities who have problematic infestations but no plan and/or resources to undertake control actions at a level required for eradication. The management outcome for these municipalities is ongoing prevention of the spread of declared weeds from existing infestations to areas free or in the process of becoming free of these weeds.
In this case, any significant development will largely eliminate the exotic species mentioned above due to their location within the proposed construction zone. Any construction activities have the potential to introduce additional weeds on to the property but the risk of this is relatively low given
80
ECOtas…providing options in environmental consulting
Ecological Assessment of Longford Waste Water Treatment Plant (Anaerobic Digester Site) 16
the well-defined (and sealed) access route to the title boundary and the well-defined title area. However, it is recommended that any debris, including topsoil and cut vegetation (both of which may contain propagules of weed species), created from development works be removed from the site and disposed of at a recognised municipal refuse management facility (in accordance with any local government regulations) or buried/burnt on site (if this is in accordance with local government regulations). The main concern is to minimise the risk of invasive exotic species becoming more widely established in the municipality. The four species detected from the study area have already been quite effectively managed through a slashing regime. Post-construction follow up management (e.g. hand-spraying of weed outbreaks) should be considered for these species to inhibit invasion to surrounding properties. A more complex site-specific weed management plan is not considered warranted.
Tasmanian Nature Conservation Act 2002
The study aea does not support any vegetation types classified as threatened under Schedule 3A of this Act. There are no constraints under this Act on the installation of the anaerobic digester facility within existing highly modified land.
Tasmanian Wildlife Regulations 1999
No species, or products (e.g. nests, dens, etc.) of species, listed on schedules of the Regulations (i.e. “specially protected wildlife”, “protected wildlife”, “partly protected wildlife”), will be knowingly disturbed. There are no constraints under this Act on the installation of the anaerobic digester facility within existing highly modified land.
Tasmanian Forest Practices Act 1985 and associated regulations
A Forest Practices Plan (FPP) is required for most “clearing” activities in areas of forest and woodland (and for some activities within threatened non-forest native vegetation). Usually, an FPP is only required for clearing activities that exceed certain thresholds i.e. 1 ha or 100 tonnes of timber, from any one property in any calendar year. The present proposal will require limited to no clearing, sch that an FPP will not be required.
REFERENCES
Buchanan, A.M. (2009). A Census of the Vascular Plants of Tasmania and Index to The Student’s Flora of Tasmania. Tasmanian Herbarium Occasional Publication No. 7, Tasmanian Herbarium, Hobart. (2009 web edition as downloaded from http://www.tmag.tas.gov.au/Herbarium/ TasVascPlants.pdf).
Department of Primary Industries, Parks, Water & Environment (DPIPWE) (2010). Natural Values Report Nos. 38467_ECOtas_Longford Waste Water Treatment Plant.
Department of Primary Industries & Water (DPIW) (2010). Threatened Native Vegetation Communities List April 2007 as per Schedule 3A of the Nature Conservation Act 2002. http://www.dpiw.tas.gov.au/inter.nsf/WebPages/AWAH-6547ZL?open
Department of Primary Industries, Parks, Water & Environment (DPIPWE) (2009). Guidelines for Natural Values Assessments, Reporting on the Impact of Proposed Activities on the Natural Values and Providing Recommendations for Mitigating Impacts on these Values. Development and Conservation Assessment Branch, Department of Primary Industries, Parks, Water and Environment.
81

ECOtas…providing options in environmental consulting
Ecological Assessment of Longford Waste Water Treatment Plant (Anaerobic Digester Site) 17
Forest Practices Authority (FPA) (2005). Forest Botany Manual: Module 5 – Midlands Region. Forest Practices Authority, Tasmania.
Forest Practices Authority (FPA) (2010). Threatened Fauna Manual Mapsheet Display Longford 5039 current as at 24 February 2010, and hyperlinked species profiles and range boundary maps. http://www.fpa.tas.gov.au/index.php?id=20.
Harris, S. & Kitchener, A. (editors) (2005). From Forest to Fjaeldmark: Descriptions of Tasmania’s Vegetation. Department of Primary Industries, Water and Environment, Hobart.
Rudman T. (2005). Interim Phytophthora cinnamomi Management Guidelines. Nature Conservation Report 05/7, Biodiversity Conservation Branch, Department of Primary Industries, Water & Environment, Hobart.
Threatened Species Unit (TSU) (2003). Notesheets for various threatened species listed in Table 1. DPIPWE, Hobart.
Wapstra, H., Wapstra, A., Wapstra, M. & Gilfedder, L. (2005). The Little Book of Common Names for Tasmanian Plants. Department of Primary Industries, Water and Environment, Hobart.
82
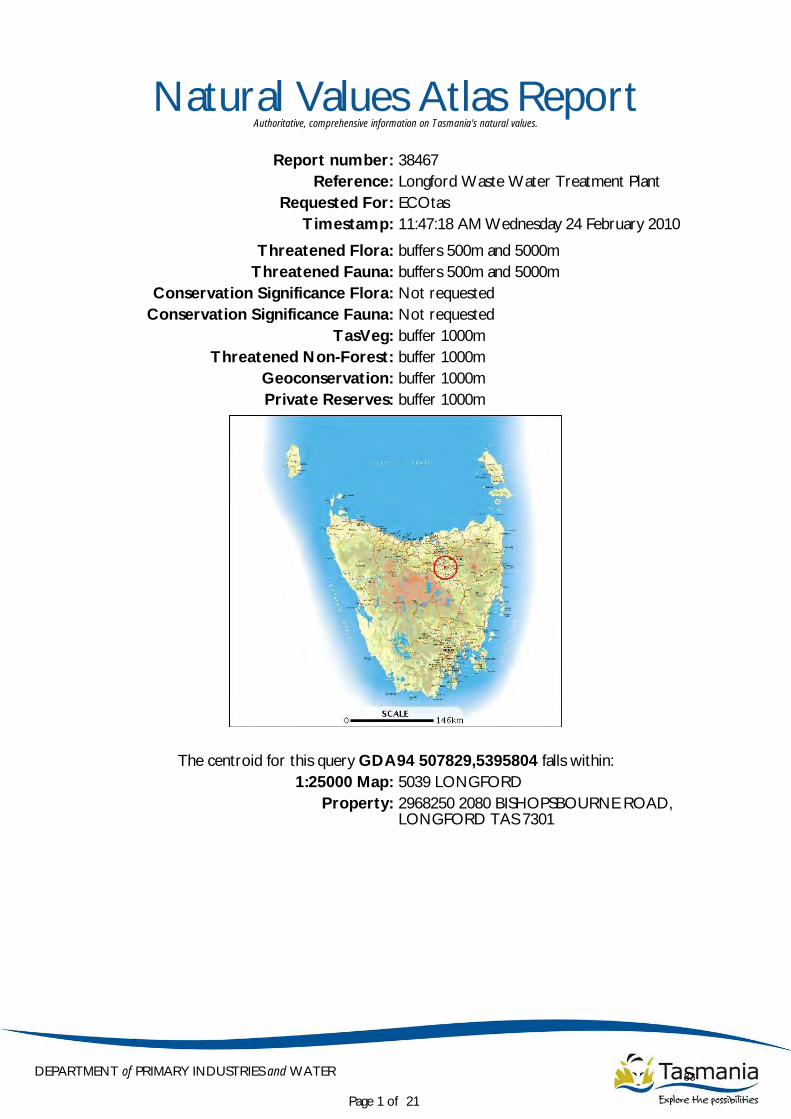
Natural Values Atlas ReportAuthoritative, comprehensive information on Tasmania's natural values.
Report number: 38467
Reference: Longford Waste Water Treatment Plant
Requested For: ECOtas
Timestamp: 11:47:18 AM Wednesday 24 February 2010
Threatened Flora: buffers 500m and 5000m
Threatened Fauna: buffers 500m and 5000m
Conservation Significance Flora: Not requested
Conservation Significance Fauna: Not requested
TasVeg: buffer 1000m
Threatened Non-Forest: buffer 1000m
Geoconservation: buffer 1000m
Private Reserves: buffer 1000m
The centroid for this query GDA94 507829,5395804 falls within:
1:25000 Map: 5039 LONGFORD
Property: 2968250 2080 BISHOPSBOURNE ROAD,LONGFORD TAS 7301
Page 1 of 21
DEPARTMENT of PRIMARY INDUSTRIES and WATER 83

E: 506892 E: 508706N: 5396804 N: 5396804
E: 506892 E: 508706N: 5394844 N: 5394844
Threatened flora within 500 metres
Page 2 of 21
DEPARTMENT of PRIMARY INDUSTRIES and WATER 84

Threatened flora within 500 metres
Page 3 of 21
DEPARTMENT of PRIMARY INDUSTRIES and WATER 85

For more information about threatened species, please contact the Manager, Threatened Species Section.
Telephone: (03) 6233 8759
Email: [email protected]
ID Species Common Name SS NS Observers Date Location (GDA94)
1049838 Arthropodium strictum chocolate lily r J.B. Davies 27-Nov-2008 507574,5395991 +/- 10m.
1049839 Arthropodium strictum chocolate lily r J.B. Davies 27-Nov-2008 507582,5395978 +/- 10m.
1049840 Caesia calliantha blue grasslily r J.B. Davies 27-Nov-2008 507605,5395937 +/- 10m.
Threatened flora within 500 metres
Page 4 of 21
DEPARTMENT of PRIMARY INDUSTRIES and WATER 86

E: 502392 E: 513206N: 5401304 N: 5401304
E: 502392 E: 513206N: 5390344 N: 5390344
Threatened flora within 5000 metres
Page 5 of 21
DEPARTMENT of PRIMARY INDUSTRIES and WATER 87

Threatened flora within 5000 metres
Page 6 of 21
DEPARTMENT of PRIMARY INDUSTRIES and WATER 88

For more information about threatened species, please contact the Manager, Threatened Species Section.
Telephone: (03) 6233 8759
Email: [email protected]
ID Species Common Name SS NS Observers Date Location (GDA94)
228047 Alternanthera denticulata lesser joyweed e A North 05-May-2000 509712,5397483 +/- 100m.
1021264 Arthropodium strictum chocolate lily r Micah Visoiu 09-Dec-2002 506412,5400883 +/- 100m.
943574 Arthropodium strictum chocolate lily r K Johnson 07-Nov-2003 509562,5392563 +/- 50m.
1049839 Arthropodium strictum chocolate lily r J.B. Davies 27-Nov-2008 507582,5395978 +/- 10m.
1049838 Arthropodium strictum chocolate lily r J.B. Davies 27-Nov-2008 507574,5395991 +/- 10m.
462681 Arthropodium strictum chocolate lily r L Gilfedder 511912,5398583 +/- 100m.
258419 Asperula subsimplex water woodruff r A North 05-May-2000 509712,5397483 +/- 100m.
300904 Brunonia australis blue pincushion r Craig Hawkins 503737,5396033 +/- 100m.
1021220 Brunonia australis blue pincushion r Micah Visoiu 09-Dec-2002 506412,5400883 +/- 100m.
930756 Brunonia australis blue pincushion r Craig Hawkins 07-Dec-2000 503712,5396083 +/- 100m.
930755 Brunonia australis blue pincushion r Craig Hawkins 07-Dec-2000 503512,5397283 +/- 100m.
930753 Brunonia australis blue pincushion r Craig Hawkins 07-Dec-2000 503321,5397678 +/- 50m.
476713 Brunonia australis blue pincushion r Louise Gilfedder 503312,5396183 +/- 100m.
476633 Brunonia australis blue pincushion r Louise Gilfedder 503612,5397683 +/- 100m.
476571 Brunonia australis blue pincushion r Louise Gilfedder 503912,5396683 +/- 100m.
299962 Brunonia australis blue pincushion r Craig Hawkins 07-Dec-2000 503512,5397383 +/- 100m.
300903 Brunonia australis blue pincushion r Craig Hawkins 07-Dec-2000 503612,5397683 +/- 100m.
1021262 Caesia calliantha blue grasslily r Micah Visoiu 09-Dec-2002 506412,5400883 +/- 100m.
928635 Caesia calliantha blue grasslily r Karen Johnson 07-Nov-2003 509592,5392723 +/- 50m.
1049840 Caesia calliantha blue grasslily r J.B. Davies 27-Nov-2008 507605,5395937 +/- 10m.
227465 Callitriche umbonata winged waterstarwort r R.J. Fensham 28-Jan-1984 510562,5396683 +/- 350m.
404468 Dianella amoena grassland flaxlily r EN J Kirkpatrick 1984 509512,5393883 +/- 100m.
228092 Isoetes elatior tall quillwort r D.I. Morris 15-Jul-1971 510412,5396783 +/- 100m.
228093 Isoetes elatior tall quillwort r D.I. Morris 15-Apr-1972 510462,5395733 +/- 250m.
1021258 Juncus amabilis gentle rush r Micah Visoiu 09-Dec-2002 506412,5400883 +/- 100m.
862717 Lepidiumpseudotasmanicum
shade peppercress r A North 16-Nov-1994? 503412,5393583 +/- 100m.
228090 Lobelia pratioides poison lobelia v H.N. Barber 19-Nov-1951 510112,5395183 +/- 5000m.
945453 Lythrum salicaria purple loosestrife v Denis IMorris 06-Mar-1975 510402,5396283 +/- 200m.
940077 Myriophyllumintegrifolium
tiny watermilfoil v R.J. Fensham 28-Jan-1984 510552,5396813 +/- 600m.
955287 Persicaria decipiens slenderwaterpepper v A North 05-May-2000 509712,5397483 +/- 100m.
227569 Pilularia novae-hollandiae austral pillwort r B Robinson 27-Nov-1988 512412,5397083 +/- 100m.
566841 Pterostylis ziegeleri grassland greenhood v VU L Gilfedder 05-Nov-1992? 511912,5398583 +/- 100m.
227444 Ranunculus pumilio var.pumilio
ferny buttercup r A North 28-Oct-1997 509812,5396483 +/- 100m.
257387 Rumex bidens mud dock r D.I. Morris 08-Nov-1978 510912,5396983 +/- 1000m.
227927 Scleranthus fasciculatus spreading knawel v Richard Barnes 17-Mar-2000 506812,5394083 +/- 100m.
227188 Trithuria submersa submerged watertuft r J. Smith 11-Dec-1998 503612,5395183 +/- 100m.
1021252 Viola cunninghamii alpine violet r Micah Visoiu 09-Dec-2002 506412,5400883 +/- 100m.
403844 Viola cunninghamii alpine violet r Jamie Kirkpatrick 1984 511912,5399083 +/- 100m.
287866 Xerochrysum palustre swamp everlasting VU R.J. Fensham 25-Nov-1985 504212,5393683 +/- 2000m.
Threatened flora within 5000 metres
Page 7 of 21
DEPARTMENT of PRIMARY INDUSTRIES and WATER 89
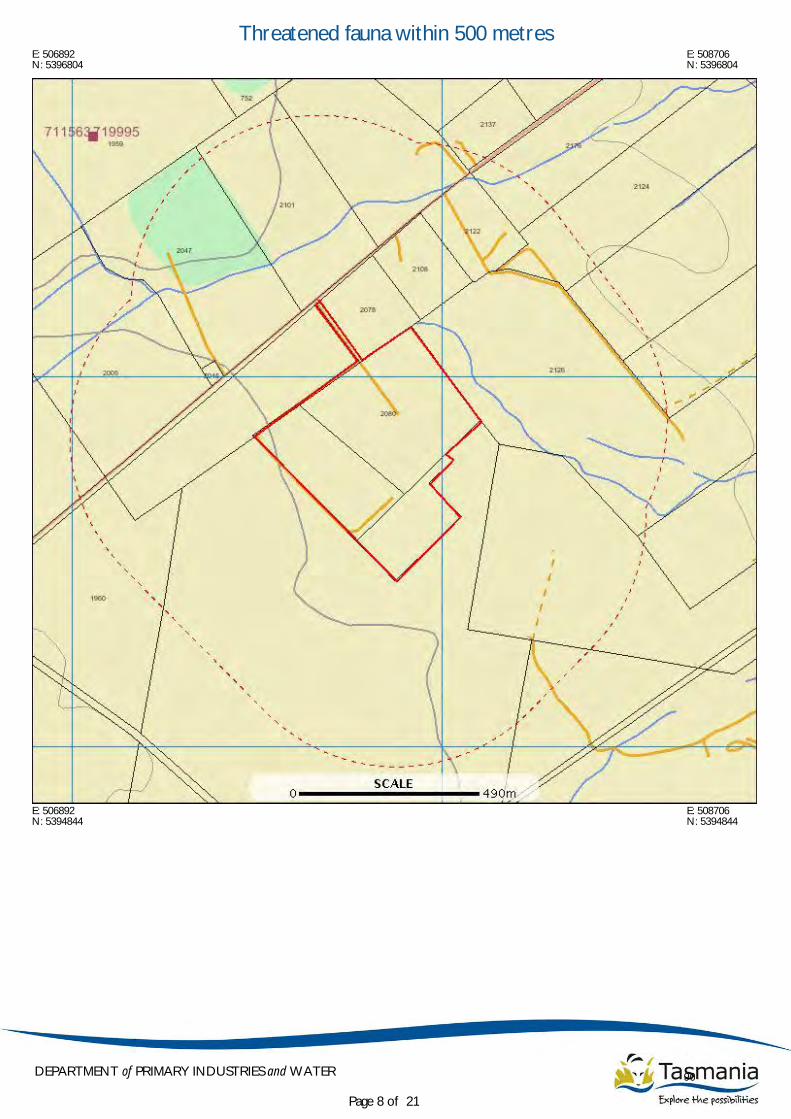
E: 506892 E: 508706N: 5396804 N: 5396804
E: 506892 E: 508706N: 5394844 N: 5394844
Threatened fauna within 500 metres
Page 8 of 21
DEPARTMENT of PRIMARY INDUSTRIES and WATER 90

Threatened fauna within 500 metres
Page 9 of 21
DEPARTMENT of PRIMARY INDUSTRIES and WATER 91

Threatened fauna within 500 metres
(based on Habitat Mapping)
For more information about threatened species, please contact the Manager, Threatened Species Section.
Telephone: (03) 6233 8759
Email: [email protected]
Species Common Name SS NS Potential Known Core
Aquila audax subsp. fleayi wedge-tailed eagle e EN 1 0 0
Aquila audax wedge-tailed eagle pe PEN 1 0 0
Perameles gunnii eastern barred bandicoot VU 1 0 0
Tyto novaehollandiae masked owl e 1 0 1
Galaxias fontanus swan galaxias e EN 1 0 0
Litoria raniformis green and golden frog v VU 1 0 0
Accipiter novaehollandiae grey goshawk e 1 0 0
Tyto novaehollandiae subsp.castanops
masked owl (tasmanian) e 1 0 1
Threatened fauna within 500 metres
Page 10 of 21
DEPARTMENT of PRIMARY INDUSTRIES and WATER 92

E: 502392 E: 513206N: 5401304 N: 5401304
E: 502392 E: 513206N: 5390344 N: 5390344
Threatened fauna within 5000 metres
Page 11 of 21
DEPARTMENT of PRIMARY INDUSTRIES and WATER 93
Threatened fauna within 5000 metres
Page 12 of 21
DEPARTMENT of PRIMARY INDUSTRIES and WATER 94

Threatened fauna within 5000 metres
(based on Habitat Mapping)
For more information about threatened species, please contact the Manager, Threatened Species Section.
Telephone: (03) 6233 8759
Email: [email protected]
ID Species Common Name SS NS Observers Date Location (GDA94)
1023559 Aquila audax subsp. fleayi wedge-tailed eagle e EN Leigh Walters 14-Jul-2008 504154,5396734 +/- 0m.
719995 Aquila audax subsp. fleayi wedge-tailed eagle e EN 31-Dec-1976? 507058,5396647 +/- 18500m.
1023558 Aquila audax subsp. fleayi wedge-tailed eagle e EN Leigh Walters 14-Jul-2008 504335,5396818 +/- 0m.
711563 Aquila audax subsp. fleayi wedge-tailed eagle e EN 03-Jun-1979? 507058,5396647 +/- 18500m.
343280 Aquila audax subsp. fleayi wedge-tailed eagle e EN Peter GCale 05-Feb-2001 503687,5397208 +/- 100m.
949440 Aquila audax subsp. fleayi wedge-tailed eagle e EN 01-Jan-1800 507613,5400184 +/- 200m.
1065974 Catadromus lacordairei catadromus carabid beetle v Simon Fearn 19-Jul-2007 505500,5394600 +/- 10m.
895939 Dasyurus maculatussubsp. maculatus
spotted-tailed quoll r VU K Little 07-May-1976? 508451,5400346 +/- 1850m.
877423 Lathamus discolor swift parrot e EN P Marmion 05-Oct-1988? 512612,5397183 +/- 3000m.
306078 Litoria raniformis green and golden frog v VU Stewart Blackhall 28-Oct-1992? 504712,5394183 +/- 1000m.
549457 Litoria raniformis green and golden frog v VU 07-Nov-1960? 511223,5394792 +/- 670m.
302546 Litoria raniformis green and golden frog v VU P Swatowski 510112,5395183 +/- 1000m.
305697 Litoria raniformis green and golden frog v VU Peter Brown 02-Jan-1994? 510312,5396583 +/- 1000m.
304639 Litoria raniformis green and golden frog v VU Peter Brown 02-Jan-1994? 509712,5396683 +/- 1000m.
305692 Litoria raniformis green and golden frog v VU Peter Brown 02-Jan-1994? 509112,5397583 +/- 1000m.
855365 Litoria raniformis green and golden frog v VU Jim Nelson 503712,5395183 +/- 100m.
895198 Perameles gunnii eastern barred bandicoot VU K Little 26-Aug-1973? 511223,5394792 +/- 1850m.
895449 Perameles gunnii eastern barred bandicoot VU K Little 511226,5396642 +/- 1850m.
895450 Perameles gunnii eastern barred bandicoot VU K Little 26-Aug-1973? 512612,5394789 +/- 1850m.
1075955 Sarcophilus harrisii tasmanian devil e EN Bill Cox 18-Nov-2004 504775,5394050 +/- 2m.
343298 Sarcophilus harrisii tasmanian devil e EN Peter GCale 05-Feb-2001 503687,5397208 +/- 100m.
359210 Tyto novaehollandiaesubsp. castanops
masked owl (tasmanian) e A Sayer 17-Sep-1963? 510945,5394792 +/- 9000m.
352373 Tyto novaehollandiaesubsp. castanops
masked owl (tasmanian) e 04-Sep-1973? 510112,5394933 +/- 1000m.
352266 Tyto novaehollandiaesubsp. castanops
masked owl (tasmanian) e Phil Bell 25-May-1996? 509487,5398183 +/- 100m.
Species Common Name SS NS Potential Known Core
Aquila audax subsp. fleayi wedge-tailed eagle e EN 1 0 0
Aquila audax wedge-tailed eagle pe PEN 1 0 0
Perameles gunnii eastern barred bandicoot VU 1 0 0
Pasmaditta jungermanniae snail (cataract gorge) v 1 0 0
Tyto novaehollandiae masked owl e 1 0 1
Galaxias fontanus swan galaxias e EN 1 0 0
Litoria raniformis green and golden frog v VU 1 0 0
Prototroctes maraena australian grayling v VU 1 0 0
Accipiter novaehollandiae grey goshawk e 1 0 0
Tyto novaehollandiae subsp.castanops
masked owl (tasmanian) e 1 0 1
Threatened fauna within 5000 metres
Page 13 of 21
DEPARTMENT of PRIMARY INDUSTRIES and WATER 95

E: 506393 E: 509207N: 5397304 N: 5397304
E: 506393 E: 509207N: 5394343 N: 5394343
TasVeg communities within 1000 metres
Page 14 of 21
DEPARTMENT of PRIMARY INDUSTRIES and WATER 96
TasVeg communities within 1000 metres
Page 15 of 21
DEPARTMENT of PRIMARY INDUSTRIES and WATER 97

For more information about TASVEG maps, please contact the Coordinator, Tasmanian Vegetation Mapping Program.
Telephone: (03) 6233 4501
Email: [email protected]
ID Code Community Emergent Species
101480319 FAG Agricultural land Eucalyptus amygdalina
101478373 DAZ Eucalyptus amygdalina inland forest and woodland on Cainozoic deposits
101478369 OAQ Water, sea
101478371 DVG Eucalyptus viminalis grassy forest and woodland
101478372 FUM Extra-urban miscellaneous
101480210 DAZ Eucalyptus amygdalina inland forest and woodland on Cainozoic deposits
101478368 OAQ Water, sea
101478367 OAQ Water, sea
101481079 FAG Agricultural land
101478370 FAG Agricultural land Eucalyptus amygdalina
TasVeg communities within 1000 metres
Page 16 of 21
DEPARTMENT of PRIMARY INDUSTRIES and WATER 98

*** No threatened non-forest communities found within 1000 metres. ***
Threatened non-forest communities within 1000 metres
Page 17 of 21
DEPARTMENT of PRIMARY INDUSTRIES and WATER 99

*** No Geoconservation sites found within 1000 metres. ***
Geoconservation sites within 1000 metres
Page 18 of 21
DEPARTMENT of PRIMARY INDUSTRIES and WATER 100

E: 506393 E: 509207N: 5397304 N: 5397304
E: 506393 E: 509207N: 5394343 N: 5394343
Private reserves within 1000 metres
Page 19 of 21
DEPARTMENT of PRIMARY INDUSTRIES and WATER 101

Private reserves within 1000 metres
Page 20 of 21
DEPARTMENT of PRIMARY INDUSTRIES and WATER 102

For more information about the Private Property Conservation Program, please contact the Manager, Private Property Conservation
Program.
Telephone: (03) 6233 6569
Email: [email protected]
CID Category Name Reserve ID
1109132 Conservation Covenant 10031
Private reserves within 1000 metres
Page 21 of 21
DEPARTMENT of PRIMARY INDUSTRIES and WATER 103

Appendix F: Air Dispersion Modell ing - Generator Exhaust
IMP Environmental - DPEMP
104

52 Grant Street, East Malvern 3145 A.C.N. 080 420 319 Tel: (61) (3) 9572 1303
Victoria, Australia Fax: (61) (3) 9572 1393
Email: [email protected] A.B.N. 35 080 420 319 Mobile: 0417 573 746
REPORT
Ausplume Air Dispersion Modelling of Emissions
from the proposed EcoSolutions Generator
IMP Environmental Pty Ltd, Tasmania
August 2010
105

Report: Ausplume Air Dispersion Modelling from the proposed Eco Solutions Generator Page 2
IMP Environmental Pty Ltd, Tasmania
August 2010
Report: Ausplume Air Dispersion Modelling of Emissions from the proposed EcoSolutions Generator
IMP Environmental Pty Ltd, Tasmania
Background
SEMF Pty Ltd commissioned Hodson & Associates Pty Ltd to conduct a series of Ausplume Air Dispersion
Modelling “runs” of emissions to air from the proposed Eco Solutions Generator, Tasmania. The key
objective of the air dispersion modelling was to assess the predicted level of compliance of the emissions
from the proposed Eco Solutions Generator with the Design Criteria stated in Schedule 2 of the Tasmanian
Environment Protection Policy (Air Quality) 2004. Hodson & Associates have successfully applied the
Victorian EPA approved Ausplume Air Dispersion Modelling software program to assist a wide range of
national, multi-national and local client organizations in their assessment of the predicted level of
compliance and/or impact of emissions from both planned and operating facilities with current
environmental requirements as defined in State environment protection policies.
Methodology
The Ausplume Air Dispersion Modelling of emissions was conducted by applying the current version,
Version 6, of the Victorian EPA Ausplume Gaussian Plume air dispersion model. The meteorological data
file (Modmetsamp.met) and terrain file (EcoSolutions_MGA25m.ter) were provided by the Tasmanian EPA.
Surrounding Terrain and Terrain File
The terrain surrounding the site consists of gentle rolling hills with the terrain rising to the west and falling
to the east. Wind patterns follow the terrain, therefore, as the plume travels from the site, it will be affected
by the terrain. The plume may also impact on elevated terrain surrounding the site, resulting in higher
pollutants concentrations at ground level (refer to diagram below).
It is therefore important to include the surrounding terrain within the Ausplume model, so its affect can be
considered. The terrain file supplied by EPA consists of a 101 x 101 grid over the area surrounding the site.
The graphic, overpage, provides details of the terrain surrounding the site (its location is marked with a ‘+’).
Plume Centre Line
106

Report: Ausplume Air Dispersion Modelling from the proposed Eco Solutions Generator Page 3
IMP Environmental Pty Ltd, Tasmania
August 2010
107

Report: Ausplume Air Dispersion Modelling from the proposed Eco Solutions Generator Page 4
IMP Environmental Pty Ltd, Tasmania
August 2010
Meteorological Data File
Weather conditions will affect the way a plume of air disperses. Therefore, the Ausplume model requires a
metrological file containing hourly meteorological data. A meteorological file was not available for the site.
In such instances, a "Metsamp" file is provided with the model which contains a sample of extreme weather
conditions which are likely to result in high ground level pollutant concentrations. The original metsamp file
only contains the various weather conditions in a single wind direction. This is suitable if the terrain is flat
and, therefore, the impact of the plume is similar in all directions. However, when terrain needs to be taken
into account (as in this case), a single wind direction will not assess the various impacts due to the differing
terrain profiles in each direction. Therefore, the metsamp file was modified by EPA, by replicating the
metsamp weather conditions in 10 degree increments over the full 360 degrees. In this manner, the
Ausplume model will be able to predict worst case ground level concentrations in each direction and include
the affect of the surrounding terrain.
Building Affects
Buildings and structures around an exhaust stack, including the building on which the stack is located, can
affect the way in which the exhaust plume is dispersed. Ausplume can include any large building or
structure and include its affect on the plume. For this exercise, several buildings and a large tank have been
included, as shown below (the blue coloured dot defines the relative location of the Generator exhaust
stack).
108

Report: Ausplume Air Dispersion Modelling from the proposed Eco Solutions Generator Page 5
IMP Environmental Pty Ltd, Tasmania
August 2010
+Ox & CO Emission Calculations
Emission data was sourced from the Generator engine manufacturer. This data had been corrected to "dry"
conditions. Table 1 shows the calculations that were used to determine the actual emission rate at the
discharge conditions.
Table 1 Calculated NOx and CO emission concentrations
+Ox (as +O2)
CO
Manufacturers Data in ppm
(dry and at discharge O2)
182 ppm 613 ppm
Emission data wet in ppm
(11% moisture)
182 x (100 - 11)% = 162 ppm 613 x (100 - 11)% = 546 ppm
Emission data in mg/m3 at 0
oC
162 / 22.4 x 46 = 333 mg/m3 546 / 22.4 x 28 = 683 mg/m
3
Emission data at 120oC (discharge
conditions)
333 x 273 / (273 + 120) = 231 mg/m3 683 x 273 / (273 + 120) = 474 mg/m
3
Sulphur Dioxide (SO2) and Hydrogen Sulphide (H2S) Emission Calculations
The engine supplier specified a maximum sulphur content in the fuel of 700 mg/10kWh of energy. By taking
this maximum sulphur content value, it is possible to calculate the amount of SO2 and Hydrogen Sulphide
emitted from the Generator. Note: All of the sulphur will normally oxidise to SO2, with only trace amounts
of H2S present. For the purposes of the Ausplume modelling exercise, a conservative approach was used
and, as such, 0.25% of the sulphur is assumed to be discharged as H2S.
Maximum sulphur content of biogas = 700 mg/10kWh = 70 mg/kWh
Fuel lower calorific value = 6.9 kWh/Nm3
Table 2 SO2 and H2S Calculations
Sulphur
Sulphur (mg/Nm3) 70 mg/kWh x 6.9 kWh/Nm
3 = 483 mg/Nm
3
SO2 H2S
99.75% of this sulphur
as SO2 & 0.25% as H2S
(@ 20oC)
483 mg/Nm3 x 99.75% x 64/32
= 963 mg/Nm3 H2S
483 mg/Nm3 x 0.25% x 34/32
= 1.28 mg/Nm3 H2S
Concentration at 120oC
(discharge conditions)
693 mg/Nm3 x (273 + 20) / (273 + 120)
= 718 mg/m3 SO2
1.28 mg/Nm3 x (273 + 20) / (273 + 120)
= 0.95 mg/m3 H2S
109
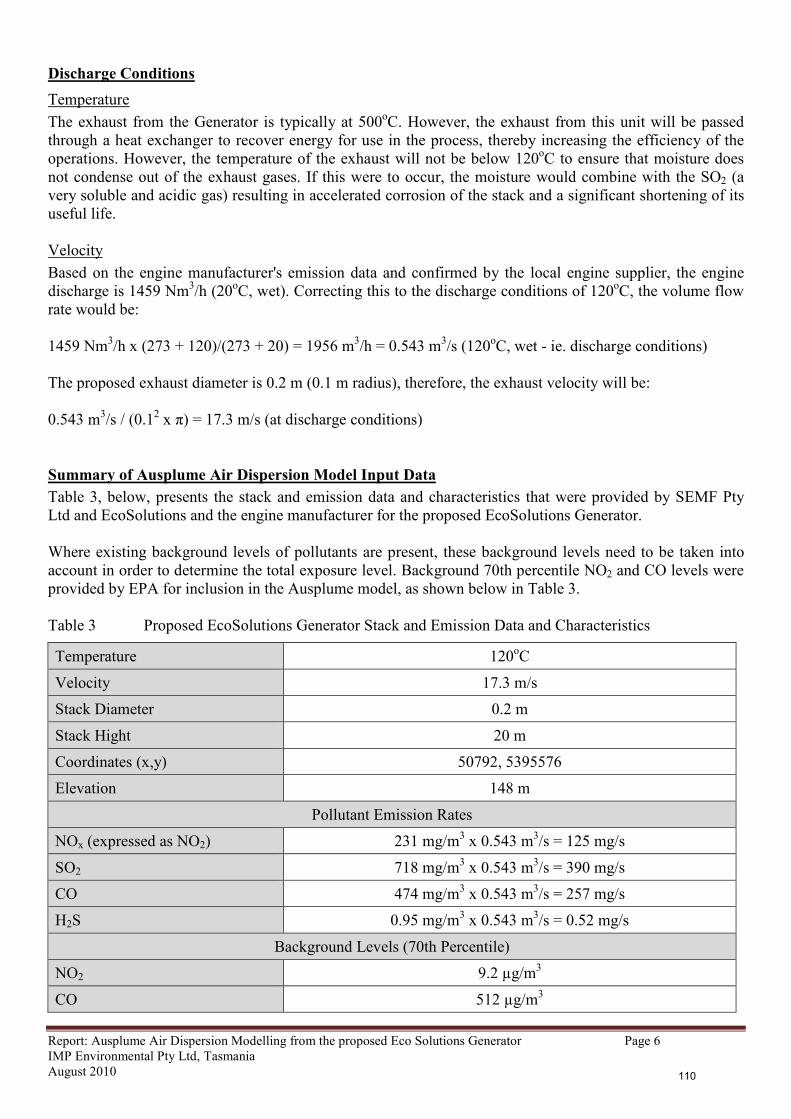
Report: Ausplume Air Dispersion Modelling from the proposed Eco Solutions Generator Page 6
IMP Environmental Pty Ltd, Tasmania
August 2010
Discharge Conditions
Temperature
The exhaust from the Generator is typically at 500oC. However, the exhaust from this unit will be passed
through a heat exchanger to recover energy for use in the process, thereby increasing the efficiency of the
operations. However, the temperature of the exhaust will not be below 120oC to ensure that moisture does
not condense out of the exhaust gases. If this were to occur, the moisture would combine with the SO2 (a
very soluble and acidic gas) resulting in accelerated corrosion of the stack and a significant shortening of its
useful life.
Velocity
Based on the engine manufacturer's emission data and confirmed by the local engine supplier, the engine
discharge is 1459 Nm3/h (20
oC, wet). Correcting this to the discharge conditions of 120
oC, the volume flow
rate would be:
1459 Nm3/h x (273 + 120)/(273 + 20) = 1956 m
3/h = 0.543 m
3/s (120
oC, wet - ie. discharge conditions)
The proposed exhaust diameter is 0.2 m (0.1 m radius), therefore, the exhaust velocity will be:
0.543 m3/s / (0.1
2 x π) = 17.3 m/s (at discharge conditions)
Summary of Ausplume Air Dispersion Model Input Data
Table 3, below, presents the stack and emission data and characteristics that were provided by SEMF Pty
Ltd and EcoSolutions and the engine manufacturer for the proposed EcoSolutions Generator.
Where existing background levels of pollutants are present, these background levels need to be taken into
account in order to determine the total exposure level. Background 70th percentile NO2 and CO levels were
provided by EPA for inclusion in the Ausplume model, as shown below in Table 3.
Table 3 Proposed EcoSolutions Generator Stack and Emission Data and Characteristics
Temperature 120oC
Velocity 17.3 m/s
Stack Diameter 0.2 m
Stack Hight 20 m
Coordinates (x,y) 50792, 5395576
Elevation 148 m
Pollutant Emission Rates
NOx (expressed as NO2) 231 mg/m3 x 0.543 m
3/s = 125 mg/s
SO2 718 mg/m3 x 0.543 m
3/s = 390 mg/s
CO 474 mg/m3 x 0.543 m
3/s = 257 mg/s
H2S 0.95 mg/m3 x 0.543 m
3/s = 0.52 mg/s
Background Levels (70th Percentile)
NO2 9.2 µg/m3
CO 512 µg/m3
110

Report: Ausplume Air Dispersion Modelling from the proposed Eco Solutions Generator Page 7
IMP Environmental Pty Ltd, Tasmania
August 2010
Ausplume Air Dispersion Model Results
Table 4, below, presents the outcome of the Ausplume Air Dispersion Model with a 20 m stack height. The
table presents comparison of the predicted 99.9th percentile concentration values for NO2, SO2 and H2S and
the maximum value for CO, along with the EPA’s Design Criteria.
Table 4 Comparison of EPA Design Criteria and Predicted Concentrations of Air Contaminants
Contaminant Averaging
Time
Design
Criteria (ppm) Design Criteria
(µg/m3 @ 20
oC)
Predicted 99.9th
percentile (µg/m3)*
% of Design
Criteria
NOx (as NO2) 1 hour 0.16 310 22.6 7%
SO2 1 hour 0.20 530 41.9 7.9%
H2S 3 minutes 0.0001 0.14 0.0958 68%
CO 8 hours 9 10,480 530 (maximum) 5%
* - All the maximum concentrations occur off-site.
Contour plots of the pollutant levels, along with the Ausplume model output files are presented in the
following pages.
In-Stack Pollutant Policy Limits
The Tasmanian EPA Air Policy also includes several in-stack pollutant limits. The only limit relevant to the
proposed Generator is the NO2 limit of 2 g/m3 @ 7% O2. As shown in the Table 3, the discharge from the
Generator is 0.231 g/m3 @ 7.8% O2 (0.245 g/m
3 @ 7% O2). Therefore, the discharge complies with the in-
stack EPA Air Policy limit.
Conclusion
The Ausplume Air Dispersion modelling reveals that the predicted concentrations of the majority of the air
contaminants are well below their respective Design Criteria. The predicted H2S content is 68% of the EPA
Design Criteria limit. Based on the emission data, the modelling and the conservative assumptions made
concerning the emission of H2S (assuming the maximum sulphur level in fuel, and that 0.25% of the sulphur
is converted to H2S), it is concluded that the emissions from a 20 m stack will comply with the Tasmanian
EPA Air Policy ground level Criteria and the in-stack limits.
Vic Natoli
Environmental Specialist – Auditor/ Ausplume Modelling
111

Rep
ort
: A
usp
lum
e A
ir D
isp
ersi
on M
od
elli
ng f
rom
the
pro
pose
d E
co S
olu
tio
ns
Gener
ato
r
P
age
8
IMP
Envir
on
menta
l P
ty L
td,
Tas
mania
Au
gu
st 2
01
0
112

Rep
ort
: A
usp
lum
e A
ir D
isp
ersi
on M
od
elli
ng f
rom
the
pro
pose
d E
co S
olu
tio
ns
Gener
ato
r
P
age
9
IMP
Envir
on
menta
l P
ty L
td,
Tas
mania
Au
gu
st 2
01
0
113

Rep
ort
: A
usp
lum
e A
ir D
isp
ersi
on M
od
elli
ng f
rom
the
pro
pose
d E
co S
olu
tio
ns
Gener
ato
r
P
age
10
IMP
Envir
on
menta
l P
ty L
td,
Tas
mania
Au
gu
st 2
01
0
114

Rep
ort
: A
usp
lum
e A
ir D
isp
ersi
on M
od
elli
ng f
rom
the
pro
pose
d E
co S
olu
tio
ns
Gener
ato
r
P
age
11
IMP
Envir
on
menta
l P
ty L
td,
Tas
mania
Au
gu
st 2
01
0
115

Report: Ausplume Air Dispersion Modelling from the proposed Eco Solutions Generator Page 12
IMP Environmental Pty Ltd, Tasmania
August 2010
AUSPLME MODEL OUTPUT FILES
1 ________________________________________________ Eco Solutions - NOx (Modifed Metsample File) ________________________________________________ Concentration or deposition Concentration Emission rate units grams/second Concentration units microgram/m3 Units conversion factor 1.00E+06 Constant background concentration 9.20E+00 Terrain effects Egan method Smooth stability class changes? No Other stability class adjustments ("urban modes") None Ignore building wake effects? No Decay coefficient (unless overridden by met. file) 0.000 Anemometer height 10 m Roughness height at the wind vane site 0.300 m Use the convective PDF algorithm? No DISPERSION CURVES Horizontal dispersion curves for sources <100m high Pasquill-Gifford Vertical dispersion curves for sources <100m high Pasquill-Gifford Horizontal dispersion curves for sources >100m high Briggs Rural Vertical dispersion curves for sources >100m high Briggs Rural Enhance horizontal plume spreads for buoyancy? Yes Enhance vertical plume spreads for buoyancy? Yes Adjust horizontal P-G formulae for roughness height? Yes Adjust vertical P-G formulae for roughness height? Yes Roughness height 0.400m Adjustment for wind directional shear None PLUME RISE OPTIONS Gradual plume rise? Yes Stack-tip downwash included? Yes Building downwash algorithm: PRIME method. Entrainment coeff. for neutral & stable lapse rates 0.60,0.60 Partial penetration of elevated inversions? No Disregard temp. gradients in the hourly met. file? No and in the absence of boundary-layer potential temperature gradients given by the hourly met. file, a value from the following table (in K/m) is used: Wind Speed Stability Class Category A B C D E F ________________________________________________________ 1 0.000 0.000 0.000 0.000 0.020 0.035 2 0.000 0.000 0.000 0.000 0.020 0.035 3 0.000 0.000 0.000 0.000 0.020 0.035 4 0.000 0.000 0.000 0.000 0.020 0.035 5 0.000 0.000 0.000 0.000 0.020 0.035 6 0.000 0.000 0.000 0.000 0.020 0.035 WIND SPEED CATEGORIES Boundaries between categories (in m/s) are: 1.54, 3.09, 5.14, 8.23, 10.80 WIND PROFILE EXPONENTS: "Irwin Rural" values (unless overridden by met. file) AVERAGING TIMES 1 hour _____________________________________________________________________________ 1 ________________________________________________ Eco Solutions - NOx (Modifed Metsample File)
116
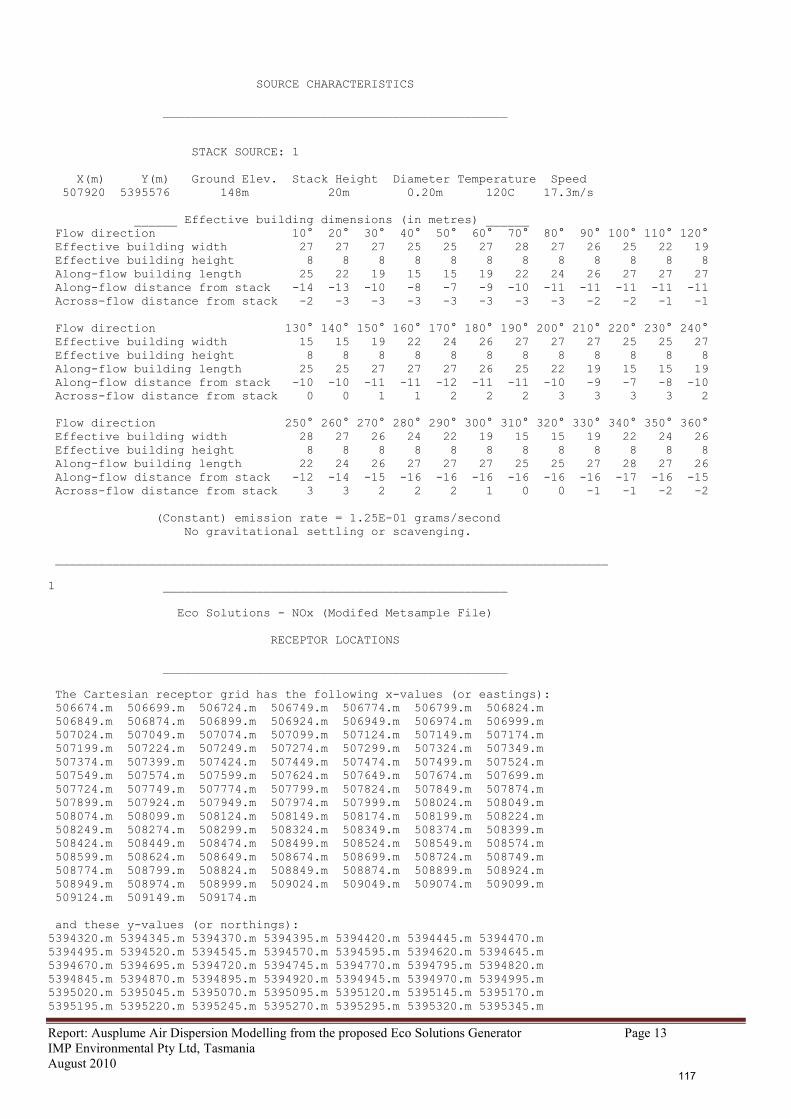
Report: Ausplume Air Dispersion Modelling from the proposed Eco Solutions Generator Page 13
IMP Environmental Pty Ltd, Tasmania
August 2010
SOURCE CHARACTERISTICS ________________________________________________ STACK SOURCE: 1 X(m) Y(m) Ground Elev. Stack Height Diameter Temperature Speed 507920 5395576 148m 20m 0.20m 120C 17.3m/s ______ Effective building dimensions (in metres) ______ Flow direction 10° 20° 30° 40° 50° 60° 70° 80° 90° 100° 110° 120° Effective building width 27 27 27 25 25 27 28 27 26 25 22 19 Effective building height 8 8 8 8 8 8 8 8 8 8 8 8 Along-flow building length 25 22 19 15 15 19 22 24 26 27 27 27 Along-flow distance from stack -14 -13 -10 -8 -7 -9 -10 -11 -11 -11 -11 -11 Across-flow distance from stack -2 -3 -3 -3 -3 -3 -3 -3 -2 -2 -1 -1 Flow direction 130° 140° 150° 160° 170° 180° 190° 200° 210° 220° 230° 240° Effective building width 15 15 19 22 24 26 27 27 27 25 25 27 Effective building height 8 8 8 8 8 8 8 8 8 8 8 8 Along-flow building length 25 25 27 27 27 26 25 22 19 15 15 19 Along-flow distance from stack -10 -10 -11 -11 -12 -11 -11 -10 -9 -7 -8 -10 Across-flow distance from stack 0 0 1 1 2 2 2 3 3 3 3 2 Flow direction 250° 260° 270° 280° 290° 300° 310° 320° 330° 340° 350° 360° Effective building width 28 27 26 24 22 19 15 15 19 22 24 26 Effective building height 8 8 8 8 8 8 8 8 8 8 8 8 Along-flow building length 22 24 26 27 27 27 25 25 27 28 27 26 Along-flow distance from stack -12 -14 -15 -16 -16 -16 -16 -16 -16 -17 -16 -15 Across-flow distance from stack 3 3 2 2 2 1 0 0 -1 -1 -2 -2 (Constant) emission rate = 1.25E-01 grams/second No gravitational settling or scavenging. _____________________________________________________________________________ 1 ________________________________________________ Eco Solutions - NOx (Modifed Metsample File) RECEPTOR LOCATIONS ________________________________________________ The Cartesian receptor grid has the following x-values (or eastings): 506674.m 506699.m 506724.m 506749.m 506774.m 506799.m 506824.m 506849.m 506874.m 506899.m 506924.m 506949.m 506974.m 506999.m 507024.m 507049.m 507074.m 507099.m 507124.m 507149.m 507174.m 507199.m 507224.m 507249.m 507274.m 507299.m 507324.m 507349.m 507374.m 507399.m 507424.m 507449.m 507474.m 507499.m 507524.m 507549.m 507574.m 507599.m 507624.m 507649.m 507674.m 507699.m 507724.m 507749.m 507774.m 507799.m 507824.m 507849.m 507874.m 507899.m 507924.m 507949.m 507974.m 507999.m 508024.m 508049.m 508074.m 508099.m 508124.m 508149.m 508174.m 508199.m 508224.m 508249.m 508274.m 508299.m 508324.m 508349.m 508374.m 508399.m 508424.m 508449.m 508474.m 508499.m 508524.m 508549.m 508574.m 508599.m 508624.m 508649.m 508674.m 508699.m 508724.m 508749.m 508774.m 508799.m 508824.m 508849.m 508874.m 508899.m 508924.m 508949.m 508974.m 508999.m 509024.m 509049.m 509074.m 509099.m 509124.m 509149.m 509174.m and these y-values (or northings): 5394320.m 5394345.m 5394370.m 5394395.m 5394420.m 5394445.m 5394470.m 5394495.m 5394520.m 5394545.m 5394570.m 5394595.m 5394620.m 5394645.m 5394670.m 5394695.m 5394720.m 5394745.m 5394770.m 5394795.m 5394820.m 5394845.m 5394870.m 5394895.m 5394920.m 5394945.m 5394970.m 5394995.m 5395020.m 5395045.m 5395070.m 5395095.m 5395120.m 5395145.m 5395170.m 5395195.m 5395220.m 5395245.m 5395270.m 5395295.m 5395320.m 5395345.m
117

Report: Ausplume Air Dispersion Modelling from the proposed Eco Solutions Generator Page 14
IMP Environmental Pty Ltd, Tasmania
August 2010
5395370.m 5395395.m 5395420.m 5395445.m 5395470.m 5395495.m 5395520.m 5395545.m 5395570.m 5395595.m 5395620.m 5395645.m 5395670.m 5395695.m 5395720.m 5395745.m 5395770.m 5395795.m 5395820.m 5395845.m 5395870.m 5395895.m 5395920.m 5395945.m 5395970.m 5395995.m 5396020.m 5396045.m 5396070.m 5396095.m 5396120.m 5396145.m 5396170.m 5396195.m 5396220.m 5396245.m 5396270.m 5396295.m 5396320.m 5396345.m 5396370.m 5396395.m 5396420.m 5396445.m 5396470.m 5396495.m 5396520.m 5396545.m 5396570.m 5396595.m 5396620.m 5396645.m 5396670.m 5396695.m 5396720.m 5396745.m 5396770.m 5396795.m 5396820.m DISCRETE RECEPTOR LOCATIONS (in metres) No. X Y ELEVN HEIGHT No. X Y ELEVN HEIGHT 1 507920 5395576 148.0 0.0 _____________________________________________________________________________ METEOROLOGICAL DATA : Modified METSAMP file. All directions in 10 degree i _____________________________________________________________________________ 1 Peak values for the 100 worst cases (in microgram/m3) Averaging time = 1 hour Rank Value Time Recorded Coordinates hour,date (* denotes polar) 1 2.49E+01 18,15/02/00 (507374, 5394920, 0.0) 2 2.48E+01 18,26/02/00 (507249, 5395020, 0.0) 3 2.47E+01 18,04/02/00 (507499, 5394845, 0.0) 4 2.45E+01 18,08/03/00 (507174, 5395145, 0.0) 5 2.42E+01 18,19/03/00 (507149, 5395295, 0.0) 6 2.40E+01 18,24/01/00 (507624, 5394770, 0.0) 7 2.40E+01 18,30/03/00 (507174, 5395445, 0.0) 8 2.29E+01 18,13/01/00 (507774, 5394795, 0.0) 9 2.26E+01 18,10/04/00 (507149, 5395570, 0.0) 10 2.21E+01 10,04/02/00 (507624, 5395070, 0.0) 11 2.21E+01 10,15/02/00 (507549, 5395145, 0.0) 12 2.20E+01 19,15/02/00 (507524, 5395095, 0.0) 13 2.20E+01 10,26/02/00 (507499, 5395220, 0.0) 14 2.20E+01 10,24/01/00 (507724, 5395045, 0.0) 15 2.20E+01 21,23/01/00 (507849, 5395395, 0.0) 16 2.20E+01 21,25/01/00 (507849, 5395395, 0.0) 17 2.20E+01 07,27/01/00 (507849, 5395395, 0.0) 18 2.20E+01 17,28/01/00 (507849, 5395395, 0.0) 19 2.20E+01 03,30/01/00 (507849, 5395395, 0.0) 20 2.20E+01 13,31/01/00 (507849, 5395395, 0.0) 21 2.20E+01 23,01/02/00 (507849, 5395395, 0.0) 22 2.19E+01 10,08/03/00 (507449, 5395295, 0.0) 23 2.19E+01 10,19/03/00 (507424, 5395395, 0.0) 24 2.19E+01 19,04/02/00 (507624, 5395070, 0.0) 25 2.19E+01 10,30/03/00 (507349, 5395470, 0.0) 26 2.19E+01 19,26/02/00 (507474, 5395195, 0.0) 27 2.18E+01 19,08/03/00 (507399, 5395270, 0.0) 28 2.17E+01 19,24/01/00 (507724, 5395045, 0.0) 29 2.17E+01 10,10/04/00 (507374, 5395570, 0.0) 30 2.17E+01 21,03/02/00 (507824, 5395420, 0.0) 31 2.17E+01 21,05/02/00 (507824, 5395420, 0.0) 32 2.17E+01 07,07/02/00 (507824, 5395420, 0.0) 33 2.17E+01 17,08/02/00 (507824, 5395420, 0.0) 34 2.17E+01 03,10/02/00 (507824, 5395420, 0.0) 35 2.17E+01 13,11/02/00 (507824, 5395420, 0.0) 36 2.17E+01 23,12/02/00 (507824, 5395420, 0.0) 37 2.17E+01 19,30/03/00 (507324, 5395470, 0.0) 38 2.17E+01 19,19/03/00 (507349, 5395370, 0.0) 39 2.16E+01 20,18/03/00 (507699, 5395495, 0.0) 40 2.16E+01 20,20/03/00 (507699, 5395495, 0.0)
118

Report: Ausplume Air Dispersion Modelling from the proposed Eco Solutions Generator Page 15
IMP Environmental Pty Ltd, Tasmania
August 2010
41 2.16E+01 06,22/03/00 (507699, 5395495, 0.0) 42 2.16E+01 16,23/03/00 (507699, 5395495, 0.0) 43 2.16E+01 02,25/03/00 (507699, 5395495, 0.0) 44 2.16E+01 12,26/03/00 (507699, 5395495, 0.0) 45 2.16E+01 22,27/03/00 (507699, 5395495, 0.0) 46 2.16E+01 21,01/01/00 (507924, 5395370, 0.0) 47 2.16E+01 21,03/01/00 (507924, 5395370, 0.0) 48 2.16E+01 07,05/01/00 (507924, 5395370, 0.0) 49 2.16E+01 17,06/01/00 (507924, 5395370, 0.0) 50 2.16E+01 03,08/01/00 (507924, 5395370, 0.0) 51 2.16E+01 13,09/01/00 (507924, 5395370, 0.0) 52 2.16E+01 23,10/01/00 (507924, 5395370, 0.0) 53 2.15E+01 21,07/03/00 (507749, 5395470, 0.0) 54 2.15E+01 21,09/03/00 (507749, 5395470, 0.0) 55 2.15E+01 07,11/03/00 (507749, 5395470, 0.0) 56 2.15E+01 17,12/03/00 (507749, 5395470, 0.0) 57 2.15E+01 03,14/03/00 (507749, 5395470, 0.0) 58 2.15E+01 13,15/03/00 (507749, 5395470, 0.0) 59 2.15E+01 23,16/03/00 (507749, 5395470, 0.0) 60 2.15E+01 20,12/01/00 (507874, 5395320, 0.0) 61 2.15E+01 20,14/01/00 (507874, 5395320, 0.0) 62 2.15E+01 06,16/01/00 (507874, 5395320, 0.0) 63 2.15E+01 16,17/01/00 (507874, 5395320, 0.0) 64 2.15E+01 02,19/01/00 (507874, 5395320, 0.0) 65 2.15E+01 12,20/01/00 (507874, 5395320, 0.0) 66 2.15E+01 22,21/01/00 (507874, 5395320, 0.0) 67 2.15E+01 11,04/02/00 (507749, 5395270, 0.0) 68 2.15E+01 21,12/01/00 (507874, 5395370, 0.0) 69 2.15E+01 21,14/01/00 (507874, 5395370, 0.0) 70 2.15E+01 07,16/01/00 (507874, 5395370, 0.0) 71 2.15E+01 17,17/01/00 (507874, 5395370, 0.0) 72 2.15E+01 03,19/01/00 (507874, 5395370, 0.0) 73 2.15E+01 13,20/01/00 (507874, 5395370, 0.0) 74 2.15E+01 23,21/01/00 (507874, 5395370, 0.0) 75 2.15E+01 21,29/03/00 (507724, 5395545, 0.0) 76 2.15E+01 21,31/03/00 (507724, 5395545, 0.0) 77 2.15E+01 07,02/04/00 (507724, 5395545, 0.0) 78 2.15E+01 17,03/04/00 (507724, 5395545, 0.0) 79 2.15E+01 03,05/04/00 (507724, 5395545, 0.0) 80 2.15E+01 13,06/04/00 (507724, 5395545, 0.0) 81 2.15E+01 23,07/04/00 (507724, 5395545, 0.0) 82 2.15E+01 20,03/02/00 (507799, 5395370, 0.0) 83 2.15E+01 20,05/02/00 (507799, 5395370, 0.0) 84 2.15E+01 06,07/02/00 (507799, 5395370, 0.0) 85 2.15E+01 16,08/02/00 (507799, 5395370, 0.0) 86 2.15E+01 02,10/02/00 (507799, 5395370, 0.0) 87 2.15E+01 12,11/02/00 (507799, 5395370, 0.0) 88 2.15E+01 22,12/02/00 (507799, 5395370, 0.0) 89 2.15E+01 10,13/01/00 (507824, 5395045, 0.0) 90 2.14E+01 20,23/01/00 (507824, 5395320, 0.0) 91 2.14E+01 20,25/01/00 (507824, 5395320, 0.0) 92 2.14E+01 06,27/01/00 (507824, 5395320, 0.0) 93 2.14E+01 16,28/01/00 (507824, 5395320, 0.0) 94 2.14E+01 02,30/01/00 (507824, 5395320, 0.0) 95 2.14E+01 12,31/01/00 (507824, 5395320, 0.0) 96 2.14E+01 22,01/02/00 (507824, 5395320, 0.0) 97 2.14E+01 21,18/03/00 (507749, 5395520, 0.0) 98 2.14E+01 21,20/03/00 (507749, 5395520, 0.0) 99 2.14E+01 07,22/03/00 (507749, 5395520, 0.0) 100 2.14E+01 23,27/03/00 (507749, 5395520, 0.0)
119

Report: Ausplume Air Dispersion Modelling from the proposed Eco Solutions Generator Page 16
IMP Environmental Pty Ltd, Tasmania
August 2010
1 ________________________________________________ Eco Solutions - SO2 (Modifed Metsample File) ________________________________________________ Concentration or deposition Concentration Emission rate units grams/second Concentration units microgram/m3 Units conversion factor 1.00E+06 Constant background concentration 0.00E+00 Terrain effects Egan method Smooth stability class changes? No Other stability class adjustments ("urban modes") None Ignore building wake effects? No Decay coefficient (unless overridden by met. file) 0.000 Anemometer height 10 m Roughness height at the wind vane site 0.300 m Use the convective PDF algorithm? No DISPERSION CURVES Horizontal dispersion curves for sources <100m high Pasquill-Gifford Vertical dispersion curves for sources <100m high Pasquill-Gifford Horizontal dispersion curves for sources >100m high Briggs Rural Vertical dispersion curves for sources >100m high Briggs Rural Enhance horizontal plume spreads for buoyancy? Yes Enhance vertical plume spreads for buoyancy? Yes Adjust horizontal P-G formulae for roughness height? Yes Adjust vertical P-G formulae for roughness height? Yes Roughness height 0.400m Adjustment for wind directional shear None PLUME RISE OPTIONS Gradual plume rise? Yes Stack-tip downwash included? Yes Building downwash algorithm: PRIME method. Entrainment coeff. for neutral & stable lapse rates 0.60,0.60 Partial penetration of elevated inversions? No Disregard temp. gradients in the hourly met. file? No and in the absence of boundary-layer potential temperature gradients given by the hourly met. file, a value from the following table (in K/m) is used: Wind Speed Stability Class Category A B C D E F ________________________________________________________ 1 0.000 0.000 0.000 0.000 0.020 0.035 2 0.000 0.000 0.000 0.000 0.020 0.035 3 0.000 0.000 0.000 0.000 0.020 0.035 4 0.000 0.000 0.000 0.000 0.020 0.035 5 0.000 0.000 0.000 0.000 0.020 0.035 6 0.000 0.000 0.000 0.000 0.020 0.035 WIND SPEED CATEGORIES Boundaries between categories (in m/s) are: 1.54, 3.09, 5.14, 8.23, 10.80 WIND PROFILE EXPONENTS: "Irwin Rural" values (unless overridden by met. file) AVERAGING TIMES 1 hour _____________________________________________________________________________ 1 ________________________________________________ Eco Solutions - SO2 (Modifed Metsample File) SOURCE CHARACTERISTICS
120

Report: Ausplume Air Dispersion Modelling from the proposed Eco Solutions Generator Page 17
IMP Environmental Pty Ltd, Tasmania
August 2010
________________________________________________ STACK SOURCE: 1 X(m) Y(m) Ground Elev. Stack Height Diameter Temperature Speed 507920 5395576 148m 20m 0.20m 120C 17.3m/s ______ Effective building dimensions (in metres) ______ Flow direction 10° 20° 30° 40° 50° 60° 70° 80° 90° 100° 110° 120° Effective building width 27 27 27 25 25 27 28 27 26 25 22 19 Effective building height 8 8 8 8 8 8 8 8 8 8 8 8 Along-flow building length 25 22 19 15 15 19 22 24 26 27 27 27 Along-flow distance from stack -14 -13 -10 -8 -7 -9 -10 -11 -11 -11 -11 -11 Across-flow distance from stack -2 -3 -3 -3 -3 -3 -3 -3 -2 -2 -1 -1 Flow direction 130° 140° 150° 160° 170° 180° 190° 200° 210° 220° 230° 240° Effective building width 15 15 19 22 24 26 27 27 27 25 25 27 Effective building height 8 8 8 8 8 8 8 8 8 8 8 8 Along-flow building length 25 25 27 27 27 26 25 22 19 15 15 19 Along-flow distance from stack -10 -10 -11 -11 -12 -11 -11 -10 -9 -7 -8 -10 Across-flow distance from stack 0 0 1 1 2 2 2 3 3 3 3 2 Flow direction 250° 260° 270° 280° 290° 300° 310° 320° 330° 340° 350° 360° Effective building width 28 27 26 24 22 19 15 15 19 22 24 26 Effective building height 8 8 8 8 8 8 8 8 8 8 8 8 Along-flow building length 22 24 26 27 27 27 25 25 27 28 27 26 Along-flow distance from stack -12 -14 -15 -16 -16 -16 -16 -16 -16 -17 -16 -15 Across-flow distance from stack 3 3 2 2 2 1 0 0 -1 -1 -2 -2 (Constant) emission rate = 3.90E-01 grams/second No gravitational settling or scavenging. _____________________________________________________________________________ 1 ________________________________________________ Eco Solutions - SO2 (Modifed Metsample File) RECEPTOR LOCATIONS ________________________________________________ The Cartesian receptor grid has the following x-values (or eastings): 506674.m 506699.m 506724.m 506749.m 506774.m 506799.m 506824.m 506849.m 506874.m 506899.m 506924.m 506949.m 506974.m 506999.m 507024.m 507049.m 507074.m 507099.m 507124.m 507149.m 507174.m 507199.m 507224.m 507249.m 507274.m 507299.m 507324.m 507349.m 507374.m 507399.m 507424.m 507449.m 507474.m 507499.m 507524.m 507549.m 507574.m 507599.m 507624.m 507649.m 507674.m 507699.m 507724.m 507749.m 507774.m 507799.m 507824.m 507849.m 507874.m 507899.m 507924.m 507949.m 507974.m 507999.m 508024.m 508049.m 508074.m 508099.m 508124.m 508149.m 508174.m 508199.m 508224.m 508249.m 508274.m 508299.m 508324.m 508349.m 508374.m 508399.m 508424.m 508449.m 508474.m 508499.m 508524.m 508549.m 508574.m 508599.m 508624.m 508649.m 508674.m 508699.m 508724.m 508749.m 508774.m 508799.m 508824.m 508849.m 508874.m 508899.m 508924.m 508949.m 508974.m 508999.m 509024.m 509049.m 509074.m 509099.m 509124.m 509149.m 509174.m and these y-values (or northings): 5394320.m 5394345.m 5394370.m 5394395.m 5394420.m 5394445.m 5394470.m 5394495.m 5394520.m 5394545.m 5394570.m 5394595.m 5394620.m 5394645.m 5394670.m 5394695.m 5394720.m 5394745.m 5394770.m 5394795.m 5394820.m 5394845.m 5394870.m 5394895.m 5394920.m 5394945.m 5394970.m 5394995.m 5395020.m 5395045.m 5395070.m 5395095.m 5395120.m 5395145.m 5395170.m 5395195.m 5395220.m 5395245.m 5395270.m 5395295.m 5395320.m 5395345.m 5395370.m 5395395.m 5395420.m 5395445.m 5395470.m 5395495.m 5395520.m 5395545.m 5395570.m 5395595.m 5395620.m 5395645.m 5395670.m 5395695.m 5395720.m 5395745.m 5395770.m 5395795.m 5395820.m 5395845.m 5395870.m
121

Report: Ausplume Air Dispersion Modelling from the proposed Eco Solutions Generator Page 18
IMP Environmental Pty Ltd, Tasmania
August 2010
5395895.m 5395920.m 5395945.m 5395970.m 5395995.m 5396020.m 5396045.m 5396070.m 5396095.m 5396120.m 5396145.m 5396170.m 5396195.m 5396220.m 5396245.m 5396270.m 5396295.m 5396320.m 5396345.m 5396370.m 5396395.m 5396420.m 5396445.m 5396470.m 5396495.m 5396520.m 5396545.m 5396570.m 5396595.m 5396620.m 5396645.m 5396670.m 5396695.m 5396720.m 5396745.m 5396770.m 5396795.m 5396820.m DISCRETE RECEPTOR LOCATIONS (in metres) No. X Y ELEVN HEIGHT No. X Y ELEVN HEIGHT 1 507920 5395576 148.0 0.0 _____________________________________________________________________________ METEOROLOGICAL DATA : Modified METSAMP file. All directions in 10 degree i _____________________________________________________________________________ 1 Peak values for the 100 worst cases (in microgram/m3) Averaging time = 1 hour Rank Value Time Recorded Coordinates hour,date (* denotes polar) 1 4.88E+01 18,15/02/00 (507374, 5394920, 0.0) 2 4.85E+01 18,26/02/00 (507249, 5395020, 0.0) 3 4.85E+01 18,04/02/00 (507499, 5394845, 0.0) 4 4.77E+01 18,08/03/00 (507174, 5395145, 0.0) 5 4.69E+01 18,19/03/00 (507149, 5395295, 0.0) 6 4.61E+01 18,24/01/00 (507624, 5394770, 0.0) 7 4.61E+01 18,30/03/00 (507174, 5395445, 0.0) 8 4.28E+01 18,13/01/00 (507774, 5394795, 0.0) 9 4.19E+01 18,10/04/00 (507149, 5395570, 0.0) 10 4.02E+01 10,04/02/00 (507624, 5395070, 0.0) 11 4.02E+01 10,15/02/00 (507549, 5395145, 0.0) 12 3.99E+01 19,15/02/00 (507524, 5395095, 0.0) 13 3.99E+01 10,26/02/00 (507499, 5395220, 0.0) 14 3.99E+01 10,24/01/00 (507724, 5395045, 0.0) 15 3.98E+01 21,23/01/00 (507849, 5395395, 0.0) 16 3.98E+01 21,25/01/00 (507849, 5395395, 0.0) 17 3.98E+01 07,27/01/00 (507849, 5395395, 0.0) 18 3.98E+01 17,28/01/00 (507849, 5395395, 0.0) 19 3.98E+01 03,30/01/00 (507849, 5395395, 0.0) 20 3.98E+01 13,31/01/00 (507849, 5395395, 0.0) 21 3.98E+01 23,01/02/00 (507849, 5395395, 0.0) 22 3.98E+01 10,08/03/00 (507449, 5395295, 0.0) 23 3.98E+01 10,19/03/00 (507424, 5395395, 0.0) 24 3.98E+01 19,04/02/00 (507624, 5395070, 0.0) 25 3.97E+01 10,30/03/00 (507349, 5395470, 0.0) 26 3.96E+01 19,26/02/00 (507474, 5395195, 0.0) 27 3.92E+01 19,08/03/00 (507399, 5395270, 0.0) 28 3.91E+01 19,24/01/00 (507724, 5395045, 0.0) 29 3.90E+01 10,10/04/00 (507374, 5395570, 0.0) 30 3.89E+01 21,03/02/00 (507824, 5395420, 0.0) 31 3.89E+01 21,05/02/00 (507824, 5395420, 0.0) 32 3.89E+01 07,07/02/00 (507824, 5395420, 0.0) 33 3.89E+01 17,08/02/00 (507824, 5395420, 0.0) 34 3.89E+01 03,10/02/00 (507824, 5395420, 0.0) 35 3.89E+01 13,11/02/00 (507824, 5395420, 0.0) 36 3.89E+01 23,12/02/00 (507824, 5395420, 0.0) 37 3.89E+01 19,30/03/00 (507324, 5395470, 0.0) 38 3.89E+01 19,19/03/00 (507349, 5395370, 0.0) 39 3.86E+01 20,18/03/00 (507699, 5395495, 0.0) 40 3.86E+01 20,20/03/00 (507699, 5395495, 0.0) 41 3.86E+01 06,22/03/00 (507699, 5395495, 0.0) 42 3.86E+01 16,23/03/00 (507699, 5395495, 0.0) 43 3.86E+01 02,25/03/00 (507699, 5395495, 0.0)
122

Report: Ausplume Air Dispersion Modelling from the proposed Eco Solutions Generator Page 19
IMP Environmental Pty Ltd, Tasmania
August 2010
44 3.86E+01 12,26/03/00 (507699, 5395495, 0.0) 45 3.86E+01 22,27/03/00 (507699, 5395495, 0.0) 46 3.86E+01 21,01/01/00 (507924, 5395370, 0.0) 47 3.86E+01 21,03/01/00 (507924, 5395370, 0.0) 48 3.86E+01 07,05/01/00 (507924, 5395370, 0.0) 49 3.86E+01 17,06/01/00 (507924, 5395370, 0.0) 50 3.86E+01 03,08/01/00 (507924, 5395370, 0.0) 51 3.86E+01 13,09/01/00 (507924, 5395370, 0.0) 52 3.86E+01 23,10/01/00 (507924, 5395370, 0.0) 53 3.85E+01 21,07/03/00 (507749, 5395470, 0.0) 54 3.85E+01 21,09/03/00 (507749, 5395470, 0.0) 55 3.85E+01 07,11/03/00 (507749, 5395470, 0.0) 56 3.85E+01 17,12/03/00 (507749, 5395470, 0.0) 57 3.85E+01 03,14/03/00 (507749, 5395470, 0.0) 58 3.85E+01 13,15/03/00 (507749, 5395470, 0.0) 59 3.85E+01 23,16/03/00 (507749, 5395470, 0.0) 60 3.85E+01 20,12/01/00 (507874, 5395320, 0.0) 61 3.85E+01 20,14/01/00 (507874, 5395320, 0.0) 62 3.85E+01 06,16/01/00 (507874, 5395320, 0.0) 63 3.85E+01 16,17/01/00 (507874, 5395320, 0.0) 64 3.85E+01 02,19/01/00 (507874, 5395320, 0.0) 65 3.85E+01 12,20/01/00 (507874, 5395320, 0.0) 66 3.85E+01 22,21/01/00 (507874, 5395320, 0.0) 67 3.84E+01 11,04/02/00 (507749, 5395270, 0.0) 68 3.83E+01 21,12/01/00 (507874, 5395370, 0.0) 69 3.83E+01 21,14/01/00 (507874, 5395370, 0.0) 70 3.83E+01 07,16/01/00 (507874, 5395370, 0.0) 71 3.83E+01 17,17/01/00 (507874, 5395370, 0.0) 72 3.83E+01 03,19/01/00 (507874, 5395370, 0.0) 73 3.83E+01 13,20/01/00 (507874, 5395370, 0.0) 74 3.83E+01 23,21/01/00 (507874, 5395370, 0.0) 75 3.83E+01 21,29/03/00 (507724, 5395545, 0.0) 76 3.83E+01 21,31/03/00 (507724, 5395545, 0.0) 77 3.83E+01 07,02/04/00 (507724, 5395545, 0.0) 78 3.83E+01 17,03/04/00 (507724, 5395545, 0.0) 79 3.83E+01 03,05/04/00 (507724, 5395545, 0.0) 80 3.83E+01 13,06/04/00 (507724, 5395545, 0.0) 81 3.83E+01 23,07/04/00 (507724, 5395545, 0.0) 82 3.83E+01 20,03/02/00 (507799, 5395370, 0.0) 83 3.83E+01 20,05/02/00 (507799, 5395370, 0.0) 84 3.83E+01 06,07/02/00 (507799, 5395370, 0.0) 85 3.83E+01 16,08/02/00 (507799, 5395370, 0.0) 86 3.83E+01 02,10/02/00 (507799, 5395370, 0.0) 87 3.83E+01 12,11/02/00 (507799, 5395370, 0.0) 88 3.83E+01 22,12/02/00 (507799, 5395370, 0.0) 89 3.82E+01 10,13/01/00 (507824, 5395045, 0.0) 90 3.82E+01 20,23/01/00 (507824, 5395320, 0.0) 91 3.82E+01 20,25/01/00 (507824, 5395320, 0.0) 92 3.82E+01 06,27/01/00 (507824, 5395320, 0.0) 93 3.82E+01 16,28/01/00 (507824, 5395320, 0.0) 94 3.82E+01 02,30/01/00 (507824, 5395320, 0.0) 95 3.82E+01 12,31/01/00 (507824, 5395320, 0.0) 96 3.82E+01 22,01/02/00 (507824, 5395320, 0.0) 97 3.82E+01 21,18/03/00 (507749, 5395520, 0.0) 98 3.82E+01 21,20/03/00 (507749, 5395520, 0.0) 99 3.82E+01 07,22/03/00 (507749, 5395520, 0.0) 100 3.82E+01 23,27/03/00 (507749, 5395520, 0.0)
123

Report: Ausplume Air Dispersion Modelling from the proposed Eco Solutions Generator Page 20
IMP Environmental Pty Ltd, Tasmania
August 2010
1 ________________________________________________ Eco Solutions - H2S (Modifed Metsample File) ________________________________________________ Concentration or deposition Concentration Emission rate units grams/second Concentration units microgram/m3 Units conversion factor 1.00E+06 Constant background concentration 0.00E+00 Terrain effects Egan method Smooth stability class changes? No Other stability class adjustments ("urban modes") None Ignore building wake effects? No Decay coefficient (unless overridden by met. file) 0.000 Anemometer height 10 m Roughness height at the wind vane site 0.300 m Use the convective PDF algorithm? No DISPERSION CURVES Horizontal dispersion curves for sources <100m high Pasquill-Gifford Vertical dispersion curves for sources <100m high Pasquill-Gifford Horizontal dispersion curves for sources >100m high Briggs Rural Vertical dispersion curves for sources >100m high Briggs Rural Enhance horizontal plume spreads for buoyancy? Yes Enhance vertical plume spreads for buoyancy? Yes Adjust horizontal P-G formulae for roughness height? Yes Adjust vertical P-G formulae for roughness height? Yes Roughness height 0.400m Adjustment for wind directional shear None PLUME RISE OPTIONS Gradual plume rise? Yes Stack-tip downwash included? Yes Building downwash algorithm: PRIME method. Entrainment coeff. for neutral & stable lapse rates 0.60,0.60 Partial penetration of elevated inversions? No Disregard temp. gradients in the hourly met. file? No and in the absence of boundary-layer potential temperature gradients given by the hourly met. file, a value from the following table (in K/m) is used: Wind Speed Stability Class Category A B C D E F ________________________________________________________ 1 0.000 0.000 0.000 0.000 0.020 0.035 2 0.000 0.000 0.000 0.000 0.020 0.035 3 0.000 0.000 0.000 0.000 0.020 0.035 4 0.000 0.000 0.000 0.000 0.020 0.035 5 0.000 0.000 0.000 0.000 0.020 0.035 6 0.000 0.000 0.000 0.000 0.020 0.035 WIND SPEED CATEGORIES Boundaries between categories (in m/s) are: 1.54, 3.09, 5.14, 8.23, 10.80 WIND PROFILE EXPONENTS: "Irwin Rural" values (unless overridden by met. file) AVERAGING TIME: 3 minutes. _____________________________________________________________________________ 1 ________________________________________________ Eco Solutions - H2S (Modifed Metsample File) SOURCE CHARACTERISTICS ________________________________________________
124

Report: Ausplume Air Dispersion Modelling from the proposed Eco Solutions Generator Page 21
IMP Environmental Pty Ltd, Tasmania
August 2010
STACK SOURCE: 1 X(m) Y(m) Ground Elev. Stack Height Diameter Temperature Speed 507920 5395576 148m 20m 0.20m 120C 17.3m/s ______ Effective building dimensions (in metres) ______ Flow direction 10° 20° 30° 40° 50° 60° 70° 80° 90° 100° 110° 120° Effective building width 27 27 27 25 25 27 28 27 26 25 22 19 Effective building height 8 8 8 8 8 8 8 8 8 8 8 8 Along-flow building length 25 22 19 15 15 19 22 24 26 27 27 27 Along-flow distance from stack -14 -13 -10 -8 -7 -9 -10 -11 -11 -11 -11 -11 Across-flow distance from stack -2 -3 -3 -3 -3 -3 -3 -3 -2 -2 -1 -1 Flow direction 130° 140° 150° 160° 170° 180° 190° 200° 210° 220° 230° 240° Effective building width 15 15 19 22 24 26 27 27 27 25 25 27 Effective building height 8 8 8 8 8 8 8 8 8 8 8 8 Along-flow building length 25 25 27 27 27 26 25 22 19 15 15 19 Along-flow distance from stack -10 -10 -11 -11 -12 -11 -11 -10 -9 -7 -8 -10 Across-flow distance from stack 0 0 1 1 2 2 2 3 3 3 3 2 Flow direction 250° 260° 270° 280° 290° 300° 310° 320° 330° 340° 350° 360° Effective building width 28 27 26 24 22 19 15 15 19 22 24 26 Effective building height 8 8 8 8 8 8 8 8 8 8 8 8 Along-flow building length 22 24 26 27 27 27 25 25 27 28 27 26 Along-flow distance from stack -12 -14 -15 -16 -16 -16 -16 -16 -16 -17 -16 -15 Across-flow distance from stack 3 3 2 2 2 1 0 0 -1 -1 -2 -2 (Constant) emission rate = 5.20E-04 grams/second No gravitational settling or scavenging. _____________________________________________________________________________ 1 ________________________________________________ Eco Solutions - H2S (Modifed Metsample File) RECEPTOR LOCATIONS ________________________________________________ The Cartesian receptor grid has the following x-values (or eastings): 506674.m 506699.m 506724.m 506749.m 506774.m 506799.m 506824.m 506849.m 506874.m 506899.m 506924.m 506949.m 506974.m 506999.m 507024.m 507049.m 507074.m 507099.m 507124.m 507149.m 507174.m 507199.m 507224.m 507249.m 507274.m 507299.m 507324.m 507349.m 507374.m 507399.m 507424.m 507449.m 507474.m 507499.m 507524.m 507549.m 507574.m 507599.m 507624.m 507649.m 507674.m 507699.m 507724.m 507749.m 507774.m 507799.m 507824.m 507849.m 507874.m 507899.m 507924.m 507949.m 507974.m 507999.m 508024.m 508049.m 508074.m 508099.m 508124.m 508149.m 508174.m 508199.m 508224.m 508249.m 508274.m 508299.m 508324.m 508349.m 508374.m 508399.m 508424.m 508449.m 508474.m 508499.m 508524.m 508549.m 508574.m 508599.m 508624.m 508649.m 508674.m 508699.m 508724.m 508749.m 508774.m 508799.m 508824.m 508849.m 508874.m 508899.m 508924.m 508949.m 508974.m 508999.m 509024.m 509049.m 509074.m 509099.m 509124.m 509149.m 509174.m and these y-values (or northings): 5394320.m 5394345.m 5394370.m 5394395.m 5394420.m 5394445.m 5394470.m 5394495.m 5394520.m 5394545.m 5394570.m 5394595.m 5394620.m 5394645.m 5394670.m 5394695.m 5394720.m 5394745.m 5394770.m 5394795.m 5394820.m 5394845.m 5394870.m 5394895.m 5394920.m 5394945.m 5394970.m 5394995.m 5395020.m 5395045.m 5395070.m 5395095.m 5395120.m 5395145.m 5395170.m 5395195.m 5395220.m 5395245.m 5395270.m 5395295.m 5395320.m 5395345.m 5395370.m 5395395.m 5395420.m 5395445.m 5395470.m 5395495.m 5395520.m 5395545.m 5395570.m 5395595.m 5395620.m 5395645.m 5395670.m 5395695.m 5395720.m 5395745.m 5395770.m 5395795.m 5395820.m 5395845.m 5395870.m 5395895.m 5395920.m 5395945.m 5395970.m 5395995.m 5396020.m 5396045.m
125

Report: Ausplume Air Dispersion Modelling from the proposed Eco Solutions Generator Page 22
IMP Environmental Pty Ltd, Tasmania
August 2010
5396070.m 5396095.m 5396120.m 5396145.m 5396170.m 5396195.m 5396220.m 5396245.m 5396270.m 5396295.m 5396320.m 5396345.m 5396370.m 5396395.m 5396420.m 5396445.m 5396470.m 5396495.m 5396520.m 5396545.m 5396570.m 5396595.m 5396620.m 5396645.m 5396670.m 5396695.m 5396720.m 5396745.m 5396770.m 5396795.m 5396820.m DISCRETE RECEPTOR LOCATIONS (in metres) No. X Y ELEVN HEIGHT No. X Y ELEVN HEIGHT 1 507920 5395576 148.0 0.0 _____________________________________________________________________________ METEOROLOGICAL DATA : Modified METSAMP file. All directions in 10 degree i _____________________________________________________________________________ 1 Peak values for the 100 worst cases (in microgram/m3) Averaging time = 3 minutes Rank Value Time Recorded Coordinates hour,date (* denotes polar) 1 1.13E-01 18,15/02/00 (507349, 5394895, 0.0) 2 1.13E-01 18,26/02/00 (507224, 5394995, 0.0) 3 1.12E-01 18,04/02/00 (507499, 5394845, 0.0) 4 1.10E-01 18,08/03/00 (507174, 5395145, 0.0) 5 1.08E-01 18,19/03/00 (507074, 5395270, 0.0) 6 1.06E-01 18,24/01/00 (507624, 5394770, 0.0) 7 1.06E-01 18,30/03/00 (507174, 5395445, 0.0) 8 9.77E-02 18,13/01/00 (507774, 5394770, 0.0) 9 9.58E-02 18,10/04/00 (507124, 5395570, 0.0) 10 9.38E-02 10,04/02/00 (507624, 5395070, 0.0) 11 9.38E-02 10,15/02/00 (507549, 5395145, 0.0) 12 9.36E-02 10,26/02/00 (507499, 5395220, 0.0) 13 9.25E-02 10,24/01/00 (507724, 5395045, 0.0) 14 9.25E-02 10,08/03/00 (507399, 5395270, 0.0) 15 9.21E-02 10,30/03/00 (507324, 5395470, 0.0) 16 9.19E-02 10,19/03/00 (507349, 5395370, 0.0) 17 9.04E-02 10,10/04/00 (507349, 5395570, 0.0) 18 8.89E-02 19,15/02/00 (507499, 5395070, 0.0) 19 8.86E-02 10,13/01/00 (507824, 5395020, 0.0) 20 8.80E-02 19,04/02/00 (507599, 5395020, 0.0) 21 8.74E-02 19,26/02/00 (507474, 5395195, 0.0) 22 8.65E-02 19,08/03/00 (507349, 5395245, 0.0) 23 8.58E-02 19,30/03/00 (507324, 5395470, 0.0) 24 8.57E-02 19,19/03/00 (507349, 5395370, 0.0) 25 8.55E-02 19,24/01/00 (507724, 5395045, 0.0) 26 8.54E-02 18,21/04/00 (507099, 5395720, 0.0) 27 8.48E-02 10,21/04/00 (507374, 5395670, 0.0) 28 8.40E-02 20,12/01/00 (507874, 5395320, 0.0) 29 8.40E-02 20,14/01/00 (507874, 5395320, 0.0) 30 8.40E-02 06,16/01/00 (507874, 5395320, 0.0) 31 8.40E-02 16,17/01/00 (507874, 5395320, 0.0) 32 8.40E-02 02,19/01/00 (507874, 5395320, 0.0) 33 8.40E-02 12,20/01/00 (507874, 5395320, 0.0) 34 8.40E-02 22,21/01/00 (507874, 5395320, 0.0) 35 8.39E-02 20,23/01/00 (507824, 5395320, 0.0) 36 8.39E-02 20,25/01/00 (507824, 5395320, 0.0) 37 8.39E-02 06,27/01/00 (507824, 5395320, 0.0) 38 8.39E-02 16,28/01/00 (507824, 5395320, 0.0) 39 8.39E-02 02,30/01/00 (507824, 5395320, 0.0) 40 8.39E-02 12,31/01/00 (507824, 5395320, 0.0) 41 8.39E-02 22,01/02/00 (507824, 5395320, 0.0) 42 8.38E-02 20,07/03/00 (507699, 5395445, 0.0) 43 8.38E-02 20,09/03/00 (507699, 5395445, 0.0) 44 8.38E-02 06,11/03/00 (507699, 5395445, 0.0)
126
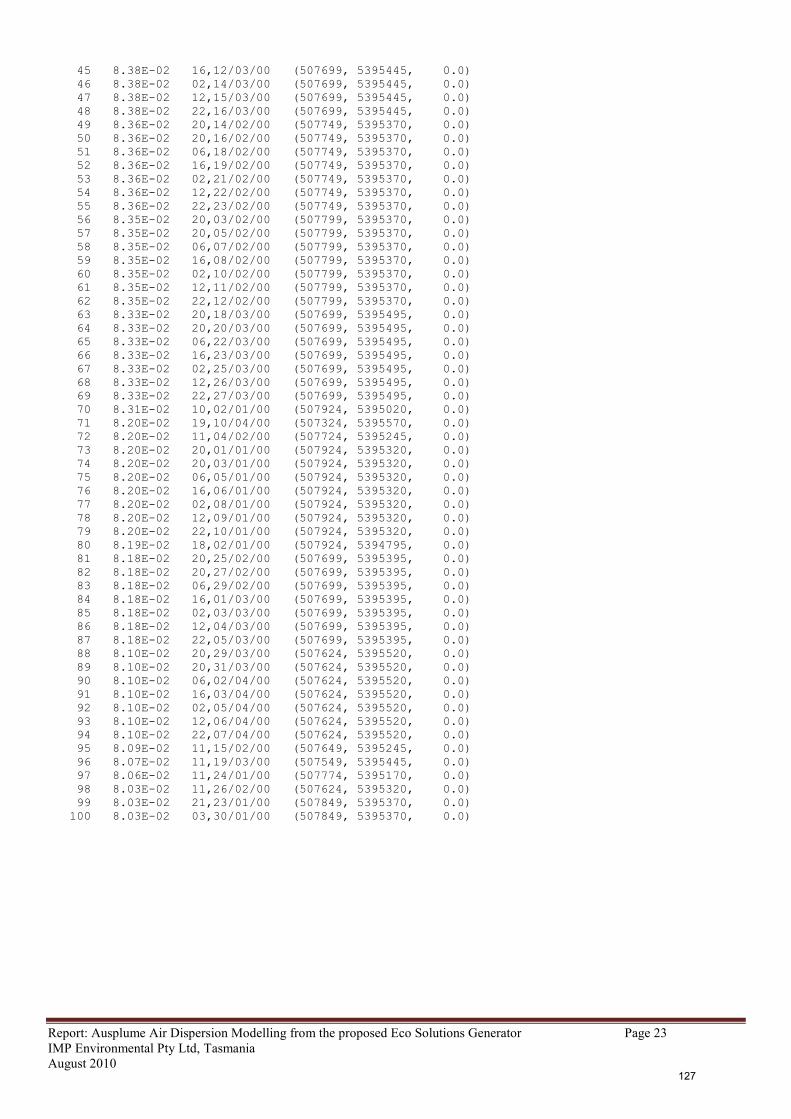
Report: Ausplume Air Dispersion Modelling from the proposed Eco Solutions Generator Page 23
IMP Environmental Pty Ltd, Tasmania
August 2010
45 8.38E-02 16,12/03/00 (507699, 5395445, 0.0) 46 8.38E-02 02,14/03/00 (507699, 5395445, 0.0) 47 8.38E-02 12,15/03/00 (507699, 5395445, 0.0) 48 8.38E-02 22,16/03/00 (507699, 5395445, 0.0) 49 8.36E-02 20,14/02/00 (507749, 5395370, 0.0) 50 8.36E-02 20,16/02/00 (507749, 5395370, 0.0) 51 8.36E-02 06,18/02/00 (507749, 5395370, 0.0) 52 8.36E-02 16,19/02/00 (507749, 5395370, 0.0) 53 8.36E-02 02,21/02/00 (507749, 5395370, 0.0) 54 8.36E-02 12,22/02/00 (507749, 5395370, 0.0) 55 8.36E-02 22,23/02/00 (507749, 5395370, 0.0) 56 8.35E-02 20,03/02/00 (507799, 5395370, 0.0) 57 8.35E-02 20,05/02/00 (507799, 5395370, 0.0) 58 8.35E-02 06,07/02/00 (507799, 5395370, 0.0) 59 8.35E-02 16,08/02/00 (507799, 5395370, 0.0) 60 8.35E-02 02,10/02/00 (507799, 5395370, 0.0) 61 8.35E-02 12,11/02/00 (507799, 5395370, 0.0) 62 8.35E-02 22,12/02/00 (507799, 5395370, 0.0) 63 8.33E-02 20,18/03/00 (507699, 5395495, 0.0) 64 8.33E-02 20,20/03/00 (507699, 5395495, 0.0) 65 8.33E-02 06,22/03/00 (507699, 5395495, 0.0) 66 8.33E-02 16,23/03/00 (507699, 5395495, 0.0) 67 8.33E-02 02,25/03/00 (507699, 5395495, 0.0) 68 8.33E-02 12,26/03/00 (507699, 5395495, 0.0) 69 8.33E-02 22,27/03/00 (507699, 5395495, 0.0) 70 8.31E-02 10,02/01/00 (507924, 5395020, 0.0) 71 8.20E-02 19,10/04/00 (507324, 5395570, 0.0) 72 8.20E-02 11,04/02/00 (507724, 5395245, 0.0) 73 8.20E-02 20,01/01/00 (507924, 5395320, 0.0) 74 8.20E-02 20,03/01/00 (507924, 5395320, 0.0) 75 8.20E-02 06,05/01/00 (507924, 5395320, 0.0) 76 8.20E-02 16,06/01/00 (507924, 5395320, 0.0) 77 8.20E-02 02,08/01/00 (507924, 5395320, 0.0) 78 8.20E-02 12,09/01/00 (507924, 5395320, 0.0) 79 8.20E-02 22,10/01/00 (507924, 5395320, 0.0) 80 8.19E-02 18,02/01/00 (507924, 5394795, 0.0) 81 8.18E-02 20,25/02/00 (507699, 5395395, 0.0) 82 8.18E-02 20,27/02/00 (507699, 5395395, 0.0) 83 8.18E-02 06,29/02/00 (507699, 5395395, 0.0) 84 8.18E-02 16,01/03/00 (507699, 5395395, 0.0) 85 8.18E-02 02,03/03/00 (507699, 5395395, 0.0) 86 8.18E-02 12,04/03/00 (507699, 5395395, 0.0) 87 8.18E-02 22,05/03/00 (507699, 5395395, 0.0) 88 8.10E-02 20,29/03/00 (507624, 5395520, 0.0) 89 8.10E-02 20,31/03/00 (507624, 5395520, 0.0) 90 8.10E-02 06,02/04/00 (507624, 5395520, 0.0) 91 8.10E-02 16,03/04/00 (507624, 5395520, 0.0) 92 8.10E-02 02,05/04/00 (507624, 5395520, 0.0) 93 8.10E-02 12,06/04/00 (507624, 5395520, 0.0) 94 8.10E-02 22,07/04/00 (507624, 5395520, 0.0) 95 8.09E-02 11,15/02/00 (507649, 5395245, 0.0) 96 8.07E-02 11,19/03/00 (507549, 5395445, 0.0) 97 8.06E-02 11,24/01/00 (507774, 5395170, 0.0) 98 8.03E-02 11,26/02/00 (507624, 5395320, 0.0) 99 8.03E-02 21,23/01/00 (507849, 5395370, 0.0) 100 8.03E-02 03,30/01/00 (507849, 5395370, 0.0)
127

Report: Ausplume Air Dispersion Modelling from the proposed Eco Solutions Generator Page 24
IMP Environmental Pty Ltd, Tasmania
August 2010
1 _______________________________________________ Eco Solutions - CO (Modifed Metsample File) _______________________________________________ Concentration or deposition Concentration Emission rate units grams/second Concentration units microgram/m3 Units conversion factor 1.00E+06 Constant background concentration 5.12E+02 Terrain effects Egan method Smooth stability class changes? No Other stability class adjustments ("urban modes") None Ignore building wake effects? No Decay coefficient (unless overridden by met. file) 0.000 Anemometer height 10 m Roughness height at the wind vane site 0.300 m Use the convective PDF algorithm? No Averaging time for sigma-theta values 60 min. DISPERSION CURVES Horizontal dispersion curves for sources <100m high Sigma-theta Vertical dispersion curves for sources <100m high Pasquill-Gifford Horizontal dispersion curves for sources >100m high Briggs Rural Vertical dispersion curves for sources >100m high Briggs Rural Enhance horizontal plume spreads for buoyancy? Yes Enhance vertical plume spreads for buoyancy? Yes Adjust horizontal P-G formulae for roughness height? Yes Adjust vertical P-G formulae for roughness height? Yes Roughness height 0.400m Adjustment for wind directional shear None PLUME RISE OPTIONS Gradual plume rise? Yes Stack-tip downwash included? Yes Building downwash algorithm: PRIME method. Entrainment coeff. for neutral & stable lapse rates 0.60,0.60 Partial penetration of elevated inversions? No Disregard temp. gradients in the hourly met. file? No and in the absence of boundary-layer potential temperature gradients given by the hourly met. file, a value from the following table (in K/m) is used: Wind Speed Stability Class Category A B C D E F ________________________________________________________ 1 0.000 0.000 0.000 0.000 0.020 0.035 2 0.000 0.000 0.000 0.000 0.020 0.035 3 0.000 0.000 0.000 0.000 0.020 0.035 4 0.000 0.000 0.000 0.000 0.020 0.035 5 0.000 0.000 0.000 0.000 0.020 0.035 6 0.000 0.000 0.000 0.000 0.020 0.035 WIND SPEED CATEGORIES Boundaries between categories (in m/s) are: 1.54, 3.09, 5.14, 8.23, 10.80 WIND PROFILE EXPONENTS: "Irwin Rural" values (unless overridden by met. file) AVERAGING TIMES 8 hours _____________________________________________________________________________ 1 _______________________________________________ Eco Solutions - CO (Modifed Metsample File) SOURCE CHARACTERISTICS
128

Report: Ausplume Air Dispersion Modelling from the proposed Eco Solutions Generator Page 25
IMP Environmental Pty Ltd, Tasmania
August 2010
_______________________________________________ STACK SOURCE: 1 X(m) Y(m) Ground Elev. Stack Height Diameter Temperature Speed 507920 5395576 148m 20m 0.20m 120C 17.3m/s ______ Effective building dimensions (in metres) ______ Flow direction 10° 20° 30° 40° 50° 60° 70° 80° 90° 100° 110° 120° Effective building width 27 27 27 25 25 27 28 27 26 25 22 19 Effective building height 8 8 8 8 8 8 8 8 8 8 8 8 Along-flow building length 25 22 19 15 15 19 22 24 26 27 27 27 Along-flow distance from stack -14 -13 -10 -8 -7 -9 -10 -11 -11 -11 -11 -11 Across-flow distance from stack -2 -3 -3 -3 -3 -3 -3 -3 -2 -2 -1 -1 Flow direction 130° 140° 150° 160° 170° 180° 190° 200° 210° 220° 230° 240° Effective building width 15 15 19 22 24 26 27 27 27 25 25 27 Effective building height 8 8 8 8 8 8 8 8 8 8 8 8 Along-flow building length 25 25 27 27 27 26 25 22 19 15 15 19 Along-flow distance from stack -10 -10 -11 -11 -12 -11 -11 -10 -9 -7 -8 -10 Across-flow distance from stack 0 0 1 1 2 2 2 3 3 3 3 2 Flow direction 250° 260° 270° 280° 290° 300° 310° 320° 330° 340° 350° 360° Effective building width 28 27 26 24 22 19 15 15 19 22 24 26 Effective building height 8 8 8 8 8 8 8 8 8 8 8 8 Along-flow building length 22 24 26 27 27 27 25 25 27 28 27 26 Along-flow distance from stack -12 -14 -15 -16 -16 -16 -16 -16 -16 -17 -16 -15 Across-flow distance from stack 3 3 2 2 2 1 0 0 -1 -1 -2 -2 (Constant) emission rate = 2.57E-01 grams/second No gravitational settling or scavenging. _____________________________________________________________________________ 1 _______________________________________________ Eco Solutions - CO (Modifed Metsample File) RECEPTOR LOCATIONS _______________________________________________ The Cartesian receptor grid has the following x-values (or eastings): 506674.m 506699.m 506724.m 506749.m 506774.m 506799.m 506824.m 506849.m 506874.m 506899.m 506924.m 506949.m 506974.m 506999.m 507024.m 507049.m 507074.m 507099.m 507124.m 507149.m 507174.m 507199.m 507224.m 507249.m 507274.m 507299.m 507324.m 507349.m 507374.m 507399.m 507424.m 507449.m 507474.m 507499.m 507524.m 507549.m 507574.m 507599.m 507624.m 507649.m 507674.m 507699.m 507724.m 507749.m 507774.m 507799.m 507824.m 507849.m 507874.m 507899.m 507924.m 507949.m 507974.m 507999.m 508024.m 508049.m 508074.m 508099.m 508124.m 508149.m 508174.m 508199.m 508224.m 508249.m 508274.m 508299.m 508324.m 508349.m 508374.m 508399.m 508424.m 508449.m 508474.m 508499.m 508524.m 508549.m 508574.m 508599.m 508624.m 508649.m 508674.m 508699.m 508724.m 508749.m 508774.m 508799.m 508824.m 508849.m 508874.m 508899.m 508924.m 508949.m 508974.m 508999.m 509024.m 509049.m 509074.m 509099.m 509124.m 509149.m 509174.m and these y-values (or northings): 5394320.m 5394345.m 5394370.m 5394395.m 5394420.m 5394445.m 5394470.m 5394495.m 5394520.m 5394545.m 5394570.m 5394595.m 5394620.m 5394645.m 5394670.m 5394695.m 5394720.m 5394745.m 5394770.m 5394795.m 5394820.m 5394845.m 5394870.m 5394895.m 5394920.m 5394945.m 5394970.m 5394995.m 5395020.m 5395045.m 5395070.m 5395095.m 5395120.m 5395145.m 5395170.m 5395195.m 5395220.m 5395245.m 5395270.m 5395295.m 5395320.m 5395345.m 5395370.m 5395395.m 5395420.m 5395445.m 5395470.m 5395495.m 5395520.m 5395545.m 5395570.m 5395595.m 5395620.m 5395645.m 5395670.m 5395695.m
129

Report: Ausplume Air Dispersion Modelling from the proposed Eco Solutions Generator Page 26
IMP Environmental Pty Ltd, Tasmania
August 2010
5395720.m 5395745.m 5395770.m 5395795.m 5395820.m 5395845.m 5395870.m 5395895.m 5395920.m 5395945.m 5395970.m 5395995.m 5396020.m 5396045.m 5396070.m 5396095.m 5396120.m 5396145.m 5396170.m 5396195.m 5396220.m 5396245.m 5396270.m 5396295.m 5396320.m 5396345.m 5396370.m 5396395.m 5396420.m 5396445.m 5396470.m 5396495.m 5396520.m 5396545.m 5396570.m 5396595.m 5396620.m 5396645.m 5396670.m 5396695.m 5396720.m 5396745.m 5396770.m 5396795.m 5396820.m DISCRETE RECEPTOR LOCATIONS (in metres) No. X Y ELEVN HEIGHT No. X Y ELEVN HEIGHT 1 507920 5395576 148.0 0.0 _____________________________________________________________________________ METEOROLOGICAL DATA : Modified METSAMP file. All directions in 10 degree i _____________________________________________________________________________ 1 Peak values for the 100 worst cases (in microgram/m3) Averaging time = 8 hours Rank Value Time Recorded Coordinates hour,date (* denotes polar) 1 5.30E+02 08,30/01/00 (507849, 5395395, 0.0) 2 5.30E+02 08,10/02/00 (507824, 5395420, 0.0) 3 5.30E+02 16,13/01/00 (507874, 5395320, 0.0) 4 5.30E+02 16,24/01/00 (507824, 5395320, 0.0) 5 5.29E+02 08,08/01/00 (507924, 5395395, 0.0) 6 5.29E+02 08,25/03/00 (507749, 5395520, 0.0) 7 5.29E+02 16,08/03/00 (507699, 5395445, 0.0) 8 5.29E+02 08,05/04/00 (507749, 5395545, 0.0) 9 5.29E+02 24,08/02/00 (507849, 5395445, 0.0) 10 5.29E+02 24,23/03/00 (507774, 5395520, 0.0) 11 5.29E+02 08,14/03/00 (507774, 5395495, 0.0) 12 5.29E+02 24,06/01/00 (507924, 5395420, 0.0) 13 5.29E+02 08,19/01/00 (507899, 5395420, 0.0) 14 5.29E+02 24,17/01/00 (507899, 5395420, 0.0) 15 5.29E+02 16,19/03/00 (507649, 5395470, 0.0) 16 5.29E+02 16,04/02/00 (507774, 5395320, 0.0) 17 5.29E+02 16,15/02/00 (507749, 5395370, 0.0) 18 5.29E+02 16,30/03/00 (507624, 5395520, 0.0) 19 5.29E+02 24,12/03/00 (507774, 5395495, 0.0) 20 5.29E+02 16,02/01/00 (507924, 5395320, 0.0) 21 5.29E+02 16,26/02/00 (507699, 5395395, 0.0) 22 5.29E+02 08,03/03/00 (507774, 5395445, 0.0) 23 5.29E+02 08,21/02/00 (507799, 5395420, 0.0) 24 5.29E+02 24,03/04/00 (507749, 5395545, 0.0) 25 5.29E+02 24,15/02/00 (507574, 5395170, 0.0) 26 5.29E+02 24,01/03/00 (507799, 5395470, 0.0) 27 5.28E+02 24,26/02/00 (507499, 5395220, 0.0) 28 5.28E+02 24,04/02/00 (507624, 5395070, 0.0) 29 5.28E+02 16,31/01/00 (507849, 5395395, 0.0) 30 5.28E+02 08,16/04/00 (507724, 5395570, 0.0) 31 5.28E+02 08,27/01/01 (507949, 5395395, 0.0) 32 5.28E+02 16,10/04/00 (507624, 5395570, 0.0) 33 5.28E+02 24,28/01/00 (507849, 5395395, 0.0) 34 5.28E+02 24,23/01/00 (507849, 5395395, 0.0) 35 5.28E+02 24,25/01/00 (507849, 5395395, 0.0) 36 5.28E+02 24,24/01/00 (507724, 5395045, 0.0) 37 5.28E+02 24,19/03/00 (507424, 5395395, 0.0) 38 5.28E+02 24,08/03/00 (507474, 5395320, 0.0) 39 5.28E+02 16,11/02/00 (507824, 5395420, 0.0) 40 5.28E+02 24,03/02/00 (507824, 5395420, 0.0) 41 5.28E+02 24,05/02/00 (507824, 5395420, 0.0) 42 5.28E+02 24,19/02/00 (507824, 5395470, 0.0)
130

Report: Ausplume Air Dispersion Modelling from the proposed Eco Solutions Generator Page 27
IMP Environmental Pty Ltd, Tasmania
August 2010
43 5.28E+02 24,30/03/00 (507349, 5395470, 0.0) 44 5.28E+02 24,01/01/00 (507924, 5395395, 0.0) 45 5.28E+02 24,03/01/00 (507924, 5395395, 0.0) 46 5.28E+02 24,18/03/00 (507749, 5395520, 0.0) 47 5.28E+02 24,20/03/00 (507749, 5395520, 0.0) 48 5.28E+02 16,09/01/00 (507924, 5395395, 0.0) 49 5.28E+02 16,26/03/00 (507749, 5395520, 0.0) 50 5.28E+02 24,12/01/00 (507899, 5395420, 0.0) 51 5.28E+02 24,14/01/00 (507899, 5395420, 0.0) 52 5.28E+02 24,25/01/01 (507949, 5395420, 0.0) 53 5.28E+02 24,29/03/00 (507749, 5395545, 0.0) 54 5.28E+02 24,31/03/00 (507749, 5395545, 0.0) 55 5.28E+02 16,21/01/01 (507974, 5395295, 0.0) 56 5.28E+02 24,07/03/00 (507774, 5395495, 0.0) 57 5.28E+02 24,09/03/00 (507774, 5395495, 0.0) 58 5.28E+02 16,06/04/00 (507749, 5395545, 0.0) 59 5.28E+02 16,20/01/00 (507899, 5395420, 0.0) 60 5.28E+02 16,15/03/00 (507749, 5395470, 0.0) 61 5.28E+02 24,10/04/00 (507374, 5395570, 0.0) 62 5.28E+02 24,14/04/00 (507749, 5395570, 0.0) 63 5.28E+02 24,25/02/00 (507774, 5395445, 0.0) 64 5.28E+02 24,27/02/00 (507774, 5395445, 0.0) 65 5.28E+02 16,04/03/00 (507774, 5395445, 0.0) 66 5.27E+02 24,14/02/00 (507799, 5395420, 0.0) 67 5.27E+02 24,16/02/00 (507799, 5395420, 0.0) 68 5.27E+02 16,22/02/00 (507799, 5395420, 0.0) 69 5.27E+02 24,13/01/00 (507824, 5395045, 0.0) 70 5.27E+02 08,27/04/00 (507699, 5395620, 0.0) 71 5.27E+02 24,20/01/01 (507949, 5395395, 0.0) 72 5.27E+02 24,22/01/01 (507949, 5395395, 0.0) 73 5.27E+02 08,09/10/00 (508099, 5395645, 0.0) 74 5.27E+02 16,21/04/00 (507624, 5395620, 0.0) 75 5.27E+02 08,04/08/00 (507949, 5395745, 0.0) 76 5.27E+02 24,09/04/00 (507724, 5395570, 0.0) 77 5.27E+02 24,11/04/00 (507724, 5395570, 0.0) 78 5.27E+02 08,16/01/01 (507999, 5395370, 0.0) 79 5.27E+02 16,17/04/00 (507724, 5395570, 0.0) 80 5.27E+02 16,28/01/01 (507949, 5395395, 0.0) 81 5.27E+02 24,13/08/00 (507974, 5395720, 0.0) 82 5.27E+02 24,02/08/00 (507949, 5395745, 0.0) 83 5.27E+02 08,28/09/00 (508074, 5395670, 0.0) 84 5.27E+02 08,24/07/00 (507924, 5395770, 0.0) 85 5.27E+02 16,21/01/00 (507899, 5395470, 0.0) 86 5.27E+02 08,31/10/00 (508124, 5395570, 0.0) 87 5.27E+02 16,01/02/00 (507874, 5395470, 0.0) 88 5.27E+02 24,14/01/01 (507974, 5395420, 0.0) 89 5.27E+02 08,15/08/00 (507974, 5395745, 0.0) 90 5.27E+02 16,07/02/00 (507849, 5395445, 0.0) 91 5.27E+02 08,13/02/00 (507849, 5395445, 0.0) 92 5.27E+02 08,26/08/00 (508024, 5395745, 0.0) 93 5.27E+02 08,20/10/00 (508124, 5395620, 0.0) 94 5.27E+02 16,16/03/00 (507824, 5395520, 0.0) 95 5.27E+02 16,23/02/00 (507849, 5395495, 0.0) 96 5.27E+02 16,22/03/00 (507774, 5395520, 0.0) 97 5.27E+02 08,28/03/00 (507774, 5395520, 0.0) 98 5.27E+02 24,24/08/00 (507999, 5395720, 0.0) 99 5.27E+02 08,11/11/00 (508099, 5395545, 0.0) 100 5.27E+02 16,13/02/00 (507849, 5395445, 0.0)
131

Appendix G: Longford Waste Water Treatment Plant - Environment Protection Notice No. 7407/2
IMP Environmental - DPEMP
132

133

134

135
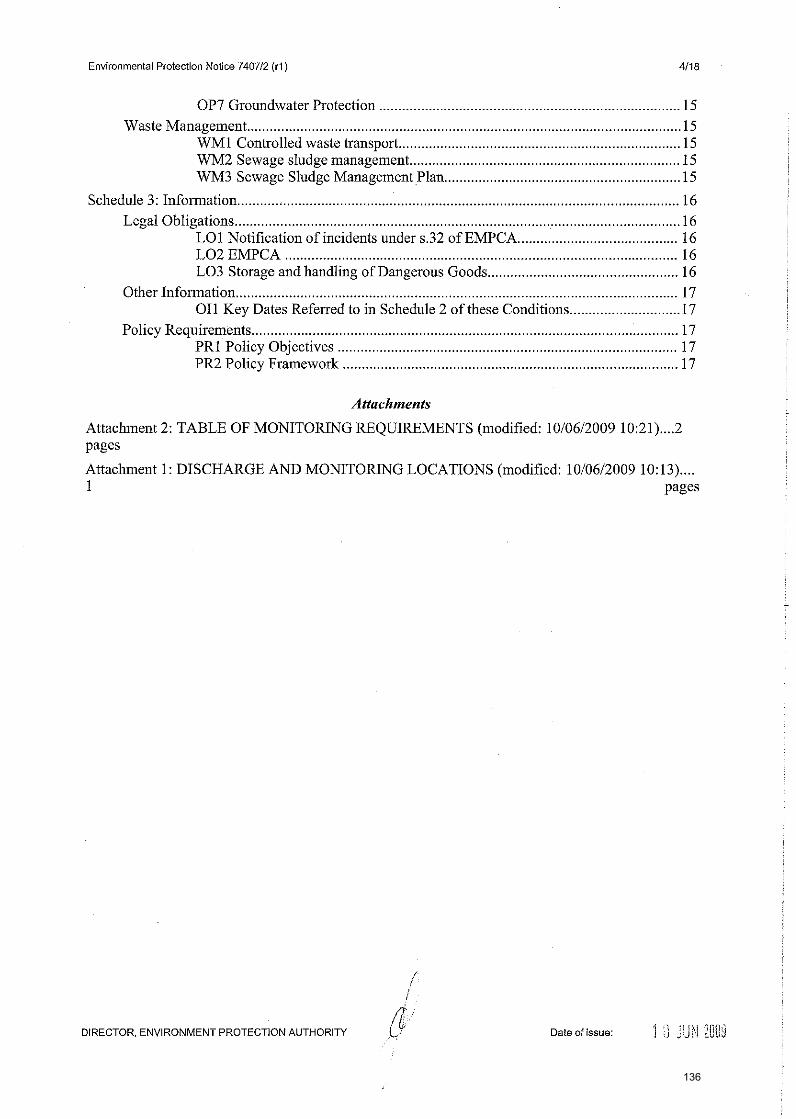
136
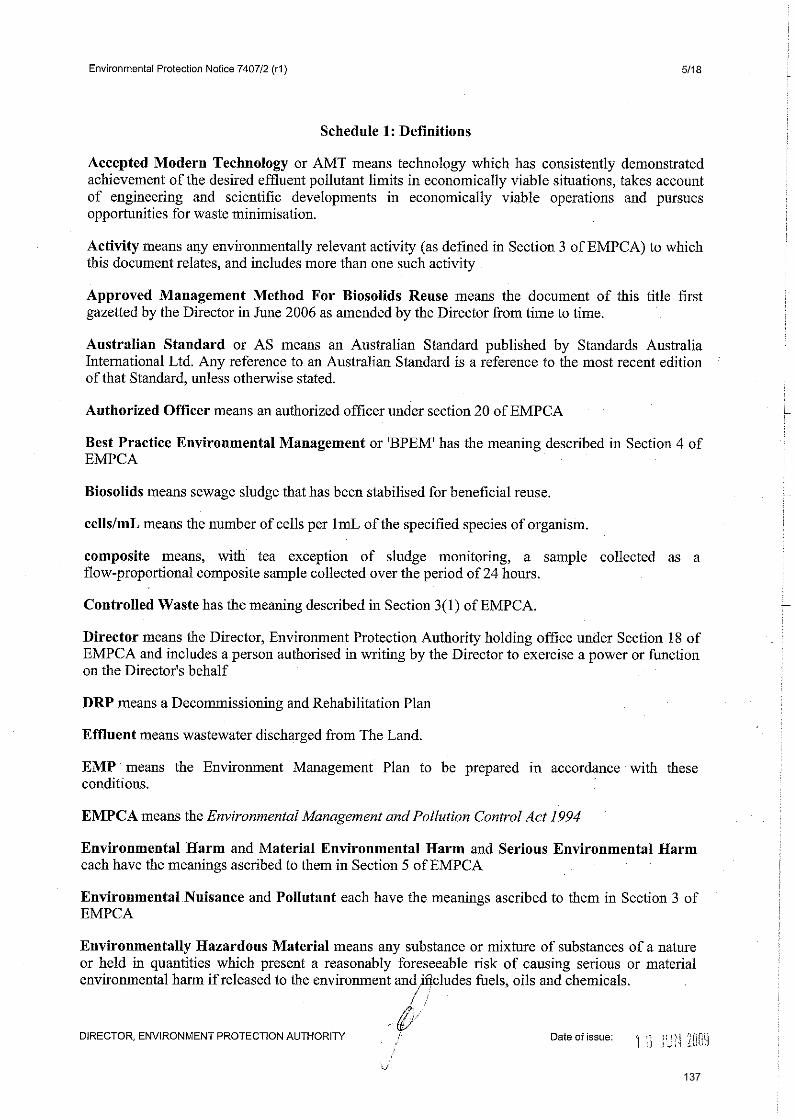
137
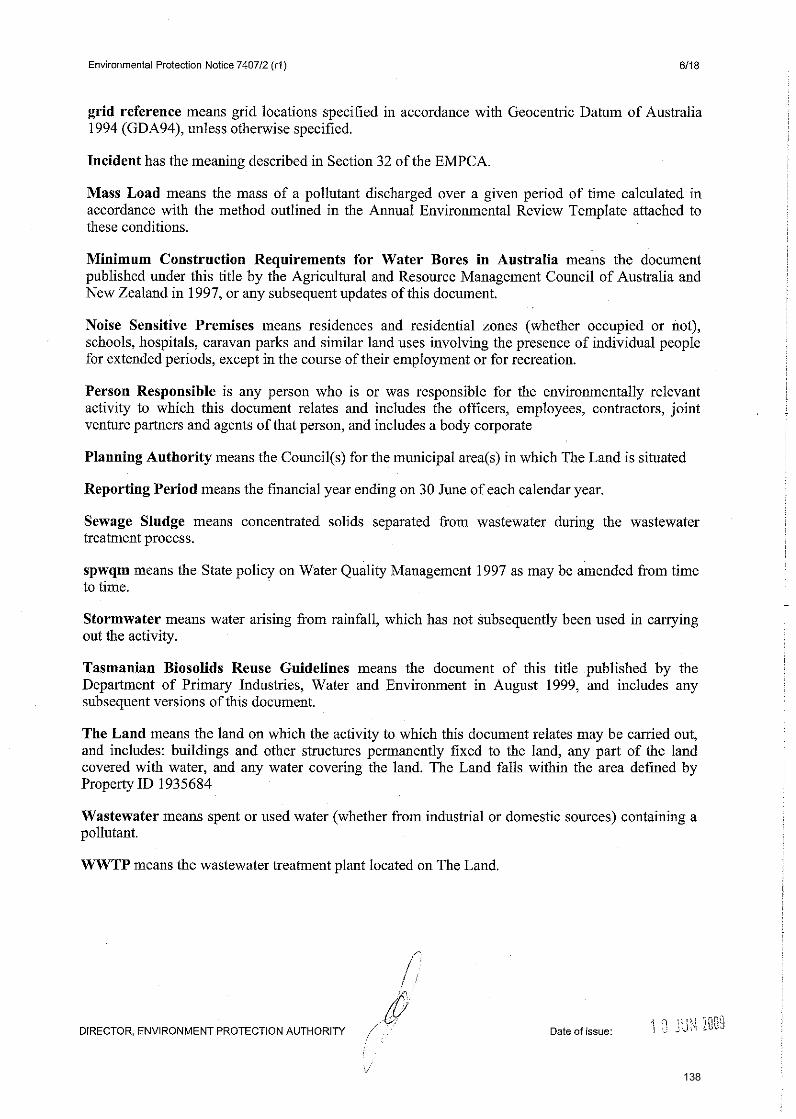
138

139
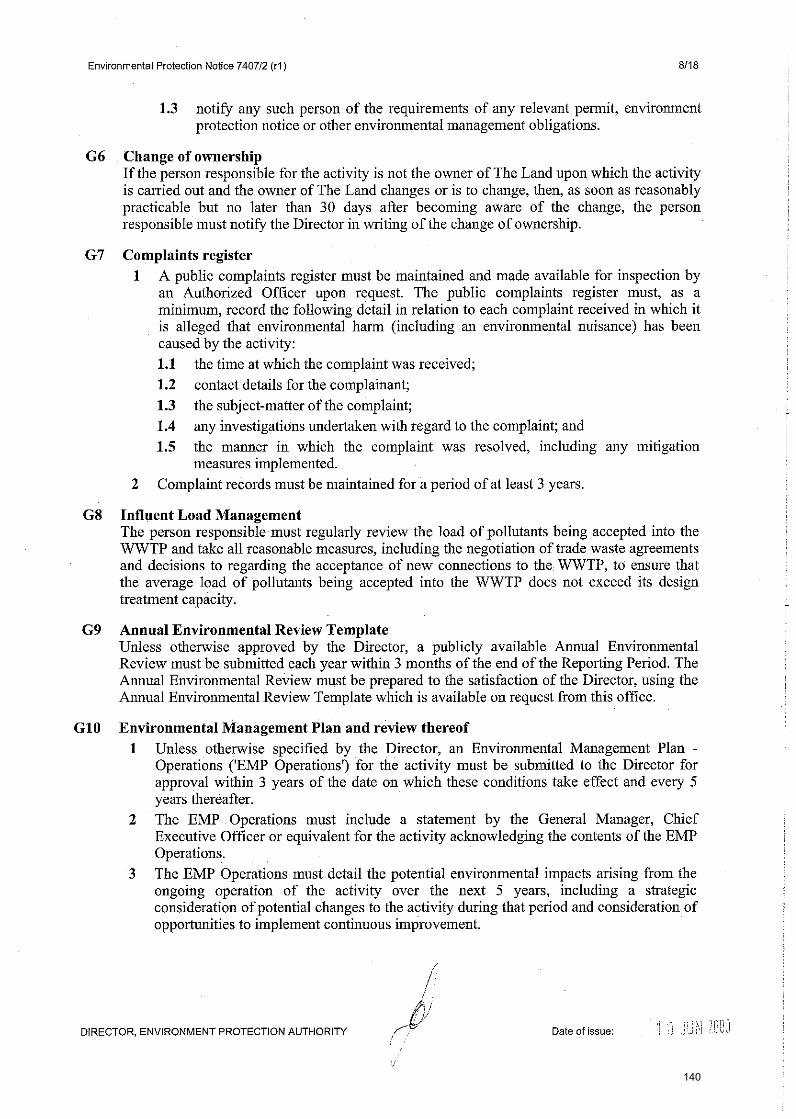
140

141
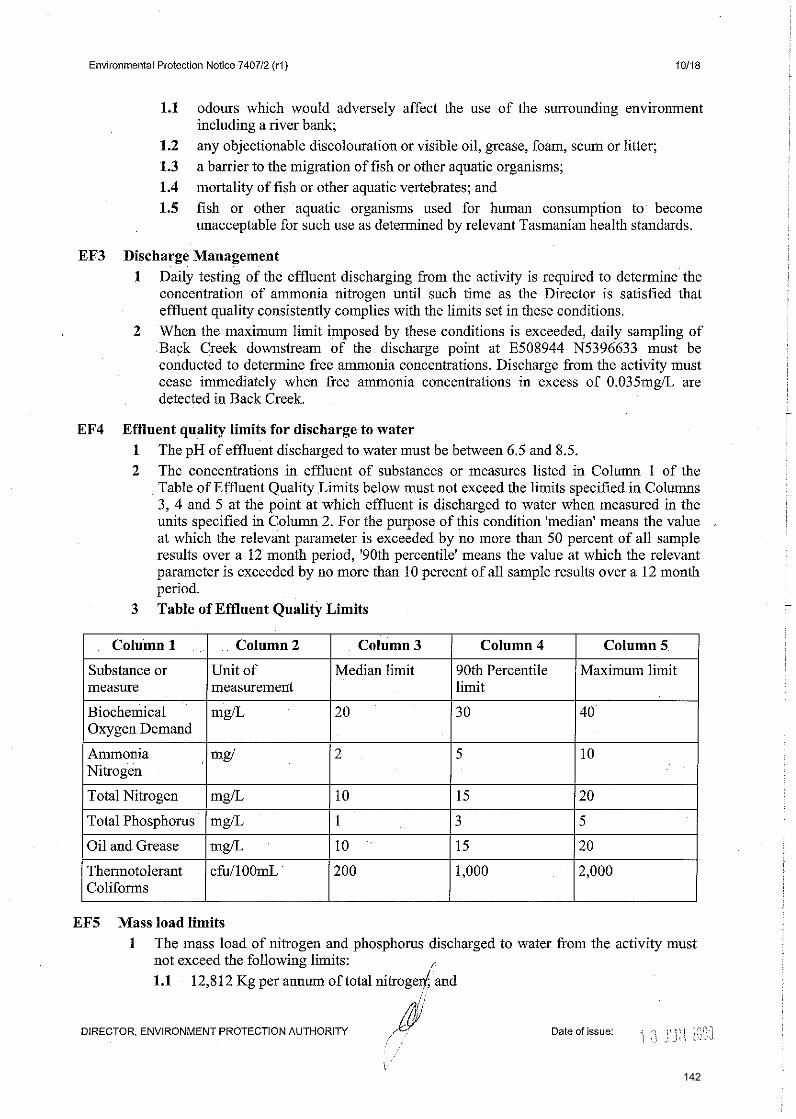
142

143

144
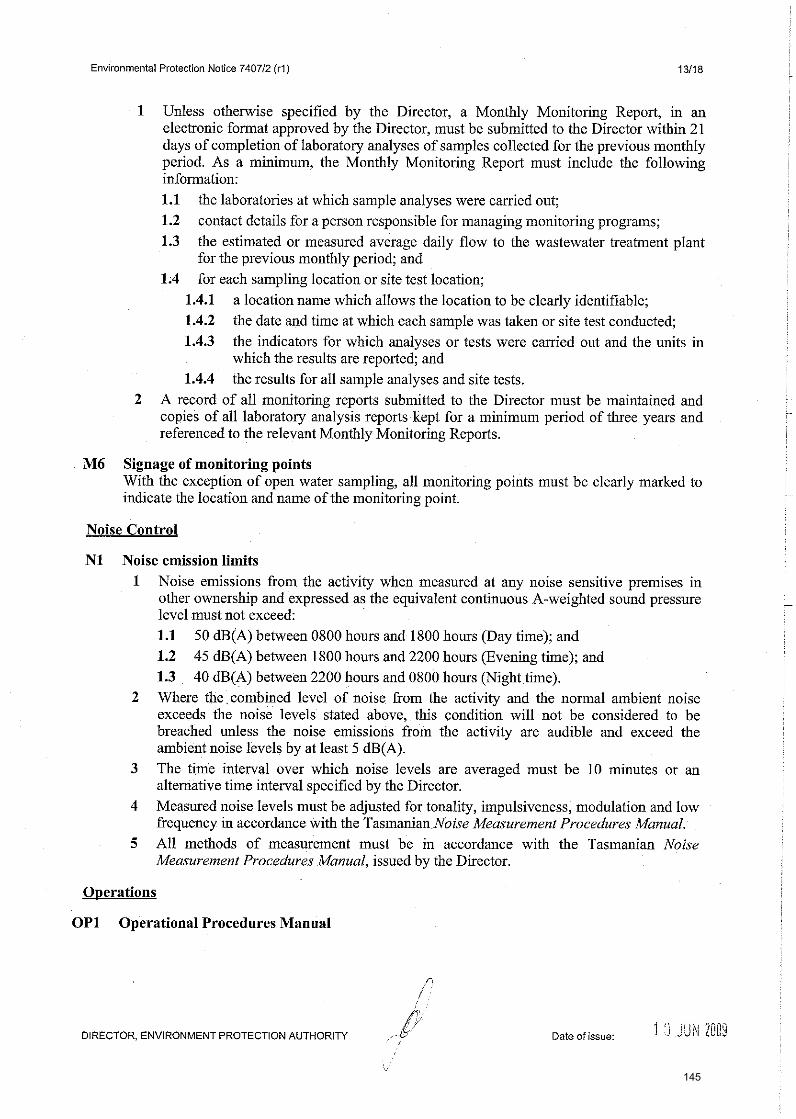
145

146
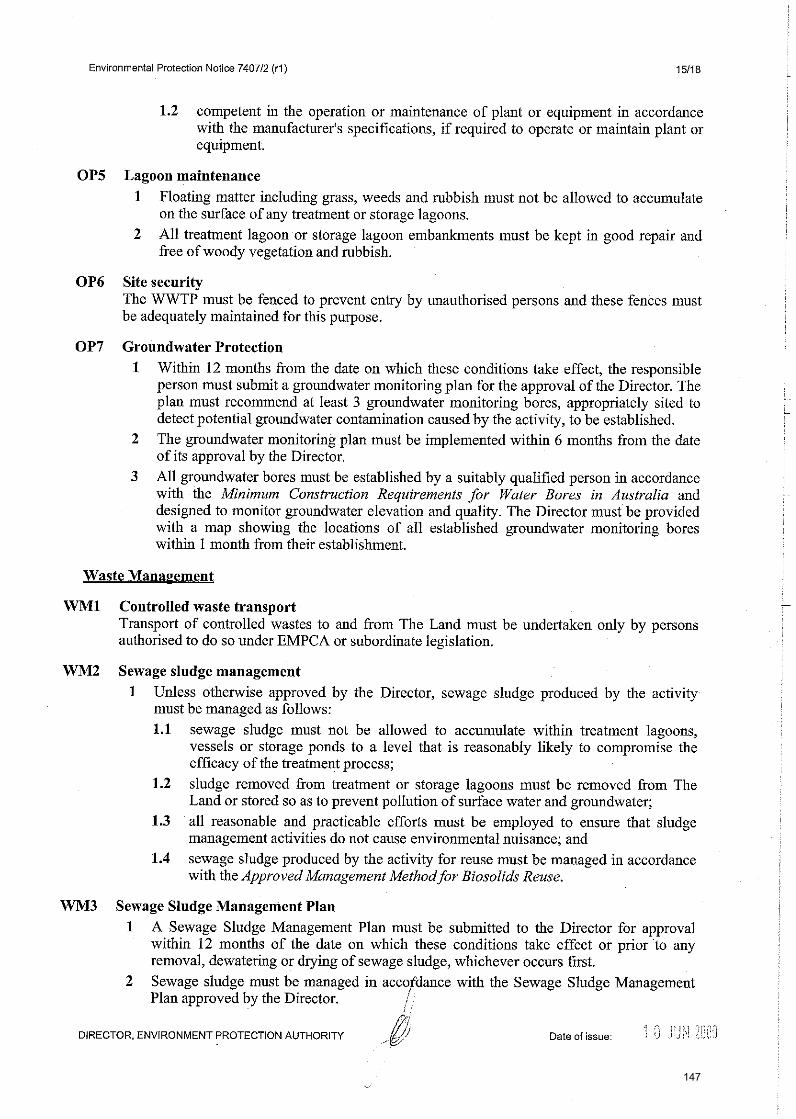
147

148

149

150

151

152

153

154
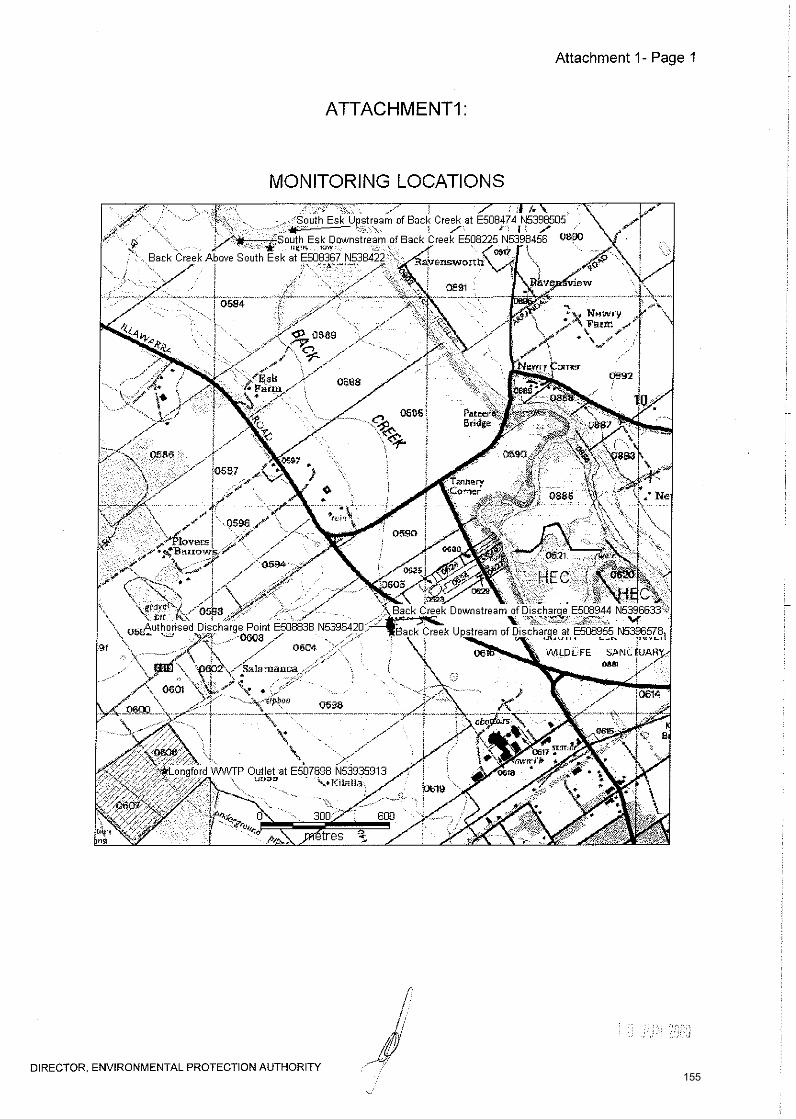
155

156

157

158

Appendix H: Greenhouse Gas Calculations
IMP Environmental - DPEMP
159

Greenhouse Gas Emissions Estimate
Category Source Value UnitsEnergy Content Factor
Emission Factor CO2
Emission Factor CH4
Emission Factor N2O
Calculated Emissions
CO2
Calculated Emissions
CH4
Calculated Emissions
N2OTotal t CO2-e
Stationary Energy Biogas 1728000 m3/annum 0.04 0.00 4.80 0.03 0.00 312.70 1.95 314.65Transport Trucks (Diesel) 65 kL/annum 38.60 69.20 0.20 0.50 173.09 0.50 1.25 174.84
Total 489.49
Landfill Abattoir 10800 tons/annum 1.1 11880
160

Appendix I: Visual Amenity Photographs
IMP Environmental - DPEMP
161

Site Photos
IMP Environmental - DPEMP
162

Site Photo
View from Hay St
IMP Environmental - DPEMP
163

View from High St
View from the Longford Football Ground
IMP Environmental - DPEMP
164
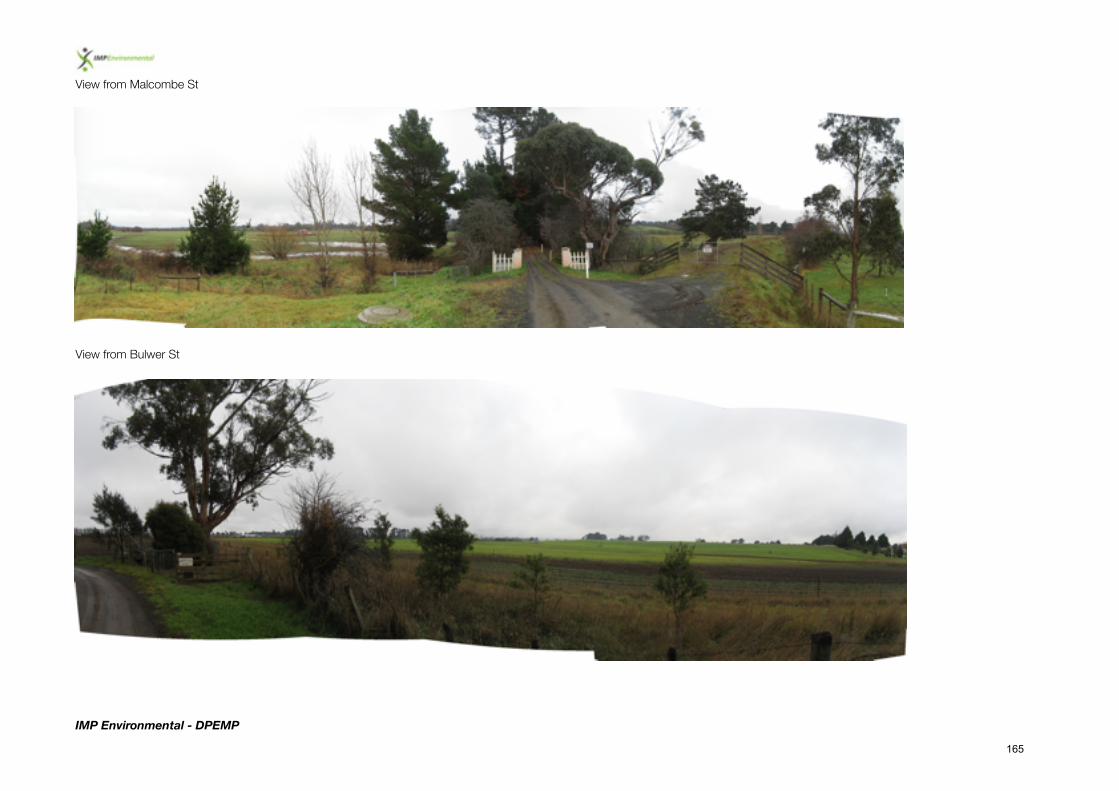
View from Malcombe St
View from Bulwer St
IMP Environmental - DPEMP
165

Appendix J: Risk Assessment
IMP Environmental - DPEMP
166

Level Descriptor Description A Almost certain Is expected to occur in most circumstances B Likely Will probably occur in most circumstances C Possible Could occur D Unlikely Could occur but not expected E Rare Occurs only in exceptional circumstances From Standards Australia HB 203:2006 Environmental risk management - Principles and process Table 4(A)
Level Descriptor Example detail description
1 Catastrophic Death, toxic release off-‐site with detrimental effect, huge financial loss 2 Major Extensive injuries, loss of production capability, off-‐site release contained with outside assistance and little detrimental impact, major
financial loss 3 Moderate Medical treatment required, on-‐site release contained with outside assistance, high financial loss 4 Minor First aid treatment, on-‐site release immediately contained, medium financial loss 5 Insignificant No injuries, low financial loss, negligible environmental impact. From Standards Australia HB 203:2006 Environmental risk management - Principles and process Table 4(B)
Consequence Likelihood Catastrophic Major Moderate Minor Insignificant
Almost Certain Extreme Extreme Extreme High High Likely Extreme Extreme High High Moderate Possible Extreme Extreme High Moderate Low Unlikely Extreme High Moderate Low Low Rare High High Moderate Low Low
Extreme Risk Immediate action required High Risk Senior management attention needed Moderate Risk Management responsibility must be specified Low Risk Manage by routine procedures From Standards Australia HB 203:2006 Environmental risk management - Principles and process Table 4(C)
167

Event / Impact to: Effect Mitigation Likelihood Consequence Risk Air Emission Odour impact to neighbours Bio-‐scrubber for emission sources, contingency
measures for process failure Possible Insignificant Low
Liquid waste Spill of process liquid, impact to environment Design of plant layout to incorporate liquid interception and collection (bunding etc)
Unlikely Insignificant Low
Stormwater contamination Design of stormwater interception and collection systems for re-‐use
Unlikely Insignificant Low
Groundwater Spill, groundwater impact Design of liquid waste and stormwater systems as above
Unlikely Insignificant Low
Noise Noise impact to neighbours High noise producing elements contained in soundproofed area in warehouse
Unlikely Insignificant Low
Solid waste Loss of material, impact to environment Use of approved waste transporters and adherence to the requirements of the Controlled Waste Tracking System
Unlikely Minor Low
Dangerous goods Spill, impact to environment Adherence to appropriate legislative and policy requirements
Unlikely Insignificant Low
Biodiversity Loss of species or habitat, weed propagation Ecological assessment of the proposed development site, minor weed management
Unlikely Insignificant Low
Heritage Disturbance of culturally significant aboriginal material
Incorporate procedure for identification of potentially significant material and notification of relevant authority into Construction Environmental Management Plan
Rare Minor Low
Health and Safety LTI, loss of life Development and adherence to appropriate OH&S policies including training
Unlikely Minor Low
Fire Damage to equipment, explosion, injury, loss of life
Construction, design and operation of proposed development to comply with relevant legislative and policy requirements to prevent and mitigate risk associated with fire
Unlikely Minor Low
168