Embed Size (px)
Citation preview
Int. J. Electrochem. Sci., 9 (2014) 32 - 45
International Journal of
ELECTROCHEMICAL SCIENCE
www.electrochemsci.org
Development of Titanium Surgery Implants for Improving
Osseointegration Through Formation of a Titanium Nanotube
Layer
N. A. Al-Mobarak*, A. A. Al-Swayih
Department of Chemistry, College of Science, Princess Nora Bint Abdul Rahman University,
Box:22559, Riyadh 11416, Kingdom of Saudi Arabia *E-mail: [email protected]
Received: 3 September 2013 / Accepted: 21 October 2013 / Published: 15 November 2013
Recently, titanium and titanium alloys with nanotube layers by anodizing process have gained great
interests as surgical implant materials. In this paper, the electrochemical stability of TiO2 nanotubue
layers prepared by anodization of pure Ti in three solutions has been investigated in simulated
biological environment by use of open-circuit potential (OCP), electrochemical impedance
spectroscopy (EIS) and potentiodynamic polarization (PD) tests. The PD testing results indicate that
the nanotubular Ti shows a slightly higher passivation current than the mechanically polished titanium
in Hank's solution, this is attributed to the large surface area created by the nanostructure. Moreover,
the electrochemical stability of Ti nanotubes is enhanced, as judged by the more nobler open circuit
potential values compared to that of Ti. The dependence of the electrochemical stability of the
nanotubular surface depended on the dimensions of the TiO2 nanotube which was controlled by
optimizing the anodization electrolyte composition. The results reveal that architecting the surface of
titanium on the nanoscale render the surface more biocompatible by creating large surface area and
more sustainable by providing more stabilized surface which is less vulnerable to corrosion. .
Keywords: Titanium nanotube, anodization, TiO2, surgery implants
1. INTRODUCTION
Ti and Ti alloys are the materials of choice for most dental and orthopedic applications. The
many advantages of these materials include biocompatibility, good resistance to corrosion, low density
and sufficiently strong for use as orthopedic implant materials [1]. These properties have been
attributed to the natural oxide layer formed spontaneously on Ti surface [2]. The natural oxide is thin
(about 3–8 nm in thickness), amorphous, and stoichiometrically defective. It is well known that the
Int. J. Electrochem. Sci., Vol. 9, 2014
33
protective and stable oxides on titanium surfaces provide favorable osseointegration. The stability of
this titanium oxide layer depends strongly on its composition, structure and thickness. As a
consequence, great efforts have been devoted to thickening and stabilizing the surface oxide on
titanium to achieve the desired biological response. Various methods were used to improve the
interfacial properties and clinical lifetime of Ti-based implants [3].
Surface treatments such as roughening by sand blasting, formation of anatase phase TiO2 [4],
hydroxyapatite coating, or chemical treatment [4-9] have been utilized to further improve the
bioactivity of Ti and enhance bone growth [10]. One method among them is anodization, which
induced the formation of rough and porous TiO2 surfaces [11]. Presently anodization is one of the most
commonly used methods to produce nanoporous surface, due to its simplicity and feasibility. In
addition, the size and shape of nanostructured materials can be tuned to the desire dimension [2].
The titanium with nanotube layers cannot only significantly increase osteoblast or bone
forming cell adhesion and function in vitro [12-14], but also promote in vivo bone formation around
implants compared to their unanodized counter parts [15,16]. This nanotube titanium layer plays an
important role in the enhancement of osseointegration through the improvement of the adhesion of the
hydroxyapatite (HAP) coating that is deposited onto TiO2 [17]. Oh et al. [12] indicated that the cell
adhesion could be improved by up to 400% because of the mechanical interlocking between the HAP
coating and the nanotube titanium oxide layer.
The TiO2 nanotube films have been extensively explored as adhesion and growth support
platforms for bone and stem cells, for the prevention of bacterial adhesion, drug delivery and
enhancing blood clotting for control of haemorrhage [18–21]. Favourable bone cell growth, cell
differentiation, and apatite-forming abilities were recently demonstrated on implants with nanotubular
titania surfaces demonstrating its promise for bone implants [22]. Recently development in stem cell
research demonstrated that titania nanotubes are able to differentiation of mesenchymal stem cells into
specific cells (osteoblasts) [23,24]. Furthermore, the outstanding photocatalytic properties of the
nanotube surface were applied to photo-induced killing of cancer cells which suggests a possible
application of nanotubes for an anticancer treatment [25].
However, up to now, few articles about corrosion behavior of nanotubes have been published
[26-28]. Corrosion is the most decisive property for the biocompatibility of an implant. The present
work was addressed to test corrosion behavior of titanium with different diameter nanotube layers in
Hank's solution and detected by scanning electron microscope (SEM), electrochemical impedance
spectroscopy (EIS) and potentiodynamic polarization. This study aims to enhance the understanding of
corrosion characteristics of different nanotubes on titanium in physiological environment.
2. MATERIALS AND METHODS
2.1. TiO2 nanotube layer formation
Ti foils with an area of 20 mm x 30 mm and thickness of 0.25 mm (99.5% metal basis, Alfa
Aesar) were used as starting material in order to obtain the TiO2 nanotube arrays. A preliminary
Int. J. Electrochem. Sci., Vol. 9, 2014
34
treatment was performed by degreasing the Ti foils using sonication in acetone, in isopropanol, and,
finally, in methanol. The foils were subsequently rinsed with deionized water and dried in nitrogen
stream. TiO2 nanotube arrays were formed by anodization in different solution at 20 V for 30 min. The
three solutions used for nanotube preparation were: (T1) 1M Na2SO4 + 0.5 wt.% NaF, (T2) 1.0 M
H3PO4 + 0.8 wt.% NaF and (T3) 0.5 (wt) % HF. Following this, the anodized samples were rinsed with
deionized water and dried in nitrogen stream. For comparison, a fresh sample of Ti without nanotube
(T) were studied. Table 1 lists the samples and conditions used in this study.
Table 1. Summary of conditions of anodization
Sample Electrolyte composition in anodization voltage time
T - - -
T1 1M Na2SO4 + 0.5 wt.% NaF
20 V
30 min T2 1.0 M H3PO4 + 0.8 wt.% NaF
T3 0.5 (wt) % HF
2.2. Surface characterization
The surface morphology of the TiO2 nanotube arrays was characterized using a scanning
electron microscope (Jeol JSM-7600F Field-Emission Scanning Electron Microscope).
2.3. Electrochemical tests
All electrochemical measurements were performed at 37 ◦C in s Hank’s physiological solution
(8 g/l NaCl, 0.4 g/l KCl, 0.35 g/l NaHCO3, 0.25 g/l NaH2PO4.×H2O, 0.06 g/l Na2HPO4.2H2O, 0.19 g/l
CaCl2.2H2O, 0.19 g/l MgCl2, 0.06 g/l MgSO4.7H2O and 1 g/l glucose, pH 7.8) [29-32].
A conventional three-electrode electrochemical cell system was used. Saturated calomel
electrode (SCE) and platinum mesh were used as reference and counter electrodes, respectively.
Potentials in the text refer to the SCE scale.
In the experiments, the open circuit potential (OCP) was measured for an hour. Then,
electrochemical impedance spectroscopy (EIS) was recorded. The frequency ranged from 100 kHz to
10 mHz at 10 cycles per decade, with an ac amplitude of ±10 mV. The absolute impedance and phase
angle were measured at each frequency. The impedance data were interpreted on the basis of
equivalent electrical circuits, using the Zsim program for fitting the experimental data. In
potentiodynamic polarization (PD) tests, the working electrode potential is continuously increased
from -250 to 500 mV relative to the OCP at a scan rate of 1 mV/s.
Int. J. Electrochem. Sci., Vol. 9, 2014
35
3. RESULTS AND DISCUSSION
3.1. The formation of nanotube oxide layers and the morphology of surfaces
It is generally agreed that the formation of TiO2 nanotube arrays in a fluoride containing
electrolyte is the result of two competing electric field-assisted processes [33,34]. The first process is
the oxidation of the Ti metal to form a passive TiO2 layer [35]:
Ti + 2H2O TiO2 + 4H+
+ 4e- (1)
Due to the fluoride ions presence, the second process is the chemical dissolution of the formed
TiO2 oxide with pits formation by the following reaction [35,36]:
TiO2 + 4H6F- ½[TiF6]
2- + 2H2O (2)
These pits act as the pore forming centres; as was described in the literature [37]. This model of
dissolution is a key factor of well organized structure of titanium nanotubes [36].
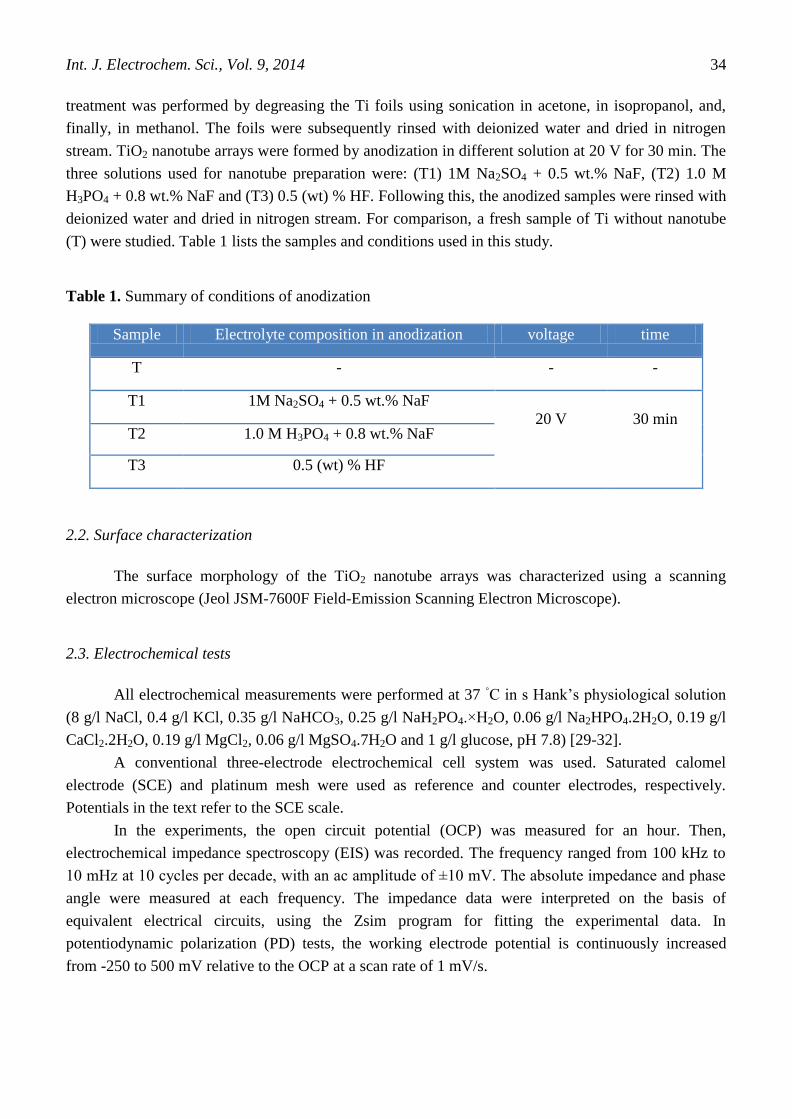
Figure 1. The SEM images and EDX of titanium oxide nanotubes formed on sample T1
Int. J. Electrochem. Sci., Vol. 9, 2014
36
Fig. 1 shows SEM images of the resulting layer for sample T1, which formed in 1M Na2SO4
containing 0.5 wt.% NaF. The figure revealed that the resulting layer consists of self-organized
nanotubes with the average diameters of approx. 70 nm and a length of approx.1.2 μm. It is apparent
that the nanotubes are open on the top. This morphology was reported before for p-TiO2 films formed
in SO4-2
containing solutions [38,39]. The closed bottoms correspond to the barrier layers formation,
similar to the case of porous alumina [40].
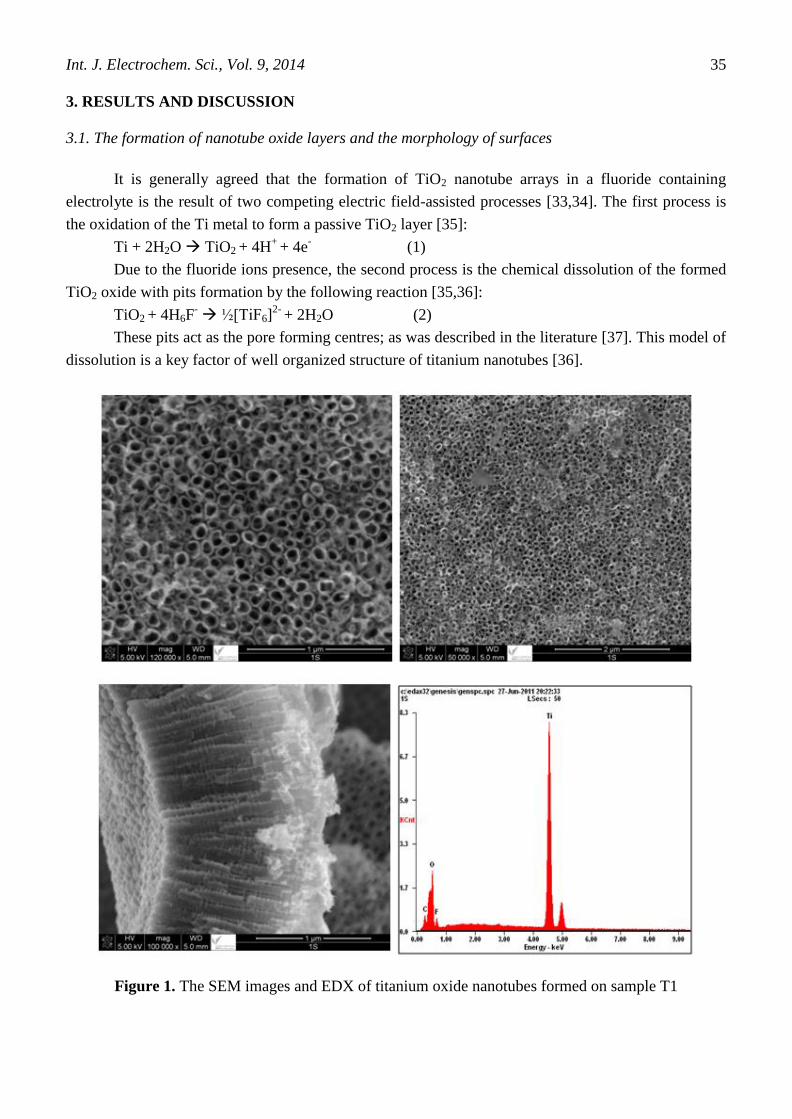
Figure 2. The SEM images and EDX of titanium oxide nanotubes formed on sample T2
Fig. 2 shows SEM images for the second sample T2, which shows self-organized TiO2
nanotubes formed in the phosphate electrolyte containing small amount of fluoride ions. A key reason
to study phosphate electrolytes is that typically compact anodic films formed on Ti contain a
Int. J. Electrochem. Sci., Vol. 9, 2014
37
significant amount of phosphorous species [41]. This anion uptake may modify the functional
properties not only of the compact oxide layers but even more, the properties of the porous layer [40].
From fig. 2, the resulting nanotube layer has average diameters of approx. 93 nm and a length of
approx.536 nm.
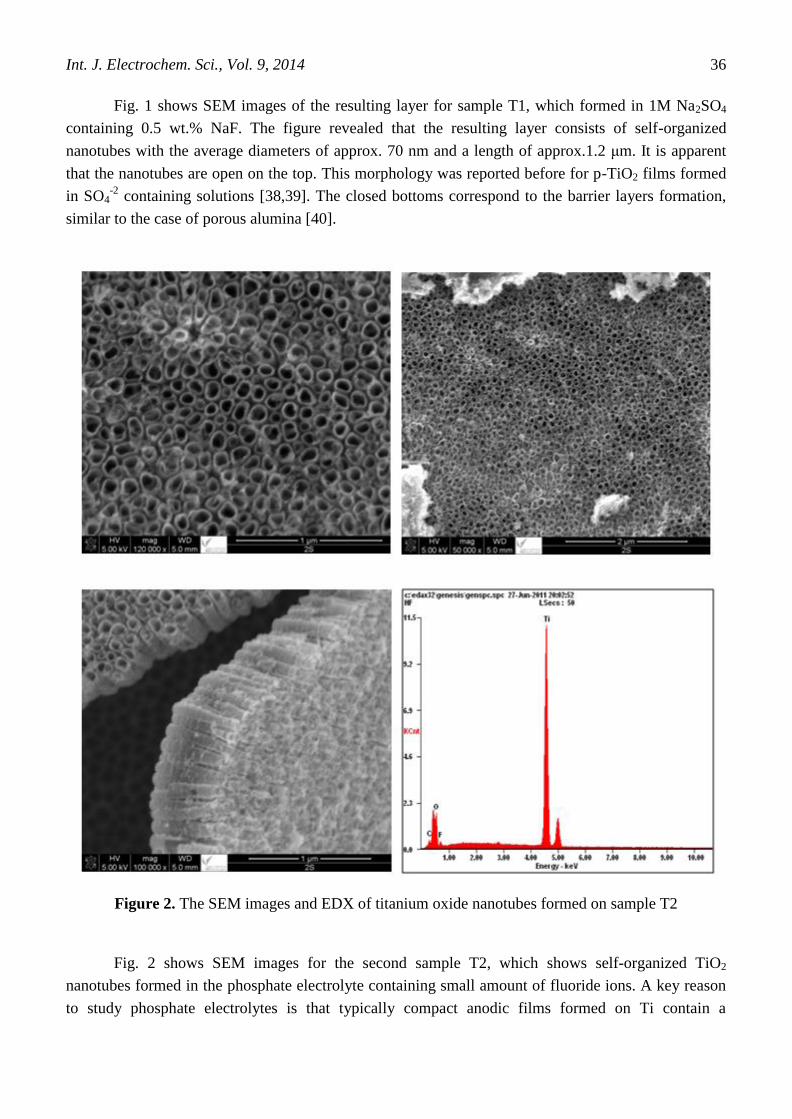
Figure 3. The SEM images and EDX of titanium oxide nanotubes formed on sample T3
Fig. 3 shows SEM images for the third sample, which formed in HF solution. The images
reveal that the layer of titanium nanotube with average diameters of approx. 52 nm and a length of
approx. 250 nm. The longer nanotubes were formed in sample T1, while the shorter were formed in
sample T3. In addition, the smallest average diameters of the nanotubes were observed in sample T3.
The nano-archtecture of the surface may strongly affect the electrochemical properties of the samples.
Int. J. Electrochem. Sci., Vol. 9, 2014
38
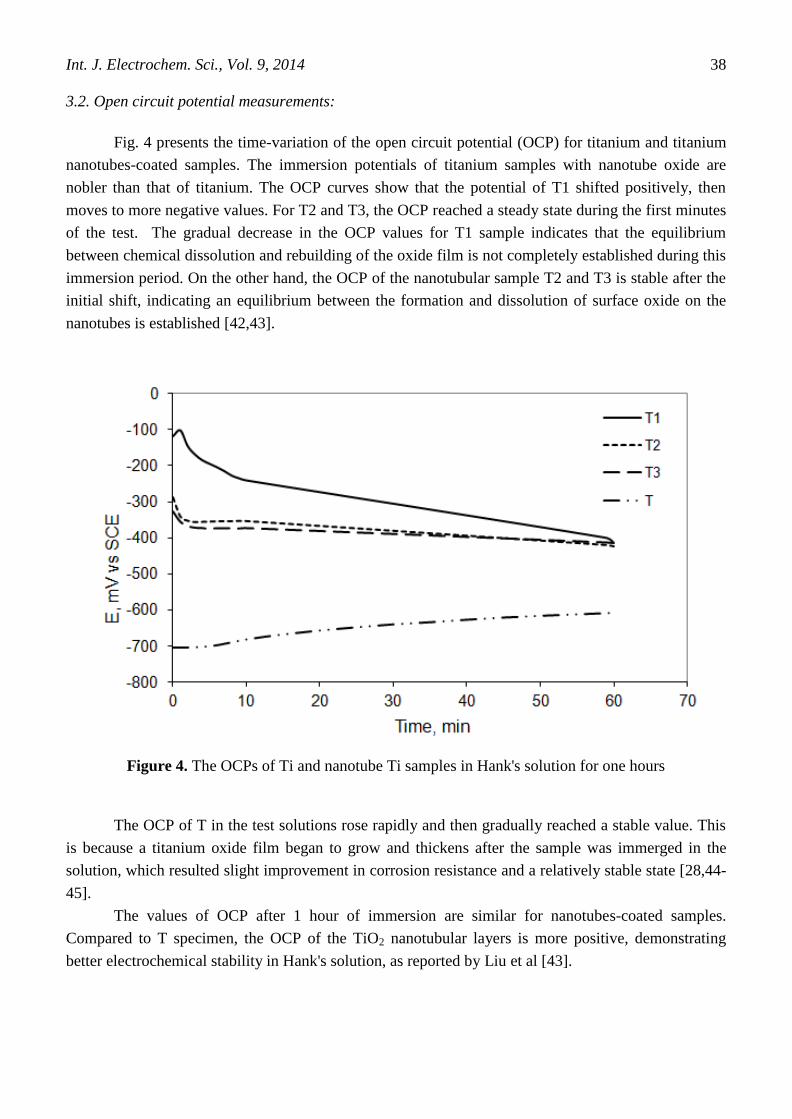
3.2. Open circuit potential measurements:
Fig. 4 presents the time-variation of the open circuit potential (OCP) for titanium and titanium
nanotubes-coated samples. The immersion potentials of titanium samples with nanotube oxide are
nobler than that of titanium. The OCP curves show that the potential of T1 shifted positively, then
moves to more negative values. For T2 and T3, the OCP reached a steady state during the first minutes
of the test. The gradual decrease in the OCP values for T1 sample indicates that the equilibrium
between chemical dissolution and rebuilding of the oxide film is not completely established during this
immersion period. On the other hand, the OCP of the nanotubular sample T2 and T3 is stable after the
initial shift, indicating an equilibrium between the formation and dissolution of surface oxide on the
nanotubes is established [42,43].
Figure 4. The OCPs of Ti and nanotube Ti samples in Hank's solution for one hours
The OCP of T in the test solutions rose rapidly and then gradually reached a stable value. This
is because a titanium oxide film began to grow and thickens after the sample was immerged in the
solution, which resulted slight improvement in corrosion resistance and a relatively stable state [28,44-
45].
The values of OCP after 1 hour of immersion are similar for nanotubes-coated samples.
Compared to T specimen, the OCP of the TiO2 nanotubular layers is more positive, demonstrating
better electrochemical stability in Hank's solution, as reported by Liu et al [43].
Int. J. Electrochem. Sci., Vol. 9, 2014
39
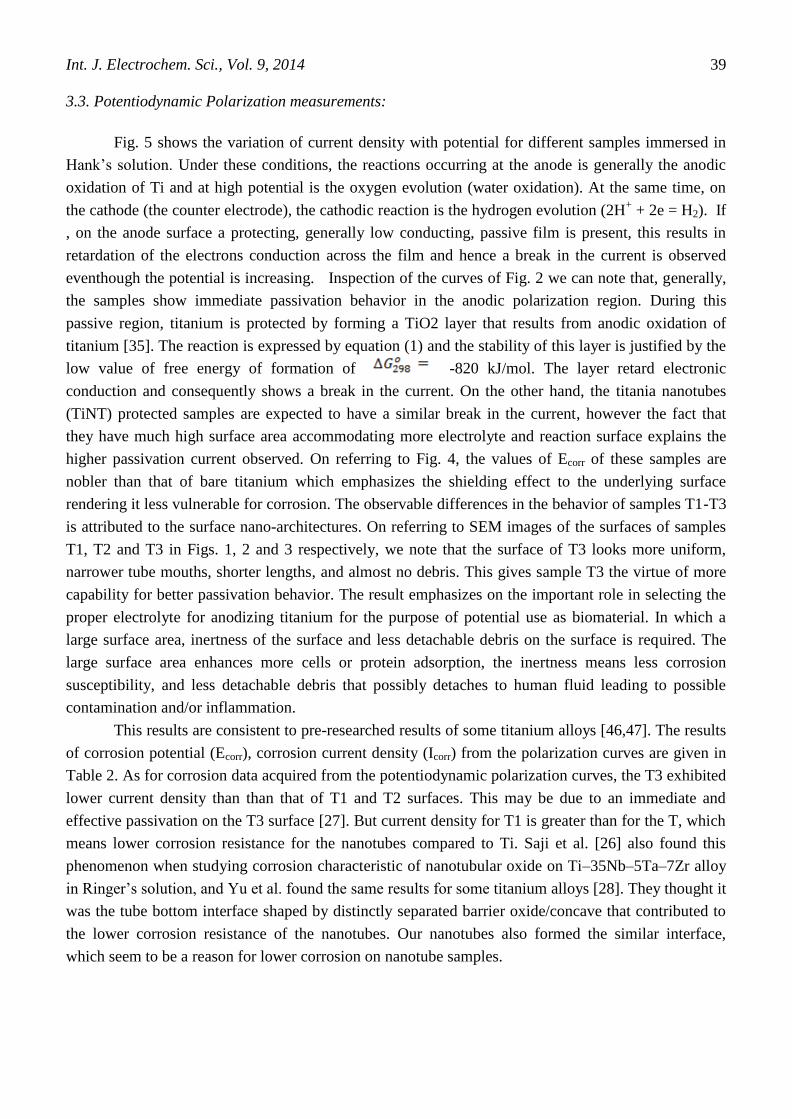
3.3. Potentiodynamic Polarization measurements:
Fig. 5 shows the variation of current density with potential for different samples immersed in
Hank’s solution. Under these conditions, the reactions occurring at the anode is generally the anodic
oxidation of Ti and at high potential is the oxygen evolution (water oxidation). At the same time, on
the cathode (the counter electrode), the cathodic reaction is the hydrogen evolution (2H+ + 2e = H2). If
, on the anode surface a protecting, generally low conducting, passive film is present, this results in
retardation of the electrons conduction across the film and hence a break in the current is observed
eventhough the potential is increasing. Inspection of the curves of Fig. 2 we can note that, generally,
the samples show immediate passivation behavior in the anodic polarization region. During this
passive region, titanium is protected by forming a TiO2 layer that results from anodic oxidation of
titanium [35]. The reaction is expressed by equation (1) and the stability of this layer is justified by the
low value of free energy of formation of -820 kJ/mol. The layer retard electronic
conduction and consequently shows a break in the current. On the other hand, the titania nanotubes
(TiNT) protected samples are expected to have a similar break in the current, however the fact that
they have much high surface area accommodating more electrolyte and reaction surface explains the
higher passivation current observed. On referring to Fig. 4, the values of Ecorr of these samples are
nobler than that of bare titanium which emphasizes the shielding effect to the underlying surface
rendering it less vulnerable for corrosion. The observable differences in the behavior of samples T1-T3
is attributed to the surface nano-architectures. On referring to SEM images of the surfaces of samples
T1, T2 and T3 in Figs. 1, 2 and 3 respectively, we note that the surface of T3 looks more uniform,
narrower tube mouths, shorter lengths, and almost no debris. This gives sample T3 the virtue of more
capability for better passivation behavior. The result emphasizes on the important role in selecting the
proper electrolyte for anodizing titanium for the purpose of potential use as biomaterial. In which a
large surface area, inertness of the surface and less detachable debris on the surface is required. The
large surface area enhances more cells or protein adsorption, the inertness means less corrosion
susceptibility, and less detachable debris that possibly detaches to human fluid leading to possible
contamination and/or inflammation.
This results are consistent to pre-researched results of some titanium alloys [46,47]. The results
of corrosion potential (Ecorr), corrosion current density (Icorr) from the polarization curves are given in
Table 2. As for corrosion data acquired from the potentiodynamic polarization curves, the T3 exhibited
lower current density than than that of T1 and T2 surfaces. This may be due to an immediate and
effective passivation on the T3 surface [27]. But current density for T1 is greater than for the T, which
means lower corrosion resistance for the nanotubes compared to Ti. Saji et al. [26] also found this
phenomenon when studying corrosion characteristic of nanotubular oxide on Ti–35Nb–5Ta–7Zr alloy
in Ringer’s solution, and Yu et al. found the same results for some titanium alloys [28]. They thought it
was the tube bottom interface shaped by distinctly separated barrier oxide/concave that contributed to
the lower corrosion resistance of the nanotubes. Our nanotubes also formed the similar interface,
which seem to be a reason for lower corrosion on nanotube samples.
Int. J. Electrochem. Sci., Vol. 9, 2014
40
Figure 5. Potentiodynamic polarization plots of Ti and nanotube Ti samples in Hank’s solution
Table 2. Electrochemical parameters obtained from potentiodynamic polarization test
Sample Ecorr
V
Ba
mV dec-1
Bc
mV dec-1
Icorr
mA cm-2
T1 -0.482 296 131 1.01 x 10⁻³
T2 -0.472 249 155 1.17 x 10⁻³
T3 -0.484 178 189 8.56 x 10⁻⁴
T -0.337 461 101 8.18 x 10⁻⁵
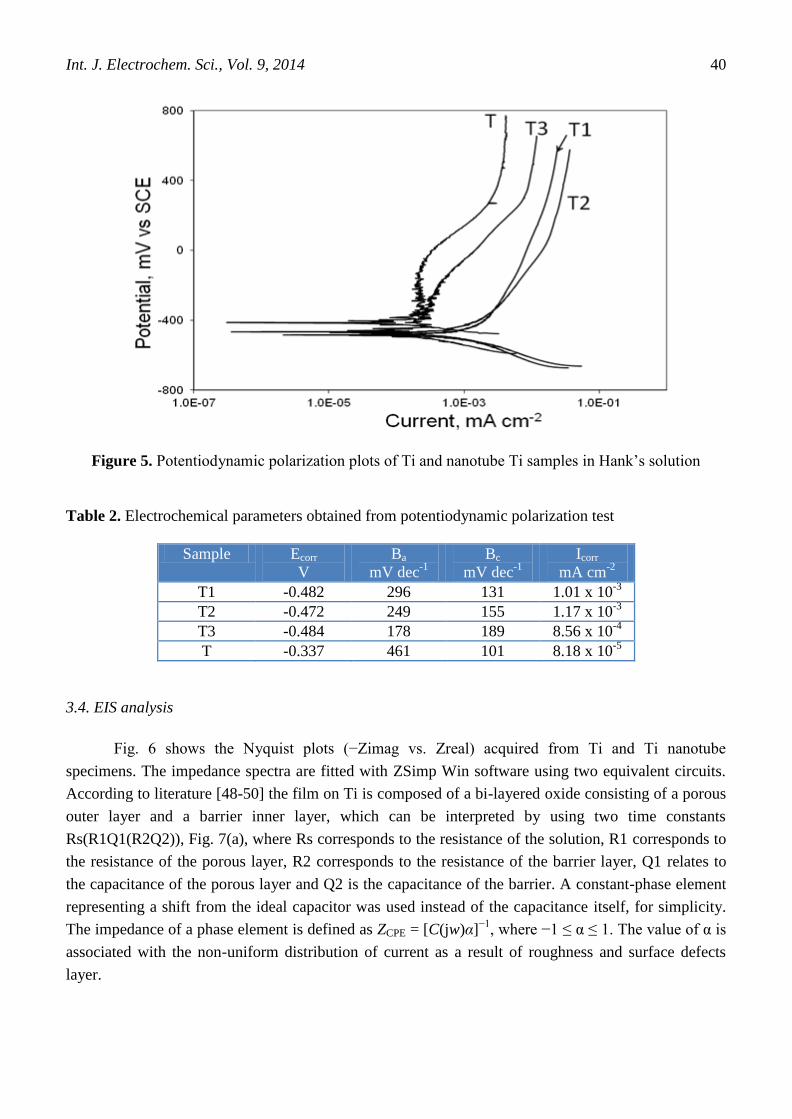
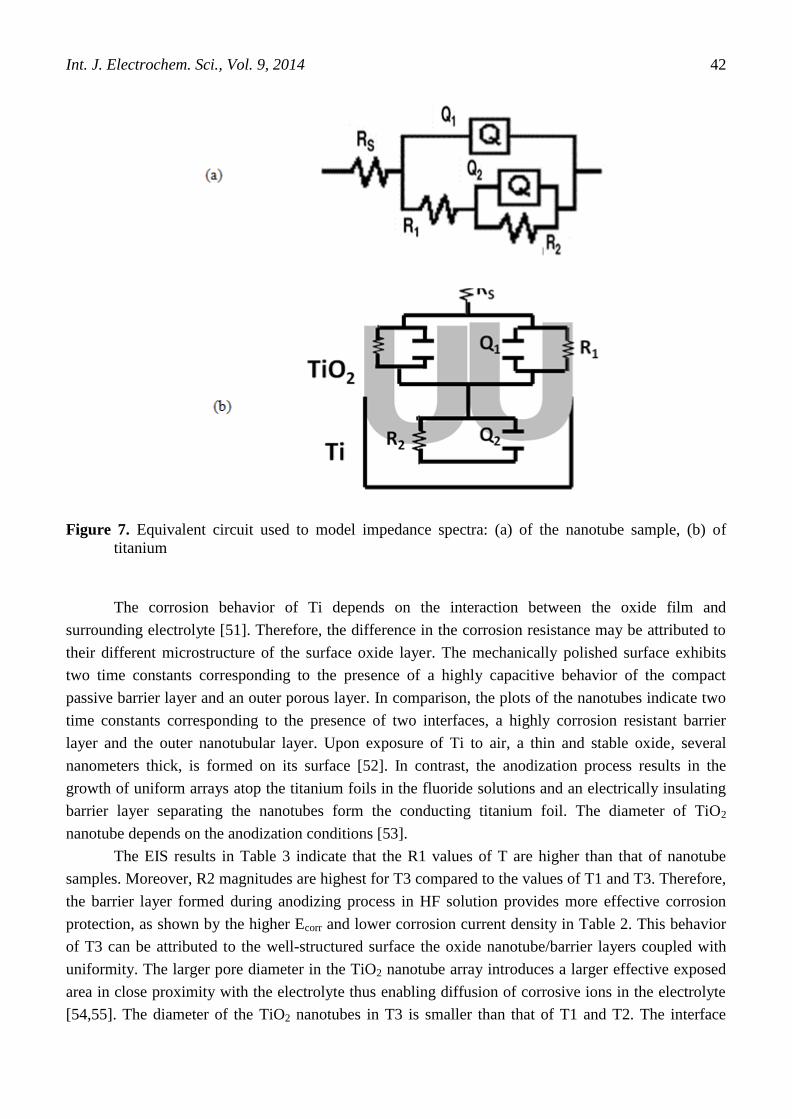
3.4. EIS analysis
Fig. 6 shows the Nyquist plots (−Zimag vs. Zreal) acquired from Ti and Ti nanotube
specimens. The impedance spectra are fitted with ZSimp Win software using two equivalent circuits.
According to literature [48-50] the film on Ti is composed of a bi-layered oxide consisting of a porous
outer layer and a barrier inner layer, which can be interpreted by using two time constants
Rs(R1Q1(R2Q2)), Fig. 7(a), where Rs corresponds to the resistance of the solution, R1 corresponds to
the resistance of the porous layer, R2 corresponds to the resistance of the barrier layer, Q1 relates to
the capacitance of the porous layer and Q2 is the capacitance of the barrier. A constant-phase element
representing a shift from the ideal capacitor was used instead of the capacitance itself, for simplicity.
The impedance of a phase element is defined as ZCPE = [C(jw)α]−1
, where −1 ≤ α ≤ 1. The value of α is
associated with the non-uniform distribution of current as a result of roughness and surface defects
layer.
Int. J. Electrochem. Sci., Vol. 9, 2014
41
Figure 6. Nyquist diagrams of Ti and nanotube Ti samples at the open-circuit potential
Table 3. Fitted electrochemical parameters determined from the Nyquist spectra based on the
equivalent circuits
Sample Rs
ohm cm2
R1 x 103
ohm cm2
Q1 x 10-4
F cm-2
n1 R2 x 103
ohm cm2
Q2 x 10-4
F
cm-2
n2
T 42.9 77.9 0.021 0.96 909.0 0.0165 0.85
T1 56.2 14.2 2.11 0.95 42.0 1.76 0.89
T2 43.1 7.95 3.06 0.94 36.8 2.11 0.91
T3 86.1 31.3 1.91 0.96 272.0 0.768 0.90
The titania nanotube-coated sample consists of an outer nanotube layer and an inner barrier
layer [42]. The EIS spectra are interpreted by using a model with two constants Rs(R1Q1)(R2Q2), as
shown in Fig. 7(b), where R1 represents the resistance of the outer nanotube layer, Q1 is the constant
phase element of the outer nanotube layer, R2 is the resistance of the inner barrier layer, and Q2 is
corresponding to the inner barrier layer [27,47]. The electrochemical parameters by fitting the circuits
(error of less than 10%) are presented in Table 3.
The values of R2 indicate that the samples with nanotube TiO2 layer have high corrosion
resistance. However, with smallest TiO2 nanotube diameters, for T3, the corrosion resistance R2 is
higher than the other two samples, which disclosing the effects of the nanotube diameter on the
corrosion resistance.
Based on these results, both the length and diameter of the nanotube might affect the
electrochemical corrosion behavior of TiO2 nanotubes atop the surface of titanium foil. The wall
between TiO2 nanotubes may be another important factor influencing the electrochemical stability
[43].
Int. J. Electrochem. Sci., Vol. 9, 2014
42
Figure 7. Equivalent circuit used to model impedance spectra: (a) of the nanotube sample, (b) of
titanium
The corrosion behavior of Ti depends on the interaction between the oxide film and
surrounding electrolyte [51]. Therefore, the difference in the corrosion resistance may be attributed to
their different microstructure of the surface oxide layer. The mechanically polished surface exhibits
two time constants corresponding to the presence of a highly capacitive behavior of the compact
passive barrier layer and an outer porous layer. In comparison, the plots of the nanotubes indicate two
time constants corresponding to the presence of two interfaces, a highly corrosion resistant barrier
layer and the outer nanotubular layer. Upon exposure of Ti to air, a thin and stable oxide, several
nanometers thick, is formed on its surface [52]. In contrast, the anodization process results in the
growth of uniform arrays atop the titanium foils in the fluoride solutions and an electrically insulating
barrier layer separating the nanotubes form the conducting titanium foil. The diameter of TiO2
nanotube depends on the anodization conditions [53].
The EIS results in Table 3 indicate that the R1 values of T are higher than that of nanotube
samples. Moreover, R2 magnitudes are highest for T3 compared to the values of T1 and T3. Therefore,
the barrier layer formed during anodizing process in HF solution provides more effective corrosion
protection, as shown by the higher Ecorr and lower corrosion current density in Table 2. This behavior
of T3 can be attributed to the well-structured surface the oxide nanotube/barrier layers coupled with
uniformity. The larger pore diameter in the TiO2 nanotube array introduces a larger effective exposed
area in close proximity with the electrolyte thus enabling diffusion of corrosive ions in the electrolyte
[54,55]. The diameter of the TiO2 nanotubes in T3 is smaller than that of T1 and T2. The interface
Int. J. Electrochem. Sci., Vol. 9, 2014
43
reaction is enhanced by a larger exposed area between the surface and electrolyte. The larger
nanotubes provide more channels for the electrolyte to reach the barrier layer consequently increasing
the chance of the reaction between corrosive ions and titanium oxide [51,56]. The phenomenon is
similar to the results reported by Jang and Kim who used nanotubes approximately 150–200 nm and
220 nm in size, respectively in the corrosion tests [42,56]. Based on these results, both the thickness of
the barrier layer and diameter of the nanotube might affect the electrochemical corrosion behavior of
TiO2 nanotubes atop the surface of titanium foil. The wall between TiO2 nanotubes may be another
important factor influencing the electrochemical stability [43].
From the standpoint of osseointegration, TiO2 nanotubes enhance apatite formation in
biomedical applications compared with the Ti metal [10] or flat TiO2 layer [57]. The nanotubular
structure (influenced by pore structure and pore size) contains significantly increased surface area and
also more ‘in between - nanotube pathways for fluid’ [10]. The increased surface area of the TiO2
nanotubes is useful for accelerated bone growth in orthopedic/dental applications [10,58].
4. CONCLUSION
TiO2 nanotubes with different sizes are synthesized on Ti by the anodization process in
different solutions containing fluoride ion. The nanotubes coated samples show higher open-circuit
potentials than mechanically polished Ti in Hank's solution. The EIS and PD results indicate that the
electrochemical stability of the nanotubular surface depends on the diameter of the TiO2 nanotube. A
diameter that is large leads to decreased corrosion resistance. Our results exhibit that the titanium with
nanotubes can improve the osseointegration of surgical implants in physiological environment.
ACKNOWLEDGMENT
The authors gratefully acknowledge the financial aid from the Deanery of Scientific Research of the
University of Princess Norah bint Abdulrahman, Riyadh, Kingdom of Saudi Arabia to the Research
Project number 026-K-32.
References
1. A. Bigi, E. Boanini, B. Bracci, A. Facchini, S. Panzavolta, F. Segatti, L. Sturba, Biomaterials 26
(2005) 4085.
2. K. Indira, U. Kamachi Mudali, N. Rajendran, Ceramics International 39 (2013) 959.
3. Seung-Hyun Jang, Han-Cheol Choe, Yeong-Mu Ko, William A. Brantley, Thin Solid Films 517
(2009) 5038.
4. M. Uchida, H.M. Kim, T. Kokubo, S. Fujibayashi, T. Nakamura, J. Biomed. Mater. Res. 64 (2003)
164.
5. E. Lugscheider, T. Weber, M. Knepper, F. Vizethum, Mater. Sci. Eng., A Struct. Mater.: Prop.
Microstruct. Process. A139 (1991) 45.
6. P. Ducheyne, W. Van Raemdonck, J.C. Heughebaert, M. Heughebaert, Biomaterials 7 (1986) 97.
7. D.R. Cooley, A.F. Van Dellen, J.O. Burgess, A.S. Windeler, J. Prosthet. Dent. 67 (1992) 93.
8. M.C. De Andrade, M.S. Sader, M.R.T. Filgueiras, T. Ogasawara, J. Mater. Sci., Mater. Med. 11
(2000) 751.
9. H.M. Kim, F. Miyaji, T. Kokubo, T. Nakamura, J. Biomed. Mater. Res. 32 (1996) 409.
10. Seunghan Oh, Sungho Jin, Materials Science and Engineering C 26 (2006) 1301.
11. A. Ghicov, P. Schmuki, Chemical Communications 20 (2009) 2791.
Int. J. Electrochem. Sci., Vol. 9, 2014
44
12. S. Oh, C. Daraio, L.H. Chen, T.R. Pisanic, R.R.Finones, S. Jin, J. Biomed. Mater. Res. A, 78
(2006) 97.
13. K.C. Popat, L. Leoni, C.A. Grimes, T.A. Desai, Biomaterials 28 (2007) 3188.
14. C. Yao, E.B. Slamovich, T.J. Webster, J. Biomed. Mater. Res. A 85 (2008) 157.
15. C.von Wilmowsky, S. Bauer, R. Lutz, M. Meisel, F.W. Neukam, T. Toyoshima, P. Schmuki, E.
Nkenke, K.A. Schlegel, J. Biomed. Mater. Res. B: Appl. Biomater. 89 (2009) 165.
16. L.M. Bjursten, L. Rasmusson, S. Oh, G.C. Smith, K.S. Brammer, S. Jin, J. Biomed. Mater. Res. A,
92 (2010) 1218.
17. Sepideh Minagar, Christopher C. Berndt, James Wang, Elena Ivanova, Cuie Wen, Acta
Biomaterialia 8 (2012) 2875.
18. L. Peng, M.L. Eltgroth, T.J. LaTempa, C.A. Grimes, T.A. Desai, Biomaterials 30 (2009) 1268.
19. L.L. Peng, A.D. Mendelsohn, T.J. LaTempa, S. Yoriya, C.A. Grimes, T.A. Desai, Nano Lett. 9
(2009) 1932.
20. K.S. Brammer, S. Oh, J.O. Gallagher, S. Jin, Nano Lett. 8 (2008) 786.
21. K.C.Popat, M. Eltgroth, T.J. LaTempa, C.A. Grimes, T.A. Desai, Biomaterials 28 (2007) 4880.
22. S.H. Oh, R.R. Finones, C. Daraio, L.H. Chen, S. Jin, Biomaterials 26 (2005) 4938.
23. S. Oh, K.S. Brammer, Y.S.J. Li, D. Teng, A.J. Engler, S. Chien, PNAS 106 (2009) 2130.
24. J. Park, S. Bauer, K.A. Schlegel, F.W. Neukam, K. von der Mark, P. Schmuki, Small 5 (2009) 666.
25. M. Kalbacova, J.M. Macak, F. Schmidt-Stein, C.T. Mierke, P. Schmuki, Phys. Status Solid RRL 2
(2008) 194.
26. V.S. Saji, H.C. Choe, W.A. Brantley, Acta Biomater. 5 (2009) 2303.
27. W.Q. Yu, J. Qiu, L. Xu, F.Q. Zhang, Biomed. Mater. 4 (2009) 065012.
28. Wei-qiang Yu, Jing Qiu, Fu-qiang Zhang, Colloids and Surfaces B: Biointerfaces 84 (2011) 400.
29. M. H. Wong, F. T. Cheng, H. C. Man, Appl. Surf. Sci. 253 (2007) 7527.
30. V. Raman, S. Nagarajan, N. Rajendran, Electrochemistry Communications 8 (2006) 1309.
31. E. Chang, T. M. Lee, Biomaterials 23 (2002) 2917.
32. A. W. E. Hodgson, Y. Mueller, D. Forster, S. Virtanen, Electrochimica Acta 47 (2002) 1913.
33. C.A. Grimes, J. Mater. Chem. 17 (2007) 1451.
34. G.A. Crawford, N. Chawla, Acta Mater. 57 (2009) 854.
35. Xuanyong Liu, Paul K. Chu, Chuanxian Ding, Materials Science and Engineering R 70 (2010)
275.
36. Mihaela Mindroiu, Cristian Pirvu, Raluca Ion, Ioana Demetrescu, Electrochimica Acta 56 (2010)
193.
37. Y. Lai, H. Zhuanga, L. Suna, Z. Chenb, L. Changjian, Electrochimica Acta 54 (2009) 6536.
38. J.M. Macak, H. Tsuchiya, P. Schmuki, Angew. Chem. 44 (2005) 2100.
39. J.M. Macak, K. Sirotna, P. Schmuki, Electrochimica Acta 50 (2005) 3679.
40. Andrei Ghicov, Hiroaki Tsuchiya, Jan M. Macak, Patrik Schmuki, Electrochemistry.
Communication 7 (2005) 505.
41. C.E.B. Marino, P.A.P. Nascente, S.R. Boaggio, R.C. Rocha-Filcho, N. Bocchi, Thin Solid Films
468 (2004) 109.
42. S.H. Jang, H.C. Choe, Y.M. Ko, W.A. Brantley, Thin Solid Films 517 (2009) 5038.
43. Chenglong Liu, Yueji Wang, Meng Wang, Weijiu Huang, Paul K. Chu, Surface and Coatings
Technology 206 (2011) 63.
44. X. Cheng, S.G. Roscoe, Biomaterials 26 (2005) 7350.
45. S.L. De Assis, S. Wolynec, I. Costa, Electrochim. Acta 51 (2006) 1815.
46. Han-Cheol Choe, Won-Gi Kim, Yong-Hoon Jeong, Surface and Coatings Technology 205 (2010)
S305.
47. V.S. Saji, H.C. Choe, Corros. Sci. 51 (2009) 1658.
48. T. Hanawa, Sci. Technol. Advs. Mater. 3 (2002) 289.
49. S.Y. Yu, J. R. Scully, Corrosion 53 (1997) 965.
Int. J. Electrochem. Sci., Vol. 9, 2014
45
50. N.A. Al-Mobarak, A.A. Al-Swayih, F.A. Al-Rashoud, Int. J. Electrochem. Sci. 6 (2011) 2031.
51. A. Balamurugan, S. Rajeswari, G. Balossier, Mater. Corros. 59 (2008) 855.
52. S. Hiromoto, T. Hanawa, K. Asami, Biomaterials 25 (2004) 979.
53. S. Bauer, S. Kleber, P. Schmuki, Electrochem. Commun. 8 (2006) 1321.
54. D.S. Kong, Langmuir 24 (2008) 5324.
55. A.G. Munoz, Q. Chen, P. Schmuki, J. Solid State, Electrochem. 11 (2007) 1077.
56. W.G. Kim, H.C. Choe, Trans. Nonferrous Met. Soc. China 19 (2009) 1005.
57. H. Tsuchiya, J.M. Macak, L. Müller, J. Kunze, F.Müller, P. Greil, S.Virtanen, P. Schmuki, J.
Biomed. Mater. Res. A 77 (2006) 534.
58. Ramaswamy Narayanan, Hyo-Jin Lee, Tae-Yub Kwon, Kyo-Han Kim, Materials Chemistry and
Physics 125 (2011) 510.
© 2014 by ESG (www.electrochemsci.org)


![Fatigue Life Prediction of Commercial Dental Implants ... et. al.pdf · shaping and finishing [8]. Dental implants are usually made from commercially pure titanium or titanium alloys](https://img.pdfslide.us/doc/110x75/5ea6923c9dcf1a5f53266e8d/fatigue-life-prediction-of-commercial-dental-implants-et-alpdf-shaping-and.jpg)