Embed Size (px)
Citation preview

DEVELOPMENT OF THE REAL ESTATE MARKET IN PRAGUE
Praha, 27 January 2011
David Dušek, Real Estate Appraisal Section
2
Table of Contents
Flat market in Prague
Office market in Prague
3
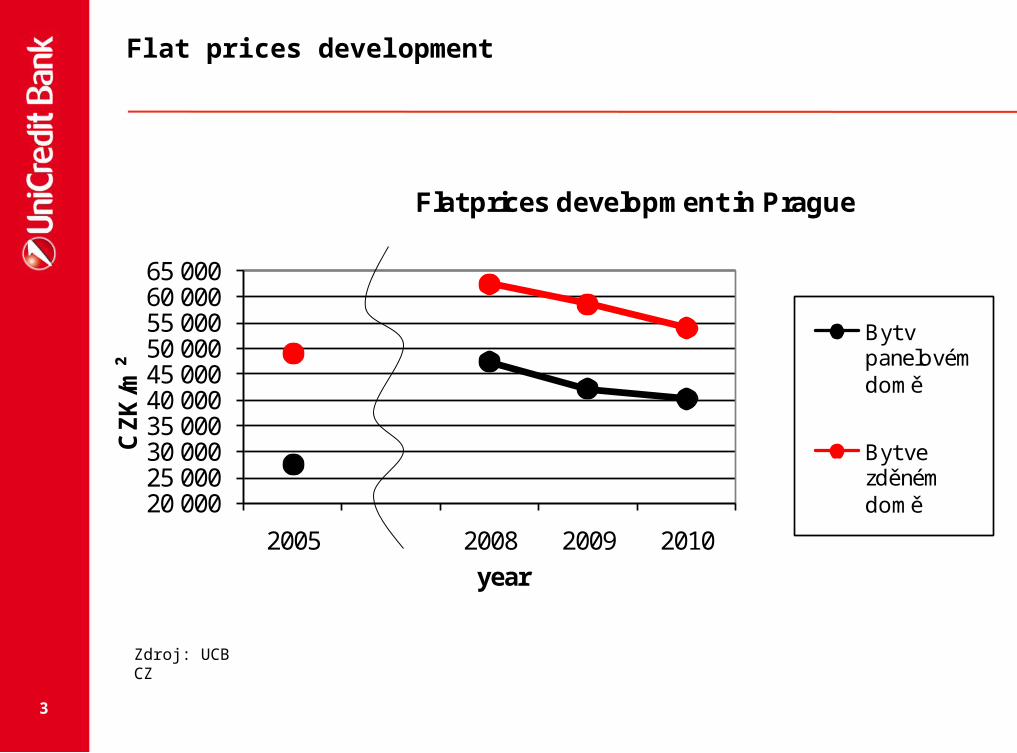
Flat prices development
20 00025 00030 00035 00040 00045 00050 00055 00060 00065 000
2005 2008 2009 2010
CZ
K/m
²
year
Flat prices development in Prague
Byt v panelovém domě
Byt ve zděném domě
Zdroj: UCB CZ
4
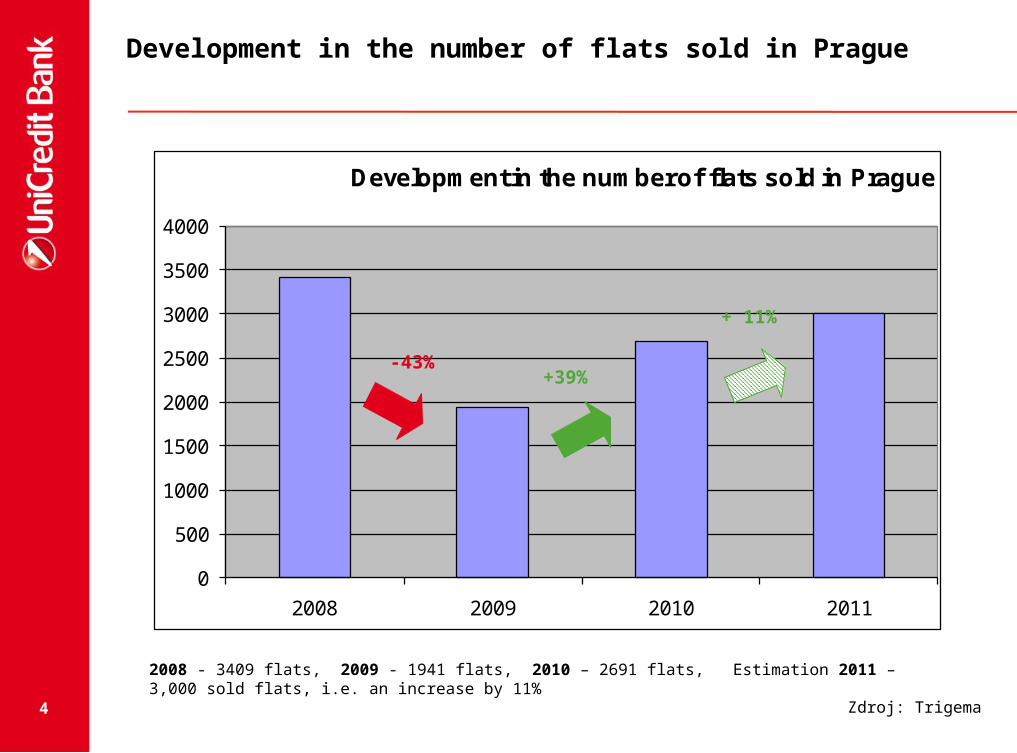
Development in the number of flats sold in Prague
0
500
1000
1500
2000
2500
3000
3500
4000
2008 2009 2010 2011
Development in the number of flats sold in Prague
2008 - 3409 flats, 2009 - 1941 flats, 2010 – 2691 flats, Estimation 2011 – 3,000 sold flats, i.e. an increase by 11%
-43%+39%
+ 11%
Zdroj: Trigema
5
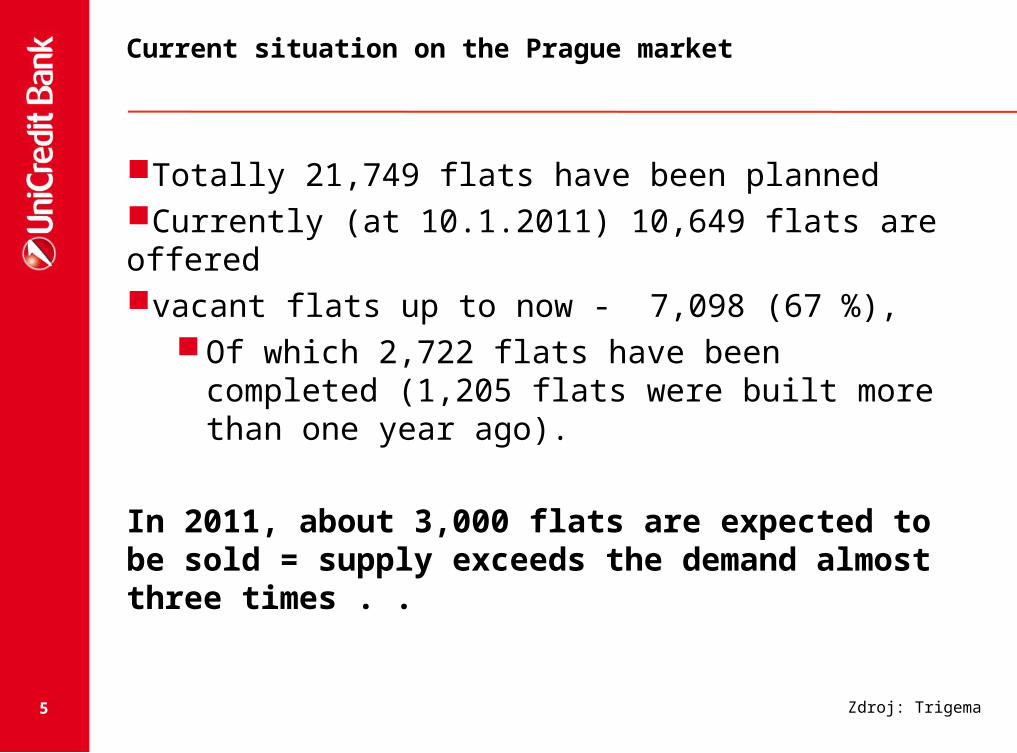
Current situation on the Prague market
Totally 21,749 flats have been planned Currently (at 10.1.2011) 10,649 flats are offeredvacant flats up to now - 7,098 (67 %),
Of which 2,722 flats have been completed (1,205 flats were built more than one year ago).
In 2011, about 3,000 flats are expected to be sold = supply exceeds the demand almost three times . .
Zdroj: Trigema
6
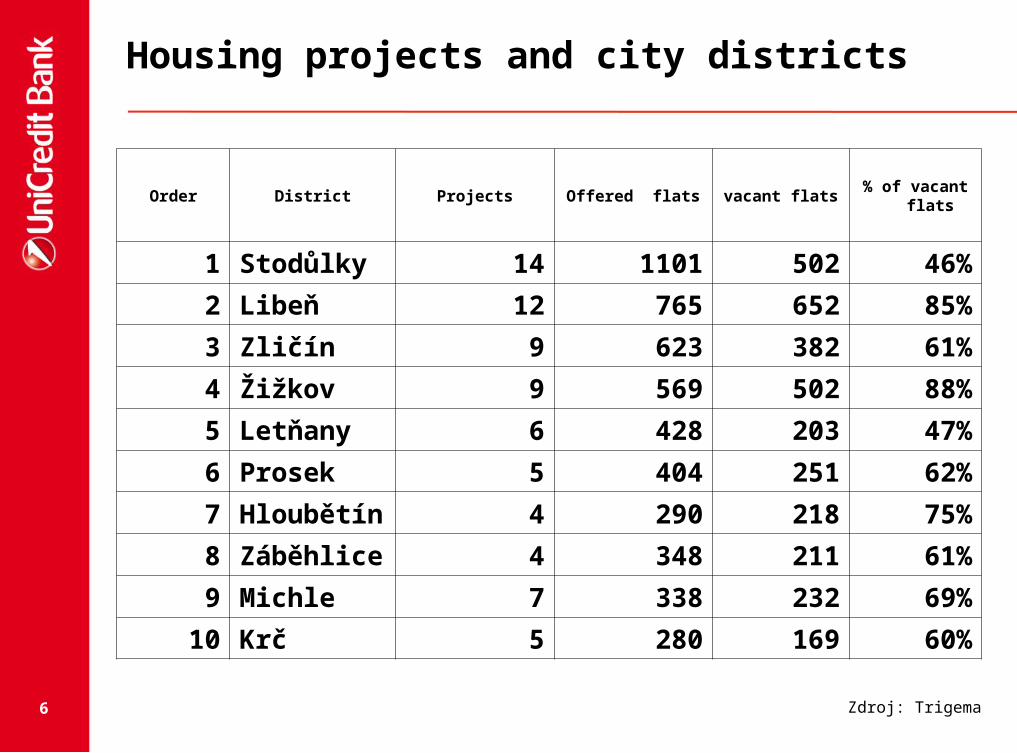
Housing projects and city districts
Order District Projects Offered flats vacant flats% of vacant
flats
1 Stodůlky 14 1101 502 46%
2 Libeň 12 765 652 85%
3 Zličín 9 623 382 61%
4 Žižkov 9 569 502 88%
5 Letňany 6 428 203 47%
6 Prosek 5 404 251 62%
7 Hloubětín 4 290 218 75%
8 Záběhlice 4 348 211 61%
9 Michle 7 338 232 69%
10 Krč 5 280 169 60%
Zdroj: Trigema
7
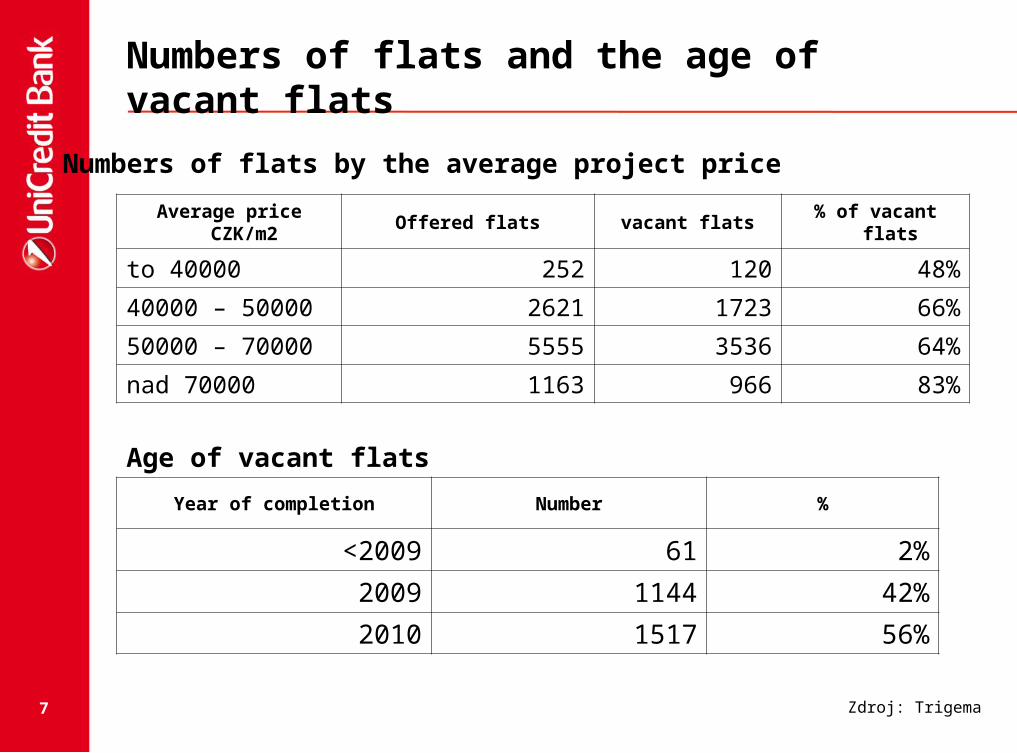
Numbers of flats and the age of vacant flats
Average price CZK/m2 Offered flats vacant flats % of vacant flats
to 40000 252 120 48%
40000 – 50000 2621 1723 66%
50000 – 70000 5555 3536 64%
nad 70000 1163 966 83%
Age of vacant flats
Year of completion Number %
<2009 61 2%
2009 1144 42%
2010 1517 56%
Numbers of flats by the average project price
Zdroj: Trigema
8
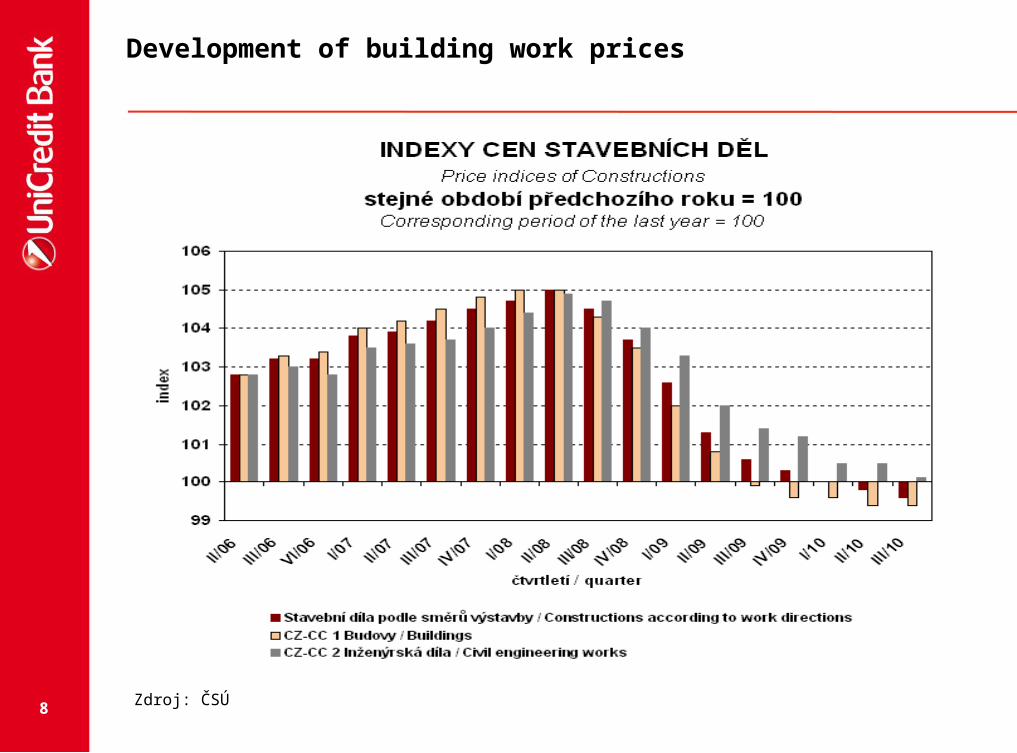
Development of building work prices
Zdroj: ČSÚ
9
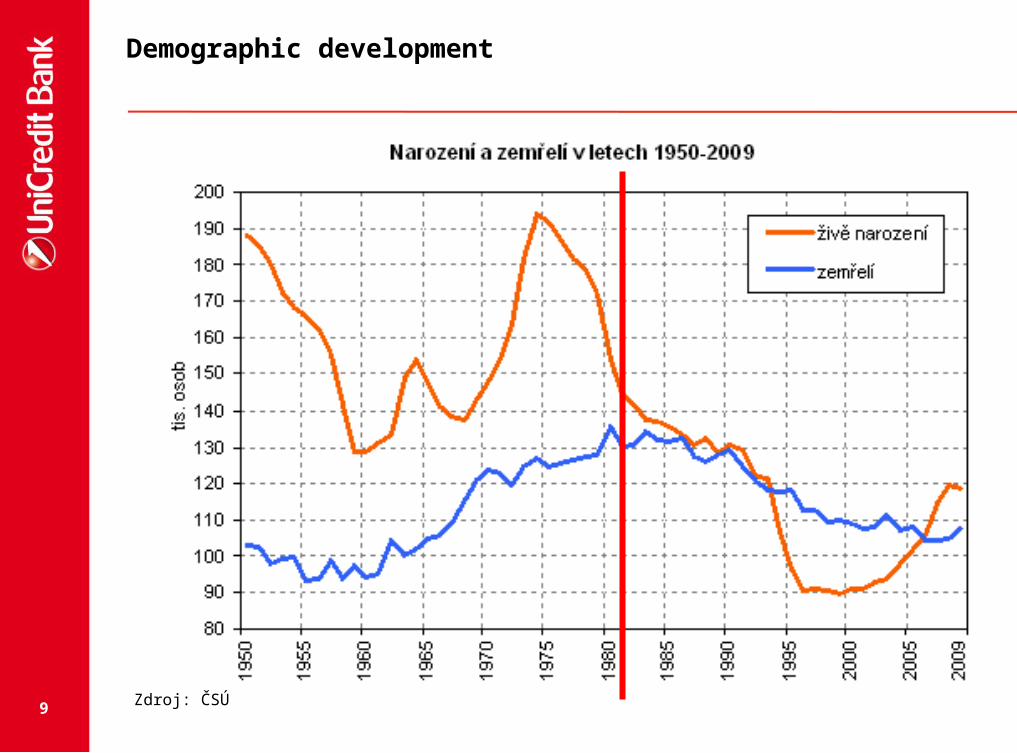
Demographic development
Zdroj: ČSÚ
10
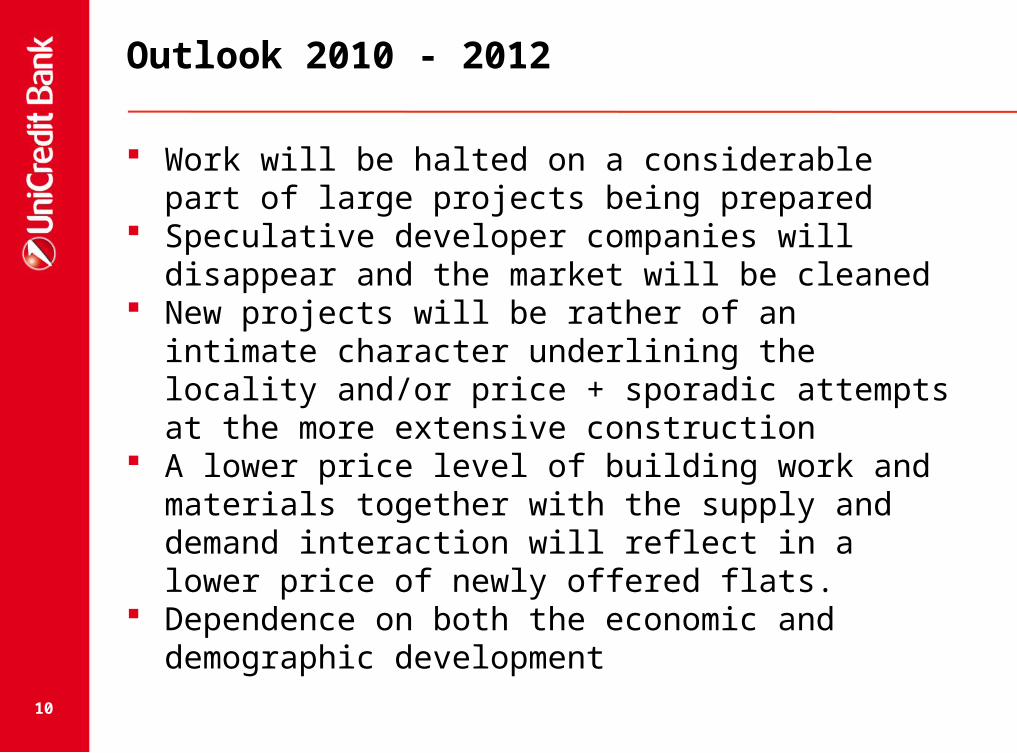
Outlook 2010 - 2012
Work will be halted on a considerable part of large projects being prepared
Speculative developer companies will disappear and the market will be cleaned
New projects will be rather of an intimate character underlining the locality and/or price + sporadic attempts at the more extensive construction
A lower price level of building work and materials together with the supply and demand interaction will reflect in a lower price of newly offered flats.
Dependence on both the economic and demographic development
11
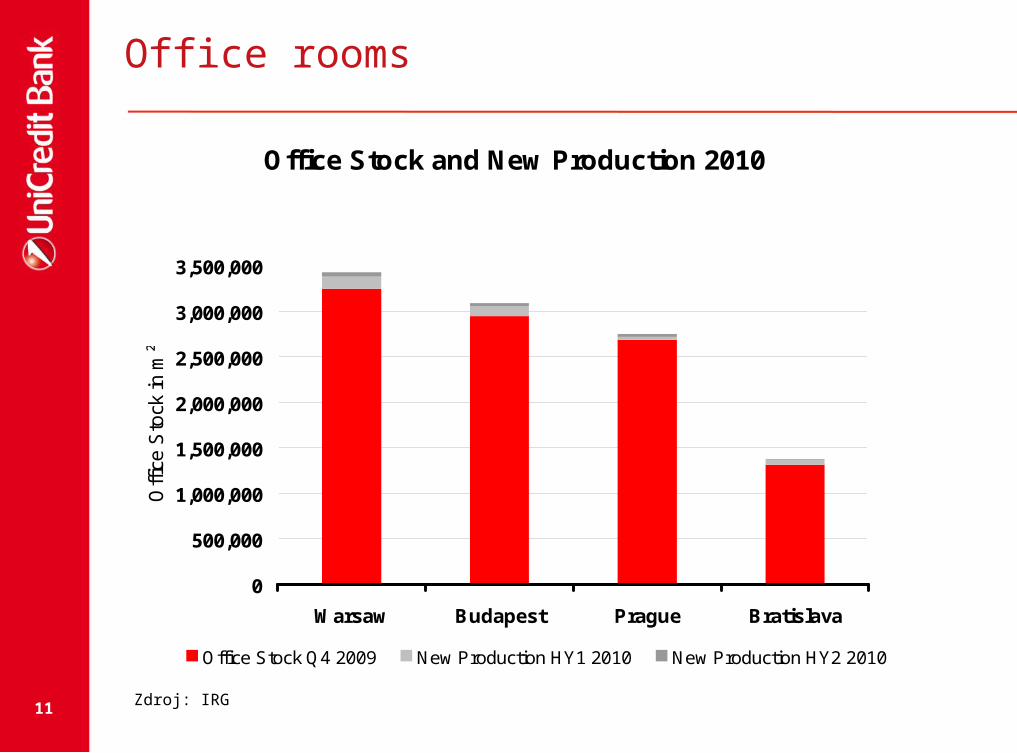
Office rooms
IRG Market Research | Operative Committee Meeting | 17.11.2010IRG Market Research | Operative Committee Meeting | 17.11.2010
Office Stock and New Production 2010
0
500,000
1,000,000
1,500,000
2,000,000
2,500,000
3,000,000
3,500,000
Warsaw Budapest Prague Bratislava
Offi
ce S
tock
in m
²
Office Stock Q4 2009 New Production HY1 2010 New Production HY2 2010
Zdroj: IRG
12
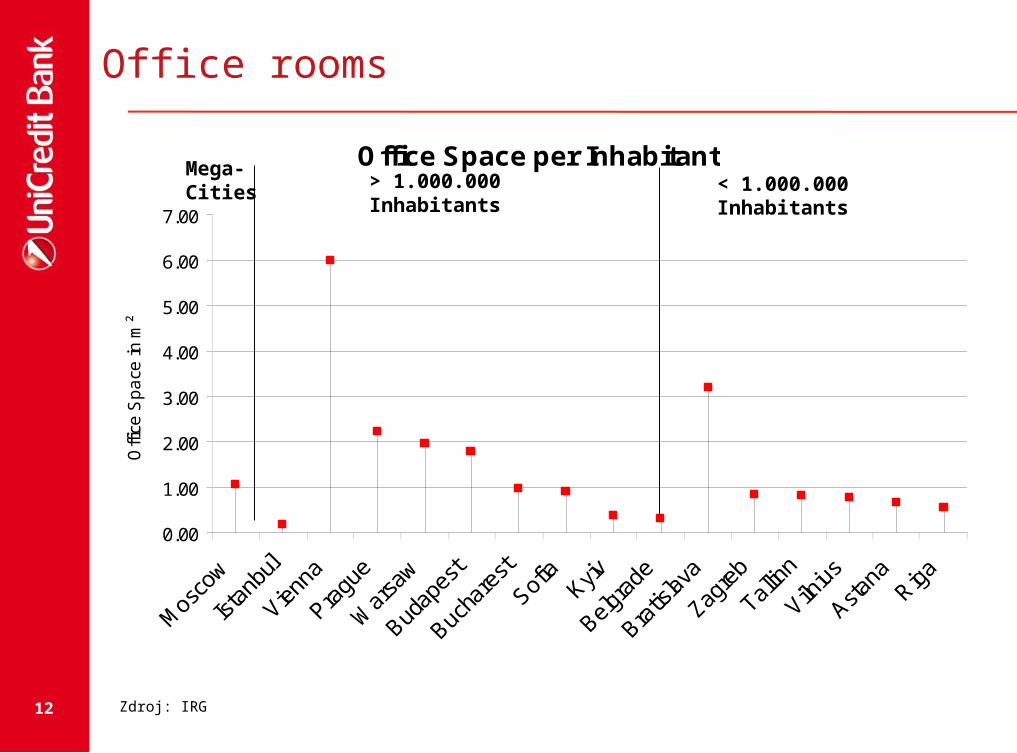
Office Space per Inhabitant
0.00
1.00
2.00
3.00
4.00
5.00
6.00
7.00
Offi
ce S
pa
ce in
m²
Zdroj: IRG
Office rooms
IRG Market Research | Operative Committee Meeting | 17.11.2010
Mega-Cities
> 1.000.000 Inhabitants < 1.000.000 Inhabitants
IRG Market Research | Operative Committee Meeting | 17.11.2010
13
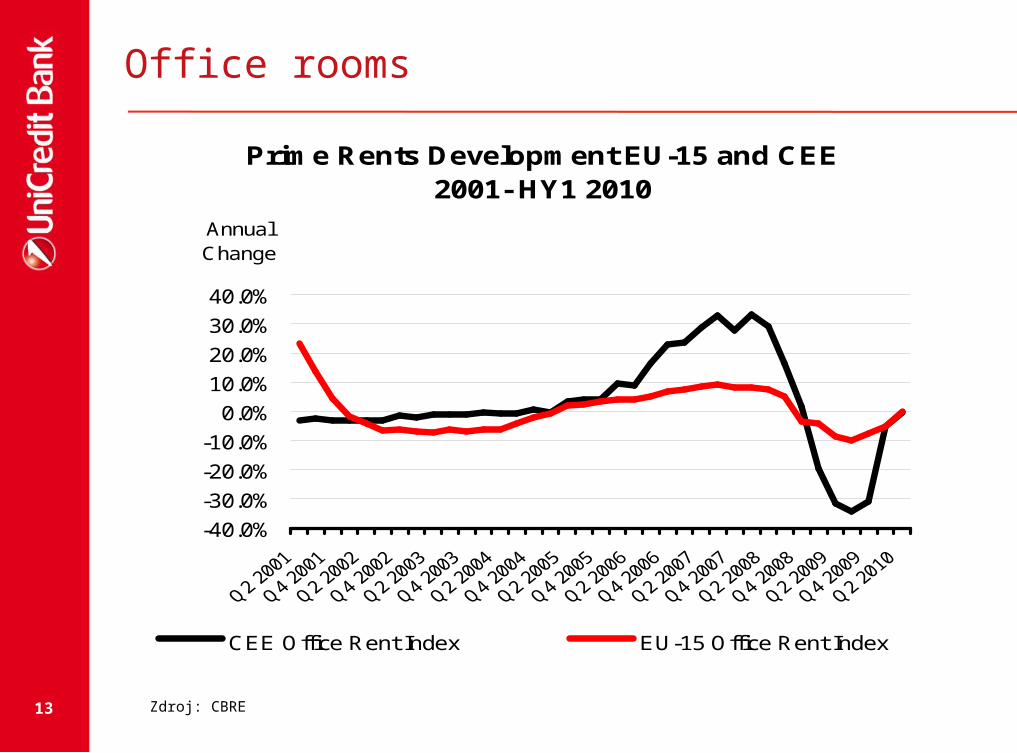
Prime Rents Development EU-15 and CEE2001- HY1 2010
-40.0%
-30.0%
-20.0%
-10.0%
0.0%
10.0%
20.0%
30.0%
40.0%
Annual Change
CEE Office Rent Index EU-15 Office Rent Index
Office rooms
IRG Market Research | Operative Committee Meeting | 17.11.2010Zdroj: CBRE
IRG Market Research | Operative Committee Meeting | 17.11.2010
14IRG Market Research | Operative Committee Meeting | 17.11.2010
Va
ca
nc
y R
ate
/Yie
lds
in %
Re
nts
Eu
ro/m
²/M
on
th
IRG Market Research | Operative Committee Meeting | 17.11.2010
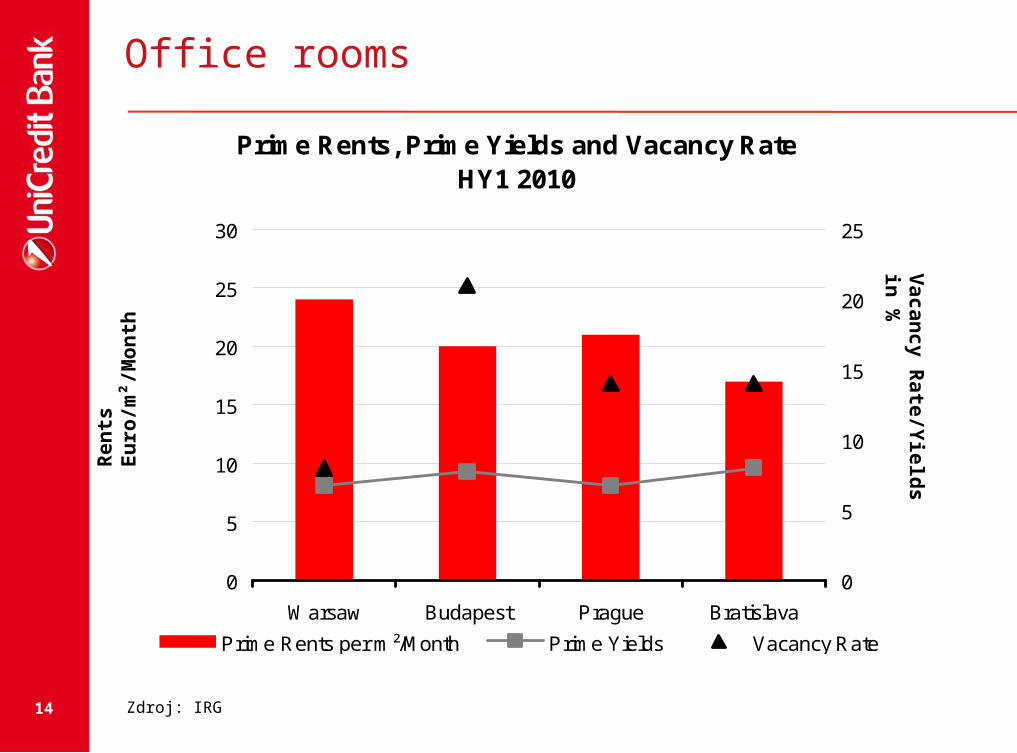
Prime Rents, Prime Yields and Vacancy Rate HY1 2010
0
5
10
15
20
25
30
Warsaw Budapest Prague Bratislava
0
5
10
15
20
25
Prime Rents per m²/Month Prime Yields Vacancy Rate
Office rooms
Zdroj: IRG
15IRG Market Research | Operative Committee Meeting | 17.11.2010
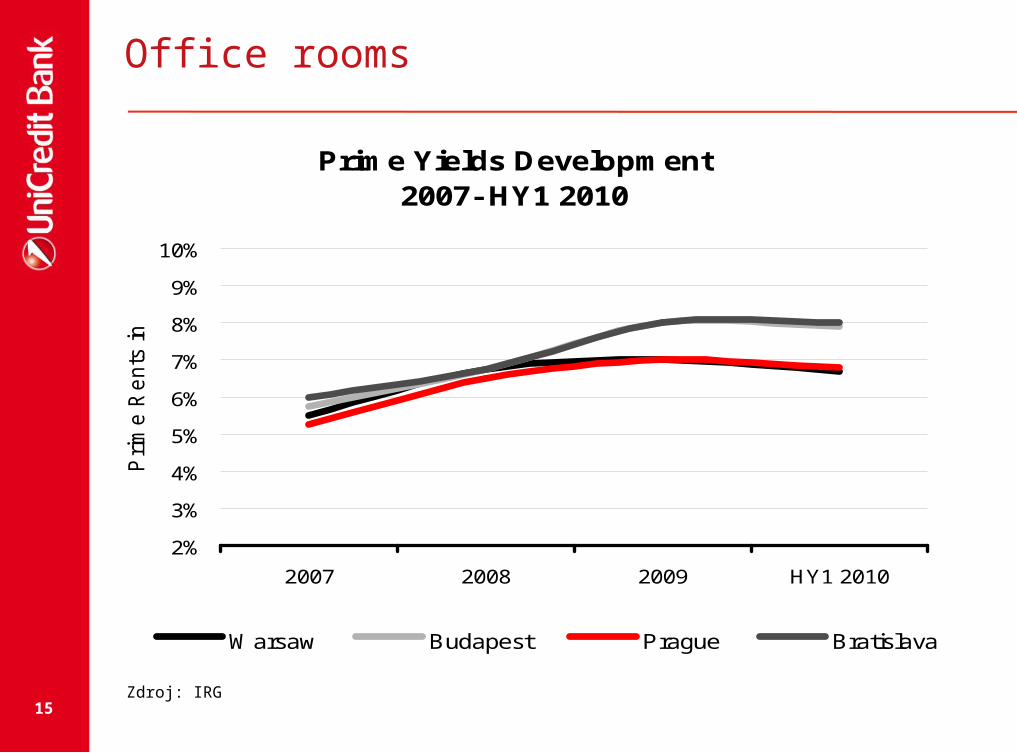
Prime Yields Development2007- HY1 2010
2%
3%
4%
5%
6%
7%
8%
9%
10%
2007 2008 2009 HY1 2010
Pri
me
Re
nts
in
%
Warsaw Budapest Prague Bratislava
Office rooms
Zdroj: IRG
16IRG Market Research | Operative Committee Meeting | 17.11.2010IRG Market Research | Operative Committee Meeting | 17.11.2010
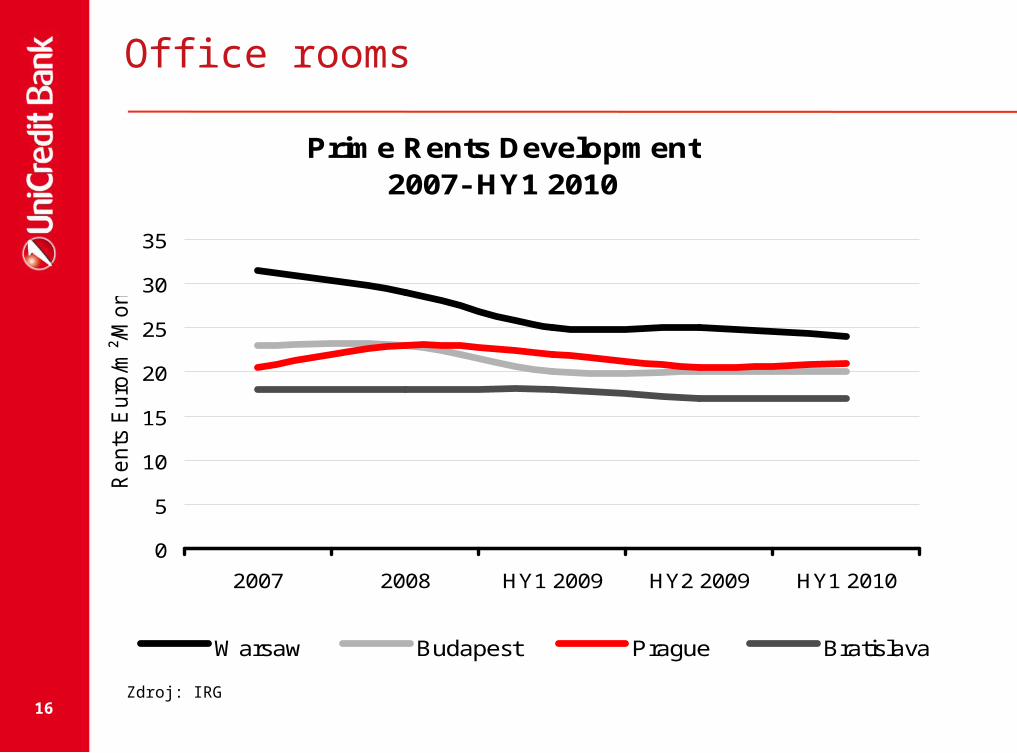
Prime Rents Development2007- HY1 2010
0
5
10
15
20
25
30
35
2007 2008 HY1 2009 HY2 2009 HY1 2010
Re
nts
Eu
ro/m
²/M
on
th
Warsaw Budapest Prague Bratislava
Office rooms
Zdroj: IRG
17IRG Market Research | Operative Committee Meeting | 17.11.2010IRG Market Research | Operative Committee Meeting | 17.11.2010
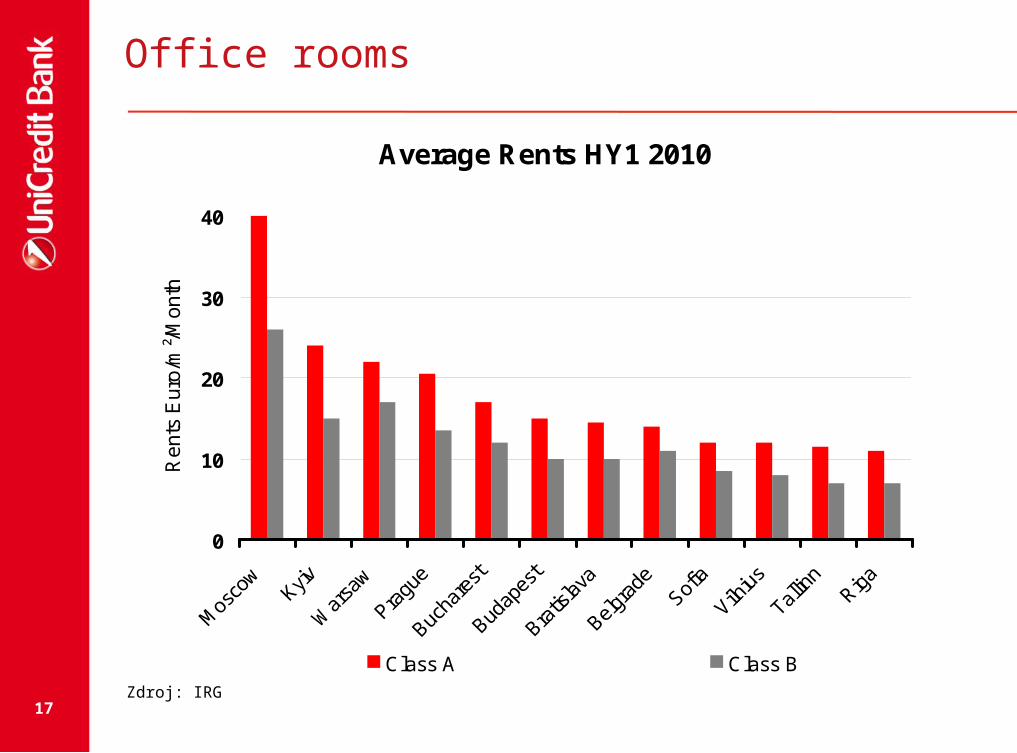
Average Rents HY1 2010
0
10
20
30
40
Rents
Euro
/m²/
Month
Class A Class B
Office rooms
Zdroj: IRG