Embed Size (px)
Citation preview
Development of the Batoka Gorge Hydro – Electric Scheme
Project Overview Document
ZESCO Limited
Zambezi River Authority
ZESA Holdings
March 2017
Batoka Gorge Hydro Electric Scheme – Project Overview Document – March 2017
Page 1
Table of contents
1. Executive Summary ........................................................................................................................... 6 2. Overview .......................................................................................................................................... 17 3. Project Participants .......................................................................................................................... 19 4. Zambia, Zimbabwe - economic overview and electricity demand ................................................... 22 5. Project Description ........................................................................................................................... 28 6. Hydrology and Energy ...................................................................................................................... 35 7. Geology ............................................................................................................................................ 41 8. Environmental and Social Impact Assessments .............................................................................. 47 9. Commercial Structure....................................................................................................................... 52 10. Procurement ..................................................................................................................................... 55 11. Managing Construction Interface Risks ........................................................................................... 57 12. Legal Framework and Overview of proposed contractual documents ............................................. 60 13. Risks and Risk Mitigation ................................................................................................................. 62 14. Indicative Financial Projections ........................................................................................................ 63
Batoka Gorge Hydro Electric Scheme – Project Overview Document – March 2017
Page 2
Disclaimer
The Zambezi River Authority (“ZRA”) is currently in the process of developing procurement documentation for the Batoka Gorge Hydro Electric Scheme (“BGHES” or “Project”). This Project Overview Document (“POD”) has been prepared taking all reasonable care. However, the information contained in it does not claim to be comprehensive, nor has it been verified by:
the ZRA
any other department of the Governments of Zambia or Zimbabwe (the “GZZ") or any state-owned entity;
any of the officers, employees, servants, agents or advisors of Government; or
any other person. Accordingly, the ZRA and parties listed above do not accept any liability or responsibility for the adequacy, accuracy or completeness of the information or opinions stated in this POD. Unless expressly stipulated herein, no representation or warranty (whether express or implied) is or will be given by the ZRA or any of its officers, employees, servants, agents, advisors or any other person with respect to the information or opinions contained in this POD, or in relation to this POD. The ZRA reserves the right to amend, modify or withdraw this POD and any part of it, and to terminate or amend any of the procedures, procurement processes or requirements detailed in it at any time, without prior notice and without liability to compensate or reimburse any person pursuant to such amendment, modification, withdrawal or termination. The terms and conditions set out in this POD are stipulated for the express benefit of the ZRA and, unless expressly stated to the contrary, may be waived at the ZRA’s sole discretion at any time. This POD is provided solely for the purpose set out herein and is not intended to form any part or basis of any investment decision by any prospective bidder, its shareholders, members or lenders. Each prospective bidder that accesses this POD must make their own, independent assessment of the Project or any part thereof in respect of which they intend submitting a response, taking such advice (whether professional or otherwise) as it deems necessary. The ZRA has engaged consultants in respect of the feasibility study, procurement of the Project and this POD. These consultants are acting solely as advisors to the ZRA to assist it in the development and implementation of the Project and, accordingly, they are not responsible, nor do they owe a duty of care, to any person other than the ZRA in respect of the Project and this POD according to their engagement agreements with the ZRA. No opinion of or for the benefit of any prospective bidder, its shareholders, members, contractors, suppliers or lenders will be provided by the aforementioned consultants to the ZRA in relation to the Project and this POD. No prospective bidder or its shareholders, members, contractors, suppliers or lenders, shall have any claim whatsoever against the ZRA, its officers, employees, servants, agents or advisors, arising out of any matter relating to the ZRA or this POD. Ernst & Young Advisory Services Pty Limited (“EY”) This POD should not be considered as advice or a recommendation by Ernst & Young Advisory Services Proprietary Limited (“EY”) or any of its subcontractors, members, shareholders, directors, officers, partners, principals or employees. The POD was compiled for, and on behalf of, the Zambezi River Authority (“ZRA”), at the ZRA’s request, and its intended purpose is solely for the provision of information. In preparing this POD, EY have not audited nor verified the reliability, accuracy or completeness of any information obtained in the course of their work, and EY consequently expresses no opinion implied or otherwise as to the reliability, accuracy and completeness thereof. Any party, other than the ZRA, that is afforded access to this POD, or a copy thereof, either through the ZRA or otherwise and chooses to rely on this POD (or any part of it) does so entirely at its own risk. To the fullest extent permitted by law, EY does not assume any responsibility and will not accept any liability in respect of this POD to any party other than the ZRA. In addition, EY does not accept any liability for any changes made to this POD after its delivery by EY to the ZRA, without EY’s prior written approval. This POD, and any interpretation of the contents of this POD, should be considered in its entirety, in light of the above and in terms of any other restrictions.
Batoka Gorge Hydro Electric Scheme – Project Overview Document – March 2017
Page 3
Contact details
For enquiries please contact the Zambezi River Authority:
The Chief Executive
Zambezi River Authority
Head Office: Kariba House
32 Cha Cha Cha Road, Lusaka
PO Box 30233, Lusaka, Zambia
Telephone: +26 0211 220241, 227970/3
Fax: +26 0211 227498
E-mail: [email protected]
E-mail: [email protected]
Batoka Gorge Hydro Electric Scheme – Project Overview Document – March 2017
Page 4
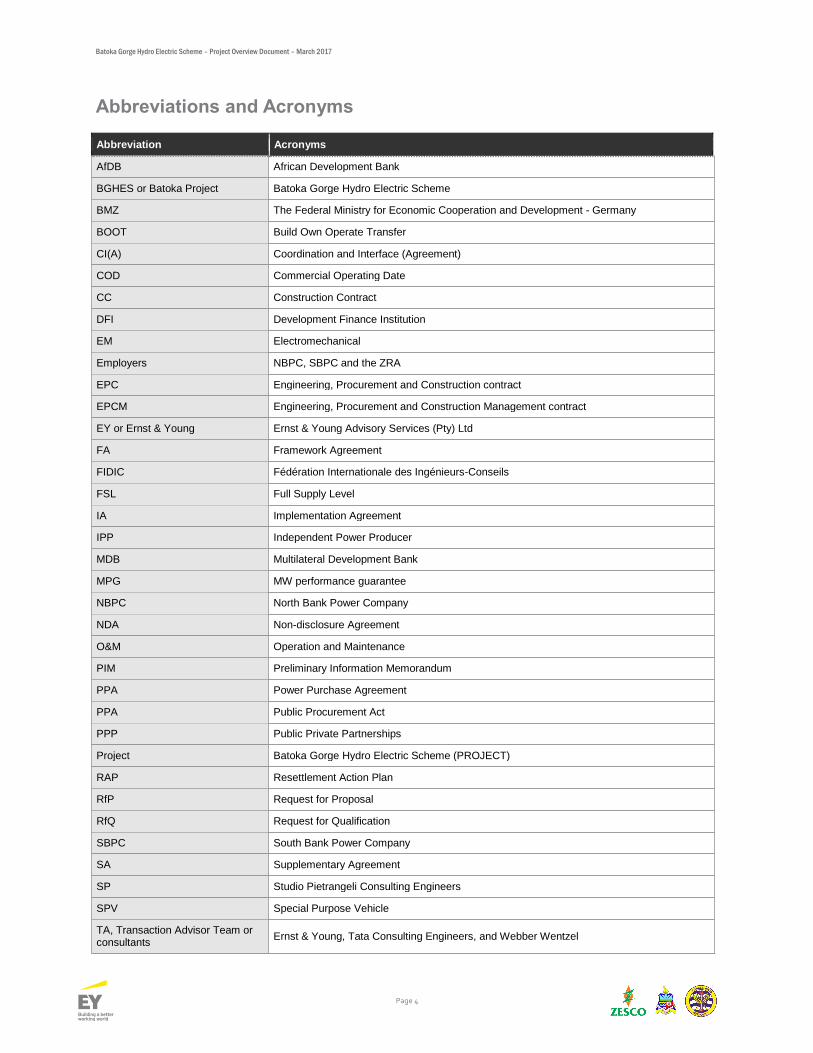
Abbreviations and Acronyms
Abbreviation Acronyms
AfDB African Development Bank
BGHES or Batoka Project Batoka Gorge Hydro Electric Scheme
BMZ The Federal Ministry for Economic Cooperation and Development - Germany
BOOT Build Own Operate Transfer
CI(A) Coordination and Interface (Agreement)
COD Commercial Operating Date
CC Construction Contract
DFI Development Finance Institution
EM Electromechanical
Employers NBPC, SBPC and the ZRA
EPC Engineering, Procurement and Construction contract
EPCM Engineering, Procurement and Construction Management contract
EY or Ernst & Young Ernst & Young Advisory Services (Pty) Ltd
FA Framework Agreement
FIDIC Fédération Internationale des Ingénieurs-Conseils
FSL Full Supply Level
IA Implementation Agreement
IPP Independent Power Producer
MDB Multilateral Development Bank
MPG MW performance guarantee
NBPC North Bank Power Company
NDA Non-disclosure Agreement
O&M Operation and Maintenance
PIM Preliminary Information Memorandum
PPA Power Purchase Agreement
PPA Public Procurement Act
PPP Public Private Partnerships
Project Batoka Gorge Hydro Electric Scheme (PROJECT)
RAP Resettlement Action Plan
RfP Request for Proposal
RfQ Request for Qualification
SBPC South Bank Power Company
SA Supplementary Agreement
SP Studio Pietrangeli Consulting Engineers
SPV Special Purpose Vehicle
TA, Transaction Advisor Team or consultants
Ernst & Young, Tata Consulting Engineers, and Webber Wentzel
Batoka Gorge Hydro Electric Scheme – Project Overview Document – March 2017
Page 5
Abbreviation Acronyms
UWA Umbrella Wrap Agreement
WSA Water Supply Agreement
WW Webber Wentzel
ZESA ZESA Holdings (Pvt) Ltd
ZESCO ZESCO Limited
ZETDC Zimbabwe Electricity Transmission and Distribution Company
ZPC Zimbabwe Power Company
ZRA Zambezi River Authority
Batoka Gorge Hydro Electric Scheme – Project Overview Document – March 2017
Page 6
1. Executive Summary
1.1 Overview
The Zambezi River Authority (ZRA), a corporation jointly and equally owned by the governments of Zambia and Zimbabwe, is considering developing the proposed Batoka Gorge Hydro-Electric Scheme (“BGHES”), and is the implementing agent for the proposed BGHES. In 2014, the ZRA initiated some further studies on the proposed BGHES and appointed Studio Pietrangeli (SP) Consulting Engineers to update the Engineering Feasibility Studies, Environmental Resources Management Southern Africa (Pty) Ltd. (ERM) to update and carry out an Environmental and Social Impact Assessment (ESIA), and Ernst & Young (EY) as Transaction Advisors to advise on the financial and commercial aspects of the project. This Project Overview Document (“POD”) provides a broad overview of the BGHES, and has been prepared to assist in discussions with potential public and private stakeholders of the BGHES. This document is for information purposes only and should not be relied upon for investment purposes.
1.2 Project Participants
The ZRA as the implementing agency for the BGHES was formed by the Zambezi River Authority Act of 1987 (Act No. 17 and Act No. 19 for Zambia and Zimbabwe respectively) and is governed by a Council of Ministers consisting of four members: two are Ministers in the Government of the Republic of Zambia; and two are Ministers in the Government of Zimbabwe. The Ministers are those holding portfolios of Energy and Finance in the respective countries. Other key stakeholders include the following agencies and entities:
Ministry of Finance, Zambia
Ministry of Finance and Economic Development, Zimbabwe
Ministry of Mines, Energy and Water Development, Zambia
Ministry of Energy & Power Development, Zimbabwe
ZESCO Limited (“ZESCO”)
Energy Regulation Board, Zambia (“ERB”)
ZESA Holdings (Pvt) Ltd, (“ZESA”)
Zimbabwe Power Company, (“ZPC”)
Zimbabwe Electricity and Distribution Company (“ZETDC”)
Zimbabwe Energy Regulatory Authority (“ZERA”)
1.3 Zambia and Zimbabwe Economic Overview and Power Demand
Zambia’s income per capita reached US$ 1,618 (in 2010 US$ terms) in 2015 after a prolonged period of consistent GDP growth dating back to 1998. Between 1998 and 2015, the Zambian economy expanded at an average rate of 6% per annum, and was 5% in 2014. In comparison, the Zimbabwean income per capita in real US$ terms is 2.4% lower today than it was in 1993, driven by a prolonged period of low and negative growth in the economy between 1998 and 2008. As a result, Zimbabwe’s GDP per capita is US$ 819 (real 2010) in 2015. However, growth rates have been strong between 2009 and 2013, remaining above 10% per annum in real terms between 2009 and 2012.
1.3.1 Power demand
The current installed generation capacity in Zambia is c.2,350 MW made up of a range of hydro and diesel generation facilities and according to the demand forecast undertaken by SP in support of the
Batoka Gorge Hydro Electric Scheme – Project Overview Document – March 2017
Page 7
Batoka Options Analysis Report, Zambia’s demand is forecast to grow from 1,911MW in 2015 to 5,508MW in 2035 representing a compound annual growth rate of 5.4%. The current installed generation capacity in Zimbabwe is c.1,960 MW made up predominantly of coal and hydro generation facilities. As per the ZETDC System Development Plan April 2015, Zimbabwe’s demand is forecast to grow from 2,116MW in 2015 to 5,301MW in 2035. The introduction of new generation projects such as the BGHES will be critical to meeting this projected demand in both countries.
1.3.2 Regional power price
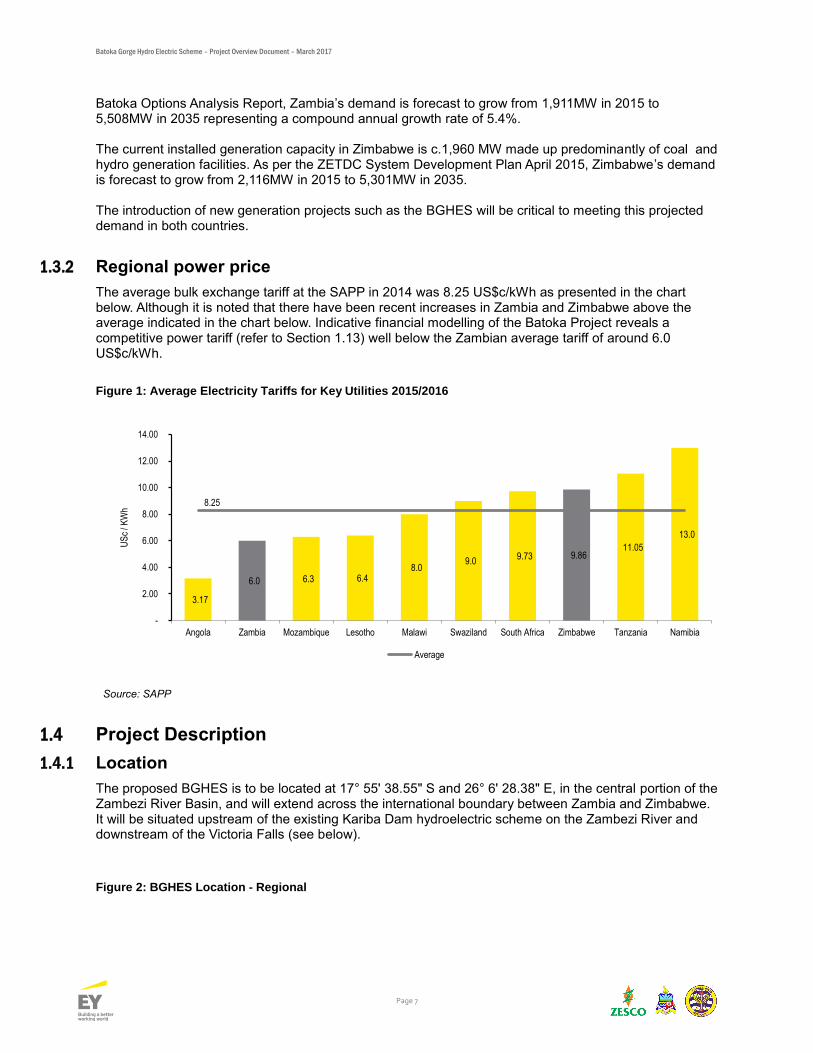
The average bulk exchange tariff at the SAPP in 2014 was 8.25 US$c/kWh as presented in the chart below. Although it is noted that there have been recent increases in Zambia and Zimbabwe above the average indicated in the chart below. Indicative financial modelling of the Batoka Project reveals a competitive power tariff (refer to Section 1.13) well below the Zambian average tariff of around 6.0 US$c/kWh.
Figure 1: Average Electricity Tariffs for Key Utilities 2015/2016
Source: SAPP
1.4 Project Description
1.4.1 Location
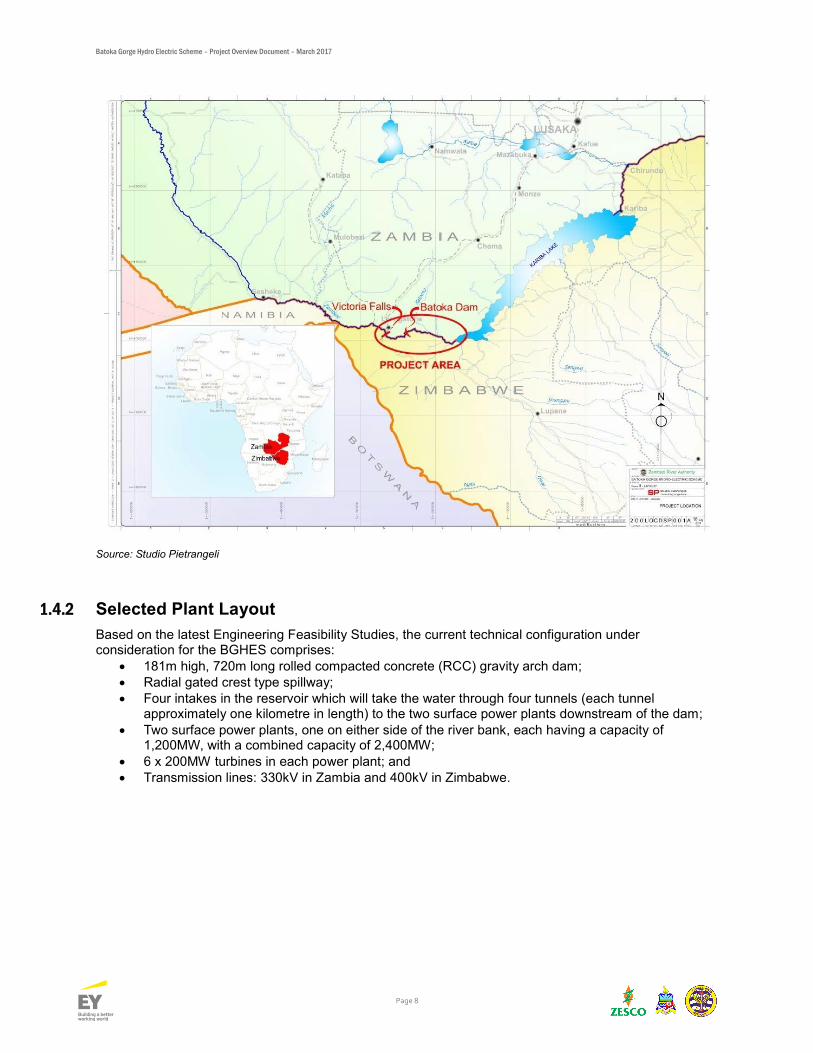
The proposed BGHES is to be located at 17° 55' 38.55" S and 26° 6' 28.38" E, in the central portion of the Zambezi River Basin, and will extend across the international boundary between Zambia and Zimbabwe. It will be situated upstream of the existing Kariba Dam hydroelectric scheme on the Zambezi River and downstream of the Victoria Falls (see below).
Figure 2: BGHES Location - Regional
3.17
6.3 6.4 8.0
9.0 9.73
11.05
13.0
6.0
9.86
8.25
-
2.00
4.00
6.00
8.00
10.00
12.00
14.00
Angola Zambia Mozambique Lesotho Malawi Swaziland South Africa Zimbabwe Tanzania Namibia
US
c / K
Wh
Average
Batoka Gorge Hydro Electric Scheme – Project Overview Document – March 2017
Page 8
Source: Studio Pietrangeli
1.4.2 Selected Plant Layout
Based on the latest Engineering Feasibility Studies, the current technical configuration under consideration for the BGHES comprises:
181m high, 720m long rolled compacted concrete (RCC) gravity arch dam;
Radial gated crest type spillway;
Four intakes in the reservoir which will take the water through four tunnels (each tunnel approximately one kilometre in length) to the two surface power plants downstream of the dam;
Two surface power plants, one on either side of the river bank, each having a capacity of 1,200MW, with a combined capacity of 2,400MW;
6 x 200MW turbines in each power plant; and
Transmission lines: 330kV in Zambia and 400kV in Zimbabwe.
Batoka Gorge Hydro Electric Scheme – Project Overview Document – March 2017
Page 9
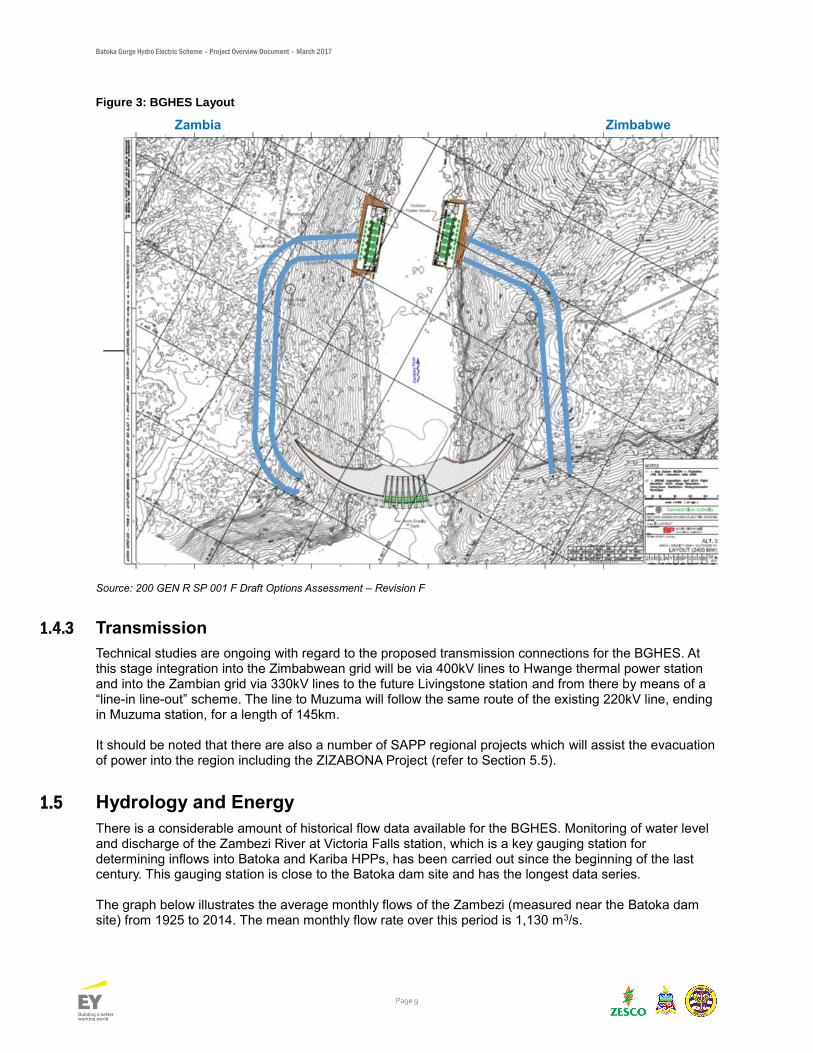
Figure 3: BGHES Layout
Zambia Zimbabwe
Source: 200 GEN R SP 001 F Draft Options Assessment – Revision F
1.4.3 Transmission
Technical studies are ongoing with regard to the proposed transmission connections for the BGHES. At this stage integration into the Zimbabwean grid will be via 400kV lines to Hwange thermal power station and into the Zambian grid via 330kV lines to the future Livingstone station and from there by means of a “line-in line-out” scheme. The line to Muzuma will follow the same route of the existing 220kV line, ending in Muzuma station, for a length of 145km. It should be noted that there are also a number of SAPP regional projects which will assist the evacuation of power into the region including the ZIZABONA Project (refer to Section 5.5).
1.5 Hydrology and Energy
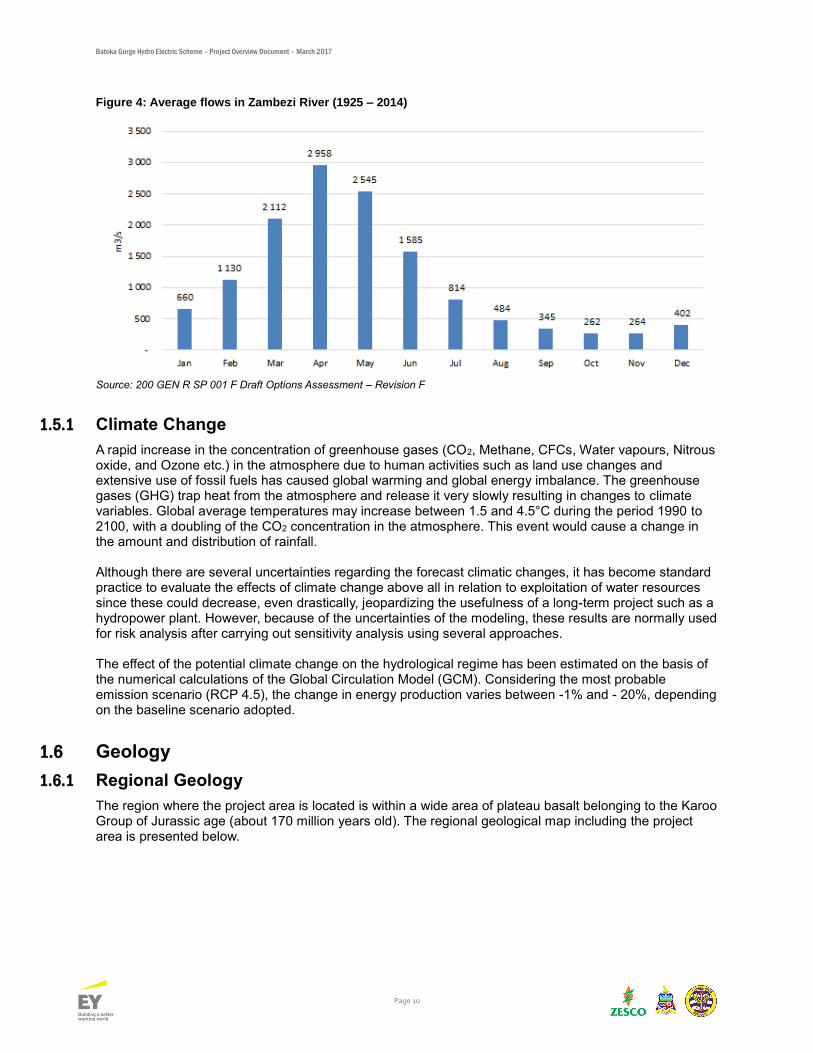
There is a considerable amount of historical flow data available for the BGHES. Monitoring of water level and discharge of the Zambezi River at Victoria Falls station, which is a key gauging station for determining inflows into Batoka and Kariba HPPs, has been carried out since the beginning of the last century. This gauging station is close to the Batoka dam site and has the longest data series. The graph below illustrates the average monthly flows of the Zambezi (measured near the Batoka dam site) from 1925 to 2014. The mean monthly flow rate over this period is 1,130 m3/s.
Batoka Gorge Hydro Electric Scheme – Project Overview Document – March 2017
Page 10
Figure 4: Average flows in Zambezi River (1925 – 2014)
Source: 200 GEN R SP 001 F Draft Options Assessment – Revision F
1.5.1 Climate Change
A rapid increase in the concentration of greenhouse gases (CO2, Methane, CFCs, Water vapours, Nitrous oxide, and Ozone etc.) in the atmosphere due to human activities such as land use changes and extensive use of fossil fuels has caused global warming and global energy imbalance. The greenhouse gases (GHG) trap heat from the atmosphere and release it very slowly resulting in changes to climate variables. Global average temperatures may increase between 1.5 and 4.5°C during the period 1990 to 2100, with a doubling of the CO2 concentration in the atmosphere. This event would cause a change in the amount and distribution of rainfall. Although there are several uncertainties regarding the forecast climatic changes, it has become standard practice to evaluate the effects of climate change above all in relation to exploitation of water resources since these could decrease, even drastically, jeopardizing the usefulness of a long-term project such as a hydropower plant. However, because of the uncertainties of the modeling, these results are normally used for risk analysis after carrying out sensitivity analysis using several approaches. The effect of the potential climate change on the hydrological regime has been estimated on the basis of the numerical calculations of the Global Circulation Model (GCM). Considering the most probable emission scenario (RCP 4.5), the change in energy production varies between -1% and - 20%, depending on the baseline scenario adopted.
1.6 Geology
1.6.1 Regional Geology
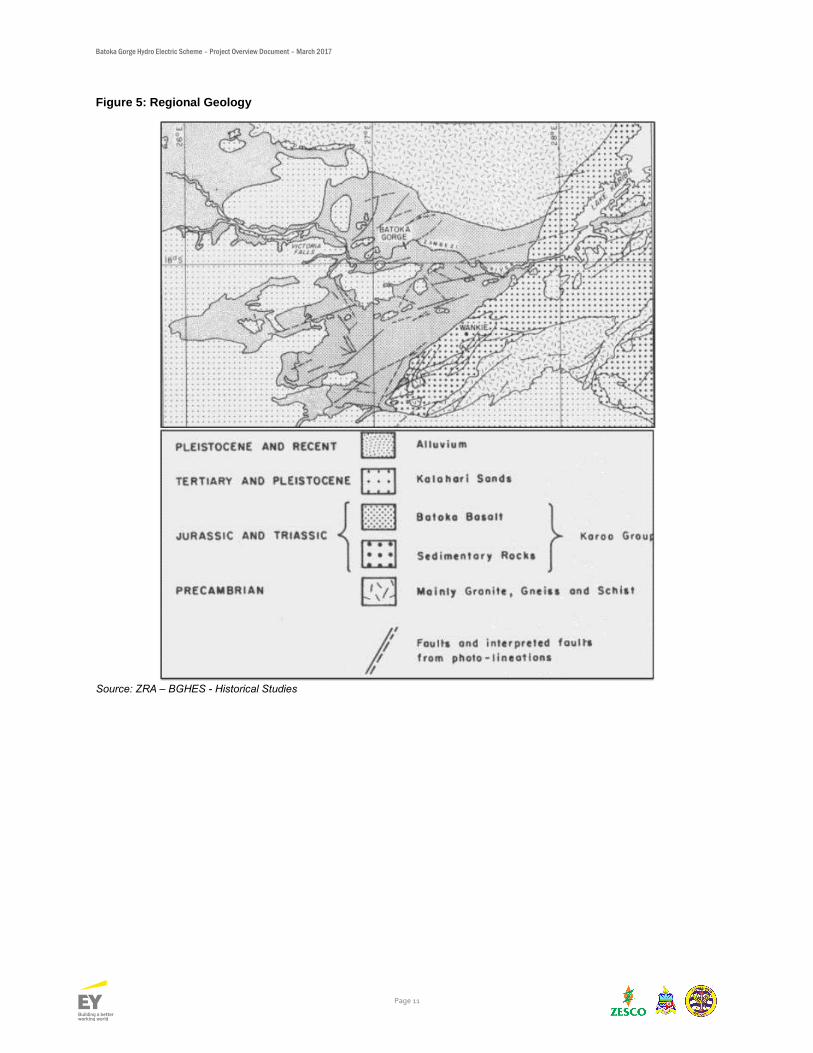
The region where the project area is located is within a wide area of plateau basalt belonging to the Karoo Group of Jurassic age (about 170 million years old). The regional geological map including the project area is presented below.
Batoka Gorge Hydro Electric Scheme – Project Overview Document – March 2017
Page 11
Figure 5: Regional Geology
Source: ZRA – BGHES - Historical Studies
Batoka Gorge Hydro Electric Scheme – Project Overview Document – March 2017
Page 12
The area exposes 1,000m thick lava pile underlain by North East Trending, 70-80km wide trough of basalt and sediments. This trough is bounded to the south-east and to the north-east by Precambrian rocks. In the southern part of the trough, the major north east trending Deka Fault, which crosses the Zambezi river about 75km downstream of the Batoka site, separates the basalts from the underlying Karoo sediments. South of the dam site and south west of Victoria Falls, the plateau basalts are covered by younger, wind transported sandy sediments and alluvium. The basalts form a very flat plateau with low flat-topped hills incised by the steep-sided gorges of the Zambezi River and its tributaries.
1.6.2 Project Geology
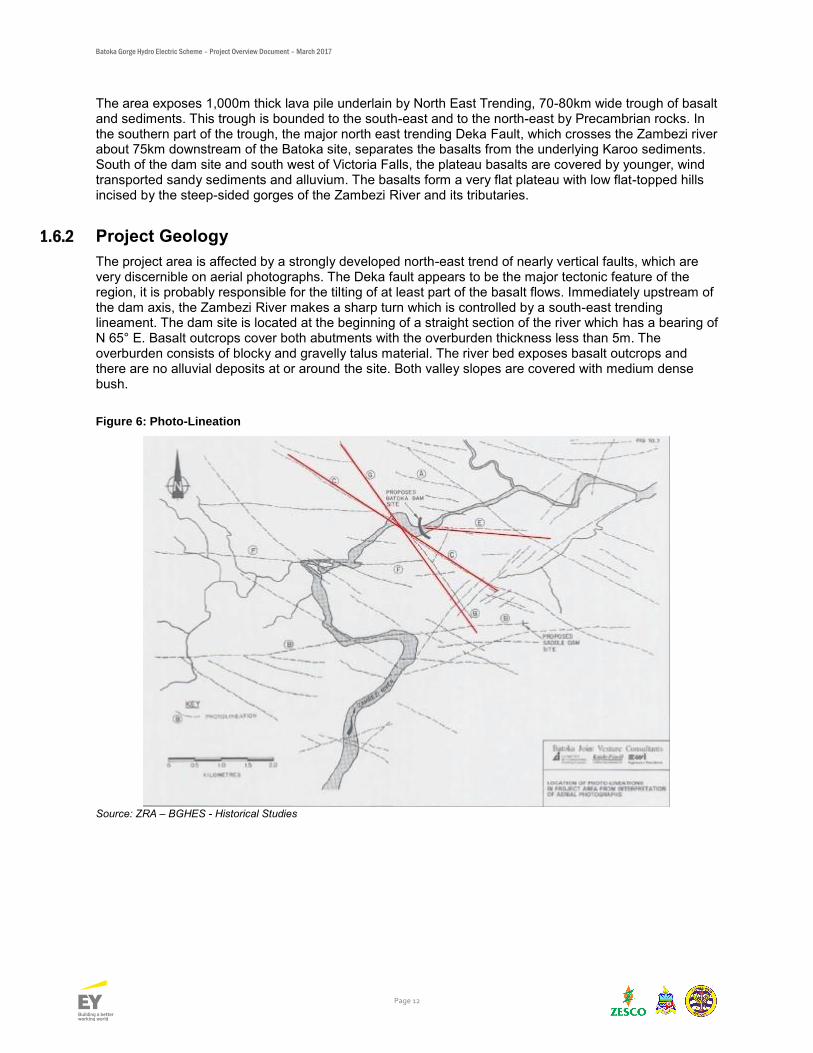
The project area is affected by a strongly developed north-east trend of nearly vertical faults, which are very discernible on aerial photographs. The Deka fault appears to be the major tectonic feature of the region, it is probably responsible for the tilting of at least part of the basalt flows. Immediately upstream of the dam axis, the Zambezi River makes a sharp turn which is controlled by a south-east trending lineament. The dam site is located at the beginning of a straight section of the river which has a bearing of N 65° E. Basalt outcrops cover both abutments with the overburden thickness less than 5m. The overburden consists of blocky and gravelly talus material. The river bed exposes basalt outcrops and there are no alluvial deposits at or around the site. Both valley slopes are covered with medium dense bush.
Figure 6: Photo-Lineation
Source: ZRA – BGHES - Historical Studies
Batoka Gorge Hydro Electric Scheme – Project Overview Document – March 2017
Page 13
1.7 Environmental and Social Impact Assessments
The ESIA is currently being completed by ERM, set out below is a summary of the key items:
The reservoir will be fully contained in the gorge, no resettlement is required for the dam, but may be required for the transmission aspects of the Project. The BGHES RAP will be compiled to meet international good practice and will ensure that negotiated compensation/replacement packages are provided.
Identified potential basin wide abstractions are not expected to be material to future flows.
The development of the BGHES and the region around it is expected to affect the quality of the water, it is recommended that appropriate investments are made in the regions waste water treatment plants as well as a sustained programme of water quality monitoring be undertaken.
The study recommends run of river operating regime and peaking be restricted as the flow disturbance would have an adverse impact on the river ecosystem.
The habitats of Avifauna such as the Taita Falcon and the Rock Pratincole are expected to be impacted negatively, but through a number of mitigation measures the impact is planned to be minimized (habitat management, minimize nesting site disturbance, creation of artificial nests and captive breeding).
The dam tailwater is expected to flood a number of rapids which are currently used for tourism purposes by both Zambia and Zimbabwe during low flows.This will be mitigated by operating the dam at a lower level that will allow rapids 9&10 to be exposed during the low flow season when rafting takes place. This will allow for half day trips
1.8 Commercial Structure
A number of commercial structures, ranging from privately owned, operated and financed to publicly owned, operated and financed have been evaluated. In December 2016, the Council of Ministers approved the preferred commercial structure for the BGHES development based on the following key factors:
The need to minimise the amount of additional debt on each country’s balance sheet;
Feedback from an international market sounding process; and
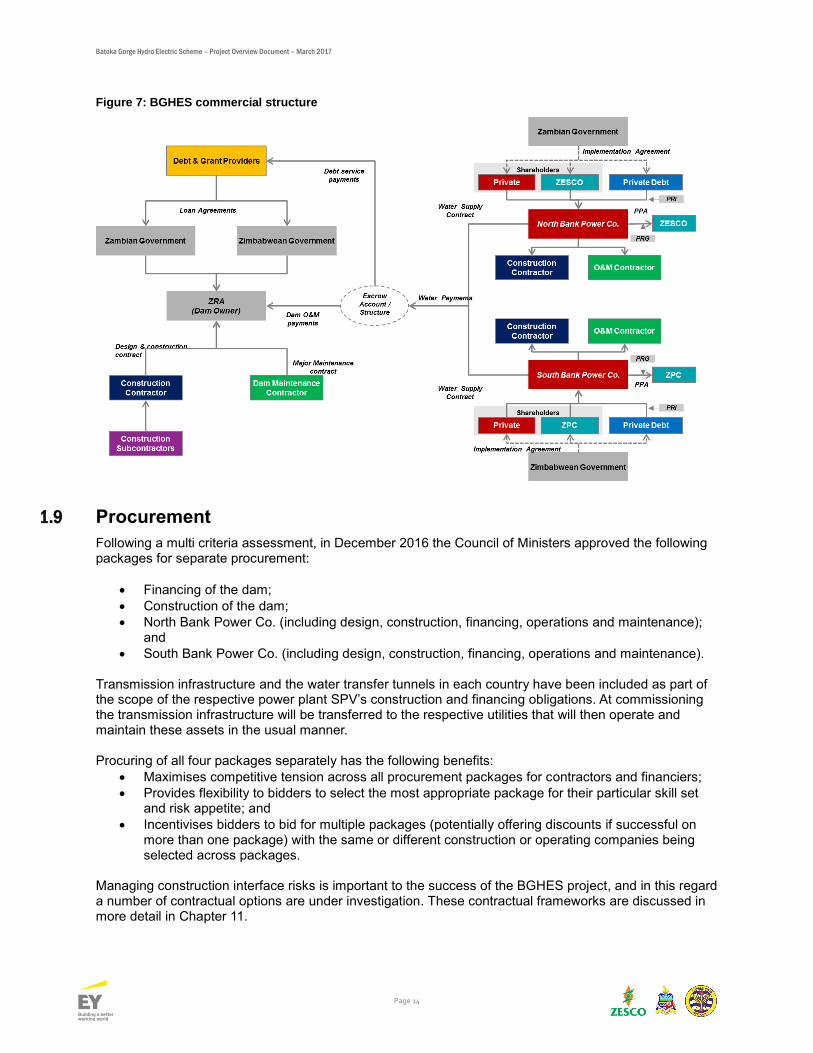
Results from a qualitative options analysis undertaken. The Council of Ministers adopted a structure of implementation of the BGHES whereby the dam would be owned by the ZRA, and the power plants would be developed under a project finance structure and owned by a Special Purpose Vehicle (“SPV”) with equity being provided by the private sector and the relevant country’s utility, and debt being raised from the private sector and DFIs. The dam will be financed by debt and grants raised by the respective countries, and then on lent to the ZRA through subsidiary agreements between the Authority and the governments of Zambia and Zimbabwe.
Batoka Gorge Hydro Electric Scheme – Project Overview Document – March 2017
Page 14
Figure 7: BGHES commercial structure
1.9 Procurement
Following a multi criteria assessment, in December 2016 the Council of Ministers approved the following packages for separate procurement:
Financing of the dam;
Construction of the dam;
North Bank Power Co. (including design, construction, financing, operations and maintenance); and
South Bank Power Co. (including design, construction, financing, operations and maintenance). Transmission infrastructure and the water transfer tunnels in each country have been included as part of the scope of the respective power plant SPV’s construction and financing obligations. At commissioning the transmission infrastructure will be transferred to the respective utilities that will then operate and maintain these assets in the usual manner. Procuring of all four packages separately has the following benefits:
Maximises competitive tension across all procurement packages for contractors and financiers;
Provides flexibility to bidders to select the most appropriate package for their particular skill set and risk appetite; and
Incentivises bidders to bid for multiple packages (potentially offering discounts if successful on more than one package) with the same or different construction or operating companies being selected across packages.
Managing construction interface risks is important to the success of the BGHES project, and in this regard a number of contractual options are under investigation. These contractual frameworks are discussed in more detail in Chapter 11.
Batoka Gorge Hydro Electric Scheme – Project Overview Document – March 2017
Page 15
1.9.1 Procurement process
Given the size of the project, and associated high bidding costs, the ZRA believes a two phase open tender process with shortlisting (RFQ and RFP phases) for construction of the dam and power house SPVs will best meet the ZRA procurement objectives. This is in line with International best practice for similar infrastructure projects.
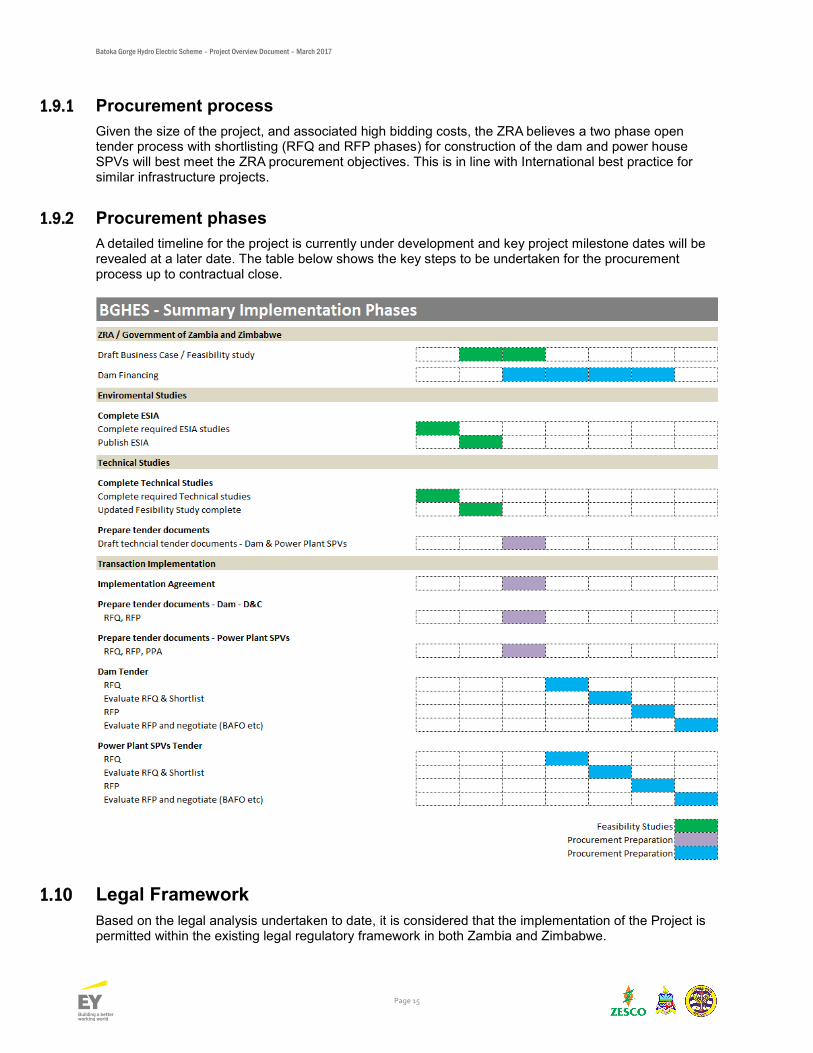
1.9.2 Procurement phases
A detailed timeline for the project is currently under development and key project milestone dates will be revealed at a later date. The table below shows the key steps to be undertaken for the procurement process up to contractual close.
1.10 Legal Framework
Based on the legal analysis undertaken to date, it is considered that the implementation of the Project is permitted within the existing legal regulatory framework in both Zambia and Zimbabwe.
Batoka Gorge Hydro Electric Scheme – Project Overview Document – March 2017
Page 16
In Zambia the Public – Private Partnership Act 14/2009 is the principal legislation setting the supportive legal framework for Projects such as BGHES, whilst in Zimbabwe the corresponding principal legislation is the Procurement Act [Chapter 22:14] which, amongst others, recognises project development modes such as Build Operate and Transfer. The Procurement Act is complemented by legislation such as the Joint Venture Act and the Public – Private Procurement Guidelines of 2013. On the regulatory side, power generation, transmission and distribution is regulated by the Electricity Act Chapter 433 in Zambia and [Chapter 13:19] in Zimbabwe. The tariff regime is regulated in terms of the Energy Regulation Act Chapter 436 of Zambia and the Energy Regulatory Authority Act [Chapter 13:23] of Zimbabwe.
1.11 Risks
A comprehensive risk assessment and framework has been developed for the project, whereby project risks were identified, quantified and appropriate mitigation measures proposed so that informed decisions could be made with regards to the choice of commercial structure and associated agreements for the BGHES. This risk assessment is an ongoing process and will be used to inform the development of the project’s contractual documents.
1.12 Indicative Financial Projections
A comprehensive financial model has been developed and populated with current cost, timing and economic estimates to implement the project. The current estimate for the average real power tariff (2015 prices) for the BGHES is US$c 3.2 per kWh. This is based on the average annual hydrological flows between 1925 and 2014 without any adjustment for climate change. Additional scenarios to test the impact of climate change on tariff are currently being undertaken.
Batoka Gorge Hydro Electric Scheme – Project Overview Document – March 2017
Page 17
2. Overview
2.1 Background to the Proposed Hydro Power Schemes on the Lower Zambezi
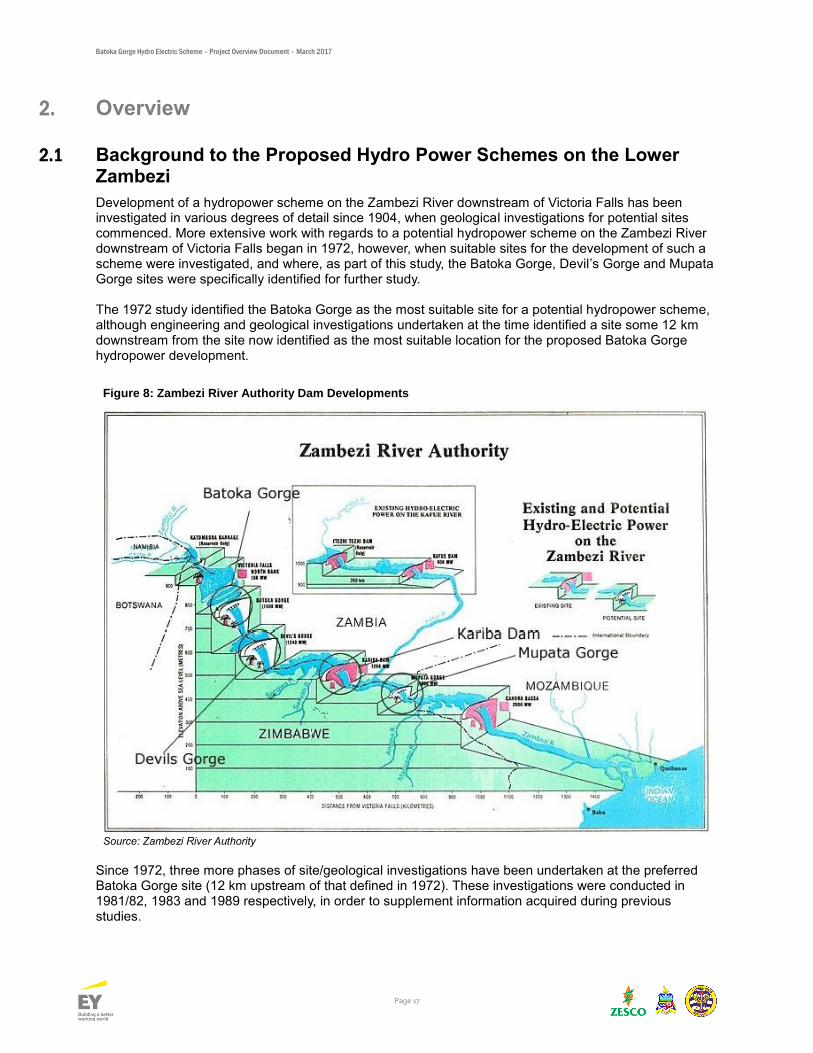
Development of a hydropower scheme on the Zambezi River downstream of Victoria Falls has been investigated in various degrees of detail since 1904, when geological investigations for potential sites commenced. More extensive work with regards to a potential hydropower scheme on the Zambezi River downstream of Victoria Falls began in 1972, however, when suitable sites for the development of such a scheme were investigated, and where, as part of this study, the Batoka Gorge, Devil’s Gorge and Mupata Gorge sites were specifically identified for further study. The 1972 study identified the Batoka Gorge as the most suitable site for a potential hydropower scheme, although engineering and geological investigations undertaken at the time identified a site some 12 km downstream from the site now identified as the most suitable location for the proposed Batoka Gorge hydropower development.
Figure 8: Zambezi River Authority Dam Developments
Source: Zambezi River Authority
Since 1972, three more phases of site/geological investigations have been undertaken at the preferred Batoka Gorge site (12 km upstream of that defined in 1972). These investigations were conducted in 1981/82, 1983 and 1989 respectively, in order to supplement information acquired during previous studies.
Batoka Gorge Hydro Electric Scheme – Project Overview Document – March 2017
Page 18
Following these studies, in 1992 the Zambezi River Authority (ZRA) commissioned the Batoka Gorge Joint Venture Consultants (BJVC) to carry out a feasibility study for the proposed Batoka Gorge Hydropower scheme. An Environmental and Social Impact Assessment (ESIA) for this proposed scheme was also undertaken as part of this feasibility study, and to address gaps identified in this 1993 ESIA, further environmental and social studies were undertaken in 1998. In 2014, the ZRA initiated some further studies on the proposed Batoka Gorge Hydro Electric Scheme (BGHES) by appointing Studio Pietrangeli (SP) Consulting Engineers to update the Engineering Feasibility Studies, Environmental Resources Management Southern Africa (Pty) Ltd. (ERM) to update and carry out an Environmental and Social Impact Assessment (ESIA), and Ernst & Young (EY) as Transaction Advisors to advise on the financial and commercial aspects of the project.
Batoka Gorge Hydro Electric Scheme – Project Overview Document – March 2017
Page 19
3. Project Participants
3.1 Overview
The following chapter provides a brief overview of the main project stakeholders in both Zambia and Zimbabwe.
3.2 Zambezi River Authority
The ZRA was formed by the Zambezi River Authority Act of 1987 (Act No. 17 and Act No. 19 Zambia and Zimbabwe respectively) and is governed by a Council of Ministers consisting of four members: two are Ministers in the Government of the Republic of Zambia; and two are Ministers in the Government of Zimbabwe. The Ministers are those holding portfolios of Energy and Finance in the respective countries. The functions of ZRA are set out in the schedule to the Act, and are as follows:
Operate, monitor and maintain the Kariba Complex ("Kariba Complex means: the Kariba Dam and reservoir, all telemetering stations relating to the Kariba Dam, any other installations owned by the Authority");
In consultation with the National Electricity Undertakings, investigate the desirability of new dams on the Zambezi River and make recommendations thereon to the Council;
Subject to the approval of the Council, construct, operate, monitor and maintain any other dams on the Zambezi River;
Collect, accumulate and process hydrological and environmental data of the Zambezi River for the better performance of its functions and for any other purpose beneficial to the Contracting States;
In consultation with the National Electricity Undertakings, regulate the water level in the Kariba reservoir and in any other reservoir owned by the Authority;
Make such recommendations to the Council as to ensure the effective and efficient use of the waters and other resources of the Zambezi;
Liaise with the National Electricity Undertakings in the performance of its functions that may affect the generation and transmission of electricity to the Contracting States;
Subject to provisions of Article 13 of the Act, recruit, employ and provide for the training of such staff as may be necessary for the performance of its functions under the Agreement;
Submit development plans and programmes to the Council for approval;
Give effect to such directions, as may from to time, be given by the Council; and
Carry out such other functions as are provided for the Agreement or are incidental or conducive to the better performance of its functions.
3.3 Zambia
3.3.1 Government of Zambia
3.3.1.1 Ministry of Finance
The Ministry is responsible for economic and financial management of Zambia and is headed by a Minister whose mandate is drawn from the Minister of Finance (Incorporation) Act, Chapter 349 of the Laws of Zambia. The administrative and technical team is headed by the Secretary to the Treasury who is assisted by two Permanent Secretaries responsible for Economic Management and Finance (EMF) and Budget and Economic Affairs (BEA).
3.3.1.2 Ministry of Energy
The Ministry of Energy coordinates the development and management of energy resources in the country. Specifically, the Ministry through the Department of Planning and Information and the Department of Energy coordinates and provides policy guidance regarding various interventions in the Energy Sector.
Batoka Gorge Hydro Electric Scheme – Project Overview Document – March 2017
Page 20
Other players in the sector include; relevant national and subnational public institutions and agencies including quasi-government bodies, private sector and communities. In addition, the Ministry has a unit called the Office for Promoting Private Power Investments (OPPPI) whose role is to promote private investment in the development of power projects in Zambia.
3.3.2 ZESCO Limited
ZESCO Limited is a parastatal, with the main function of producing power in Zambia. ZESCO produces approximately 80 % of the electricity consumed in the country and has historically been the main player in the generation, transmission and distribution of electricity in Zambia. In addition, ZESCO represents Zambia in the Southern African Power Pool. The electricity produced by the proposed BGHES will be sold to the national grid, which is managed and maintained by ZESCO.
3.3.3 Energy Regulation Board
The ERB has the mandate of regulating the energy sector in Zambia in line with the provisions of the Energy Regulation Act of 2003. The ERB has the responsibility of ensuring that power generating utilities earn a reasonable rate of return on their investments that is necessary to provide a quality service at affordable prices to the consumer. In order to carry out this role, the ERB, among other functions, ensures that all energy utilities in the sector are licensed, monitors levels and structures of competition, and investigates and remedies consumer complaints. The unit price of the electricity generated by the proposed BGHES will be regulated by the ERB.
3.4 Zimbabwe
3.4.1 Government of Zimbabwe
3.4.1.1 Ministry of Finance & Economic Development
The Ministry is responsible for economic and financial management of Zimbabwe and is headed by a Minister, whilst the second in command and administrative head and Accounting Officer is the Permanent Secretary. The Permanent Secretary is assisted by four Principal Directors who head the following Departments: Accountant General, Budgets, Finance and Taxation, and the Debt Management Office.
3.4.1.2 Minister of Energy & Power Development
The Ministry is the administering authority in regards to energy and power development in Zimbabwe. The Ministry comprises the following departments:
Petroleum;
Power Development;
Policy and Planning;
Energy Conservation and Renewable Energy;
Finance Human Resources and Administration;
Legal Services; and
Internal Audit. The Power Development Department is one of the technical departments of the Ministry. Its main role is to facilitate the improvement of availability of electricity to the populace, as well as the attainment of self-sufficiency in electricity generation. The achievement of the strategic goals is centered on the effective administration of the utilities under the Department’s purview namely ZESA Holdings (Pvt) Ltd and its subsidiaries: Zimbabwe Power Company (ZPC), Zimbabwe Electricity Transmission and Distribution
Batoka Gorge Hydro Electric Scheme – Project Overview Document – March 2017
Page 21
Company (ZETDC), Powertel, ZESA Enterprises (ZENT); the Rural Electrification Agency (REA); Zimbabwe Electricity Regulatory Commission (ZERC) and the Zambezi River Authority (ZRA).
3.4.2 ZESA
Zimbabwe Electricity Supply Authority, (ZESA) officially called ZESA Holdings (Pvt) LTD., is a state-owned company whose task is to generate, transmit, and distribute electricity in Zimbabwe. It has organized this task by delegation to its subsidiaries, the energy generating company Zimbabwe Power Company (ZPC) and the Zimbabwe Electricity Transmission and Distribution Company (ZETDC). ZESA is the majority electricity generator and supplier for the public grid. There are other independent power producers which generate and supply power to the grid on a relatively smaller scale. ZESA represents Zimbabwe in the Southern African Power Pool.
3.4.3 ZPC
Zimbabwe Power Company (ZPC) was incorporated in 1996 as an investment vehicle in the generation of electricity and became operational in 1999. The organisation has been authorised to construct, own, operate and maintain power generation stations for the supply of electricity. ZPC currently operates four coal fired power stations, Hwange, Bulawayo, Munyati and Harare thermal stations, and one hydro power station, Kariba South Power Station. All five have a total of 1960 MW as installed capacity.
3.4.4 ZETDC
The Zimbabwe Electricity and Distribution Company (ZETDC) is a subsidiary of ZESA Holdings. ZETDC is responsible for the transmission of electricity from the power stations, the distribution of electricity as well as its retailing to end users.
3.4.5 ZERA
The Zimbabwe Energy Regulatory Authority (ZERA) is a statutory body established by the Energy Regulatory Authority Act [Chapter 13:23] of 2011. The Act mandates and empowers the Authority to regulate the procurement, production, transportation, transmission, distribution, importation and exportation of energy derived from any energy source.
Batoka Gorge Hydro Electric Scheme – Project Overview Document – March 2017
Page 22
4. Zambia, Zimbabwe - economic overview and electricity demand
4.1 Overview
The following chapter sets out a summary of the prevailing macroeconomic conditions in Zambia and Zimbabwe. This chapter has been included so as to primarily present two things; the current makeup of the Zambian and Zimbabwean economies and how, although each economy has seen strong growth recently the shortage of power is negatively impacting growth in both countries.
4.2 Growth and Income Levels
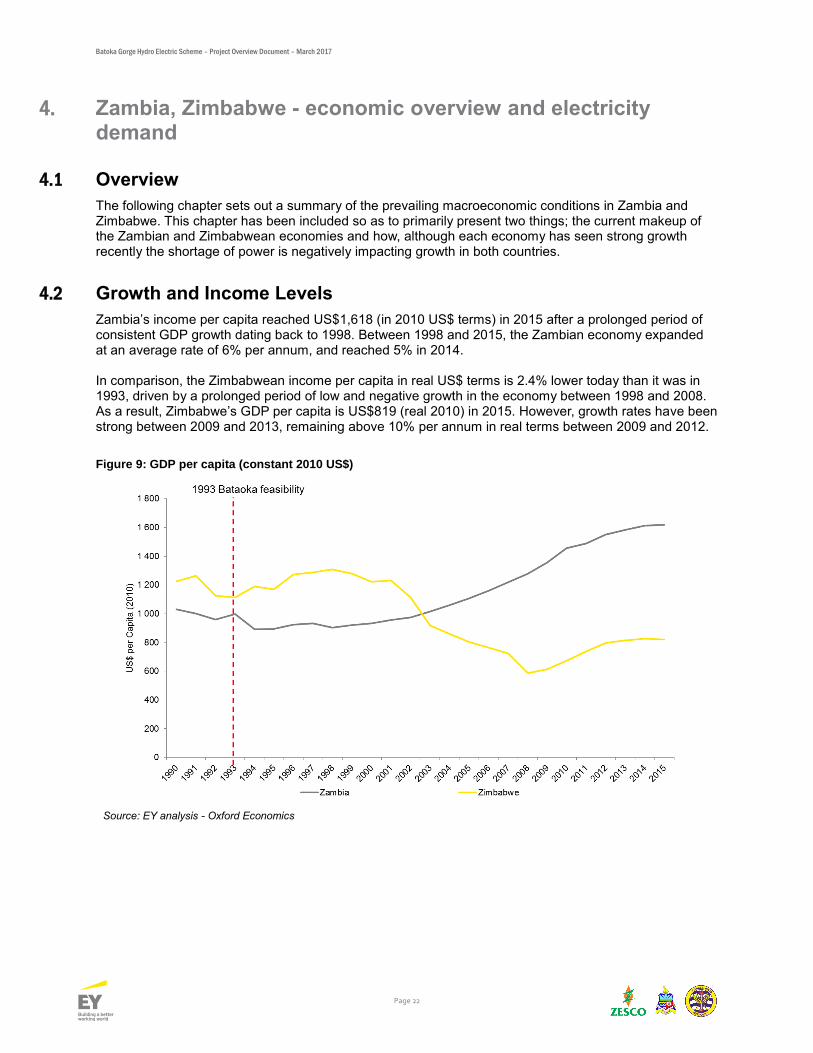
Zambia’s income per capita reached US$1,618 (in 2010 US$ terms) in 2015 after a prolonged period of consistent GDP growth dating back to 1998. Between 1998 and 2015, the Zambian economy expanded at an average rate of 6% per annum, and reached 5% in 2014. In comparison, the Zimbabwean income per capita in real US$ terms is 2.4% lower today than it was in 1993, driven by a prolonged period of low and negative growth in the economy between 1998 and 2008. As a result, Zimbabwe’s GDP per capita is US$819 (real 2010) in 2015. However, growth rates have been strong between 2009 and 2013, remaining above 10% per annum in real terms between 2009 and 2012.
Figure 9: GDP per capita (constant 2010 US$)
Source: EY analysis - Oxford Economics
Batoka Gorge Hydro Electric Scheme – Project Overview Document – March 2017
Page 23
4.3 Zambia macroeconomic condition
4.3.1 Composition of the Zambian economy
Agriculture and mining are the two largest sectors contributing to the Zambian economy, both of which have driven growth in the country in recent years, partially due to high copper prices and domestic policies aimed at improving land access and reform of the agricultural sector. Strong levels of investment in the mining sector have occurred in recent years, with large expansions to copper mining in the northern regions of the country, with strong demand stemming from China. This investment has had a secondary impact on the Zambian economy as has been seen with growth in construction, transport, communications and trade, as well as increasing electricity demand due to the energy intensive nature of mining. Consequently, electricity demand doubled between 1990 and 2014, rising from under 1,000MW to close to 2,000MW in 2014.
4.3.2 Zambian Government budget balance
With tax receipts on the increase due to strong economic growth, and increased taxes from mining operations, the Zambian government deficit remained relatively stable and in the region of 3% between 2003 and 2011. However, with increasing expenditure, the deficit started to increase, reaching a level of 6% in 2014. Further, a fall in mining receipts in 2015 related to lower mining activity saw the deficit increase to 8% in 2015. Overall, government debt is now on the increase, and with a larger deficit expected in 2016, this, and the large depreciation in the exchange rate will have an impact on overall Debt : GDP levels. This means that the Debt : GDP ratio is expected to move quickly towards the threshold set in the Maaztricht accord, of 60% of GDP. Breaching this level could have implications for the cost and availability of raising further funds from the market.
4.3.3 Zambia country rating (Fitch)
On 21 February 2017, Fitch affirmed Zambia’s credit rating at a B, but a negative outlook on its long term foreign and local currency issuer default ratings. The negative outlook on the rating was based on lower GDP growth, and rising government debt. However, the affirmation of the B rating was driven by an improving fiscal and external outlook, enhanced monetary policy credibility and the potential implementation of a fiscal and economic adjustment agenda. The new fiscal approach is also likely to be supported by the adoption of an IMF programme.
4.3.4 Zambian growth forecast
The combination of lower copper prices, the exchange rate shock, and policy uncertainty in the mining sector has resulted in a downward revision of growth estimates. This has meant that GDP growth is expected to moderate to 3.1% in 2016, the weakest level since 1998. However, higher growth rates are still expected for 2017, recovering to 4.3%, on the back of recoveries in power supply and copper output. In 2017 and 2018, it is expected that GDP growth will average at close to 5%. These expected growth rates will continue to put pressure on local electricity production and resources, requiring an increase in electricity supply.
Batoka Gorge Hydro Electric Scheme – Project Overview Document – March 2017
Page 24
4.4 Zimbabwe macroeconomic condition
4.4.1 Composition of the Zimbabwean economy
Traditionally, manufacturing and agriculture have played a pivotal role in the Zimbabwean economy, and in 2009, these sectors represented over 30% of gross domestic product. In 2016, Zimbabwe fell back into a recession, with the economy contracting by 0.2% in real terms. The reduction in output was driven by poor liquidity in the country, which led to low domestic production across a range of sectors including agriculture, mining and manufacturing.
4.4.2 Zimbabwean Government budget balance
The country has high levels of indebtedness of the public sector. In 2014, the level of external debt reached over US$ 10 billion, giving rise to a debt to GDP ratio of close to 80% and as a result the overall fiscal position remains under strain with the government implementing a cash budgeting framework. Within this framework, there is little opportunity for the government to increase its reliance on external creditors, and by extension, to reallocate funding towards much needed infrastructure investment. However, it is understood that the Zimbabwean government is exploring options for comprehensive debt relief from investors, akin to the Highly Indebted Poor Countries (HIPC) initiative, which has been used successfully in a number of other countries. As a result, we understand that the IMF, AfDB, and the World Bank are at an advanced stage for providing a roadmap to address the country’s areas clearance programme. Importantly, Zimbabwe has been making regular payments to the AfDB, the IMF and the World Bank since 2013 (OECD, 2015).
4.4.3 Zimbabwe growth forecast
Negative growth seen in 2016 is expected to continue in 2017 with a further contraction of 1.7% in GDP expected. Growth is expected to be constrained, but increasing to 1.3% in 2019. The main export sectors include agricultural products fuels and mining products. The agricultural sector has been negatively impacted by droughts (significant decrease in tobacco output, one of the main exports). Further, decreasing commodity prices and the weak global economic climate are hampering demand for mining products (diamonds, platinum). As a result, the current account is expected to remain negative through to 2018, with a deficit of over 10% of GDP remaining over this period. This large deficit remains a significant threat to growth in Zimbabwe. However, recent stability in the political environment, coupled with a resolution on Zimbabwe’s outstanding debt, will see a renewed impetus on investment, and should stimulate growth. Stronger growth rates will further drive demand for electricity from Zimbabwe, and increases the need for investment in the sector.
4.5 Sovereign debt in Zambia and Zimbabwe
The following section sets out a summary of the prevailing sovereign debt position in Zambia and Zimbabwe.
4.5.1 Zambia
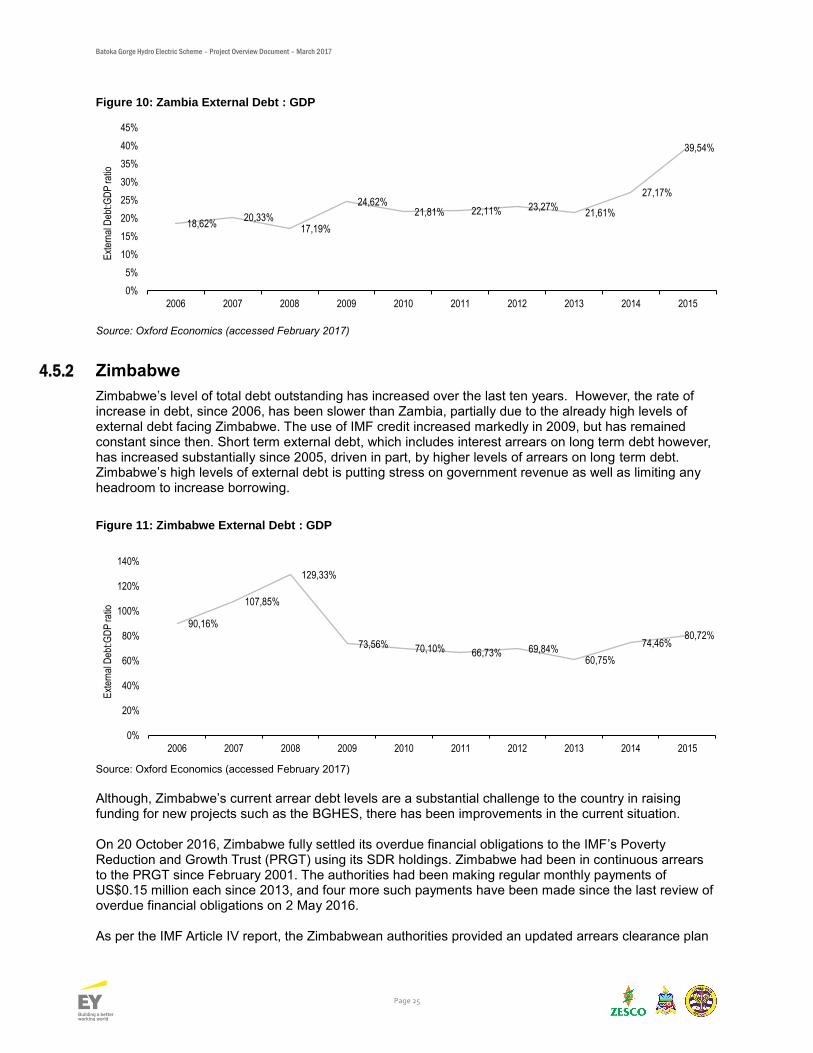
Zambia’s overall external debt to GDP levels have increased at a moderate rate between 2006 and 2013. However, poor commodity prices, slower growth and the weakening exchange rate have meant that the debt to GDP ratio is expected to increase substantially through to 2018. This will put pressure on spending in Zambia, limiting the ability of the economy to raise more debt to fund investment.
Batoka Gorge Hydro Electric Scheme – Project Overview Document – March 2017
Page 25
Figure 10: Zambia External Debt : GDP
Source: Oxford Economics (accessed February 2017)
4.5.2 Zimbabwe
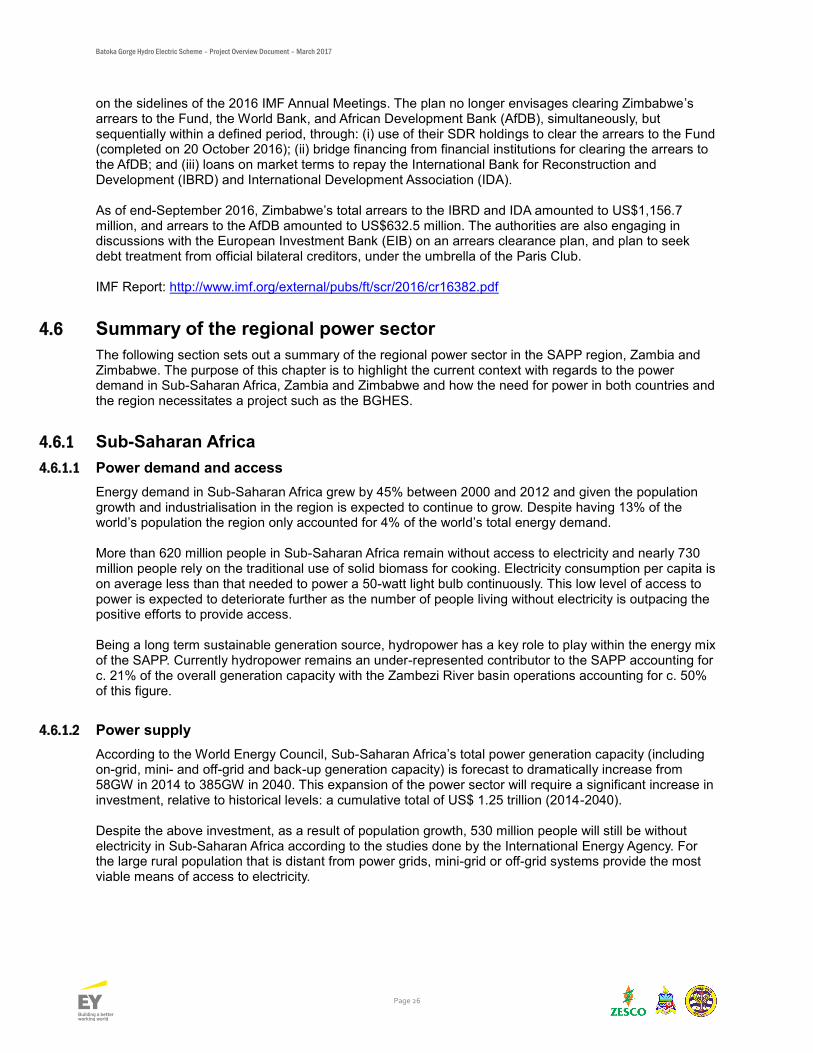
Zimbabwe’s level of total debt outstanding has increased over the last ten years. However, the rate of increase in debt, since 2006, has been slower than Zambia, partially due to the already high levels of external debt facing Zimbabwe. The use of IMF credit increased markedly in 2009, but has remained constant since then. Short term external debt, which includes interest arrears on long term debt however, has increased substantially since 2005, driven in part, by higher levels of arrears on long term debt. Zimbabwe’s high levels of external debt is putting stress on government revenue as well as limiting any headroom to increase borrowing.
Figure 11: Zimbabwe External Debt : GDP
Source: Oxford Economics (accessed February 2017)
Although, Zimbabwe’s current arrear debt levels are a substantial challenge to the country in raising funding for new projects such as the BGHES, there has been improvements in the current situation. On 20 October 2016, Zimbabwe fully settled its overdue financial obligations to the IMF’s Poverty Reduction and Growth Trust (PRGT) using its SDR holdings. Zimbabwe had been in continuous arrears to the PRGT since February 2001. The authorities had been making regular monthly payments of US$0.15 million each since 2013, and four more such payments have been made since the last review of overdue financial obligations on 2 May 2016. As per the IMF Article IV report, the Zimbabwean authorities provided an updated arrears clearance plan
18,62%20,33%
17,19%
24,62%21,81% 22,11% 23,27%
21,61%
27,17%
39,54%
0%
5%
10%
15%
20%
25%
30%
35%
40%
45%
2006 2007 2008 2009 2010 2011 2012 2013 2014 2015
Ext
erna
l Deb
t:GD
P ra
tio
90,16%
107,85%
129,33%
73,56% 70,10% 66,73% 69,84%60,75%
74,46%80,72%
0%
20%
40%
60%
80%
100%
120%
140%
2006 2007 2008 2009 2010 2011 2012 2013 2014 2015
Ext
erna
l Deb
t:GD
P ra
tio
Batoka Gorge Hydro Electric Scheme – Project Overview Document – March 2017
Page 26
on the sidelines of the 2016 IMF Annual Meetings. The plan no longer envisages clearing Zimbabwe’s arrears to the Fund, the World Bank, and African Development Bank (AfDB), simultaneously, but sequentially within a defined period, through: (i) use of their SDR holdings to clear the arrears to the Fund (completed on 20 October 2016); (ii) bridge financing from financial institutions for clearing the arrears to the AfDB; and (iii) loans on market terms to repay the International Bank for Reconstruction and Development (IBRD) and International Development Association (IDA). As of end-September 2016, Zimbabwe’s total arrears to the IBRD and IDA amounted to US$1,156.7 million, and arrears to the AfDB amounted to US$632.5 million. The authorities are also engaging in discussions with the European Investment Bank (EIB) on an arrears clearance plan, and plan to seek debt treatment from official bilateral creditors, under the umbrella of the Paris Club. IMF Report: http://www.imf.org/external/pubs/ft/scr/2016/cr16382.pdf
4.6 Summary of the regional power sector
The following section sets out a summary of the regional power sector in the SAPP region, Zambia and Zimbabwe. The purpose of this chapter is to highlight the current context with regards to the power demand in Sub-Saharan Africa, Zambia and Zimbabwe and how the need for power in both countries and the region necessitates a project such as the BGHES.
4.6.1 Sub-Saharan Africa
4.6.1.1 Power demand and access
Energy demand in Sub-Saharan Africa grew by 45% between 2000 and 2012 and given the population growth and industrialisation in the region is expected to continue to grow. Despite having 13% of the world’s population the region only accounted for 4% of the world’s total energy demand. More than 620 million people in Sub-Saharan Africa remain without access to electricity and nearly 730 million people rely on the traditional use of solid biomass for cooking. Electricity consumption per capita is on average less than that needed to power a 50-watt light bulb continuously. This low level of access to power is expected to deteriorate further as the number of people living without electricity is outpacing the positive efforts to provide access. Being a long term sustainable generation source, hydropower has a key role to play within the energy mix of the SAPP. Currently hydropower remains an under-represented contributor to the SAPP accounting for c. 21% of the overall generation capacity with the Zambezi River basin operations accounting for c. 50% of this figure.
4.6.1.2 Power supply
According to the World Energy Council, Sub-Saharan Africa’s total power generation capacity (including on-grid, mini- and off-grid and back-up generation capacity) is forecast to dramatically increase from 58GW in 2014 to 385GW in 2040. This expansion of the power sector will require a significant increase in investment, relative to historical levels: a cumulative total of US$ 1.25 trillion (2014-2040). Despite the above investment, as a result of population growth, 530 million people will still be without electricity in Sub-Saharan Africa according to the studies done by the International Energy Agency. For the large rural population that is distant from power grids, mini-grid or off-grid systems provide the most viable means of access to electricity.
Batoka Gorge Hydro Electric Scheme – Project Overview Document – March 2017
Page 27
4.6.1.3 Regional power price
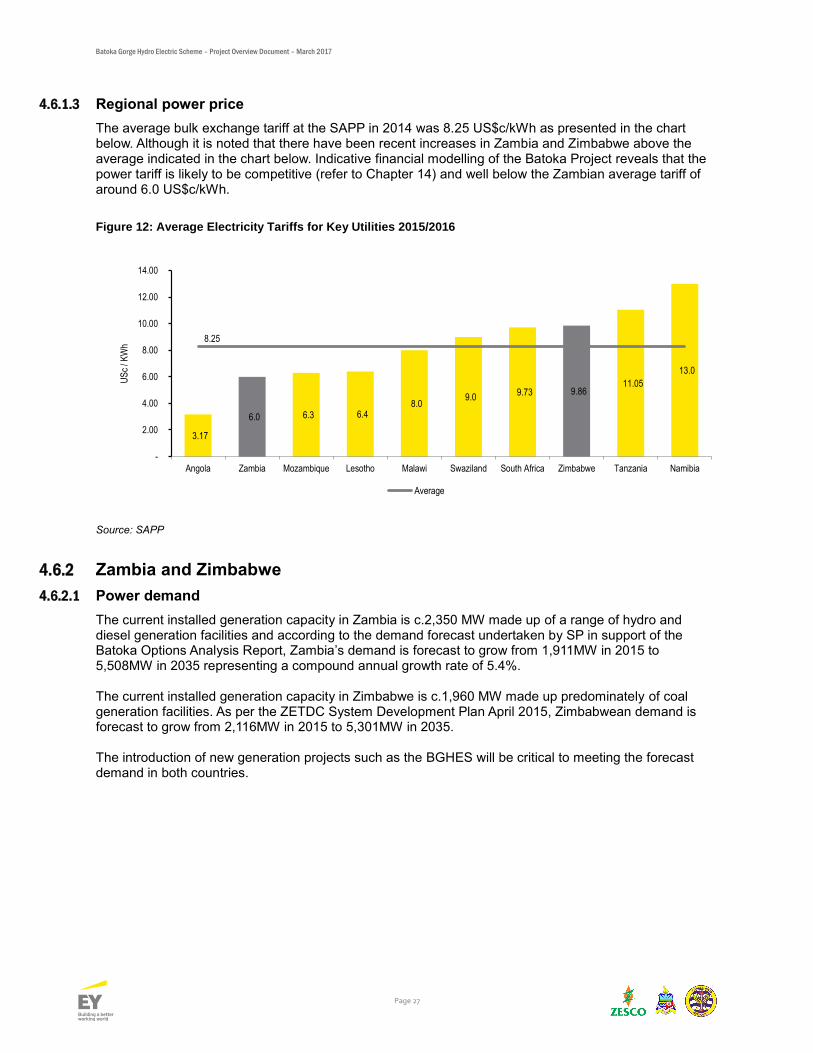
The average bulk exchange tariff at the SAPP in 2014 was 8.25 US$c/kWh as presented in the chart below. Although it is noted that there have been recent increases in Zambia and Zimbabwe above the average indicated in the chart below. Indicative financial modelling of the Batoka Project reveals that the power tariff is likely to be competitive (refer to Chapter 14) and well below the Zambian average tariff of around 6.0 US$c/kWh.
Figure 12: Average Electricity Tariffs for Key Utilities 2015/2016
Source: SAPP
4.6.2 Zambia and Zimbabwe
4.6.2.1 Power demand
The current installed generation capacity in Zambia is c.2,350 MW made up of a range of hydro and diesel generation facilities and according to the demand forecast undertaken by SP in support of the Batoka Options Analysis Report, Zambia’s demand is forecast to grow from 1,911MW in 2015 to 5,508MW in 2035 representing a compound annual growth rate of 5.4%. The current installed generation capacity in Zimbabwe is c.1,960 MW made up predominately of coal generation facilities. As per the ZETDC System Development Plan April 2015, Zimbabwean demand is forecast to grow from 2,116MW in 2015 to 5,301MW in 2035. The introduction of new generation projects such as the BGHES will be critical to meeting the forecast demand in both countries.
3.17
6.3 6.4 8.0
9.0 9.73
11.05
13.0
6.0
9.86
8.25
-
2.00
4.00
6.00
8.00
10.00
12.00
14.00
Angola Zambia Mozambique Lesotho Malawi Swaziland South Africa Zimbabwe Tanzania Namibia
US
c / K
Wh
Average
Batoka Gorge Hydro Electric Scheme – Project Overview Document – March 2017
Page 28
5. Project Description
5.1 Overview
The following chapter provides an overview on the selected location and scheme layout for the BGHES.
5.2 Location
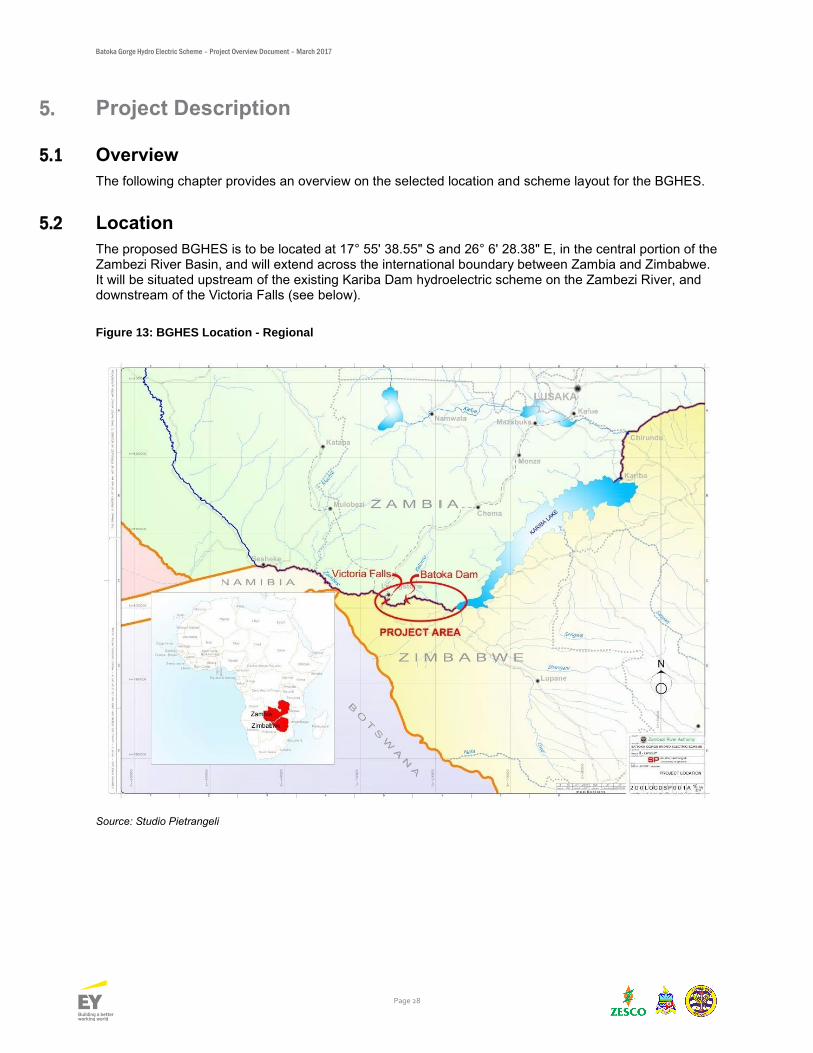
The proposed BGHES is to be located at 17° 55' 38.55" S and 26° 6' 28.38" E, in the central portion of the Zambezi River Basin, and will extend across the international boundary between Zambia and Zimbabwe. It will be situated upstream of the existing Kariba Dam hydroelectric scheme on the Zambezi River, and downstream of the Victoria Falls (see below).
Figure 13: BGHES Location - Regional
Source: Studio Pietrangeli
Batoka Gorge Hydro Electric Scheme – Project Overview Document – March 2017
Page 29
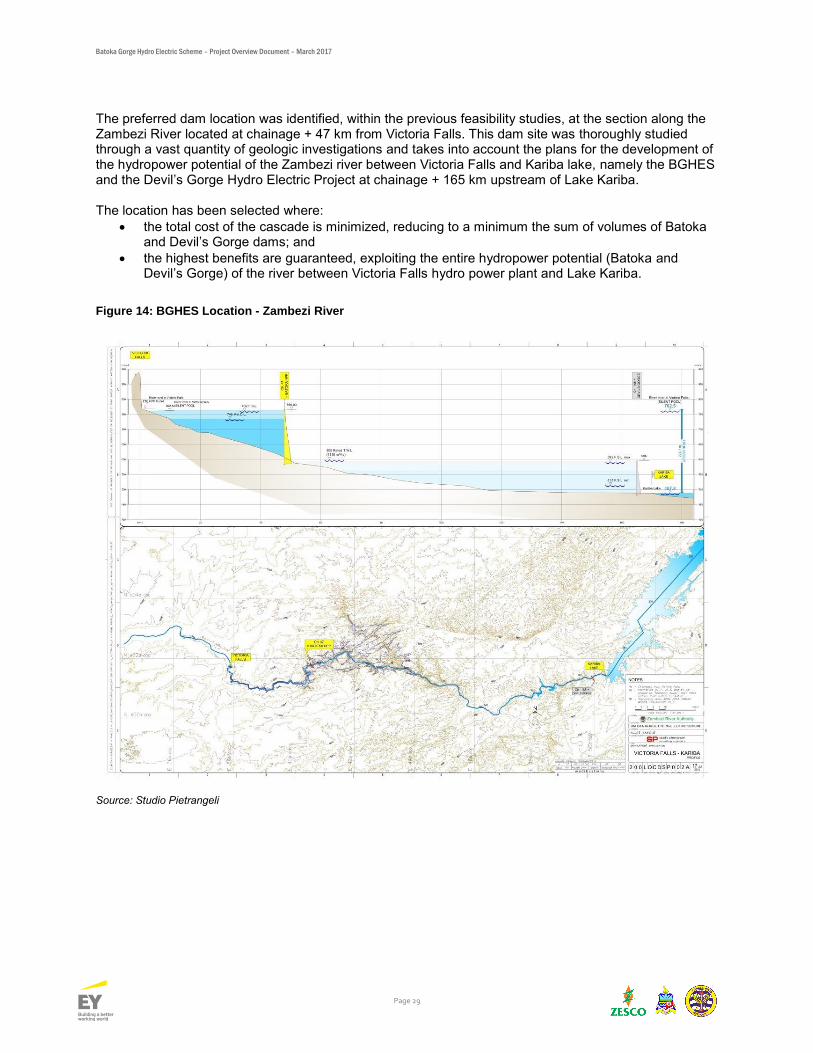
The preferred dam location was identified, within the previous feasibility studies, at the section along the Zambezi River located at chainage + 47 km from Victoria Falls. This dam site was thoroughly studied through a vast quantity of geologic investigations and takes into account the plans for the development of the hydropower potential of the Zambezi river between Victoria Falls and Kariba lake, namely the BGHES and the Devil’s Gorge Hydro Electric Project at chainage + 165 km upstream of Lake Kariba. The location has been selected where:
the total cost of the cascade is minimized, reducing to a minimum the sum of volumes of Batoka and Devil’s Gorge dams; and
the highest benefits are guaranteed, exploiting the entire hydropower potential (Batoka and Devil’s Gorge) of the river between Victoria Falls hydro power plant and Lake Kariba.
Figure 14: BGHES Location - Zambezi River
Source: Studio Pietrangeli
Batoka Gorge Hydro Electric Scheme – Project Overview Document – March 2017
Page 30
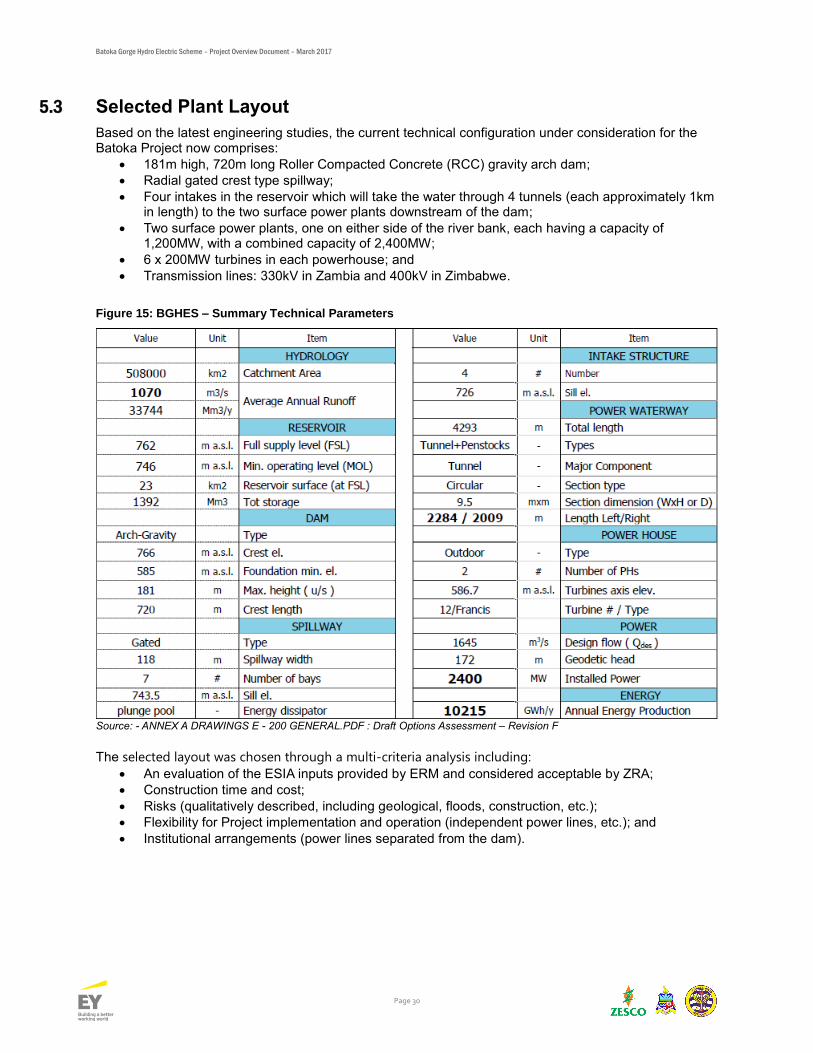
5.3 Selected Plant Layout
Based on the latest engineering studies, the current technical configuration under consideration for the Batoka Project now comprises:
181m high, 720m long Roller Compacted Concrete (RCC) gravity arch dam;
Radial gated crest type spillway;
Four intakes in the reservoir which will take the water through 4 tunnels (each approximately 1km in length) to the two surface power plants downstream of the dam;
Two surface power plants, one on either side of the river bank, each having a capacity of 1,200MW, with a combined capacity of 2,400MW;
6 x 200MW turbines in each powerhouse; and
Transmission lines: 330kV in Zambia and 400kV in Zimbabwe.
Figure 15: BGHES – Summary Technical Parameters
Source: - ANNEX A DRAWINGS E - 200 GENERAL.PDF : Draft Options Assessment – Revision F
The selected layout was chosen through a multi-criteria analysis including:
An evaluation of the ESIA inputs provided by ERM and considered acceptable by ZRA;
Construction time and cost;
Risks (qualitatively described, including geological, floods, construction, etc.);
Flexibility for Project implementation and operation (independent power lines, etc.); and
Institutional arrangements (power lines separated from the dam).
Batoka Gorge Hydro Electric Scheme – Project Overview Document – March 2017
Page 31
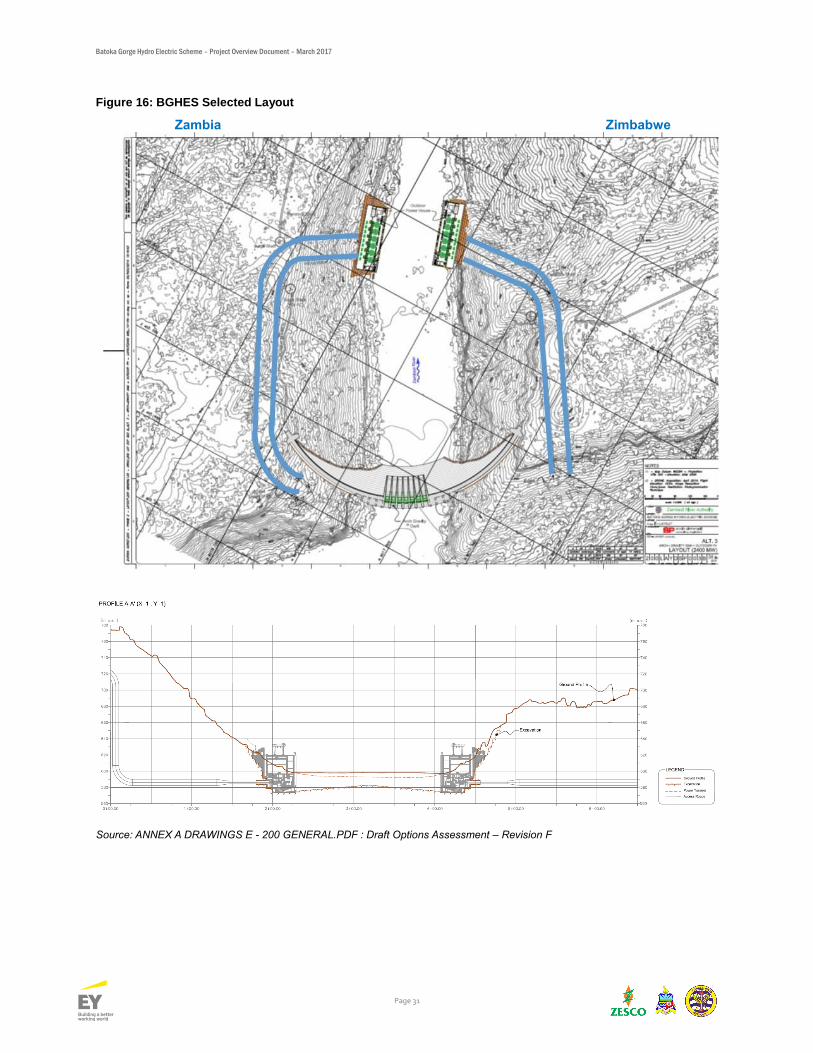
Figure 16: BGHES Selected Layout
Zambia Zimbabwe
Source: ANNEX A DRAWINGS E - 200 GENERAL.PDF : Draft Options Assessment – Revision F
Batoka Gorge Hydro Electric Scheme – Project Overview Document – March 2017
Page 32
5.4 Support Site layout
Further technical studies to confirm the construction camp, access roads, and ancillary supplies (including water, sewage, and power etc.) are in progress.
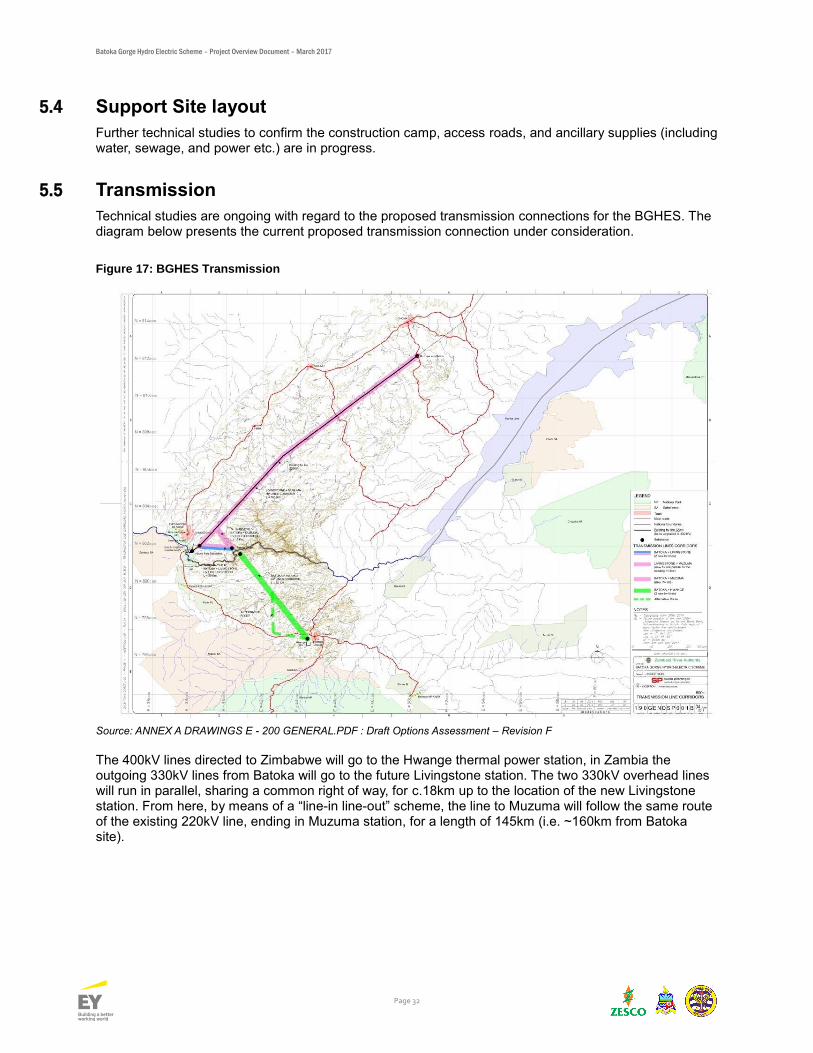
5.5 Transmission
Technical studies are ongoing with regard to the proposed transmission connections for the BGHES. The diagram below presents the current proposed transmission connection under consideration.
Figure 17: BGHES Transmission
Source: ANNEX A DRAWINGS E - 200 GENERAL.PDF : Draft Options Assessment – Revision F The 400kV lines directed to Zimbabwe will go to the Hwange thermal power station, in Zambia the outgoing 330kV lines from Batoka will go to the future Livingstone station. The two 330kV overhead lines will run in parallel, sharing a common right of way, for c.18km up to the location of the new Livingstone station. From here, by means of a “line-in line-out” scheme, the line to Muzuma will follow the same route of the existing 220kV line, ending in Muzuma station, for a length of 145km (i.e. ~160km from Batoka site).
Batoka Gorge Hydro Electric Scheme – Project Overview Document – March 2017
Page 33
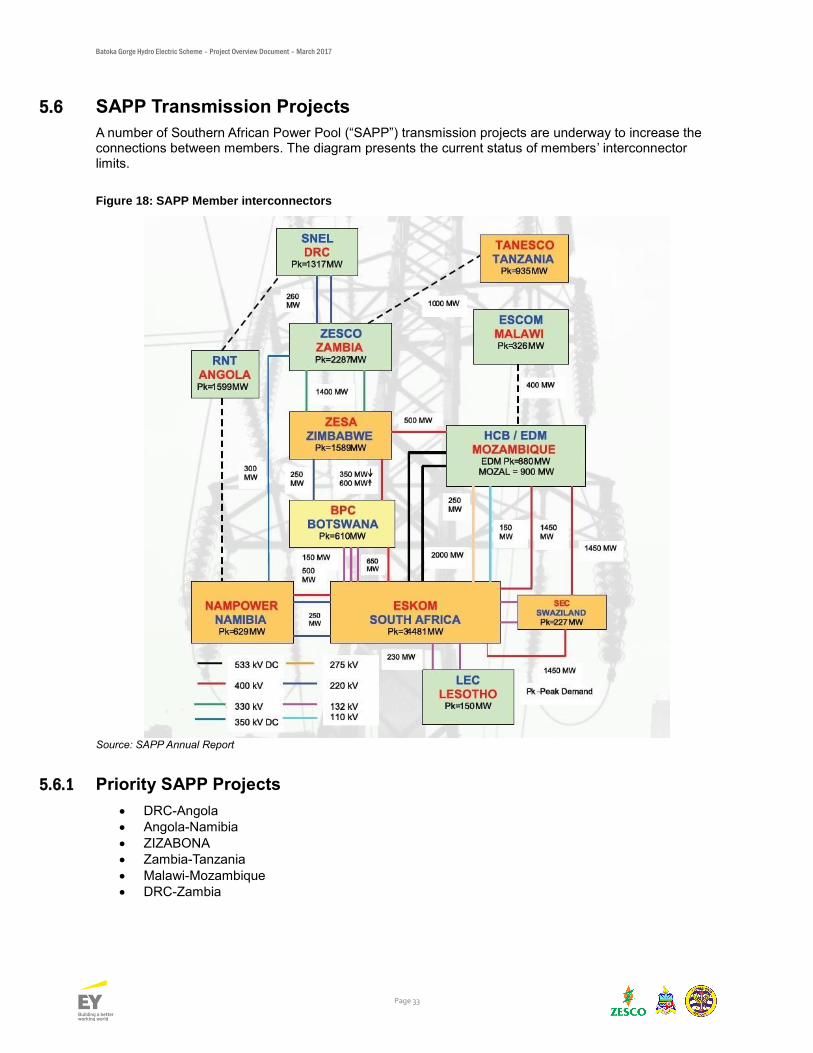
5.6 SAPP Transmission Projects
A number of Southern African Power Pool (“SAPP”) transmission projects are underway to increase the connections between members. The diagram presents the current status of members’ interconnector limits.
Figure 18: SAPP Member interconnectors
Source: SAPP Annual Report
5.6.1 Priority SAPP Projects
DRC-Angola
Angola-Namibia
ZIZABONA
Zambia-Tanzania
Malawi-Mozambique
DRC-Zambia
Batoka Gorge Hydro Electric Scheme – Project Overview Document – March 2017
Page 34
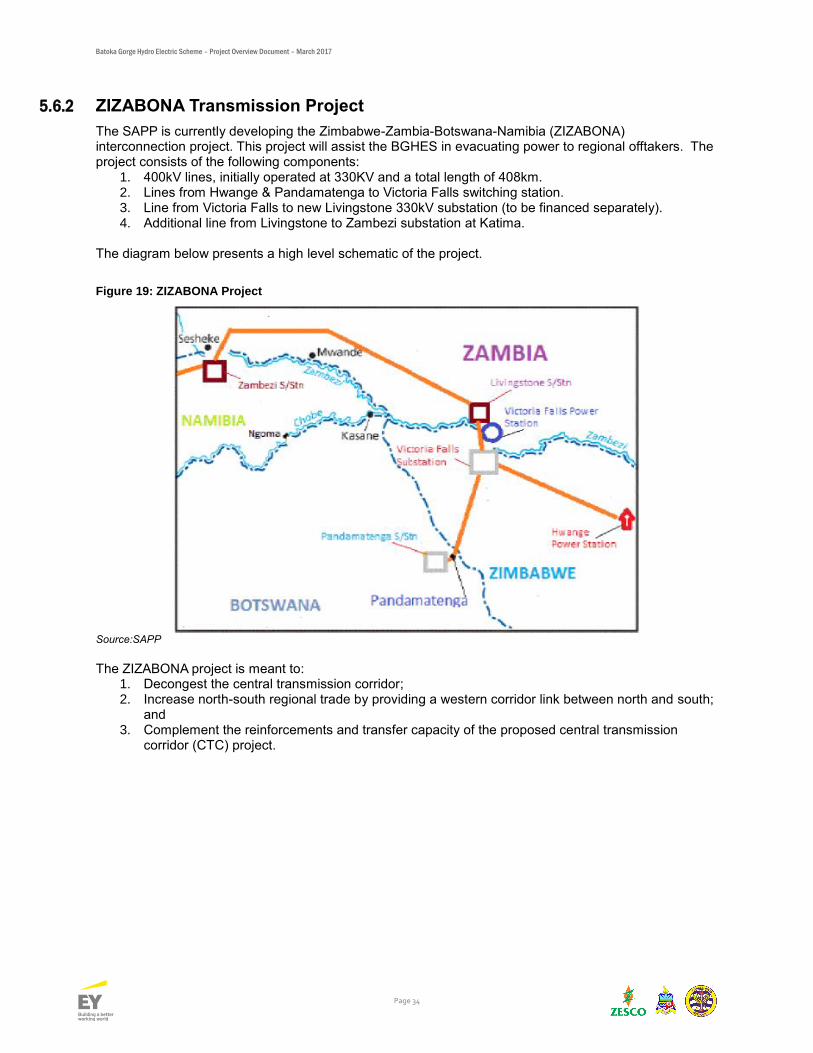
5.6.2 ZIZABONA Transmission Project
The SAPP is currently developing the Zimbabwe-Zambia-Botswana-Namibia (ZIZABONA) interconnection project. This project will assist the BGHES in evacuating power to regional offtakers. The project consists of the following components:
1. 400kV lines, initially operated at 330KV and a total length of 408km. 2. Lines from Hwange & Pandamatenga to Victoria Falls switching station. 3. Line from Victoria Falls to new Livingstone 330kV substation (to be financed separately). 4. Additional line from Livingstone to Zambezi substation at Katima.
The diagram below presents a high level schematic of the project.
Figure 19: ZIZABONA Project
Source:SAPP
The ZIZABONA project is meant to:
1. Decongest the central transmission corridor; 2. Increase north-south regional trade by providing a western corridor link between north and south;
and 3. Complement the reinforcements and transfer capacity of the proposed central transmission
corridor (CTC) project.
Batoka Gorge Hydro Electric Scheme – Project Overview Document – March 2017
Page 35
6. Hydrology and Energy
6.1 Overview
The following chapter provides an overview of the available data used to arrive at the hydrology assumptions for the BGHES.
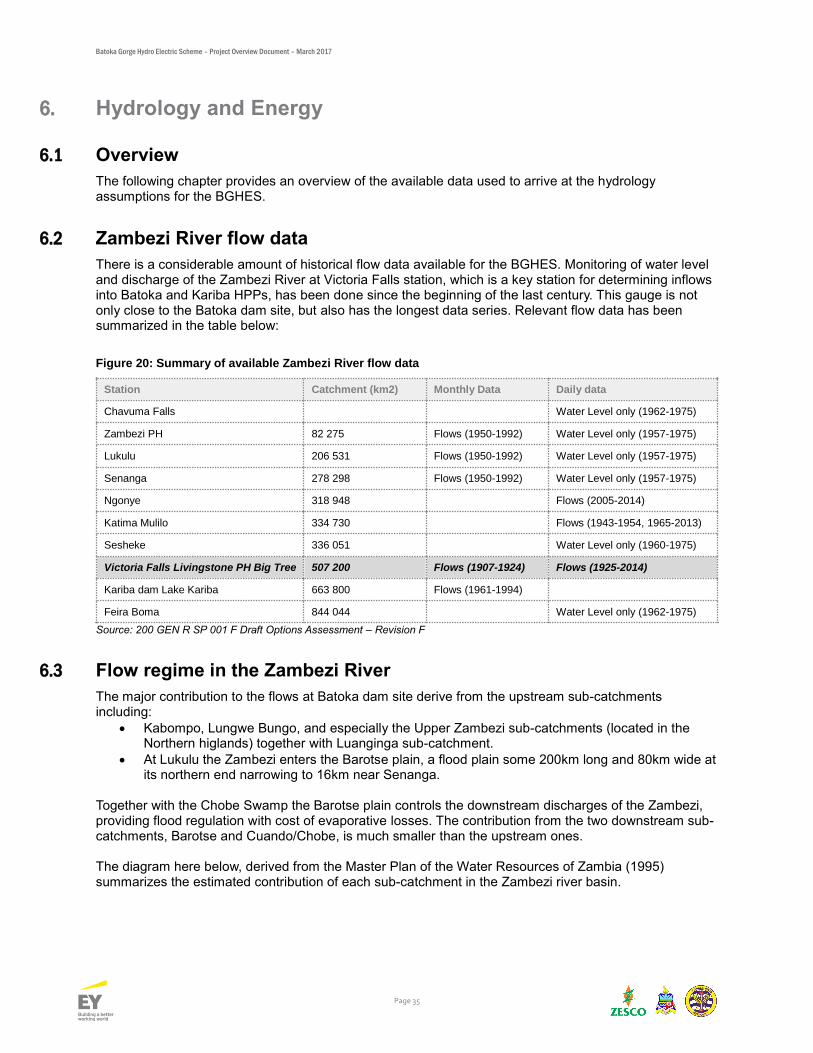
6.2 Zambezi River flow data
There is a considerable amount of historical flow data available for the BGHES. Monitoring of water level and discharge of the Zambezi River at Victoria Falls station, which is a key station for determining inflows into Batoka and Kariba HPPs, has been done since the beginning of the last century. This gauge is not only close to the Batoka dam site, but also has the longest data series. Relevant flow data has been summarized in the table below:
Figure 20: Summary of available Zambezi River flow data
Station Catchment (km2) Monthly Data Daily data
Chavuma Falls Water Level only (1962-1975)
Zambezi PH 82 275 Flows (1950-1992) Water Level only (1957-1975)
Lukulu 206 531 Flows (1950-1992) Water Level only (1957-1975)
Senanga 278 298 Flows (1950-1992) Water Level only (1957-1975)
Ngonye 318 948 Flows (2005-2014)
Katima Mulilo 334 730 Flows (1943-1954, 1965-2013)
Sesheke 336 051 Water Level only (1960-1975)
Victoria Falls Livingstone PH Big Tree 507 200 Flows (1907-1924) Flows (1925-2014)
Kariba dam Lake Kariba 663 800 Flows (1961-1994)
Feira Boma 844 044 Water Level only (1962-1975)
Source: 200 GEN R SP 001 F Draft Options Assessment – Revision F
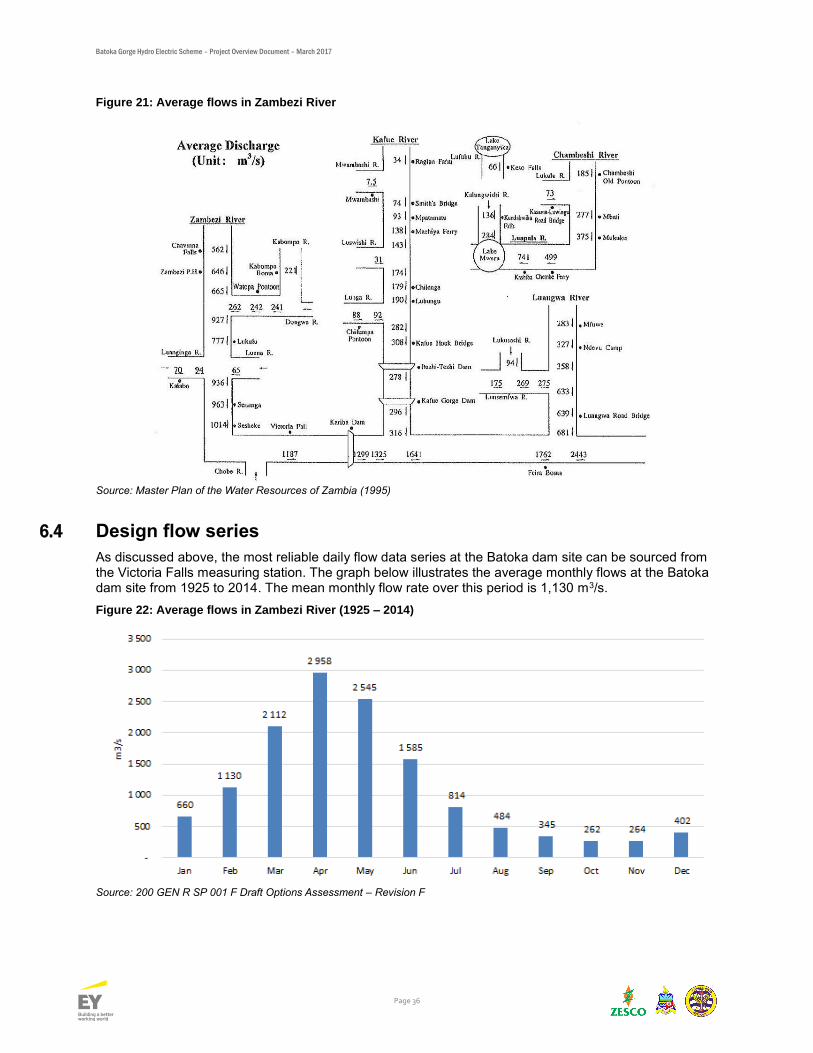
6.3 Flow regime in the Zambezi River
The major contribution to the flows at Batoka dam site derive from the upstream sub-catchments including:
Kabompo, Lungwe Bungo, and especially the Upper Zambezi sub-catchments (located in the Northern higlands) together with Luanginga sub-catchment.
At Lukulu the Zambezi enters the Barotse plain, a flood plain some 200km long and 80km wide at its northern end narrowing to 16km near Senanga.
Together with the Chobe Swamp the Barotse plain controls the downstream discharges of the Zambezi, providing flood regulation with cost of evaporative losses. The contribution from the two downstream sub-catchments, Barotse and Cuando/Chobe, is much smaller than the upstream ones. The diagram here below, derived from the Master Plan of the Water Resources of Zambia (1995) summarizes the estimated contribution of each sub-catchment in the Zambezi river basin.
Batoka Gorge Hydro Electric Scheme – Project Overview Document – March 2017
Page 36
Figure 21: Average flows in Zambezi River
Source: Master Plan of the Water Resources of Zambia (1995)
6.4 Design flow series
As discussed above, the most reliable daily flow data series at the Batoka dam site can be sourced from the Victoria Falls measuring station. The graph below illustrates the average monthly flows at the Batoka dam site from 1925 to 2014. The mean monthly flow rate over this period is 1,130 m3/s.
Figure 22: Average flows in Zambezi River (1925 – 2014)
Source: 200 GEN R SP 001 F Draft Options Assessment – Revision F
Batoka Gorge Hydro Electric Scheme – Project Overview Document – March 2017
Page 37
6.5 Climate change
A rapid increase in the concentration of greenhouse gases (CO2, Methane, CFCs, Water vapours, Nitrous oxide, and Ozone etc.) in the atmosphere due to human activities such as land use changes and extensive use of fossil fuels has caused global warming and global energy imbalance. The greenhouse gases (GHG) trap heat from the atmosphere and release it very slowly resulting in changes to climate variables. Global average temperatures may increase between 1.5 and 4.5° C during the period 1990-2100, with a doubling of the CO2 concentration in the atmosphere. This event would cause a change in the amount and distribution of the rainfall. Although there are several uncertainties regarding the forecast climatic changes, it has become standard practice to evaluate the effects of climate change above all in relation to exploitation of water resources since these could decrease, even drastically, jeopardizing the usefulness of a long-term project such as a hydropower plant. However, because of the uncertainties of the modelling, these results are normally used for risk analysis after carrying out sensitivity analysis using several approaches. The effect of the potential climate change on the hydrological regime has been estimated on the basis of the numerical calculations of the Global Circulation Model (GCM). Since the results of the analysis might vary substantially, changing the global circulation model, emission scenario or baseline scenario, a complete sensitivity analysis was carried out calculating:
Three emission scenarios (RCP, Representative Concentration Pathway): o RCP 4.5 o RCP 6.0 o RCP 8.5
Five GCMs (Global Circulation Models): o BNU-ESM (BCC-CSM for scenario RCP 6.0) o CanESM2 (ESM1-M for scenario RCP 6.0) o CNRM-CM5 (IPSL-CM5A for scenario RCP 6.0) o MIROC-ESM o MIROC-ESM-CHEM
Two Baselines: o Best approximation (10 recent years, 2000-2010) o Conservative (20 recent years, 1990-2010)
The input data (projection of the temperatures and precipitations) utilized in the calculations was provided by IPCC (Intergovernmental Panel on Climate Changes) and reported in the Assessment Report No. 5 (AR5). The HEC-HMS software for the water balance model on a daily basis has been adopted to simulate runoff under varied daily temperature and areal precipitation patterns. A calibration process for the evaluation of model parameters was carried out. The flow data obtained has been used to finalize a complete sensitivity analysis of the variation of the energy production of the plant simulating the effect of the climate change using average flows from the GCMs, the three emission scenarios and the two baseline scenarios above recalled. The results obtained are summarized in the following table.
Batoka Gorge Hydro Electric Scheme – Project Overview Document – March 2017
Page 38
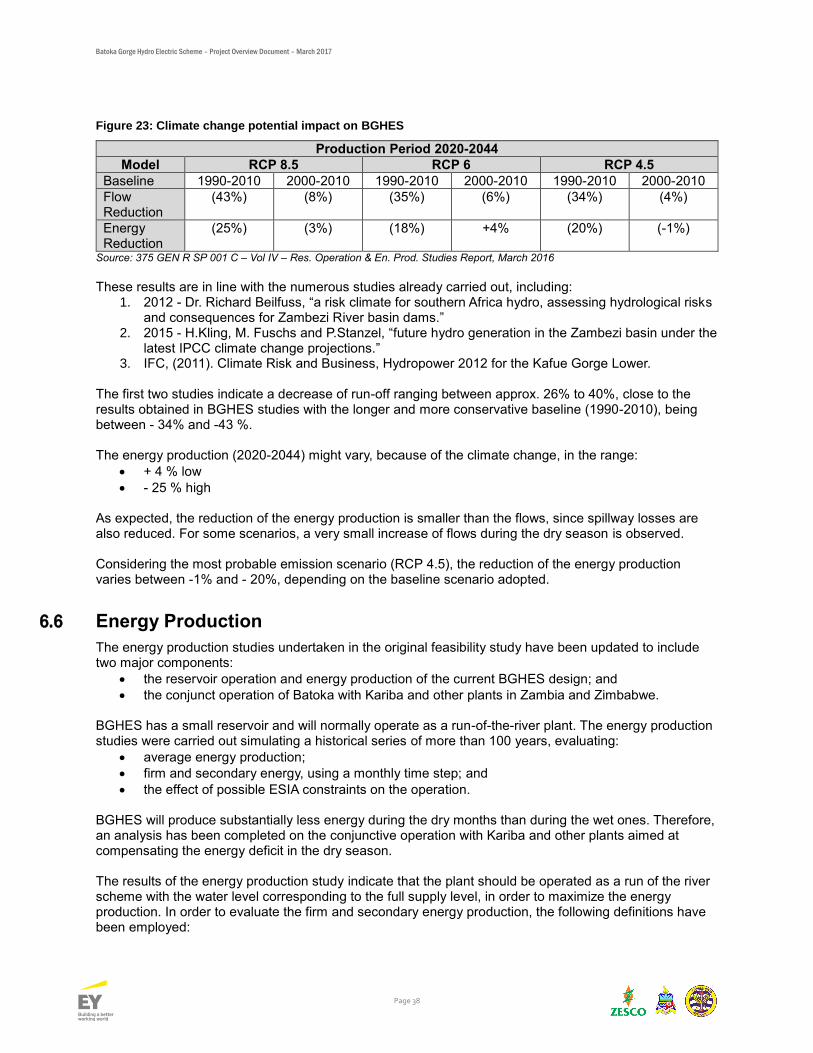
Figure 23: Climate change potential impact on BGHES
Production Period 2020-2044
Model RCP 8.5 RCP 6 RCP 4.5
Baseline 1990-2010 2000-2010 1990-2010 2000-2010 1990-2010 2000-2010
Flow Reduction
(43%) (8%) (35%) (6%) (34%) (4%)
Energy Reduction
(25%) (3%) (18%) +4% (20%) (-1%)
Source: 375 GEN R SP 001 C – Vol IV – Res. Operation & En. Prod. Studies Report, March 2016 These results are in line with the numerous studies already carried out, including:
1. 2012 - Dr. Richard Beilfuss, “a risk climate for southern Africa hydro, assessing hydrological risks and consequences for Zambezi River basin dams.”
2. 2015 - H.Kling, M. Fuschs and P.Stanzel, “future hydro generation in the Zambezi basin under the latest IPCC climate change projections.”
3. IFC, (2011). Climate Risk and Business, Hydropower 2012 for the Kafue Gorge Lower. The first two studies indicate a decrease of run-off ranging between approx. 26% to 40%, close to the results obtained in BGHES studies with the longer and more conservative baseline (1990-2010), being between - 34% and -43 %. The energy production (2020-2044) might vary, because of the climate change, in the range:
+ 4 % low
- 25 % high As expected, the reduction of the energy production is smaller than the flows, since spillway losses are also reduced. For some scenarios, a very small increase of flows during the dry season is observed. Considering the most probable emission scenario (RCP 4.5), the reduction of the energy production varies between -1% and - 20%, depending on the baseline scenario adopted.
6.6 Energy Production
The energy production studies undertaken in the original feasibility study have been updated to include two major components:
the reservoir operation and energy production of the current BGHES design; and
the conjunct operation of Batoka with Kariba and other plants in Zambia and Zimbabwe. BGHES has a small reservoir and will normally operate as a run-of-the-river plant. The energy production studies were carried out simulating a historical series of more than 100 years, evaluating:
average energy production;
firm and secondary energy, using a monthly time step; and
the effect of possible ESIA constraints on the operation. BGHES will produce substantially less energy during the dry months than during the wet ones. Therefore, an analysis has been completed on the conjunctive operation with Kariba and other plants aimed at compensating the energy deficit in the dry season. The results of the energy production study indicate that the plant should be operated as a run of the river scheme with the water level corresponding to the full supply level, in order to maximize the energy production. In order to evaluate the firm and secondary energy production, the following definitions have been employed:
Batoka Gorge Hydro Electric Scheme – Project Overview Document – March 2017
Page 39
Average energy: Average energy produced ( firm + secondary )
Firm energy: Energy produced guaranteed with a reliability of 95%
Secondary Energy: Energy produced in excess of the firm energy ( i.e. during high flows periods )
These assumptions were used for the evaluation of the monthly firm energy, available for the 95% of the time. This analysis is conducted using the daily energy production data calculated using the design series evaluated during a period of 89 years.
Figure 24: Average annual energy production (1925-2014)
9867 GWh/y Average energy production E_tot 5883 GWh/y Firm energy E_firm 3984 GWh/y Secondary energy E_second
Source: 375 GEN R SP 001 C – Vol IV – Res. Operation & En. Prod. Studies Report, March 2016
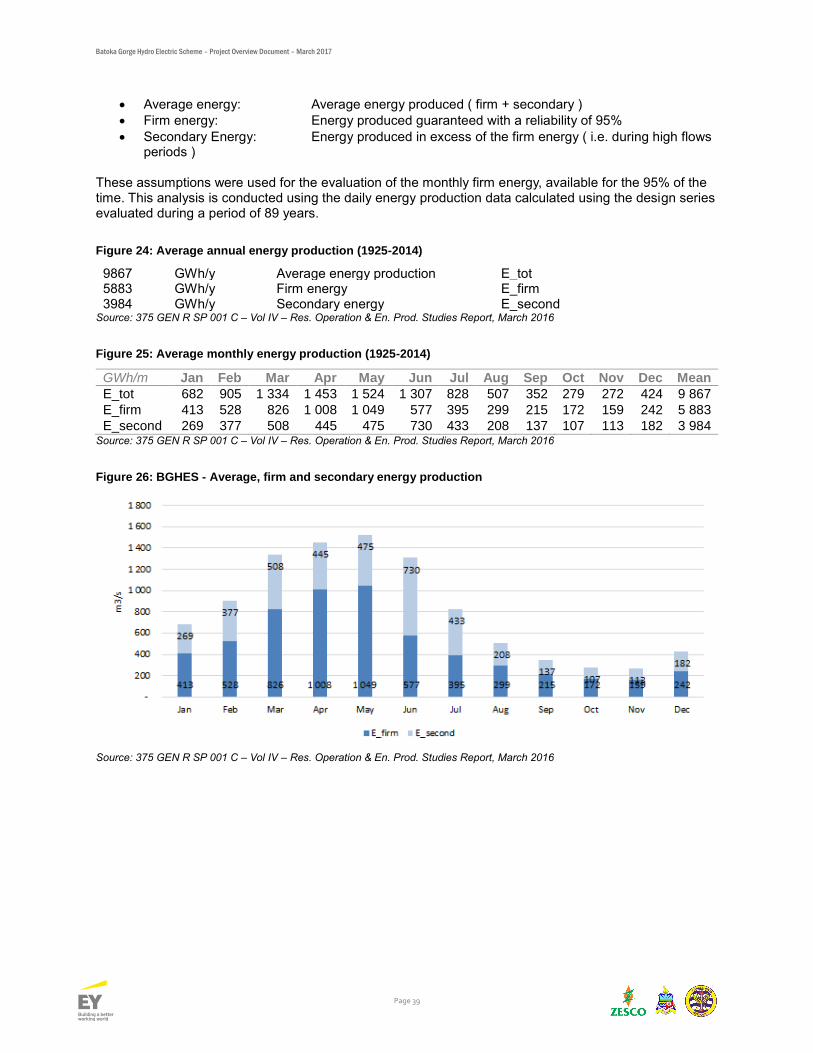
Figure 25: Average monthly energy production (1925-2014)
GWh/m Jan Feb Mar Apr May Jun Jul Aug Sep Oct Nov Dec Mean
E_tot 682 905 1 334 1 453 1 524 1 307 828 507 352 279 272 424 9 867
E_firm 413 528 826 1 008 1 049 577 395 299 215 172 159 242 5 883
E_second 269 377 508 445 475 730 433 208 137 107 113 182 3 984 Source: 375 GEN R SP 001 C – Vol IV – Res. Operation & En. Prod. Studies Report, March 2016
Figure 26: BGHES - Average, firm and secondary energy production
Source: 375 GEN R SP 001 C – Vol IV – Res. Operation & En. Prod. Studies Report, March 2016
Batoka Gorge Hydro Electric Scheme – Project Overview Document – March 2017
Page 40
6.6.1 Energy Production with FSL at 730m during the dry season
The analysis of the energy production was carried out also with an additional scenario operating the reservoir during most of the year with the water level at the FSL, and during the dry months ( August to December ) with the water level at 730 m a.s.l. This scenario was conceived during the ESIA studies, in order to provide a valuable mitigation measure for the impacts of Batoka’s reservoir, particularly for the rafting industry The energy loss caused by the reduction of the reservoir water level during the dry months was calculated at 360 GWh/year, representing about a 3.5 % of the average yearly energy production of the plant.
6.6.2 Energy Production and Climate Change
Moreover, a basic analysis has been developed considering the effect of potential climate change on the hydrological regime of the Zambezi river. The simulations have been performed for the projection period 2020-2044 modelling the five scenarios obtained using the Global Circulation Models. The total yearly energy for the BNU-ESM scenario is equal to 5,666 GWh/year.
Batoka Gorge Hydro Electric Scheme – Project Overview Document – March 2017
Page 41
7. Geology
7.1 Overview
The following chapter presents a summary of the geological studies undertaken to date for the development of the BGHES.
7.2 Regional Geology
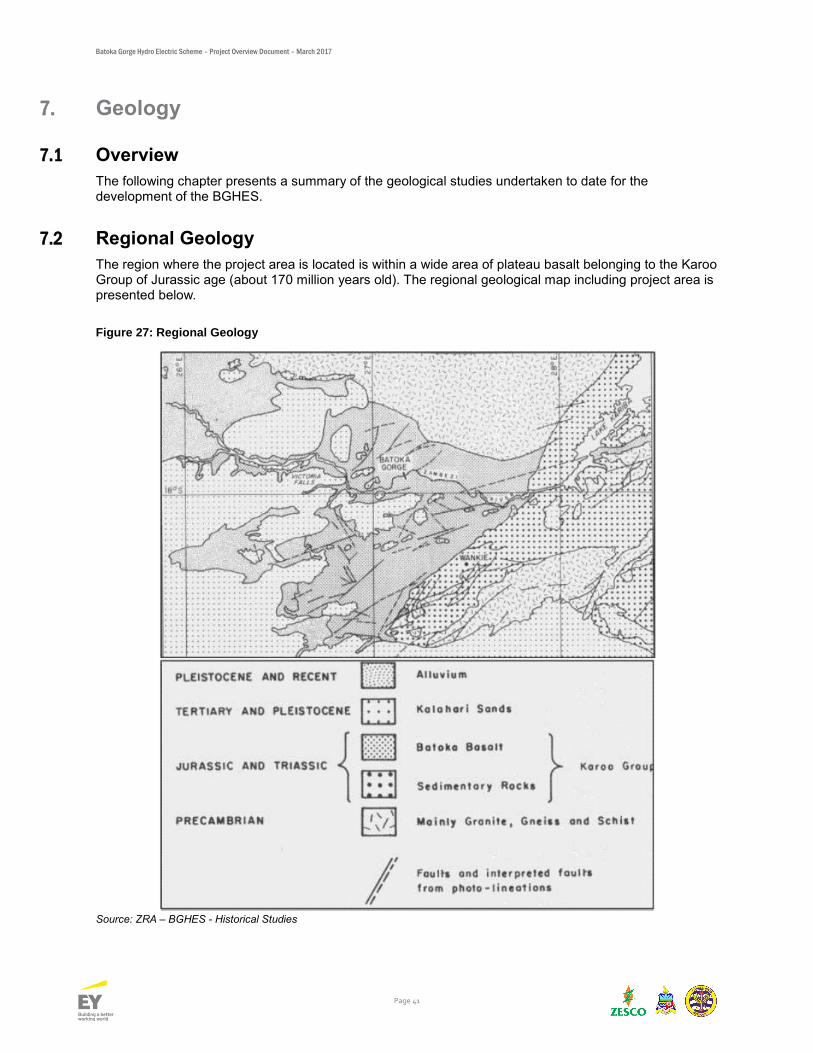
The region where the project area is located is within a wide area of plateau basalt belonging to the Karoo Group of Jurassic age (about 170 million years old). The regional geological map including project area is presented below.
Figure 27: Regional Geology
Source: ZRA – BGHES - Historical Studies
Batoka Gorge Hydro Electric Scheme – Project Overview Document – March 2017
Page 42
The area exposes 1,000m thick lava pile underlain by North East Trending, 70-80km wide trough of basalt and sediments. This trough is bounded to the south-east and to the north-east by Precambrian rocks. In the southern part of the trough, the major north east trending Deka Fault, which crosses the Zambezi river about 75 km downstream of the Batoka site, separates the basalts from the underlying Karoo sediments. South of the dam site and south west of Victoria Falls, the plateau basalts are covered by younger, wind transported sandy sediments and alluvium. The basalts form a very flat plateau with low flat-topped hills incised by the steep-sided gorges of the Zambezi River and its tributaries.
7.3 Project Geology
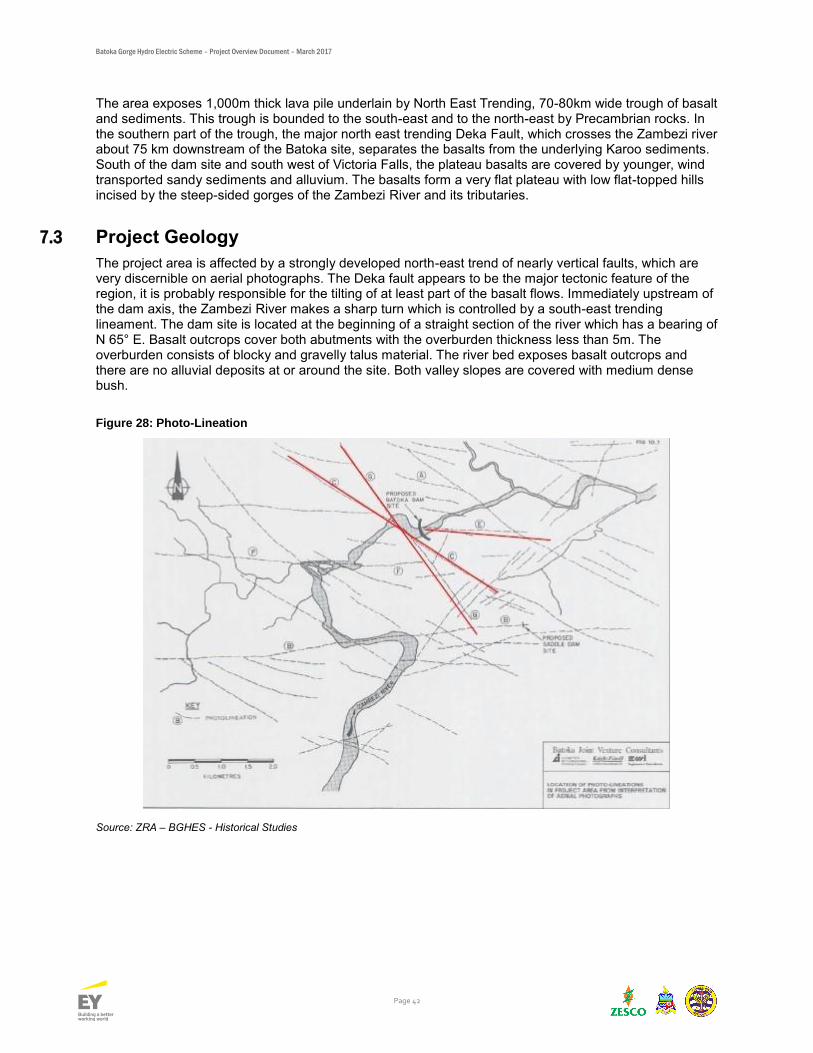
The project area is affected by a strongly developed north-east trend of nearly vertical faults, which are very discernible on aerial photographs. The Deka fault appears to be the major tectonic feature of the region, it is probably responsible for the tilting of at least part of the basalt flows. Immediately upstream of the dam axis, the Zambezi River makes a sharp turn which is controlled by a south-east trending lineament. The dam site is located at the beginning of a straight section of the river which has a bearing of N 65° E. Basalt outcrops cover both abutments with the overburden thickness less than 5m. The overburden consists of blocky and gravelly talus material. The river bed exposes basalt outcrops and there are no alluvial deposits at or around the site. Both valley slopes are covered with medium dense bush.
Figure 28: Photo-Lineation
Source: ZRA – BGHES - Historical Studies
Batoka Gorge Hydro Electric Scheme – Project Overview Document – March 2017
Page 43
7.4 Dam Morphology
7.4.1 South Bank - Zimbabwe
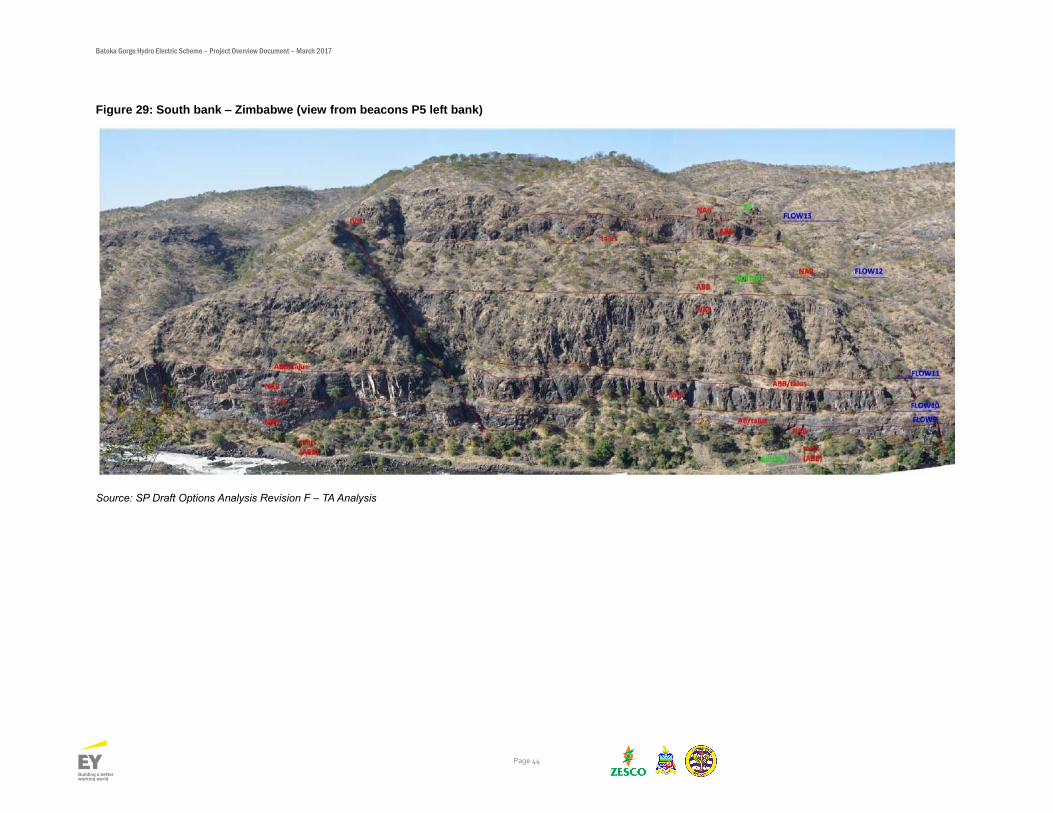
The photographs presented below show a geological interpretation with the indication of the flows no. 8 to 13 (from river bed to the top of the bank) and the lithological layers which form the flows. The photo overleaf shows the layered structure of the right bank. The morphology is conditioned by the above mentioned layered structure, but it is not always strictly related to the lithology. This means that steep cliffs are often constituted of more resistant, non-amygdaloidal basalt (NAB), but also of auto brecciated basalt (ABB); in the same way, moderately steep slopes are formed both of ABB and NAB. The photo shows the presence of three scarps, very steep up to sub-vertical, separated by medium steep slopes.
Starting from the bottom, along the river bank a detrital talus is placed upon the foot of the slope. According to investigation data, ABB of flow 8 underlies the debris covering.
Over the talus, the first scarp is divided by a small ledge which separates the scarp in two cliffs (somewhere the ledge is absent and a single cliff forms the scarp). The first lower part of the scarp is made out of NAB (flow 9), and ends with a thin layer of AB. The ledge signs the passage from flow 9 to flow 10. The second cliff is formed by NAB and ends with a small ledge, presumably made out of the upper layer ABB of flow 10.
A second scarp, less steep than the first one, but with a similar height, is made of NAB of flow 11. The rock forming this scarp is highly jointed (mainly sub-vertical joints) and eroded with some small gullies.
Over the second scarp, a long, moderate steep slope, with scattered rock outcrops and a bush covering, forms the part of the bank between elevations 640 and 720. From available geological and investigation data, confirmed by preliminary surveys, it results that the lower part of this slope is formed of ABB of flow 11, while the upper part is made of NAB of flow 12.
The third scarp begins over this portion of the slope, characterized by a sub-vertical cliff, made of ABB of flow 12; comparing it with the other two scarps, this one appears irregular and morphologically indented.
Over the third scarp, a medium steep slope, covered by bush, joins the top of the bank (the top hill is formed by NAB of flow 13).
Batoka Gorge Hydro Electric Scheme – Project Overview Document – March 2017
Page 44
Figure 29: South bank – Zimbabwe (view from beacons P5 left bank)
Source: SP Draft Options Analysis Revision F – TA Analysis
Batoka Gorge Hydro Electric Scheme – Project Overview Document – March 2017
Page 45
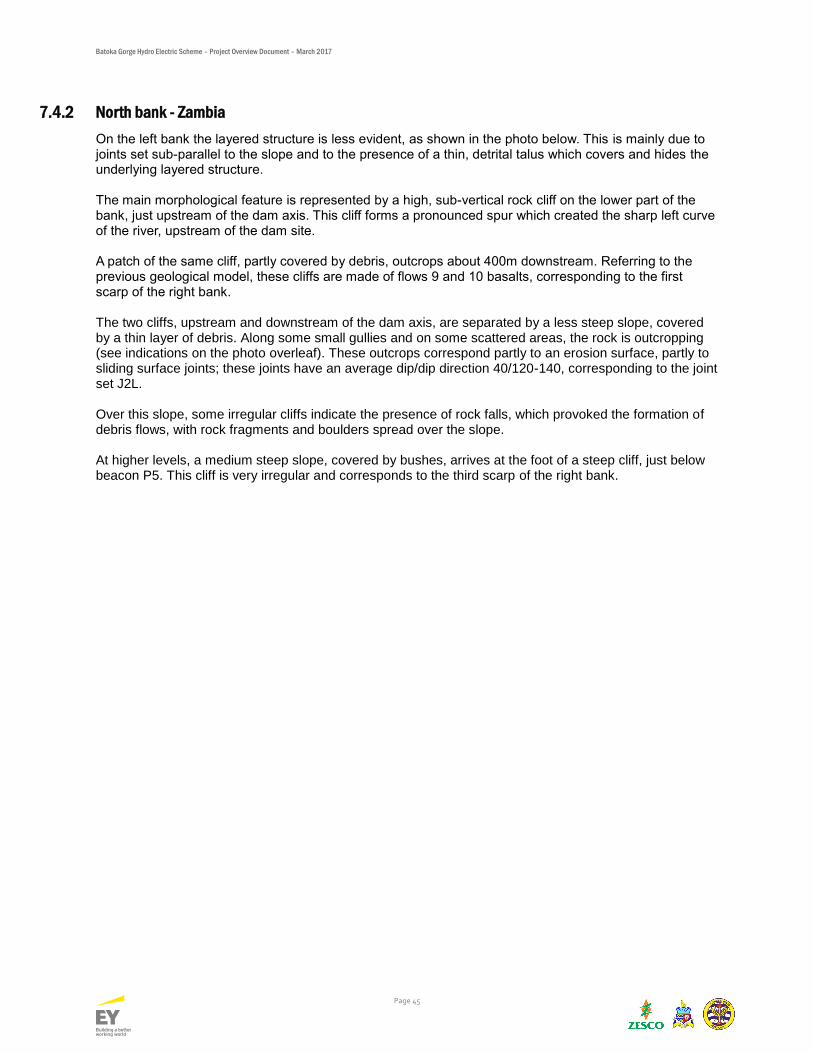
7.4.2 North bank - Zambia
On the left bank the layered structure is less evident, as shown in the photo below. This is mainly due to joints set sub-parallel to the slope and to the presence of a thin, detrital talus which covers and hides the underlying layered structure. The main morphological feature is represented by a high, sub-vertical rock cliff on the lower part of the bank, just upstream of the dam axis. This cliff forms a pronounced spur which created the sharp left curve of the river, upstream of the dam site. A patch of the same cliff, partly covered by debris, outcrops about 400m downstream. Referring to the previous geological model, these cliffs are made of flows 9 and 10 basalts, corresponding to the first scarp of the right bank. The two cliffs, upstream and downstream of the dam axis, are separated by a less steep slope, covered by a thin layer of debris. Along some small gullies and on some scattered areas, the rock is outcropping (see indications on the photo overleaf). These outcrops correspond partly to an erosion surface, partly to sliding surface joints; these joints have an average dip/dip direction 40/120-140, corresponding to the joint set J2L. Over this slope, some irregular cliffs indicate the presence of rock falls, which provoked the formation of debris flows, with rock fragments and boulders spread over the slope. At higher levels, a medium steep slope, covered by bushes, arrives at the foot of a steep cliff, just below beacon P5. This cliff is very irregular and corresponds to the third scarp of the right bank.
Batoka Gorge Hydro Electric Scheme – Project Overview Document – March 2017
Page 46
Figure 30: Left bank (view from beacon P3 right bank)
Source: SP Draft Options Analysis Revision F – TA Analysis
Batoka Gorge Hydro Electric Scheme – Project Overview Document – March 2017
Page 47
8. Environmental and Social Impact Assessments
8.1 Overview
The following chapter presents a summary of a number of key areas under analysis in the ESIA undertaken by ERM. A number of aspects of these studies are still under discussion.
8.2 Hydrology
8.2.1 Basin-Wide Abstractions
The Upper Catchment of the Zambezi above Victoria Falls is predominantly rural and the largest abstractions from the river and its tributaries are for irrigated agriculture. The total estimated direct abstractions in 2010 in the Upper Catchment (around 86 million m3 per year) represent approximately 0.3 % of the annual average runoff at Victoria Falls (World Bank, 2010).
8.2.2 Water Quality
It was found through the recent studies that in all of the water quality datasets there has been no significant change in the chemical constitution of the water above Victoria Falls in recent decades, and that water quality conditions at that point are generally indicative of a largely unpolluted, undeveloped catchment. The most effective mitigation measure to maintain good water quality conditions in the reservoir will be to minimise and control upstream pollution sources wherever possible. Primarily, this would involve a sustained programme of investment to upgrade municipal and industrial wastewater treatment facilities and sewerage systems in the main urban centres of Victoria Falls and Livingstone, and preferably also in Kasane. The water quality control measures should also be accompanied by a routine programme of water quality monitoring in the reservoir, as currently performed by the ZRA for Lake Kariba, with both physical and biological indicators included. The latter should include the sampling and analysis of fish tissue for the potential accumulation of toxic pollutants, in particular lead.
8.2.3 Water Environmental Flows
As a relatively small impoundment and storage capacity relative to its inflow, the proposed BGHES will be operated primarily as a run-of river scheme. There is an option of daily peaking, with the majority of its power generation capacity in the high flow season. The efficiency of the proposed scheme increases if the peak load could be generated and exported at a premium to the SAPP. Daily peaking may, however result in significant impacts on the riverine ecosystem due to flow disturbance, reducing ecological status to C/D (Moderately/Largely Modified), but this will depend ultimately on the final peaking and minimum flow conditions adopted. Such operating rules are under consideration, and will need to be a balance between operational efficiencies and downstream ecological and social impact.
8.3 Ecological Environment
The construction of large dams on the Zambezi River are converting long stretches of flowing riverine habitat to broad standing water pelagic habitat. Hydropower schemes on Lake Kariba and Cahorra Bassa have created reservoirs with lengths of approximately 220 km and 250 km respectively. The Victoria Falls presents a natural barrier to the movement of fish, but the loss of habitats associated with the river, such as riparian vegetation creates a significant fragmentation effect to a large number of species, such as
Batoka Gorge Hydro Electric Scheme – Project Overview Document – March 2017
Page 48
lesser mammals, birds and reptiles. Insect life associated with river habitats is lost and forms a continuous food source that is key to the movement of migratory birds along river corridors. The natural flow regime of the Zambezi River is being affected by a number of hydropower schemes that currently exist, are under construction or are planned for the near future. A World Bank study of the Zambezi River Basin provides an overview of eight existing hydropower schemes and an additional 12 new hydropower or extensions of existing schemes. Additional hydropower schemes have been planned since that report, such as the Kabompo Gorge and Ngonye Falls. Some schemes, such as the Victoria Falls power plant are based on a run-of-river and have no impact on the natural flow regimes, whereas others such as Kariba and Cahora Bassa have vast reservoirs with a major impact on flow regimes.
8.3.1 Avifauna (Taita Falcon & Rock Pratincole)
As per the ESIA the local Taita Falcon population is the single largest known population, and any impacts could affect the species as a whole. The loss of Rock Pratincole habitat could result in a shift in their distribution patterns. Most raptors are wide ranging and survive at low densities, and the loss of a few individuals can be significant to the population. Taita Falcons, the most sensitive species affected, are extremely rare, yet classified as Vulnerable by the IUCN Red-list of Threatened Species. Populations are reduced due to other factors. Large numbers of Endangered vultures and other red-listed birds are at risk from the transmission lines. The proposed mitigation measures include:
Monitoring of Taita Falcons and Habitat Management - The impact of the reservoir on the Taita Falcon population is unknown, and careful monitoring of the Taita Falcon population has been requested in both the 1993 and 1998 studies, is listed as a requirement by the ZPWMA, and will be implemented by the ZRA.
Minimise Disturbance to Nesting Sites - Flooding of the Batoka Gorge will result in the water surface being close to the level of some of the Taita Falcon nesting sites, and movement of boats on the reservoir for fishing or tourism purposes may present a disturbance to these birds.
Artificial Falcon Nest Creation - Taita Falcons prefer to breed in large holes high on a vertical cliff face, and few suitable breeding sites exist naturally. Experiments should be conducted to create of additional nesting holes in the cliffs under the supervision of specialist ornithologists. The Batoka Dam Wall will be over 90 meters in height and one or two artificial nesting sites could be created in locations on the wall where they would be safe from surplus water overflow.
Captive Falcon Breeding Programme - Based on the results of monitoring and expert ornithological opinion, captive breeding programmes should be considered, whereby eggs are taken from nests, the young are reared and released back into their natural habitats with financial support from the income generated by the hydropower scheme.
8.3.2 Fish Communities
The fish communities within the Batoka Gorge are considered to be in a natural state with minimal utilisation due to the inaccessibility of the habitat, although downstream of the gorge (site EF2) there is evidence of heavy utilisation. No unique fish species are known to occur within the gorge.
8.3.3 Crocodiles and Other Fauna
A large Nile crocodile population is present, particularly in the lower reaches of the Zambezi River before Lake Kariba. The crocodile population declined dramatically in the 1950s and 1960s but has since recovered and many mature breeding adults are now present. Lake Kariba supports a large crocodile population but the shorelines are not steep sided and provide breeding and refuge areas for these animals. Breeding and refuge habitats within the Batoka reservoir may be limited but crocodiles are expected to adapt to the new conditions and their populations should persist there.
Batoka Gorge Hydro Electric Scheme – Project Overview Document – March 2017
Page 49
Large numbers of bats are thought to migrate into the Batoka Gorge on a seasonal basis, and are thought to be attracted to midges emerging from the rapids of the Zambezi River. Little is known about these bats and the impacts associated with development of the BGHES are unknown. Other sensitive receptors include the broad diversity of lesser fauna at risk by increased activity through general disturbance, road kills and displacement by construction activities. These species include a wide diversity of small mammals, birds, reptiles, amphibians and other fauna.
8.4 Social Environment
The proposed Project is expected to cause some in-migration into the project area and surrounds related to the arrival of opportunistic economic migrants and migrant labour. Other developments in the project area, specifically the Ndlovu and Jambezi Housing Schemes in Zimbabwe which are intended as satellite towns to be established 40 km outside of Victoria Falls and in close proximity to the airport which is proposed to enhance employment and infrastructure development, may increase the scale and likelihood of this in-migration due to a perception that more benefits are available in the area. The creation of a buffer for ecotourism by the Hwange District Council also highlights the anticipated in-migration expectation to the area. This increased in-migration is likely to contribute to in-migration related impacts including service delivery by the District Authorities and additional strain on already in adequate education and medical facilities. Positive benefits associated with the proposed BGHES include increased employment, purchase of local goods and services and social investment and community development. These may be enhanced by other projects in the area provided that these also promote the employment of local people and procurement as far as possible. Both the Hwange Rural District Council in Zimbabwe and Chief Mukuni’s chiefdom in Zambia are compiling plans to maximise and enhance local tourism economic benefits wherever possible. Combined and focussed social investment strategies, not compiled in isolation could also assist communities as a whole.
8.5 Resettlement in the Project Area
Resettlement may be required for the transmission aspects of the Batoka Gorge Project. The BGHES RAP will be compiled to meet international good practice and will ensure that negotiated compensation/replacement packages are provided. Communication is vital to ensuring that this is understood by the local communities and those impacted by resettlement. The RAP Process and its contents will be disclosed to all other potential developers in the area and discussions held with these parties in the early stage of the RAP Process so as to ascertain the status and level of their resettlement commitments.
8.6 Rafting
Many of the impacts identified in the ESIA can be minimised through the application of appropriate mitigation measures, as elaborated in the project specific ESMPs for construction and operation. However, some impacts are a direct consequence of the reservoir impoundment and the only available mitigation is to alter the operational water levels at the dam (either permanently or seasonally), and in so doing reduce the extent of the upstream effects. The development of the BGHES will have a key effect on the rafting industry. Set out below are some current proposals being discussed as to how to mitigate the effect on this industry.
Reducing the low flow season (in rafting terms, from August to January) operational level to 730 masl, thereby freeing a reach of river for rafting during this dry (low flow) period (typically when
Batoka Gorge Hydro Electric Scheme – Project Overview Document – March 2017
Page 50
flows are less than 500m3/s) that extends all the way from the Victoria Falls downstream to around rapids 9 and 10, which is the current limit of half-day rafting trips on the river; and
Increase the operating level during the high flow season (February to July) operational level to 757masl under normal flow conditions in the river, and to 762masl under high flow conditions, defined as the flow above which the Victoria Falls power station would normally begin to flood (at approximate flows of 3,000m3/s).
The potential benefits of this flexible operational regime would be to maximise power generation during the high flow season whilst facilitating full half-day rafting trips in the river for the majority of the rafting season, and minimising (and potentially avoiding) any incremental effects from flooding at the Victoria Falls Power Station. However, changing the operating level of the dam by some 27 to 32 metres on a regular basis such as this will clearly have consequences for both ecological and aesthetic conditions in the impoundment zone. Moreover, there will be periods during the filling and emptying of the reservoir at the beginning and end of the high flow season, when downstream patterns of flow will be disrupted. This may have consequences for downstream users, and in particular aquatic ecology, and again, these operating rules will need to be finalised to minimise disruptions and impacts to downstream users. The choice of the final option of the permanent and/or seasonal FSL will therefore need to be a compromise between relative economic costs and local and regional benefits, in particular to critical habitat and to local and regional ecotourism.
Figure 31: Map showing FSL of 730 mamsl (low flow seasonal operation)
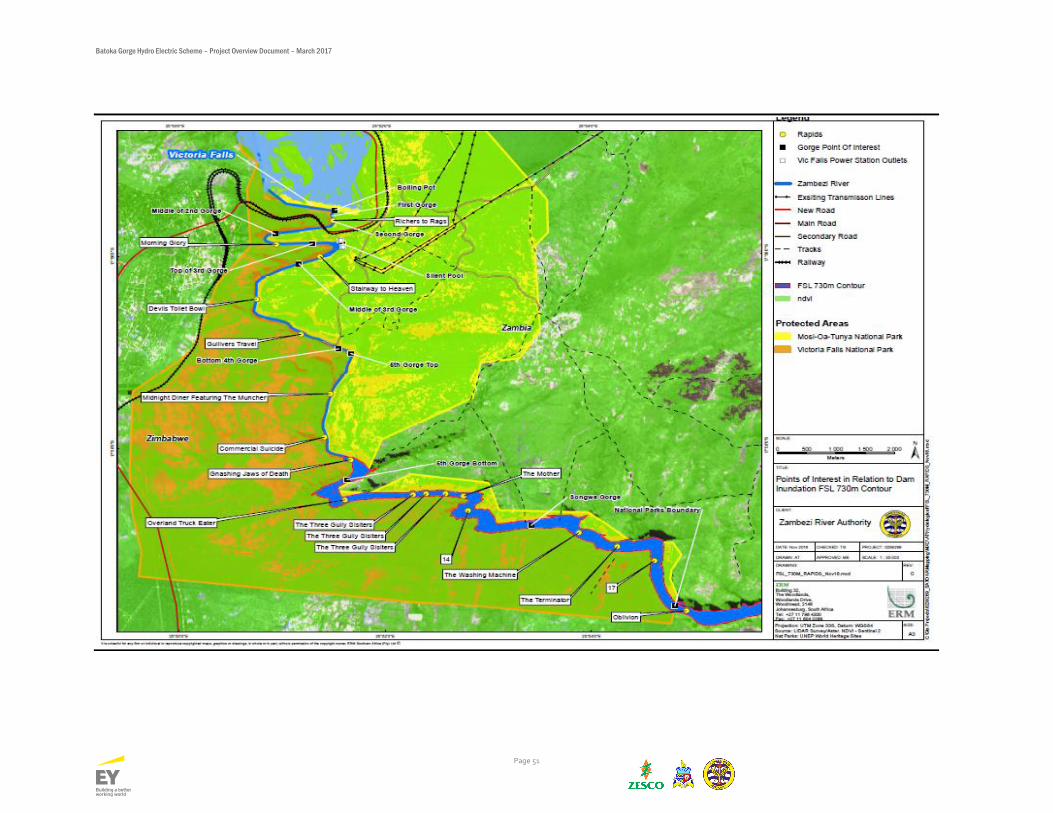
Batoka Gorge Hydro Electric Scheme – Project Overview Document – March 2017
Page 51
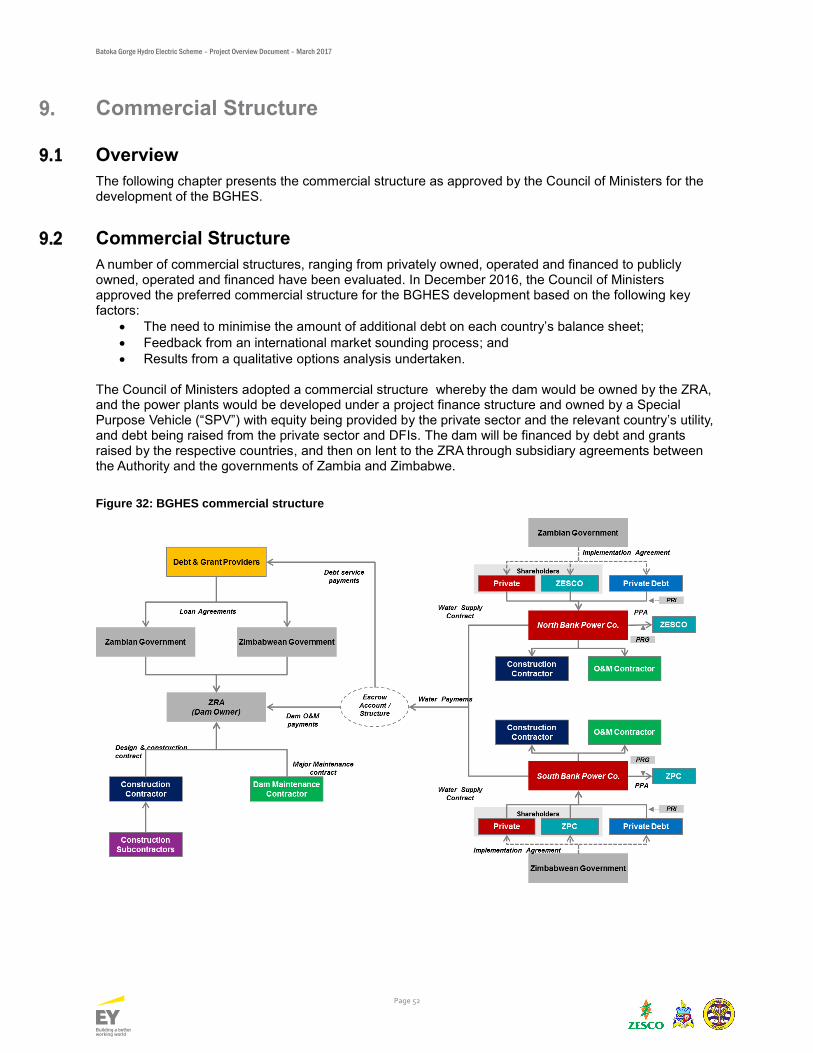
Batoka Gorge Hydro Electric Scheme – Project Overview Document – March 2017
Page 52
9. Commercial Structure
9.1 Overview
The following chapter presents the commercial structure as approved by the Council of Ministers for the development of the BGHES.
9.2 Commercial Structure
A number of commercial structures, ranging from privately owned, operated and financed to publicly owned, operated and financed have been evaluated. In December 2016, the Council of Ministers approved the preferred commercial structure for the BGHES development based on the following key factors:
The need to minimise the amount of additional debt on each country’s balance sheet;
Feedback from an international market sounding process; and
Results from a qualitative options analysis undertaken. The Council of Ministers adopted a commercial structure whereby the dam would be owned by the ZRA, and the power plants would be developed under a project finance structure and owned by a Special Purpose Vehicle (“SPV”) with equity being provided by the private sector and the relevant country’s utility, and debt being raised from the private sector and DFIs. The dam will be financed by debt and grants raised by the respective countries, and then on lent to the ZRA through subsidiary agreements between the Authority and the governments of Zambia and Zimbabwe.
Figure 32: BGHES commercial structure
Batoka Gorge Hydro Electric Scheme – Project Overview Document – March 2017
Page 53
9.3 Dam Construction
The dam will be delivered under a design and construction contract. Under the contract, ZRA would select a contractor who undertakes the detailed dam design and construction works. The contractor would coordinate all design, procurement and construction work and would be responsible for completing the dam project to the required standards, and on time.
9.4 Dam Operations and Maintenance
The ZRA will operate the dam (as per its role on the Kariba complex), the costs of which will be recovered from the water payments made by the power plant companies to the ZRA as per the terms of the water supply contract. Operation activities at Batoka that the ZRA will be responsible for are as defined in their mandate, and include such tasks as:
Dam wall monitoring and surveillance
Dam wall maintenance
Operational hydrology
Water resources & environmental monitoring The ZRA can subcontract certain of the above services if the expertise or capacity is not available in-house. Periodical major maintenance of the dam wall may likely need to be undertaken by suitably experienced, specialist contractors.
9.5 Payment Mechanism – Water Payments
Water payments are made by the North Bank Power Company and by the South Bank Power Company to the ZRA for the ZRA to service in full, its costs directly related to the dam construction and its operation and in line with the regulation applicable in both countries. The water charge can be split into a capacity charge and energy charge to allow for the payments to service finance obligations under various hydrological conditions. The payment mechanism for the water supply agreement assumes that the hydrological risk (in terms of reduced volume of water flow, and hence reduced power supply) will be predominantly taken by the utility companies (and ultimately power consumers) who in turn will seek to mitigate this risk. There are a number of options (or combination of options) potentially available to the utilities/governments to manage the risk of higher energy costs in periods of low river flow:
Set the dam capacity payments at marginally higher levels than required to cover forecast debt service payments (actual amount to be determined by detailed modelling). The additional cash is used to set up a reserve that can be called upon to provide the top up cash needed during periods of sustained low water flow. Once the reserve reaches a certain amount that is considered suitable, surplus cash could be used to provide extra liquidity for possible acceleration of debt repayments. A certain portion of this reserve may need to be pre-funded at the end of the construction period.
The utilities may take out weather related insurance to cover certain low probability events. Liquidity cover and other insurance products can also be employed.
The utilities may take some of the risk exposure in the short term, which could be recouped over time from higher energy tariffs to end users.
Government support by providing top up payments. A further possible risk mitigation, following application of the above mitigants, could be to have a reducing capacity payment formula, triggered only when the unit cost of power reaches a level that is uncompetitive in the region. To achieve this it may be necessary to structure the dam debt with some flexibility in the repayment profile providing options for debt rescheduling. This may involve some upward adjustment to the capacity payment, as described above.
Batoka Gorge Hydro Electric Scheme – Project Overview Document – March 2017
Page 54
The terms and conditions in the water supply agreement will be largely identical for each country’s utility. The water supply agreement will include the obligations of the ZRA to provide water under the agreed operating regime (e.g. run of the river flow).
9.6 Power Plant Ownership & Financing
Under this option it is assumed that separate special purpose vehicles would be established to own the north bank power plant and the south bank power plant. In the structure diagram above, these entities are named the North Bank Power Company and South Bank Power Company respectively. These power companies would be jointly owned by private companies/investors and the respective power utilities. It is assumed that at the end of the concession period, the power assets will be transferred to the respective countries. Financing for each power plant would be undertaken based on project finance structure with a combination of equity and debt finance.
9.7 Power Plants construction
An EPC contract may be considered the best form of contract for the power plants and is fairly standard for projects developed under this type of structure. Separate EPC subcontracts for individual components i.e. power plant works, connection works and electro-mechanical works could be structured as separate subcontracts to the main EPC contract. Each power plant company will be responsible for financing and constructing their respective power plants.
9.8 Power Plants - Operations and Maintenance
Operations & maintenance for the power plant will be the responsibility of the power plant companies and the operations and maintenance contracts may be subcontracted to specialist contractors.
9.9 Payment mechanism – power sales
Each respective utility will pay a water payment to ZRA. This water payment will be largely a “pass through cost” from the utility to the power purchasers. In addition the capital expenditure (capex) cost of constructing the power plant will be charged to end users (or PPA counterparties) based on each utility’s regulatory requirements for amortising capex. In addition, the fixed and variable operations and maintenance costs associated with running the power plant will be passed on to power purchasers. The capex based cost and fixed operations and maintenance costs plus dam capacity costs will make up the capacity payment component of the power charge, while variable O&M costs and variable dam costs will make up the variable payment component.
Batoka Gorge Hydro Electric Scheme – Project Overview Document – March 2017
Page 55
10. Procurement
10.1 Overview
The following chapter presents a procurement plan which has been approved by the Council of Ministers and is currently being developed for the BGHES.
10.2 Procurement packages
Following a multi criteria assessment, in December 2016 the Council of Ministers approved the following packages for separate procurement:
Financing of the dam;
Construction of the dam;
North Bank SPV (including design, construction, financing, operations and maintenance); and
South Bank SPV (including design, construction, financing, operations and maintenance). Transmission infrastructure and the water transfer tunnels have been included as part of the scope of the respective powerhouse SPV’s construction and financing obligations. At commissioning the transmission infrastructure will be transferred to the respective utilities that will then operate and maintain these assets in the usual manner. Procuring of all four packages separately has the following benefits:
Maximises competitive tension across all procurement packages for contractors and financiers;
Provides flexibility to bidders to select the most appropriate package for their particular skill set and risk appetite; and
Incentivises bidders to bid for multiple packages (potentially offering discounts if successful on more than one package) with the same or different construction or operating companies being selected across packages.
Managing construction interface risks is important to the success of the BGHES project, and in this regard a number of contractual options have been investigated. These contractual frameworks are discussed in Chapter 11.
10.3 Procurement process
Given the size of the project, and associated high bidding costs, the ZRA believes a two phase open tender process with shortlisting (Request For Qualifications (RFQ) and Request for Proposals (RFP) phases) for construction of the dam and power house SPVs will best meet the ZRA procurement objectives. This is in line with international best practice for similar infrastructure projects.
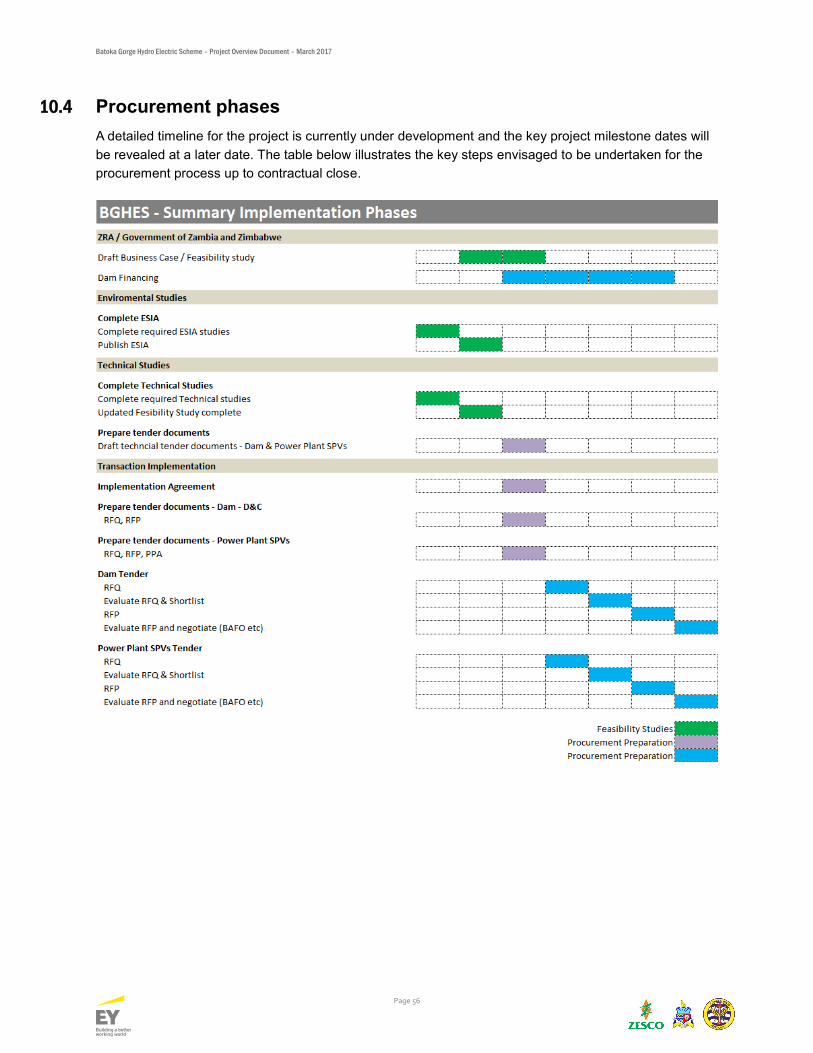
Batoka Gorge Hydro Electric Scheme – Project Overview Document – March 2017
Page 56
10.4 Procurement phases
A detailed timeline for the project is currently under development and the key project milestone dates will
be revealed at a later date. The table below illustrates the key steps envisaged to be undertaken for the
procurement process up to contractual close.
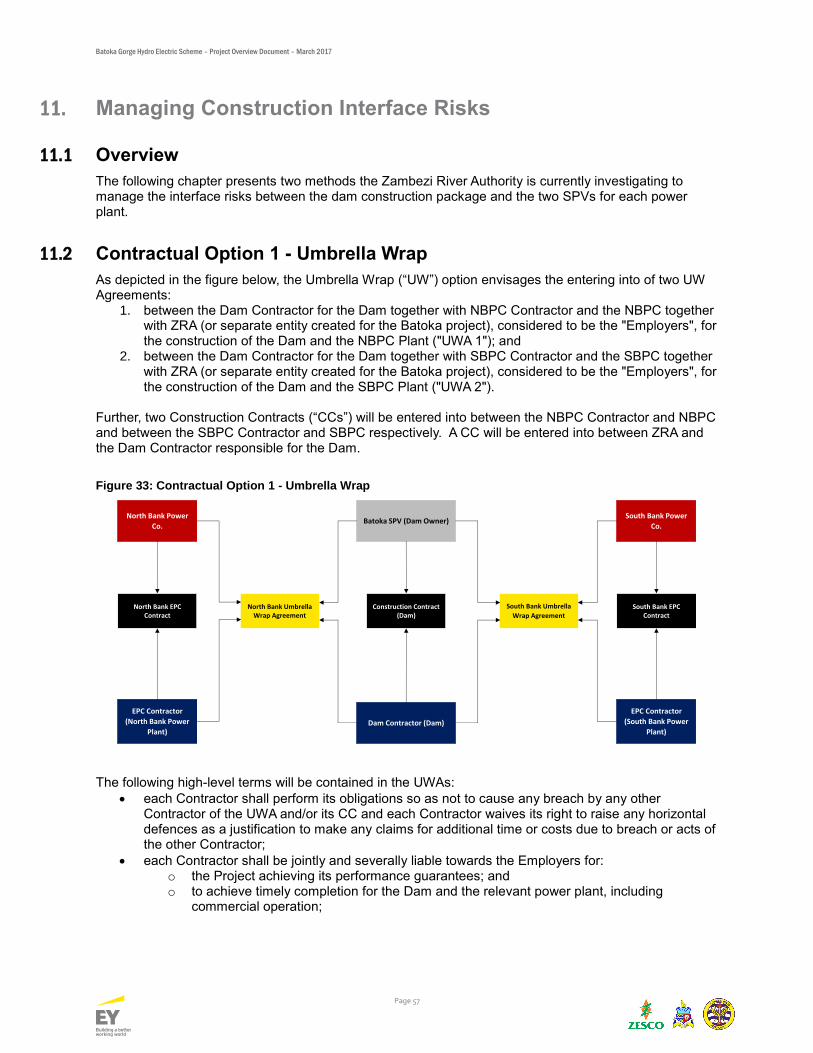
Batoka Gorge Hydro Electric Scheme – Project Overview Document – March 2017
Page 57
11. Managing Construction Interface Risks
11.1 Overview
The following chapter presents two methods the Zambezi River Authority is currently investigating to manage the interface risks between the dam construction package and the two SPVs for each power plant.
11.2 Contractual Option 1 - Umbrella Wrap
As depicted in the figure below, the Umbrella Wrap (“UW”) option envisages the entering into of two UW Agreements:
1. between the Dam Contractor for the Dam together with NBPC Contractor and the NBPC together with ZRA (or separate entity created for the Batoka project), considered to be the "Employers", for the construction of the Dam and the NBPC Plant ("UWA 1"); and
2. between the Dam Contractor for the Dam together with SBPC Contractor and the SBPC together with ZRA (or separate entity created for the Batoka project), considered to be the "Employers", for the construction of the Dam and the SBPC Plant ("UWA 2").
Further, two Construction Contracts (“CCs”) will be entered into between the NBPC Contractor and NBPC and between the SBPC Contractor and SBPC respectively. A CC will be entered into between ZRA and the Dam Contractor responsible for the Dam.
Figure 33: Contractual Option 1 - Umbrella Wrap
The following high-level terms will be contained in the UWAs:
each Contractor shall perform its obligations so as not to cause any breach by any other Contractor of the UWA and/or its CC and each Contractor waives its right to raise any horizontal defences as a justification to make any claims for additional time or costs due to breach or acts of the other Contractor;
each Contractor shall be jointly and severally liable towards the Employers for: o the Project achieving its performance guarantees; and o to achieve timely completion for the Dam and the relevant power plant, including
commercial operation;
North Bank Umbrella Wrap Agreement
EPC Contractor
(North Bank Power
Plant)
North Bank Power
Co.
South Bank Umbrella
Wrap AgreementNorth Bank EPC
Contract
Batoka SPV (Dam Owner)
Dam Contractor (Dam)
Construction Contract (Dam)
EPC Contractor
(South Bank Power
Plant)
South Bank Power
Co.
South Bank EPC Contract
Batoka Gorge Hydro Electric Scheme – Project Overview Document – March 2017
Page 58
the Employers can terminate the UWA and both power plant CCs (and Dam Contractor's CC (in respect of the Dam) and recover their equity contribution and debt costs if the Dam and/or the relevant power plant do not achieve the MPG by the Longstop Date;
Limit of liability for Contractors pertaining to: o defects liability, delay damages and contracted performance guarantees are to be
covered under each CC. Each Contractor is to be severally liable toward the Employer they have contracted with under their CC, up to caps contained therein; and
o a failure to achieve the MPGs by the Longstop Date shall be dealt with under the UWA. Each Contractor will be jointly and separately liable to the Employer up to a value that is equal to the equity contribution and debt costs of Employers, with debt costs including outstanding senior debt, breakage costs and hedge costs;
each Contractor is to provide a parent company guarantee from its ultimate parent company, warranting its performance and covering indemnities/liabilities under the UWA and the relevant CC;
the UWA and each CC (shall remain effective until each Contractor (and parent companies') obligations and liabilities have been discharged, extinguished or satisfied in full;
the Contractors shall be required to cross indemnify one another to the extent of their contribution towards the others liability; and
risk allocation for Force Majeure, sustained drought conditions, Government Risk Events and Site Conditions are to be regulated under the CCs, as well as dispute resolution/termination on a back to back basis with the PPA.
In terms of power plant CCs, such contracts shall be bespoke contracts based on the FIDIC Silver Book modified to include, inter alia, PPA, IA and bankability requirements. In terms of the CC for the Dam, ideally also be based on the FIDIC Silver Book modified to include, inter alia, PPA, IA and bankability requirements. This CC shall make provision for a novation to and verification of the EPCM's existing design by the Dam Contractor for the Dam.
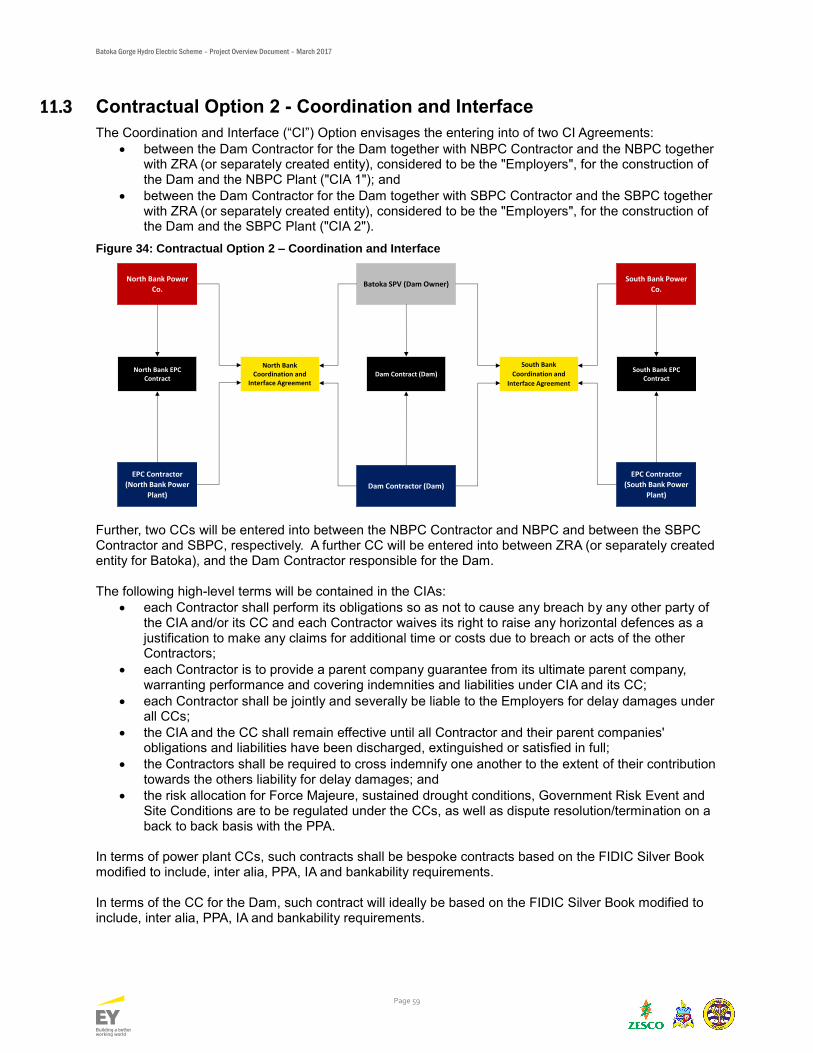
Batoka Gorge Hydro Electric Scheme – Project Overview Document – March 2017
Page 59
11.3 Contractual Option 2 - Coordination and Interface
The Coordination and Interface (“CI”) Option envisages the entering into of two CI Agreements:
between the Dam Contractor for the Dam together with NBPC Contractor and the NBPC together with ZRA (or separately created entity), considered to be the "Employers", for the construction of the Dam and the NBPC Plant ("CIA 1"); and
between the Dam Contractor for the Dam together with SBPC Contractor and the SBPC together with ZRA (or separately created entity), considered to be the "Employers", for the construction of the Dam and the SBPC Plant ("CIA 2").
Figure 34: Contractual Option 2 – Coordination and Interface
Further, two CCs will be entered into between the NBPC Contractor and NBPC and between the SBPC Contractor and SBPC, respectively. A further CC will be entered into between ZRA (or separately created entity for Batoka), and the Dam Contractor responsible for the Dam. The following high-level terms will be contained in the CIAs:
each Contractor shall perform its obligations so as not to cause any breach by any other party of the CIA and/or its CC and each Contractor waives its right to raise any horizontal defences as a justification to make any claims for additional time or costs due to breach or acts of the other Contractors;
each Contractor is to provide a parent company guarantee from its ultimate parent company, warranting performance and covering indemnities and liabilities under CIA and its CC;
each Contractor shall be jointly and severally be liable to the Employers for delay damages under all CCs;
the CIA and the CC shall remain effective until all Contractor and their parent companies' obligations and liabilities have been discharged, extinguished or satisfied in full;
the Contractors shall be required to cross indemnify one another to the extent of their contribution towards the others liability for delay damages; and
the risk allocation for Force Majeure, sustained drought conditions, Government Risk Event and Site Conditions are to be regulated under the CCs, as well as dispute resolution/termination on a back to back basis with the PPA.
In terms of power plant CCs, such contracts shall be bespoke contracts based on the FIDIC Silver Book modified to include, inter alia, PPA, IA and bankability requirements. In terms of the CC for the Dam, such contract will ideally be based on the FIDIC Silver Book modified to include, inter alia, PPA, IA and bankability requirements.
North Bank Coordination and
Interface Agreement
EPC Contractor
(North Bank Power
Plant)
North Bank Power
Co.
South Bank
Coordination and
Interface Agreement
North Bank EPC Contract
Batoka SPV (Dam Owner)
Dam Contractor (Dam)
Dam Contract (Dam)
EPC Contractor
(South Bank Power
Plant)
South Bank Power
Co.
South Bank EPC Contract
Batoka Gorge Hydro Electric Scheme – Project Overview Document – March 2017
Page 60
12. Legal Framework and Overview of proposed contractual documents
12.1 Overview
The following section provides an overview of the regulatory framework and contractual documents currently being prepared for the implementation of the project.
12.2 Zambezi River Authority Acts
In 1987, the Governments of Zambia and Zimbabwe entered into an interstate agreement in respect of the use and management of the Zambezi Scheme. The Agreement sought to, inter alia, derive the greatest possible benefit for Zambia and Zimbabwe from the natural advantages offered by the Zambezi Scheme, as well as improve and intensify the utilisation of the waters for the production of energy. The Authority was established through the simultaneous enactment of legislation in Zimbabwe and Zambia, namely, the ZRA Acts. The Authority is governed by the Council of Ministers comprised of heads of designated Ministries of the Governments of Zambia and Zimbabwe. The ZRA Acts and the Agreement confer on the Authority the status of a body corporate. The Council of Ministers is responsible for giving direction to, and supervising the operations of the Authority and may also prescribe anything which, in its opinion, is necessary or convenient for the better exercise of the functions of the Authority. In terms of the ZRA Acts and the Agreement, the Governments of Zambia and Zimbabwe are required to contribute equally to the development of infrastructure within the Zambezi Scheme. Further, the schedules to the ZRA Acts provide for four main strategic functions of the Authority as follows:
to investigate the desirability of constructing new dams on the Zambezi River and make recommendations thereon to the Council of Ministers;
subject to the approval of the Council of Ministers, construct, operate, monitor and maintain dams on the Zambezi River;
make recommendations to the Council of Ministers which seek to ensure the effective and efficient use of the waters and other resources of the Zambezi river; and
submit development plans and programmes to the Council of Ministers for approval.
12.3 Project Legal Environment
Based on the legal analysis undertaken to date it is believed that the implementation of the Project, is permitted within the existing legal regulatory framework in both Zambia and Zimbabwe In Zambia the Public – Private Partnership Act 14/2009 is the principal legislation setting the supportive legal framework for Projects such BGHES whilst in Zimbabwe the corresponding principal legislation is the Procurement Act [Chapter 22:14] which, amongst others, recognises project development modes such as Build Operate and Transfer. The Procurement Act is complemented by legislation such as the Joint Venture Act and the Public – Private Procurement Guidelines of 2013. On the regulatory side, power generation, transmission and distribution is regulated by the Electricity Act Chapter 433 in Zambia and [Chapter 13:19] in Zimbabwe. The tariff regime is regulated in terms of the Energy Regulation Act Chapter 436 of Zambia and the Energy Regulatory Authority Act [Chapter 13:23] of Zimbabwe.
Batoka Gorge Hydro Electric Scheme – Project Overview Document – March 2017
Page 61
12.4 Project Power Purchase Agreement(s) and Power Trade
12.4.1 Project Power Purchase Agreement
The power purchase agreements (“PPA”) as currently being considered for the BGHES between the SPVs and the utility will have a 'tariff' which is split between:
An availability charge (also known as a capacity charge) for making their power plant, also referred to as the facility, available to provide power and this charge covers the capital expenditure involved in building the power station , as well as its fixed operating expenditure; and
A usage charge (also known as a variable charge) for the marginal cost of generating power as and when required and such charge usually covers the cost of the fuel (and in this case, water) required for the facility to generate power.
Under the above tariff arrangement, the flow of funds to the project company are not dependent on the amount of power required, if any, as the availability charge is required to be paid to the project company whether or not power is required by the purchaser of such power.
12.4.2 Power Trade or Power Export Agreements
The power purchase agreements (“PPA”) signed by each respective utility will be supported by back to back Power Export Agreements (“PXA”) with regional utilities.
12.5 Construction Arrangements
As set out in the Procurement section of this Project Overview Document, Construction Agreements are being developed in terms of
- power plant construction contracts, such that the contracts shall be bespoke contracts based on the FIDIC Silver Book modified to include, inter alia, PPA, IA and bankability requirements; and the
- Dam, ideally also based on the FIDIC Silver Book modified to include, inter alia, PPA, IA and bankability requirements.
12.6 Operation and Maintenance Arrangements
An O&M agreement is being prepared which will govern the day-to-day running of the power plant by the Project Company. Involvement of the national utilities in the operation and maintenance is being considered here in balance with requirements lenders to the Project Company are expected to have.
12.7 Implementation Agreement
An Implementation Agreement is currently being developed which will provide a direct contractual obligation and undertaking between the Government of Zambia and Zimbabwe and each SPV.
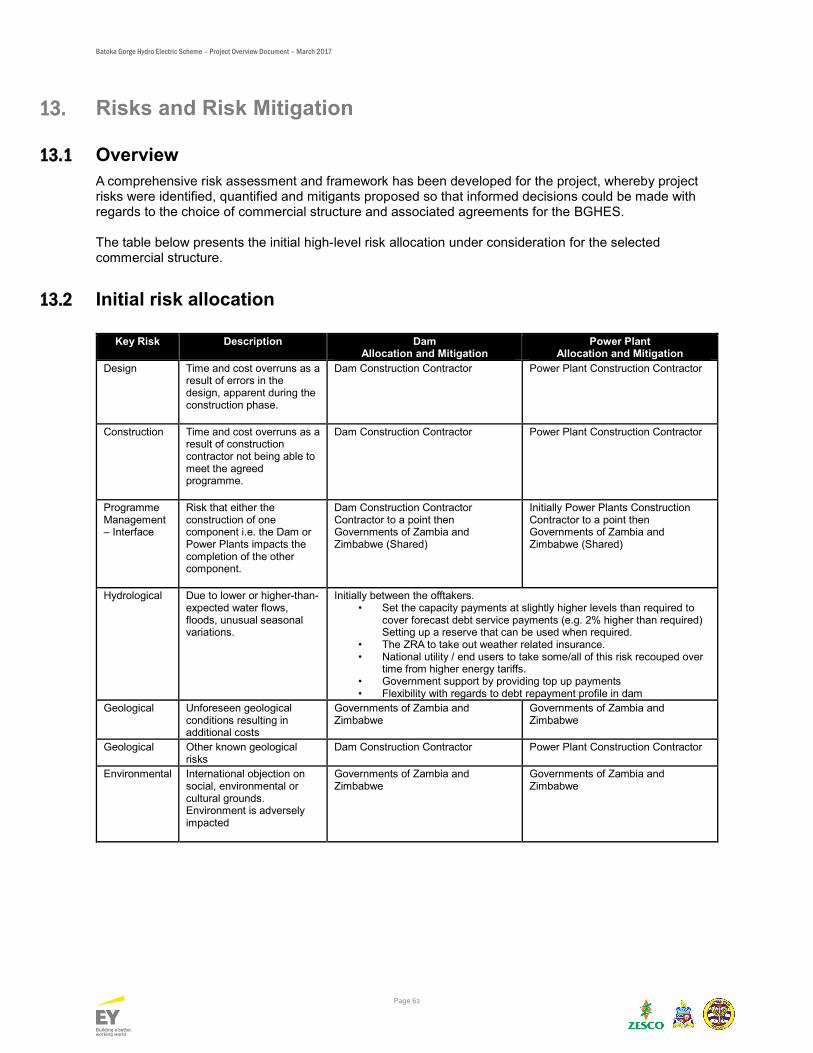
Batoka Gorge Hydro Electric Scheme – Project Overview Document – March 2017
Page 62
13. Risks and Risk Mitigation
13.1 Overview
A comprehensive risk assessment and framework has been developed for the project, whereby project risks were identified, quantified and mitigants proposed so that informed decisions could be made with regards to the choice of commercial structure and associated agreements for the BGHES. The table below presents the initial high-level risk allocation under consideration for the selected commercial structure.
13.2 Initial risk allocation
Key Risk Description Dam
Allocation and Mitigation Power Plant
Allocation and Mitigation
Design Time and cost overruns as a result of errors in the design, apparent during the construction phase.
Dam Construction Contractor Power Plant Construction Contractor
Construction Time and cost overruns as a result of construction contractor not being able to meet the agreed programme.
Dam Construction Contractor Power Plant Construction Contractor
Programme Management – Interface
Risk that either the construction of one component i.e. the Dam or Power Plants impacts the completion of the other component.
Dam Construction Contractor Contractor to a point then Governments of Zambia and Zimbabwe (Shared)
Initially Power Plants Construction Contractor to a point then Governments of Zambia and Zimbabwe (Shared)
Hydrological Due to lower or higher-than-expected water flows, floods, unusual seasonal variations.
Initially between the offtakers. • Set the capacity payments at slightly higher levels than required to
cover forecast debt service payments (e.g. 2% higher than required) Setting up a reserve that can be used when required.
• The ZRA to take out weather related insurance. • National utility / end users to take some/all of this risk recouped over
time from higher energy tariffs. • Government support by providing top up payments • Flexibility with regards to debt repayment profile in dam
Geological Unforeseen geological conditions resulting in additional costs
Governments of Zambia and Zimbabwe
Governments of Zambia and Zimbabwe
Geological Other known geological risks
Dam Construction Contractor
Power Plant Construction Contractor
Environmental International objection on social, environmental or cultural grounds. Environment is adversely impacted
Governments of Zambia and Zimbabwe
Governments of Zambia and Zimbabwe
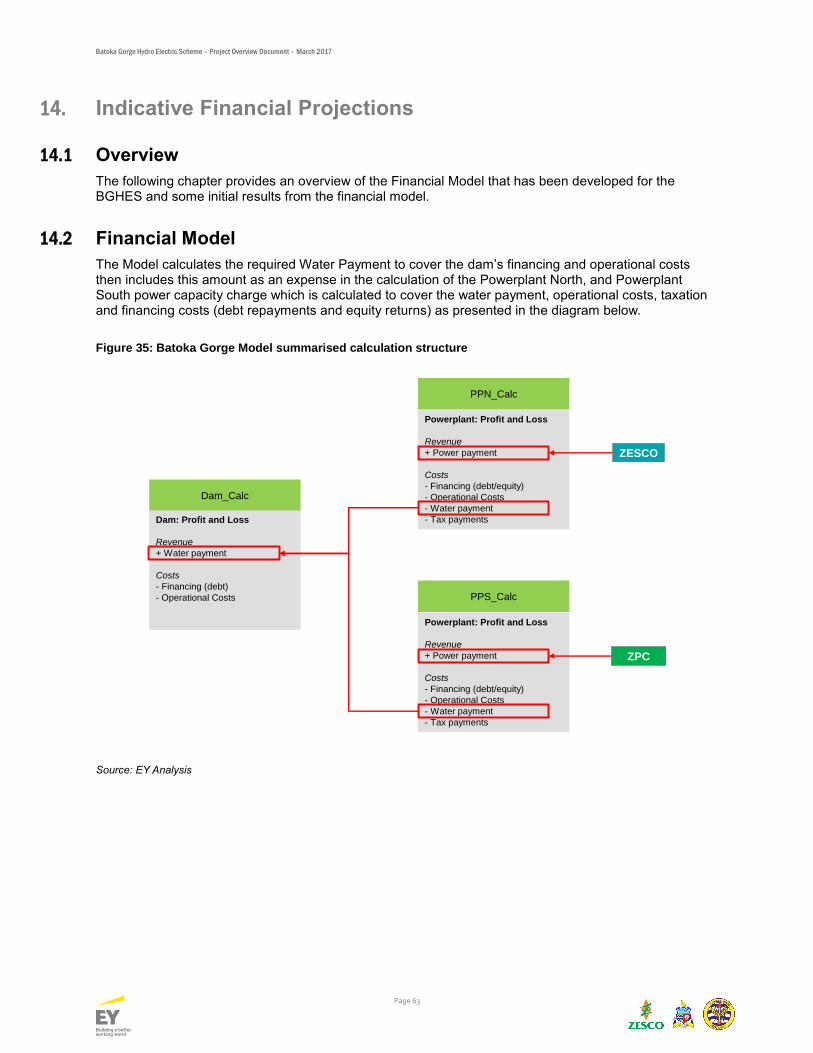
Batoka Gorge Hydro Electric Scheme – Project Overview Document – March 2017
Page 63
14. Indicative Financial Projections
14.1 Overview
The following chapter provides an overview of the Financial Model that has been developed for the BGHES and some initial results from the financial model.
14.2 Financial Model
The Model calculates the required Water Payment to cover the dam’s financing and operational costs then includes this amount as an expense in the calculation of the Powerplant North, and Powerplant South power capacity charge which is calculated to cover the water payment, operational costs, taxation and financing costs (debt repayments and equity returns) as presented in the diagram below.
Figure 35: Batoka Gorge Model summarised calculation structure
Source: EY Analysis
Dam_Calc
PPN_Calc
PPS_Calc
Dam: Profit and Loss
Revenue
+ Water payment
Costs
- Financing (debt)
- Operational Costs
Powerplant: Profit and Loss
Revenue
+ Power payment
Costs
- Financing (debt/equity)
- Operational Costs
- Water payment
- Tax payments
Powerplant: Profit and Loss
Revenue
+ Power payment
Costs
- Financing (debt/equity)
- Operational Costs
- Water payment
- Tax payments
ZPC
ZESCO
Batoka Gorge Hydro Electric Scheme – Project Overview Document – March 2017
Page 64
14.3 Capital cost breakdown
Current capital expenditure figures have been taken from SP Options Assessment Report Version F.
14.3.1 Dam
Table 1: Dam construction costs
Component USD 000's*
Civil Works (Dam, Spillway, Intakes) 1 532 000
* 2015 Prices
14.3.2 Power Plants
Table 2: Construction costs – Power Plants
Component Powerhouse North
(US$m)* Powerhouse South
(US$m)*
Power Plant Structure (including waterways) 223 500 223 500
EM equipment 262 500 262 500
Transmission Lines 60 500 60 500
* 2015 Prices
14.4 Sources and uses of funds
14.4.1 Dam
Table 3: Use of funds - Dam
USD 000's % of Total
Construction Costs 1 642 076 76.8%
Interest during construction 400 737 18.7%
Arrangement fees 58 818 2.8%
Commitment fees 36 498 1.7%
Agency fees 700 0%
Total Project Costs 2 138 828 100%
Table 4: Source of funds - Dam
USD 000's % of Total
Equity - 0%
Senior Debt 2 138 828 100%
Total Project Finance 2 138 828 100%
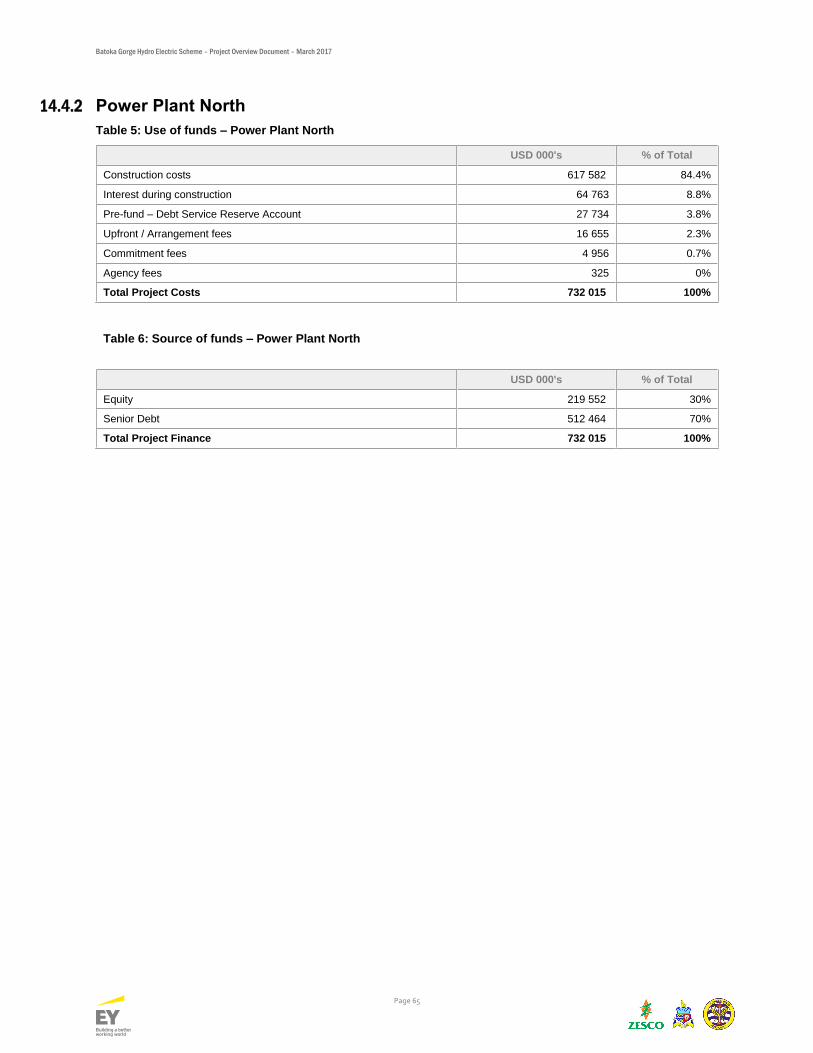
Batoka Gorge Hydro Electric Scheme – Project Overview Document – March 2017
Page 65
14.4.2 Power Plant North
Table 5: Use of funds – Power Plant North
USD 000's % of Total
Construction costs 617 582 84.4%
Interest during construction 64 763 8.8%
Pre-fund – Debt Service Reserve Account 27 734 3.8%
Upfront / Arrangement fees 16 655 2.3%
Commitment fees 4 956 0.7%
Agency fees 325 0%
Total Project Costs 732 015 100%
Table 6: Source of funds – Power Plant North
USD 000's % of Total
Equity 219 552 30%
Senior Debt 512 464 70%
Total Project Finance 732 015 100%

Batoka Gorge Hydro Electric Scheme – Project Overview Document – March 2017
Page 66
14.4.3 Power Plant South
Table 7: Uses of funds – Power Plant South
USD 000's % of Total
Construction costs 617 582 84.4%
Interest during construction 64 754 8.8%
Pre-fund – Debt Service Reserve Account 27 730 3.8%
Upfront / Arrangement fees 16 653 2.3%
Commitment fees 4 955 0.7%
Agency fees 325 0%
Total Project Costs 732 015 100%
Table 8: Source of funds – Power Plant South
USD 000's % of Total
Equity 219 606 30%
Senior Debt 512 394 70%
Total Project Finance 732 015 100%
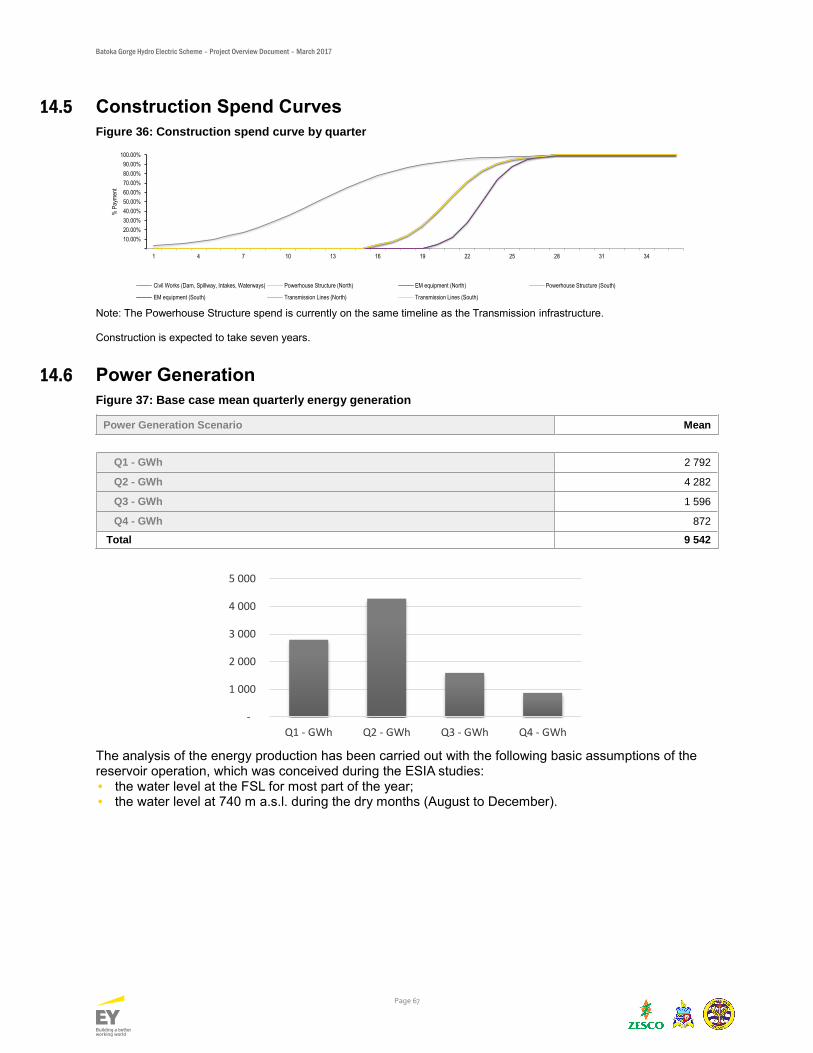
Batoka Gorge Hydro Electric Scheme – Project Overview Document – March 2017
Page 67
14.5 Construction Spend Curves
Figure 36: Construction spend curve by quarter
Note: The Powerhouse Structure spend is currently on the same timeline as the Transmission infrastructure. Construction is expected to take seven years.
14.6 Power Generation
Figure 37: Base case mean quarterly energy generation
Power Generation Scenario Mean
Q1 - GWh 2 792
Q2 - GWh 4 282
Q3 - GWh 1 596
Q4 - GWh 872
Total 9 542
The analysis of the energy production has been carried out with the following basic assumptions of the reservoir operation, which was conceived during the ESIA studies: • the water level at the FSL for most part of the year; • the water level at 740 m a.s.l. during the dry months (August to December).
10.00%
20.00%
30.00%
40.00%
50.00%
60.00%
70.00%
80.00%
90.00%
100.00%
1 4 7 10 13 16 19 22 25 28 31 34
% P
aym
ent
Civil Works (Dam, Spillway, Intakes, Waterways) Powerhouse Structure (North) EM equipment (North) Powerhouse Structure (South)
EM equipment (South) Transmission Lines (North) Transmission Lines (South)
-
1 000
2 000
3 000
4 000
5 000
Q1 - GWh Q2 - GWh Q3 - GWh Q4 - GWh
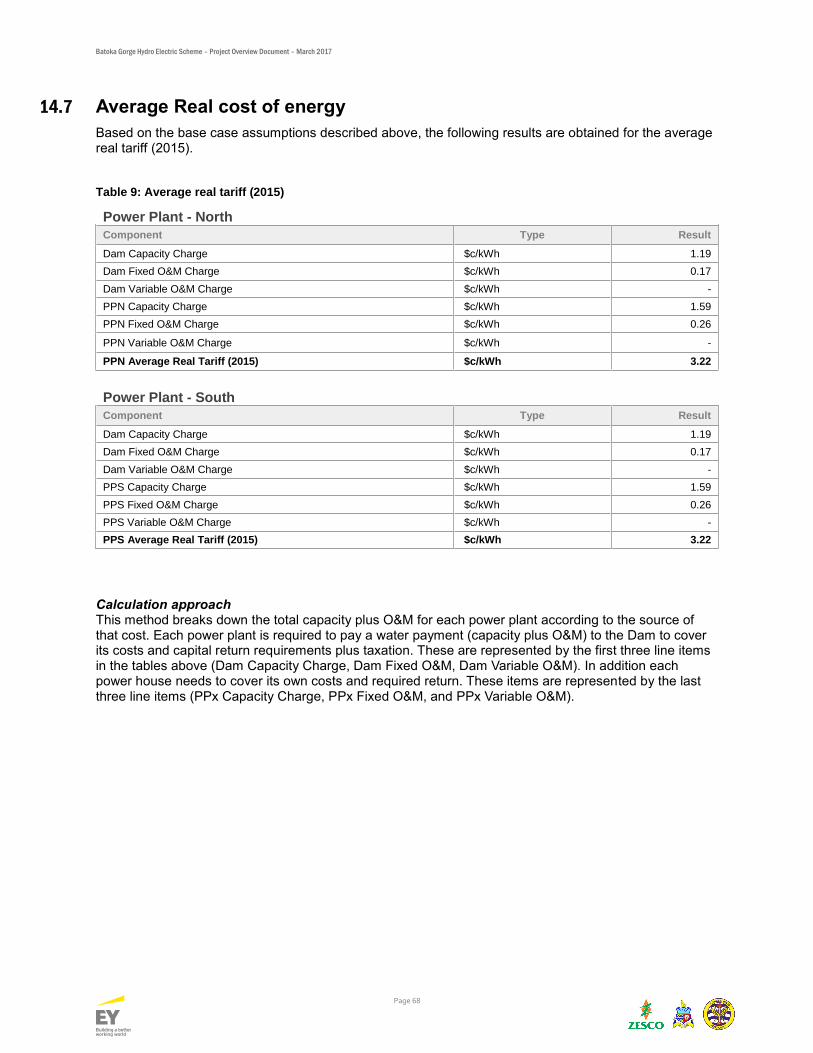
Batoka Gorge Hydro Electric Scheme – Project Overview Document – March 2017
Page 68
14.7 Average Real cost of energy
Based on the base case assumptions described above, the following results are obtained for the average real tariff (2015).
Table 9: Average real tariff (2015)
Power Plant - North Component Type Result
Dam Capacity Charge $c/kWh 1.19
Dam Fixed O&M Charge $c/kWh 0.17
Dam Variable O&M Charge $c/kWh -
PPN Capacity Charge $c/kWh 1.59
PPN Fixed O&M Charge $c/kWh 0.26
PPN Variable O&M Charge $c/kWh -
PPN Average Real Tariff (2015) $c/kWh 3.22
Power Plant - South Component Type Result
Dam Capacity Charge $c/kWh 1.19
Dam Fixed O&M Charge $c/kWh 0.17
Dam Variable O&M Charge $c/kWh -
PPS Capacity Charge $c/kWh 1.59
PPS Fixed O&M Charge $c/kWh 0.26
PPS Variable O&M Charge $c/kWh -
PPS Average Real Tariff (2015) $c/kWh 3.22
Calculation approach This method breaks down the total capacity plus O&M for each power plant according to the source of that cost. Each power plant is required to pay a water payment (capacity plus O&M) to the Dam to cover its costs and capital return requirements plus taxation. These are represented by the first three line items in the tables above (Dam Capacity Charge, Dam Fixed O&M, Dam Variable O&M). In addition each power house needs to cover its own costs and required return. These items are represented by the last three line items (PPx Capacity Charge, PPx Fixed O&M, and PPx Variable O&M).