Embed Size (px)
Citation preview
STATE OF CALIFORNIA DEPARTMENT OF TRANSPORTATION
DIVISION OF RESEARCH AND INNOVATION OFFICE OF MATERIALS AND INFRASTRUCTURE
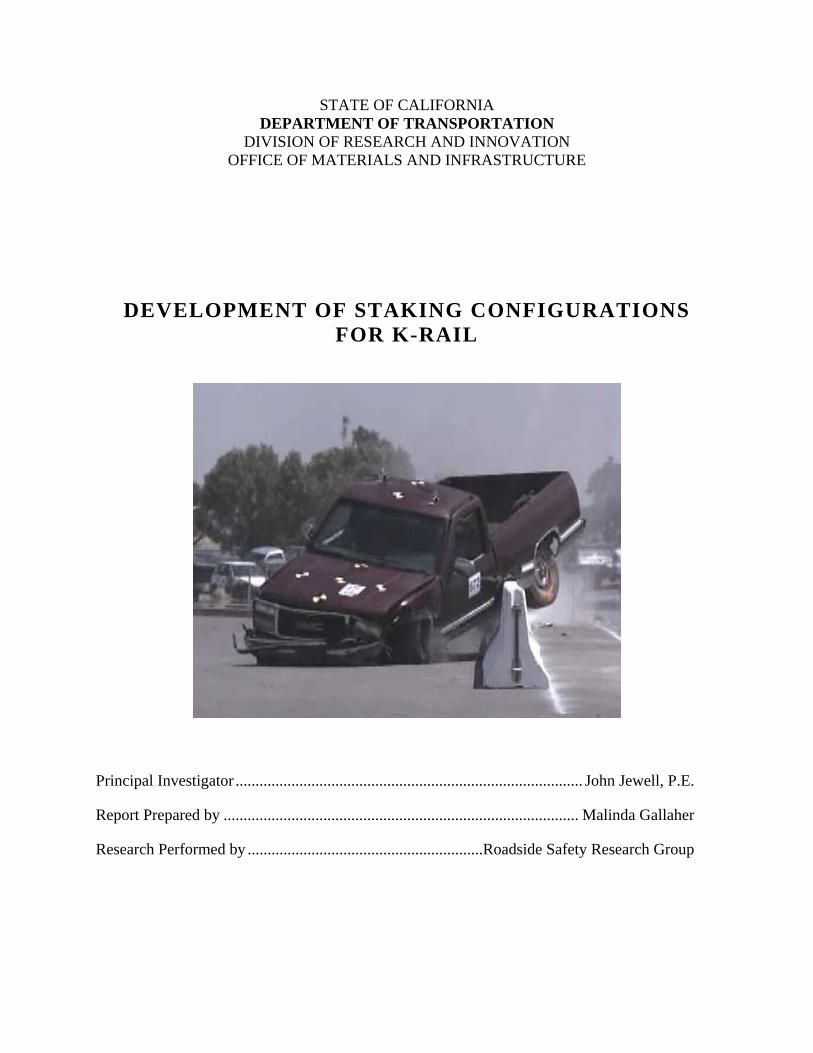
DEVELOPMENT OF STAKING CONFIGURATIONS FOR K-RAIL
Principal Investigator ....................................................................................... John Jewell, P.E.
Report Prepared by ......................................................................................... Malinda Gallaher
Research Performed by ...........................................................Roadside Safety Research Group

STATE OF CALIFORNIA
DEPARTMENT OF TRANSPORTATION DIVISION OF RESEARCH AND INNOVATION
OFFICE OF MATERIALS AND INFRASTRUCTURE
DEVELOPMENT OF STAKING CONFIGURATIONS FOR K-RAIL
Supervised by............................................................................................Robert Meline, P.E.
Principal Investigator ................................................................................... John Jewell, P.E.
Report Prepared by ...................................................................................... Malinda Gallaher
Research Performed by ........................................................Roadside Safety Research Group

i
1. REPORT NO.
FHWA/CA/MI-2006/21
2. GOVERNMENT ACCESSION NO.
3. RECIPIENT'S CATALOG NO.
4. TITLE AND SUBTITLE
DEVELOPMENT OF STAKING CONFIGURATIONS FOR K-RAIL
5. REPORT DATE
December 2008 6. PERFORMING ORGANIZATION CODE
7. AUTHOR(S)
Malinda Gallaher
8. PERFORMING ORGANIZATION REPORT NO.
65-680928
9. PERFORMING ORGANIZATION NAME AND ADDRESS Roadside Safety Research Group California Department of Transportation 5900 Folsom Blvd., Sacramento, CA. 95819
10. WORK UNIT NO.
11. CONTRACT OR GRANT NO.
12. SPONSORING AGENCY NAME AND ADDRESS California Department of Transportation 5900 Folsom Blvd., Sacramento CA. 95819
13. TYPE OF REPORT & PERIOD COVERED
Final 14. SPONSORING AGENCY CODE
15. SUPPLEMENTARY NOTES
This project was performed in cooperation with the US Department of Transportation, Federal Highway Administration, under the research project titled “DEVELOPMENT OF STAKING CONFIGURATIONS FOR K-RAIL.”
16. ABSTRACT
Full-scale crash testing was conducted on various staking configurations for pre-cast concrete barrier (California K-rail). The staking configurations tested were developed in effort to optimize cost and worker safety. Testing was conducted in accordance with NCHRP Report 350. The tested barriers consisted of twelve or thirteen concrete segments, each 6045 mm (20 ft) in length. The segments were placed on 125-mm (5-in) AC pavement and connected together with 31.8 x 660 - mm (1.25 x-26 in) pins. Each segment was secured to the ground using 25 x 610-mm (24-in) stakes either uncapped or capped. The tests were performed at the Caltrans Dynamic Test Facility in West Sacramento, California. A total of six crash tests were conducted under Report 350 Test Level 3-11. Two testing groups were established: K-rail as a median barrier and K-rail adjacent to an excavation. Each group was tested under three staking configurations. One test from the median barrier group and two tests from the excavation group were within the limits of Report 350 Test Level 3-11. It is recommended that staked K-rail be approved for use on California State highways when the following conditions are present:
1. When K-rail is placed as a semi-permanent median barrier with less than 610 mm (2 ft) from the edge of travel way in both directions, use four capped stakes per section every other section.
2. When K-rail is placed less than 610 mm (2 ft) from the edge of an excavation, use two capped stakes per section along the traffic side. The distance between the K-rail and excavation must be a minimum of 75 mm (3 in).
17. KEY WORDS
K-rail, Type K, Type 50, Temporary Barriers, Safety Shape Barrier, Crash Test, Staking, Stake, New Jersey Shape, Temporary Railing, Tie-down, Anchored Barrier
18. DISTRIBUTION STATEMENT
No Restrictions. This document is available through the National Technical Information Service, Springfield, VA 22161
19. SECURITY CLASSIF. (OF THIS REPORT)
Unclassified
20. SECURITY CLASSIF. (OF THIS PAGE)
Unclassified 21. NO. OF PAGES
129
22. PRICE

ii
NOTICE
The contents of this report reflect the views of Roadside Safety Research Group, which is responsible for the facts and the accuracy of the data presented herein. The contents do not necessarily reflect the official views or policies of the State of California or the Federal Highway Administration. This report does not constitute a standard specification or regulation.
Neither the State of California nor the United States Government endorses products or manufacturers. Trade or manufacturers' names appear herein only because they are considered essential to the object of this document.

iii
English to Metric System (SI) of Measurement
SI CONVERSION FACTORS
To Convert From To Multiply By
ACCELERATION m/s2 ft/s2 3.281
AREA m2 ft2 10.764
ENERGY Joule (J) ft.lbf 0.7376
FORCE Newton (N) lbf 0.2248
LENGTH m ft 3.281 m in 39.37 cm in 0.3937 mm in 0.03937
MASS kg lbm 2.205
PRESSURE OR STRESS kPa psi 0.1450
VELOCITY km/h mph 0.6214 m/s ft/s 3.281 km/h ft/s 0.9113
VOLUME liters gal 0.2642

iv
ACKNOWLEDGMENTS
This work was accomplished in cooperation with the United States Department of Transportation, Federal Highway Administration.
Special appreciation is due to the following staff members of Materials Engineering and Testing Services (METS) and the Division of Research and Innovation (DRI) for their help on this project:
John Jewell, Robert Meline, Larry Moore, Mike O’Keeffe, David Whitesel, and Ali Zalekian - test preparation, data reduction, vehicle preparation, and film processing; Eric Jacobson, and Ed Ung - electronic instrumentation; and Bill Poroshin, Mike Said, and Martin Zanotti - machine shop services. Thanks also to Dave Bengel, Independent Camera Operator.
Other persons from Caltrans who made important contributions include:
Project Committee Members – Janice Benton (Traffic Operations), Greg Berry (HQ Construction), Ray Estakhri (Traffic Operations), Gary Gauthier (Roadside Safety and Research), Randy Hiatt (Traffic Operations), Celso Izquierdo (HQ Construction), Ken Kochevar (FHWA), and Matt Schmitz (FHWA).
From Headquarters Photography - Don Tateishi.
Engineering Student Assistants - Jon Nguyen, Ron Phoebus, Brian Icban, and Brent Norton.

v
TABLE OF CONTENTS 1. INTRODUCTION..............................................................................................................................................1
1.1. Problem ......................................................................................................................................................1 1.2. Objective ....................................................................................................................................................1 1.3. Background and Significance of Work.......................................................................................................1 1.4. Literature Search ........................................................................................................................................2 1.5. Scope ..........................................................................................................................................................2
2. TECHNICAL DISCUSSION ............................................................................................................................4 2.1. Test Conditions – Crash Tests ....................................................................................................................4
2.1.1. Test Facilities.........................................................................................................................................4 2.1.2. Test Article Design ................................................................................................................................5
2.1.2.1. K-rail ............................................................................................................................................5 2.1.2.2. Stakes ...........................................................................................................................................6 2.1.2.3. Stake Configurations ....................................................................................................................7
Figure 2-5. Staking Configurations Layout ........................................................................................................8 2.1.3. Test Vehicles ..........................................................................................................................................9 2.1.4. Data Acquisition System ......................................................................................................................10
2.2. Test Results – Crash Tests........................................................................................................................10 2.2.1. Test 671 – Median Layout: 2 Uncapped Stakes per Barrier................................................................10
2.2.1.1. Impact Description/Vehicle Behavior ........................................................................................10 2.2.1.2. Barrier Damage ..........................................................................................................................13 2.2.1.3. Vehicle Damage .........................................................................................................................15 2.2.1.4. Test 671 Data Summary Sheet ...................................................................................................17
2.2.2. Test 672 – Median Layout: 4 Uncapped Stakes per Every Other Barrier ...........................................18 2.2.2.1. Impact Description/Vehicle Behavior ........................................................................................18 2.2.2.2. Barrier Damage ..........................................................................................................................21 2.2.2.3. Vehicle Damage .........................................................................................................................23 2.2.2.4. Test 672 Data Summary Sheet ...................................................................................................25
2.2.3. Test 673 - Median Layout: 4 Capped Stakes per Every Other Barrier................................................26 2.2.3.1. Impact Description/Vehicle Behavior ........................................................................................26 2.2.3.2. Barrier Damage ..........................................................................................................................29 2.2.3.3. Vehicle Damage .........................................................................................................................31 2.2.3.4. Test 673 Data Summary Sheet ...................................................................................................33
2.2.4. Test 674 – Excavation Layout: 4 Capped Stakes per Every Other Barrier .........................................34 2.2.4.1. Impact Description/Vehicle Behavior ........................................................................................34 2.2.4.2. Barrier Damage ..........................................................................................................................36 2.2.4.3. Vehicle Damage .........................................................................................................................40 2.2.4.4. Test 674 Data Summary Sheet ...................................................................................................42
2.2.5. Test 675 – Excavation Layout: 2 Capped Stakes per Barrier on Traffic Side .....................................43 2.2.5.1. Impact Description/Vehicle Behavior ........................................................................................43 2.2.5.2. Barrier Damage ..........................................................................................................................45 2.2.5.3. Vehicle Damage .........................................................................................................................47 2.2.5.4. Test 675 Data Summary Sheet ...................................................................................................49
2.2.6. Test 676 – 1 Capped Stake per Barrier................................................................................................50 2.2.6.1. Impact Description/Vehicle Behavior ........................................................................................50 2.2.6.2. Barrier Damage ..........................................................................................................................53 2.2.6.3. Vehicle Damage .........................................................................................................................54 2.2.6.4. Test 676 Data Summary Sheet ...................................................................................................56
2.3. Discussion of Test Results........................................................................................................................57 2.3.1. Structural Adequacy ............................................................................................................................57
2.3.1.1. Median Barrier Configurations ..................................................................................................57 2.3.1.2. Adjacent to Excavation Configurations......................................................................................57
2.3.2. Occupant Risk......................................................................................................................................58

vi
2.3.2.1. Median Barrier Configurations ..................................................................................................58 2.3.2.2. Adjacent to Excavation Configurations......................................................................................58
2.3.3. Vehicle Trajectory ...............................................................................................................................58 2.3.3.1. Median Barrier Configurations ..................................................................................................58 2.3.3.2. Adjacent to Excavation Configurations......................................................................................58
3. CONCLUSIONS ..............................................................................................................................................66
4. RECOMMENDATIONS.................................................................................................................................67
5. IMPLEMENTATION .....................................................................................................................................68
6. REFERENCES.................................................................................................................................................69
7. APPENDIX.......................................................................................................................................................70 7.1. Test Vehicle..............................................................................................................................................70
7.1.1. Equipment ............................................................................................................................................70 7.1.2. Vehicle Parameters..............................................................................................................................71
7.2. Guidance System......................................................................................................................................77 7.3. Photo Instrumentation...............................................................................................................................78 7.4. Video Analysis .........................................................................................................................................81 7.5. Detailed Drawings of Test Article ............................................................................................................82 7.6. Test Article Installation ............................................................................................................................86 7.7. Electronic Instrumentation and Data ........................................................................................................87
7.7.1. Instrumentation....................................................................................................................................87 7.7.2. Data .....................................................................................................................................................89

vii
LIST OF FIGURES
Figure 2-1. Asphalt Concrete Thickness........................................................................................................................4 Figure 2-2. K-rail Rebar Placement..............................................................................................................................5 Figure 2-3. Uncapped Stake .........................................................................................................................................6 Figure 2-4. Capped Stake .............................................................................................................................................6 Figure 2-5. Staking Configurations Layout ..................................................................................................................8 Figure 2-6. Test 671 - Side View of Vehicle Pre-Impact ...........................................................................................11 Figure 2-7. Test 671 - Vehicle at Impact Location Pre-Impact ..................................................................................11 Figure 2-8. Test 671 - Close-up view of Vehicle at Impact Location Pre-Impact ......................................................12 Figure 2-9. Test 671 - Barrier Pre-Impact ..................................................................................................................12 Figure 2-10. Test 671 - Barrier Static Displacements [mm].......................................................................................13 Figure 2-11. Test 671 - Downstream View of Barrier Post-Impact............................................................................13 Figure 2-12. Test 671 - Impact Location Post-Impact ................................................................................................14 Figure 2-13. Test 671 - Section 6 Upstream Stake Post-Impact .................................................................................14 Figure 2-14. Test 671 - Side View of Vehicle Post-Impact........................................................................................15 Figure 2-15. Test 671 – Front-left View of Vehicle Post-Impact ...............................................................................16 Figure 2-16. Test 671 - Front-right View of Vehicle Post-Impact .............................................................................16 Figure 2-17. Test 671 - Impact sequence and diagram...............................................................................................17 Figure 2-18. Test 672 - Side View of Vehicle Pre-Impact .........................................................................................18 Figure 2-19. Test 672 - Vehicle at Impact Location Pre-Impact ................................................................................19 Figure 2-20. Test 672 - Close-up View of Vehicle at Impact Location......................................................................19 Figure 2-21. Test 672 - Barrier Pre-Impact ................................................................................................................20 Figure 2-22. Test 672 - Stake #6B Pre-Impact ...........................................................................................................20 Figure 2-23. Test 672 - Barrier Static Displacements [mm].......................................................................................21 Figure 2-24. Test 672 - Downstream View of Barrier Post-Impact............................................................................21 Figure 2-25. Test 672 - Impact Point Post-Impact......................................................................................................22 Figure 2-26. Test 672 - Stake #6B Post-Impact..........................................................................................................22 Figure 2-27. Test 672 - Scuffing on the Backside of the Barrier ................................................................................23 Figure 2-28. Test 672 - Side View of Vehicle Post-Impact........................................................................................23 Figure 2-29. Test 672 - Front-left View of Vehicle Post-Impact................................................................................24 Figure 2-30. Test 672 - Impact sequence and diagram...............................................................................................25 Figure 2-31. Test 673 - Side View of Vehicle Pre-Impact .........................................................................................26 Figure 2-32. Test 673 - Vehicle at Impact Location Pre-Impact ................................................................................27 Figure 2-33. Test 673 - Close-up View of Vehicle at Impact Location Pre-Impact ...................................................27 Figure 2-34. Test 673 - Barrier Pre-Impact ................................................................................................................28 Figure 2-35. Test 673 - Stake #6B Pre-Impact ...........................................................................................................28 Figure 2-36. Test 673 - Barrier Static Displacements [mm].......................................................................................29 Figure 2-37. Test 673 - Downstream View of Barrier Post-Impact............................................................................29 Figure 2-38. Test 673 - Impact Point Post-Impact......................................................................................................30 Figure 2-39. Test 673 - Stake #6B Post-Impact..........................................................................................................30 Figure 2-40. Test 673 - Side View of Vehicle Post-Impact........................................................................................31 Figure 2-41. Test 673 - Front-left View of Vehicle Post-Impact................................................................................32 Figure 2-42. Test 673 - Barrier Involved with Secondary Impact ..............................................................................32 Figure 2-43. Test 673 - Impact sequence and diagram...............................................................................................33 Figure 2-44. Test 674 - Side View of Vehicle Pre-Impact .........................................................................................34 Figure 2-45. Test 674 - Vehicle at Impact Location Pre-Impact ................................................................................35 Figure 2-46. Test 674 - Close-up View of Vehicle at Impact Location......................................................................35 Figure 2-47. Test 674 - Barrier Pre-Impact ................................................................................................................36 Figure 2-48. Test 674 - Overall View of Excavation..................................................................................................36 Figure 2-49. Test 674 - Barrier Static Displacements [mm].......................................................................................37 Figure 2-50. Test 674 - Downstream View of Barrier Post-Impact............................................................................37 Figure 2-51. Test 674 - Impact Point Post-Impact......................................................................................................38 Figure 2-52. Test 674 – Upstream, Impact-side Stake in Section 8 Post-Impact........................................................38 Figure 2-53. Test 674 - Back of Barrier Post-Impact .................................................................................................39

viii
Figure 2-54. Test 674 - Damaged Pavement from Rear Stake ...................................................................................39 Figure 2-55. Test 674 - Pavement Damage after Barrier Removal.............................................................................40 Figure 2-56. Test 674 - Side View of Vehicle Post-Impact........................................................................................40 Figure 2-57. Test 674 - Front-right View of Vehicle Post-Impact .............................................................................41 Figure 2-58. Test 674 - Impact sequence and diagram...............................................................................................42 Figure 2-59. Test 675 - Side View of Vehicle Pre-Impact .........................................................................................43 Figure 2-60. Test 675 - Vehicle at Impact Location Pre-Impact ................................................................................44 Figure 2-61. Test 675 - Close-up View of Vehicle at Impact Location......................................................................44 Figure 2-62. Test 675 - Barrier Pre-Impact ................................................................................................................45 Figure 2-63. Test 675 - Barrier Static Displacements [mm].......................................................................................45 Figure 2-64. Test 675 - Downstream View of Barrier Post-Impact............................................................................46 Figure 2-65. Test 675 - Barrier over Excavation ........................................................................................................46 Figure 2-66. Test 675 - Impact Point Post-Impact......................................................................................................47 Figure 2-67. Test 675 - Stake at Impact Point ............................................................................................................47 Figure 2-68. Test 675 - Stake Downstream from Impact Point ..................................................................................47 Figure 2-69. Test 675 - Side View of Vehicle Post-Impact........................................................................................48 Figure 2-70. Test 675 - Front-right View of Vehicle Post-Impact .............................................................................48 Figure 2-71. Test 675 - Impact sequence and diagram...............................................................................................49 Figure 2-72. Test 676 - Side View of Vehicle Pre-Impact .........................................................................................51 Figure 2-73. Test 676 - Vehicle at Impact Location Pre-Impact ................................................................................51 Figure 2-74. Test 676 - Close-up View of Vehicle at Impact Location......................................................................52 Figure 2-75. Test 676 - Barrier Pre-Impact ................................................................................................................52 Figure 2-76. Test 676 - Barrier Static Displacements [mm].......................................................................................53 Figure 2-77. Test 676 - Downstream View of Barrier Post-Impact............................................................................53 Figure 2-78. Test 676 - Impact Point Post-Impact......................................................................................................54 Figure 2-79. Test 676 - Stake Downstream of Impact Point.......................................................................................54 Figure 2-80. Test 676 - Vehicle Post-Impact Front View...........................................................................................55 Figure 2-81. Test 676 - Vehicle Post-Impact Side View ............................................................................................55 Figure 2-82. Test 676 - Impact sequence and diagram...............................................................................................56 Figure 7-1. Guidance System .....................................................................................................................................77 Figure 7-2. Typical Camera Locations and Labels .....................................................................................................78 Figure 7-3. K-rail Standard Plan (2004) .....................................................................................................................82 Figure 7-4. Typical Uncapped Stake Installation Layout ...........................................................................................83 Figure 7-5. Typical Capped Stake Installation Layout ...............................................................................................84 Figure 7-6. Capped Stake Dimensions [mm]..............................................................................................................85 Figure 7-7. Stake Installation......................................................................................................................................86 Figure 7-8. Forklift Carrying K-rail............................................................................................................................86 Figure 7-9. Installed Uncapped Stake.........................................................................................................................86 Figure 7-10. Installed Capped Stake...........................................................................................................................86 Figure 7-11. Instrumentation Layout ..........................................................................................................................87 Figure 7-12. Vehicle Accelerometer and Gyro Sign Convention ...............................................................................89 Figure 7-13. Test 671 Vehicle Accelerations Vs Time...............................................................................................90 Figure 7-14. Test 671 Vehicle Longitudinal Acceleration, Velocity, and Distance Vs Time ....................................91 Figure 7-15. Test 671 Vehicle Lateral Acceleration, Velocity, and Distance Vs Time..............................................92 Figure 7-16. Test 671 Acceleration Severity Index Vs Time .....................................................................................93 Figure 7-17. Test 671 Vehicle Roll, Pitch, and Yaw Vs Time ...................................................................................94 Figure 7-18. Test 672 Vehicle Accelerations Vs Time...............................................................................................95 Figure 7-19. Test 672 Vehicle Longitudinal Acceleration, Velocity, and Distance Vs Time ....................................96 Figure 7-20. Test 672 Vehicle Lateral Acceleration, Velocity, and Distance Vs Time..............................................97 Figure 7-21. Test 672 Vehicle Roll, Pitch, and Yaw Vs Time ...................................................................................98 Figure 7-22. Test 672 Acceleration Severity Index Vs Time .....................................................................................99 Figure 7-23. Test 673 Vehicle Accelerations Vs Time.............................................................................................100 Figure 7-24. Test 673 Vehicle Longitudinal Acceleration, Velocity, and Distance Vs Time ..................................101 Figure 7-25. Test 673 Vehicle Lateral Acceleration, Velocity, and Distance Vs Time............................................102 Figure 7-26. Test 673 Vehicle Roll, Pitch, and Yaw Vs Time .................................................................................103 Figure 7-27. Test 673 Acceleration Severity Index Vs Time ...................................................................................104

ix
Figure 7-28. Test 674 Vehicle Longitudinal Acceleration, Velocity, and Distance Vs Time ..................................105 Figure 7-29. Test 674 Vehicle Accelerations Vs Time.............................................................................................106 Figure 7-30. Test 674 Vehicle Lateral Acceleration, Velocity, and Distance Vs Time............................................107 Figure 7-31. Test 674 Vehicle Roll, Pitch, and Yaw Vs Time .................................................................................108 Figure 7-32. Test 674 Acceleration Severity Index Vs Time ...................................................................................109 Figure 7-33. Test 675 Acceleration Severity Index Vs Time ...................................................................................110 Figure 7-34. Test 675 Vehicle Roll, Pitch, and Yaw Vs Time .................................................................................111 Figure 7-35. Test 675 Vehicle Accelerations Vs Time.............................................................................................112 Figure 7-36. Test 675 Vehicle Lateral Acceleration, Velocity, and Distance Vs Time............................................113 Figure 7-37. Test 675 Vehicle Longitudinal Acceleration, Velocity, and Distance Vs Time ..................................114 Figure 7-38. Test 676 Vehicle Accelerations Vs Time.............................................................................................115 Figure 7-39. Test 676 Vehicle Longitudinal Acceleration, Velocity, and Distance Vs Time ..................................116 Figure 7-40. Test 676 Vehicle Lateral Acceleration, Velocity, and Distance Vs Time............................................117 Figure 7-41. Test 676 Vehicle Roll, Pitch, and Yaw Vs Time .................................................................................118 Figure 7-42. Test 676 Acceleration Severity Index Vs Time ...................................................................................119

x
LIST OF TABLES Table 1-1. Target Impact Conditions.............................................................................................................................3 Table 2-1. Test Vehicle Masses....................................................................................................................................9 Table 2-2. Test 671 Assessment Summary.................................................................................................................59 Table 2-3. Test 672 Assessment Summary.................................................................................................................60 Table 2-4. Test 673 Assessment Summary.................................................................................................................61 Table 2-5. Test 674 Assessment Summary.................................................................................................................62 Table 2-6. Test 675 Assessment Summary.................................................................................................................63 Table 2-7. Test 676 Assessment Summary.................................................................................................................64 Table 2-8. Vehicle Trajectory, Speed and Impact Severity ........................................................................................65 Table 2-9. Tolerances for Impact Angle, Velocity and Severity ................................................................................65 Table 7-1. Test 671 Vehicle Dimensions....................................................................................................................71 Table 7-2. Test 672 Vehicle Dimensions....................................................................................................................72 Table 7-3. Test 673 Vehicle Dimensions....................................................................................................................73 Table 7-4. Test 674 Vehicle Dimensions....................................................................................................................74 Table 7-5. Test 675 Vehicle Dimensions....................................................................................................................75 Table 7-6. Test 676 Vehicle Dimensions....................................................................................................................76 Table 7-7. Camera Type .............................................................................................................................................78 Table 7-8. Camera Locations for Test 671 through Test 673 .....................................................................................79 Table 7-9. Camera Locations for Test 674 through Test 676 .....................................................................................80 Table 7-10. Accelerometer and Gyro Specifications ..................................................................................................88

1 INTRODUCTION
1
1. INTRODUCTION
1.1. Problem The current policy for the staking of K-rail is not consistent with the current
understanding of how K-rail reacts during vehicular impacts. Efforts to develop a new policy for staking K-rail during construction have been met with concern over cost-effectiveness and crash-worthiness issues. A new configuration for staked K-rail that passes NCHRP Report 350 guidelines [1] must be developed to provide the safest alternative for the traveling public and construction personnel with minimal deployment cost.
1.2. Objective This research project focuses on developing a cost-effective staking configuration for K-
rail, which meets NCHRP Report 350 Test Level 3 for longitudinal barriers and the needs of Caltrans’ Traffic Operations and Construction. Traffic Operations requested a staking configuration to use when K-rail is placed as a median barrier in narrow medians. Construction requested a configuration that meets two criteria: place K-rail near the edge of an excavation and minimize the distance between the K-rail and the excavation. In addition, both groups requested that the staking configurations minimize barrier movement, pavement damage, and worker exposure.
1.3. Background and Significance of Work Caltrans’ current standard for portable concrete barrier is K-rail. This barrier may be
used in long-term installations when properly installed [2]. K-rail evolved from the Type 50 (“New Jersey shape”) median barrier, which has been approved for use in California and other states since the mid-1960s. By 1971, substantial interest was expressed in California and other states to develop a movable barrier that could be used in work zones. In 1972, Caltrans ran a series of crash tests on K-rail. The test results led to the approval of K-rail for use as a temporary barrier in California. The K-rail that has become the standard consists of 6.1-ma (20-ft) long sections with pin and loop connections, each weighing approximately 3630 kg (8000 lbs).
In 1999, Caltrans tested fully staked K-rail for temporary installations, and the results showed that fully staked K-rail greatly reduced lateral barrier movement [3]. Traffic Operations issued a Policy Directive on 1/18/2002 that required K-rail to be staked when it was placed near the edge of travel way and/or near the edge of an excavation. However, the policy was rescinded on 3/15/2002 due to the increased traffic exposure for construction workers during stake installation, damage to the pavement, and increased cost of traffic control. This research project was established to address the concerns listed above. The results of this research will lead to new policy that outlines the minimum guidelines for temporary K-rail installations.
a Metric units are used for measurements taken for NCHRP Report 350 evaluation criteria. Dual units (Metric followed by U.S. Customary) are used for measurements related to the test article.

1 INTRODUCTION
2
1.4. Literature Search A search for information about staked K-rail consisted of information contained in past
crash test reports by Caltrans and other agencies. Information was found in: • Compliance Crash Testing of K-rail Used in Semi-Permanent Installations,
FHWA/CA/OR-99/07 [3] • Dynamic Tests of Prestressed Concrete Median Barrier Type 50, Series XXVI, CA-HY-
MR-6588-1-73-06 [4] • Crash Test Results for the Idaho 6095-mm Concrete Barrier [5] • “Tie-Downs and Transitions for Temporary Concrete Barriers,” Journal of the
Transportation Research Board, No. 1984 [6]
1.5. Scope A total of six tests were performed and evaluated in accordance to NCHRP Report 350.
The first three tests evaluated K-rail when placed as a semi-permanent median barrier and the last three evaluated K-rail when place adjacent to an excavation. The testing matrix established for this project is shown in Table 1-1 on the proceeding page.

1 INTRODUCTION
3
Table 1-1. Target Impact Conditions
NCHRP REPORT 350
Test # STAKE CONFIGURATION
Vehicle
Mass [kg]
(lbm)
Impact
Speed [km/h]
(mph)
Impact
Angle [deg]
Test
Designation Vehicle
K-RAIL PLACED AS A SEMI-PERMANENT BARRIER
671 2 uncapped stakes in opposite corners, upstream relative to the traffic flow.
2000
(4410)
100
(62.1) 25 3-11 2000P
672 4 uncapped stakes per section, every other section.
2000
(4410)
100
(62.1) 25 3-11 2000P
673 4 capped stakes per section, every other section.
2000
(4410) 100 25 3-11 2000P
K-RAIL PLACED ADJACENT TO AN EXCAVATION
674
4 capped stakes per section, every other section with the barrier offset by 152mm (6 in) from the excavation’s edge.
2000
(4410)
100
(62.1) 25 3-11 2000P
675
2 capped stakes per section, traffic side with the barrier offset by 76mm (3 in) from the excavation’s edge.
2000
(4410)
100
(62.1) 25 3-11 2000P
676
1 capped stake per section, traffic side, upstream relative to traffic with the barrier offset by 76mm (3 in) from the excavation’s edge.
2000
(4410)
100
(62.1) 25 3-11 2000P

2 TECHNICAL DISCUSSION
4
2. TECHNICAL DISCUSSION
2.1. Test Conditions – Crash Tests
2.1.1. Test Facilities All of the crash tests were conducted at the Caltrans Dynamic Test Facility in West
Sacramento, California. The test area is a large, flat, asphalt concrete surface containing 2 overlays (Figure 2-1). Each overlay measured approximately 51 mm (2 in) thick. There were no obstructions near or within the testing area.
Figure 2-1. Asphalt Concrete Thickness

2 TECHNICAL DISCUSSION
5
2.1.2. Test Article Design
2.1.2.1. K-rail The K-rail was purchased new at Concrete Products in Tracy, CA. The K-rail was
manufactured to Caltrans’ Standard Plans and Specifications. Members of the Roadside Safety and Research Group visited the plant to inspect the K-rail. They evaluated the construction process, collected concrete samples for testing, measured the concrete temperature, performed a slump test, and checked the rebar placement (Figure 2-2).
Sampling cylinders were prepared for later testing of the compressive strength of the concrete. Three cylinders were sent for testing to the concrete testing section at the Caltrans Transportation Laboratory. The 28-day average compressive strength was found to be 29,160 kPa (4230 psi). The results from all tests and inspections met or exceeded Caltrans’ 2004 Standard Specifications. The 2004 K-rail Standard Plan is located in Section 7.5 of the Appendix.
Figure 2-2. K-rail Rebar Placement

2 TECHNICAL DISCUSSION
6
2.1.2.2. Stakes
2.1.2.2.1. Stake Description The stakes originally selected were 610-mm (24-in) long, #25M (#8) deformed rebar of
ASTM A615 Grade 60 material (Figure 2-3). These parameters were selected for the following reasons:
1. Deformed bar (vs. smooth bar) to increase the uplift resistance. 2. 610-mm (24-in) length allows for quick installation. A longer length would consume
more installation time, and thus, would increase worker exposure. Additionally, a longer stake would not provide a significant amount of lateral resistance.
3. #25M (#8) rebar is the largest size that will fit through a K-rail staking slot. It provides greater to lateral displacement than smaller sizes.
4. ASTM A615 Grade 60 deformed rebar is a common material.
Figure 2-3. Uncapped Stake
For conservative results, the uncapped stakes were driven down until their heads were
flush with the K-rail slot’s horizontal surface. More details about the stakes and installation process are located in Sections 7.5 and 7.6.
Starting with Test 673, the stake design was modified to have a cap (Figure 2-4). This addition provided uplift resistance and prevented the K-rail from slipping over the stake when impacted. The uplift resistance was important since, without caps, the K-rail would rotate about the stakes opposite the impact side. The vehicle would then travel up the face of the barrier and be launched onto the top of the barrier.
The stake design changed to 610-mm (24-in) long, #25M (#8) deformed rebar of ASTM A706 Grade 60 material with a 70-mm (2.75-in) diameter by 13-mm (0.5-in) thick washer welded approximately 25 mm (1 in) below the top surface. Points were added to the stakes for Tests 674 – 676 for quicker installation. More information about stakes and the installation process is located in Sections 7.5 and 7.6.
Figure 2-4. Capped Stake
2 TECHNICAL DISCUSSION
7
2.1.2.3. Stake Configurations Two types of staking configurations were developed. The first configuration type is used
when K-rail is placed as a temporary median barrier. The second configuration type is used when K-rail is placed adjacent to an excavation during construction.
2.1.2.3.1. Median Configurations (Tests 671-673) The median configurations are symmetrically designed relative to the traffic flow. The
configurations are shown in top section of Figure 2-5. The staking configuration for Test 671 incorporated two uncapped stakes per barrier.
The stakes were placed in opposing corners in the slot that was upstream relative to the traffic’s flow. The critical impact point (CIP) was located 305 mm upstream from a joint to maximize the potential for vehicle roll and the barrier displacement.
The staking configuration for Test 672 incorporated four uncapped stakes in every other barrier. As in Test 671, the critical impact point was located 305 mm upstream from a joint on a staked section to maximize the vehicle’s roll and the barrier’s displacement.
The staking configuration for Test 673 incorporated four capped stakes in every other barrier. It was noted after Tests 671 and 672 that the uncapped stakes provided no uplift resistance for the barrier. Also, once the barrier lifted above the stake’s top edge, the stake provided no lateral resistance. Therefore, the configuration for Test 673 is the same as it was for Test 672, but capped stakes replaced uncapped stakes. Again, the critical impact point was located 305 mm upstream from a joint on a staked section to maximize the vehicle roll and the barrier displacement.
2.1.2.3.2. Adjacent to an Excavation Configurations (Tests 674-676) The adjacent-to-an-excavation configurations were designed to establish guidelines for
the minimum distance between the K-rail and an excavation and to minimize the lateral barrier movement. The excavation was approximately 610 mm deep. The configurations are shown in lower section of Figure 2-5.
The staking configuration for Test 674 incorporated four capped stakes in every other barrier. Since this configuration had a favorable result for Test 673, it was the first choice for the adjacent-to-an-excavation testing series. The barrier was placed 150 mm from the edge of the excavation. The critical impact point was located 914 mm upstream from a joint on a non-staked barrier segment to evaluate for potential vehicle snagging and to maximize the barrier displacement.
The staking configuration for Test 675 incorporated two capped stakes per barrier on the traffic side. It was noted from previous tests that the stakes that were located opposite of the impact side created a pivot point when the barrier was impacted. The pivot point would cause the barrier to rollback, which led to vehicle roll. The barrier was placed 75 mm from the edge of the excavation versus at the edge to account for varying edge conditions. The critical impact point was located 914 mm upstream from a joint to evaluate for potential vehicle snagging and to maximize the barrier displacement.
The staking configuration for Test 676 incorporated one capped stake per barrier in the traffic side’s upstream slot. It was designed to further reduce installation costs, pavement damage, and worker exposure. The barrier was placed 75 mm from the edge of the excavation

2 TECHNICAL DISCUSSION
8
versus at the edge to account for varying edge conditions. The critical impact point was located 305 mm upstream from a joint to maximize the barrier’s displacement.
Figure 2-5. Staking Configurations Layout

2 TECHNICAL DISCUSSION
9
2.1.3. Test Vehicles Most test vehicles complied with NCHRP Report 350 Test Designation 3-11 guidelines.
One vehicle was below the recommended test inertial massb. For all tests, the vehicles were ¾-ton pickups in good condition, free of major body damage and not missing any structural parts. All of the vehicles had front-mounted engines and standard equipment.
Table 2-1. Test Vehicle Masses
Test No. Vehicle Test Inertial
Units Model Year
Manufactured c Kg
(lbm)
671 GMC Sierra 2500 1992 1986.7
(4379.9)
672 GMC Sierra 2500 1993 1987.4
(4381.5)
673 Chevrolet 2500 1997 2016.3
(4445.2)
674 GMC Cheyenne 1989 1929.7b
(4254.3)
675 Chevrolet Silverado 1994 2005.9
(4422.2)
676 Chevrolet Silverado 1988 1981.0
(4367.4)
The test vehicles were self-powered and used a speed control device to limit acceleration
once the impact speed had been reached. Remote braking was possible at any time during all tests via a radio-linked, remote-controlled braking setup. A short distance before the point of
b The test inertial mass was less than the recommended test inertial mass range (2000 +/- 45 kg). The same conclusion for this test would have been made with a vehicle that was within the recommended test inertial mass range. c NCHRP Report 350 recommends that test vehicles be less than six years old at the time of testing. Although all of the vehicles were older than the recommended age limit, the body style of the 2500 pickup was the same from 1988 – 1998. In 1999 and 2000 the older body style was still available for new purchase.

2 TECHNICAL DISCUSSION
10
impact each vehicle was released from the guidance rail and the ignition system was deactivated. A detailed description of the test vehicle equipment and guidance system is contained in Sections 7.1 and 7.2 (located in the Appendix).
2.1.4. Data Acquisition System All tests were recorded with high-speed digital video cameras, one normal speed digital
video camera, and one digital SLR camera. The test vehicles and test articles were photographed before and after impact with a digital video camera and a digital SLR camera. A film report of this project was assembled using edited portions of the digital film and camera coverage. More detailed information on the cameras is located in Section 7.3.
Two sets of orthogonal accelerometers were mounted in the center of gravity of each vehicle. One set of rate gyro transducers was placed 191 mm (7.5 in) behind the set of accelerometers (along the X-axis) to measure the roll, pitch, and yaw rates. These data were used in calculating the occupant impact velocities, ridedown accelerations, and maximum vehicle rotation. More information on instrumentation is located in Section 7.7.1.
Two separate digital transient data recorders, manufactured by GMH Engineering (Model II), were used to record electronic data during all tests. The digital data were analyzed with custom DADiSP workbooks using a personal computer. The test data is located in the Appendix.
2.2. Test Results – Crash Tests
2.2.1. Test 671 – Median Layout: 2 Uncapped Stakes per Barrier
2.2.1.1. Impact Description/Vehicle Behavior The intended impact angle of 25° and impact location on the vehicle’s left-front corner
was set by the placement of the guide rail (Figure 2-7). Film analysis indicated that the actual impact angle was 28.3°, and the actual impact location was 93 mm upstream from the intended Critical Impact Point (CIP). The impact speed of 101.4 km/h (63.0 mph) was obtained by averaging the output from two independent speed traps located just upstream from the impact point. This speed was confirmed via film analysis. Upon impact the vehicle’s left front corner was crushed while the barrier rocked back and shifted laterally away from the impact. The vehicle rode upwards on the barrier during impact and stayed in contact for 3.2 m (10.5 ft). Approximately 0.29 s after impact the left rear tire lost contact with the barrier, and the vehicle was in the air. The vehicle rolled to the right (positive), and its right front tire landed on the ground 14.1 m (46.3 ft) from the CIP and 0.61 s after the initial impact. The vehicle’s undercarriage landed on top of the barrier 19.1 m (62.7 ft) from the CIP and 1.12 s after the initial impact. The vehicle remained in contact with the top of the barrier until reaching the end of the last segment, at which point it dropped to the ground. The brakes were applied 1.22 s after the initial impact as indicated by the data recorder’s event channel. The vehicle came to rest 76 m (250 ft) from the CIP. Figure 2-6 through Figure 2-16 show the pre-test and post-test condition of the test vehicle and test article. Sequence photographs of the impact for Test 671 are shown as Figure 2-17 on the data summary sheet on page 17.
The longitudinal occupant impact velocity was 5.25 m/s (17.2 ft/s), which was below the allowable maximum of 12 m/s (39 ft/s) specified in NCHRP Report 350. The longitudinal

2 TECHNICAL DISCUSSION
11
occupant ridedown acceleration, 3.96 g, was below the allowed maximum of 20 g. Test results are summarized in Table 2-2 on page 59.
Figure 2-6. Test 671 - Side View of Vehicle Pre-Impact
Figure 2-7. Test 671 - Vehicle at Impact Location Pre-Impact

2 TECHNICAL DISCUSSION
12
Figure 2-8. Test 671 - Close-up view of Vehicle at Impact Location Pre-Impact
Figure 2-9. Test 671 - Barrier Pre-Impact
2 TECHNICAL DISCUSSION
13
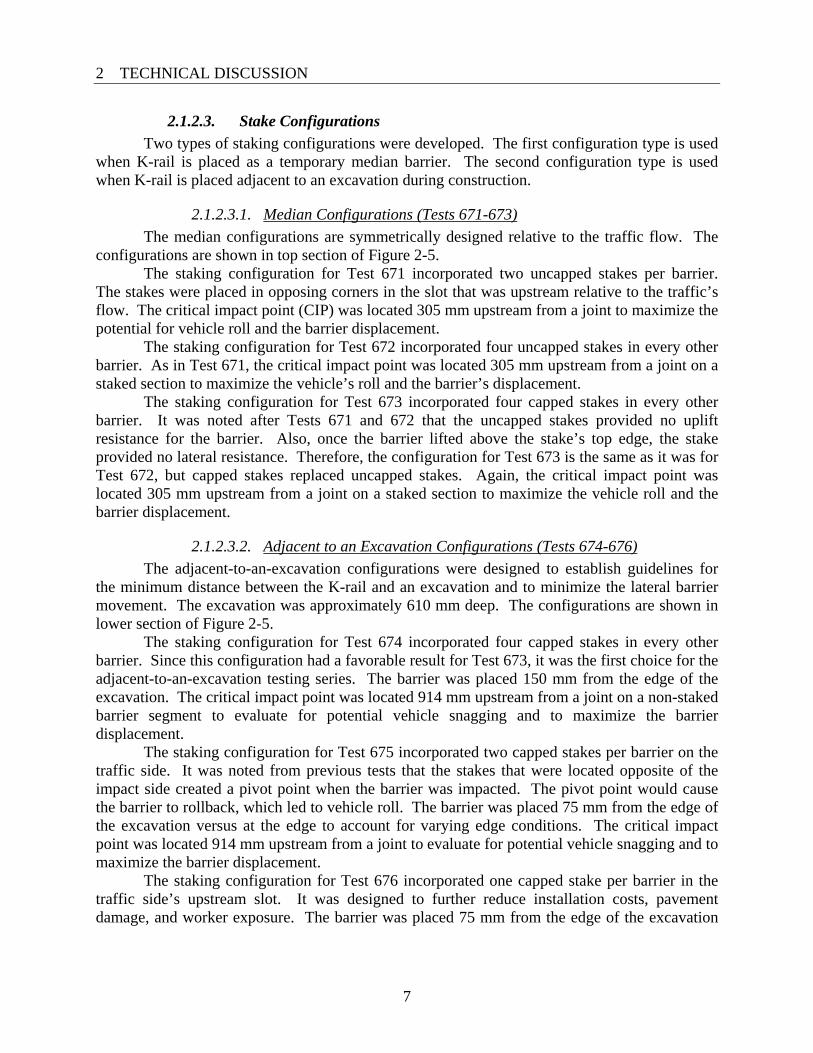
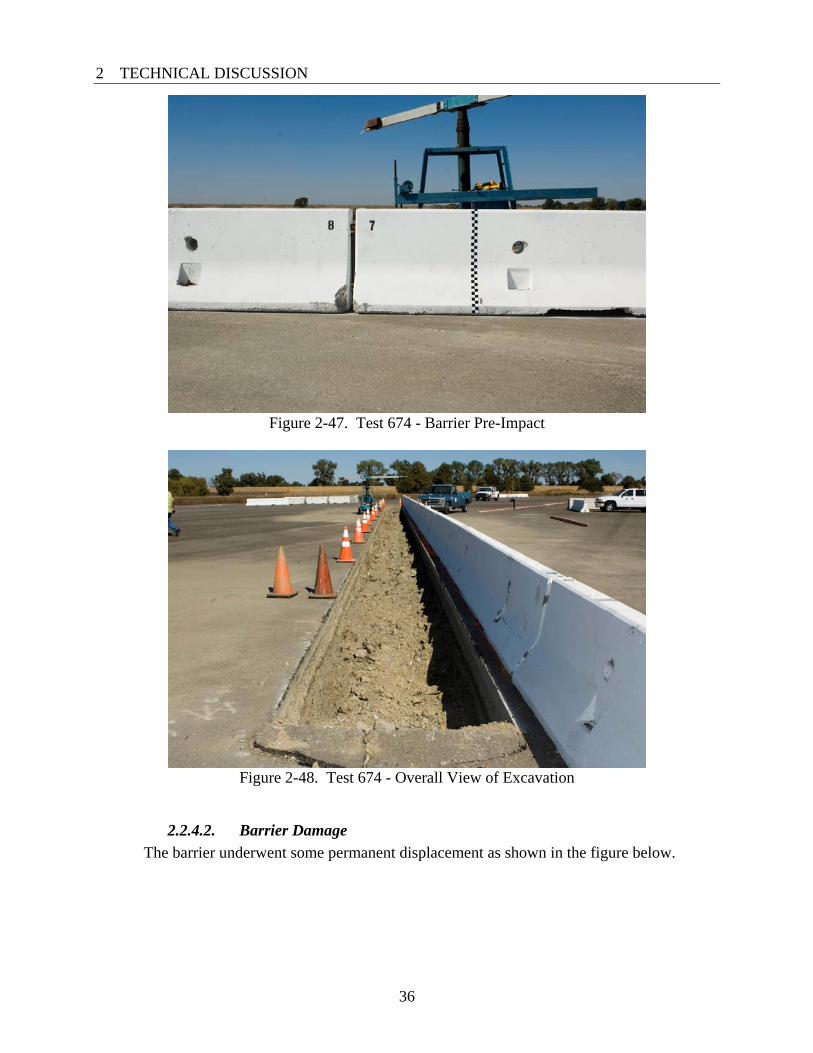
2.2.1.2. Barrier Damage The barrier underwent some permanent displacement as seen in the figure below
(segments that did not have any measurable movement are not shown).
Figure 2-10. Test 671 - Barrier Static Displacements [mm]
The pin and loop connection between sections 5 & 6, 6 & 7 (nearest to the impact point) and 7 & 8 bent and caused spalling at the joint. Sections 6 through 12 had scuffmarks. Sections 10 and 11 had minor scrapping on the top, which occurred when the vehicle rode on top of the barrier. The upstream stake in Section 6 & both stakes in Section 7 were bent. The staked, upstream slot in Section 6 had spalling. The maximum lateral static displacement was 370 mm (14.6 in), and the maximum lateral dynamic displacement was 389 mm (15.3 in) at the toe. Static measurements were taken with a tape measure and dynamic measurements were obtained via film analysis. After impact, segments 6 and 7 maintained a backward lean due to obstructions under the K-rail.
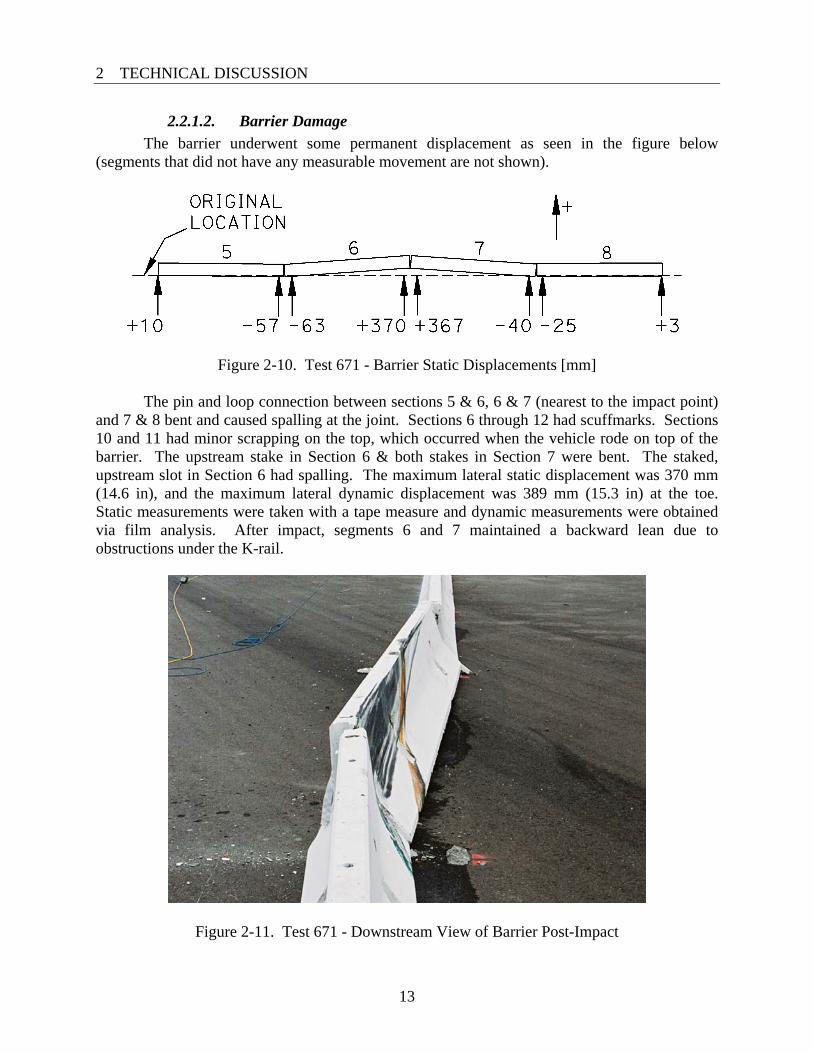
Figure 2-11. Test 671 - Downstream View of Barrier Post-Impact
2 TECHNICAL DISCUSSION
14
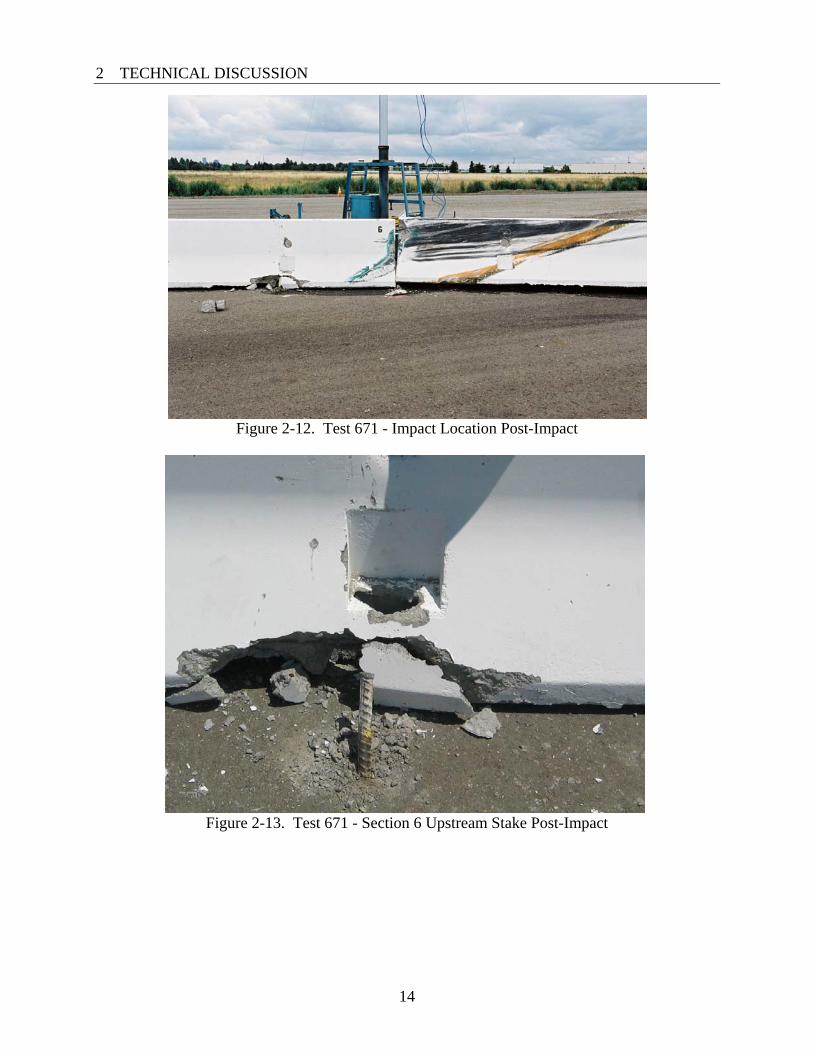
Figure 2-12. Test 671 - Impact Location Post-Impact
Figure 2-13. Test 671 - Section 6 Upstream Stake Post-Impact
2 TECHNICAL DISCUSSION
15
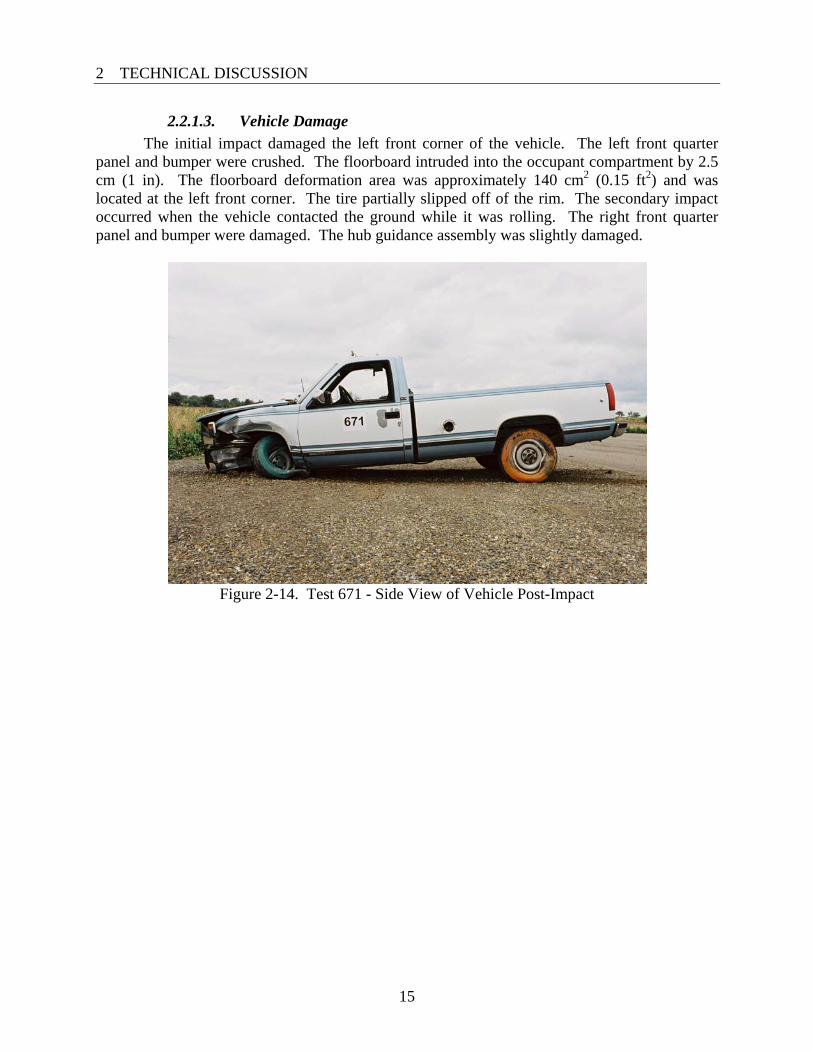
2.2.1.3. Vehicle Damage The initial impact damaged the left front corner of the vehicle. The left front quarter
panel and bumper were crushed. The floorboard intruded into the occupant compartment by 2.5 cm (1 in). The floorboard deformation area was approximately 140 cm2 (0.15 ft2) and was located at the left front corner. The tire partially slipped off of the rim. The secondary impact occurred when the vehicle contacted the ground while it was rolling. The right front quarter panel and bumper were damaged. The hub guidance assembly was slightly damaged.
Figure 2-14. Test 671 - Side View of Vehicle Post-Impact

2 TECHNICAL DISCUSSION
16
Figure 2-15. Test 671 – Front-left View of Vehicle Post-Impact
Figure 2-16. Test 671 - Front-right View of Vehicle Post-Impact

2 TECHNICAL DISCUSSION
17
2.2.1.4. Test 671 Data Summary Sheet
t = 0.000 sec t = 0.100 sec t = 0.200 sec t = 0.300 sec
t = 0.000 sec t = 0.250 sec t = 0.500 sec t = 0.750 sec
Figure 2-17. Test 671 - Impact sequence and diagram General Information Testing Agency..........California DOT Test Number ..............671 Test Date ................... June 9, 2005 Test Article Type......Semi-permanent K-rail in a median
barrier configuration Staking Configuration ...................................
2 uncapped stakes in opposite corners, upstream relative to the traffic flow.
Installation Length.....73.1 m (239.8 ft) Element Length .........6.1 m (20 ft)
Element Height..........0.8 m (32 in) Element Weight.........3540 kg (7805.7 lb) Test Vehicle Type...........................Production Model Designation................2000P Model ........................1992 GMC Sierra Mass: Curb ................1984.9 kg (4375.9 lbm) Test Inertial.....1986.7 kg (4380.0 lbm)
Impact Conditions Impact Velocity .........101.4 km/h (63.0 mph) Impact Angle .............28.3°
Exit Conditions Exit Velocity..............n/a Exit Angle .................0°
Test Data Occupant Impact Velocity Long ...................5.25 m/s (17.2 ft/s) Lat ...................... -5.33 m/s (-17.5 ft/s) Ridedown Acceleration Long ...................3.96 g Lat ...................... -5.50 g ASI ............................1.41 OCDI .........................LF0010000 Post-Impact Vehicular Behavior
(Data Analysis/Video Analysis) Maximum Roll Angle..................33.93° / 63° Maximum Pitch Angle ................14.30° / 16° Maximum Yaw Angle .................24.22° / n/a Test Article Deflections Dynamic ....................389 mm (15.3 in) Permanent..................370 mm (14.6 in)

2 TECHNICAL DISCUSSION
18
2.2.2. Test 672 – Median Layout: 4 Uncapped Stakes per Every Other Barrier
2.2.2.1. Impact Description/Vehicle Behavior The intended impact angle of 25° and impact location on the vehicle’s left-front corner
was set by the placement of the guide rail (Figure 2-19). Film analysis indicated that the actual impact angle was 26.0°, and the actual impact location was 127 mm (5 in) upstream from the intended CIP. The impact speed of 99.1 km/h (61.6 mph) was obtained by averaging the output from two independent speed traps located just upstream from the impact point. This speed was confirmed via film analysis. Upon impact the vehicle’s left front corner was crushed. The vehicle rode upwards on the barrier during impact and stayed in contact for 3.0 m (9.8 ft). Approximately 0.29 s after impact the left rear tire lost contact with the barrier and the vehicle was in the air. The vehicle rolled to the right before its right front tire landed on the ground 13.3 m (43.6 ft) from the CIP and 0.59 s after the initial impact. The vehicle’s undercarriage landed on top of the barrier 23.8 m (78.1 ft) from the CIP and 1.23 s after the initial impact. The vehicle remained in contact with the top of the barrier until the end of the last segment was passed. The brakes were applied 0.82 s after the initial impact as indicated by the data recorder’s event channel. The vehicle came to rest 53 m (174 ft) from the CIP.
The longitudinal occupant impact velocity was 4.60 m/s 15.1 ft/s), which was above the allowable maximum of 12 m/s (39 ft/s) specified in NCHRP Report 350. The longitudinal occupant ridedown acceleration, -4.57 g, was below the allowed maximum of 20 g. Test results are summarized in Table 2-3 on page 60.
Figure 2-18 through Figure 2-29 show pre-test and post-test condition of the test vehicle
and test article. Sequence photographs of the impact for Test 672 are shown as Figure 2-30 on the data summary sheet on page 25.
Figure 2-18. Test 672 - Side View of Vehicle Pre-Impact

2 TECHNICAL DISCUSSION
19
Figure 2-19. Test 672 - Vehicle at Impact Location Pre-Impact
Figure 2-20. Test 672 - Close-up View of Vehicle at Impact Location

2 TECHNICAL DISCUSSION
20
Figure 2-21. Test 672 - Barrier Pre-Impact
Figure 2-22. Test 672 - Stake #6B Pre-Impact

2 TECHNICAL DISCUSSION
21
2.2.2.2. Barrier Damage The barrier underwent some permanent displacement as seen in the figure below.
Figure 2-23. Test 672 - Barrier Static Displacements [mm]
The pin and loop connection between sections 5 & 6, 6 & 7 (nearest to the impact point) and 7 & 8 bent and caused spalling at the joint. Some stakes in Section 6 were bent and the slots they were in had spalling. Sections 6 and 7 had scuffmarks from the impact. Sections 10 through 12 had minor scrapping on the top, which occurred when the vehicle rode on top of the barrier. Section 7 underwent the most movement with a maximum lateral static displacement of 205 mm (8.1 in) and maximum lateral dynamic displacement of 256 mm (10 in) at the toe. Static measurements were taken with a tape measure and dynamic measurements were obtained via film analysis.
Figure 2-24. Test 672 - Downstream View of Barrier Post-Impact

2 TECHNICAL DISCUSSION
22
Figure 2-25. Test 672 - Impact Point Post-Impact
Figure 2-26. Test 672 - Stake #6B Post-Impact
2 TECHNICAL DISCUSSION
23
Figure 2-27. Test 672 - Scuffing on the Backside of the Barrier
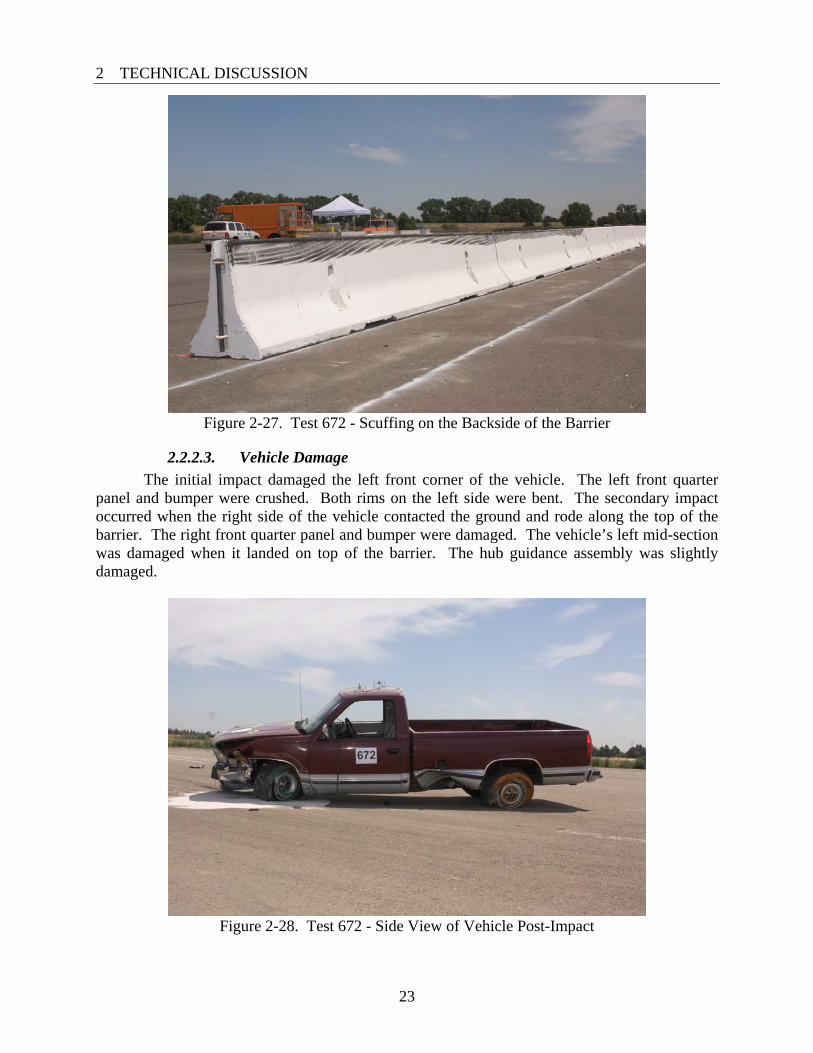
2.2.2.3. Vehicle Damage The initial impact damaged the left front corner of the vehicle. The left front quarter
panel and bumper were crushed. Both rims on the left side were bent. The secondary impact occurred when the right side of the vehicle contacted the ground and rode along the top of the barrier. The right front quarter panel and bumper were damaged. The vehicle’s left mid-section was damaged when it landed on top of the barrier. The hub guidance assembly was slightly damaged.
Figure 2-28. Test 672 - Side View of Vehicle Post-Impact

2 TECHNICAL DISCUSSION
24
Figure 2-29. Test 672 - Front-left View of Vehicle Post-Impact

2 TECHNICAL DISCUSSION
25
2.2.2.4. Test 672 Data Summary Sheet
t = 0.000 sec t = 0.176 sec t = 0.352 sec t = 0.528 sec
t = 0.704 sec t = 0.880 sec t = 1.056 sec t = 1.232 sec
Figure 2-30. Test 672 - Impact sequence and diagram
General Information Testing Agency..........California DOT Test Number ..............672 Test Date ................... June 23, 2005 Test Article Type......Semi-permanent K-rail in a median
barrier configuration Staking Configuration ...................................
4 uncapped stakes per section, every other element.
Installation Length.....73.1 m (239.8 ft) Elements Length........6.1 m (20 ft)
Elements Height ........0.8 m (32 in) Elements Weight .......3540 kg (7805.7 lb) Test Vehicle Type...........................Production Model Designation................2000P Model ........................1993 GMC Sierra Mass: Curb ................1967.6 kg (4337.8 lbm) Test Inertial.....1987.4 kg (4381.5 lbm)
Impact Conditions Impact Velocity .........99.1 km/h (61.6 mph) Impact Angle .............26.0°
Exit Conditions Exit Velocity..............n/a Exit Angle .................0°
Test Data Occupant Impact Velocity Long ...................4.60 m/s (15.1 ft/s) Lat ......................7.91 m/s (25.9 ft/s) Ridedown Acceleration Long ................... -4.57 g Lat ...................... -6.78 g ASI ............................1.50 OCDI .........................LF0011000 Post-Impact Vehicular Behavior
(Data Analysis/Video Analysis) Maximum Roll Angle..................56.66°/65° Maximum Pitch Angle ................14.28°/14° Maximum Yaw Angle .................35.34°/ --- Test Article Deflections
Dynamic .................... 256 mm (8.1 in) Permanent.................. 205 mm (10.1 in)
2 TECHNICAL DISCUSSION
26
2.2.3. Test 673 - Median Layout: 4 Capped Stakes per Every Other Barrier
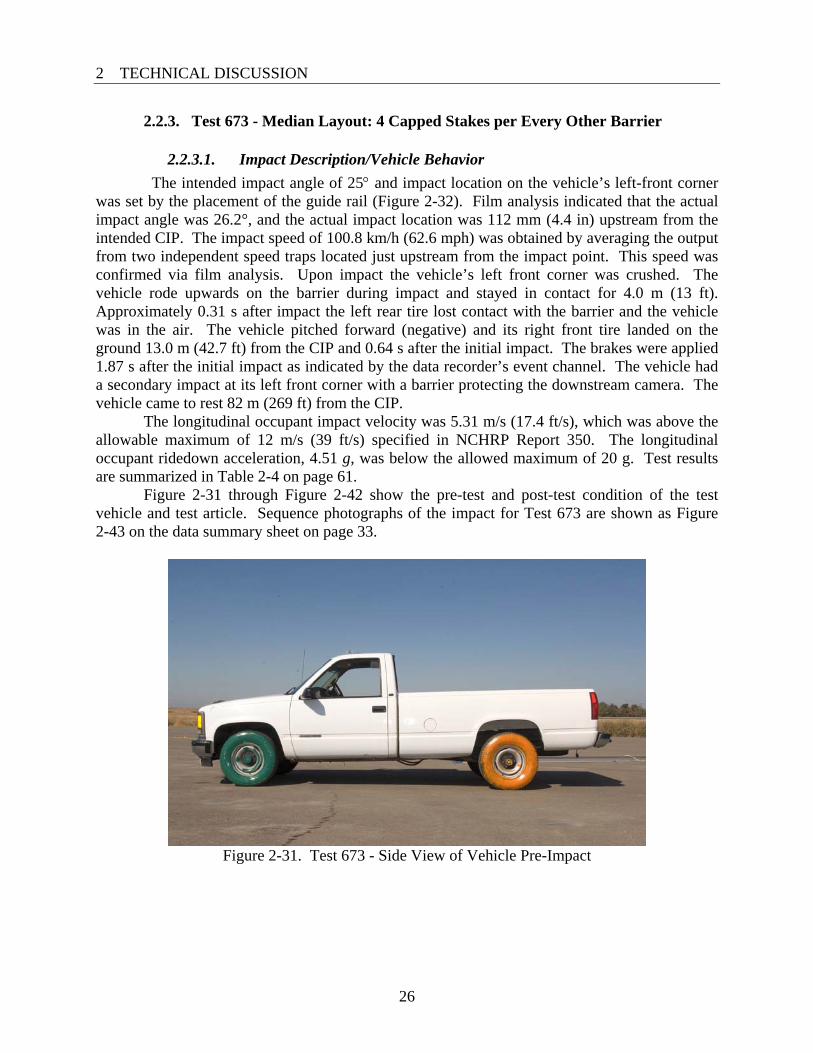
2.2.3.1. Impact Description/Vehicle Behavior The intended impact angle of 25° and impact location on the vehicle’s left-front corner
was set by the placement of the guide rail (Figure 2-32). Film analysis indicated that the actual impact angle was 26.2°, and the actual impact location was 112 mm (4.4 in) upstream from the intended CIP. The impact speed of 100.8 km/h (62.6 mph) was obtained by averaging the output from two independent speed traps located just upstream from the impact point. This speed was confirmed via film analysis. Upon impact the vehicle’s left front corner was crushed. The vehicle rode upwards on the barrier during impact and stayed in contact for 4.0 m (13 ft). Approximately 0.31 s after impact the left rear tire lost contact with the barrier and the vehicle was in the air. The vehicle pitched forward (negative) and its right front tire landed on the ground 13.0 m (42.7 ft) from the CIP and 0.64 s after the initial impact. The brakes were applied 1.87 s after the initial impact as indicated by the data recorder’s event channel. The vehicle had a secondary impact at its left front corner with a barrier protecting the downstream camera. The vehicle came to rest 82 m (269 ft) from the CIP.
The longitudinal occupant impact velocity was 5.31 m/s (17.4 ft/s), which was above the allowable maximum of 12 m/s (39 ft/s) specified in NCHRP Report 350. The longitudinal occupant ridedown acceleration, 4.51 g, was below the allowed maximum of 20 g. Test results are summarized in Table 2-4 on page 61.
Figure 2-31 through Figure 2-42 show the pre-test and post-test condition of the test vehicle and test article. Sequence photographs of the impact for Test 673 are shown as Figure 2-43 on the data summary sheet on page 33.
Figure 2-31. Test 673 - Side View of Vehicle Pre-Impact

2 TECHNICAL DISCUSSION
27
Figure 2-32. Test 673 - Vehicle at Impact Location Pre-Impact
Figure 2-33. Test 673 - Close-up View of Vehicle at Impact Location Pre-Impact
2 TECHNICAL DISCUSSION
28
Figure 2-34. Test 673 - Barrier Pre-Impact
Figure 2-35. Test 673 - Stake #6B Pre-Impact

2 TECHNICAL DISCUSSION
29
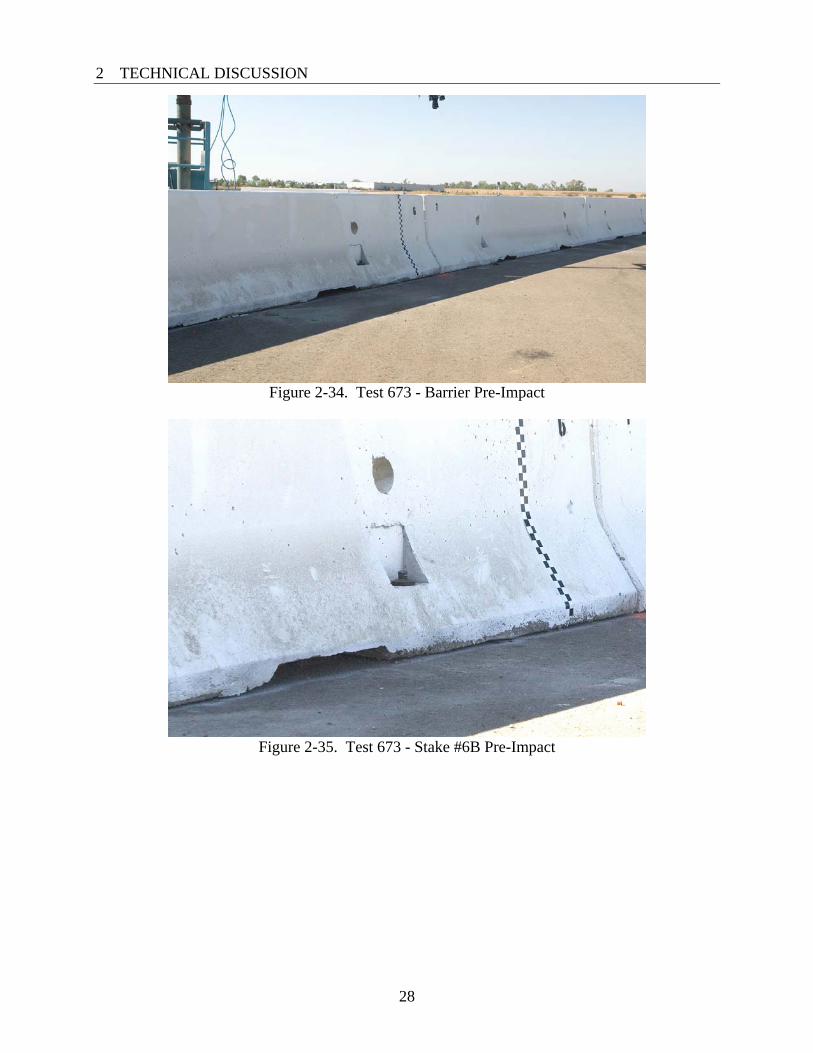
2.2.3.2. Barrier Damage The barrier underwent some permanent displacement as seen in the figure below.
Figure 2-36. Test 673 - Barrier Static Displacements [mm]
The pin and loop connection between sections 6 & 7 (nearest to the impact point) and 7 & 8 bent and caused spalling at the joint. Section 6 had a large, vertical crack on the impact side near the impact point. Sections 6 and 7 had scuffmarks from the initial impact. Some of the stakes lifted due to the barrier rotation. The maximum lateral static displacement was 163 mm (6.4 in) with a maximum lateral dynamic displacement of 200 mm (7.9 in) at the toe. Static measurements were taken with a tape measure, and dynamic measurements were obtained via film analysis.
Figure 2-37. Test 673 - Downstream View of Barrier Post-Impact

2 TECHNICAL DISCUSSION
30
Figure 2-38. Test 673 - Impact Point Post-Impact
Figure 2-39. Test 673 - Stake #6B Post-Impact

2 TECHNICAL DISCUSSION
31
2.2.3.3. Vehicle Damage The initial impact damaged the left front corner of the vehicle. The left front quarter
panel and bumper were crushed. A secondary impact occurred when the vehicle impacted a barrier protecting a camera. The impact was located at the left front corner again and further damaged the area. The hood was crushed inwards and the left front tire and rim were damaged. The maximum floorboard intrudedd into the occupant compartment by 3 cm (1.2 in). The floorboard deformation area was approximately 3275 cm2 (3.5 ft2) and was located at the left front corner.
For Test 673, the vehicle impacted a K-rail section that had greater lateral and uplift resistance from the stakes than previous tests (due to the number of stakes and the caps); thus, Test 673’s vehicle was damaged more than previous tests.
Figure 2-40. Test 673 - Side View of Vehicle Post-Impact
d The floorboard deformation was greater for this test than the previous test since the
vehicle impacted a fully staked section of K-rail. Upon impact, some of the vehicle’s kinetic energy is absorbed by the barrier (causing the barrier to typically move) and reduces damage to the vehicle. For this project, the amount of energy transferred to the barrier was dependent on:
1. Lateral resistance from the stakes 2. Uplift resistance along the impact side from the stakes
When the resistances in items 1 and 2 are increased, the kinetic energy absorbed by the barrier is reduced, and barrier displacement is decreased.

2 TECHNICAL DISCUSSION
32
Figure 2-41. Test 673 - Front-left View of Vehicle Post-Impact
Figure 2-42. Test 673 - Barrier Involved with Secondary Impact
ORIGINAL BARRIER LOCATION

2 TECHNICAL DISCUSSION
33
2.2.3.4. Test 673 Data Summary Sheet
t = 0.000 sec t = 0.084 sec t = 0.168 sec t = 0.250 sec
t = 0.000 sec t = 0.250 sec t = 0.500 sec t = 0.750 sec
Figure 2-43. Test 673 - Impact sequence and diagram
General Information Testing Agency..........California DOT Test Number ..............673 Test Date ...................August 24, 2005 Test Article Type......Semi-permanent K-rail in a median
barrier configuration Staking Configuration ...................................
K-rail as a temporary median divider with 4 capped stakes per section, every other section.
Installation Length.....79.2 m (259.8 ft) Element Length .........6.1 m (20 ft)
Element Height..........0.8 m (32 in) Element Weight.........3540 kg (7805.7 lb) Test Vehicle Type...........................Production Model Designation................2000P Model ........................1997 Chevy 2500 Mass: Curb ................1951.2 kg (4301.7 kg) Test Inertial.....2016.3 kg (4445.2 kg)
Impact Conditions Impact Velocity .........100.8 km/h (62.6 mph) Impact Angle .............26.2°
Exit Conditions Exit Velocity..............84 km/h (52 mph) Exit Angle .................>5°
Test Data Occupant Impact Velocity Long ...................5.31 m/s (17.4 ft/s) Lat ...................... -7.25 m/s (23.8 ft/s) Ridedown Acceleration Long ...................4.51 g Lat ......................11.21 g ASI ............................1.73 OCDI .........................LF0011001 Post-Impact Vehicular Behavior
(Data Analysis/Video Analysis) Maximum Roll Angle..................33.26°/39° Maximum Pitch Angle ................19.48°/30° Maximum Yaw Angle .................65.80°/ n/a Test Article Deflections Dynamic ....................207 mm (8.1 in) Permanent..................163 mm (6.4 in)

2 TECHNICAL DISCUSSION
34
2.2.4. Test 674 – Excavation Layout: 4 Capped Stakes per Every Other Barrier
2.2.4.1. Impact Description/Vehicle Behavior The intended impact angle of 25° and impact location on the vehicle’s right-front corner
was set by the placement of the guide rail (Figure 2-45). Film analysis indicated that the actual impact angle was 26.5°, and the actual impact location was 130 mm (5.1 in) upstream from the intended CIP, resulting in an impact point 783 mm (30.8 in) upstream from a joint. The impact speed of 98.9 km/h (61.4 mph) was obtained by averaging the output from two independent speed traps located just upstream from the impact point. This speed was confirmed via film analysis. Upon impact the vehicle’s right front corner was crushed. The vehicle rode upwards on the barrier face during impact and stayed in contact for 4.5 m (15 ft). Approximately 0.37 s after impact the right rear tire lost contact with the barrier and the vehicle was in the air. The vehicle pitched forward and its left front tire landed on the ground 13.0 m (42.7 ft) from the CIP and 0.59 s after the initial impact. The brakes were applied 1.30 s after the initial impact as indicated by the data recorder’s event channel. The vehicle came to rest 51 m (170 ft) from the CIP.
The longitudinal occupant impact velocity was -3.80 m/s (-12.5 ft/s), which was below the allowable maximum of 12 m/s (39 ft/s) specified in NCHRP Report 350. The longitudinal occupant ridedown acceleration, -5.66 g, was below the allowed maximum of 20 g. Test results are summarized in Table 2-5 on page 62.
Figure 2-44 through Figure 2-57 show the pre-test and post-test condition of the test vehicle and test article. Sequence photographs of the impact for Test 674 are shown in Figure 2-58 on the data summary sheet.
Figure 2-44. Test 674 - Side View of Vehicle Pre-Impact

2 TECHNICAL DISCUSSION
35
Figure 2-45. Test 674 - Vehicle at Impact Location Pre-Impact
Figure 2-46. Test 674 - Close-up View of Vehicle at Impact Location
2 TECHNICAL DISCUSSION
36
Figure 2-47. Test 674 - Barrier Pre-Impact
Figure 2-48. Test 674 - Overall View of Excavation
2.2.4.2. Barrier Damage The barrier underwent some permanent displacement as shown in the figure below.

2 TECHNICAL DISCUSSION
37
Figure 2-49. Test 674 - Barrier Static Displacements [mm]
The pin and loop connection between sections 7 & 8 (nearest to the impact point) and 8 & 9 bent and caused spalling at the joint. Section 8 had spalling at the upstream, impact-side slot due to the stake bending. The upstream, excavation-side stake in Section 8 broke through the AC. The maximum lateral static displacement was 670 mm (26.3 in). Static measurements were taken with a tape measure. Due to the angle between the vehicle targets and the camera, the dynamic displacement could not be accurately measured.
Figure 2-50. Test 674 - Downstream View of Barrier Post-Impact

2 TECHNICAL DISCUSSION
38
Figure 2-51. Test 674 - Impact Point Post-Impact
Figure 2-52. Test 674 – Upstream, Impact-side Stake in Section 8 Post-Impact

2 TECHNICAL DISCUSSION
39
Figure 2-53. Test 674 - Back of Barrier Post-Impact
Figure 2-54. Test 674 - Damaged Pavement from Rear Stake

2 TECHNICAL DISCUSSION
40
Figure 2-55. Test 674 - Pavement Damage after Barrier Removal
2.2.4.3. Vehicle Damage The impact damaged the right front corner of the vehicle. The right front quarter panel
and bumper were crushed. Both front tires were damaged. The body on the right side had minor body damage from scraping against the barrier. The bottom of the tailgate detached from the bed and was held in place by the upper hinges.
Figure 2-56. Test 674 - Side View of Vehicle Post-Impact

2 TECHNICAL DISCUSSION
41
Figure 2-57. Test 674 - Front-right View of Vehicle Post-Impact

2 TECHNICAL DISCUSSION
42
2.2.4.4. Test 674 Data Summary Sheet
t = 0.000 sec t = 0.060 sec t = 0.120 sec t = 0.180 sec
t = 0.000 sec t = 0.200 sec t = 0.400 sec t = 0.600 sec
Figure 2-58. Test 674 - Impact sequence and diagram
General Information Testing Agency..........California DOT Test Number ..............674 Test Date ...................October 5, 2005 Test Article Type......Longitudinal Barrier /Temporary
Barrier, with excavation 152 mm behind back of K-rail
Staking Configuration ................................... 4 capped stakes per section, every other section.
Installation Length.....79.2 m (259.8 ft) Element Length .........6.1 m (20 ft)
Element Height..........0.8 m (32 in) Element Weight.........3540 kg (7805.7 lb) Test Vehicle Type...........................Production Model Designation................2000P Model ........................1989 GMC Cheyenne Mass Curb ................1901.8 kg (4192.7 lbm) Test Inertial.....1929.7 kg (4254.3 lbm)
Impact Conditions Impact Velocity .........98.9 km/h (61.4 mph) Impact Angle .............26.5°
Exit Conditions Exit Velocity..............86 km/h (53 mph) Exit Angle .................5°
Test Data Occupant Impact Velocity Long ................... -3.80 m/s (-12.5 ft/s) Lat ...................... -9.55 m/s (-31.3 ft/s) Ridedown Acceleration Long ................... -5.66 g Lat ......................8.74 g ASI ............................2.11 OCDI .........................RF0001000 Post-Impact Vehicular Behavior
(Data Analysis/Video Analysis) Maximum Roll Angle.............. -29.71°/-10° Maximum Pitch Angle ............ -27.98°/ 25° Maximum Yaw Angle ............. -46.96°/ --- Test Article Deflections Dynamic ................ n/a Permanent.............. 670 mm (26.4 in)

2 TECHNICAL DISCUSSION
43
2.2.5. Test 675 – Excavation Layout: 2 Capped Stakes per Barrier on Traffic Side
2.2.5.1. Impact Description/Vehicle Behavior The intended impact angle of 25° and impact location on the vehicle’s right-front corner
was set by the placement of the guide rail (Figure 2-60). Film analysis indicated that the actual impact angle was 26.4°, and the actual impact location was 170 mm (6.7 in) downstream from the intended CIP. The impact speed of 100.6 km/h (62.5 mph) was obtained by averaging the output from two independent speed traps located just upstream from the impact point. This speed was confirmed via film analysis. Upon impact the vehicle’s right front corner was crushed. The vehicle rode upward on the barrier during impact and stayed in contact for 4.5 m (14 ft). Approximately 0.29 s after impact the right rear tire lost contact with the barrier and the vehicle was in the air. The vehicle rolled to the left and its left front tire landed on the ground 12.9 m (42.3 ft) from the CIP and 0.58 s after the initial impact. The brakes were applied 1.17 s after the initial impact as indicated by video analysis using the brake flash. The vehicle came to rest 61 m (200 ft) from the CIP.
The longitudinal occupant impact velocity was 4.66 m/s (15.3 ft/s), which was above the allowable maximum of 12 m/s (39 ft/s) specified in NCHRP Report 350. The longitudinal occupant ridedown acceleration, -3.68 g, was below the allowed maximum of 20 g. Test results are summarized in Table 2-6 on page 63.
Figure 2-59 through Figure 2-70 show the pre-test and post-test condition of the test vehicle and test article. Sequence photographs of the impact for Test 675 are shown as Figure 2-71 on the data summary sheet on page 49.
Figure 2-59. Test 675 - Side View of Vehicle Pre-Impact

2 TECHNICAL DISCUSSION
44
Figure 2-60. Test 675 - Vehicle at Impact Location Pre-Impact
Figure 2-61. Test 675 - Close-up View of Vehicle at Impact Location

2 TECHNICAL DISCUSSION
45
Figure 2-62. Test 675 - Barrier Pre-Impact
2.2.5.2. Barrier Damage The barrier underwent some permanent displacement as seen in the figure below.
Figure 2-63. Test 675 - Barrier Static Displacements [mm]
The pin and loop connection between sections 5 & 6 (nearest to the impact point) and 6 & 7 bent and caused spalling at the joint. The slots located in the upstream end of Section 5 and downstream end of Section 6 had spalling. Sections 5 and 6 had scuffmarks on the surface from the impact. The barriers’ maximum lateral static displacement was 350 mm (13.8 in) and the maximum lateral dynamic displacement was 350 mm (13.8 in) at the toe. The barrier extended over the excavation by approximately 280 mm (11.0 in). Static measurements were taken with a tape measure, and dynamic measurements were obtained via film analysis.

2 TECHNICAL DISCUSSION
46
Figure 2-64. Test 675 - Downstream View of Barrier Post-Impact
Figure 2-65. Test 675 - Barrier over Excavation

2 TECHNICAL DISCUSSION
47
Figure 2-66. Test 675 - Impact Point Post-Impact
Figure 2-67. Test 675 - Stake at Impact
Point
Figure 2-68. Test 675 - Stake Downstream
from Impact Point
2.2.5.3. Vehicle Damage The impact damaged the right front corner of the vehicle. The right front quarter panel
and bumper were crushed. The tire slipped off the rim. The suspension and steering assemblies were damage. The tie rod sheered off the spindle. The hub guidance assembly was slightly damaged.

2 TECHNICAL DISCUSSION
48
Figure 2-69. Test 675 - Side View of Vehicle Post-Impact
Figure 2-70. Test 675 - Front-right View of Vehicle Post-Impact
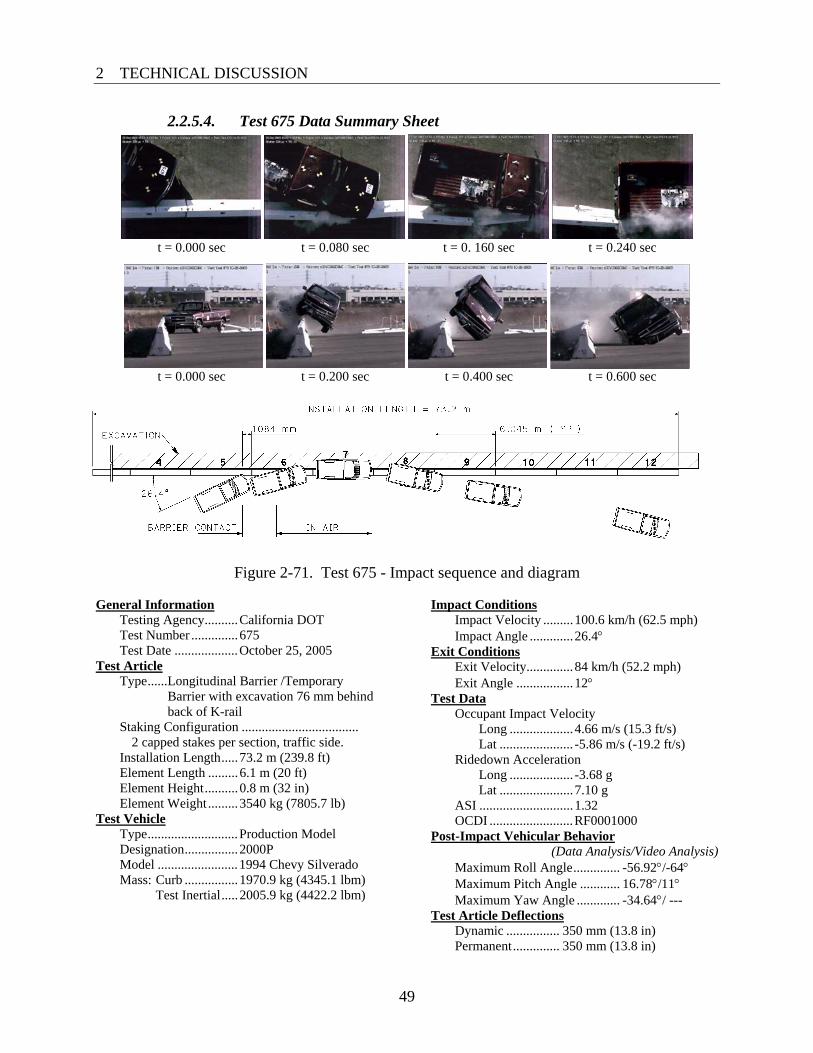
2 TECHNICAL DISCUSSION
49
2.2.5.4. Test 675 Data Summary Sheet
t = 0.000 sec t = 0.080 sec t = 0. 160 sec t = 0.240 sec
t = 0.000 sec t = 0.200 sec t = 0.400 sec t = 0.600 sec
Figure 2-71. Test 675 - Impact sequence and diagram General Information Testing Agency..........California DOT Test Number ..............675 Test Date ...................October 25, 2005 Test Article Type......Longitudinal Barrier /Temporary
Barrier with excavation 76 mm behind back of K-rail
Staking Configuration ................................... 2 capped stakes per section, traffic side.
Installation Length.....73.2 m (239.8 ft) Element Length .........6.1 m (20 ft)
Element Height..........0.8 m (32 in) Element Weight.........3540 kg (7805.7 lb) Test Vehicle Type...........................Production Model Designation................2000P Model ........................1994 Chevy Silverado Mass: Curb ................1970.9 kg (4345.1 lbm) Test Inertial.....2005.9 kg (4422.2 lbm)
Impact Conditions Impact Velocity .........100.6 km/h (62.5 mph) Impact Angle .............26.4°
Exit Conditions Exit Velocity..............84 km/h (52.2 mph) Exit Angle .................12°
Test Data Occupant Impact Velocity Long ...................4.66 m/s (15.3 ft/s) Lat ...................... -5.86 m/s (-19.2 ft/s) Ridedown Acceleration Long ................... -3.68 g Lat ......................7.10 g ASI ............................1.32 OCDI .........................RF0001000 Post-Impact Vehicular Behavior
(Data Analysis/Video Analysis) Maximum Roll Angle.............. -56.92°/-64° Maximum Pitch Angle ............ 16.78°/11° Maximum Yaw Angle ............. -34.64°/ --- Test Article Deflections Dynamic ................ 350 mm (13.8 in) Permanent.............. 350 mm (13.8 in)
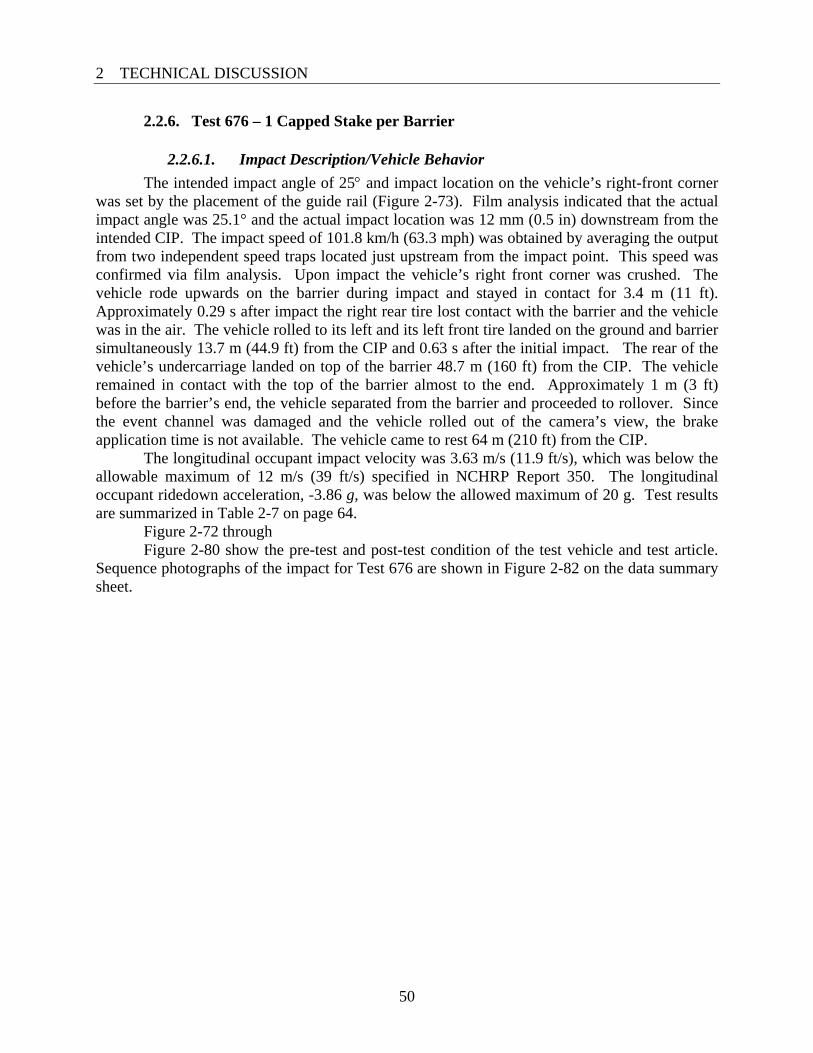
2 TECHNICAL DISCUSSION
50
2.2.6. Test 676 – 1 Capped Stake per Barrier
2.2.6.1. Impact Description/Vehicle Behavior The intended impact angle of 25° and impact location on the vehicle’s right-front corner
was set by the placement of the guide rail (Figure 2-73). Film analysis indicated that the actual impact angle was 25.1° and the actual impact location was 12 mm (0.5 in) downstream from the intended CIP. The impact speed of 101.8 km/h (63.3 mph) was obtained by averaging the output from two independent speed traps located just upstream from the impact point. This speed was confirmed via film analysis. Upon impact the vehicle’s right front corner was crushed. The vehicle rode upwards on the barrier during impact and stayed in contact for 3.4 m (11 ft). Approximately 0.29 s after impact the right rear tire lost contact with the barrier and the vehicle was in the air. The vehicle rolled to its left and its left front tire landed on the ground and barrier simultaneously 13.7 m (44.9 ft) from the CIP and 0.63 s after the initial impact. The rear of the vehicle’s undercarriage landed on top of the barrier 48.7 m (160 ft) from the CIP. The vehicle remained in contact with the top of the barrier almost to the end. Approximately 1 m (3 ft) before the barrier’s end, the vehicle separated from the barrier and proceeded to rollover. Since the event channel was damaged and the vehicle rolled out of the camera’s view, the brake application time is not available. The vehicle came to rest 64 m (210 ft) from the CIP.
The longitudinal occupant impact velocity was 3.63 m/s (11.9 ft/s), which was below the allowable maximum of 12 m/s (39 ft/s) specified in NCHRP Report 350. The longitudinal occupant ridedown acceleration, -3.86 g, was below the allowed maximum of 20 g. Test results are summarized in Table 2-7 on page 64.
Figure 2-72 through Figure 2-80 show the pre-test and post-test condition of the test vehicle and test article.
Sequence photographs of the impact for Test 676 are shown in Figure 2-82 on the data summary sheet.

2 TECHNICAL DISCUSSION
51
Figure 2-72. Test 676 - Side View of Vehicle Pre-Impact
Figure 2-73. Test 676 - Vehicle at Impact Location Pre-Impact
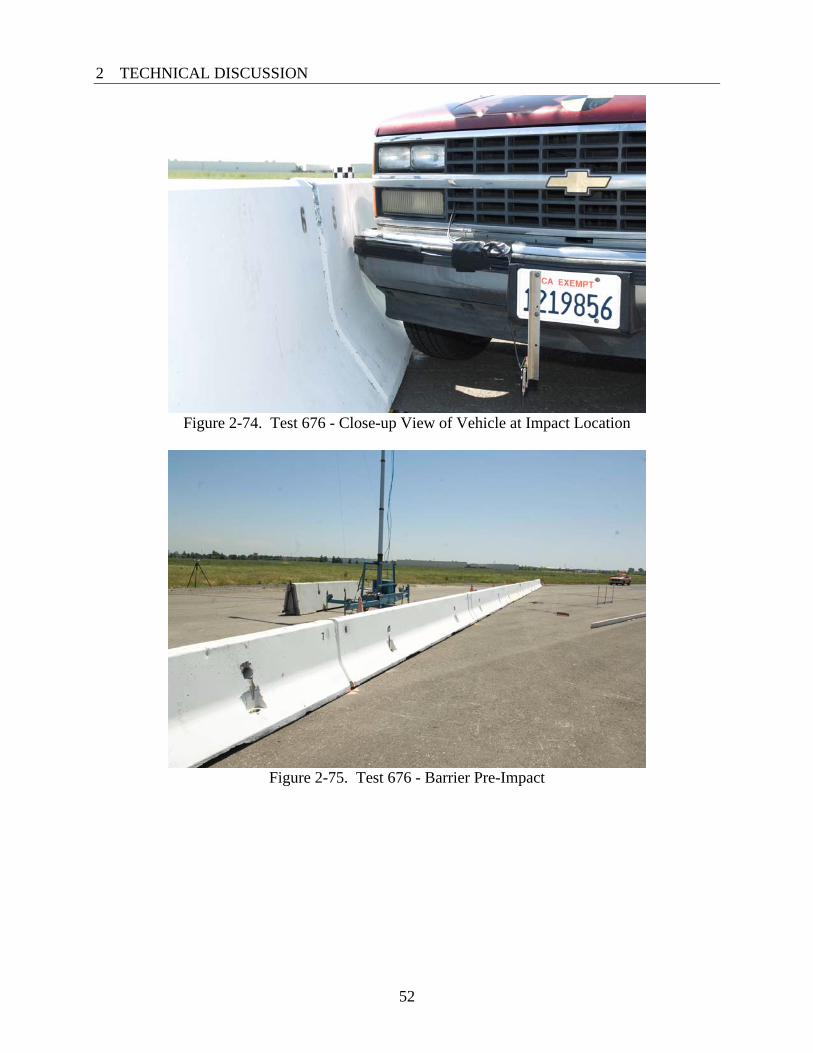
2 TECHNICAL DISCUSSION
52
Figure 2-74. Test 676 - Close-up View of Vehicle at Impact Location
Figure 2-75. Test 676 - Barrier Pre-Impact

2 TECHNICAL DISCUSSION
53
2.2.6.2. Barrier Damage The barrier underwent some permanent displacement as seen in the figure below.
Figure 2-76. Test 676 - Barrier Static Displacements [mm]
The pin and loop connections between sections 5 & 6 (nearest to the impact point) and 6 & 7 were bent and caused spalling at the joint. Section 5 had spalling at the stake location. Sections 5 and 6 had scuffmarks from the impact. Sections 9 through 12 had minor scrapping on the top, which occurred when the vehicle rode on top of the barrier.
The maximum lateral static displacement was 505 mm (20.0 in). Due to the angle between the vehicle targets and the camera, the dynamic displacement could not be accurately measured.
Figure 2-77. Test 676 - Downstream View of Barrier Post-Impact

2 TECHNICAL DISCUSSION
54
Figure 2-78. Test 676 - Impact Point Post-Impact
Figure 2-79. Test 676 - Stake Downstream of Impact Point
2.2.6.3. Vehicle Damage The initial impact damaged the right front corner of the vehicle. The right front quarter
panel and bumper were crushed inwards. The right front tire and right side rims were damaged. The right body panel was crushed when the vehicle rode on top of the barrier. The windshield was damaged during the rollover, but remained in place. The rear window shattered.

2 TECHNICAL DISCUSSION
55
Figure 2-80. Test 676 - Vehicle Post-Impact Front View
Figure 2-81. Test 676 - Vehicle Post-Impact Side View

2 TECHNICAL DISCUSSION
56
2.2.6.4. Test 676 Data Summary Sheet
t = 0.000 sec t = 0.150 sec t = 0.300 sec t = 0.450 sec
t = 0.600 sec t = 0.750 sec t = 0.900 sec t = 1.050 sec
Figure 2-82. Test 676 - Impact sequence and diagram
General Information Testing Agency..........California DOT Test Number ..............676 Test Date ...................May 16, 2006 Test Article Type......Longitudinal Barrier /Temporary
Barrier with excavation 76 mm behind back of K-rail
Staking Configuration ................................... 1 capped stake per section, traffic side, upstream relative to traffic.
Installation Length.....73.1 m (239.8 ft) Element Length .........6.1 m (20 ft)
Height Length............0.8 m (32 in) Weight Length...........3540 kg (7805.7 lb) Test Vehicle Type...........................Production Model Designation................2000P Model ........................1988 Chevy Silverado Mass: Curb ................1923.5 kg (4240.6 lbm) Test Inertial.....1981.0 kg (4367.4 lbm)
Impact Conditions Impact Velocity .........101.8 km/h (63.3 mph) Impact Angle .............25.1° Exit Conditions
Exit Velocity..............n/a Exit Angle .................0°
Test Data Occupant Impact Velocity Long ...................3.63 m/s (11.9 ft/s) Lat ...................... -5.96 m/s (-19.6 ft/s) Ridedown Acceleration Long ................... -3.86 g Lat ......................5.35 g ASI ............................1.16 OCDI .........................RF0011010 Post-Impact Vehicular Behavior
(Data Analysis/Video Analysis) Maximum Roll Angle.............. -57.41°/ -55° Maximum Pitch Angle ............ 14.10°/ 25° Maximum Yaw Angle ............. -52.45°/ n/a Test Article Deflections Dynamic ................ n/a mm Permanent.............. 505 mm (20.0 in)

2 TECHNICAL DISCUSSION
57
2.3. Discussion of Test Results NCHRP Report 350 stipulates that crash test performance is assessed according to three
evaluation factors: 1) Structural Adequacy, 2) Occupant Risk, and 3) Vehicle Trajectory. These evaluation factors are further defined by evaluation criteria and are shown for each test designation in Table 5.1 of NCHRP Report 350. The NCHRP Report 350 Test Designation is 3-11 (2000P vehicle) for all tests conducted during this research.
2.3.1. Structural Adequacy
2.3.1.1. Median Barrier Configurations Of the three tests conducted in the median barrier configuration, only Test 673
demonstrated acceptable structural adequacy. Tests 671 and 672 failed to safely redirect the test vehicle, demonstrating an inadequate structural integrity.
Test 671, with each K-rail element being held in position by two uncapped stakes in a staggered configuration, resulted in launching the vehicle up, over, and onto the top of the barrier. This was an unstable result, which could have led to a rollover or impact with oncoming traffic.
Test 672, with four uncapped stakes in every other K-rail element, yielded the same result as Test 671. The K-rail element leaned back and lifted off of the uncapped stake, resulting in a vehicle riding up the face and resting on the top of the barrier.
Test 673, with four capped stakes in every other K-rail element, resulted in one cracked K-rail element, a permanent lateral displacement of 163 mm (604 in), and some damage to the K-rail interconnects at the impact point. However, the damage to the barrier was not unexpected and the vehicle stability was much better in this test than it had been in the previous two. The vehicle did not vault onto the top of the barrier. The structural adequacy was acceptable for test configuration 673.
2.3.1.2. Adjacent to Excavation Configurations Since this configuration involves an excavation, the K-rail Staking Committee added an
additional criterion for evaluation in the Structural Adequacy category. The Committee asked that the lateral penetration of the K-rail into the excavation be kept to a minimum and that the Committee review the test results. Based on the additional Structural Adequacy Criteria, the configuration in Test 675 demonstrated acceptable structural adequacy, while the configurations in tests 674 and 676 did not.
Tests 674 (which was the same configuration as 673 except with the excavation), resulted in an acceptable redirection of the test vehicle but produced excessive penetration of the barrier into the excavation, posing an unacceptable risk to workers. Additionally, the failure of the AC pavement behind the rear stakes would require additional exposure of workers during pavement repair efforts at a later date.
Test 675, with capped stakes placed in every stake hole on the traffic-side of the K-rail but none on the excavation side, resulted in minimal lateral deflation and good vehicle redirection. There was no damage to the pavement. The review by the Committee resulted in the assessment that the 280 mm (11 in) of overlap into the excavation was acceptable. The structural adequacy of configuration 675 is acceptable.

2 TECHNICAL DISCUSSION
58
Test 676, with a single capped stake on the downstream traffic side of each K-rail, resulted in excessive barrier movement and a rollover of the test vehicle. This test was a clear failure of the Structural Adequacy criteria.
A detailed assessment summary of structural adequacy for each test is shown in Table 2-2 through Table 2-7.
2.3.2. Occupant Risk
2.3.2.1. Median Barrier Configurations All three of the median configuration tests passed the criteria for occupant risk.
However, it should be noted that tests 671 and 672 resulted in the test vehicles straddling the barrier, which could result in secondary impacts and greater occupant risk. The occupant deformations were considered acceptable for all of the median configuration tests.
2.3.2.2. Adjacent to Excavation Configurations Of the three tests conducted on excavation configurations, only test 675 concluded with
acceptable results. The other configurations presented undue hazards to either the vehicle occupants or the work zone personnel.
Although Test 674 resulted in acceptable conditions for the vehicle occupants, there were undue hazards to the work zone personnel. Failure of the AC to hold the rear stake caused a large chunk of the AC to break loose and fall into the excavation. Additionally, the barrier penetrated 670 mm (26 in) into the excavation. The Committee considered the pavement failure and the deflection as unacceptable to the work zone safety.
Test 675 resulted in acceptable occupant risk. There was lateral deflection of barrier. However, the AC did not fail and the barrier deflection was acceptable to the Committee.
Test 676 failed several criterion of the Occupant Risk. There was excessive barrier penetration into the work zone. After impact the vehicle slid along the top of the barrier, presenting addition risk to the work zone. After losing contact with the barrier the vehicle rolled over.
A detailed assessment summary of occupant risk for each test is shown in Table 2-2 through Table 2-7.
2.3.3. Vehicle Trajectory
2.3.3.1. Median Barrier Configurations The vehicle trajectory was considered marginal for tests 671 and 672 because the vehicle
ended up straddling the barrier. Test 673 was considered to have acceptable post-impact trajectory.
2.3.3.2. Adjacent to Excavation Configurations Test 674 and Test 675 had acceptable vehicle trajectory. The vehicle for Test 674,
however, ended with a high degree of yaw toward the barrier shortly after impact. The vehicle trajectory for Test 676 was not acceptable due to the rollover. A detailed assessment summary of vehicle trajectory for each test is shown in Table 2-2
through Table 2-7.

2 TECHNICAL DISCUSSION
59
Table 2-2. Test 671 Assessment Summary Test No. 671 – Temporary Railing (Type K) with 2000P Date June 5, 2005 Test agency California Dept. of Transportation
Evaluation Criteria Test Results Assessment
Structural Adequacy
A. The Test article should contain and redirect the vehicle; the vehicle should not penetrate, underride, or override the installation although controlled lateral deflection on the test article is acceptable
Vehicle landed on top of the barrier and intruded into opposing traffic.
Fail
Occupant Risk
D. Detached elements, fragments or other debris from the test article should not penetrate or show potential for penetrating the occupant compartment, or present an undue hazard to other traffic, pedestrians, or personnel in a work zone. Deformation of, or intrusions into, the occupant compartment that could cause serious injuries should not be permitted.
There were minor penetrations into the passenger compartment. Deformation was well within Report 350 guidelines.
Pass
F. The vehicle should remain upright during and after collision although moderate roll, pitching, and yawing are acceptable.
Vehicle remained upright and stable throughout the test and had a moderate roll.
Pass
Vehicle Trajectory
K. After collision it is preferable that the vehicle’s trajectory not intrude into adjacent traffic lanes.
The vehicle straddled the barrier, but maintained a relatively straight course after exiting the barrier.
Marginal Pass
L. The occupant impact velocity in the longitudinal direction should not exceed 12 m/s and the occupant ridedown acceleration in the longitudinal direction should not exceed 20 G’s.
Long. Occ. Impact Vel. = 5.25 m/s
Long. Occ. Ridedown = 3.96 g
Pass
M. The exit angle from the test article preferably should be less than 60% of the test impact angle, measured at time of the vehicle loss contact with the test article.
The vehicle remained within the preferred limit.
Pass

2 TECHNICAL DISCUSSION
60
Table 2-3. Test 672 Assessment Summary
Test No. 672 – Temporary Railing (Type K) with 2000P Date June 23, 2005 Test agency California Dept. of Transportation
Evaluation Criteria Test Results Assessment
Structural Adequacy
A. The Test article should contain and redirect the vehicle; the vehicle should not penetrate, underride, or override the installation although controlled lateral deflection on the test article is acceptable
Vehicle landed on top of the barrier and intruded into opposing traffic.
Fail
Occupant Risk
D. Detached elements, fragments or other debris from the test article should not penetrate or show potential for penetrating the occupant compartment, or present an undue hazard to other traffic, pedestrians, or personnel in a work zone. Deformation of, or intrusions into, the occupant compartment that could cause serious injuries should not be permitted.
There were minor penetrations into the passenger compartment. Deformation was well within Report 350 guidelines.
Pass
F. The vehicle should remain upright during and after collision although moderate roll, pitching, and yawing are acceptable.
Vehicle remained upright and stable throughout the test and had a moderate roll.
Pass
Vehicle Trajectory
K. After collision it is preferable that the vehicle’s trajectory not intrude into adjacent traffic lanes.
The vehicle straddled the barrier, but maintained a relatively straight course after exiting the barrier.
Marginal Pass
L. The occupant impact velocity in the longitudinal direction should not exceed 12 m/s and the occupant ridedown acceleration in the longitudinal direction should not exceed 20 G’s.
Long. Occ. Impact Vel. = 4.60 m/s
Long. Occ. Ridedown = -4.57 g
Pass
M. The exit angle from the test article preferably should be less than 60% of the test impact angle, measured at time of the vehicle loss contact with the test article.
The vehicle remained within the preferred limit.
Pass

2 TECHNICAL DISCUSSION
61
Table 2-4. Test 673 Assessment Summary
Test No. 673 – Temporary Railing (Type K) with 2000P Date August 24, 2005 Test agency California Dept. of Transportation
Evaluation Criteria Test Results Assessment
Structural Adequacy
A. The Test article should contain and redirect the vehicle; the vehicle should not penetrate, underride, or override the installation although controlled lateral deflection on the test article is acceptable
Vehicle contained and redirected. Pass
Occupant Risk
D. Detached elements, fragments or other debris from the test article should not penetrate or show potential for penetrating the occupant compartment, or present an undue hazard to other traffic, pedestrians, or personnel in a work zone. Deformation of, or intrusions into, the occupant compartment that could cause serious injuries should not be permitted.
There were minor penetrations into the passenger compartment. Deformation was well within Report 350 guidelines.
Pass
F. The vehicle should remain upright during and after collision although moderate roll, pitching, and yawing are acceptable.
Vehicle remained upright and stable throughout the test.
Pass
Vehicle Trajectory
K. After collision it is preferable that the vehicle’s trajectory not intrude into adjacent traffic lanes.
The vehicle maintained a relatively straight course after exiting the barrier.
Pass
L. The occupant impact velocity in the longitudinal direction should not exceed 12 m/s and the occupant ridedown acceleration in the longitudinal direction should not exceed 20 G’s.
Long. Occ. Impact Vel. = 5.25 m/s
Long. Occ. Ridedown = 3.96 g
Pass
M. The exit angle from the test article preferably should be less than 60% of the test impact angle, measured at time of the vehicle loss contact with the test article.
The vehicle remained within the preferred limit.
Pass

2 TECHNICAL DISCUSSION
62
Table 2-5. Test 674 Assessment Summary Test No. 674 – Temporary Railing (Type K) with 2000P Date October 5, 2005 Test agency California Dept. of Transportation
Evaluation Criteria Test Results Assessment
Structural Adequacy
A. The Test article should contain and redirect the vehicle; the vehicle should not penetrate, underride, or override the installation although controlled lateral deflection on the test article is acceptable
Although the vehicle was contained and redirected, the AC supporting the rear stakes filed, resulting in an uncontrolled lateral deflection of the barrier.
Failure
Occupant Risk
D. Detached elements, fragments or other debris from the test article should not penetrate or show potential for penetrating the occupant compartment, or present an undue hazard to other traffic, pedestrians, or personnel in a work zone. Deformation of, or intrusions into, the occupant compartment that could cause serious injuries should not be permitted.
There were minor penetrations into the passenger compartment. Deformation was well within Report 350 guidelines. However, the level of lateral translation of the barrier and debris from the filing AC posed an undue risk the work zone personnel.
Maginal
Failure
F. The vehicle should remain upright during and after collision although moderate roll, pitching, and yawing are acceptable.
Vehicle remained upright and stable throughout the test.
Pass
Vehicle Trajectory
K. After collision it is preferable that the vehicle’s trajectory not intrude into adjacent traffic lanes.
The vehicle maintained a relatively straight course after exiting the barrier.
Pass
L. The occupant impact velocity in the longitudinal direction should not exceed 12 m/s and the occupant ridedown acceleration in the longitudinal direction should not exceed 20 G’s.
Long. Occ. Impact Vel. = 3.80 m/s
Long. Occ. Ridedown = -5.66 g
Pass
M. The exit angle from the test article preferably should be less than 60% of the test impact angle, measured at time of the vehicle loss contact with the test article.
The vehicle remained within the preferred limit.
Pass

2 TECHNICAL DISCUSSION
63
Table 2-6. Test 675 Assessment Summary Test No. 675 – Temporary Railing (Type K) with 2000P Date October 25, 2005 Test agency California Dept. of Transportation
Evaluation Criteria Test Results Assessment
Structural Adequacy
A. The Test article should contain and redirect the vehicle; the vehicle should not penetrate, underride, or override the installation although controlled lateral deflection on the test article is acceptable
Vehicle contained and redirected. Pass
Occupant Risk
D. Detached elements, fragments or other debris from the test article should not penetrate or show potential for penetrating the occupant compartment, or present an undue hazard to other traffic, pedestrians, or personnel in a work zone. Deformation of, or intrusions into, the occupant compartment that could cause serious injuries should not be permitted.
There were minor penetrations into the passenger compartment. Deformation was well within Report 350 guidelines.
Pass
F. The vehicle should remain upright during and after collision although moderate roll, pitching, and yawing are acceptable.
Vehicle remained upright and stable throughout the test and had a moderate roll.
Pass
Vehicle Trajectory
K. After collision it is preferable that the vehicle’s trajectory not intrude into adjacent traffic lanes.
The vehicle maintained a relatively straight course after exiting the barrier.
Pass
L. The occupant impact velocity in the longitudinal direction should not exceed 12 m/s and the occupant ridedown acceleration in the longitudinal direction should not exceed 20 G’s.
Long. Occ. Impact Vel. = 4.66 m/s
Long. Occ. Ridedown = -3.68 g
Pass
M. The exit angle from the test article preferably should be less than 60% of the test impact angle, measured at time of the vehicle loss contact with the test article.
The vehicle remained within the preferred limit.
Pass

2 TECHNICAL DISCUSSION
64
Table 2-7. Test 676 Assessment Summary Test No. 676 – Temporary Railing (Type K) with 2000P Date May 16, 2006 Test agency California Dept. of Transportation
Evaluation Criteria Test Results Assessment
Structural Adequacy
A. The Test article should contain and redirect the vehicle; the vehicle should not penetrate, underride, or override the installation although controlled lateral deflection on the test article is acceptable
Vehicle rode on top of the barrier and intruded into construction zone.
Fail
Occupant Risk
D. Detached elements, fragments or other debris from the test article should not penetrate or show potential for penetrating the occupant compartment, or present an undue hazard to other traffic, pedestrians, or personnel in a work zone. Deformation of, or intrusions into, the occupant compartment that could cause serious injuries should not be permitted.
There were minor penetrations into the passenger compartment. Deformation was well within Report 350 guidelines. However, the level of lateral translation of the barrier posed added risk the work zone personnel.
Marginal Pass
F. The vehicle should remain upright during and after collision although moderate roll, pitching, and yawing are acceptable.
Vehicle rolled-over after losing contact with the barrier.
Fail
Vehicle Trajectory
K. After collision it is preferable that the vehicle’s trajectory not intrude into adjacent traffic lanes.
The vehicle did not maintained a relatively straight course after exiting the barrier.
Fail
L. The occupant impact velocity in the longitudinal direction should not exceed 12 m/s and the occupant ridedown acceleration in the longitudinal direction should not exceed 20 G’s.
Long. Occ. Impact Vel. = 3.63 m/s
Long. Occ. Ridedown = -3.86 g
Pass
M. The exit angle from the test article preferably should be less than 60% of the test impact angle, measured at time of the vehicle loss contact with the test article.
The vehicle remained within the preferred limit.
Pass
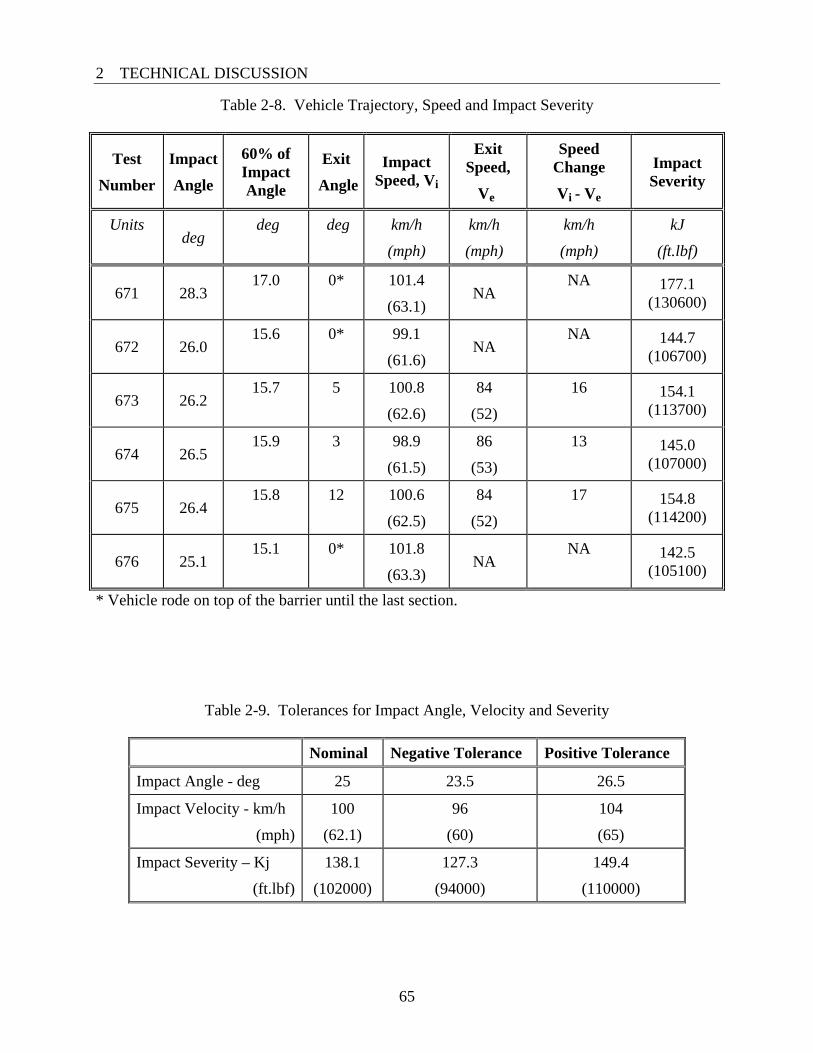
2 TECHNICAL DISCUSSION
65
Table 2-8. Vehicle Trajectory, Speed and Impact Severity
Test
Number
Impact
Angle
60% of Impact Angle
Exit
AngleImpact
Speed, Vi
Exit Speed,
Ve
Speed Change
Vi - Ve
Impact Severity
Units deg
deg deg km/h
(mph)
km/h
(mph)
km/h
(mph)
kJ
(ft.lbf)
671 28.3 17.0 0* 101.4
(63.1) NA
NA 177.1 (130600)
672 26.0 15.6 0* 99.1
(61.6) NA
NA 144.7 (106700)
673 26.2 15.7 5 100.8
(62.6)
84
(52)
16 154.1 (113700)
674 26.5 15.9 3 98.9
(61.5)
86
(53)
13 145.0 (107000)
675 26.4 15.8 12 100.6
(62.5)
84
(52)
17 154.8 (114200)
676 25.1 15.1 0* 101.8
(63.3) NA
NA 142.5 (105100)
* Vehicle rode on top of the barrier until the last section.
Table 2-9. Tolerances for Impact Angle, Velocity and Severity
Nominal Negative Tolerance Positive Tolerance
Impact Angle - deg 25 23.5 26.5
Impact Velocity - km/h
(mph)
100
(62.1)
96
(60)
104
(65)
Impact Severity – Kj
(ft.lbf)
138.1
(102000)
127.3
(94000)
149.4
(110000)
3 CONCLUSIONS
66
3. CONCLUSIONS Based on the testing of the K-rail as described in this report, the following conclusions
can be drawn:
1. The staking configurations in Tests 671 and 672 resulted in the test vehicles overriding
the barrier into opposing traffic and are unacceptable as longitudinal TL-3 median barrier configurations. It was concluded that additional testing would have to balance the need for minimal lateral deflection with minimal barrier leaning. The front of the barrier would have to be kept down.
2. The staking configuration in Test 673 successfully contained and redirected a 2000-kg (4410-lbm) pickup truck impacting at 25° and 100 km/h (62.1 mph) and is a good staking configuration for use in TL-3 median applications.
3. Although the staking configuration in Test 674 successfully contained and redirected a 2000-kg (4410-lbm) pickup truck impacting at 25° and 100 km/h (62.1 mph), damage to the pavement and the high lateral deflection make this configuration a danger to work zone personnel. Therefore this configuration is unacceptable for use adjacent to an excavation.
4. The staking configuration in Test 675 placed stakes only on the traffic side of the barrier to maximize the amount of ground resistance behind the stake and to minimize the amount of barrier lean. This configuration successfully contained and redirected a 2000-kg (4410-lbm) pickup truck impacting at 25° and 100 km/h (62.1 mph) and is a good staking configuration for use in TL-3 applications where placing K-rail adjacent to an excavation is necessary.
5. The staking configuration in Test 676 resulted in the vehicle overriding the barrier and rolling over. This configuration is unacceptable in a TL-3 application. After Test 676, it was concluded that the least number of capped stakes that could be used to safely restrain K-rail is two stakes per segment.
6. Damage to installations of K-rail in crashes similar to the tests conducted for this project will result in small to moderate amounts of scraping and spalling of the rail and deformation to the connection loops and pins.
7. Damage to the asphalt concrete from the stakes was minimal before and after impact with the exception of Test 674. The hole in the asphalt concrete after a stake was removed measured approximately 25 mm x 380 mm (1 in x 15 in)
8. Capped stakes provided uplift resistance and greater lateral resistance than uncapped stakes.
9. The K-rail stakes on the side opposite of impact, while adding shear strength, also create a pivot point upon impact. However, stakes within 305 mm (12 in) of the excavation tear out and add little shear strength as in test 674
4 RECOMMENDATIONS
67
4. RECOMMENDATIONS Based on the conclusions, the following are recommended:
1. When K-rail is placed as a semi-permanent median barrier on low and high-speed highways with less than 610 mm (24 in) from the edge of travel way, using four capped stakes per every other segment is an acceptable option where the first and last segments are staked.
2. When K-rail is placed between 75 and 610 mm (3 and 24 in) from the edge of an excavation on low and high-speed highways, use two capped stakes per segment along the traffic side.
3. Placing K-rail less than 75 mm (3 in) from an excavation is not recommended even with staking.
4. The minimum recommended depth for the asphalt concrete supporting staked K-rail is 100 mm (4 in).
5. The staking of K-rail is not recommended for permanent installations due to concern for decreasing performance of the stakes over time.
6. The stakes should be capped in a manor similar to what was used in this testing.

4 RECOMMENDATIONS
68
5. IMPLEMENTATION The Caltrans Division of Traffic Operations and Construction will be responsible for
creating and distributing a policy memo dictating the appropriate staking configuration for any future K-rail installations.

6 REFERENCES
69
6. REFERENCES
1. H.E. Ross, D.L. Sicking, R.A. Zimmer, and J.D. Michie. “Recommended Procedures for the Safety Performance Evaluation of Highway Features,” Transportation Research Board (NCHRP), National Cooperative Highway Research Program Report 350, 1993.
2. Department of Transportation, Division of Traffic Operations. “Long-Term Installations of K-rail.” Memo to All District Division Chiefs, State of California, California. 28 November 1994.
3. Rich Peter and John Jewell. “Compliance Crash Testing of K-rail Used in Semi- Permanent Installations,” California Department of Transportation, October 1999.
4. E.F. Nordlin, W.R. Juergens, J.R. Stoker, R.L. Stoughton, R.N. Doty, E.J. Tye, R.A. Pelkey, and W.F. Crozier. “Dynamic Tests of Prestressed Concrete Median Barrier Type 50, Series XXVI,” Materials and Research Department, California Division of Highways, 1973.
5. “NCHRP Report 350 Crash Test Results for the Idaho 6095-mm Concrete Barrier,” E-TECH Testing Services Inc, April 2000.
6. Bob W. Bielenberg, John D. Reid, Ronald K. Faller, John R. Rohde, and Dean L, Sicking. “Tie-Downs and Transitions for Temporary Concrete Barriers,” Journal of the Transportation Research Board, No.1984, Transportation Research Board, Highway Facility Design 2006.

7 APPENDIX
70
7. APPENDIX
7.1. Test Vehicle
7.1.1. Equipment The test vehicles were modified as follows for the crash tests: • The gas tanks on the test vehicles were disconnected from the fuel supply line and drained.
A 12-liter (3.2-gal) safety gas tank was installed in the truck bed or rear cargo area and connected to the fuel supply line. The stock fuel tanks had dry ice or gaseous CO2 added to purge fuel vapors.
• One 12-volt, deep-cycle, gel cell motorcycle storage battery was mounted in the vehicle. The battery operated the solenoid-valve braking/accelerator system, rate gyros, and the electronic control box. Two additional 12-volt, deep-cycle, gel cell battery powered the transient data recorder.
• A 1700-kPa (250-psi) CO2 system, actuated by a solenoid valve, controlled remote braking after impact and emergency braking if necessary. This system included a pneumatic ram that was attached to the brake pedal. The operating pressure for the ram was adjusted through a pressure regulator during a series of trial runs prior to the actual test. Adjustments were made to assure the shortest stopping distance without locking up the wheels. When activated, the brakes could be applied in less than 100 milliseconds.
• The remote brakes were controlled via a radio link transmitter. When the brakes were applied by remote control from the console trailer, the ignition was also automatically rendered inoperable by removing power to the coil.
• For all self-propelled vehicle tests, an accelerator switch was located on the rear of the vehicle. The switch opened an electric solenoid, which in turn released compressed CO2 from a reservoir into a pneumatic ram that had been attached to the accelerator pedal. The CO2 pressure for the accelerator ram was regulated to the same pressure of the remote braking system. The speed at which the ram extended was adjusted via a needle valve.
• For all self-propelled vehicle tests a speed control device, connected in-line with the primary winding of the coil, was used to regulate the speed of the test vehicle based on the signal from a speed sensor output from the vehicle transmission. This device was calibrated prior to all tests by conducting a series of trial runs through a speed trap comprised of two tape switches set a specified distance apart and a digital timer. When the speed control device was not compatible with the vehicle, a series of tests were performed to acquire the distance for the vehicle to reach a specified speed. During the tests, a driver would immediately press the accelerator pedal to the floorboard to simulate the pneumatic ram. The vehicle would start at a set distance from the tape switches. Depending on the speed result, the vehicle would be shifted closer or further away from the tape switches. After the vehicle reached the specified speed from a location three consecutive times, the starting distance was determined for the actual test.
• For all self-propelled vehicle tests a micro switch was mounted below the front bumper and connected to the ignition system. A trip plate on the ground near the impact point triggered the switch as the car passed over it. The switch would open the ignition circuit and shut off the vehicle’s engine prior to impact.

7 APPENDIX
71
7.1.2. Vehicle Parameters
Table 7-1 through Table 7-6 gives specific information regarding vehicle dimensions and weights for Tests 671 through 676.
Table 7-1. Test 671 Vehicle Dimensions
VEHICLE DIMENSIONS Test #: 671 DATE: 04-04-04 TEST NO: 671 VIN: 1GTFC24K2NE532112 MAKE: GMC
MODEL: 2500 SIERRA YEAR: 1992 ODOMETER: 176177 mi TIRE SIZE: LT 225/75R16
TIRE INFLATION PRESSURE (psig): NOT RECORDED
MASS DISTRIBUTION (kg): LF 543.8 RF 551.3 LR 437.1 RR 454.5
DESCRIBE ANY DAMAGE TO VEHICLE PRIOR TO TEST: none
ENGINE TYPE: V8
ENGINE CID: 350
TRANSMISSION TYPE:
X AUTO
MANUAL
OPTIONAL EQUIPMENT: none
DUMMY DATA:
TYPE: N/A
MASS: N/A
SEAT POSITION: N/A
GEOMETRY (mm):
A 1900 D 1790 G 1497 K 632 N 1558 Q 445
B 900 E 1330 H L 77 O 1612
C 3335 F 5560 J 1045 M P 745
MASS (kg) CURB TEST INERTIAL GROSS STATIC
M1 1110.2 1095.1 1095.1
M2 874.7 891.6 891.6
MT 1984.9 1986.7 1986.7
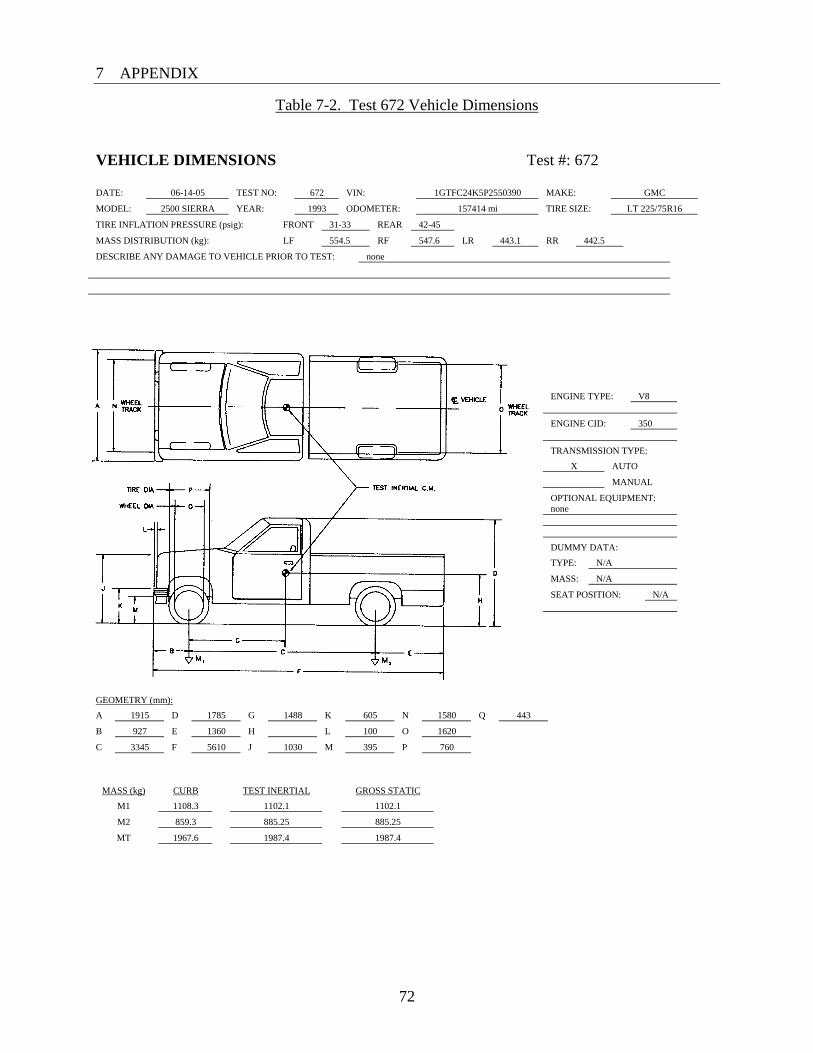
7 APPENDIX
72
Table 7-2. Test 672 Vehicle Dimensions
VEHICLE DIMENSIONS Test #: 672
ENGINE TYPE: V8
ENGINE CID: 350
TRANSMISSION TYPE:
X AUTO
MANUAL
OPTIONAL EQUIPMENT: none
DUMMY DATA:
TYPE: N/A
MASS: N/A
SEAT POSITION: N/A
GEOMETRY (mm):
A 1915 D 1785 G 1488 K 605 N 1580 Q 443
B 927 E 1360 H L 100 O 1620
C 3345 F 5610 J 1030 M 395 P 760
MASS (kg) CURB TEST INERTIAL GROSS STATIC
M1 1108.3 1102.1 1102.1
M2 859.3 885.25 885.25
MT 1967.6 1987.4 1987.4
DATE: 06-14-05 TEST NO: 672 VIN: 1GTFC24K5P2550390 MAKE: GMC
MODEL: 2500 SIERRA YEAR: 1993 ODOMETER: 157414 mi TIRE SIZE: LT 225/75R16
TIRE INFLATION PRESSURE (psig): FRONT 31-33 REAR 42-45
MASS DISTRIBUTION (kg): LF 554.5 RF 547.6 LR 443.1 RR 442.5
DESCRIBE ANY DAMAGE TO VEHICLE PRIOR TO TEST: none

7 APPENDIX
73
Table 7-3. Test 673 Vehicle Dimensions
VEHICLE DIMENSIONS Test #: 673 DATE: 08-08-05 TEST NO: 673 VIN: 1GCFC24MIVZ136702 MAKE: CHEVY
MODEL: 2500 YEAR: 1997 ODOMETER: 131456 mi TIRE SIZE: LT 245/75R16
TIRE INFLATION PRESSURE (psig): 50
MASS DISTRIBUTION (kg): LF 589.3 RF 558.4 LR 425.9 RR 442.5
DESCRIBE ANY DAMAGE TO VEHICLE PRIOR TO TEST: none
ENGINE TYPE: V8
ENGINE CID: 350
TRANSMISSION TYPE:
X AUTO
MANUAL
OPTIONAL EQUIPMENT: none
DUMMY DATA:
TYPE: N/A
MASS: N/A
SEAT POSITION: N/A
GEOMETRY (mm):
A 1900 D 1760 G 1489 K 630 N 1555 Q 440
B 910 E 1250 H L 95 O 1610
C 1760 F 5550 J 990 M 410 P 760
MASS (kg) CURB TEST INERTIAL GROSS STATIC
M1 1138.6 1147.9 1147.9
M2 812.6 868.4 868.4
MT 1951.2 2016.3 2016.3

7 APPENDIX
74
Table 7-4. Test 674 Vehicle Dimensions
VEHICLE DIMENSIONS Test #: 674 DATE: 09-16-05 TEST NO: 674 VIN: 1GCFC24HAKE227696 MAKE: GMC
MODEL: CHEYENNE YEAR: 1989 ODOMETER: 104344 mi TIRE SIZE: LT 225/75R16
TIRE INFLATION PRESSURE (psig): 50
MASS DISTRIBUTION (kg): LF 560.2 RF 528.5 LR 420.1 RR 421.1
DESCRIBE ANY DAMAGE TO VEHICLE PRIOR TO TEST: none
ENGINE TYPE: V8
ENGINE CID: 305
TRANSMISSION TYPE:
X AUTO
MANUAL
OPTIONAL EQUIPMENT: none
DUMMY DATA:
TYPE: N/A
MASS: N/A
SEAT POSITION: N/A
GEOMETRY (mm):
A 1880 D 1760 G 1460.2 K 590 N 1575 Q 440
B 890 E 1275 H L 90 O 1615
C 3350 F 5530 J 965 M 375 P 720
MASS (kg) CURB TEST INERTIAL GROSS STATIC
M1 1094.5 1088.6 1088.6
M2 807.3 841.1 841.1
MT 1901.8 1929.7 1929.7

7 APPENDIX
75
Table 7-5. Test 675 Vehicle Dimensions
VEHICLE DIMENSIONS Test #: 675 DATE: 10-18-05 TEST NO: 675 VIN: 1GCGC24K2RE107690 MAKE: CHEVROLET
MODEL: SILVERADO YEAR: 1994 ODOMETER: 119490 mi TIRE SIZE: LT 245/75R16
TIRE INFLATION PRESSURE (psig): 45
MASS DISTRIBUTION (kg): LF 566 RF 544.3 LR 447.8 RR 447.8
DESCRIBE ANY DAMAGE TO VEHICLE PRIOR TO TEST: none
ENGINE TYPE: V8
ENGINE CID: 350
TRANSMISSION TYPE:
X AUTO
MANUAL
OPTIONAL EQUIPMENT: none
DUMMY DATA:
TYPE: N/A
MASS: N/A
SEAT POSITION: N/A
GEOMETRY (mm):
A 1880 D 1800 G 1495.8 K 630 N 1590 Q 445
B 890 E 1280 H L 110 O 1620
C 3350 F 5480 J 1100 M 420 P 755
MASS (kg) CURB TEST INERTIAL GROSS STATIC
M1 1118.1 1110.3 1110.3
M2 852.8 895.6 895.6
MT 1970.9 2005.9 2005.9

7 APPENDIX
76
Table 7-6. Test 676 Vehicle Dimensions
VEHICLE DIMENSIONS Test #: 676 DATE: 03-22-06 TEST NO: 676 VIN: 1GCFC24K8J2326361 MAKE: CHEVY
MODEL: SILVERADO YEAR: 1988 ODOMETER: 139955 mi TIRE SIZE: LT 245/75R16
TIRE INFLATION PRESSURE (psig): 50
MASS DISTRIBUTION (kg): LF 554.5 RF 542.4 LR 443.6 RR 440.6
DESCRIBE ANY DAMAGE TO VEHICLE PRIOR TO TEST: none
ENGINE TYPE: V8
ENGINE CID: 350
TRANSMISSION TYPE:
X AUTO
MANUAL
OPTIONAL EQUIPMENT: none
DUMMY DATA:
TYPE: N/A
MASS: N/A
SEAT POSITION: N/A
GEOMETRY (mm):
A 1860 D 1780 G 1493.3 K 625 N 1830 Q 440
B 845 E 1310 H L 85 O 1595
C 3345 F 5500 J 1045 M 405 P 770
MASS (kg) CURB TEST INERTIAL GROSS STATIC
M1 1095.2 1096.8 1096.8
M2 837.3 884.2 884.2
MT 1932.5 1981.0 1981.0

7 APPENDIX
77
7.2. Guidance System A rail guidance system directed all vehicles into the test articles. The guidance rail,
anchored at 3.8-m (12-ft) intervals along its length, was used to guide a mechanical arm that was attached to the vehicle’s front wheel (Figure 7-1). A 10-mm (0.4-in) nylon rope was used to trigger the release mechanism on the guidance arm, thereby releasing the vehicle from the guidance system before impact.
Figure 7-1. Guidance System

7 APPENDIX
78
7.3. Photo Instrumentation Several high-speed digital cameras recorded the impact during the crash tests. Figure 7-2
shows a diagram of the camera locations. The types of cameras used are shown in Table 7-7 and their locations are shown in Table 7-8 and Table 7-9.
All of these cameras were mounted on tripods except the three that were mounted on a 10.7-m (35.1-ft) high tower directly over the impact location.
A video camera and a digital SLR camera were turned on by hand and used to obtain pan shots during the test. A switch on a console trailer near the impact area remotely triggered the other cameras. The test vehicle and test article were photographed before and after impact with digital video camera and a digital SLR camera. A film report of this project has been assembled using edited portions of the crash testing coverage.
Figure 7-2. Typical Camera Locations and Labels
Table 7-7. Camera Type
Camera Location Figure 7-2 Label Camera Upstream A Weinberger SpeedCam Visario 1500
Downstream B Weinberger SpeedCam Visario 1500 Across C Weinberger SpeedCam Visario 1500 Behind D Weinberger SpeedCam Visario 1500
Upstream Overhead E Weinberger SpeedCam Visario 1500 Center Overhead F Weinberger SpeedCam Visario 1500
Downstream Overhead G Weinberger SpeedCam Visario 1500 Pan Digital Camera H Canon XL-1 Digital SLR Camera J Nikon D2X
Ground Camera K Weinberger SpeedCam Visario 1500 Ground Pan Camera L Canon XL-1
79
7 APPEN
DIX
Table 7-8. Camera Locations for Test 671 through Test 673
(Relative to the Critical Impact Point)
Test #671 Test #672 Test #673 Camera Location
Figure 7-2 Label x y z x y z x y z
Upstream A -35.7 mm -330 mm 1 m -36.6 m 0 m 1 m -37 m 0 m 1 m
Downstream B 65.2 m 145 mm 1 m 75.3 m 0 m 1 m 508 mm 74 m 1 m
Across C -2.6 m -19.4 m 1 m -711 mm -17.3 m 1 m 2 m -18.8 m 1 m
Behind D 22.5 m 9.8 m 1 m 28.8 m 10.7 m 1 m 27.3 m 10.9 m 1 m
Upstream Overhead E -457 mm 0 m 9.1 m -457 mm 0 mm 9.1 m -457 mm 0 mm 9.1 m
Center Overhead F 0 mm 0 mm 9.1 m 0 mm 0 mm 9.1 m 0 mm 0 mm 9.1 m
Downstream Overhead G 457 mm 0 mm 9.1 m 457 mm 0 mm 9.1 m 457 mm 0 mm 9.1 m
Pan Digital Camera H -2.5 m -21.6 m 5 m 3.5 m -20.4 m 5 m 4.6 m -19.6 m 5 m
Digital SLR Camera J -1575 mm -21.6 m 5 m 4.5 m -20.4 m 5 m 3.5 m -20 m 5 m
Ground Camera K - - - -3.8 m 2 m - - - -
Ground Pan Camera L - - - - - - - - -

80
7 APPEN
DIX
Table 7-9. Camera Locations for Test 674 through Test 676
(Relative to the Critical Impact Point)
Test #674 Test #675 Test #676 Camera Location
Figure 7-2 Label x y z x y z x y z
Upstream A -42.4 m 0 m 1 m -30.8 m 0 m 1 m
Downstream B 85 m 0 m 1 m 74.6 m 0 m 1 m
Across C -1092 mm -14.7 m 1 m -1.4 m -16.4 m 1 m
Behind D 28.3 m 10.7 m 1 m 4.2 m 18.2 m 1 m
Upstream Overhead E -457 mm 0 mm 9.1 m -457 mm 0 mm 9.1 m
Center Overhead F 0 mm 0 mm 9.1 m 0 mm 0 mm 9.1 m
Downstream Overhead G 457 mm 0 mm 9.1 m 457 mm 0 mm 9.1 m
Pan Digital Camera H 4.5 m -15.7 m 5 m 4.5 m -15.7 m 5 m
Digital SLR Camera J 6.3 m -15.8 m 5 m 6.3 m -15.8 m 5 m
Ground Camera K - - - - - -
Ground Pan Camera L 2 m -14.8 m 305 mm
Locations not recorded
- - -

7 APPENDIX
81
7.4. Video Analysis Visual Fusion, video analysis software, was used to verify the impact speed and to
obtain the impact angle, exit angle, exit speed, brake application time, and the maximum yaw, pitch, and roll angles.
The following are the pretest procedures that are completed to enable film data analysis: 1. Butterfly targets were attached to the top and sides of each test vehicle. The
targets were located on the vehicle at intervals of 0.5 and 1.0 meters (1.64 and 3.28 ft). The targets established scale factors and horizontal and vertical alignment.
2. Flashbulbs, mounted on the test vehicle, were electronically triggered to establish 1) initial vehicle-to-article contact, and 2) the time of the application of the vehicle brakes. The impact flashbulbs begin to glow immediately upon activation, but have a delay of several milliseconds before lighting up to full intensity.

7 APPENDIX
82
7.5. Detailed Drawings of Test Article
Figure 7-3. K-rail Standard Plan (2004)

7 APPENDIX
83
Figure 7-4. Typical Uncapped Stake Installation Layout

7 APPENDIX
84
Figure 7-5. Typical Capped Stake Installation Layout

7 APPENDIX
85
Figure 7-6. Capped Stake Dimensions [mm]

7 APPENDIX
86
7.6. Test Article Installation The K-rail barrier was placed on a surveyed line using a forklift with lifting
hooks. The pins were placed in the pin-and-loop connection by hand. The barrier was not pull tight to maintain some of the slack in the joints. Holes in the asphalt concrete were drilled by using the K-rail stake holes as guides for a roto-hammer and 7/8-in drill bit. The stakes were installed in the pre-drilled holes using a 60-lb (27-kg) jackhammer with a stake-driving attachment. They were driven in until the head of the stakes cleared the barrier face to prevent wheel snagging (Figure 7-4 and Figure 7-10).
Figure 7-7. Stake Installation
Figure 7-8. Forklift Carrying K-rail
Figure 7-9. Installed Uncapped Stake
Figure 7-10. Installed Capped Stake
7 APPENDIX
87
7.7. Electronic Instrumentation and Data
7.7.1. Instrumentation Transducer data were recorded on two separate GMH Engineering, Data Brick, Model II,
digital transient data recorders (TDR) that were mounted in the vehicle for all tests. The transducers mounted on the vehicle include two sets of accelerometers and one set of rate gyros at the center of gravity. The TDR data were reduced using a desktop personal computer running DADiSP 4.1. Beginning at Test 674, a new set of gyros was installed. The previous set of gyros had malfunctioned and could not be repaired. The gyro and accelerometer specifications are shown in Table 7-10. The vehicle accelerometer and gyro sign convention used throughout this report is the same as that described in NCHRP Report 350 and is shown in Figure 7-12.
A rigid stand with three retro-reflective 90° polarizing tape strips was placed on the ground near the test article and alongside the path of the test vehicle (Figure 7-11). The strips were spaced at carefully measured intervals of 1.000-m (3.281-ft). The test vehicle had an onboard optical sensor that produced sequential impulses or “event blips” that were recorded concurrently with the accelerometer signals on the TDR, serving as “event markers”. The impact velocity of the vehicle could be determined from these sensor impulses and timing cycles and the known distance between the tape strips. A pressure-sensitive tape switch on the front bumper of the vehicle closed at the instant of impact and triggered two events: 1) an “event marker” was added to the recorded data, and 2) a flashbulb mounted on the top of the vehicle was activated. Two other pressure-sensitive tape switches, connected to a speed trap, were placed 4.000-m (13.124-ft) apart just upstream of the test article specifically to establish the impact speed of the test vehicle. The layout for all of the pressure-sensitive tape switches is shown in Figure 7-11.
The data curves are shown in Figure 7-13 through Figure 7-42 and include the accelerometer and rate gyro records from the test vehicles. They also show the velocity and displacement curves for the longitudinal and lateral components. These plots were needed to calculate the occupant impact velocity defined in NCHRP Report 350. All data were analyzed using software written by DADiSP and modified by Caltrans.
S
peed
Tra
p "A
" (4
m)
Spe
ed T
rap
"B" (
4 m
)
Rig
id F
ram
e w
/ 3 R
etro
-re
flect
ive
Stri
ps a
t 1 m
O.C
.
Engine Cut-off Switch
Figure 7-11. Instrumentation Layout

7 APPENDIX
88
Table 7-10. Accelerometer and Gyro Specifications
MANUFACTURER LOCATION RANGE ORIENTATION TEST NUMBER
Endevco Vehicle’s C.G. 100 G Longitudinal (primary) ALL
Endevco Vehicle’s C.G. 100 G Lateral (primary) ALL
Endevco Vehicle’s C.G. 100 G Vertical (primary) ALL
Endevco Vehicle’s C.G. 100 G Longitudinal (secondary) ALL
Endevco Vehicle’s C.G. 100 G Lateral (secondary) ALL
Endevco Vehicle’s C.G. 100 G Vertical (secondary) ALL
Humphrey 191 mm (7.5-in) behind the C.G. (along the X-axis)
180 DEG/SEC Roll 671, 672, 673
Humphrey 191 mm (7.5-in) behind the C.G. (along the X-axis)
90 DEG/SEC Pitch 671, 672, 673
Humphrey 191 mm (7.5-in) behind the C.G. (along the X-axis)
180 DEG/SEC Yaw 671, 672, 673
BEI Systron Donner Inertial 191 mm (7.5-in) behind the C.G. (along the X-axis)
500 deg/sec Roll 674, 675, 676
BEI Systron Donner Inertial 191 mm (7.5-in) behind the C.G. (along the X-axis)
500 deg/sec Pitch 674, 675, 676
BEI Systron Donner Inertial 191 mm (7.5-in) behind the C.G. (along the X-axis)
500 deg/sec Yaw 674, 675, 676
7 APPENDIX
89
Figure 7-12. Vehicle Accelerometer and Gyro Sign Convention
7.7.2. Data Figure 7-13 through Figure 7-42 show the data for Tests 671 through 676.

7 APPEN
DIX
90
Figure 7-13. Test 671 Vehicle Accelerations Vs Time
7 APPEN
DIX
91
Figure 7-14. Test 671 Vehicle Longitudinal Acceleration, Velocity, and Distance Vs Time

7 APPEN
DIX
92
Figure 7-15. Test 671 Vehicle Lateral Acceleration, Velocity, and Distance Vs Time
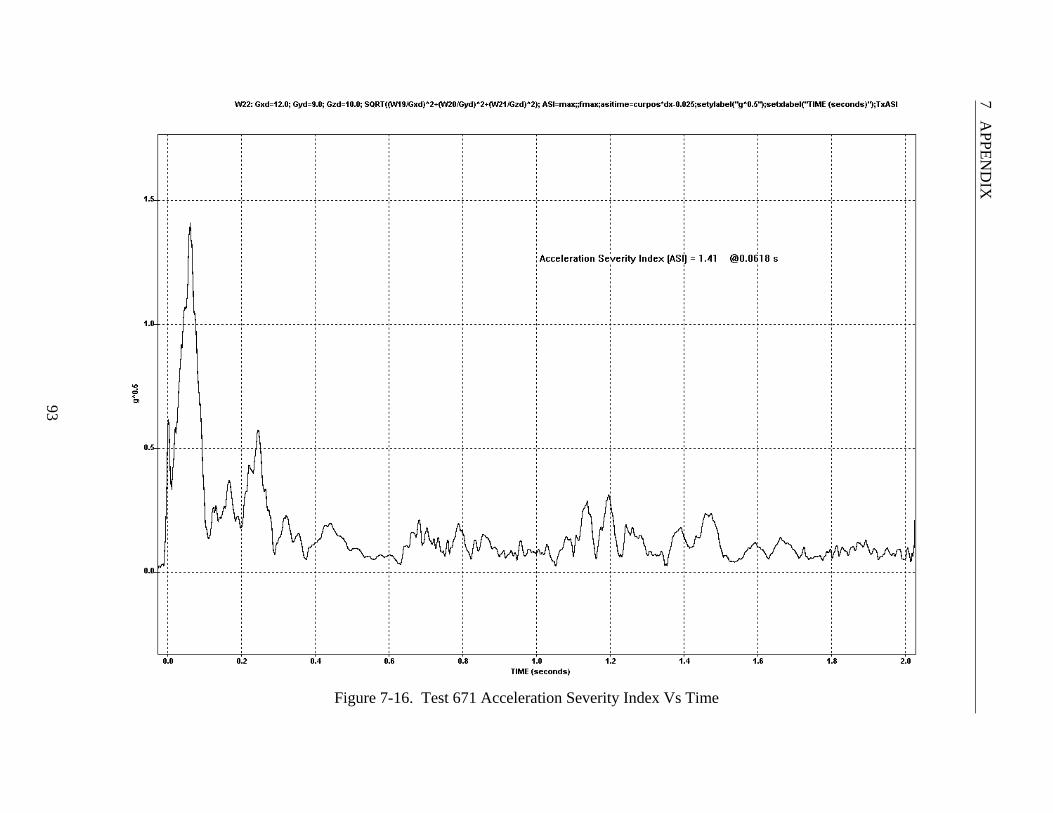
7 APPEN
DIX
93
Figure 7-16. Test 671 Acceleration Severity Index Vs Time

7 APPEN
DIX
94
Figure 7-17. Test 671 Vehicle Roll, Pitch, and Yaw Vs Time

7 APPEN
DIX
95
Figure 7-18. Test 672 Vehicle Accelerations Vs Time

7 APPEN
DIX
96
Figure 7-19. Test 672 Vehicle Longitudinal Acceleration, Velocity, and Distance Vs Time

7 APPEN
DIX
97
Figure 7-20. Test 672 Vehicle Lateral Acceleration, Velocity, and Distance Vs Time

7 APPEN
DIX
98
Figure 7-21. Test 672 Vehicle Roll, Pitch, and Yaw Vs Time

7 APPEN
DIX
99
Figure 7-22. Test 672 Acceleration Severity Index Vs Time
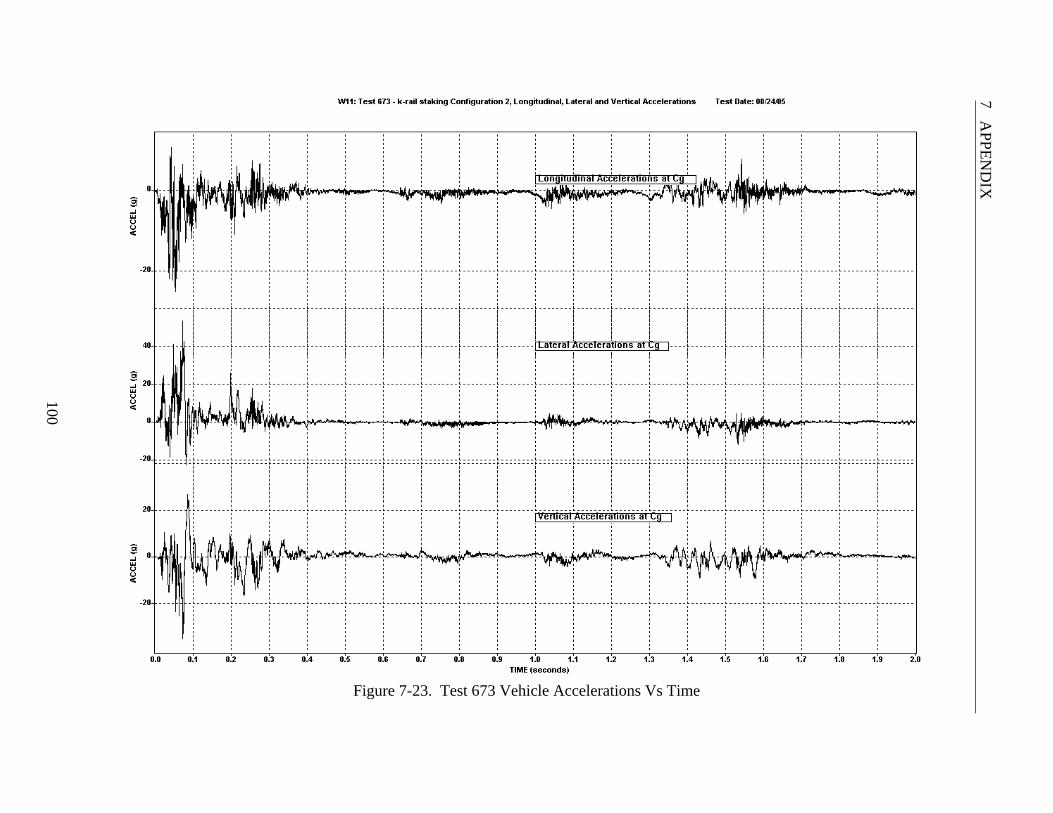
7 APPEN
DIX
100
Figure 7-23. Test 673 Vehicle Accelerations Vs Time

7 APPEN
DIX
101
Figure 7-24. Test 673 Vehicle Longitudinal Acceleration, Velocity, and Distance Vs Time

7 APPEN
DIX
102
Figure 7-25. Test 673 Vehicle Lateral Acceleration, Velocity, and Distance Vs Time

7 APPEN
DIX
103
Figure 7-26. Test 673 Vehicle Roll, Pitch, and Yaw Vs Time

7 APPEN
DIX
104
Figure 7-27. Test 673 Acceleration Severity Index Vs Time
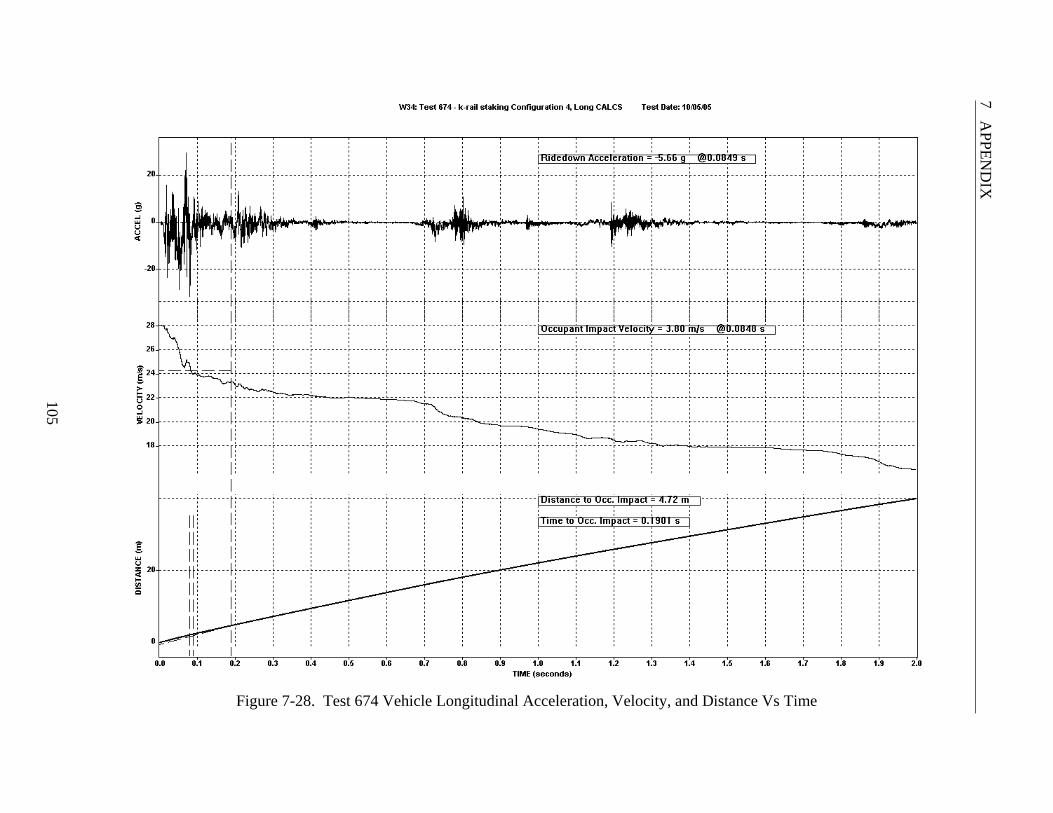
7 APPEN
DIX
105
Figure 7-28. Test 674 Vehicle Longitudinal Acceleration, Velocity, and Distance Vs Time

7 APPEN
DIX
106
Figure 7-29. Test 674 Vehicle Accelerations Vs Time

7 APPEN
DIX
107
Figure 7-30. Test 674 Vehicle Lateral Acceleration, Velocity, and Distance Vs Time

7 APPEN
DIX
108
Figure 7-31. Test 674 Vehicle Roll, Pitch, and Yaw Vs Time
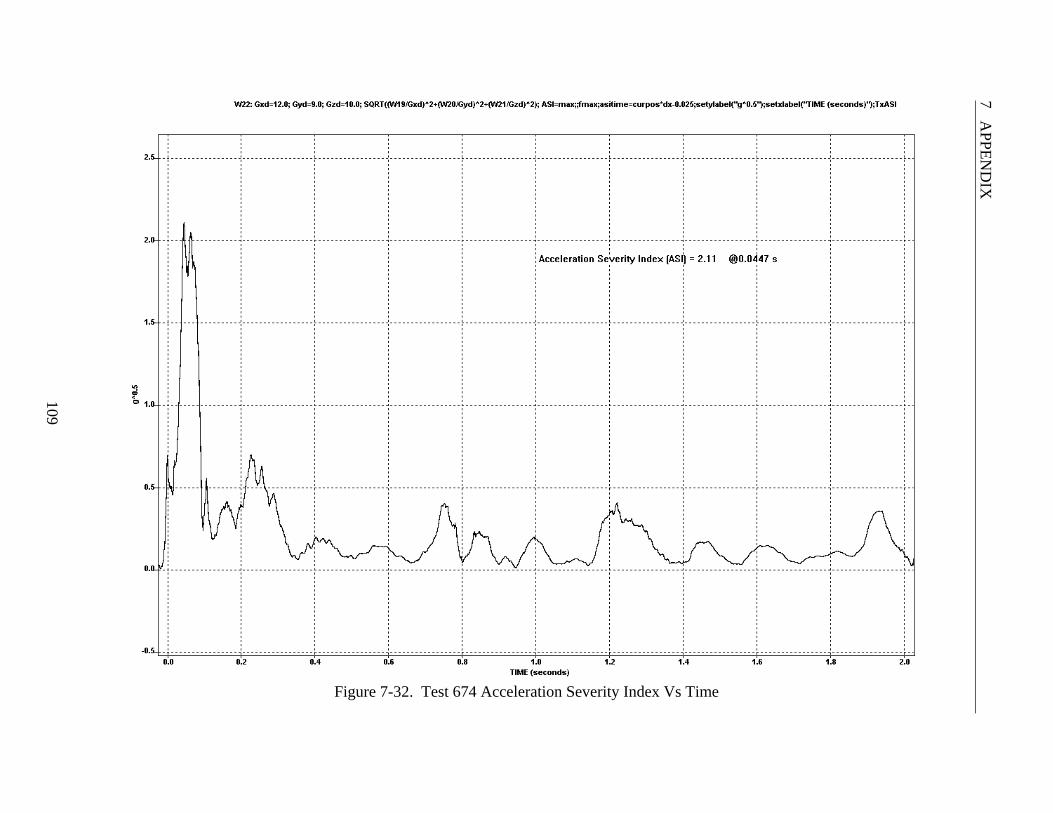
7 APPEN
DIX
109
Figure 7-32. Test 674 Acceleration Severity Index Vs Time

7 APPEN
DIX
110
Figure 7-33. Test 675 Acceleration Severity Index Vs Time

7 APPEN
DIX
111
Figure 7-34. Test 675 Vehicle Roll, Pitch, and Yaw Vs Time

7 APPEN
DIX
112
Figure 7-35. Test 675 Vehicle Accelerations Vs Time

7 APPEN
DIX
113
Figure 7-36. Test 675 Vehicle Lateral Acceleration, Velocity, and Distance Vs Time

7 APPEN
DIX
114
Figure 7-37. Test 675 Vehicle Longitudinal Acceleration, Velocity, and Distance Vs Time

7 APPEN
DIX
115
Figure 7-38. Test 676 Vehicle Accelerations Vs Time

7 APPEN
DIX
116
Figure 7-39. Test 676 Vehicle Longitudinal Acceleration, Velocity, and Distance Vs Time
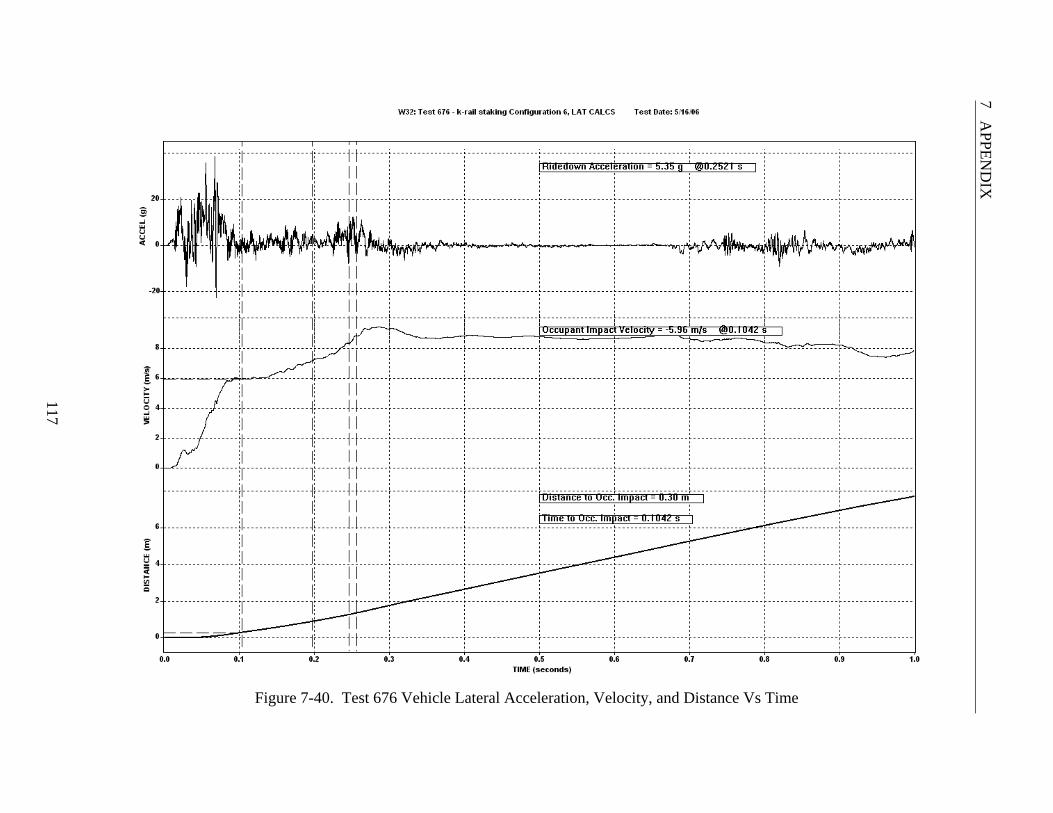
7 APPEN
DIX
117
Figure 7-40. Test 676 Vehicle Lateral Acceleration, Velocity, and Distance Vs Time

7 APPEN
DIX
118
Figure 7-41. Test 676 Vehicle Roll, Pitch, and Yaw Vs Time

7 APPEN
DIX
119
Figure 7-42. Test 676 Acceleration Severity Index Vs Time