Embed Size (px)
Citation preview
Proceedings of the International Conference on Industrial Engineering and Operations Management Bandung, Indonesia, March 6-8, 2018
© IEOM Society International
Development of Risk-Based Standardized WBS (Work
Breakdown Structure) for Quality Planning of Flyover
Works
Made Widhi Adnyana Surya Pratita
Civil Engineering Department
University of Indonesia
Salemba, Jakarta, Indonesia
Yusuf Latif
Civil Engineering Department
University of Indonesia
Salemba, Jakarta,
Indonesia
Abstract
Work Breakdown Structure (WBS) is a breakdown of project works into smaller components so it can
be better managed. It is also known that the quality of project works is also important to controlled in
order to avoid mismatch. The approaches of risk considerations are now required for the whole process
on quality management. Therefore, the development of risk-based standardized WBS is proposed for
quality planning of flyover works. The conducted research consists of several stages with qualitative risk
analysis method. The result indicate that standardized WBS consists of 5 primary levels and 2
complementary levels, with 5 dominant risk variables on quality performance and recommended risk
responses as the development of standardized WBS.
Keywords: Flyover, Project,Quality, Risk,WBS
1. Introduction
Construction activity is an important element in development. In developing countries, in order to
improve the standard of living of their people, the demand for construction project activities will
be felt. The rapidly growing construction project demands the importance of building on demand
from the owner, where the flyover building (Flyover) is part of the construction industry that is
influenced by economic parameters and psychological parameters. . The contribution of the
construction sector to the formation of gross domestic product (GDP) is also quite significant, is
10.38 percent, ranks fourth after the industrial, agricultural and trade sectors. and placed this
activity as one of the economic supporters of the capital [1 ].
In the current development of the construction world, there are a lot of projects emerging in
various types, especially in the field of infrastructure, such as the construction of toll roads,
flyovers (Flyover), and tunnels. Construction of the construction project requires knowledge,
expertise, insight, and experience in the construction world is not small. This should all be owned
2694
Proceedings of the International Conference on Industrial Engineering and Operations Management Bandung, Indonesia, March 6-8, 2018
© IEOM Society International
by all parties involved in the construction of a construction project for planners, project leaders,
construction managers, and contractors. One of the most important things to be done in the early
stages of planning a construction project is to plan the resources to be used based on the Work
Breakdown Structure [2 ].
Due to its complexity, the successful management of construction projects from the perspective of
the contractor or project implementer depends on the maturation of the planning [3 ]. Significance
of the importance of Work Breakdown Structure, as follows [4 ]:
1. The description of the program as a summary of the small parts
2. Planning.
3. Networking and supervision planning.
4. Division of responsibilities.
The need for standardized WBS is critical, as it will present an integrated approach to project
management and present the basis for performance measurement [5 ]. Therefore, the development
of a standard WBS risk-based standard flyover work designed for quality planning is proposed.
The purpose of this research to the following:
1. Make WBS Standards in flyover work.
2. Identify the implementation methods and technologies used of each flyover work package.
3. Identify activities based on the WBS-based method of implementing flyover work.
4. Identify resources based on activities on flyover work packages.
5. Identify risk-based activities and resources that affect the quality performance of each
flyover package.
The scope of the study is limited to the following:
1. The research is done from the internal side of the contractor.
2. The project under study is a project that has been implemented from 2010 to 2017.
3. Research location in Jabodetabek, Indonesia.
4. WBS developed standards are items that have a high risk on flyover work.
5. This flyover work using the box girder.
6. Quality planning referred to in the research is planning on flyover work.
2. WBS Flyover Risk-Based for Quality Planning
2.1 Standard WBS Flyover
As a technical reference for the implementation of road and bridge project works within the
Directorate General of Binamargayang applicable in Indonesia, there is a document of the general
specification of road and bridge construction works as part of contract documents of road and
bridge construction work used to achieve a product of work from the preparation process,
methods of implementation, materials, equipment, quality control, and payment procedures.
The General Specification of Binamarga 2010 has its third revision valid since November 12,
2014, since the issuance of the Director General of Highways No. 10 / SE / Db / 2014 regarding
2695
Proceedings of the International Conference on Industrial Engineering and Operations Management Bandung, Indonesia, March 6-8, 2018
© IEOM Society International
the Submission of Standard Procurement Document and General Specification 2010 (Revision 3)
for Road and Bridges Construction Works.
The General Specification Binamarga 2010 consists of 10 divisions, to the following:
1. Division 1 General
2. Division 2 Drainage
3. Division 3 Land Works
4. Division 4 Widening of Pavement and Shoulders
5. Division 5 Concrete Pavement and Concrete Pavement Pavement
6. Division 6 Asphalt pavement
7. Division 7 Structure
8. Division 8 Refund conditions and Minor works
9. Division 9 Daily Jobs
10. Division 10 Routine Maintenance
Meanwhile, as a technical reference for the implementation of freeway and toll road projects
within the Directorate General of Binamarga, both for the National Road Implementing Agency
(BPPN / BPJN) and Toll Road Enterprises (BUJT) applicable in Indonesia, there is a Special
Specification of Road Frequency and Toll Roads that have been in force since March 13, 2017,
since the issuance of the Director General of Highways No. 02 / SE / Db / 2017 concerning the
Submission of Technical Specifications and Special Specifications of Highway and Toll Road
2017 in the Directorate General of Highways.
The Special Specification of Freeway and Toll Road consists of 17 general divisions and 3 special
divisions, to the following:
1. Division 1 General
2. Division 2 Cleaning the Workplace
3. Division 3 Demolition
4. Division 4 Land Works
5. Division 5 Galian Structure
6. Division 6 Drainage
7. Division 7 Preparation of Ground
8. Division 8 Aggregate Base
9. Division 9 Pavement
10. Division 10 Concrete Structure
11. Division 11 STr structural Steel Works
12. Division 12 Other Jobs
13. Division 13 Lighting, Traffic Light and Electrical Works
14. Division 14 Plaza Tol
15. Division 15 Transfer and Protection of Existing Equipment
16. Division 16 Toll Offices and Facilities
17. Division 17 Daily Jobs
18. Division of SKh 1.09 Office and Field Facilities
19. Division of SKh 1.16 Traffic Management
20. Division of SKh 1.20 Mobilization
2696
Proceedings of the International Conference on Industrial Engineering and Operations Management Bandung, Indonesia, March 6-8, 2018
© IEOM Society International
2.2 WBS Risk-Based Official Standards
Project risk is the possibility of events that bring undesirable consequences for the project
objectives. If an event occurs then it may affect the scope of the project, schedule, cost, or quality.
Risk can be prioritized by assessing the probability of occurrence and its impact through
qualitative risk analysis [6]. Since WBS ordinary standards may not consider the project risk
response, standards-based WBS based risk is the improvement of WBS standards coupled with
the risk response associated with the project objectives and targets, in this study is the risk
response to quality performance.
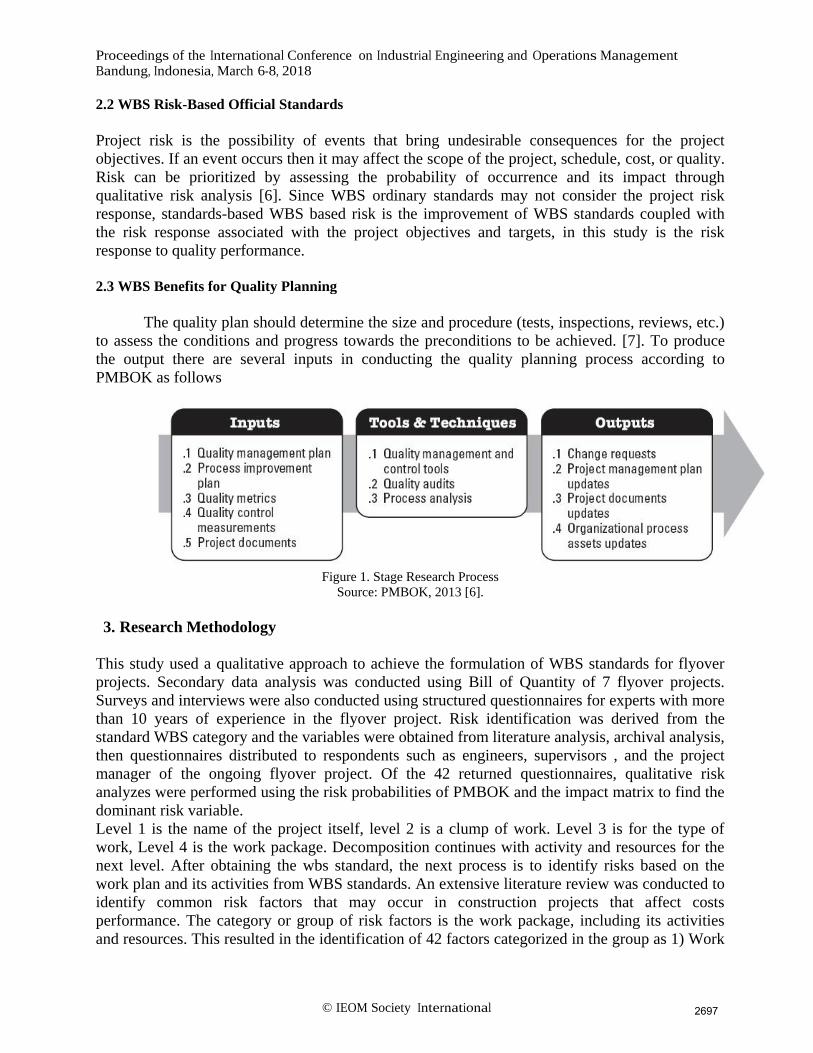
2.3 WBS Benefits for Quality Planning
The quality plan should determine the size and procedure (tests, inspections, reviews, etc.)
to assess the conditions and progress towards the preconditions to be achieved. [7]. To produce
the output there are several inputs in conducting the quality planning process according to
PMBOK as follows
Figure 1. Stage Research Process
Source: PMBOK, 2013 [6].
3. Research Methodology
This study used a qualitative approach to achieve the formulation of WBS standards for flyover
projects. Secondary data analysis was conducted using Bill of Quantity of 7 flyover projects.
Surveys and interviews were also conducted using structured questionnaires for experts with more
than 10 years of experience in the flyover project. Risk identification was derived from the
standard WBS category and the variables were obtained from literature analysis, archival analysis,
then questionnaires distributed to respondents such as engineers, supervisors , and the project
manager of the ongoing flyover project. Of the 42 returned questionnaires, qualitative risk
analyzes were performed using the risk probabilities of PMBOK and the impact matrix to find the
dominant risk variable.
Level 1 is the name of the project itself, level 2 is a clump of work. Level 3 is for the type of
work, Level 4 is the work package. Decomposition continues with activity and resources for the
next level. After obtaining the wbs standard, the next process is to identify risks based on the
work plan and its activities from WBS standards. An extensive literature review was conducted to
identify common risk factors that may occur in construction projects that affect costs
performance. The category or group of risk factors is the work package, including its activities
and resources. This resulted in the identification of 42 factors categorized in the group as 1) Work
2697
Proceedings of the International Conference on Industrial Engineering and Operations Management Bandung, Indonesia, March 6-8, 2018
© IEOM Society International
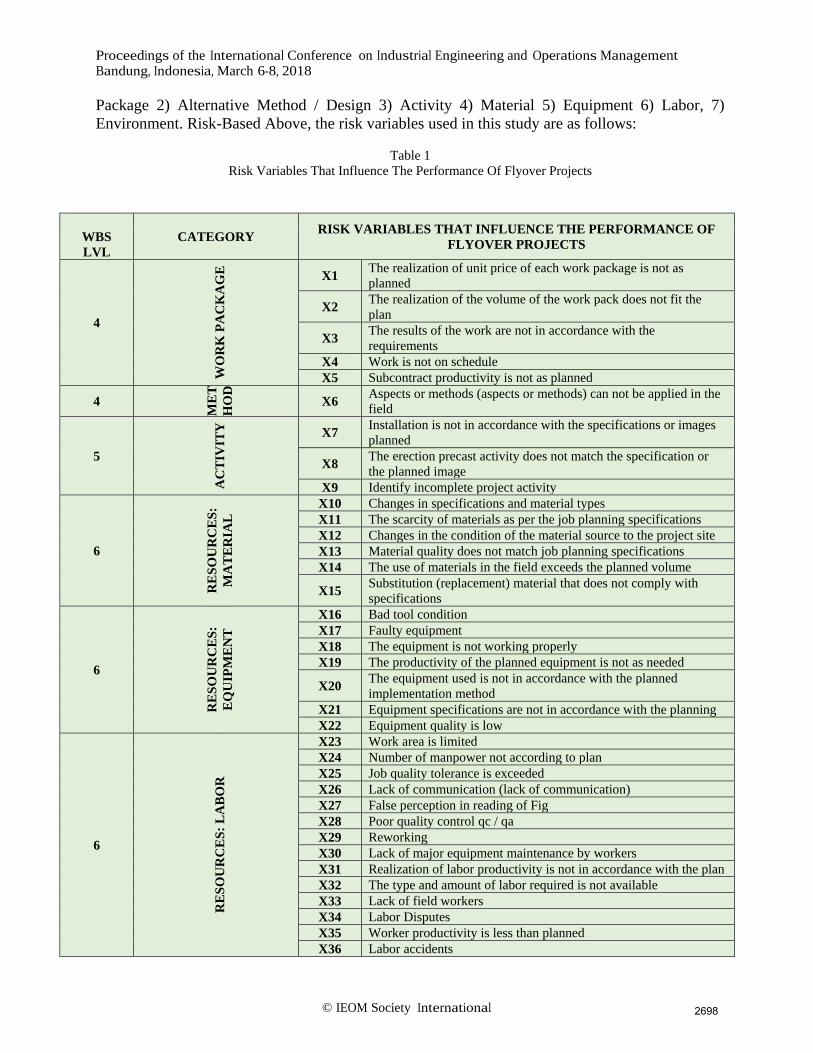
Package 2) Alternative Method / Design 3) Activity 4) Material 5) Equipment 6) Labor, 7)
Environment. Risk-Based Above, the risk variables used in this study are as follows:
Table 1
Risk Variables That Influence The Performance Of Flyover Projects
WBS
LVL
CATEGORY RISK VARIABLES THAT INFLUENCE THE PERFORMANCE OF
FLYOVER PROJECTS
4
WO
RK
PA
CK
AG
E
X1 The realization of unit price of each work package is not as
planned
X2 The realization of the volume of the work pack does not fit the
plan
X3 The results of the work are not in accordance with the
requirements
X4 Work is not on schedule
X5 Subcontract productivity is not as planned
4
ME
T
HO
D
X6 Aspects or methods (aspects or methods) can not be applied in the
field
5
AC
TIV
ITY
X7 Installation is not in accordance with the specifications or images
planned
X8 The erection precast activity does not match the specification or
the planned image
X9 Identify incomplete project activity
6
RE
SO
UR
CE
S:
MA
TE
RIA
L
X10 Changes in specifications and material types
X11 The scarcity of materials as per the job planning specifications
X12 Changes in the condition of the material source to the project site
X13 Material quality does not match job planning specifications
X14 The use of materials in the field exceeds the planned volume
X15 Substitution (replacement) material that does not comply with
specifications
6
RE
SO
UR
CE
S:
EQ
UIP
ME
NT
X16 Bad tool condition
X17 Faulty equipment
X18 The equipment is not working properly
X19 The productivity of the planned equipment is not as needed
X20 The equipment used is not in accordance with the planned
implementation method
X21 Equipment specifications are not in accordance with the planning
X22 Equipment quality is low
6
RE
SO
UR
CE
S:
LA
BO
R
X23 Work area is limited
X24 Number of manpower not according to plan
X25 Job quality tolerance is exceeded
X26 Lack of communication (lack of communication)
X27 False perception in reading of Fig
X28 Poor quality control qc / qa
X29 Reworking
X30 Lack of major equipment maintenance by workers
X31 Realization of labor productivity is not in accordance with the plan
X32 The type and amount of labor required is not available
X33 Lack of field workers
X34 Labor Disputes
X35 Worker productivity is less than planned
X36 Labor accidents
2698
Proceedings of the International Conference on Industrial Engineering and Operations Management Bandung, Indonesia, March 6-8, 2018
© IEOM Society International
WBS
LVL
CATEGORY RISK VARIABLES THAT INFLUENCE THE PERFORMANCE OF
FLYOVER PROJECTS
X37 The quality of the workforce is not as planned
X38 The division of duties and authority is not understood by the
worker
6
EN
VIR
ON
ME
NT
X39 There is no working procedure
X40 No WI (work instruction)
X41 Changes in work schedules do not take into account the weather
X42 No waste management is planned
X43 Documents of subsurface geological conditions are incompatible
with actual field conditions
X44 Document The subsurface hydrological conditions are not in
accordance with actual field conditions
X45 Natural disasters
Source: Self-processed, 2017
The data were collected using a questionnaire survey to find out the practitioners' perceptions of
risk factors. The target respondent is an experienced practitioner in the apartment construction
project. Five likert scale points were selected to obtain the probability of risk factors in the
construction project identified in the literature review. The 5-point Likert scale is adopted, where
1) represents "rare" 2) "occasionally" 3) "rather often" 4) "often", and 5) "very often". Likewise,
likert scale is also chosen to get the impact of risk factors where 1) is represented "very low", 2)
"low" 3) "Medium" 4) "high" and 5) "very high". Once the probability and impact are determined,
the risk score can be calculated by the following expression:
R = P x I
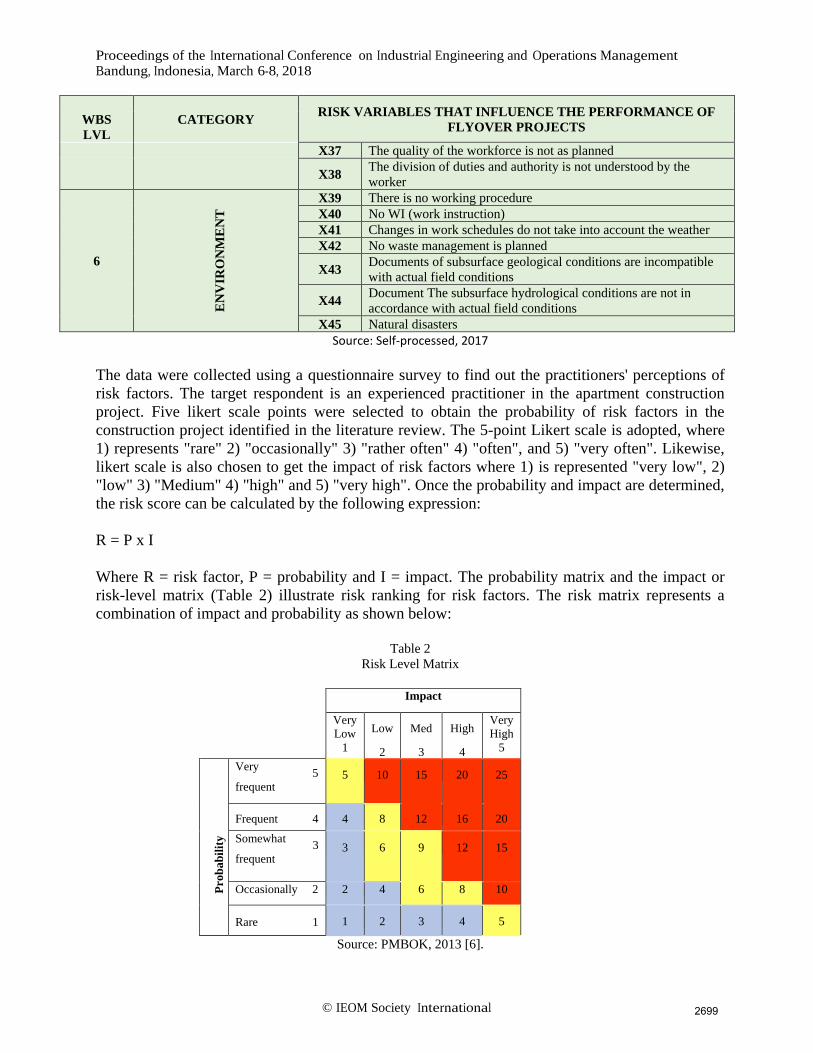
Where R = risk factor, P = probability and I = impact. The probability matrix and the impact or
risk-level matrix (Table 2) illustrate risk ranking for risk factors. The risk matrix represents a
combination of impact and probability as shown below:
Table 2
Risk Level Matrix
Impact
Very
Low
1
Low
2
Med
3
High
4
Very
High
5
Prob
ab
ilit
y
Very 5
frequent
5
10
15
20
25
Frequent 4
4
8
12
16
20
Somewhat 3
frequent
3
6
9
12
15
Occasionally 2 2 4 6 8 10
Rare 1
1
2
3
4
5
Source: PMBOK, 2013 [6].
2699
Proceedings of the International Conference on Industrial Engineering and Operations Management Bandung, Indonesia, March 6-8, 2018
© IEOM Society International
Each of the risks placed on the table will fall under one of the categories in different colors. Here
are some details about each category:
1. Height: the risk of falling on a cell is marked in red, is the most critical risk and it is should be
handled on a high priority basis. The Project team must be prepared to act immediately to
eliminate the risk completely.
2. Medium: the risk of falling in one yellow cell, may affect cost performance, is handled
directly at the project level (project manager).
3. Low risk: the risk of falling in a little blue cell effect on cost performance and handled
directly by engineers or related parties
To develop risk-based WBS, the highest ranking risk variables are analyzed for their preventive
and corrective actions through pattern recognition, as well as through the RBSxWBS matrix. The
RBSxWBS matrix is a Risk Breakdown Structure mapping that affects WBS items. The matrix
uses the dominant risk variable for RBS input, and the Pareto method as the approach to selecting
a particular job is dominant at 80% of project cost for WBS item input. The result of the risk
responses from interviews 7 experts from construction practitioners and academics with more
than 10 years of experience used to develop WBS standards.
4. Results and Discussion
4.1. Demography Result
There are 42 respondents have been re-received. Profile of respondents as summarized in
the table below: Table 3 Category Type of Respondent Institution Table 4 Respondent Education Category
Source: Self-processed, 2017
Source: Self-processed, 2017
Table 5 Position Category / Position of Respondents Table 6 Work Experience Category
Source: Self-processed, 2017
Source: Self-processed, 2017
And illustrated as shown below :
No Agency Sample
1 Contractor A 13
2 Contractor B 7
3 Contractor C 7
4 Owner D 8
5 Contractor E 7
No Education Sample
1 D3 7
2 S1 29
3 S2 6
No Job title Sample
1 Supervisor 9
2 Engineer 24
3 Project Manager 2
No Jabatan Pekerjaan Jumlah Sampel
1 <5 tahun 8
2 6-10 tahun 13
3 11-15 tahun 10
4 16-20 tahun 4
5 >20 tahun 7
2700
Proceedings of the International Conference on Industrial Engineering and Operations Management Bandung, Indonesia, March 6-8, 2018
© IEOM Society International
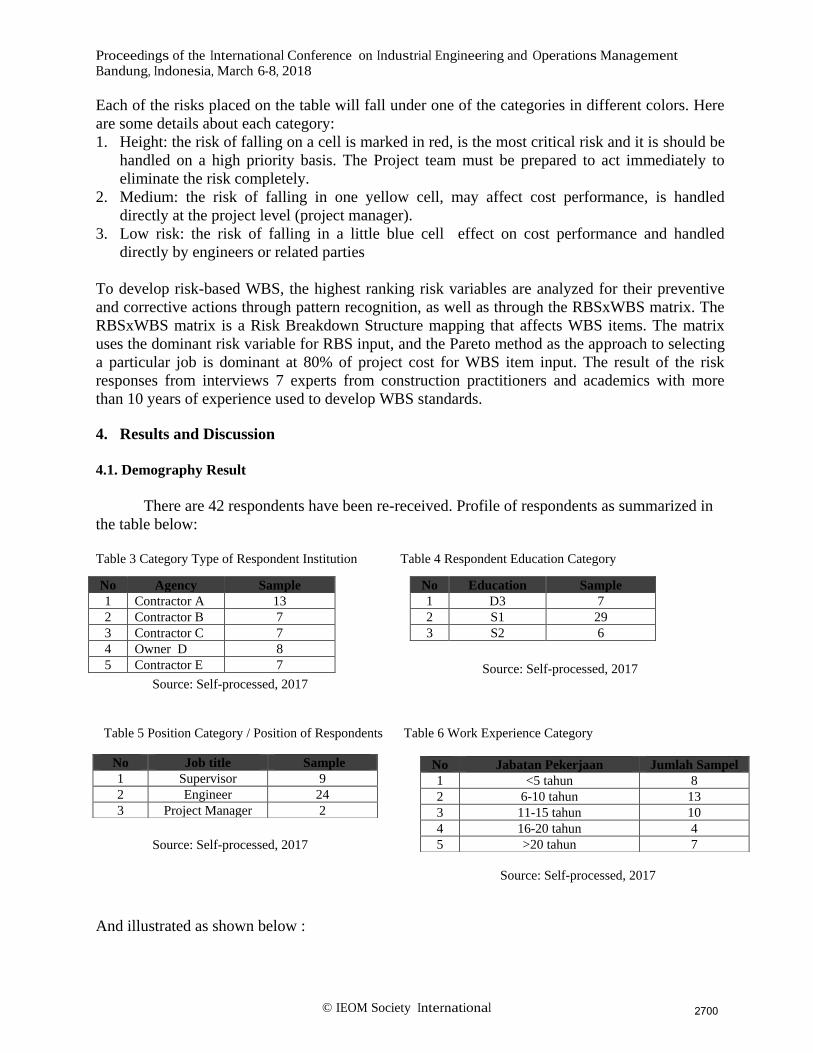
Figure 2 Data Distribution Diagram by Type of Institution Figure 3 Data Distribution Diagram by Education
Source: Self-processed, 2017 Source: Self-processed, 2017
Figure 2 indicates that the most respondets were contractor A . As shown in figure 3, shows that
majority (73%) of respondent had Bachelor degree 69,05%.
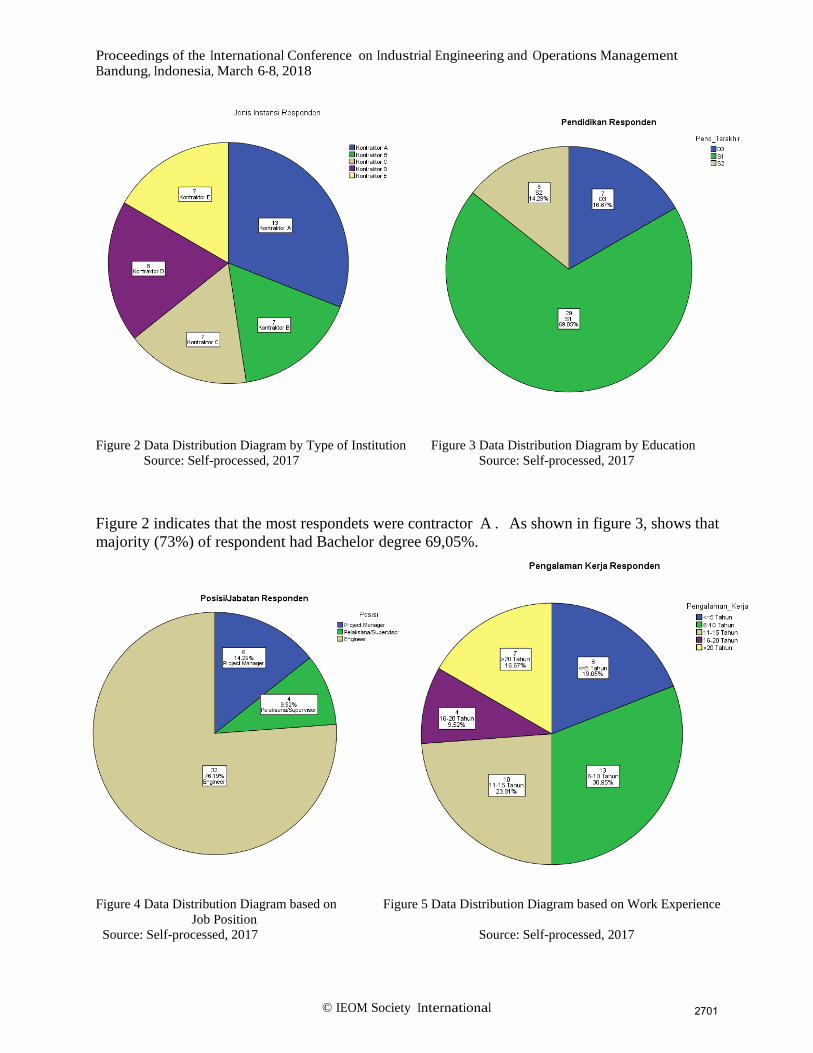
Figure 4 Data Distribution Diagram based on Figure 5 Data Distribution Diagram based on Work Experience
Job Position
Source: Self-processed, 2017 Source: Self-processed, 2017
2701
Proceedings of the International Conference on Industrial Engineering and Operations Management Bandung, Indonesia, March 6-8, 2018
© IEOM Society International
Figure 4 indicates that the most respondets were engineers 76,19%, PM or managers 14,29%
and staff 9,52%. As shown in figure 5, the respondents had various lengths of years of
experience in handling flyover works. Figure 5 shows that majority (30,95%) of respondent had
working experience 6-10 years; while 23,81% of respondents had working experience of 11 – 15
years; 19,05% of repondents had below 5 years working experience; 16,67% of respondent
had working experience above 20 years and 9,52% of the respondents had working expeerience
of 16-20 years.
Based on the above results, it appears that all variables meet the null hypothesis (Ho) because it
meets the Asymp value. Sig (2-tailed) is greater than the 0.05 level of significance (α) so there is
no significant difference of perception for all responses to the work agency, education,
occupational background, and work experience.
5.2. Test Validity and Reliability
Test Validity is used to find out how precisely a measuring instrument capable of performing
functions. Measuring tool that can be used in testing the validity of a questionnaire is the number
of correlation results between the score statement and the overall score of statement respondents
to the information in the questionnaire. While the reliability test is used to determine the
consistency of the measuring instrument, that is how the gauge can be reliable and remain
consistent if the measurement is repeated. Test Validity and reliability are used to determine the
consistency of answers. Testing the validity and reliability of this software using SPSS version 22.
Validity test uses corrected total correlation value using r value from table. In this study r table is
seen at 95% confidence level or 5% significance for 2 side test with 42 respondents, so the degree
of freedom (df) = N-2 = 40, for df = 40 has r table value 0, 3044.
While the reliability test using cronbach's alpha method. Research is said to be reliable if the
value of alpha is greater than the critical product moment r value. The conditions for test
reliability with cronbach's alpha method are as follows:
• The Cronbach Alpha value ≤ 0.6 indicates that the research questionnaire is not reliable.
• The Cronbach Alpha value ≥ 0.6 indicates that the research questionnaire is reliable.
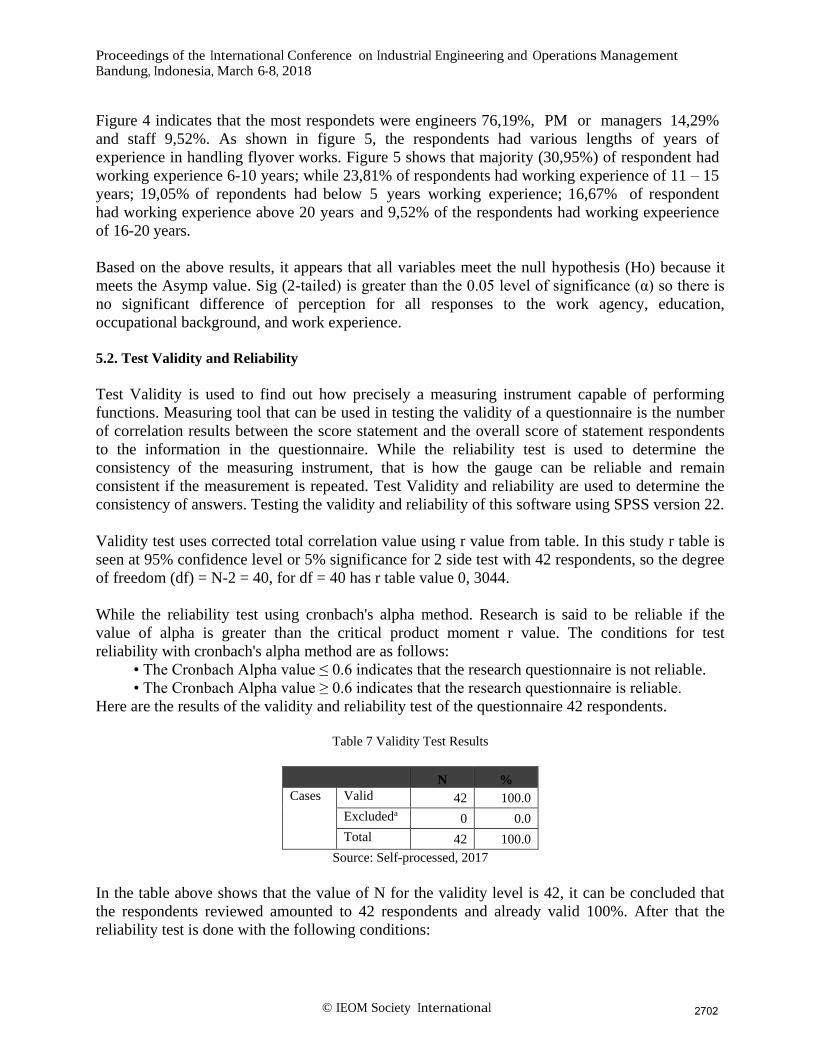
Here are the results of the validity and reliability test of the questionnaire 42 respondents.
Table 7 Validity Test Results
N %
Cases Valid 42 100.0
Excludeda 0 0.0
Total 42 100.0
Source: Self-processed, 2017
In the table above shows that the value of N for the validity level is 42, it can be concluded that
the respondents reviewed amounted to 42 respondents and already valid 100%. After that the
reliability test is done with the following conditions:
2702
Proceedings of the International Conference on Industrial Engineering and Operations Management Bandung, Indonesia, March 6-8, 2018
© IEOM Society International
• If the value of r alpha positive ≥ r table, then reliable
• If the value of r alpha negative ≤ r table, then not reliable
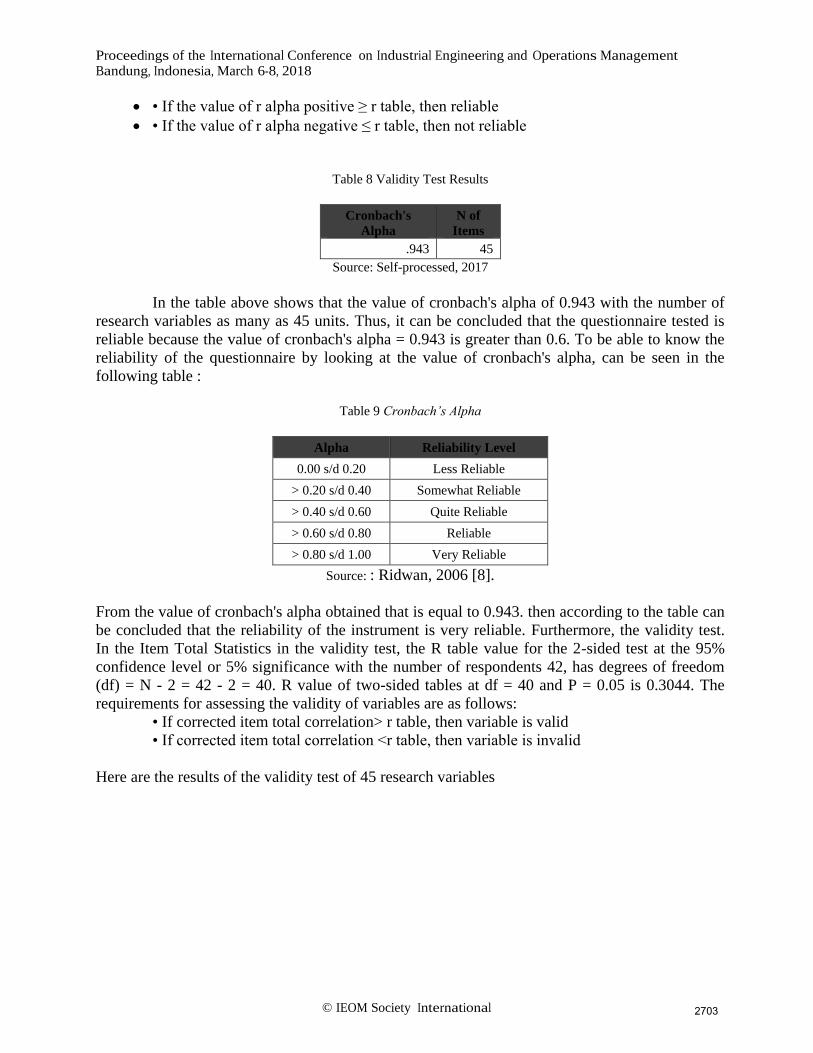
Table 8 Validity Test Results
Cronbach's
Alpha
N of
Items
.943 45
Source: Self-processed, 2017
In the table above shows that the value of cronbach's alpha of 0.943 with the number of
research variables as many as 45 units. Thus, it can be concluded that the questionnaire tested is
reliable because the value of cronbach's alpha = 0.943 is greater than 0.6. To be able to know the
reliability of the questionnaire by looking at the value of cronbach's alpha, can be seen in the
following table :
Table 9 Cronbach’s Alpha
Alpha Reliability Level
0.00 s/d 0.20 Less Reliable
> 0.20 s/d 0.40 Somewhat Reliable
> 0.40 s/d 0.60 Quite Reliable
> 0.60 s/d 0.80 Reliable
> 0.80 s/d 1.00 Very Reliable
Source: : Ridwan, 2006 [8].
From the value of cronbach's alpha obtained that is equal to 0.943. then according to the table can
be concluded that the reliability of the instrument is very reliable. Furthermore, the validity test.
In the Item Total Statistics in the validity test, the R table value for the 2-sided test at the 95%
confidence level or 5% significance with the number of respondents 42, has degrees of freedom
(df) = N - 2 = 42 - 2 = 40. R value of two-sided tables at df = 40 and P = 0.05 is 0.3044. The
requirements for assessing the validity of variables are as follows:
• If corrected item total correlation> r table, then variable is valid
• If corrected item total correlation <r table, then variable is invalid
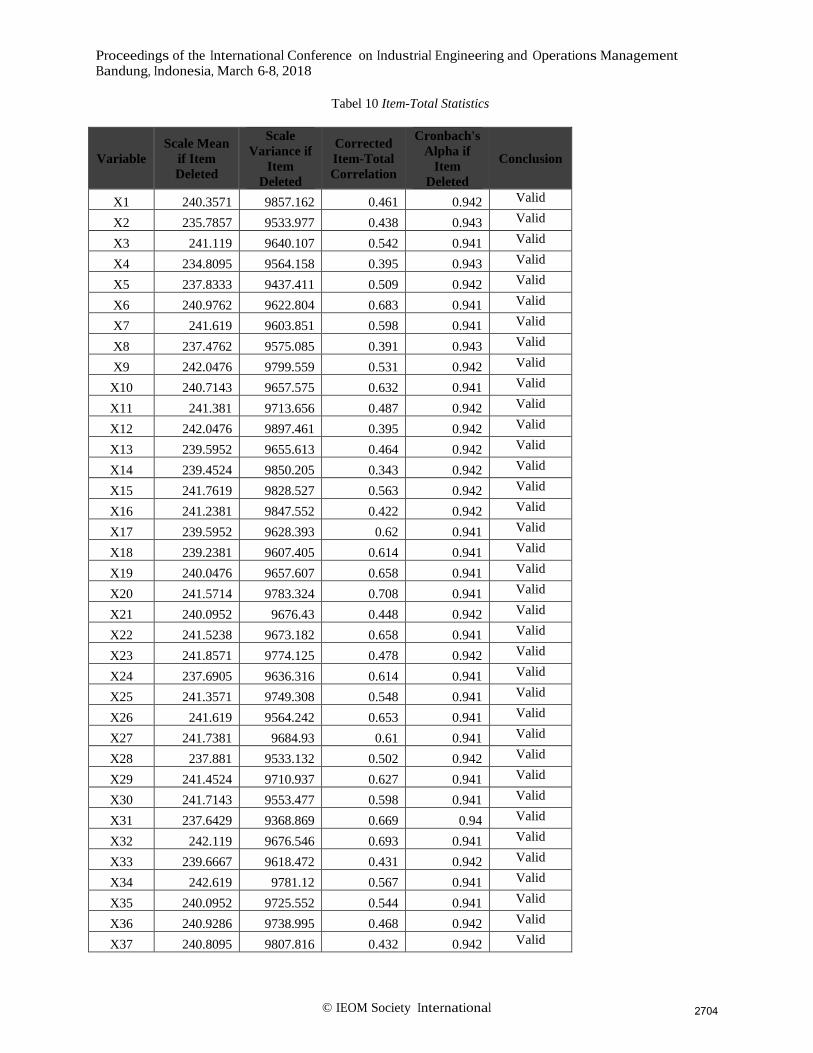
Here are the results of the validity test of 45 research variables
2703
Proceedings of the International Conference on Industrial Engineering and Operations Management Bandung, Indonesia, March 6-8, 2018
© IEOM Society International
Tabel 10 Item-Total Statistics
Variable
Scale Mean
if Item
Deleted
Scale
Variance if
Item
Deleted
Corrected
Item-Total
Correlation
Cronbach's
Alpha if
Item
Deleted
Conclusion
X1 240.3571 9857.162 0.461 0.942 Valid
X2 235.7857 9533.977 0.438 0.943 Valid
X3 241.119 9640.107 0.542 0.941 Valid
X4 234.8095 9564.158 0.395 0.943 Valid
X5 237.8333 9437.411 0.509 0.942 Valid
X6 240.9762 9622.804 0.683 0.941 Valid
X7 241.619 9603.851 0.598 0.941 Valid
X8 237.4762 9575.085 0.391 0.943 Valid
X9 242.0476 9799.559 0.531 0.942 Valid
X10 240.7143 9657.575 0.632 0.941 Valid
X11 241.381 9713.656 0.487 0.942 Valid
X12 242.0476 9897.461 0.395 0.942 Valid
X13 239.5952 9655.613 0.464 0.942 Valid
X14 239.4524 9850.205 0.343 0.942 Valid
X15 241.7619 9828.527 0.563 0.942 Valid
X16 241.2381 9847.552 0.422 0.942 Valid
X17 239.5952 9628.393 0.62 0.941 Valid
X18 239.2381 9607.405 0.614 0.941 Valid
X19 240.0476 9657.607 0.658 0.941 Valid
X20 241.5714 9783.324 0.708 0.941 Valid
X21 240.0952 9676.43 0.448 0.942 Valid
X22 241.5238 9673.182 0.658 0.941 Valid
X23 241.8571 9774.125 0.478 0.942 Valid
X24 237.6905 9636.316 0.614 0.941 Valid
X25 241.3571 9749.308 0.548 0.941 Valid
X26 241.619 9564.242 0.653 0.941 Valid
X27 241.7381 9684.93 0.61 0.941 Valid
X28 237.881 9533.132 0.502 0.942 Valid
X29 241.4524 9710.937 0.627 0.941 Valid
X30 241.7143 9553.477 0.598 0.941 Valid
X31 237.6429 9368.869 0.669 0.94 Valid
X32 242.119 9676.546 0.693 0.941 Valid
X33 239.6667 9618.472 0.431 0.942 Valid
X34 242.619 9781.12 0.567 0.941 Valid
X35 240.0952 9725.552 0.544 0.941 Valid
X36 240.9286 9738.995 0.468 0.942 Valid
X37 240.8095 9807.816 0.432 0.942 Valid
2704
Proceedings of the International Conference on Industrial Engineering and Operations Management Bandung, Indonesia, March 6-8, 2018
© IEOM Society International
Variable
Scale Mean
if Item
Deleted
Scale
Variance if
Item
Deleted
Corrected
Item-Total
Correlation
Cronbach's
Alpha if
Item
Deleted
Conclusion
X38 242.5476 9770.888 0.649 0.941 Valid
X39 242.5 9785.72 0.617 0.941 Valid
X40 242.4286 9799.178 0.56 0.941 Valid
X41 240.9286 9384.166 0.55 0.942 Valid
X42 242.3333 9773.789 0.532 0.942 Valid
X43 237.381 9500.827 0.391 0.944 Valid
X44 240.9524 9584.388 0.485 0.942 Valid
X45 242.3095 9753.097 0.561 0.941 Valid
Source: Self-processed, 2017
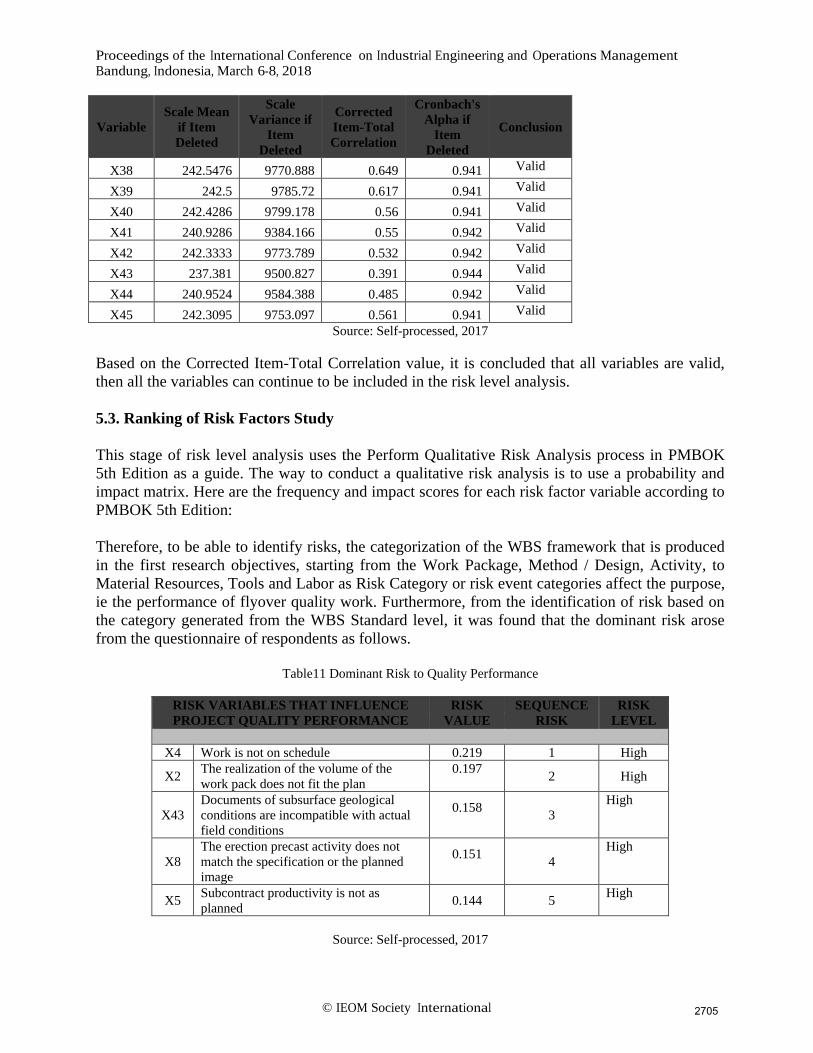
Based on the Corrected Item-Total Correlation value, it is concluded that all variables are valid,
then all the variables can continue to be included in the risk level analysis.
5.3. Ranking of Risk Factors Study
This stage of risk level analysis uses the Perform Qualitative Risk Analysis process in PMBOK
5th Edition as a guide. The way to conduct a qualitative risk analysis is to use a probability and
impact matrix. Here are the frequency and impact scores for each risk factor variable according to
PMBOK 5th Edition:
Therefore, to be able to identify risks, the categorization of the WBS framework that is produced
in the first research objectives, starting from the Work Package, Method / Design, Activity, to
Material Resources, Tools and Labor as Risk Category or risk event categories affect the purpose,
ie the performance of flyover quality work. Furthermore, from the identification of risk based on
the category generated from the WBS Standard level, it was found that the dominant risk arose
from the questionnaire of respondents as follows.
Table11 Dominant Risk to Quality Performance
RISK VARIABLES THAT INFLUENCE
PROJECT QUALITY PERFORMANCE
RISK
VALUE
SEQUENCE
RISK
RISK
LEVEL
X4 Work is not on schedule 0.219 1 High
X2 The realization of the volume of the
work pack does not fit the plan
0.197
2 High
X43
Documents of subsurface geological
conditions are incompatible with actual
field conditions
0.158
3
High
X8
The erection precast activity does not
match the specification or the planned
image
0.151
4
High
X5 Subcontract productivity is not as
planned 0.144 5
High
Source: Self-processed, 2017
2705
Proceedings of the International Conference on Industrial Engineering and Operations Management Bandung, Indonesia, March 6-8, 2018
© IEOM Society International
From the validation of the experts in this study also found that some quite frequent risk variables
in structural work, among others: X4. Work is not on schedule, X2. Realization volume of work
package not according to plan, X43. Document of subsurface geological conditions not in
accordance with actual field conditions, X8. The erection precast activity does not match the
specification or the planned image, X5. Subcontract productivity is not as planned.
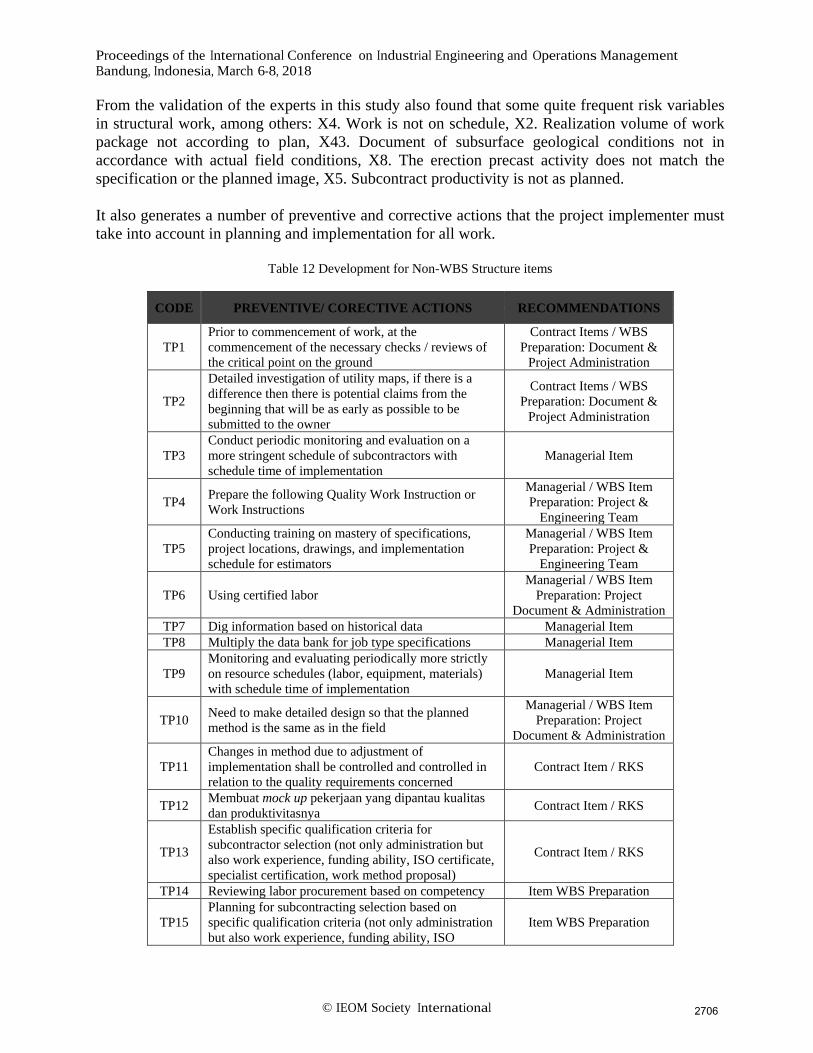
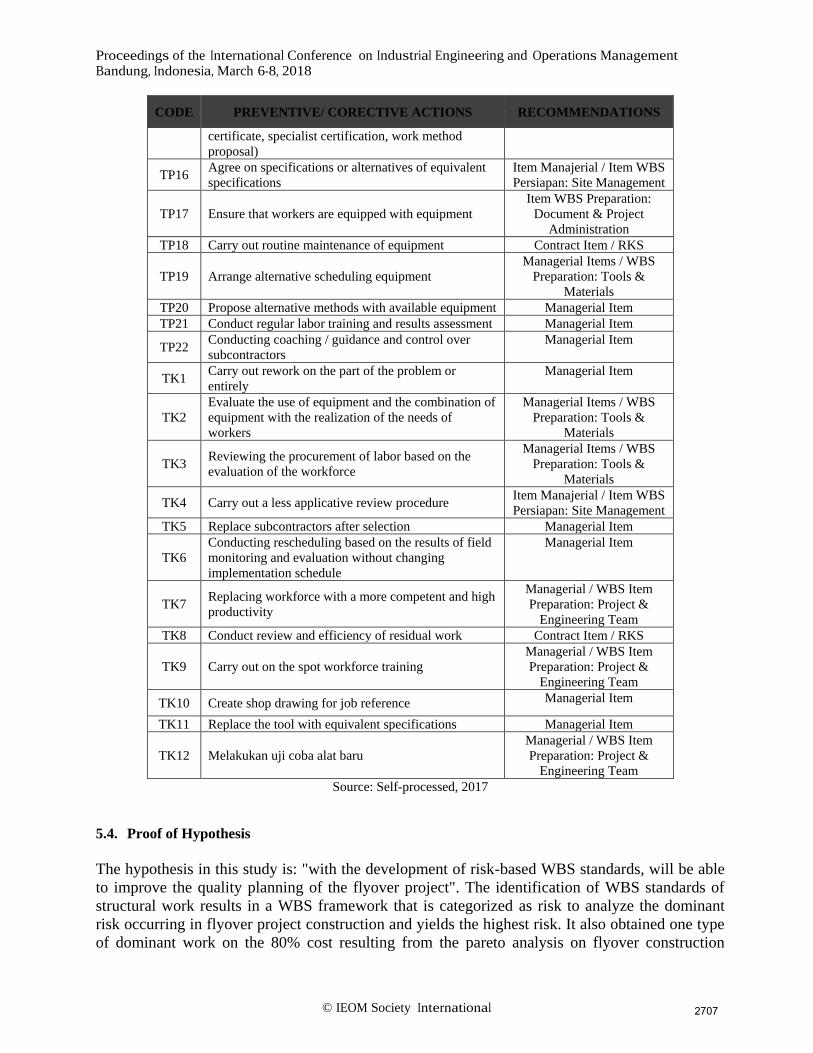
It also generates a number of preventive and corrective actions that the project implementer must
take into account in planning and implementation for all work.
Table 12 Development for Non-WBS Structure items
CODE PREVENTIVE/ CORECTIVE ACTIONS RECOMMENDATIONS
TP1
Prior to commencement of work, at the
commencement of the necessary checks / reviews of
the critical point on the ground
Contract Items / WBS
Preparation: Document &
Project Administration
TP2
Detailed investigation of utility maps, if there is a
difference then there is potential claims from the
beginning that will be as early as possible to be
submitted to the owner
Contract Items / WBS
Preparation: Document &
Project Administration
TP3
Conduct periodic monitoring and evaluation on a
more stringent schedule of subcontractors with
schedule time of implementation
Managerial Item
TP4 Prepare the following Quality Work Instruction or
Work Instructions
Managerial / WBS Item
Preparation: Project &
Engineering Team
TP5
Conducting training on mastery of specifications,
project locations, drawings, and implementation
schedule for estimators
Managerial / WBS Item
Preparation: Project &
Engineering Team
TP6 Using certified labor
Managerial / WBS Item
Preparation: Project
Document & Administration
TP7 Dig information based on historical data Managerial Item
TP8 Multiply the data bank for job type specifications Managerial Item
TP9
Monitoring and evaluating periodically more strictly
on resource schedules (labor, equipment, materials)
with schedule time of implementation
Managerial Item
TP10 Need to make detailed design so that the planned
method is the same as in the field
Managerial / WBS Item
Preparation: Project
Document & Administration
TP11
Changes in method due to adjustment of
implementation shall be controlled and controlled in
relation to the quality requirements concerned
Contract Item / RKS
TP12 Membuat mock up pekerjaan yang dipantau kualitas
dan produktivitasnya Contract Item / RKS
TP13
Establish specific qualification criteria for
subcontractor selection (not only administration but
also work experience, funding ability, ISO certificate,
specialist certification, work method proposal)
Contract Item / RKS
TP14 Reviewing labor procurement based on competency Item WBS Preparation
TP15
Planning for subcontracting selection based on
specific qualification criteria (not only administration
but also work experience, funding ability, ISO
Item WBS Preparation
2706
Proceedings of the International Conference on Industrial Engineering and Operations Management Bandung, Indonesia, March 6-8, 2018
© IEOM Society International
CODE PREVENTIVE/ CORECTIVE ACTIONS RECOMMENDATIONS
certificate, specialist certification, work method
proposal)
TP16 Agree on specifications or alternatives of equivalent
specifications
Item Manajerial / Item WBS
Persiapan: Site Management
TP17 Ensure that workers are equipped with equipment
Item WBS Preparation:
Document & Project
Administration
TP18 Carry out routine maintenance of equipment Contract Item / RKS
TP19 Arrange alternative scheduling equipment
Managerial Items / WBS
Preparation: Tools &
Materials
TP20 Propose alternative methods with available equipment Managerial Item
TP21 Conduct regular labor training and results assessment Managerial Item
TP22 Conducting coaching / guidance and control over
subcontractors
Managerial Item
TK1 Carry out rework on the part of the problem or
entirely
Managerial Item
TK2
Evaluate the use of equipment and the combination of
equipment with the realization of the needs of
workers
Managerial Items / WBS
Preparation: Tools &
Materials
TK3 Reviewing the procurement of labor based on the
evaluation of the workforce
Managerial Items / WBS
Preparation: Tools &
Materials
TK4 Carry out a less applicative review procedure Item Manajerial / Item WBS
Persiapan: Site Management
TK5 Replace subcontractors after selection Managerial Item
TK6
Conducting rescheduling based on the results of field
monitoring and evaluation without changing
implementation schedule
Managerial Item
TK7 Replacing workforce with a more competent and high
productivity
Managerial / WBS Item
Preparation: Project &
Engineering Team
TK8 Conduct review and efficiency of residual work Contract Item / RKS
TK9 Carry out on the spot workforce training
Managerial / WBS Item
Preparation: Project &
Engineering Team
TK10 Create shop drawing for job reference Managerial Item
TK11 Replace the tool with equivalent specifications Managerial Item
TK12 Melakukan uji coba alat baru
Managerial / WBS Item
Preparation: Project &
Engineering Team
Source: Self-processed, 2017
5.4. Proof of Hypothesis
The hypothesis in this study is: "with the development of risk-based WBS standards, will be able
to improve the quality planning of the flyover project". The identification of WBS standards of
structural work results in a WBS framework that is categorized as risk to analyze the dominant
risk occurring in flyover project construction and yields the highest risk. It also obtained one type
of dominant work on the 80% cost resulting from the pareto analysis on flyover construction
2707
Proceedings of the International Conference on Industrial Engineering and Operations Management Bandung, Indonesia, March 6-8, 2018
© IEOM Society International
elements, namely Structural Work. Analysis of Causes, Impacts, Preventive Actions and
Corrective Actions against these dominant risks generates recommendations or additional
activities for the Structure underlying the importance of developing the WBS Risk-based
standards, since responses to those risks can be recommendations for action on improvements to
WBS in project management .
The process of breaking down the risk and handling it from developing this WBS standard can
help project implementers to become the basis for quality planning, identifying jobs to the
smallest items and setting each quality or quality objective in more detail, accurate, and specific.
Risk responses are also considered so that risk-based WBS can be used as a control tool to ensure
work has already considered the requirements to respond to quality-related risks. Then the proven
research hypothesis.
6. Conclusion
The purpose of this research are:
1. Make WBS Standards in flyover work.
2. Identify the implementation methods and technologies used of each flyover work package.
3. Identify activities based on the WBS-based method of implementing flyover work.
4. Identify resources based on activities on flyover work packages.
5. Identify risk-based activities and resources that affect the quality performance of each flyover
package.
The first research objective indicate that standardized WBS consists of 4 primary level and 2
complementary level; The second research objective generates 5 dominant risks towards quality
performance after qualitative risk analysis, the highest risk score obtained from the category of
WBS Level 7 Labor Resources. The third research objective shows that not every risk
responses can be adopted directly into related WBS structure. Risk-based standardized WBS can
be utilized for the basis of quality planning, helping project executor identifies project works to
the smallest items and setting quality objective for each items in greater accuracy as a tool
to ensure every work has considered the requirements to respond quality-related risks.
References
Asiyanto, Manajemen Produksi Untuk Jasa Konstruksi, Pradnya Paramita, Jakarta, 2005.
Asiyanto, Manajemen Risiko untuk Kontraktor, Pradnya Paramita, Jakarta, 2009. [2]
Badan Pusat Statistik Provinsi DKI Jakarta, Statistik Daerah DKI Jakarta 2016, Katalog BPS: 1101002.31,
2016.[1]
Biffi, M. H., Linking the Estimate, the Schedule and the Cost Control through a Standardized WBS, AACE
International Transaction, 2008.
Brotherton, S. A., Fried, R. T., & S. Norman, E., Applying the Work Breakdown Structure to the Project
Management Lifecycle, PMI Global Proceedings, 2008.
Burghate, S., Burghate, M., & Burghate, N., Work Breakdown Structure: Simplifying Project Management,
International Journal of Computing Technology, Volume 2, Issue 12, 511-515, 2015.
Devi, T. R., & Reddy, S., Work Breakdown Structure of the Project. International Jornal of Engineering Research
and Applications Volume 2 Issue 2, 683-686, 2012.
Edward, S., & Gaspersz, V., Total Quality Management, Gramedia Pustaka Utama, Jakarta, 2008.
Eriyanto,. Teknik Sampling: Analisis Opini Publik, LKis Pelangi Aksara, Yogyakarta, 2007.
F.D. Postula, WBS Criteria For Effective Project Control, AACE Tran, 16, 1-7 ,1991. [3]
116 2708
Proceedings of the International Conference on Industrial Engineering and Operations Management Bandung, Indonesia, March 6-8, 2018
© IEOM Society International
Halpin, Daniel W., Construction Management, John Willey &Sons. Inc, United States, 1998
Hans, R. T., WBS a tool for software project scope variation. International Journal of Software Engineering &
Application, 2013..
Ibrahim, Y. M., Kaka, A. P., Trucco, E., Kagioglou, M., & Aouad, G., Semi Automatic Development of the Work
Breakdown Structure (WBS) for Construction Projects. International Built and Human Environment
Research, 2007. [5]
Irdemoosa, E. S., Dindarloo, S. R., & Sharifzadeh, M., Work Breakdown Structure (WBS) Development for
Underground Construction. Automation in Construction, 85-94, 2015.
Jing-jing, Z., Guo-qing, W., & Wei, Z., Research on Four-Electrical Railway Project Cost Estimate Based on the
WBS Standard Templates. International Conference on Management Science & Engineering, Vol 20, 720-
726, 2013.
Jung, Y., Moon, B. S., Kim, Y. M., & Kim, W., Integrated Cost and Schedule Control Systems for Nuclear Power
Plant Construction, Science and Technology of Nuclear Installations, 2015.
K. Yin, Prof.Dr. Robert, Studi kasus desain & metode, PT Raja Grafindo Persada, Jakarta, 2013.
Kenley, R., & Harfield, T., Reviewing the IJPM for WBS: the Search for Planning and Control. Procedia - Social and
Behavioral Sciences 119, 887-893, 2014.
Khera, R., Ransom, P., & F. Speth, T., Using work breakdown structure models to develope treatment costs,
American Water Work Association, E628-E641, 2013.
Kumar, Ranjit, Research Methodology a step-by-step guide for beginners 3rd edition, SAGE Publications Ltd.,
California, 2011.
Lai, S. T., A WBS-Based Plan Chengeability Measurement Model for Reducing Software Project Change Risk,
Lecture Notes on Software Engineering, Vol. 2, No. 1, 94-99, 2014.
Li, D., & Lu, M., Automated Generation of Work Breakdown Structure and Network Model for Earthwork Project
Planning : A Flow Network-Based Optimization Approach. Construction Egineering Mangement, 2016.
Logawa, Gunawan, Manajemen Proyek Konstruksi. Penerbit Universitas Trisakti, Jakarta, 2007.
Martinez, J. M., & Selles, M. E., A fuzzy quality cost estimation method, Fuzzy Sets and Systems 266, 157-170, 2015.
Momoh, A., Roy, R., & Shehab, E., A Work Breakdown Structure for Implementing and Costing ERP Project,
Communications of the IBIMA, Vol 6, 2008.
Nicholas, J. M., Project Management for Business and Engineering Principles and Practice, Oxford: Elsevier,
2004 [7]
Permen PUPR No. 19, Peraturan Menteri Pekerjaan Umum dan Perumahan Rakyat No. 19 Tahun 2011 tentang
Persyaratan Teknis Jalan dan Kriteria Perencanaan Teknis Jalan, 2011.
Permen PUPR No. 28, Peraturan Menteri Pekerjaan Umum dan Perumahan Rakyat No. 28 Tahun 2016 tentang
Pedoman Analisis Harga Satuan Pekerjaan Bidang Pekerjaan Umum, 2016.
Peraturan Gubernur Provinsi Daerah Khusus Ibukota Jakarta Nomor 273 Tahun 2016 tentang Organisasi dan
Tata Kerja Dinas Bina Marga. Pemerintah Provinsi DKI Jakarta, 2016.
Polonski, M., Application of The Work Breakdown Structure in Determining Cost Buffers in Construction Schedule.
Archives of Civil Engineering Vol LXI, 147-161, 2015.
Ponticelli, S., O'Brien, W., & Leite, F., Advanced Work Packaging as Emerging Planning Approach to Improve
Project Performance: Case Studies from the Industrial Costruction Sector. 5th International/11th
Construction Specialty Conference, 230-1,230-10, 2015.
Project Management Institute, Practice Standard for Work Breakdown Structures-Second Edition, 2006.
Project Management Institute, Project Management Body of Knowledge Guide - Fifth Edition, 2013. [6]
PT PP (persero)-General Contractor, Buku referensi untuk kontraktor bangunan gedung dan sipil, Gramedia Pustaka
Utama, Jakarta, 2003.
Queensland Government, Project Management Work Breakdown Structure Guide, Program Management
Improvement, Department of Transport and Main Roads, Queensland, 2007
Rafiq, M. Choudhry, Ph.D., P.E., M.ASCE; and Hafiz Zahoor, Strengths and Weaknesses of Safety Practices to
Improve Safety Performance in Construction Projects in Pakistan. Journal (ASCE)EI.1943-5541.0000292,
2016
Ridwan, Skala Pengukuran Variabel-variabel Penelitian. Alfabeta, Bandung, 2008 [8]
Su, L., WBS-based Risk Identification for the Whole Process of Real Estate Project and Countermeasures. National
Conference on Information Technology and Computer Science, 2012.
Suanda, B., Advanced & Effective Project Management, Panduan Lengkap Bagi Praktisi Manajemen Proyek
Profesional, PP Concstruction & Investment, Jakarta, 2016.
Sufren, & Natanael, Y., Belajar Otodidak SPSS, PT. Gramedia, Jakarta, 2014.
2709
Proceedings of the International Conference on Industrial Engineering and Operations Management Bandung, Indonesia, March 6-8, 2018
© IEOM Society International
Sukandarrumidi, Metodologi Penelitian: Petunjuk Praktis untuk peneliti pemula, Gadjah Mada University Press,
Yogyakarta, 2006.
Sugiyono, Metode Penelitian Bisnis, CV Alfabeta, Bandung, 2001.
Sugiyono, Statistik Untuk Penelitian, Alfabeta, Bandung, 2004.
Sugiyono, Metode Penelitian Kuantitatif, Kualitatif, dan R&D,Alfabeta, Bandung, 2009.
Sugiyono, Statistika untuk penelitian, Alfabeta, Bandung, 2013.
Tan, W., Practical Research Method, Pearson Education South Asia Pte Ltd., Singapore, 2011.
Tangoro, D., Somaatmadja, S., & Sukardi, K., Teknologi Bangunan, UI Press, Jakarta, 2007.
UU RI No. 2, Undang-Undang RI No. 2 Tahun 2017 tentang Jasa Konstruksi, 2017.
Veronika, A., Risk Management : The Unknown, AVENEW Indonesia, Jakarta, 2013.
Wang , Wenbo; Hong Chen; and Jibiao Zhou, Risk Assessment and Early-Warning System for High-Speed Railway
during the Construction and Operation of Underpass Bridges. Journal (ASCE) CF.1943-5509.0000717,
2015.
Wulfram, I. Ervianto, Manajemen Proyek Konstruksi, CV. ANDI OFFSET, Yogyakarta, 2005.
Zecheru, V., & Olaru, G., Work Breakdown Structure (WBS) in Project Management. Review of International
Comparative Management Volume 17, Issue 1, 61-69, 2016.
Zou, P. X., Zhang, G., & Wang, J., Identifying Key Risks in Construction Projects: Life Cycle and Stakeholder
Perspectives. International Journal of Construction Management • February 2014, 2014.
Zwikael, O., Critical Planning Processes in Construction Projects. Contruction Innovation Vol 9 No 4, 372-387,
2009. [4]
Made Widhi Adnyana Surya Pratita is a civil engineering master student at the University of Indonesia, Jakarta,
Indonesia. He received her bachelor's degree in civil engineering from University of Indonesia, Jakarta, Indonesia. He
has worked for the Government of DKI Jakarta for 7 years. Currently, He is assigned to work on Dinas Bina Marga
Area of West Jakarta.
2710