Embed Size (px)
Citation preview
Technical Report Documentation Page
Form DOT F 1700.7 (8-72) Reproduction of completed page authorized
1. Report No. FHWA/TX-11/0-6100-3
2. Government Accession No.
3. Recipient's Catalog No.
4. Title and Subtitle DEVELOPMENT OF PRECAST BRIDGE DECK OVERHANG SYSTEM: TECHNICAL REPORT
5. Report Date February 2010 Publish: July 20116. Performing Organization Code
7. Author(s) David Trejo and Young Hoon Kim
8. Performing Organization Report No. Report 0-6100-3
9. Performing Organization Name and Address Texas Transportation Institute The Texas A&M University System College Station, Texas 77843-3135
10. Work Unit No. (TRAIS) 11. Contract or Grant No. Project 0-6100
12. Sponsoring Agency Name and Address Texas Department of Transportation Research and Technology Implementation Office P. O. Box 5080 Austin, Texas 78763-5080
13. Type of Report and Period Covered Technical Report: September 2007–August 200914. Sponsoring Agency Code
15. Supplementary Notes Project performed in cooperation with the Texas Department of Transportation and the Federal Highway Administration. Project Title: Development of Precast Bridge Deck Overhang System URL: http://tti.tamu.edu/documents/0-6100-3.pdf16. Abstract The implementation of full-depth, precast overhang panel systems has the potential to improve constructability, productivity, and make bridges more economical. Initial testing and analyses reported in the 0-6100-2 report resulted in a design that required a large number of shear pockets in the overhang panels. The general design methodology used in this report was to determine the number of connectors based on the shear capacity of a girder with conventional R-bars (not necessarily based on the required demand). The large number of shear pockets reduced the constructability and economy of the precast overhang system. Report 0-6100-1 (produced after 0-6100-2) used the American Association of State Highway Officials Load and Resistance Factor Design (AASHTO LRFD [2008]) demand requirements to design the number of shear pockets for a precast overhang panel system and reported that the number of pockets per panel could be reduced from the numbers reported in report 0-6100-2. However, this report only included an analysis for one beam type and one span length. In addition, the demand load used did not include all factors typically used by designers. Additional testing was required to assess different connector systems and further analyses were needed for the new Texas Department of Transportation (TxDOT) girders. The testing and analyses documented in this report (0-6100-3) provides a new equation for determining the number of shear pockets required for the various shear connector/coupler systems evaluated in this research. This equation was used to determine the number of shear pockets required for the newer TxDOT girders. Results from this research indicate that the roughened surface provides strong adhesion between the top girder surface and a precast panel. Steel reinforcing hoops placed in the shear pocket and shear reinforcing hoops placed in the overhang panel around the opening of the shear pocket provided limited or no improvement in capacity of the shear connector/coupler system. Hollow structural section (HSS) steel tubes placed around the perimeter of the shear pocket during fabrication did result in samples with higher shear capacities and could result in overhang panels with fewer shear pockets. This system could make constructing bridges with precast overhang systems more constructible, economical, and could reduce the construction time. 17. Key Words Shear Friction, Push-Off Test, Composite System, Anchor Type
18. Distribution Statement No restrictions. This document is available to the public through NTIS: National Technical Information Service Alexandria, Virginia 22312 http://www.ntis.gov
19. Security Classif.(of this report) Unclassified
20. Security Classif.(of this page) Unclassified
21. No. of Pages 60
22. Price


DEVELOPMENT OF PRECAST BRIDGE DECK OVERHANG SYSTEM: TECHNICAL REPORT
by
David Trejo, Ph.D., P.E. Professor and Hal D. Pritchett Endowed Chair
and
Young Hoon Kim, Ph.D.
Post-Doctoral Scholar
School of Civil and Construction Engineering Oregon State University
(formerly at the Texas Transportation Institute)
Report 0-6100-3 Project 0-6100
Project Title: Development of Precast Bridge Deck Overhang System
Performed in cooperation with the Texas Department of Transportation
and the Federal Highway Administration
February 2010 Publish: July 2011
TEXAS TRANSPORTATION INSTITUTE The Texas A&M University System College Station, Texas 77843-3135

TxDOT 0-6100-3 Development of Precast Bridge Deck Overhang System
v
DISCLAIMER
The contents of this report reflect the views of the authors, who are responsible for the facts and
the accuracy of the data presented herein. The contents do not necessarily reflect the official
view or policies of the Federal Highway Administration (FHWA) or the Texas Department of
Transportation (TxDOT). This report does not constitute a standard, specification, or regulation.
The engineer in charge was David Trejo, Ph.D., P.E. #93490.
The United States Government and the State of Texas do not endorse products or
manufacturers. Trade or manufacturers’ names appear herein solely because they are considered
essential to the objective of this report.

TxDOT 0-6100-3 Development of Precast Bridge Deck Overhang System
vi
ACKNOWLEDGMENTS
This project was conducted at Texas A&M University (TAMU) and was supported by TxDOT
and FHWA through the Texas Transportation Institute (TTI) as part of Project 0-6100,
Development of Precast Bridge Deck Overhang System. The valuable input of
Dr. German Claros, Mr. Ricardo Gonzalez, Mr. Ralph Browne, Mr. Graham Bettis, Mr. Manuel
Padron, Mr. Alfredo Valles, Mr. John Holt, Mr. Loyl Bussell, Mr. Robert Cochrane, Mr. Lewis
Gamboa, Mr. Michael Hyzak, and Mr. Brian Merrill is appreciated. The authors also wish to
thank Dr. Peter Keating, Mr. Matt Potter of the Civil Engineering High Bay Structural and
Materials Laboratory (HBSML) at TAMU; and Dr. Radhakrishna Pillai for their continuous
support and assistance, and all the students who assisted with the project.

TxDOT 0-6100-3 Development of Precast Bridge Deck Overhang System
vii
TABLE OF CONTENTS Page
LIST OF FIGURES ..................................................................................................................... ix
LIST OF TABLES ....................................................................................................................... xi
1. INTRODUCTION....................................................................................................................1
1.1. GENERAL ...........................................................................................................................1 1.2. OBJECTIVES .......................................................................................................................2 1.3. ORGANIZATION OF THIS REPORT ........................................................................................2
2. LITERATURE REVIEW .......................................................................................................3
2.1. GENERAL ...........................................................................................................................3 2.2. SHEAR FRICTION THEORY ..................................................................................................3 2.3. STEEL GIRDER AND CONCRETE COMPOSITE SYSTEM .........................................................6 2.4. CODE DEVELOPMENT .........................................................................................................7
2.4.1. The American Association of State Highway and Transportation Officials (AASHTO) Design ................................................................................7
2.4.2. American Concrete Institute (ACI) Design ..........................................................8
2.5. RESEARCH ON FULL-DEPTH PRECAST GIRDER SYSTEM ...................................................10
3. EXPERIMENTAL PROGRAM ...........................................................................................13
3.1. INTRODUCTION ................................................................................................................13 3.2. PUSH-OFF TEST SAMPLE AND EXPERIMENTAL DESIGN ....................................................13 3.3. MATERIALS ......................................................................................................................15
3.3.1. Concrete ..............................................................................................................15 3.3.2. Grout ...................................................................................................................17 3.3.3. Reinforcement and Shear Connectors .................................................................18
3.4. FABRICATION OF PUSH-OFF TEST SAMPLES ....................................................................18 3.4.1. Reinforcement Layout ........................................................................................19 3.4.2. Shear Connector Layout and Shear Pocket Confinement ...................................19
3.4.2.1. R2-0.4-N Series Push-off Samples .......................................................20 3.4.2.2. S2-0.62 Series Push-off Samples..........................................................21 3.4.2.3. S2-1.83 Series Push-off Samples..........................................................25 3.4.2.4. S4 Series Push-off Samples ..................................................................27
3.4.3. Alignment of Deck and Girder Elements and Filling the Haunch and Shear Pockets of Push-off Samples ....................................................................28
TxDOT 0-6100-3 Development of Precast Bridge Deck Overhang System
viii
3.5. PUSH-OFF TEST PROCEDURES ..........................................................................................29 3.5.1. Push-off Test Set-up ...........................................................................................29 3.5.2. Instrumentation for Stress and Displacement Measurement ..............................30 3.5.3. Rate of Loading during the Push-off Test ...........................................................30
4. TEST RESULTS AND ANALYSIS .....................................................................................31
4.1. GENERAL .........................................................................................................................31 4.2. TEST RESULTS .................................................................................................................33 4.3. FAILURE MECHANISMS IN R2 SERIES PUSH-OFF SAMPLES ...............................................34 4.4. FAILURE MECHANISMS IN S2 SERIES PUSH-OFF SAMPLES ...............................................37 4.5. FAILURE MECHANISMS IN S4 SERIES PUSH-OFF SAMPLES ...............................................41 4.6. ANALYSIS OF RESULTS ....................................................................................................42
4.6.1. General ................................................................................................................42 4.6.2. Determination of Shear Transfer Parameters ......................................................44 4.6.3. Shear Demand Estimation...................................................................................47 4.6.4. Shear Pocket Design ...........................................................................................51
4.7. SUMMARY ........................................................................................................................53
5. SUMMARY, CONCLUSION, AND RECOMMENDATIONS.........................................55
5.1. SUMMARY AND CONCLUSIONS.........................................................................................55 5.2. RECOMMENDATIONS ........................................................................................................56
REFERENCES .............................................................................................................................58
TxDOT 0-6100-3 Development of Precast Bridge Deck Overhang System
ix
LIST OF FIGURES
Figure 1-1. Precast girder and deck system (Araujo and Debs 2005) ............................................1
Figure 2-1. Shear-friction hypothesis (Birkeland and Birkeland 1966) .........................................3
Figure 2-2. Shear stress behavior using Mohr-Coulomb Equation (Coulomb 1776) .....................5
Figure 2-3. Roughened shear friction hypothesis (Patton 1966) ....................................................6
Figure 3-1. Simplified schematic of a push-off sample showing the elements representing the girder, deck, haunch, and shear connectors ........................................................14
Figure 3-2. Naming convention for the shear connector series ....................................................15
Figure 3-3. Schematic of R2-0.4-N series push-off samples with R-bar systems ........................21
Figure 3-4. Schematic of S2-0.62-N series push-off sample (no confinement) ...........................22
Figure 3-5. Schematic of S2-0.62-I series push-off sample (confinement is inside the shear pocket).......................................................................................................................23
Figure 3-6. Schematic of S2-0.62-O series push-off sample (confinement is outside the shear pocket) .............................................................................................................24
Figure 3-7. Schematic of S2-0.62-IO series push-off sample (confinement is at both the inside and outside of the shear pocket) .....................................................................25
Figure 3-8. Schematic of S2-1.83-N series push-off sample (no confinement) ...........................26
Figure 3-9. Schematic of S2-1.83-IO series push-off sample (confinement is at both the inside and outside of the shear pocket) .....................................................................26
Figure 3-10. Photographs: (a) Setup for proper positioning of the hoops inside the shear pocket; (b) an inner confinement ..............................................................................27
Figure 3-11. Schematic of S4-3.66-O[H] series push-off sample (HSS confinement outside the shear pocket) .......................................................................................................28
Figure 3-12. The push-off test setup .............................................................................................29
Figure 3-13. Instrumentations for displacement measurement .....................................................30
Figure 4-1. Mechanisms of shear connector systems: (a) Shear key action, (b) Dowel action .........................................................................................................................32
Figure 4-2. Typical failure mode and the plot of the system ........................................................32
TxDOT 0-6100-3 Development of Precast Bridge Deck Overhang System
x
Figure 4-3. Three mechanisms of dowel action (Park and Paulay 1975) .....................................33
Figure 4-4. Shear load versus slip of R-bar system: (a) Shear force versus slip, (b) Shear force versus strain, (c) Strain versus slip ..................................................................36
Figure 4-5. Shear connector failure modes: (a) Anchorage failure, (b) Shear connector failure at shear ...........................................................................................................38
Figure 4-6. Effect of confinement: (a) 0.75-in. (19 mm) diameter shear connectors/couplers, (b) 1.25-in. (32 mm) diameter shear connectors/couplers ......40
Figure 4-7. Failure modes in S4-3.66-O[H] samples: (a) Shear failure at the interface between shear connector and coupler, (b) Adhesion loss between shear pocket and deck ....................................................................................................................41
Figure 4-8. Effect of confinement on shear transfer .....................................................................42
Figure 4-9. Three equations of shear transfer mechanisms ..........................................................44
Figure 4-10. TxDOT I-Girder (Tx28, Tx34, and Tx40) (http://www.txdot.state.tx.us) ...............49
Figure 4-11. TxDOT I-Girder (Tx46 and Tx54) (http://www.txdot.state.tx.us) ...........................50
Figure 4-12. TxDOT I-Girder (Tx62 and Tx70) (http://www.txdot.state.tx.us) ...........................51

TxDOT 0-6100-3 Development of Precast Bridge Deck Overhang System
xi
LIST OF TABLES
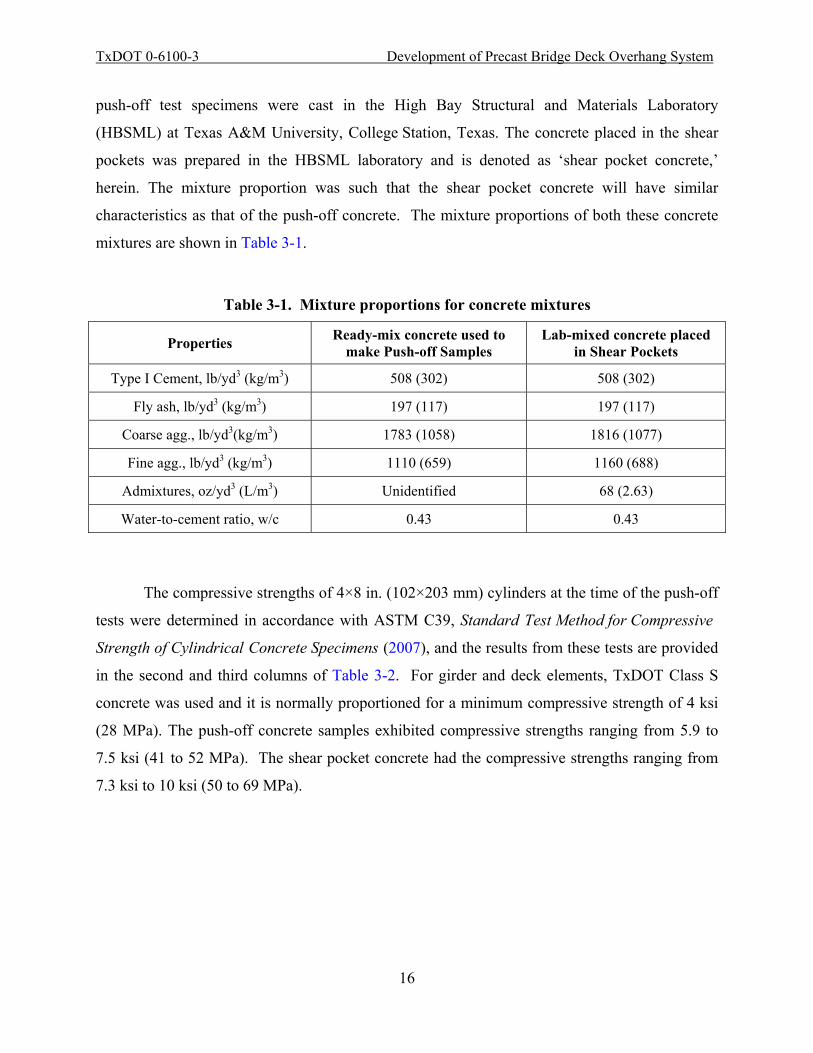
Table 3-1. Mixture proportions for concrete mixtures ..................................................................16
Table 3-2. Compressive strength of concrete and grout at the time of push-off test ....................17
Table 3-3. Mechanical properties of reinforcement and shear connectors ...................................18
Table 3-4. Detailed shear connectors and shear pockets ..............................................................20
Table 4-1. Summary of test results ...............................................................................................34
Table 4-2. Summary of shear transfer parameters ........................................................................46
Table 4-3. Demand of shear transfer force (Vh) ............................................................................48
Table 4-4. Estimated shear pockets for AASHTO LRFD demands .............................................52


TxDOT 0-6100-3 Development of Precast Bridge Deck Overhang System
1
1. INTRODUCTION
1.1. GENERAL
Precast girders and precast deck panels have been used widely in bridge construction. Figure 1-1
shows a portion of a bridge made of precast girder and precast deck systems.
Figure 1-1. Precast girder and deck system (Araujo and Debs 2005)
In this report, a shear connector is defined as a system that connects the girder and deck
panels. As shown in Figure 1-1, a typical shear connector system consists of steel connectors
(made of conventional reinforcement hooks known as R-bars) provided across the girder and the
shear pockets in the deck panels. These shear pockets are then typically filled with cementitious
grout or cast-in-place (CIP) concrete. This system assists in achieving a composite action
between the precast girders and precast deck panels on a bridge.
Over the last few decades there have been several studies investigating the horizontal
shear mechanism between the precast girders and precast deck panels. As precast systems
become more common, there is a need to identify systems that have the potential to reduce
construction time and increase safety at the time of construction. Reports on the previous phases
TxDOT 0-6100-3 Development of Precast Bridge Deck Overhang System
2
of this project (0-6100-1 and 0-6100-2) indicated that the shear capacity of the shear connectors
between the girder and full-depth overhang panels was low and recommended panels with a
larger number of shear pockets. However, providing more shear pockets increases construction
costs and reduces the constructability. Therefore, research is needed to improve the performance
of shear connectors for precast overhang systems.
1.2. OBJECTIVES
For precast girder and precast overhang deck systems, it is important not only to align and place
the precast deck panels at the correct position on the girder, but also to connect each other to
achieve composite action. Early research results indicated low shear capacity in the shear
connector systems and therefore, the capacity of the shear connector system requires further
investigation. The objectives of this research are to:
• investigate the efficiency of eight types of shear connectors between girders and full-depth overhang panels and
• develop and recommend an improved shear connector design with reduced number of shear pockets and maximized shear capacity per shear pocket.
To achieve these objectives, the shear strength and behavior of eight different types of
connector systems with triplicate specimens for each system type (i.e., a total of 24 tests) were
fabricated, tested, and assessed.
1.3. ORGANIZATION OF THIS REPORT
Section 2 provides a brief review of previous studies related to shear friction in concrete systems
and the design equations based on shear friction and push-off tests. Section 3 presents the
overall experimental program, which covers test matrix, test procedures, and the design or layout
of test samples. This section also provides properties of the materials used in this research.
Section 4 discusses the test results and the design methods to estimate the optimum number of
pockets for the precast panels. Finally, the findings from this project and recommendations are
summarized in Section 5.

TxDOT 0-6100-3 Development of Precast Bridge Deck Overhang System
3
2. LITERATURE REVIEW
2.1. GENERAL
Research has been conducted to better understand the behavior of shear connectors in precast
deck systems (Scholz et al. 2007, National Cooperative Highway Research Program [NCHRP]
584 2008). Shear friction on cast-in-place CIP deck systems has been studied and many
equations have been recommended (AASHTO LRFD 2007LRFD 2007).
2.2. SHEAR FRICTION THEORY
Birkeland and Birkeland (1966) proposed the simple physical model for shear friction.
Figure 2-1 shows the shear-friction hypothesis.
Figure 2-1. Shear-friction hypothesis (Birkeland and Birkeland 1966)
As shown in Figure 2-1(a), consider a case with no shear connector across the shear
plane. For an element to slide along the assumed shear plane, m-m, the shear force, V, should be
(a)
(b)

TxDOT 0-6100-3 Development of Precast Bridge Deck Overhang System
4
increased up to μP, where μ is coefficient of friction and P is the normal force. Now, consider
the case with a shear connector, as shown in Figure 2-1(b). As the slip progresses, a normal
displacement, δ, occurs. This displacement can be large enough to cause yielding of the shear
connector. Also, this displacement induces a tension force, T, in the shear connector placed
across the roughened shear plane. This tension force is equal to the clamping force and is
calculated as follows:
yvfT A f= (2.1)
where Avf and fy are the cross-sectional area and yield strength of the shear connector. The
sawtooth in Figure 2-1(b) represents the surface roughness, which assists in resisting the shear
force, V. The term V can be calculated as follows:
tan tany yvf vfV T A f A f= φ = φ = μ (2.2)
where μ is 1.7 for monolithic concrete, 1.4 for intentionally roughened surface, and 0.8 to 1.0 for
ordinary shear planes with contacting steel interfaces. The frictional force, μP, resists the sliding
of the elements. To provide sufficient safety warnings in advance, shear connector systems are
designed for a ductile failure rather than a brittle failure. To this effect, the reinforcement ratio is
limited to a maximum of 0.015 such that the shear connectors will yield and fail before the
concrete elements fail. In addition, it is also recommended that the shearing stress should not
exceed 0.8 ksi (5.5 MPa) for concrete with a compressive strength of 4 ksi (28 MPa) or higher.
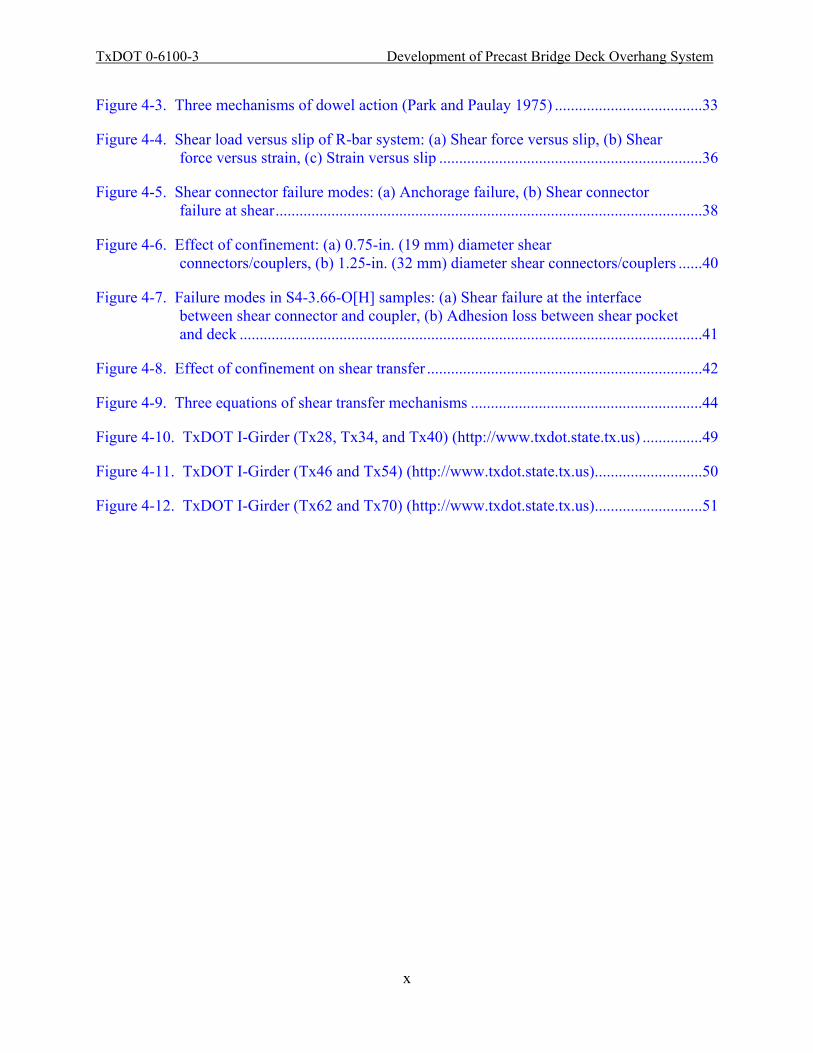
The Mohr-Coulomb equation can be used to estimate the shear stress, v, and is commonly
used in soil and rock systems. Figure 2-2(a) shows a schematic of two elements in shear and the
stress and displacement variables. Figure 2-2(b) shows the variation of stress as a function of
shear displacement, δs. It also shows the Mohr-Coulomb equations for peak and sustained
stresses. Note that c is the cohesive strength of the material in the shear plane, σn is the normal
stress, φ is the angle of internal friction, and, φsus is the sustained angle of internal friction.
TxDOT 0-6100-3 Development of Precast Bridge Deck Overhang System
5
Graphical representations of these Mohr-Coulomb equations are provided in Figure 2-2(c) and
shows that the peak and sustained stresses vary linearly as a function of normal stress.
Figure 2-2. Shear stress behavior using Mohr-Coulomb Equation (Coulomb 1776)
The equation in the American Association of State Highway and Transportation Officials
– Load and Resistance Factor Design – Bridge Design Specifications (AASHTO LRFD 2007) is
analogous to the Mohr-Coulomb equations. In AASHTO LRFD (2007), the nominal peak shear
stress, vpeak, n, is expressed as follows:
, tanpeak n nv c= +σ φ (2.3)
where the c, σn, and, φ are as defined in Figure 2-2. For practical applications, the term c
depends on the surface roughness and is equal to the shear stress at zero normal stress. After
sufficient slip or shear displacement occurs, the term c becomes zero and the sustained shear
stress, vsus, is expressed as follows [AASHTO LRFD (2007)]:
tansus n susv =σ φ (2.4)
normal stress, σn
peak stress = c + σn (tan φ)
Sustained stress = σn (tan φsus)
shea
r stre
ss, v
peak stress
Sustained stress
Shear displacement, δs
φ
φsus
Shear displacement, δs
shear stress, v
normal stress, σsh
ear s
tress
,v
(a) (b) (c)
TxDOT 0-6100-3 Development of Precast Bridge Deck Overhang System
6
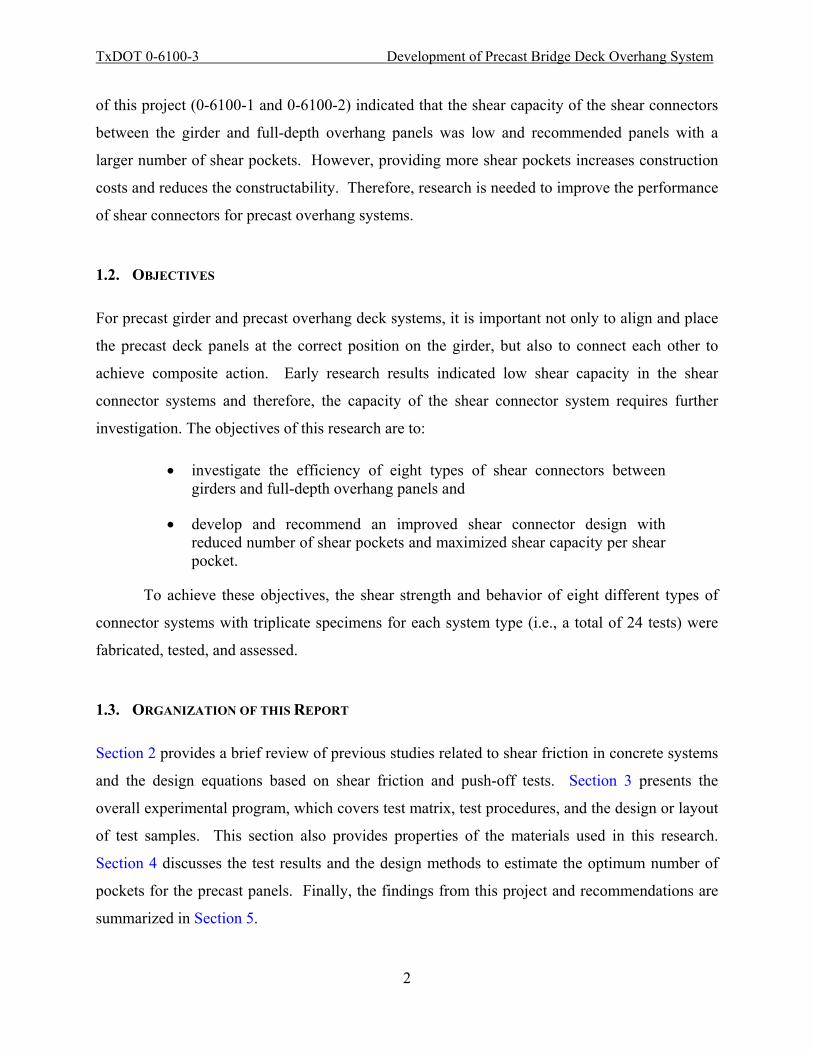
where σn and φsus are as defined in Figure 2-2. For roughened surfaces as shown in Figure 2-3,
the shear stress can be expressed as follows (Patton 1966):
tan( )r n bv i= σ φ + (2.5)
where bφ is the basic friction angle of the surface, and i is the angle of the sawtooth. It is
believed that as the shear displacement increases, the sawtooth surface behaves as a physical
interlock on the shear planes. When the sawtooth is intact, the normal displacement leads to an
increase in the normal stress on the shear connector. This is similar to the hypothesis of
Birkeland and Birkeland (1966). However, the equation developed by Patton (1966) has an
additional term (i.e., bφ of the surface) to consider the initial friction condition.
Figure 2-3. Roughened shear friction hypothesis (Patton 1966)
Recently, Mattock (2001) concluded that the shear friction is resisted by two major
components: the undulations on the roughened surfaces, and the frictional stress provided by the
clamping force resulting from the normal displacement caused by the separation of the
roughened surfaces. This is reasonable because the main principle of shear friction theory was
developed based on the behavior of under-reinforced shear plane.
2.3. STEEL GIRDER AND CONCRETE COMPOSITE SYSTEM
Rezansoff and Hosain (1983) investigated the shear behavior of a stud-girder connection in a
steel girder-CIP deck system to evaluate the required number of shear studs. The effect of the

TxDOT 0-6100-3 Development of Precast Bridge Deck Overhang System
7
orientation of the applied load was also studied. The researchers recommended a small number
of shear connectors to induce ductile failure of the shear stud and allow slip. The expected
mechanism is analogous to the ductile failure of an under-reinforced beam, where flexural
reinforcement yields and fails before the concrete fails.
2.4. CODE DEVELOPMENT
2.4.1. The American Association of State Highway and Transportation Officials Design
Article 5.8.4 in AASHTO LRFD (2007) requires a standard design concept and calculation
formula for shear connections on precast girder and deck systems as follows:
ni uiV Vφ ⋅ ≥ (2.6)
where Vni is the nominal interface shear resistance (kips [N]), Vui is the factored interface shear
force due to the applied load, and φ is the reduction factor for the shear resistance.
When a CIP concrete slab is placed on a clean concrete girder surface roughened to an
amplitude of 0.25 in. (6.4 mm), the nominal interface shear resistance is taken as follows
[AASHTO LRFD (2007)]:
{( )
concrete contributions fromcontribution steel connector and normal load
n cv y cvfV c A A f P= ⋅ + μ ⋅ ⋅ +1442443
(2.7)
1
2
c cv
ni
cv
K f AV or
K A
′⎧⎪≤ ⎨⎪⎩
(2.8)
TxDOT 0-6100-3 Development of Precast Bridge Deck Overhang System
8
where c = cohesion factor (0.28 ksi [1.9 MPa]); Acv = interface area of the concrete engaged in
shear transfer (in.2 [mm2]); μ = coefficient of friction (1.0 for roughened concrete surface to an
amplitude of 0.25 in. (6.4 mm)); Avf = cross section of the shear reinforcement (in.2 [mm2]); fy =
yield strength of the shear reinforcement (ksi [MPa]); Pc = net compressive force normal to the
shear plane (kips) (conservative if Pc is neglected); K1 = fraction of concrete strength available to
resist the interface shear (0.3); and K2 = limiting interface shear resistance and can be taken as
1.8 ksi [12.4 MPa] for normal-weight concrete or 1.3 ksi [8.9 MPa] for lightweight concrete.
The upper limits should be defined to prevent brittle failure of the concrete (that can occur if the
shear plane is over-reinforced) before the yielding of the steel (Birkeland and Birkeland 1966;
and Mattock 2001). Note that c is cohesive force in the previous discussions in this report.
However, in AASHTO LRFD (2007), it is defined as the cohesion factor and is used to capture
the effects of cohesion and/or aggregate interlock. As shown in Eq. (2.7), the horizontal shear
resistance consists of contributions from the concrete surface, the steel connectors, and the
normal load. Note that Eqs. (2.7) and (2.8) are for applications when R-bars are used and if the
amplitude of the roughened surface is less than the 0.25 in. (6.4 mm) specified, AASHTO LRFD
(2007) requires that the coefficient of friction, μ, be reduced to 0.6.
2.4.2. American Concrete Institute (ACI) Design
The ACI 318-08 (2008) code provides the following expression for shear resistance:
n y vfV f A= μ ⋅ ⋅ (2.9)
where Vn is the nominal shear strength; μ is the coefficient of friction; fy is the yield strength of
the shear connector (ksi [MPa]); and Avf is the area of the shear transfer reinforcement (in.2
[mm2]). This equation is valid when the shear connector is perpendicular to the shear plane. The
recommended value of μ is 1.4 for normal-weight concrete placed monolithically. The
recommended value of μ is 1.0 for normal-weight concrete placed against another concrete
surface roughened to 0.25-in. (6.4 mm) amplitude. For normal-weight concrete anchored to
as-rolled structural steel beams with headed studs or reinforcing bar connectors, the
TxDOT 0-6100-3 Development of Precast Bridge Deck Overhang System
9
recommended value of μ is 0.7. For these cases, when lightweight concrete is used, the
recommended value of μ is further reduced by 25 percent (i.e., 0.5). Eq. (2.9) is generally used
to estimate the quantity of shear connectors. To achieve a ductile failure of the systems with
normal-weight concrete, either placed monolithically or placed against an existing hardened
concrete with intentionally roughened surface, ACI 318-08 (2008) provides the following upper
limits for the Eq. (2.9):
0.2(480 0.08)1600
c
c cv
cv
n
cv
f AV f A
A
⎧⎪≤ +⎨⎪⎩
(2.10)
where Acv is the interface area of the concrete engaged in shear transfer (in.2 [mm2]). For other
cases, ACI 318-08 (2008) provides the following upper limits for the Eq. (2.9):
0.2800
c cvn
cv
f AV
A⎧
≤ ⎨⎩
(2.11)
If the above discussed ACI design equations are used, the value of the nominal shear
strength, Vn, increases as the yield strength of reinforcement increases. However, Mattock and
Hawkins (1972) and Mattock (2001) concluded that the rate of increase gradually decreases to a
constant value of approximately 0.8 instead of the constant value of μ, which is 1.4 for
normal-weight concrete (per ACI 318-08 2008). Therefore, the following equation was proposed
by ACI 318-08 Commentary, which was based on PCI Design Handbook (2004), Mattock et al.
(1976), and Mattock (1974), for a better estimate of the nominal shear strength:
10.8n y cvfV f A A K= + (2.12)
where Ac is the area of concrete section for resisting the shear force (in.2) and K1 is 400 psi
(2.76 MPa) for normal-weight concrete and 200 psi (1.38 MPa) for all-lightweight concrete. The
TxDOT 0-6100-3 Development of Precast Bridge Deck Overhang System
10
first term represents the traditional concepts of friction resulting from a clamping force. The
second term represents the resistance from the shearing protrusions (causing roughness) on the
shear plane and the dowel action of the reinforcement (ACI 318-08). According to Mattock et al.
(1976), the slip distance corresponding to the maximum peak shear force was less than 0.05 in.
(1.3 mm).
2.5. RESEARCH ON FULL-DEPTH PRECAST GIRDER SYSTEM
Scholz et al. (2007), Kovach and Naito (2008), the National Cooperative Highway Research
Program (NCHRP 2008), and Trejo et al. (2009) conducted push-off tests and full-scale testing
to improve the design of shear connectors for a girder-haunch-deck system. Sullivan (2007)
made full-depth, large-scale, precast bridge deck panels and performed various tests. These tests
included typical push-off tests to investigate the shear resistance performance. The performance
of Grade 60 reinforcing bars and headed–studs (with a yield strength of 49 ksi [338 kPa]) as
shear connectors were evaluated using push-off tests. Bars and studs with different diameters and
various quantities were evaluated. The studs exhibited good ductility, but due to the relatively
low tensile strength, a large number of studs were required in the shear pockets. When
reinforcing bars (i.e., R-bars) were used as shear connectors, the intentionally roughened surface
on the bottom side of precast deck panels did not assist in achieving higher shear resistance
values. When the headed-studs were used as shear connectors, the interfacial failure occurred
between the haunch and the beam and, therefore, the intentionally roughened surface was not
governing the failure. Scholz et al. (2007) concluded that the shear resistance is the combination
of the chemical cohesion and Coulomb friction caused by the clamping force. The researchers
concluded that if the cohesive bond was broken (i.e., cracks form) at the shear plane then only
the shear connector provided the shear resistance. Scholz et al. (2007) also reported that the
initial peak load is the resistance offered by the cohesive bond (i.e., cvcA ), and a secondary, post-
peak load is the shear resistance offered by the shear connectors ( ( )s y nA f Pμ + ). With this, the
authors recommended the following equation for designing shear connectors:
max( )
cvn
s y n
cAv
A f P⎧
= ⎨μ +⎩ (2.13)

TxDOT 0-6100-3 Development of Precast Bridge Deck Overhang System
11
where:
• c is the cohesive force (assumed to be equal to 0.075 ksi [0.52 MPa]),
• Acv is the interface shear area;
• μ is the frictional coefficient (0.9 for a grout on concrete-concrete interface, 0.6 for a grout-steel interface),
• As is the cross-sectional area of the shear connector,
• fy is the yield stress of the shear connector, and
• Pn is the additional normal force from external loads.
Kovach and Naito (2008) investigated the shear friction of girder-deck systems without
shear connectors. They reported that the cohesion and adhesion between the girder and deck
could provide sufficient shear resistance. In addition, the authors concluded that the interface
roughness had a pronounced effect on the composite shear action and a sufficient level of
roughness could help obtain a high level of horizontal shear capacity. Therefore, the surface
condition, cohesion, and adhesion should be considered for the design and practice.
NCHRP (2008) investigated the shear capacity of headed-studs as shear connectors
between concrete panels and structural steel girders. The researchers conducted push-off tests on
the systems with four and eight headed-studs (each 1.25-in. [32 mm] in diameter). To improve
the interface shear capacity, cross ties and steel tube systems were used to confine the grout in
the shear pocket that surrounds the shear connectors. The testing indicated that push-off tests are
sufficient to reflect the performance of full-size specimens. They found that the HSS (hollow
structural section) steel tubes could effectively confine the grout that surrounds the shear studs in
the shear pockets. However, test results showed high peak loads with relatively low ductility.
Based on this study, design recommendations to achieve the peak shear resistance of the system
were proposed.
The reports from the previous phases of TxDOT project 0-6100 evaluated shear
connector capacities of different connector systems for full-depth precast panel systems (Trejo et
al. 2009). The performance of the grout material in the haunch and other parameters that can
affect the shear capacity of the system was evaluated. It was noted that the roughness of the

TxDOT 0-6100-3 Development of Precast Bridge Deck Overhang System
12
interfaces between the deck, haunch, and girder are more dependent on the secondary and
post-peak shear strength than the initial peak shear strength. Note that the initial peak strength is
a function of the cohesion only. Preliminary results from unroughened specimens indicated a
friction factor of approximately 0.4. The testing with roughened concrete surfaces indicated a
friction factor of 0.6 to 0.8. As a result of this low friction factor, many shear pockets and shear
connectors were required to match the capacity of the R-bar system used in the current TxDOT
design. In addition, when thicker haunches (say 3.5 in. [89 mm]) were assessed, sufficient shear
capacity and ductility could not be achieved. The report recommended a system with a large
number of shear pockets for a bridge overhang system. However, requiring a large number of
shear pockets could pose many constructability and economical issues. Therefore, further
research was recommended to evaluate different systems with reduced number of shear pockets
leading to a more constructible and economical design.

TxDOT 0-6100-3 Development of Precast Bridge Deck Overhang System
13
3. EXPERIMENTAL PROGRAM
3.1. INTRODUCTION
This section presents the experimental program adopted for this research. A simplified
schematic of the push-off test sample and experimental design is presented first. The
characteristics of the materials used in the test program are then presented. The detailed design
and layout of different series of push-off test specimens are then presented. Following this, the
push-off test procedures are presented. Note that the experimental design was developed with
close collaborations with TxDOT personnel. A full factorial test design and full-scale tests were
not possible due to time and cost constraints.
3.2. PUSH-OFF TEST SAMPLE AND EXPERIMENTAL DESIGN
Push-off test samples were designed to assess the performance of different shear connector
designs. Figure 3-1 shows a simplified schematic of a push-off sample tested in the laboratory.
A shear pocket system consists of shear connectors and couplers, filling materials in a shear
pocket, and any confinement system (i.e., reinforcement hoops or HSS [hollow structural
section] steel tube).

TxDOT 0-6100-3 Development of Precast Bridge Deck Overhang System
14
Figure 3-1. Simplified schematic of a push-off sample showing the elements representing the girder, deck, haunch, and shear connectors
Each push-off test sample consists of the following four major elements:
• a girder with embedded shear connector couplers (referred to herein as the girder element),
• a precast deck panel containing a single shear pocket (referred to herein as the deck element),
• a haunch between the girder and deck, and
• a shear connector system.
Figure 3-2 shows the naming convention used to identify the series of shear connector
samples. For example, S2-0.62-IO represents a series containing two [2] shear connectors and
couplers [S] within total cross-sectional area, Asc, of 0.62 in.2 (400 mm2) [0.62], with

TxDOT 0-6100-3 Development of Precast Bridge Deck Overhang System
15
confinement at both the inside [I] and outside [O] of the shear pocket. Shear connector couplers
were embedded in the girder element such that the all-thread rods (i.e., shear connectors) can be
post-installed to connect the girder element to the deck element.
Figure 3-2. Naming convention for the shear connector series
Two types of shear connector/couple systems (R: R-bar and S: shear connector/coupler
system) were tested. The effects of the following five confinement conditions were evaluated.
• N: No confinement;
• I: Inside the shear pocket;
• O: Outside the shear pocket;
• IO: Both inside and outside the shear pocket; and
• O[H]: HSS steel tube outside the shear pocket.
The following eight series of push-off samples were designed and fabricated: R2-0.4-N,
S2-0.62-N, S2-0.62-I, S2-0.62-O, S2-0.62-IO, S2-1.83-N, S2-1.83-IO, S4-3.66-O[H]. Three
replicate samples of each of these series were fabricated and tested for shear capacity.
3.3. MATERIALS
This section presents characteristics of the materials used for the push-off test program.
3.3.1. Concrete
Ready-mix concrete from a local plant was procured for preparing the girder and deck elements
of the push-off test specimens. This concrete is denoted as ‘push-off concrete,’ herein. The
S2-0.62-IOShear connector/coupler type
and number of shear connector
Cross sectional area, Asc, of 0.62 in2 (400 mm2)
Confinement type
TxDOT 0-6100-3 Development of Precast Bridge Deck Overhang System
16
push-off test specimens were cast in the High Bay Structural and Materials Laboratory
(HBSML) at Texas A&M University, College Station, Texas. The concrete placed in the shear
pockets was prepared in the HBSML laboratory and is denoted as ‘shear pocket concrete,’
herein. The mixture proportion was such that the shear pocket concrete will have similar
characteristics as that of the push-off concrete. The mixture proportions of both these concrete
mixtures are shown in Table 3-1.
Table 3-1. Mixture proportions for concrete mixtures
Properties Ready-mix concrete used to make Push-off Samples
Lab-mixed concrete placed in Shear Pockets
Type I Cement, lb/yd3 (kg/m3) 508 (302) 508 (302)
Fly ash, lb/yd3 (kg/m3) 197 (117) 197 (117)
Coarse agg., lb/yd3(kg/m3) 1783 (1058) 1816 (1077)
Fine agg., lb/yd3 (kg/m3) 1110 (659) 1160 (688)
Admixtures, oz/yd3 (L/m3) Unidentified 68 (2.63)
Water-to-cement ratio, w/c 0.43 0.43
The compressive strengths of 4×8 in. (102×203 mm) cylinders at the time of the push-off
tests were determined in accordance with ASTM C39, Standard Test Method for Compressive
Strength of Cylindrical Concrete Specimens (2007), and the results from these tests are provided
in the second and third columns of Table 3-2. For girder and deck elements, TxDOT Class S
concrete was used and it is normally proportioned for a minimum compressive strength of 4 ksi
(28 MPa). The push-off concrete samples exhibited compressive strengths ranging from 5.9 to
7.5 ksi (41 to 52 MPa). The shear pocket concrete had the compressive strengths ranging from
7.3 ksi to 10 ksi (50 to 69 MPa).

TxDOT 0-6100-3 Development of Precast Bridge Deck Overhang System
17
Table 3-2. Compressive strength of concrete and grout at the time of push-off test
Series Name of the Push-off Samples
Push-off Sample Concrete, ksi (MPa)
Shear Pocket Concrete, ksi (MPa)
Haunch Grout, ksi (MPa)
R2-0.4-N 6.6 (45) Data not available 7.4 (51)
S2-0.62-N 7.5 (52) 8.2 (56) 6.9 (47)
S2-0.62-I 7.6 (53) 9.6 (66) 6.3 (43)
S2-0.62-O 6.1 (42) 7.3 (51) 6.1 (42)
S2-0.62-IO 6.1 (42) 7.3 (51) 6.1 (42)
S2-1.83-N 5.9 (41) 7.9 (55) 6.3 (44)
S2-1.83-IO 6.6 (45) 10 (69) 8.1 (56)
S4-3.66-O[H] 6.6 (46) 7.9 (55) 7.5 (52)
3.3.2. Grout
In addition to the two types of concrete, two types of grout (i.e., BASF Set 45 and
SikaGroutTM 212) were also used in this test program. The BASF Set 45 is magnesium
phosphate-based and the SikaGroutTM 212 is a non-shrinking hydraulic cement structural grout
meeting the ASTM C1170 Standard Specification for Package d Dry, Hydraulic-Cement Grout
(2007). To measure the consistency and cohesiveness, the flow cone test was performed
following the method used by Trejo et al. (2009). The diameter of the grout patty at the end of
the flow cone test was a measure of the consistency and cohesiveness of the grout mixture. The
target diameter was determined to be at least 8 in. (203 mm) such that the mixture is sufficiently
consistent and cohesive. Based on preliminary trial mixtures, it was determined that a water-
powder ratio (w/p) of 0.065 was suitable for the BASF Set 45 grout and a w/p of 0.14 was
suitable for SikaGroutTM 212. The compressive strength of 2-in. (50 mm) grout cubes was
determined in accordance with the ASTM C109, Standard Test Method for Compressive
Strength of Hydraulic Cement Mortars (Using 2-in or [50mm] Cube Specimens) (2008), and the
results from these tests are shown in the fourth column of Table 3-2. The compressive strengths
of grout samples ranged from 6.1 to 8.1 ksi (42 to 56 MPa).

TxDOT 0-6100-3 Development of Precast Bridge Deck Overhang System
18
3.3.3. Reinforcement and Shear Connectors
Grade 60 reinforcement meeting the ASTM A615, Standard Specification for Deformed and
Plain Carbon-Steel Bars for Concrete Reinforcement (2008), was used in the push-off samples.
The 1.25- and 0.75-in. (32 and 19 mm) diameter all-thread rods (Product No. B-12 manufactured
by Dayton Superior) were used as shear connectors, as recommended by TxDOT personnel.
Table 3-3 shows the yield and tensile strength (or stress) and strains of the reinforcement and
shear connectors used in this research. Closed couplers were used to connect the shear
connectors (Product No. B-32 manufactured by Dayton Superior). For the 0.75-in. (19 mm)
diameter all-thread rods, the length and the outer diameter of the coupler were 3.0 and 1.1 in. (76
and 27 mm), respectively. For the 1.25-in. (32 mm) diameter all-thread rods, the length and the
outer diameter of the coupler were 5.5 and 1.9 in. (140 and 48 mm), respectively. In this study,
there was no failure associated with the couplers. This indicates that the coupler provided
sufficient capacity for the shear connector.
Table 3-3. Mechanical properties of reinforcement and shear connectors
Sample I.D. Yield
strength, fy, ksi (MPa)
Yield Strain, εy,x10-6 in./in. (mm/mm)
Ultimate Strength, fu, ksi (MPa)
Ultimate Strain, εu,
× 10-6 in./in. (mm/mm)
Modulus of Elasticity, E,
ksi (GPa)
#4 (M 13) reinforcement 62 (428) 2200 97 (669) - 29,000 (200)
0.75-in. (19 mm) diameter shear
connector 110* (759) 5800 123 (848) 22,400 28,060 (193)
1.25-in. (32 mm) diameter shear
connector 97* (669) 5260 116 (800) 28,300 29,600 (204)
Note: * yield strength and strain are determined from 0.2 percent offset strain. “-” indicates that data is not available.
3.4. FABRICATION OF PUSH-OFF TEST SAMPLES
All the push-off test specimens were fabricated in the High Bay Structural and Materials
Laboratory at Texas A&M University, College Station, Texas. Following is a brief discussion

TxDOT 0-6100-3 Development of Precast Bridge Deck Overhang System
19
on the reinforcement layout, the shear connector layout, and the alignment of girder and deck
elements, and the process of filling the haunch and shear pockets.
3.4.1. Reinforcement Layout
For the samples in the R2-0.4-N series, the layout of reinforcement was similar to that in the
samples used in the research by Scholz et al. (2007). The samples in S2 and S4 series contain #5
(M16) and #4 (M13) reinforcement, respectively, to mimic the detail of a typical girder-haunch-
deck system in a bridge. The samples in S4-3.66-O[H] series resembled the deck panel used in
the NCHRP (2008) study, except for the detail of shear connector system and shear pocket
design.
3.4.2. Shear Connector Layout and Shear Pocket Confinement
Trejo et al. (2009) found that lack of confinement of the portion of the shear connector/coupler
inside the girder resulted in premature failure of the anchorage of the shear connector/coupler.
Therefore, two bundled hoops [#4 (M13)] were placed to confine the concrete surrounding the
shear couplers to prevent the premature failure of the anchorage of the shear connector/coupler
systems in the push-off test specimens. Similar hoops were also provided in the shear pockets to
confine the concrete/grout around the all-thread rods in the deck elements. Table 3-4 shows the
type, number, and diameter of shear connectors and the type of confinement in the shear pockets.
It should also be noted that this test assumes that the concrete around the couplers embedded
inside the girder is well-confined, and will not fail. Note that the design for the S series shear
connectors was determined using an increased haunch depth. Also, rectangular pockets were
preferred for the design of precast deck and the placement of multiple shear connectors.

TxDOT 0-6100-3 Development of Precast Bridge Deck Overhang System
20
Table 3-4. Detailed shear connectors and shear pockets
Series Identification
Connection Type
Number of Shear
Connectors and its
Diameter
Asc
in2 (mm2)
Interface shear plan
area, In.2 (m2)
Confinement Condition of the
Concrete around the
Shear Connector in the deck
Normal Force
kips (kN)
R2-0.4-N R-bar 2 legs
(0.50-in.) 0.40 (258)
416 (0.26) None [N] 2.5 (11)
S2-0.62-N
Shear Connector /Coupler
2 (0.75-in.)
0.62 (400)
416 (0.26) None [N] 1.3 (5.8)
S2-0.62-I 2
(0.75-in.) 0.62 (400)
416 (0.26) Inside [I] 1.3 (5.8)
S2-0.62-O 2
(0.75-in.) 0.62 (400)
416 (0.26) Outside [O] 1.3 (5.8)
S2-0.62-IO 2
(0.75-in.) 0.62 (400)
416 (0.26) Both inside and outside [IO] 1.3 (5.8)
S2-1.83-N 2
(1.25-in.) 1.83
(1180) 416 (0.26) None [N] 1.3 (5.8)
S2-1.83-IO 2
(1.25-in.) 1.83
(1180) 416 (0.26) Both inside and
outside [IO] 1.3 (5.8)
S4-3.66-O[H] 4
(1.25-in.) 3.66
(2361) 696 (0.45)
Outside the shear pocket with HSS
tube, O[H] 1.3 (5.8)
3.4.2.1. R2-0.4-N Series Push-off Samples
R-bars are widely used in girders for CIP deck systems on bridges. Figure 3-3 shows the
schematic of the R2-0.4-N series push-off sample using conventional R-bars as the shear
connectors. The #4 (M13) R-bars were embedded into the girder when the girder was cast. The
deck element has a 6 in. (152 mm) diameter shear pocket through the entire depth of the deck.
When assembling the girder elements and deck elements, the 2-in. (50 mm) thick haunch and the
shear pocket were filled with the BASF Set 45 grout.

TxDOT 0-6100-3 Development of Precast Bridge Deck Overhang System
21
Figure 3-3. Schematic of R2-0.4-N series push-off samples with R-bar systems
3.4.2.2. S2-0.62 Series Push-off Samples
As shown in Table 3-4, the push-off samples in the S2 series had two shear connectors
embedded into the deck panel. In addition, four types of confinement (i.e., N, I, O, and IO)
around the two shear connectors (0.75-in. [19 mm] diameter) were tested. In the S2-0.62-N
series push-off samples, the deck element had a 5×10 in. (127×254 mm) shear pocket with no
reinforcement for confinement (see Figure 3-4). The samples in the S2-0.62-I series had five
layers of #3 (M10) hoops at 1.75 in. (45 mm) spacing. The distance from the centroid of
reinforcement to the bottom surface of the girder is 1.5 in. (38 mm). These hoops were placed
inside the shear pocket and surrounding the shear connectors (see Figure 3-5). The S2-0.62-O
series push-off samples had three layers of #3 (M10) hoops at 1.75 in. (45 mm) spacing (see
Figure 3-6). The distance from the centroid of reinforcement to the bottom surface of the deck is
1.5 in. (38 mm). These hoops were placed outside the shear pocket (see Figure 3-6). The S2-
0.62-IO series push-off samples had hoops at both the inside and outside of the shear pocket in

TxDOT 0-6100-3 Development of Precast Bridge Deck Overhang System
22
the precast deck panel (see Figure 3-7). The hoops placed inside the shear pocket in the above
samples were placed at the desired position before casting grout into the shear pocket (see Figure
3-7).
Figure 3-4. Schematic of S2-0.62-N series push-off sample (no confinement)

TxDOT 0-6100-3 Development of Precast Bridge Deck Overhang System
23
Figure 3-5. Schematic of S2-0.62-I series push-off sample (confinement is inside the shear pocket)
TxDOT 0-6100-3 Development of Precast Bridge Deck Overhang System
24
Figure 3-6. Schematic of S2-0.62-O series push-off sample (confinement is outside the shear pocket)

TxDOT 0-6100-3 Development of Precast Bridge Deck Overhang System
25
Figure 3-7. Schematic of S2-0.62-IO series push-off sample (confinement is at both the inside and outside of the shear pocket)
3.4.2.3. S2-1.83 Series Push-off Samples
As shown in Figure 3-8, the S2-1.83-N sample was designed to have two shear connectors (each
1.25 in. [32 mm] diameter) for the girder-haunch-deck system. The precast deck panel has an
8×10 in. (203 × 254 mm) shear pocket with no reinforcement for confinement. The shear
connectors with nuts were post-installed into this shear pocket with 4 in. (102 mm) embedment
length to resist shear force. As shown in Figure 3-9, the S2-1.83-IO series push-off samples
were fabricated in a similar fashion as the S2-1.83-N series samples, except that hoops were
provided at both the inside and outside of shear pocket (i.e., IO confinement). The 4 in. (102
mm) embedment length of the shear connectors into the deck resulted in three layers of hoops for
the inside of shear pocket as compared to five layers for the S2-0.62-IO series containing 6 in.
(152 mm) embedment length shear connectors. To confine the surroundings of shear connectors,
three layers of outer shear confinement were placed with 1.5 in. (38 mm) spacing (see Figure
3-10).

TxDOT 0-6100-3 Development of Precast Bridge Deck Overhang System
26
Figure 3-8. Schematic of S2-1.83-N series push-off sample (no confinement)
Figure 3-9. Schematic of S2-1.83-IO series push-off sample (confinement is at both the inside and outside of the shear pocket)
TxDOT 0-6100-3 Development of Precast Bridge Deck Overhang System
27
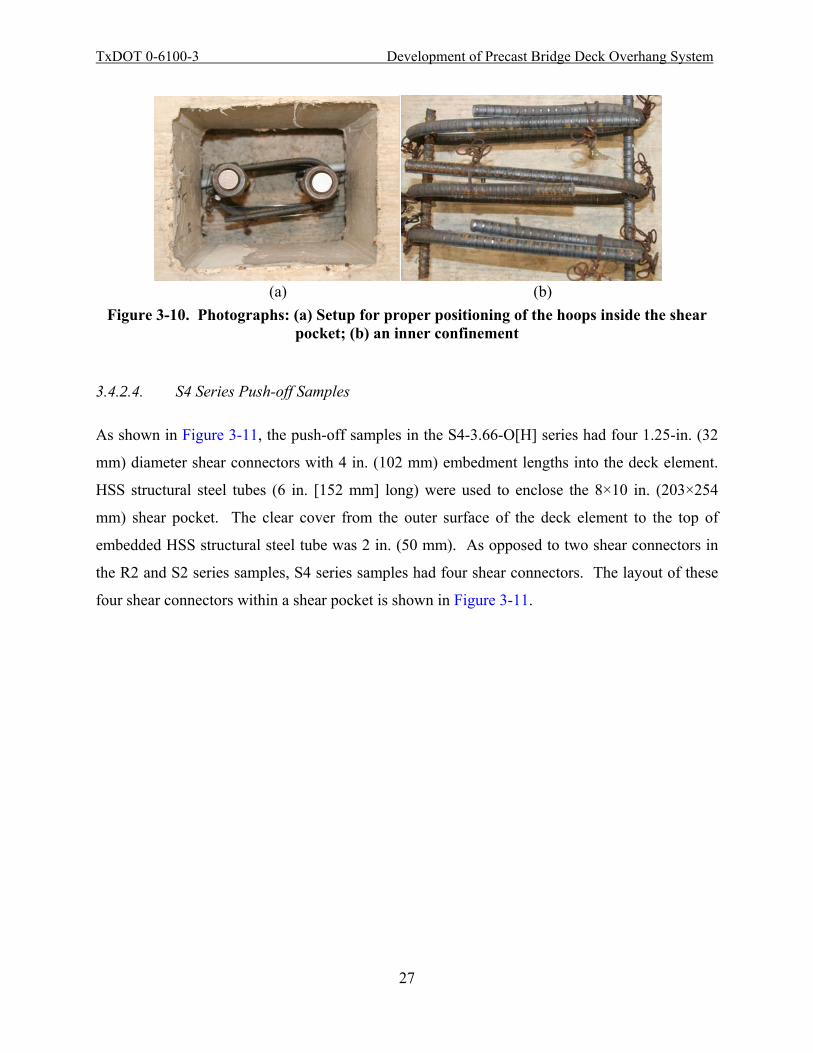
Figure 3-10. Photographs: (a) Setup for proper positioning of the hoops inside the shear pocket; (b) an inner confinement
3.4.2.4. S4 Series Push-off Samples
As shown in Figure 3-11, the push-off samples in the S4-3.66-O[H] series had four 1.25-in. (32
mm) diameter shear connectors with 4 in. (102 mm) embedment lengths into the deck element.
HSS structural steel tubes (6 in. [152 mm] long) were used to enclose the 8×10 in. (203×254
mm) shear pocket. The clear cover from the outer surface of the deck element to the top of
embedded HSS structural steel tube was 2 in. (50 mm). As opposed to two shear connectors in
the R2 and S2 series samples, S4 series samples had four shear connectors. The layout of these
four shear connectors within a shear pocket is shown in Figure 3-11.
(a) (b)

TxDOT 0-6100-3 Development of Precast Bridge Deck Overhang System
28
Figure 3-11. Schematic of S4-3.66-O[H] series push-off sample (HSS confinement outside the shear pocket)
3.4.3. Alignment of Deck and Girder Elements and Filling the Haunch and Shear Pockets
of Push-off Samples
Trejo et al. (2009) developed appropriate forms to contain the fresh grout while filling the
haunch. To ensure the desired haunch heights, forms and chairs of appropriate heights were
placed in between the deck and girder elements. The haunch height was 2 in. (50 mm) for the
R2-0.4-N series samples and was 3.5 in. (89 mm) for samples in all other series. Immediately
after the initial setting, the concrete surface of the girder element was roughened using steel wire
brushes. For all the samples, except the R2-0.4-N series samples, the haunch and shear pockets
were filled with SikaGroutTM 212 grout up to 2 in. (50 mm) above the bottom of the deck panel
(into the pocket). Then, after allowing the grout to set for approximately 15 to 30 minutes, the
remaining space in the shear pockets was filled with shear pocket concrete. For the R2-0.4-N
series samples, the haunch and shear pockets were completely filled with BASF Set 45 grout. In
all the samples, the grout and/or concrete surfaces were finished and cured.

TxDOT 0-6100-3 Development of Precast Bridge Deck Overhang System
29
3.5. PUSH-OFF TEST PROCEDURES
3.5.1. Push-off Test Setup
A total of 24 push-off tests were conducted to investigate the shear transfer behavior of the
girder-haunch-deck systems. Figure 3-12 shows the schematic of the push-off test setup.
Figure 3-12. The push-off test setup
Six steel pipes (roller supports) were used to allow the girder element to slide without
friction between the floor and the girder element. A 600-kip (270 ton) capacity actuator was
used to apply the shear force to the deck element. A steel plate and a neoprene pad were inserted
between loading apparatus and the deck element to prevent local crushing of the concrete. The
elements of the push-off sample were positioned such that the midpoint G of the contact between
the load cell and the girder element, the midpoint D of the contact between the reaction frame
and the deck element, and the midpoint H of the haunch were on the same horizontal line. This
provided a shear force on the girder-haunch-deck interface of the system with no bending or
torsion. Based on the superimposed dead load used by Sullivan (2007), a 2.5-kip (11 kN) steel
frame was placed on the deck to simulate the superimposed dead load for the testing of the
samples in R2 series. However, while testing the samples in the S2 and S4 series, a 1.3-kip
(6 kN) steel frame was placed on the deck element to simulate the typical tributary dead load on
every pocket in an 8-ft long precast panel with five pockets. This value was used in the
preliminary design of the Rock Creek Bridge in Parker County, Texas.
GH
D
Girder Element
Deck Element Reaction Frame
Roller Supports

TxDOT 0-6100-3 Development of Precast Bridge Deck Overhang System
30
3.5.2. Instrumentation for Stress and Displacement Measurement
The strain gages were attached on the surface of the steel shear connectors. Four strain gages
were installed such that the pure tensile stress on the shear connectors (i.e., excluding torsional
and bending stresses) could be measured. Figure 3-13 shows the locations of the Linear Variable
Differential Transformers (LVDT) and string potentiometers to measure the lateral and vertical
displacements. Four LVDTs were installed in the horizontal direction to measure the horizontal
slip (to compensate for the out-of-plane displacements [i.e., rotational displacement]) between
the girder and the deck elements. In addition, four LVDTs and four string potentiometers were
installed in the vertical direction to measure the vertical displacement between the girder and the
deck elements (i.e., across the haunch thickness).
Figure 3-13. Instrumentations for displacement measurement
3.5.3. Rate of Loading during the Push-off Test
During the initial loading, a load control regime was adopted. Later, a displacement control
regime was adopted. In the initial load control regime, the rate of loading was 7 kips/min.
(31 kN/min.). After the load reached 30 kips (133 kN), further loading was applied with a
displacement rate of 0.05 in./min. (1.3 mm/min.) until the load reached peak load. Due to the
failure of cohesion or adhesion within the girder-haunch-deck systems, the load decreased during
testing. After this drop in the load, the displacement rate was increased to 0.2 in./min.
(5.0 mm/min.). Loading was stopped when the horizontal slip between the girder and deck
elements reached 1.5 in. (38 mm).
LVDTsString potentiometerDeck element
TxDOT 0-6100-3 Development of Precast Bridge Deck Overhang System
31
4. TEST RESULTS AND ANALYSIS
4.1. GENERAL
Push-off tests were conducted to investigate various shear transfer and failure mechanisms in
girder-haunch-deck systems. Five stages of shear transfer and failure mechanisms were
identified during the testing:
• initial adhesion loss (Stage 1),
• shear key action (Stage 2),
• shear key action failure at peak load (Stage 3),
• dowel action of the shear connectors at sustained load (Stage 4), and
• final failure of the system (Stage 5).
In Stage 1, the adhesion between the components (i.e., girder, haunch, and precast deck)
failed due to the shear load (defined as Vloss herein), resulting in the initial slip, which was less
than 0.05 in. (1.3 mm). This, in turn, resulted in the stress concentration near a shear pocket
system.
In Stage 2, the shear connectors and concrete and/or grout in the shear pocket acted as a
shear key. The additional shear resistance was then provided by this shear key and the clamping
force of the shear connectors.
In Stage 3, as the load increased, the shear key was sheared off or failed at the peak load
(Vpeak).
In Stage 4, after the shear key failed, the dowel action across the shear interface was the
main source of shear resistance until the system failure occurred. This available shear resistance
was defined as sustained shear resistance, Vsus. Figure 4-1 shows the mechanisms of shear key
action and dowel action of the shear connectors. It should be noted that before the initiation of
slip at the interface, there is no clamping force provided by the slab dead load. The clamping
force occurs when the interface between the girder and deck are starting to separate as the shear

TxDOT 0-6100-3 Development of Precast Bridge Deck Overhang System
32
connectors build up stress. Figure 4-2 shows a typical plot of the interface shear load versus slip
in the girder-haunch-deck systems. Stage 5 was failure of the system.
Figure 4-1. Mechanisms of shear connector systems: (a) Shear key action, (b) Dowel action
Figure 4-2. Typical failure mode and the plot of the system
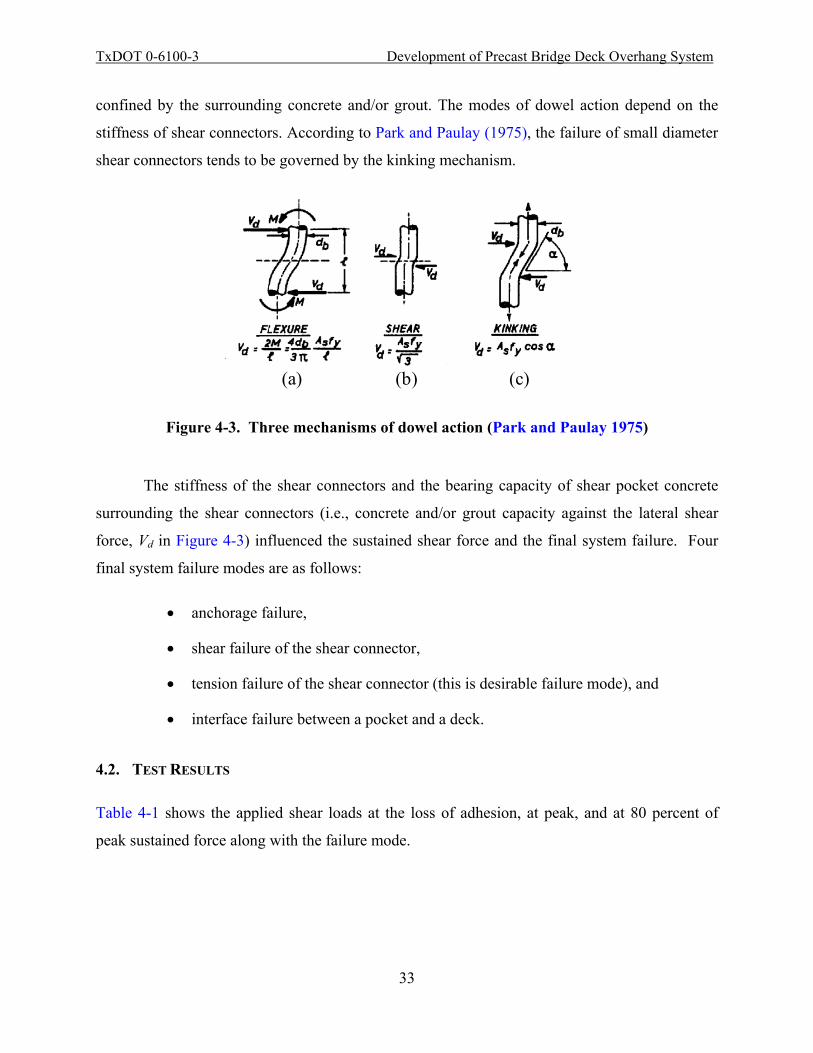
Figure 4-3 shows three mechanisms of dowel action: a) the bending of the shear
connector; b) the shearing of the shear connector; and c) the kinking of the shear connectors. To
activate the dowel mechanisms, the anchorage zone in the girder and deck should be well-
0 0.05 0.1 0.15 0.2 0.25 0.30
50
100
150
200
250
App
lied
Shea
r For
ce (k
ips)
Slip (in.)
Peak Shear Force (Vpeak
)
Adhesion Loss at (Vloss
)
Sustained Shear Force (V
sus)
(b)
(a)
TxDOT 0-6100-3 Development of Precast Bridge Deck Overhang System
33
confined by the surrounding concrete and/or grout. The modes of dowel action depend on the
stiffness of shear connectors. According to Park and Paulay (1975), the failure of small diameter
shear connectors tends to be governed by the kinking mechanism.
Figure 4-3. Three mechanisms of dowel action (Park and Paulay 1975)
The stiffness of the shear connectors and the bearing capacity of shear pocket concrete
surrounding the shear connectors (i.e., concrete and/or grout capacity against the lateral shear
force, Vd in Figure 4-3) influenced the sustained shear force and the final system failure. Four
final system failure modes are as follows:
• anchorage failure,
• shear failure of the shear connector,
• tension failure of the shear connector (this is desirable failure mode), and
• interface failure between a pocket and a deck.
4.2. TEST RESULTS
Table 4-1 shows the applied shear loads at the loss of adhesion, at peak, and at 80 percent of
peak sustained force along with the failure mode.
(a) (b) (c)

TxDOT 0-6100-3 Development of Precast Bridge Deck Overhang System
34
Table 4-1. Summary of test results
Series I.D. Sample I.D. Vloss,
kips (kN) Vpeak,
kips (kN) 0.8 Vsus, kips(kN)
Failure Mode
R2-0.4-N 1 - 55 (250) 33 (147) BF 2 52 (230) 75 (330) 35 (160) BF 3 50 (220) 73 (330) 34 (151) BF
S2-0.62-N 1 63 (280) 83 (370) 66 (290) BF 2 54 (240) 79 (350) 60 (270) BF 3 50 (220) 76 (340) 60 (270) BF
S2-0.62-I 1 54 (240) 81 (360) 54 (240) BF 2 54 (240) 78 (350) 56 (250) BF 3 55 (240) 97 (430) 76 (340) BF
S2-0.62-O 1 48 (210) 87 (390) 54 (240) BF 2 45 (200) 66 (290) 45 (200) BF 3 62 (280) 89 (400) 56 (250) BF
S2-0.62-IO 1 49 (220) 92 (400) 72 (320) BF 2 67 (300) 95 (420) 61 (270) BF 3 61 (270) 99 (440) 62 (280) BF
S2-1.83-N 1 45 (200) 65 (290) 51 (230) DDF 2 42 (190) 68 (300) 54 (240) DDF 3 45 (200) 98 (440) 40 (180) DF
S2-1.83-IO 1 61 (270) 99 (440) - DF 2 58 (260) 113 (500) - DF 3 - 118 (530) - DF
S4-3.66-O[H] 1 - 216 (960) - IF 2 78 (350) 189 (840) 117 (520) BF 3 86 (380) 184 (820) 145 (650) BF
Note: BF = bar failure; DF = deck concrete failure; DDF = ductile deck failure; IF=shear pocket adhesion loss; ‘-’ indicates no data available.
4.3. FAILURE MECHANISMS IN R2 SERIES PUSH-OFF SAMPLES
The roughened surface of the girder element can provide strong adhesion between the girder and
the haunch of a girder-haunch-deck system. However, the adhesion between the unroughened
surface underneath the deck element and the haunch surface was typically weak. After adhesion
loss, the shear pocket system resisted the shear force until the peak load. At the peak load, all the
reinforcement (i.e., R-bars) began strain hardening. After the peak load, the dowel action
(kinking) of the R-bars seemed to be the main source of resisting the shear load. It should be

TxDOT 0-6100-3 Development of Precast Bridge Deck Overhang System
35
noted that a girder-haunch-deck system does not perform in the same manner as a conventional
girder-CIP deck system that does not have shear pockets. The shear key action provided by the
shear pockets does not exist in the girder-CIP deck system in bridges. The girder-CIP deck
system can exhibit higher adhesion between the roughened girder surface and the CIP deck.
However, the post-peak behavior of the girder-haunch-deck system was similar to a CIP deck
system after the adhesion failure of the interface between the deck concrete and girder.
Figure 4-4 shows the shear load versus slip for the R2-0.4-N samples containing a
conventional R-bar. The average peak load and the 80 percent sustained load were 67 and 34
kips (300 and 150 kN), respectively. When the slip reached approximately 0.05 in. (1.3 mm), the
clamping force of the R-bar reached the force corresponding to the yield strain of the R-bar.
After adhesion failure, the shear load was carried by the shear pocket system (R-bar and grout in
the shear pocket), which acted like a shear key. There is a possibility that cracks formed in the
shear pocket system. However, the influence of these cracks on the performance was less than
the influence of the loss of adhesion because the shear connector continued to provide a
clamping force. After peak load and the breakdown of the shear key action or loss of friction,
the shear resistance dropped, resulting in significant slip. The sustained load indicates that the
shear force was provided by the strain hardening of shear connector.

TxDOT 0-6100-3 Development of Precast Bridge Deck Overhang System
36
Figure 4-4. Shear load versus slip of R-bar system: (a) Shear force versus slip, (b) Shear
force versus strain, (c) Strain versus slip
0
50
100
150
0
100
200
300
400
500
600
0 0.05 0.1 0.15 0.2 0.25 0.3
0 1 2 3 4 5 6 7
Sample 1Sample 2
App
lied
Shea
r For
ce (k
ips)
Slip (in.)
Slip (mm)
Applied Shear Force (kN
)
R2-0.4-NPeak Shear Force
(a)
0 500 100015002000 250030000
50
100
150
0
100
200
300
400
500
600Sample 1Sample 2
Strain of connector (x10-6 in./in. or mm/mm)
App
lied
Shea
r For
ce (k
ips)
εy
Applied Shear Force (kN
)
Peak Shear Force
(b)
0
500
1000
1500
2000
2500
0 0.05 0.1 0.15 0.2 0.25 0.3
0 1 2 3 4 5 6 7
Sample 1Sample 2
Stra
in (x
10-6
in./i
n. o
r mm
/mm
)
εy
Peak Shear Force
Slip (in.)
Slip (mm)
(c)

TxDOT 0-6100-3 Development of Precast Bridge Deck Overhang System
37
4.4. FAILURE MECHANISMS IN S2 SERIES PUSH-OFF SAMPLES
The roughened surface on the girder provided relatively strong adhesion between the girder and
the haunch of a push-off sample. However, the unroughened surface underneath the precast deck
exhibited weak adhesion with the haunch. After adhesion loss, the main source of shear
resistance was believed to be provided by the shear pocket system until the peak load.
It is believed that the sustained shear resistance was achieved mainly due to the
contribution from the dowel action of the shear connectors. Diagonal shear cracks in the haunch
region developed due to flexural deformations of the shear connectors as observed during testing.
When high strength shear connectors/couplers were used, the flexural and shear strength of the
shear connectors contributed to the dowel action. As the stiffness of the shear connectors
increased, the flexural and shear strength mechanisms seemed to be dominant. When the bearing
force on the concrete and grout in a shear pocket was lower than the dowel action force, the
grout and concrete in the shear pocket was fractured, as shown in Figure 4-5(a). This failure
mode was observed with the 1.25-in. (32 mm) diameter shear connector systems in S2-1.83-N
and S2-1.83-IO series samples. When the bearing force on the concrete and grout in a shear
pocket was higher than the dowel action force, the shear failure of the shear connectors occurred.
This failure mode was observed in the 0.75-in. (19 mm) diameter shear connector systems, as
shown in Figure 4-5(b).

TxDOT 0-6100-3 Development of Precast Bridge Deck Overhang System
38
Figure 4-5. Shear connector failure modes: (a) Anchorage failure, (b) Shear connector failure at shear
To achieve a high sustained load and a ductile failure mechanism, the anchorage zone of
both the shear pocket and the girder should be sufficiently confined. The effect of different
confinement systems on the shear transfer performance in the S2-0.62 and S2-1.83 series
samples were studied. Figure 4-6 shows peak and sustained shear loads of the two shear
connector/coupler systems with and without confinement. Shear pocket systems with no
confinement (i.e., S2-0.62-N and S2-1.83-N series samples) were used as the reference for the
comparisons with the confined systems and these were identified as the benchmarks. Maximum
values among three replicates were used as the benchmark (hatched columns in Figure 4-6). To
assess the effect of confinement on shear transfer mechanisms, using the maximum value as the
benchmark was more conservative than taking the average value as the benchmark, and this was
done here.
For the 0.75-in. (19 mm) diameter shear connector/coupler system, providing the
confinement system did not improve the shear transfer performance (See Figure 4-6 [a]). The
O-type confinement (i.e., in S2-0.62-O series samples) resulted in a reduction of the sustained
deck
haunch
girder
deckhaunch
(a)
(b)
girder
Shear connector

TxDOT 0-6100-3 Development of Precast Bridge Deck Overhang System
39
shear load by approximately 30 percent when compared to the benchmark. When I-type
confinement was provided (i.e., in S2-0.62-I series samples), only one sample exhibited higher
peak and sustained shear loads than the corresponding benchmark value. When IO-type
confinement was provided (i.e., in S2-0.62-IO series samples), the peak shear loads were 11 to
19 percent higher than the benchmark values.
In summary, the hoop confinement (i.e., #3 [M10] reinforcement hoops) did not
significantly improve the shear transfer performance of the shear pocket systems with 0.75-in.
(19 mm) diameter shear connector/couplers. However, providing IO confinement around the
1.25-in. (32 mm) diameter shear connector/coupler system increased the peak shear resistance by
less than 20 percent of the benchmark value (See Figure 4.6 [b]). However, the anchorage failure
could not be prevented by the IO confinement system and this resulted in low sustained shear
resistance. This indicates that the shear transfer mechanism of the small diameter shear
connectors/coupler systems was likely to be different from that of large diameter shear
connectors/coupler systems.
TxDOT 0-6100-3 Development of Precast Bridge Deck Overhang System
40
Figure 4-6. Effect of confinement: (a) 0.75-in. (19 mm) diameter shear connectors/couplers,
(b) 1.25-in. (32 mm) diameter shear connectors/couplers
0
20
40
60
80
100
120
80% Sustained Load
0
100
200
300
400
500
App
lied
Shea
r For
ce (k
ips) A
pplied Shear Force (kN)
S2-0.62-N S2-0.62-I S2-0.62-O S2-0.62-IO
Peak Load
Note: Individual Samples
Peak Load (Benchmark)80% Sustained Load (Benchmark)
(a)
0
20
40
60
80
100
120
80% Sustained Load
0
100
200
300
400
500
App
lied
Shea
r For
ce (k
ips) A
pplied Shear Force (kN)
S2-1.83-N S2-1.83-IO
No
Sust
aine
d Lo
ad
No
Sust
aine
d Lo
ad
No
Sust
aine
d Lo
ad
Peak Load
Note: Individual Samples
Peak Load (Benchmark)80% Sustained Load (Benchmark)
(b)

TxDOT 0-6100-3 Development of Precast Bridge Deck Overhang System
41
4.5. FAILURE MECHANISMS IN S4 SERIES PUSH-OFF SAMPLES
The S4-3.66-O[H] samples had four shear connectors confined by the HSS tube. Shear
connectors failed in two samples, as shown in Figure 4-7(a). One sample experienced the
adhesion loss between the surface of the HSS steel tube and the precast deck panel, as shown in
Figure 4-7(b). However, there was no sign of shear connector failure in this particular sample.
This test was stopped due to the uplift of the deck. The probability of this type of failure in the
field would be expected to be low because multiple shear pockets provide additional shear keys
and the self-weight of the system provides additional resistance to the uplift. However, holes in
the HSS or welded studs on the sides could likely prevent this.
Figure 4-7. Failure modes in S4-3.66-O[H] samples: (a) Shear failure at the interface between shear connector and coupler, (b) Adhesion loss between shear pocket and deck
Figure 4-8 shows the overall comparison of the R-bar system (benchmark), the IO-type
confinement system, and the HSS tube system. This figure provides information on the effect of
Girder Deck
Adhesion loss
Deck
Shear connector
failure
(a)
(b)
TxDOT 0-6100-3 Development of Precast Bridge Deck Overhang System
42
confinement. Test results indicate that the IO-type confinement with #3 [M10] hoops seemed to
be only effective when using 0.75-in. (19 mm) diameter shear connectors. The HSS tube system
seemed to provide both shear key and dowel action, resulting in higher peak and sustained loads.
Figure 4-8. Effect of confinement on shear transfer
4.6. ANALYSIS OF RESULTS
4.6.1. General
Shear friction factors were determined based on the test results, and the number of shear pockets
per panel was estimated. The R-bar system achieved the yielding of the R-bars. However, the
test results indicate that the shear connector/coupler system did not yield. Design equations in
ACI 318-08 (2008) and AASHTO LRFD (2007) were used to estimate the shear transfer
capacity of two elements (i.e., girder-CIP deck system with no haunch and shear pockets). It
should be noted that the girder-haunch-deck system was not the same system as the girder-CIP
deck system or steel girder-precast deck systems. Therefore, a new design approach was
necessary to improve the shear transfer mechanism of the shear connector/coupler system.
0
50
100
150
200
250
80% Sustained Load
0
200
400
600
800
1000
R2-0.4-N S2-0.62-IO S2-1.83-IO S4-3.66-O[H]
App
lied
Shea
r For
ce (k
ips) A
pplied Shear Force (kN)
Peak Load
Anc
hora
ge F
ailu
re
Peak Load (Benchmark)80% Sustained Load (Benchmark)
Note: S4-3.66-O[H] 80% sustained load data is average of two samples. All others are average of three samples.

TxDOT 0-6100-3 Development of Precast Bridge Deck Overhang System
43
Figure 4-9 shows three equations that can be used to predict the adhesion loss, peak, and
sustained shear loads of the systems tested. For the shear connector/coupler system design, the
loss, peak, and sustained loads can be expressed as follows:
..............................................( )
( ).......................( )
( )...................................( )
loss
peak
sus n
cv cv
cv sc y n
r
p
sc y
V cA c A a
V c A A f P b
V A f P c
′ ′= =
′ ′= + μ ⋅ +
= μ ⋅ +
∑
∑
(4.1)
where:
• Vloss is the shear force at the adhesion loss,
• Vpeak is the peak shear force,
• Vsus is the sustained or post-peak force,
• c is the adhesion stress on the interface between girder and deck,
• Acv is the effective interface area of concrete engaged in shear transfer (haunch and deck contact area),
• c’ is the interlock of the crack surface in the shear pocket system,
• A’cv is the effective interface area of the concrete engaged in shear transfer (herein referred to as the cracked area in the shear pocket system),
• Asc is the cross-sectional area of shear connectors,
• fy is the yield strength of the shear connector,
• μp is the coefficient of friction at peak shear force for surfaces roughened to an amplitude of approximately 0.20 to 0.25 in. (5 to 6.4 mm),
• μr is the coefficient of friction at sustained force (herein 80 percent Vsus) for surfaces roughened to an amplitude of approximately 0.20 to 0.25 in. (5 to 6.4 mm), and
• Pn is a permanent normal force to the shear plane.
At the point of adhesion loss, the adhesion load (cAcv in Eq. (4.1)(a)) was transferred to
the shear pocket system (c’A’cv in the first term of Eq. (4.1)(b)). It was assumed that this load
TxDOT 0-6100-3 Development of Precast Bridge Deck Overhang System
44
could be transferred to the shear key when the shear connectors are in tension. The slip at the
peak load was relatively small compared to the slip during the sustained load region. The second
term of Eq. (4.1)(b) was the shear key action provided by the clamping force at the peak shear
load. Eq. (4.1)(c) includes fy multiplied by the coefficient, μr to estimate the shear capacity of the
bars resulting from shear failure. In the following section, the coefficients are determined from
the test results.
Figure 4-9. Three equations of shear transfer mechanisms
4.6.2. Determination of Shear Transfer Parameters
Table 4-2 summarizes the coefficients along with the failure mode and the stress levels of the
shear connectors. The average of the c values from all the samples was 127 psi (875 kN/m2) and
the standard deviation was 15 psi (103 kN/m2). These consistent values indicate that the
adhesion capacity was not dependent on the shear connector type. The 0.75-in. (19 mm)
diameter shear connector and the conventional R-bar system provided higher c' values than the
0
50
100
150
200
250
0
200
400
600
800
1000
0 0.05 0.1 0.15 0.2 0.25 0.3
0 1 2 3 4 5 6 7
App
lied
Shea
r For
ce (k
ips)
Slip (in.)
Slip (mm)
Applied Shear Force (kN
)
cAcv
μp(A
sfy+P
n)
μr(A
sfy+P
n)
S2-1.83-N (Sample 3)
80%Vsus
Design assumption
c'A'cv

TxDOT 0-6100-3 Development of Precast Bridge Deck Overhang System
45
1.25-in. (32 mm) diameter shear connector system, except when the HSS tube confinement
system was used. For 1.25-in. (32 mm) diameter shear connector/coupler systems, the IO-type
confinement increased the shear key action. However, there was no significant increase in the
shear capacity of the 0.75-in. (19 mm) diameter shear connector/coupler system. The tensile
strength of the shear connector influenced the normal displacement at the girder-haunch-deck
interface, which in turn influenced the roughness of the interface. This could change the
coefficient of friction between the girder-haunch-deck during slipping. As the stiffness of the
shear connector decreased, the coefficient of friction values at peak and the sustained shear force
increased, indicating the high clamping stress in the shear connectors. While the R2-0.4-N
samples had the highest average values for the coefficient of friction at peak and sustained shear
force, the S2-1.83 series samples exhibited the lowest values (or no data were available when
anchorage failure occurred).

TxDOT 0-6100-3 Development of Precast Bridge Deck Overhang System
46
Table 4-2. Summary of shear transfer parameters
Series I.D. Sample number
Asfy+Pn, kips
c'A'cv or cAcv, kips
c, psi
c', psi
μp
μr (80
percent Vsus)
Bar failure mode
R2-0.4-N
1 27 - - - - 1.21 Tension failure
2 27 52 125 1839 0.84 1.29 3 27 50 120 1768 0.84 1.26
Average 27 51 123 1804 0.84 1.25
S2-0.62-N
1 70 63 152 1264 0.28 0.96 Shear failure
2 70 54 130 1084 0.36 0.86 3 70 50 120 1000 0.37 0.86
Average 70 56 134 1116 0.34 0.89
S2-0.62-I
1 70 54 130 1080 0.39 0.77 Shear failure
2 70 54 130 1080 0.35 0.81 3 70 55 132 1100 0.60 1.09
Average 70 54 131 1087 0.45 0.89
S2-0.62-O
1 70 48 115 960 0.56 0.78 Shear failure
2 70 45 108 900 0.30 0.64 3 70 62 149 1240 0.39 0.81
Average 70 52 124 1033 0.42 0.74
S2-0.62-IO
1 70 49 118 980 0.62 1.04 Shear failure
2 70 67 162 1348 0.40 0.87 3 70 61 147 1222 0.55 0.89
Average 70 59 142 1183 0.52 0.93
S2-1.83-N
1 179 45 109 568 0.11 0.29
- 2 179 42 101 526 0.14 0.30 3 179 45 109 568 0.29 0.22
Average 179 44 106 554 0.18 0.27
S2-1.83-IO
1 179 61 147 763 0.21 - *8 percentfu
2 179 58 139 725 0.31 - *5 percentfu
3 179 - - - - - - Average 179 60 143 744 0.26 - -
S4-3.66-O[H]
1 356 - - - - - *13percentfu
2 356 78 112 975 0.31 0.33 shear 3 356 86 124 1075 0.28 0.41 shear
Average 356 82 118 1025 0.30 0.37 - Note: * indicates percent stress of ultimate capacity of a shear connector; ‘-’ indicates no data available;1 psi =
6.895 MPa; 1 kip = 4.448 kN

TxDOT 0-6100-3 Development of Precast Bridge Deck Overhang System
47
4.6.3. Shear Demand Estimation
Table 3.4.1-1 of AASHTO LRFD (2007) provides the following load combination for
STRENGTH-I limit state:
1.25 1.5 1.75( )Q DC DW LL IM= + + + (4.2)
where:
• Q is the factored load effect (herein Vu),
• DC is the dead load effect without the wearing surface weight,
• DW is the dead load effect due to wearing surface weight,
• LL is live load, and IM is dynamic load.
The maximum live load can be estimated based on the combination (HL-93 loading condition) of
HS20 truck design load and design lane load. The dynamic load effect factor can be taken as
1.33. Therefore, LL+IM is equal to 1.33 LL. For this case, the number of girders will be
assumed to be 6. The bearing weight is estimated to be 0.109 kips/ft/girder (1.59 kN/m/girder).
The barrier weight is assumed to be 326 lb/ft (4.75 kN/m). The weight of 1.5-in. (38 mm) thick
wearing surface is assumed to be 0.0175 kips/ft2 (0.84 kN/m2). The clear roadway width is
assumed to be 6 ft per girder. This leads to the wearing surface weight of 0.105 kips/ft2 (5.027
kN/m2). The effective depth will be taken as 0.72 h. Table 4-3 shows the demand shear transfer
force at the critical section for shear (the first panel from the support). The dimensions of the
girders are presented in Figure 4-10 through Figure 4-12.
Note that these demand loads were calculated based on the 2007 AASHTO LRFD and
TxDOT I-girder with varied span lengths. They are different from the demand load (based on
one girder type with the older types of TxDOT girders) reported in 0-6100-1 and 0-6100-2, and
are likely more realistic of current TxDOT design practices.
TxDOT 0-6100-3 Development of Precast Bridge Deck Overhang System
48
Table 4-3. Demand of shear transfer force (Vh)
Beam Type Top flange width, bf,
inch (mm)
Structure Depth, h *, inch (mm)
Max. Span length, ft (m)
Vu (Strength limit I), kips
(kN)
Vh, kips/inch (kN/m)
Tx28 36 (914) 40 (1016) 80 (24) 109 (485) 4.2 (0.74)
Tx34 36 (914) 46 (1168) 95 (29) 119 (529) 4.0 (0.70)
Tx40 36 (914) 52 (1321) 105 (32) 121(538) 3.6 (0.63)
Tx46 36 (914) 58 (1473) 120 (37) 130 (578) 3.5 (0.61)
Tx54 36 (914) 66 (1676) 140 (43) 140 (623) 3.2 (0.56)
Tx62 42 (1067) 74 (1880) 150 (46) 139 (618) 2.9 (0.51)
Tx70 42 (1067) 82 (2083) 150 (46) 127 (565) 2.4 (0.42) Note:* h = Beam depth + Precast deck depth (8 in.) + Haunch (4 in.).
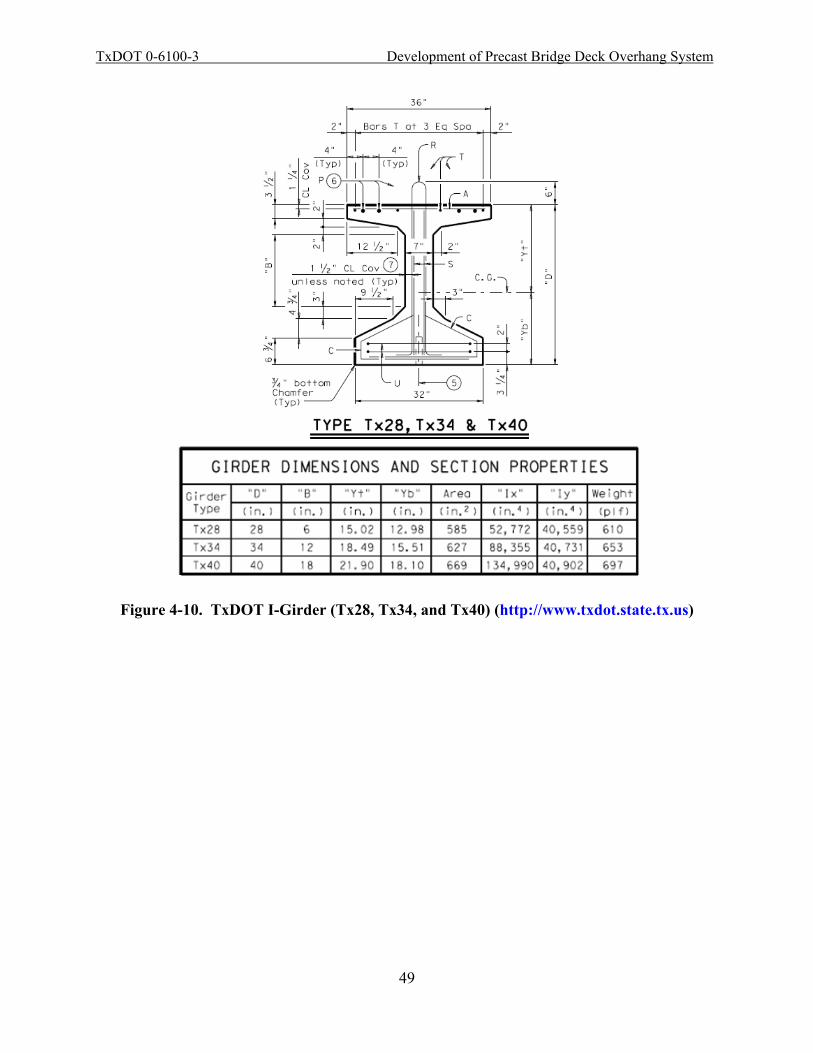
TxDOT 0-6100-3 Development of Precast Bridge Deck Overhang System
49
Figure 4-10. TxDOT I-Girder (Tx28, Tx34, and Tx40) (http://www.txdot.state.tx.us)

TxDOT 0-6100-3 Development of Precast Bridge Deck Overhang System
50
Figure 4-11. TxDOT I-Girder (Tx46 and Tx54) (http://www.txdot.state.tx.us)

TxDOT 0-6100-3 Development of Precast Bridge Deck Overhang System
51
Figure 4-12. TxDOT I-Girder (Tx62 and Tx70) (http://www.txdot.state.tx.us)
4.6.4. Shear Pocket Design
The smaller of the peak load and sustained load can be taken as the nominal shear transfer
capacity and this can be used to determine the number of shear pockets in a precast overhang
panel. The nominal shear transfer capacity of all shear pockets per panel can be estimated using
the following equation:
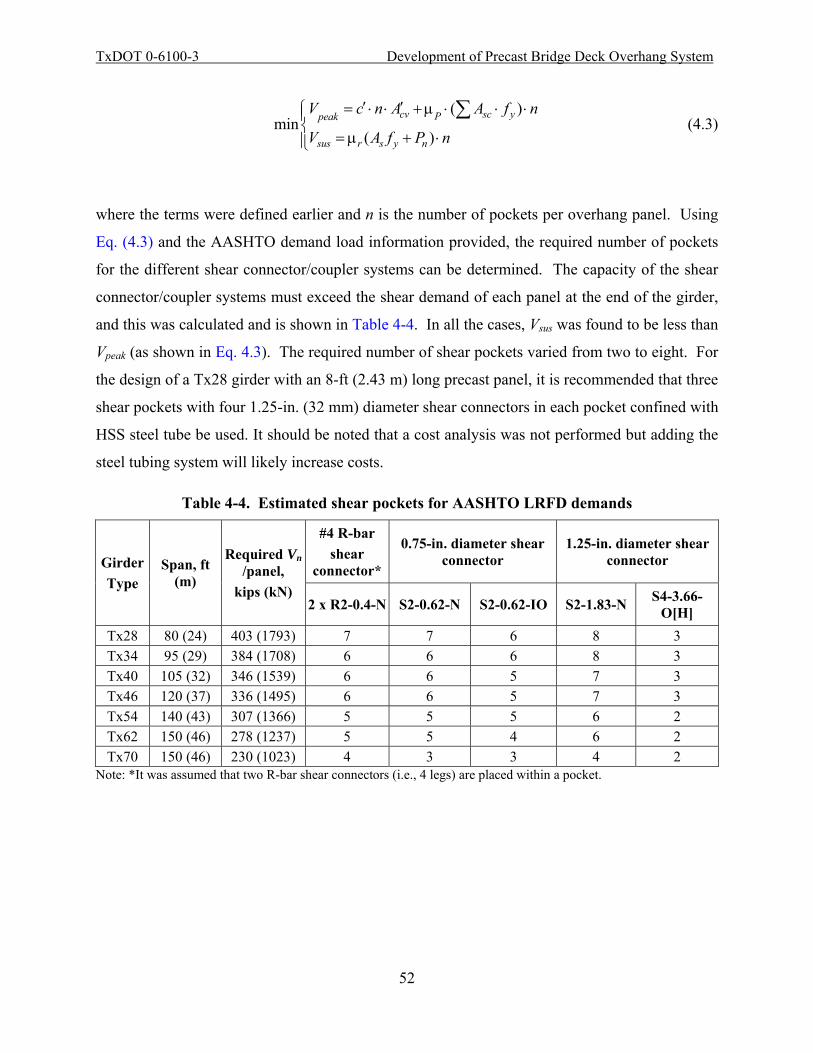
TxDOT 0-6100-3 Development of Precast Bridge Deck Overhang System
52
min( )
( )cv sc yPpeak
sus r s y n
V c n A A f n
V A f P n
′ ′= ⋅ ⋅ + μ ⋅ ⋅ ⋅⎧⎪⎨
= μ + ⋅⎪⎩
∑ (4.3)
where the terms were defined earlier and n is the number of pockets per overhang panel. Using
Eq. (4.3) and the AASHTO demand load information provided, the required number of pockets
for the different shear connector/coupler systems can be determined. The capacity of the shear
connector/coupler systems must exceed the shear demand of each panel at the end of the girder,
and this was calculated and is shown in Table 4-4. In all the cases, Vsus was found to be less than
Vpeak (as shown in Eq. 4.3). The required number of shear pockets varied from two to eight. For
the design of a Tx28 girder with an 8-ft (2.43 m) long precast panel, it is recommended that three
shear pockets with four 1.25-in. (32 mm) diameter shear connectors in each pocket confined with
HSS steel tube be used. It should be noted that a cost analysis was not performed but adding the
steel tubing system will likely increase costs.
Table 4-4. Estimated shear pockets for AASHTO LRFD demands
Girder Type
Span, ft (m)
Required Vn /panel,
kips (kN)
#4 R-bar shear
connector*
0.75-in. diameter shear connector
1.25-in. diameter shear connector
2 x R2-0.4-N S2-0.62-N S2-0.62-IO S2-1.83-N S4-3.66-O[H]
Tx28 80 (24) 403 (1793) 7 7 6 8 3 Tx34 95 (29) 384 (1708) 6 6 6 8 3 Tx40 105 (32) 346 (1539) 6 6 5 7 3 Tx46 120 (37) 336 (1495) 6 6 5 7 3 Tx54 140 (43) 307 (1366) 5 5 5 6 2 Tx62 150 (46) 278 (1237) 5 5 4 6 2 Tx70 150 (46) 230 (1023) 4 3 3 4 2
Note: *It was assumed that two R-bar shear connectors (i.e., 4 legs) are placed within a pocket.
TxDOT 0-6100-3 Development of Precast Bridge Deck Overhang System
53
4.7. SUMMARY
This section provides the information on the overall findings in the push-off tests.
• There were five stages of shear transfer and failure mechanisms prior to system
failure. These stages included the initial adhesion loss, shear key action, shear key
action failure, dowel action of the shear connectors at the sustained load, and final
failure of the system.
• The roughened surface on the girder surface provided a stronger adhesion between
the haunch material and the adjacent girder surface in the push-off samples (i.e., Vloss
values). However, Vloss values were not used to design the connections. Shear key
action clamped by shear connectors increased the interface shear capacity until the
shear key failed. Dowel action of the shear connectors is likely the main source of
the interface shear capacity after shear key failure.
• Four confinement systems were tested. These included three different hoop
confinement systems (inner, outer, and both) and one steel tube system. Test results
indicate that the steel tube system provided both improved shear key action and
improved dowel action and resulted in higher peak and sustained shear loads. It was
found that neither the inner confinement system alone or the outer confinement
system alone improved the confinement significantly. The S2-0.62-IO series
(containing inner and outer confinement) seemed to be effective only when the 0.75-
in. (19 mm) diameter shear connector/coupler system was used.
• A new design equation (Eq. 4.3) is proposed to estimate the shear capacity of the
girder-haunch-deck systems. The smaller value of the peak and sustained shear
capacity can be taken as the nominal shear transfer capacity and this can be used to
determine the number of shear pockets in a panel. Using the sustained shear value
may be conservative – using a percentage (less than 100 percent) of the peak load will
likely result in a lower number of pockets but may not be as conservative. The
number of shear pockets in each panel was determined for the newer TxDOT girder-

TxDOT 0-6100-3 Development of Precast Bridge Deck Overhang System
54
haunch-deck systems. Based on 80 percent of the sustained load, results indicate that
three shear pockets with four 1.25-in. (32 mm) diameter shear connectors in each
pocket, with each pocket confined with HSS steel tube is sufficient for Tx28 girder-
haunch-deck systems when using the AASHTO LRFD demand.

TxDOT 0-6100-3 Development of Precast Bridge Deck Overhang System
55
5. SUMMARY, CONCLUSIONS, AND RECOMMENDATIONS
5.1. SUMMARY AND CONCLUSIONS
The implementation of full-depth, precast overhang panel systems have the potential to improve
constructability and make bridges more economical. Initial testing and analyses reported in
0-6100-2 resulted in a design that required a large number of shear pockets in the overhang
panels to achieve the required interface shear capacity. Report 0-6100-1 took a different
approach for the design of the shear pockets and reported that the number of pockets per panel
could be reduced. However, this analysis included only one beam type and one span. In
addition, the demand was less than that typically used by AASHTO and the analysis was
performed for older types of TxDOT precast beams. The testing and analyses documented in
this report provide an assessment for determining the number of shear pockets required for
various connector systems for the newer TxDOT beams and recommendations are provided for a
number of beam types and spans. Specifically, this research was performed to assess a new shear
connector system for a full-depth precast deck to provide sufficient safety and structural
integrity. A total of 24 push-off tests were performed to investigate the shear transfer
performance. Test results were used to develop an appropriate equation for the design of high
strength shear connector/coupler systems for girder-haunch-deck systems. The major findings
are presented as follows:
1. Mechanisms: For the shear connector/coupler systems documented in this report,
there were five distinct stages up to failure. These stages included the initial
adhesion loss, shear key action, shear key action failure, dowel action of the shear
connectors at the sustained load, and final failure of the system.
2. Mechanisms: The roughened surface on the girder surface provided a stronger
adhesion between the haunch material and the adjacent girder surface in the push-
off samples. The unroughened surface on the underside of the precast deck panel
exhibited weaker adhesion to the haunch material. Surface roughening improves
the adhesion of the system but the surface adhesion (Vloss) was not used in

TxDOT 0-6100-3 Development of Precast Bridge Deck Overhang System
56
determining the shear resistance of the interface plane. After adhesion loss, the
main source of shear resistance was provided by shear key action near the shear
pocket (shear connectors/couplers, filling materials, and a confinement system)
until the peak load was achieved. The sustained load seems to be a result of the
dowel action of shear connectors.
3. Confinement Effect: Test result indicated the #3 [M10] hoop confinement system
(S2-0.62-IO) seemed to be effective only when the 0.75-in. (19 mm) diameter
shear connector/coupler system was used. The steel tube system provided both
improved shear key action and dowel action and resulted in higher peak and
sustained shear loads.
4. Design: This research resulted in the development of a new design equation for
estimating the shear capacity of girder-haunch-deck systems. Based on this
proposed equation, results indicate that pockets containing 1.25-in. (32 mm)
diameter shear connectors with steel tube confinement require the least number of
pockets. Note that the design uses 80 percent of the sustained load (Vsus). This
may be conservative. Using a percentage less than 100 and the peak load (Vpeak)
may result in even further reductions in pockets and connectors. For Tx 28 girders
(girders with the highest demand), results indicate that three shear pockets are
required for end panels. Table 4-4 provides a summary for different girder types
and connector systems. It should be noted that the research in this report only
assessed the shear capacity of systems with single pockets under lab conditions.
Issues related to fatigue, incorrect construction, non-uniform stress distributions,
and other potential influencing variables were not assessed. Care and good
engineering judgment should be used when designing overhang panels with the
proposed equation.
5.2. RECOMMENDATIONS
The following recommendations and future work are recommended based on the findings from this project.

TxDOT 0-6100-3 Development of Precast Bridge Deck Overhang System
57
1. The research findings indicate that high strength shear connectors with an
appropriate confinement system can reduce the number of shear pockets required
in precast overhang panels.
2. TxDOT should use appropriate friction factors and cohesion factors considering
the diameter of the shear connectors and the effectiveness of confinement. When
large diameter shear connectors are proposed, the friction factor should be reduced.
When a confinement system is proposed, the cohesion factor can be increased.
However, the cohesion factor should be limited to achieve sustained ductile
behavior. The design should be executed to the bar failure mode without deck and
shear pocket failure.
3. The grouping effects of the shear connectors in pockets should be further
investigated for both R-bar systems and shear connector systems. Additional
testing containing two shear connectors confined by the steel tube would be
beneficial to assess grouping effects.
4. To prevent interfacial failure between the steel confining tube and the deck
concrete, holes should be cut into the steel tube or protrusions should be welded to
the outside surface of the tube. This will likely resist slip in the vertical direction.
5. The full-scale tests with multiple shear pockets are necessary to verify proposed
design equation.


TxDOT 0-6100-3 Development of Precast Bridge Deck Overhang System
59
REFERENCES
AASHTO LRFD (2007). AASHTO LRFD Bridge Design Specifications, 4th Edition, 2007,
American Association of State Highway and Transportation Officials, Washington, D.C.
ACI (2008). Building Code Requirements for Reinforced Structural Concrete (ACI 318-08) and
Commentary, American Concrete Institute, Farmington Hills, Detroit.
Araujo, D. L., and Debs, M. K. El. (2005). “Strength of Shear Connection in Composite Bridges
with Precast Decks Using High Performance Concrete and Shear-keys, Materials and
Structures, Vol. 38, pp. 173-181.
ASTM A615 (2008). “Standard Specification for Deformed and Plain Carbon-steel Bars for
Concrete Reinforcement.” Annual book of ASTM standards, The American Society for
Testing and Materials, West Conshohocken, Pennsylvania.
ASTM C39 (2007). “Standard Test Method for Compressive Strength of Cylindrical Concrete
Specimens.” Annual book of ASTM standards, The American Society for Testing and
Materials, West Conshohocken, Pennsylvania.
ASTM C109 (2008). “Standard Test Method for Compressive Strength of Hydraulic Cement
Mortars (Using 2-in or [50mm] Cube Specimens).” Annual book of ASTM standards, The
American Society for Testing and Materials, West Conshohocken, Pennsylvania.
ASTM C1170 (2007). “Standard Specification for Packaged Dry, Hydraulic-Cement Grout.”
Annual book of ASTM standards, The American Society for Testing and Materials, West
Conshohocken, Pennsylvania.
Birkeland and Birkeland (1966). “Connections in Pre-Cast Concrete Construction.” ACI Journal,
Vol. 63, No. 3, pp. 345-367.
Coulomb, C. A. (1776). Essai sur une application des regles des maximis et minimis a quelquels
problems de statique, relatifs a la architecture.Academie Royale des Sciences,, Vol. 7, pp.
343-382.
Kovach, J. D., and Natio, C. (2008). “Horizontal Shear Capacity of Composite Concrete Beams
without Interface Ties.” Advanced Technology for Large Structural Systems (ATLSS)
Report No. 08-05, Lehigh University, Bethlehem.
Mattock, A. H., and Hawkins, N. M. (1972). “Shear Transfer in Reinforced Concrete–Recent
Research,” Precast/Prestressed Concrete Institute (PCI) Journal, Vol. 17, No. 2, pp. 55-75.

TxDOT 0-6100-3 Development of Precast Bridge Deck Overhang System
60
Mattock, A. H., Li, W. K., and Want, T. C. (1976). “Shear Transfer in Lightweight Reinforced
Concrete,” PCI Journal, Vol. 21, No. 1, pp. 20-39.
Mattock, A. H. (1974). “Shear Transfer in Concrete Having Reinforcement at an Angle to Shear
Plane,” Shear in Reinforced Concrete, SP-42, American Concrete Institute, Farmington Hills,
MI, pp. 17-42.
Mattock, A. H. (2001). “Shear Friction and High-Strength Concrete,” ACI Structural Journal,
Vol. 98, No. 1, pp. 50-59.
NCHRP Report 584 (2008). “Full-Depth Precast Concrete Bridge Deck Panel System.”
Transportation Research Board, Washington, D.C.
PCI Design Handbook (2004). Precast and Prestressed Concrete, 6th Edition, MNL-120-4,
Precast/Prestressed Concrete Institute, Chicago, IL, p. 736.
Patton, F. D. (1966). “Multiple mode of shear failure in rock and related materials,” PhD
Dissertation, University of Illinois at Urbana-Champaign, IL,
Park, P., and T. Paulay (1975). Reinforced Concrete Structures, John Wiley & Sons, New York,
p. 769. Rezansoff, T., and Hosain, M. U. (1983). “Headed Shear Stud Connectors in a Stub-girder floor
system: a preliminary study: Reply,” Canadian Journal of Civil Engineering.
Scholz, D.P., Wallenfelsz, J. A., Lijeron, C., and Roberts-Wollmann, C.L. (2007).
“Recommendations for the Connection Between Full-Depth Precast Bridge Deck Panel
Systems and Precast I-Beams.” Report No. VTRC 07-CR17, Virgnia Transportation
Research Council, Charlottesville, VA.
Sullivan, S. (2007). “Construction and Behavior of Precast Bridge Deck Panel Systems.” Ph.D.
Dissertation, Virginia Tech, Blacksburg.
Trejo, D., Hite, M., Mander, J., Mander, T. J., Henley, M., Scott, R., Ley, T., and Patil, S.
(2009). “Development of a Precast Bridge Deck Overhang.” TxDOT Report 0-6100-2.
Trejo, D., Hite, M., Mander, J., Mander, T. J., Henley, M., Scott, R., Ley, T., and Patil, S.
(2011). “Development of a Precast Bridge Deck Overhang.” TxDOT Report 0-6100-1.