Embed Size (px)
Citation preview
Development of Oilseed Crops for Biodiesel Production under Colorado
Limited Irrigation Conditions
Jerry JohnsonNicolas EnjalbertJoel Schneekloth
Alan HelmRavi Malhotra
Daren Coonrod
April 2009
Completion Report No. 211
Th is report was fi nanced in part by the U.S. Department of the Interior, Geological Survey, through the Colorado Water Institute. Th e views and conclusions contained in this document are those of the authors and should not be interpreted as necessarily representing the offi cial policies, either expressed or implied, of the U.S. Government.
Additional copies of this report can be obtained from the Colorado Water Institute, E102 Engineering Building, Colorado State University, Fort Collins, CO 80523‐1033 970‐491‐6308 or email: [email protected], or downloaded as a PDF fi le from http://www.cwi.colostate.edu.
Colorado State University is an equal opportunity/affi rmative action employer and complies with all federal and Colorado laws, regulations, and executive orders regarding affi rmative action requirements in all programs. Th e Offi ce of Equal Opportunity and Diversity is located in 101 Student Services. To assist Colorado State University in meeting its affi rmative action responsibilities, ethnic minorities, women and other protected class members are encouraged to apply and to so identify themselves.
Acknowledgements
Th e investigators are thankful for the support received from the Colorado Water Institute (CWI), without which most of the oilseed-for-biofuel research accomplishments during the past two years would not have been possible. Extension and training of students at all levels were also made possible by funding support from CWI. Th e authors extend a special thanks to CWI’s director, Reagan Waskom, for his guidance and willingness to share in our triumphs and setbacks during the life of this project. As evidenced in this fi nal report, our accomplishments have only been possible because we have worked seamlessly as a team, each author and investor depending on the knowledge, experience, and work of the other members of the team. No less important to the success of this project are the collaborating farmers, Colorado Agriculture Research Centers, USDA-ARS researchers, private companies, and state agencies that have conducted trials or supported oilseed research.
1
Development of Oilseed Crops for Biodiesel Production under Colorado Limited
Irrigation Conditions
Final Report to the Colorado Water Institute Jerry Johnson Associate Professor Extension Specialist Nicolas Enjalbert Graduate Research Assistant Joel Schneekloth Extension Water Resource Specialist Alan Helm Agronomy/Weed Management Specialist Ravi Malhotra Executive Director, iCast Daren Coonrod Plant Geneticist Cargill Department of Soil and Crop Sciences Colorado State University Fort Collins, CO 80523
2
Table of Contents
Introduction ..................................................................................................................................... 4
History of the Diesel Engine ................................................................................................... 4
Scope ............................................................................................................................................... 5
Objectives ....................................................................................................................................... 5
Definition and Conceptualization of Limited Irrigation in Colorado ............................................. 5
Project ............................................................................................................................................. 7
Target Species Variety Performance Trials Results and Analyses ............................................. 7
Results of 2007 and 2008 Crop Variety Performance Trials ...................................................... 8
Soybean ................................................................................................................................... 9
Sunflower .............................................................................................................................. 10
Safflower ............................................................................................................................... 12
Winter and Spring Canola ..................................................................................................... 13
Camelina ............................................................................................................................... 15
Oil Profile Analysis of the Targeted Crops ............................................................................... 19
Camelina Agronomy Trial ........................................................................................................ 21
Screening New Alternative Crops ................................................................................................ 24
Camelina sativa ......................................................................................................................... 24
Brassica carinata (Ethiopian mustard) ..................................................................................... 26
The Approach............................................................................................................................ 26
Greenhouse Study ................................................................................................................. 27
Field Study ............................................................................................................................ 27
Results and Analysis ................................................................................................................. 27
Camelina sativa ..................................................................................................................... 27
3
Brassica carinata ................................................................................................................... 31
Economic Feasibility .................................................................................................................... 34
Limited Irrigation Rotation ....................................................................................................... 35
Dryland Rotation ....................................................................................................................... 36
Benefits of SVO for Colorado ...................................................................................................... 40
Training ......................................................................................................................................... 42
Table of Figures ............................................................................................................................ 46
References ..................................................................................................................................... 49
4
Introduction
Since 2001, Colorado State University’s Crops Testing Program, in collaboration with many
other university and USDA ARS researchers, extension agents, farmers, private companies, and
a non-profit organization, has undertaken oilseed-for-biofuel crop research and extension. The
objective of this research is to test and adapt oilseed crop species (and varieties) to dryland,
limited irrigation, and fully irrigated cropping systems prevalent in eastern Colorado, eastern
Wyoming, western Kansas, and the Nebraska Panhandle. Regionally applied research has
focused on agronomy trials, interaction with first-adopter farmers, weed control experiments,
insect pest observations, crop water use experiments, and crop response to variable climatic
conditions. This research has resulted in strong collegial relationships among researchers,
farmers, private company representatives, and extension agents within the Great Plains area.
This research project is an integral contributor and benefactor of our overall efforts to provide
cropping alternatives that are economically feasible and environmentally sustainable to eastern
Colorado producers, specifically those with limited irrigation.
History of the Diesel Engine
During 1885, Rudolf Diesel set up his first shop-laboratory in Paris and began the 13-year ordeal
of creating his distinctive engine. In 1893, he published a paper describing an engine with
‘sparkless’ combustion within a cylinder, named the internal combustion engine. Baron von
Krupp and Machinenfabrik Augsburg Nurnberg Company in Germany supported Rudolf Diesel
financially and provided engineers to work with him on the development of an engine designed
to burn coal dust, because there were mountains of useless coal dust piled up in the Ruhr Valley.
The first experimental engine was built in 1893and used high pressure air to blast the coal dust
into the combustion chamber. The engine exploded and further developments of coal dust based
fuel failed. However, a compression ignition engine that used oil, putatively peanut oil, as fuel
was successful, and a number of manufacturers were licensed to build similar engines. In 1894,
Diesel filed for a patent for his new invention, dubbed the diesel engine. Rudolf Diesel was
almost killed by his engine when it exploded. However, the engine was the first to prove that fuel
could be ignited without a spark. In 1896, Diesel demonstrated another model with the
5
theoretical efficiency of 75 percent, in contrast to the 10 percent efficiency of the steam engine.
In 1898, Rudolf Diesel was granted his patent #608,845 for an "internal combustion engine" and
in that same year, Busch installed a Rudolf Diesel-type engine in its brewery in St. Louis. That
was the first engine of that kind in the United States.
Scope
This two-year project used field, greenhouse, and laboratory facilities to screen oilseed
germplasm from around the world and to select oilseed cultivars adapted to Colorado’s limited
irrigation conditions and train a new crops specialist.
Objectives
1. To screen advanced lines of promising oilseed crop species (canola, camelina, soybean,
sunflower) for adapted cultivars that could be grown by Colorado producers in the near
future for biodiesel production and oilseed meal to feed northeast Colorado livestock.
2. To develop a research-based agronomic package of best management practices for
oilseed production under limited irrigation conditions especially oriented toward weed
control and water management.
3. To import and screen potentially new and underdeveloped oilseed crop species from
temperate zones around the world.
4. To train a new crop agronomist/breeder to the PhD level. To train summer students and
research associates in new crop research techniques and methodologies.
5. To determine the economic feasibility of oilseed crop production under limited irrigation
conditions in light of dynamic interactions of variable yield, fuel costs, and input costs.
Definition and Conceptualization of Limited Irrigation in Colorado
“Limited irrigation occurs when water supplies are restricted in some way to the point that full
evapotranspiration demands cannot be met” (Klocke et al., 2004). Full irrigation is the amount of
water minus rainfall and stored soil moisture needed to achieve maximum crop yield. However,
when irrigation water is insufficient to meet crop demand, limited irrigation management
strategies should be considered (Norton et al., 2000).
6
There are two types of limited irrigation:
1. Supply: The amount of water available is fixed at any given time in the crop season and
applied on a delivery schedule, not on crop demand. During high demand, the crop water
requirements may not be met. The Fort Collins trials were conducted under this
production environment (in addition to high pH and highly sodic soil conditions).
2. Capacity: The global water amount is limited in quantity but not in a fixed schedule, and
crops can be irrigated on demand. However, it is important to choose the most critical
stage when the water is to be applied. The other trials in the study were established under
this water regime.
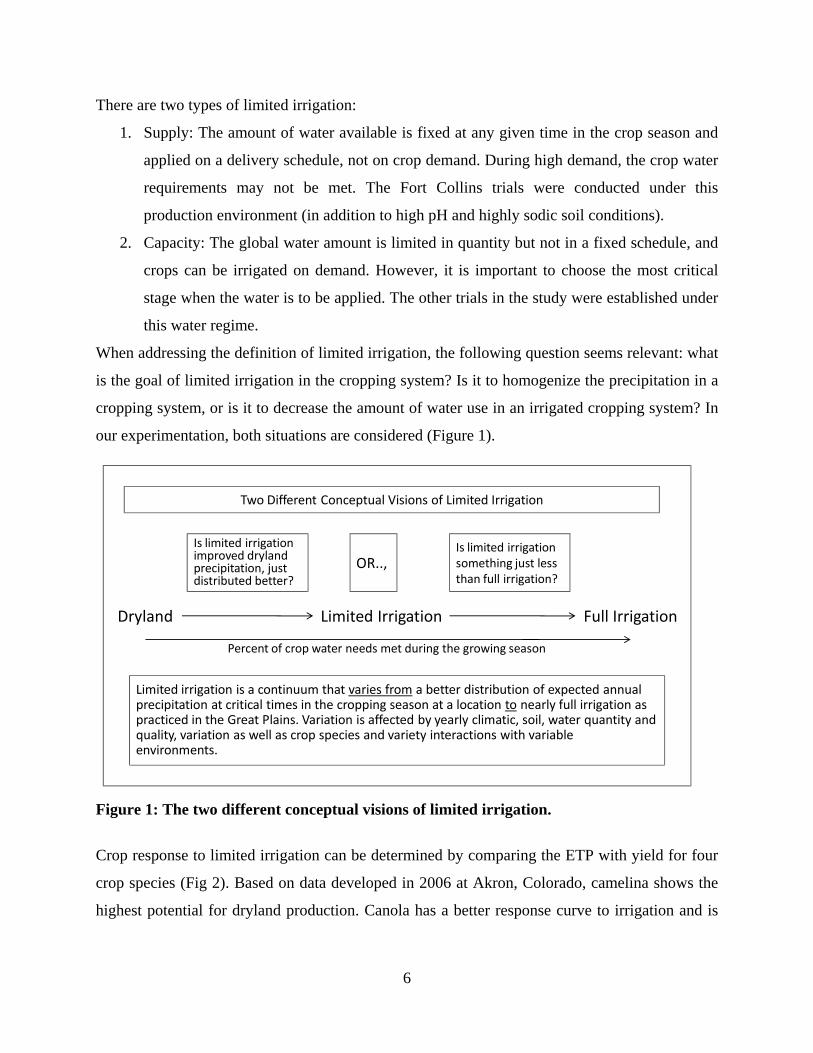
When addressing the definition of limited irrigation, the following question seems relevant: what
is the goal of limited irrigation in the cropping system? Is it to homogenize the precipitation in a
cropping system, or is it to decrease the amount of water use in an irrigated cropping system? In
our experimentation, both situations are considered (Figure 1).
Two Different Conceptual Visions of Limited Irrigation
Dryland Limited Irrigation Full Irrigation
Percent of crop water needs met during the growing season
Limited irrigation is a continuum that varies from a better distribution of expected annual precipitation at critical times in the cropping season at a location to nearly full irrigation as practiced in the Great Plains. Variation is affected by yearly climatic, soil, water quantity and quality, variation as well as crop species and variety interactions with variable environments.
Is limited irrigation improved dryland precipitation, just distributed better?
OR.., Is limited irrigation something just less than full irrigation?
Figure 1: The two different conceptual visions of limited irrigation.
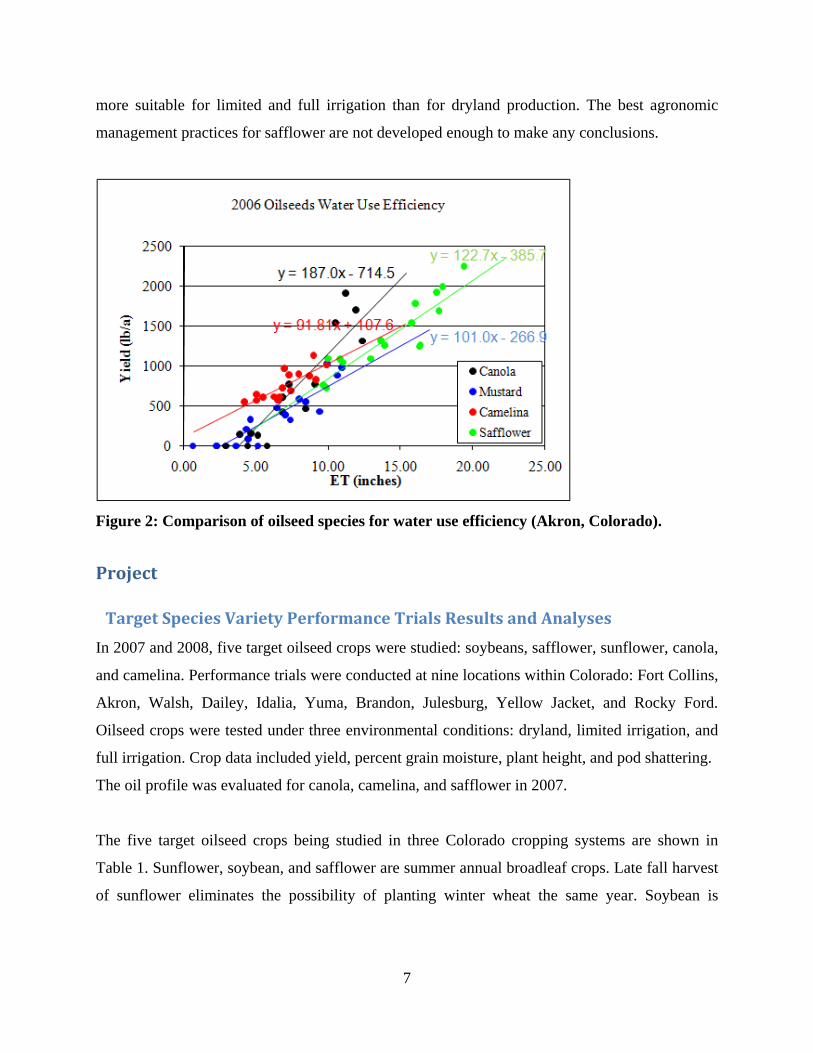
Crop response to limited irrigation can be determined by comparing the ETP with yield for four
crop species (Fig 2). Based on data developed in 2006 at Akron, Colorado, camelina shows the
highest potential for dryland production. Canola has a better response curve to irrigation and is
7
more suitable for limited and full irrigation than for dryland production. The best agronomic
management practices for safflower are not developed enough to make any conclusions.
Figure 2: Comparison of oilseed species for water use efficiency (Akron, Colorado).
Project
Target Species Variety Performance Trials Results and Analyses
In 2007 and 2008, five target oilseed crops were studied: soybeans, safflower, sunflower, canola,
and camelina. Performance trials were conducted at nine locations within Colorado: Fort Collins,
Akron, Walsh, Dailey, Idalia, Yuma, Brandon, Julesburg, Yellow Jacket, and Rocky Ford.
Oilseed crops were tested under three environmental conditions: dryland, limited irrigation, and
full irrigation. Crop data included yield, percent grain moisture, plant height, and pod shattering.
The oil profile was evaluated for canola, camelina, and safflower in 2007.
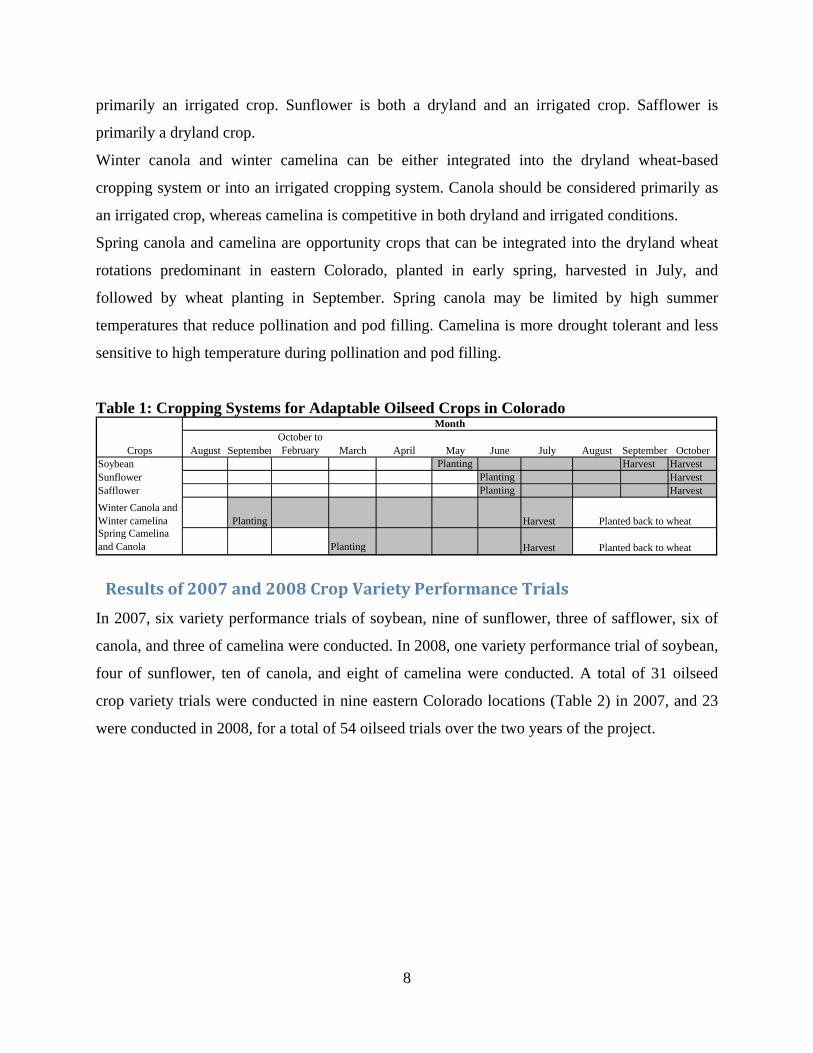
The five target oilseed crops being studied in three Colorado cropping systems are shown in
Table 1. Sunflower, soybean, and safflower are summer annual broadleaf crops. Late fall harvest
of sunflower eliminates the possibility of planting winter wheat the same year. Soybean is
8
primarily an irrigated crop. Sunflower is both a dryland and an irrigated crop. Safflower is
primarily a dryland crop.
Winter canola and winter camelina can be either integrated into the dryland wheat-based
cropping system or into an irrigated cropping system. Canola should be considered primarily as
an irrigated crop, whereas camelina is competitive in both dryland and irrigated conditions.
Spring canola and camelina are opportunity crops that can be integrated into the dryland wheat
rotations predominant in eastern Colorado, planted in early spring, harvested in July, and
followed by wheat planting in September. Spring canola may be limited by high summer
temperatures that reduce pollination and pod filling. Camelina is more drought tolerant and less
sensitive to high temperature during pollination and pod filling.
Table 1: Cropping Systems for Adaptable Oilseed Crops in Colorado
August SeptemberOctober to February March April May June July August September October
Soybean Planting Harvest HarvestSunflower Planting HarvestSafflower Planting HarvestWinter Canola and Winter camelina Planting HarvestSpring Camelina and Canola Planting Harvest
Month
Crops
Planted back to wheat
Planted back to wheat
Results of 2007 and 2008 Crop Variety Performance Trials
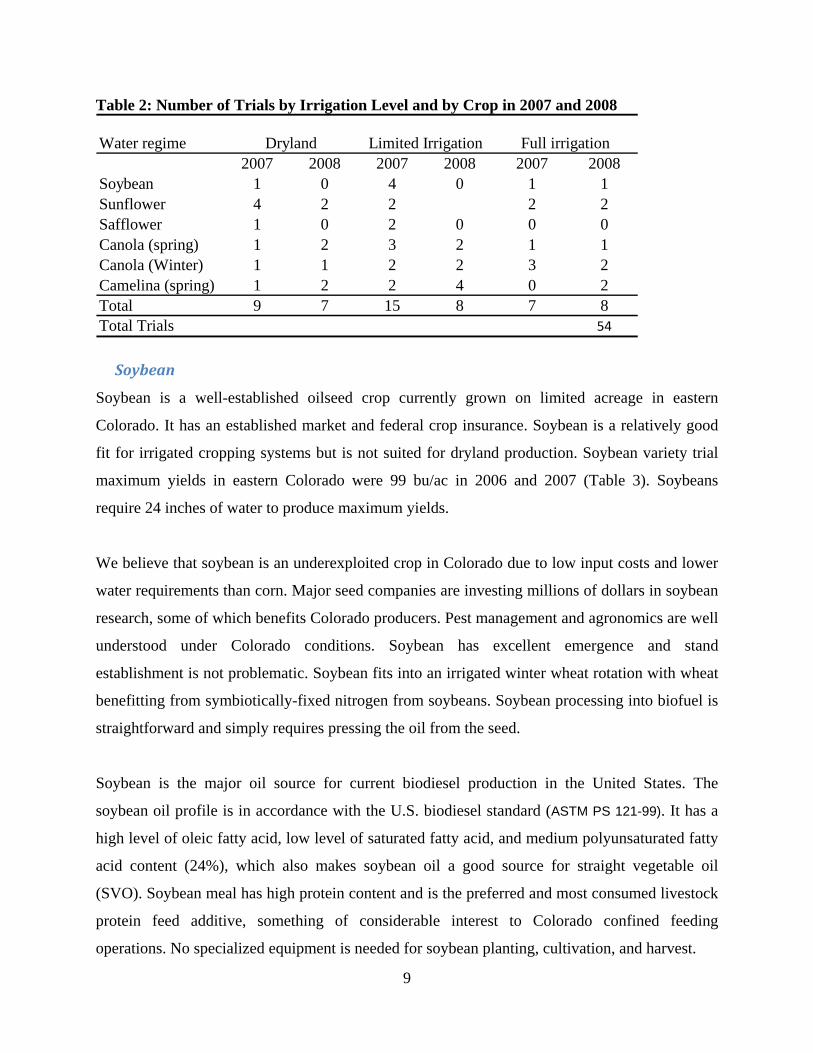
In 2007, six variety performance trials of soybean, nine of sunflower, three of safflower, six of
canola, and three of camelina were conducted. In 2008, one variety performance trial of soybean,
four of sunflower, ten of canola, and eight of camelina were conducted. A total of 31 oilseed
crop variety trials were conducted in nine eastern Colorado locations (Table 2) in 2007, and 23
were conducted in 2008, for a total of 54 oilseed trials over the two years of the project.
9
Table 2: Number of Trials by Irrigation Level and by Crop in 2007 and 2008
Water regime2007 2008 2007 2008 2007 2008
Soybean 1 0 4 0 1 1Sunflower 4 2 2 2 2Safflower 1 0 2 0 0 0Canola (spring) 1 2 3 2 1 1Canola (Winter) 1 1 2 2 3 2Camelina (spring) 1 2 2 4 0 2Total 9 7 15 8 7 8Total Trials 54
Full irrigationLimited IrrigationDryland
Soybean
Soybean is a well-established oilseed crop currently grown on limited acreage in eastern
Colorado. It has an established market and federal crop insurance. Soybean is a relatively good
fit for irrigated cropping systems but is not suited for dryland production. Soybean variety trial
maximum yields in eastern Colorado were 99 bu/ac in 2006 and 2007 (Table 3). Soybeans
require 24 inches of water to produce maximum yields.
We believe that soybean is an underexploited crop in Colorado due to low input costs and lower
water requirements than corn. Major seed companies are investing millions of dollars in soybean
research, some of which benefits Colorado producers. Pest management and agronomics are well
understood under Colorado conditions. Soybean has excellent emergence and stand
establishment is not problematic. Soybean fits into an irrigated winter wheat rotation with wheat
benefitting from symbiotically-fixed nitrogen from soybeans. Soybean processing into biofuel is
straightforward and simply requires pressing the oil from the seed.
Soybean is the major oil source for current biodiesel production in the United States. The
soybean oil profile is in accordance with the U.S. biodiesel standard (ASTM PS 121-99). It has a
high level of oleic fatty acid, low level of saturated fatty acid, and medium polyunsaturated fatty
acid content (24%), which also makes soybean oil a good source for straight vegetable oil
(SVO). Soybean meal has high protein content and is the preferred and most consumed livestock
protein feed additive, something of considerable interest to Colorado confined feeding
operations. No specialized equipment is needed for soybean planting, cultivation, and harvest.
10
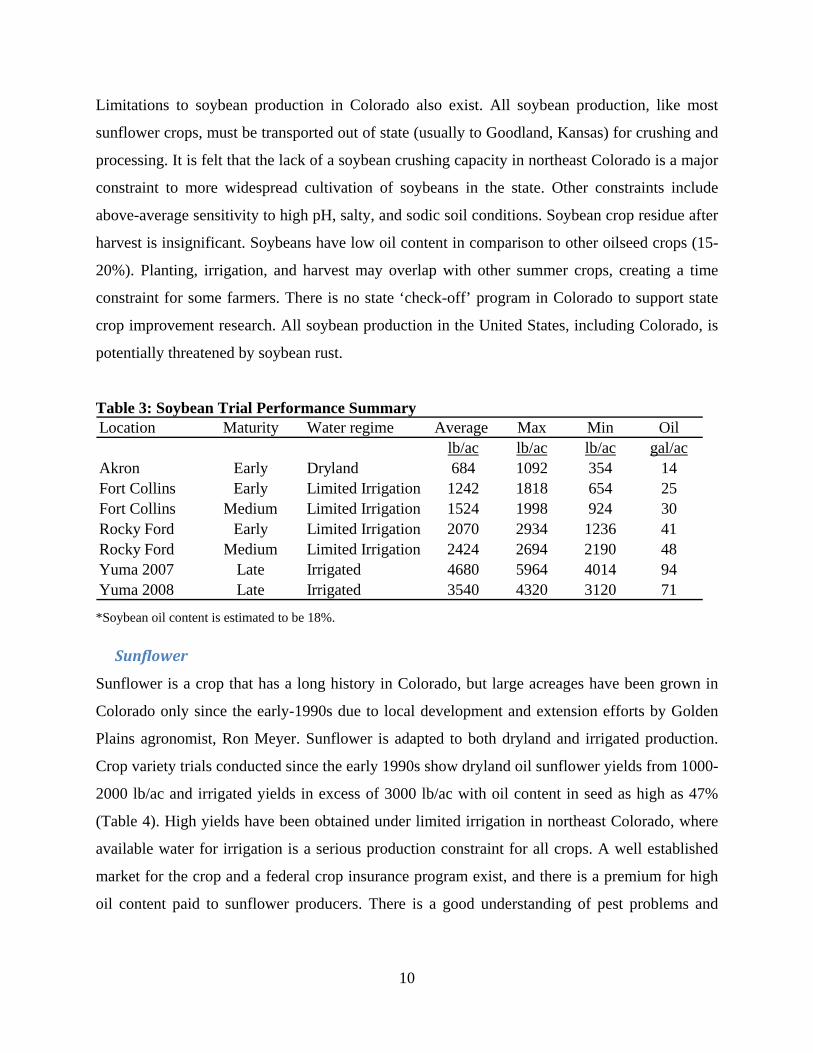
Limitations to soybean production in Colorado also exist. All soybean production, like most
sunflower crops, must be transported out of state (usually to Goodland, Kansas) for crushing and
processing. It is felt that the lack of a soybean crushing capacity in northeast Colorado is a major
constraint to more widespread cultivation of soybeans in the state. Other constraints include
above-average sensitivity to high pH, salty, and sodic soil conditions. Soybean crop residue after
harvest is insignificant. Soybeans have low oil content in comparison to other oilseed crops (15-
20%). Planting, irrigation, and harvest may overlap with other summer crops, creating a time
constraint for some farmers. There is no state ‘check-off’ program in Colorado to support state
crop improvement research. All soybean production in the United States, including Colorado, is
potentially threatened by soybean rust.
Table 3: Soybean Trial Performance Summary Location Maturity Water regime Average Max Min Oil
lb/ac lb/ac lb/ac gal/acAkron Early Dryland 684 1092 354 14Fort Collins Early Limited Irrigation 1242 1818 654 25Fort Collins Medium Limited Irrigation 1524 1998 924 30Rocky Ford Early Limited Irrigation 2070 2934 1236 41Rocky Ford Medium Limited Irrigation 2424 2694 2190 48Yuma 2007 Late Irrigated 4680 5964 4014 94Yuma 2008 Late Irrigated 3540 4320 3120 71
*Soybean oil content is estimated to be 18%.
Sunflower
Sunflower is a crop that has a long history in Colorado, but large acreages have been grown in
Colorado only since the early-1990s due to local development and extension efforts by Golden
Plains agronomist, Ron Meyer. Sunflower is adapted to both dryland and irrigated production.
Crop variety trials conducted since the early 1990s show dryland oil sunflower yields from 1000-
2000 lb/ac and irrigated yields in excess of 3000 lb/ac with oil content in seed as high as 47%
(Table 4). High yields have been obtained under limited irrigation in northeast Colorado, where
available water for irrigation is a serious production constraint for all crops. A well established
market for the crop and a federal crop insurance program exist, and there is a premium for high
oil content paid to sunflower producers. There is a good understanding of pest problems and
11
management in Colorado conditions, and sunflowers are better able to recover from hail damage
than many other crops.
Sunflowers fit well into both conventional and no-till cropping systems. Colorado producers are
adopting rotations, including a summer crop like sunflower, corn, or proso millet, while moving
away from the traditional wheat-fallow rotation. Many high-yielding and high oil content
sunflower hybrid varieties are available for producers who benefit from sunflower improvement
conducted by many major crop seed companies and crop variety testing under Colorado
conditions. Sunflowers are well suited to direct harvest with planting, tillage, and harvest
equipment already owned by Colorado producers. Even prior to the recent release of herbicide-
resistant sunflower hybrids, conventional chemical weed control packages existed that—albeit
not perfect—were suitable for Colorado production. High protein sunflower meal is valuable to
sunflower processing companies. In addition to the National Sunflower Association, which
supports research and promotes sunflower products, the Colorado Sunflower Administrative
Committee, our state ‘check-off’ organization created and funded by Colorado producers,
supports applied research and promotion of Colorado
produced sunflower products. Sunflower oil is the second
most produced oilseed for biofuel in Europe.
Some constraints to sunflower production should be
mentioned. There have been some instances of yield
reduction in the crops subsequent to sunflower due to
extensive water and nutrient extraction by a good sunflower
crop. Sunflowers have a history of poor emergence under
dry planting conditions, resulting in poor stand
establishment. Weed management in sunflower can be
troublesome when dealing with late emerging weeds.
Sunflower residue after harvest is not significant and does
not stand up to high winds. Rodents, voles, ground squirrels, and birds can unearth newly planted
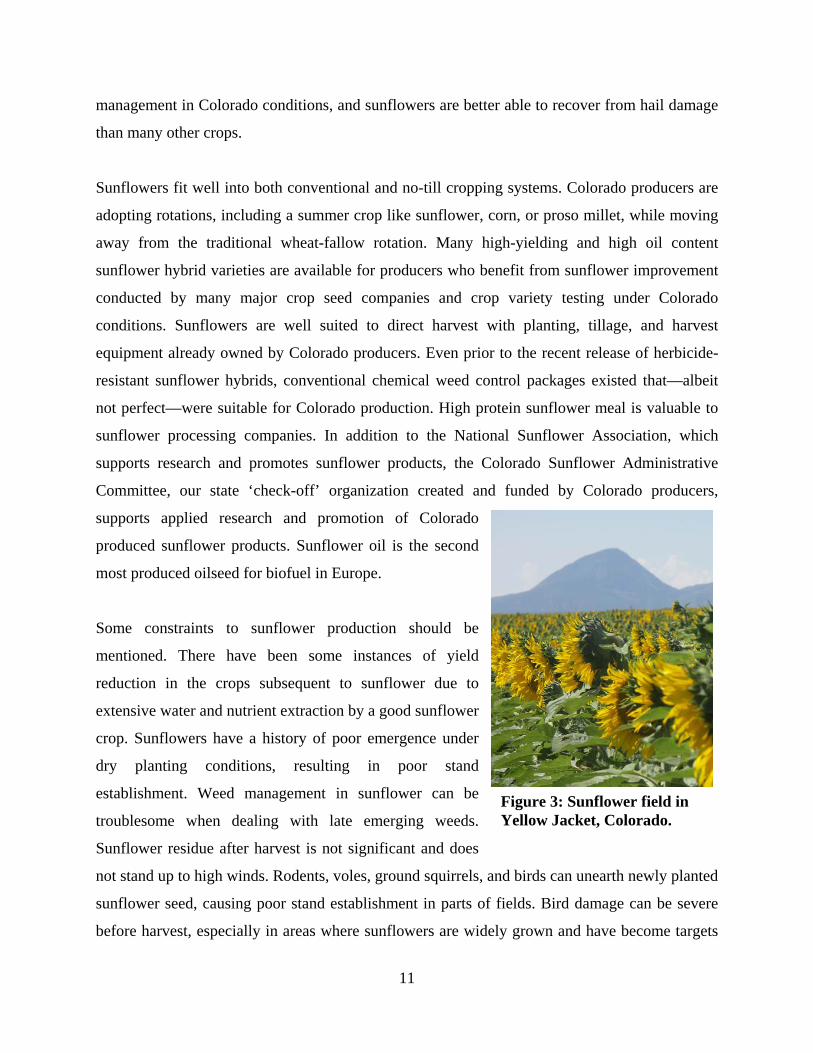
sunflower seed, causing poor stand establishment in parts of fields. Bird damage can be severe
before harvest, especially in areas where sunflowers are widely grown and have become targets
Figure 3: Sunflower field in Yellow Jacket, Colorado.

12
of local blackbird populations. When processing sunflower for biofuel, wax content from the oils
needs to removed to avoid damage to engines. Although sunflower has good potential as a
biofuel crop in Colorado, vegetable oil market prices have historically exceeded the value of the
oil for biofuel. The Colorado company crushing sunflowers for oil is in Lamar, and the whole oil
is exported out of Colorado for refining and retail sales. The majority of the Colorado sunflower
crop produced in northeast Colorado must be transported to Goodland, Kansas, for crushing. A
new facility will begin operations in 2009 in Dove Creek, Colorado.
Table 4: 2007 and 2008 Sunflower Trial Performance Summary
Location Type Water regime2007 2008 2007 2008 2007 2008 2007 2008 Averagelb/ac lb/ac lb/ac lb/ac lb/ac lb/ac % % gal/ac
Brandon Oil Dryland 2005 1366 2445 1936 1611 953 38.7 40 89.9Julesburg Oil Irrigated 2768 3474 2278 41.15 40 147.6Idalia Irrigated 2407 3620 1269 40 128.4
Average Max MinYield
Oil
Safflower
Safflower is a potential oilseed crop for Colorado that is well suited to dryland production. There
is a limited market established for safflower in the state meaning that producers interested in
growing safflower should identify a market before planting the crop. There is no crop insurance
available for safflower in Colorado, and there is no ‘check-off’ or grower organization that
would support research and marketing of safflower. Being a relatively short-season crop, it fits
well into crop rotations. It is also an aggressive scavenger for water and residual fertility.
Safflower seed has relatively high oil content and is easily processed; it requires no special
equipment for planting and is directly harvested. Emergence and stand establishment are
typically not a problem in production of safflower.
Safflower production and use constraints outnumber the constraints for more widely produced
crops like sunflower and soybean. There is not a varietal improvement program in the High
Plains, and seed for planting can be hard to find. Weed management in safflower can be
problematic due to the lack of herbicides labeled for broadleaf weed control. Hauling the
harvested crop is an issue since the market is limited. The research knowledge base for safflower
production in Colorado is scarce because there is no producer organization to promote this crop.
Safflower’s response to irrigation is not established but is being researched. Safflower can
13
present a fire hazard during harvest and leaves little residue. Safflower is another potential
biofuel crop but, like sunflower, it competes directly with human consumption.
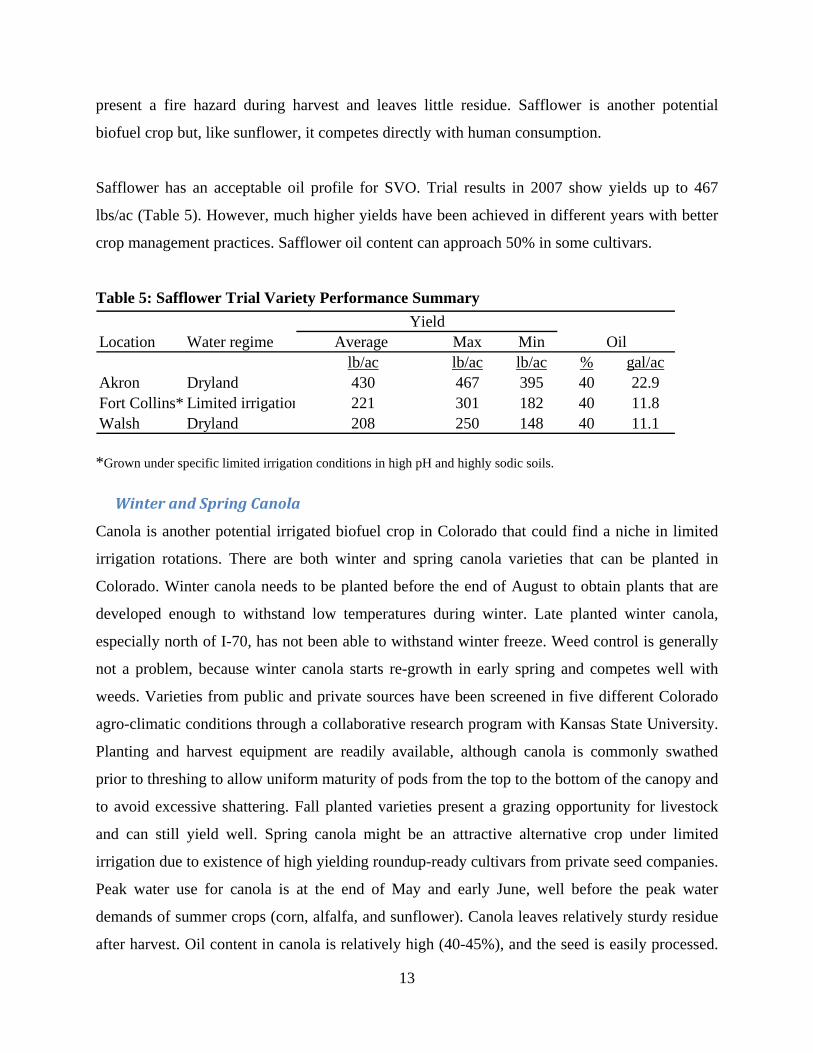
Safflower has an acceptable oil profile for SVO. Trial results in 2007 show yields up to 467
lbs/ac (Table 5). However, much higher yields have been achieved in different years with better
crop management practices. Safflower oil content can approach 50% in some cultivars.
Table 5: Safflower Trial Variety Performance Summary
Location Water regime Average Max Minlb/ac lb/ac lb/ac % gal/ac
Akron Dryland 430 467 395 40 22.9Fort Collins* Limited irrigation 221 301 182 40 11.8Walsh Dryland 208 250 148 40 11.1
YieldOil
*Grown under specific limited irrigation conditions in high pH and highly sodic soils.
Winter and Spring Canola
Canola is another potential irrigated biofuel crop in Colorado that could find a niche in limited
irrigation rotations. There are both winter and spring canola varieties that can be planted in
Colorado. Winter canola needs to be planted before the end of August to obtain plants that are
developed enough to withstand low temperatures during winter. Late planted winter canola,
especially north of I-70, has not been able to withstand winter freeze. Weed control is generally
not a problem, because winter canola starts re-growth in early spring and competes well with
weeds. Varieties from public and private sources have been screened in five different Colorado
agro-climatic conditions through a collaborative research program with Kansas State University.
Planting and harvest equipment are readily available, although canola is commonly swathed
prior to threshing to allow uniform maturity of pods from the top to the bottom of the canopy and
to avoid excessive shattering. Fall planted varieties present a grazing opportunity for livestock
and can still yield well. Spring canola might be an attractive alternative crop under limited
irrigation due to existence of high yielding roundup-ready cultivars from private seed companies.
Peak water use for canola is at the end of May and early June, well before the peak water
demands of summer crops (corn, alfalfa, and sunflower). Canola leaves relatively sturdy residue
after harvest. Oil content in canola is relatively high (40-45%), and the seed is easily processed.
14
The meal byproduct is high in protein and is a valuable livestock feed, like soybean. Canola
produces a high-quality fuel and has good potential for biofuel and meal production for use on
the farm.
There are several downsides to canola production. Flea beetles that attack young canola
seedlings must be controlled with chemical treatments. There is not a well established market,
and there is no Colorado grower organization to promote production and research. Canola is not
a good candidate for direct harvest and should be swathed and then picked up much the same as
millet. Canola is sensitive to many of the herbicides used in other crops and in fallow periods
such as atrazine, Ally, and others. Since there is not a well established market for canola in
Colorado, hauling of the harvested product can be an issue.
Canola is small-seeded and needs to be shallow planted to obtain good stands. Deep seeding, or
soil crusting, or planting into dry soil conditions can significantly reduce stands. Canola is
sensitive to high temperatures during flowering, which may reduce yields. Lack of adequate soil
moisture will reduce yields more than with camelina. Canola has a taproot system giving the
crop access to deep water and nutrients (Downey et al., 1974). However, when grown in
semiarid regions such as the High Plains, the canola roots require adequate subsoil moisture to
sustain the crop during flowering and seed filling. Under managed irrigation, winter canola is
capable of yielding more than 3,000 lbs/ac. Low crop prices and lack of an established market
infrastructure for canola are significant obstacles to more widespread production in Colorado.
With limited grower experience and the lack of insurance programs, production of canola has
been limited.
15
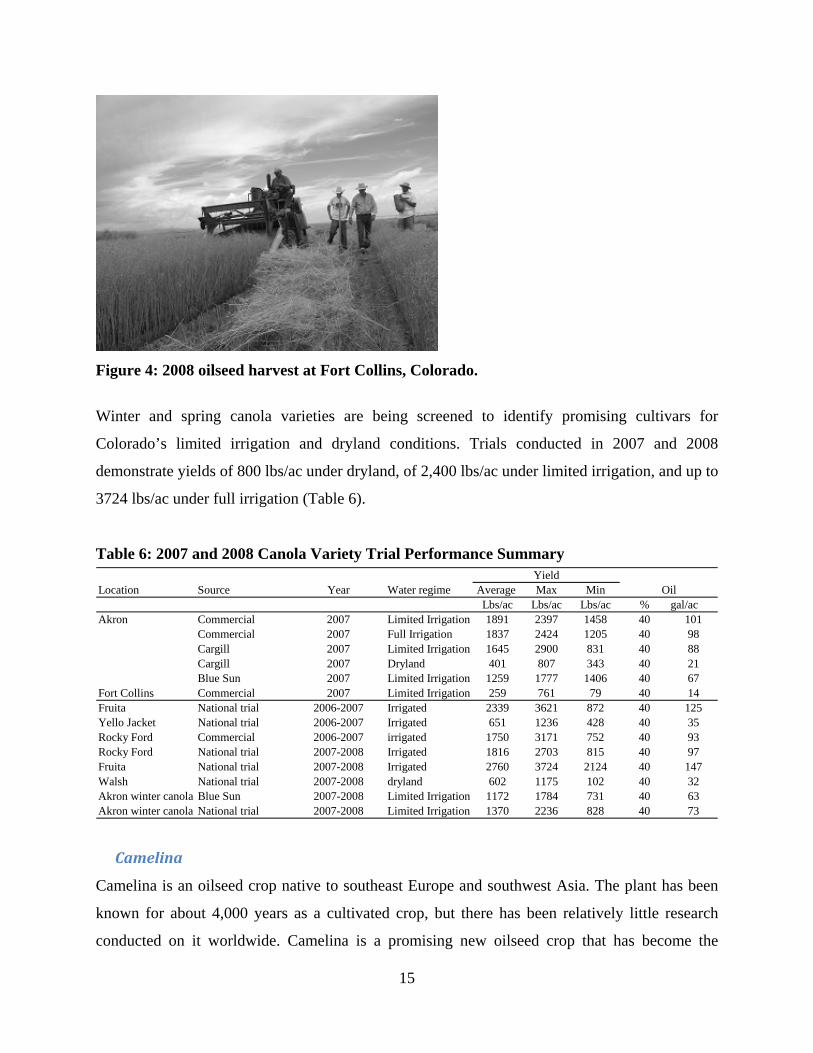
Figure 4: 2008 oilseed harvest at Fort Collins, Colorado.
Winter and spring canola varieties are being screened to identify promising cultivars for
Colorado’s limited irrigation and dryland conditions. Trials conducted in 2007 and 2008
demonstrate yields of 800 lbs/ac under dryland, of 2,400 lbs/ac under limited irrigation, and up to
3724 lbs/ac under full irrigation (Table 6).
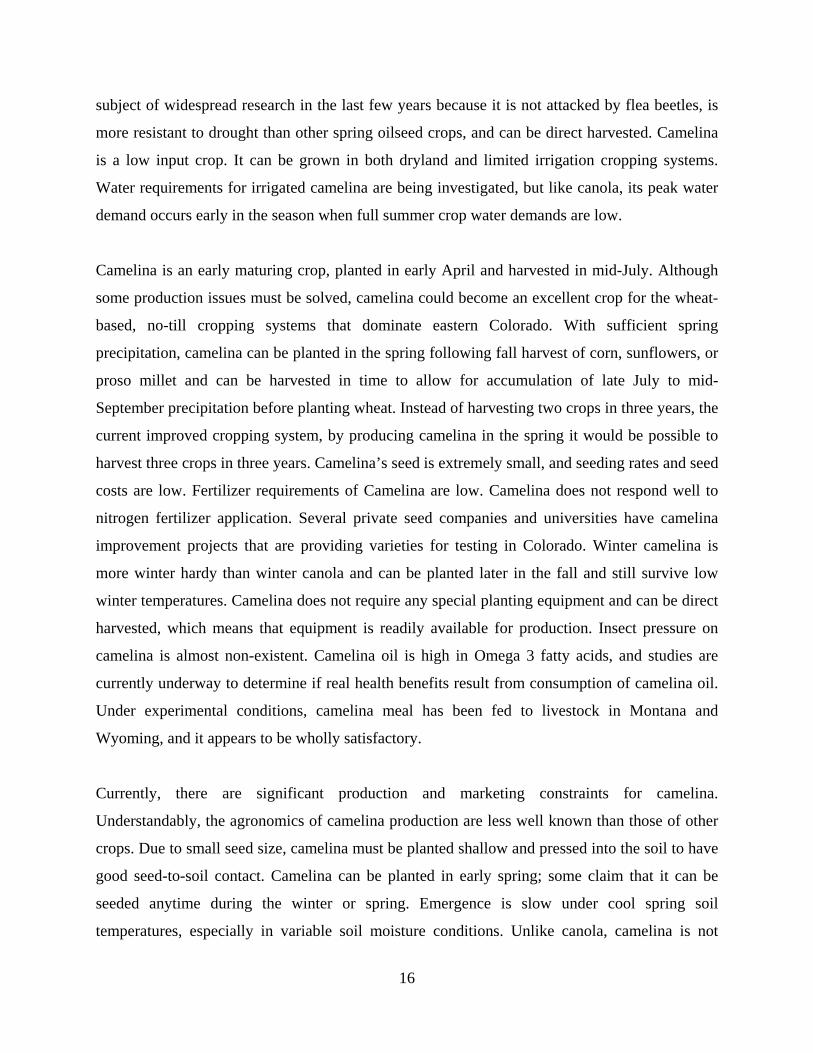
Table 6: 2007 and 2008 Canola Variety Trial Performance Summary
Location Source Year Water regime Average Max MinLbs/ac Lbs/ac Lbs/ac % gal/ac
Akron Commercial 2007 Limited Irrigation 1891 2397 1458 40 101Commercial 2007 Full Irrigation 1837 2424 1205 40 98Cargill 2007 Limited Irrigation 1645 2900 831 40 88Cargill 2007 Dryland 401 807 343 40 21Blue Sun 2007 Limited Irrigation 1259 1777 1406 40 67
Fort Collins Commercial 2007 Limited Irrigation 259 761 79 40 14Fruita National trial 2006-2007 Irrigated 2339 3621 872 40 125Yello Jacket National trial 2006-2007 Irrigated 651 1236 428 40 35Rocky Ford Commercial 2006-2007 irrigated 1750 3171 752 40 93Rocky Ford National trial 2007-2008 Irrigated 1816 2703 815 40 97Fruita National trial 2007-2008 Irrigated 2760 3724 2124 40 147Walsh National trial 2007-2008 dryland 602 1175 102 40 32Akron winter canola Blue Sun 2007-2008 Limited Irrigation 1172 1784 731 40 63Akron winter canola National trial 2007-2008 Limited Irrigation 1370 2236 828 40 73
YieldOil
Camelina
Camelina is an oilseed crop native to southeast Europe and southwest Asia. The plant has been
known for about 4,000 years as a cultivated crop, but there has been relatively little research
conducted on it worldwide. Camelina is a promising new oilseed crop that has become the
16
subject of widespread research in the last few years because it is not attacked by flea beetles, is
more resistant to drought than other spring oilseed crops, and can be direct harvested. Camelina
is a low input crop. It can be grown in both dryland and limited irrigation cropping systems.
Water requirements for irrigated camelina are being investigated, but like canola, its peak water
demand occurs early in the season when full summer crop water demands are low.
Camelina is an early maturing crop, planted in early April and harvested in mid-July. Although
some production issues must be solved, camelina could become an excellent crop for the wheat-
based, no-till cropping systems that dominate eastern Colorado. With sufficient spring
precipitation, camelina can be planted in the spring following fall harvest of corn, sunflowers, or
proso millet and can be harvested in time to allow for accumulation of late July to mid-
September precipitation before planting wheat. Instead of harvesting two crops in three years, the
current improved cropping system, by producing camelina in the spring it would be possible to
harvest three crops in three years. Camelina’s seed is extremely small, and seeding rates and seed
costs are low. Fertilizer requirements of Camelina are low. Camelina does not respond well to
nitrogen fertilizer application. Several private seed companies and universities have camelina
improvement projects that are providing varieties for testing in Colorado. Winter camelina is
more winter hardy than winter canola and can be planted later in the fall and still survive low
winter temperatures. Camelina does not require any special planting equipment and can be direct
harvested, which means that equipment is readily available for production. Insect pressure on
camelina is almost non-existent. Camelina oil is high in Omega 3 fatty acids, and studies are
currently underway to determine if real health benefits result from consumption of camelina oil.
Under experimental conditions, camelina meal has been fed to livestock in Montana and
Wyoming, and it appears to be wholly satisfactory.
Currently, there are significant production and marketing constraints for camelina.
Understandably, the agronomics of camelina production are less well known than those of other
crops. Due to small seed size, camelina must be planted shallow and pressed into the soil to have
good seed-to-soil contact. Camelina can be planted in early spring; some claim that it can be
seeded anytime during the winter or spring. Emergence is slow under cool spring soil
temperatures, especially in variable soil moisture conditions. Unlike canola, camelina is not
17
attacked by flea beetles. Camelina’s stand establishment and weed control are being investigated
in the Great Plains and the Pacific Northwest. There is currently very little acreage of camelina
being planted in Colorado, and there is no grower ‘check-off’ program to support research and
production. Federal and state agencies are providing research funds that have helped address
some basic water and fertilizer requirement issues and conduct variety trials. For several years,
camelina producers were able to sell seed to Blue Sun Biodiesel, but seed prices were low and
hauling to crushing facilities was an additional cost. Marketing needs to be fully investigated by
producers before planting. Camelina is a small-seeded crop that may require adjustments to
equipment to prevent loss during harvest and hauling. Camelina’s meal is currently not legal for
sale as livestock feed, although high omega 3 content in the oil and meal indicates that it might
be more beneficial than other oilseed for human and livestock health.
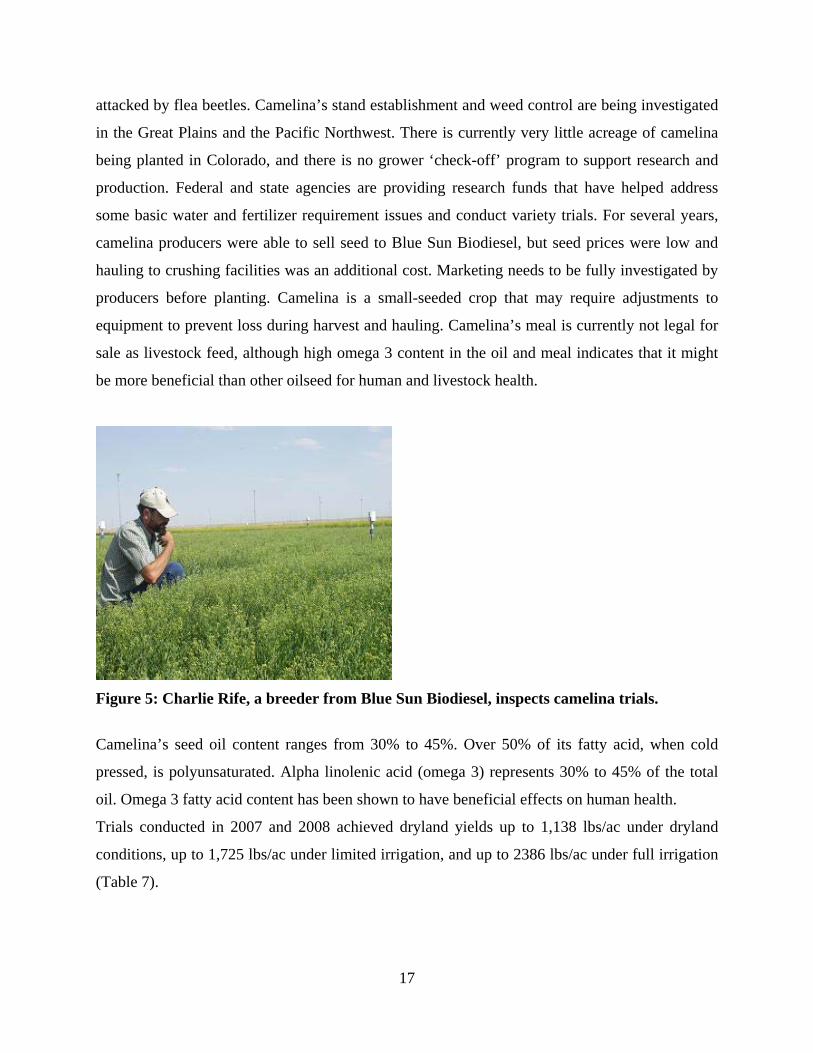
Figure 5: Charlie Rife, a breeder from Blue Sun Biodiesel, inspects camelina trials.
Camelina’s seed oil content ranges from 30% to 45%. Over 50% of its fatty acid, when cold
pressed, is polyunsaturated. Alpha linolenic acid (omega 3) represents 30% to 45% of the total
oil. Omega 3 fatty acid content has been shown to have beneficial effects on human health.
Trials conducted in 2007 and 2008 achieved dryland yields up to 1,138 lbs/ac under dryland
conditions, up to 1,725 lbs/ac under limited irrigation, and up to 2386 lbs/ac under full irrigation
(Table 7).
18
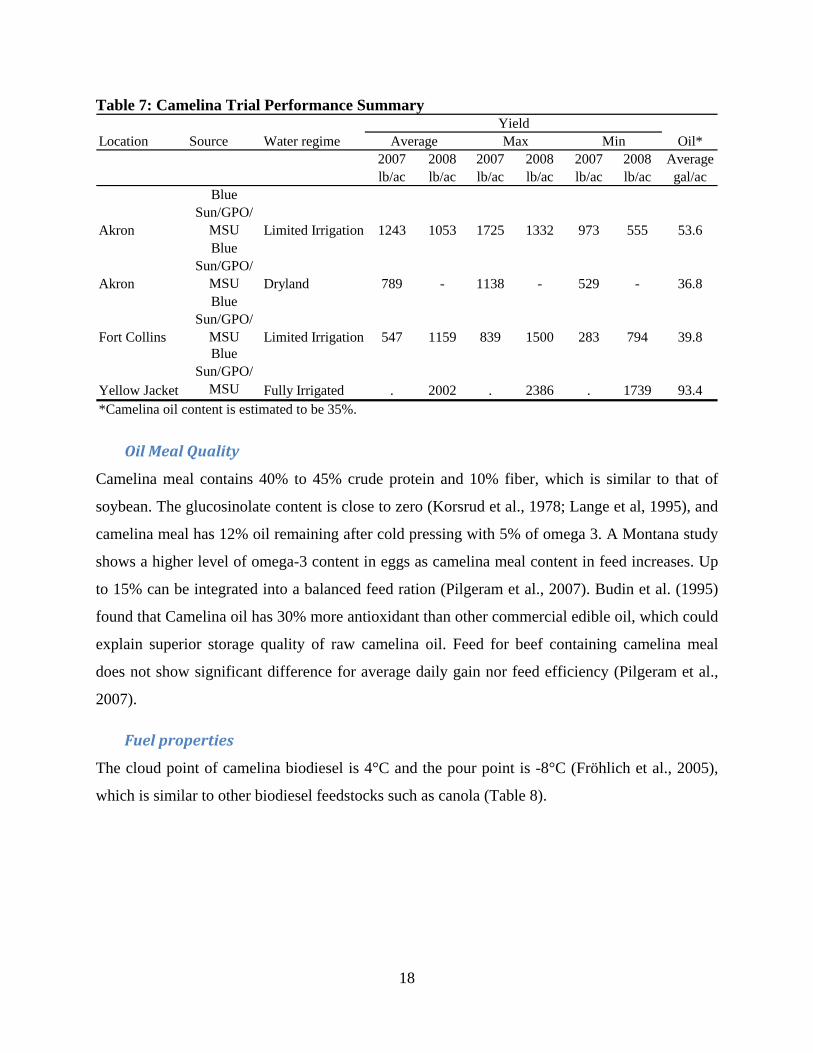
Table 7: Camelina Trial Performance Summary
Location Source Water regime Oil*2007 2008 2007 2008 2007 2008 Averagelb/ac lb/ac lb/ac lb/ac lb/ac lb/ac gal/ac
Akron
Blue Sun/GPO/
MSU Limited Irrigation 1243 1053 1725 1332 973 555 53.6
Akron
Blue Sun/GPO/
MSU Dryland 789 - 1138 - 529 - 36.8
Fort Collins
Blue Sun/GPO/
MSU Limited Irrigation 547 1159 839 1500 283 794 39.8
Yellow Jacket
Blue Sun/GPO/
MSU Fully Irrigated . 2002 . 2386 . 1739 93.4*Camelina oil content is estimated to be 35%.
Average Max MinYield
Oil Meal Quality
Camelina meal contains 40% to 45% crude protein and 10% fiber, which is similar to that of
soybean. The glucosinolate content is close to zero (Korsrud et al., 1978; Lange et al, 1995), and
camelina meal has 12% oil remaining after cold pressing with 5% of omega 3. A Montana study
shows a higher level of omega-3 content in eggs as camelina meal content in feed increases. Up
to 15% can be integrated into a balanced feed ration (Pilgeram et al., 2007). Budin et al. (1995)
found that Camelina oil has 30% more antioxidant than other commercial edible oil, which could
explain superior storage quality of raw camelina oil. Feed for beef containing camelina meal
does not show significant difference for average daily gain nor feed efficiency (Pilgeram et al.,
2007).
Fuel properties
The cloud point of camelina biodiesel is 4°C and the pour point is -8°C (Fröhlich et al., 2005),
which is similar to other biodiesel feedstocks such as canola (Table 8).
19
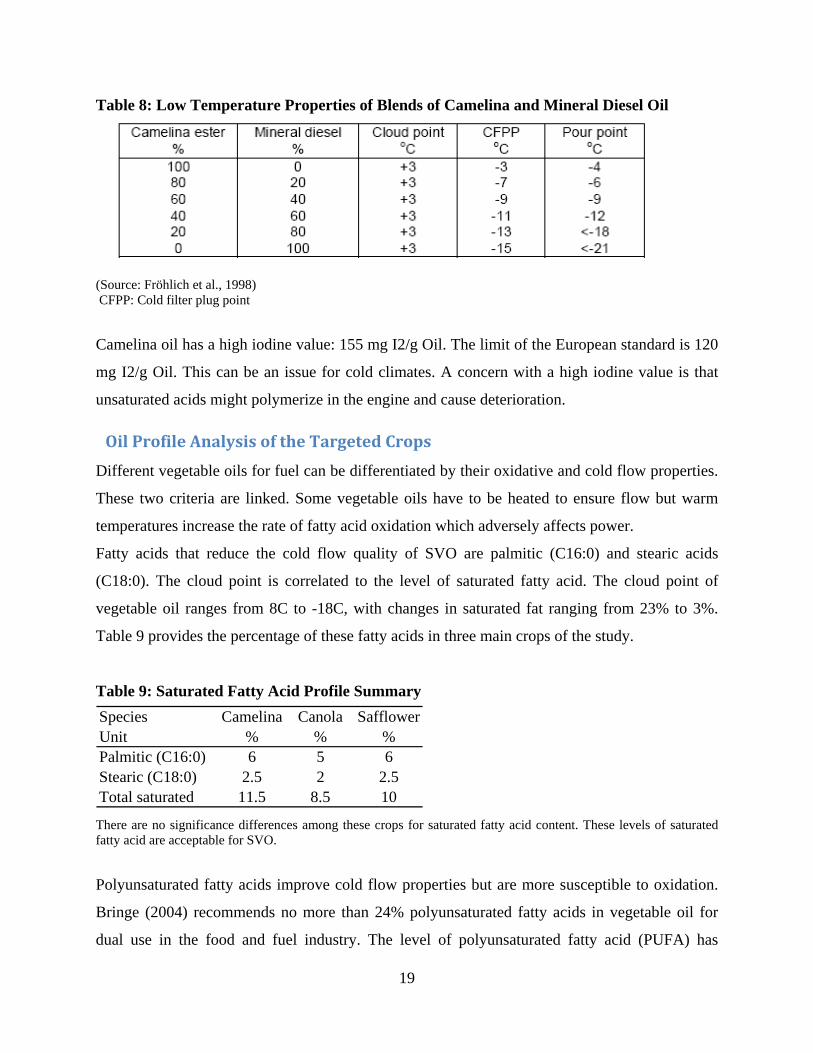
Table 8: Low Temperature Properties of Blends of Camelina and Mineral Diesel Oil
(Source: Fröhlich et al., 1998) CFPP: Cold filter plug point
Camelina oil has a high iodine value: 155 mg I2/g Oil. The limit of the European standard is 120
mg I2/g Oil. This can be an issue for cold climates. A concern with a high iodine value is that
unsaturated acids might polymerize in the engine and cause deterioration.
Oil Profile Analysis of the Targeted Crops
Different vegetable oils for fuel can be differentiated by their oxidative and cold flow properties.
These two criteria are linked. Some vegetable oils have to be heated to ensure flow but warm
temperatures increase the rate of fatty acid oxidation which adversely affects power.
Fatty acids that reduce the cold flow quality of SVO are palmitic (C16:0) and stearic acids
(C18:0). The cloud point is correlated to the level of saturated fatty acid. The cloud point of
vegetable oil ranges from 8C to -18C, with changes in saturated fat ranging from 23% to 3%.
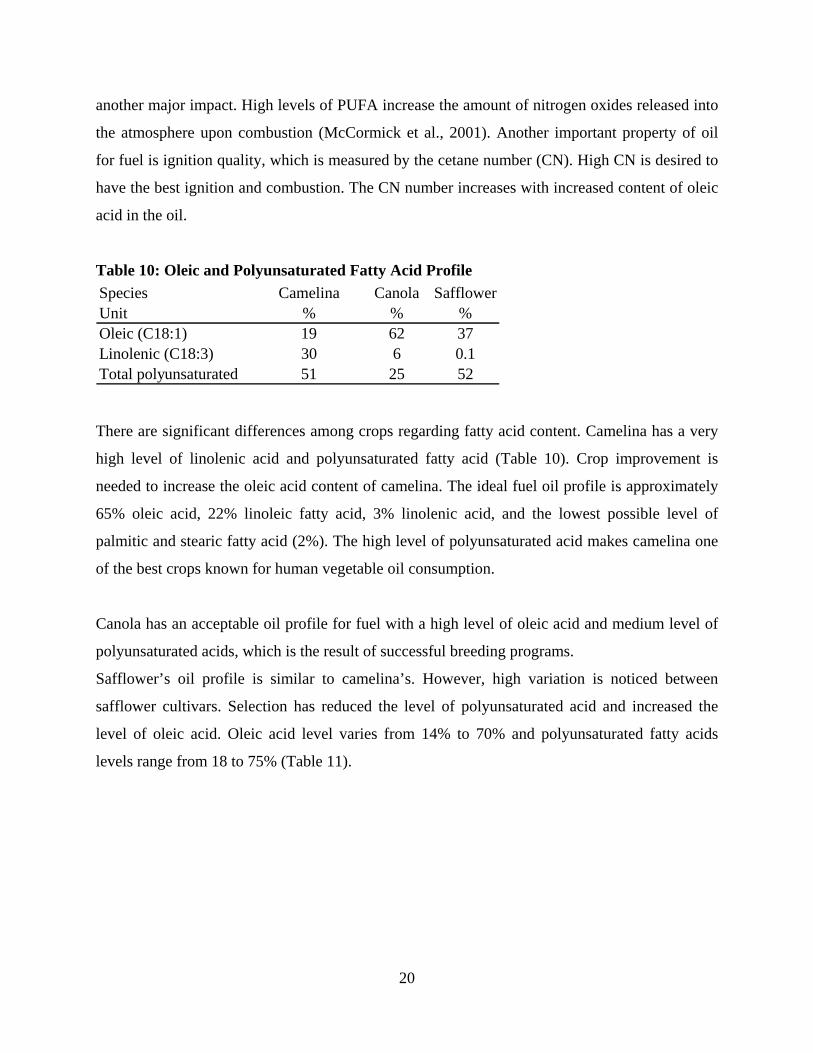
Table 9 provides the percentage of these fatty acids in three main crops of the study.
Table 9: Saturated Fatty Acid Profile Summary Species Camelina Canola SafflowerUnit % % %Palmitic (C16:0) 6 5 6Stearic (C18:0) 2.5 2 2.5Total saturated 11.5 8.5 10
There are no significance differences among these crops for saturated fatty acid content. These levels of saturated fatty acid are acceptable for SVO.
Polyunsaturated fatty acids improve cold flow properties but are more susceptible to oxidation.
Bringe (2004) recommends no more than 24% polyunsaturated fatty acids in vegetable oil for
dual use in the food and fuel industry. The level of polyunsaturated fatty acid (PUFA) has
20
another major impact. High levels of PUFA increase the amount of nitrogen oxides released into
the atmosphere upon combustion (McCormick et al., 2001). Another important property of oil
for fuel is ignition quality, which is measured by the cetane number (CN). High CN is desired to
have the best ignition and combustion. The CN number increases with increased content of oleic
acid in the oil.
Table 10: Oleic and Polyunsaturated Fatty Acid Profile Species Camelina Canola SafflowerUnit % % %Oleic (C18:1) 19 62 37Linolenic (C18:3) 30 6 0.1Total polyunsaturated 51 25 52
There are significant differences among crops regarding fatty acid content. Camelina has a very
high level of linolenic acid and polyunsaturated fatty acid (Table 10). Crop improvement is
needed to increase the oleic acid content of camelina. The ideal fuel oil profile is approximately
65% oleic acid, 22% linoleic fatty acid, 3% linolenic acid, and the lowest possible level of
palmitic and stearic fatty acid (2%). The high level of polyunsaturated acid makes camelina one
of the best crops known for human vegetable oil consumption.
Canola has an acceptable oil profile for fuel with a high level of oleic acid and medium level of
polyunsaturated acids, which is the result of successful breeding programs.
Safflower’s oil profile is similar to camelina’s. However, high variation is noticed between
safflower cultivars. Selection has reduced the level of polyunsaturated acid and increased the
level of oleic acid. Oleic acid level varies from 14% to 70% and polyunsaturated fatty acids
levels range from 18 to 75% (Table 11).
21
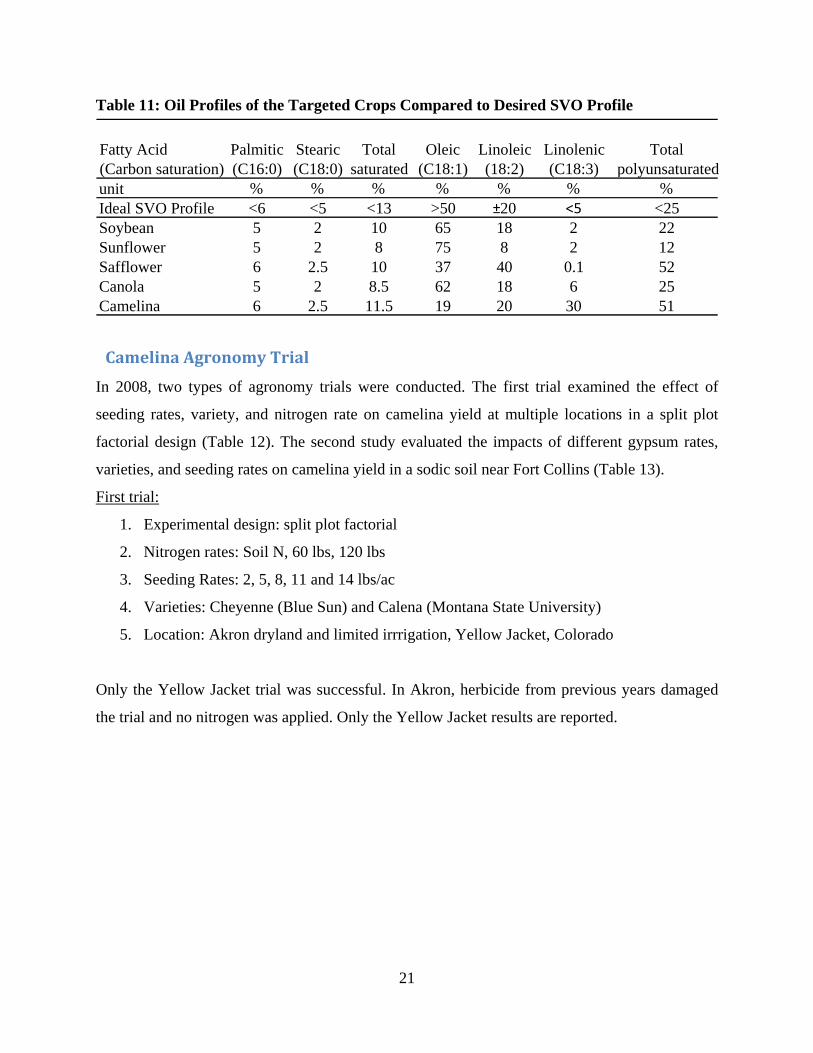
Table 11: Oil Profiles of the Targeted Crops Compared to Desired SVO Profile
Camelina Agronomy Trial
In 2008, two types of agronomy trials were conducted. The first trial examined the effect of
seeding rates, variety, and nitrogen rate on camelina yield at multiple locations in a split plot
factorial design (Table 12). The second study evaluated the impacts of different gypsum rates,
varieties, and seeding rates on camelina yield in a sodic soil near Fort Collins (Table 13).
First trial:
1. Experimental design: split plot factorial
2. Nitrogen rates: Soil N, 60 lbs, 120 lbs
3. Seeding Rates: 2, 5, 8, 11 and 14 lbs/ac
4. Varieties: Cheyenne (Blue Sun) and Calena (Montana State University)
5. Location: Akron dryland and limited irrrigation, Yellow Jacket, Colorado
Only the Yellow Jacket trial was successful. In Akron, herbicide from previous years damaged
the trial and no nitrogen was applied. Only the Yellow Jacket results are reported.
Fatty Acid (Carbon saturation)
Palmitic (C16:0)
Stearic(C18:0)
Totalsaturated
Oleic (C18:1)
Linoleic (18:2)
Linolenic (C18:3)
Total polyunsaturated
unit % % % % % % %Ideal SVO Profile <6 <5 <13 >50 ±20 <5 <25Soybean 5 2 10 65 18 2 22Sunflower 5 2 8 75 8 2 12Safflower 6 2.5 10 37 40 0.1 52Canola 5 2 8.5 62 18 6 25Camelina 6 2.5 11.5 19 20 30 51
22
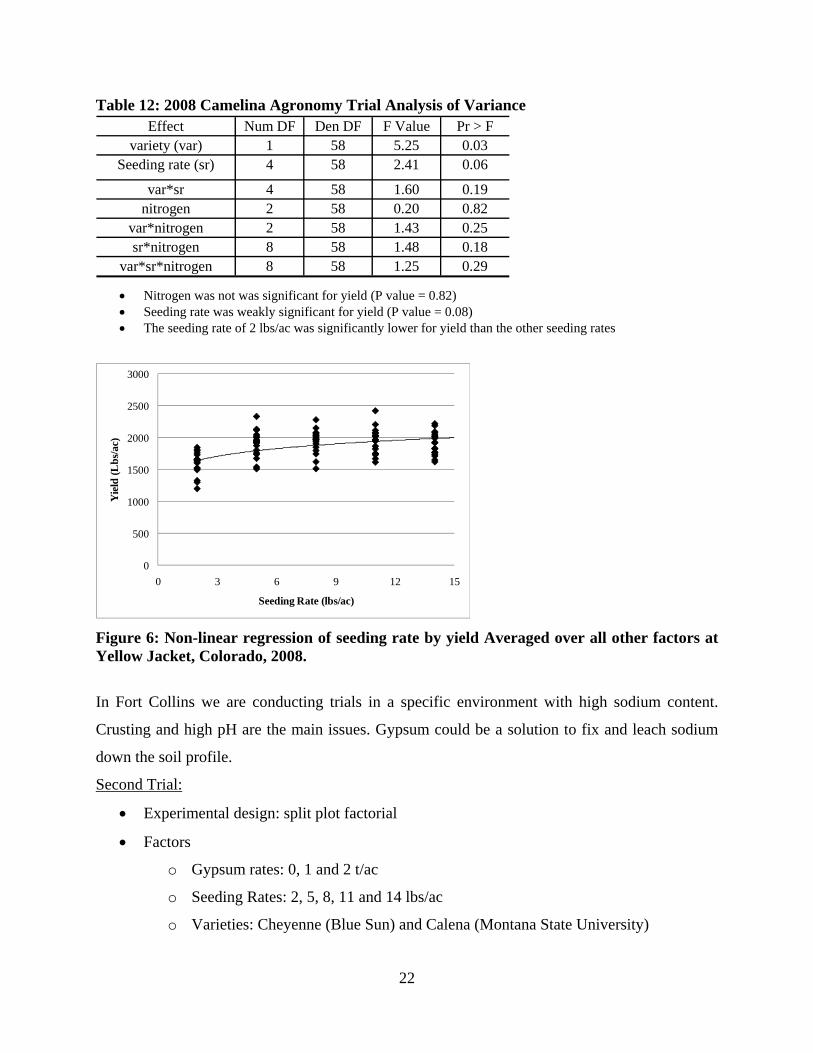
Table 12: 2008 Camelina Agronomy Trial Analysis of Variance Effect Num DF Den DF F Value Pr > F
variety (var) 1 58 5.25 0.03Seeding rate (sr) 4 58 2.41 0.06
var*sr 4 58 1.60 0.19nitrogen 2 58 0.20 0.82
var*nitrogen 2 58 1.43 0.25sr*nitrogen 8 58 1.48 0.18
var*sr*nitrogen 8 58 1.25 0.29 • Nitrogen was not was significant for yield (P value = 0.82) • Seeding rate was weakly significant for yield (P value = 0.08) • The seeding rate of 2 lbs/ac was significantly lower for yield than the other seeding rates
0
500
1000
1500
2000
2500
3000
0 3 6 9 12 15
Yie
ld (L
bs/a
c)
Seeding Rate (lbs/ac)
Figure 6: Non-linear regression of seeding rate by yield Averaged over all other factors at Yellow Jacket, Colorado, 2008.
In Fort Collins we are conducting trials in a specific environment with high sodium content.
Crusting and high pH are the main issues. Gypsum could be a solution to fix and leach sodium
down the soil profile.
Second Trial:
• Experimental design: split plot factorial
• Factors
o Gypsum rates: 0, 1 and 2 t/ac
o Seeding Rates: 2, 5, 8, 11 and 14 lbs/ac
o Varieties: Cheyenne (Blue Sun) and Calena (Montana State University)
23
o Location: Fort Collins, limited irrrigation (total water: 11 inches) under one sodic
soil: Medium high SAR: 7.5.
• No significant interaction between variety, seeding rate, and gypsum occurred.
• A positive yield response occurred with increasing gypsum rate with camelina. Plant
height shows an increase with gypsum rate.
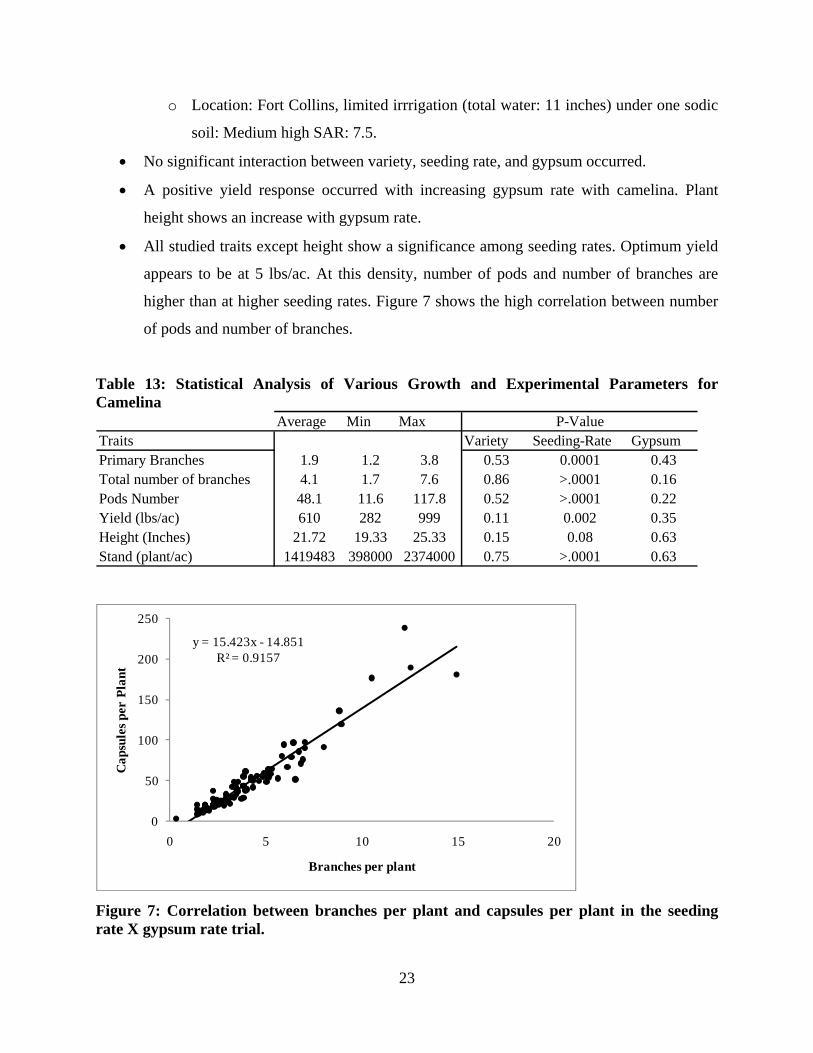
• All studied traits except height show a significance among seeding rates. Optimum yield
appears to be at 5 lbs/ac. At this density, number of pods and number of branches are
higher than at higher seeding rates. Figure 7 shows the high correlation between number
of pods and number of branches.
Table 13: Statistical Analysis of Various Growth and Experimental Parameters for Camelina
Average Min MaxTraits Variety Seeding-Rate GypsumPrimary Branches 1.9 1.2 3.8 0.53 0.0001 0.43Total number of branches 4.1 1.7 7.6 0.86 >.0001 0.16Pods Number 48.1 11.6 117.8 0.52 >.0001 0.22Yield (lbs/ac) 610 282 999 0.11 0.002 0.35Height (Inches) 21.72 19.33 25.33 0.15 0.08 0.63Stand (plant/ac) 1419483 398000 2374000 0.75 >.0001 0.63
P-Value
y = 15.423x - 14.851R² = 0.9157
0
50
100
150
200
250
0 5 10 15 20
Cap
sule
s per
Pla
nt
Branches per plant
Figure 7: Correlation between branches per plant and capsules per plant in the seeding rate X gypsum rate trial.

24
Screening New Alternative Crops
The genetic study of camelina’s drought resistance is based on a unique set of over 100
accessions from the European collection. Europe is the center of origin for camelina. The
approach is simple, and water use efficiency is the main research objective. The collection is
planted in the greenhouse and in the field under fully irrigated and dry conditions, and all growth
and reproduction characteristics are measured. The first objective, which has already been met, is
to determine if there is sufficient variation in drought response to justify further investigation, or
if additional genetic material needs to be included in the set of accessions. After the first round of
greenhouse/field observations, John McKay and Nicolas Enjalbert have identified accessions that
show repeatable variation in response to drought both in the greenhouse and in the field.
Correlations with growth and reproduction observations have given them some insight into
which characteristics might be responsible for differential response to drought. This research
should lead to identification of measurable traits that indicate improved water use efficiency,
which can be used by breeders to identify drought resistant lines within their breeding
populations. This research presents the base for future investigators to identify regions in the
camelina genome responsible for the traits
that confer drought resistance, and to
provide oilseed physiologists the
information necessary to better understand
the mechanisms of drought resistance.
Camelina sativa
The Camelina sativa accessions in the
tested collection have 16 countries of
origin (Table 14).
Country of origin # accessionsCzech Republic/Slovakia 1Former Soviet Union 14Belgium 2Bulgaria 6Germany 38Italy 1Kyrgyzstan 1Poland 5Romania 1Russia 1Spain 1Sweden 1Switzerland 1Ukraine 1unknown 26Former Yugoslavia 1Total 101
Table 14: Country of Origin of Camelina Accessions
25
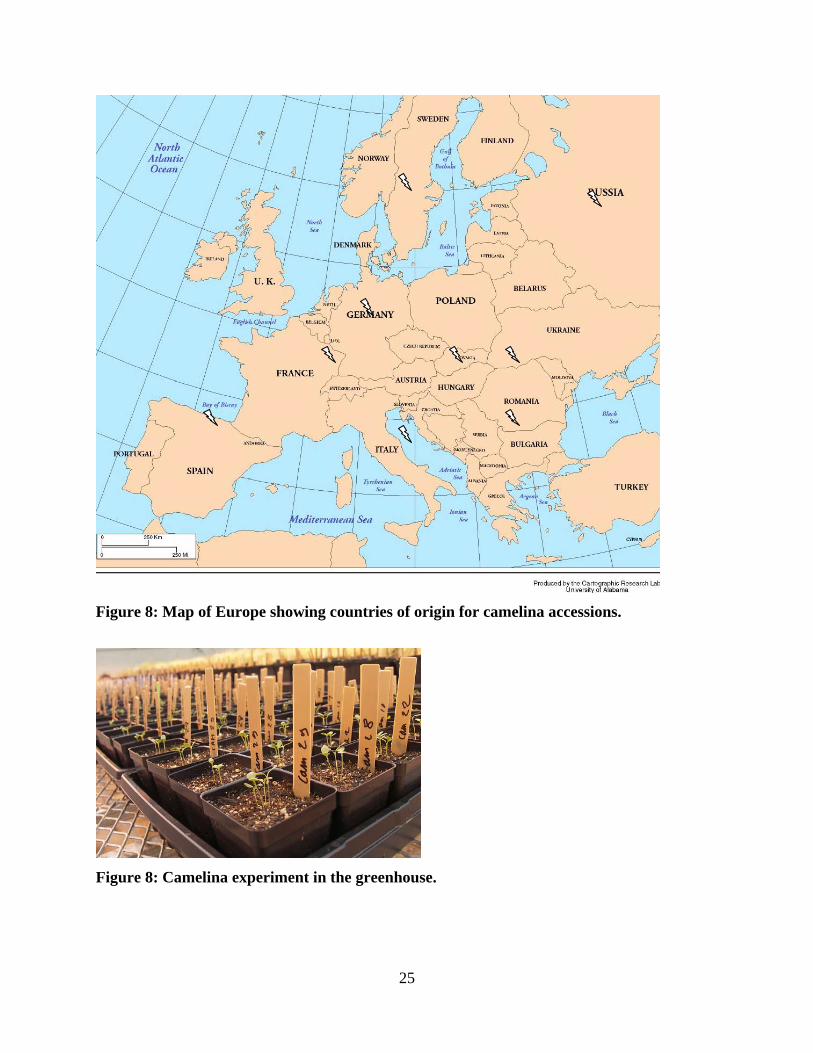
Figure 8: Map of Europe showing countries of origin for camelina accessions.
Figure 8: Camelina experiment in the greenhouse.
26
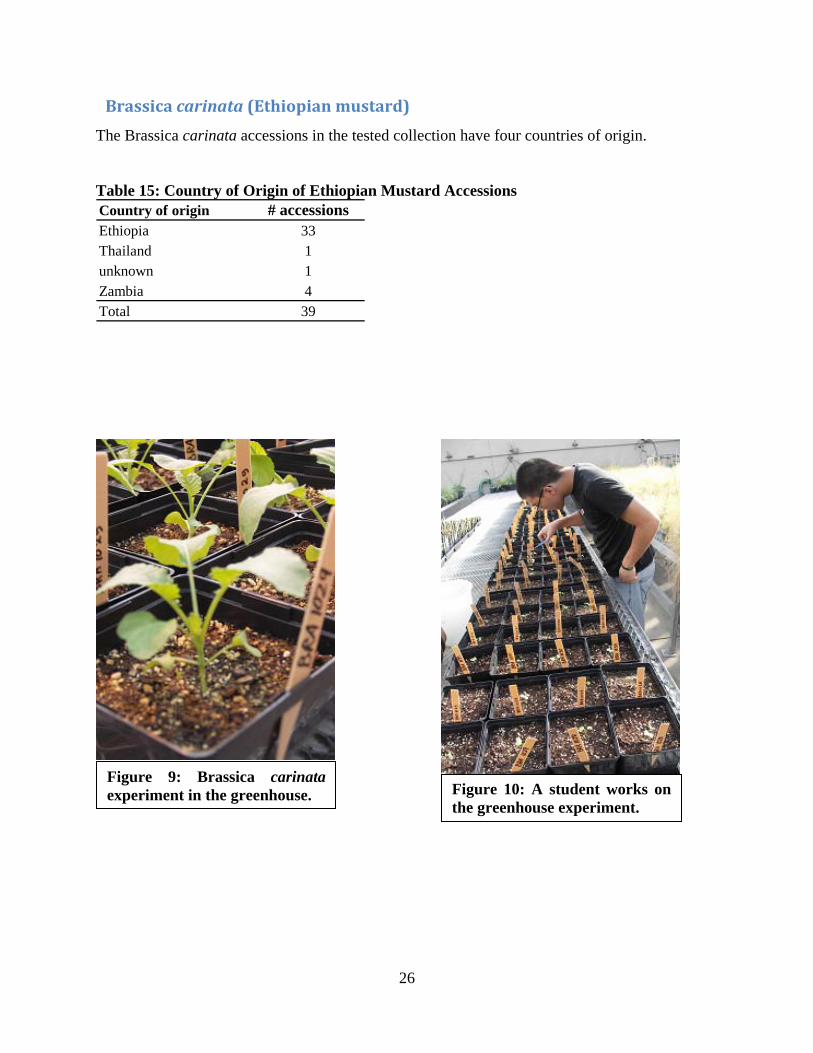
Brassica carinata (Ethiopian mustard)
The Brassica carinata accessions in the tested collection have four countries of origin.
Table 15: Country of Origin of Ethiopian Mustard Accessions Country of origin # accessionsEthiopia 33Thailand 1unknown 1Zambia 4Total 39
Figure 9: Brassica carinata experiment in the greenhouse. Figure 10: A student works on
the greenhouse experiment.
27
The Approach
Greenhouse Study
Two moisture treatments were applied: drought (60% of field capacity) and fully irrigated.
There were four replicates for each treatment.
Phenotypic measurement included height, number of pods, and seed weight.
Field Study
85 accessions of Camelina sativa were grown.
39 accessions of Brassica carinata were grown.
100 accessions of Brassica juncea were grown.
Two treatments: dryland and irrigated (flood irrigated three times).
Two replicates for each treatment.
Previous crop was alfalfa.
Planted by hand in one-meter rows.
Phenotypic measurements included height, date of flowering, number of pod, pods density, pod
size, seed weight, number of seed per pods, number of branches, and biomass per plant.
Results and Analysis
Several field conditions affected plant emergence and growth. The seed bed was rough, and there
was high clay content in the seed bed soil. Plant growth was suppressed and plant population was
reduced by flooding caused by the tornado that struck the research station in June 2008.
Camelina sativa
There were significant differences among accessions for height and pod number in the
greenhouse, as well as significant differences among accessions for seed weight in the field
(Table 16).

28
Table 16: Summary of Camelina Performance in the Greenhouse and in the Field
Height Pods Height Seed wt plt Biomassp-value p-value p-value p-value p-value
Accessions 0.0002 0.0013 0.0905 0.0018 0.1014Treatment <.0001 <.0001 <.0001 <.0001 <.0001 Interaction 0.99 0.27 0.16 0.0044 0.252CV 16 41 47 79 53
Greenhouse Field
0
0.1
0.2
0.3
0.4
0.5
Dry Wet
Seed
yield (gram
s)
Figure 11: The interaction of accessions under wet and dry conditions for seed weight in the greenhouse.
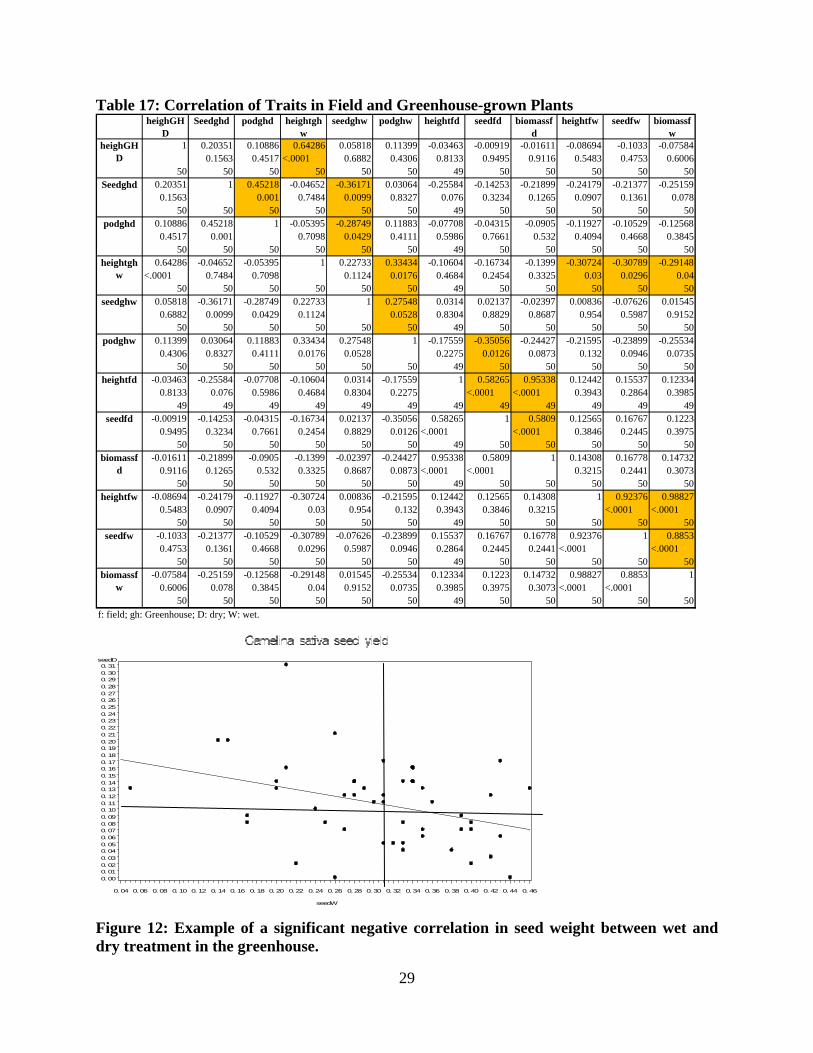
All traits measured in the greenhouse were also measured in the field. Table 17 is the complete
correlation table for these traits. Figure 13 is an example of one correlation showing that seed
weight in the greenhouse is negatively correlated under dry conditions to seed weight from all
accessions under well watered conditions (r = -0.36; P = 0.0099). This suggests that some
accessions are better adapted to dry environments. These accessions are potential sources of
genes for drought tolerance.
29
Table 17: Correlation of Traits in Field and Greenhouse-grown Plants heighGH
DSeedghd podghd heightgh
wseedghw podghw heightfd seedfd biomassf
dheightfw seedfw biomassf
w1 0.20351 0.10886 0.64286 0.05818 0.11399 -0.03463 -0.00919 -0.01611 -0.08694 -0.1033 -0.07584
0.1563 0.4517 <.0001 0.6882 0.4306 0.8133 0.9495 0.9116 0.5483 0.4753 0.600650 50 50 50 50 50 49 50 50 50 50 50
0.20351 1 0.45218 -0.04652 -0.36171 0.03064 -0.25584 -0.14253 -0.21899 -0.24179 -0.21377 -0.251590.1563 0.001 0.7484 0.0099 0.8327 0.076 0.3234 0.1265 0.0907 0.1361 0.078
50 50 50 50 50 50 49 50 50 50 50 500.10886 0.45218 1 -0.05395 -0.28749 0.11883 -0.07708 -0.04315 -0.0905 -0.11927 -0.10529 -0.12568
0.4517 0.001 0.7098 0.0429 0.4111 0.5986 0.7661 0.532 0.4094 0.4668 0.384550 50 50 50 50 50 49 50 50 50 50 50
0.64286 -0.04652 -0.05395 1 0.22733 0.33434 -0.10604 -0.16734 -0.1399 -0.30724 -0.30789 -0.29148<.0001 0.7484 0.7098 0.1124 0.0176 0.4684 0.2454 0.3325 0.03 0.0296 0.04
50 50 50 50 50 50 49 50 50 50 50 500.05818 -0.36171 -0.28749 0.22733 1 0.27548 0.0314 0.02137 -0.02397 0.00836 -0.07626 0.01545
0.6882 0.0099 0.0429 0.1124 0.0528 0.8304 0.8829 0.8687 0.954 0.5987 0.915250 50 50 50 50 50 49 50 50 50 50 50
0.11399 0.03064 0.11883 0.33434 0.27548 1 -0.17559 -0.35056 -0.24427 -0.21595 -0.23899 -0.255340.4306 0.8327 0.4111 0.0176 0.0528 0.2275 0.0126 0.0873 0.132 0.0946 0.0735
50 50 50 50 50 50 49 50 50 50 50 50-0.03463 -0.25584 -0.07708 -0.10604 0.0314 -0.17559 1 0.58265 0.95338 0.12442 0.15537 0.12334
0.8133 0.076 0.5986 0.4684 0.8304 0.2275 <.0001 <.0001 0.3943 0.2864 0.398549 49 49 49 49 49 49 49 49 49 49 49
-0.00919 -0.14253 -0.04315 -0.16734 0.02137 -0.35056 0.58265 1 0.5809 0.12565 0.16767 0.12230.9495 0.3234 0.7661 0.2454 0.8829 0.0126 <.0001 <.0001 0.3846 0.2445 0.3975
50 50 50 50 50 50 49 50 50 50 50 50-0.01611 -0.21899 -0.0905 -0.1399 -0.02397 -0.24427 0.95338 0.5809 1 0.14308 0.16778 0.14732
0.9116 0.1265 0.532 0.3325 0.8687 0.0873 <.0001 <.0001 0.3215 0.2441 0.307350 50 50 50 50 50 49 50 50 50 50 50
-0.08694 -0.24179 -0.11927 -0.30724 0.00836 -0.21595 0.12442 0.12565 0.14308 1 0.92376 0.988270.5483 0.0907 0.4094 0.03 0.954 0.132 0.3943 0.3846 0.3215 <.0001 <.0001
50 50 50 50 50 50 49 50 50 50 50 50-0.1033 -0.21377 -0.10529 -0.30789 -0.07626 -0.23899 0.15537 0.16767 0.16778 0.92376 1 0.88530.4753 0.1361 0.4668 0.0296 0.5987 0.0946 0.2864 0.2445 0.2441 <.0001 <.0001
50 50 50 50 50 50 49 50 50 50 50 50-0.07584 -0.25159 -0.12568 -0.29148 0.01545 -0.25534 0.12334 0.1223 0.14732 0.98827 0.8853 1
0.6006 0.078 0.3845 0.04 0.9152 0.0735 0.3985 0.3975 0.3073 <.0001 <.000150 50 50 50 50 50 49 50 50 50 50 50
f: field; gh: Greenhouse; D: dry; W: wet.
seedfd
biomassfd
heightfw
seedfw
biomassfw
heighGHD
Seedghd
podghd
heightghw
seedghw
podghw
heightfd
seedD
0. 000. 010. 020. 030. 040. 050. 060. 070. 080. 090. 100. 110. 120. 130. 140. 150. 160. 170. 180. 190. 200. 210. 220. 230. 240. 250. 260. 270. 280. 290. 300. 31
seedW
0. 04 0. 06 0. 08 0. 10 0. 12 0. 14 0. 16 0. 18 0. 20 0. 22 0. 24 0. 26 0. 28 0. 30 0. 32 0. 34 0. 36 0. 38 0. 40 0. 42 0. 44 0. 46
Figure 12: Example of a significant negative correlation in seed weight between wet and dry treatment in the greenhouse.
30
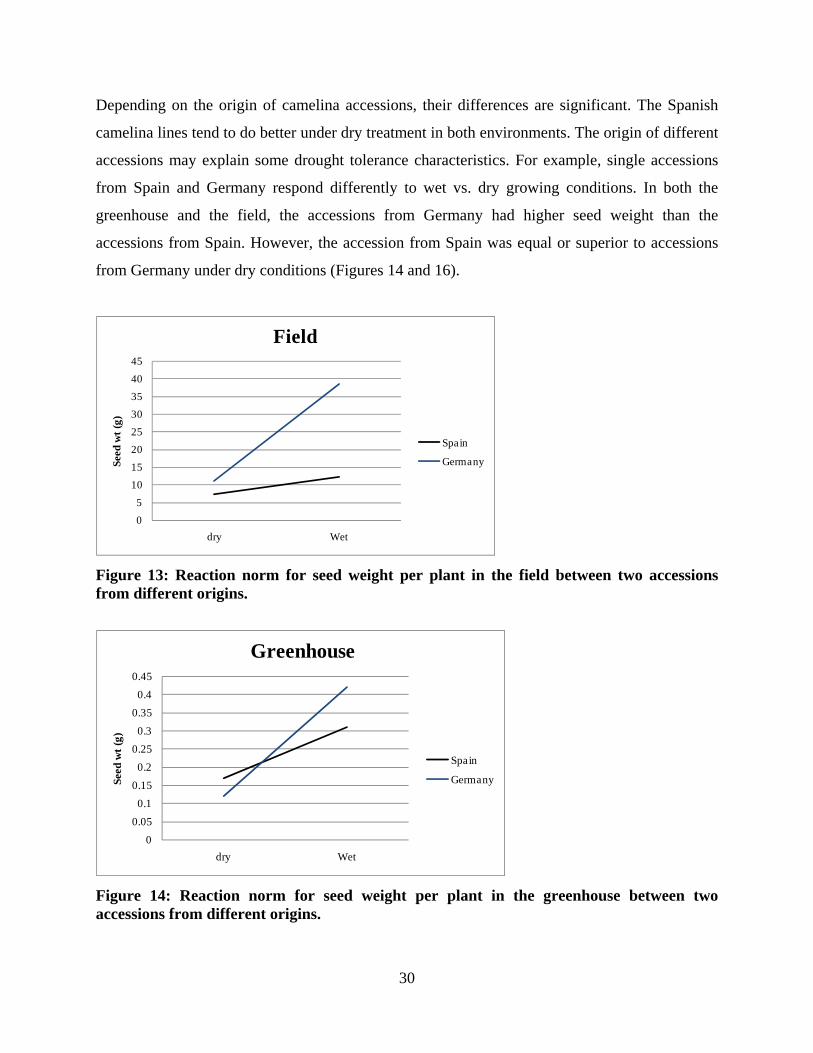
Depending on the origin of camelina accessions, their differences are significant. The Spanish
camelina lines tend to do better under dry treatment in both environments. The origin of different
accessions may explain some drought tolerance characteristics. For example, single accessions
from Spain and Germany respond differently to wet vs. dry growing conditions. In both the
greenhouse and the field, the accessions from Germany had higher seed weight than the
accessions from Spain. However, the accession from Spain was equal or superior to accessions
from Germany under dry conditions (Figures 14 and 16).
05
1015
202530
354045
dry Wet
Seed
wt (
g)
Field
Spain
Germany
Figure 13: Reaction norm for seed weight per plant in the field between two accessions from different origins.
00.05
0.10.15
0.20.250.3
0.350.4
0.45
dry Wet
Seed
wt (
g)
Greenhouse
Spain
Germany
Figure 14: Reaction norm for seed weight per plant in the greenhouse between two accessions from different origins.

31
Brassica carinata
There were significant differences among accessions for height, seed weight, pod number, and
plant biomass in the field (Table 18).
Table 18: Summary of Brasica carinata Screening Statistical Analysis Height Seed wt plt Biomass Pods p-value p-value p-value p-value
Accessions <.0001 <.0001 0.1400 <.0001Treatment <.0001 <.0001 <.0001 <.0001 Interaction 0.0036 0.09 0.47 0.25CV (%) 12 27 43 19
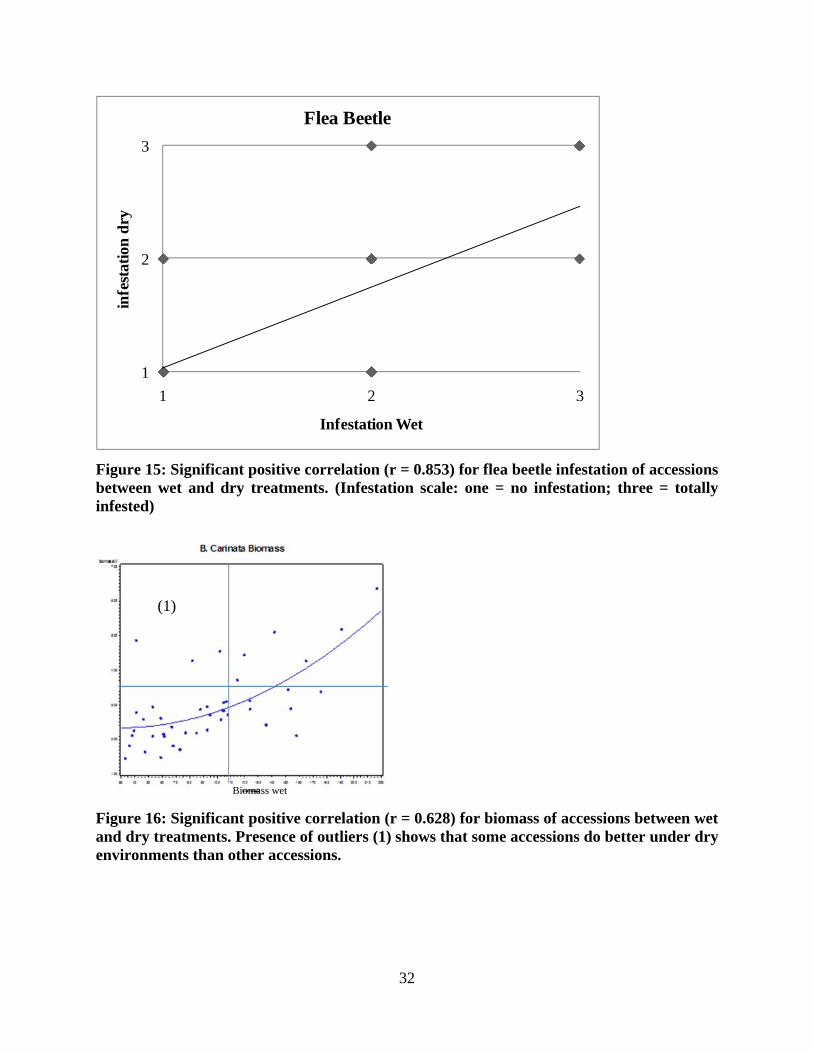
Flea beetle is one of the most damaging pests to canola. Notes were taken on all accessions. The
flea beetle pressure was very high. Some Brassica carinata accessions did not have any flea
beetles on them, and some were entirely infested. The evaluation was done on a scale from one
to three:
• One: no damage
• Two: partially infested
• Three: entirely infested
The results show a strong correlation between dry and wet treatments, suggesting that the flea
beetle tolerance is not dependent on water regime. Some accessions appear to be resistant to flea
beetles. It could be attributed to the glucosinolate content in the plant, which inhibits insect
feeding. Camelina was not affected by flea beetles.
32
1
2
3
1 2 3
infe
stat
ion
dry
Infestation Wet
Flea Beetle
Figure 15: Significant positive correlation (r = 0.853) for flea beetle infestation of accessions between wet and dry treatments. (Infestation scale: one = no infestation; three = totally infested)
Figure 16: Significant positive correlation (r = 0.628) for biomass of accessions between wet and dry treatments. Presence of outliers (1) shows that some accessions do better under dry environments than other accessions.
(1)
Biomass wet
33
Table 19: Correlation of Traits in Field-Grown Brassica carinata heightD HeightW biomasW biomasD seedW seedD podD podW
1 0.23316 0.19738 0.25294 0.16641 0.12536 0.44935 0.224720.1147 0.1937 0.0937 0.2636 0.4119 0.0015 0.1289
47 47 45 45 47 45 47 470.23316 1 0.53879 0.36023 0.33341 0.08989 0.3288 0.65001
0.1147 0.0001 0.0139 0.0206 0.5524 0.0225 <.000147 48 46 46 48 46 48 48
0.19738 0.53879 1 0.62829 0.73085 0.11262 0.08611 0.07060.1937 0.0001 <.0001 <.0001 0.4667 0.5694 0.641
45 46 46 44 46 44 46 460.25294 0.36023 0.62829 1 0.21302 0.37905 0.17958 -0.00553
0.0937 0.0139 <.0001 0.1552 0.0094 0.2324 0.970945 46 44 46 46 46 46 46
0.16641 0.33341 0.73085 0.21302 1 0.18996 0.09873 0.088070.2636 0.0206 <.0001 0.1552 0.2061 0.5044 0.5517
47 48 46 46 48 46 48 480.12536 0.08989 0.11262 0.37905 0.18996 1 0.10733 0.03764
0.4119 0.5524 0.4667 0.0094 0.2061 0.4777 0.803945 46 44 46 46 46 46 46
0.44935 0.3288 0.08611 0.17958 0.09873 0.10733 1 0.480030.0015 0.0225 0.5694 0.2324 0.5044 0.4777 0.0006
47 48 46 46 48 46 48 480.22472 0.65001 0.0706 -0.00553 0.08807 0.03764 0.48003 1
0.1289 <.0001 0.641 0.9709 0.5517 0.8039 0.000647 48 46 46 48 46 48 48
W: irrigated; D: dryland
podD
podW
heightD
HeightW
biomasW
biomasD
seedW
seedD
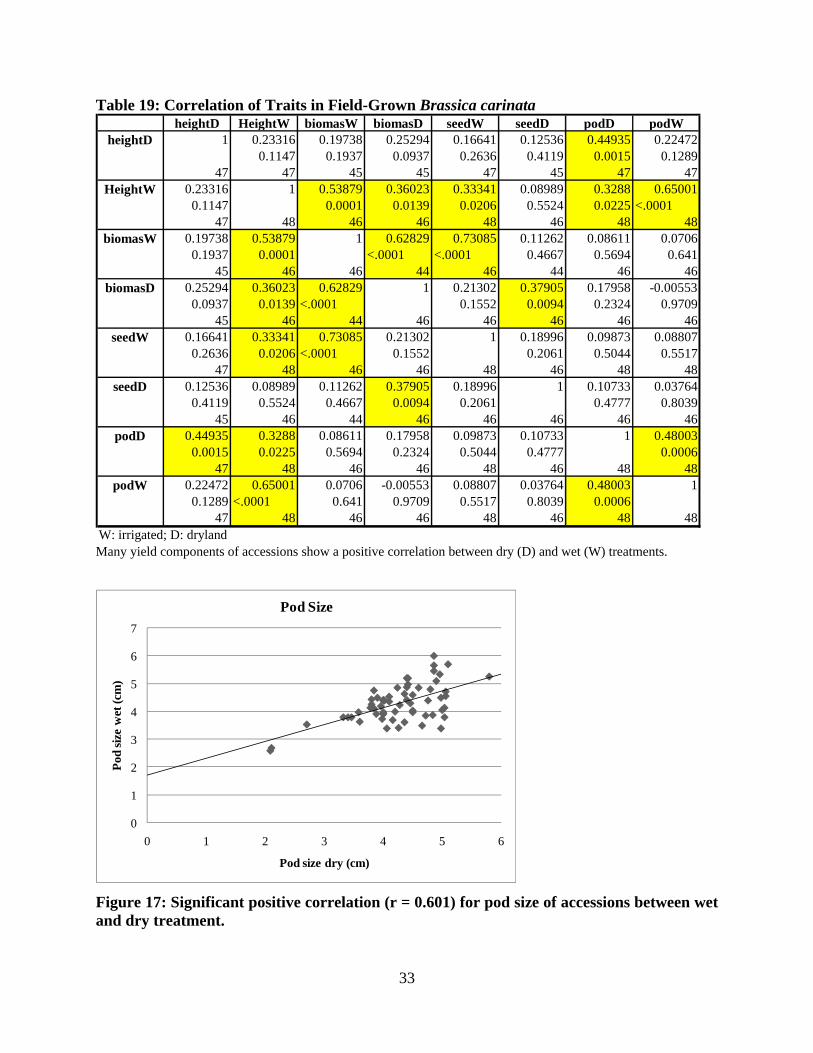
Many yield components of accessions show a positive correlation between dry (D) and wet (W) treatments.
0
1
2
3
4
5
6
7
0 1 2 3 4 5 6
Pod
size
wet
(cm
)
Pod size dry (cm)
Pod Size
Figure 17: Significant positive correlation (r = 0.601) for pod size of accessions between wet and dry treatment.
34
We have found substantial variation among Camelina sativa, Brassica carinata, and Brassica
juncea accessions in several traits of interest. These traits exhibit significant effects of genotype
and treatment, as well as interactions between them, emphasizing the importance of local
environment for the evaluation of lines for selection. Additional traits of importance will be
evaluated in these accessions (such as oil content and profile, carbon isotope ratio, seed size, and
protein content). In future years, a mapping population of camelina will be evaluated to localize
genetic regions associated with these traits.
Economic Feasibility
The following economic feasibility study is designed to address three practical economic
questions frequently asked about oilseed production for use as SVO on the farm. Oilseed crops in
the Brassicacea family, like canola and camelina, are good rotation crops because they could fit
into a wheat-based cropping system, and they can break some harmful pest cycles.
1. What is the break-even price per pound and yield that would make it
economically feasible to produce oilseed under limited irrigation conditions,
dryland and full irrigation?
2. What price per gallon of petroleum diesel vs. oilseed yield is feasible to grow
your own fuel?
3. What is the break-even price per pound and diesel that would make it
economically feasible to buy and crush oilseed for fuel without growing any crop?
Cropping systems options that include oilseed production for biofuel can be considered, but in
the interest of answering these three questions as succinctly and clearly as possible our economic
example is based on:
1. A limited irrigation system: three crops in three years and including winter wheat:
corn/spring canola /winter wheat
2. A dryland system: three crops in three years and including winter wheat: corn/spring
camelina/winter wheat
The rotation with spring canola allows the producer to harvest the oilseed in late July and plant
winter wheat in the same year. Our limited irrigation cropping system production costs differ
35
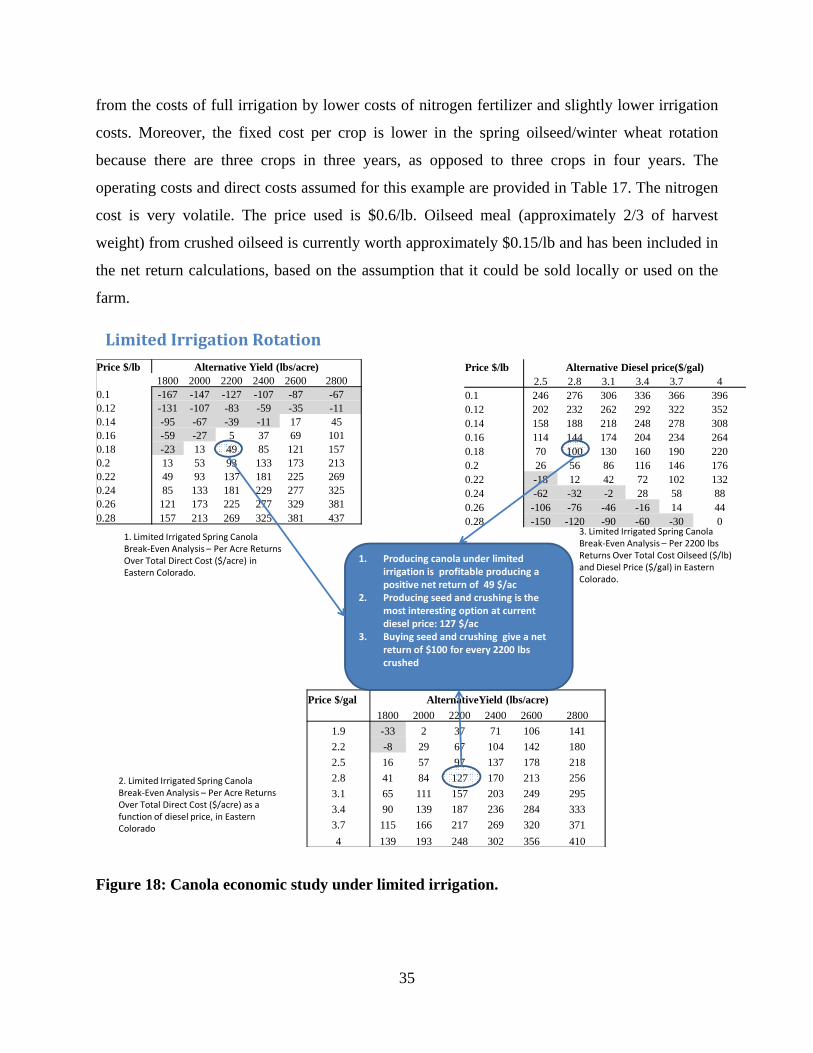
from the costs of full irrigation by lower costs of nitrogen fertilizer and slightly lower irrigation
costs. Moreover, the fixed cost per crop is lower in the spring oilseed/winter wheat rotation
because there are three crops in three years, as opposed to three crops in four years. The
operating costs and direct costs assumed for this example are provided in Table 17. The nitrogen
cost is very volatile. The price used is $0.6/lb. Oilseed meal (approximately 2/3 of harvest
weight) from crushed oilseed is currently worth approximately $0.15/lb and has been included in
the net return calculations, based on the assumption that it could be sold locally or used on the
farm.
Limited Irrigation Rotation Price $/lb Alternative Yield (lbs/acre)
49 1800 2000 2200 2400 2600 28000.1 -167 -147 -127 -107 -87 -670.12 -131 -107 -83 -59 -35 -110.14 -95 -67 -39 -11 17 450.16 -59 -27 5 37 69 1010.18 -23 13 49 85 121 1570.2 13 53 93 133 173 2130.22 49 93 137 181 225 2690.24 85 133 181 229 277 3250.26 121 173 225 277 329 3810.28 157 213 269 325 381 437
Price $/gal AlternativeYield (lbs/acre)147.1 1800 2000 2200 2400 2600 2800
1.9 -33 2 37 71 106 1412.2 -8 29 67 104 142 1802.5 16 57 97 137 178 2182.8 41 84 127 170 213 2563.1 65 111 157 203 249 2953.4 90 139 187 236 284 3333.7 115 166 217 269 320 3714 139 193 248 302 356 410
Price $/lb Alternative Diesel price($/gal)120 2.5 2.8 3.1 3.4 3.7 40.1 246 276 306 336 366 3960.12 202 232 262 292 322 3520.14 158 188 218 248 278 3080.16 114 144 174 204 234 2640.18 70 100 130 160 190 2200.2 26 56 86 116 146 1760.22 -18 12 42 72 102 1320.24 -62 -32 -2 28 58 880.26 -106 -76 -46 -16 14 440.28 -150 -120 -90 -60 -30 0
1. Producing canola under limited irrigation is profitable producing a positive net return of 49 $/ac
2. Producing seed and crushing is the most interesting option at current diesel price: 127 $/ac
3. Buying seed and crushing give a net return of $100 for every 2200 lbs crushed
3. Limited Irrigated Spring Canola Break‐Even Analysis – Per 2200 lbs Returns Over Total Cost Oilseed ($/lb) and Diesel Price ($/gal) in Eastern Colorado.
1. Limited Irrigated Spring Canola Break‐Even Analysis – Per Acre Returns Over Total Direct Cost ($/acre) in Eastern Colorado.
2. Limited Irrigated Spring Canola Break‐Even Analysis – Per Acre ReturnsOver Total Direct Cost ($/acre) as a function of diesel price, in EasternColorado
Figure 18: Canola economic study under limited irrigation.
36
At average yield of 2,200 lbs/ac under limited irrigation (2007 average trial yield), the net return
at the current market price ($0.18/lb) is estimated at $127/ac, if the seed is crushed on farm. At
yields of 2,200 and 2,400 lbs/ac, the break-even points are estimated at $0.15 and $0.14,
respectively. After several years of experimentation and experience in farmer’s fields, we believe
that average and sustainable limited irrigation canola yields of 2000-2400 lb/ac are realistically
attainable. Even when the price of petroleum diesel is at $2.50/gallon and hypothetical yields of
1800 lb/ac, positive returns per acre would be expected for SVO production on the farm with
canola, but not with camelina. At average yields of 2200 lb/ac and petroleum diesel at
$2.50/gallon, net returns are expected to be $96/ac.
Dryland Rotation
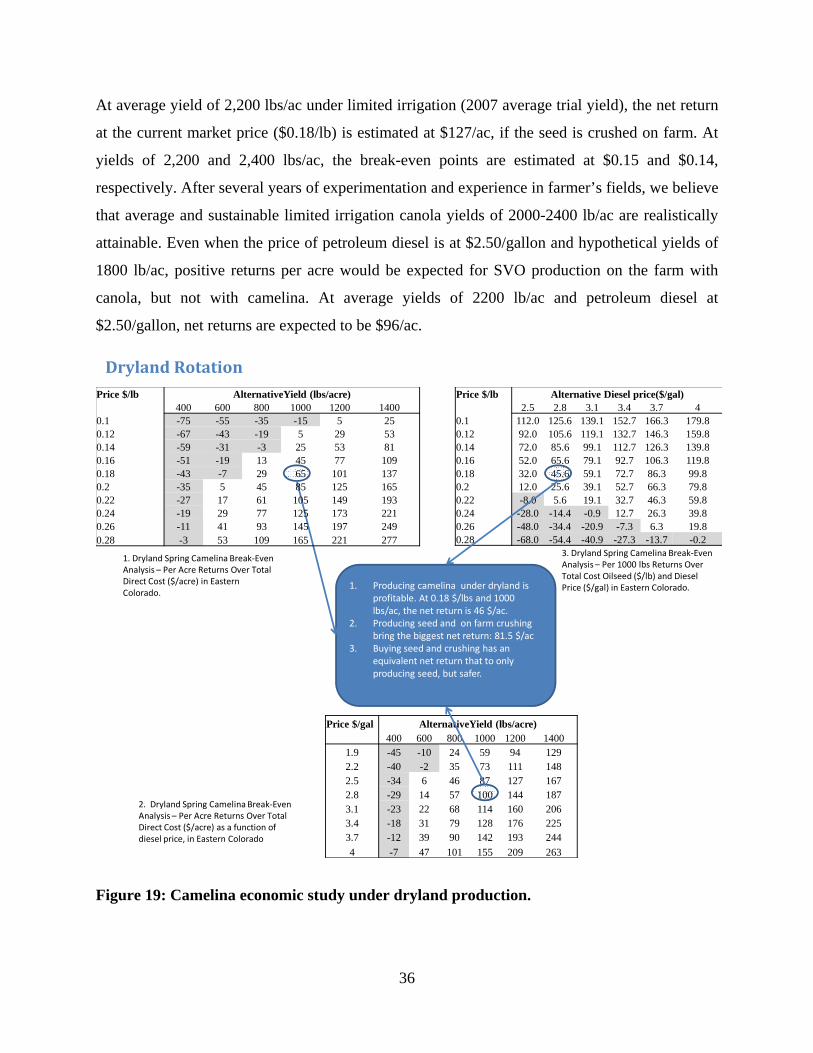
Price $/gal AlternativeYield (lbs/acre)109.6 400 600 800 1000 1200 1400
1.9 -45 -10 24 59 94 1292.2 -40 -2 35 73 111 1482.5 -34 6 46 87 127 1672.8 -29 14 57 100 144 1873.1 -23 22 68 114 160 2063.4 -18 31 79 128 176 2253.7 -12 39 90 142 193 2444 -7 47 101 155 209 263
Price $/lb Alternative Diesel price($/gal)54.61643836 2.5 2.8 3.1 3.4 3.7 40.1 112.0 125.6 139.1 152.7 166.3 179.80.12 92.0 105.6 119.1 132.7 146.3 159.80.14 72.0 85.6 99.1 112.7 126.3 139.80.16 52.0 65.6 79.1 92.7 106.3 119.80.18 32.0 45.6 59.1 72.7 86.3 99.80.2 12.0 25.6 39.1 52.7 66.3 79.80.22 -8.0 5.6 19.1 32.7 46.3 59.80.24 -28.0 -14.4 -0.9 12.7 26.3 39.80.26 -48.0 -34.4 -20.9 -7.3 6.3 19.80.28 -68.0 -54.4 -40.9 -27.3 -13.7 -0.2
1. Producing camelina under dryland is profitable. At 0.18 $/lbs and 1000 lbs/ac, the net return is 46 $/ac.
2. Producing seed and on farm crushing bring the biggest net return: 81.5 $/ac
3. Buying seed and crushing has an equivalent net return that to only producing seed, but safer.
3. Dryland Spring Camelina Break‐Even Analysis – Per 1000 lbs Returns Over Total Cost Oilseed ($/lb) and Diesel Price ($/gal) in Eastern Colorado.
1. Dryland Spring Camelina Break‐Even Analysis – Per Acre Returns Over Total Direct Cost ($/acre) in Eastern Colorado.
2. Dryland Spring Camelina Break‐EvenAnalysis – Per Acre Returns Over Total Direct Cost ($/acre) as a function of diesel price, in Eastern Colorado
Price $/lb AlternativeYield (lbs/acre)65 400 600 800 1000 1200 1400
0.1 -75 -55 -35 -15 5 250.12 -67 -43 -19 5 29 530.14 -59 -31 -3 25 53 810.16 -51 -19 13 45 77 1090.18 -43 -7 29 65 101 1370.2 -35 5 45 85 125 1650.22 -27 17 61 105 149 1930.24 -19 29 77 125 173 2210.26 -11 41 93 145 197 2490.28 -3 53 109 165 221 277
Figure 19: Camelina economic study under dryland production.
37
At average yield of 1,000 lbs/ac under dryland (2007 average trial yield), the net return at the
current market price ($0.18/lb) would be $81.5/ac if seed is crushed on farm. After several years
of experimentation and experience in farmers’ fields, we believe that average and sustainable
dryland camelina yields of 800-1000 lb/ac are realistically attainable. Perhaps equally important
is that on-farm production of biofuel (independence from foreign energy) would make
Colorado’s food and feed supply more secure without being affected by world affairs beyond
local control. In addition, the carbon footprint of Colorado agriculture would be smaller.
38
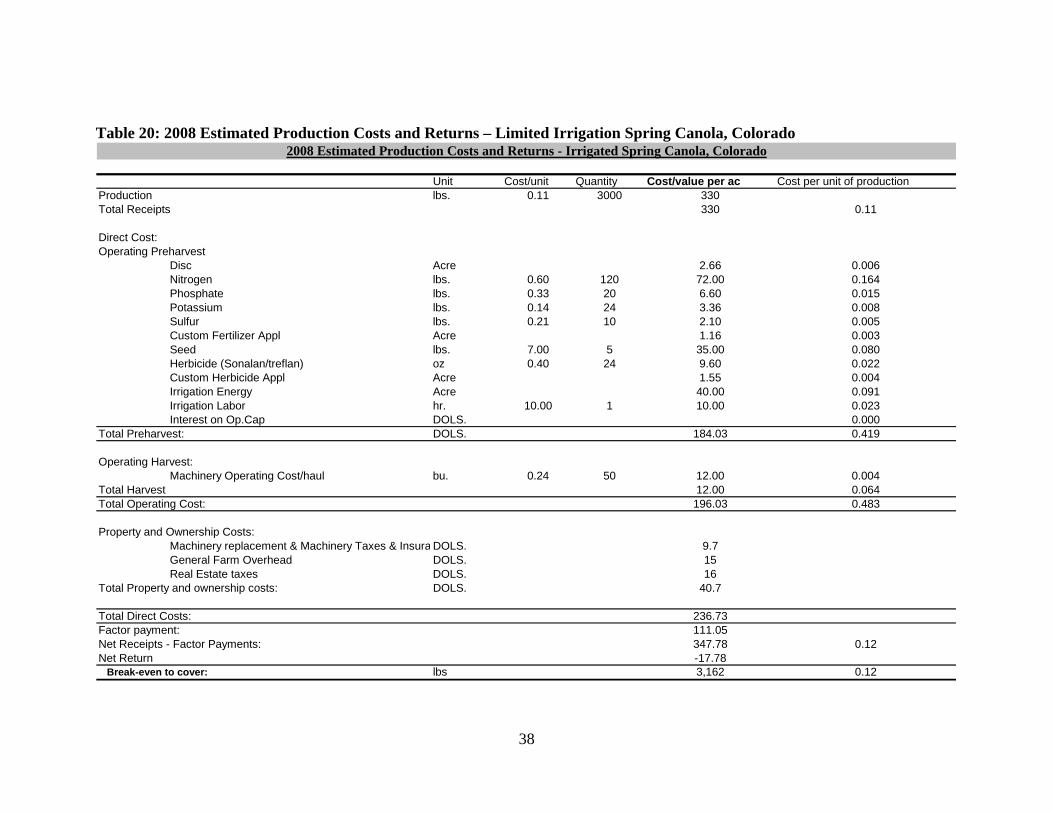
Table 20: 2008 Estimated Production Costs and Returns – Limited Irrigation Spring Canola, Colorado
Unit Cost/unit Quantity Cost/value per ac Cost per unit of productionProduction lbs. 0.11 3000 330Total Receipts 330 0.11
Direct Cost:Operating Preharvest
Disc Acre 2.66 0.006Nitrogen lbs. 0.60 120 72.00 0.164Phosphate lbs. 0.33 20 6.60 0.015Potassium lbs. 0.14 24 3.36 0.008Sulfur lbs. 0.21 10 2.10 0.005Custom Fertilizer Appl Acre 1.16 0.003Seed lbs. 7.00 5 35.00 0.080Herbicide (Sonalan/treflan) oz 0.40 24 9.60 0.022Custom Herbicide Appl Acre 1.55 0.004Irrigation Energy Acre 40.00 0.091Irrigation Labor hr. 10.00 1 10.00 0.023Interest on Op.Cap DOLS. 0.000
Total Preharvest: DOLS. 184.03 0.419
Operating Harvest:Machinery Operating Cost/haul bu. 0.24 50 12.00 0.004
Total Harvest 12.00 0.064Total Operating Cost: 196.03 0.483
Property and Ownership Costs:Machinery replacement & Machinery Taxes & Insura DOLS. 9.7General Farm Overhead DOLS. 15Real Estate taxes DOLS. 16
Total Property and ownership costs: DOLS. 40.7
Total Direct Costs: 236.73Factor payment: 111.05Net Receipts - Factor Payments: 347.78 0.12Net Return -17.78 Break-even to cover: lbs 3,162 0.12
2008 Estimated Production Costs and Returns - Irrigated Spring Canola, Colorado
39
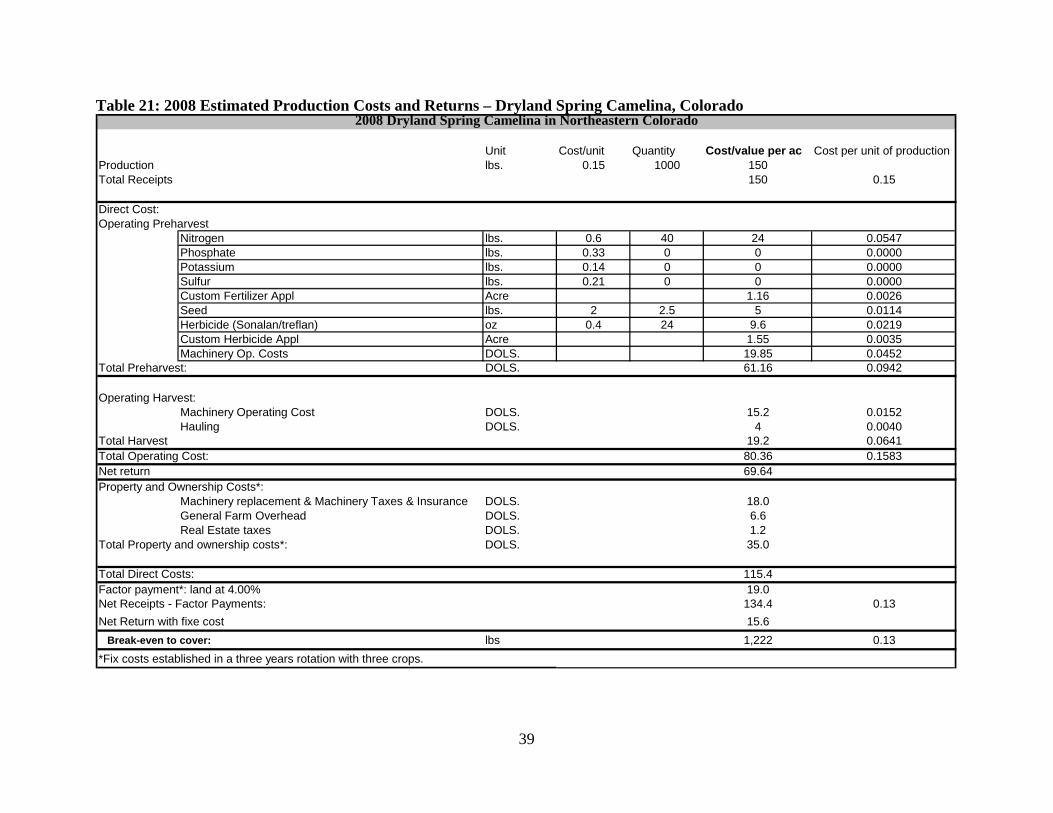
Table 21: 2008 Estimated Production Costs and Returns – Dryland Spring Camelina, Colorado
Unit Cost/unit Quantity Cost/value per ac Cost per unit of productionProduction lbs. 0.15 1000 150Total Receipts 150 0.15
Direct Cost:Operating Preharvest
Nitrogen lbs. 0.6 40 24 0.0547Phosphate lbs. 0.33 0 0 0.0000Potassium lbs. 0.14 0 0 0.0000Sulfur lbs. 0.21 0 0 0.0000Custom Fertilizer Appl Acre 1.16 0.0026Seed lbs. 2 2.5 5 0.0114Herbicide (Sonalan/treflan) oz 0.4 24 9.6 0.0219Custom Herbicide Appl Acre 1.55 0.0035Machinery Op. Costs DOLS. 19.85 0.0452
Total Preharvest: DOLS. 61.16 0.0942
Operating Harvest:Machinery Operating Cost DOLS. 15.2 0.0152Hauling DOLS. 4 0.0040
Total Harvest 19.2 0.0641Total Operating Cost: 80.36 0.1583Net return 69.64Property and Ownership Costs*:
Machinery replacement & Machinery Taxes & Insurance DOLS. 18.0General Farm Overhead DOLS. 6.6Real Estate taxes DOLS. 1.2
Total Property and ownership costs*: DOLS. 35.0
Total Direct Costs: 115.4Factor payment*: land at 4.00% 19.0Net Receipts - Factor Payments: 134.4 0.13Net Return with fixe cost 15.6 Break-even to cover: lbs 1,222 0.13*Fix costs established in a three years rotation with three crops.
2008 Dryland Spring Camelina in Northeastern Colorado

40
Benefits of SVO for Colorado
SVO has many benefits when compared to petro-diesel and other biofuels. It requires no
refining, and it is not harmful to living organisms. As a renewable resource it provides a reliable
income opportunity for many farming generations. The German Federal Water Act on the
Classification of Substances Hazardous to Waters denotes SVO as NWG (non hazardous to
water)1. Biodiesel, on the other hand, is slightly hazardous to water, while diesel and gasoline are
rated as highest toxicity. A North American study of the toxicity of vegetable oil in freshwater
has found no harmful SVO effects2.
Figure 20: iCAST Engineering Project manager Micah Allen presents “How to Make Your Own Fuel” to a group of farmers.
As a fuel, SVO emits 40 to 60% less soot3,4 than petro-diesel. It does not contain sulphur, and
therefore does not cause acid rain5. In addition, carbon monoxide and particulate emissions are
slightly lower. CO2 emissions are also reduced by 80 to 96%6,7 compared to petro-diesel when
1 (WGK (Wassergefährdungsklassen):The German Water hazard classes. Available at http://www.folkecenter.dk/plant‐oil/WGK_ENG.htm; http://www.folkecenter.dk/plant-oil/publications/vwvws.pdf) 2 (http://www.epa.gov/oilspill/pdfs/Li-Lee-Cobanli-Wrenn-Venosa-Doe_FSS06.pdf ) 3 (http://home.clara.net/heureka/gaia/veggie-oil.htm). 4 (http://www.biomatnet.org/secure/Fair/F484.htm) 5 www.folkecenter.dk/plant-oil/publications/PPO-emissions.htm 6 (http://www.folkecenter.dk/plant‐oil/publications/energy_co2_balance.pdf)

41
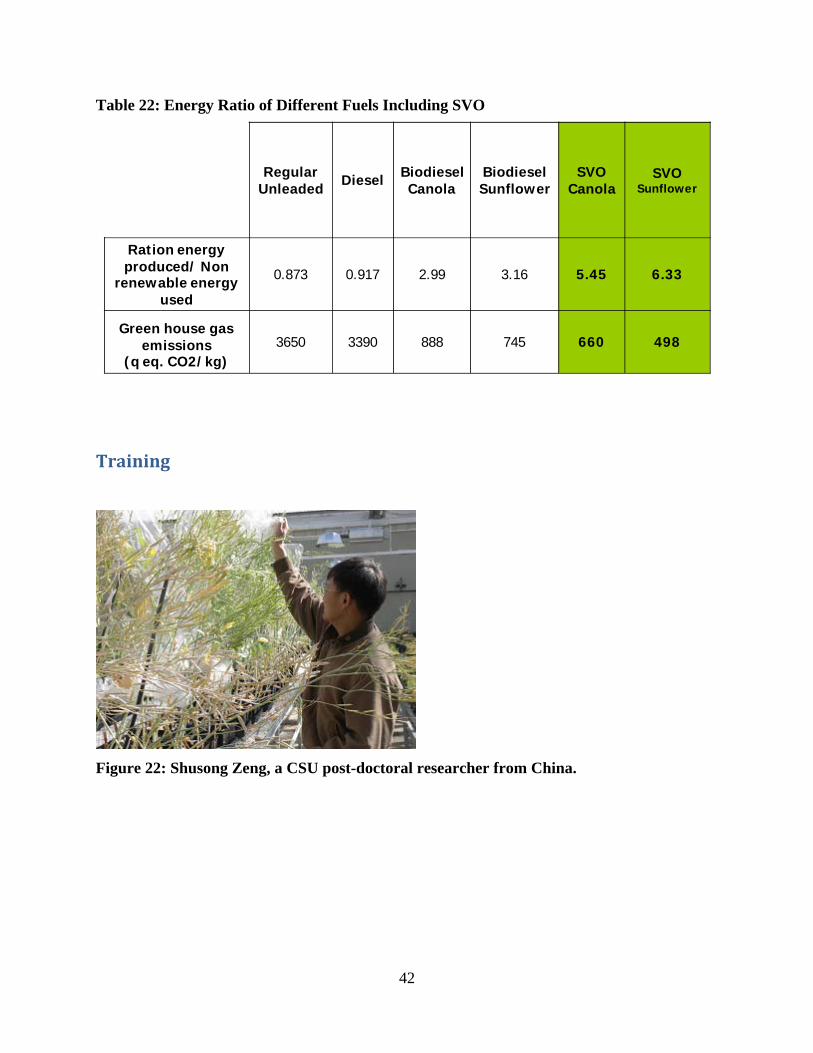
locally produced and used for fuel. Finally, Polycyclic Aromatic Hydrocarbons (PAH) emissions
are distinctly lower for all vegetable fuels, reducing risks of cancer8 (Figure 22). SVO can
contribute to an energy-independent Colorado agricultural system and can increase food and feed
sector security. Gasoline has a 0.8739 energy ratio (energy yield/energy input). If we include
distribution and the value of canola meal, the energy ratio number for canola-based SVO is
5.4510, while for sunflower-based SVO, it is 6.3311 (Table 22).
Figure 21: Canola oil emissions testing results.
7 Institut Français des Huiles Végétales Pure, ADEME 21/11/06 8 http://www.biomatnet.org/secure/Fair/F484.htm 9 Institut Français des Huiles Végétales Pure, ADEME 21/11/06 10 http://www.valbiom.be/, Biomass certification 11 ADVA 31
42
Table 22: Energy Ratio of Different Fuels Including SVO
RegularUnleaded Diesel Biodiesel
CanolaBiodiesel Sunflower
SVO Canola
SVO Sunflower
Ration energy produced/ Non
renewable energy used
0.873 0.917 2.99 3.16 5.45 6.33
Green house gas emissions
(q eq. CO2/kg)3650 3390 888 745 660 498
Training
Figure 22: Shusong Zeng, a CSU post-doctoral researcher from China.
43
Figure 23 : CSU undergraduate student Tom Fitzgerald with Shusong Zeng.
Figure 24: Gaelle Berges, master’s student from Ecole d’Ingenieur de Purpan in France.
44
Figure 25 : David Johnson and Blake Robinson, high school students Fort Collins.
Figure 26: CSU graduate student Jean-Nicolas Enjalbert.
45
Figure 27: A biodiesel adventure journalist from Japan.
Figure 28: A group of farmers at the Oilseed Field Day at Yellow Jacket, Colorado, summer 2008.
46
Figures and Tables
Figure 1: The two different conceptual visions of limited irrigation. ............................................. 6
Figure 2: Comparison of oilseed species for water use efficiency (Akron, Colorado). .................. 7
Figure 3: Sunflower field in Yellow Jacket, Colorado. ................................................................ 11
Figure 4: 2008 oilseed harvest at Fort Collins, Colorado. ............................................................ 15
Figure 5: Charlie Rife, a breeder from Blue Sun Biodiesel, inspects camelina trials. .................. 17
Figure 6: Non-linear regression of seeding rate by yield Averaged over all other factors at
Yellow Jacket, Colorado, 2008. .................................................................................................... 22
Figure 7: Correlation between branches per plant and capsules per plant in the seeding rate X
gypsum rate trial. .......................................................................................................................... 23
Figure 8:Map of Europe showing countries of origin for camelina accessions. ........................... 25
Figure 9: Camelina experiment in the greenhouse. ...................................................................... 25
Figure 10: Brassica carinata experiment in the greenhouse. ........................................................ 26
Figure 11: A student works on the greenhouse experiment. ......................................................... 26
Figure 12: The interaction of accessions under wet and dry conditions for seed weight in the
greenhouse. ................................................................................................................................... 28
Figure 13: Example of a significant negative correlation in seed weight between wet and dry
treatment in the greenhouse. ......................................................................................................... 29
Figure 14: Reaction norm for seed weight per plant in the field between two accessions from
different origins. ............................................................................................................................ 30
Figure 15: Reaction norm for seed weight per plant in the greenhouse between two accessions
from different origins. ................................................................................................................... 30
Figure 16: Significant positive correlation (r = 0.853) for flea beetle infestation of accessions
between wet and dry treatments. (Infestation scale: one = no infestation; three = totally infested)
....................................................................................................................................................... 32
Figure 17: Significant positive correlation (r = 0.628) for biomass of accessions between wet and
dry treatments. Presence of outliers (1) shows that some accessions do better under dry
environments than other accessions. ............................................................................................. 32
Figure 18: Significant positive correlation (r = 0.601) for pod size of accessions between wet and
dry treatment. ................................................................................................................................ 33
47
Figure 19: Canola economic study under limited irrigation. ........................................................ 35
Figure 20: Camelina economic study under dryland production. ................................................. 36
Figure 21: iCAST Engineering Project manager Micah Allen presents “How to Make Your Own
Fuel” to a group of farmers. .......................................................................................................... 40
Figure 22: Canola oil emissions testing results............................................................................. 41
Figure 23: Shusong Zeng, a CSU post-doctoral researcher from China. ...................................... 42
Figure 24 : CSU undergraduate student Tom Fitzgerald with Shusong Zeng. ............................. 43
Figure 25: Gaelle Berges, master’s student from Ecole d’Ingenieur de Purpan in France. .......... 43
Figure 26 : David Johnson and Blake Robinson, high school students Fort Collins. ................... 44
Figure 27: CSU graduate student Jean-Nicolas Enjalbert. ............................................................ 44
Figure 28: A biodiesel adventure journalist from Japan. .............................................................. 45
Figure 29: A group of farmers at the Oilseed Field Day at Yellow Jacket, Colorado, summer
2008............................................................................................................................................... 45
Table 1: Cropping Systems for Adaptable Oilseed Crops in Colorado .......................................... 8
Table 2: Number of Trials by Irrigation Level and by Crop in 2007 and 2008 .............................. 9
Table 3: Soybean Trial Performance Summary ............................................................................ 10
Table 4: 2007 and 2008 Sunflower Trial Performance Summary ................................................ 12
Table 5: Safflower Trial Variety Performance Summary ............................................................. 13
Table 6: 2007 and 2008 Canola Variety Trial Performance Summary ........................................ 15
Table 7: Camelina Trial Performance Summary .......................................................................... 18
Table 8: Low Temperature Properties of Blends of Camelina and Mineral Diesel Oil ............... 19
Table 9: Saturated Fatty Acid Profile Summary ........................................................................... 19
Table 10: Oleic and Polyunsaturated Fatty Acid Profile .............................................................. 20
Table 11: Oil Profiles of the Targeted Crops Compared to Desired SVO Profile ........................ 21
Table 12: 2008 Camelina Agronomy Trial Analysis of Variance ................................................ 22
Table 13: Statistical Analysis of Various Growth and Experimental Parameters for Camelina .. 23
Table 14: Country of Origin of Camelina Accessions .................................................................. 24
Table 15: Country of Origin of Ethiopian Mustard Accessions ................................................... 26
Table 16: Summary of Camelina Performance in the Greenhouse and in the Field ..................... 28
Table 17: Correlation of Traits in Field and Greenhouse-grown Plants ....................................... 29
48
Table 18: Summary of Brasica carinata Screening Statistical Analysis ...................................... 31
Table 19: Correlation of Traits in Field-Grown Brassica carinata .............................................. 33
Table 20: 2008 Estimated Production Costs and Returns – Limited Irrigation Spring Canola,
Colorado ........................................................................................................................................ 38
Table 21: 2008 Estimated Production Costs and Returns – Dryland Spring Camelina, Colorado39
Table 22: Energy Ratio of Different Fuels Including SVO .......................................................... 42
49
References
Budin, J.T., Breene, W.M., & Putnam D.H. (1995). Some compositional properties of Camelina (Camelina-sativa L Crantz) seeds and oils. Journal of the American Oil Chemists Society, 72, 309-315.
Downey, R.K., and Klassen A.J., Pawlowsk.Sh. (1974). Breeding quality improvements into Canadian Brassica oilseed crops. Fette Seifen Anstrichmittel, 76, 302-302.
Fröhlich, A., and Rice, B. (2005). Evaluation of Camelina sativa oil as a feedstock for biodiesel production. Industrial Crops and Products, 21(1). 25-31.
Haas, M.J., Scott, K.M., Alleman, T.L., & McCormick R.L. (2001). Engine performance of biodiesel fuel prepared from soybean soapstock: A high quality renewable fuel produced from a waste feedstock. Energy & Fuels, 15, 1207-1212.
Klocke, N.L., Schneekloth, J.P., Melvin, S.R., Clark, R.T., & Payero, J.O. (2004). Field scale limited irrigation scenarios for water policy strategies. Applied Engineering in Agriculture, 20, 623-631.
Korsrud, G.O., Keith, M.O., & Bell, J.M. (1978). Comparison of nutritional value of Crambe and Camelina seed meals with egg and casein. Canadian Journal of Animal Science, 58, 493-499.
Lange, R., Schumann, W., Petrzika, M., Busch, H., & Marquard, R. (1995). Glucosinolates in linseed dodder. Fett Wissenschaft Technologie-Fat Science Technology, 97, 146-152.
Norton, N.A., Clark, R.T., & Schneekloth, J.P. (2000). Effects of alternative irrigation allocations on water use, net returns, and marginal user costs. Journal of Agricultural and Resource Economics, 25, 732-732.
Pilgeram, A.L., Sands, D.C., Boss, D., Dale, N., Wichman, D., Lamb, P., Lu, C., Barrows, R., Kirkpatrick, M., Thompson, B., & Johnson, D.L., (2007). Camelina sativa, A Montana Omega-3 and Fuel Crop. Issues in New Crops and New Uses.