Embed Size (px)
Citation preview
Ana Paula Barreto Terrasso
Degree in Biochemistry
Development of novel human cellular models for neurotoxicity studies
Dissertation to obtain master degree in Genética Molecular e Biomedicina
Supervisor: Catarina Brito, Investigador Auxiliar, IBET, ITQB-UNL Internal Supervisor: Margarida Castro Caldas, Professor Auxiliar, FCT-UNL
Jury: President: Prof. Doutora Margarida Casal Ribeiro Castro Caldas Braga Arguer: Prof. Doutora Júlia Carvalho Costa Supervisor: Doutora Ana Catarina Maurício Brito Ataíde Montes
November, 2012

II
III
Development of novel human cellular models for neurotoxicity studies
Copyright Ana Paula Barreto Terrasso, FCT/ UNL, UNL
A Faculdade de Ciências e Tecnologia e a Universidade Nova de Lisboa têm o direito,
perpétuo e sem limites geográficos, de arquivar e publicar esta dissertação através de exemplares
impressos reproduzidos em papel ou de forma digital, ou por qualquer outro meio conhecido ou que
venha a ser inventado, e de a divulgar através de repositórios científicos e de admitir a sua cópia e
distribuição com objetivos educacionais ou de investigação, não comerciais, desde que seja dado
crédito ao autor e editor.

IV
V
Acknowledgements
I would like to acknowledge all the people directly or indirectly involved in this thesis.
To Prof. Dr. Paula Alves, for the opportunity to do my master thesis at Animal Cell
Technology Unit at IBET, ITQB-UNL, for the good working conditions offered and for being a strong
example of leadership.
To Dr. Catarina Brito, it’s a privilege and a pleasure to work with her, for her guidance, for all
the knowledge, support and patience to teach me all the techniques of animal cell culture, for being
always there. For the hours of scientific discussions and for the friendly conversation; for being an
example in science, helping me to grow as scientist.
To Prof. Dr. Margarida Castro Caldas for accepting to be my internal supervisor and for being
available to help during my master thesis work.
To Dr. Margarida Serra for all the support and advices about NT2 cells culture and for her
willingness, always being there to help.
To Dr. Marcos Sousa for all the support and advices with stirred suspension culture systems
and also for his availability.
To Dr. Cristina Pereira for all the patience and advices about qRT-PCR.
To all Animal Cell Technology Unit members, for the good working environment, friendship
and the help during this year, specially to Marta Estrada, Sofia Rebelo, Daniel Simão, Catarina Pinto,
and Marta Silva for all the good scientific discussions, for all the willingness for help and specially for
the friendship and support in good and in bad moments.
A todos os meus amigos, por toda a amizade e apoio e por todos os momentos de descontração
que passámos juntos.
Ao Paulo, por todo o apoio e incentivo, por estar sempre ao meu lado e por toda a paciência e
carinho. Obrigada por toda a força que me deste, sem ti não seria o mesmo.
Ao meu irmão Zé Luis, obrigado por todo o apoio, por todos os bons momentos e por me
ajudares a ir em frente.
Às pessoas mais importantes, os meus pais, Ana e António, sem vocês nada seria possível,
obrigado por todo o amor e por todo o apoio, carinho e incentivo para seguir em frente, obrigado por
estarem sempre lá, em todos os momentos.

VI
VII
Preface
This work was performed in the Animal Cell Technology Unit of IBET and ITQB-UNL,
within the scope of the project - “3D in vitro models for reducing animal experimentation in
pharmaceutical development: integrative approaches for prediction of hepatic drug metabolism and
neurotoxicity”, PTDC/EEB-BIO/112786/2009, funded by FCT (Fundação para a Ciência e
Tecnologia), Portugal.
Part of the work described was accepted for a poster presentation in the international meeting
of the European Society for Toxicology in Vitro (ESTIV2012):
Terrasso A.P., Pereira C., Serra M., Alves P.M. and Brito C. Novel human 3D cell models for
neurotoxicity studies. ESTIV 2012, October 2012, Lisboa, Portugal.

VIII
IX
Abstract
Information currently available on neurotoxicity of chemicals is scarce and there are a
growing number of new compounds to be tested. Therefore, new strategies are necessary to identify
neurotoxic agents with speed, reliability and respect for animal welfare.
The limited availability of primary human brain cells means that there is a need for human cell
lines that reliably model human neurons and astrocytes. Despite the advances in stem cell research,
numerous challenges must be overcome before this technology can be widespread used, such as low
differentiation efficiency.
Human pluripotent embryocarcinoma NTera2/cloneD1 (NT2) cell line is an alternative cell
source from which neurons and astrocytes can be derived in vitro.
The aim of this work was to develop scalable and reproducible novel human cellular models
using NT2 cells as source of differentiated neural phenotypes.
A 2D culture system for astrocytic differentiation was implemented. After 4 weeks of
differentiation with retinoic acid followed by 5 weeks maturation with mitotic inhibitors, astrocytes
obtained expressed vimentin, GFAP, S100- and GLT-1 as characterized by immunodetection and
qRT-PCR.
Then, a 3D culture approach was adopted, using stirred suspension culture systems, in which
cell-cell and cell-extracellular matrix interactions occur, mimicking better the in vivo situation. NT2
cells, inoculated as single cells, spontaneously aggregated without compromising their pluripotency.
Optimization of stirring rate allowed control of aggregate size along time. After 3 weeks of RA
treatment and 2 weeks of maturation, neurons expressing βIII-tubulin, MAPs and synaptophysin and
astrocytes expressing vimentin, GFAP, S100- and GLT-1 were detected, as characterized by
immunodetection and qRT-PCR. Furthermore, astrocytes presented a 2.5-fold higher yield than that
observed in 2D culture systems.
Results showed that NT2 differentiated cells are promising models for neurotoxicity testing.
Furthermore, the 3D culture systems developed herein can contribute to increase the relevance of these
studies, recapitulating human neuron-astrocyte interactions in a 3D cellular context.
Keywords: human stem cells, NTera2/cloneD1 cell line, neural differentiation, stirred suspension
culture systems, 3D cell models, aggregates.

X
XI
Resumo
A informação disponível em termos da neurotoxicidade de compostos é escassa além de
existir um número crescente de compostos que precisam de ser caracterizados. Assim, é necessário
desenvolver novas estratégias que permitam identificar agentes neurotóxicos com rapidez e reduzir a
experimentação animal.
Devido à escassez de culturas primárias de células neurais humanas há a necessidade de
modelos neurais humanos alternativos. As células estaminais humanas são uma fonte promissora, no
entanto para a sua implementação ainda é necessário superar desafios como a baixa eficiência de
diferenciação.
A linha celular NTera2/cloneD1 (NT2) é uma linha pluripotente, derivada de um
teratocarcinoma embrionário humano, sendo uma fonte alternativa para obtenção de neurónios e
astrócitos humanos.
O objectivo deste trabalho foi desenvolver um novo modelo celular humano usando a linha
celular NT2 como fonte de células diferenciadas com fenótipos neurais.
Procedeu-se à implementação de um sistema de cultura 2D para diferenciação astrocítica.
Após 4 semanas de diferenciação com ácido retinóico e 5 semanas de maturação com inibidores de
mitose foi detectada, por imunodetecção e qRT-PCR, a presença de astrócitos que expressam
vimentina, GFAP, S100- e GLT-1.
Seguidamente foi desenvolvida uma estratégia de cultura 3D, baseada em sistemas de cultura
agitados, que permite interacções célula-célula e célula-matriz extracelular, mimetizando melhor a
situação in vivo. As células foram inoculadas como suspensão celular e agregaram espontaneamente,
sem comprometer o seu estado de pluripotência. A optimização da velocidade de agitação permitiu
controlar o tamanho dos agregados durante a cultura. Após 3 semanas de tratamento com ácido
retinóico e 2 semanas de maturação foi detectada, por imunodetecção e qRT-PCR, a presença de
neurónios que expressam III-tubulina, MAPs e sinaptofisina e astrócitos que expressam vimentina,
GFAP, S100- e GLT-1. O rendimento em astrócitos foi 2,5 vezes maior que nos sistemas de cultura
2D.
Os resultados obtidos mostraram a linha celular NT2 diferenciada adoptando uma estratégia de
cultura 3D é um modelo promissor para estudos de neurotoxicidade.
Palavras-chave: células estaminais humanas, linha celular NTera2/cloneD1, diferenciação neural,
sistemas de cultura agitados, modelos celulares 3D, agregados.

XII
XIII
Contents
I. Introduction ..................................................................................................................................... 1
I.1 Brain cells .............................................................................................................................. 1
I.2 Need for new cellular models for neurotoxicity studies ........................................................ 6
I.3 Cell Sources ........................................................................................................................... 8
I.4 NTera-2/ clone D1 cell line ................................................................................................. 11
i. Neurons derived from NTera-2/ clone D1 cell line ............................................................. 12
ii. Astrocytes derived from NTera-2/ clone D1 cell line ......................................................... 13
I.5 Two and three dimensional culture systems ........................................................................ 14
I.6 Stirred culture systems ........................................................................................................ 18
I.7 Thesis Aim .......................................................................................................................... 21
II. Materials and Methods .................................................................................................................. 23
II.1. Cell proliferation ................................................................................................................. 23
II.2. Media formulation ............................................................................................................... 23
II.3. Neuronal differentiation in 2D culture systems................................................................... 23
II.4. Astrocyte differentiation in 2D culture systems .................................................................. 24
II.5. Neural differentiation in stirred suspension culture systems ............................................... 25
II.6. Maturation in 2D culture systems ....................................................................................... 26
II.7. Cell concentration and viability determination ................................................................... 26
II.8. Aggregate size determination .............................................................................................. 27
II.9. Characterization by immunofluorescence microscopy ....................................................... 27
II.10. Protein extraction and Western blot analysis ...................................................................... 28
II.11. qRT-PCR analysis ............................................................................................................... 29
II.12. Flow cytometry analysis ...................................................................................................... 31
III. Results and Discussion .................................................................................................................. 33
III.1. NT2 cell differentiation in 2D culture systems .................................................................... 33
III.2. NT2 neural differentiation in a stirred suspension culture system ........................................ 45
III.3. 2D maturation ........................................................................................................................ 62
XIV
IV. Conclusion ..................................................................................................................................... 67
V. Perspectives ................................................................................................................................... 69
VI. References ..................................................................................................................................... 71
XV
Figure Index
Figure I.1: Different types of CNS cells. Glial cells interactions with neurons and blood vessels. ........ 2
Figure I.2: Glutamate-glutamine cycle. ................................................................................................... 4
Figure I.3: CNS development. ................................................................................................................. 9
Figure I.4: Neural stem cells (NSC) populations that can be isolated or generated in vitro. ................ 10
Figure I.5: 3D culture methods .............................................................................................................. 15
Figure I.6: Neuronal cultures in 2D and 3D .......................................................................................... 17
Figure I.7: Suspension culture systems. ................................................................................................ 19
Figure II.1: Schematic design of 2D culture system for NT2 cell neuronal differentiation and
maturation.. ............................................................................................................................................ 24
Figure II.2: Schematic design of 2D culture system for NT2 cell astrocytic differentiation and
maturation. ............................................................................................................................................. 24
Figure II.3: Spinner-flask from Corning® Life Sciences ...................................................................... 25
Figure II.4: Schematic design of 3D culture system for NT2 neuronal and astrocytic differentiation and
maturation .............................................................................................................................................. 26
Figure III.1: Characterization of undifferentiated NT2 cells by immunofluorescence microscopy.
Detection of SSEA-1, SSEA-4, Tra-1-60, Tra-1-81, Oct-4 , Nestin and vimentin ............................... 34
Figure III.2: Phase contrast images of NT2 astrocytic cultures after MI treatment. ............................. 35
Figure III.3: Characterization of NT2 astrocytic cultures by immunofluorescence microscopy.
Detection of GFAP. ............................................................................................................................... 36
Figure III.4: Characterization of NT2 astrocytic cultures by immunofluorescence microscopy.
Detection of GFAP and vimentin.. ........................................................................................................ 37
Figure III.5: Characterization of NT2 astrocytic cultures by immunofluorescence microscopy.
Detection of Oct-4 and Nestin. .............................................................................................................. 38
Figure III.6: Characterization of NT2 astrocytic cultures by qRT-PCR. Nestin, GFAP, S-100,
GLAST and GLT-1 gene expression normalized for NT2 undifferentiated cells. ................................ 38
Figure III.7: Characterization of NT2 astrocytic cultures by immunofluorescence microscopy.
Detection of GLAST and GLT-1 .......................................................................................................... 40
Figure III.8: Characterization of NT2 neuronal cultures by immunofluorescence microscopy.
Detection of βIII-tubulin and nestin. ..................................................................................................... 43
Figure III.9: Characterization of NT2 neuronal cultures by immunofluorescence microscopy.
Detection of MAPs and synaptophysin.. ............................................................................................... 43
Figure III.10: Aggregate size profile along culture time in a stirred suspension culture system. ......... 46
Figure III.11: Monitorization of 3D cultures along aggregation, differentiation and maturation without
mitotic inhibitors. .................................................................................................................................. 47
XVI
Figure III.12: Characterization of 3D cultures by immunofluorescence microscopy. Detection of Oct-4
and nestin at day 0 and day 3 of culture. ............................................................................................... 48
Figure III.13: Characterization of 3D cultures by immunofluorescence microscopy. Detection of
SSEA-1, SSEA-4, Tra-1-60 and Tra-1-81 at day 0 and day 3 of culture. ............................................. 49
Figure III.14: Characterization of 3D cultures by flow cytometry. Detection of SSEA-1, SSEA-4, Tra-
1-60 and Tra-1-81 at day 0 and day 3.................................................................................................... 50
Figure III.15: Monitorization of 3D cultures after 1 week maturation with mitotic inhibitors ............. 51
Figure III.16: Characterization of 3D cultures by immunofluorescence microscopy. Detection of
pluripotency markers Oct-4, SSEA-1, SSEA-4, TRA-1-60 and Tra-1-81 along differentiation (day 10,
17 and 24). ............................................................................................................................................. 52
Figure III.17: Characterization of 3D cultures by Western blot. Detection of synaptophysin, III-
tubulin, GFAP and vimentin. ................................................................................................................ 53
Figure III.18: Characterization of 3D cultures by immunofluorescence microscopy. Detection of
nestin, III-Tubulin, MAPs and synaptophysin along differentiation (day 10, 17 and 24).. ................ 54
Figure III.19: Characterization of 3D cultures by immunofluorescence microscopy. Detection of
nestin, III-Tubulin, MAPs, synaptophysin and GFAP along maturation without mitotic inhibitors
(day 30 and 37).. .................................................................................................................................... 55
Figure III.20: Characterization of 3D cultures by qRT-PCR. Nestin, III-tubulin, GFAP, S100-,
GLAST and GLT-1 gene expression normalized for NT2 undifferentiated cells (day 0) ..................... 56
Figure III.21: Characterization of 3D cultures by immunofluorescence microscopy. Detection of
GFAP, vimentin, GLAST and GLT-1 along differentiation (day 10, 17 and 24) ................................. 58
Figure III.22: Characterization of 3D cultures by immunofluorescence microscopy. Detection of
GFAP, vimentin, GLAST and GLT-1 along maturation without mitotic inhibitors (day 30 and 37).. . 59
Figure III.23: Maturation in 2D culture conditions: phase contrast microscopy of cells after 3 weeks of
differentiation in 3D culture and 1 week of maturation with mitotic inhibitors. ................................... 62
Figure III.24: Maturation in 2D culture conditions: phase contrast microscopy of cells after 3 weeks of
differentiation in 3D culture and 5 weeks of maturation with mitotic inhibitors .................................. 62
Figure III.25: Characterization of maturation in 2D culture system, after differentiation in 3D culture.
Detection of III-Tubulin, MAPs, synaptophysin, GFAP, vimentin, GLAST and GLT-1 ................... 63
Figure III.26: Percentage of GFAP positive cells in NT2 astrocytic cultures obtained by different
culture systems ...................................................................................................................................... 64
XVII
Table Index
Table II.1: Media and its composition ................................................................................................... 23
Table II.2: List of primary antibodies and dilutions used for immunofluorescence microscopy .......... 28
Table II.3: List of primary antibodies and dilutions used for Western blot analysis............................. 29
Table II.4: List of primers and its sequence used for qRT-PCR analysis............................................. 30
Table II.5: Thermal parameters used in qRT-PCR ................................................................................ 30
Table II.6: List of primary antibodies and dilutions used for flow cytometry analysis ......................... 31
Table III.1: Differentiation efficiencies obtained with 10 or 12 RA treatments. .................................. 42

XVIII
XIX
Abreviations
AM Astrocytic culture medium
BBB Blood brain barrier
cDNA Complementary deoxyribonucleic acid
ChAT Choline acetyl transferase
CNS Central Nervous System
c-Ara Cytosin-β-D-arabinofuranoside
DAPI 4',6-diamidino-2-phenylindole
DM Differentiation medium
DMEM Dubelco´s modified Eagle’s medium
DNA Deoxyribonucleic acid
EAAT Excitatory aminoacid transporter
EDTA Ethylenediamine tetraacetic acid
FBS Fetal bovine serum
FdUr 5-fluoro-2’-deoxyuridine
FSG Fish skin gelatin
GAD Glutamate descarboxylase
GFAP Glial fibrillary acidic protein
GLAST Glutamate aspartate transporter
GLT-1 Glutamate transporter 1
g/ L Grams per liter
hECC Human embryonic carcinoma cells
hESC Human embryonic stem cells
hPSC Human pluripotent stem cells
hiPSC Human induced pluripotent stem cells
hNSC Human neural stem cells
kDa Kilo Daltons
MAPs Microtubule associated proteins
MI Mitotic inhibitors
MI I Mitotic inhibitors medium I
MI II Mitotic inhibitors medium II
min. Minutes
NPC Neural progenitor cells
NT2 NTera2/ cl. D1cell line
XX
Oct-4 Octamer-binding transcription factor 4
PBS Phosphate buffer saline
PDL Poly-D-lysine
PFA Paraformaldehyde
PM Proliferation medium
P/S Penicillin-streptomycin
qRT-PCR Quantitative real time polymerase chain reaction
RA Retinoic acid
RNA Ribonucleic acid
RT Room temperature
SD Standard deviation
SSEA-1 Stage-specific embryonic antigen 1
SSEA-4 Stage-specific embryonic antigen 4
TH Tyrosine hydrolase
Tra-1-60 Tumor Rejection Antigen-1-60
Tra-1-81 Tumor Rejection Antigen-1-81
Tx-100 TritonX-100
Urd Uridine
VGluT-1 Vesicular glutamate transporter 1
w/ v Weigh per volume
µm Micrometer
µM Micromolar
º C Celsius degrees
% Percent
1
I. Introduction
I.1 Brain cells
The brain, part of the central nervous system (CNS), is the most complex organ in mammals
that controls most vital functions and is constituted mainly by neurons and glial cells.
Neurons are one of the most highly specialized cell types and the core components of nervous
system. All neurological processes are dependent on complex cell-cell interactions between single
neurons or groups of related neurons. Neurons can be described according to their size and shape,
neurochemical characteristics, location and connectivity and all of these features are determinants of
their particular functional role in the brain (Byrne and Roberts, 2009). According to the
neurotransmitter used for signaling process, two major classes of neurons, which represent more than
90% of neurons in brain, can be considerate: inhibitory GABAergic interneurons that make local
contacts and use GABA and excitatory glutamatergic neurons that used glutamate as neurotransmitter.
Other types of neurons localized in more specialized areas include cholinergic neurons that use
acetylcholine as neurotransmitter and are mostly motor neurons, serotonergic neurons that use
serotonin as neurotransmitter and are mostly found in raphe nuclei, specific regions of the brainstem
that innervate to the forebrain and dopaminergic neurons that reside mostly within the substance nigra
and contain the catecholamine-synthesizing enzyme tyrosine-hydroxylase as well as dopamine as
neurotransmitter (Brodal, 2010; Byrne and Roberts, 2009).
Even though the large number of neurons, glial cells occupy the most part of the brain volume.
The proportion of glial cells to neurons varies between animal and brain regions but seems to be
correlated with animal size as the mouse, human and elephant brain possess approximately 65%, 90%
and 97% of glial cells (Allen and Barres, 2009).
Glia and neurons mainly share a common origin from precursor cells derived from the
embryonic the germ layer known as the neuroectoderm. A notable exception is microglia, which are
part of the immune system and enter in the brain from the blood circulation early during development
(Allen and Barres, 2009).
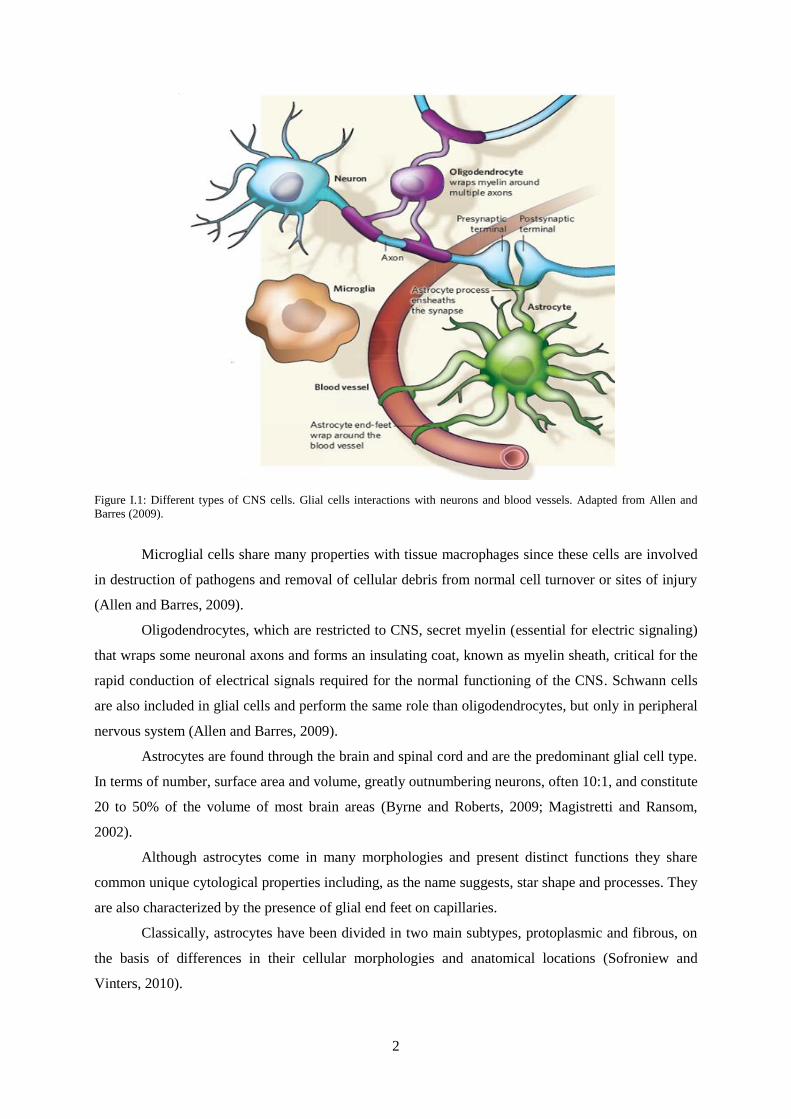
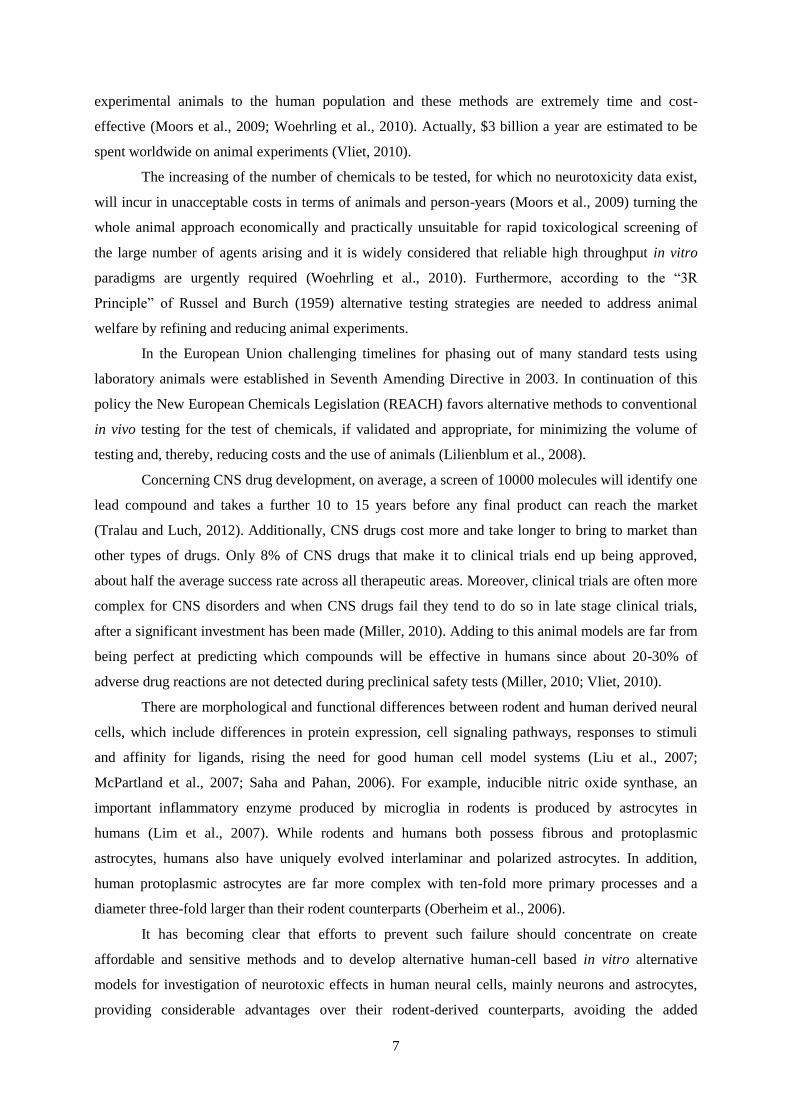
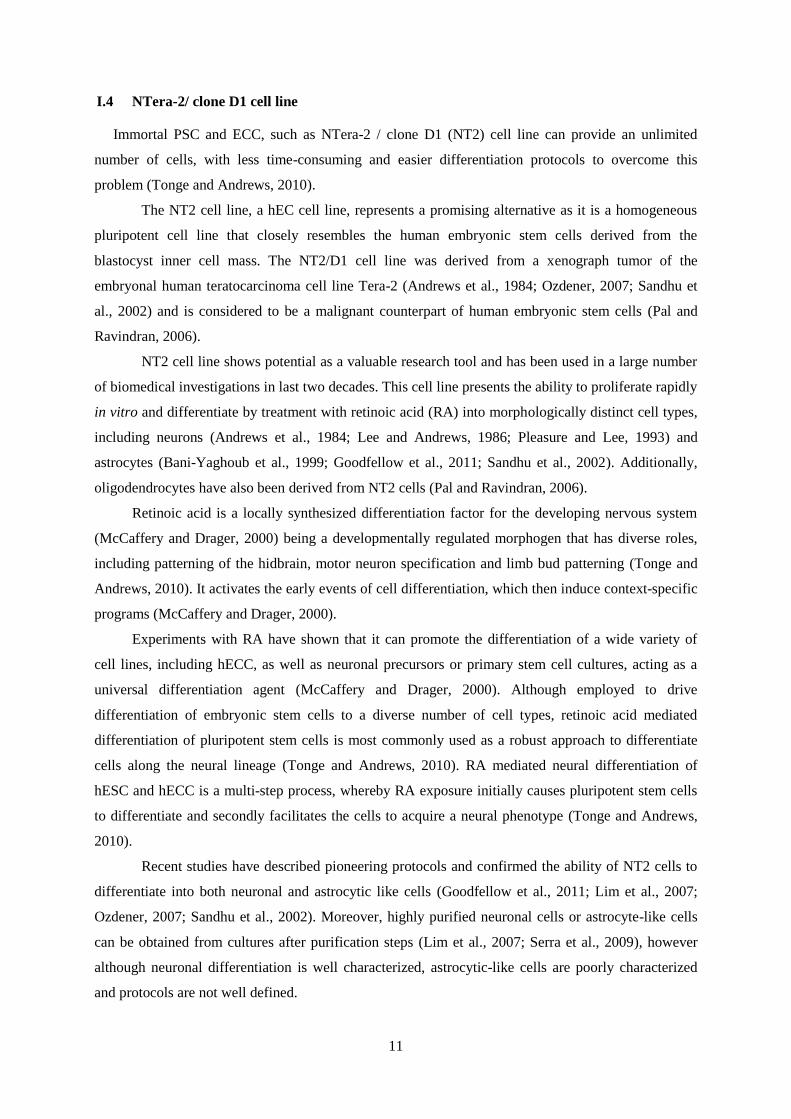
There are three major types of glial cells in the mature human central nervous system:
microglia, oligodendrocytes and astrocytes (Allen and Barres, 2009), as describe in Fig. I.1.
2
Figure I.1: Different types of CNS cells. Glial cells interactions with neurons and blood vessels. Adapted from Allen and
Barres (2009).
Microglial cells share many properties with tissue macrophages since these cells are involved
in destruction of pathogens and removal of cellular debris from normal cell turnover or sites of injury
(Allen and Barres, 2009).
Oligodendrocytes, which are restricted to CNS, secret myelin (essential for electric signaling)
that wraps some neuronal axons and forms an insulating coat, known as myelin sheath, critical for the
rapid conduction of electrical signals required for the normal functioning of the CNS. Schwann cells
are also included in glial cells and perform the same role than oligodendrocytes, but only in peripheral
nervous system (Allen and Barres, 2009).
Astrocytes are found through the brain and spinal cord and are the predominant glial cell type.
In terms of number, surface area and volume, greatly outnumbering neurons, often 10:1, and constitute
20 to 50% of the volume of most brain areas (Byrne and Roberts, 2009; Magistretti and Ransom,
2002).
Although astrocytes come in many morphologies and present distinct functions they share
common unique cytological properties including, as the name suggests, star shape and processes. They
are also characterized by the presence of glial end feet on capillaries.
Classically, astrocytes have been divided in two main subtypes, protoplasmic and fibrous, on
the basis of differences in their cellular morphologies and anatomical locations (Sofroniew and
Vinters, 2010).
3
The brain is constituted by gray matter, made up of neuron cell bodies, dendrites and
unmyelinated axons and by white matter made up of bundles of axons that are myelinated. Astrocytes
in white matter are fibrous astrocytes, usually associated with neuronal axons and are complex cells
with 50 to 60 long branching processes that radiate from the cell body and terminate in end-feet at the
pial surface, on blood vessels, or freely among axons. Astrocytes in gray matter are protoplasmic
astrocytes, closely associated with neuronal cell bodies and synapses and have profuse, short stubby
processes that contact blood vessels and the pial surface (Allen and Barres, 2009; Magistretti and
Ransom, 2002). Furthermore, protoplasmic astrocytes differ between the various regions of grey
matter and even within a single brain region, neighbor astrocytes are probably different. This is not
surprising, because, if astrocytes fulfill different functions, they must be adapted to specific brain
regions (Allen and Barres, 2009).
Despite their differences, astrocytes usually express intermediate filaments composed of a glial
fibrillary acidic protein, commonly referred to as GFAP. Nevertheless, fibrous astrocytes contain more
GFAP filaments than protoplasmic astrocytes and these are the most common type of astrocytes.
Furthermore, GFAP expression by astrocytes in human CNS, exhibits both regional and local
variabilities and some types of astrocytes have been described as GFAP-negative (Sofroniew and
Vinters, 2010). On the other hand GFAP has been identified in other cell types besides astrocytes
(Middeldorp et al., 2010).
Other astrocytic markers are S100-β, glutamine synthetase (Byrne and Roberts, 2009;
Magistretti and Ransom, 2002) and aquaporin 4 (reviewed by Molofsky et al., 2012; Oberheim et al.,
2009).
S100-β belongs to the S-100 family of calcium binding proteins and is expressed by astrocytic
precursors and mature astrocytes (Donato et al., 2009; Reali et al., 2011). S-100β can be released to
the extracellular space by mature astrocytes and depending on the concentration can play a
neurotrophic or a neurotoxic role. Normally it is present in brain extracellular space at subnanomolar
to nanomolar concentrations, protecting neurons against oxidative stress and promoting neurite
outgrowth as well as astrocytic uptake of glutamate (Reali et al., 2011; Wang and Bordey, 2008).
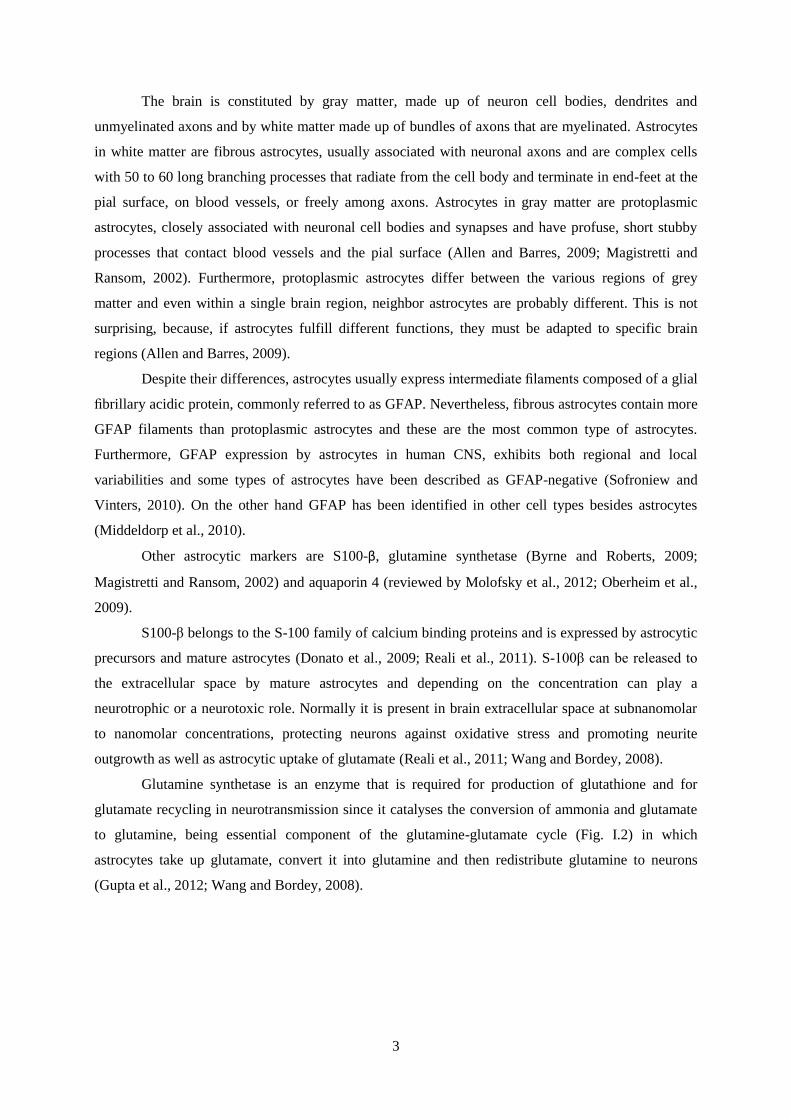
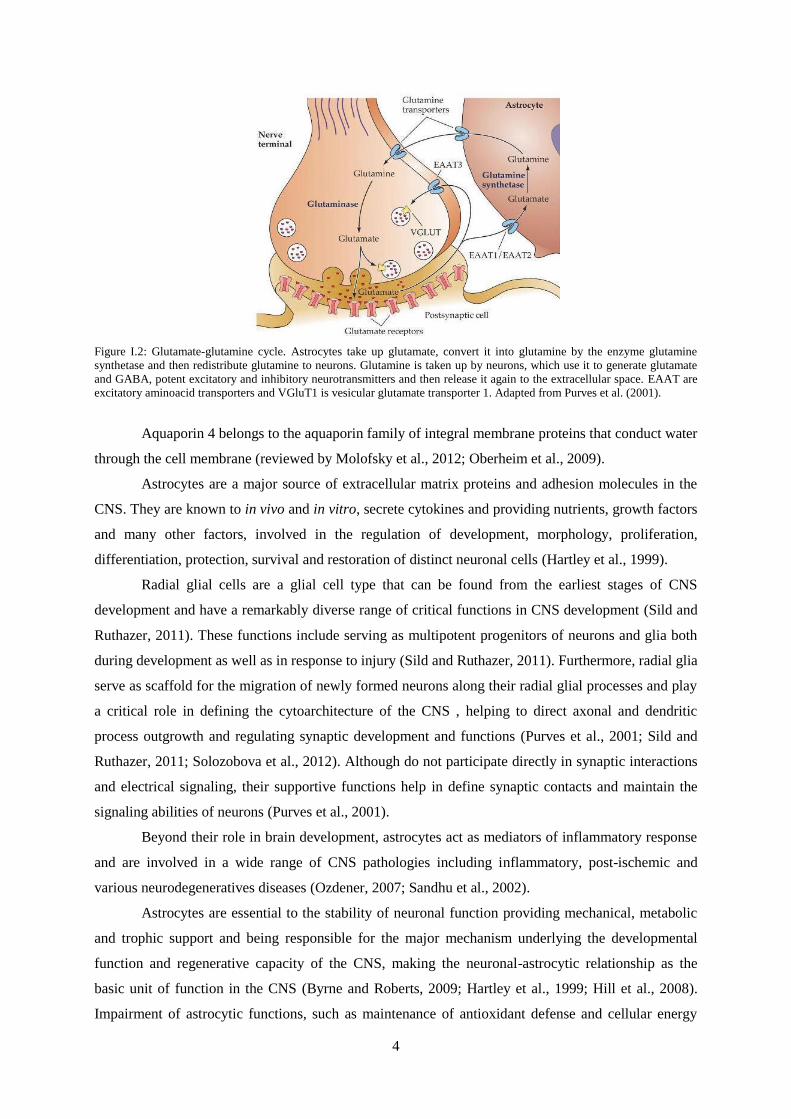
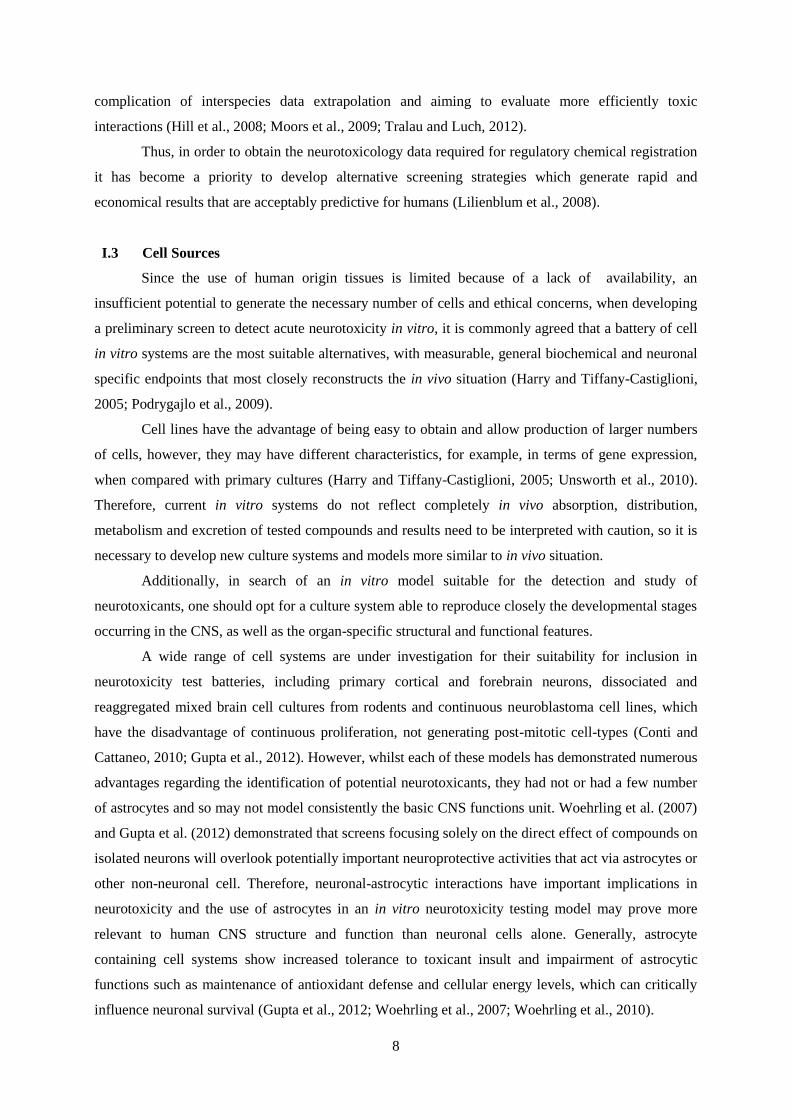
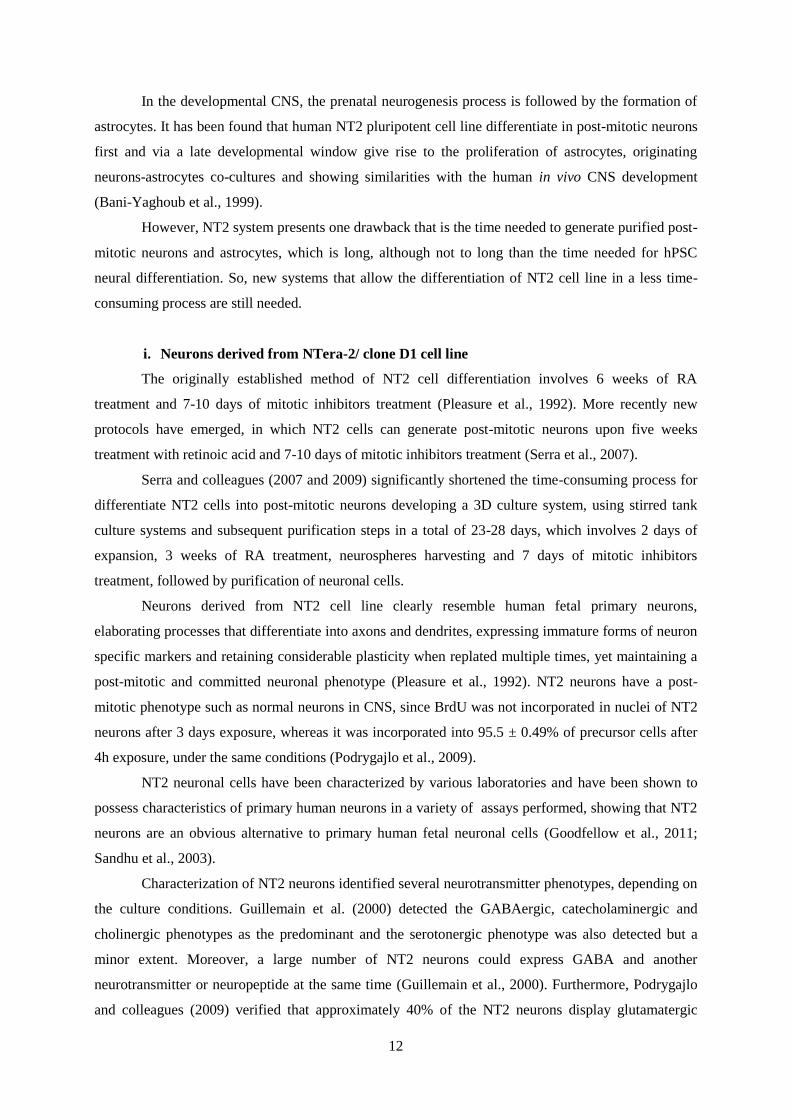
Glutamine synthetase is an enzyme that is required for production of glutathione and for
glutamate recycling in neurotransmission since it catalyses the conversion of ammonia and glutamate
to glutamine, being essential component of the glutamine-glutamate cycle (Fig. I.2) in which
astrocytes take up glutamate, convert it into glutamine and then redistribute glutamine to neurons
(Gupta et al., 2012; Wang and Bordey, 2008).
4
Figure I.2: Glutamate-glutamine cycle. Astrocytes take up glutamate, convert it into glutamine by the enzyme glutamine
synthetase and then redistribute glutamine to neurons. Glutamine is taken up by neurons, which use it to generate glutamate
and GABA, potent excitatory and inhibitory neurotransmitters and then release it again to the extracellular space. EAAT are
excitatory aminoacid transporters and VGluT1 is vesicular glutamate transporter 1. Adapted from Purves et al. (2001).
Aquaporin 4 belongs to the aquaporin family of integral membrane proteins that conduct water
through the cell membrane (reviewed by Molofsky et al., 2012; Oberheim et al., 2009).
Astrocytes are a major source of extracellular matrix proteins and adhesion molecules in the
CNS. They are known to in vivo and in vitro, secrete cytokines and providing nutrients, growth factors
and many other factors, involved in the regulation of development, morphology, proliferation,
differentiation, protection, survival and restoration of distinct neuronal cells (Hartley et al., 1999).
Radial glial cells are a glial cell type that can be found from the earliest stages of CNS
development and have a remarkably diverse range of critical functions in CNS development (Sild and
Ruthazer, 2011). These functions include serving as multipotent progenitors of neurons and glia both
during development as well as in response to injury (Sild and Ruthazer, 2011). Furthermore, radial glia
serve as scaffold for the migration of newly formed neurons along their radial glial processes and play
a critical role in defining the cytoarchitecture of the CNS , helping to direct axonal and dendritic
process outgrowth and regulating synaptic development and functions (Purves et al., 2001; Sild and
Ruthazer, 2011; Solozobova et al., 2012). Although do not participate directly in synaptic interactions
and electrical signaling, their supportive functions help in define synaptic contacts and maintain the
signaling abilities of neurons (Purves et al., 2001).
Beyond their role in brain development, astrocytes act as mediators of inflammatory response
and are involved in a wide range of CNS pathologies including inflammatory, post-ischemic and
various neurodegeneratives diseases (Ozdener, 2007; Sandhu et al., 2002).
Astrocytes are essential to the stability of neuronal function providing mechanical, metabolic
and trophic support and being responsible for the major mechanism underlying the developmental
function and regenerative capacity of the CNS, making the neuronal-astrocytic relationship as the
basic unit of function in the CNS (Byrne and Roberts, 2009; Hartley et al., 1999; Hill et al., 2008).
Impairment of astrocytic functions, such as maintenance of antioxidant defense and cellular energy
5
levels can critically influence neuronal survival (Takuma et al., 2004). Moreover, most of the growth
factors also act in a specific manner on the development and functions of astrocytes and
oligodendrocytes. So, astrocytes are important for the normal homeostatic regulation of the neural
microenvironment.
During neurotransmission, neurotransmitters and ions are released at high concentrations in
the synaptic cleft. The rapid removal of these substances is important so that they do not interfere with
future synaptic activity. The presence of astrocyte processes around synapses positions them well to
regulate neurotransmitter uptake and inactivation. These possibilities are consistent with the presence
in astrocytes of transport systems for many neurotransmitters. For instance, glutamate reuptake is
performed mostly by astrocytes (Fig. I.3), which convert glutamate into glutamine through enzymatic
activity of glutamine synthetase and then release it to the extracellular space.
Glutamine is taken up by neurons, which use it to generate glutamate and GABA, potent
excitatory and inhibitory neurotransmitters, respectively (Byrne and Roberts, 2009). Reuptake of
glutamate is carried out by high-affinity sodium-dependent glutamate transporters that belong to a
family of integral membrane transport protein. There are five mammalian isoforms of sodium-
dependent glutamate transporters, named excitatory amino acid transporter (EAAT): EAAT1 (or
GLAST, glutamate-aspartate transporter), EAAT2 (or GLT-1, glutamate transporter 1), EAAT3,
EAAT4 and EAAT5. These five EAAT subtypes that share approximately 50-60% aminoacid
sequence homology differ in regional, cellular, and developmental distribution (Chao et al., 2010; Kim
et al., 2011). In general, the predominant isoforms expressed by astrocytes are GLAST and GLT-1,
whereas EAAT3 and EAAT4 are found on cortical neurons and EAAT5 is found almost exclusively in
retinal cells (Kim et al., 2011; Sanchez et al., 2009). GLAST is predominant in the cortex at early
stages during the first postnatal week and GLT-1 expression increases progressively with maturation,
starting during the second week to become the major transporter thereafter. GLAST is also present in
the precursor population, named radial glial cells although its expression in human radial glia
population is heterogeneous (Cantini et al., 2012; Howard et al., 2008).
Astrocytes are also thought to be involved in the exchange of chemicals between the
circulatory system and nervous tissue and to form the selectively permeable and protective blood brain
barrier (BBB), which is a specialized system of brain microvascular endothelial cells that restricts the
access of circulating chemicals to the brain and spinal cord, protecting the brain from toxic substances
in the blood, filters the excess of toxic molecules from the brain to the blood stream and supplies the
CNS with nutrients (Wang and Bordey, 2008). Its major function is to maintain, in a variety of ways,
an appropriate chemical environment for neuronal signaling (Allen and Barres, 2009).
For a long time, astrocytes were thought to physically form the blood–brain barrier and, in
fact, astrocytes are indeed the blood–brain barrier in lower species. However, in higher species,
astrocytes are responsible for inducing and maintaining the tight junctions in endothelial cells that
effectively form the barrier (Magistretti and Ransom, 2002; Purves et al., 2001). The dynamic
6
interactions between astrocytes and endothelial cells regulate BBB stability and permeability since
astrocytes specialized processes ensheath the brain vasculature and are believed to regulate the
induction of BBB, such as tight junctions formation and expression of transporter systems (Wang and
Bordey, 2008).
Astrocytes play a major role in detoxification of the CNS by sequestering metals and a variety
of neuroactive substances of endogenous and xenobiotic origin and also take part in angiogenesis,
which may be important in the development and repair of the CNS (Byrne and Roberts, 2009).
This way, astrocytes protect not only against excitotoxicity by clearing excess of excitatory
neurotransmitters from the extracellular space but also are involved in response to neurotoxicants,
presenting a protective role of neurons (Woehrling et al., 2007).
The multifaceted nature of the astrocytic-neuronal unit provides numerous potential sites of
disruption for neurotoxic chemicals and whilst astrocytes are less susceptible to damage than neurons
they may undergo degeneration or activation (Tieu et al., 2001; Woehrling et al., 2011).
I.2 Need for new cellular models for neurotoxicity studies
The developmental, structural and functional features of the Central Nervous System (CNS)
are known to be particularly complex due to the high elaborate neuronal connectivity and the intimate
physical, communicative and metabolic interactions between all cell types present in CNS, including
neurons, astrocytes, oligodendrocytes and microglial cells (Honegger, 2011). Therefore, the CNS
belongs to the critical target organs of xenobiotics and other potential toxicants because of the high
vulnerability of this organ and the serious consequences that adverse effects have for entire organism,
resulting in neurologic deficits that negatively affects families and society (Honegger, 2011; Moors et
al., 2009).
Chemicals may adversely affect the CNS in various ways. They may perturb commitment of
neural stem cells, cell migration, synaptogenesis, cell death, formation of transmitters and receptors,
trimming of connections, myelinization and development of the BBB. Impairment of the CNS can lead
to a variety of health effects such as altered behavior, mental retardation and other
neurodevelopmental disabilities and diseases (Coecke et al., 2007).
Given the little information available on neurotoxicity and the growing number of chemicals
that need to be tested, new testing strategies and approaches are necessary to identify neurotoxic
agents with speed, reliability and respect for animal welfare, with the ultimate goal to generate tests
with higher high-throughput that can provide mechanistic data and possibly predict the levels of
exposure that may cause adverse effect in humans (Tofighi et al., 2011).
Current testing guidelines propose investigation in rodents, mainly rats, and the risk of human
neurotoxicity from drugs and other chemicals is estimated via the addition of safety factors to toxicity
data derived from in vivo animal models. However, there are reservations regarding extrapolation from
7
experimental animals to the human population and these methods are extremely time and cost-
effective (Moors et al., 2009; Woehrling et al., 2010). Actually, $3 billion a year are estimated to be
spent worldwide on animal experiments (Vliet, 2010).
The increasing of the number of chemicals to be tested, for which no neurotoxicity data exist,
will incur in unacceptable costs in terms of animals and person-years (Moors et al., 2009) turning the
whole animal approach economically and practically unsuitable for rapid toxicological screening of
the large number of agents arising and it is widely considered that reliable high throughput in vitro
paradigms are urgently required (Woehrling et al., 2010). Furthermore, according to the “3R
Principle” of Russel and Burch (1959) alternative testing strategies are needed to address animal
welfare by refining and reducing animal experiments.
In the European Union challenging timelines for phasing out of many standard tests using
laboratory animals were established in Seventh Amending Directive in 2003. In continuation of this
policy the New European Chemicals Legislation (REACH) favors alternative methods to conventional
in vivo testing for the test of chemicals, if validated and appropriate, for minimizing the volume of
testing and, thereby, reducing costs and the use of animals (Lilienblum et al., 2008).
Concerning CNS drug development, on average, a screen of 10000 molecules will identify one
lead compound and takes a further 10 to 15 years before any final product can reach the market
(Tralau and Luch, 2012). Additionally, CNS drugs cost more and take longer to bring to market than
other types of drugs. Only 8% of CNS drugs that make it to clinical trials end up being approved,
about half the average success rate across all therapeutic areas. Moreover, clinical trials are often more
complex for CNS disorders and when CNS drugs fail they tend to do so in late stage clinical trials,
after a significant investment has been made (Miller, 2010). Adding to this animal models are far from
being perfect at predicting which compounds will be effective in humans since about 20-30% of
adverse drug reactions are not detected during preclinical safety tests (Miller, 2010; Vliet, 2010).
There are morphological and functional differences between rodent and human derived neural
cells, which include differences in protein expression, cell signaling pathways, responses to stimuli
and affinity for ligands, rising the need for good human cell model systems (Liu et al., 2007;
McPartland et al., 2007; Saha and Pahan, 2006). For example, inducible nitric oxide synthase, an
important inflammatory enzyme produced by microglia in rodents is produced by astrocytes in
humans (Lim et al., 2007). While rodents and humans both possess fibrous and protoplasmic
astrocytes, humans also have uniquely evolved interlaminar and polarized astrocytes. In addition,
human protoplasmic astrocytes are far more complex with ten-fold more primary processes and a
diameter three-fold larger than their rodent counterparts (Oberheim et al., 2006).
It has becoming clear that efforts to prevent such failure should concentrate on create
affordable and sensitive methods and to develop alternative human-cell based in vitro alternative
models for investigation of neurotoxic effects in human neural cells, mainly neurons and astrocytes,
providing considerable advantages over their rodent-derived counterparts, avoiding the added
8
complication of interspecies data extrapolation and aiming to evaluate more efficiently toxic
interactions (Hill et al., 2008; Moors et al., 2009; Tralau and Luch, 2012).
Thus, in order to obtain the neurotoxicology data required for regulatory chemical registration
it has become a priority to develop alternative screening strategies which generate rapid and
economical results that are acceptably predictive for humans (Lilienblum et al., 2008).
I.3 Cell Sources
Since the use of human origin tissues is limited because of a lack of availability, an
insufficient potential to generate the necessary number of cells and ethical concerns, when developing
a preliminary screen to detect acute neurotoxicity in vitro, it is commonly agreed that a battery of cell
in vitro systems are the most suitable alternatives, with measurable, general biochemical and neuronal
specific endpoints that most closely reconstructs the in vivo situation (Harry and Tiffany-Castiglioni,
2005; Podrygajlo et al., 2009).
Cell lines have the advantage of being easy to obtain and allow production of larger numbers
of cells, however, they may have different characteristics, for example, in terms of gene expression,
when compared with primary cultures (Harry and Tiffany-Castiglioni, 2005; Unsworth et al., 2010).
Therefore, current in vitro systems do not reflect completely in vivo absorption, distribution,
metabolism and excretion of tested compounds and results need to be interpreted with caution, so it is
necessary to develop new culture systems and models more similar to in vivo situation.
Additionally, in search of an in vitro model suitable for the detection and study of
neurotoxicants, one should opt for a culture system able to reproduce closely the developmental stages
occurring in the CNS, as well as the organ-specific structural and functional features.
A wide range of cell systems are under investigation for their suitability for inclusion in
neurotoxicity test batteries, including primary cortical and forebrain neurons, dissociated and
reaggregated mixed brain cell cultures from rodents and continuous neuroblastoma cell lines, which
have the disadvantage of continuous proliferation, not generating post-mitotic cell-types (Conti and
Cattaneo, 2010; Gupta et al., 2012). However, whilst each of these models has demonstrated numerous
advantages regarding the identification of potential neurotoxicants, they had not or had a few number
of astrocytes and so may not model consistently the basic CNS functions unit. Woehrling et al. (2007)
and Gupta et al. (2012) demonstrated that screens focusing solely on the direct effect of compounds on
isolated neurons will overlook potentially important neuroprotective activities that act via astrocytes or
other non-neuronal cell. Therefore, neuronal-astrocytic interactions have important implications in
neurotoxicity and the use of astrocytes in an in vitro neurotoxicity testing model may prove more
relevant to human CNS structure and function than neuronal cells alone. Generally, astrocyte
containing cell systems show increased tolerance to toxicant insult and impairment of astrocytic
functions such as maintenance of antioxidant defense and cellular energy levels, which can critically
influence neuronal survival (Gupta et al., 2012; Woehrling et al., 2007; Woehrling et al., 2010).
9
In vitro, human astrocytes have been shown to protect neurons against insults such as
glutamate excitotoxicity and oxidative stress through the release of growth factors (Gupta et al., 2012;
Sandhu et al., 2003) and subsequently neuronal tolerance of many toxicants may be substantially
increased by the proximity of astrocytes (Woehrling et al., 2007).
Primary cultures derived from fetal brain tissues have been the first models of human brain
and for the last 2 decades multipotent neural stem cells (NSC) or neural progenitor cells (NPC) have
been isolated from multiple brain regions
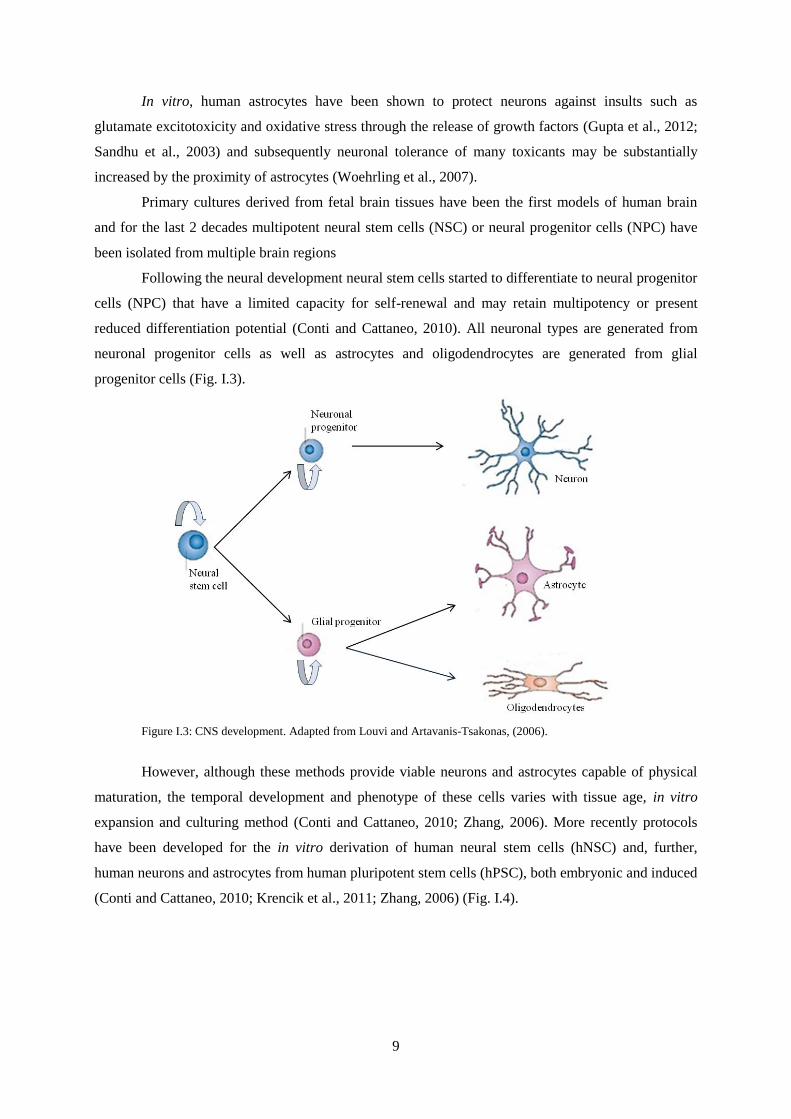
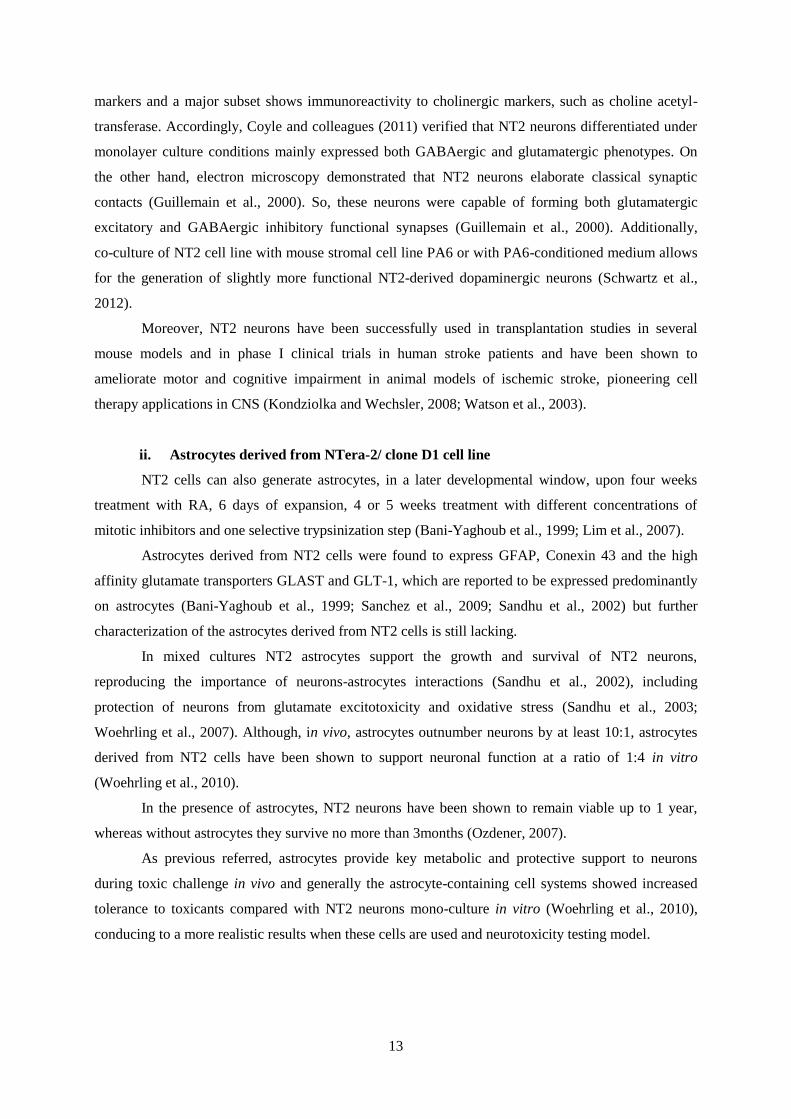
Following the neural development neural stem cells started to differentiate to neural progenitor
cells (NPC) that have a limited capacity for self-renewal and may retain multipotency or present
reduced differentiation potential (Conti and Cattaneo, 2010). All neuronal types are generated from
neuronal progenitor cells as well as astrocytes and oligodendrocytes are generated from glial
progenitor cells (Fig. I.3).
Figure I.3: CNS development. Adapted from Louvi and Artavanis-Tsakonas, (2006).
However, although these methods provide viable neurons and astrocytes capable of physical
maturation, the temporal development and phenotype of these cells varies with tissue age, in vitro
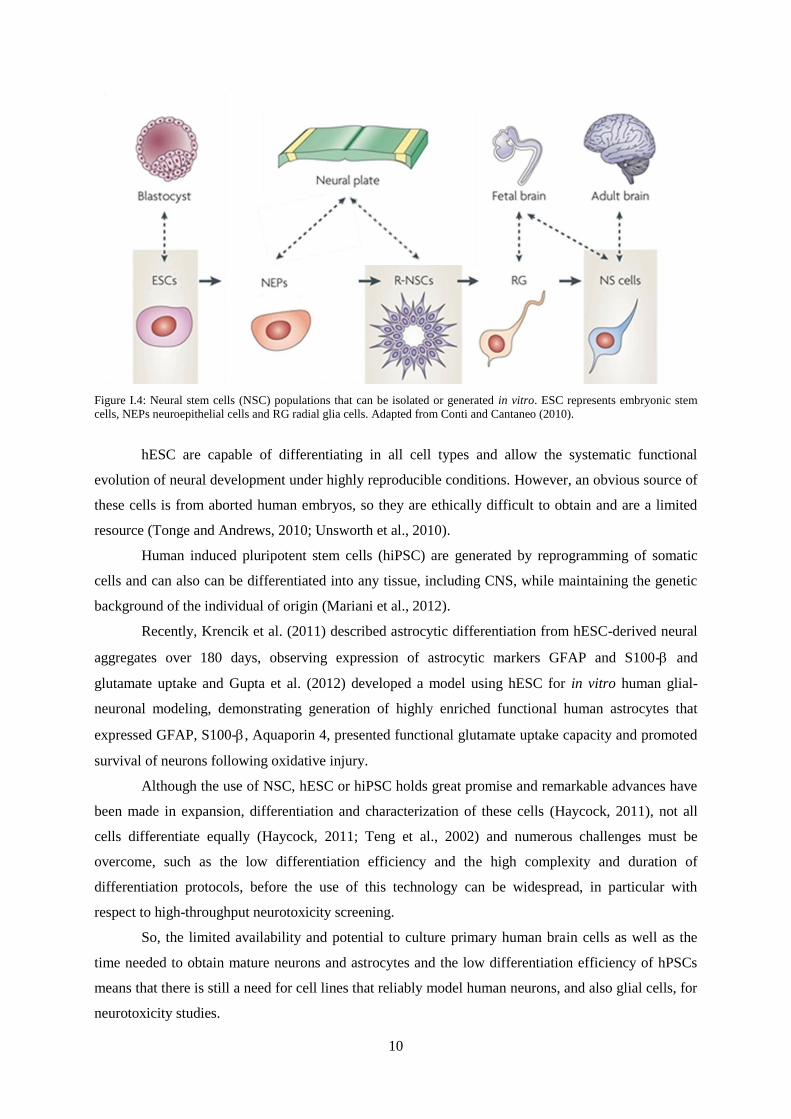
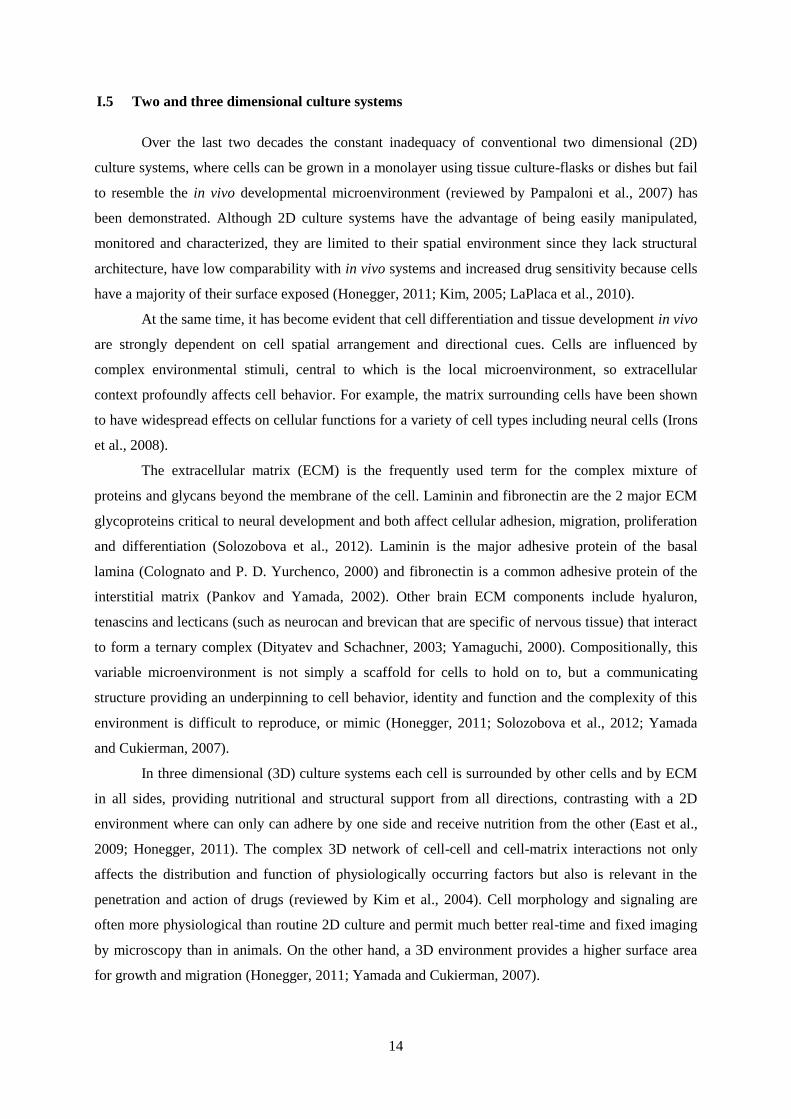
expansion and culturing method (Conti and Cattaneo, 2010; Zhang, 2006). More recently protocols
have been developed for the in vitro derivation of human neural stem cells (hNSC) and, further,
human neurons and astrocytes from human pluripotent stem cells (hPSC), both embryonic and induced
(Conti and Cattaneo, 2010; Krencik et al., 2011; Zhang, 2006) (Fig. I.4).
10
Figure I.4: Neural stem cells (NSC) populations that can be isolated or generated in vitro. ESC represents embryonic stem
cells, NEPs neuroepithelial cells and RG radial glia cells. Adapted from Conti and Cantaneo (2010).
hESC are capable of differentiating in all cell types and allow the systematic functional
evolution of neural development under highly reproducible conditions. However, an obvious source of
these cells is from aborted human embryos, so they are ethically difficult to obtain and are a limited
resource (Tonge and Andrews, 2010; Unsworth et al., 2010).
Human induced pluripotent stem cells (hiPSC) are generated by reprogramming of somatic
cells and can also can be differentiated into any tissue, including CNS, while maintaining the genetic
background of the individual of origin (Mariani et al., 2012).
Recently, Krencik et al. (2011) described astrocytic differentiation from hESC-derived neural
aggregates over 180 days, observing expression of astrocytic markers GFAP and S100- and
glutamate uptake and Gupta et al. (2012) developed a model using hESC for in vitro human glial-
neuronal modeling, demonstrating generation of highly enriched functional human astrocytes that
expressed GFAP, S100-, Aquaporin 4, presented functional glutamate uptake capacity and promoted
survival of neurons following oxidative injury.
Although the use of NSC, hESC or hiPSC holds great promise and remarkable advances have
been made in expansion, differentiation and characterization of these cells (Haycock, 2011), not all
cells differentiate equally (Haycock, 2011; Teng et al., 2002) and numerous challenges must be
overcome, such as the low differentiation efficiency and the high complexity and duration of
differentiation protocols, before the use of this technology can be widespread, in particular with
respect to high-throughput neurotoxicity screening.
So, the limited availability and potential to culture primary human brain cells as well as the
time needed to obtain mature neurons and astrocytes and the low differentiation efficiency of hPSCs
means that there is still a need for cell lines that reliably model human neurons, and also glial cells, for
neurotoxicity studies.
11
I.4 NTera-2/ clone D1 cell line
Immortal PSC and ECC, such as NTera-2 / clone D1 (NT2) cell line can provide an unlimited
number of cells, with less time-consuming and easier differentiation protocols to overcome this
problem (Tonge and Andrews, 2010).
The NT2 cell line, a hEC cell line, represents a promising alternative as it is a homogeneous
pluripotent cell line that closely resembles the human embryonic stem cells derived from the
blastocyst inner cell mass. The NT2/D1 cell line was derived from a xenograph tumor of the
embryonal human teratocarcinoma cell line Tera-2 (Andrews et al., 1984; Ozdener, 2007; Sandhu et
al., 2002) and is considered to be a malignant counterpart of human embryonic stem cells (Pal and
Ravindran, 2006).
NT2 cell line shows potential as a valuable research tool and has been used in a large number
of biomedical investigations in last two decades. This cell line presents the ability to proliferate rapidly
in vitro and differentiate by treatment with retinoic acid (RA) into morphologically distinct cell types,
including neurons (Andrews et al., 1984; Lee and Andrews, 1986; Pleasure and Lee, 1993) and
astrocytes (Bani-Yaghoub et al., 1999; Goodfellow et al., 2011; Sandhu et al., 2002). Additionally,
oligodendrocytes have also been derived from NT2 cells (Pal and Ravindran, 2006).
Retinoic acid is a locally synthesized differentiation factor for the developing nervous system
(McCaffery and Drager, 2000) being a developmentally regulated morphogen that has diverse roles,
including patterning of the hidbrain, motor neuron specification and limb bud patterning (Tonge and
Andrews, 2010). It activates the early events of cell differentiation, which then induce context-specific
programs (McCaffery and Drager, 2000).
Experiments with RA have shown that it can promote the differentiation of a wide variety of
cell lines, including hECC, as well as neuronal precursors or primary stem cell cultures, acting as a
universal differentiation agent (McCaffery and Drager, 2000). Although employed to drive
differentiation of embryonic stem cells to a diverse number of cell types, retinoic acid mediated
differentiation of pluripotent stem cells is most commonly used as a robust approach to differentiate
cells along the neural lineage (Tonge and Andrews, 2010). RA mediated neural differentiation of
hESC and hECC is a multi-step process, whereby RA exposure initially causes pluripotent stem cells
to differentiate and secondly facilitates the cells to acquire a neural phenotype (Tonge and Andrews,
2010).
Recent studies have described pioneering protocols and confirmed the ability of NT2 cells to
differentiate into both neuronal and astrocytic like cells (Goodfellow et al., 2011; Lim et al., 2007;
Ozdener, 2007; Sandhu et al., 2002). Moreover, highly purified neuronal cells or astrocyte-like cells
can be obtained from cultures after purification steps (Lim et al., 2007; Serra et al., 2009), however
although neuronal differentiation is well characterized, astrocytic-like cells are poorly characterized
and protocols are not well defined.
12
In the developmental CNS, the prenatal neurogenesis process is followed by the formation of
astrocytes. It has been found that human NT2 pluripotent cell line differentiate in post-mitotic neurons
first and via a late developmental window give rise to the proliferation of astrocytes, originating
neurons-astrocytes co-cultures and showing similarities with the human in vivo CNS development
(Bani-Yaghoub et al., 1999).
However, NT2 system presents one drawback that is the time needed to generate purified post-
mitotic neurons and astrocytes, which is long, although not to long than the time needed for hPSC
neural differentiation. So, new systems that allow the differentiation of NT2 cell line in a less time-
consuming process are still needed.
i. Neurons derived from NTera-2/ clone D1 cell line
The originally established method of NT2 cell differentiation involves 6 weeks of RA
treatment and 7-10 days of mitotic inhibitors treatment (Pleasure et al., 1992). More recently new
protocols have emerged, in which NT2 cells can generate post-mitotic neurons upon five weeks
treatment with retinoic acid and 7-10 days of mitotic inhibitors treatment (Serra et al., 2007).
Serra and colleagues (2007 and 2009) significantly shortened the time-consuming process for
differentiate NT2 cells into post-mitotic neurons developing a 3D culture system, using stirred tank
culture systems and subsequent purification steps in a total of 23-28 days, which involves 2 days of
expansion, 3 weeks of RA treatment, neurospheres harvesting and 7 days of mitotic inhibitors
treatment, followed by purification of neuronal cells.
Neurons derived from NT2 cell line clearly resemble human fetal primary neurons,
elaborating processes that differentiate into axons and dendrites, expressing immature forms of neuron
specific markers and retaining considerable plasticity when replated multiple times, yet maintaining a
post-mitotic and committed neuronal phenotype (Pleasure et al., 1992). NT2 neurons have a post-
mitotic phenotype such as normal neurons in CNS, since BrdU was not incorporated in nuclei of NT2
neurons after 3 days exposure, whereas it was incorporated into 95.5 ± 0.49% of precursor cells after
4h exposure, under the same conditions (Podrygajlo et al., 2009).
NT2 neuronal cells have been characterized by various laboratories and have been shown to
possess characteristics of primary human neurons in a variety of assays performed, showing that NT2
neurons are an obvious alternative to primary human fetal neuronal cells (Goodfellow et al., 2011;
Sandhu et al., 2003).
Characterization of NT2 neurons identified several neurotransmitter phenotypes, depending on
the culture conditions. Guillemain et al. (2000) detected the GABAergic, catecholaminergic and
cholinergic phenotypes as the predominant and the serotonergic phenotype was also detected but a
minor extent. Moreover, a large number of NT2 neurons could express GABA and another
neurotransmitter or neuropeptide at the same time (Guillemain et al., 2000). Furthermore, Podrygajlo
and colleagues (2009) verified that approximately 40% of the NT2 neurons display glutamatergic
13
markers and a major subset shows immunoreactivity to cholinergic markers, such as choline acetyl-
transferase. Accordingly, Coyle and colleagues (2011) verified that NT2 neurons differentiated under
monolayer culture conditions mainly expressed both GABAergic and glutamatergic phenotypes. On
the other hand, electron microscopy demonstrated that NT2 neurons elaborate classical synaptic
contacts (Guillemain et al., 2000). So, these neurons were capable of forming both glutamatergic
excitatory and GABAergic inhibitory functional synapses (Guillemain et al., 2000). Additionally,
co-culture of NT2 cell line with mouse stromal cell line PA6 or with PA6-conditioned medium allows
for the generation of slightly more functional NT2-derived dopaminergic neurons (Schwartz et al.,
2012).
Moreover, NT2 neurons have been successfully used in transplantation studies in several
mouse models and in phase I clinical trials in human stroke patients and have been shown to
ameliorate motor and cognitive impairment in animal models of ischemic stroke, pioneering cell
therapy applications in CNS (Kondziolka and Wechsler, 2008; Watson et al., 2003).
ii. Astrocytes derived from NTera-2/ clone D1 cell line
NT2 cells can also generate astrocytes, in a later developmental window, upon four weeks
treatment with RA, 6 days of expansion, 4 or 5 weeks treatment with different concentrations of
mitotic inhibitors and one selective trypsinization step (Bani-Yaghoub et al., 1999; Lim et al., 2007).
Astrocytes derived from NT2 cells were found to express GFAP, Conexin 43 and the high
affinity glutamate transporters GLAST and GLT-1, which are reported to be expressed predominantly
on astrocytes (Bani-Yaghoub et al., 1999; Sanchez et al., 2009; Sandhu et al., 2002) but further
characterization of the astrocytes derived from NT2 cells is still lacking.
In mixed cultures NT2 astrocytes support the growth and survival of NT2 neurons,
reproducing the importance of neurons-astrocytes interactions (Sandhu et al., 2002), including
protection of neurons from glutamate excitotoxicity and oxidative stress (Sandhu et al., 2003;
Woehrling et al., 2007). Although, in vivo, astrocytes outnumber neurons by at least 10:1, astrocytes
derived from NT2 cells have been shown to support neuronal function at a ratio of 1:4 in vitro
(Woehrling et al., 2010).
In the presence of astrocytes, NT2 neurons have been shown to remain viable up to 1 year,
whereas without astrocytes they survive no more than 3months (Ozdener, 2007).
As previous referred, astrocytes provide key metabolic and protective support to neurons
during toxic challenge in vivo and generally the astrocyte-containing cell systems showed increased
tolerance to toxicants compared with NT2 neurons mono-culture in vitro (Woehrling et al., 2010),
conducing to a more realistic results when these cells are used and neurotoxicity testing model.
14
I.5 Two and three dimensional culture systems
Over the last two decades the constant inadequacy of conventional two dimensional (2D)
culture systems, where cells can be grown in a monolayer using tissue culture-flasks or dishes but fail
to resemble the in vivo developmental microenvironment (reviewed by Pampaloni et al., 2007) has
been demonstrated. Although 2D culture systems have the advantage of being easily manipulated,
monitored and characterized, they are limited to their spatial environment since they lack structural
architecture, have low comparability with in vivo systems and increased drug sensitivity because cells
have a majority of their surface exposed (Honegger, 2011; Kim, 2005; LaPlaca et al., 2010).
At the same time, it has become evident that cell differentiation and tissue development in vivo
are strongly dependent on cell spatial arrangement and directional cues. Cells are influenced by
complex environmental stimuli, central to which is the local microenvironment, so extracellular
context profoundly affects cell behavior. For example, the matrix surrounding cells have been shown
to have widespread effects on cellular functions for a variety of cell types including neural cells (Irons
et al., 2008).
The extracellular matrix (ECM) is the frequently used term for the complex mixture of
proteins and glycans beyond the membrane of the cell. Laminin and fibronectin are the 2 major ECM
glycoproteins critical to neural development and both affect cellular adhesion, migration, proliferation
and differentiation (Solozobova et al., 2012). Laminin is the major adhesive protein of the basal
lamina (Colognato and P. D. Yurchenco, 2000) and fibronectin is a common adhesive protein of the
interstitial matrix (Pankov and Yamada, 2002). Other brain ECM components include hyaluron,
tenascins and lecticans (such as neurocan and brevican that are specific of nervous tissue) that interact
to form a ternary complex (Dityatev and Schachner, 2003; Yamaguchi, 2000). Compositionally, this
variable microenvironment is not simply a scaffold for cells to hold on to, but a communicating
structure providing an underpinning to cell behavior, identity and function and the complexity of this
environment is difficult to reproduce, or mimic (Honegger, 2011; Solozobova et al., 2012; Yamada
and Cukierman, 2007).
In three dimensional (3D) culture systems each cell is surrounded by other cells and by ECM
in all sides, providing nutritional and structural support from all directions, contrasting with a 2D
environment where can only can adhere by one side and receive nutrition from the other (East et al.,
2009; Honegger, 2011). The complex 3D network of cell-cell and cell-matrix interactions not only
affects the distribution and function of physiologically occurring factors but also is relevant in the
penetration and action of drugs (reviewed by Kim et al., 2004). Cell morphology and signaling are
often more physiological than routine 2D culture and permit much better real-time and fixed imaging
by microscopy than in animals. On the other hand, a 3D environment provides a higher surface area
for growth and migration (Honegger, 2011; Yamada and Cukierman, 2007).
15
Cells, such as human fibroblasts, melanoma cells, stem cells and neuronal cells, growing in 3D
culture environments closely resemble the in vivo situation and present morphology, cell-cell and cell-
matrix interactions, proliferation rates, migration, gene expression, differentiation, cellular signaling or
pathological susceptibility more similar to in vivo than those growing in 2D culture systems
(Cukierman et al., 2002; Hindie et al., 2006; Irons et al., 2008; LaPlaca et al., 2010; Liu et al., 2006 ;
Willerth et al., 2006; Yamada and Cukierman, 2007).
3D culture systems that are able to reproduce or mimic some elements of the ECM have been
developed, using several methods (Honegger, 2011; Yamada and Cukierman, 2007) , including
organotypic slice cultures, gel scaffold cultures, cell microcarriers and spontaneous aggregation of
cells to form 3D spheroids (Haycock, 2011). These vary in terms of cell dispersion and preservation of
tissue function and organization (Kim, 2005; Kim et al., 2004; LaPlaca et al., 2010).
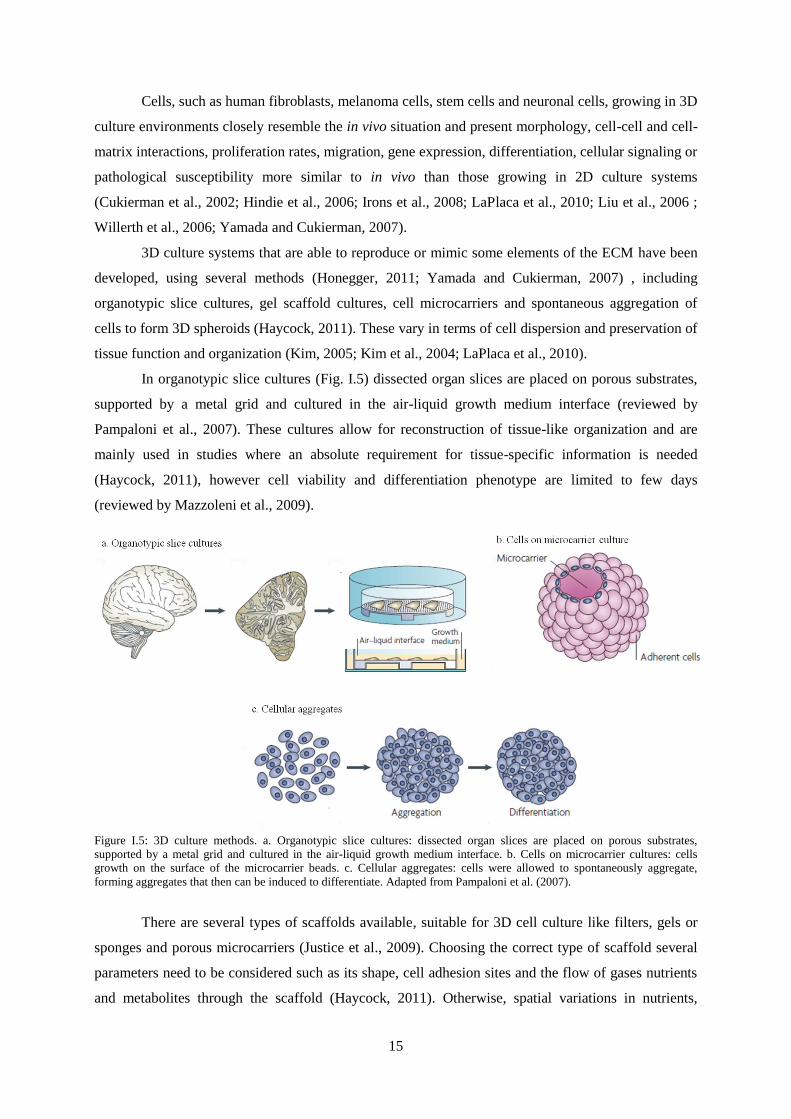
In organotypic slice cultures (Fig. I.5) dissected organ slices are placed on porous substrates,
supported by a metal grid and cultured in the air-liquid growth medium interface (reviewed by
Pampaloni et al., 2007). These cultures allow for reconstruction of tissue-like organization and are
mainly used in studies where an absolute requirement for tissue-specific information is needed
(Haycock, 2011), however cell viability and differentiation phenotype are limited to few days
(reviewed by Mazzoleni et al., 2009).
Figure I.5: 3D culture methods. a. Organotypic slice cultures: dissected organ slices are placed on porous substrates,
supported by a metal grid and cultured in the air-liquid growth medium interface. b. Cells on microcarrier cultures: cells
growth on the surface of the microcarrier beads. c. Cellular aggregates: cells were allowed to spontaneously aggregate,
forming aggregates that then can be induced to differentiate. Adapted from Pampaloni et al. (2007).
There are several types of scaffolds available, suitable for 3D cell culture like filters, gels or
sponges and porous microcarriers (Justice et al., 2009). Choosing the correct type of scaffold several
parameters need to be considered such as its shape, cell adhesion sites and the flow of gases nutrients
and metabolites through the scaffold (Haycock, 2011). Otherwise, spatial variations in nutrients,
16
oxygen and metabolites concentrations may exist and modify cell behavior randomly through the
scaffold (reviewed Mazzoleni et al., 2009).
Filter well inserts are devices that hold a filter membrane in a culture vessel of choice,
allowing for an upper compartment and lower compartment on either side and were one of the first
technologies that began to approach a 3D-like exposure of cells to a substrate, by allowing all
membrane sides to interact with the environment and also allowing for the study of both surfaces of a
cell monolayer (Justice et al., 2009). Filter well inserts come in a vast array of formats, sizes, coatings
and pore sizes, depending on the cell type used and the assay performed (Justice et al., 2009).
Scaffolds as gels and sponges use purified ECM molecules and biopolymers to recreate in vivo
cues for cells. Most common gels are gelatin, collagen and laminin and sponges are generally
lyophilized gels with large pores for cellular microenvironments (Justice et al., 2009). The scaffold
based culture systems are gaining popularity as the 3D matrix is used to promote multilayer growth of
cells and as cells divide they fill the interstices within the scaffold to form a 3D culture (reviewed by
Kim, 2005). Although scaffolds present a great potential in recreating the natural physical and
structural environment of living tissues, the constituents of the scaffold can profoundly affect the
properties of the culture (Tan et al., 2001) and these culture methods are difficult to control in terms of
diffusion of gases and nutrients (reviewed by Serra et al., 2012).
Microcarriers are small spheres (Fig. I.5), typically with less than 500µm in diameter, which
can be porous or non porous and whose enormous surface area of up to 500cm2/g allow for culture
large numbers of cells in small volumes (Justice et al., 2009). Cells on the surface of non porous
microcarriers assume a configuration suchlike to that in 2D monolayers and cell damage due to
physical forces can occur (Kehoe et al., 2010; Serra et al., 2012). In porous microcarriers cells can
grow in a 3D environment nevertheless, limited mass and gas diffusion inside the pores can occur
(reviewed by Serra et al., 2012). Moreover, microcarriers can be customized, for example by attaching
various synthetic peptides or ECM molecules, such as collagen or laminin, to accommodate the
adhesion needs of diverse cell types (Justice et al., 2009; Kehoe et al., 2010). The primary advantages
of microcarriers is that they support the aggregation of anchorage dependent cells and cell lines which
do not spontaneously aggregate, providing an effective vehicle to promote the culture of these cells.
However this approach also has some disadvantages including adhesion of microcarriers to each other
and formation of larger spheroid-like structures and additional operating costs due to material costs
(reviewed by Kim, 2005; Serra et al., 2012). Conventionally, microcarrier bead cultures involve
growth in stirred tank vessels to assist in mixing and provision of nutrients.
Although 3D cell cultures can be generated by culturing cells on artificial substrates, as
previous referred, spontaneous cell aggregation can also be exploited (Fig. I.5) generating more or less
spherical cellular 3D aggregates where cells can be grown maintaining cellular function and inducing
cellular differentiation, also allowing to obtain cultures in a more in vivo-like environment (reviewed
by Kim et al., 2004).
17
Neural cells can be propagated as floating cell aggregates, called neurospheres which contain
progenitors mixed with differentiated cells embedded in a complex extracellular matrix (Rodrigues et
al., 2011). The tissue-specific environment within the aggregates enables the cells to interact in a
physiological manner by physical contacts as well as by the exchange of soluble messengers and
metabolites. Intrinsic factors enable extensive cellular differentiation and the formation of hystotypic
structures, such as extracellular matrix, mature synapses, functional neuronal networks and myelinated
axons (Honegger, 2011). In vivo-like cell-cell interactions may lead to increase cellular survival and
more realistic gene expression and cellular behavior. For example, it has been shown that neurons
differentiated from brain neural stem cells are viable longer when grown in 3D cultures than in
monolayer cultures (LaPlaca et al., 2010). Furthermore, 3D cultures have been shown to result in
longer neurite outgrowth, higher levels of survival and different patterns of differentiation when
compared with 2D monolayers (LaPlaca et al., 2010).
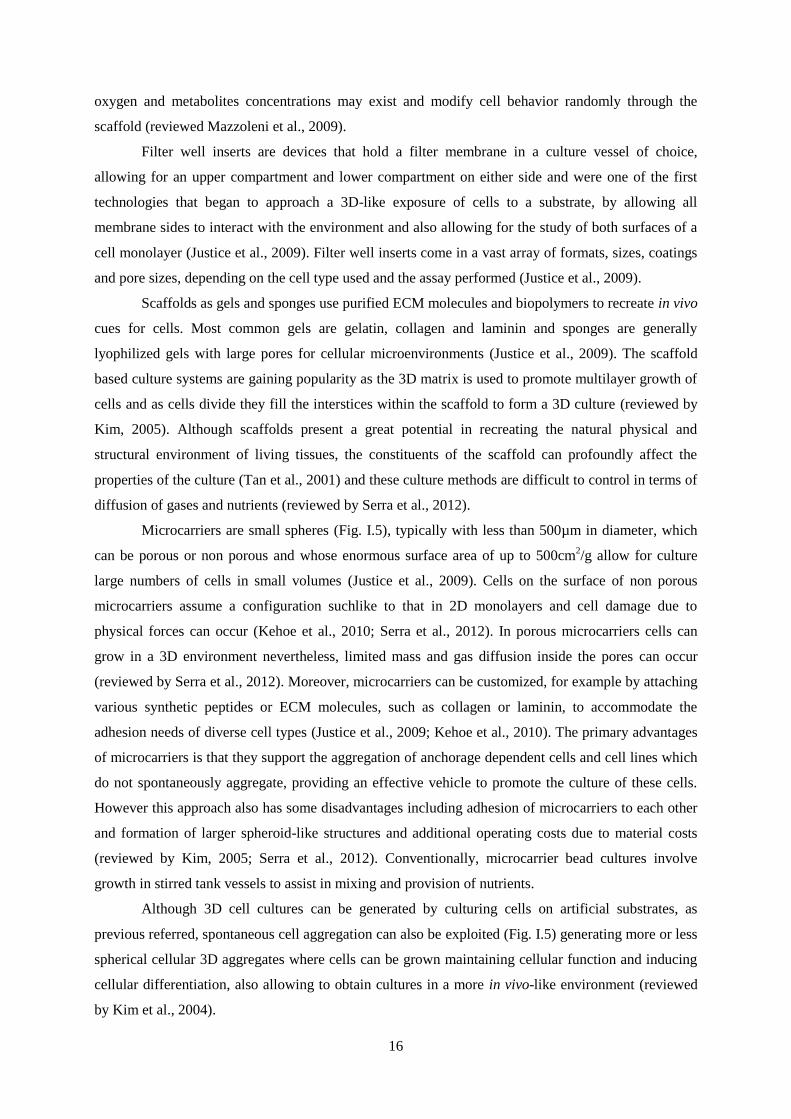
In 3D culture of neural cells neurites are able to extend in all directions (Fig. I.6) and these
systems are able to reconstitute spontaneously a histotypic brain architecture to reach a high level of
structural and functional maturity (Honegger, 2011; LaPlaca et al., 2010).
Figure I.6: Neuronal cultures in 2D (left) and 3D (right). Neurons in 2D have flattened morphology, while neurons in 3D
presented round morphology with cell interactions possible in all spatial dimensions. Adapted from LaPlaca et al. (2010).
Primary rat brain neurons and astrocytes can be grown and long-term maintained under 3D
conditions (Santos et al., 2005) and this culture method proved to be a very valuable tool for
interpretation and confirmation of detailed events of cellular metabolism through the different
developmental stages of brain aggregate cultures (Santos et al., 2007).
Furthermore, in cultures of primary astrocytes changing from conventional 2D monolayer to a
3D setting leads to downregulation of astrocytic activation markers, indicating that astrocytes in 3D
are less reactive than their 2D counterparts, thus resembling the physiologically in vivo situation (East
et al., 2009).
18
Despite research with neurospheres has largely focused on their application for
neuroregeneration in diseases of the central nervous system, a few studies have also utilized
neurospheres for toxicity studies in vitro, by analyzing a variety of endpoints such as viability,
proliferation, migration, differentiation, neurite outgrowth and apoptosis, providing support for their
use in hazard identification for chemicals that may cause neurotoxicity (Breier et al., 2010)
However, 3D aggregate cultures have some limitations, such as diffusion limitations of
nutrients and oxygen through the aggregates, which increase with density and size of the aggregates
and accumulation of toxic byproducts in the center of aggregates with higher diameters, which might
affect cell viability, proliferation and gene expression (Irons et al., 2008; LaPlaca et al., 2010). In
addition, 3D cultures typically are randomly oriented, varying in their ability to mimic in vivo tissue
conditions, since several tissue architectures are difficult to reproduce. Nonetheless, the potential
advantages warrant the use of 3D cultures rather than glass or plastic support, as cell respond
differently depending on the extracellular mechanical properties (Irons et al., 2008; LaPlaca et al.,
2010).
Nonetheless, until the moment, 3D cell culture systems have failed to be widely adopted
because automated methods do not yet exist. Until recently the reality was that 2D cultures are
entrenched within the drug testing infrastructure creating a challenge to introducing 3D culture
methods (Justice et al., 2009).
I.6 Stirred culture systems
In the past years, with the recent advances in engineering, 3D culture systems have proved to
be crucial tools to initiate, maintain and differentiate cells in larger quantities as a result of greater
control over culture composition that is physic-chemically defined, availability of new culture systems
where culture conditions can be monitored and tightly controlled and greater choice in the method of
inducing 3D growth (Kasper et al., 2009).
For cells to growth as 3D aggregates conditions in which the adhesive forces between the cells
are greater than for the substrate where cells are plated on are required. The simplest way to achieve
these conditions is by using static matrix cultures or liquid overlay techniques in static culture systems,
which prevents matrix deposition and where no shear stress exist. Although spheroids generated in
liquid overlay cultures maintain the cellular composition and differentiation of intact tissue, mass
transfer and cell survival are limited (reviewed by Mazzoleni et al., 2009).
Alternative methods to grow cells as aggregates are gyratory rotation techniques, using
gyratory shakers, rotary culture systems and stirred suspension culture systems such as spinner-flasks
or controlled stirred tank bioreactors.
Gyratory rotation techniques involves placing a cell suspension of specific concentration in an
Erlenmeyer flask containing a specific amount of media and this flask is rotated is a gyratory rotation
19
incubator until spheroids of required size be produced (reviewed by Kim et al., 2004; Mazzoleni et al.,
2009).
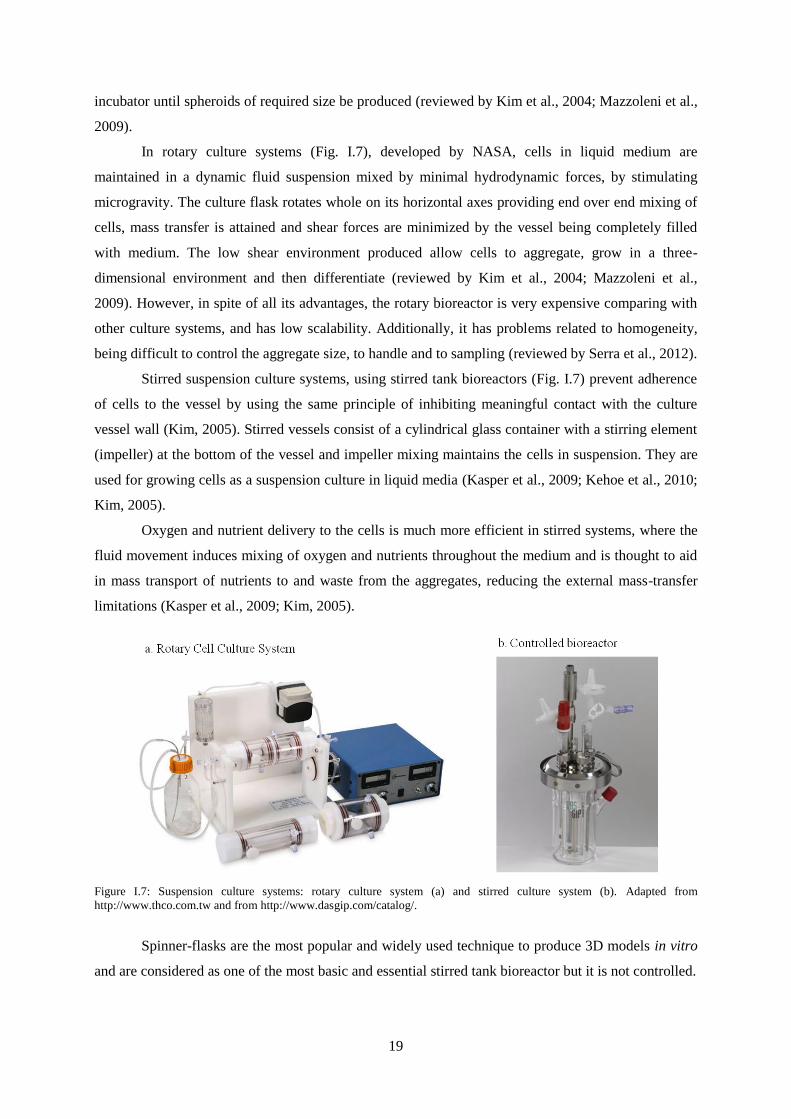
In rotary culture systems (Fig. I.7), developed by NASA, cells in liquid medium are
maintained in a dynamic fluid suspension mixed by minimal hydrodynamic forces, by stimulating
microgravity. The culture flask rotates whole on its horizontal axes providing end over end mixing of
cells, mass transfer is attained and shear forces are minimized by the vessel being completely filled
with medium. The low shear environment produced allow cells to aggregate, grow in a three-
dimensional environment and then differentiate (reviewed by Kim et al., 2004; Mazzoleni et al.,
2009). However, in spite of all its advantages, the rotary bioreactor is very expensive comparing with
other culture systems, and has low scalability. Additionally, it has problems related to homogeneity,
being difficult to control the aggregate size, to handle and to sampling (reviewed by Serra et al., 2012).
Stirred suspension culture systems, using stirred tank bioreactors (Fig. I.7) prevent adherence
of cells to the vessel by using the same principle of inhibiting meaningful contact with the culture
vessel wall (Kim, 2005). Stirred vessels consist of a cylindrical glass container with a stirring element
(impeller) at the bottom of the vessel and impeller mixing maintains the cells in suspension. They are
used for growing cells as a suspension culture in liquid media (Kasper et al., 2009; Kehoe et al., 2010;
Kim, 2005).
Oxygen and nutrient delivery to the cells is much more efficient in stirred systems, where the
fluid movement induces mixing of oxygen and nutrients throughout the medium and is thought to aid
in mass transport of nutrients to and waste from the aggregates, reducing the external mass-transfer
limitations (Kasper et al., 2009; Kim, 2005).
Figure I.7: Suspension culture systems: rotary culture system (a) and stirred culture system (b). Adapted from
http://www.thco.com.tw and from http://www.dasgip.com/catalog/.
Spinner-flasks are the most popular and widely used technique to produce 3D models in vitro
and are considered as one of the most basic and essential stirred tank bioreactor but it is not controlled.
20
On the other hand, computer controlled stirred tank bioreactors have a simple design, can be scaled-up
and are generally defined as devices in which biological and/or biochemical processes can be
developed under closely monitored and tightly controlled environmental and operating conditions,
allowing monitor and control of parameters such as mixing, pH, temperature, oxygen, pressure,
nutrient supply and waste removal (Hutmacher and Singh, 2008).
One noteworthy factor heavily hindering homeostatic control in cell culture systems is the
abrupt change in the concentration of metabolites, catabolites, signal molecules and pH when the
culture medium is exchanged in periodic batches. In traditional static culture procedures, this effect
can be avoided performing partial medium changes, however requiring additional repeated manpower
involvement.
Bioreactor technology also offers the option of work in a perfusion mode, which is the better
solution by enabling either semi-continuous automatic replenishment of exhausted media at defined
time-points or feedback-controlled addition of fresh media, aimed to re-establishing a homeostatic
parameter to a pre-defined set point (Kasper et al., 2009).
Due to tight control of culture variables stirred tank bioreactors present a high level of
reproducibility between experiments and allow for easy-sampling and better homogeneity of cultures
(Martin et al., 2004; Rodrigues et al., 2011).
Furthermore, control and automation introduced by bioreactors for specific experimental
bioprocess allow for transfer to large-scale applications (Martin et al., 2004).
Bioreactors represent not only powerful technical tools to support and direct the in vitro
development of living, functional tissues, but also dynamic culture model systems to study
fundamental mechanisms of cell functions and reactions to neurotoxicants under physiologically
relevant conditions (Kasper et al., 2009).
Further, stirred tank culture systems provide the culture of cells using several culture strategies
including aggregates, microcarriers or scaffolds and, most important, stirred suspension bioreactors are
heavily utilized in the biotechnology industry. Hence, systems developed around this bioreactor type
may be easier to translate to a commercial production setting than entirely novel designs (Kehoe et al.,
2010).
Summarizing, the core principles for stirred tank bioreactors are: maintaining sterility, good
mass transfer, suitable for scale-up, reproducibility of samples, controlled metabolic environment and
ability to impose physiologically relevant mechanical stimulation to cells.
Biotechnological advances in suspension culture systems that exploit cell-cell and cell-matrix
interactions, adequate for neural cells namely small scale bioreactors and low shear-stress impellers
had been advantageous for the implementation of novel in vitro models for neurotoxicity research
(Irons et al., 2008).
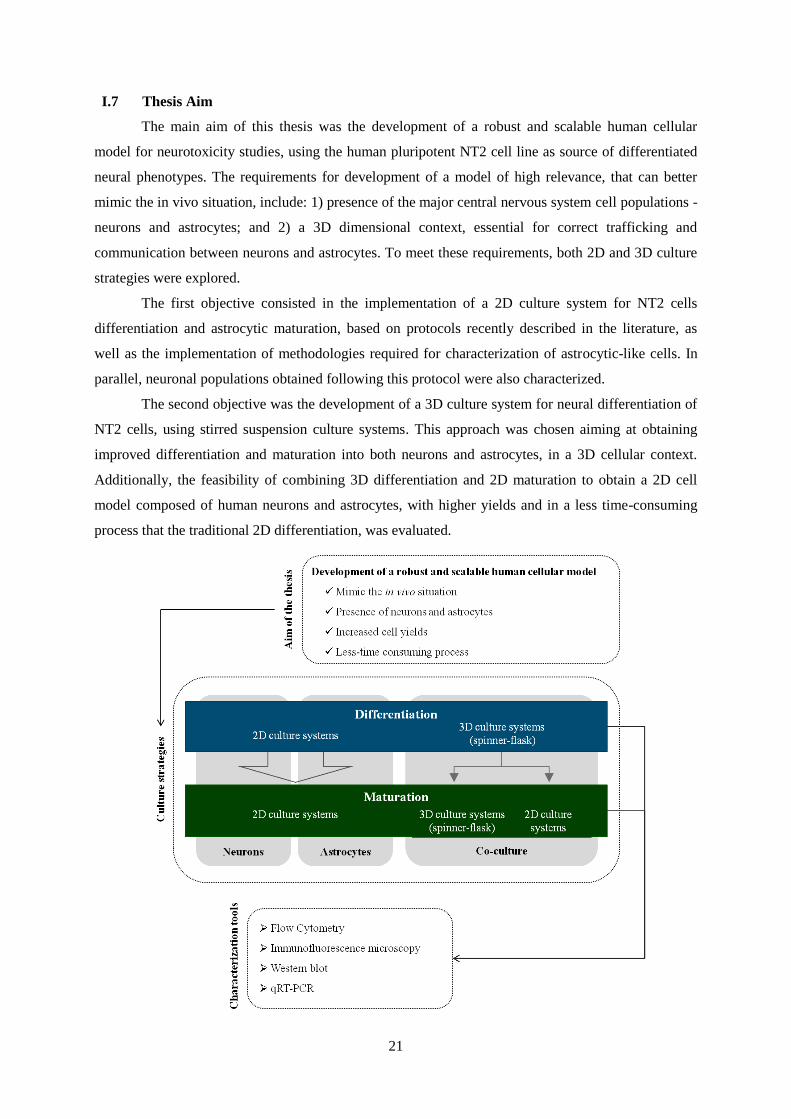
21
I.7 Thesis Aim
The main aim of this thesis was the development of a robust and scalable human cellular
model for neurotoxicity studies, using the human pluripotent NT2 cell line as source of differentiated
neural phenotypes. The requirements for development of a model of high relevance, that can better
mimic the in vivo situation, include: 1) presence of the major central nervous system cell populations -
neurons and astrocytes; and 2) a 3D dimensional context, essential for correct trafficking and
communication between neurons and astrocytes. To meet these requirements, both 2D and 3D culture
strategies were explored.
The first objective consisted in the implementation of a 2D culture system for NT2 cells
differentiation and astrocytic maturation, based on protocols recently described in the literature, as
well as the implementation of methodologies required for characterization of astrocytic-like cells. In
parallel, neuronal populations obtained following this protocol were also characterized.
The second objective was the development of a 3D culture system for neural differentiation of
NT2 cells, using stirred suspension culture systems. This approach was chosen aiming at obtaining
improved differentiation and maturation into both neurons and astrocytes, in a 3D cellular context.
Additionally, the feasibility of combining 3D differentiation and 2D maturation to obtain a 2D cell
model composed of human neurons and astrocytes, with higher yields and in a less time-consuming
process that the traditional 2D differentiation, was evaluated.

22
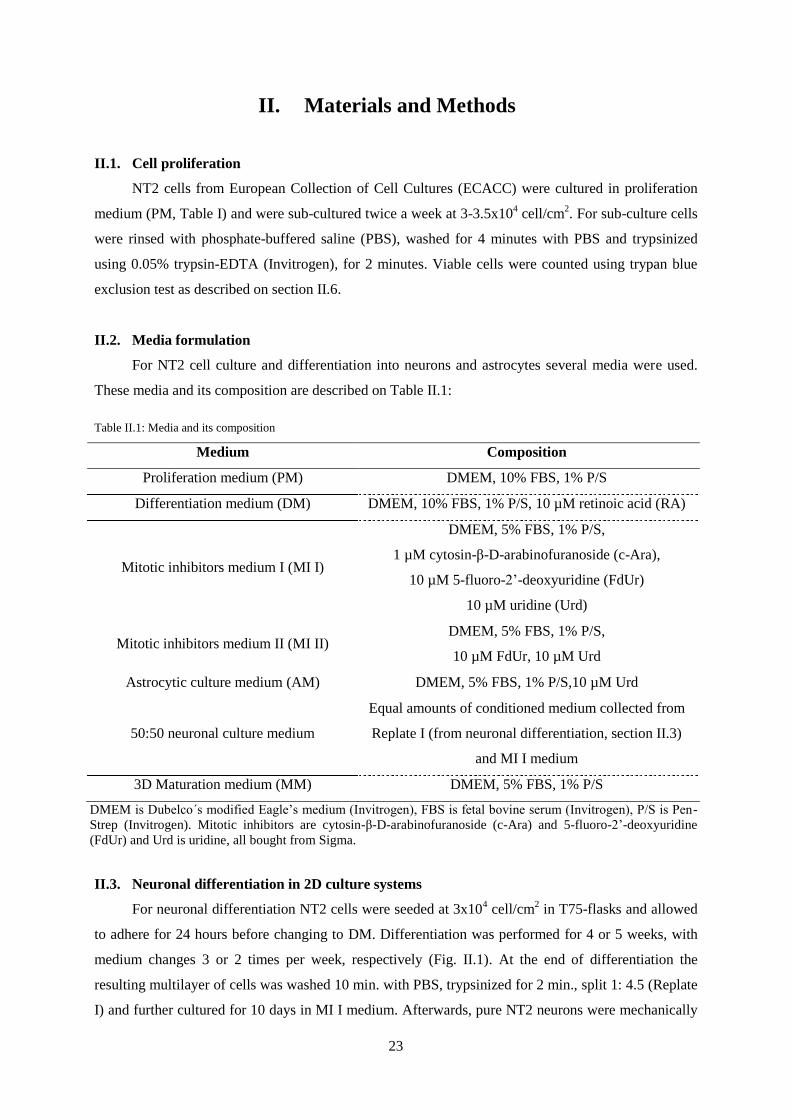
23
II. Materials and Methods
II.1. Cell proliferation
NT2 cells from European Collection of Cell Cultures (ECACC) were cultured in proliferation
medium (PM, Table I) and were sub-cultured twice a week at 3-3.5x10⁴ cell/cm
2. For sub-culture cells
were rinsed with phosphate-buffered saline (PBS), washed for 4 minutes with PBS and trypsinized
using 0.05% trypsin-EDTA (Invitrogen), for 2 minutes. Viable cells were counted using trypan blue
exclusion test as described on section II.6.
II.2. Media formulation
For NT2 cell culture and differentiation into neurons and astrocytes several media were used.
These media and its composition are described on Table II.1:
Table II.1: Media and its composition
Medium Composition
Proliferation medium (PM) DMEM, 10% FBS, 1% P/S
Differentiation medium (DM) DMEM, 10% FBS, 1% P/S, 10 µM retinoic acid (RA)
Mitotic inhibitors medium I (MI I)
DMEM, 5% FBS, 1% P/S,
1 µM cytosin-β-D-arabinofuranoside (c-Ara),
10 µM 5-fluoro-2’-deoxyuridine (FdUr)
10 µM uridine (Urd)
Mitotic inhibitors medium II (MI II) DMEM, 5% FBS, 1% P/S,
10 µM FdUr, 10 µM Urd
Astrocytic culture medium (AM) DMEM, 5% FBS, 1% P/S,10 µM Urd
50:50 neuronal culture medium
Equal amounts of conditioned medium collected from
Replate I (from neuronal differentiation, section II.3)
and MI I medium
3D Maturation medium (MM) DMEM, 5% FBS, 1% P/S
DMEM is Dubelco´s modified Eagle’s medium (Invitrogen), FBS is fetal bovine serum (Invitrogen), P/S is Pen-
Strep (Invitrogen). Mitotic inhibitors are cytosin-β-D-arabinofuranoside (c-Ara) and 5-fluoro-2’-deoxyuridine
(FdUr) and Urd is uridine, all bought from Sigma.
II.3. Neuronal differentiation in 2D culture systems
For neuronal differentiation NT2 cells were seeded at 3x10⁴ cell/cm
2 in T75-flasks and allowed
to adhere for 24 hours before changing to DM. Differentiation was performed for 4 or 5 weeks, with
medium changes 3 or 2 times per week, respectively (Fig. II.1). At the end of differentiation the
resulting multilayer of cells was washed 10 min. with PBS, trypsinized for 2 min., split 1: 4.5 (Replate
I) and further cultured for 10 days in MI I medium. Afterwards, pure NT2 neurons were mechanically
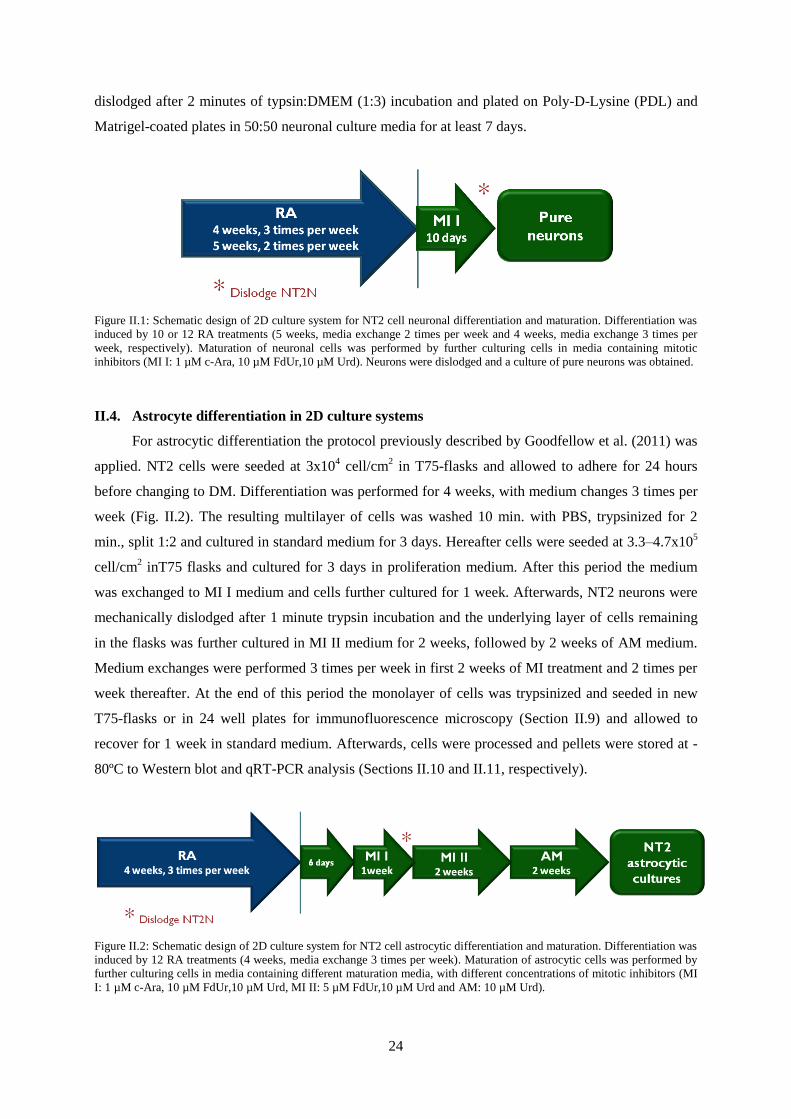
24
dislodged after 2 minutes of typsin:DMEM (1:3) incubation and plated on Poly-D-Lysine (PDL) and
Matrigel-coated plates in 50:50 neuronal culture media for at least 7 days.
Figure II.1: Schematic design of 2D culture system for NT2 cell neuronal differentiation and maturation. Differentiation was
induced by 10 or 12 RA treatments (5 weeks, media exchange 2 times per week and 4 weeks, media exchange 3 times per
week, respectively). Maturation of neuronal cells was performed by further culturing cells in media containing mitotic
inhibitors (MI I: 1 µM c-Ara, 10 µM FdUr,10 µM Urd). Neurons were dislodged and a culture of pure neurons was obtained.
II.4. Astrocyte differentiation in 2D culture systems
For astrocytic differentiation the protocol previously described by Goodfellow et al. (2011) was
applied. NT2 cells were seeded at 3x10⁴ cell/cm
2 in T75-flasks and allowed to adhere for 24 hours
before changing to DM. Differentiation was performed for 4 weeks, with medium changes 3 times per
week (Fig. II.2). The resulting multilayer of cells was washed 10 min. with PBS, trypsinized for 2
min., split 1:2 and cultured in standard medium for 3 days. Hereafter cells were seeded at 3.3–4.7x10⁵
cell/cm2 inT75 flasks and cultured for 3 days in proliferation medium. After this period the medium
was exchanged to MI I medium and cells further cultured for 1 week. Afterwards, NT2 neurons were
mechanically dislodged after 1 minute trypsin incubation and the underlying layer of cells remaining
in the flasks was further cultured in MI II medium for 2 weeks, followed by 2 weeks of AM medium.
Medium exchanges were performed 3 times per week in first 2 weeks of MI treatment and 2 times per
week thereafter. At the end of this period the monolayer of cells was trypsinized and seeded in new
T75-flasks or in 24 well plates for immunofluorescence microscopy (Section II.9) and allowed to
recover for 1 week in standard medium. Afterwards, cells were processed and pellets were stored at -
80ºC to Western blot and qRT-PCR analysis (Sections II.10 and II.11, respectively).
Figure II.2: Schematic design of 2D culture system for NT2 cell astrocytic differentiation and maturation. Differentiation was
induced by 12 RA treatments (4 weeks, media exchange 3 times per week). Maturation of astrocytic cells was performed by
further culturing cells in media containing different maturation media, with different concentrations of mitotic inhibitors (MI
I: 1 µM c-Ara, 10 µM FdUr,10 µM Urd, MI II: 5 µM FdUr,10 µM Urd and AM: 10 µM Urd).
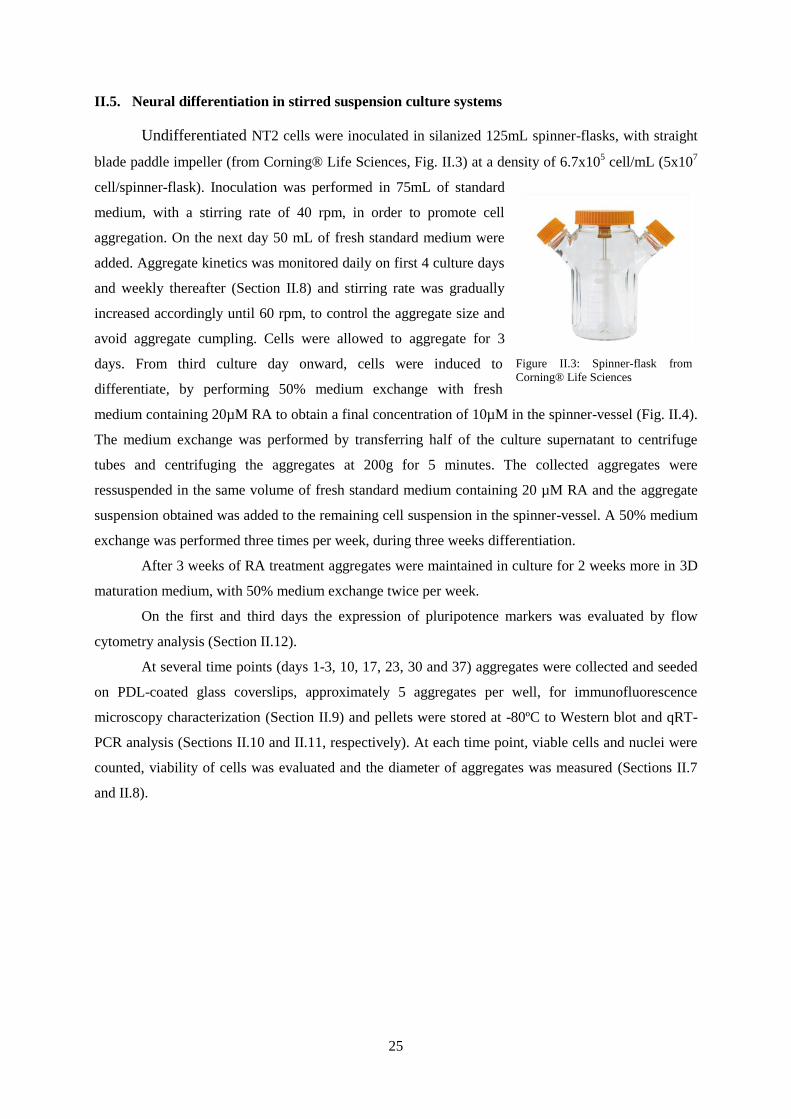
25
II.5. Neural differentiation in stirred suspension culture systems
Undifferentiated NT2 cells were inoculated in silanized 125mL spinner-flasks, with straight
blade paddle impeller (from Corning® Life Sciences, Fig. II.3) at a density of 6.7x10⁵ cell/mL (5x10
7
cell/spinner-flask). Inoculation was performed in 75mL of standard
medium, with a stirring rate of 40 rpm, in order to promote cell
aggregation. On the next day 50 mL of fresh standard medium were
added. Aggregate kinetics was monitored daily on first 4 culture days
and weekly thereafter (Section II.8) and stirring rate was gradually
increased accordingly until 60 rpm, to control the aggregate size and
avoid aggregate cumpling. Cells were allowed to aggregate for 3
days. From third culture day onward, cells were induced to
differentiate, by performing 50% medium exchange with fresh
medium containing 20µM RA to obtain a final concentration of 10µM in the spinner-vessel (Fig. II.4).
The medium exchange was performed by transferring half of the culture supernatant to centrifuge
tubes and centrifuging the aggregates at 200g for 5 minutes. The collected aggregates were
ressuspended in the same volume of fresh standard medium containing 20 µM RA and the aggregate
suspension obtained was added to the remaining cell suspension in the spinner-vessel. A 50% medium
exchange was performed three times per week, during three weeks differentiation.
After 3 weeks of RA treatment aggregates were maintained in culture for 2 weeks more in 3D
maturation medium, with 50% medium exchange twice per week.
On the first and third days the expression of pluripotence markers was evaluated by flow
cytometry analysis (Section II.12).
At several time points (days 1-3, 10, 17, 23, 30 and 37) aggregates were collected and seeded
on PDL-coated glass coverslips, approximately 5 aggregates per well, for immunofluorescence
microscopy characterization (Section II.9) and pellets were stored at -80ºC to Western blot and qRT-
PCR analysis (Sections II.10 and II.11, respectively). At each time point, viable cells and nuclei were
counted, viability of cells was evaluated and the diameter of aggregates was measured (Sections II.7
and II.8).
Figure II.3: Spinner-flask from
Corning® Life Sciences
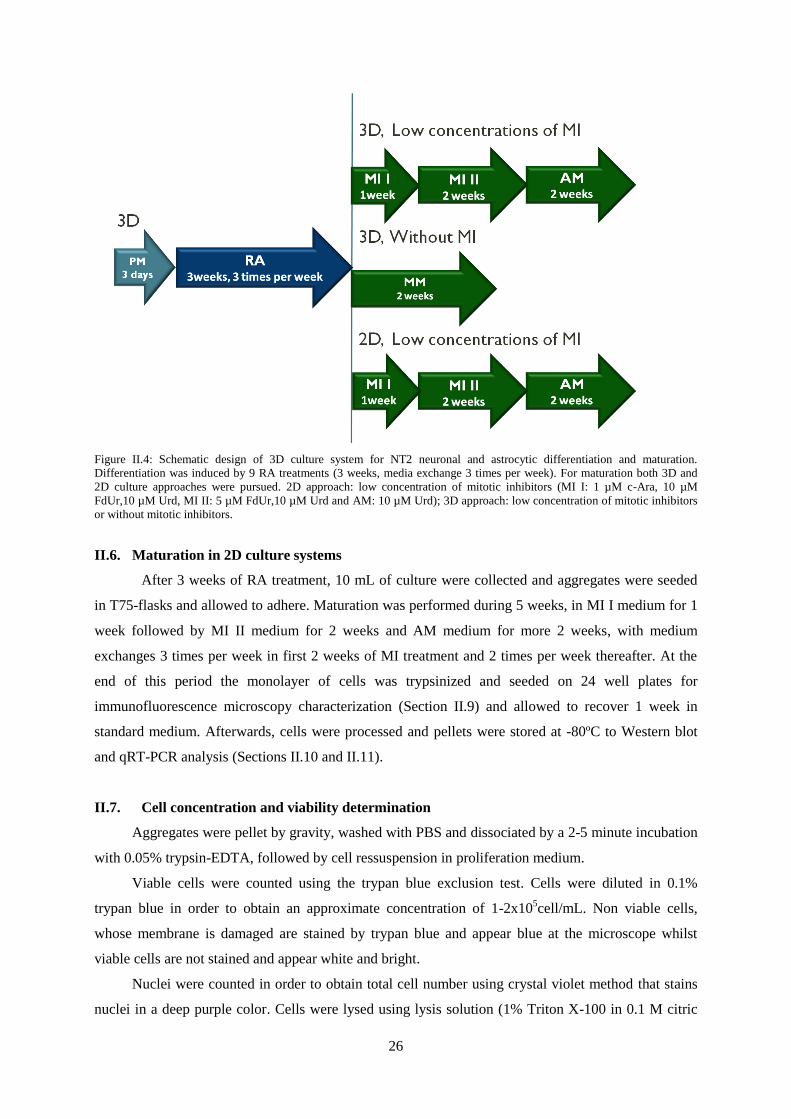
26
Figure II.4: Schematic design of 3D culture system for NT2 neuronal and astrocytic differentiation and maturation.
Differentiation was induced by 9 RA treatments (3 weeks, media exchange 3 times per week). For maturation both 3D and
2D culture approaches were pursued. 2D approach: low concentration of mitotic inhibitors (MI I: 1 µM c-Ara, 10 µM
FdUr,10 µM Urd, MI II: 5 µM FdUr,10 µM Urd and AM: 10 µM Urd); 3D approach: low concentration of mitotic inhibitors
or without mitotic inhibitors.
II.6. Maturation in 2D culture systems
After 3 weeks of RA treatment, 10 mL of culture were collected and aggregates were seeded
in T75-flasks and allowed to adhere. Maturation was performed during 5 weeks, in MI I medium for 1
week followed by MI II medium for 2 weeks and AM medium for more 2 weeks, with medium
exchanges 3 times per week in first 2 weeks of MI treatment and 2 times per week thereafter. At the
end of this period the monolayer of cells was trypsinized and seeded on 24 well plates for
immunofluorescence microscopy characterization (Section II.9) and allowed to recover 1 week in
standard medium. Afterwards, cells were processed and pellets were stored at -80ºC to Western blot
and qRT-PCR analysis (Sections II.10 and II.11).
II.7. Cell concentration and viability determination
Aggregates were pellet by gravity, washed with PBS and dissociated by a 2-5 minute incubation
with 0.05% trypsin-EDTA, followed by cell ressuspension in proliferation medium.
Viable cells were counted using the trypan blue exclusion test. Cells were diluted in 0.1%
trypan blue in order to obtain an approximate concentration of 1-2x10⁵cell/mL. Non viable cells,
whose membrane is damaged are stained by trypan blue and appear blue at the microscope whilst
viable cells are not stained and appear white and bright.
Nuclei were counted in order to obtain total cell number using crystal violet method that stains
nuclei in a deep purple color. Cells were lysed using lysis solution (1% Triton X-100 in 0.1 M citric
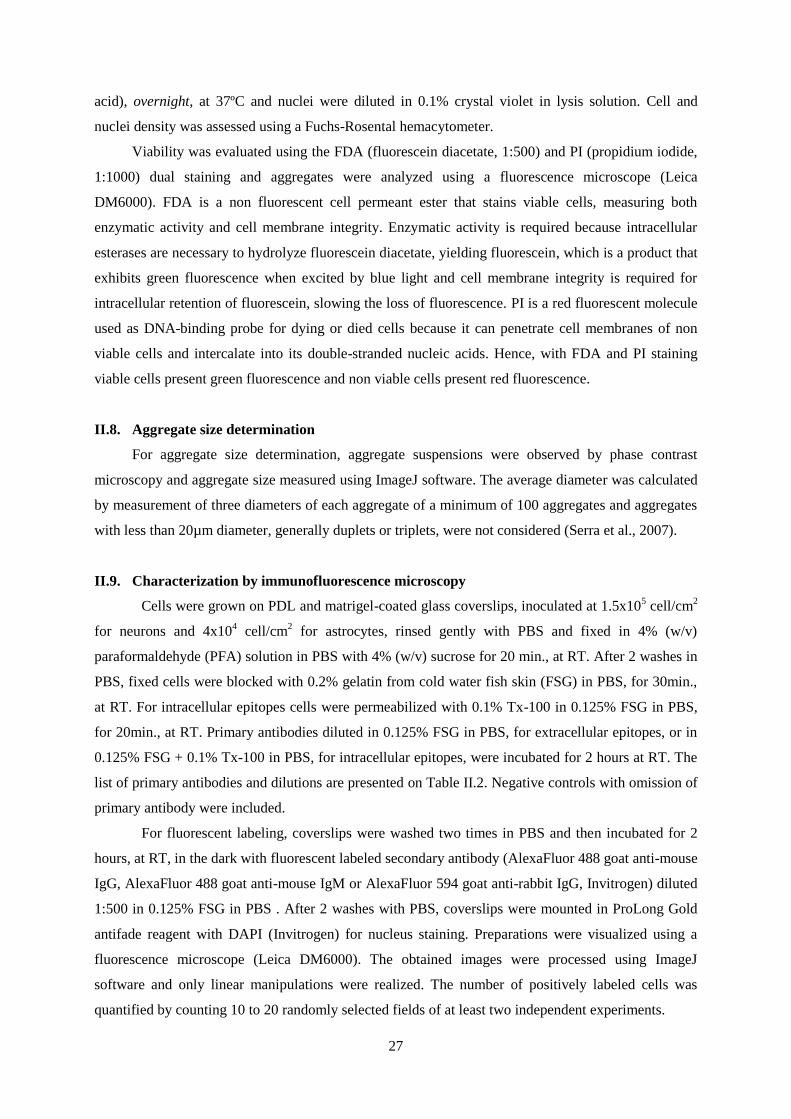
27
acid), overnight, at 37ºC and nuclei were diluted in 0.1% crystal violet in lysis solution. Cell and
nuclei density was assessed using a Fuchs-Rosental hemacytometer.
Viability was evaluated using the FDA (fluorescein diacetate, 1:500) and PI (propidium iodide,
1:1000) dual staining and aggregates were analyzed using a fluorescence microscope (Leica
DM6000). FDA is a non fluorescent cell permeant ester that stains viable cells, measuring both
enzymatic activity and cell membrane integrity. Enzymatic activity is required because intracellular
esterases are necessary to hydrolyze fluorescein diacetate, yielding fluorescein, which is a product that
exhibits green fluorescence when excited by blue light and cell membrane integrity is required for
intracellular retention of fluorescein, slowing the loss of fluorescence. PI is a red fluorescent molecule
used as DNA-binding probe for dying or died cells because it can penetrate cell membranes of non
viable cells and intercalate into its double-stranded nucleic acids. Hence, with FDA and PI staining
viable cells present green fluorescence and non viable cells present red fluorescence.
II.8. Aggregate size determination
For aggregate size determination, aggregate suspensions were observed by phase contrast
microscopy and aggregate size measured using ImageJ software. The average diameter was calculated
by measurement of three diameters of each aggregate of a minimum of 100 aggregates and aggregates
with less than 20µm diameter, generally duplets or triplets, were not considered (Serra et al., 2007).
II.9. Characterization by immunofluorescence microscopy
Cells were grown on PDL and matrigel-coated glass coverslips, inoculated at 1.5x10⁵ cell/cm
2
for neurons and 4x10⁴ cell/cm
2 for astrocytes, rinsed gently with PBS and fixed in 4% (w/v)
paraformaldehyde (PFA) solution in PBS with 4% (w/v) sucrose for 20 min., at RT. After 2 washes in
PBS, fixed cells were blocked with 0.2% gelatin from cold water fish skin (FSG) in PBS, for 30min.,
at RT. For intracellular epitopes cells were permeabilized with 0.1% Tx-100 in 0.125% FSG in PBS,
for 20min., at RT. Primary antibodies diluted in 0.125% FSG in PBS, for extracellular epitopes, or in
0.125% FSG + 0.1% Tx-100 in PBS, for intracellular epitopes, were incubated for 2 hours at RT. The
list of primary antibodies and dilutions are presented on Table II.2. Negative controls with omission of
primary antibody were included.
For fluorescent labeling, coverslips were washed two times in PBS and then incubated for 2
hours, at RT, in the dark with fluorescent labeled secondary antibody (AlexaFluor 488 goat anti-mouse
IgG, AlexaFluor 488 goat anti-mouse IgM or AlexaFluor 594 goat anti-rabbit IgG, Invitrogen) diluted
1:500 in 0.125% FSG in PBS . After 2 washes with PBS, coverslips were mounted in ProLong Gold
antifade reagent with DAPI (Invitrogen) for nucleus staining. Preparations were visualized using a
fluorescence microscope (Leica DM6000). The obtained images were processed using ImageJ
software and only linear manipulations were realized. The number of positively labeled cells was
quantified by counting 10 to 20 randomly selected fields of at least two independent experiments.
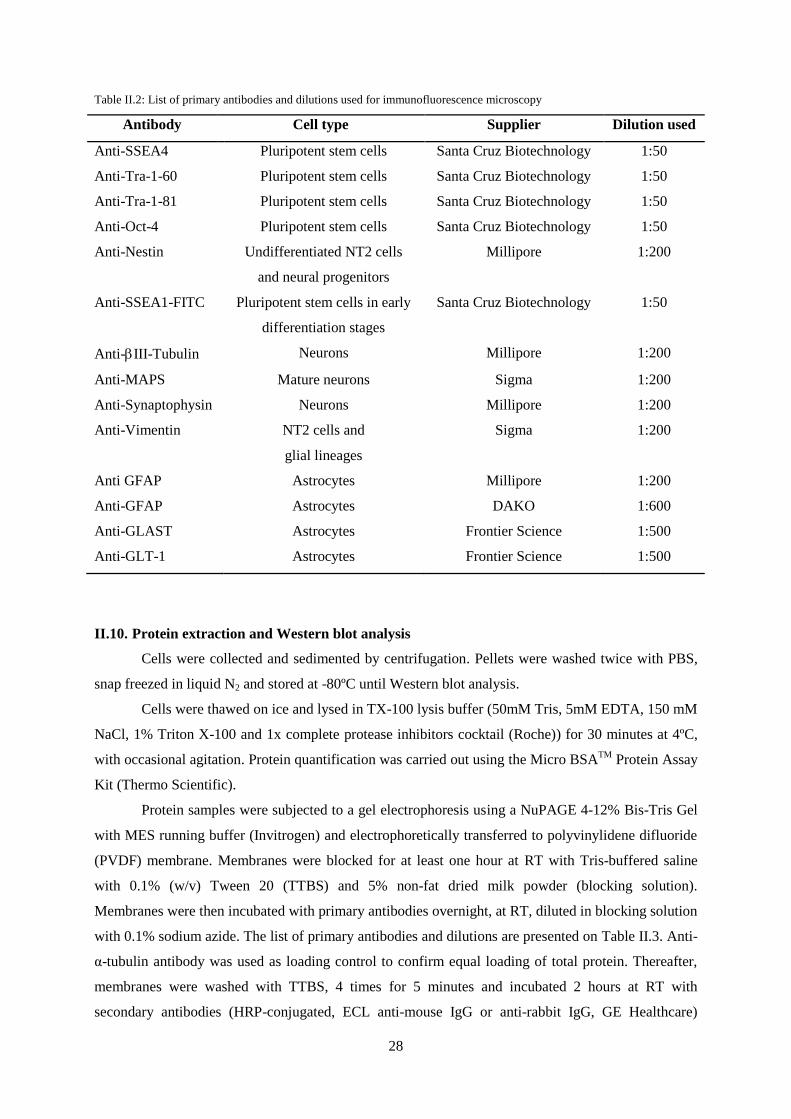
28
Table II.2: List of primary antibodies and dilutions used for immunofluorescence microscopy
Antibody Cell type Supplier Dilution used
Anti-SSEA4 Pluripotent stem cells Santa Cruz Biotechnology 1:50
Anti-Tra-1-60 Pluripotent stem cells Santa Cruz Biotechnology 1:50
Anti-Tra-1-81 Pluripotent stem cells Santa Cruz Biotechnology 1:50
Anti-Oct-4 Pluripotent stem cells Santa Cruz Biotechnology 1:50
Anti-Nestin Undifferentiated NT2 cells
and neural progenitors
Millipore 1:200
Anti-SSEA1-FITC Pluripotent stem cells in early
differentiation stages
Santa Cruz Biotechnology 1:50
Anti-III-Tubulin Neurons Millipore 1:200
Anti-MAPS Mature neurons Sigma 1:200
Anti-Synaptophysin Neurons Millipore 1:200
Anti-Vimentin NT2 cells and
glial lineages
Sigma 1:200
Anti GFAP Astrocytes Millipore 1:200
Anti-GFAP Astrocytes DAKO 1:600
Anti-GLAST Astrocytes Frontier Science 1:500
Anti-GLT-1 Astrocytes Frontier Science 1:500
II.10. Protein extraction and Western blot analysis
Cells were collected and sedimented by centrifugation. Pellets were washed twice with PBS,
snap freezed in liquid N2 and stored at -80ºC until Western blot analysis.
Cells were thawed on ice and lysed in TX-100 lysis buffer (50mM Tris, 5mM EDTA, 150 mM
NaCl, 1% Triton X-100 and 1x complete protease inhibitors cocktail (Roche)) for 30 minutes at 4ºC,
with occasional agitation. Protein quantification was carried out using the Micro BSATM
Protein Assay
Kit (Thermo Scientific).
Protein samples were subjected to a gel electrophoresis using a NuPAGE 4-12% Bis-Tris Gel
with MES running buffer (Invitrogen) and electrophoretically transferred to polyvinylidene difluoride
(PVDF) membrane. Membranes were blocked for at least one hour at RT with Tris-buffered saline
with 0.1% (w/v) Tween 20 (TTBS) and 5% non-fat dried milk powder (blocking solution).
Membranes were then incubated with primary antibodies overnight, at RT, diluted in blocking solution
with 0.1% sodium azide. The list of primary antibodies and dilutions are presented on Table II.3. Anti-
α-tubulin antibody was used as loading control to confirm equal loading of total protein. Thereafter,
membranes were washed with TTBS, 4 times for 5 minutes and incubated 2 hours at RT with
secondary antibodies (HRP-conjugated, ECL anti-mouse IgG or anti-rabbit IgG, GE Healthcare)
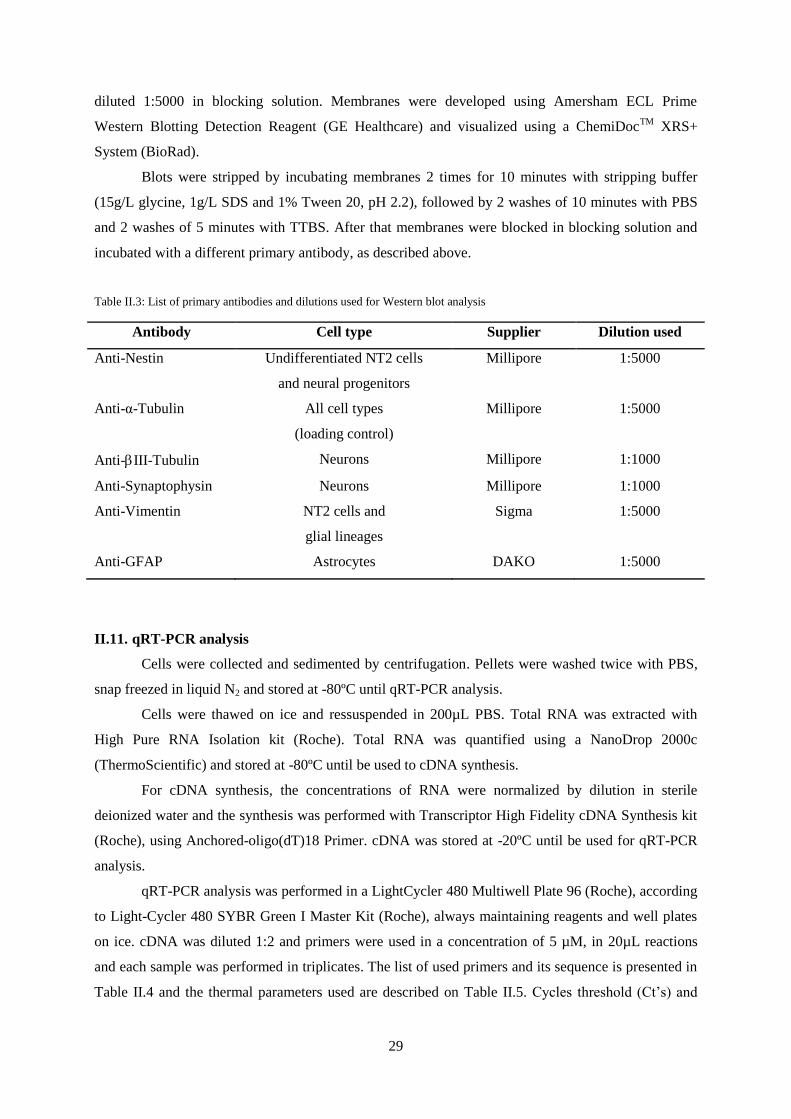
29
diluted 1:5000 in blocking solution. Membranes were developed using Amersham ECL Prime
Western Blotting Detection Reagent (GE Healthcare) and visualized using a ChemiDocTM
XRS+
System (BioRad).
Blots were stripped by incubating membranes 2 times for 10 minutes with stripping buffer
(15g/L glycine, 1g/L SDS and 1% Tween 20, pH 2.2), followed by 2 washes of 10 minutes with PBS
and 2 washes of 5 minutes with TTBS. After that membranes were blocked in blocking solution and
incubated with a different primary antibody, as described above.
Table II.3: List of primary antibodies and dilutions used for Western blot analysis
Antibody Cell type Supplier Dilution used
Anti-Nestin Undifferentiated NT2 cells
and neural progenitors
Millipore 1:5000
Anti-α-Tubulin All cell types
(loading control)
Millipore 1:5000
Anti-III-Tubulin Neurons Millipore 1:1000
Anti-Synaptophysin Neurons Millipore 1:1000
Anti-Vimentin NT2 cells and
glial lineages
Sigma 1:5000
Anti-GFAP Astrocytes DAKO 1:5000
II.11. qRT-PCR analysis
Cells were collected and sedimented by centrifugation. Pellets were washed twice with PBS,
snap freezed in liquid N2 and stored at -80ºC until qRT-PCR analysis.
Cells were thawed on ice and ressuspended in 200µL PBS. Total RNA was extracted with
High Pure RNA Isolation kit (Roche). Total RNA was quantified using a NanoDrop 2000c
(ThermoScientific) and stored at -80ºC until be used to cDNA synthesis.
For cDNA synthesis, the concentrations of RNA were normalized by dilution in sterile
deionized water and the synthesis was performed with Transcriptor High Fidelity cDNA Synthesis kit
(Roche), using Anchored-oligo(dT)18 Primer. cDNA was stored at -20ºC until be used for qRT-PCR
analysis.
qRT-PCR analysis was performed in a LightCycler 480 Multiwell Plate 96 (Roche), according
to Light-Cycler 480 SYBR Green I Master Kit (Roche), always maintaining reagents and well plates
on ice. cDNA was diluted 1:2 and primers were used in a concentration of 5 µM, in 20µL reactions
and each sample was performed in triplicates. The list of used primers and its sequence is presented in
Table II.4 and the thermal parameters used are described on Table II.5. Cycles threshold (Ct’s) and
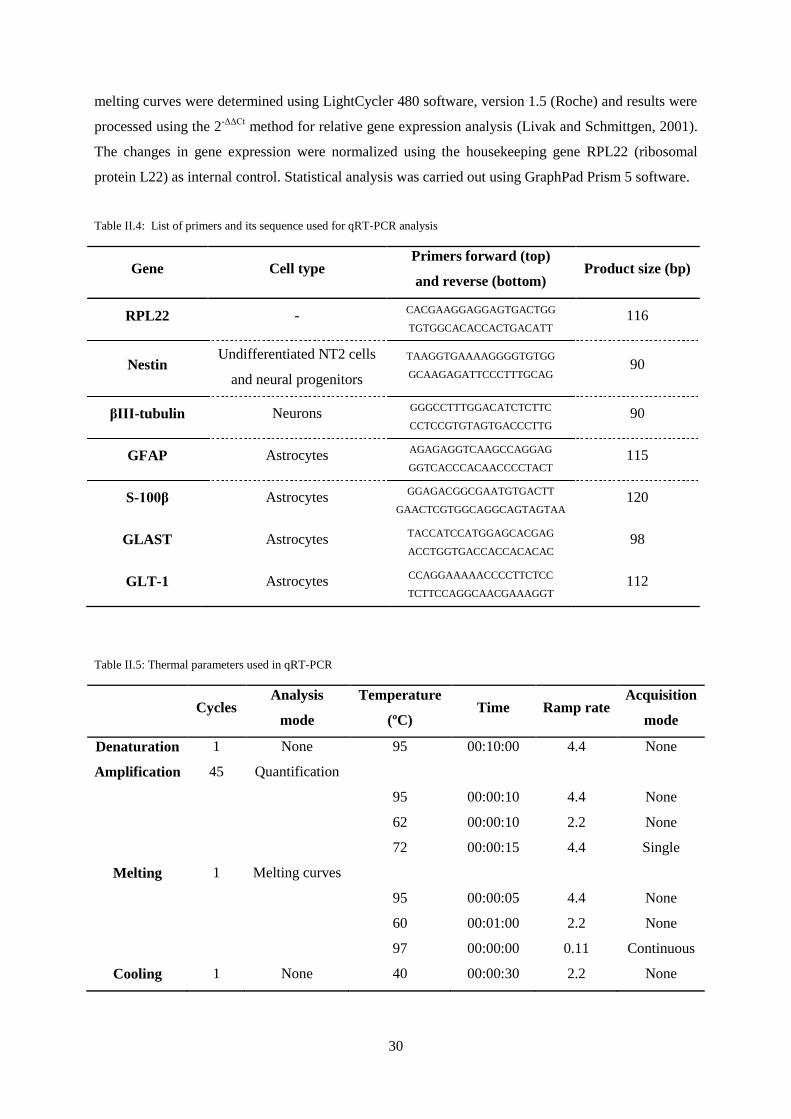
30
melting curves were determined using LightCycler 480 software, version 1.5 (Roche) and results were
processed using the 2-ΔΔCt
method for relative gene expression analysis (Livak and Schmittgen, 2001).
The changes in gene expression were normalized using the housekeeping gene RPL22 (ribosomal
protein L22) as internal control. Statistical analysis was carried out using GraphPad Prism 5 software.
Table II.4: List of primers and its sequence used for qRT-PCR analysis
Gene Cell type Primers forward (top)
and reverse (bottom) Product size (bp)
RPL22 -
CACGAAGGAGGAGTGACTGG
TGTGGCACACCACTGACATT 116
Nestin
Undifferentiated NT2 cells
and neural progenitors
TAAGGTGAAAAGGGGTGTGG
GCAAGAGATTCCCTTTGCAG 90
βIII-tubulin Neurons
GGGCCTTTGGACATCTCTTC
CCTCCGTGTAGTGACCCTTG 90
GFAP Astrocytes
AGAGAGGTCAAGCCAGGAG
GGTCACCCACAACCCCTACT 115
S-100β Astrocytes
GGAGACGGCGAATGTGACTT
GAACTCGTGGCAGGCAGTAGTAA 120
GLAST Astrocytes
TACCATCCATGGAGCACGAG
ACCTGGTGACCACCACACAC 98
GLT-1 Astrocytes
CCAGGAAAAACCCCTTCTCC
TCTTCCAGGCAACGAAAGGT 112
Table II.5: Thermal parameters used in qRT-PCR
Cycles Analysis
mode
Temperature
(ºC) Time Ramp rate
Acquisition
mode
Denaturation 1 None 95 00:10:00 4.4 None
Amplification 45 Quantification
95 00:00:10 4.4 None
62 00:00:10 2.2 None
72 00:00:15 4.4 Single
Melting 1 Melting curves
95 00:00:05 4.4 None
60 00:01:00 2.2 None
97 00:00:00 0.11 Continuous
Cooling 1 None 40 00:00:30 2.2 None
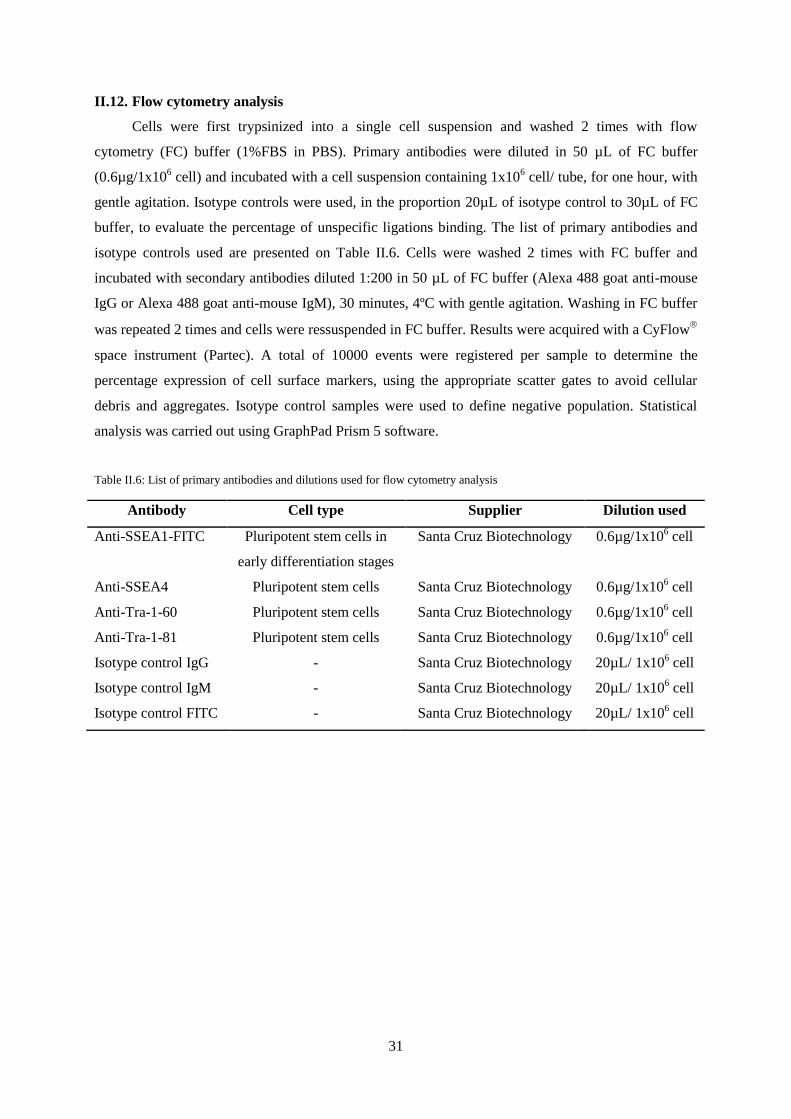
31
II.12. Flow cytometry analysis
Cells were first trypsinized into a single cell suspension and washed 2 times with flow
cytometry (FC) buffer (1%FBS in PBS). Primary antibodies were diluted in 50 µL of FC buffer
(0.6µg/1x106 cell) and incubated with a cell suspension containing 1x10
6 cell/ tube, for one hour, with
gentle agitation. Isotype controls were used, in the proportion 20µL of isotype control to 30µL of FC
buffer, to evaluate the percentage of unspecific ligations binding. The list of primary antibodies and
isotype controls used are presented on Table II.6. Cells were washed 2 times with FC buffer and
incubated with secondary antibodies diluted 1:200 in 50 µL of FC buffer (Alexa 488 goat anti-mouse
IgG or Alexa 488 goat anti-mouse IgM), 30 minutes, 4ºC with gentle agitation. Washing in FC buffer
was repeated 2 times and cells were ressuspended in FC buffer. Results were acquired with a CyFlow
space instrument (Partec). A total of 10000 events were registered per sample to determine the
percentage expression of cell surface markers, using the appropriate scatter gates to avoid cellular
debris and aggregates. Isotype control samples were used to define negative population. Statistical
analysis was carried out using GraphPad Prism 5 software.
Table II.6: List of primary antibodies and dilutions used for flow cytometry analysis
Antibody Cell type Supplier Dilution used
Anti-SSEA1-FITC Pluripotent stem cells in
early differentiation stages
Santa Cruz Biotechnology 0.6µg/1x106 cell
Anti-SSEA4 Pluripotent stem cells Santa Cruz Biotechnology 0.6µg/1x106 cell
Anti-Tra-1-60 Pluripotent stem cells Santa Cruz Biotechnology 0.6µg/1x106 cell
Anti-Tra-1-81 Pluripotent stem cells Santa Cruz Biotechnology 0.6µg/1x106 cell
Isotype control IgG - Santa Cruz Biotechnology 20µL/ 1x10⁶ cell
Isotype control IgM - Santa Cruz Biotechnology 20µL/ 1x10⁶ cell
Isotype control FITC - Santa Cruz Biotechnology 20µL/ 1x10⁶ cell

32
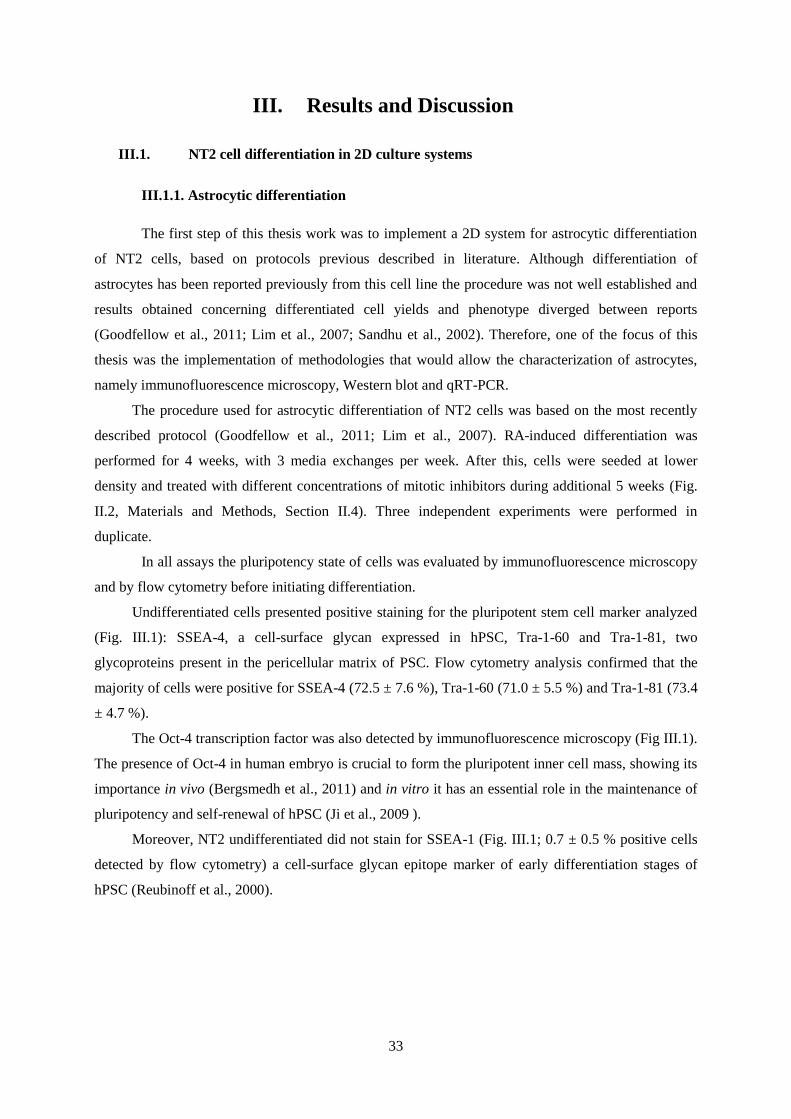
33
III. Results and Discussion
III.1. NT2 cell differentiation in 2D culture systems
III.1.1. Astrocytic differentiation
The first step of this thesis work was to implement a 2D system for astrocytic differentiation
of NT2 cells, based on protocols previous described in literature. Although differentiation of
astrocytes has been reported previously from this cell line the procedure was not well established and
results obtained concerning differentiated cell yields and phenotype diverged between reports
(Goodfellow et al., 2011; Lim et al., 2007; Sandhu et al., 2002). Therefore, one of the focus of this
thesis was the implementation of methodologies that would allow the characterization of astrocytes,
namely immunofluorescence microscopy, Western blot and qRT-PCR.
The procedure used for astrocytic differentiation of NT2 cells was based on the most recently
described protocol (Goodfellow et al., 2011; Lim et al., 2007). RA-induced differentiation was
performed for 4 weeks, with 3 media exchanges per week. After this, cells were seeded at lower
density and treated with different concentrations of mitotic inhibitors during additional 5 weeks (Fig.
II.2, Materials and Methods, Section II.4). Three independent experiments were performed in
duplicate.
In all assays the pluripotency state of cells was evaluated by immunofluorescence microscopy
and by flow cytometry before initiating differentiation.
Undifferentiated cells presented positive staining for the pluripotent stem cell marker analyzed
(Fig. III.1): SSEA-4, a cell-surface glycan expressed in hPSC, Tra-1-60 and Tra-1-81, two
glycoproteins present in the pericellular matrix of PSC. Flow cytometry analysis confirmed that the
majority of cells were positive for SSEA-4 (72.5 ± 7.6 %), Tra-1-60 (71.0 ± 5.5 %) and Tra-1-81 (73.4
± 4.7 %).
The Oct-4 transcription factor was also detected by immunofluorescence microscopy (Fig III.1).
The presence of Oct-4 in human embryo is crucial to form the pluripotent inner cell mass, showing its
importance in vivo (Bergsmedh et al., 2011) and in vitro it has an essential role in the maintenance of
pluripotency and self-renewal of hPSC (Ji et al., 2009 ).
Moreover, NT2 undifferentiated did not stain for SSEA-1 (Fig. III.1; 0.7 ± 0.5 % positive cells
detected by flow cytometry) a cell-surface glycan epitope marker of early differentiation stages of
hPSC (Reubinoff et al., 2000).
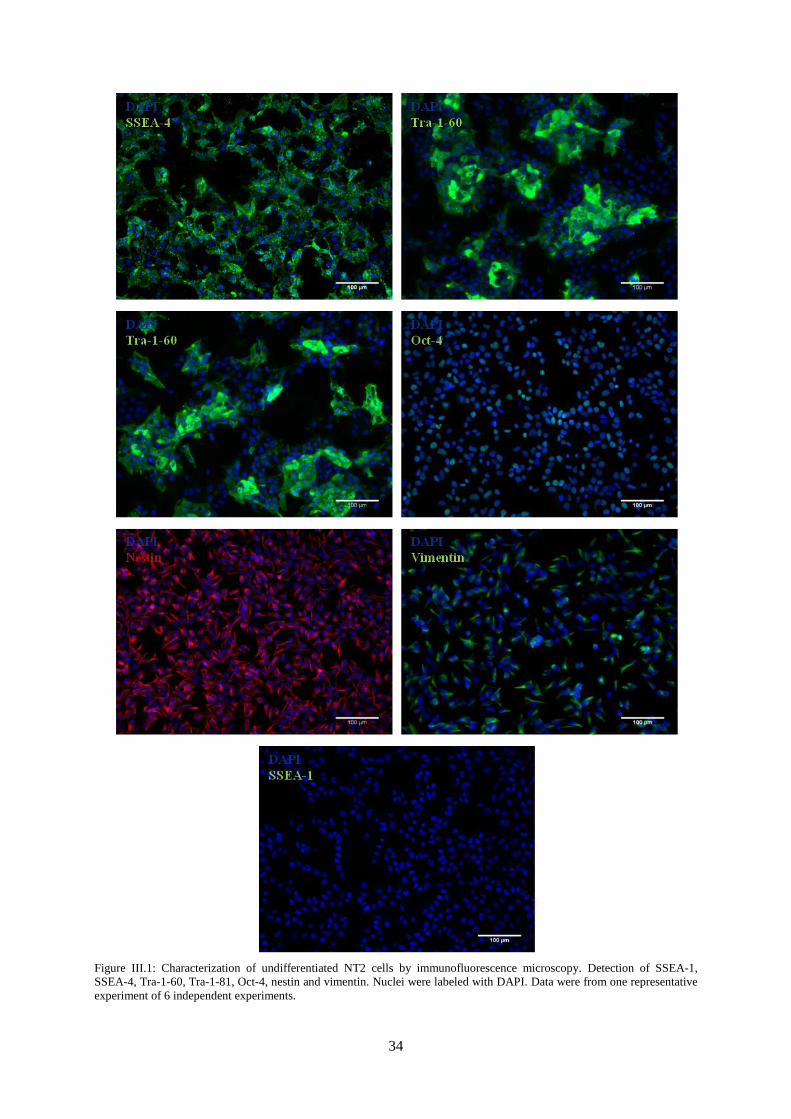
34
Figure III.1: Characterization of undifferentiated NT2 cells by immunofluorescence microscopy. Detection of SSEA-1,
SSEA-4, Tra-1-60, Tra-1-81, Oct-4, nestin and vimentin. Nuclei were labeled with DAPI. Data were from one representative
experiment of 6 independent experiments.
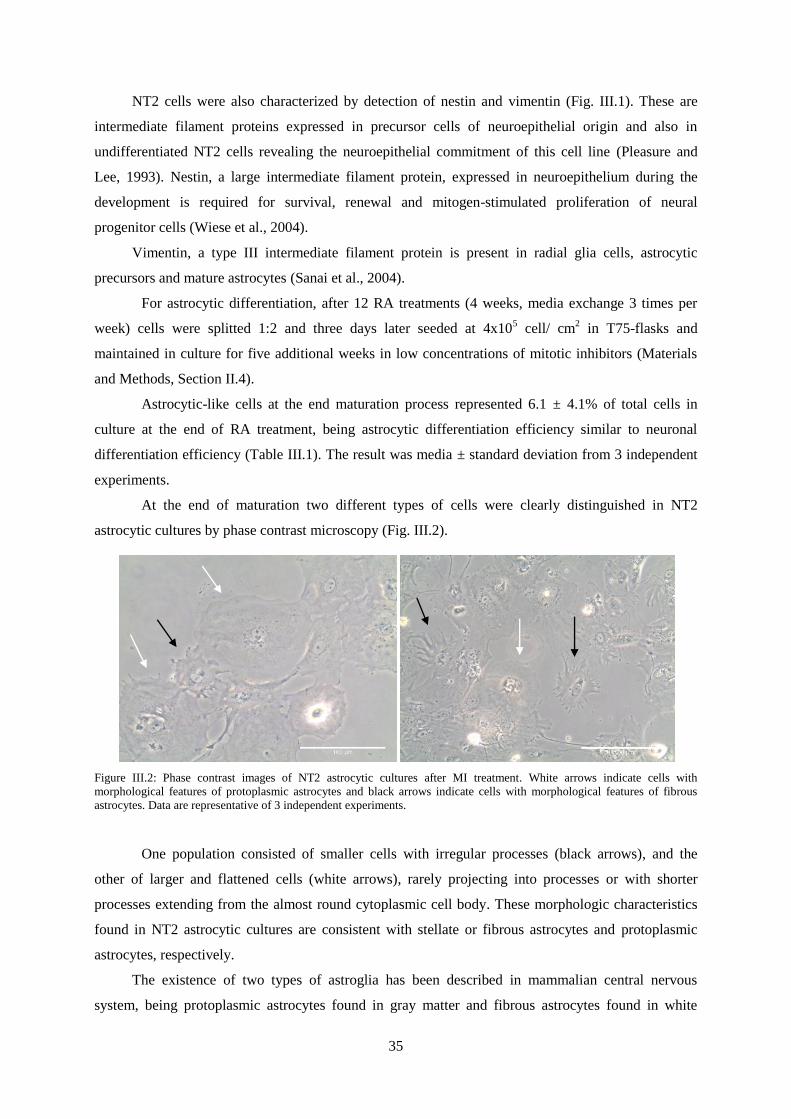
35
NT2 cells were also characterized by detection of nestin and vimentin (Fig. III.1). These are
intermediate filament proteins expressed in precursor cells of neuroepithelial origin and also in
undifferentiated NT2 cells revealing the neuroepithelial commitment of this cell line (Pleasure and
Lee, 1993). Nestin, a large intermediate filament protein, expressed in neuroepithelium during the
development is required for survival, renewal and mitogen-stimulated proliferation of neural
progenitor cells (Wiese et al., 2004).
Vimentin, a type III intermediate filament protein is present in radial glia cells, astrocytic
precursors and mature astrocytes (Sanai et al., 2004).
For astrocytic differentiation, after 12 RA treatments (4 weeks, media exchange 3 times per
week) cells were splitted 1:2 and three days later seeded at 4x10⁵ cell/ cm
2 in T75-flasks and
maintained in culture for five additional weeks in low concentrations of mitotic inhibitors (Materials
and Methods, Section II.4).
Astrocytic-like cells at the end maturation process represented 6.1 ± 4.1% of total cells in
culture at the end of RA treatment, being astrocytic differentiation efficiency similar to neuronal
differentiation efficiency (Table III.1). The result was media ± standard deviation from 3 independent
experiments.
At the end of maturation two different types of cells were clearly distinguished in NT2
astrocytic cultures by phase contrast microscopy (Fig. III.2).
Figure III.2: Phase contrast images of NT2 astrocytic cultures after MI treatment. White arrows indicate cells with
morphological features of protoplasmic astrocytes and black arrows indicate cells with morphological features of fibrous
astrocytes. Data are representative of 3 independent experiments.
One population consisted of smaller cells with irregular processes (black arrows), and the
other of larger and flattened cells (white arrows), rarely projecting into processes or with shorter
processes extending from the almost round cytoplasmic cell body. These morphologic characteristics
found in NT2 astrocytic cultures are consistent with stellate or fibrous astrocytes and protoplasmic
astrocytes, respectively.
The existence of two types of astroglia has been described in mammalian central nervous
system, being protoplasmic astrocytes found in gray matter and fibrous astrocytes found in white
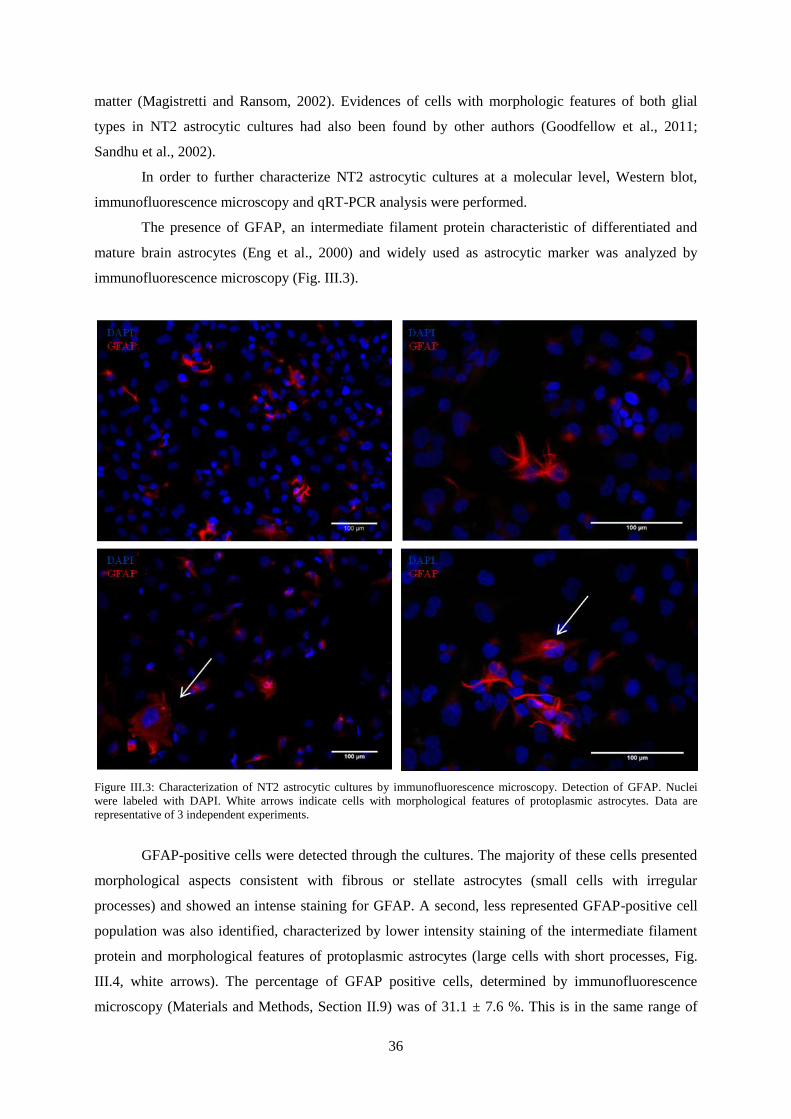
36
matter (Magistretti and Ransom, 2002). Evidences of cells with morphologic features of both glial
types in NT2 astrocytic cultures had also been found by other authors (Goodfellow et al., 2011;
Sandhu et al., 2002).
In order to further characterize NT2 astrocytic cultures at a molecular level, Western blot,
immunofluorescence microscopy and qRT-PCR analysis were performed.
The presence of GFAP, an intermediate filament protein characteristic of differentiated and
mature brain astrocytes (Eng et al., 2000) and widely used as astrocytic marker was analyzed by
immunofluorescence microscopy (Fig. III.3).
Figure III.3: Characterization of NT2 astrocytic cultures by immunofluorescence microscopy. Detection of GFAP. Nuclei
were labeled with DAPI. White arrows indicate cells with morphological features of protoplasmic astrocytes. Data are
representative of 3 independent experiments.
GFAP-positive cells were detected through the cultures. The majority of these cells presented
morphological aspects consistent with fibrous or stellate astrocytes (small cells with irregular
processes) and showed an intense staining for GFAP. A second, less represented GFAP-positive cell
population was also identified, characterized by lower intensity staining of the intermediate filament
protein and morphological features of protoplasmic astrocytes (large cells with short processes, Fig.
III.4, white arrows). The percentage of GFAP positive cells, determined by immunofluorescence
microscopy (Materials and Methods, Section II.9) was of 31.1 ± 7.6 %. This is in the same range of
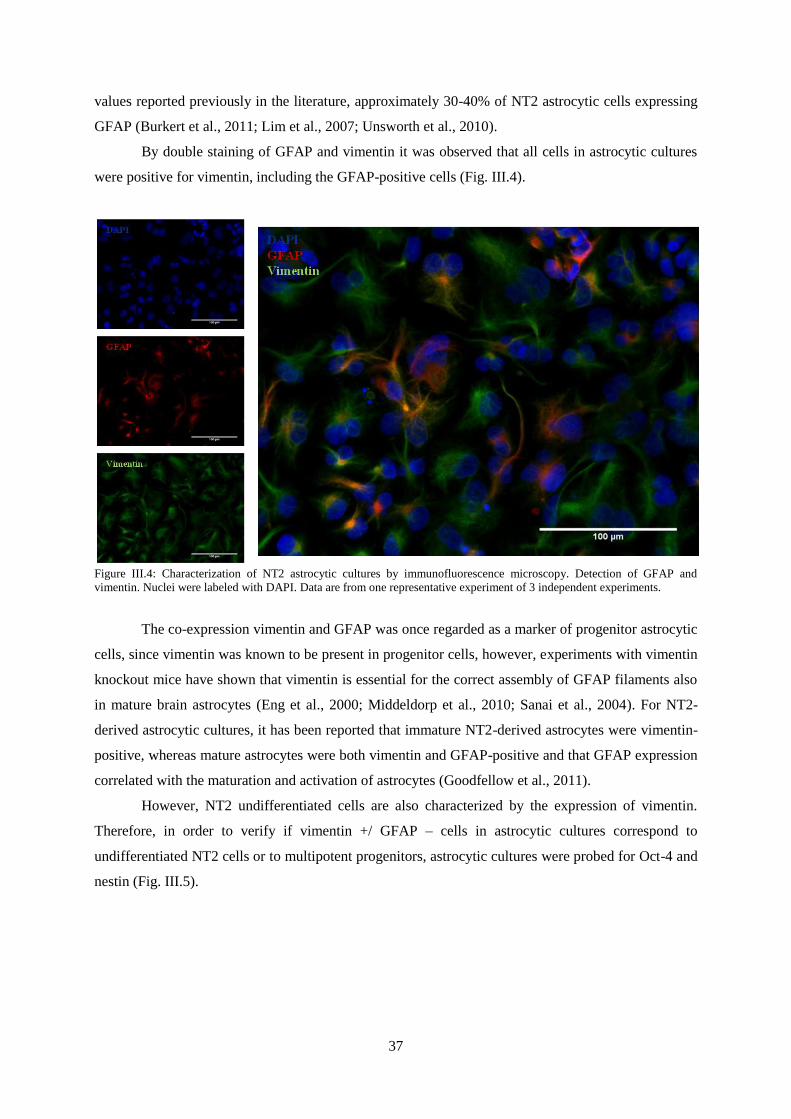
37
values reported previously in the literature, approximately 30-40% of NT2 astrocytic cells expressing
GFAP (Burkert et al., 2011; Lim et al., 2007; Unsworth et al., 2010).
By double staining of GFAP and vimentin it was observed that all cells in astrocytic cultures
were positive for vimentin, including the GFAP-positive cells (Fig. III.4).
Figure III.4: Characterization of NT2 astrocytic cultures by immunofluorescence microscopy. Detection of GFAP and
vimentin. Nuclei were labeled with DAPI. Data are from one representative experiment of 3 independent experiments.
The co-expression vimentin and GFAP was once regarded as a marker of progenitor astrocytic
cells, since vimentin was known to be present in progenitor cells, however, experiments with vimentin
knockout mice have shown that vimentin is essential for the correct assembly of GFAP filaments also
in mature brain astrocytes (Eng et al., 2000; Middeldorp et al., 2010; Sanai et al., 2004). For NT2-
derived astrocytic cultures, it has been reported that immature NT2-derived astrocytes were vimentin-
positive, whereas mature astrocytes were both vimentin and GFAP-positive and that GFAP expression
correlated with the maturation and activation of astrocytes (Goodfellow et al., 2011).
However, NT2 undifferentiated cells are also characterized by the expression of vimentin.
Therefore, in order to verify if vimentin +/ GFAP – cells in astrocytic cultures correspond to
undifferentiated NT2 cells or to multipotent progenitors, astrocytic cultures were probed for Oct-4 and
nestin (Fig. III.5).
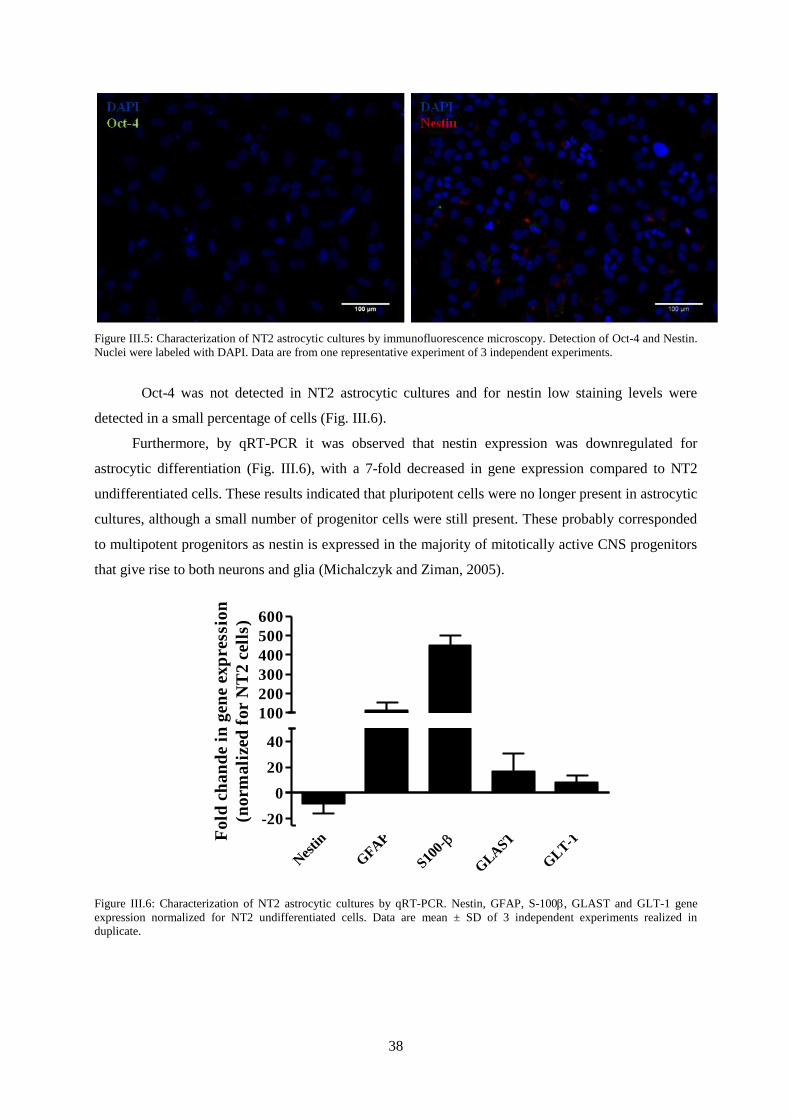
38
Figure III.5: Characterization of NT2 astrocytic cultures by immunofluorescence microscopy. Detection of Oct-4 and Nestin.
Nuclei were labeled with DAPI. Data are from one representative experiment of 3 independent experiments.
Oct-4 was not detected in NT2 astrocytic cultures and for nestin low staining levels were
detected in a small percentage of cells (Fig. III.6).
Furthermore, by qRT-PCR it was observed that nestin expression was downregulated for
astrocytic differentiation (Fig. III.6), with a 7-fold decreased in gene expression compared to NT2
undifferentiated cells. These results indicated that pluripotent cells were no longer present in astrocytic
cultures, although a small number of progenitor cells were still present. These probably corresponded
to multipotent progenitors as nestin is expressed in the majority of mitotically active CNS progenitors
that give rise to both neurons and glia (Michalczyk and Ziman, 2005).
Nes
tin
GFA
P
S100-
GLA
ST
GLT-1
-20
0
20
40
100
200
300
400
500
600
Fo
ld c
ha
nd
e in
gen
e ex
pre
ssio
n
(no
rma
lize
d f
or
NT
2 c
ells
)
Figure III.6: Characterization of NT2 astrocytic cultures by qRT-PCR. Nestin, GFAP, S-100, GLAST and GLT-1 gene
expression normalized for NT2 undifferentiated cells. Data are mean ± SD of 3 independent experiments realized in
duplicate.
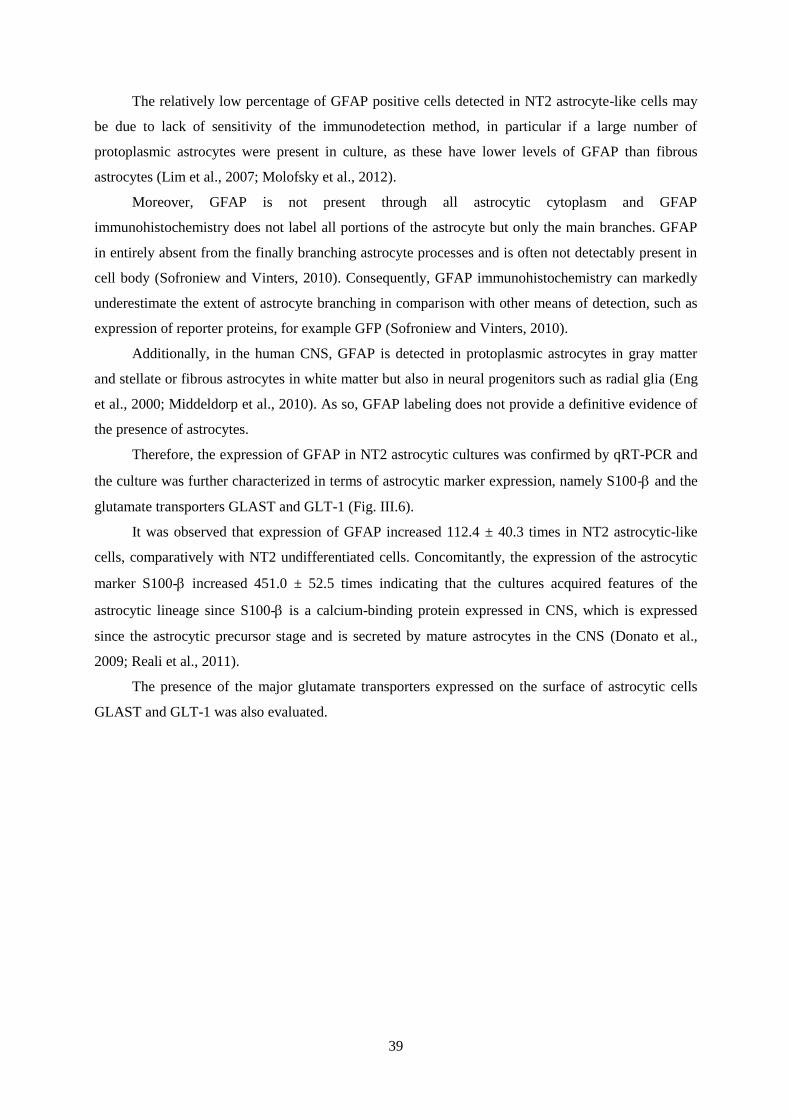
39
The relatively low percentage of GFAP positive cells detected in NT2 astrocyte-like cells may
be due to lack of sensitivity of the immunodetection method, in particular if a large number of
protoplasmic astrocytes were present in culture, as these have lower levels of GFAP than fibrous
astrocytes (Lim et al., 2007; Molofsky et al., 2012).
Moreover, GFAP is not present through all astrocytic cytoplasm and GFAP
immunohistochemistry does not label all portions of the astrocyte but only the main branches. GFAP
in entirely absent from the finally branching astrocyte processes and is often not detectably present in
cell body (Sofroniew and Vinters, 2010). Consequently, GFAP immunohistochemistry can markedly
underestimate the extent of astrocyte branching in comparison with other means of detection, such as
expression of reporter proteins, for example GFP (Sofroniew and Vinters, 2010).
Additionally, in the human CNS, GFAP is detected in protoplasmic astrocytes in gray matter
and stellate or fibrous astrocytes in white matter but also in neural progenitors such as radial glia (Eng
et al., 2000; Middeldorp et al., 2010). As so, GFAP labeling does not provide a definitive evidence of
the presence of astrocytes.
Therefore, the expression of GFAP in NT2 astrocytic cultures was confirmed by qRT-PCR and
the culture was further characterized in terms of astrocytic marker expression, namely S100- and the
glutamate transporters GLAST and GLT-1 (Fig. III.6).
It was observed that expression of GFAP increased 112.4 ± 40.3 times in NT2 astrocytic-like
cells, comparatively with NT2 undifferentiated cells. Concomitantly, the expression of the astrocytic
marker S100- increased 451.0 ± 52.5 times indicating that the cultures acquired features of the
astrocytic lineage since S100- is a calcium-binding protein expressed in CNS, which is expressed
since the astrocytic precursor stage and is secreted by mature astrocytes in the CNS (Donato et al.,
2009; Reali et al., 2011).
The presence of the major glutamate transporters expressed on the surface of astrocytic cells
GLAST and GLT-1 was also evaluated.
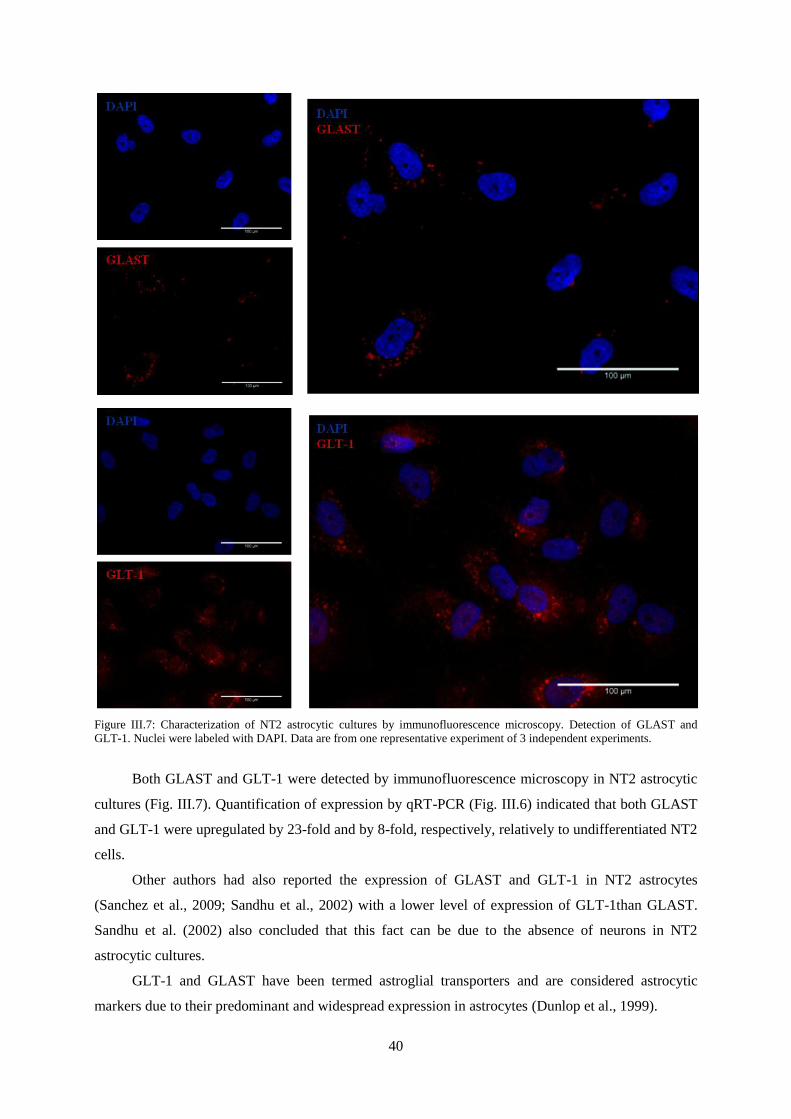
40
Figure III.7: Characterization of NT2 astrocytic cultures by immunofluorescence microscopy. Detection of GLAST and
GLT-1. Nuclei were labeled with DAPI. Data are from one representative experiment of 3 independent experiments.
Both GLAST and GLT-1 were detected by immunofluorescence microscopy in NT2 astrocytic
cultures (Fig. III.7). Quantification of expression by qRT-PCR (Fig. III.6) indicated that both GLAST
and GLT-1 were upregulated by 23-fold and by 8-fold, respectively, relatively to undifferentiated NT2
cells.
Other authors had also reported the expression of GLAST and GLT-1 in NT2 astrocytes
(Sanchez et al., 2009; Sandhu et al., 2002) with a lower level of expression of GLT-1than GLAST.
Sandhu et al. (2002) also concluded that this fact can be due to the absence of neurons in NT2
astrocytic cultures.
GLT-1 and GLAST have been termed astroglial transporters and are considered astrocytic
markers due to their predominant and widespread expression in astrocytes (Dunlop et al., 1999).
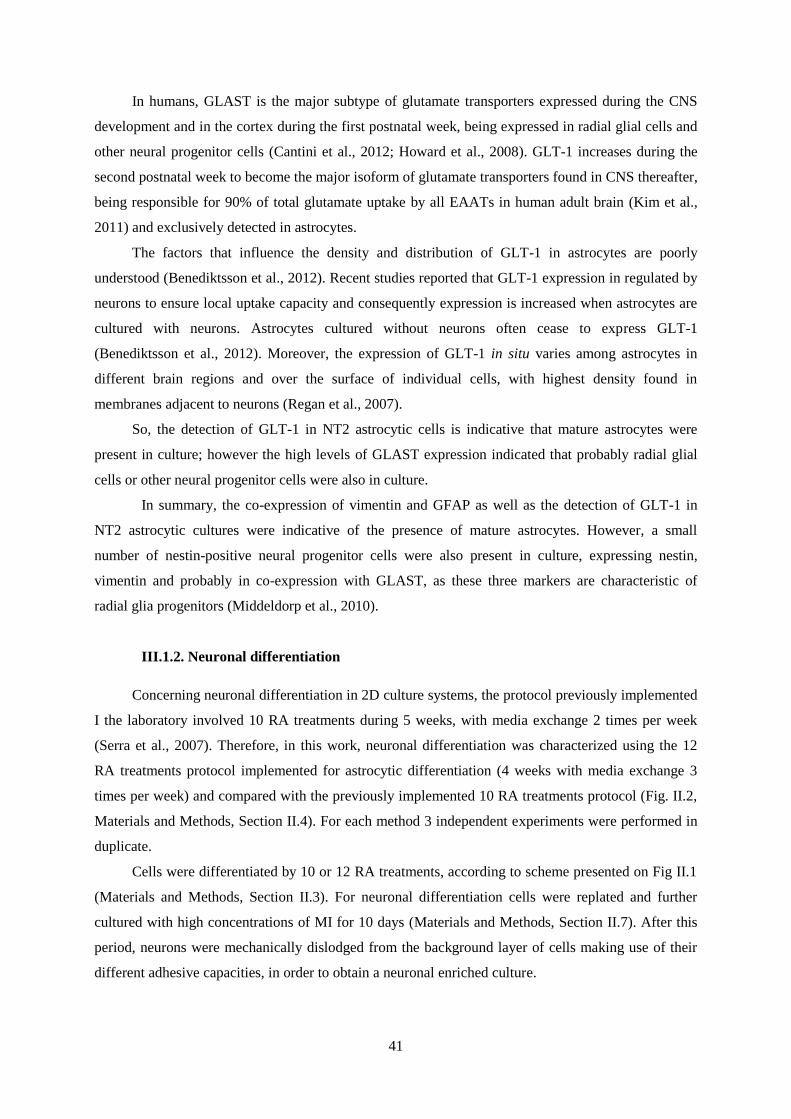
41
In humans, GLAST is the major subtype of glutamate transporters expressed during the CNS
development and in the cortex during the first postnatal week, being expressed in radial glial cells and
other neural progenitor cells (Cantini et al., 2012; Howard et al., 2008). GLT-1 increases during the
second postnatal week to become the major isoform of glutamate transporters found in CNS thereafter,
being responsible for 90% of total glutamate uptake by all EAATs in human adult brain (Kim et al.,
2011) and exclusively detected in astrocytes.
The factors that influence the density and distribution of GLT-1 in astrocytes are poorly
understood (Benediktsson et al., 2012). Recent studies reported that GLT-1 expression in regulated by
neurons to ensure local uptake capacity and consequently expression is increased when astrocytes are
cultured with neurons. Astrocytes cultured without neurons often cease to express GLT-1
(Benediktsson et al., 2012). Moreover, the expression of GLT-1 in situ varies among astrocytes in
different brain regions and over the surface of individual cells, with highest density found in
membranes adjacent to neurons (Regan et al., 2007).
So, the detection of GLT-1 in NT2 astrocytic cells is indicative that mature astrocytes were
present in culture; however the high levels of GLAST expression indicated that probably radial glial
cells or other neural progenitor cells were also in culture.
In summary, the co-expression of vimentin and GFAP as well as the detection of GLT-1 in
NT2 astrocytic cultures were indicative of the presence of mature astrocytes. However, a small
number of nestin-positive neural progenitor cells were also present in culture, expressing nestin,
vimentin and probably in co-expression with GLAST, as these three markers are characteristic of
radial glia progenitors (Middeldorp et al., 2010).
III.1.2. Neuronal differentiation
Concerning neuronal differentiation in 2D culture systems, the protocol previously implemented
I the laboratory involved 10 RA treatments during 5 weeks, with media exchange 2 times per week
(Serra et al., 2007). Therefore, in this work, neuronal differentiation was characterized using the 12
RA treatments protocol implemented for astrocytic differentiation (4 weeks with media exchange 3
times per week) and compared with the previously implemented 10 RA treatments protocol (Fig. II.2,
Materials and Methods, Section II.4). For each method 3 independent experiments were performed in
duplicate.
Cells were differentiated by 10 or 12 RA treatments, according to scheme presented on Fig II.1
(Materials and Methods, Section II.3). For neuronal differentiation cells were replated and further
cultured with high concentrations of MI for 10 days (Materials and Methods, Section II.7). After this
period, neurons were mechanically dislodged from the background layer of cells making use of their
different adhesive capacities, in order to obtain a neuronal enriched culture.
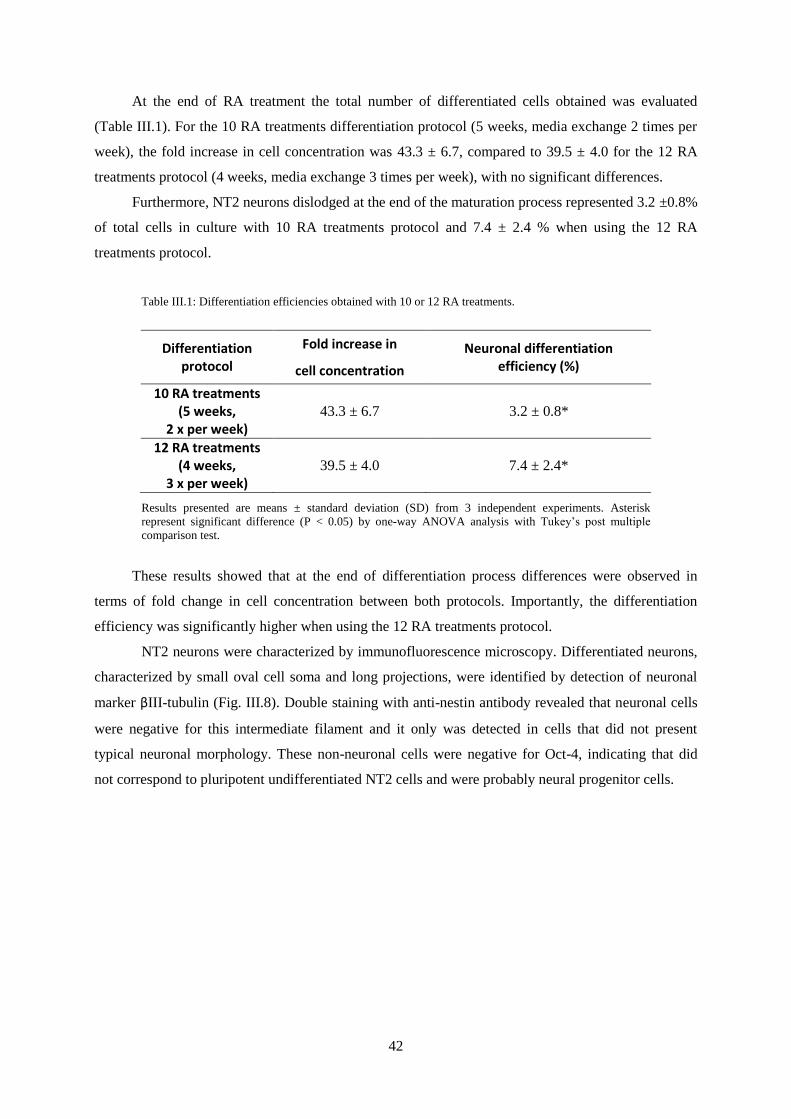
42
At the end of RA treatment the total number of differentiated cells obtained was evaluated
(Table III.1). For the 10 RA treatments differentiation protocol (5 weeks, media exchange 2 times per
week), the fold increase in cell concentration was 43.3 ± 6.7, compared to 39.5 ± 4.0 for the 12 RA
treatments protocol (4 weeks, media exchange 3 times per week), with no significant differences.
Furthermore, NT2 neurons dislodged at the end of the maturation process represented 3.2 ±0.8%
of total cells in culture with 10 RA treatments protocol and 7.4 ± 2.4 % when using the 12 RA
treatments protocol.
Table III.1: Differentiation efficiencies obtained with 10 or 12 RA treatments.
Differentiation protocol
Fold increase in Neuronal differentiation efficiency (%) cell concentration
10 RA treatments (5 weeks,
2 x per week) 43.3 ± 6.7 3.2 ± 0.8*
12 RA treatments (4 weeks,
3 x per week) 39.5 ± 4.0 7.4 ± 2.4*
Results presented are means ± standard deviation (SD) from 3 independent experiments. Asterisk
represent significant difference (P < 0.05) by one-way ANOVA analysis with Tukey’s post multiple
comparison test.
These results showed that at the end of differentiation process differences were observed in
terms of fold change in cell concentration between both protocols. Importantly, the differentiation
efficiency was significantly higher when using the 12 RA treatments protocol.
NT2 neurons were characterized by immunofluorescence microscopy. Differentiated neurons,
characterized by small oval cell soma and long projections, were identified by detection of neuronal
marker βIII-tubulin (Fig. III.8). Double staining with anti-nestin antibody revealed that neuronal cells
were negative for this intermediate filament and it only was detected in cells that did not present
typical neuronal morphology. These non-neuronal cells were negative for Oct-4, indicating that did
not correspond to pluripotent undifferentiated NT2 cells and were probably neural progenitor cells.
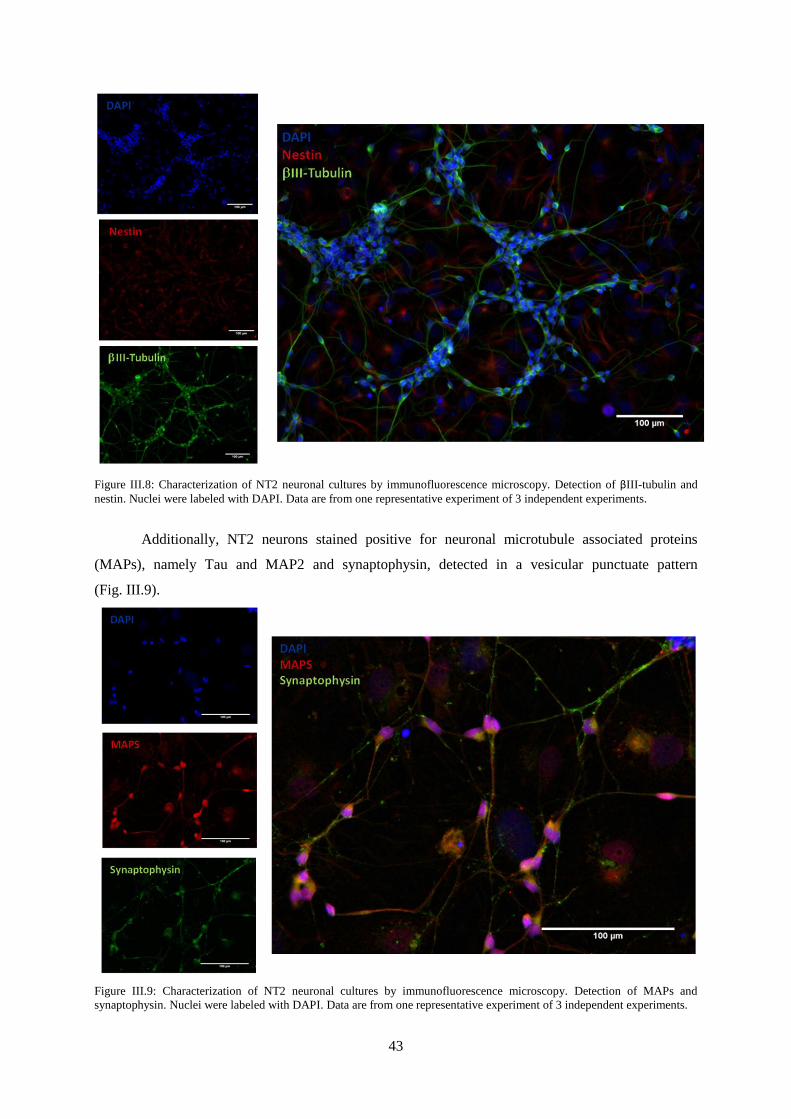
43
Figure III.8: Characterization of NT2 neuronal cultures by immunofluorescence microscopy. Detection of βIII-tubulin and
nestin. Nuclei were labeled with DAPI. Data are from one representative experiment of 3 independent experiments.
Additionally, NT2 neurons stained positive for neuronal microtubule associated proteins
(MAPs), namely Tau and MAP2 and synaptophysin, detected in a vesicular punctuate pattern
(Fig. III.9).
Figure III.9: Characterization of NT2 neuronal cultures by immunofluorescence microscopy. Detection of MAPs and
synaptophysin. Nuclei were labeled with DAPI. Data are from one representative experiment of 3 independent experiments.
44
The presence of these MAPs, which are expressed in mature neurons (Dehmelt and Halpain,
2004) as well as the vesicular localization of synaptophysin, a glycoprotein present in the membrane
of pre-synaptic vesicles (Wiedenmann and Franke, 1985) indicated that mature human neurons were
obtained from NT2 cells using the experimental conditions described.
These results are in accordance with previous observations that demonstrated that NT2
neurons elaborate classic synaptic contacts (Guillemain et al., 2000) and stain for synapsin, a soluble
protein associated with the reserve pool of synaptic vesicles (Podrygajlo et al., 2009; Tegenge et al.,
2011) and for the integral synaptic vesicle protein synaptogamin (Podrygajlo et al., 2009).
Based on these results, the 12 RA treatments protocol was chosen as the most efficient for
2D neural differentiation of NT2 cells, since it allowed a 20% shortening in the duration of the
differentiation process, together with a 2-fold increase in neuronal differentiation efficiency.
Altogether, presented results showed that a protocol to obtain mature neurons and astrocytes
from NT2 undifferentiated cells using retinoic acid as inducing differentiation agent for 4 weeks was
successfully implemented. Neurons were detected in culture first and after 10 days treatment of
differentiated cells with high concentration of mitotic inhibitors neurons already expressed βIII-
tubulin, MAPS and synaptophysin. Astrocytes were detected in culture only after an extended time of
treatment with mitotic inhibitors and after 5 weeks treatment with low concentrations of mitotic
inhibitors it was possible obtain a culture in which mature astrocytes were present, expressing
astrocytic markers such as vimentin, GFAP and S100-β as well as the glutamate transporters GLAST
and GLT-1, similarly to the in vivo situation in human adult brain.
In neuronal and astrocytic differentiation, incubation with mitotic inhibitors led to an
elimination of proliferating NT2 cells and the cultures become gradually enriched in differentiated
NT2 neurons, with extensive neuritic networks, and NT2 astrocytes. As NT2 neurons are post-mitotic
cells (Pleasure et al., 1992) they were not affected by mitotic inhibitors. NT2 astrocytes, on the other
hand, have slower proliferation rates (Sanchez et al., 2009; Sandhu et al., 2002) and therefore were
much less affected by mitotic inhibitors than rapidly proliferating NT2 undifferentiated cells or
multipotent neural progenitors (Przyborski et al., 2000).
This pattern of astrocytes appearing in a later developmental window than neurons,
recapitulating CNS development is similar to that observed for neuroepithelial cells derived from
human embryonic stem cells that gradually give rise to neurons, in the first month of differentiation
and later appear astrocytes or oligodendrocytes, after 2 or 3 months of differentiation (Hu et al., 2010).
NT2 neurons and astrocytes obtained using the described 2D culture system resembled human
neurons and astrocytes, however, do not mimic the in vivo situation because cells are limited in spatial
microenvironment and are not completely in contact with other cells and with an extracellular matrix.
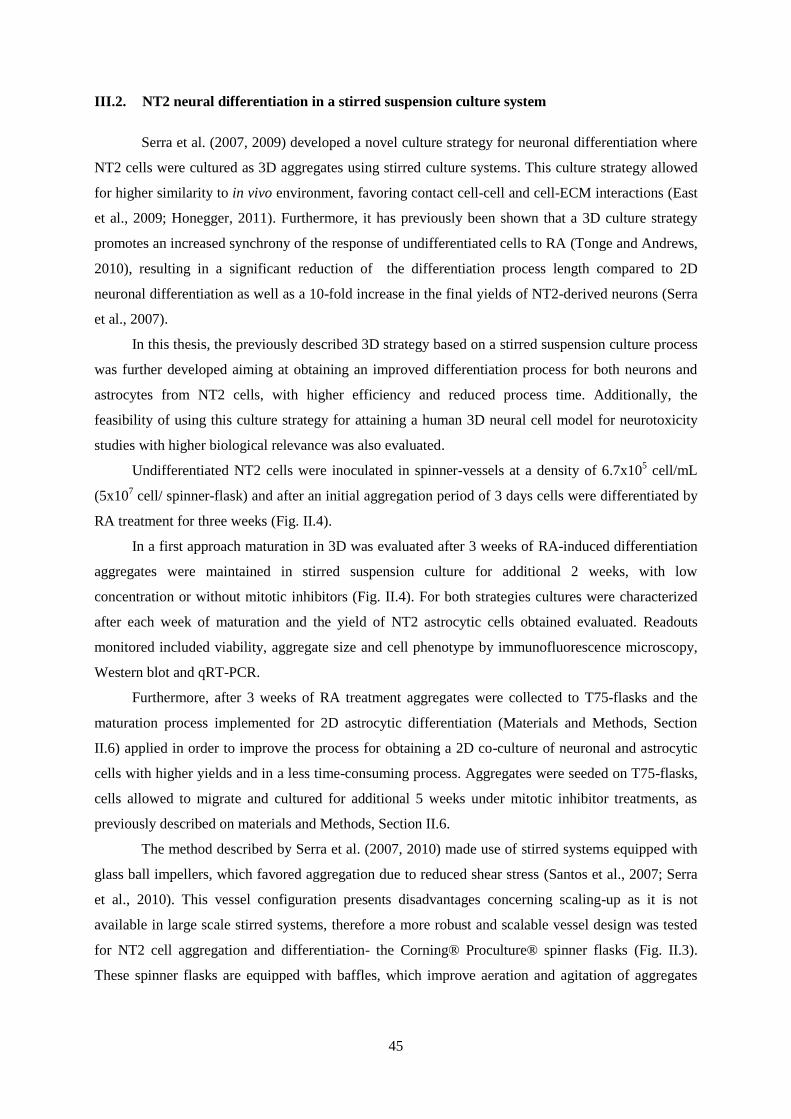
45
III.2. NT2 neural differentiation in a stirred suspension culture system
Serra et al. (2007, 2009) developed a novel culture strategy for neuronal differentiation where
NT2 cells were cultured as 3D aggregates using stirred culture systems. This culture strategy allowed
for higher similarity to in vivo environment, favoring contact cell-cell and cell-ECM interactions (East
et al., 2009; Honegger, 2011). Furthermore, it has previously been shown that a 3D culture strategy
promotes an increased synchrony of the response of undifferentiated cells to RA (Tonge and Andrews,
2010), resulting in a significant reduction of the differentiation process length compared to 2D
neuronal differentiation as well as a 10-fold increase in the final yields of NT2-derived neurons (Serra
et al., 2007).
In this thesis, the previously described 3D strategy based on a stirred suspension culture process
was further developed aiming at obtaining an improved differentiation process for both neurons and
astrocytes from NT2 cells, with higher efficiency and reduced process time. Additionally, the
feasibility of using this culture strategy for attaining a human 3D neural cell model for neurotoxicity
studies with higher biological relevance was also evaluated.
Undifferentiated NT2 cells were inoculated in spinner-vessels at a density of 6.7x10⁵ cell/mL
(5x10⁷ cell/ spinner-flask) and after an initial aggregation period of 3 days cells were differentiated by
RA treatment for three weeks (Fig. II.4).
In a first approach maturation in 3D was evaluated after 3 weeks of RA-induced differentiation
aggregates were maintained in stirred suspension culture for additional 2 weeks, with low
concentration or without mitotic inhibitors (Fig. II.4). For both strategies cultures were characterized
after each week of maturation and the yield of NT2 astrocytic cells obtained evaluated. Readouts
monitored included viability, aggregate size and cell phenotype by immunofluorescence microscopy,
Western blot and qRT-PCR.
Furthermore, after 3 weeks of RA treatment aggregates were collected to T75-flasks and the
maturation process implemented for 2D astrocytic differentiation (Materials and Methods, Section
II.6) applied in order to improve the process for obtaining a 2D co-culture of neuronal and astrocytic
cells with higher yields and in a less time-consuming process. Aggregates were seeded on T75-flasks,
cells allowed to migrate and cultured for additional 5 weeks under mitotic inhibitor treatments, as
previously described on materials and Methods, Section II.6.
The method described by Serra et al. (2007, 2010) made use of stirred systems equipped with
glass ball impellers, which favored aggregation due to reduced shear stress (Santos et al., 2007; Serra
et al., 2010). This vessel configuration presents disadvantages concerning scaling-up as it is not
available in large scale stirred systems, therefore a more robust and scalable vessel design was tested
for NT2 cell aggregation and differentiation- the Corning® Proculture® spinner flasks (Fig. II.3).
These spinner flasks are equipped with baffles, which improve aeration and agitation of aggregates
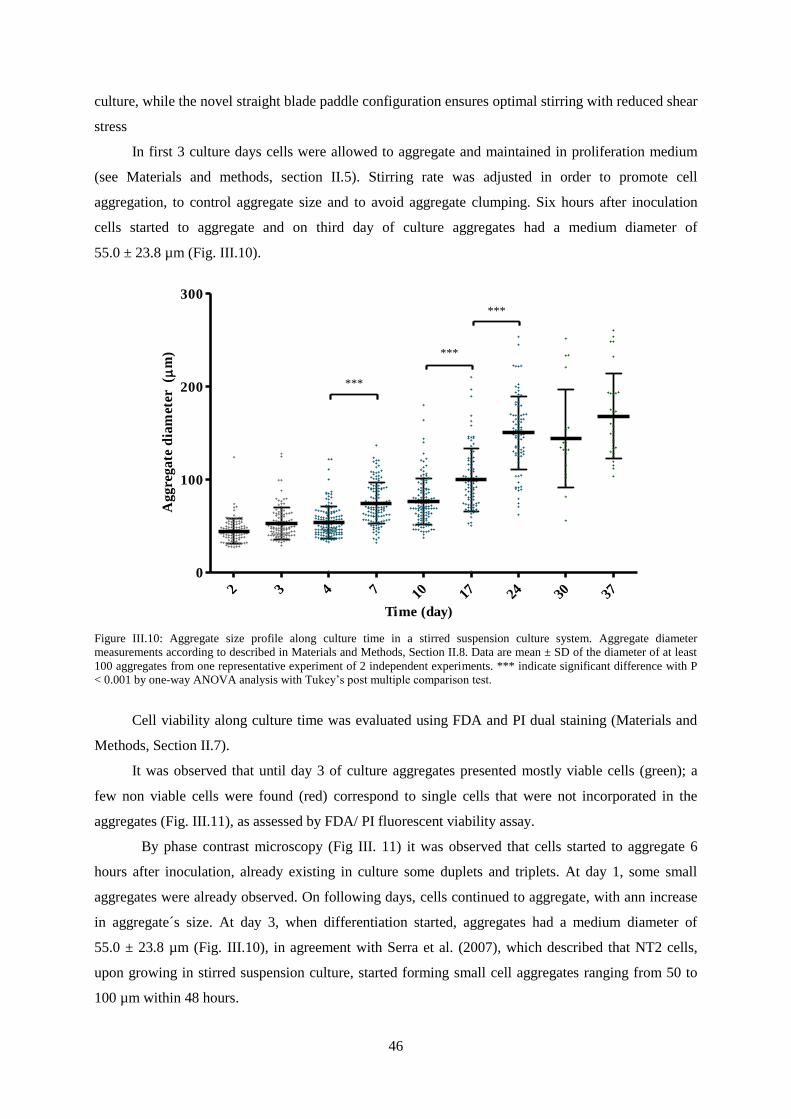
46
culture, while the novel straight blade paddle configuration ensures optimal stirring with reduced shear
stress
In first 3 culture days cells were allowed to aggregate and maintained in proliferation medium
(see Materials and methods, section II.5). Stirring rate was adjusted in order to promote cell
aggregation, to control aggregate size and to avoid aggregate clumping. Six hours after inoculation
cells started to aggregate and on third day of culture aggregates had a medium diameter of
55.0 ± 23.8 µm (Fig. III.10).
2 3 4 7 10 17 24 30 37
0
100
200
300
***
***
***
Time (day)
Ag
gre
ga
te d
iam
eter
(
m)
Figure III.10: Aggregate size profile along culture time in a stirred suspension culture system. Aggregate diameter
measurements according to described in Materials and Methods, Section II.8. Data are mean ± SD of the diameter of at least
100 aggregates from one representative experiment of 2 independent experiments. *** indicate significant difference with P
< 0.001 by one-way ANOVA analysis with Tukey’s post multiple comparison test.
Cell viability along culture time was evaluated using FDA and PI dual staining (Materials and
Methods, Section II.7).
It was observed that until day 3 of culture aggregates presented mostly viable cells (green); a
few non viable cells were found (red) correspond to single cells that were not incorporated in the
aggregates (Fig. III.11), as assessed by FDA/ PI fluorescent viability assay.
By phase contrast microscopy (Fig III. 11) it was observed that cells started to aggregate 6
hours after inoculation, already existing in culture some duplets and triplets. At day 1, some small
aggregates were already observed. On following days, cells continued to aggregate, with ann increase
in aggregate´s size. At day 3, when differentiation started, aggregates had a medium diameter of
55.0 ± 23.8 µm (Fig. III.10), in agreement with Serra et al. (2007), which described that NT2 cells,
upon growing in stirred suspension culture, started forming small cell aggregates ranging from 50 to
100 µm within 48 hours.
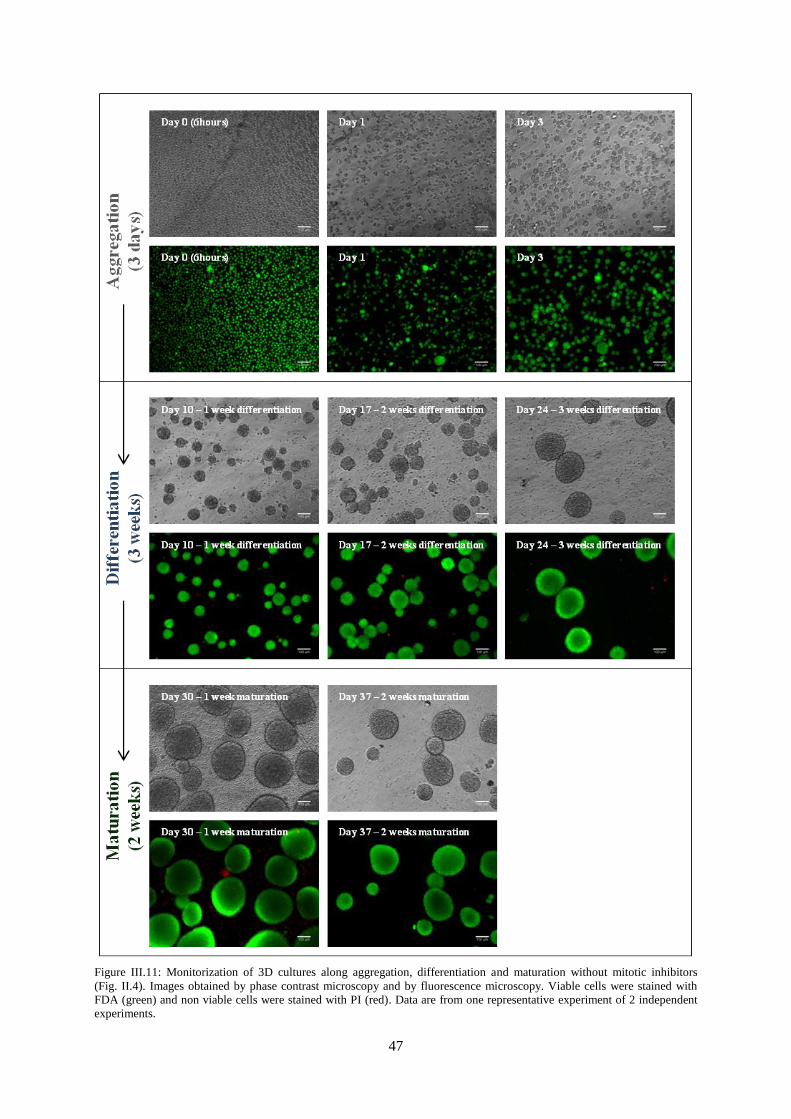
47
Figure III.11: Monitorization of 3D cultures along aggregation, differentiation and maturation without mitotic inhibitors
(Fig. II.4). Images obtained by phase contrast microscopy and by fluorescence microscopy. Viable cells were stained with
FDA (green) and non viable cells were stained with PI (red). Data are from one representative experiment of 2 independent
experiments.
48
The pluripotency state of the cells was evaluated at day 3 by immunofluorescence microscopy
and by flow cytometry, using the cell surface markers SSEA-1, SSEA-4, Tra-1-60, Tra-1-81, and the
intracelualr markers Oct-4 and nestin.
Immunofluorescence microscopy analysis showed that at both day 0 and day 3 all cells in
culture were oct-4 and nestin-positive (Fig. III.12) and that the majority of cells were stained for the
stem cell surface markers (Fig. III.13).
Figure III.12: Characterization of 3D cultures by immunofluorescence microscopy. Detection of Oct-4 and nestin at day 0
and day 3 of culture. Nuclei were labeled with DAPI. Data are from one representative experiment of 2 independent
experiments.
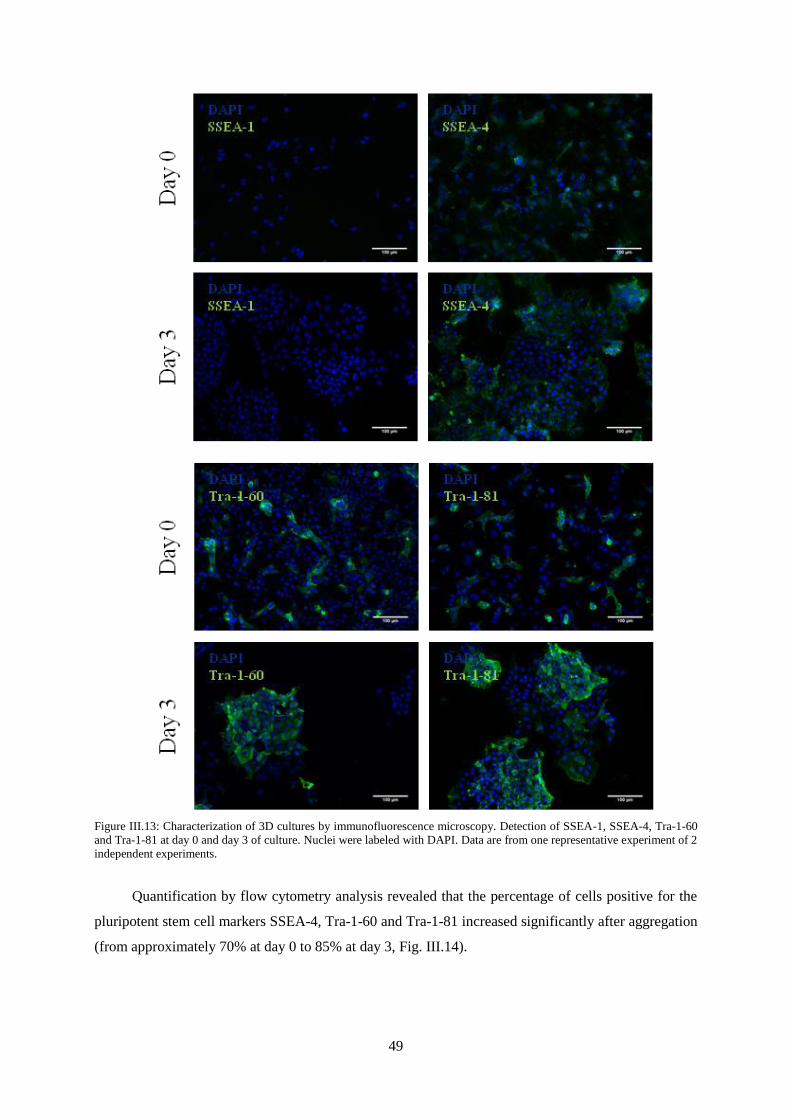
49
Figure III.13: Characterization of 3D cultures by immunofluorescence microscopy. Detection of SSEA-1, SSEA-4, Tra-1-60
and Tra-1-81 at day 0 and day 3 of culture. Nuclei were labeled with DAPI. Data are from one representative experiment of 2
independent experiments.
Quantification by flow cytometry analysis revealed that the percentage of cells positive for the
pluripotent stem cell markers SSEA-4, Tra-1-60 and Tra-1-81 increased significantly after aggregation
(from approximately 70% at day 0 to 85% at day 3, Fig. III.14).
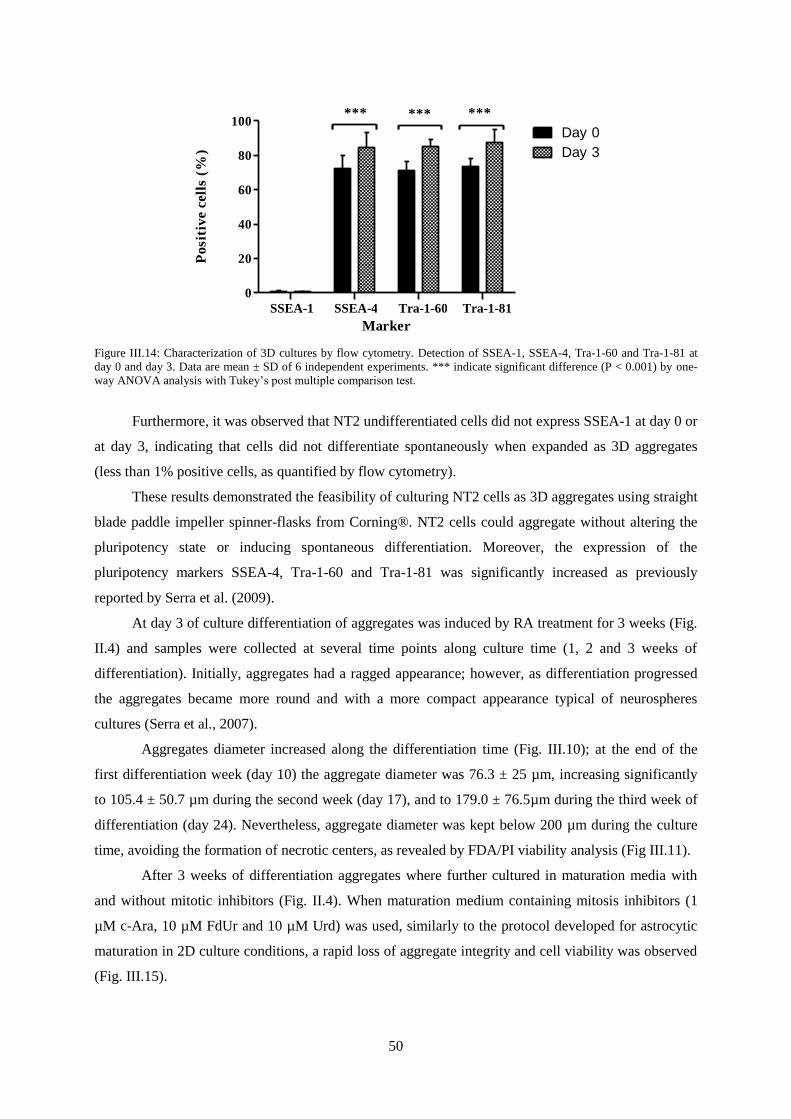
50
SSEA-1 SSEA-4 Tra-1-60 Tra-1-81
0
20
40
60
80
100*** ******
Day 0
Day 3
Marker
Po
sit
ive c
ell
s (
%)
Figure III.14: Characterization of 3D cultures by flow cytometry. Detection of SSEA-1, SSEA-4, Tra-1-60 and Tra-1-81 at
day 0 and day 3. Data are mean ± SD of 6 independent experiments. *** indicate significant difference (P < 0.001) by one-
way ANOVA analysis with Tukey’s post multiple comparison test.
Furthermore, it was observed that NT2 undifferentiated cells did not express SSEA-1 at day 0 or
at day 3, indicating that cells did not differentiate spontaneously when expanded as 3D aggregates
(less than 1% positive cells, as quantified by flow cytometry).
These results demonstrated the feasibility of culturing NT2 cells as 3D aggregates using straight
blade paddle impeller spinner-flasks from Corning®. NT2 cells could aggregate without altering the
pluripotency state or inducing spontaneous differentiation. Moreover, the expression of the
pluripotency markers SSEA-4, Tra-1-60 and Tra-1-81 was significantly increased as previously
reported by Serra et al. (2009).
At day 3 of culture differentiation of aggregates was induced by RA treatment for 3 weeks (Fig.
II.4) and samples were collected at several time points along culture time (1, 2 and 3 weeks of
differentiation). Initially, aggregates had a ragged appearance; however, as differentiation progressed
the aggregates became more round and with a more compact appearance typical of neurospheres
cultures (Serra et al., 2007).
Aggregates diameter increased along the differentiation time (Fig. III.10); at the end of the
first differentiation week (day 10) the aggregate diameter was 76.3 ± 25 µm, increasing significantly
to 105.4 ± 50.7 µm during the second week (day 17), and to 179.0 ± 76.5µm during the third week of
differentiation (day 24). Nevertheless, aggregate diameter was kept below 200 µm during the culture
time, avoiding the formation of necrotic centers, as revealed by FDA/PI viability analysis (Fig III.11).
After 3 weeks of differentiation aggregates where further cultured in maturation media with
and without mitotic inhibitors (Fig. II.4). When maturation medium containing mitosis inhibitors (1
µM c-Ara, 10 µM FdUr and 10 µM Urd) was used, similarly to the protocol developed for astrocytic
maturation in 2D culture conditions, a rapid loss of aggregate integrity and cell viability was observed
(Fig. III.15).
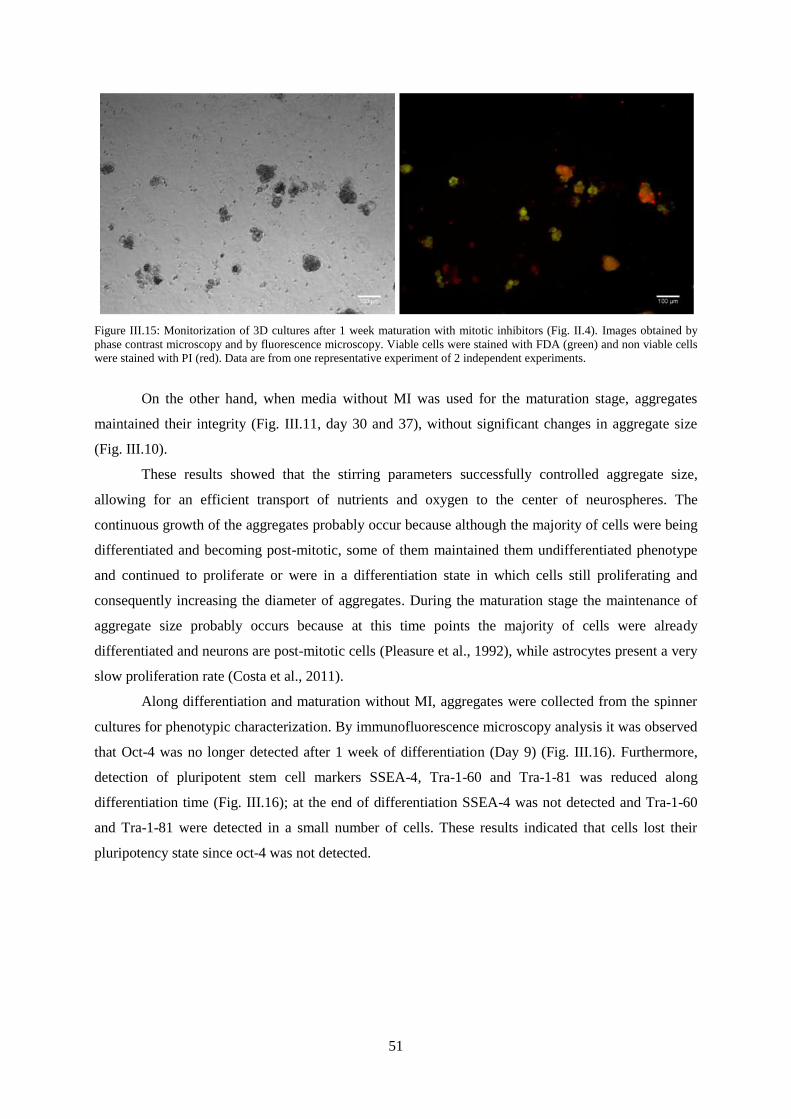
51
Figure III.15: Monitorization of 3D cultures after 1 week maturation with mitotic inhibitors (Fig. II.4). Images obtained by
phase contrast microscopy and by fluorescence microscopy. Viable cells were stained with FDA (green) and non viable cells
were stained with PI (red). Data are from one representative experiment of 2 independent experiments.
On the other hand, when media without MI was used for the maturation stage, aggregates
maintained their integrity (Fig. III.11, day 30 and 37), without significant changes in aggregate size
(Fig. III.10).
These results showed that the stirring parameters successfully controlled aggregate size,
allowing for an efficient transport of nutrients and oxygen to the center of neurospheres. The
continuous growth of the aggregates probably occur because although the majority of cells were being
differentiated and becoming post-mitotic, some of them maintained them undifferentiated phenotype
and continued to proliferate or were in a differentiation state in which cells still proliferating and
consequently increasing the diameter of aggregates. During the maturation stage the maintenance of
aggregate size probably occurs because at this time points the majority of cells were already
differentiated and neurons are post-mitotic cells (Pleasure et al., 1992), while astrocytes present a very
slow proliferation rate (Costa et al., 2011).
Along differentiation and maturation without MI, aggregates were collected from the spinner
cultures for phenotypic characterization. By immunofluorescence microscopy analysis it was observed
that Oct-4 was no longer detected after 1 week of differentiation (Day 9) (Fig. III.16). Furthermore,
detection of pluripotent stem cell markers SSEA-4, Tra-1-60 and Tra-1-81 was reduced along
differentiation time (Fig. III.16); at the end of differentiation SSEA-4 was not detected and Tra-1-60
and Tra-1-81 were detected in a small number of cells. These results indicated that cells lost their
pluripotency state since oct-4 was not detected.
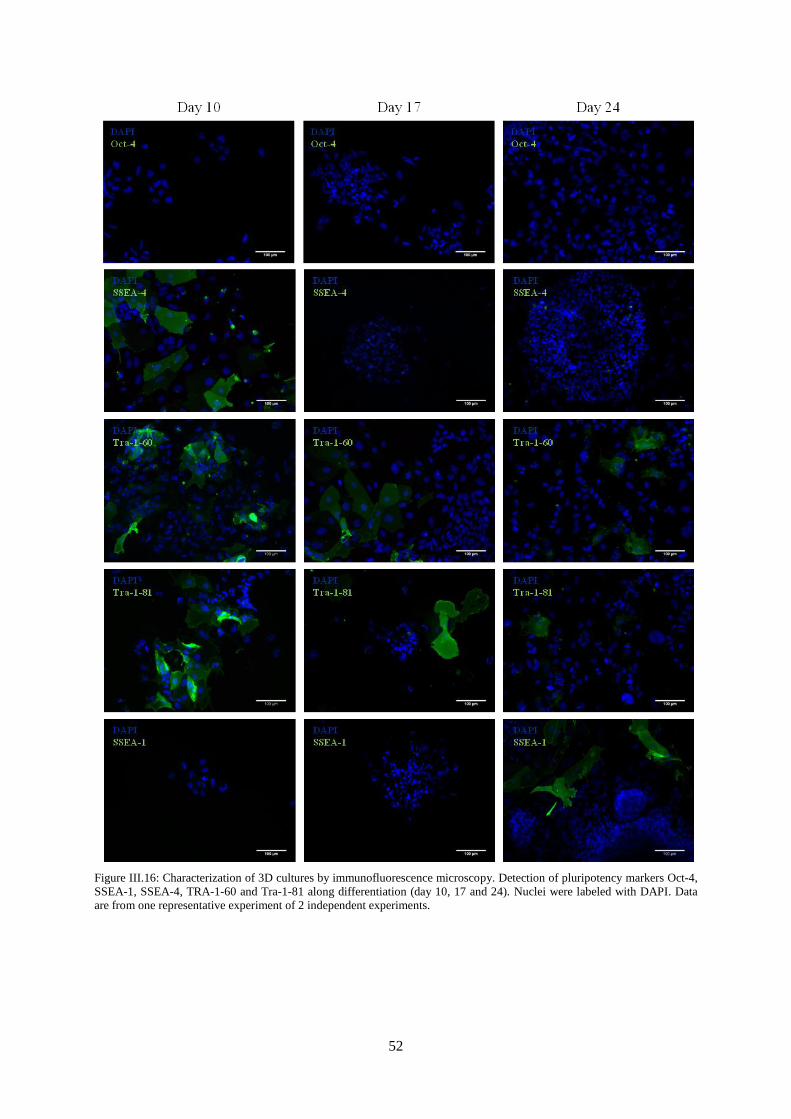
52
Figure III.16: Characterization of 3D cultures by immunofluorescence microscopy. Detection of pluripotency markers Oct-4,
SSEA-1, SSEA-4, TRA-1-60 and Tra-1-81 along differentiation (day 10, 17 and 24). Nuclei were labeled with DAPI. Data
are from one representative experiment of 2 independent experiments.
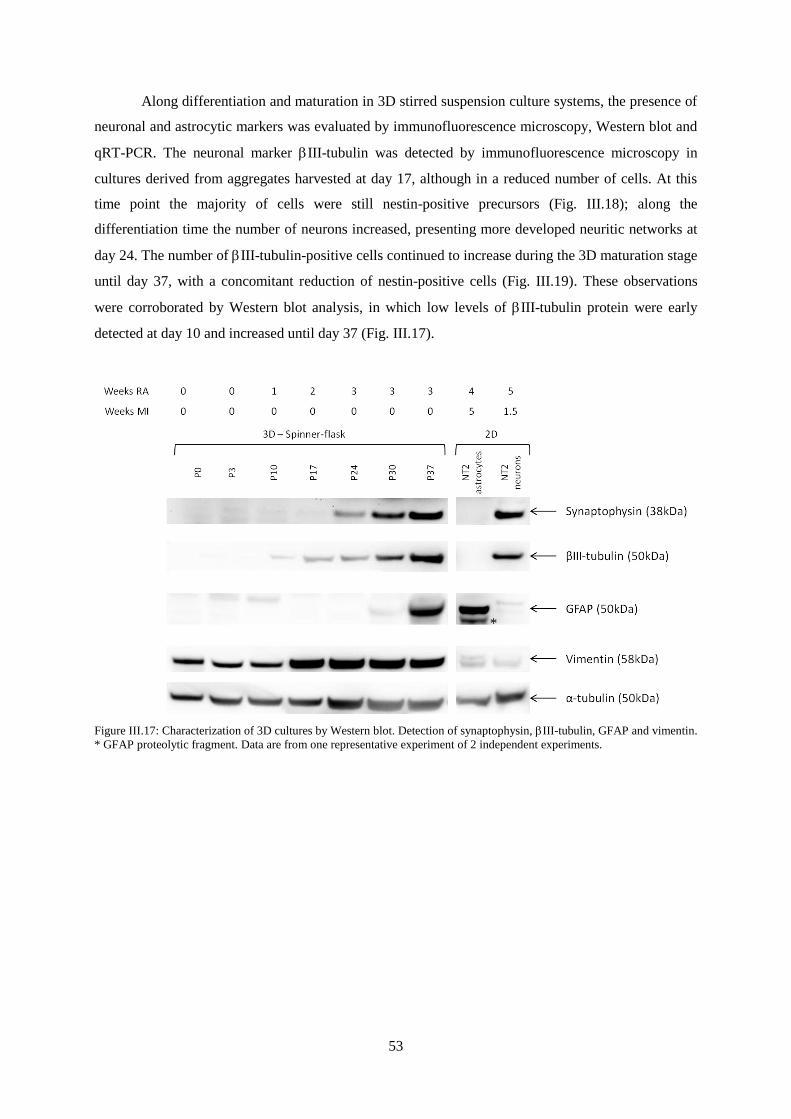
53
Along differentiation and maturation in 3D stirred suspension culture systems, the presence of
neuronal and astrocytic markers was evaluated by immunofluorescence microscopy, Western blot and
qRT-PCR. The neuronal marker III-tubulin was detected by immunofluorescence microscopy in
cultures derived from aggregates harvested at day 17, although in a reduced number of cells. At this
time point the majority of cells were still nestin-positive precursors (Fig. III.18); along the
differentiation time the number of neurons increased, presenting more developed neuritic networks at
day 24. The number of III-tubulin-positive cells continued to increase during the 3D maturation stage
until day 37, with a concomitant reduction of nestin-positive cells (Fig. III.19). These observations
were corroborated by Western blot analysis, in which low levels of III-tubulin protein were early
detected at day 10 and increased until day 37 (Fig. III.17).
Figure III.17: Characterization of 3D cultures by Western blot. Detection of synaptophysin, III-tubulin, GFAP and vimentin.
* GFAP proteolytic fragment. Data are from one representative experiment of 2 independent experiments.
*
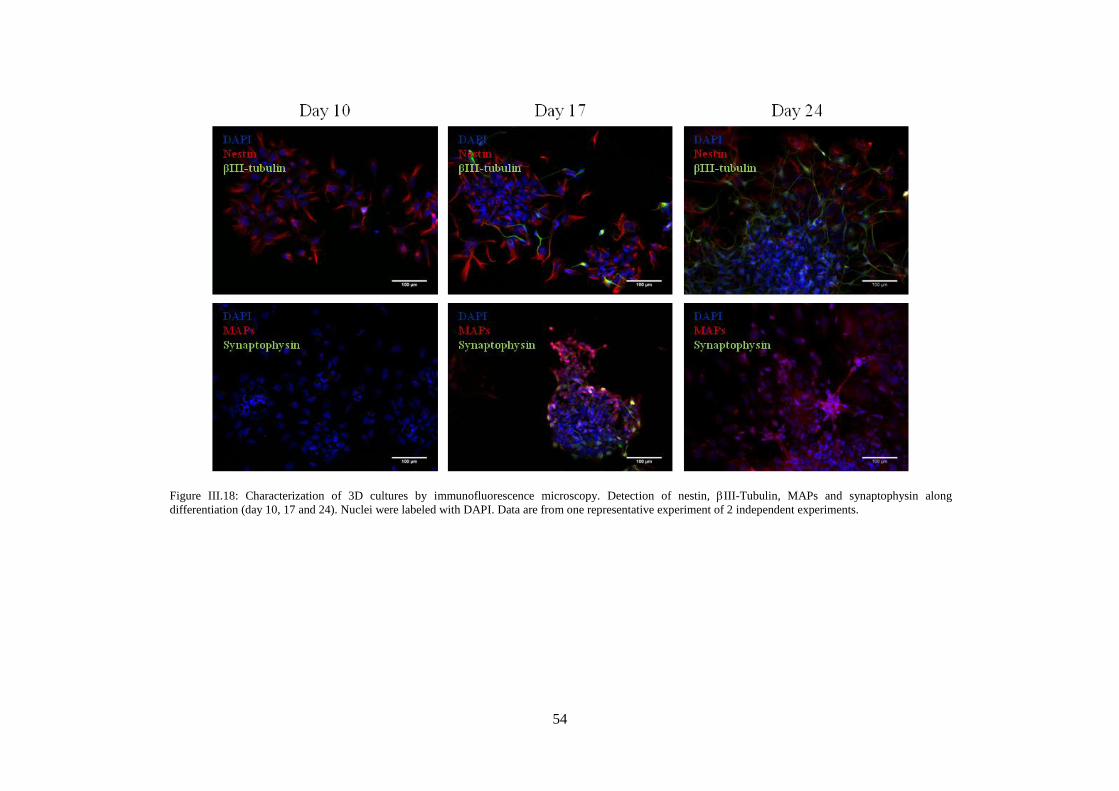
54
Figure III.18: Characterization of 3D cultures by immunofluorescence microscopy. Detection of nestin, III-Tubulin, MAPs and synaptophysin along
differentiation (day 10, 17 and 24). Nuclei were labeled with DAPI. Data are from one representative experiment of 2 independent experiments.
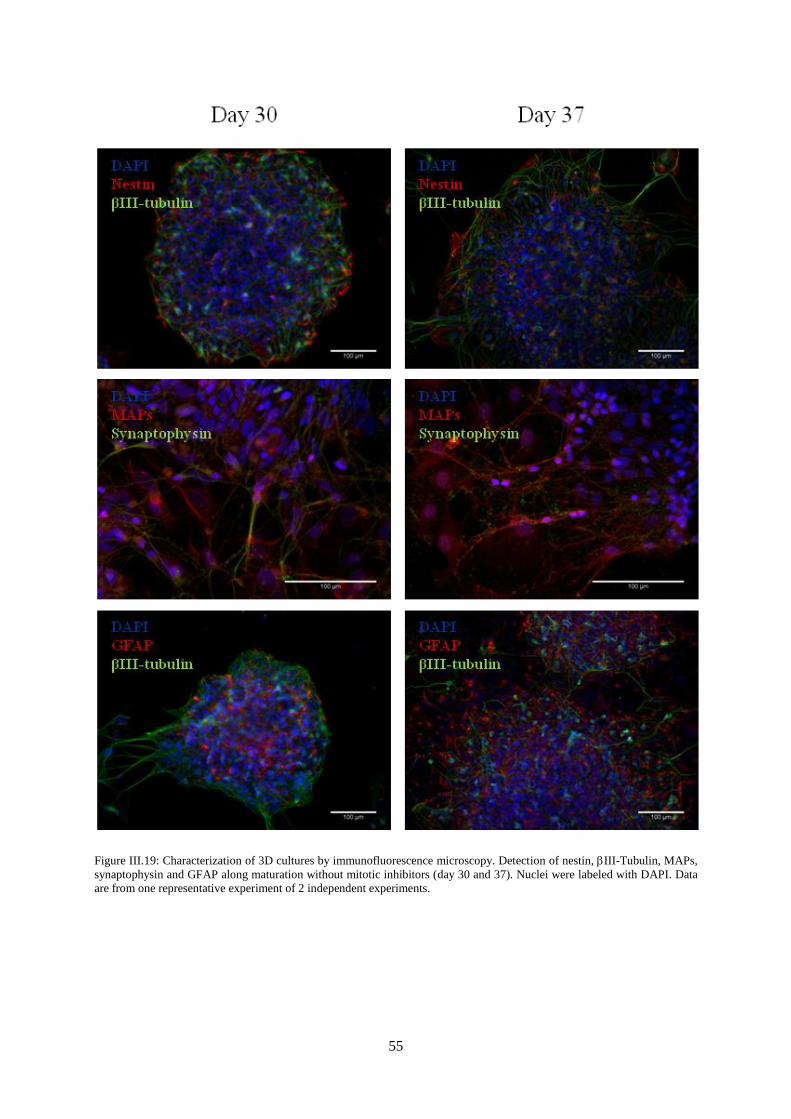
55
Figure III.19: Characterization of 3D cultures by immunofluorescence microscopy. Detection of nestin, III-Tubulin, MAPs,
synaptophysin and GFAP along maturation without mitotic inhibitors (day 30 and 37). Nuclei were labeled with DAPI. Data
are from one representative experiment of 2 independent experiments.
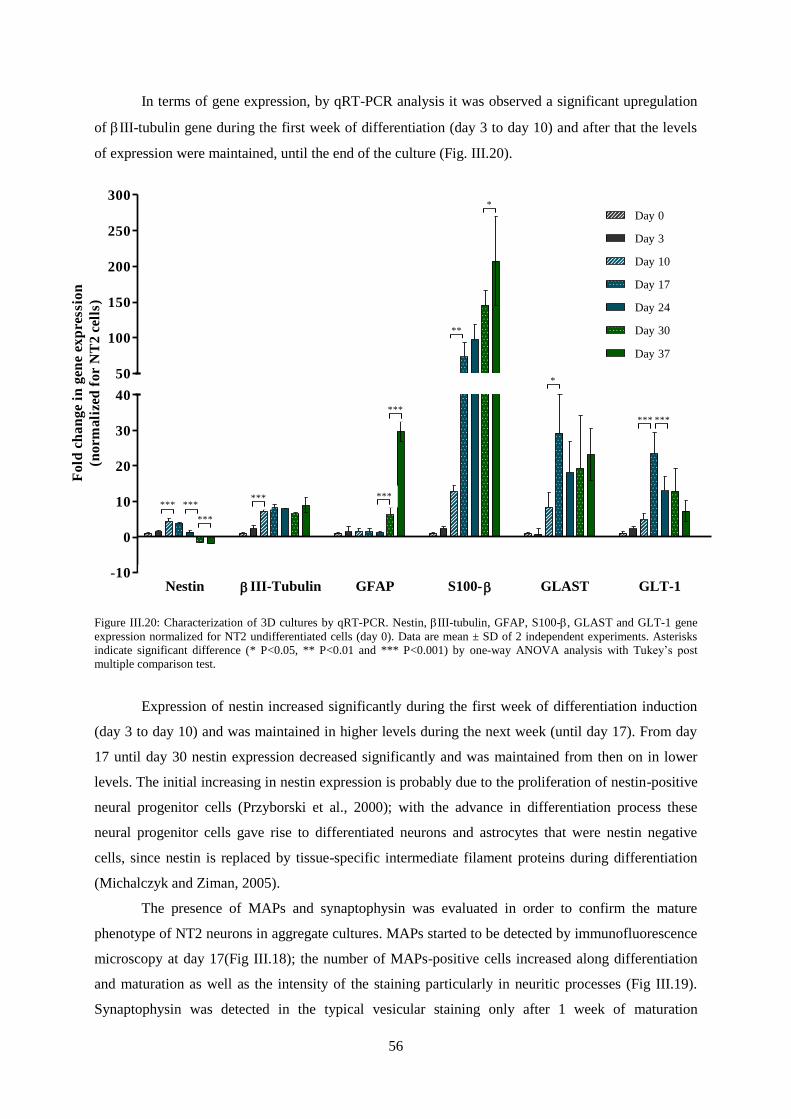
56
In terms of gene expression, by qRT-PCR analysis it was observed a significant upregulation
of III-tubulin gene during the first week of differentiation (day 3 to day 10) and after that the levels
of expression were maintained, until the end of the culture (Fig. III.20).
Nestin III-Tubulin GFAP S100- GLAST GLT-1-10
0
10
20
30
40
50
100
150
200
250
300
Day 0
Day 3
Day 10
Day 17
Day 24
Day 30
Day 37
*** ***
***
***
***
**
*
*
*** ***
***
Fo
ld c
ha
ng
e i
n g
en
e e
xp
ressio
n
(no
rm
ali
zed
fo
r N
T2
cel
ls)
Figure III.20: Characterization of 3D cultures by qRT-PCR. Nestin, III-tubulin, GFAP, S100-, GLAST and GLT-1 gene
expression normalized for NT2 undifferentiated cells (day 0). Data are mean ± SD of 2 independent experiments. Asterisks
indicate significant difference (* P<0.05, ** P<0.01 and *** P<0.001) by one-way ANOVA analysis with Tukey’s post
multiple comparison test.
Expression of nestin increased significantly during the first week of differentiation induction
(day 3 to day 10) and was maintained in higher levels during the next week (until day 17). From day
17 until day 30 nestin expression decreased significantly and was maintained from then on in lower
levels. The initial increasing in nestin expression is probably due to the proliferation of nestin-positive
neural progenitor cells (Przyborski et al., 2000); with the advance in differentiation process these
neural progenitor cells gave rise to differentiated neurons and astrocytes that were nestin negative
cells, since nestin is replaced by tissue-specific intermediate filament proteins during differentiation
(Michalczyk and Ziman, 2005).
The presence of MAPs and synaptophysin was evaluated in order to confirm the mature
phenotype of NT2 neurons in aggregate cultures. MAPs started to be detected by immunofluorescence
microscopy at day 17(Fig III.18); the number of MAPs-positive cells increased along differentiation
and maturation as well as the intensity of the staining particularly in neuritic processes (Fig III.19).
Synaptophysin was detected in the typical vesicular staining only after 1 week of maturation
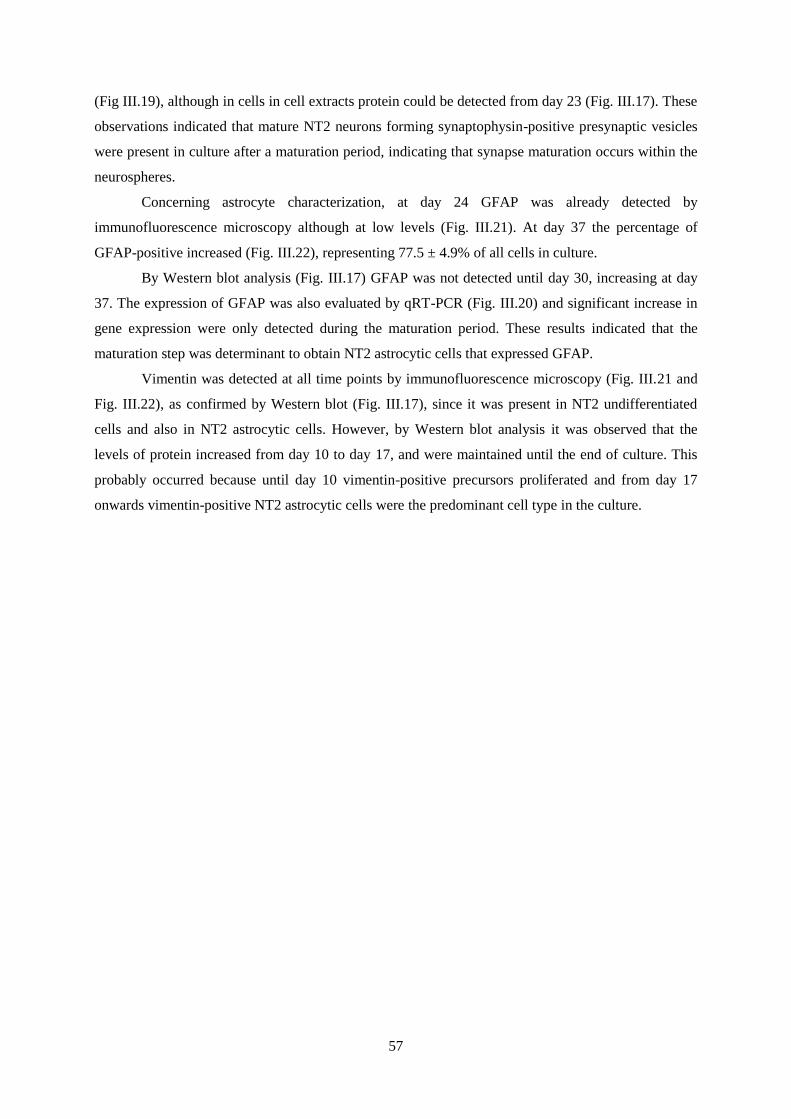
57
(Fig III.19), although in cells in cell extracts protein could be detected from day 23 (Fig. III.17). These
observations indicated that mature NT2 neurons forming synaptophysin-positive presynaptic vesicles
were present in culture after a maturation period, indicating that synapse maturation occurs within the
neurospheres.
Concerning astrocyte characterization, at day 24 GFAP was already detected by
immunofluorescence microscopy although at low levels (Fig. III.21). At day 37 the percentage of
GFAP-positive increased (Fig. III.22), representing 77.5 ± 4.9% of all cells in culture.
By Western blot analysis (Fig. III.17) GFAP was not detected until day 30, increasing at day
37. The expression of GFAP was also evaluated by qRT-PCR (Fig. III.20) and significant increase in
gene expression were only detected during the maturation period. These results indicated that the
maturation step was determinant to obtain NT2 astrocytic cells that expressed GFAP.
Vimentin was detected at all time points by immunofluorescence microscopy (Fig. III.21 and
Fig. III.22), as confirmed by Western blot (Fig. III.17), since it was present in NT2 undifferentiated
cells and also in NT2 astrocytic cells. However, by Western blot analysis it was observed that the
levels of protein increased from day 10 to day 17, and were maintained until the end of culture. This
probably occurred because until day 10 vimentin-positive precursors proliferated and from day 17
onwards vimentin-positive NT2 astrocytic cells were the predominant cell type in the culture.
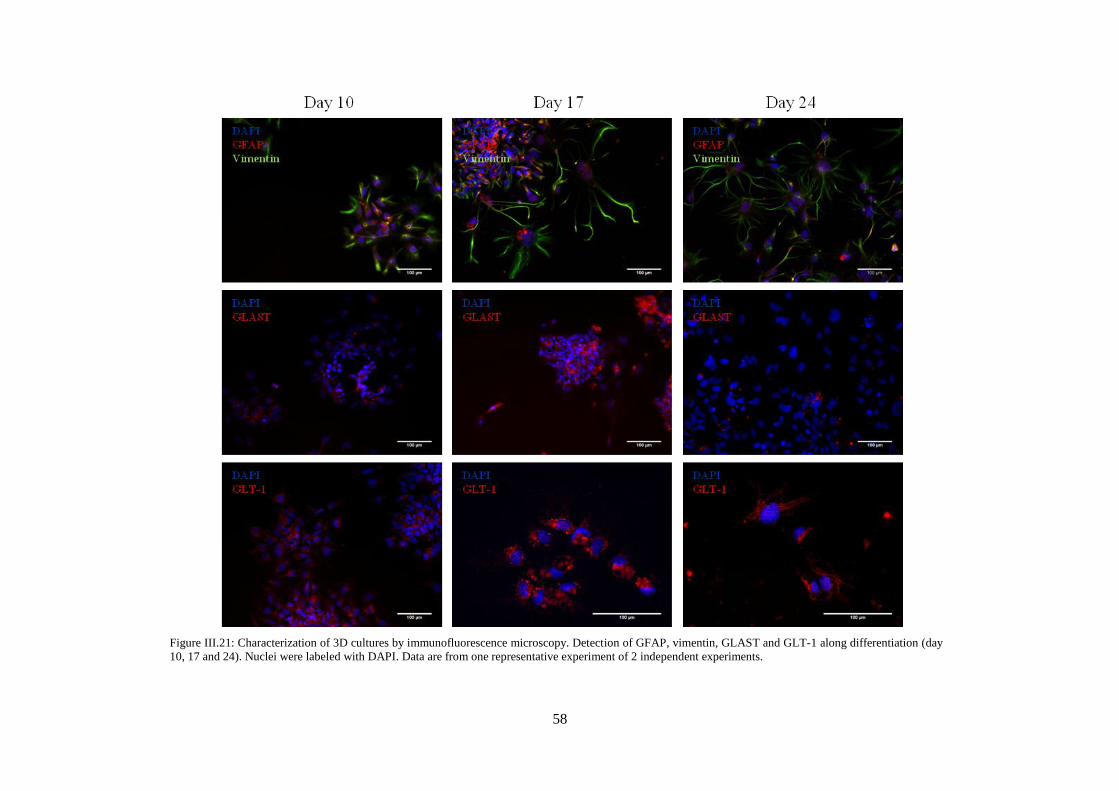
58
Figure III.21: Characterization of 3D cultures by immunofluorescence microscopy. Detection of GFAP, vimentin, GLAST and GLT-1 along differentiation (day
10, 17 and 24). Nuclei were labeled with DAPI. Data are from one representative experiment of 2 independent experiments.
59
Figure III.22: Characterization of 3D cultures by immunofluorescence microscopy. Detection of GFAP, vimentin, GLAST
and GLT-1 along maturation without mitotic inhibitors (day 30 and 37). Nuclei were labeled with DAPI. Data are from one
representative experiment of 2 independent experiments.
60
In order to confirm the mature phenotype of astrocytes, expression of S100-, GLAST and
GLT-1 was also evaluated.
Expression of S100- increased significantly from day 10 to 17 and was maintained without
significant differences until day 30 (145.8 ± 20.4 - fold changes in gene expression, Fig. III.20).
During the maturation period there was further upregulation of the gene, with a significant increase in
expression from day 30 to 37.
Expression of S100- was detected earlier than GFAP, probably because this calcium-binding
protein is present in neural precursor cells already committed with the astrocytic lineage (Donato et
al., 2009). Accordingly, it has been described that during glial differentiation of hiESC S-100
positive cells appear in culture after 4 weeks of differentiation whereas GFAP-positive astrocytes with
a stellate-like morphology appeared only 3 months of culture (Mariani et al., 2012).
Both glutamate transporters, GLAST and GLT-1, were detected from day 9 until the end of
culture although GLT-1 was detected almost all non-neuronal cells, contrary to GLAST that was
detected in a more reduced number of cells (Fig. III.21 and Fig. III.22). By qRT-PCR analysis it was
observed that GLAST expression increased significantly from day 10 to day 17 and then was
maintained until the end of culture and GLT-1 expression also increased significantly from day 10 to
day 17, although decreased from day 17 to day 23 and then was maintained until the end of culture
(Fig. III.20).
The expression of S100- as well as the detection of glutamate transporters GLAST and GLT-
1 in NT2 aggregates indicated that mature astrocytes were present in culture and the end of maturation
period. Nevertheless, some nestin-positive neural progenitor cells were still present in the aggregates,
as well as GLAST-positive cells probably corresponding to astrocytic precursors or mature astrocytes
(reviewed by Had-Aissouni, 2012).
In summary, the use of stirred suspension culture systems allowed obtaining a co-culture of
mature neuronal and astrocytic cells, with III-tubulin and GFAP positive cells homogenously
distributed throughout the neurospheres(Fig. III.19).
At the end of 3D maturation most of the cells were neurons (III-tubulin-positive) or
astrocytes (GFAP-positive) cells and the percentage of astrocytic cells was around 77%. Therefore, the
percentage of neuronal cells was lower than 13%. These results are in good agreement with the human
brain, in which neurons and astrocytes are present in a 1:10 ratio. Additionally, it has also been
reported that NSC, derived from embryonic CNS, which generate neurons and astrocytes in an
approximate ratio of 1:5, respectively (Schwars, 2007).
Neurons appeared early in culture, during the first weeks of differentiation, whilst an
additional maturation period was necessary to obtain astrocytes, as previously observed in 2D culture
systems. Although neurons were detected earlier in culture, the additional maturation period was
required to obtain mature neurons, expressing MAPs and vesicular synaptophysin.
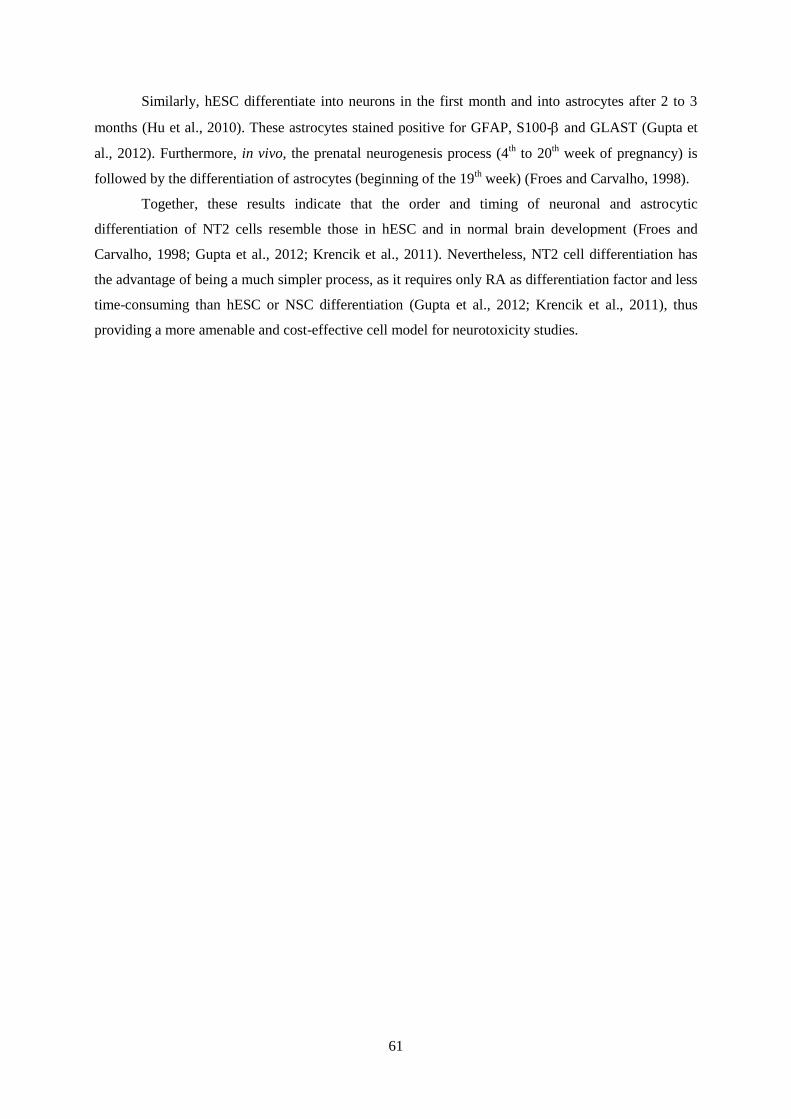
61
Similarly, hESC differentiate into neurons in the first month and into astrocytes after 2 to 3
months (Hu et al., 2010). These astrocytes stained positive for GFAP, S100- and GLAST (Gupta et
al., 2012). Furthermore, in vivo, the prenatal neurogenesis process (4th to 20
th week of pregnancy) is
followed by the differentiation of astrocytes (beginning of the 19th week) (Froes and Carvalho, 1998).
Together, these results indicate that the order and timing of neuronal and astrocytic
differentiation of NT2 cells resemble those in hESC and in normal brain development (Froes and
Carvalho, 1998; Gupta et al., 2012; Krencik et al., 2011). Nevertheless, NT2 cell differentiation has
the advantage of being a much simpler process, as it requires only RA as differentiation factor and less
time-consuming than hESC or NSC differentiation (Gupta et al., 2012; Krencik et al., 2011), thus
providing a more amenable and cost-effective cell model for neurotoxicity studies.
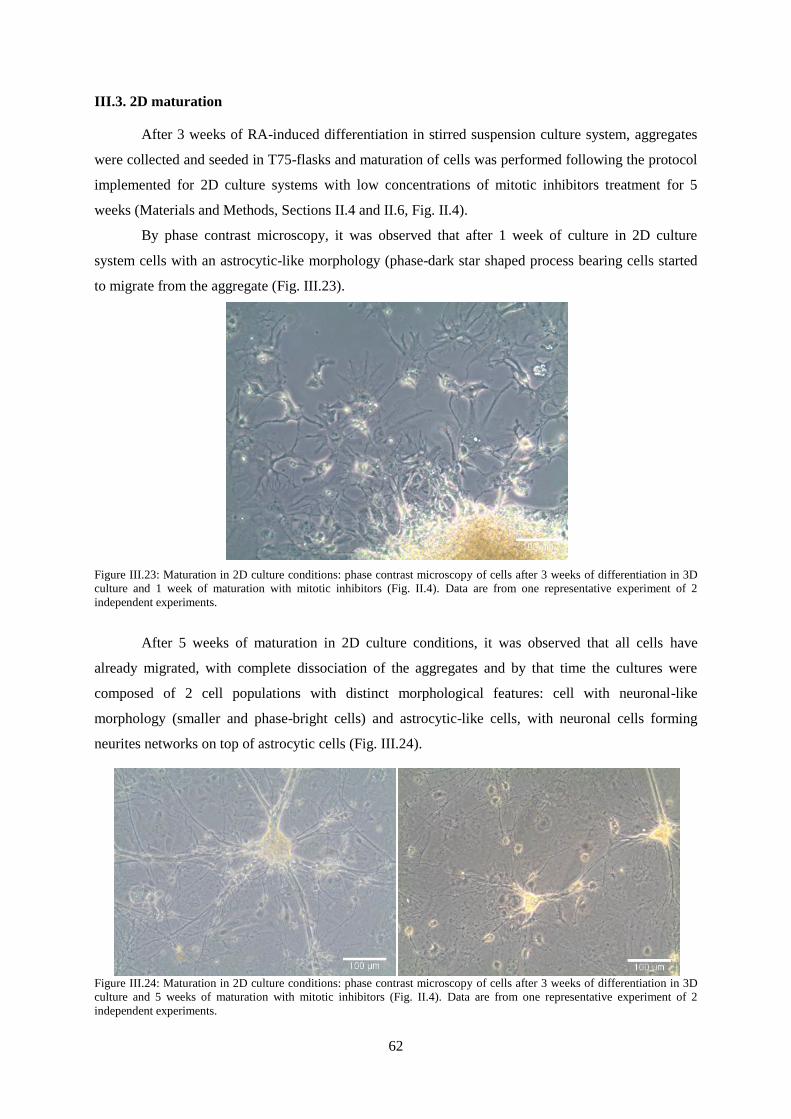
62
III.3. 2D maturation
After 3 weeks of RA-induced differentiation in stirred suspension culture system, aggregates
were collected and seeded in T75-flasks and maturation of cells was performed following the protocol
implemented for 2D culture systems with low concentrations of mitotic inhibitors treatment for 5
weeks (Materials and Methods, Sections II.4 and II.6, Fig. II.4).
By phase contrast microscopy, it was observed that after 1 week of culture in 2D culture
system cells with an astrocytic-like morphology (phase-dark star shaped process bearing cells started
to migrate from the aggregate (Fig. III.23).
Figure III.23: Maturation in 2D culture conditions: phase contrast microscopy of cells after 3 weeks of differentiation in 3D
culture and 1 week of maturation with mitotic inhibitors (Fig. II.4). Data are from one representative experiment of 2
independent experiments.
After 5 weeks of maturation in 2D culture conditions, it was observed that all cells have
already migrated, with complete dissociation of the aggregates and by that time the cultures were
composed of 2 cell populations with distinct morphological features: cell with neuronal-like
morphology (smaller and phase-bright cells) and astrocytic-like cells, with neuronal cells forming
neurites networks on top of astrocytic cells (Fig. III.24).
Figure III.24: Maturation in 2D culture conditions: phase contrast microscopy of cells after 3 weeks of differentiation in 3D
culture and 5 weeks of maturation with mitotic inhibitors (Fig. II.4). Data are from one representative experiment of 2
independent experiments.
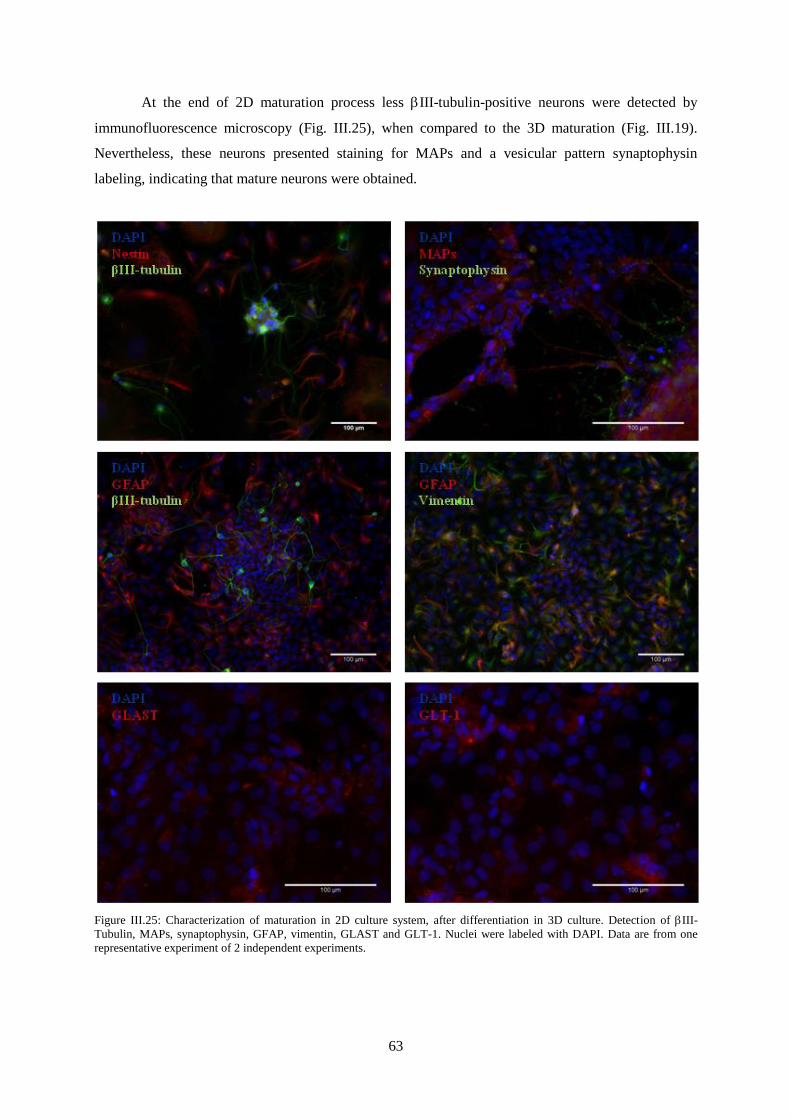
63
At the end of 2D maturation process less III-tubulin-positive neurons were detected by
immunofluorescence microscopy (Fig. III.25), when compared to the 3D maturation (Fig. III.19).
Nevertheless, these neurons presented staining for MAPs and a vesicular pattern synaptophysin
labeling, indicating that mature neurons were obtained.
Figure III.25: Characterization of maturation in 2D culture system, after differentiation in 3D culture. Detection of III-
Tubulin, MAPs, synaptophysin, GFAP, vimentin, GLAST and GLT-1. Nuclei were labeled with DAPI. Data are from one
representative experiment of 2 independent experiments.
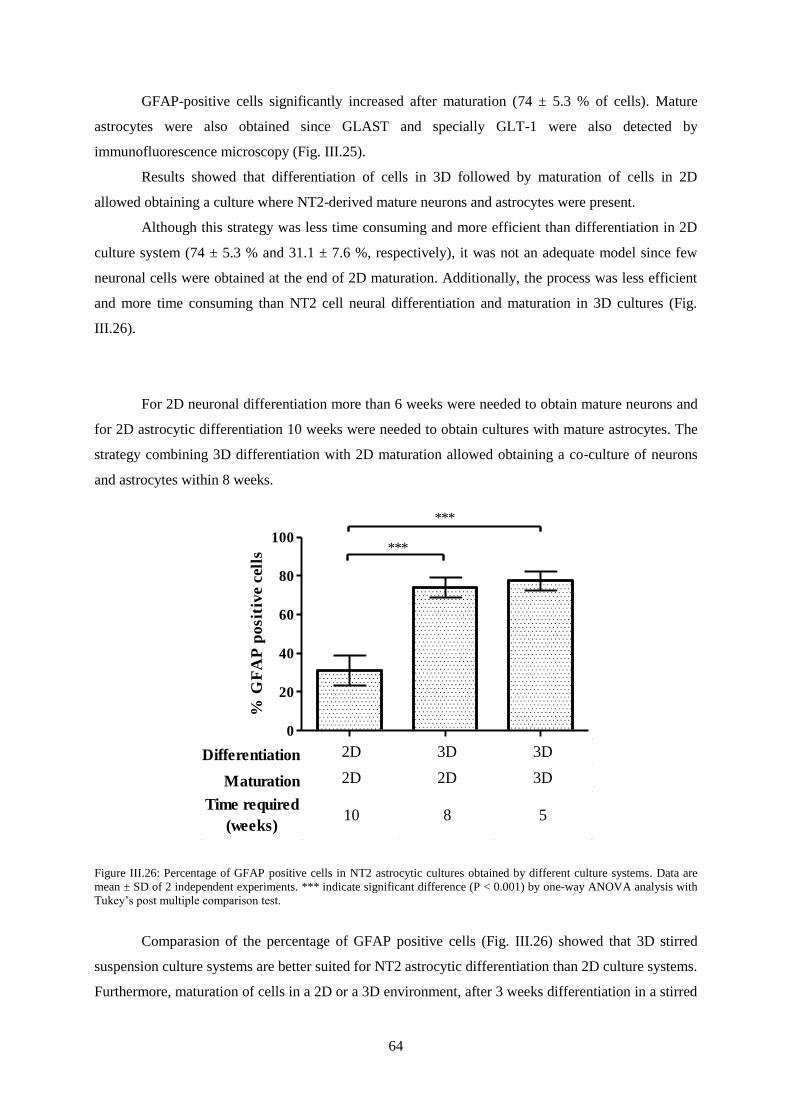
64
GFAP-positive cells significantly increased after maturation (74 ± 5.3 % of cells). Mature
astrocytes were also obtained since GLAST and specially GLT-1 were also detected by
immunofluorescence microscopy (Fig. III.25).
Results showed that differentiation of cells in 3D followed by maturation of cells in 2D
allowed obtaining a culture where NT2-derived mature neurons and astrocytes were present.
Although this strategy was less time consuming and more efficient than differentiation in 2D
culture system (74 ± 5.3 % and 31.1 ± 7.6 %, respectively), it was not an adequate model since few
neuronal cells were obtained at the end of 2D maturation. Additionally, the process was less efficient
and more time consuming than NT2 cell neural differentiation and maturation in 3D cultures (Fig.
III.26).
For 2D neuronal differentiation more than 6 weeks were needed to obtain mature neurons and
for 2D astrocytic differentiation 10 weeks were needed to obtain cultures with mature astrocytes. The
strategy combining 3D differentiation with 2D maturation allowed obtaining a co-culture of neurons
and astrocytes within 8 weeks.
0
20
40
60
80
100
***
***
Differentiation 2D 3D 3D
Maturation 2D 2D 3D
Time required
(weeks)10 8 5
% G
FA
P p
osit
ive c
ells
Figure III.26: Percentage of GFAP positive cells in NT2 astrocytic cultures obtained by different culture systems. Data are
mean ± SD of 2 independent experiments. *** indicate significant difference (P < 0.001) by one-way ANOVA analysis with
Tukey’s post multiple comparison test.
Comparasion of the percentage of GFAP positive cells (Fig. III.26) showed that 3D stirred
suspension culture systems are better suited for NT2 astrocytic differentiation than 2D culture systems.
Furthermore, maturation of cells in a 2D or a 3D environment, after 3 weeks differentiation in a stirred
65
suspension culture system, was equivalent since differences between GFAP postive cells percentage
were not significant, showing that an increased synchrony in response to RA of undifferentiated NT2
cells in a 3D environment (Tonge and Andrews, 2010) is a crucial step of this process to improve the
differentiation yields.
Nevertheless, the 3D culture system was the more efficient and less time consuming process
that allowed obtaining a neuronal-astrocytic co-culture, with mature neural cells in 5 weeks.
Another advantage of 3D stirred culture system is that it is scaleable, unlike the 2D culture
system.
Stirred suspension culture method gave rise to a more complex and robust model for
neurotoxicity studies since cell-cell and cell-ECM interactions can occur and consequently favoring
neuron-astrocyte interactions. Therefore, astrocytes have potential to protect neurons against some
insults and subsequently neuronal tolerance can be increased by the proximity of astrocytes and these
effects cannot be predicted in models where only neuronal cells were used.
Although human stem cells are powerful tools for neural differentiation and development of
models for neurotoxicity studies, a lot of exogenous factors such as growth factors and ECM
components, are required to maintain their stem cell status and also to induce cells to follow a standard
course of neuronal development, serially differentiating from pluripotent cells to neural progenitors
and then to fully differentiated neurons (Karumbayaram et al., 2009). Moreover, stem cells are not
ready available, also by ethical reasons regarding the use of human embryo-derived cells to maintain
and the needed reagents and media are expensive (Dhara and Stice, 2008; Stewart et al., 2003).
Besides, the maintenance of NT2 cells and their neural differentiation is less demanding and is more
amenable to scale-up and increase the yield of differentiated cell types.
In conclusion, stirred suspension culture system is a suitable method for NT2 cell line
differentiation in neuronal and astrocytic cells and allow to obtain a promising model for neurotoxicity
studies, in which both neurons and astrocytes are represented and, furthermore, many features of
human neurons and astrocytes are highly conserved in NT2-derived neural cells.
This model is more relevant to human CNS structure and functions than models with only
neuronal cells, probably mimicking better the in vivo situation, since it model better the basic CNS
functions unit.
Moreover, in this model is used a human cell line being easy to obtain cells and to maintain
these cells in culture and allowing to high-throughput screening. Due to the fact of cells were from
human origin interspecies data extrapolation is avoided in neurotoxicity studies.

66
67
IV. Conclusion
In this work a 2D culture system for astrocytic differentiation of NT2 cells was successfully
implemented in the Laboratory, as well as analytic tools essential for evaluation of astrocytic
differentiation efficiency.
Moreover, a human 3D neural cellular model was developed using stirred suspension culture
systems. By integrating an aggregation step with efficient differentiation and maturation processes,
this culture strategy allowed the generation of human neural aggregates highly enriched in mature
neurons and astrocytes. Furthermore, the yields of neuronal and astrocytic differentiation were
improved and the time of the process was significantly reduced, when compared to the standard static
differentiation protocols.
This efficient and robust scalable culture strategy is a promising tool for generation of large
numbers of human differentiated 3D neural aggregates, required for the implementation of high-
throughput neurotoxicity studies.

68
69
V. Perspectives
For validation of the cellular model for neurotoxicity testing, assays will be performed with
prototypical neurotoxicants, such as glutamate, acrylamide or hydroxyurea. Endpoints of cell viability,
detection of neuronal and astrocytic markers by qRT-PCR, Western blot and immunofluorescence
microscopy, as well as functional endpoints such as glutamate uptake, glutamine synthesis, cellular
energy (ATP) and caspase-3 activation will be used to evaluate the neurotoxic effect.
Further characterization of NT2 neuronal and astrocytic phenotypes obtained using 3D culture
systems includes the identification of the neurotransmitter phenotypes of NT2 neurons (by
immunofluorescence microscopy, Western blot and qRT-PCR analysis).Synaptic functionality will be
evaluated by loading the neurons with fluorescent styril amphiphilic dyes (e.g. FM1-43) that are
endocytosed and released following stimulation.
Astrocytes will be evaluated in terms of functionality by performing glutamate uptake assays
and synthesis of glutamine determined by Nuclear Magnetic Resonance (NMR).
Metabolic traffic between neurons and astrocytes in co-culture will also be evaluated by
combining NMR with metabolic flux analysis tools.
Moreover, the 3D cell culture strategy developed could be further improved by using
controlled stirred tank bioreactors. It is expected that by optimizing parameters such as mixing, pH,
temperature, oxygen and nutrient supply, higher differentiation yields and improvement of the
maturation process will be obtained.

70
71
VI. References
Allen NJ, Barres BA. 2009. Neuroscience: Glia — more than just brain glue. Nature 457:675-
677.
Andrews PW, Damjanov I, Simon D, Banting GS, Carlin C, Dracopoli NC, Fogh J. 1984.
Pluripotent embryonal carcinoma clones derived from the human teratocarcinoma cell line Tera-2.
Differentiation in vivo and in vitro. Lab. Invest. 50:147–162.
Bani-Yaghoub M, Felker JM, Naus CCG. 1999. Human NT2/D1 cells differentiate into
functional astrocytes. Neuro Report 10:3843-3846.
Benediktsson A, Marrs G, Tu JC, Worley P, Rothstein J, Bergles D, Dailey M. 2012. Neuronal
Activity Regulates Glutamate Transporter Dynamics in Developing Astrocytes. Glia 60:175–188.
Bergsmedh A, Donohoe ME, Hughes R-A, Hadjantonakis A-K. 2011. Understanding the
Molecular Circuitry of Cell Lineage Specification in the Early Mouse Embryo. Genes & Development
2:420-448.
Breier JM, Gassmann K, Kayser R, Stegeman H, Groot DD, Fritsche E, Shafer TJ. 2010.
Neural progenitor cells as models for high-throughput screens of developmental neurotoxicity: State of
the science. Neurotoxicology and Teratology 32:4-15.
Brodal P. 2010. The Central Nervous System: Structure and Function. Oxford University
Press.
Burkert K, Moodley K, Angel CE, Brooks A, Graham S. 2011. Detailed analysis of
inflammatory and neuromodulatory cytokine secretion 3 from human NT2 astrocytes using multiplex
bead array. Neurochemistry International.
Byrne J, Roberts J. 2009. From molecules to networks: An introduction to cellular and
molecular neuroscience. Elsevier, London.
Cantini G, Pisati F, Pessina S, Finocchiaro G, Pellegattat S. 2012. Immunotherapy against the
radial glia marker GLAST effectively triggers specific antitumor effectors without autoimmunity.
OncoImmunology 8:1-10.
Chao X-d, Fei F, Fei Z. 2010. The Role of Excitatory Amino Acid Transporters in Cerebral
Ischemia. Neurochem Res 35:1224–1230.
Coecke S, Goldberg AM, Allen S, Buzanska L, Calamandrei G, Crofton K, Hareng L, Hartung
T, Knaut H, Honegger P, Jacobs M, Lein P, Li A, Mundy W, Owen D, Schneider S, Silbergeld E,
Reum T, Trnovec T, Monnet-Tschudi F, Bal-Price1 A. 2007. Incorporating In Vitro Alternative
Methods for Developmental Neurotoxicity into International Hazard and Risk Assessment Strategies.
Environmental Health Perspectives 115:924-931.
Colognato H, P. D. Yurchenco PD. 2000. Form and function: The laminin family of
heterotrimers. Developmental Dynamics 218:213-234.
72
Conti L, Cattaneo E. 2010. Neural stem cell systems: physiological players or in vitro entities?
Nat. Rev. Neurosci. 11:176–187.
Costa MR, Ortega F, Brill MS, Beckervordersandforth R, Petrone C, Schroeder T, Götz M,
Berninger B. 2011. Continuous live imaging of adult neural stem cell division and lineage progression
in vitro. Development and stem cells 138:1057-1068.
Cukierman E, Pankov R, Yamada K. 2002. Cell interactions with thrre-dimensional matrices.
Current Opinion in Cell Biology 14:633-639.
Dehmelt L, Halpain S. 2004. The MAP2/Tau family of microtubule-associated proteins.
Genome Biology 6:204-214.
Dhara SK, Stice SL. 2008. Neural Differentiation of Human Embryonic Stem Cells. Journal of
Cellular Biochemistry 105:633–640.
Dityatev A, Schachner M. 2003. Extracellualr matrix molecules and synaptic plasticity. Nature
Reviews Neuroscience 4:456-468.
Donato R, Sorci G, Riuzzi F, Arcuri C, Bianchi R, Brozzi F, Tubaro C, Giambanco I. 2009.
S100B's double life: Intracellular regulator and extracellular signal. Biochimica et Biophysica Acta
1793:1008–1022.
Dunlop J, Lou Z, McIlvain HB. 1999. Properties of excitatory amino acid transport in the
human U373 astrocytoma cell line. Brain Research 839:235–242.
East E, Golding JP, Phillips JB. 2009. A versatile 3D culture model facilitates monitoring of astrocytes
undergoing reactive gliosis. Journal of Tissue Engineering and regenerative medicine 3:634–646.
Eng L, Ghirnikar R, Lee Y. 2000. Glial fibrillary acidic protein: GFAP-thirty-one years (1969-
2000). Neurochem Res. 25:1439-1451.
Froes MM, Carvalho ACCd. 1998. Gap junction- mediated loops of neuronal-glial
interactions. Glia 24:97-107.
Goodfellow CE, Graham SE, Dragunow M, Glass aM. 2011. Characterization of Ntera2/D1
Cells as a Model System for the Investigation of Cannabinoid Function in Human Neurons and
Astrocytes. Journal of Neuroscience Research.
Guillemain I, Alonso G, Patey G, Privat A, Chaudieu I. 2000. Human NT2 Neurons Express a
Large Variety of Neurotransmission Phenotypes In Vitro. The Journal of Comparative Neurology
422:380–395.
Gupta K, Patani R, Baxter P, Serio A, Story D, Tsujita T, Hayes JD, Pedersen RA,
Hardingham GE, Chandran S. 2012. Human embryonic stem cell derived astrocytes mediate non-cell-
autonomous neuroprotection through endogenous and drug-induced mechanisms. Cell Death and
Differentiation 19:779–787.
Had-Aissouni L. 2012. Toward a new role for plasma membrane sodium-dependent glutamate
transporters of astrocytes: maintenance of antioxidant defenses beyond extracellular glutamate
clearance. Amino Acids 42:181–197.
73
Harry GJ, Tiffany-Castiglioni E. 2005. Evaluation of neurotoxic potential by use of in vitro
systems. . Expert Opin Drug Metab Toxicol 1:701–713.
Hartley RS, Margulis M, Fishman PS, Lee VM, Tang CM. 1999. Functional synapses are
formed between human NTera2 (NT2N, hNT) neurons grown on astrocytes. J Comp Neurol 407:1-10.
Haycock JW. 2011. 3D Cell Culture: A Review of Current Approaches and
Techniqueseditor^editors. 3D Cell Culture: Methods and Protocols, Methods in Molecular Biology.
Springer Science.
Hill EJ, Woehrling EK, Prince M, Coleman MD. 2008. Differentiating human NT2/D1
neurospheres as a versatile in vitro 3D model system for developmental neurotoxicity testing.
Toxicology 249:243-250.
Hindie M, Vayssade M, Dufresne M, Queant S, Warocquier-Clerout R, Legeay G, Vigneron
P, Olivier V, Duval JL, Nagel MD. 2006. Interactions of B16F10 melanoma cells aggregated on a
cellulose substrate. J. Cell. Biochem. 99:96–104.
Honegger. 2011. Preparation, maintenance and use of serum-free aggregating brain cell
cultures Methods in Molecular Biology 758.
Howard BM, Mo Z, Filipovic R, Moore AR, Antic SD, Zecevic N. 2008. Radial Glia Cells in
the Developing Human Brain. Neuroscientist 14:459-473.
Hu B-Y, Weick JP, Yu J, Ma L-X, Zhang X-Q, Thomson JA, Zhang S-C. 2010. Neural
differentiation of human induced pluripotent stem cells follows developmental principles but with
variable potency. PNAS 9:4335–4340.
Hutmacher DW, Singh H. 2008. Computational fluid dynamics for improved bioreactor design
and 3D culture. Trends in Biotechnology 26:166-172.
Irons HR, Cullen DK, Shapiro NP, Lambert NA, Lee RH, LaPlaca MC. 2008. Three-
dimensional neural constructs: a novel platform for neurophysiological investigation. Journal of
Neural Enginnering 5:333-341.
Ji J, Werbowetski-Ogilvie TE, Zhong B, Hong S-H, Bhatia M. 2009 Pluripotent Transcription
Factors Possess Distinct Roles in Normal versus Transformed Human Stem Cells. PLoS ONE 4:1-9.
Justice BA, Badr NA, Felder RA. 2009. 3D cell culture opens new dimensions in cell-based
assays. Drug Discovery Today 14:102-107.
Karumbayaram S, Novitch B, Patterson M, Umbach J, Richter L, Lindgren A, Conway A,
Clark A, Goldman S, Plath K, Wiedau-Pazos M, Kornblum H, Lowry W. 2009. Directed
Differentiation of Human-Induced Pluripotent Stem Cells Generates Active Motor Neurons. Stem
Cells 27:806–811.
Kasper C, Griensven Mv, Pörtner R. 2009. Bioreactor Systems for Tissue Engineering.
Springer.
Kehoe DE, Jing D, Lock LT, Tzanakakis ES. 2010. Scalable Stirred-Suspension Bioreactor
Culture of Human Pluripotent Stem Cells. Tissue Enginnering 16:405-421.
74
Kim JB. 2005. Three-dimensional tissue culture models in cancer biology. Seminars in Cancer
Biology 15:365–377.
Kim JB, Stein R, O’Hare MJ. 2004. Three-dimensional in vitro tissue culture models of breast
cancer – a review. Breast Cancer Research and Treatment 85:281–291.
Kim K, Lee S, Kegelmen TP, Su Z-Z, Dash R. 2011. Role of Excitatory Amino Acid
Transporter-2 (EAAT2) and Glutamate in Neurodegeneration: Opportunities for Developing Novel
Therapeutics. Journal of Cellular Physiology:2484-2493.
Kondziolka D, Wechsler L. 2008. Stroke repair with cell transplantation: neuronal cells,
neuroprogenitor cells, and stem cells. Neurosurg Focus 24:E13 (1-6).
Krencik R, Weick JP, Liu Y, Zhang ZJ, Zhang SC. 2011. Specification of transplantable
astroglial
subtypes from human pluripotent stem cells. Nat Biotechnol 29:528–534.
LaPlaca MC, Vernekar VN, Shoemaker JT, Cullen DK. 2010. Three-Dimensional Neuronal
Cultures.187-204.
Lee VM, Andrews PW. 1986. Differentiation of NTERA-2 clonal human embryonal
carcinoma cells into neurons involves the induction of all three neurofilament proteins. Journal
Neuroscience Research 6:514–521.
Lilienblum W, Dekant W, Foth H, Gebel T, Hengstler JG, Kahl R. 2008. Alternative methods
to safety studies in experimental animals: role in the risk assessment of chemicals under the new
European Chemicals Legislation (REACH). Arch Toxicol 82:211–236.
Lim JH, Gibbons HM, O'Carroll SJ, Narayan PJ, Faull RLM, Dragunow M. 2007.
Extracellular signal-regulated kinase involvement in human astrocyte migration. Brain Research
1164:1-13.
Liu H, Lin J, Roy K. 2006 Effect of 3D scaffold and dynamic culture condition on the global
gene expression profile of mouse embryonic stem cells. Biomaterials 27:5978–89.
Liu M, Hurn PD, Roselli CE, Alkayed NJ. 2007. Role of P450 aromatase in sex-specific
astrocytic cell death. J Cereb Blood Flow Metab 27:135–141.
Livak KJ, Schmittgen TD. 2001. Analysis of Relative Gene Expression Data Using Real-Time
Quantitative PCR and the 2-DDCt Method. Methods 25:402-408.
Louvi A, Artavanis-Tsakonas S. 2006. Notch signalling in vertebrate neural development.
Nature Reviews Neuroscience 7
93-102.
Magistretti P, Ransom B. 2002. Astrocyteseditor^editors. Neuropsychopharmacology: The
fifth generation of progress.
Mariani J, Simonini MV, Palejev D, Tomasini L, Coppola G, Szekely AM, Horvathe TL,
Vaccarino FM. 2012. Modeling human cortical development in vitro using induced pluripotent stem
cells. PNAS.
75
Martin I, Wendt D, Heberer M. 2004. The role of bioreactors in tissue engineering. TRENDS
in Biotechnology 22:80-86.
Mazzoleni G, Lorenzo DD, Steimberg N. 2009. Modelling tissues in 3D: the next future of
pharmaco-toxicology and food research? Genes Nutr 4:13–22.
McCaffery P, Drager UC. 2000. Regulation of retinoic acid signaling in the embryonic
nervous system: a master differentiation factor. Cytokine & Growth Factor Reviews 11:233-249.
McPartland JM, Glass M, Pertwee RG. 2007. Meta-analysis of cannabinoid ligand binding
affinity and receptor distribution: interspecies differences. Br J Pharmacol 152:583–593.
Moors M, Rockel TD, Abel J, Cline JE, Gassmann K, Schreiber T, Schuwald J, Weinmann N,
Fritsche E. 2009. Human Neurospheres as Three-Dimensional Cellular Systems for Developmental
Neurotoxicity Testing. Environmental Health Perspectives 117:1131-1138.
Michalczyk K, Ziman M. 2005. Nestin structure and predicted function in cellular cytoskeletal
organisation. Histol Histopathol 20:665-671.
Middeldorp J, Boer K, Sluijs JA, Filippis LD, Encha-Razavi F, Vescovi AL, Swaab DF,
Aronica E, Hol EM. 2010. GFAPd in radial glia and subventricular zone progenitors in the developing
human cortex. Development 137:313-321.
Miller G. 2010. Is pharma running out of brain ideas? Science 239.
Molofsky AV, Krenick R, Ullian E, Tsai H-h, Deneen B, Richardson WD, Barres BA,
Rowitch DH. 2012. Astrocytes and disease: a neurodevelopmental perspective. Genes & Development
26:891–907.
Oberheim NA, Takano T, Han X, He W, Lin JHC, Wang F, Xu Q, Wyatt JD, Pilcher W,
Ojemann JG, Ransom BR, Goldman SA, Nedergaard M. 2009. Uniquely Hominid Features of Adult
Human Astrocytes. The Journal of Neuroscience 29:3276 –3287.
Oberheim NA, Wang X, Goldman S, Nedergaard M. 2006. Astrocytic complexity
distinguishes the human brain. Trends in Neuroscience 29:547–553.
Ozdener H. 2007. Inducible functional expression of Bcl-2 in human astrocytes derived from
NTera-2 cells. Journal of Neuroscience Methods 159:8-18.
Pal R, Ravindran G. 2006. Assessment of pluripotency and multilineage differentiation
potential of NTERA-2 cells as a model for studying human embryonic stem cells. Cell Prolif. 39:585–
598.
Pampaloni F, Reynaud EG, Stelzer EHK. 2007. The third dimension bridges the gap between
cell culture and live tissue. Nat. Rev. Mol. Cell Biol. 8:839–845.
Pankov R, Yamada KM. 2002. Fibronectin at a glance. J Cell Sci 115:3861-3863.
Pleasure SJ, Lee VM. 1993. NTera 2 cells: a human cell line which displays characteristics
expected of a human committed neuronal progenitor cell. Journal Neuroscience Research 35:585–602.
76
Pleasure SJ, Page C, Lee VM. 1992. Pure, postmitotic, polarized human neurons derived from
NTera 2 cells provide a system for expressing exogenous proteins in terminally differentiated neurons.
Journal Neuroscience 12:1802–1815.
Podrygajlo G, Tegeng MA, Gierse A, Paquet-Durand F, Tan S, Bicker G, Stern M. 2009.
Cellular phenotypes of human model neurons (NT2) after differentiation in aggregate culture. Cell
Tissue Research 336:439–452.
Przyborski SA, Morton IE, Wood A, Andrews PW. 2000. Developmental regulation of
neurogenesis in the pluripotent human embryonal carcinoma cell line NTERA-2. . Eur Journal
Neuroscience 12:3521–3528.
Purves D, Augustine GJ, Fitzpatrick D, editors. 2001. Neuroscience.
Reali C, Pillai R, Saba F, Cabras S, Michetti F, Sogos V. 2011. S100B modulates growth
factors and costimulatory molecules expression in cultured human astrocytes. Journal of
Neuroimmunology 243:95-99.
Regan MR, Huang YH, Kim YS, Dykes-Hoberg MI, Jin L, Watkins AM, Bergles DE,
Rothstein JD. 2007. Variations in promoter activity reveal a differential expression and physiology of
glutamate transporters by glia in the developing and mature CNS. J Neurosci 27:6607–6619.
Reubinoff BE, Pera MF, Fong C-Y, Trounson A, Bongso A. 2000. Embryonic stem cell lines
from human blastocysts: somatic differentiation in vitro. Nature 18:339-404.
Rodrigues CAV, Diogo MM, Silva CLd, Cabral JMS. 2011. Design and operation of
bioreactor systems for the expansion of pluripotent stem cell-derived neural stem cells.
Saha RN, Pahan K. 2006. Signals for the induction of nitric oxide synthase in astrocytes.
Neurochem Int 49:154–163.
Sanai N, Tramontin AD, Quinones-Hinojosa A, Barbaro NM, Gupta N, Kunwar S, Lawton
MT, McDermott MW, Parsa AT, Manuel-Garcia VJ. 2004. Unique astrocyte ribbon in adult human
brain contains neural stem cells but lacks chain migration. Nature 427:740-744.
Sanchez MC, Benitez A, Ortloff L, Greena LM. 2009. Alterations in Glutamate Uptake in
NT2-Derived Neurons and Astrocytes after Exposure to Gamma Radiation. Radiat Research 171:41-
52.
Sandhu JK, Pandey S, Ribecco-Lutkiewicz M, Monette R, Borowy-Borowski H, Walker PR,
Sikorsk M. 2003. Molecular Mechanisms of Glutamate Neurotoxicity in Mixed Cultures of NT2-
Derived Neurons and Astrocytes: Protective Effects of Coenzyme Q10. Journal of Neuroscience
Research 72:691–703.
Sandhu JK, Sikorska M, Walker PR. 2002. Characterization of Astrocytes Derived From
Human NTera-2/D1 Embryonal Carcinoma Cells. Journal of Neuroscience Research 68:604-614.
Santos SS, Fonseca LL, Monteiro MAR, Carrondo MJT, Alves PM. 2005. Culturing Primary
Brain Astrocytes Under a Fully Controlled Environment in a Novel Bioreactor. Journal Neuroscience
Research 79:26-32.
77
Santos SS, Leite S, Sonnewald U, Carrondo MJT, Alves PM. 2007. Stirred Vessel Cultures of
Rat Brain Cells Aggregates: Characterization of Major Metabolic Pathways and Cell Population
Dynamics. Journal Neuroscience Research 85:3386–3397.
Schwars J. 2007. Developmental perspectives on human midbrain-derived neural stem cells.
Parkinsonism and Related Disorders13:466-468.
Schwartz CM, Tavakoli T, Jamias C, Park S-S, Maudsley S, Martin B, Phillips TM, Yao PJ,
Itoh K, Ma W, Rao MS, Arenas E, Mattson MP. 2012. Stromal Factors SDF1a, sFRP1, and VEGFD
Induce Dopaminergic Neuron Differentiation of Human Pluripotent Stem Cells. Journal of
Neuroscience Research 90:1367–1381.
Serra M, Brito C, Correia C, Alves PM. 2012. Process engineering of human pluripotent stem
cells for clinical application. Trends in Biotechnology.
Serra M, Brito C, Costa EM, Sousa MF, Alves PM. 2009. Integrating human stem cell
expansion and neuronal differentiation in bioreactors. BMC Biotechnology 9:82-96.
Serra M, Brito C, Sousa M, Jensen J, Tostões R, Clemente J, Strehl R, Hyllner J, Carrondo
MJT, Alves PM. 2010. Improving expansion of pluripotent human embryonic stem cells in perfused
bioreactors through oxygen control. Journal of Biotechnology 148:208–215.
Serra M, Leite S, Brito C, Costa J, Carrondo MJT, Alves PM. 2007. Novel culture strategy for
human stem cell proliferation and neuronal differentiation. Journal of Neuroscience Research 85:3557-
3566.
Sild M, Ruthazer ES. 2011. Radial Glia: Progenitor, Pathway, and Partner. Neuroscientist
17:288-302
Sofroniew MV, Vinters HV. 2010. Astrocytes: biology and pathology. Acta Neuropathol
119:7–35.
Solozobova V, Wyvekens N, Pruszak J. 2012. Lessons from the Embryonic Neural Stem Cell
Niche for Neural Lineage Differentiation of Pluripotent Stem Cells. Stem Cell Rev and Rep 8:813–
829.
Stewart R, Christie V, Przyborski S. 2003. Manipulation of Human Pluripotent Embryonal
Carcinoma Stem Cells and the Development of Neural Subtypes. Stem Cells 21:248-256.
Takuma K, Baba A, Matsuda T. 2004. Astrocyte apoptosis: implications for neuroprotection. Progress
in Neurobiology 72:111–127.
Tan W, Krishnaraj R, . TAD. 2001. Evaluation of nanostructured composite collagen-chitosan
matrices for tissue engineering. Tissue Eng. 7:203–10.
Tegenge MA, Roloff F, Bicker G. 2011. Rapid differentiation of human embryonal carcinoma
stem cells (NT2) into neurons for neurite outgrowth analysis. Cell Mol Neurobiol 31:635-643.
Teng YD, Lavik EB, Qu XL, Park K, Ourednik J, Zurakowski D, Langer R, Snyder EY. 2002.
Functional recovery following traumatic spinal cord injury mediated by a unique polymer scaffold
seeded with neural stem cells. Proc Natl. Acad. Sci. 99:3024–3029.
78
Tieu K, Ashe PC, Zuo DM, Yu PH. 2001. Inhibition of 6-hydroxydopamine-induced p53
expression and survival of neuroblastoma cells following interaction with astrocytes. Neuroscience
103:125–132.
Tofighi R, Moors M, Bose R, Noramidah W, Ibrahim W, Ceccatelli S. 2011. Neural stem cells
for developmental neuroxoxicity studies. Methods in Molecular Biology 758.
Tonge PD, Andrews PW. 2010. Retinoic acid directs neuronal differentiation of human
pluripotent stem cell lines in a non-cell-autonomous manner. Differentiation 80:20–30.
Tralau T, Luch A. 2012. Drug-mediated toxicity: illuminating the 'bad' in the test tube by
means of cellular assays? Trendes in Pharmacology Sciences.
Unsworth CP, Graham ES, Delivopoulos E, Dragunow M, Murray AF. 2010. First human
hNT neurons patterned on parylene-C/silicon dioxide substrates: Combining an accessible cell line and
robust patterning technology for the study of the pathological adult human brain. Journal of
Neuroscience Methods 194 154–157.
Vliet Ev. 2010. Current Standing and Future Prospects for the Technologies Proposed to
Transform Toxicity Testing in the 21st Century. Altex 28.
Wang DD, Bordey A. 2008. The Astrocyte Odyssey. Prog Neurobiol. 86:342–367.
Watson DJ, Longhi L, Lee EB, Fulp CT, Fujimoto S, Royo NC, Passini MA, Trojanowski JQ,
Lee VM, McIntosh TK, Wolfe JH. 2003. Genetically modified NT2N human neuronal cells mediate
longterm gene expression as CNS grafts in vivo and improve functional ognitive outcome following
experimental traumatic brain injury. J. Neuropathol. Exp. Neurol. 62:368–380.
Wiedenmann B, Franke WW. 1985. Identification and localization of synaptophysin, an
integral membrane glycoprotein of Mr 38,000 characteristic of presynaptic vesicles. Cell 41:1017-
1028.
Wiese C, Rolletscheka A, Kaniaa G, Blyszczuka P, Tarasovb KV, Tarasovab Y, Werstob RP,
Bohelerb KR, Wobus AM. 2004. Nestin expression – a property of multi-lineage progenitor cells?
Cellular and Molecular Life Sciences 61 2510–2522.
Willerth SM, Arendas KJ, Gottlieb DI, Sakiyama-Elbert SE. 2006. Optimization of fibrin
scaffolds for differentiation of murine embryonic stem cells into neural lineage cells. Biomaterials
27:5990–6003.
Woehrling EK, Hill EJ, Coleman MD. 2007. Development of a neurotoxicity test-system,
using human post-mitotic, astrocytic and neuronal cell lines in co-culture. Toxicology in vitro.
Woehrling EK, Hill EJ, Coleman MD. 2010. Evaluation of the Importance of Astrocytes
When Screening for Acute Toxicity in Neuronal Cell Systems. Neurotoxicity Research 17:103-113.
Woehrling EK, Hill EJ, Torr EE, Coleman MD. 2011. Single-Cell ELISA and Flow
Cytometry as Methods for Highlighting Potential Neuronal and Astrocytic Toxicant Specificity.
Neurotoxicity Research 19:472-483.
79
Yamada KM, Cukierman E. 2007. Modeling Tissue Morphogenesis and Cancer in 3D. Cell
130:601-610.
Yamaguchi Y. 2000. Lecticans: organizers of the brain extracellular matrix. Cell. Mol. Life
Sci. 57.
Zhang S-C. 2006. Neural Subtype Specification from Embryonic Stem Cells. Brain
Pathology:132-142.