Embed Size (px)
Citation preview
SZENT ISTVÁN UNIVERSITY
DEVELOPMENT OF NOVEL CRYOPRESERVATION
METHOD FOR MAMMALIAN OOCYTE
Jun Liu
GÖDÖLLŐ
2009
2
The PhD program
Name: Animal Husbandry Science PhD School
Discipline: Animal Husbandry Science
Leader: Prof. Dr. Miklós Mézes DSc
Head of Department,
Szent István University, Faculty of Agricultural and Environmental Sciences,
Department of Nutrition
Supervisor: Prof. Dr. András Dinnyés, DSc
Head of Molecular Animal Biotechnology Laboratory,
Szent István University, Faculty of Agricultural and Environmental Sciences,
Institute for Basic Animal Sciences
…………………………………… ……………………………….
Approval of the PhD School Leader Approval of the Supervisor
3
TABLE OF CONTENTS
CHAPTER 1. INTRODUCTION..................................................................................................................8
1.1 THE SIGNIFICANCE OF MAMMALIAN OOCYTE CRYOPRESERVATION.......................................................8
1.2 CRYOPRESERVATION METHODS..............................................................................................................9
1.2.1 Interrupted Slow Freezing ............................................................................................................9
1.2.2 Vitrification ................................................................................................................................11
1.2.3 Ultrarapid Vitrification ..............................................................................................................11
1.3 THE STATE OF THE ART OF OOCYTE CRYOPRESERVATION......................................................................12
1.4 COMPLICATIONS OF THE OOCYTE CRYOPRESERVATION .........................................................................15
1.5 DEVELOPMENTS OF OPTIMIZED CRYOPRESERVATION METHODS VIA FUNDAMENTAL APPROACH
AND THEORETICAL ANALYSIS................................................................................................................16
1.6 OUTLINE OF THE STUDY........................................................................................................................18
CHAPTER 2. THEORY OF FUNDAMENATAL CRYOBIOLOGY AND EQUATION DERIVATION
...............................................................................................................................................20
2.1 BIOPHYSICAL EVENTS DURING CRYOPRESERVATION.............................................................................20
2.2 MATHEMATICAL FORMULATION OF THE MEMBRANE PERMEABILITY COEFFICIENTS..............................22
2.3 ACTIVATION ENERGIES FOR PARAMETERS.............................................................................................24
2.4 CALCULATIONS OF INTRACELLULAR WATER VOLUME AND CPA CONCENTRATIONS DURING FREEZING
AND THAWING. ......................................................................................................................................24
CHAPTER 3. A THEORETICAL MODEL FOR THE DEVELOPMENT OF INTERRUPTED SLOW
FREEZING PROCEDURES......................................................................................................27
3.1 INTRODUCTION................................................................................................................................27
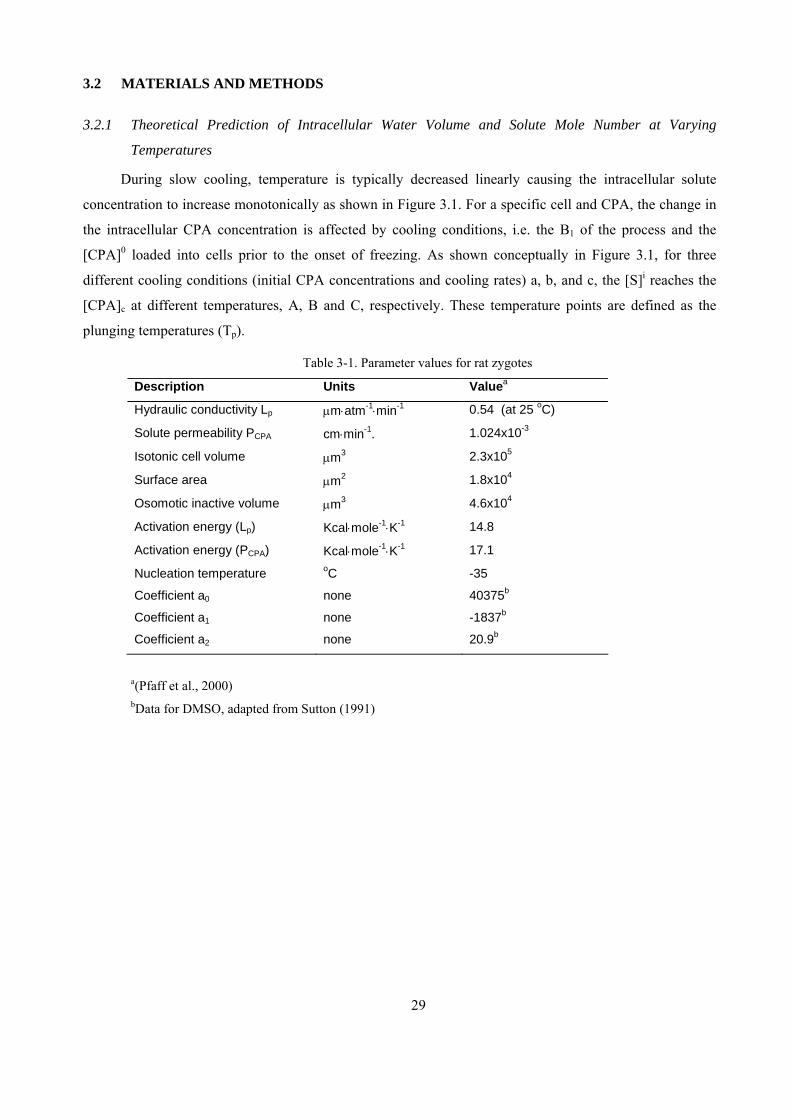
3.2 MATERIALS AND METHODS..........................................................................................................29
3.2.1 Theoretical Prediction of Intracellular Water Volume and Solute Mole Number at Varying
Temperatures .............................................................................................................................29
3.2.2 Assumptions Pertaining to Intracellular Ice Formation (IIF) ....................................................31
3.2.3 Source of Embryos for Ice Nucleation Experiments ...................................................................32
3.2.4 Determination of Critical Concentration ...................................................................................32
3.2.5 Measurement of Cooling and Warming Rates Inside Straws .....................................................33
3.2.6 Prediction of the Theoretically Optimized Cryopreservation Protocol......................................33
3.3 RESULTS.............................................................................................................................................35
3.3.1 Cooling/Warming Rates in 0.25 ml Plastic Straws.....................................................................35
3.3.2 Estimation of Critical Concentration. ........................................................................................35
3.3.3 Experimental Determination of Intracellular Nucleation Temperature .....................................36
3.3.4 Estimation of Optimal Plunging Temperature............................................................................37
3.4 DISCUSSION ......................................................................................................................................38
4
CHAPTER 4. ACCUMULATIVE OSMOTIC DAMAGE MODEL FOR OOCYTE
CRYOPRESERVATION ...........................................................................................................45
4.1 INTRODUCTION................................................................................................................................45
4.2 MATERIALS AND METHOD ....................................................................................................................46
4.2.1 Oocyte collection ........................................................................................................................46
4.2.2 Determination of the permeability coefficients...........................................................................48
4.2.3 Parthenogenetic activation and development.............................................................................48
4.2.4 Theoretical simulations and accumulative osmotic damage model............................................49
4.2.5 Statistical analyses .....................................................................................................................49
4.3 RESULTS.............................................................................................................................................50
4.3.1 Rabbit oocyte CPA permeabilities..............................................................................................50
4.3.2 Blastocyst Development and AOD..............................................................................................50
4.4 DISCUSSION ......................................................................................................................................53
4.4.1 CPA permeabilities.....................................................................................................................54
4.4.2 AOD model .................................................................................................................................54
CHAPTER 5. DEVELOPMENT OF A NOVEL CRYOPRESERVATION THREE-STEP METHOD
FOR MAMMALIAN OOCYTE ................................................................................................56
5.1 INTRODUCTION................................................................................................................................56
5.2 METHOD ...............................................................................................................................................57
5.2.1 Physical events involved in “three-step” cryopreservation .......................................................57
5.2.2 Additional Equations ..................................................................................................................59
5.2.3 Calculation of the probability of intracellular ice formation (PIIF)............................................59
5.2.4 Determination of PIIF parameters ...............................................................................................60
5.2.5 Presentation of calculation results .............................................................................................61
5.2.6 Experiments to validate the theoretical predictions. ..................................................................61
5.3 RESULTS.............................................................................................................................................63
5.3.1 IIF Observation and Determination of IIF Parameters .............................................................63
5.3.2 Determination of the PIIF values for different combinations of Tp, C0, and th.............................64
5.3.3 Experimental results versus the theoretical predictions.............................................................65
5.3.4 Optimization of an oocyte freezing protocol...............................................................................66
5.4 DISCUSSION ......................................................................................................................................67
5.4.1 General discussion of PIIF-Plot...................................................................................................67
5.4.2 IIF Observations and Prediction................................................................................................67
CHAPTER 6. NEW SCIENTIFIC RESULTS...........................................................................................69
CHAPTER 7. CONCLUSION.....................................................................................................................71
CHAPTER 8. SUMMARY ..........................................................................................................................78
CHAPTER 9. LIST OF PUBLICATIONS.................................................................................................80

5
CHAPTER 10. REFERENCE.......................................................................................................................83
CHAPTER 11. ACKNOWLEDGEMENTS.................................................................................................90
6
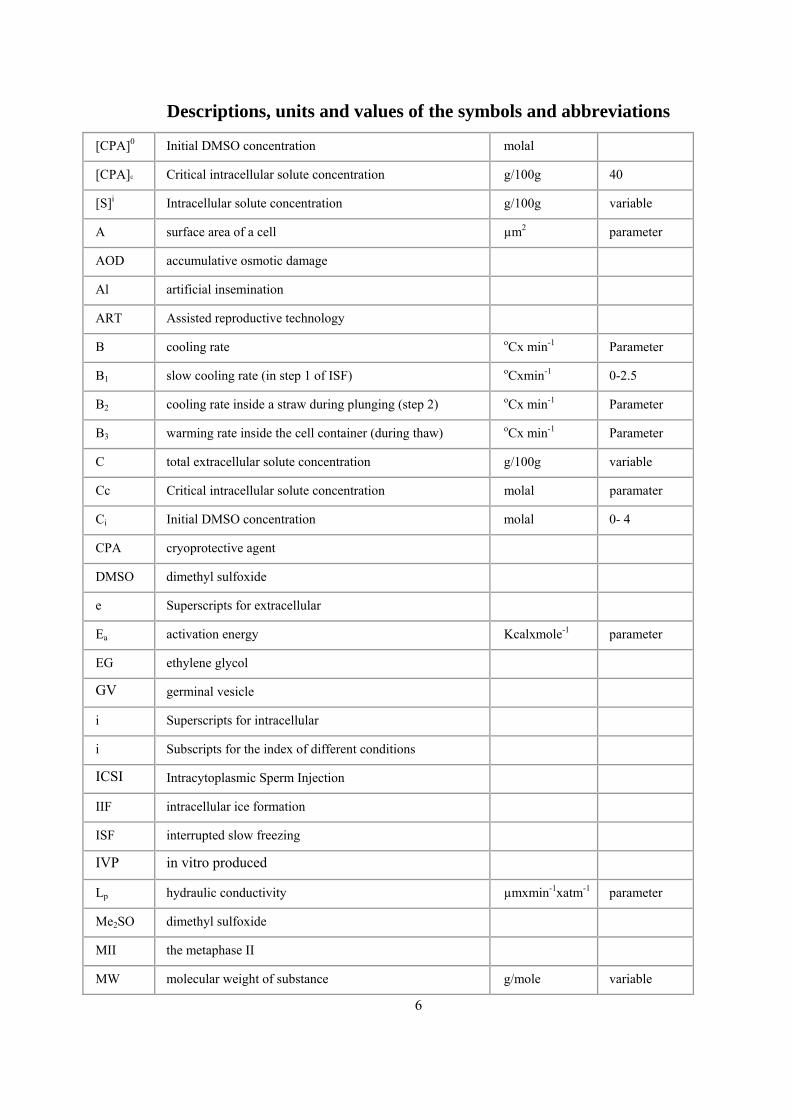
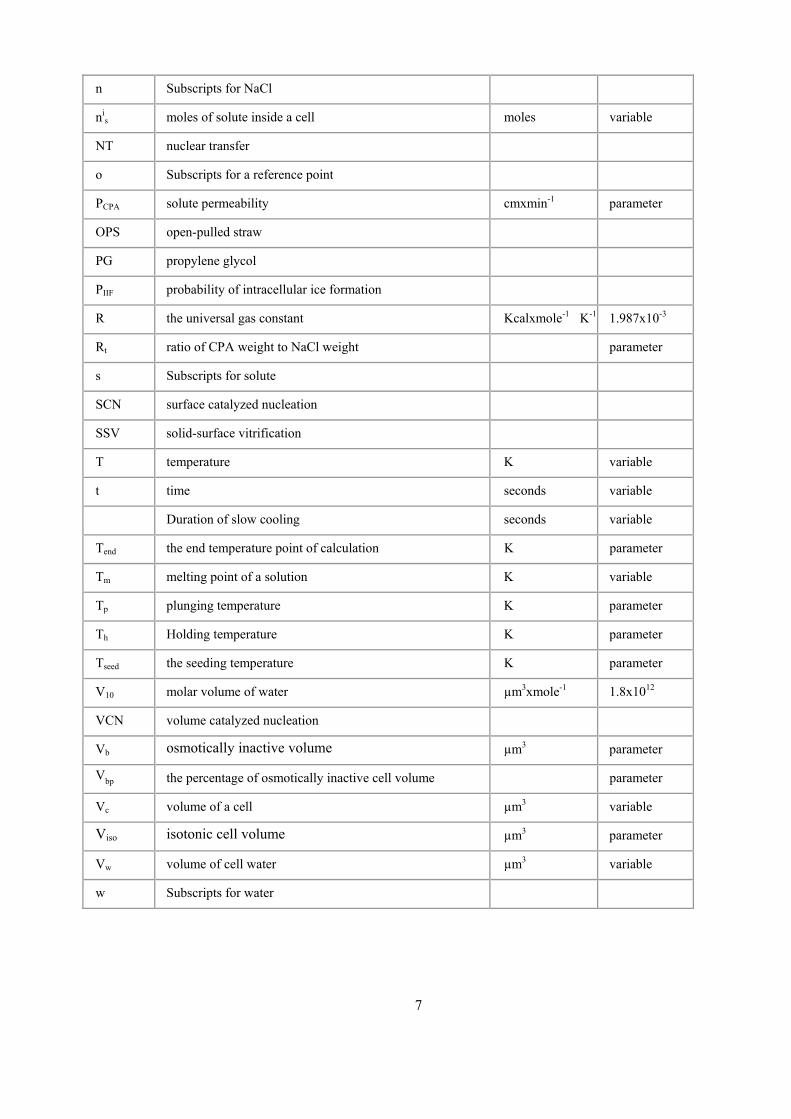
Descriptions, units and values of the symbols and abbreviations
[CPA]0 Initial DMSO concentration molal
[CPA]c Critical intracellular solute concentration g/100g 40
[S]i Intracellular solute concentration g/100g variable
A surface area of a cell µm2 parameter
AOD accumulative osmotic damage
Al artificial insemination
ART Assisted reproductive technology
B cooling rate oCx min-1 Parameter
B1 slow cooling rate (in step 1 of ISF) oCxmin-1 0-2.5
B2 cooling rate inside a straw during plunging (step 2) oCx min-1 Parameter
B3 warming rate inside the cell container (during thaw) oCx min-1 Parameter
C total extracellular solute concentration g/100g variable
Cc Critical intracellular solute concentration molal paramater
Ci Initial DMSO concentration molal 0- 4
CPA cryoprotective agent
DMSO dimethyl sulfoxide
e Superscripts for extracellular
Ea activation energy Kcalxmole-1 parameter
EG ethylene glycol
GV germinal vesicle
i Superscripts for intracellular
i Subscripts for the index of different conditions
ICSI Intracytoplasmic Sperm Injection
IIF intracellular ice formation
ISF interrupted slow freezing
IVP in vitro produced
Lp hydraulic conductivity µmxmin-1xatm-1 parameter
Me2SO dimethyl sulfoxide
MII the metaphase II
MW molecular weight of substance g/mole variable
7
n Subscripts for NaCl
nis moles of solute inside a cell moles variable
NT nuclear transfer
o Subscripts for a reference point
PCPA solute permeability cmxmin-1 parameter
OPS open-pulled straw
PG propylene glycol
PIIF probability of intracellular ice formation
R the universal gas constant Kcalxmole-1K-1 1.987x10⁻³
Rt ratio of CPA weight to NaCl weight parameter
s Subscripts for solute
SCN surface catalyzed nucleation
SSV solid-surface vitrification
T temperature K variable
t time seconds variable
Duration of slow cooling seconds variable
Tend the end temperature point of calculation K parameter
Tm melting point of a solution K variable
Tp plunging temperature K parameter
Th Holding temperature K parameter
Tseed the seeding temperature K parameter
V10 molar volume of water µm3xmole-1 1.8x10¹²
VCN volume catalyzed nucleation
Vb osmotically inactive volume µm3 parameter
Vbp the percentage of osmotically inactive cell volume parameter
Vc volume of a cell µm3 variable
Viso isotonic cell volume µm3 parameter
Vw volume of cell water µm3 variable
w Subscripts for water
8
CHAPTER 1. INTRODUCTION
1.1 THE SIGNIFICANCE OF MAMMALIAN OOCYTE CRYOPRESERVATION
Mammalian oocyte cryopreservation has applications in animal agriculture, biomedical research,
human reproductive medicine and biodiversity preservation. Among species used for animal agriculture,
cryopreserved oocytes would play an important role in developing improved breeding programs. By using
in vitro produced (IVP) embryos from elite animals, significant improvements in reducing the generational
interval can be attained (Presicce et al., 1997). This technology would also allow the rescue of gametes
from otherwise infertile animals, as well as the use of abattoir-derived oocytes that are increasingly being
used in research (Day, 2000). Additionally, those highly valuable transgenic animals make successful
cryopreservation critical. For one thing it will allow international distribution of these genotypes. Secondly,
it will facilitate the creation of repositories in the event of a catastrophe such as disease outbreak or natural
disaster.
Production of transgenic lab animals (such as mice, rats, rabbit and hamster) provides a powerful
model to explore the regulation of gene expression as well as the regulation of cellular and physiological
processes (Glenister et al., 1990; Leibo et al., 1991). Recent years, genetically-modified animals have been
created in large numbers. Given their value as models for biological systems, it is desirable to preserve
these strains indefinitely for future studies. The high costs of producing and maintaining genetically altered
animal needs reliable cryopreservation protocols in order to preserve specific strains for experimental
purposes, without perpetuating these strains through continuous live breeding. Cryopreservation of
germplasm offers a way to reduce these costs by allowing the maintenance of “frozen” colonies as a backup
in the event of a disease outbreak or other emergency, or as a full replacement of breeding colonies that are
not currently in use but whose maintenance is desired for future research (Critser and Russell, 2000).
Additionally, a frozen colony derived from founder animals would help alleviate inbreeding depression and
genetic drift, thus maintaining overall genetic vigor while minimizing the number of animals necessary for
maintenance of a live colony (Whittingham, 1974). At the present time, nuclear transfer (NT) technology is
relatively inefficient, and relies on the ready access to mature oocytes. Having an efficient means to
cryopreserve oocytes would ensure a steady supply of these cells for NT procedures, and could alleviate
inefficiencies associated with seasonal variability of oocyte quality (Rutledge et al., 1999).
The demand for human reproductive medical services continues to increase (Andersen et al., 2006).
Cryopreservation of spermatozoa and preimplantation embryos has been an integral component of patient
services for many years. It has been shown that the use of embryo cryopreservation can improve the chance
of a successful pregnancy from each oocyte collection (Schnorr et al., 2000). Unfortunately,
cryopreservation of supernumerary embryos presents ethical concerns for some individuals (Michelmann
and Nayudu, 2006); in some countries embryo cryopreservation is not permitted (Benagiano and Gianaroli,
2004). In such cases, oocyte cryopreservation has been adopted as a replacement technique in an effort to
9
improve the chances of pregnancy per oocyte retrieval cycle, and lighten these ethical and legal concerns by
allowing the creation of only the numbers of embryos deemed appropriate for transfer, by preserving the
potential for future attempts at pregnancy should the initial one fail. Oocyte cryopreservation also provides
an opportunity to preserve the fertility of women undergoing potentially deleterious iatrogenic procedures
such as chemotherapy, which usually results in the loss of gonadal function and subsequent infertility.
Oocyte cryopreservation is also important for family planning given that the average age of childbearing
continues to increase and embryo cryopreservation is not desirable for many women without partners.
Additionally, having successful methods available to cryopreserve human oocytes would allow the
establishment of oocyte banks to assist those female patients who cannot produce viable oocytes (Karow,
1997). Oocyte cryopreservation would not only obviate cycle synchronization between donor and recipient,
a method that is not always successful, but it would allow sufficient time for seroconversion of the donor in
the event of a recent infection with a transmittable disease (Critser et al., 1997). Such practices are routine
in semen banks and are facilitated by the ability to cryopreserve human semen.
To some extent gamete storage can provide insurance for preserving the existing genetic diversity
within endangered species. These species survive in nature but often in fragmented habitats, or live in
geographically disparate zoos and they are also susceptible to inbreeding depression, environmental
catastrophes, epidemics, and even to drastic shifts in social and political structures. Application of assisted
reproduction technologies using frozen–thawed gametes of rare and endangered species will become
increasingly important in conservation biology programs (Dinnyes et al., 2007; Wildt, 2000).
1.2 CRYOPRESERVATION METHODS
In general, the cryopreservation of cells involves an initial exposure to cryoprotective agents (CPAs),
cooling to subzero temperatures, storage, thawing, and finally, dilution and removal of the CPA, with return
to physiological environment. Currently, there are three main strategies: interrupted slow freezing (ISF),
traditional vitrification (vitrification in straws) and ultrarapid vitrification.
1.2.1 Interrupted Slow Freezing
The most common cryopreservation method is the ISF procedure, consisting of an initial slow,
controlled-rate cooling to subzero temperatures followed by rapid cooling as the sample is plunged into
liquid nitrogen (LN2) for storage. During the controlled slow cooling extracellular ice formation is induced
(seeding) at a temperature just below the solution’s freezing point, and then the cooling continues at a given
rate in the presence of a growing extracellular ice phase, which raises the extracellular solute concentration
in the unfrozen fraction and results in water being removed from the cell via exosmosis. Permeating CPAs,
such as glycerol (GLY), dimethyl sulfoxide (Me2SO or DMSO), ethylene glycol (EG) or propylene glycol
(PG) are typically included in the freezing medium, to protect the cells against injury from the high
concentrations of electrolytes that develop as water is removed from the solution as ice. These CPAs
become increasingly concentrated intracellularly as the cell dehydrates. The slow cooling step is terminated
at an intermediate temperature (Tp, in the range of -30 to -80 oC) then plunging, a rapid cooling step, is
initiated in which the remaining intracellular water either vitrifies or form small non-damaging ice crystals.
Control of the cooling and warming rates is crucial. If cells are cooled too rapidly during the
controlled slow cooling process, water does not exit the cells fast enough to maintain equilibrium and,
therefore, the embryos freeze intracellularly, resulting in death in most cases. If cooling is too slow, the
long duration can cause ‘solution effects’ injury resulting from the high concentration of extra-and
intracellular solutes, probably due to the effects of the solutes on the cellular membrane or through osmotic
dehydration. Oocyte cryopreservation protocols commonly use controlled cooling rates in the range of 0.3 -
0.6°C/ min. During warming the small intracellular ice crystals might subsequently undergo re-
crystallization, forming bigger ice crystals that rupture the cell membrane, thus leading to fatal damage.
Rapid thawing can prevent the re-crystallization (Van den Abbeel et al., 1994).
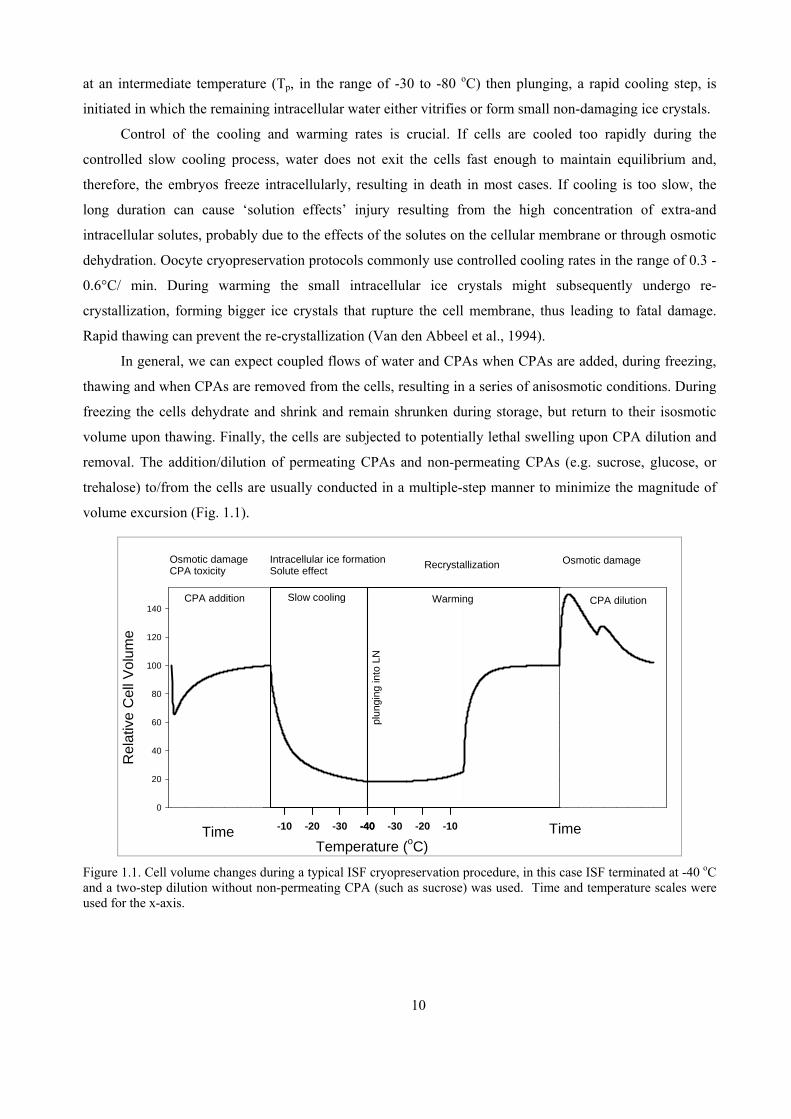
In general, we can expect coupled flows of water and CPAs when CPAs are added, during freezing,
thawing and when CPAs are removed from the cells, resulting in a series of anisosmotic conditions. During
freezing the cells dehydrate and shrink and remain shrunken during storage, but return to their isosmotic
volume upon thawing. Finally, the cells are subjected to potentially lethal swelling upon CPA dilution and
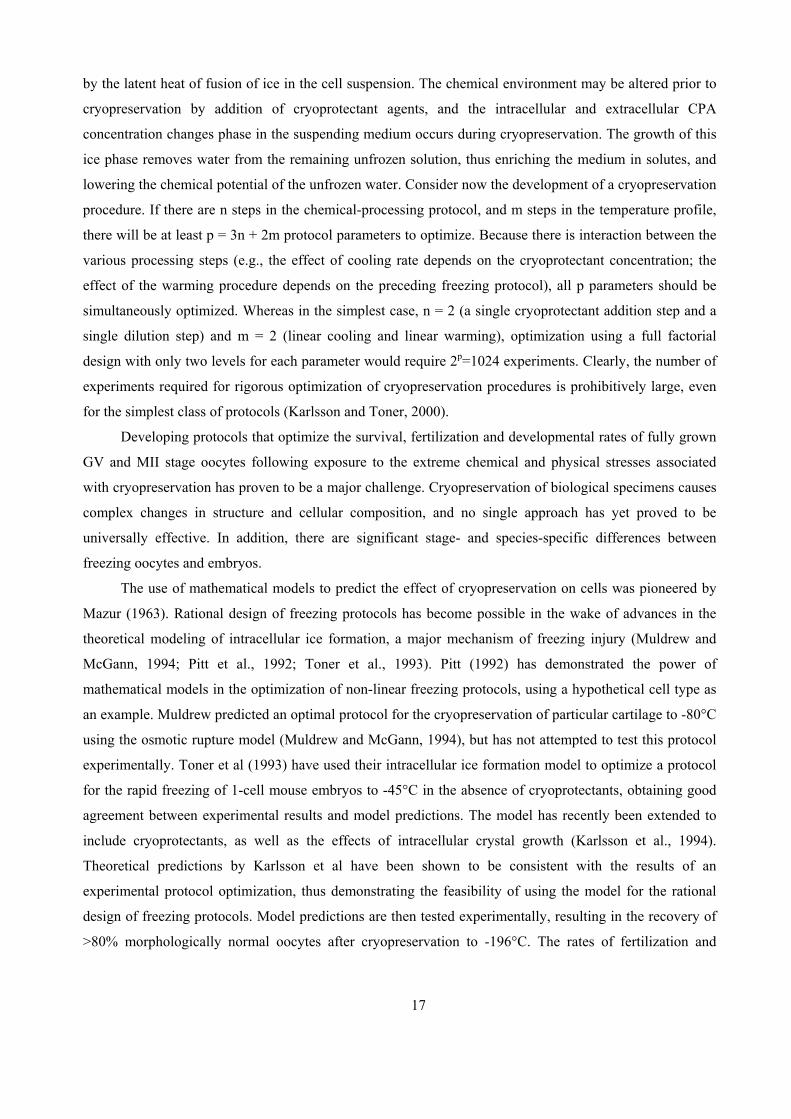
removal. The addition/dilution of permeating CPAs and non-permeating CPAs (e.g. sucrose, glucose, or
trehalose) to/from the cells are usually conducted in a multiple-step manner to minimize the magnitude of
volume excursion (Fig. 1.1).
-10 -20 -30 -40
Rel
ativ
e C
ell V
olum
e
-10-20-30-40 Time Temperature (oC)
0
20
40
60
80
100
120
140
Time
plun
ging
into
LN
CPA addition CPA dilutionSlow cooling Warming
Osmotic damageCPA toxicity
Intracellular ice formationSolute effect
Recrystallization Osmotic damage
Figure 1.1. Cell volume changes during a typical ISF cryopreservation procedure, in this case ISF terminated at -40 oC and a two-step dilution without non-permeating CPA (such as sucrose) was used. Time and temperature scales were used for the x-axis.
10
11
1.2.2 Vitrification
Vitrification, cryopreservation without ice formation, is a process of converting a solution into a
glass-like amorphous solid state that is free of any crystalline structures. This can be achieved by utilizing
high cooling rates with high concentrations of CPAs (Fahy et al., 1984). A typical vitrification protocol
requires a high concentration of CPAs in the medium (30-50% compared with 5-10% for ISF) at a cooling
rate easily achievable for conventional laboratory conditions and set-ups. Such high CPA concentrations
can be detrimental to oocytes, causing both biochemical alterations and lethal osmotic injury. Various
strategies have been described to counter the potential toxicity of solutions including: (1) the use of a
combination of CPA solutes, each of which is below a toxic concentration, yet in combination would allow
vitrification; (2) addition of non-permeating CPAs such as disaccharides (e.g. sucrose or trehalose) or high
molecular weight molecules (e.g. Ficoll, polyvinylalcohol or polyvinylpyrrolidone) can significantly reduce
the amount of permeable CPA required, (3) the use of compounds which counteract the toxicity of other
agents (e.g. acetamide with DMSO; and (4) reducing the time for which and/or the temperature at which the
embryos are exposed to CPAs.
1.2.3 Ultrarapid Vitrification
Reducing the solute concentrations in combination with higher cooling rates is an efficient strategy
employed to achieve vitrification of oocytes. To achieve very high cooling rates, the volume of the
vitrification solution should be minimized by using specially designed containers, open-pulled straws (Vajta
et al., 1998), electron microscope copper grids (Martino et al., 1996b), cryo-loops (Lane et al., 1999),
cryotops (Kuwayama et al., 2005), and by solid-surface vitrification (Dinnyes et al., 2000). When solution
concentrations are reduced, the likelihood of devitrification during warming increases. Hence, the high
warming rate is important. Many of these novel technologies use direct exposure of samples to LN2, which
often precludes effective biocontainment (Dinnyes et al., 2007).
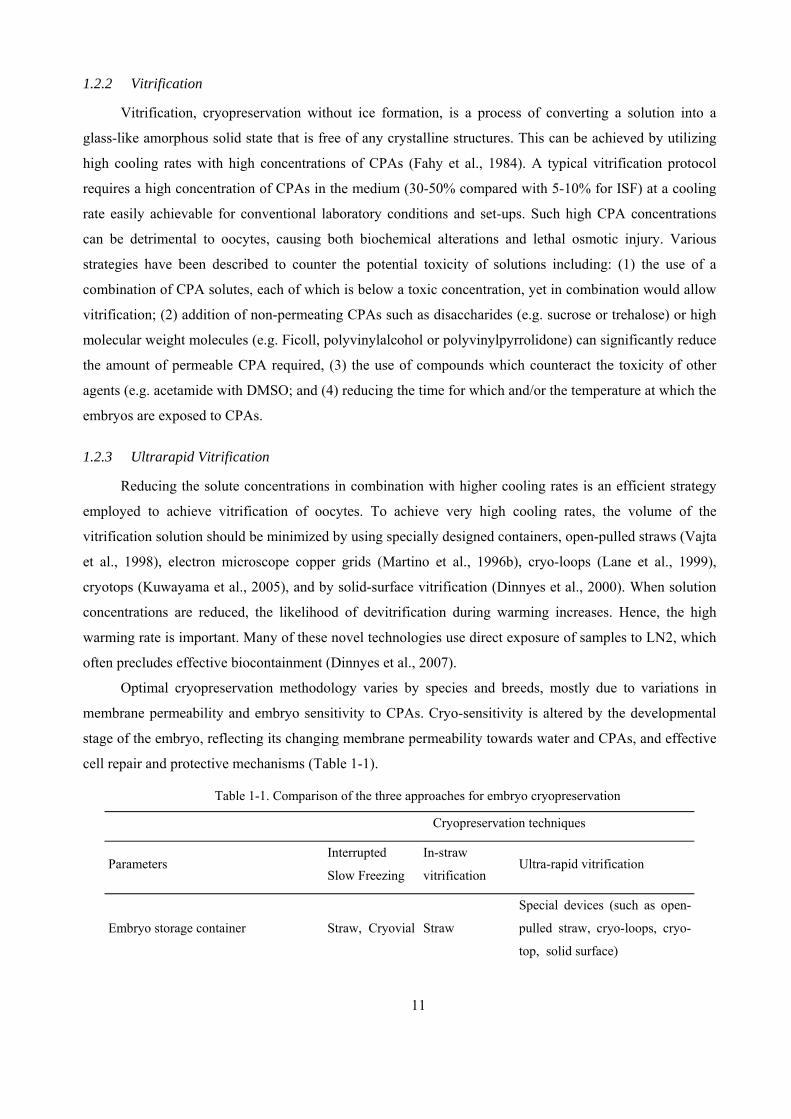
Optimal cryopreservation methodology varies by species and breeds, mostly due to variations in
membrane permeability and embryo sensitivity to CPAs. Cryo-sensitivity is altered by the developmental
stage of the embryo, reflecting its changing membrane permeability towards water and CPAs, and effective
cell repair and protective mechanisms (Table 1-1).
Table 1-1. Comparison of the three approaches for embryo cryopreservation
Cryopreservation techniques
Parameters Interrupted
Slow Freezing
In-straw
vitrification Ultra-rapid vitrification
Embryo storage container Straw, Cryovial Straw
Special devices (such as open-
pulled straw, cryo-loops, cryo-
top, solid surface)
12
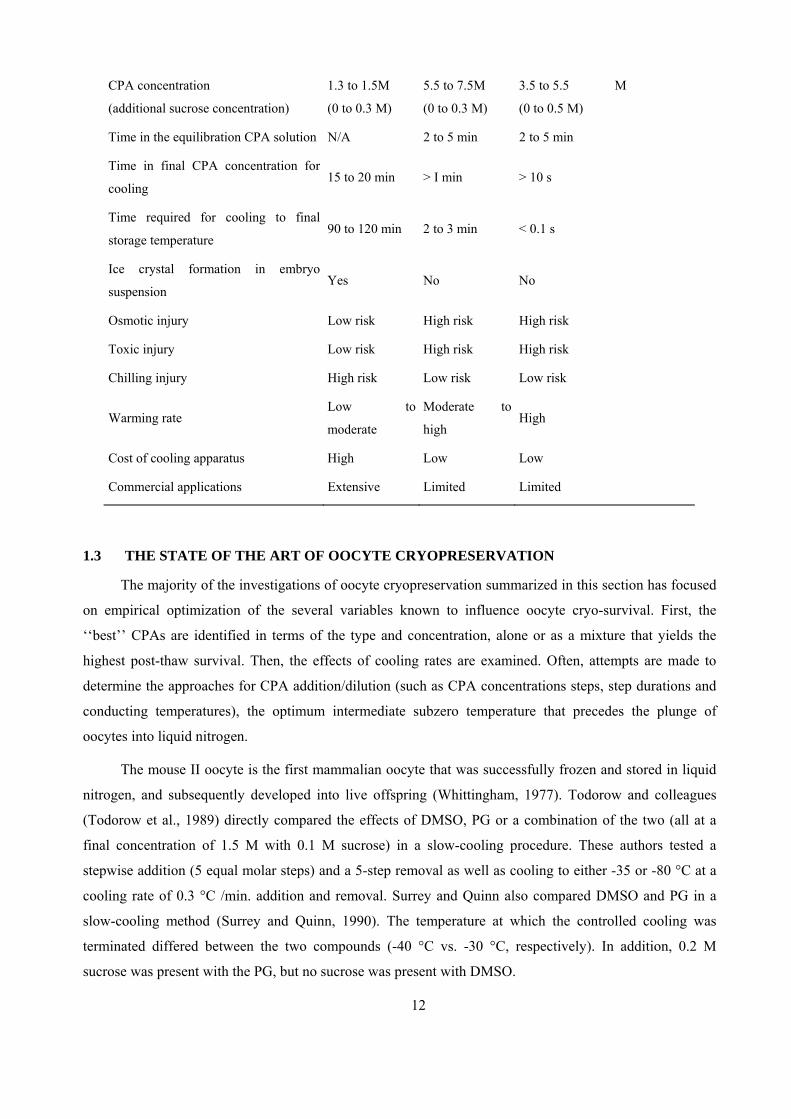
CPA concentration
(additional sucrose concentration)
1.3 to 1.5M
(0 to 0.3 M)
5.5 to 7.5M
(0 to 0.3 M)
3.5 to 5.5 M
(0 to 0.5 M)
Time in the equilibration CPA solution N/A 2 to 5 min 2 to 5 min
Time in final CPA concentration for
cooling 15 to 20 min > I min > 10 s
Time required for cooling to final
storage temperature 90 to 120 min 2 to 3 min < 0.1 s
Ice crystal formation in embryo
suspension Yes No No
Osmotic injury Low risk High risk High risk
Toxic injury Low risk High risk High risk
Chilling injury High risk Low risk Low risk
Warming rate Low to
moderate
Moderate to
high High
Cost of cooling apparatus High Low Low
Commercial applications Extensive Limited Limited
1.3 THE STATE OF THE ART OF OOCYTE CRYOPRESERVATION
The majority of the investigations of oocyte cryopreservation summarized in this section has focused
on empirical optimization of the several variables known to influence oocyte cryo-survival. First, the
‘‘best’’ CPAs are identified in terms of the type and concentration, alone or as a mixture that yields the
highest post-thaw survival. Then, the effects of cooling rates are examined. Often, attempts are made to
determine the approaches for CPA addition/dilution (such as CPA concentrations steps, step durations and
conducting temperatures), the optimum intermediate subzero temperature that precedes the plunge of
oocytes into liquid nitrogen.
The mouse II oocyte is the first mammalian oocyte that was successfully frozen and stored in liquid
nitrogen, and subsequently developed into live offspring (Whittingham, 1977). Todorow and colleagues
(Todorow et al., 1989) directly compared the effects of DMSO, PG or a combination of the two (all at a
final concentration of 1.5 M with 0.1 M sucrose) in a slow-cooling procedure. These authors tested a
stepwise addition (5 equal molar steps) and a 5-step removal as well as cooling to either -35 or -80 °C at a
cooling rate of 0.3 °C /min. addition and removal. Surrey and Quinn also compared DMSO and PG in a
slow-cooling method (Surrey and Quinn, 1990). The temperature at which the controlled cooling was
terminated differed between the two compounds (-40 °C vs. -30 °C, respectively). In addition, 0.2 M
sucrose was present with the PG, but no sucrose was present with DMSO.
13
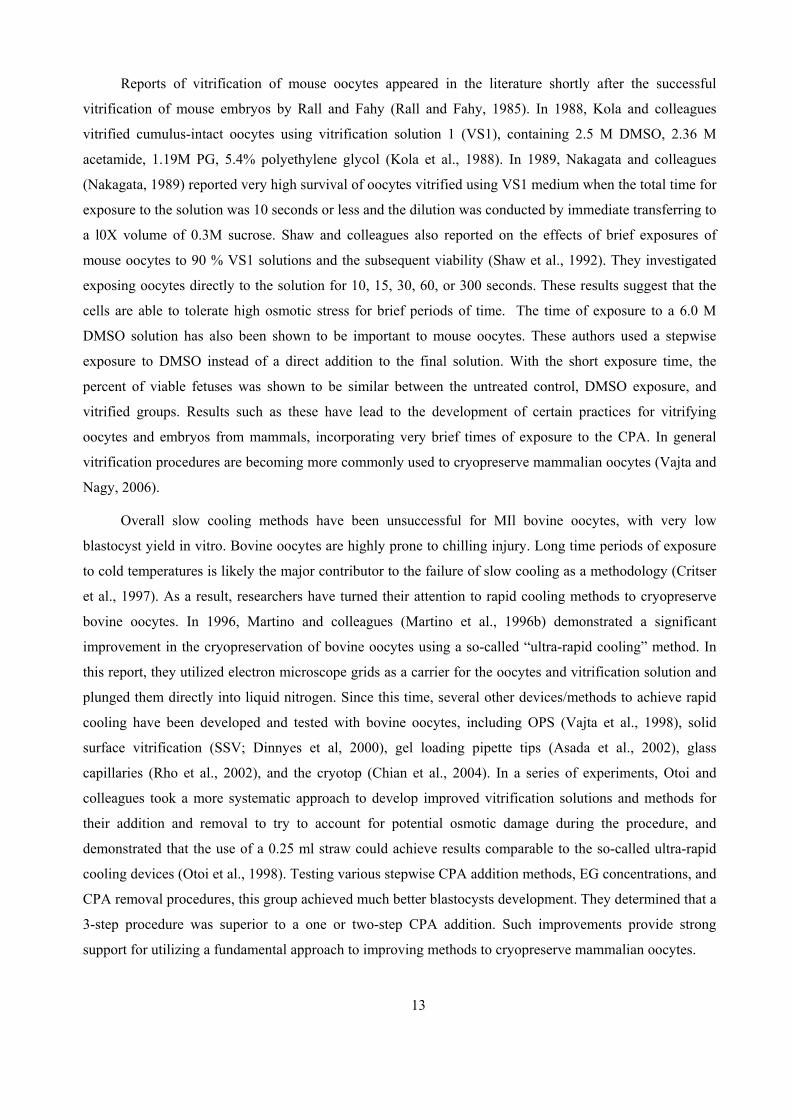
Reports of vitrification of mouse oocytes appeared in the literature shortly after the successful
vitrification of mouse embryos by Rall and Fahy (Rall and Fahy, 1985). In 1988, Kola and colleagues
vitrified cumulus-intact oocytes using vitrification solution 1 (VS1), containing 2.5 M DMSO, 2.36 M
acetamide, 1.19M PG, 5.4% polyethylene glycol (Kola et al., 1988). In 1989, Nakagata and colleagues
(Nakagata, 1989) reported very high survival of oocytes vitrified using VS1 medium when the total time for
exposure to the solution was 10 seconds or less and the dilution was conducted by immediate transferring to
a l0X volume of 0.3M sucrose. Shaw and colleagues also reported on the effects of brief exposures of
mouse oocytes to 90 % VS1 solutions and the subsequent viability (Shaw et al., 1992). They investigated
exposing oocytes directly to the solution for 10, 15, 30, 60, or 300 seconds. These results suggest that the
cells are able to tolerate high osmotic stress for brief periods of time. The time of exposure to a 6.0 M
DMSO solution has also been shown to be important to mouse oocytes. These authors used a stepwise
exposure to DMSO instead of a direct addition to the final solution. With the short exposure time, the
percent of viable fetuses was shown to be similar between the untreated control, DMSO exposure, and
vitrified groups. Results such as these have lead to the development of certain practices for vitrifying
oocytes and embryos from mammals, incorporating very brief times of exposure to the CPA. In general
vitrification procedures are becoming more commonly used to cryopreserve mammalian oocytes (Vajta and
Nagy, 2006).
Overall slow cooling methods have been unsuccessful for MIl bovine oocytes, with very low
blastocyst yield in vitro. Bovine oocytes are highly prone to chilling injury. Long time periods of exposure
to cold temperatures is likely the major contributor to the failure of slow cooling as a methodology (Critser
et al., 1997). As a result, researchers have turned their attention to rapid cooling methods to cryopreserve
bovine oocytes. In 1996, Martino and colleagues (Martino et al., 1996b) demonstrated a significant
improvement in the cryopreservation of bovine oocytes using a so-called “ultra-rapid cooling” method. In
this report, they utilized electron microscope grids as a carrier for the oocytes and vitrification solution and
plunged them directly into liquid nitrogen. Since this time, several other devices/methods to achieve rapid
cooling have been developed and tested with bovine oocytes, including OPS (Vajta et al., 1998), solid
surface vitrification (SSV; Dinnyes et al, 2000), gel loading pipette tips (Asada et al., 2002), glass
capillaries (Rho et al., 2002), and the cryotop (Chian et al., 2004). In a series of experiments, Otoi and
colleagues took a more systematic approach to develop improved vitrification solutions and methods for
their addition and removal to try to account for potential osmotic damage during the procedure, and
demonstrated that the use of a 0.25 ml straw could achieve results comparable to the so-called ultra-rapid
cooling devices (Otoi et al., 1998). Testing various stepwise CPA addition methods, EG concentrations, and
CPA removal procedures, this group achieved much better blastocysts development. They determined that a
3-step procedure was superior to a one or two-step CPA addition. Such improvements provide strong
support for utilizing a fundamental approach to improving methods to cryopreserve mammalian oocytes.
14
The first report of a pregnancy and subsequent delivery of a human baby derived from a frozen and
thawed oocyte appeared in 1986 and 1988, respectively (Chen, 1986, 1988). Several other reports appeared
in the late 1980’s describing additional attempts to cryopreserve human oocytes. One notable feature of
these reports (and many other reports on oocyte and embryo cryobiology) is the lack of fundamental
experiments designed to characterize the cryobiology of human oocytes. Instead, simple changes to a
standard equilibrium protocol were made and outcomes were assessed. Changes included altering the
addition and removal of the cryoprotectant (stepwise and at room temperature; (Diedrich et al., 1987)), and
assessing the effects of PG vs. DMSO (Al-Hasani et al., 1987). Concerns over possible damage to the
meiotic spindle during cryopreservation of oocytes slowed progress in this field during the early years.
Late, in the middle of 90s, the use of low concentrations of sucrose (0.1 M) in the freezing medium became
routine, and likely contributed to the increased post-thaw morphological survival of oocytes with this
method. In 2001, Fabbri and colleagues (Fabbri et al., 2001) systematically studied the effects of different
sucrose concentrations on oocyte survival with the equilibrium method using 1.5 M PG. Increasing the
concentration of sucrose from 0.1 M to 0.3M caused a marked improvement in survival, from 33 % to 82
%. Although some investigators claimed the clinical results are nearly equivalent to the use of fresh
embryos (Marina and Marina, 2003), other investigators have been more cautious in their interpretation
(Coticchio et al., 2004), and in two recent reports with a very large number of cycles, the results were still
rather poor (Borini et al., 2006; Levi Setti et al., 2006), especially when compared to the use of fresh
embryos.
Some studies, however, have been of a more fundamental nature in which investigators have
attempted to elucidate basic principles responsible for damage or death of oocytes. In such studies, intrinsic
properties of oocytes, such as their permeability to water and/or to solutes, may be determined. Leibo et al.
(Leibo et al., 1974) and Parkening et al. (Parkening et al., 1976) began investigation of the fundamental
cryobiology of mouse oocytes in regard to intracellular freezing temperatures, effects of various low
temperatures, cryoprotective agents and cooling rates on the survival, fertilizability and development. Pfaff et
al reported their research on the membrane permeability characteristics to water and DMSO for in-vivo-
and in-vitro-derived and cultured murine oocytes (Pfaff et al., 1998); and Agca et al on rat immature and
mature oocytes (Agca et al., 2000a).
Osmotic characteristics of the plasma membrane to water and intracellular ice crystal formation
kinetics of bovine oocytes from different developmental stages (GV, MII, in vitro fertilized (IVF)) have
also been very well documented (Ruffing et al., 1993). Osmotic behavior in the presence of NaCl as a
function of time, and intracellular ice crystal formation temperature in the presence of glycerol, ethylene
glycol and propylene glycol as a function of cooling rate has been investigated. It has been determined that
mature bovine oocytes have a smaller inactive cell volume fraction compared to immature oocytes. It was
concluded from these experiments that differences exist in oocytes from different developmental stages and
was suggested that these factors have to be considered in developing cryopreservation protocols. Later,
15
Agca et al published systematic studies on the effect of osmotic stress on the developmental competence
of germinal vesicle and MII stage bovine cumulus oocyte complexes and its relevance to cryopreservation,
the effect of developmental stage on bovine oocyte plasma membrane water and cryoprotectant
permeability characteristics and temperature dependence (Agca et al., 1999; Agca et al., 1998b; Agca et al.,
2000b).
The first (Hunter et al., 1992a; Hunter et al., 1992b) examined the water permeability of both "fresh"
and failed-to-fertilize oocytes and found that human oocytes have oolemma water permeability
characteristics very similar to mouse oocytes (0.48 m/min/atm at 20C) with an activation energy of 9.5
kcal/mol. Others (Fuller et al., 1992) examined the permeability of mouse and human oocytes to 1,2-
propanediol and water simultaneously. The results of this study indicated that human oocytes are about
twice as permeable to 1,2-propanediol as mouse oocytes. McWilliams et al. (McWilliams et al., 1995)
studied osmotic and physiological responses of human oocytes to concentrated solutions of mono and
disaccharides and found that non-permeating saccharides can serve as a great osmotic buffer and promotes
the recovery of human oocytes. Recently, osmotic responses and tolerance limits to changes in external
osmolalities, and oolemma permeability characteristics, of human in vitro matured MII oocytes was
reported (Van den Abbeel et al., 2007).
The establishment of long-term preservation methods for mammalian oocytes at the desired
developmental stage has significant importance in improving ART for human and various animal species.
However, the determination of reliable methods for oocyte cryopreservation has been challenging. The first
live birth was obtained from cryopreserved MII mouse oocytes was reported nearly 32 years ago
(Whittingham, 1977), in which a slow cooling in the presence of DMSO was used. Subsequent studies in
other mammalian species utilizing 1.5 M DMSO or 1,2 propanediol (PROH) and cooling rates of 0.3-
0.5°C/min (seeding the samples at –7°C) to –40 or –80°C have been disappointing (Bernard and Fuller,
1996; Critser et al., 1997). These attempts have shown that it is possible to obtain live births from
cryopreserved human (Chen, 1986; Porcu et al., 1997), and bovine (Fuku et al., 1992; Lim et al., 1992)
oocytes, but with extremely low rates of success.
1.4 COMPLICATIONS OF THE OOCYTE CRYOPRESERVATION
Difficulties in the cryopreservation of mammalian oocytes are due to their complex structures at the
organelle/subcellular level (Friedler et al., 1988; Arav et al., 1993). Furthermore, the oocyte’s cytoskeleton
structure can be sensitive to cooling. At the time of ovulation, in most species oocytes are in metaphase
stage of the second division (MII). The dichromatid chromosomes aligned on the equatorial axis are bound
to the microtubules in the meiotic spindle. This stage can be problematic for cryopreservation with
temperature and CPA sensitivity of the spindle and microtubules (Watson and Holt, 2001). Cooling oocytes
to low temperatures substantially disrupts cytoskeletal elements (e.g., spindle fiber integrity), causes
depolymerization of the spindle and microtubules (Songsasen et al., 2002; Wu et al., 1999; Zenzes et al.,
16
2001). As a result, fertilization may not take place because normal separation of chromatids might be
disturbed, resulting in aneuploidy following extrusion of the second polar body. Zona pellucida hardening
due to premature cortical granule release can be triggered by some CPA and eventually can prevent normal
fertilization (Fabbri, 2006). Additionally, a recent study indicated that irreversible oolemma lipid-phase
changes occur during cooling. The large size of oocytes with consequent low surface-to-volume ratios make
it more difficult for water and cryoprotectants to enter or leave the cells across plasma membranes, thus
increasing the chances of ice crystal formation and CPA toxicity (Leibo and Songsasen, 2002).
Since the effects of chilling on the developmental potential of oocytes from many species are widely
recognized, ultra-rapid cooling methods, first introduced by Rall and Fahy (1985), have been used to
cryopreserve mouse (Isachenko and Nayudu, 1999; Nakagata, 1989; Shaw et al., 1992; Valojerdi and
Salehnia, 2005), human (Kuwayama, 2007; Kuwayama et al., 2005; Yoon et al., 2003), and bovine (Cetin
and Bastan, 2006; Vajta et al., 1998) oocytes with varying levels of success. Recent trends in mammalian
oocyte cryopreservation have lead to the use of various devices for vitrification such as such as open-pulled
straws (Vajta et al., 1998), electron microscope copper grids (Martino et al., 1996b), cryo-loops (Lane et al.,
1999), cryotops (Kuwayama et al., 2005), and by solid-surface vitrification (Dinnyes et al., 2000).
However, the vitrification method requires a high concentration of permeable and/or non-permeable CPAs
loaded into cells before plunging into LN. Introducing this relatively high solute concentration into cells
exposes the cells to extreme osmotic stresses and chemical toxicity, and is also a procedural challenge in
practice (Huang et al., 2006; Stachecki and Cohen, 2004). In addition, most of these novel technologies
require direct exposure of samples to liquid nitrogen in order to achieve sufficiently rapid cooling rates, and
this usually precludes effective biocontainment (Mortimer, 2004).
1.5 DEVELOPMENTS OF OPTIMIZED CRYOPRESERVATION METHODS VIA
FUNDAMENTAL APPROACH AND THEORETICAL ANALYSIS
Currently used oocyte cryopreservation protocols have been direct, or slight modifications of the
methods developed for mouse embryos. These were primarily developed by trial and error adjustments of
cooling and warming rates, and choice of CPA and CPA concentration. However, because there are a large
number of protocol variables potentially affecting cell viability, an exhaustive experimental search for the
optimal combination of these parameters would be prohibitively expensive in terms of time and resources.
Recently, it has been realized that a fundamental understanding of the nature of damage to oocytes during
the multiple steps involved in the cryopreservation procedure, such as CPA addition/removal, cooling, and
intracellular ice formation temperature, is crucial. The ability for successful cryopreservation of mammalian
oocytes is highly dependant upon an understanding of the fundamental cryobiological factors that determine
viability or death post-thaw.
The cryopreservation process causes significant changes in the thermal, chemical, and physical
environment in the tissue, with attendant risks of biological damage. Temperature changes are mainly due
to heat-transfer boundary conditions imposed by the cooling and warming methods, but can also be affected
17
by the latent heat of fusion of ice in the cell suspension. The chemical environment may be altered prior to
cryopreservation by addition of cryoprotectant agents, and the intracellular and extracellular CPA
concentration changes phase in the suspending medium occurs during cryopreservation. The growth of this
ice phase removes water from the remaining unfrozen solution, thus enriching the medium in solutes, and
lowering the chemical potential of the unfrozen water. Consider now the development of a cryopreservation
procedure. If there are n steps in the chemical-processing protocol, and m steps in the temperature profile,
there will be at least p = 3n + 2m protocol parameters to optimize. Because there is interaction between the
various processing steps (e.g., the effect of cooling rate depends on the cryoprotectant concentration; the
effect of the warming procedure depends on the preceding freezing protocol), all p parameters should be
simultaneously optimized. Whereas in the simplest case, n = 2 (a single cryoprotectant addition step and a
single dilution step) and m = 2 (linear cooling and linear warming), optimization using a full factorial
design with only two levels for each parameter would require 2p=1024 experiments. Clearly, the number of
experiments required for rigorous optimization of cryopreservation procedures is prohibitively large, even
for the simplest class of protocols (Karlsson and Toner, 2000).
Developing protocols that optimize the survival, fertilization and developmental rates of fully grown
GV and MII stage oocytes following exposure to the extreme chemical and physical stresses associated
with cryopreservation has proven to be a major challenge. Cryopreservation of biological specimens causes
complex changes in structure and cellular composition, and no single approach has yet proved to be
universally effective. In addition, there are significant stage- and species-specific differences between
freezing oocytes and embryos.
The use of mathematical models to predict the effect of cryopreservation on cells was pioneered by
Mazur (1963). Rational design of freezing protocols has become possible in the wake of advances in the
theoretical modeling of intracellular ice formation, a major mechanism of freezing injury (Muldrew and
McGann, 1994; Pitt et al., 1992; Toner et al., 1993). Pitt (1992) has demonstrated the power of
mathematical models in the optimization of non-linear freezing protocols, using a hypothetical cell type as
an example. Muldrew predicted an optimal protocol for the cryopreservation of particular cartilage to -80°C
using the osmotic rupture model (Muldrew and McGann, 1994), but has not attempted to test this protocol
experimentally. Toner et al (1993) have used their intracellular ice formation model to optimize a protocol
for the rapid freezing of 1-cell mouse embryos to -45°C in the absence of cryoprotectants, obtaining good
agreement between experimental results and model predictions. The model has recently been extended to
include cryoprotectants, as well as the effects of intracellular crystal growth (Karlsson et al., 1994).
Theoretical predictions by Karlsson et al have been shown to be consistent with the results of an
experimental protocol optimization, thus demonstrating the feasibility of using the model for the rational
design of freezing protocols. Model predictions are then tested experimentally, resulting in the recovery of
>80% morphologically normal oocytes after cryopreservation to -196°C. The rates of fertilization and
18
development of these oocytes were comparable with values obtained using current cryopreservation
techniques for mouse oocytes.
1.6 OUTLINE OF THE STUDY
In this Ph.D. thesis, starting from basic cryobiology principles, following the establishment of
comprehensive theoretical modeling are presented.
Chapter 1 presents an overview of the current state of oocyte cryopreservation, and the summary of
the developments of optimized cryopreservation methods via fundamental approach and theoretical
analysis. In Chapter 2, typical biophysical events that occur during a procedure of cryopreservation are
discussed in details. Based on the classic membrane transportation equations (Kedem and Katchalsky
formulism) for a ternary solution, a theoretical model that includes the movement of cryoprotectant across
the plasma membrane during cooling and warming and the ternary phase diagram is derived for the first
time. All equations that govern these biophysical events are presented, along with oocyte related parameters
and their relevance to cryopreservation.
In Chapter 3, one stand-alone published manuscript presents the method of theoretically optimizing
an ISF protocol. In this study, rat zygote was chosen as the model cell and DMSO was chosen as the
permeable CPA because the most complete set of information exists for this combination. Theoretically,
these calculations may be conducted for any cell type and CPA provided the appropriate information
regarding the fundamental membrane permeability parameters and phase diagram solution characteristics
are known. While the procedures described in this chapter focused upon rat zygotes, the cryobiological
principle and the methodology would apply directly to other species and other cell types; including
mammalian oocytes.
In Chapter 4, one stand-alone manuscript presents an accumulative osmotic damage model for oocyte
cryopreservation. The objective of the this study was to experimentally determine osmotic characteristics of
rabbit oocytes, such as the osmotically inactive volume (Vb), isotonic oocyte volume (Viso), and the values
of membrane permeability coefficients for water (hydraulic conductivity, Lp), and permeating
cryoprotectants (Ps ) . Investigation of the rabbit oocyte volume responses during the cryoprotectant agent
(CPA) addition and dilution procedures was conducted and compared to the ability of the
parthenogenetically activated oocytes to develop to blastocysts in culture. The results of this comparison led
to the establishment of a new model to describe the accumulative osmotic damage (AOD) associated with
the processes of the addition/dilution.
In Chapter 5, the research on the development of a novel cryopreservation three-step method for
mammalian oocyte is presented. Cryopreservation of metaphase II oocytes requires that they pass through a
critical temperature range rapidly enough to prevent chilling injury associated with the depolymerization of
the metaphase spindle fibers. In order to accomplish this, a “three-step freezing” method was designed. The
first step is a non-equilibrium cooling step, which reduces the sample temperature from ambient
19
temperature to an intermediate temperature (Tp) at a high rate. The second step involves maintaining the
cells at Tp for a specific time (th) allowing the CPA to reach a critical concentration intracellularly. The
third step involves rapidly cooling the cells by plunging the sample into liquid nitrogen. Using biophysical
characteristics that were experimentally determined previously, such as the membrane permeability
coefficient(s) for water (Lp), CPAs (PCPA) and their activation energies (Ea of Lp and Ea of PCPA) , and
intracellular ice formation (IIF) kinetic parameters, the current model allows the investigation of the
relationships among the initial CPA concentration, Tp and th at Tp. The calculation results would eliminate
the conditions that lead to a high probability of intracellular ice formation (PIIF) both during the holding
period or the plunge into LN2, the latter occurring if an insufficient intracellular concentration to achieve
intracellular vitrification during the holding period is attained. Calculation results are presented in contour
plots, from which cryopreservation protocols can be created by identifying conditions that could be used
from the plots. The model was quite accurate in predicting the likelihood of intracellular ice formation, with
3 of the 4 combinations having 95 percent confidence intervals containing the value of the model's
prediction for mouse oocytes.
The overall goal of the work is to develop rational design approach to cryopreservation protocols for
mammalian oocyte, in which a theoretical model is used to efficiently optimize a freezing protocol for
oocytes. This may be critical in developing successful cryopreservation methods for human or endangered
species/breeds oocytes by drastically reducing the number of oocytes and experiments required for
optimization. In addition, theoretical models can be the basis for the researchers to improve their
understanding on the complex behavior of cells during cryopreservation.
20
CHAPTER 2. THEORY OF FUNDAMENATAL CRYOBIOLOGY AND EQUATION
DERIVATION
2.1 BIOPHYSICAL EVENTS DURING CRYOPRESERVATION
Current cryopreservation protocols consist of a series of biophysical events that subject cells to major
anisosmotic conditions which result in potentially damaging changes in cell volume. Cells shrink
transiently upon the addition of cryoprotective agents (CPA) and then re-swell as the cryoprotectant
permeates. Cells undergo a second shrinkage when cooled at rates low enough to preclude intracellular
freezing as growing extracellular ice concentrates the solutes in the diminishing volume of non-frozen
water, causing exosmosis. The cells return once again to their normal volume during warming and thawing.
Finally, cells undergo a potentially damaging osmotic volume excursion during the removal of the
cryoprotectant (Mazur, 1984, 1990). The direction and magnitude of the volume excursion depends on the
manner of the addition or removal of cryoprotectant and on the inherent permeability of the cell to both
cryoprotectant and water (Gao et al., 1995; Levin and Miller, 1981). These osmotically driven volume
changes (at constant or varying temperatures) can be described theoretically using biophysical equations
(Kedem and Katchalsky, 1958) if these transport parameters describing the permeability of the cell to water
and solute are known, namely: (1) the hydraulic conductivity of water (Lp), (2) the permeability coefficient
of the solute (Ps). Mazur et al. (1972) first proposed a “two-factor” hypotheses of cell damage during
cooling and warming, based primarily on the rate of cooling. In Mazur’s model, cells lose viability at
supraoptimal cooling rates due to intracellular ice formation (IIF) and at suboptimal rates by a prolonged
exposure to high solute concentrations. Numerous attempts have been made to correlate observations of cell
injury at supraoptimal cooling rates with predictions of intracellular ice nucleation using physicochemical
theory. Mazur (1960) suggested that intracellular ice formation (IIF) was caused by the growth of ice
crystals through aqueous channels in the plasma membrane. Toner et al (1990) introduced a two-factor
mechanism of IIF: volume catalyzed nucleation (VCN) and surface catalyzed nucleation (SCN) to
investigate the IIF induced by heterogeneous nucleators in cell solution (VCN) and the internal surface of
the membrane (SCN). Muldrew and McGann (1990) proposed a mechanism of intracellular ice formation
resulting from membrane damage caused by exceeding a critical gradient in osmotic pressure. Pitt et al
(1992) introduced a stochastic model to calculate the probability of IIF based on the extent of supercooling
of the cytoplasm. For the “solution effects” caused by suboptimal cooling, Fahy (1981) and Pegg and
Diaper (1988) studied the solute loading and susceptibility of slowly cooled cells to rapid warming. A
quantitative investigation of any of the above theories, to different extents, requires knowledge of: (1) the
change in cell water volume vs. temperature during cooling and warming, (2) the change in intracellular
solute concentration vs. temperature, (3) the change in extracellular solute concentration vs. temperature,
and (4) the degree of supercooling vs. temperature.
21
It is possible to determine these changes provided that: (1) the cell acts as an ideal osmometer (a
plot of cell volume vs. 1/osmolality is linear), (2) the above transport parameters and their respective
activation energies (Ea) are known, and (3) the phase diagram of the CPA solution is known. In order to
accurately calculate the changes that occur during cryopreservation, one must ensure that the parameters
are accurately determined and that the theoretical model is as complete as possible. Mazur (1963) first
introduced a model to examine the kinetics of water loss from cells at subzero temperatures, which
permitted the calculation of cell water content as a function of temperature and cooling rate, and the
variability of these parameters with cell volume, surface area, hydraulic conductivity and its temperature
coefficient. In his model, Mazur assumed that the plasma membrane was impermeable to the
cryoprotectant at temperatures below 0oC, and used the Clausius-Clapeyron equation describing the vapor
pressure change as a function of temperature.
2.2 MATHEMATICAL FORMULATION OF THE MEMBRANE PERMEABILITY
COEFFICIENTS
The Kedem and Katchalsky formulism was used in present dissertation as the theoretical model of
the permeability of cell membranes to nonelectrolytes (Kedem and Katchalsky, 1958). Briefly, for a ternary
solution consisting of a permeable solute (cryoprotectant, subscript “s”) and an impermeable solute (NaCl,
subscript “n”), the total transmembrane volume flux (Jv) and permeable solute flux (Js) are presented as:
1
A
dV
dtJ L P P RT M M RT M Mv p
e ine
ni
se
si ( ) ( ) ( ) (2.1)
1
1A
dn
dtJ m J P as
i
s s v s se
si ( ) ( a ) , (2.2)
where V is cell volume and nis is the number of moles of CPA inside the cell, P is the hydrostatic pressure,
and M is osmolality and a is activity (explanations for descriptions, units and values of the symbols are
summarized in Table A). In the term m =sm m
m mse
si
se
si
ln ln
, m is the concentration in molal. The superscripts
“i” and “e” refer to the intra- and extracellular cell compartment, respectively. The terms Lp, Ps and are
parameters for the hydraulic conductivity of water, the permeability coefficient of the CPA, and the
reflection coefficient, respectively. The temperature and universal gas constant are given by T and R,
respectively. Equations 2.1 and 2.2 may be rewritten in more convenient terms. The contribution of the
CPA to the osmolality and activity of the solution may be represented as products of molality and
coefficients:
(2.3a) M m
a m
sj
s s sj
sj
sj
sj
where is the osmotic coefficient and is the activity coefficient, and vs is equal to unity for the
nonelectrolyte CPA. In this paper, and are set to be unity so that
s s
s s
, (2.3b) M m a msj
sj
sj
sj ,
where j = i or e for the intra or extracellular region. For the impermeable solute (NaCl), the osmotic
coefficient n was assumed to be constant. Then the intracellular osmolality of NaCl is given by:
M MV V V
V V Vni
no
ob s
o
b s
( )( ) ( )
, (2.4)
where Vb is the osmotically inactive cell volume and V N Vs si
s is the CPA volume (Vs is the
partial molar volume of the CPA). The superscript “(o)” represents the initial values at t = 0. In the
22
absence of CPA, Vs = 0, and assuming that the initial conditions are isotonic and Vbp is the percentage of
osmotically inactive cell volume, i.e. Vb=VisoVbp., then Eq. 2.4 becomes:
V
V
M
MV V
iso
isobp bp ( )1 . (2.5)
This equation defines the Boyle Van’t-Hoff plot, in which V / Viso is plotted vs. Miso / M and the
percentage of osmotically inactive cell volume, Vbp, is given by the intercept of the plot. The relation
between and is given by: nsi ms
i
, (2.6) n V V V msi
b si ( s)
where (V -Vb- Vs) denotes the volume of intracellular water.
Combining Equations 2.1, 2.2, and 2.6 and assuming the hydrostatic pressure difference across the
membrane is zero, a pair of coupled nonlinear equations that describe the cell volume and amount of solute
in the cell as functions of time are obtained:
dV
dtL ART M M m mp n
ine
si
se ( ) ( ) (2.7)
and
dm
dt
V m
V Vm
m
V m
dV
dtAP m ms
is s
i
bs
si
s si s s
esi
( )[ ( )
( )] [(
11
1
2
)] . (2.8)
23
2.3 ACTIVATION ENERGIES FOR PARAMETERS
The Arrhenius relationship was used to describe the temperature dependence of the parameters Lp
and Ps (Levin et al., 1976). The value of any parameter Pa (Lp or Ps) at any temperature T can be obtained
by the following formula:
P T PE
R T Ta aoa
o
( ) exp
1 1; (2.9a)
or in another form:
ln[ ( )]P TE
RTaa Constant , (2.9b)
where Ea is the activation energy for the process, expressed here in Kcal/mole, R is the universal gas
constant, and T the absolute temperature. The subscript “(o)” represents the values at a reference
temperature To. From Eq. 2.9b, if the Pa data at different temperatures are plotted as ln[Pa(T)] vs. 1/T , a
linear plot, (Arrhenius plot), is obtained with a slope of:
slope E Ra / , (2.10)
from which Ea can be determined.
2.4 CALCULATIONS OF INTRACELLULAR WATER VOLUME AND CPA
CONCENTRATIONS DURING FREEZING AND THAWING.
By Raoult’s law, the vapor pressure of a solvent is proportional to the mole fraction of solvent. The
vapour pressure of water in intracellular and extracellular regions can be described by:
, and (2.11) p p xio
i
(2.12) p p xeo
e
where po is the vapor pressure of pure water, and xn
n n nx
n
n n ni w
i
wi
ni
si
e we
we
ne
se
, are the mole
fractions of intracellular and extracellular water, respectively. The superscripts “i” and “e” refer to the intra-
and extracellular compartments, respectively; and subscripts “n”, “w” and “s” refer to NaCl, water and
solute CPA, respectively. Further, we can write the mole fractions in the following manner:
xn
n n n
n v
n n n v
V
V n n vi w
i
wi
ni
si
wi
wi
ni
si
wi
wi
ni
si
10
10 10( ) ( ), and (2.13)
1
1 1x
n n
n
W MW W MW
W MWene
se
we
ne
n se
s
we
w
, (2.14)
24
where n is the mole number, W is the weight of a substance in grams, MW is the molecular weight, and v10
is the molar volume of water. We define in this paper instead of the standard notation R to
distinguish the weight ratio from the universal gas constant R. So Eq. 2.14 becomes:
R W Wt se
ne /
1
11 1
1x
W
WMW
MW R MW
W
WGe
se
we w
n t s
se
we
, (2.15)
where G MWMW R MWw
n t s
1 1. Hereafter we ignore the superscript “e” for the weight of
substances in extracellular region.
The melting point for DMSO/NaCl/Water ternary solution is given by (Pegg, 1986):
T A (2.16) C B C C Cm 1 12
13
where coefficients A1, B1 , and C1 are functions of Rt. At any temperature above the eutectic temperature,
the extracellular solute concentration at temperature T can be obtained by solving for C=C(T, Rt) in Eq.
2.16. By definition, C is the total solute concentration in g/100g and can be written as:
CW
W W W Wst
st w w st
100 100
1 /, (2.17a)
and W W W W Rst n s s t ( )1 1 . (2.17b)
Rearranging the above equations, we get:
W
W C Rw
s t
1001 1
1) . (2.18)
By putting Eq. 2.18 into Eq. 2.15, we have:
1
1 1100x
GW
W
G C
Ces
w
'
( ), (2.19)
where GGR
Rt
t
'
( )
1. The rate of change of the cell water volume is given by:
dV
dtAL Tw
pi e ( )( ), (2.20)
where RT
vp po
10
ln( ) . Considering the cooling rate B=dT/dt, we obtain
dV
dT
ARTL T
v Bp pw p e
( )ln ln
10
i . (2.21)
25
Substituting Eq. 2.11 and Eq. 2.12 for pe and pi in Eq. 2.21, we have:
dV
dt
ARTL T
v Bx xw p i e
( )ln ln( / )
10
1 .
Replacing the xi by Eq. 2.13 and 1/xe by Eq. 2.19, we now have:
dV
dT
ARTL T
v B
V
V n n v
G C T
C Tw p w
w ni
si
( )ln
( )ln
( )
( )
'
10 10
1100
. (2.22)
If the transmembrane movement of CPA is taken into consideration, the following equation is used to
calculate the change in intracellular CPA (assume = 1):
dn
dtAP T m ms
i
se i ( ) . (2.23)
The intracellular CPA concentration can be calculated as mi=nis/Vw and the extracellular
concentration is given by:
mW
MW W
R C
MW C Re s
s w
t
s t
1000 1000
100 1( )( ). (2.24)
Finally we obtained two coupled equations depicting the changes of intracellular water volume and
the mole number of CPA during temperature changes with cooling rate of B in the presence of extracellular
ice:
dV
dT
ARTL T
v B
V
V n n v
G C T
C Tw p w
w ni
si
( )ln
( )ln
( )
( )
'
10 10
1100
(2.25)
dn
dT
AP T
B
R C
MW C R
n
Vsi
s t
s t
si
w
( )
( )( )
1000
100 1. (2.26)
These equations represent a theoretical model incorporating the transmembrane movement of
cryoprotectant at during a cooling rate of B. The model can be used to investigate the responses of cells to
established cryopreservation procedures by simulating the cell water volume, the water flux across the
plasma membrane, intra- and extracellular solute concentrations, the degree of supercooling of the
cytoplasm, and the probability of ice nucleation in the cytoplasm.
26
27
CHAPTER 3. A THEORETICAL MODEL FOR THE DEVELOPMENT OF
INTERRUPTED SLOW FREEZING PROCEDURES
3.1 INTRODUCTION
Current mammalian oocyte and embryo cryopreservation protocols have evolved from methods that
have been successful with mouse and cattle embryos (Stachecki et al., 1998). The basic strategy typically
employed involves the use of a “two-step” or “interrupted slow freezing” (ISF) procedure; which is a
common approach currently used to cryopreserve many different cell and tissue types (Mazur, 1990). In
general, this procedure consists of an initial slow cooling period followed by rapid cooling as the sample is
plunged into liquid nitrogen (LN2) for final storage. In the initial slow cooling step, extracellular ice is
induced at a temperature just below the solution freezing point, and then slow cooling continues (at a given
rate defined as: B1) in the presence of this growing ice phase, which raises the extracellular solute
concentration in the unfrozen fraction and results in water being removed from the cell via exosmosis (see
Table A for a complete description of terms and abbreviations). Permeating CPAs, such as GLY, DMSO,
EG or PG are typically included in the suspension medium, to protect the cell against injury from the high
concentrations of electrolytes (so-called solution effects) that develop as water is removed from the solution
as ice. These CPAs become increasingly concentrated intracellularly as the cell dehydrates.
As this ISF procedure continues, the slow cooling step is terminated at an intermediate temperature at
which plunging occurs (Tp), and is followed by a rapid cooling step (at a given rate defined as: B2) in which
the cell is usually plunged into LN2. Provided the initial cooling step was conducted in such a way as to
allow a “critical concentration” ([CPA]c) of intracellular solute ([S]i; in the present study defined as CPA +
NaCl) to be reached within the cell, the CPA will interact with the remaining water during this rapid
cooling step, resulting in the intracellular solution forming a glass-like structure (vitrification) preventing
damaging intracellular ice formation (IIF). The concentration of CPA required to achieve intracellular
vitrification during the subsequent rapid cooling (and to maintain the vitrified state during warming) is
dependent upon the nature of the solute, the rate of rapid cooling during the plunge into LN2, and the rate of
warming during subsequent thawing (Ren et al., 1994).
The Tp at which the [CPA]c is attained during the slow cooling phase of ISF will depend upon the
initial concentration of CPA present in the cells (at the onset of the slow freezing step) and the initial slow
cooling rate. For a given [CPA]c, this temperature could be theoretically determined for a specific initial
concentration of CPA loaded into cells prior to freezing and a specific cooling rate. This suggests that
theoretical determination of an ISF cryopreservation protocol is possible provided that the [CPA]c is
known.
Therefore, in the context of ISF protocol development, the goal is to determine the best selection of
the initial CPA concentration ([CPA]0), B1 and the Tp, which allows the [S]i to reach the [CPA]c. These
28
determinations can be achieved by experimental and theoretical approaches. The procedures usually involve
defining ranges of prospective selections of [CPA]0 and B1 for a given cell and CPA type, followed by
evaluation of these ranges to determine which will yield optimal results judged by experimental or
established theoretical criteria. Many models have been proposed to integrate the above aspects (to differing
extents) in an attempt to quantitatively examine the biophysical events that occur during cryopreservation.
Mazur (1963; 1966) first introduced a model which allowed the examination of the kinetics of water loss
from cells at subzero temperatures, relating it to the effects of cooling and warming velocity on cryo-
survival. Liu et al. (1997) established a theoretical model incorporating the transmembrane movement of
cryoprotectant at low temperatures and the DMSO/NaCl/water ternary phase diagram. Karlsson et al.
(1996) have conducted a comprehensive study in which a coupled mechanistic model was used to design
and optimize a two-step cryopreservation protocol for mouse oocytes. Briefly, their method consisted of
fixing a given CPA concentration (1.5 M) then optimizing the cryopreservation protocol by: (i) minimizing
the time taken to reach the final temperature (to reduce injury by solution effects) and (ii) avoiding IIF. The
optimization process developed by Karlsson et al. involved defining a cost function equivalent to the
duration of the freezing protocol. The protocol was then theoretically optimized by using a sequential
simplex algorithm to minimize the cost function, subject to the constraint that the predicted incidence of
intracellular ice formation remains below 5%.
The objective of the present study was to theoretically optimize an ISF protocol to cryopreserve rat
zygotes. In this study, DMSO was chosen as the permeable CPA because the most complete set of
information exists for solutions of this permeating cryoprotectant, specifically critical
concentrations/cooling and warming rates necessary for vitrification and ternary solution phase diagram
information (Pegg, 1986). The basic phenomenological strategy employed in the current model was similar
to Karlsson et al.’s (1996) studies in that the consequences of the duration of slow cooling and the
probability of IIF were considered; however the current strategy employed a different theoretical method.
Specifically, the current model assumed: a) that the cell membrane was permeable to CPA at any
temperature (with permeability being calculated using the Arrhenius relationship); b) the actual ternary
solution phase diagram was used instead of the more general Clausius-Clapeyron equation; and c) a
simplified model was used to predict IIF. Essentially, development of the model followed three steps: (1) an
initial range of DMSO concentrations from 0 to 4 Molal, and a range of cooling rates from 0 to 2.5oC/min
were evaluated theoretically to determine the selections of [CPA]0 and B1 that would allow the [S]i to reach
the [CPA]c; (2) using Mazur’s IIF model (Mazur, 1977), the selections that could result in IIF were
eliminated; and (3) the associated plunging temperatures for the combinations of [CPA]0 and B1 ranges
were then calculated. The optimum set of conditions from the final range was then selected based on
minimum duration of slow cooling.
3.2 MATERIALS AND METHODS
3.2.1 Theoretical Prediction of Intracellular Water Volume and Solute Mole Number at Varying
Temperatures
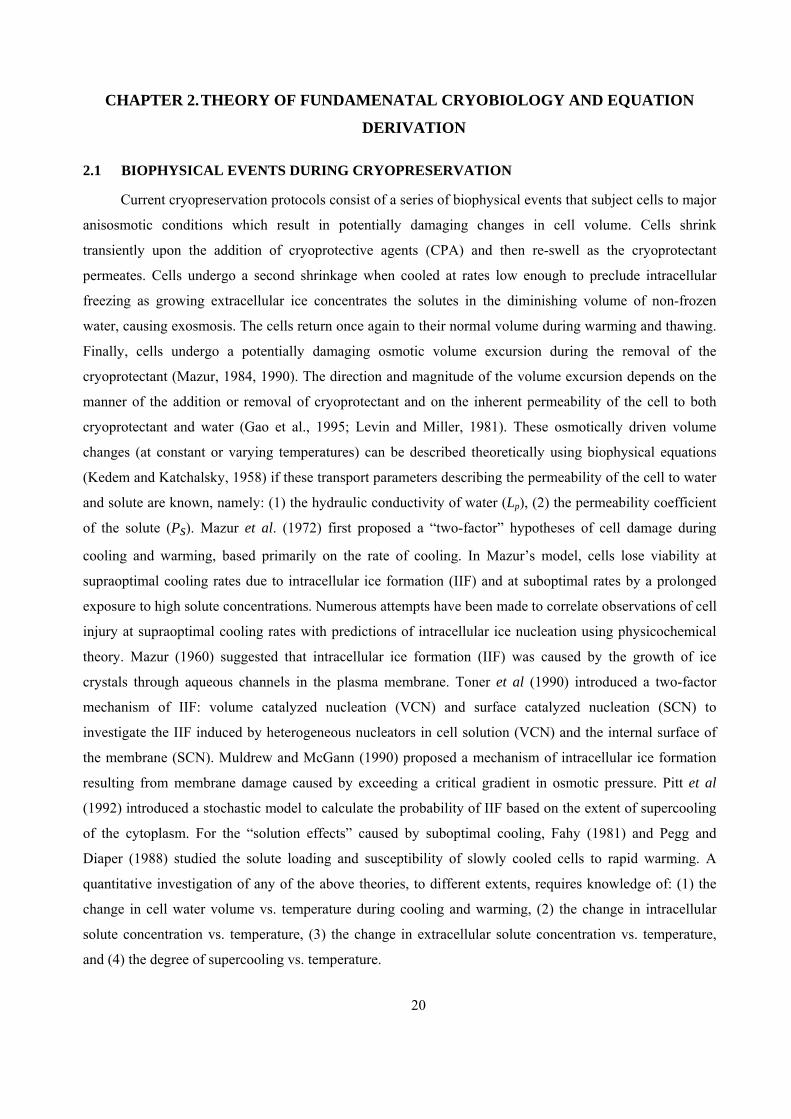
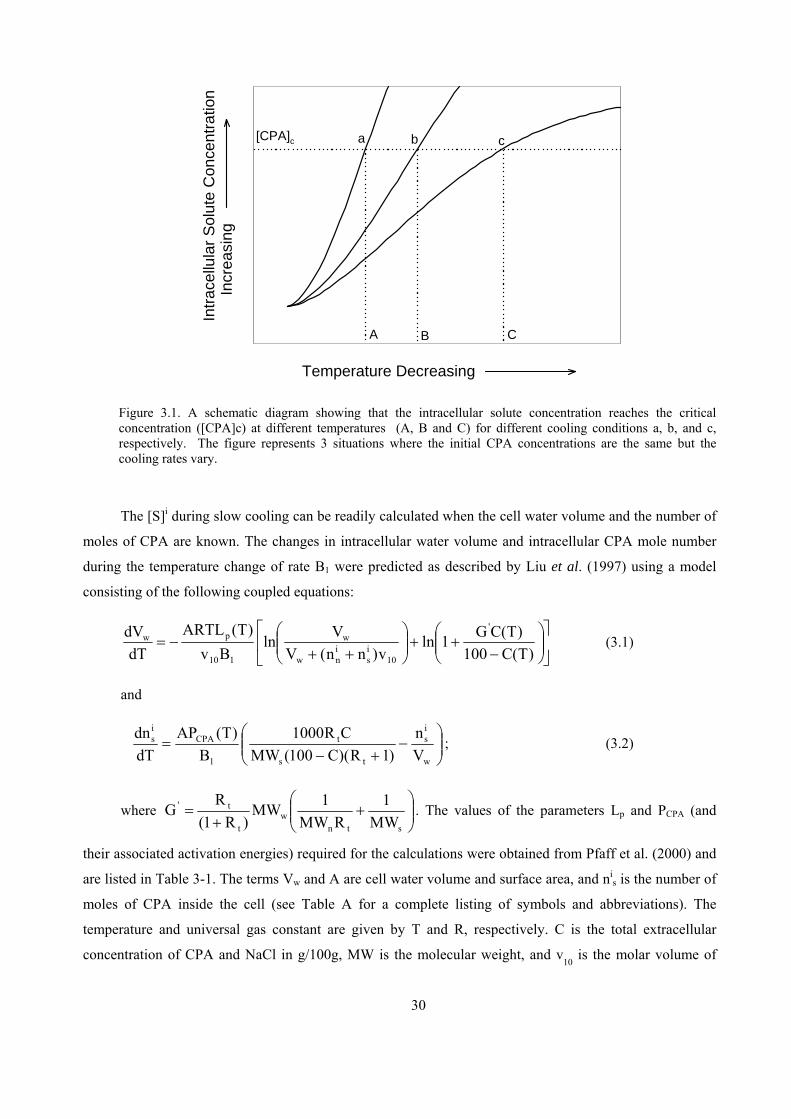
During slow cooling, temperature is typically decreased linearly causing the intracellular solute
concentration to increase monotonically as shown in Figure 3.1. For a specific cell and CPA, the change in
the intracellular CPA concentration is affected by cooling conditions, i.e. the B1 of the process and the
[CPA]0 loaded into cells prior to the onset of freezing. As shown conceptually in Figure 3.1, for three
different cooling conditions (initial CPA concentrations and cooling rates) a, b, and c, the [S]i reaches the
[CPA]c at different temperatures, A, B and C, respectively. These temperature points are defined as the
plunging temperatures (Tp).
Table 3-1. Parameter values for rat zygotes
Description Units Valuea
Hydraulic conductivity Lp matm-1min-1 0.54 (at 25 oC)
Solute permeability PCPA cmmin-1. 1.024x10⁻³
Isotonic cell volume m3 2.3x10⁵
Surface area m2 1.8x10⁴
Osomotic inactive volume m3 4.6x10⁴
Activation energy (Lp) Kcalmole-1K-1 14.8
Activation energy (PCPA) Kcalmole-1K-1 17.1
Nucleation temperature oC -35
Coefficient a0 none 40375b
Coefficient a1 none -1837b
Coefficient a2 none 20.9b
a(Pfaff et al., 2000) bData for DMSO, adapted from Sutton (1991)
29
Temperature Decreasing
Intr
ace
llula
r S
olut
e C
once
ntr
atio
n
In
crea
sing
[CPA]c b c
B CA
a
Figure 3.1. A schematic diagram showing that the intracellular solute concentration reaches the critical concentration ([CPA]c) at different temperatures (A, B and C) for different cooling conditions a, b, and c, respectively. The figure represents 3 situations where the initial CPA concentrations are the same but the cooling rates vary.
The [S]i during slow cooling can be readily calculated when the cell water volume and the number of
moles of CPA are known. The changes in intracellular water volume and intracellular CPA mole number
during the temperature change of rate B1 were predicted as described by Liu et al. (1997) using a model
consisting of the following coupled equations:
)T(C100
)T(CG1ln
v)nn(V
Vln
Bv
)T(ARTL
dT
dV '
10is
inw
w
110
pw (3.1)
and
w
is
ts
t
1
CPAis
V
n
)1R)(C100(MW
CR1000
B
)T(AP
dT
dn; (3.2)
where
stnw
t
t'
MW
1
RMW
1MW
)R1(
RG . The values of the parameters Lp and PCPA (and
their associated activation energies) required for the calculations were obtained from Pfaff et al. (2000) and
are listed in Table 3-1. The terms Vw and A are cell water volume and surface area, and nis is the number of
moles of CPA inside the cell (see Table A for a complete listing of symbols and abbreviations). The
temperature and universal gas constant are given by T and R, respectively. C is the total extracellular
concentration of CPA and NaCl in g/100g, MW is the molecular weight, and v10
is the molar volume of
30
water. In the current study, Rt is defined as (W is the weight of a substance) instead of the
standard notation R to distinguish it from the universal gas constant R.
en
es W/W
The value of parameter Lp(T) and PCPA(T) in equations (3.1) and (3.2) can be calculated using the
following Arrhenius relationship(Levin et al., 1976):
T
1
R
,L(EexpP)T(P pa
araoara
T
1)P
o
CPA ; (3.3)
where Para = Lp or PCPA and Ea(Lp , PCPA) is the activation energy for the process, expressed here in
Kcal/mole. The subscript “o” represents the values at a reference temperature To.
The extracellular solute concentration, C=C (T, Rt), at temperature T can be obtained by solving the
following equation of the melting point for DMSO/NaCl/Water ternary solution (Pegg, 1986):
(3.4) 33
221 CACACAT
where coefficients A1, A2 , and A3 are functions of Rt.
By solving these equations, it is possible to quantitatively calculate: (i) the change in cell water
volume vs. temperature during cooling; (ii) the change in [S]i vs. temperature; and (iii) the change in
extracellular solute concentration vs. temperature.
3.2.2 Assumptions Pertaining to Intracellular Ice Formation (IIF)
Several theories have been proposed to quantitatively study the probability of IIF (Karlsson et al.,
1994; Muldrew and McGann, 1990, 1994; Pitt et al., 1992; Toner et al., 1990). These models, to some
extent, require additional parameters to describe the kinetics of intracellular ice formation. These
parameters are usually cell specific and are typically determined by experiments incorporating relatively
high cooling rates in order to observe IIF. The present method makes assumptions based upon Mazur’s
“three requirements” for IIF: (1) the sample temperature has reached the ice nucleation zone, or in other
words, the temperature has become lower than the nucleation temperature; (2) the intracellular water
content at that time is 10% of its isotonic value; and (3) the intracellular water is 2oC or more
supercooled. Based upon these criteria, IIF will not occur if any one of these requirements is not met. Cell
water content can be calculated as described above while the nucleation temperature must be
experimentally determined. The extent of supercooling can be calculated by taking the difference between
the melting points (determined by the NaCl/DMSO/H2O phase diagram, Equation 4) of intracellular and
extracellular solutions. For any given [CPA]0 and B1, the total [S]i can be calculated at any temperature.
This information enables determination of the plunging temperature Tp for specific [CPA]0 and B1
combinations, provided that the [CPA]c for a given CPA is known.
31
3.2.3 Source of Embryos for Ice Nucleation Experiments
Each experimental replicate consisted of five to ten postpubertal, naturally cycling female rats (8-10
weeks of age) from an outbred stock (HSD: Sprague Dawley SD), (Harlan Sprague Dawley, Inc.,
Indianapolis, IN) which were synchronized using a GnRH agonist (des-Gly10,[p-Ala6]-Luteinizing Hormone
Releasing Hormone Ethylamide (Sigma Chemical Co, St. Louis, MO). The lyophilized powder was
dissolved and reconstituted using physiological saline to yield a 200 g/ml solution. Each female rat was
injected (IP) with 0.2ml (40 g) of GnRH agonist solution between 9:00 am and 10:30 am and placed in a
cage with a mature male rat in the afternoon of the 4th day after synchronization. The following morning,
the female rats were screened for presence of vaginal plugs, and vaginal cytology was evaluated for the
presence of spermatozoa and stage of the estrous cycle. For collection and recovery of zygotes, rats were
injected (IM) with 0.1 ml of a 10:2 (v/v) mixture of 100 mg/ml Ketamine (Ketaset, Fort dodge Animal
House, Fort Dodge, IA): 100 mg/ml Xylazine (Rompun, Bayer Co., Shawnee Mission, KS) for sedation
followed by cervical dislocation. The oviducts were excised and placed into a petri-dish containing
phosphate buffered saline (PBS) (Life Technologies Inc., Grand Island, NY), supplemented with 1 mg/ml
hyaluronidase (Sigma Chemical Co., St. Louis, MO) and 4 mg/ml bovine serum albumin (BSA) (Sigma
Chemical Co., St. Louis MO). The extended, translucent oviductal ampulla was dissected to release the
clutch of zygotes into the solution in the petri-dish. The zygotes were left in the petri-dish with the
hyaluronidase for approximately 5 minutes to enable dissociation and removal of the cumulus cells from the
zygotes. A stereo dissecting microscope (Nikon SMZ-2T) was used to evaluate the zygotes for the presence
of polar bodies and pronuclei to verify fertilization. The cumulus-free zygotes were washed by transferring
them through three drops of hyaluronidase-free PBS before being placed into 40 l culture drops of Ham’s
F10 under oil in petri-dishes, and maintained in an incubator in humidified 5% CO2 and air / 90% N2 at
37°C.
3.2.4 Determination of Critical Concentration
For the purposes of this study, the [CPA]c was assumed to be the greater value between the
concentration necessary to induce vitrification during cooling ([CPA]c) and that required to preclude
devitrification during warming ([CPA]c) at rates that could be attained in the given cell containers. This
concentration is defined as [CPA]c, and was the value used in the optimization calculation. Using the
[CPA]c ensures a conservative estimate of [CPA]c for determination of [CPA]0, B1and the Tp. For the
plunging step, the following formula introduced by Sutton (1991) was used for calculating the critical
cooling rate (Bc) for a given concentration (C) of solute (CPA and NaCl) in solution with H2O:
(3.5) B a a C a Cc o 1 22
where a0, a1 and a2 are coefficients (Table 3-1). For the present formalism, C was based on CPA and
NaCl content at a constant ratio (it should be noted that Equation 3.5 was originally developed based on
32
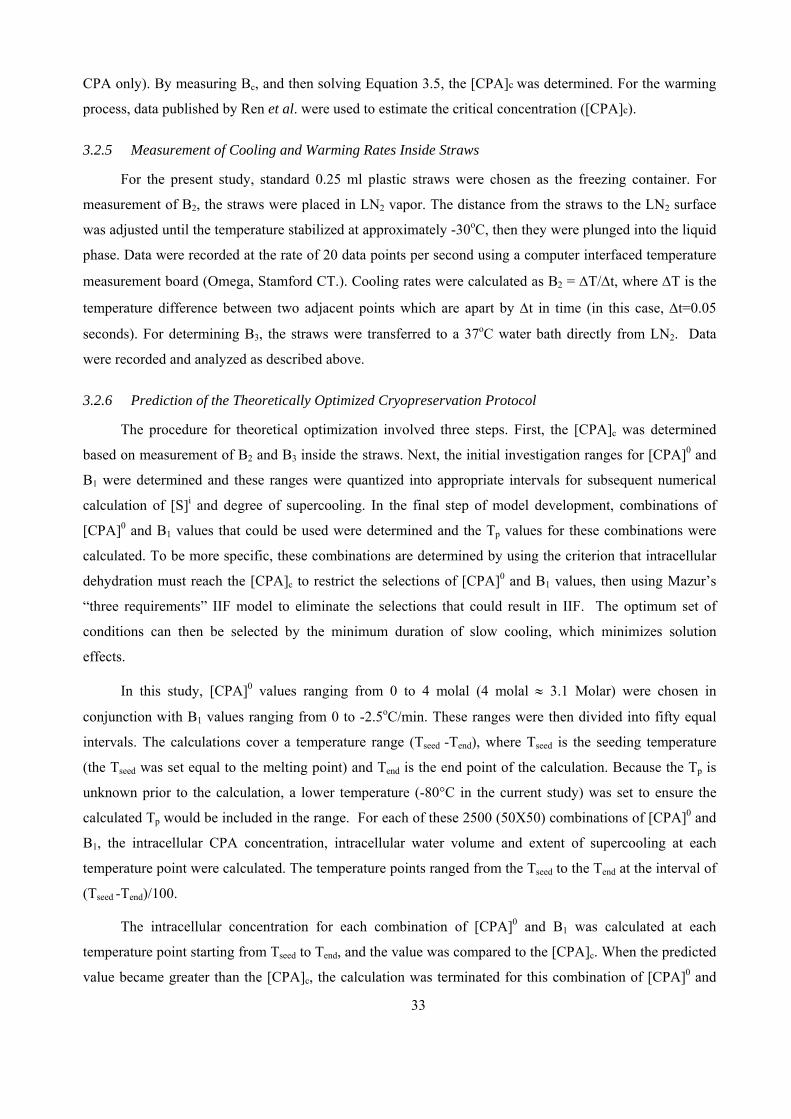
33
CPA only). By measuring Bc, and then solving Equation 3.5, the [CPA]c was determined. For the warming
process, data published by Ren et al. were used to estimate the critical concentration ([CPA]c).
3.2.5 Measurement of Cooling and Warming Rates Inside Straws
For the present study, standard 0.25 ml plastic straws were chosen as the freezing container. For
measurement of B2, the straws were placed in LN2 vapor. The distance from the straws to the LN2 surface
was adjusted until the temperature stabilized at approximately -30oC, then they were plunged into the liquid
phase. Data were recorded at the rate of 20 data points per second using a computer interfaced temperature
measurement board (Omega, Stamford CT.). Cooling rates were calculated as B2 = T/t, where T is the
temperature difference between two adjacent points which are apart by t in time (in this case, t=0.05
seconds). For determining B3, the straws were transferred to a 37oC water bath directly from LN2. Data
were recorded and analyzed as described above.
3.2.6 Prediction of the Theoretically Optimized Cryopreservation Protocol
The procedure for theoretical optimization involved three steps. First, the [CPA]c was determined
based on measurement of B2 and B3 inside the straws. Next, the initial investigation ranges for [CPA]0 and
B1 were determined and these ranges were quantized into appropriate intervals for subsequent numerical
calculation of [S]i and degree of supercooling. In the final step of model development, combinations of
[CPA]0 and B1 values that could be used were determined and the Tp values for these combinations were
calculated. To be more specific, these combinations are determined by using the criterion that intracellular
dehydration must reach the [CPA]c to restrict the selections of [CPA]0 and B1 values, then using Mazur’s
“three requirements” IIF model to eliminate the selections that could result in IIF. The optimum set of
conditions can then be selected by the minimum duration of slow cooling, which minimizes solution
effects.
In this study, [CPA]0 values ranging from 0 to 4 molal (4 molal 3.1 Molar) were chosen in
conjunction with B1 values ranging from 0 to -2.5oC/min. These ranges were then divided into fifty equal
intervals. The calculations cover a temperature range (Tseed -Tend), where Tseed is the seeding temperature
(the Tseed was set equal to the melting point) and Tend is the end point of the calculation. Because the Tp is
unknown prior to the calculation, a lower temperature (-80°C in the current study) was set to ensure the
calculated Tp would be included in the range. For each of these 2500 (50X50) combinations of [CPA]0 and
B1, the intracellular CPA concentration, intracellular water volume and extent of supercooling at each
temperature point were calculated. The temperature points ranged from the Tseed to the Tend at the interval of
(Tseed -Tend)/100.
The intracellular concentration for each combination of [CPA]0 and B1 was calculated at each
temperature point starting from Tseed to Tend, and the value was compared to the [CPA]c. When the predicted
value became greater than the [CPA]c, the calculation was terminated for this combination of [CPA]0 and
B1 and the temperature point was recorded. The extent of supercooling and intracellular water volume was
then calculated for the temperature points that fell below the nucleation temperature to determine if IIF
would occur based on Mazur’s “three requirements”. Any combination which would likely result in IIF was
then ruled out. If the [S]i could not reach the [CPA]c over the entire temperature range, this combination of
[CPA]0 values and B1 values were also ruled out. The remaining points were considered the optimum range
for plunging in LN2 for that particular combination of [CPA]0 and B1 values.
Because the B1 and Tp values for the optimum region are known, the duration of slow cooling can
readily be calculated as:
i1
seedipii B
TT , (3.6)
where i is the time required to cool the cells from seeding temperature to plunging temperature, and Tpi,
Tseedi and B1i are the associated Tp, Tseed and B1, for each individual combination, respectively. Each i can
be determined for each of the combinations of initial concentration and cooling rate.
34
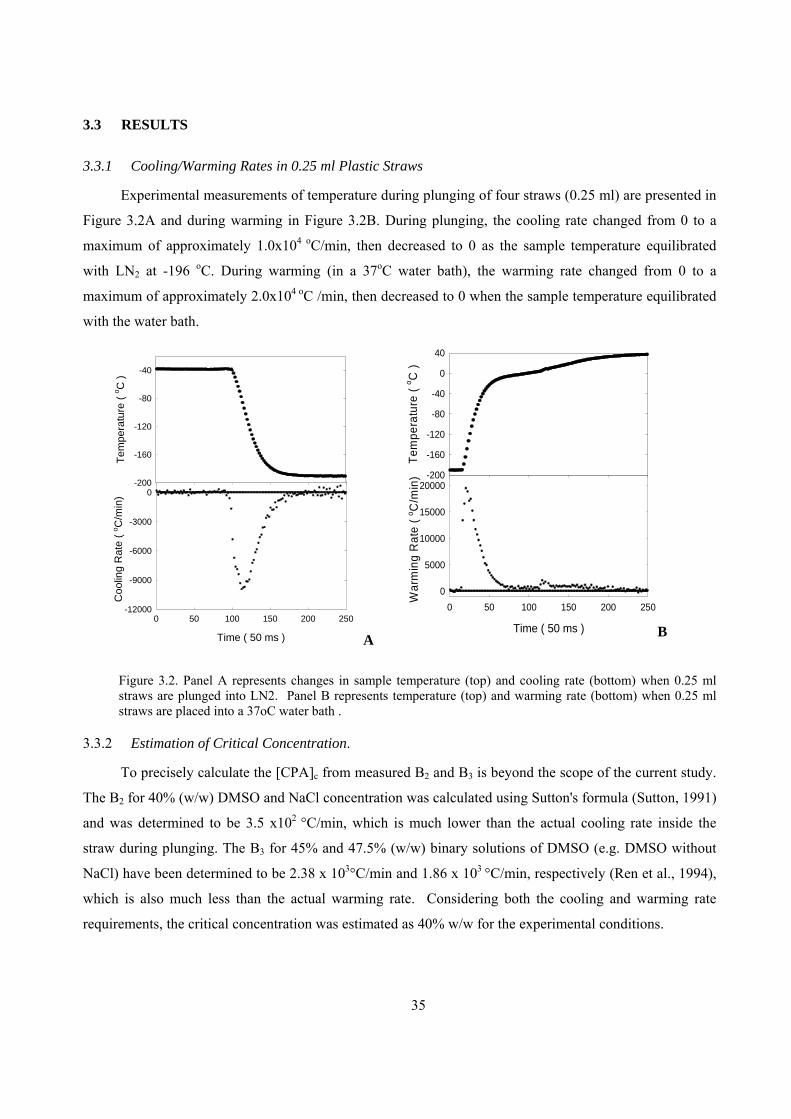
3.3 RESULTS
3.3.1 Cooling/Warming Rates in 0.25 ml Plastic Straws
Experimental measurements of temperature during plunging of four straws (0.25 ml) are presented in
Figure 3.2A and during warming in Figure 3.2B. During plunging, the cooling rate changed from 0 to a
maximum of approximately 1.0x10⁴ oC/min, then decreased to 0 as the sample temperature equilibrated
with LN2 at -196 oC. During warming (in a 37oC water bath), the warming rate changed from 0 to a
maximum of approximately 2.0x10⁴ oC /min, then decreased to 0 when the sample temperature equilibrated
with the water bath.
Time ( 50 ms )
0 50 100 150 200 250
Co
olin
g R
ate
( o
C/m
in)
-12000
-9000
-6000
-3000
0
Tem
pera
ture
( o C
)
-200
-160
-120
-80
-40
A Time ( 50 ms )
0 50 100 150 200 250
War
min
g R
ate
( oC
/min
)
0
5000
10000
15000
20000
Tem
pera
ture
( o C
)
-200
-160
-120
-80
-40
0
40
B
Figure 3.2. Panel A represents changes in sample temperature (top) and cooling rate (bottom) when 0.25 ml straws are plunged into LN2. Panel B represents temperature (top) and warming rate (bottom) when 0.25 ml straws are placed into a 37oC water bath .
3.3.2 Estimation of Critical Concentration.
To precisely calculate the [CPA]c from measured B2 and B3 is beyond the scope of the current study.
The B2 for 40% (w/w) DMSO and NaCl concentration was calculated using Sutton's formula (Sutton, 1991)
and was determined to be 3.5 x10² °C/min, which is much lower than the actual cooling rate inside the
straw during plunging. The B3 for 45% and 47.5% (w/w) binary solutions of DMSO (e.g. DMSO without
NaCl) have been determined to be 2.38 x 10³°C/min and 1.86 x 10³ °C/min, respectively (Ren et al., 1994),
which is also much less than the actual warming rate. Considering both the cooling and warming rate
requirements, the critical concentration was estimated as 40% w/w for the experimental conditions.
35
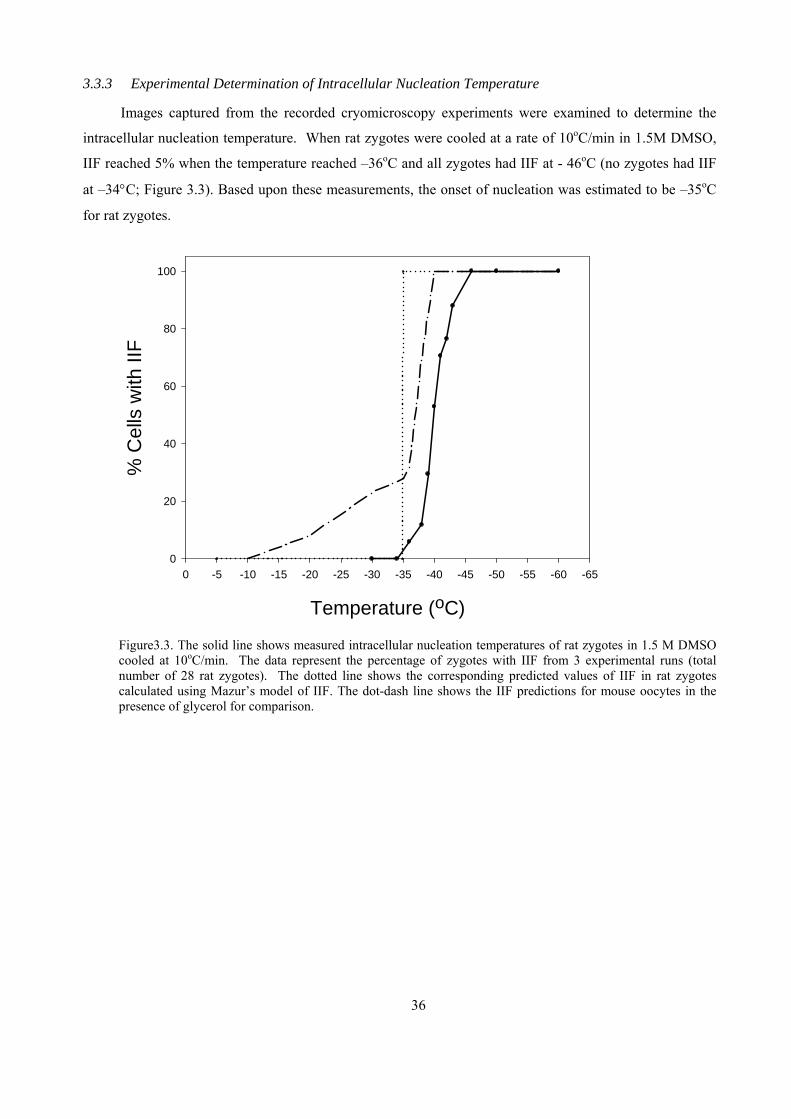
3.3.3 Experimental Determination of Intracellular Nucleation Temperature
Images captured from the recorded cryomicroscopy experiments were examined to determine the
intracellular nucleation temperature. When rat zygotes were cooled at a rate of 10oC/min in 1.5M DMSO,
IIF reached 5% when the temperature reached –36oC and all zygotes had IIF at - 46oC (no zygotes had IIF
at –34C; Figure 3.3). Based upon these measurements, the onset of nucleation was estimated to be –35oC
for rat zygotes.
Temperature (oC)
-65-60-55-50-45-40-35-30-25-20-15-10-50
% C
ells
with
IIF
0
20
40
60
80
100
Figure3.3. The solid line shows measured intracellular nucleation temperatures of rat zygotes in 1.5 M DMSO cooled at 10oC/min. The data represent the percentage of zygotes with IIF from 3 experimental runs (total number of 28 rat zygotes). The dotted line shows the corresponding predicted values of IIF in rat zygotes calculated using Mazur’s model of IIF. The dot-dash line shows the IIF predictions for mouse oocytes in the presence of glycerol for comparison.
36
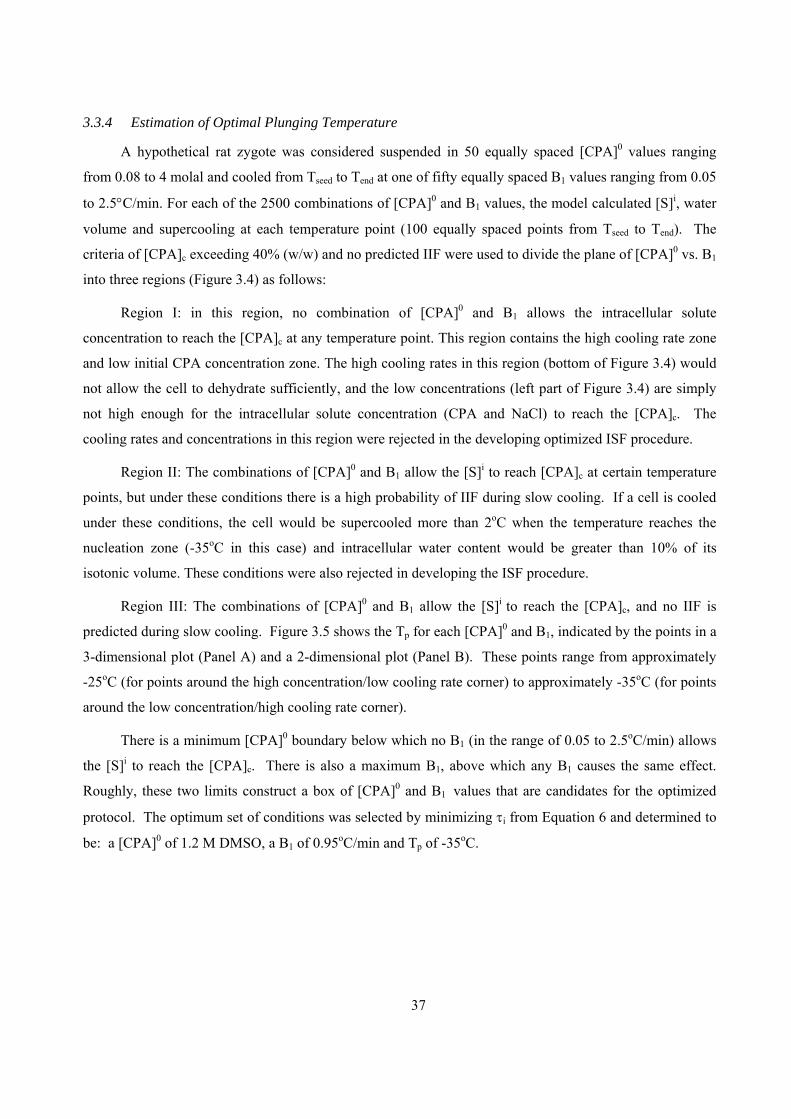
37
3.3.4 Estimation of Optimal Plunging Temperature
A hypothetical rat zygote was considered suspended in 50 equally spaced [CPA]0 values ranging
from 0.08 to 4 molal and cooled from Tseed to Tend at one of fifty equally spaced B1 values ranging from 0.05
to 2.5C/min. For each of the 2500 combinations of [CPA]0 and B1 values, the model calculated [S]i, water
volume and supercooling at each temperature point (100 equally spaced points from Tseed to Tend). The
criteria of [CPA]c exceeding 40% (w/w) and no predicted IIF were used to divide the plane of [CPA]0 vs. B1
into three regions (Figure 3.4) as follows:
Region I: in this region, no combination of [CPA]0 and B1 allows the intracellular solute
concentration to reach the [CPA]c at any temperature point. This region contains the high cooling rate zone
and low initial CPA concentration zone. The high cooling rates in this region (bottom of Figure 3.4) would
not allow the cell to dehydrate sufficiently, and the low concentrations (left part of Figure 3.4) are simply
not high enough for the intracellular solute concentration (CPA and NaCl) to reach the [CPA]c. The
cooling rates and concentrations in this region were rejected in the developing optimized ISF procedure.
Region II: The combinations of [CPA]0 and B1 allow the [S]i to reach [CPA]c at certain temperature
points, but under these conditions there is a high probability of IIF during slow cooling. If a cell is cooled
under these conditions, the cell would be supercooled more than 2oC when the temperature reaches the
nucleation zone (-35oC in this case) and intracellular water content would be greater than 10% of its
isotonic volume. These conditions were also rejected in developing the ISF procedure.
Region III: The combinations of [CPA]0 and B1 allow the [S]i to reach the [CPA]c, and no IIF is
predicted during slow cooling. Figure 3.5 shows the Tp for each [CPA]0 and B1, indicated by the points in a
3-dimensional plot (Panel A) and a 2-dimensional plot (Panel B). These points range from approximately
-25oC (for points around the high concentration/low cooling rate corner) to approximately -35oC (for points
around the low concentration/high cooling rate corner).
There is a minimum [CPA]0 boundary below which no B1 (in the range of 0.05 to 2.5oC/min) allows
the [S]i to reach the [CPA]c. There is also a maximum B1, above which any B1 causes the same effect.
Roughly, these two limits construct a box of [CPA]0 and B1 values that are candidates for the optimized
protocol. The optimum set of conditions was selected by minimizing i from Equation 6 and determined to
be: a [CPA]0 of 1.2 M DMSO, a B1 of 0.95oC/min and Tp of -35oC.
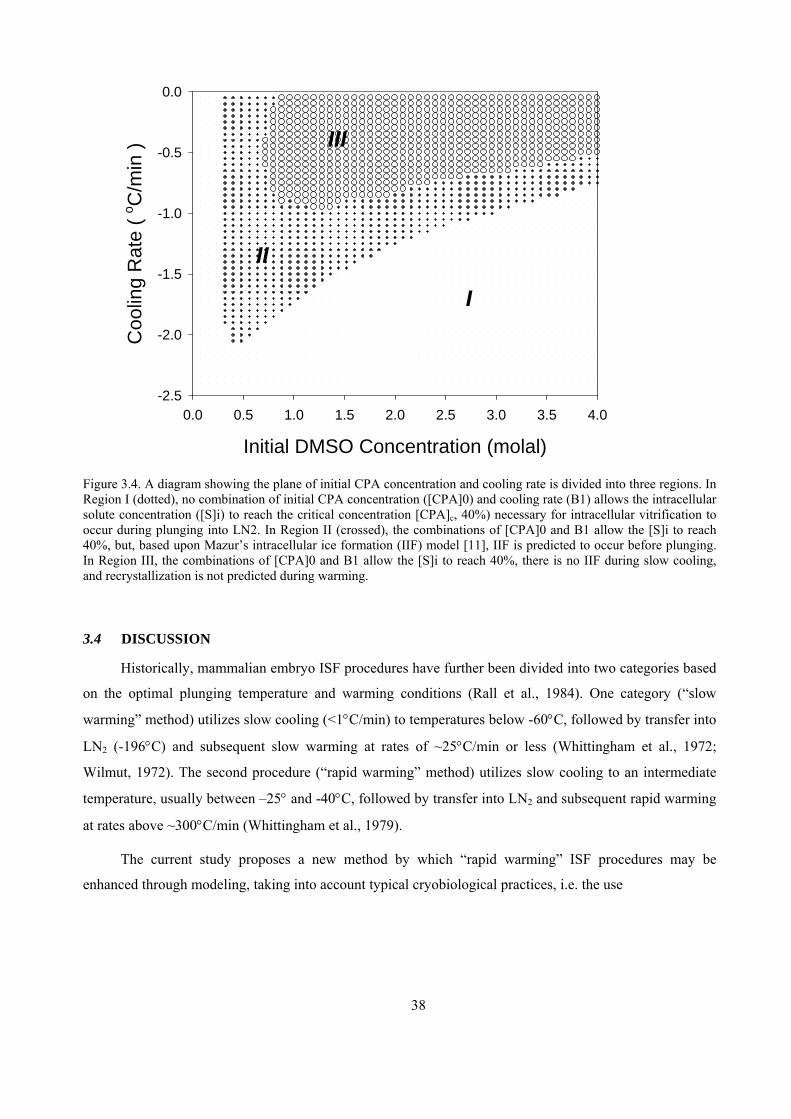
Initial DMSO Concentration (molal)
0.0 0.5 1.0 1.5 2.0 2.5 3.0 3.5 4.0
Coo
ling
Rat
e (
oC
/min
)
-2.5
-2.0
-1.5
-1.0
-0.5
0.0
I
II
III
Figure 3.4. A diagram showing the plane of initial CPA concentration and cooling rate is divided into three regions. In Region I (dotted), no combination of initial CPA concentration ([CPA]0) and cooling rate (B1) allows the intracellular solute concentration ([S]i) to reach the critical concentration [CPA]c, 40%) necessary for intracellular vitrification to occur during plunging into LN2. In Region II (crossed), the combinations of [CPA]0 and B1 allow the [S]i to reach 40%, but, based upon Mazur’s intracellular ice formation (IIF) model [11], IIF is predicted to occur before plunging. In Region III, the combinations of [CPA]0 and B1 allow the [S]i to reach 40%, there is no IIF during slow cooling, and recrystallization is not predicted during warming.
3.4 DISCUSSION
Historically, mammalian embryo ISF procedures have further been divided into two categories based
on the optimal plunging temperature and warming conditions (Rall et al., 1984). One category (“slow
warming” method) utilizes slow cooling (<1C/min) to temperatures below -60C, followed by transfer into
LN2 (-196C) and subsequent slow warming at rates of ~25C/min or less (Whittingham et al., 1972;
Wilmut, 1972). The second procedure (“rapid warming” method) utilizes slow cooling to an intermediate
temperature, usually between –25 and -40C, followed by transfer into LN2 and subsequent rapid warming
at rates above ~300C/min (Whittingham et al., 1979).
The current study proposes a new method by which “rapid warming” ISF procedures may be
enhanced through modeling, taking into account typical cryobiological practices, i.e. the use
38
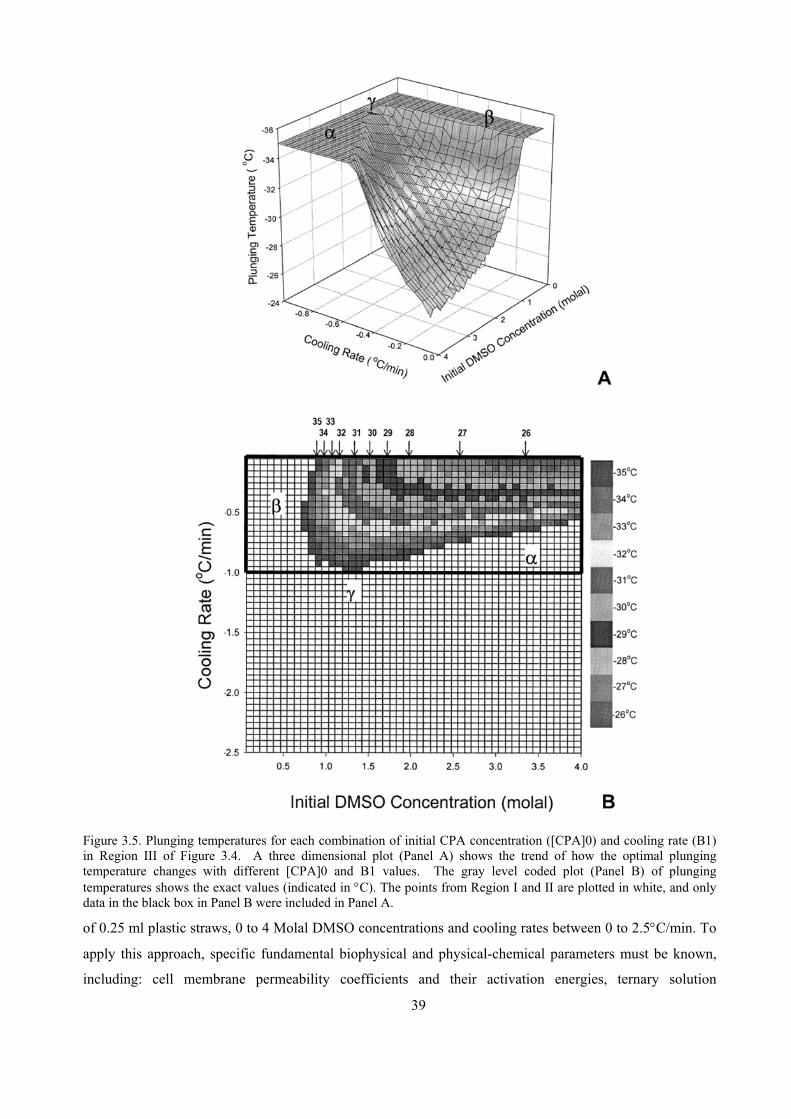
Figure 3.5. Plunging temperatures for each combination of initial CPA concentration ([CPA]0) and cooling rate (B1) in Region III of Figure 3.4. A three dimensional plot (Panel A) shows the trend of how the optimal plunging temperature changes with different [CPA]0 and B1 values. The gray level coded plot (Panel B) of plunging temperatures shows the exact values (indicated in C). The points from Region I and II are plotted in white, and only data in the black box in Panel B were included in Panel A.
of 0.25 ml plastic straws, 0 to 4 Molal DMSO concentrations and cooling rates between 0 to 2.5C/min. To
apply this approach, specific fundamental biophysical and physical-chemical parameters must be known,
including: cell membrane permeability coefficients and their activation energies, ternary solution
39
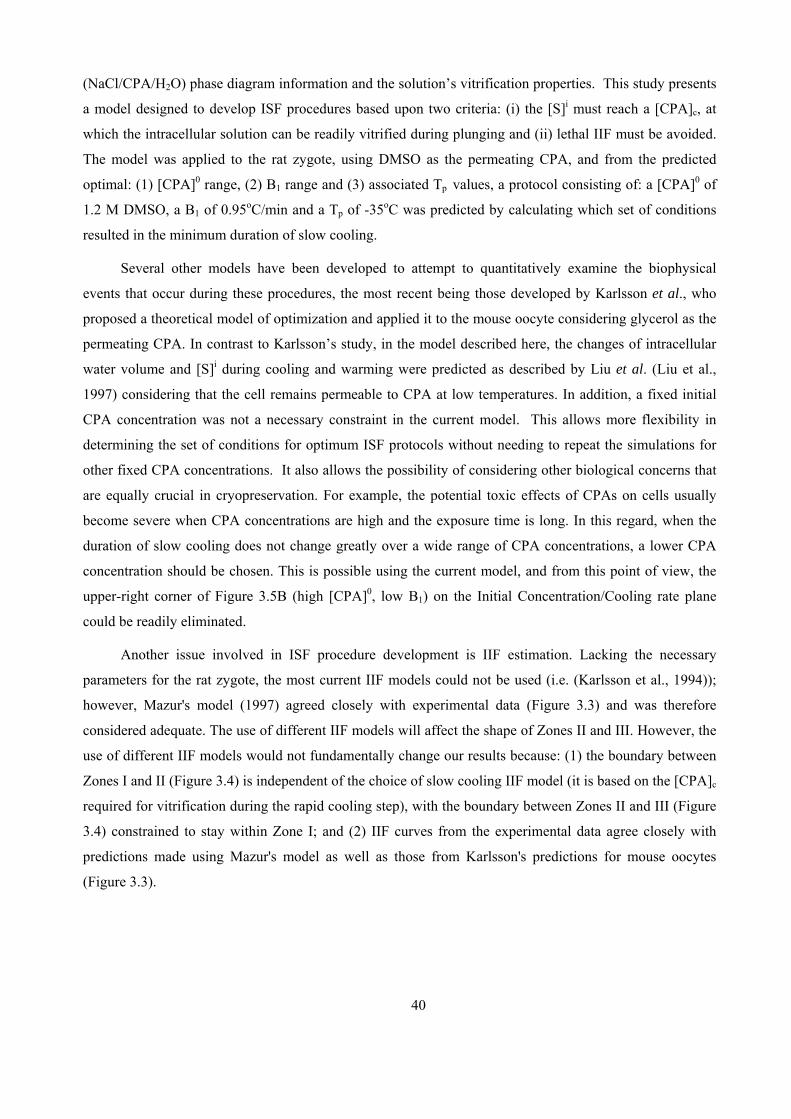
40
(NaCl/CPA/H2O) phase diagram information and the solution’s vitrification properties. This study presents
a model designed to develop ISF procedures based upon two criteria: (i) the [S]i must reach a [CPA]c, at
which the intracellular solution can be readily vitrified during plunging and (ii) lethal IIF must be avoided.
The model was applied to the rat zygote, using DMSO as the permeating CPA, and from the predicted
optimal: (1) [CPA]0 range, (2) B1 range and (3) associated Tp values, a protocol consisting of: a [CPA]0 of
1.2 M DMSO, a B1 of 0.95oC/min and a Tp of -35oC was predicted by calculating which set of conditions
resulted in the minimum duration of slow cooling.
Several other models have been developed to attempt to quantitatively examine the biophysical
events that occur during these procedures, the most recent being those developed by Karlsson et al., who
proposed a theoretical model of optimization and applied it to the mouse oocyte considering glycerol as the
permeating CPA. In contrast to Karlsson’s study, in the model described here, the changes of intracellular
water volume and [S]i during cooling and warming were predicted as described by Liu et al. (Liu et al.,
1997) considering that the cell remains permeable to CPA at low temperatures. In addition, a fixed initial
CPA concentration was not a necessary constraint in the current model. This allows more flexibility in
determining the set of conditions for optimum ISF protocols without needing to repeat the simulations for
other fixed CPA concentrations. It also allows the possibility of considering other biological concerns that
are equally crucial in cryopreservation. For example, the potential toxic effects of CPAs on cells usually
become severe when CPA concentrations are high and the exposure time is long. In this regard, when the
duration of slow cooling does not change greatly over a wide range of CPA concentrations, a lower CPA
concentration should be chosen. This is possible using the current model, and from this point of view, the
upper-right corner of Figure 3.5B (high [CPA]0, low B1) on the Initial Concentration/Cooling rate plane
could be readily eliminated.
Another issue involved in ISF procedure development is IIF estimation. Lacking the necessary
parameters for the rat zygote, the most current IIF models could not be used (i.e. (Karlsson et al., 1994));
however, Mazur's model (1997) agreed closely with experimental data (Figure 3.3) and was therefore
considered adequate. The use of different IIF models will affect the shape of Zones II and III. However, the
use of different IIF models would not fundamentally change our results because: (1) the boundary between
Zones I and II (Figure 3.4) is independent of the choice of slow cooling IIF model (it is based on the [CPA]c
required for vitrification during the rapid cooling step), with the boundary between Zones II and III (Figure
3.4) constrained to stay within Zone I; and (2) IIF curves from the experimental data agree closely with
predictions made using Mazur's model as well as those from Karlsson's predictions for mouse oocytes
(Figure 3.3).
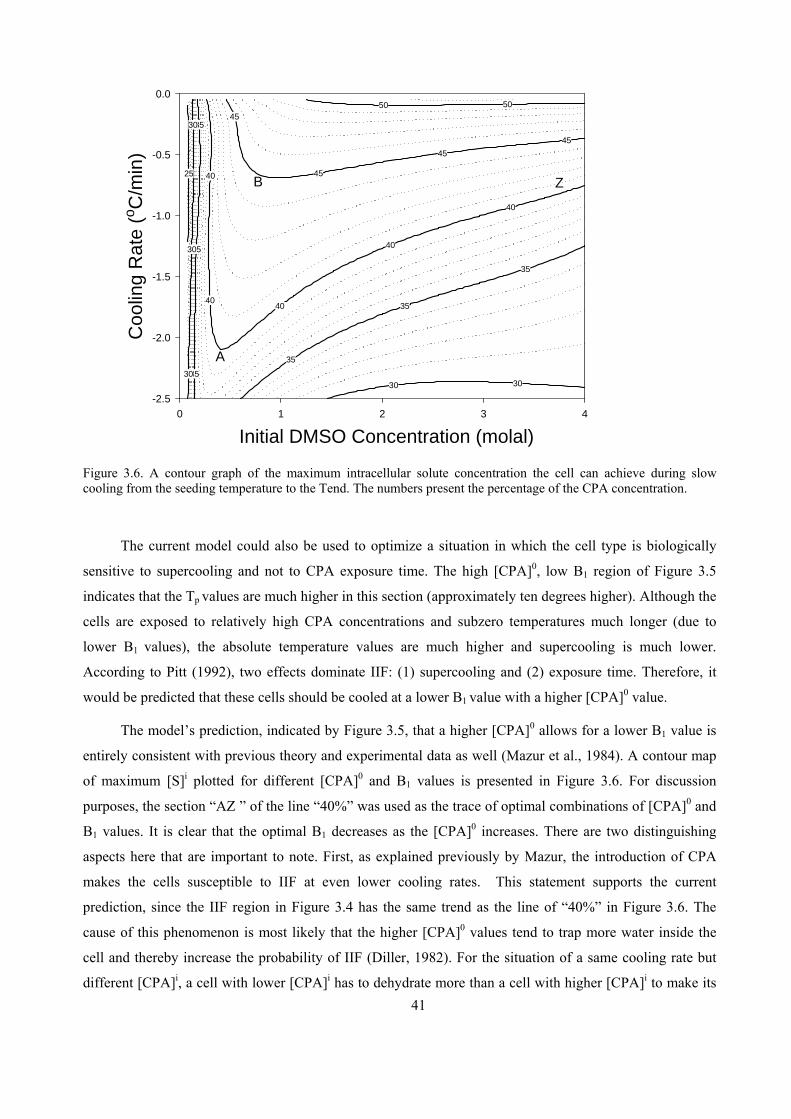
3030
35
35
35
40
4040
40
40
45
45
45
45
50 50
35
35
3530
30
30
25
Initial DMSO Concentration (molal)0 1 2 3 4
Coo
ling
Rat
e (o C
/min
)
-2.5
-2.0
-1.5
-1.0
-0.5
0.0
A
ZB
Figure 3.6. A contour graph of the maximum intracellular solute concentration the cell can achieve during slow cooling from the seeding temperature to the Tend. The numbers present the percentage of the CPA concentration.
The current model could also be used to optimize a situation in which the cell type is biologically
sensitive to supercooling and not to CPA exposure time. The high [CPA]0, low B1 region of Figure 3.5
indicates that the Tp values are much higher in this section (approximately ten degrees higher). Although the
cells are exposed to relatively high CPA concentrations and subzero temperatures much longer (due to
lower B1 values), the absolute temperature values are much higher and supercooling is much lower.
According to Pitt (1992), two effects dominate IIF: (1) supercooling and (2) exposure time. Therefore, it
would be predicted that these cells should be cooled at a lower B1 value with a higher [CPA]0 value.
The model’s prediction, indicated by Figure 3.5, that a higher [CPA]0 allows for a lower B1 value is
entirely consistent with previous theory and experimental data as well (Mazur et al., 1984). A contour map
of maximum [S]i plotted for different [CPA]0 and B1 values is presented in Figure 3.6. For discussion
purposes, the section “AZ ” of the line “40%” was used as the trace of optimal combinations of [CPA]0 and
B1 values. It is clear that the optimal B1 decreases as the [CPA]0 increases. There are two distinguishing
aspects here that are important to note. First, as explained previously by Mazur, the introduction of CPA
makes the cells susceptible to IIF at even lower cooling rates. This statement supports the current
prediction, since the IIF region in Figure 3.4 has the same trend as the line of “40%” in Figure 3.6. The
cause of this phenomenon is most likely that the higher [CPA]0 values tend to trap more water inside the
cell and thereby increase the probability of IIF (Diller, 1982). For the situation of a same cooling rate but
different [CPA]i, a cell with lower [CPA]i has to dehydrate more than a cell with higher [CPA]i to make its
41
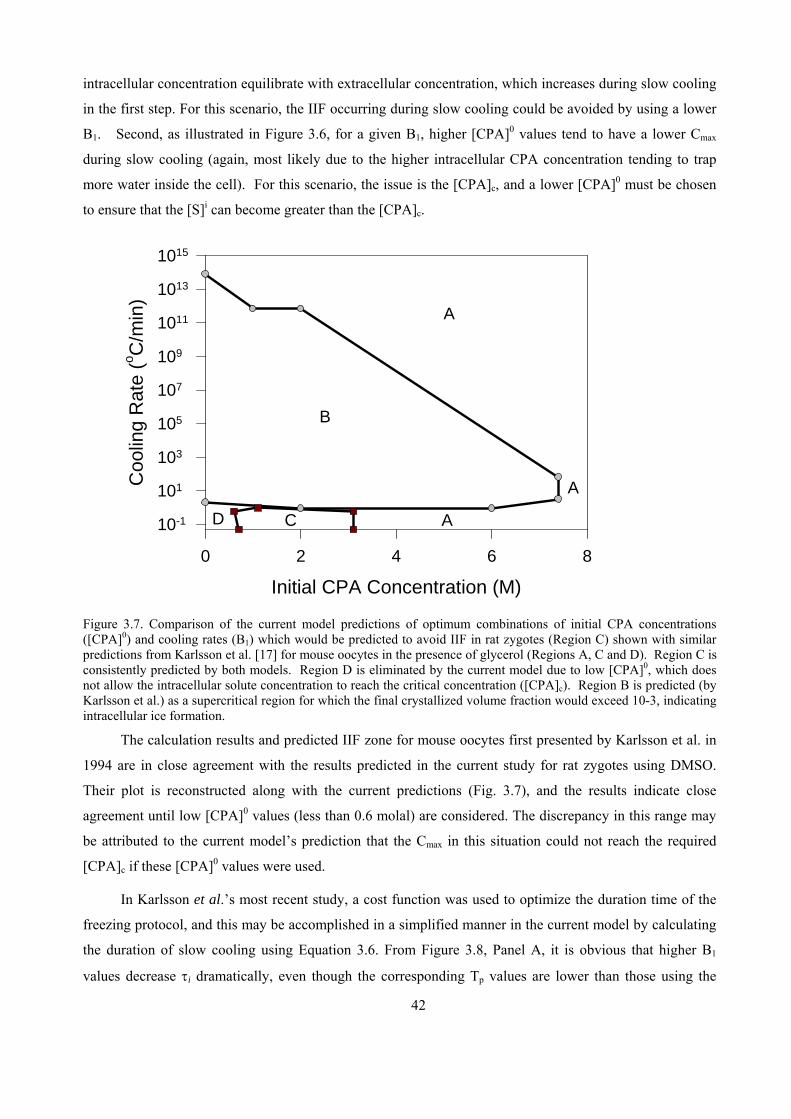
intracellular concentration equilibrate with extracellular concentration, which increases during slow cooling
in the first step. For this scenario, the IIF occurring during slow cooling could be avoided by using a lower
B1. Second, as illustrated in Figure 3.6, for a given B1, higher [CPA]0 values tend to have a lower Cmax
during slow cooling (again, most likely due to the higher intracellular CPA concentration tending to trap
more water inside the cell). For this scenario, the issue is the [CPA]c, and a lower [CPA]0 must be chosen
to ensure that the [S]i can become greater than the [CPA]c.
Initial CPA Concentration (M)
0 2 4 6 8
Coo
ling
Rat
e (o C
/min
)
10-1
101
103
105
107
109
1011
1013
1015
A
B
CD A
A
Figure 3.7. Comparison of the current model predictions of optimum combinations of initial CPA concentrations ([CPA]0) and cooling rates (B1) which would be predicted to avoid IIF in rat zygotes (Region C) shown with similar predictions from Karlsson et al. [17] for mouse oocytes in the presence of glycerol (Regions A, C and D). Region C is consistently predicted by both models. Region D is eliminated by the current model due to low [CPA]0, which does not allow the intracellular solute concentration to reach the critical concentration ([CPA]c). Region B is predicted (by Karlsson et al.) as a supercritical region for which the final crystallized volume fraction would exceed 10-3, indicating intracellular ice formation.
The calculation results and predicted IIF zone for mouse oocytes first presented by Karlsson et al. in
1994 are in close agreement with the results predicted in the current study for rat zygotes using DMSO.
Their plot is reconstructed along with the current predictions (Fig. 3.7), and the results indicate close
agreement until low [CPA]0 values (less than 0.6 molal) are considered. The discrepancy in this range may
be attributed to the current model’s prediction that the Cmax in this situation could not reach the required
[CPA]c if these [CPA]0 values were used.
In Karlsson et al.’s most recent study, a cost function was used to optimize the duration time of the
freezing protocol, and this may be accomplished in a simplified manner in the current model by calculating
the duration of slow cooling using Equation 3.6. From Figure 3.8, Panel A, it is obvious that higher B1
values decrease i dramatically, even though the corresponding Tp values are lower than those using the
42

43
lower B1 values. Figure 3.8, Panel B indicates that there is an optimal [CPA]0 for a given B1, which
minimizes the duration of the slow cooling step. For the rat zygote, this optimal [CPA]0 changes slightly
for different B1 values. When the B1 increases from 0.1oC/min to 0.95oC/min, the optimal [CPA]0 decreases
from 1.7 Molal to 1.2 Molal. Similar to the predictions made by Karlsson’s model, these optimal
conditions occur right on the border of regions where unacceptable cell damage is predicted. Therefore,
though theoretically optimal, this set of conditions may actually be risky in practice, because any procedural
error (e.g., fluctuation in cooling rate, error in solution preparation) or error in solution properties (e.g.,
error in [CPA]c estimation) could result in unexpected negative consequences. Indeed, the determination of
Zone III is very sensitive to the value of [CPA]c. The estimated [CPA]c values used in the model were
based on published data for binary solutions (e.g. CPA and H2O only). If this approximation resulted in an
under-estimation of [CPA]c, it could be detrimental because in practice the [S]i would not be high enough at
Tp to ensure vitrification during plunging. By selecting a point more towards the center of Zone III, (e.g. a
[CPA]0 of 1.5 Molal DMSO, a B1 of 0.5C/min and a Tp of -30C) a more conservative estimation can be
achieved.
Consistent with the current model, Hirabayashi (1997) recently reported cryopreservation of 2-cell
rat embryos using an ISF method consisting of a 0.5 oC/min B1, a [CPA]0 of 10%(v/v) DMSO (~ 1.45M),
and a Tp of -30oC. Using late morula or early blastocysts obtained from naturally ovulated and mated
Wistar female rats, Utsumi et al. (1992) investigated the effects of [CPA]0 on percent survival (at a fixed
B1) and found a 0% and 20% survival rate for 0.15 M and 0.3 M DMSO, respectively. Survival increased to
60% and 59% for 1.0 M and 1.5 M. This same study also reported the effects of B1 and Tp (at a fixed
[CPA]0) on embryo survival. Utsumi et al. concluded that survival decreased dramatically when a 5oC/min
B1 was used; while, for the same Tp, the percent survival tended to be higher if a lower B1 was used. All of
these experimental results correspond well with the current model predictions (Region III in Figure 3.4).
However, it is important to note that direct comparisons cannot be made because embryo developmental
stages and specific experimental conditions were different from those used to develop the model in the
current study.
Figure 3.6 suggests an alternative way to optimize ISF procedures. If a discrete isoconcentration line
is roughly used as the guideline for selecting [CPA]0 and B1, the “turning point” (e.g., A and B in Figure
3.6, where the curve has the smallest radius) could be considered as the optimal point for corresponding
isoconcentrations since B1 has the maximum value while [CPA]0 is close to the minimum value. If a
comparison is made between the turning points of 40% and 45% isoconcentration lines, we can conclude
that the optimal B1 is much higher for 40% than 45% and the [CPA]0 is relatively lower. The former
condition, higher B1 and lower [CPA]0, would appear to be optimal because the higher B1 shortens the
duration of slow cooling (therefore potentially reducing solution effects injury), and the lower [CPA]0
lowers the osmotic stress and lessens the potential CPA toxicity.
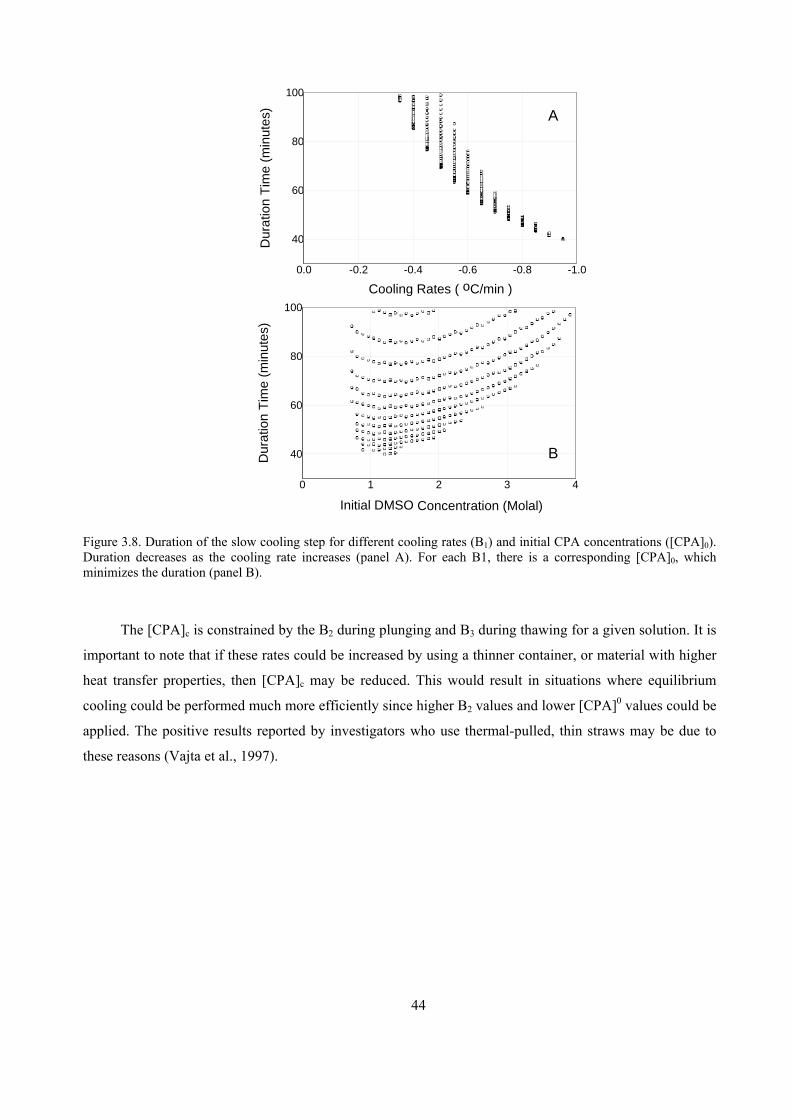
40
60
80
100
-1.0-0.8-0.6-0.4-0.20.0D
ura
tion
Tim
e (m
inut
es)
Cooling Rates ( oC/min )
40
60
80
100
0 1 2 3 4
Dur
atio
n T
ime
(m
inut
es)
Initial DMSO Concentration (Molal)
A
B
Figure 3.8. Duration of the slow cooling step for different cooling rates (B1) and initial CPA concentrations ([CPA]0). Duration decreases as the cooling rate increases (panel A). For each B1, there is a corresponding [CPA]0, which minimizes the duration (panel B).
The [CPA]c is constrained by the B2 during plunging and B3 during thawing for a given solution. It is
important to note that if these rates could be increased by using a thinner container, or material with higher
heat transfer properties, then [CPA]c may be reduced. This would result in situations where equilibrium
cooling could be performed much more efficiently since higher B2 values and lower [CPA]0 values could be
applied. The positive results reported by investigators who use thermal-pulled, thin straws may be due to
these reasons (Vajta et al., 1997).
44
45
CHAPTER 4. ACCUMULATIVE OSMOTIC DAMAGE MODEL FOR OOCYTE
CRYOPRESERVATION
4.1 INTRODUCTION
Oocyte cryopreservation can also provide more efficient treatment for individuals needing oocytes
from donors and those wishing to preserve fertility before cancer treatments. While advances have been
made in oocyte cryopreservation as measured by the delivery of healthy babies in recent years (Gook and
Edgar, 2007), continued optimization of human oocyte cryopreservation techniques is challenging due to
the scarcity of material for experimentation. Cryopreservation consists of several steps including adding
and removing cryoprotectants and cooling and warming. Each of the steps can be conducted in a large
number of ways. Furthermore, recent trends in mammalian oocyte cryopreservation have lead to the use of
various devices for vitrification such as open-pulled straws, electron microscope copper grids, cryoloop,
cryotop, or even without any containers in micro-drops (Papis et al., 2000) and by solid-surface
vitrification. Therefore, testing all of the possible options for cryopreservation through experimental
optimization will require a very large number of oocytes. Conducting such trials with human oocytes would
be very challenging for many reasons (de Melo-Martin and Cholst, 2007). As a result, rapid advances in the
understanding of mammalian oocyte cryobiology will require the use of animal models.
The rabbit has been used as a model organism for studying mammalian reproduction for decades
(Chang et al., 1970; Heape, 1891; Pincus, 1939); in particular it was instrumental in the development of
techniques such as in vitro fertilization, embryo culture, and embryo transfer that are essential components
of modern assisted reproductive medicine (Betteridge, 1981; Chang, 1948, 1959). Experimental evidence
suggests that the extreme sensitivity of cattle and pig oocytes to cooling in comparison to oocytes from
humans may make them relatively poor models (Hunter et al., 1991; Liu et al., 2003; Martino et al., 1996a).
Optimization of cryopreservation procedures can be pursued by a wholly empirical approach, or by
using fundamental cryobiology theory and testing the theoretical results experimentally (Leibo, 2007).
Taking a theoretical approach with the use of computer modeling requires the knowledge of several
biophysical parameters of the cells under study, including the cell volume (which includes the proportion of
osmotically-active and non-active components), the cell surface area, and the permeability of the cell to
water and cryoprotectants. Using computer modeling, we investigated the rabbit oocyte volume responses
during the cryoprotectant agent (CPA) addition and dilution procedures, and compared these responses to
the ability of the oocytes to develop to blastocysts in culture. The results of this comparison led to the
establishment of a new model to describe the accumulative osmotic damage (AOD) associated with the
processes of the addition/dilution. This new model more accurately describes the viability loss seen
compared to a simpler maximum volume excursion model which has been described in the past.
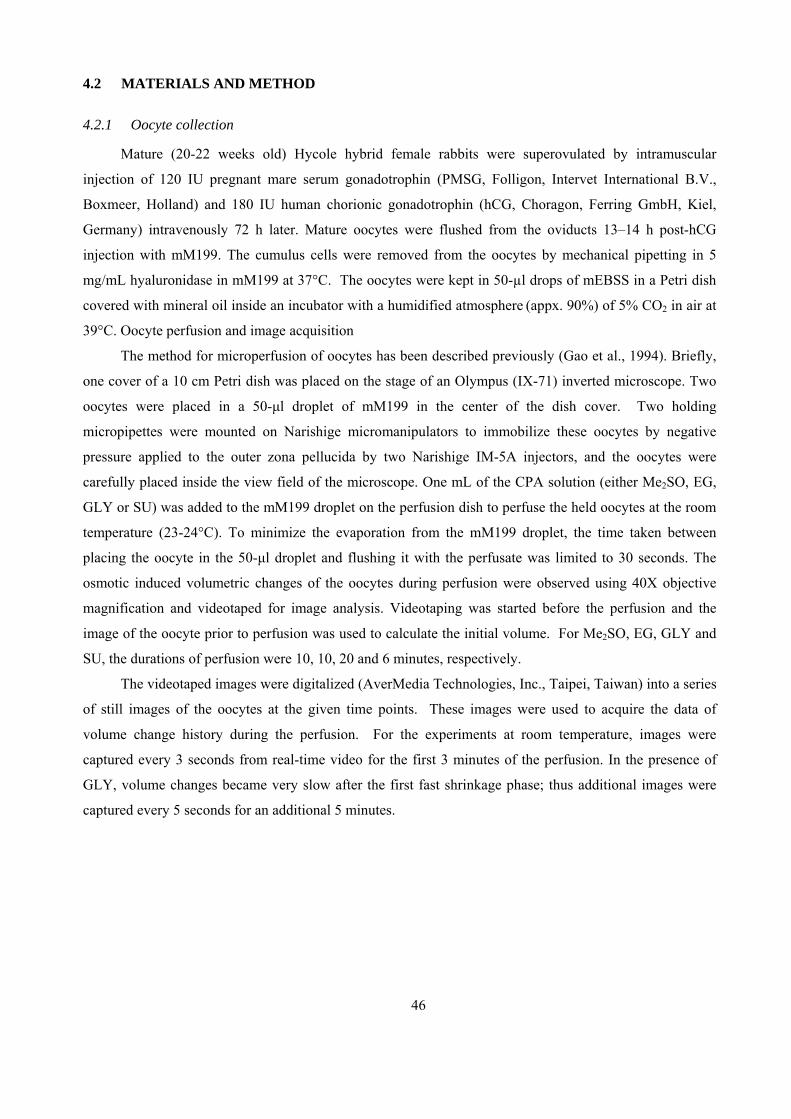
46
4.2 MATERIALS AND METHOD
4.2.1 Oocyte collection
Mature (20-22 weeks old) Hycole hybrid female rabbits were superovulated by intramuscular
injection of 120 IU pregnant mare serum gonadotrophin (PMSG, Folligon, Intervet International B.V.,
Boxmeer, Holland) and 180 IU human chorionic gonadotrophin (hCG, Choragon, Ferring GmbH, Kiel,
Germany) intravenously 72 h later. Mature oocytes were flushed from the oviducts 13–14 h post-hCG
injection with mM199. The cumulus cells were removed from the oocytes by mechanical pipetting in 5
mg/mL hyaluronidase in mM199 at 37°C. The oocytes were kept in 50-µl drops of mEBSS in a Petri dish
covered with mineral oil inside an incubator with a humidified atmosphere (appx. 90%) of 5% CO2 in air at
39°C. Oocyte perfusion and image acquisition
The method for microperfusion of oocytes has been described previously (Gao et al., 1994). Briefly,
one cover of a 10 cm Petri dish was placed on the stage of an Olympus (IX-71) inverted microscope. Two
oocytes were placed in a 50-μl droplet of mM199 in the center of the dish cover. Two holding
micropipettes were mounted on Narishige micromanipulators to immobilize these oocytes by negative
pressure applied to the outer zona pellucida by two Narishige IM-5A injectors, and the oocytes were
carefully placed inside the view field of the microscope. One mL of the CPA solution (either Me2SO, EG,
GLY or SU) was added to the mM199 droplet on the perfusion dish to perfuse the held oocytes at the room
temperature (23-24°C). To minimize the evaporation from the mM199 droplet, the time taken between
placing the oocyte in the 50-μl droplet and flushing it with the perfusate was limited to 30 seconds. The
osmotic induced volumetric changes of the oocytes during perfusion were observed using 40X objective
magnification and videotaped for image analysis. Videotaping was started before the perfusion and the
image of the oocyte prior to perfusion was used to calculate the initial volume. For Me2SO, EG, GLY and
SU, the durations of perfusion were 10, 10, 20 and 6 minutes, respectively.
The videotaped images were digitalized (AverMedia Technologies, Inc., Taipei, Taiwan) into a series
of still images of the oocytes at the given time points. These images were used to acquire the data of
volume change history during the perfusion. For the experiments at room temperature, images were
captured every 3 seconds from real-time video for the first 3 minutes of the perfusion. In the presence of
GLY, volume changes became very slow after the first fast shrinkage phase; thus additional images were
captured every 5 seconds for an additional 5 minutes.
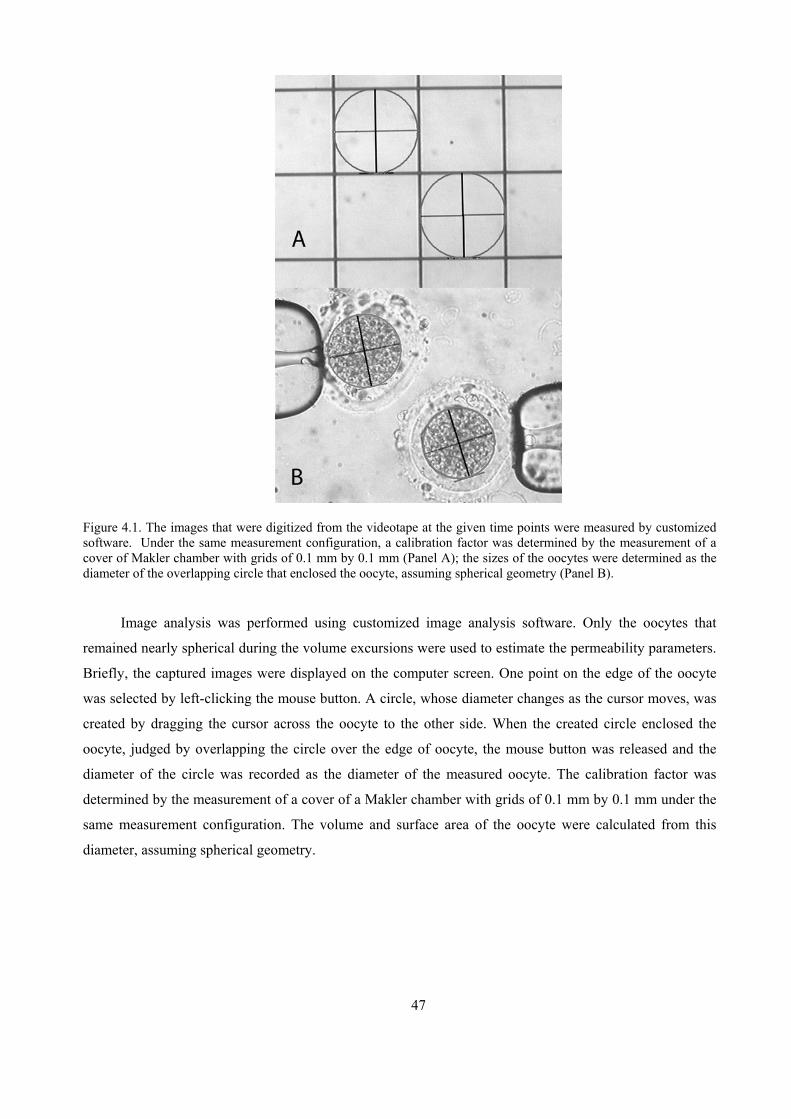
Figure 4.1. The images that were digitized from the videotape at the given time points were measured by customized software. Under the same measurement configuration, a calibration factor was determined by the measurement of a cover of Makler chamber with grids of 0.1 mm by 0.1 mm (Panel A); the sizes of the oocytes were determined as the diameter of the overlapping circle that enclosed the oocyte, assuming spherical geometry (Panel B).
Image analysis was performed using customized image analysis software. Only the oocytes that
remained nearly spherical during the volume excursions were used to estimate the permeability parameters.
Briefly, the captured images were displayed on the computer screen. One point on the edge of the oocyte
was selected by left-clicking the mouse button. A circle, whose diameter changes as the cursor moves, was
created by dragging the cursor across the oocyte to the other side. When the created circle enclosed the
oocyte, judged by overlapping the circle over the edge of oocyte, the mouse button was released and the
diameter of the circle was recorded as the diameter of the measured oocyte. The calibration factor was
determined by the measurement of a cover of a Makler chamber with grids of 0.1 mm by 0.1 mm under the
same measurement configuration. The volume and surface area of the oocyte were calculated from this
diameter, assuming spherical geometry.
47
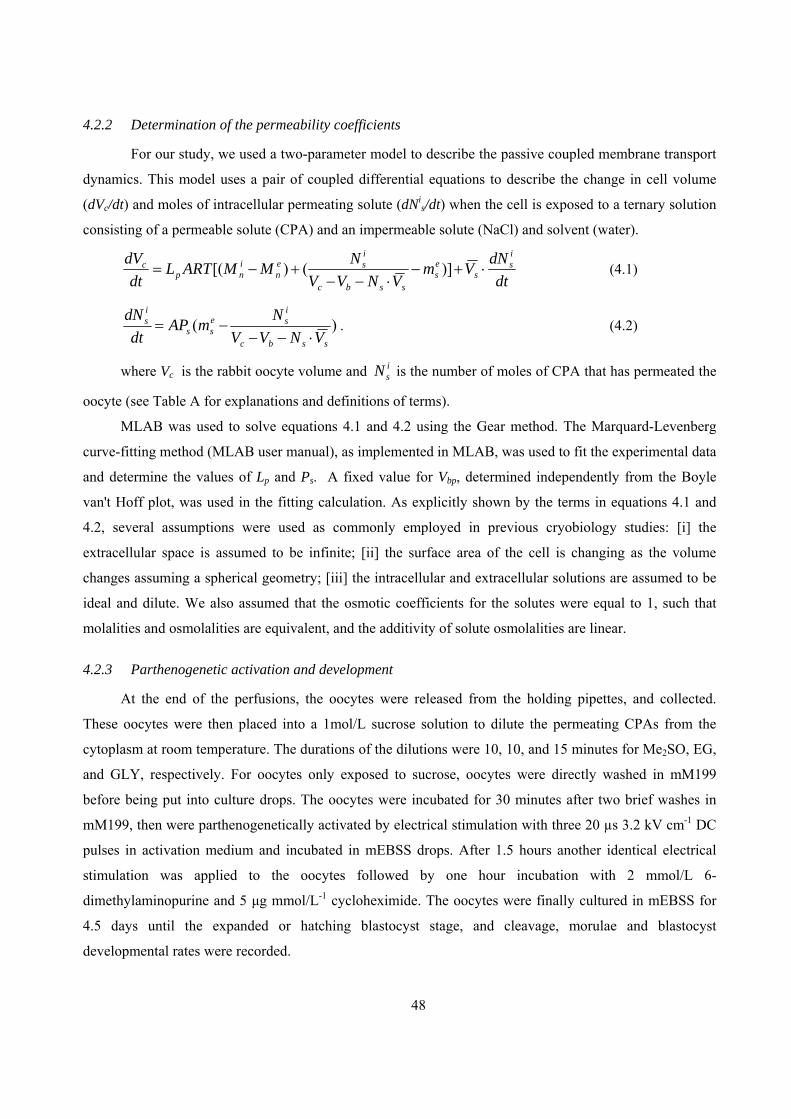
4.2.2 Determination of the permeability coefficients
For our study, we used a two-parameter model to describe the passive coupled membrane transport
dynamics. This model uses a pair of coupled differential equations to describe the change in cell volume
(dVc/dt) and moles of intracellular permeating solute (dNis/dt) when the cell is exposed to a ternary solution
consisting of a permeable solute (CPA) and an impermeable solute (NaCl) and solvent (water).
dt
dNVm
VNVV
NMMARTL
dt
dV is
ses
ssbc
ise
ninp
c
)]()[( (4.1)
)(ssbc
ise
ss
is
VNVV
NmAP
dt
dN
. (4.2)
where Vc is the rabbit oocyte volume and is the number of moles of CPA that has permeated the
oocyte (see Table A for explanations and definitions of terms).
isN
MLAB was used to solve equations 4.1 and 4.2 using the Gear method. The Marquard-Levenberg
curve-fitting method (MLAB user manual), as implemented in MLAB, was used to fit the experimental data
and determine the values of Lp and Ps. A fixed value for Vbp, determined independently from the Boyle
van't Hoff plot, was used in the fitting calculation. As explicitly shown by the terms in equations 4.1 and
4.2, several assumptions were used as commonly employed in previous cryobiology studies: [i] the
extracellular space is assumed to be infinite; [ii] the surface area of the cell is changing as the volume
changes assuming a spherical geometry; [iii] the intracellular and extracellular solutions are assumed to be
ideal and dilute. We also assumed that the osmotic coefficients for the solutes were equal to 1, such that
molalities and osmolalities are equivalent, and the additivity of solute osmolalities are linear.
4.2.3 Parthenogenetic activation and development
At the end of the perfusions, the oocytes were released from the holding pipettes, and collected.
These oocytes were then placed into a 1mol/L sucrose solution to dilute the permeating CPAs from the
cytoplasm at room temperature. The durations of the dilutions were 10, 10, and 15 minutes for Me2SO, EG,
and GLY, respectively. For oocytes only exposed to sucrose, oocytes were directly washed in mM199
before being put into culture drops. The oocytes were incubated for 30 minutes after two brief washes in
mM199, then were parthenogenetically activated by electrical stimulation with three 20 µs 3.2 kV cm-1 DC
pulses in activation medium and incubated in mEBSS drops. After 1.5 hours another identical electrical
stimulation was applied to the oocytes followed by one hour incubation with 2 mmol/L 6-
dimethylaminopurine and 5 μg mmol/L-1 cycloheximide. The oocytes were finally cultured in mEBSS for
4.5 days until the expanded or hatching blastocyst stage, and cleavage, morulae and blastocyst
developmental rates were recorded.
48
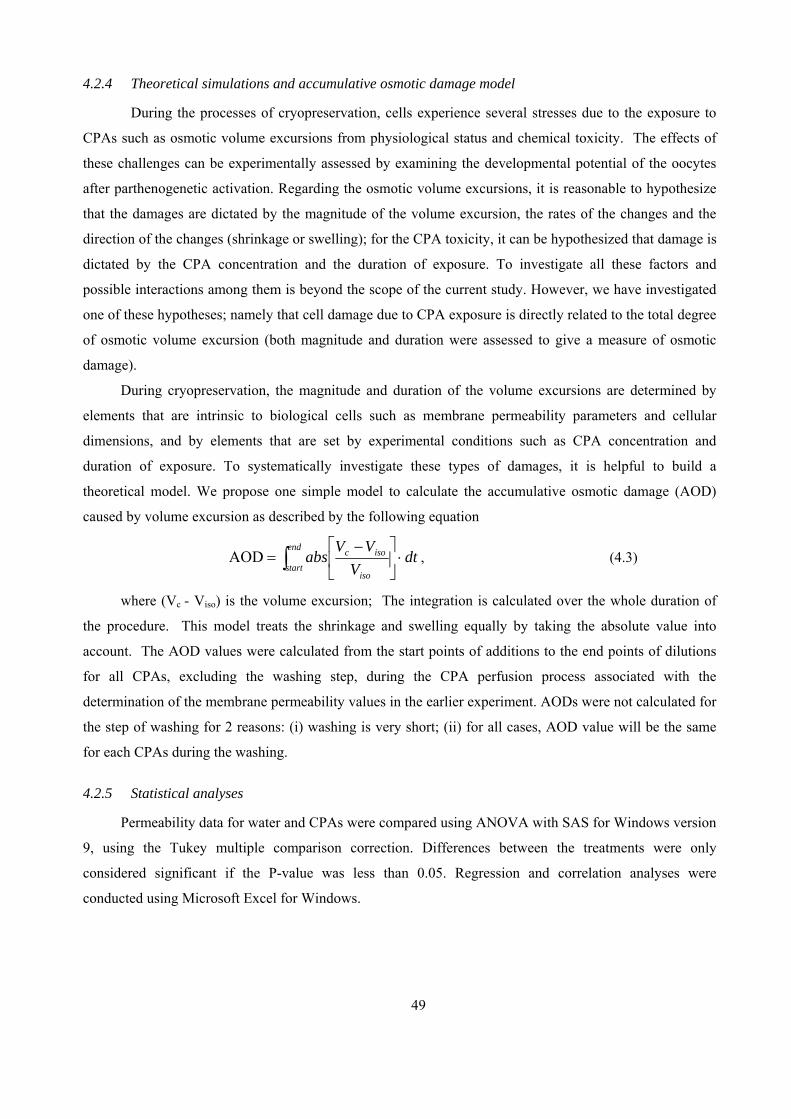
4.2.4 Theoretical simulations and accumulative osmotic damage model
During the processes of cryopreservation, cells experience several stresses due to the exposure to
CPAs such as osmotic volume excursions from physiological status and chemical toxicity. The effects of
these challenges can be experimentally assessed by examining the developmental potential of the oocytes
after parthenogenetic activation. Regarding the osmotic volume excursions, it is reasonable to hypothesize
that the damages are dictated by the magnitude of the volume excursion, the rates of the changes and the
direction of the changes (shrinkage or swelling); for the CPA toxicity, it can be hypothesized that damage is
dictated by the CPA concentration and the duration of exposure. To investigate all these factors and
possible interactions among them is beyond the scope of the current study. However, we have investigated
one of these hypotheses; namely that cell damage due to CPA exposure is directly related to the total degree
of osmotic volume excursion (both magnitude and duration were assessed to give a measure of osmotic
damage).
During cryopreservation, the magnitude and duration of the volume excursions are determined by
elements that are intrinsic to biological cells such as membrane permeability parameters and cellular
dimensions, and by elements that are set by experimental conditions such as CPA concentration and
duration of exposure. To systematically investigate these types of damages, it is helpful to build a
theoretical model. We propose one simple model to calculate the accumulative osmotic damage (AOD)
caused by volume excursion as described by the following equation
end
startiso
isoc dtV
VVabsAOD , (4.3)
where (Vc - Viso) is the volume excursion; The integration is calculated over the whole duration of
the procedure. This model treats the shrinkage and swelling equally by taking the absolute value into
account. The AOD values were calculated from the start points of additions to the end points of dilutions
for all CPAs, excluding the washing step, during the CPA perfusion process associated with the
determination of the membrane permeability values in the earlier experiment. AODs were not calculated for
the step of washing for 2 reasons: (i) washing is very short; (ii) for all cases, AOD value will be the same
for each CPAs during the washing.
4.2.5 Statistical analyses
Permeability data for water and CPAs were compared using ANOVA with SAS for Windows version
9, using the Tukey multiple comparison correction. Differences between the treatments were only
considered significant if the P-value was less than 0.05. Regression and correlation analyses were
conducted using Microsoft Excel for Windows.
49
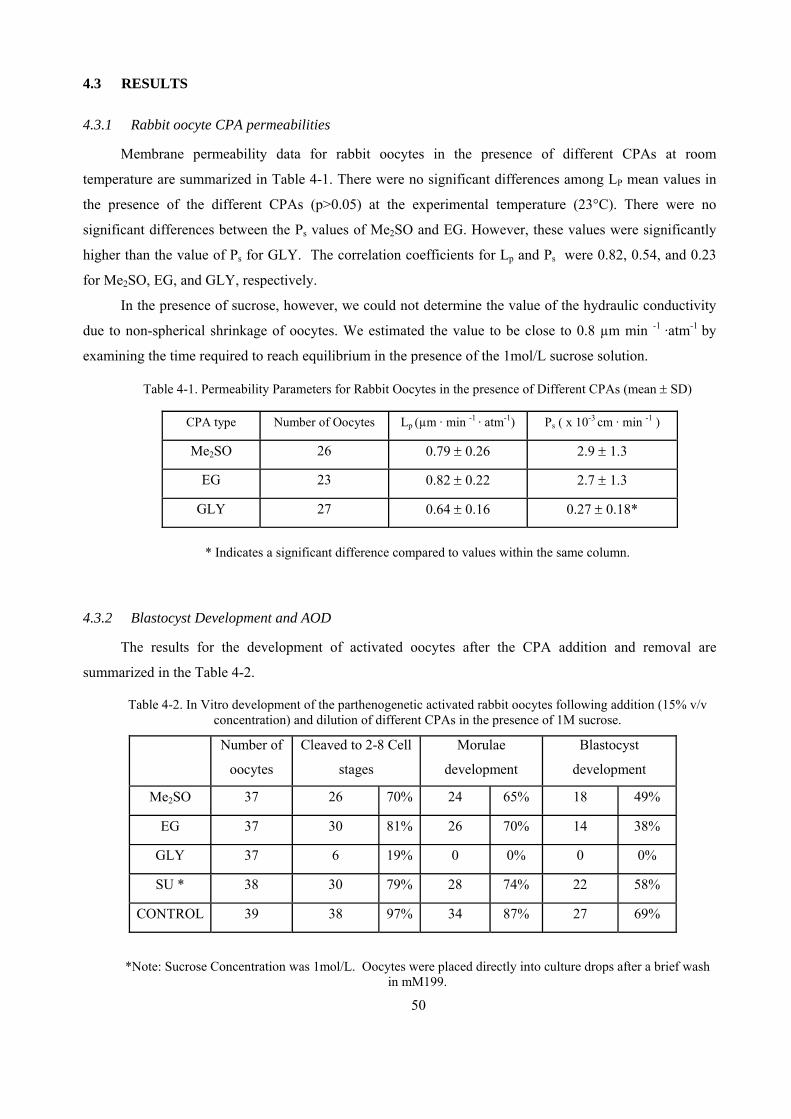
4.3 RESULTS
4.3.1 Rabbit oocyte CPA permeabilities
Membrane permeability data for rabbit oocytes in the presence of different CPAs at room
temperature are summarized in Table 4-1. There were no significant differences among LP mean values in
the presence of the different CPAs (p>0.05) at the experimental temperature (23°C). There were no
significant differences between the Ps values of Me2SO and EG. However, these values were significantly
higher than the value of Ps for GLY. The correlation coefficients for Lp and Ps were 0.82, 0.54, and 0.23
for Me2SO, EG, and GLY, respectively.
In the presence of sucrose, however, we could not determine the value of the hydraulic conductivity
due to non-spherical shrinkage of oocytes. We estimated the value to be close to 0.8 µm min -1 ·atm-1 by
examining the time required to reach equilibrium in the presence of the 1mol/L sucrose solution.
Table 4-1. Permeability Parameters for Rabbit Oocytes in the presence of Different CPAs (mean SD)
CPA type Number of Oocytes Lp (µm · min -1 · atm-1) Ps ( x 10-3 cm · min -1 )
Me2SO 26 0.79 0.26 2.9 1.3
EG 23 0.82 0.22 2.7 1.3
GLY 27 0.64 0.16 0.27 0.18*
* Indicates a significant difference compared to values within the same column.
4.3.2 Blastocyst Development and AOD
The results for the development of activated oocytes after the CPA addition and removal are
summarized in the Table 4-2.
Table 4-2. In Vitro development of the parthenogenetic activated rabbit oocytes following addition (15% v/v concentration) and dilution of different CPAs in the presence of 1M sucrose.
Number of
oocytes
Cleaved to 2-8 Cell
stages
Morulae
development
Blastocyst
development
Me2SO 37 26 70% 24 65% 18 49%
EG 37 30 81% 26 70% 14 38%
GLY 37 6 19% 0 0% 0 0%
SU * 38 30 79% 28 74% 22 58%
CONTROL 39 38 97% 34 87% 27 69%
*Note: Sucrose Concentration was 1mol/L. Oocytes were placed directly into culture drops after a brief wash in mM199.
50
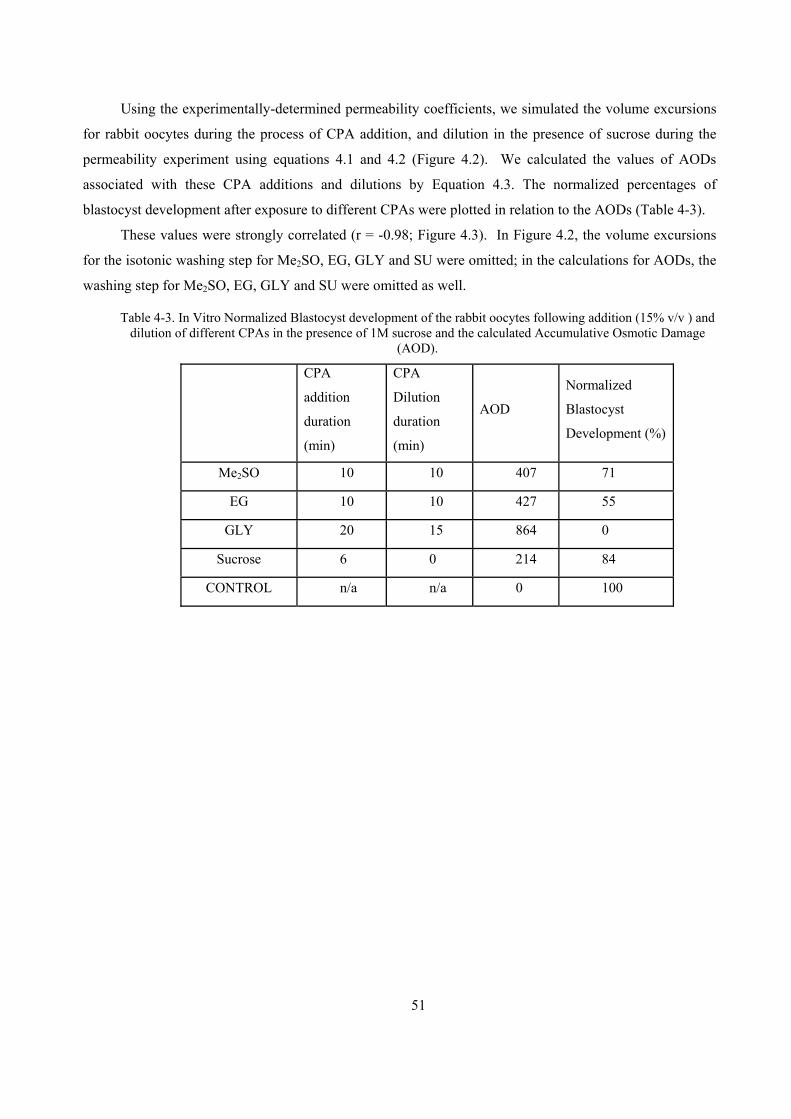
Using the experimentally-determined permeability coefficients, we simulated the volume excursions
for rabbit oocytes during the process of CPA addition, and dilution in the presence of sucrose during the
permeability experiment using equations 4.1 and 4.2 (Figure 4.2). We calculated the values of AODs
associated with these CPA additions and dilutions by Equation 4.3. The normalized percentages of
blastocyst development after exposure to different CPAs were plotted in relation to the AODs (Table 4-3).
These values were strongly correlated (r = -0.98; Figure 4.3). In Figure 4.2, the volume excursions
for the isotonic washing step for Me2SO, EG, GLY and SU were omitted; in the calculations for AODs, the
washing step for Me2SO, EG, GLY and SU were omitted as well.
Table 4-3. In Vitro Normalized Blastocyst development of the rabbit oocytes following addition (15% v/v ) and dilution of different CPAs in the presence of 1M sucrose and the calculated Accumulative Osmotic Damage
(AOD).
CPA
addition
duration
(min)
CPA
Dilution
duration
(min)
AOD
Normalized
Blastocyst
Development (%)
Me2SO 10 10 407 71
EG 10 10 427 55
GLY 20 15 864 0
Sucrose 6 0 214 84
CONTROL n/a n/a 0 100
51

Figure 4.2. Volume changes in the normalized scale as a function of time following CPA additions and dilutions at the room temperature. The durations of addition and dilution in the presence of each CPA are the same as the oocyte experienced in the experiments. There is no dilution for sucrose. Isotonic volume lines are given in the addition and dilution plots by two horizontal solid lines at the unit normalized volume.
52
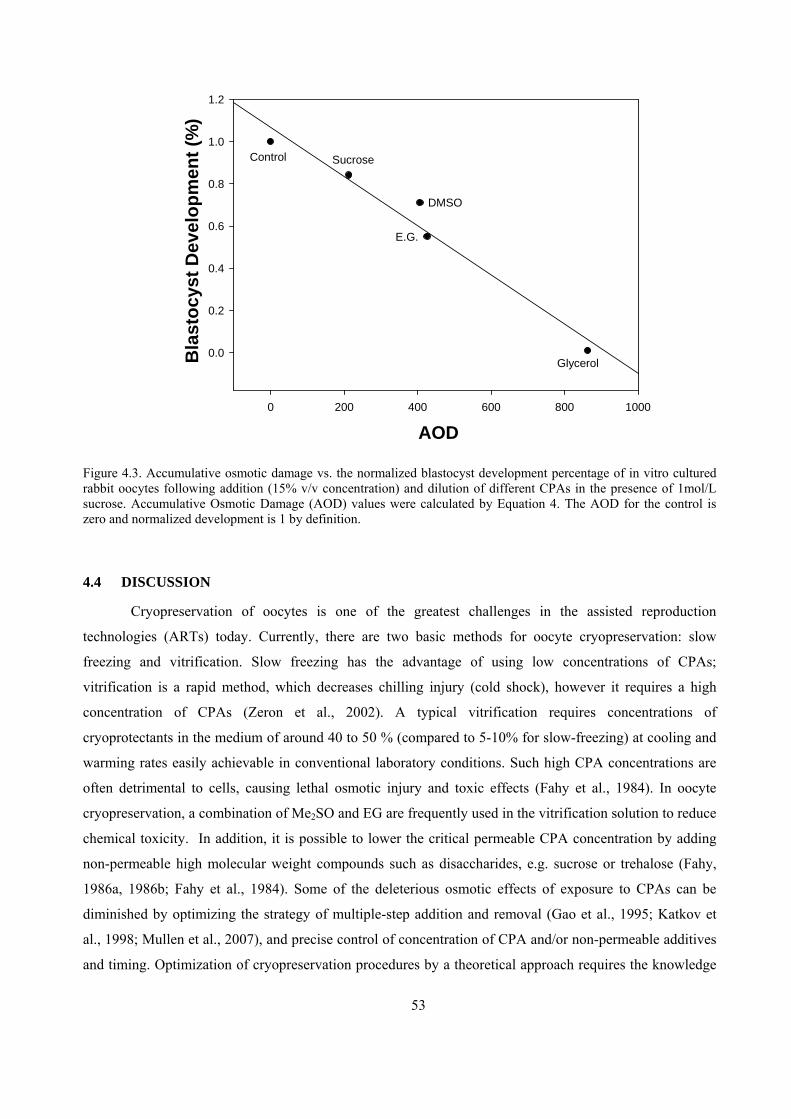
AOD
0 200 400 600 800 1000
Bla
sto
cyst
Dev
elo
pm
ent
(%)
0.0
0.2
0.4
0.6
0.8
1.0
1.2
Sucrose
DMSO
Glycerol
Control
E.G.
Figure 4.3. Accumulative osmotic damage vs. the normalized blastocyst development percentage of in vitro cultured rabbit oocytes following addition (15% v/v concentration) and dilution of different CPAs in the presence of 1mol/L sucrose. Accumulative Osmotic Damage (AOD) values were calculated by Equation 4. The AOD for the control is zero and normalized development is 1 by definition.
4.4 DISCUSSION
Cryopreservation of oocytes is one of the greatest challenges in the assisted reproduction
technologies (ARTs) today. Currently, there are two basic methods for oocyte cryopreservation: slow
freezing and vitrification. Slow freezing has the advantage of using low concentrations of CPAs;
vitrification is a rapid method, which decreases chilling injury (cold shock), however it requires a high
concentration of CPAs (Zeron et al., 2002). A typical vitrification requires concentrations of
cryoprotectants in the medium of around 40 to 50 % (compared to 5-10% for slow-freezing) at cooling and
warming rates easily achievable in conventional laboratory conditions. Such high CPA concentrations are
often detrimental to cells, causing lethal osmotic injury and toxic effects (Fahy et al., 1984). In oocyte
cryopreservation, a combination of Me2SO and EG are frequently used in the vitrification solution to reduce
chemical toxicity. In addition, it is possible to lower the critical permeable CPA concentration by adding
non-permeable high molecular weight compounds such as disaccharides, e.g. sucrose or trehalose (Fahy,
1986a, 1986b; Fahy et al., 1984). Some of the deleterious osmotic effects of exposure to CPAs can be
diminished by optimizing the strategy of multiple-step addition and removal (Gao et al., 1995; Katkov et
al., 1998; Mullen et al., 2007), and precise control of concentration of CPA and/or non-permeable additives
and timing. Optimization of cryopreservation procedures by a theoretical approach requires the knowledge
53

54
of several biophysical parameters of the cells under study, including the cell volume (which includes the
proportion of osmotically-active and non-active components), the cell surface area, and the permeability of
the cell to water and cryoprotectants (Mazur, 2004). In addition, it requires the knowledge of tolerable
levels of osmotic stress.
4.4.1 CPA permeabilities
The hydraulic conductivity and CPA permeability results obtained in this study are summarized in
the Table 4.1. The hydraulic conductivity in the presence of Me2SO is slightly higher to those described for
mouse (0.63 µm min -1 ·atm-1 at 24 oC (Agca et al., 1998a), human (0.7 µm min -1 ·atm-1 at 24 oC (Paynter et
al., 1999). In the presence of EG, the hydraulic conductivity obtained in this study is similar to or slightly
higher than those described for mouse (0.73 µm min -1 ·atm-1 at 24 oC (Paynter et al., 1999), and human
(0.64 µm min -1 atm-1 at 24 oC, (Mullen, 2007); 0.82 µm min -1 ·atm-1 (De Santis et al., 2007).
The CPA permeability in the presence of Me2SO obtained in this study is higher than those
described for mouse (1.69 x 10⁻³ cm min-1 at 24°C (Agca et al., 1998a) and human oocytes (1.5 x 10⁻³ cm
min-1 at 24 oC (Paynter et al., 1999). In the presence of EG, the CPA permeability obtained in this study is
also higher than those described for mouse (0.85 x 10⁻³ cm min-1 at 24°C (Paynter et al., 1999), human (0.81
x 10-3 cm min-1 at 24 oC, (Mullen, 2007) and 0.6 x 10⁻³ cm min-1 (De Santis et al., 2007).
4.4.2 AOD model
During CPA addition and dilution procedures, cells experience osmotically-induced volumetric
changes. These changes can cause irreversible damage to cells when critical volume excursion limits
(swelling and shrinkage) are reached (Mazur and Schneider, 1986). To our best knowledge, no quantitative
model has been developed to describe the associated damage. Historically, osmotic damage during CPA
addition and removal has been equated solely to the magnitude of the volume changes experienced
(Meryman, 2007). As a result, attempts to mitigate this damage have focused on preventing cells from
exceeding a specified volume range. On the contrary, the results from the present study suggest that the
magnitude of the volume excursion is not the sole predictor of osmotic damage, at least for mammalian
oocytes. This idea is also supported by recently published reports describing attempts to improve
vitrification of mammalian oocytes which include a brief exposure to the vitrification solution prior to
cooling (Bos-Mikich et al., 1995; Kuwayama et al., 2005; Nakagata, 1989; Shaw et al., 1992; Somfai et al.,
2006). In some studies, experimental treatments where cells were only exposed to the solution conditions
and not subjected to cooling have shown relatively good survival, particularly if the exposure time to the
most concentrated solution was short (Fuku et al., 1995; Hotamisligil et al., 1996) and reports cited above).
These results, along with those from the present study suggest that there is a kinetic component to osmotic
damage.
55
Using cell permeability parameters and computer modeling enables simulation of volume changes in
various situations of CPA addition and dilution. In the typical volume vs. time plot of cellular volume
change (e.g. Figure 4.2), the result of the integration calculation of AOD will be proportional to the area of
the curves between the volume line and isotonic volume line. This provides a way to visually estimate the
magnitude of AOD. In this study, we developed a straightforward quantitative osmotic volume excursion
model that incorporates both magnitude and duration of volume excursions that are associated with the
procedure of cryoprotectant addition and removal. As a first test of the validity of this model, we have
assessed the correlation between the in vitro development potential of the parthenogenetically- activated
oocytes and the associate AOD (equation 4.4) resulting from the CPA addition and dilution procedures used
in the permeability study (Table 4-3). During CPA dilutions in the presence of sucrose, we used the
estimated value of hydraulic conductivity 0.8 µm min -1 ·atm-1. The correlation between these two data sets
is strong (r = -0.98). The hypothesis that both the magnitude and duration of the osmotic volume
excursions is responsible for loss of cell viability is supported by comparing the volume excursions for
exposure to sucrose and glycerol in Figure 4.4. If the magnitude of the volume excursion was the only
factor responsible for cell injury, the developmental potential of cells exposed to these 2 treatments should
be very similar (since the absolute cell volume excursion which cells experienced during these treatments
was similar). Examination of Figure 4.5 shows this not to be the case, however; oocytes exposed only to
sucrose survived very well compared to those exposed to glycerol, despite the magnitude of volume
changes being similar. We acknowledge that chemical toxicity of glycerol cannot be completely discounted
as a possible cause of the difference in the viability seen between these two treatments, nor can the
possibility of a stabilization effect of sucrose. The cell permeability values for glycerol suggest that only a
small amount of this compound would have entered the oocytes during the exposure. Therefore, we feel
that chemical toxicity is not a likely explanation for the degree of viability loss seen with GLY exposure.
In the procedures of CPA addition/dilution, one will always encounter the dilemma of the magnitude
versus duration issue: multiple step addition/dilution that decreases the magnitude prolongs the duration. A
more accurate model for describing the effects of both factors should allow the development of improved
cryopreservation procedures. Here we propose the AOD model as a first step toward the development of a
more comprehensive description of osmotic damage to cells during CPA addition and removal. Future
attempts at model development should include the inclusion of a chemical toxicity effect, which could help
to resolve the uncertainty described above.

56
CHAPTER 5. DEVELOPMENT OF A NOVEL CRYOPRESERVATION THREE-STEP
METHOD FOR MAMMALIAN OOCYTE
5.1 INTRODUCTION
The establishment of long-term preservation methods for mammalian oocytes will provide an
alternative to embryo cryopreservation. However, the determination of reliable methods for mammalian
oocyte cryopreservation has been challenging. Mature oocytes exposed to sub-physiologic temperatures
experience a substantial degree of disruption of their metaphase II spindles (Aman and Parks, 1994;
Pickering et al., 1990), cortical granules (Vincent and Johnson, 1992) and plasma membrane (Arav et al.,
1996). Chilling and cryopreservation of germinal vesicle (GV) oocytes causes reduction in maturation rates,
resulting in reduced developmental potential following fertilization (Martino et al., 1996a; Pickering et al.,
1990; Zenzes et al., 2001). Many studies indicate that cryopreservation of either GV or MII oocytes using
current slow cooling protocols will result in reduction in cell viability for different reasons (Critser et al.,
1997). Since the effects of chilling on the developmental potential of oocytes from many species are
widely recognized, ultra-rapid cooling methods, introduced by Rall and Fahy (Fahy, 1986b; Rall et al.,
1987), have been used to cryopreserve mouse (Nakagata, 1989; Rayos et al., 1994; Wood et al., 1993),
human (Yoon et al., 2000) and bovine (Martino et al., 1996b; Vajta et al., 1998) oocytes with varying levels
of success. However, the vitrification method requires a high concentration of CPA (e.g. 6M) loaded into
cells before plunging into LN2. Introducing this high solute concentration into cells exposes the cells to
extreme osmotic stresses and chemical toxicity, and is also a procedural challenge (Agca, 2000; Fahy,
1986b; Hotamisligil et al., 1996).
Rapid freezing by a so-called “two-step” procedure has been studied for several types of cells (Landa,
1990; Lopez-Bejar et al., 1994; McGann and Farrant, 1976; Rapatz and Luyet, 1973; Wood and Farrant, 1980).
This approach, in fact, consists of three steps: first, CPA loading followed by a fast cooling step, which
reduces sample temperature from physiologic temperature to a subzero holding temperature (Tp, e.g. –25oC)
at a high rate. The second step involves maintaining the cells at Tp for a specific period. The third step
involves plunging the sample into liquid nitrogen (LN2). Basically, intracellular CPA concentration
increases during the second step as a result of dehydration. When the intracellular CPA concentration
reaches a critical concentration (Cc) sufficient to allow intracellular vitrification, the oocytes are plunged
into LN2 (third step), concluding a “three-step freezing” method. The procedure could overcome these
problems that are associated with the cryopreservation of oocytes by: (a) loading oocytes with a moderate
concentration of CPA (e.g. 2.5 M) (b) using a very fast cooling rate to cool oocytes to Tp where the chilling
effects on spindle depolymerization and developmental potential may be reduced (Aigner et al., 1992).
This procedure puts cells in highly supercooled situation. Theoretically, as a cell is progressively
supercooled, there is an associated increase in the probability of intracellular ice formation (PIIF). The
kinetics of this ice formation is dependent on conditions of supercooling, temperature and intracellular
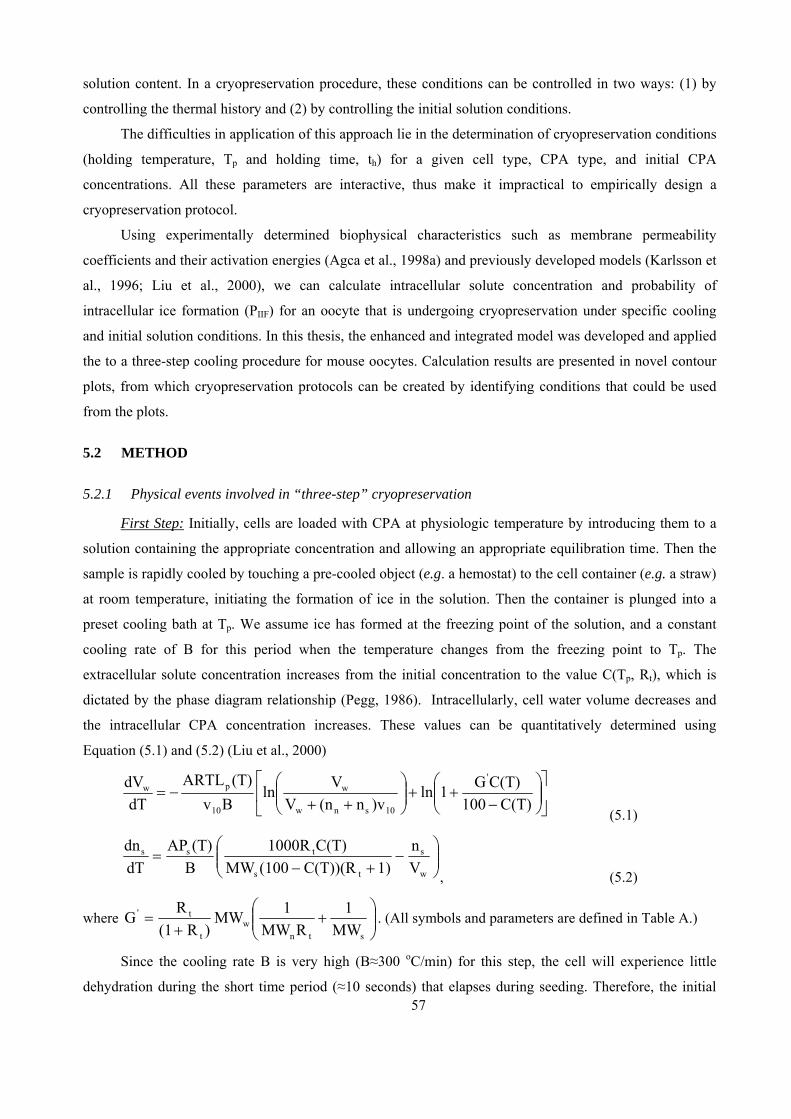
solution content. In a cryopreservation procedure, these conditions can be controlled in two ways: (1) by
controlling the thermal history and (2) by controlling the initial solution conditions.
The difficulties in application of this approach lie in the determination of cryopreservation conditions
(holding temperature, Tp and holding time, th) for a given cell type, CPA type, and initial CPA
concentrations. All these parameters are interactive, thus make it impractical to empirically design a
cryopreservation protocol.
Using experimentally determined biophysical characteristics such as membrane permeability
coefficients and their activation energies (Agca et al., 1998a) and previously developed models (Karlsson et
al., 1996; Liu et al., 2000), we can calculate intracellular solute concentration and probability of
intracellular ice formation (PIIF) for an oocyte that is undergoing cryopreservation under specific cooling
and initial solution conditions. In this thesis, the enhanced and integrated model was developed and applied
the to a three-step cooling procedure for mouse oocytes. Calculation results are presented in novel contour
plots, from which cryopreservation protocols can be created by identifying conditions that could be used
from the plots.
5.2 METHOD
5.2.1 Physical events involved in “three-step” cryopreservation
First Step: Initially, cells are loaded with CPA at physiologic temperature by introducing them to a
solution containing the appropriate concentration and allowing an appropriate equilibration time. Then the
sample is rapidly cooled by touching a pre-cooled object (e.g. a hemostat) to the cell container (e.g. a straw)
at room temperature, initiating the formation of ice in the solution. Then the container is plunged into a
preset cooling bath at Tp. We assume ice has formed at the freezing point of the solution, and a constant
cooling rate of B for this period when the temperature changes from the freezing point to Tp. The
extracellular solute concentration increases from the initial concentration to the value C(Tp, Rt), which is
dictated by the phase diagram relationship (Pegg, 1986). Intracellularly, cell water volume decreases and
the intracellular CPA concentration increases. These values can be quantitatively determined using
Equation (5.1) and (5.2) (Liu et al., 2000)
C(T)100
C(T)G1ln
)vn(nV
Vln
Bv
(T)ARTL
dT
dV '
10snw
w
10
pw
(5.1)
w
s
ts
tss
V
n
1)C(T))(R(100MW
C(T)1000R
B
(T)AP
dT
dn
, (5.2)
where
stnw
t
t'
MW
1
RMW
1MW
)R(1
RG . (All symbols and parameters are defined in Table A.)
57
Since the cooling rate B is very high (B≈300 oC/min) for this step, the cell will experience little
dehydration during the short time period (≈10 seconds) that elapses during seeding. Therefore, the initial
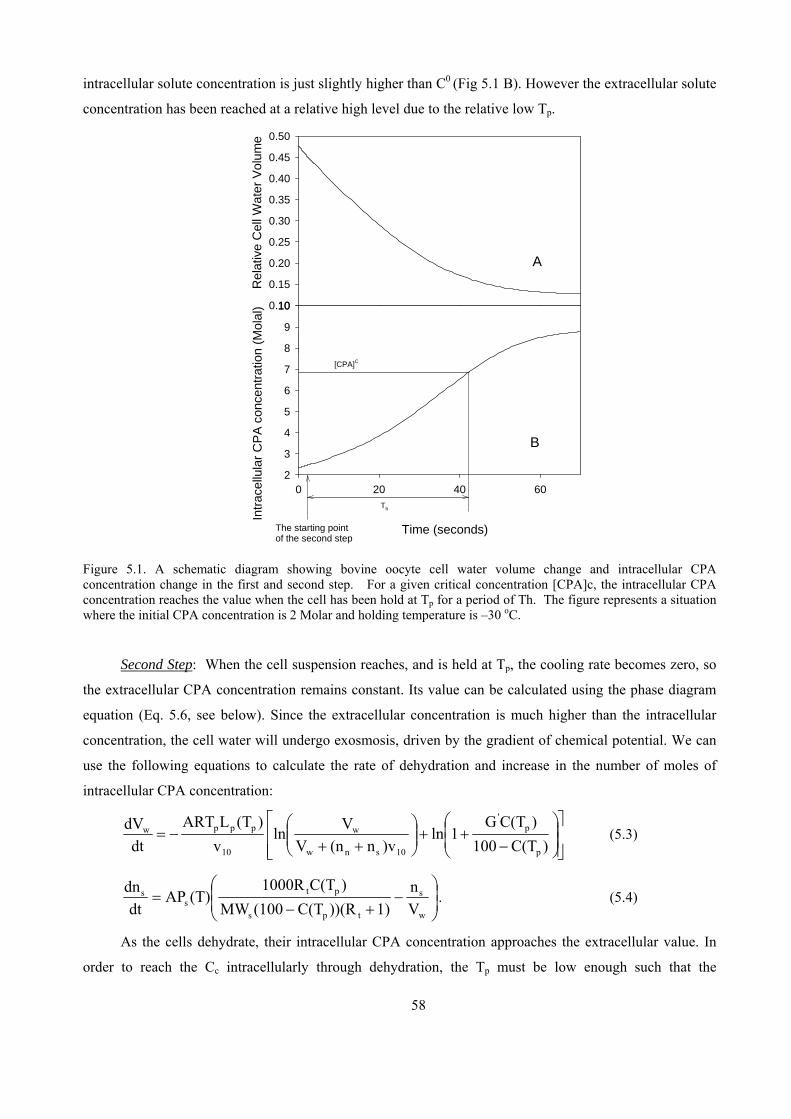
intracellular solute concentration is just slightly higher than C0 (Fig 5.1 B). However the extracellular solute
concentration has been reached at a relative high level due to the relative low Tp.
Rel
ativ
e C
ell W
ater
Vol
ume
0.10
0.15
0.20
0.25
0.30
0.35
0.40
0.45
0.50
Col 1 vs Col 2
Time (seconds)
0 20 40 60
Intr
acel
lula
r C
PA
con
cent
ratio
n (M
olal
)
2
3
4
5
6
7
8
9
10
Th
[CPA]C
The starting point of the second step
B
A
Figure 5.1. A schematic diagram showing bovine oocyte cell water volume change and intracellular CPA concentration change in the first and second step. For a given critical concentration [CPA]c, the intracellular CPA concentration reaches the value when the cell has been hold at Tp for a period of Th. The figure represents a situation where the initial CPA concentration is 2 Molar and holding temperature is –30 oC.
Second Step: When the cell suspension reaches, and is held at Tp, the cooling rate becomes zero, so
the extracellular CPA concentration remains constant. Its value can be calculated using the phase diagram
equation (Eq. 5.6, see below). Since the extracellular concentration is much higher than the intracellular
concentration, the cell water will undergo exosmosis, driven by the gradient of chemical potential. We can
use the following equations to calculate the rate of dehydration and increase in the number of moles of
intracellular CPA concentration:
)C(T100
)C(TG1ln
)vn(nV
Vln
v
)(TLART
dt
dV
p
p'
10snw
w
10
pppw (5.3)
w
s
tps
pts
s
V
n
1)))(RC(T(100MW
)C(T1000R(T)AP
dt
dn. (5.4)
As the cells dehydrate, their intracellular CPA concentration approaches the extracellular value. In
order to reach the Cc intracellularly through dehydration, the Tp must be low enough such that the
58
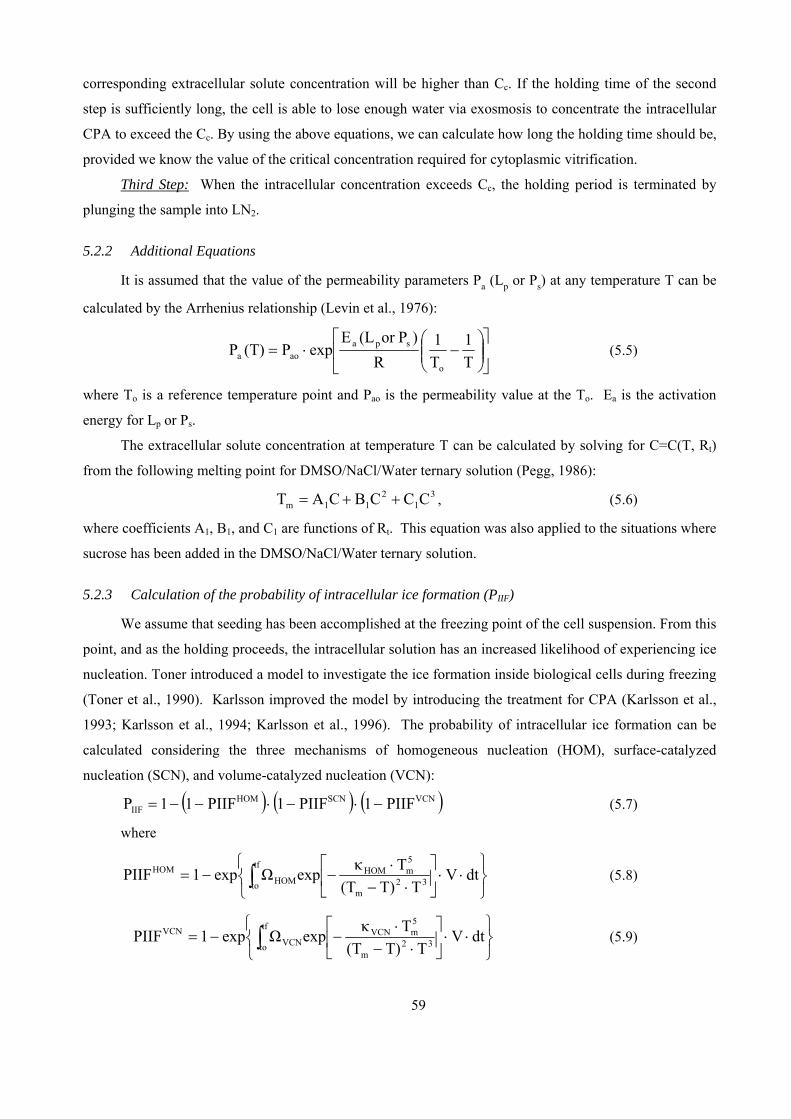
corresponding extracellular solute concentration will be higher than Cc. If the holding time of the second
step is sufficiently long, the cell is able to lose enough water via exosmosis to concentrate the intracellular
CPA to exceed the Cc. By using the above equations, we can calculate how long the holding time should be,
provided we know the value of the critical concentration required for cytoplasmic vitrification.
Third Step: When the intracellular concentration exceeds Cc, the holding period is terminated by
plunging the sample into LN2.
5.2.2 Additional Equations
It is assumed that the value of the permeability parameters Pa (Lp or Ps) at any temperature T can be
calculated by the Arrhenius relationship (Levin et al., 1976):
T
1
T
1
R
)Por (LEexpP(T)P
o
spaaoa (5.5)
where To is a reference temperature point and Pao is the permeability value at the To. Ea is the activation
energy for Lp or Ps.
The extracellular solute concentration at temperature T can be calculated by solving for C=C(T, Rt)
from the following melting point for DMSO/NaCl/Water ternary solution (Pegg, 1986):
, (5.6) 31
211m CCCBCAT
where coefficients A1, B1, and C1 are functions of Rt. This equation was also applied to the situations where
sucrose has been added in the DMSO/NaCl/Water ternary solution.
5.2.3 Calculation of the probability of intracellular ice formation (PIIF)
We assume that seeding has been accomplished at the freezing point of the cell suspension. From this
point, and as the holding proceeds, the intracellular solution has an increased likelihood of experiencing ice
nucleation. Toner introduced a model to investigate the ice formation inside biological cells during freezing
(Toner et al., 1990). Karlsson improved the model by introducing the treatment for CPA (Karlsson et al.,
1993; Karlsson et al., 1994; Karlsson et al., 1996). The probability of intracellular ice formation can be
calculated considering the three mechanisms of homogeneous nucleation (HOM), surface-catalyzed
nucleation (SCN), and volume-catalyzed nucleation (VCN):
VCNSCNHOMIIF PIIF1PIIF1PIIF11P (5.7)
where
dtV
TT)(T
TκexpΩexp1PIIF
tf
to 32m
5mHOM
HOMHOM (5.8)
dtV
TT)(T
TκexpΩexp1PIIF
tf
to 32m
5mVCN
VCNVCN (5.9)
59
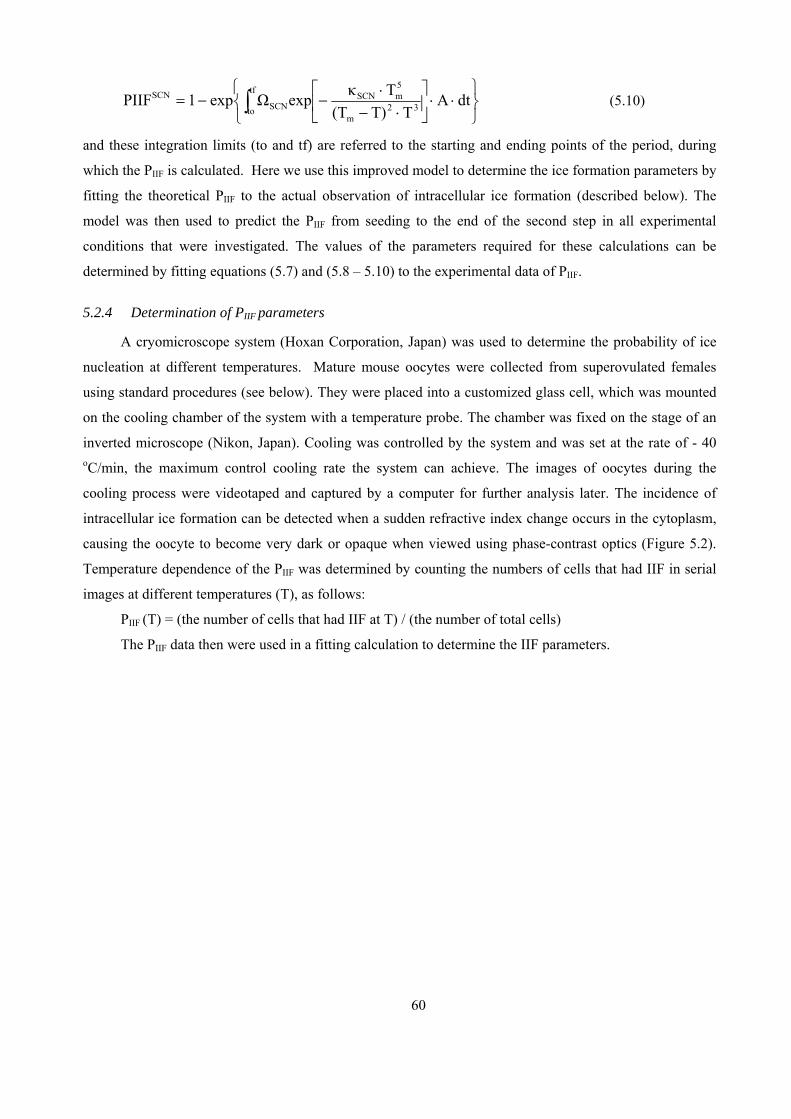
dtA
TT)(T
TκexpΩexp1PIIF
tf
to 32m
5mSCN
SCNSCN (5.10)
and these integration limits (to and tf) are referred to the starting and ending points of the period, during
which the PIIF is calculated. Here we use this improved model to determine the ice formation parameters by
fitting the theoretical PIIF to the actual observation of intracellular ice formation (described below). The
model was then used to predict the PIIF from seeding to the end of the second step in all experimental
conditions that were investigated. The values of the parameters required for these calculations can be
determined by fitting equations (5.7) and (5.8 – 5.10) to the experimental data of PIIF.
5.2.4 Determination of PIIF parameters
A cryomicroscope system (Hoxan Corporation, Japan) was used to determine the probability of ice
nucleation at different temperatures. Mature mouse oocytes were collected from superovulated females
using standard procedures (see below). They were placed into a customized glass cell, which was mounted
on the cooling chamber of the system with a temperature probe. The chamber was fixed on the stage of an
inverted microscope (Nikon, Japan). Cooling was controlled by the system and was set at the rate of - 40 oC/min, the maximum control cooling rate the system can achieve. The images of oocytes during the
cooling process were videotaped and captured by a computer for further analysis later. The incidence of
intracellular ice formation can be detected when a sudden refractive index change occurs in the cytoplasm,
causing the oocyte to become very dark or opaque when viewed using phase-contrast optics (Figure 5.2).
Temperature dependence of the PIIF was determined by counting the numbers of cells that had IIF in serial
images at different temperatures (T), as follows:
PIIF (T) = (the number of cells that had IIF at T) / (the number of total cells)
The PIIF data then were used in a fitting calculation to determine the IIF parameters.
60
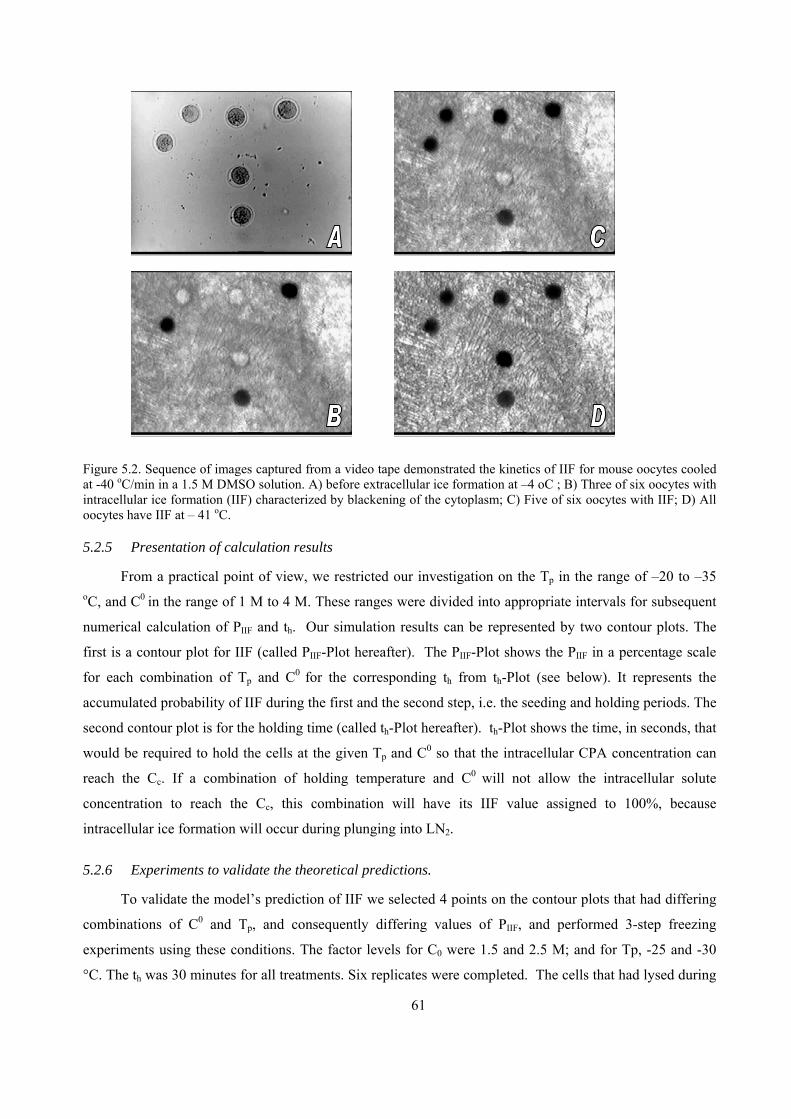
Figure 5.2. Sequence of images captured from a video tape demonstrated the kinetics of IIF for mouse oocytes cooled at -40 oC/min in a 1.5 M DMSO solution. A) before extracellular ice formation at –4 oC ; B) Three of six oocytes with intracellular ice formation (IIF) characterized by blackening of the cytoplasm; C) Five of six oocytes with IIF; D) All oocytes have IIF at – 41 oC.
5.2.5 Presentation of calculation results
From a practical point of view, we restricted our investigation on the Tp in the range of –20 to –35 oC, and C0 in the range of 1 M to 4 M. These ranges were divided into appropriate intervals for subsequent
numerical calculation of PIIF and th. Our simulation results can be represented by two contour plots. The
first is a contour plot for IIF (called PIIF-Plot hereafter). The PIIF-Plot shows the PIIF in a percentage scale
for each combination of Tp and C0 for the corresponding th from th-Plot (see below). It represents the
accumulated probability of IIF during the first and the second step, i.e. the seeding and holding periods. The
second contour plot is for the holding time (called th-Plot hereafter). th-Plot shows the time, in seconds, that
would be required to hold the cells at the given Tp and C0 so that the intracellular CPA concentration can
reach the Cc. If a combination of holding temperature and C0 will not allow the intracellular solute
concentration to reach the Cc, this combination will have its IIF value assigned to 100%, because
intracellular ice formation will occur during plunging into LN2.
5.2.6 Experiments to validate the theoretical predictions.
To validate the model’s prediction of IIF we selected 4 points on the contour plots that had differing
combinations of C0 and Tp, and consequently differing values of PIIF, and performed 3-step freezing
experiments using these conditions. The factor levels for C0 were 1.5 and 2.5 M; and for Tp, -25 and -30
°C. The th was 30 minutes for all treatments. Six replicates were completed. The cells that had lysed during
61
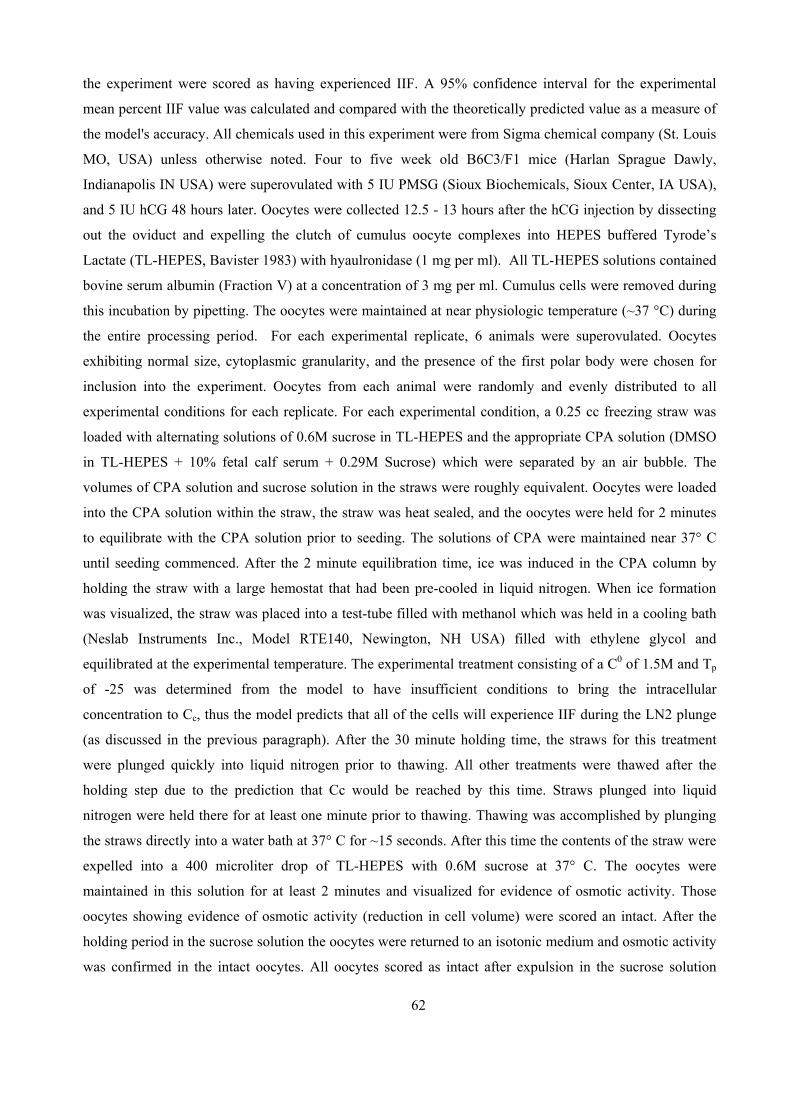
62
the experiment were scored as having experienced IIF. A 95% confidence interval for the experimental
mean percent IIF value was calculated and compared with the theoretically predicted value as a measure of
the model's accuracy. All chemicals used in this experiment were from Sigma chemical company (St. Louis
MO, USA) unless otherwise noted. Four to five week old B6C3/F1 mice (Harlan Sprague Dawly,
Indianapolis IN USA) were superovulated with 5 IU PMSG (Sioux Biochemicals, Sioux Center, IA USA),
and 5 IU hCG 48 hours later. Oocytes were collected 12.5 - 13 hours after the hCG injection by dissecting
out the oviduct and expelling the clutch of cumulus oocyte complexes into HEPES buffered Tyrode’s
Lactate (TL-HEPES, Bavister 1983) with hyaulronidase (1 mg per ml). All TL-HEPES solutions contained
bovine serum albumin (Fraction V) at a concentration of 3 mg per ml. Cumulus cells were removed during
this incubation by pipetting. The oocytes were maintained at near physiologic temperature (~37 °C) during
the entire processing period. For each experimental replicate, 6 animals were superovulated. Oocytes
exhibiting normal size, cytoplasmic granularity, and the presence of the first polar body were chosen for
inclusion into the experiment. Oocytes from each animal were randomly and evenly distributed to all
experimental conditions for each replicate. For each experimental condition, a 0.25 cc freezing straw was
loaded with alternating solutions of 0.6M sucrose in TL-HEPES and the appropriate CPA solution (DMSO
in TL-HEPES + 10% fetal calf serum + 0.29M Sucrose) which were separated by an air bubble. The
volumes of CPA solution and sucrose solution in the straws were roughly equivalent. Oocytes were loaded
into the CPA solution within the straw, the straw was heat sealed, and the oocytes were held for 2 minutes
to equilibrate with the CPA solution prior to seeding. The solutions of CPA were maintained near 37° C
until seeding commenced. After the 2 minute equilibration time, ice was induced in the CPA column by
holding the straw with a large hemostat that had been pre-cooled in liquid nitrogen. When ice formation
was visualized, the straw was placed into a test-tube filled with methanol which was held in a cooling bath
(Neslab Instruments Inc., Model RTE140, Newington, NH USA) filled with ethylene glycol and
equilibrated at the experimental temperature. The experimental treatment consisting of a C0 of 1.5M and Tp
of -25 was determined from the model to have insufficient conditions to bring the intracellular
concentration to Cc, thus the model predicts that all of the cells will experience IIF during the LN2 plunge
(as discussed in the previous paragraph). After the 30 minute holding time, the straws for this treatment
were plunged quickly into liquid nitrogen prior to thawing. All other treatments were thawed after the
holding step due to the prediction that Cc would be reached by this time. Straws plunged into liquid
nitrogen were held there for at least one minute prior to thawing. Thawing was accomplished by plunging
the straws directly into a water bath at 37° C for ~15 seconds. After this time the contents of the straw were
expelled into a 400 microliter drop of TL-HEPES with 0.6M sucrose at 37° C. The oocytes were
maintained in this solution for at least 2 minutes and visualized for evidence of osmotic activity. Those
oocytes showing evidence of osmotic activity (reduction in cell volume) were scored an intact. After the
holding period in the sucrose solution the oocytes were returned to an isotonic medium and osmotic activity
was confirmed in the intact oocytes. All oocytes scored as intact after expulsion in the sucrose solution
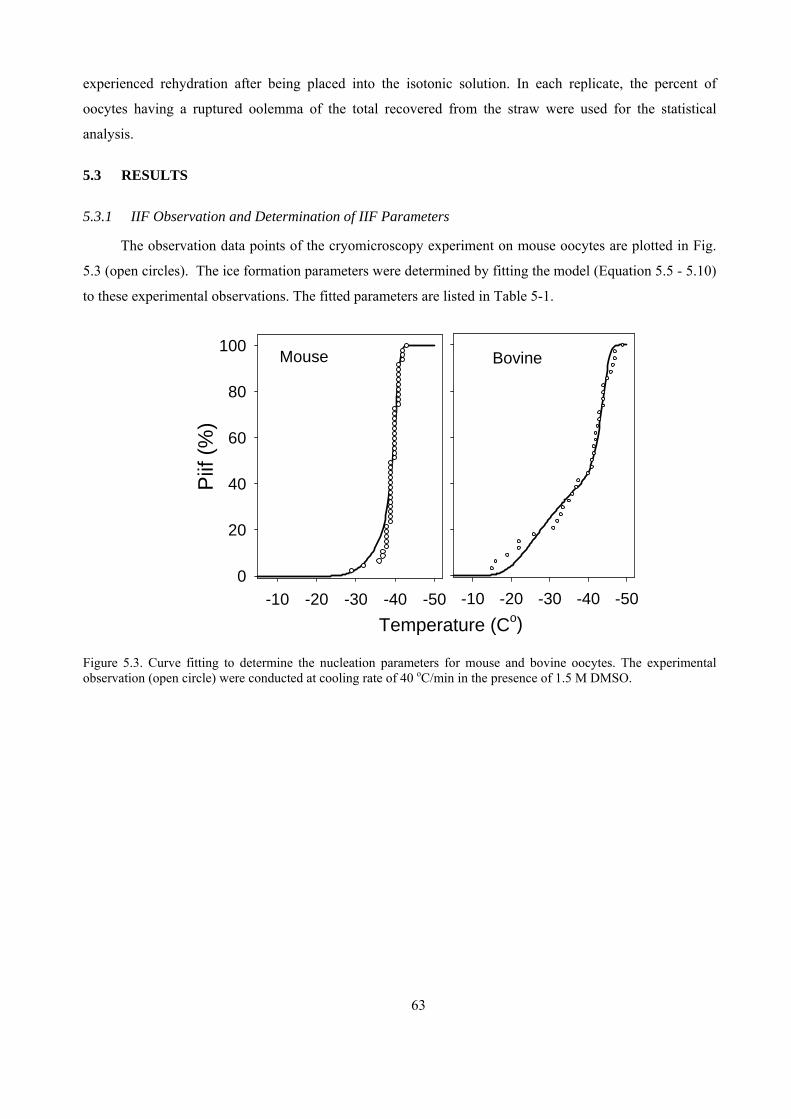
experienced rehydration after being placed into the isotonic solution. In each replicate, the percent of
oocytes having a ruptured oolemma of the total recovered from the straw were used for the statistical
analysis.
5.3 RESULTS
5.3.1 IIF Observation and Determination of IIF Parameters
The observation data points of the cryomicroscopy experiment on mouse oocytes are plotted in Fig.
5.3 (open circles). The ice formation parameters were determined by fitting the model (Equation 5.5 - 5.10)
to these experimental observations. The fitted parameters are listed in Table 5-1.
Mouse
Temperature (Co)-50-40-30-20-10
Piif
(%
)
0
20
40
60
80
100Bovine
-50-40-30-20-10
Figure 5.3. Curve fitting to determine the nucleation parameters for mouse and bovine oocytes. The experimental observation (open circle) were conducted at cooling rate of 40 oC/min in the presence of 1.5 M DMSO.
63
Table 5-1. Parameter values used in the current paper
Description Units Mouse Oocytea Bovine Oocyteb
hydraulic conductivity Lp matm-1min-1 0.40 (at 20 oC) 1.16 (at 20 oC)
solute permeability Ps cmmin-1. 1.07 x 10⁻³ 2.6 x 10⁻³
Isotonic Cell Volume m3 1.96 x 10⁵ 8.34 x 10⁵
Surface Area m2 1.63 x 10⁴ 4.28 x 10⁴
Osomotic inactive volume percentage 20% 20%
Activation Energy (Lp) Kcalmole-1K-1 16.4 8.46
Activation Energy (Ps) Kcalmole-1K-1 23.2 21.1
oΩ for VCN m-3sec-1 1.993 x 10⁴ 2.032 x 10³
oκ for VCN K5 3.611 x 10¹¹ 3.263 x 10¹¹
oΩ for SCN m-2sec-1 3.062 x 10⁻⁴ 3.916 x 10⁻⁵
oκ for SCN K5 5.404 x 10¹⁰ 1.885 x 10⁹
a Agca et al (1998a) b Agca et al (1999)
5.3.2 Determination of the PIIF values for different combinations of Tp, C0, and th
The calculation results were represented by the PIIF-Plot showing the PIIF in a percentage scale and
corresponding th for each combination of Tp and C0, over the investigation on the Tp in the range of –20 to –
35 oC, and C0 in the range of 1 M to 4 M (Fig. 5.4). We assumed that 40% was the Cc of DMSO for mouse
oocytes, and 0.29M sucrose was present in this extracellular solution. The area of 100% PIIF (the area
without contour lines in Fig. 5.4), which was assigned to 100% due to insufficient intracellular
concentration, divided the plane of Tp/C0 roughly in one third diagonally. The remaining section of the
plots are divided by contour lines that show the PIIF values and holding times for the associated C0 and Tp
values listed on the axes.
64
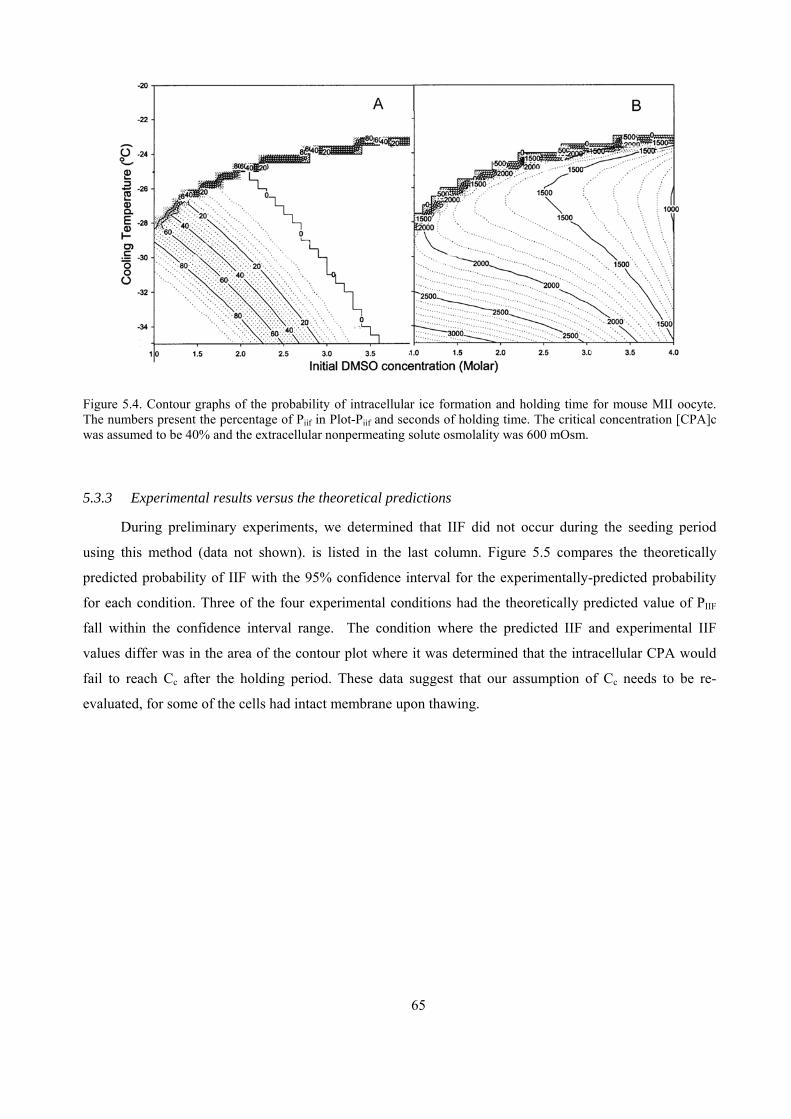
Figure 5.4. Contour graphs of the probability of intracellular ice formation and holding time for mouse MII oocyte. The numbers present the percentage of Piif in Plot-Piif and seconds of holding time. The critical concentration [CPA]c was assumed to be 40% and the extracellular nonpermeating solute osmolality was 600 mOsm.
5.3.3 Experimental results versus the theoretical predictions
During preliminary experiments, we determined that IIF did not occur during the seeding period
using this method (data not shown). is listed in the last column. Figure 5.5 compares the theoretically
predicted probability of IIF with the 95% confidence interval for the experimentally-predicted probability
for each condition. Three of the four experimental conditions had the theoretically predicted value of PIIF
fall within the confidence interval range. The condition where the predicted IIF and experimental IIF
values differ was in the area of the contour plot where it was determined that the intracellular CPA would
fail to reach Cc after the holding period. These data suggest that our assumption of Cc needs to be re-
evaluated, for some of the cells had intact membrane upon thawing.
65
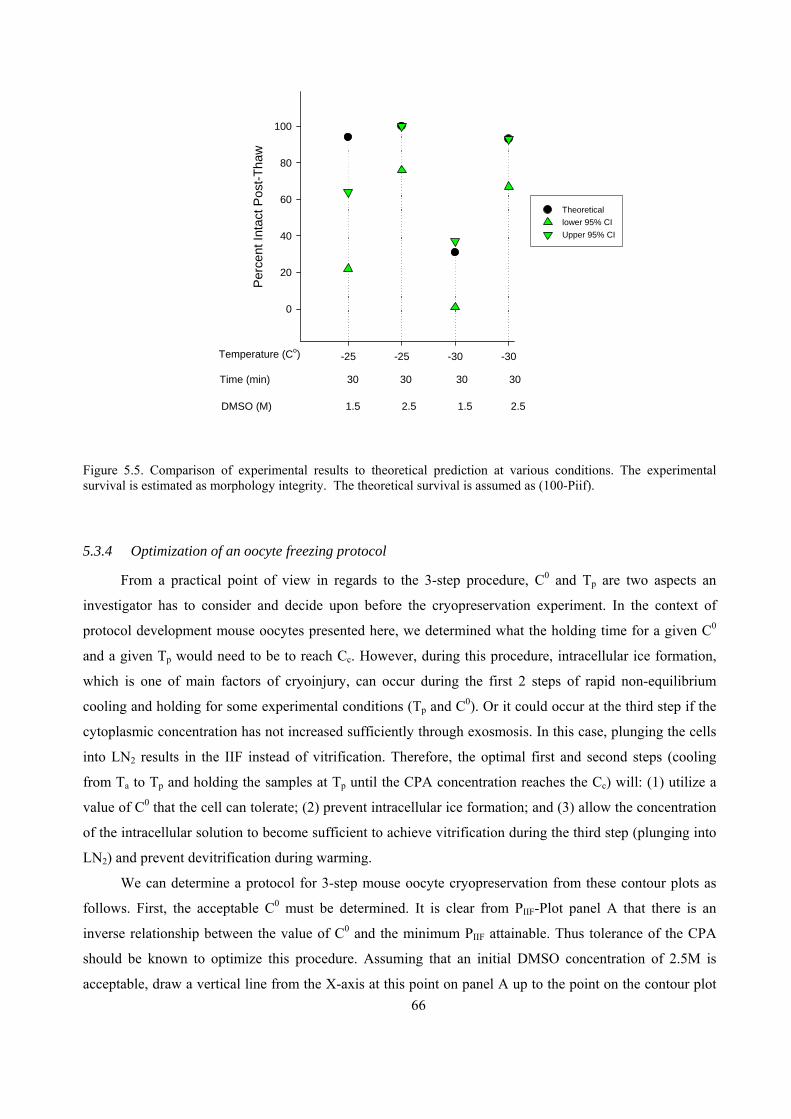
-25 -25 -30 -30
Per
cent
Inta
ct P
ost-
Th
aw
0
20
40
60
80
100
Theoretical
lower 95% CI
Upper 95% CI
Temperature (Co)
Time (min) 30 30 30 30
DMSO (M) 1.5 2.5 1.5 2.5
Figure 5.5. Comparison of experimental results to theoretical prediction at various conditions. The experimental survival is estimated as morphology integrity. The theoretical survival is assumed as (100-Piif).
5.3.4 Optimization of an oocyte freezing protocol
From a practical point of view in regards to the 3-step procedure, C0 and Tp are two aspects an
investigator has to consider and decide upon before the cryopreservation experiment. In the context of
protocol development mouse oocytes presented here, we determined what the holding time for a given C0
and a given Tp would need to be to reach Cc. However, during this procedure, intracellular ice formation,
which is one of main factors of cryoinjury, can occur during the first 2 steps of rapid non-equilibrium
cooling and holding for some experimental conditions (Tp and C0). Or it could occur at the third step if the
cytoplasmic concentration has not increased sufficiently through exosmosis. In this case, plunging the cells
into LN2 results in the IIF instead of vitrification. Therefore, the optimal first and second steps (cooling
from Ta to Tp and holding the samples at Tp until the CPA concentration reaches the Cc) will: (1) utilize a
value of C0 that the cell can tolerate; (2) prevent intracellular ice formation; and (3) allow the concentration
of the intracellular solution to become sufficient to achieve vitrification during the third step (plunging into
LN2) and prevent devitrification during warming.
We can determine a protocol for 3-step mouse oocyte cryopreservation from these contour plots as
follows. First, the acceptable C0 must be determined. It is clear from PIIF-Plot panel A that there is an
inverse relationship between the value of C0 and the minimum PIIF attainable. Thus tolerance of the CPA
should be known to optimize this procedure. Assuming that an initial DMSO concentration of 2.5M is
acceptable, draw a vertical line from the X-axis at this point on panel A up to the point on the contour plot
66
67
where the PIIF is acceptable (in this instance we can achieve a predicted PIIF value of 0). Then the
appropriate holding temperature may be determined by referring to the Y-axis at this point, which is -25 oC
in this instance. The holding time for this combination can be determined by locating the same point on
panel B and identifying the contour line which crosses this point. In this case is it about 1700 seconds.
Therefore, the appropriate procedure would be to load the cells with 2.5M DMSO, plunge the straw into a
cooling bath set to –25 oC after seeding, hold the straw in this bath for 1700 seconds, and then plunge the
straw into liquid nitrogen.
5.4 DISCUSSION
5.4.1 General discussion of PIIF-Plot
In the area with the absence of contour bars, the values for PIIF were assigned to be 100% as stated
above. This area encompasses almost all points that have holding temperatures above –24 oC. This can be
readily explained by examining the phase diagram for a solution of 2.5 M DMSO plus 0.32M NaCl, the
solute concentrations will not reach 40% when the temperature is –24 oC or above. During the cooling
process, the concentration of the extracellular solution will follow the phase diagram, the value being solely
determined by temperature for the given solution. The intracellular solute concentration approaches the
extracellular concentration during the holding step, but will never exceed it. Therefore, the Tp must be low
enough so that the extracellular solute concentration at the Tp is great than Cc.
From the PIIF-Plot, the effects of C0 and Tp on PIIF are explicitly shown. For a given Tp, the values of
PIIF decrease as the C0 increases. Higher intracellular CPA concentrations tend to reduce the extent of
supercooling, which is the major factor of PIIF. For a given C0, the values of PIIF increase as the Tp
decreases. Lower holding temperatures increase the extent of supercooling and decrease membrane
permeabilities (Lp and Ps) and dehydration. Consequently, this results in a higher PIIF.
The iso-PIIF contour lines lay approximately diagonally on the plane of C0 and Tp. When we have to
select conditions for a freezing protocol, we can readily choose values from the uppermost-left section
along the iso-PIIF line, assuming that this value of PIIF is acceptable. The holding time can be determined by
checking the time in seconds for the same condition (C0 and Tp) from the th-plot.
5.4.2 IIF Observations and Prediction
The kinetics of intracellular ice formation are dependent upon the conditions of supercooling,
temperature and intracellular content. The probability of IIF at different temperatures under a specific
cooling condition can be determined by cryo-microscopy experiments, hence the ice formation parameters
can be calculated. A model can be constructed which uses these parameters to estimate the PIIF under
different experimental conditions, and these values can be compared with experimental results. As shown in
Figure 3, the theoretical prediction from our model matched the experimental results quite well, with the
exception of the point in the range where PIIF was set to 100%. We assumed that the intracellular DMSO
68
concentration needed to reach a value of 40% to achieve vitrification upon plunging into liquid nitrogen.
This was based upon previous work with oocyte vitrification. Many studies have used a final CPA
concentration near this value and achieved vitrification. To improve the model, this assumption will have to
be investigated further. Lowering this requirement would likely allow improvements in this method of
cryopreservation by allowing a broader range of C0, Tp, and th values to be used, which could reduce CPA
exposure or time factors and lead to less stress on the cells during the procedure.
69
CHAPTER 6. NEW SCIENTIFIC RESULTS
1. New coupled equations have been developed to examine the changes of intracellular water volume
and the mole number of CPA during temperature changes with cooling rate of B in the presence of
extracellular ice. Two significant improvements have incorporated into this enhanced theoretical
model. It includes the movement of CPA across the plasma membrane during cooling and
warming. The actual ternary phase diagram was used instead of the idealized Clausius-Clapeyron
equation to calculate the extracellular solute concentration.
2. The novel methodology has been established to utilize theoretical models for the development of
cryopreservation protocols by designing specific cooling profiles and selecting appropriate external
conditions to optimize the cryopreservation survivals. It has been utilized to very practical
cryopreservation conditions for rat zygotes in the presence of DMSO as the CPA. The optimum
protocol has been determined to be: a [CPA]0 of 1.2 M DMSO, a B1 of 0.95oC/min and Tp of
-35oC, based on minimum duration of slow cooling.
3. Systematic simulation calculates have been conducted for 2500 cryopreservation conditions and the
novel concept of the regions and their cryopreservation relevance have been presented. These
regions can be served as the guideline for cryobiologists to design new cryopreservation protocols.
4. The accumulative osmotic damage (AOD) has been proposed for the first time to systematically
investigate effects of osmotic stress. It calculates an integration of the relative volume excursion of
the oocyte over the whole duration of the procedure. It incorporates both magnitude and duration of
volume excursions that are associated with the procedure of cryoprotectant addition and removal.
5. The hydraulic conductivity and CPA permeability in the presence of Me2SO, GLY and EG were
experimentally measured in this study for rabbit oocytes. Results from the current study indicates
that the GLY permeability is an order of magnitude lower than that of Me2SO and EG. These
parameters were used to calculate the values of AODs. The AODs show a very strong correlation
to the normalized percentages of blastocyst development after exposure to corresponding CPAs.
6. A novel cryopreservation protocol (three-step) has been designed to overcome problems that are
associated with the cryopreservation of oocytes via a theoretical model that has been enhanced by
integrating the ice formation kinetics of three mechanisms of nucleation. For the first time, the ice
70
formation parameters were determined by fitting the model to experimental observations for mouse
and bovine oocytes. For mouse oocytes, the protocol was established via the theoretical calculation
as the following: to load the cells with 2.5M DMSO, plunge the straw into a cooling bath set to –25 oC after seeding, hold the straw in this bath for 1700 seconds, and then plunge the straw into liquid
nitrogen.
71
CHAPTER 7. CONCLUSION
Cryopreservation methods can be developed by theoretically examining biophysical events during the
processes of the cryopreservation. These events include the movement of intracellular water and permeating
cryoprotectant across the plasma membrane prior to, during and after freezing, ice formation, vitrification
and thawing. During a cryopreservation procedure, cellular status such as cell water volume and
intracellular solute concentration can be calculated by established equations along with corresponding
parameters. The kinetics of these statuses are dependent on the intrinsic cellular characteristics, such as
membrane permeability coefficients and related activation energies, and external conditions applied, such
as equilibrated CPA concentrations, cooling rates and warming rates, and they are intimate related to the
probability of intracellular ice formation (cell damage). This thesis presents the methodology of utilizing
theoretical models for the development of cryopreservation protocols by designing specific cooling profiles
and selecting appropriate external conditions to optimize the cryopreservation survivals.
Based on the classic membrane transportation equations (Kedem and Katchalsky formulism) for a
ternary solution, a theoretical model that includes the movement of cryoprotectant across the plasma
membrane during cooling and warming and the ternary phase diagram was established in the first time. This
thesis provides the detailed derivation steps for the final coupled equations that describe the changes of
intracellular water volume and the mole number of CPA during temperature changes with cooling rate of B
in the presence of extracellular ice. These equations allow us to investigate the responses of cells during
cryopreservation procedures by simulating the cell water volume, the water flux across the plasma
membrane, intra- and extracellular solute concentrations, the degree of supercooling of the cytoplasm, and
the probability of ice nucleation in the cytoplasm. This work had constructed a firm foundation for a
comprehensive framework that was established later to optimize one cryopreservation procedure so called
the interrupted slow freezing, the prevalent method for oocyte and embryo cryopreservation.
The interrupted slow freezing (ISF) consists of an initial controlled slow cooling period, which is
terminated at an intermediate temperature (Tp), followed by rapid cooling as the sample is plunged into
liquid nitrogen (LN2) for final storage. In the context of ISF protocol development, the goal is to determine
the best selection of the initial CPA concentration ([CPA]0), B1 and the Tp. In this study, rat zygotes was the
model cell and DMSO was chosen as the permeable CPA because the most complete set of information
exists for solutions of this permeating cryoprotectant, specifically critical concentrations/cooling and
warming rates necessary for vitrification and ternary solution phase diagram information(Pegg, 1986).
Cooling rates and warming rates were measured inside 0.25ml plastic straw and the values of these rates
were used to estimate the [CPA]c based on Stton’s formulism.
Essentially, the development of the model followed these steps: (1) an initial range of DMSO
concentrations from 0 to 4 Molal, and a range of cooling rates from 0 to 2.5oC/min were evaluated
theoretically to determine the selections of [CPA]0 and B1 that would allow the [S]i to reach the [CPA]c
72
during the controlled slow cooling (2) using Mazur’s IIF model (Mazur, 1977), the conditions that could
result in IIF were eliminated; and (3) the associated plunging temperatures for the combinations of [CPA]0
and B1 ranges were then calculated; (4) The optimum set of conditions from the final range was then
selected based on minimum duration of slow cooling.
For the purpose of the numerical calculations, the above ranges of [CPA]0 and cool rate B1 are
divided into 50 points each. For every combination of [CPA]0 and B1 value (50X50=2500 total), the
established model calculated [S]i, water volume and supercooling at each temperature point (100 equally
spaced points from Tseed to Tend). The criteria of the critical concentration [CPA]c exceeding 40% (w/w) and
no predicted IIF were used to select the candidates of [CPA]0 and B1 for the protocol.
When the obtained results for 2500 combinations are plotted on the plane of [CPA]0 and B1, three
regions appear with their own characteristics. Region I: in this region, no combination of [CPA]0 and B1
allows the intracellular solute concentration to reach the [CPA]c at any temperature point. This region
contains the high cooling rate zone and low initial CPA concentration zone. The logic is obviously: the high
cooling rates in this region would not allow the cell to dehydrate sufficiently, and the low concentrations
are simply not high enough for the intracellular solute concentration to reach the [CPA]c Region II: The
combinations of [CPA]0 and B1 allow the [S]i to reach [CPA]c at certain temperature points, but there is a
high probability of IIF during slow cooling. Region III: The combinations of [CPA]0 and B1 allow the [S]i
to reach the [CPA]c, and no IIF is predicted during slow cooling.
The concept of the regions and their relevance to cryopreservation was novel. Empirical trial-and-
error methodology can hardly achieve this due to limited study points. These regions can be served as the
guideline for cryobiologists to design cryopreservation protocol for new cell type. In the current system (rat
zygote, 0.25 ml plastic straw and DMSO as CPA), the region plot (Figure 4.4) shows that there is a
minimum [CPA]0 boundary below which no B1 (in the range of 0.05 to 2.5oC/min) allows the [S]i to reach
the [CPA]c; there is also a maximum B1, above which any B1 causes the same effect. Roughly, these two
limits construct a box of [CPA]0 and B1 values that are candidates for the optimized protocol. The optimum
set of conditions was selected by minimizing i from Eq 3.6 and determined to be: a [CPA]0 of 1.2 M
DMSO, a B1 of 0.95oC/min and Tp of -35oC.
The current research results suggest an alternative way to cryopreservate mammalian oocytes. The
[CPA]c is constrained by the B2 during plunging and B3 during thawing for a given solution. It is important
to note that if these rates could be increased by using a thinner container, or material with higher heat
transfer properties, then [CPA]c may be reduced. This would result in situations where controlled cooling
could be performed much more efficiently by applying higher B1 values and lower [CPA]0 values. These
conditions would appear to be optimal because the higher B1 shortens the duration of slow cooling
(therefore potentially reducing solution effects injury), and the lower [CPA]0 lowers the osmotic stress and
lessens the potential CPA toxicity.
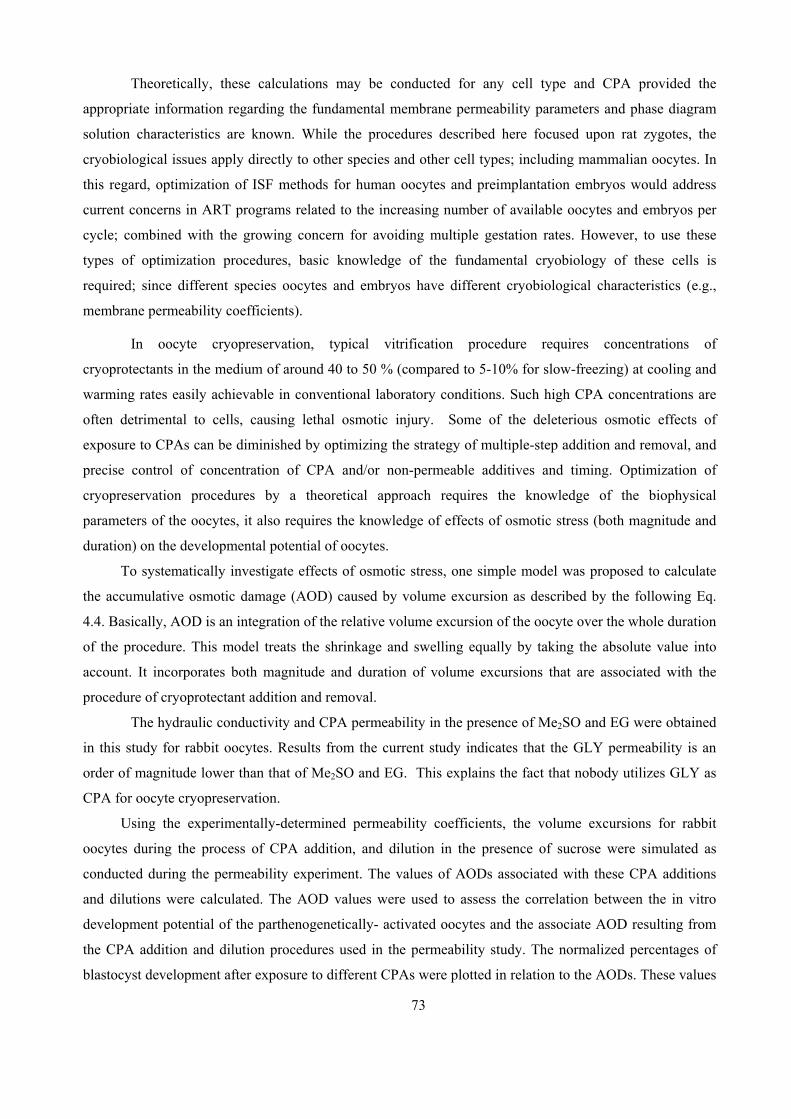
73
Theoretically, these calculations may be conducted for any cell type and CPA provided the
appropriate information regarding the fundamental membrane permeability parameters and phase diagram
solution characteristics are known. While the procedures described here focused upon rat zygotes, the
cryobiological issues apply directly to other species and other cell types; including mammalian oocytes. In
this regard, optimization of ISF methods for human oocytes and preimplantation embryos would address
current concerns in ART programs related to the increasing number of available oocytes and embryos per
cycle; combined with the growing concern for avoiding multiple gestation rates. However, to use these
types of optimization procedures, basic knowledge of the fundamental cryobiology of these cells is
required; since different species oocytes and embryos have different cryobiological characteristics (e.g.,
membrane permeability coefficients).
In oocyte cryopreservation, typical vitrification procedure requires concentrations of
cryoprotectants in the medium of around 40 to 50 % (compared to 5-10% for slow-freezing) at cooling and
warming rates easily achievable in conventional laboratory conditions. Such high CPA concentrations are
often detrimental to cells, causing lethal osmotic injury. Some of the deleterious osmotic effects of
exposure to CPAs can be diminished by optimizing the strategy of multiple-step addition and removal, and
precise control of concentration of CPA and/or non-permeable additives and timing. Optimization of
cryopreservation procedures by a theoretical approach requires the knowledge of the biophysical
parameters of the oocytes, it also requires the knowledge of effects of osmotic stress (both magnitude and
duration) on the developmental potential of oocytes.
To systematically investigate effects of osmotic stress, one simple model was proposed to calculate
the accumulative osmotic damage (AOD) caused by volume excursion as described by the following Eq.
4.4. Basically, AOD is an integration of the relative volume excursion of the oocyte over the whole duration
of the procedure. This model treats the shrinkage and swelling equally by taking the absolute value into
account. It incorporates both magnitude and duration of volume excursions that are associated with the
procedure of cryoprotectant addition and removal.
The hydraulic conductivity and CPA permeability in the presence of Me2SO and EG were obtained
in this study for rabbit oocytes. Results from the current study indicates that the GLY permeability is an
order of magnitude lower than that of Me2SO and EG. This explains the fact that nobody utilizes GLY as
CPA for oocyte cryopreservation.
Using the experimentally-determined permeability coefficients, the volume excursions for rabbit
oocytes during the process of CPA addition, and dilution in the presence of sucrose were simulated as
conducted during the permeability experiment. The values of AODs associated with these CPA additions
and dilutions were calculated. The AOD values were used to assess the correlation between the in vitro
development potential of the parthenogenetically- activated oocytes and the associate AOD resulting from
the CPA addition and dilution procedures used in the permeability study. The normalized percentages of
blastocyst development after exposure to different CPAs were plotted in relation to the AODs. These values
74
were strongly correlated (r = -0.98; Figure 4.3). It could be concluded that the osmotic damage associated
with CPA addition and removal is accurately described by both a magnitude and duration using an
accumulated osmotic damage model.
In the procedures of CPA addition/dilution, one will always encounter the dilemma of the
magnitude versus duration issue: multiple step addition/dilution that decreases the magnitude prolongs the
duration. Historically, osmotic damage during CPA addition and removal has been focused on the
magnitude of the volume changes experienced. As a result, attempts to mitigate this damage have focused
on preventing cells from exceeding a specified volume range. The current more accurate AOD model for
describing the effects of both factors should allow the development of improved cryopreservation
procedures.
Recently, CPA dilution condition in the procedure of oocyte cryopreservation has been given more
attention (Coticchio et al., 2007). Currently, applied dilution conditions are generally derived from the
protocols designed for cleavage-stage embryos and are likely to be rather inappropriate. For human oocyte
cryopreservation, there are two popular dilution approaches: one is multiple steps of sucrose only dilution
with decreasing sucrose concentrations; another is multiple steps of CPA + sucrose dilution with decreasing
CPA + sucrose concentrations. The current AOD model should be a useful tool to examine these
approaches, or even optimize these approaches.
This AOD model is a first step toward the development of a more comprehensive description of
osmotic damage to cells during CPA addition and removal. Future attempts at model development should
include the inclusion of a chemical toxicity effect. Future studies should independently test this model to
determine if it is more broadly applicable.
Since the effects of chilling on the developmental potential of oocytes from many species are widely
recognized, vitrification and ultra-rapid vitrification methods were applied to cryopreserve mammalian
oocyte with varying levels of success. However, the vitrification requires high concentrations of CPAs
loaded into cells before plunging into LN2. Introducing high solute concentrations into oocytes exposes the
oocytes to extreme osmotic stresses and chemical toxicity, and is also facing procedural difficulties. In
addition, many of these novel technologies use direct exposure of samples to LN, which might cause
contamination from/to other biomaterials in the same container.
It is the objective of this thesis to design novel cryopreservation protocol to overcome these problems
that are associated with the cryopreservation of oocytes by: (a) loading oocytes with a moderate
concentration of CPA (e.g. 2.5 M); (b) using a very fast cooling rate to cool oocytes to Tp where the chilling
effects on spindle depolymerization and developmental potential may be reduced; (c) plunging the oocyte
into LN for final storage in a conventional cryopreservation straw. However, these procedures put an oocyte
in a highly supercooled situation. Theoretically, as a cell is progressively supercooled, there is an associated
increase in the probability of intracellular ice formation (PIIF). The difficulties in application of this
approach lie in the determination of cryopreservation conditions (holding temperature, Tp and holding time,
75
th) for an oocyte, CPA type, and initial CPA concentrations. All these parameters are interactive, thus make
it impractical to empirically design a cryopreservation protocol.
In this thesis, the theoretical model introduced in the previous chapter was enhanced by integrating
the ice formation kinetics that includes three mechanisms of homogeneous nucleation (HOM), surface-
catalyzed nucleation (SCN), and volume-catalyzed nucleation (VCN). IIF observation was conducted on a
cryomicroscope system to determine the probability of ice nucleation at different temperatures. The ice
formation parameters were determined by fitting the model to these experimental observations for mouse
and bovine oocytes.
PIIF and th were calculated for different Tps and initial CPA concentrations (C0). The calculation
results can be used to eliminate the conditions that lead to a high probability of intracellular ice formation
during the holding period or the plunge into LN2, the latter occurring if an insufficient intracellular
concentration to achieve intracellular vitrification during the holding period is attained.
The calculation results were represented by the PIIF-Plot showing the PIIF in a percentage scale and
corresponding th for each combination of Tp and C0, over the investigation on the Tp in the range of –20 to –
35 oC, and C0 in the range of 1 M to 4 M. For mouse oocytes, the protocol was established via the
theoretical calculation as the following: to load the cells with 2.5M DMSO, plunge the straw into a cooling
bath set to –25 oC after seeding, hold the straw in this bath for 1700 seconds, and then plunge the straw into
liquid nitrogen.
The calculation results show that the Tp must be low enough so that the extracellular solute
concentration at the Tp should be great than [CPA]c. This value can be readily calculated from the phase
diagram of the extracellular solution. From the PIIF-Plot, the effects of C0 and Tp on PIIF are explicitly
shown. For a given Tp, the values of PIIF decrease as the C0 increases. Higher intracellular CPA
concentrations tend to reduce the extent of supercooling, which is the major factor of PIIF. For a given C0,
the values of PIIF increase as the Tp decreases. Lower holding temperatures increase the extent of
supercooling and decrease membrane permeabilities (Lp and Ps) and dehydration. Consequently, this
results in a higher PIIF. This information provides the principle of selecting C0 and Tp for a 3-step
cryopreservation protocol:
Tp should be as high as possible but low enough so that the extracellular solute concentration
at the Tp should be great than [CPA]c.
C0 should be as high as possible but within the toxicity and osmotic tolerance of the oocyte.
The kinetics of intracellular ice formation are dependent upon the conditions of supercooling,
temperature and intracellular content. The constructed model can estimate the PIIF under different
experimental conditions, and these values can be compared with experimental results. Figure 5.5 compares
the theoretically predicted probability of IIF with the 95% confidence interval for the experimentally-
predicted probability for each condition. Seventy five percent of experimental conditions had the
theoretically predicted value of PIIF fall within the confidence interval range.
76
As shown in Arrenius relationship, one parameter, Ea, dictates how permeability changes while
temperature changes. Because of the exponential relationship, the value of Ea has huge impact on the
permeability value. The current method aims at cryopreservation of oocytes. It applies a high cooling rate at
the first step to decrease the temperature from a physiological level to a relative low level (Tp, e.g. -25),
hoping that depolymerization would not become severe during this short period. At the end of this period
(first step), the cell water volume would not change too much from its initial value due to short time and
dramatically reduction of the membrane permeability, which is highly dependent on temperature. Most cell
water was driven out of cells during the holding period at a constant temperature Tp. Because of high Ea
value for Ps, the value of Ps at Tp is so low that cross-membrane CPA movement is negligible at this
holding period. So cells response just like that they were placed in a hypertonic solution, which composed
of just nonpermeating solute (i.e. NaCl, or sucrose). For this case, Lp value dominates the dehydration
process.
We should consider the PIIF from two aspects: IIF kinetic parameters and membrane permeabilities,
which are highly dependent on their activation energies. As stated before, three-step is not best strategy to
freeze cells. It has been designed to minimize the spindle depolymerization. Applicability of this method to
a specific cell type will be determined by the inherent permeability parameters AND IIF parameters.
Different cell types have different value for these parameters. We found in our recent parallel studies that
bovine oocyte have relatively high tendency to have IIF compared to mouse oocyte. On the other hand, they
have less values of activation energies (Agca et al., 1999).
This characteristics permits bovine oocytes relatively great dehydration at low temperature, hence
reduces the probability of IIF. Compared to bovine oocyte, mouse oocytes have higher activation energies;
they have relative lower values of kinetic parameters. This characteristics provides cells relative slower
dehydration at low temperature, but lower values of kinetic parameters predicts low probability of IIF as
well. So the three-step method can be applied to bovine and mouse oocytes. If a kind of cell has high
activation energies and high value of kinetic parameters, then the method can not be applied.
The values of activation energy for Lp are 16.4 and 8.5 Kcal/mole/K for mouse and bovine,
respectively. Reflected onto the plots of PIIF-Plot and th-Plot, a bovine oocyte dehydrated very quickly,
water volume and supercooling decreased readily, so PIIF was much lower, and holding time was much
shorter than a mouse oocyte assumed the same experimental condition applied. This demonstrated that there
is huge difference exist between different species. Different protocols should be applied accordingly.
The present report outlines a process whereby fundamental principles of cryobiology have been
applied to the design of a cryopreservation procedure intended to overcome challenges unique to a specific
cell type. Chilling injury at temperatures between 25 and 0º C has long been understood to have detrimental
effects on the viability of mature mammalian oocytes. By rapidly traversing this temperature range, it has
been suggested that these effects can be overcome. However, holding a cell suspension at a high sub-zero
temperature makes cytoplasmic water crystallization likely, resulting in lethal rupture of the cell membrane.

77
By integrating theoretical concepts and experimental observations, a model was developed to predict the
likelihood of intracellular ice formation for combinations of DMSO concentrations, holding times, and
holding temperatures in a 3-step freezing design. The model was quite accurate in predicting the likelihood
of intracellular ice formation, with 3 of the 4 combinations having 95 percent confidence intervals
containing the value of the model's prediction. It remains to be seen if this approach will also preserve the
developmental potential of the oocytes.
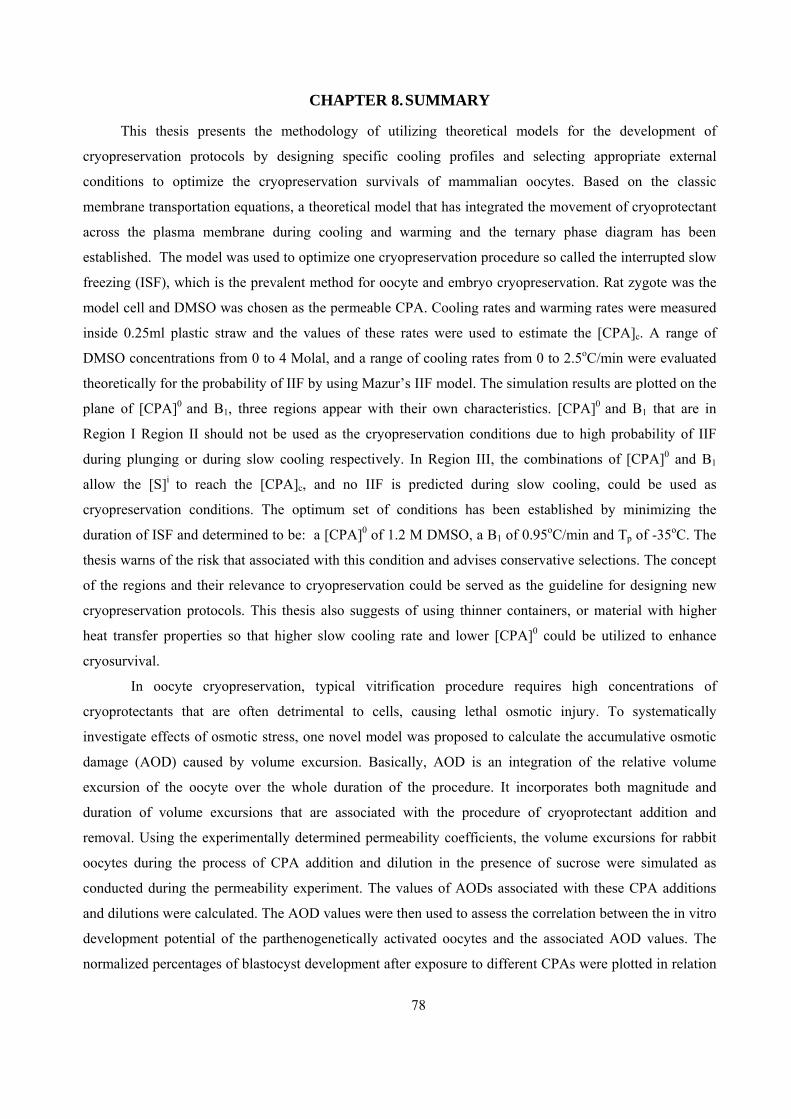
78
CHAPTER 8. SUMMARY
This thesis presents the methodology of utilizing theoretical models for the development of
cryopreservation protocols by designing specific cooling profiles and selecting appropriate external
conditions to optimize the cryopreservation survivals of mammalian oocytes. Based on the classic
membrane transportation equations, a theoretical model that has integrated the movement of cryoprotectant
across the plasma membrane during cooling and warming and the ternary phase diagram has been
established. The model was used to optimize one cryopreservation procedure so called the interrupted slow
freezing (ISF), which is the prevalent method for oocyte and embryo cryopreservation. Rat zygote was the
model cell and DMSO was chosen as the permeable CPA. Cooling rates and warming rates were measured
inside 0.25ml plastic straw and the values of these rates were used to estimate the [CPA]c. A range of
DMSO concentrations from 0 to 4 Molal, and a range of cooling rates from 0 to 2.5oC/min were evaluated
theoretically for the probability of IIF by using Mazur’s IIF model. The simulation results are plotted on the
plane of [CPA]0 and B1, three regions appear with their own characteristics. [CPA]0 and B1 that are in
Region I Region II should not be used as the cryopreservation conditions due to high probability of IIF
during plunging or during slow cooling respectively. In Region III, the combinations of [CPA]0 and B1
allow the [S]i to reach the [CPA]c, and no IIF is predicted during slow cooling, could be used as
cryopreservation conditions. The optimum set of conditions has been established by minimizing the
duration of ISF and determined to be: a [CPA]0 of 1.2 M DMSO, a B1 of 0.95oC/min and Tp of -35oC. The
thesis warns of the risk that associated with this condition and advises conservative selections. The concept
of the regions and their relevance to cryopreservation could be served as the guideline for designing new
cryopreservation protocols. This thesis also suggests of using thinner containers, or material with higher
heat transfer properties so that higher slow cooling rate and lower [CPA]0 could be utilized to enhance
cryosurvival.
In oocyte cryopreservation, typical vitrification procedure requires high concentrations of
cryoprotectants that are often detrimental to cells, causing lethal osmotic injury. To systematically
investigate effects of osmotic stress, one novel model was proposed to calculate the accumulative osmotic
damage (AOD) caused by volume excursion. Basically, AOD is an integration of the relative volume
excursion of the oocyte over the whole duration of the procedure. It incorporates both magnitude and
duration of volume excursions that are associated with the procedure of cryoprotectant addition and
removal. Using the experimentally determined permeability coefficients, the volume excursions for rabbit
oocytes during the process of CPA addition and dilution in the presence of sucrose were simulated as
conducted during the permeability experiment. The values of AODs associated with these CPA additions
and dilutions were calculated. The AOD values were then used to assess the correlation between the in vitro
development potential of the parthenogenetically activated oocytes and the associated AOD values. The
normalized percentages of blastocyst development after exposure to different CPAs were plotted in relation
79
to the AODs, and they are strongly correlated, indicating that the osmotic damage associated with CPA
addition and removal is accurately described by both a magnitude and duration using an accumulated
osmotic damage model. Future studies are needed to independently test this model to determine if it is more
broadly applicable.
In order to design a novel cryopreservation protocol to overcome problems that are associated with the
cryopreservation of oocytes, the previous theoretical model has been enhanced by integrating the ice
formation kinetics that includes three mechanisms of homogeneous nucleation (HOM), surface-catalyzed
nucleation (SCN), and volume-catalyzed nucleation (VCN). IIF observation was conducted on a
cryomicroscope system to determine the probability of ice nucleation at different temperatures. The ice
formation parameters were determined by fitting the model to these experimental observations for mouse
and bovine oocytes. By integrating theoretical concepts and experimental observations, this model predicts
the likelihood of intracellular ice formation for combinations of DMSO concentrations, holding times, and
holding temperatures in a 3-step freezing design. The calculation results were represented by two novel
plots: the PIIF-Plot showing the PIIF in a percentage scale and corresponding th in th-Plot for each
combination of Tp and C0, over the investigation on the Tp in the range of –20 to –35 oC, and C0 in the range
of 1 M to 4 M. For mouse oocytes, the protocol was established via the theoretical calculation as the
following: to load the cells with 2.5M DMSO, plunge the straw into a cooling bath set to –25 oC after
seeding, hold the straw in this bath for 1700 seconds, and then plunge the straw into liquid nitrogen. The
model was quite accurate in predicting the likelihood of intracellular ice formation, with 3 of the 4
combinations having 95 percent confidence intervals containing the value of the model's prediction. Further
research should be focused on examining the developmental potential of the oocytes preserved by this
approach.
80
CHAPTER 9. LIST OF PUBLICATIONS
1. Glazar AI, Mullen SF, Liu J, Benson JD, Critser JK, Squires EL, et al. Osmotic tolerance limits
and membrane permeability characteristics of stallion spermatozoa treated with cholesterol.
Cryobiology 2009;59(2):201-6.
2. Meng Q, Polgar Z, Liu J, Dinnyes A. Live birth of somatic cell-cloned rabbits following
trichostatin A treatment and cotransfer of parthenogenetic embryos. Cloning Stem Cells
2009;11(1):203-208.
3. Liu J, Mullen S, Meng Q, Critser J, Dinnyes A. Determination of oocyte membrane permeability
coefficients and their application to cryopreservation in a rabbit model. Cryobiology
2009;59(2):127-34.
4. Van den Abbeel E, Schneider U, Liu J, Agca Y, Critser JK, Van Steirteghem A. Osmotic responses
and tolerance limits to changes in external osmolalities, and oolemma permeability characteristics,
of human in vitro matured MII oocytes. Hum Reprod 2007;22(7):1959-72.
5. Dinnyes A, Liu J, Nedambale TL. Novel gamete storage. Reprod Fertil Dev 2007;19(6):719-31.
6. Chaveiro A, Liu J, Engel B, Critser JK, Woelders H. Significant variability among bulls in the
sperm membrane permeability for water and glycerol: possible implications for semen freezing
protocols for individual males. Cryobiology 2006;53(3):349-59.
7. Agca Y, Mullen S, Liu J, Johnson-Ward J, Gould K, Chan A, et al. Osmotic tolerance and
membrane permeability characteristics of rhesus monkey (Macaca mulatta) spermatozoa.
Cryobiology 2005;51(1):1-14.
8. Agca Y, Liu J, Mullen S, Johnson-Ward J, Gould K, Chan A, et al. Chimpanzee (Pan troglodytes)
spermatozoa osmotic tolerance and cryoprotectant permeability characteristics. J Androl
2005;26(4):470-7.
9. Chaveiro A, Liu J, Mullen S, Woelders H, Critser JK. Determination of bull sperm membrane
permeability to water and cryoprotectants using a concentration-dependent self-quenching
fluorophore. Cryobiology 2004;48(1):72-80.
10. Woods EJ, Liu J, Pollok K, Hartwell J, Smith FO, Williams DA, et al. A theoretically optimized
method for cord blood stem cell cryopreservation. J Hematother Stem Cell Res 2003;12(3):341-50.
11. Guthrie HD, Liu J, Critser JK. Osmotic tolerance limits and effects of cryoprotectants on motility
of bovine spermatozoa. Biol Reprod 2002;67(6):1811-6.
12. Agca Y, Gilmore J, Byers M, Woods EJ, Liu J, Critser JK. Osmotic characteristics of mouse
spermatozoa in the presence of extenders and sugars. Biol Reprod 2002;67(5):1493-501.
13. Liu J, Christian JA, Critser JK. Canine RBC osmotic tolerance and membrane permeability.
Cryobiology 2002;44(3):258-68.
81
14. Woods EJ, Liu J, Derrow CW, Smith FO, Williams DA, Critser JK. Osmometric and permeability
characteristics of human placental/umbilical cord blood CD34+ cells and their application to
cryopreservation. J Hematother Stem Cell Res 2000;9(2):161-73.
15. Agca Y, Liu J, Critser ES, Critser JK. Fundamental cryobiology of rat immature and mature
oocytes: hydraulic conductivity in the presence of Me(2)SO, Me(2)SO permeability, and their
activation energies. J Exp Zool 2000;286(5):523-33.
16. Agca Y, Liu J, Rutledge JJ, Critser ES, Critser JK. Effect of osmotic stress on the developmental
competence of germinal vesicle and metaphase II stage bovine cumulus oocyte complexes and its
relevance to cryopreservation. Mol Reprod Dev 2000;55(2):212-9.
17. Gilmore JA, Liu J, Woods EJ, Peter AT, Critser JK. Cryoprotective agent and temperature effects
on human sperm membrane permeabilities: convergence of theoretical and empirical approaches
for optimal cryopreservation methods. Hum Reprod 2000;15(2):335-43.
18. Liu J, Woods EJ, Agca Y, Critser ES, Critser JK. Cryobiology of rat embryos II: A theoretical
model for the development of interrupted slow freezing procedures. Biol Reprod 2000;63(5):1303-
12.
19. Pfaff RT, Agca Y, Liu J, Woods EJ, Peter AT, Critser JK. Cryobiology of rat embryos I:
determination of zygote membrane permeability coefficients for water and cryoprotectants, their
activation energies, and the development of improved cryopreservation methods. Biol Reprod
2000;63(5):1294-302.
20. Woods EJ, Liu J, Zieger MA, Lakey JR, Critser JK. Water and cryoprotectant permeability
characteristics of isolated human and canine pancreatic islets. Cell Transplant 1999;8(5):549-59.
21. Agca Y, Liu J, Critser ES, McGrath JJ, Critser JK. Temperature-dependent osmotic behavior of
germinal vesicle and metaphase II stage bovine oocytes in the presence of Me2SO in relationship to
cryobiology. Mol Reprod Dev 1999;53(1):59-67.
22. Zieger MA, Woods EJ, Lakey JR, Liu J, Critser JK. Osmotic tolerance limits of canine pancreatic
islets. Cell Transplant 1999;8(3):277-84.
23. Phelps MJ, Liu J, Benson JD, Willoughby CE, Gilmore JA, Critser JK. Effects of Percoll
separation, cryoprotective agents, and temperature on plasma membrane permeability
characteristics of murine spermatozoa and their relevance to cryopreservation. Biol Reprod
1999;61(4):1031-41.
24. Woods EJ, Liu J, Zieger MA, Lakey JR, Critser JK. The effects of microencapsulation on
pancreatic islet osmotically induced volumetric response. Cell Transplant 1999;8(6):699-708.
25. Woods EJ, Liu J, Gilmore JA, Reid TJ, Gao DY, Critser JK. Determination of human platelet
membrane permeability coefficients using the Kedem-Katchalsky formalism: estimates from two-
vs three-parameter fits. Cryobiology 1999;38(3):200-8.
82
26. Pfaff RT, Liu J, Gao D, Peter AT, Li TK, Critser JK. Water and DMSO membrane permeability
characteristics of in-vivo- and in-vitro-derived and cultured murine oocytes and embryos. Mol Hum
Reprod 1998;4(1):51-9.
27. Woods EJ, Lakey JR, Zieger MA, Liu J, Critser JK. Osmotic responses of isolated canine islets to
novel cryoprotectants. Transplant Proc 1998;30(2):388-9.
28. Agca Y, Liu J, McGrath JJ, Peter AT, Critser ES, Critser JK. Membrane permeability
characteristics of metaphase II mouse oocytes at various temperatures in the presence of Me2SO.
Cryobiology 1998;36(4):287-300.
29. Agca Y, Liu J, Peter AT, Critser ES, Critser JK. Effect of developmental stage on bovine oocyte
plasma membrane water and cryoprotectant permeability characteristics. Mol Reprod Dev
1998;49(4):408-15.
30. Gilmore JA, Liu J, Peter AT, Critser JK. Determination of plasma membrane characteristics of
boar spermatozoa and their relevance to cryopreservation. Biol Reprod 1998;58(1):28-36.
31. Liu J, Zieger MA, Lakey JR, Woods E, Critser JK. Water and DMSO permeability at 22 degrees
C, 5 degrees C, and -3 degrees C for human pancreatic islet cells. Transplant Proc 1997;29(4):1987.
32. Woods EJ, Lakey JR, Zieger MA, Liu J, Nelson D, Critser JK. Permeability characteristics of
microencapsulated pancreatic islets. Transplant Proc 1997;29(4):2148.
33. Woods EJ, Zieger MA, Lakey JR, Liu J, Critser JK. Osmotic characteristics of isolated human and
canine pancreatic islets. Cryobiology 1997;35(2):106-13.
34. Lakey JR, Zieger MA, Woods EJ, Liu J, Critser JK. Hypoosmotic exposure of canine pancreatic
digest as a means to purify islet tissue. Cell Transplant 1997;6(4):423-8.
35. Gilmore JA, Liu J, Gao DY, Critser JK. Determination of optimal cryoprotectants and procedures
for their addition and removal from human spermatozoa. Hum Reprod 1997;12(1):112-8.
36. Liu J, Zieger MA, Lakey JR, Woods EJ, Critser JK. The determination of membrane permeability
coefficients of canine pancreatic islet cells and their application to islet cryopreservation.
Cryobiology 1997;35(1):1-13.
37. Gao DY, Liu J, Liu C, McGann LE, Watson PF, Kleinhans FW, et al. Prevention of osmotic injury
to human spermatozoa during addition and removal of glycerol. Hum Reprod 1995;10(5):1109-22.
38. Gilmore JA, McGann LE, Liu J, Gao DY, Peter AT, Kleinhans FW, et al. Effect of cryoprotectant
solutes on water permeability of human spermatozoa. Biol Reprod 1995;53(5):985-95.
83
CHAPTER 10. REFERENCE
Agca, Y. (2000). Cryopreservation of oocyte and ovarian tissue. Ilar Journal 41, 207-20. Agca, Y., Liu, J., Critser, E. S., and Critser, J. K. (2000a). Fundamental cryobiology of rat immature and
mature oocytes: hydraulic conductivity in the presence of Me(2)SO, Me(2)SO permeability, and their activation energies. Journal of Experimental Zoology 286, 523-33.
Agca, Y., Liu, J., Critser, E. S., McGrath, J. J., and Critser, J. K. (1999). Temperature-dependent osmotic behavior of germinal vesicle and metaphase II stage bovine oocytes in the presence of Me2SO in relationship to cryobiology. Molecular Reproduction & Development 53, 59-67.
Agca, Y., Liu, J., McGrath, J. J., Peter, A. T., Critser, E. S., and Critser, J. K. (1998a). Membrane permeability characteristics of metaphase II mouse oocytes at various temperatures in the presence of Me2SO. Cryobiology 36, 287-300.
Agca, Y., Liu, J., Peter, A. T., Critser, E. S., and Critser, J. K. (1998b). Effect of developmental stage on bovine oocyte plasma membrane water and cryoprotectant permeability characteristics. Molecular Reproduction & Development 49, 408-15.
Agca, Y., Liu, J., Rutledge, J. J., Critser, E. S., and Critser, J. K. (2000b). Effect of osmotic stress on the developmental competence of germinal vesicle and metaphase II stage bovine cumulus oocyte complexes and its relevance to cryopreservation. Molecular Reproduction & Development 55, 212-9.
Aigner, S., Van der Elst, J., Siebzehnrubl, E., Wildt, L., Lang, N., and Van Steirteghem, A. C. (1992). The influence of slow and ultra-rapid freezing on the organization of the meiotic spindle of the mouse oocyte. Human Reproduction 7, 857-64.
Al-Hasani, S., Diedrich, K., van der Ven, H., Reinecke, A., Hartje, M., and Krebs, D. (1987). Cryopreservation of human oocytes. Human Reproduction 2, 695-700.
Aman, R. R., and Parks, J. E. (1994). Effects of cooling and rewarming on the meiotic spindle and chromosomes of in vitro-matured bovine oocytes. Biol Reprod 50, 103-10.
Andersen, A. N., Gianaroli, L., Felberbaum, R., de Mouzon, J., and Nygren, K. G. (2006). Assisted reproductive technology in Europe, 2002. Results generated from European registers by ESHRE. Hum Reprod 21, 1680-97.
Arav, A., Shehu, D., and Mattioli, M. (1993). Osmotic and cytotoxic study of vitrification of immature bovine oocytes. Journal of Reproduction & Fertility 99, 353-8.
Arav, A., Zeron, Y., Leslie, S. B., Behboodi, E., Anderson, G. B., and Crowe, J. H. (1996). Phase transition temperature and chilling sensitivity of bovine oocytes. Cryobiology 33, 589-99.
Asada, M., Ishibashi, S., Ikumi, S., and Fukui, Y. (2002). Effect of polyvinyl alcohol (PVA) concentration during vitrification of in vitro matured bovine oocytes. Theriogenology 58, 1199-208.
Benagiano, G., and Gianaroli, L. (2004). The new Italian IVF legislation. Reprod Biomed Online 9, 117-25. Bernard, A., and Fuller, B. J. (1996). Cryopreservation of human oocytes: a review of current problems and
perspectives. Human Reproduction Update 2, 193-207. Betteridge, K. J. (1981). An historical look at embryo transfer. J Reprod Fertil 62, 1-13. Borini, A., Sciajno, R., Bianchi, V., Sereni, E., Flamigni, C., and Coticchio, G. (2006). Clinical outcome of
oocyte cryopreservation after slow cooling with a protocol utilizing a high sucrose concentration. Hum Reprod 21, 512-7.
Bos-Mikich, A., Wood, M. J., Candy, C. J., and Whittingham, D. G. (1995). Cytogenetical analysis and developmental potential of vitrified mouse oocytes. Biology of Reproduction 53, 780-5.
Cetin, Y., and Bastan, A. (2006). Cryopreservation of immature bovine oocytes by vitrification in straws. Anim Reprod Sci 92, 29-36.
Chang, M. C. (1948). Transplantation of fertilized rabbit ova: the effect on viability of age, in vitro storage period, and storage temperature. Nature 161, 978.
Chang, M. C. (1959). Fertilization of rabbit ova in vitro. Nature 184(Suppl 7), 466-7. Chang, M. C., Casas, J. H., and Hunt, D. M. (1970). Prevention of pregnancy in the rabbit by subcutaneous
implantation of silastic tube containing oestrogen. Nature 226, 1262-3. Chen, C. (1986). Pregnancy after human oocyte cryopreservation. Lancet 1, 884-6.
84
Chen, C. (1988). Pregnancies after human oocyte cryopreservation. Annals of the New York Academy of Sciences 541, 541-9.
Chian, R. C., Kuwayama, M., Tan, L., Tan, J., Kato, O., and Nagai, T. (2004). High survival rate of bovine oocytes matured in vitro following vitrification. J Reprod Dev 50, 685-96.
Coticchio, G., Bonu, M., Borini, A., and Flamigni, C. (2004). Oocyte cryopreservation: a biological perspective. Eur J Obstet Gynecol Reprod Biol 1, S2-7.
Coticchio, G., Bonu, M. A., Sciajno, R., Sereni, E., Bianchi, V., and Borini, A. (2007). Truths and myths of oocyte sensitivity to controlled rate freezing. Reprod Biomed Online 15, 24-30.
Critser, J. K., Agca, Y., and Gunasena, K. T. (1997). The Cryobiology of Mammalian Oocytes. In "Reproductive Tissue Banking, Scientific Principles" (A. M. Karow and J. K. Critser, eds.), pp. 329-357. Academic Press, San Diego.
Critser, J. K., and Russell, R. J. (2000). Genome resource banking of laboratory animal models. Ilar Journal 41, 183-6.
Day, B. N. (2000). Reproductive biotechnologies: current status in porcine reproduction. Animal Reproduction Science 60-61, 161-72.
de Melo-Martin, I., and Cholst, I. N. (2007). Researching human oocyte cryopreservation: ethical issues. Fertil Steril.
De Santis, L., Coticchio, G., Paynter, S., Albertini, D., Hutt, K., Cino, I., Iaccarino, M., Gambardella, A., Flamigni, C., and Borini, A. (2007). Permeability of human oocytes to ethylene glycol and their survival and spindle configurations after slow cooling cryopreservation. Hum Reprod 22, 2776-83.
Diedrich, K., Al-Hasani, S., Van der Ven, H., and Krebs, D. (1987). Successful in vitro fertilizationof frozen-thawed rabbit and human oocytes. Proceedings of the 5th world congress on IVF and ET, 652-70.
Diller, K. R. (1982). Quantitative low temperature optical microscopy of biological systems. J Microsc 126, 9-28.
Dinnyes, A., Dai, Y., Jiang, S., and Yang, X. (2000). High developmental rates of vitrified bovine oocytes following parthenogenetic activation, in vitro fertilization, and somatic cell nuclear transfer. Biology of Reproduction 63, 513-8.
Dinnyes, A., Liu, J., and Nedambale, T. L. (2007). Novel gamete storage. Reprod Fertil Dev 19, 719-31. Fabbri, R. (2006). Cryopreservation of human oocytes and ovarian tissue. Cell Tissue Bank 7, 113-22. Fabbri, R., Porcu, E., Marsella, T., Rocchetta, G., Venturoli, S., and Flamigni, C. (2001). Human oocyte
cryopreservation: new perspectives regarding oocyte survival. Human Reproduction 16, 411-6. Fahy, G. M. (1981). Simplified calculation of cell water content during freezing and thawing in nonideal
solutions of cryoprotective agents and its possible application to the study of "solution effects" injury. Cryobiology 18, 473-82.
Fahy, G. M. (1986a). The relevance of cryoprotectant "toxicity" to cryobiology. Cryobiology 23, 1-13. Fahy, G. M. (1986b). Vitrification: a new approach to organ cryopreservation. Progress in Clinical &
Biological Research 224, 305-35. Fahy, G. M., MacFarlane, D. R., Angell, C. A., and Meryman, H. T. (1984). Vitrification as an approach to
cryopreservation. Cryobiology 21, 407-26. Friedler, S., Giudice, L. C., and Lamb, E. J. (1988). Cryopreservation of embryos and ova. Fertility &
Sterility 49, 743-64. Fuku, E., Kojima, T., Shioya, Y., Marcus, G. J., and Downey, B. R. (1992). In vitro fertilization and
development of frozen-thawed bovine oocytes. Cryobiology 29, 485-92. Fuku, E. J., Liu, J., and Downey, B. R. (1995). In vitro viability and ultrastructural changes in bovine
oocytes treated with a vitrification solution. Mol Reprod Dev 40, 177-85. Fuller, B., Hunter, J. E., Bernard, A. G., McGrath, J. J., Curtis, P., and Jackson, A. (1992). The permeability
of unfertilized oocytes to 1,2-propanediol A comparison of mouse and human cells. Cryo-Letters 13, 287-92.
Gao, D. Y., Liu, J., Liu, C., McGann, L. E., Watson, P. F., Kleinhans, F. W., Mazur, P., Critser, E. S., and Critser, J. K. (1995). Prevention of osmotic injury to human spermatozoa during addition and removal of glycerol. Human Reproduction 10, 1109-22.
85
Gao, D. Y., McGrath, J. J., Tao, J., Benson, C. T., Critser, E. S., and Critser, J. K. (1994). Membrane transport properties of mammalian oocytes: a micropipette perfusion technique. J Reprod Fertil 102, 385-92.
Glenister, P. H., Whittingham, D. G., and Wood, M. J. (1990). Genome cryopreservation: a valuable contribution to mammalian genetic research. Genetical Research 56, 253-8.
Gook, D. A., and Edgar, D. H. (2007). Human oocyte cryopreservation. Hum Reprod Update 13, 591-605. Heape, W. (1891). Preliminary note on the transplantation and growth of mammalian ova within a uterine
foster-mother. Proc. R. Soc. 48, 457-8. Hirabayashi, M., Takahashi, R., Sekiguchi, J., and Ueda, M. (1997). Viability of transgenic rat embryos
after freezing and thawing. Experimental Animals 46, 111-5. Hotamisligil, S., Toner, M., and Powers, R. D. (1996). Changes in membrane integrity, cytoskeletal
structure, and developmental potential of murine oocytes after vitrification in ethylene glycol. Biology of Reproduction 55, 161-8.
Huang, J. H. Y., Chen, H. Y., Tan, S. L., and Chain, R. C. (2006). Effects of osmotic stress and cryoprotectant toxicity on mouse oocyte fertilization and subsequent embryonic development in vitro. Cell Preserv Technol 4, 149-160.
Hunter, J., Bernard, A., Fuller, B., McGrath, J., and Shaw, R. W. (1992a). Plasma membrane water permeabilities of human oocytes: the temperature dependence of water movement in individual cells. Journal of Cellular Physiology 150, 175-9.
Hunter, J. E., Bernard, A., Fuller, B., Amso, N., and Shaw, R. W. (1991). Fertilization and development of the human oocyte following exposure to cryoprotectants, low temperatures and cryopreservation: a comparison of two techniques. Human Reproduction 6, 1460-5.
Hunter, J. E., Bernard, A., Fuller, B. J., McGrath, J. J., and Shaw, R. W. (1992b). Measurements of the membrane water permeability (Lp) and its temperature dependence (activation energy) in human fresh and failed-to-fertilize oocytes and mouse oocyte. Cryobiology 29, 240-9.
Isachenko, E. F., and Nayudu, P. L. (1999). Vitrification of mouse germinal vesicle oocytes: effect of treatment temperature and egg yolk on chromatin and spindle normality and cumulus integrity. Human Reproduction 14, 400-8.
Karlsson, J. O., Cravalho, E. G., Borel Rinkes, I. H., Tompkins, R. G., Yarmush, M. L., and Toner, M. (1993). Nucleation and growth of ice crystals inside cultured hepatocytes during freezing in the presence of dimethyl sulfoxide. Biophys J 65, 2524-36.
Karlsson, J. O., Cravalho, E. G., and Toner, M. (1994). A model of diffusion-limited ice growth inside biological cells during freezing. Journal of Applied Physiology 75, 4442-4450.
Karlsson, J. O., Eroglu, A., Toth, T. L., Cravalho, E. G., and Toner, M. (1996). Fertilization and development of mouse oocytes cryopreserved using a theoretically optimized protocol. Human Reproduction 11, 1296-305.
Karlsson, J. O. M., and Toner, M. (2000). "Cryopreservation," Academic Press, San Diego, CA. Karow, A. M. (1997). Implications of Tissue Banking for Human Reproductive Medicine. In "Reproductive
Tissue Banking, Scientific Principles" (A. M. Karow and J. K. Critser, eds.), pp. 441-464. Academic Press, San Diego.
Katkov, II, Katkova, N., Critser, J. K., and Mazur, P. (1998). Mouse spermatozoa in high concentrations of glycerol: chemical toxicity vs osmotic shock at normal and reduced oxygen concentrations. Cryobiology 37, 325-38.
Kedem, O., and Katchalsky, A. (1958). Thermodynamic analysis of the permeability of biological membranes to non-electrolytes. Biochimica et Biophysica Acta 27, 229-246.
Kola, I., Kirby, C., Shaw, J., Davey, A., and Trounson, A. (1988). Vitrification of mouse oocytes results in aneuploid zygotes and malformed fetuses. Teratology 38, 467-74.
Kuwayama, M. (2007). Highly efficient vitrification for cryopreservation of human oocytes and embryos: The Cryotop method. Theriogenology 67, 73-80.
Kuwayama, M., Vajta, G., Kato, O., and Leibo, S. P. (2005). Highly efficient vitrification method for cryopreservation of human oocytes. Reprod Biomed Online 11, 300-8.
Landa, V. (1990). "Two-step" freezing of individual blastomeres from mouse eight-cell embryos. Folia Biologica 36, 51-6.
86
Lane, M., Schoolcraft, W. B., and Gardner, D. K. (1999). Vitrification of mouse and human blastocysts using a novel cryoloop container-less technique. Fertility & Sterility 72, 1073-8.
Leibo, S. P. (2007). Cryopreservation of oocytes and embryos: Optimization by theoretical versus empirical analysis. Theriogenology.
Leibo, S. P., DeMayo, F. J., and O'Malley, B. (1991). Production of transgenic mice from cryopreserved fertilized ova. Molecular Reproduction & Development 30, 313-9.
Leibo, S. P., Mazur, P., and Jackowski, S. C. (1974). Factors affecting survival of mouse embryos during freezing and thawing. Exp Cell Res 89, 79-88.
Leibo, S. P., and Songsasen, N. (2002). Cryopreservation of gametes and embryos of non-domestic species. Theriogenology 57, 303-26.
Levi Setti, P. E., Albani, E., Novara, P. V., Cesana, A., and Morreale, G. (2006). Cryopreservation of supernumerary oocytes in IVF/ICSI cycles. Hum Reprod 21, 370-5.
Levin, R. L., Cravalho, E. G., and Huggins, C. E. (1976). A membrane model describing the effect of temperature on the water conductivity of erythrocyte membranes at subzero temperatures. Cryobiology 13, 415-29.
Levin, R. L., and Miller, T. W. (1981). An optimum method for the introduction or removal of permeable cryoprotectants: isolated cells. Cryobiology 18, 32-48.
Lim, J. M., Fukui, Y., and Ono, H. (1992). The post-thaw developmental competence of bovine oocytes frozen at various maturation stages followed by in vitro maturation and fertilization. Theriogenology 37, 351-61.
Liu, J., Woods, E. J., Agca, Y., Critser, E. S., and Critser, J. K. (2000). Cryobiology of rat embryos II: A theoretical model for the development of interrupted slow freezing procedures. Biology of Reproduction 63, 1303-12.
Liu, J., Zieger, M. A., Lakey, J. R., Woods, E. J., and Critser, J. K. (1997). The determination of membrane permeability coefficients of canine pancreatic islet cells and their application to islet cryopreservation. Cryobiology 35, 1-13.
Liu, R. H., Sun, Q. Y., Li, Y. H., Jiao, L. H., and Wang, W. H. (2003). Effects of cooling on meiotic spindle structure and chromosome alignment within in vitro matured porcine oocytes. Mol Reprod Dev 65, 212-8.
Lopez-Bejar, M., Lopez-Gatius, F., Camon, J., Rutllant, J., and Labernia, J. (1994). Development in vitro of rabbit embryos after freezing by two-step or ultra-rapid cooling methods. Zentralblatt fur Veterinarmedizin - Reihe A 41, 780-90.
Marina, F., and Marina, S. (2003). Comments on oocyte cryopreservation. Reproductive Biomedicine Online 6, 401-2.
Martino, A., Pollard, J. W., and Leibo, S. P. (1996a). Effect of chilling bovine oocytes on their developmental competence. Molecular Reproduction & Development 45, 503-12.
Martino, A., Songsasen, N., and Leibo, S. P. (1996b). Development into blastocysts of bovine oocytes cryopreserved by ultra-rapid cooling. Biology of Reproduction 54, 1059-69.
Mazur, P. (1963). Kinetics of water loss from cells at subzero temperatures and the likelihood of intracellular freezing. Journal of General Physiology 47, 47-69.
Mazur, P. (1966). Theoretical and experimental effects of cooling and warming velocity on the survival of frozen and thawed cells. Cryobiology 2, 181-92.
Mazur, P. (1977). The role of intracellular freezing in the death of cells cooled at supraoptimal rates. Cryobiology 14, 251-72.
Mazur, P. (1984). Freezing of living cells: mechanisms and implications. Am J Physiol 247, C125-42. Mazur, P. (1990). Equilibrium, quasi-equilibrium, and nonequilibrium freezing of mammalian embryos.
Cell Biophysics 17, 53-92. Mazur, P. (2004). Principles of Cryobiology. In "Life in the Frozen State" (B. J. Fuller, N. Lane and E. E.
Benson, eds.), pp. 3-65. CRC Press, Boca Raton. Mazur, P., Rall, W. F., and Leibo, S. P. (1984). Kinetics of water loss and the likelihood of intracellular
freezing in mouse ova. Influence of the method of calculating the temperature dependence of water permeability. Cell Biophysics 6, 197-213.
Mazur, P., and Schneider, U. (1986). Osmotic responses of preimplantation mouse and bovine embryos and their cryobiological implications. Cell Biophys 8, 259-85.
87
McGann, L. E., and Farrant, J. (1976). Survival of tissue culture cells frozen by a two-step procedure to -196 degrees C. I. Holding temperature and time. Cryobiology 13, 261-8.
McWilliams, R. B., Gibbons, W. E., and Leibo, S. P. (1995). Osmotic and physiological responses of mouse zygotes and human oocytes to mono- and disaccharides. Human Reproduction 10, 1163-71.
Meryman, H. T. (2007). Cryopreservation of living cells: principles and practice. Transfusion 47, 935-45. Michelmann, H. W., and Nayudu, P. (2006). Cryopreservation of human embryos. Cell Tissue Bank 7, 135-
41. Mortimer, D. (2004). Current and future concepts and practices in human sperm cryobanking. Reprod
Biomed Online 9, 134-51. Muldrew, K., and McGann, L. E. (1990). Mechanisms of intracellular ice formation. Biophysical Journal
57, 525-32. Muldrew, K., and McGann, L. E. (1994). The osmotic rupture hypothesis of intracellular freezing injury.
Biophysical Journal 66, 532-41. Mullen, S. F. (2007). Advances in the fundamental cryobiology of mammalian oocytes, University of
Missouri, Columbia. Mullen, S. F., Rosenbaum, M., and Critser, J. K. (2007). The effect of osmotic stress on the cell volume,
metaphase II spindle and developmental potential of in vitro matured porcine oocytes. Cryobiology 54, 281-9.
Nakagata, N. (1989). High survival rate of unfertilized mouse oocytes after vitrification. Journal of Reproduction & Fertility 87, 479-83.
Otoi, T., Yamamoto, K., Koyama, N., Tachikawa, S., and Suzuki, T. (1998). Cryopreservation of mature bovine oocytes by vitrification in straws. Cryobiology 37, 77-85.
Papis, K., Shimizu, M., and Izaike, Y. (2000). Factors affecting the survivability of bovine oocytes vitrified in droplets. Theriogenology 54, 651-8.
Parkening, T. A., Tsunoda, Y., and Chang, M. C. (1976). Effects of various low temperatures, cryoprotective agents and cooling rates on the survival, fertilizability and development of frozen-thawed mouse eggs. J Exp Zool 197, 369-74.
Paynter, S. J., Cooper, A., Gregory, L., Fuller, B. J., and Shaw, R. W. (1999). Permeability characteristics of human oocytes in the presence of the cryoprotectant dimethylsulphoxide. Human Reproduction 14, 2338-42.
Pegg, D. E. (1986). Equations for obtaining melting points and eutectic temperatures for the ternary system dimethylsulphoxide/sodium chloride/water. Cryo-Letters 7, 387-394.
Pegg, D. E., and Diaper, M. P. (1988). On the mechanism of injury to slowly frozen erythrocytes. Biophys J 54, 471-88.
Pfaff, R. T., Agca, Y., Liu, J., Woods, E. J., Peter, A. T., and Critser, J. K. (2000). Cryobiology of rat embryos I: determination of zygote membrane permeability coefficients for water and cryoprotectants, their activation energies, and the development of improved cryopreservation methods. Biology of Reproduction 63, 1294-302.
Pfaff, R. T., Liu, J., Gao, D., Peter, A. T., Li, T. K., and Critser, J. K. (1998). Water and DMSO membrane permeability characteristics of in-vivo- and in-vitro-derived and cultured murine oocytes and embryos. Molecular Human Reproduction 4, 51-9.
Pickering, S. J., Braude, P. R., Johnson, M. H., Cant, A., and Currie, J. (1990). Transient cooling to room temperature can cause irreversible disruption of the meiotic spindle in the human oocyte. Fertil Steril 54, 102-8.
Pincus, G. (1939). The development of fertilized and artificially activated eggs. Journal of Experimental Zoology 82, 85-130.
Pitt, R. E., Chandrasekaran, M., and Parks, J. E. (1992). Performance of a kinetic model for intracellular ice formation based on the extent of supercooling. Cryobiology 29, 359-73.
Porcu, E., Fabbri, R., Seracchioli, R., Ciotti, P. M., Magrini, O., and Flamigni, C. (1997). Birth of a healthy female after intracytoplasmic sperm injection of cryopreserved human oocytes. Fertility & Sterility 68, 724-6.
Presicce, G. A., Jiang, S., Simkin, M., Zhang, L., Looney, C. R., Godke, R. A., and Yang, X. (1997). Age and hormonal dependence of acquisition of oocyte competence for embryogenesis in prepubertal calves. Biol Reprod 56, 386-92.
88
Rall, W. F., and Fahy, G. M. (1985). Ice-free cryopreservation of mouse embryos at -196 degrees C by vitrification. Nature 313, 573-5.
Rall, W. F., Reid, D. S., and Polge, C. (1984). Analysis of slow-warming injury of mouse embryos by cryomicroscopical and physiochemical methods. Cryobiology 21, 106-21.
Rall, W. F., Wood, M. J., Kirby, C., and Whittingham, D. G. (1987). Development of mouse embryos cryopreserved by vitrification. J Reprod Fertil 80, 499-504.
Rapatz, G., and Luyet, B. (1973). The cryopreservation of blood by the method of two-step freezing. Biodynamica 11, 169-79.
Rayos, A. A., Takahashi, Y., Hishinuma, M., and Kanagawa, H. (1994). Quick freezing of unfertilized mouse oocytes using ethylene glycol with sucrose or trehalose. Journal of Reproduction & Fertility 100, 123-9.
Ren, H. S., Wei, Y., Hua, T. C., and Zhang, J. (1994). Theoretical Prediction of Vitrification and Devitrification Tendencies for Cryoprotective Solutions. Cryobiology 31, 47-56.
Rho, G. J., Kim, S., Yoo, J. G., Balasubramanian, S., Lee, H. J., and Choe, S. Y. (2002). Microtubulin configuration and mitochondrial distribution after ultra-rapid cooling of bovine oocytes. Mol Reprod Dev 63, 464-70.
Ruffing, N. A., Steponkus, P. L., Pitt, R. E., and Parks, J. E. (1993). Osmometric behavior, hydraulic conductivity, and incidence of intracellular ice formation in bovine oocytes at different developmental stages. Cryobiology 30, 562-80.
Rutledge, J. J., Monson, R. L., Northey, D. L., and Leibfried-Rutledge, M. L. (1999). Seasonality of cattle embryo production in a temperate region. Theriogenology 51, 330 (Abstract).
Schnorr, J. A., Muasher, S. J., and Jones, H. W., Jr. (2000). Evaluation of the clinical efficacy of embryo cryopreservation. Molecular & Cellular Endocrinology 169, 85-9.
Shaw, P. W., Bernard, A. G., Fuller, B. J., Hunter, J. H., and Shaw, R. W. (1992). Vitrification of mouse oocytes using short cryoprotectant exposure: effects of varying exposure times on survival. Molecular Reproduction & Development 33, 210-4.
Somfai, T., Dinnyes, A., Sage, D., Marosan, M., Carnwath, J. W., Ozawa, M., Kikuchi, K., and Niemann, H. (2006). Development to the blastocyst stage of parthenogenetically activated in vitro matured porcine oocytes after solid surface vitrification (SSV). Theriogenology 66, 415-22.
Songsasen, N., Yu, I. J., Ratterree, M. S., VandeVoort, C. A., and Leibo, S. P. (2002). Effect of chilling on the organization of tubulin and chromosomes in rhesus monkey oocytes. Fertil Steril 77, 818-25.
Stachecki, J. J., and Cohen, J. (2004). An overview of oocyte cryopreservation. Reprod Biomed Online 9, 152-63.
Stachecki, J. J., Cohen, J., and Willadsen, S. M. (1998). Cryopreservation of unfertilized mouse oocytes: the effect of replacing sodium with choline in the freezing medium. Cryobiology 37, 346-54.
Surrey, E. S., and Quinn, P. J. (1990). Successful ultrarapid freezing of unfertilized oocytes. Journal of in Vitro Fertilization & Embryo Transfer 7, 262-6.
Sutton, R. L. (1991). Critical cooling rates to avoid ice crystallization in solutions of cryoprotective agents. J. Chem. Soc. Faraday Trans. 87, 101-105.
Todorow, S. J., Siebzehnrubl, E. R., Spitzer, M., Koch, R., Wildt, L., and Lang, N. (1989). Comparative results on survival of human and animal eggs using different cryoprotectants and freeze-thawing regimens. II. Human. Human Reproduction 4, 812-6.
Toner, M., Cravalho, E. G., and Huggins, C. E. (1990). Thermodynamics and kinetics of intracellular ice formation during freezing of biological cells. Journal of Applied Physiology 69, 1582-1593.
Toner, M., Cravalho, E. G., and Karel, M. (1993). Cellular response of mouse oocytes to freezing stress: prediction of intracellular ice formation. Journal of Biomechanical Engineering 115, 169-74.
Utsumi, K., Hochi, S., and Iritani, A. (1992). Cryoprotective effect of polyols on rat embryos during two-step freezing. Cryobiology 29, 332-41.
Vajta, G., Booth, P. J., Holm, P., Greve, T., and Callesen, H. (1997). Successful vitrification of early stage bovine in vitro produced embryos with the open pulled straw (OPS) method. Cryo-Letters 18, 191-195.
Vajta, G., Holm, P., Kuwayama, M., Booth, P. J., Jacobsen, H., Greve, T., and Callesen, H. (1998). Open Pulled Straw (OPS) vitrification: a new way to reduce cryoinjuries of bovine ova and embryos. Molecular Reproduction & Development 51, 53-8.
89
Vajta, G., and Nagy, Z. P. (2006). Are programmable freezers still needed in the embryo laboratory? Review on vitrification. Reprod Biomed Online 12, 779-96.
Valojerdi, M. R., and Salehnia, M. (2005). Developmental potential and ultrastructural injuries of metaphase II (MII) mouse oocytes after slow freezing or vitrification. J Assist Reprod Genet 22, 119-27.
Van den Abbeel, E., Schneider, U., Liu, J., Agca, Y., Critser, J. K., and Van Steirteghem, A. (2007). Osmotic responses and tolerance limits to changes in external osmolalities, and oolemma permeability characteristics, of human in vitro matured MII oocytes. Hum Reprod, doi: 10.1093/humrep/dem083 In Press
Van den Abbeel, E., Van der Elst, J., and Van Steirteghem, A. C. (1994). The effect of temperature at which slow cooling is terminated and of thawing rate on the survival of one-cell mouse embryos frozen in dimethyl sulfoxide or 1,2-propanediol solutions. Cryobiology 31, 423-33.
Vincent, C., and Johnson, M. H. (1992). Cooling, cryoprotectants, and the cytoskeleton of the mammalian oocyte. Oxford Reviews of Reproductive Biology 14, 73-100.
Watson, P. F., and Holt, W. V. (2001). Germplasm cryopreservation and non-human primates. In "Cryobanking the genetic resource" (P. F. Watson and W. V. Holt, eds.), pp. 407-426. Taylor and Francis, London.
Whittingham, D. G. (1974). Embryo banks in the future of developmental genetics. Genetics 78, 395-402. Whittingham, D. G. (1977). Fertilization in vitro and development to term of unfertilized mouse oocytes
previously stored at --196 degrees C. Journal of Reproduction & Fertility 49, 89-94. Whittingham, D. G., Leibo, S. P., and Mazur, P. (1972). Survival of mouse embryos frozen to -196 degrees
and -269 degrees C. Science 178, 411-4. Whittingham, D. G., Wood, M., Farrant, J., Lee, H., and Halsey, J. A. (1979). Survival of frozen mouse
embryos after rapid thawing from -196 degrees C. J Reprod Fertil 56, 11-21. Wildt, D. E. (2000). Genome resource banking for wildlife research, management, and conservation. Ilar
Journal 41, 228-34. Wilmut, I. (1972). The effect of cooling rate, warming rate, cryoprotective agent and stage of development
on survival of mouse embryos during freezing and thawing. Life Sci II 11, 1071-9. Wood, M. J., Barros, C., Candy, C. J., Carroll, J., Melendez, J., and Whittingham, D. G. (1993). High rates
of survival and fertilization of mouse and hamster oocytes after vitrification in dimethylsulphoxide. Biol Reprod 49, 489-95.
Wood, M. J., and Farrant, J. (1980). Preservation of mouse embryos by two-step freezing. Cryobiology 17, 178-80.
Wu, B., Tong, J., and Leibo, S. P. (1999). Effects of cooling germinal vesicle-stage bovine oocytes on meiotic spindle formation following in vitro maturation. Molecular Reproduction & Development 54, 388-95.
Yoon, T. K., Chung, H. M., Lim, J. M., Han, S. Y., Ko, J. J., and Cha, K. Y. (2000). Pregnancy and delivery of healthy infants developed from vitrified oocytes in a stimulated in vitro fertilization-embryo transfer program. Fertility & Sterility 74, 180-1.
Yoon, T. K., Kim, T. J., Park, S. E., Hong, S. W., Ko, J. J., Chung, H. M., and Cha, K. Y. (2003). Live births after vitrification of oocytes in a stimulated in vitro fertilization-embryo transfer program. Fertil Steril 79, 1323-6.
Zenzes, M. T., Bielecki, R., Casper, R. F., and Leibo, S. P. (2001). Effects of chilling to 0 degrees C on the morphology of meiotic spindles in human metaphase II oocytes. Fertil Steril 75, 769-77.
Zeron, Y., Sklan, D., and Arav, A. (2002). Effect of polyunsaturated fatty acid supplementation on biophysical parameters and chilling sensitivity of ewe oocytes. Mol Reprod Dev 61, 271-8.
90
CHAPTER 11. ACKNOWLEDGEMENTS
The work presented in this dissertation could not have been completed without the assistance and
dedication of numerous individuals. First and foremost, I would like to thank Dr. Andras Dinnyes for all of
his support, kindness, understanding, and patience in relation to both science and life. He gave me the
opportunity to study and work in this great country with a group of wonderful colleagues who provided me
strength, companionship, encouragement, humility, and humor. My staying in Hungary is one of the most
memorable experiences of my life.
I have had the pleasure of working with many most knowledgeable, kindest, and most respectable
people I have ever encountered. Among them, Dr. John Critser has taught me many things, encouraged me
in my pursuit of ideas, supported me in times of need and worry, and provided me with numerous
opportunities; Dr. Yuksel Agca and Dr. Steve Mullen have been great colleagues, mentors, and friends. I
am particularly appreciative of all of those with whom I have worked directly and assisted me with the
work presented here. I will apologize in advance for those who are not directly named. None of this work
could have been completed without the diligence and kindness of these colleagues of the various
institutions of which I have been affiliated.
Finally yet importantly, I would like to express my gratitude to my dear wife, my parents and parents
in law for their nourishment, guidance, encouragement, sacrifice and believing. Especial thanks to my
daughter for being such a wonderful baby in days and nights I spent on this dissertation preparation.