Embed Size (px)
Citation preview
Louisiana State UniversityLSU Digital Commons
LSU Master's Theses Graduate School
2005
Development of non-dairy frozen dessertcontaining soy protein and coconut milkLuciana SolerLouisiana State University and Agricultural and Mechanical College, [email protected]
Follow this and additional works at: https://digitalcommons.lsu.edu/gradschool_theses
Part of the Life Sciences Commons
This Thesis is brought to you for free and open access by the Graduate School at LSU Digital Commons. It has been accepted for inclusion in LSUMaster's Theses by an authorized graduate school editor of LSU Digital Commons. For more information, please contact [email protected].
Recommended CitationSoler, Luciana, "Development of non-dairy frozen dessert containing soy protein and coconut milk" (2005). LSU Master's Theses. 2330.https://digitalcommons.lsu.edu/gradschool_theses/2330
DEVELOPMENT OF NON-DAIRY FROZEN DESSERT CONTAINING SOY PROTEIN AND COCONUT MILK
A Thesis
Submitted to the Graduate Faculty of the Louisiana State University and
Agricultural and Mechanical College in partial fulfillment of the
requirements for the degree of Master of Science
in
The Department of Food Science
by Luciana Soler
B.S., Agricultural Business, Nicholls State University, 2001 December, 2005

ii
DEDICATION
I would like to dedicate this thesis to my parents. There are no words to describe the
love, appreciation and admiration that I have for you guys. You have made me the person who
I am today; you have always believed in me and supported every single one of my actions, and
for that, I am forever grateful. I am truly blessed to have such loving and supportive parents
like you. THANK YOU!
iii
ACKNOWLEDGEMENTS
First of all, I would like to thank God for always giving faith and strength in everything
I do.
I would like to express my immense gratitude to my major professor and advisor, Dr.
Witoon Prinyawiwatkul, for his guidance, patience and understanding throughout the years. I
have thoroughly enjoyed being his student and working with him. I would also like to thank the
members of my committee, Dr. Marlene Janes and Dr. Charles Boeneke, for all their help
during my research. I would like to thank Andres Herrera for all his incredible help during both
studies of my research. I honestly do not think I would have been able to do all this without his
help.
I would also like to thank Senthil Ganesh, Tony and everyone in the Dairy Science
Department for all their help, support and for letting me use their equipment throughout my
research.
I would like to thank my parents, Enrique and Blanca, for all their love and financial
support throughout all my education. To my brother, Alfredo, for always “having my back”
and listening to me when I needed someone to talk, for that I love him and thank him.
To Tommy, my future husband and best friend, I would like to thank him for all his
support and patience throughout this journey. His love and belief in me encourage me to
always do my best, and for that I thank and love him dearly.
I would like to extend my thanks to Karen, Maria, Darryl, Dereck, Jeff, Armen, Ning,
Janette, and everyone else in the Food Science Department for helping and supporting me
throughout my consumer studies and making my experience at LSU an unforgettable one.
iv
TABLE OF CONTENTS DEDICATION............................................................................................................................ ii ACKNOWLEDGEMENTS ..................................................................................................... iii LIST OF TABLES .................................................................................................................... vi LIST OF FIGURES ................................................................................................................ viii ABSTRACT............................................................................................................................... ix CHAPTER 1. INTRODUCTION............................................................................................. 1 CHAPTER 2. LITERATURE REVIEW................................................................................. 3
2.1 Introduction...................................................................................................................... 3 2.2 Ice Cream.......................................................................................................................... 3 2.3 Regulations ....................................................................................................................... 6 2.4 Soy Protein........................................................................................................................ 8 2.5 Coconut Milk.................................................................................................................. 14 2.6 Lactose Intolerance........................................................................................................ 15 2.7 Vegetarianism................................................................................................................. 16
CHAPTER 3. DEVELOPMENT AND CHARACTERIZATION OF CONSUMER SENSORY QUALITY OF A NON-DAIRY FROZEN DESSERT PREPARED WITH COCONUT MILK AND SOY PROTEIN ISOLATE .......................................................... 18
3.1 Introduction.................................................................................................................... 18 3.2 Materials and Methods.................................................................................................. 19
3.2.1 Frozen Dessert Preparation ................................................................................... 19 3.2.2 Consumer Acceptance Test.................................................................................... 22 3.2.3 Statistical Data Analysis ......................................................................................... 23
3.3 Results and Discussion................................................................................................... 26 3.3.1 Demographic Information...................................................................................... 26 3.3.2 Consumer Acceptability ......................................................................................... 26 3.3.3 Acceptability and Purchase Intent ........................................................................ 27 3.3.4 Overall Product Differences................................................................................... 28 3.3.5 Logistic Regression Analysis and Predictive Discriminant Analysis (PDA) for Product Acceptability and Purchase Intent .................................................................. 29 3.3.6 Changes in Probability of Purchase Intent Using the McNemar Test............... 34
3.4 Conclusions..................................................................................................................... 35 CHAPTER 4. DEVELOPMENT AND CHARACTERIZATION OF CONSUMER SENSORY QUALITY OF A NON-DAIRY STRAWBERRY CHEESECAKE FROZEN DESSERT PREPARED WITH COCONUT MILK AND SOY PROTEIN ISOLATE.... 36
4.1 Introduction.................................................................................................................... 36 4.2 Materials and Methods.................................................................................................. 37
v
4.2.1 Non-Dairy Strawberry Cheesecake Frozen Dessert Preparation ...................... 37 4.2.2 Mixture Experimental Design................................................................................ 39 4.2.3 Consumer Acceptance Test.................................................................................... 41 4.2.4 Statistical Data Analysis ......................................................................................... 42
4.2.4.1 Principal Component Analysis ....................................................................... 43 4.3 Results and Discussion................................................................................................... 43
4.3.1 Demographic Information...................................................................................... 43 4.3.2 Product Information............................................................................................... 44 4.3.3 Consumer Acceptability ......................................................................................... 45 4.3.4 Acceptability and Purchase Intent ........................................................................ 46 4.3.5 Overall Product Differences................................................................................... 48 4.3.6 Logistic Regression Analysis and Predictive Discriminant Analysis (PDA) for Product Acceptability and Purchase Intent .................................................................. 49 4.3.7 Changes in Probability of Purchase Intent........................................................... 51 4.3.8 Principal Component Analysis .............................................................................. 53
4.4 Conclusions..................................................................................................................... 55 CHAPTER 5. SUMMARY AND CONCLUSIONS.............................................................. 56 REFERENCES......................................................................................................................... 59 APPENDIX A: STUDY 1 ........................................................................................................ 64
a. Sample Survey.................................................................................................................. 64 b. SAS Code: Logistic and PDA.......................................................................................... 65 c. SAS Code: McNemar....................................................................................................... 67
APPENDIX B: STUDY 2 ........................................................................................................ 69
a. Research Consent Form .................................................................................................. 69 b. Sample Survey.................................................................................................................. 70 c. SAS Code: PCA................................................................................................................ 71 d. SAS Code: Logistic Regression, PDA, ANOVA, MANOVA, DDA............................. 71 e. SAS Code: McNemar Test............................................................................................... 73 f. PCA bi-plot (product attribute) involving Principal Component 2 and Principal Component 3......................................................................................................................... 73
VITA.......................................................................................................................................... 74
vi
LIST OF TABLES
Table 1: Ingredient (%) for Frozen Desserts……………………………………….………….19 Table 2: Comparisons of Purchase Intent Before and After Additional Information Provided to Consumers………………………………………………………………………...23 Table 3: Frequency of Consumer Age………………………………………………………...26 Table 4: Frequency of Consumer Gender……………………………………………………..26 Table 5: Mean Score ± Standard Deviation for Consumer Acceptability for Sensory Attributes and Overall Liking………………………………………………………………….27 Table 6: Positive (Yes) Responses for Product Acceptance and Purchase Intent of Non-Dairy Frozen Dessert Formulations………………………………………………………28 Table 7: Multivariate Statistics and F Approximations……………………………………….29 Table 8: Canonical Structure r’s Describing Differences Between Frozen Desserts (Based on Pooled Within Group Variances)…………………………………………………..29 Table 9: Hit Rate (%) for Product Acceptability and Purchase Intent………………………...30 Table 10: Full Logistic Regression Models for Predicting Acceptability and Purchase Intent…………………………………………………………………………………………...30 Table 11: Prob>�2 and Odds Ratio Estimates for Consumer Acceptance and Purchase Intent (Full Model)……………………………………………………………………………..32 Table 12: Prob>�2 and Odds Ratio Estimates for Consumer Acceptance and Purchase Intent for Vanilla Flavored Non-Dairy Frozen Dessert………………………………………..32 Table 13: Prob>�2 and Odds Ratio Estimates for Consumer Acceptance and Purchase Intent for Peach Flavored Non-Dairy Frozen Dessert…………………………………………33 Table 14: Prob>�2 and Odds Ratio Estimates for Consumer Acceptance and Purchase Intent for Strawberry Cheesecake Flavored Non-Dairy Frozen Dessert………………………33 Table 15: Changes in Probability of Purchase Intent………………………………………….34 Table 16: Nine Formulations for Non-Dairy Strawberry Cheesecake Frozen Desserts………40 Table 17: Frequency of Consumer Age……………………………………………………….44 Table 18: Frequency of Consumer Gender……………………………………………………44
vii
Table 19: Frequency of Consumer Rating (JAR) for Coconut Flavor and Sweetness Intensities…………………………………………………………………………..45 Table 20: Mean Score (Standard Deviation) for Consumer Acceptability for Sensory Attributes and Overall Liking*………………………………………………………………...46 Table 21: Positive (Yes) Responses for Product Acceptability and Purchase Intent of Non-Dairy Strawberry Cheesecake Frozen Dessert Formulations…………………………….47 Table 22: Multivariate Statistics and F Approximations……………………………………...48 Table 23: Canonical Structure r’s Describing Differences Between Frozen Desserts (Based on Pooled Within Group Variances)…………………………………………………...48 Table 24: Full Logistic Regression Models for Predicting Acceptability and Purchase Intent…………………………………………………………………………………………...50 Table 25: Prob>�2 and Odds Ratio Estimates for Consumer Acceptance and Purchase Intent (Full Model)…..…………………………………………………………………………50 Table 26: % Hit Rate for Product Acceptability and Purchase Intent………………………...51 Table 27: Odds Ratio Based on Overall Liking for Purchase Intent (A Single Variable Model)..………………………………………………………………………………………...51 Table 28: Changes in Probability of Purchase Intent using the McNemar Test …...…………52 Table 29: Changes in Probability of Purchase Intent using the McNemar Test………………52
viii
LIST OF FIGURES
Figure 1: Soy Sales Trend from 1992 through 2003………………………………………….10 Figure 2: Process Flow Diagram for Non-Dairy Frozen Desserts…………………………….21 Figure 3: The constrained region in the simplex coordinate system. X1 = soy protein isolate, X2 = water and X3 = coconut milk. Letters within the triangle represent the 9 formulations and correspond to the letters in Table 16…………………………………..40 Figure 4: PCA bi-plot (product attribute) involving Principal Component 1 and Principal Component 2………………………………………………………………………...54 Figure 5: PCA bi-plot (product attribute) involving Principal Component 1 and Principal Component 3…………………………………………………………………….54
ix
ABSTRACT
As consumers have pursued healthier lifestyles in recent years, consumption of soy
foods has risen steadily, encouraged by scientific studies showing health benefits from these
products. There is a large market for ice cream in the United States. However, since ice cream
contains dairy ingredients, a number of Americans are not able to consume it because of
dietary habits due to religious beliefs, lactose intolerance, vegetarianism or other related
ideologies. For years, these groups of consumers have been able to substitute ice cream with
frozen desserts containing soy protein as a substitute for milk protein, but never in the United
States have companies used a mixture of the soy protein with coconut milk in ice cream or
frozen dessert formulations.
A non-dairy frozen dessert containing coconut milk and soy protein (meeting FDA
requirements for health claim) was developed, and two consumer studies were performed to
determine sensory attributes critical to consumer acceptance and purchase intent. In the first
study (n = 109) three formulations were developed: vanilla (A), peach (B) and strawberry
cheesecake (C). Drivers for acceptance and purchase intent were overall liking/flavor/texture,
and overall liking/flavor/sweetness, respectively. Appearance and color were important for
purchase intent for product C, not for A and B. Flavor choices affected purchase intent; flavor
was most critical to purchase intent for product B, not for A. Products A, B, and C had an
original purchase intent of 34%, 44%, and 83%, respectively; these figures (except for product
B) significantly (prob.<0.05) increased after information about health benefit of soy
protein/non-dairy ingredients had been given to consumers.
In study two, nine different formulations of the strawberry cheesecake-flavor desserts
were developed. Consumers (n = 432) evaluated two of the nine formulations for acceptability

x
of consumer sensory attributes. There were significant differences found among the nine
formulations and overall liking, flavor and texture were the attributes responsible for the
differences. Overall liking and flavor were the two most important factors in determining both
consumer acceptance and purchase intent.
1
CHAPTER 1. INTRODUCTION
Ice cream and related frozen desserts are consumed by more than 90% of households in
the United States. According to 2004 U.S. production, ice cream accounts for the largest share
(60%) of the frozen dessert market (International Dairy Foods Association, 2005). Reduced-fat,
light, low-fat and nonfat ice cream account for 28% of the market, followed by frozen yogurt
(4%), water ice (4%), sherbet (3.5%) and other (0.5%). Since ice cream contains dairy
ingredients, a number of Americans are not able to consume it because of dietary habits due to
religious beliefs, lactose intolerance, vegetarianism or other related ideologies. Because of this,
soy-based products have become increasingly popular and gradually moved into the mainstream
market.
Vegetarians and health enthusiasts have known for years that foods rich in soy protein
offer a good alternative to meat, poultry, and other animal-based products. As consumers have
pursued healthier lifestyles in recent years, consumption of soy foods has risen steadily,
encouraged by scientific studies showing health benefits from these products. In October 1999,
the U.S. Food and Drug Administration gave food manufacturers permission to put labels on
products containing at least 6.25 grams of soy protein per serving, indicating that these foods
may help lower heart disease risk. There are many soy-based frozen desserts in the market, but
there is no evidence of a commercial frozen dessert formulated with soy protein isolate and
coconut milk. Because the non-dairy frozen desserts lack the milk-fat, which makes the product
creamier, coconut milk may be added to help reduce the sandiness and iciness that are often
related with soy-based frozen desserts.
2
This thesis research was designed to develop a non-dairy frozen dessert containing soy
protein and coconut milk and to determine the consumer sensory characteristics that determine
product acceptance and purchase intent.
This thesis is divided into five chapters. Chapter one provides a short introduction and
discusses this research’s justification. Chapter two presents a literature review with concepts
related to this thesis work. Chapters three and four are the two consumer studies investigating
consumer attitude towards non-dairy frozen dessert containing soy protein and coconut milk.
Chapter five consists of a brief summary of all findings of this research and possible future work.
A list of all references cited, and the appendices that contain the questionnaires for both
consumer studies, the research consent form, SAS code and other figures are provided. Finally,
the last page of this thesis contains the VITA of the author of this work.
3
CHAPTER 2. LITERATURE REVIEW
2.1 Introduction
Ice cream has long been a favorite of the American consumer. In fact, it ranks second to
cookies as the favorite dessert of Americans. According to the United States Department of
Agriculture (USDA, 2005), the total U.S. production of ice cream and related frozen desserts in
2004 amounted to about 1.6 billion gallons, translating to about 21.5 quarts per person.
Moreover, according to the International Dairy Foods Association, in 2002, the total U.S. sales
of ice cream and frozen desserts reached $20.5 billion. Of that total, $8.1 billion was spent on
products for "at home" consumption, while $12.5 billion was spent on "away from home" frozen
dessert purchases (scoop shops, foodservice and other retail sales outlets). Unfortunately, some
Americans are not able to consume ice cream due to changes in their eating habits or to lactose
intolerance. The product developed for this thesis is catered to these types of consumers
2.2 Ice Cream
Ice cream is a frozen foam that consists of air cells dispersed in an aqueous matrix
(Marshall et al., 2003). The three main structural components of ice cream are air cells, ice
crystals, and fat globules, which have a major influence on the sensory and textural properties of
ice cream. These three main structural components are distributed throughout a continuous
phase of unfrozen solution (serum). The processing of ice cream involves the mixing of the
ingredients, homogenization of the mixture, pasteurization and aging at 4°C before freezing in a
scraped surface heat exchanger and hardening (Berger, 1990). The homogenization of the ice
cream mix ruptures the original fat globules in milk and results in the formation of smaller
globules with new exposed surfaces; these are stabilized by the proteins and the low molecular
4
weight emulsifiers (Augustin and Udabage, 2003). In the vast majority of countries, heat
treatment of ice cream mix, to a level sufficient to destroy vegetative pathogens, is mandatory.
The minimum permitted heat treatment varies from country to country and, in the US, from state
to state (Varnam and Sutherland, 2001). According to the FDA, milk can be pasteurized by a
High-Temperature-Short-Time Treatment (HTST) or by a Low-Temperature-Long-Time
Treatment (LTLT). The HTST treatment uses 72°C (161°F) for 15 seconds, and the LTLT
treatment uses 63°C (145°F) for 30 minutes; for ice cream mix a pasteurization of 71°C (160°F)
for 30 minutes is used. The pasteurization temperature and time used for ice cream mix is a little
higher than that of milk since the consistency of the mixture is thicker than that of milk. These
heat treatments cause the destruction of pathogens in the ice cream mix, give ice cream a longer
shelf life, improve the solubility of ingredients, and melt the milk fat. The application of
different heat treatments can affect the ice cream properties. Pasteurization at lower temperatures
for longer times generally results in the improved solubility of stabilizers and gives ice creams
better melt resistance (Loewenstein and Haddad, 1972a, 1972b).
Following the heat treatment the mix must be cooled. Cooling and aging of the ice cream
mix cause crystallization of the fat. Cooling and aging also promote the displacement of the
proteins, which are adsorbed onto the fat globules during homogenization, by low molecular
weight surfactants in the ice cream mix (Augustin and Udabage, 2003). It has been shown that
decreasing the temperature of an emulsion increases the displacement of proteins from an oil-
water interface by low molecular weight surfactants and further, that the temperature induced
changes in interface composition are dependent on the type of emulsifier used (Krog, 1991). The
mix is held at 4°C for 24 hours. Longer holding periods should be avoided to prevent spoilage by
5
psychrotrophic microorganisms. Cooling the mix to –1 to 2°C in a scraped surface heat
exchanger permits the use of shorter aging periods (Sutherland and Varnam, 2001).
In traditional ice cream manufacturing freezing is a two-stage process. According to
Sutherland and Varnam (2001), in the first stage the temperature is reduced under agitation, air
being incorporated to give an aerated product. The amount of air incorporated, the time the ice
cream mix spends in the freezing barrel, the temperature of the freezer outlet and the dasher
speed all affect the final structure development of an ice cream during the dynamic freezing
process (Augustin and Udabage, 2003). Incorporation of air during freezing leads to an increase
in volume of the mix, so-called the overrun. Overrun may be calculated either by volume or by
weight and is also an important quality determinant. A high overrun ice cream has less flavor, a
drier appearance and a less stiff texture (Sutherland and Varnam, 2001). In most countries ice
cream is sold by volume, so it is economically desirable to have an overrun as high as possible
without adversely affecting the characteristics of the ice cream.
The second stage, which is much slower, involves no incorporation of air and takes place
under quiescent conditions in a hardening room or tunnel. The process is not complete and even
at very low temperatures some water remains unfrozen. The crystallization stage is of major
importance with respect to ice cream quality since the texture is largely determined by the size of
the ice crystals. Faster freezing rates are preferred because at slow freezing rates the crystals
formed are bigger and can be detectable in the mouth. Ice cream should be stored at constant
temperatures since the fluctuations lead to migration and accumulation of water and the
formation of large crystals upon refreezing. A temperature of –20 to –25°C is used for long-term
storage, but higher temperatures of –13 to –18°C are acceptable during transport and short-term
display (Sutherland and Varnam, 2001).
6
The physical, functional and sensory properties of ice cream influence the consumer’s
perception and acceptance of an ice cream. A desirable ice cream has good flavor, body and
texture, color, and melting characteristics and should be of good microbial quality (Rothwell,
1985; Marshall and Arbuckle, 1996). Flavor is one of the more important attributes of ice cream
for the consumer. The pasteurization of the ice cream mix causes loss of volatile flavors and
governs the extent of interactions between components of the mix. Homogenization and freezing
affect the flavor through their effects on the size of the fat globules, which, in turn, governs the
mouthfeel and the flavor-release properties of the ice cream (Lipsch, 1986).
2.3 Regulations
There are specific guidelines set by the Food and Drug Administration (FDA) as to what
can be called ice cream. These guidelines can be found under the Code of Federal Regulations
(21 CFR 135.110, 2003) and contain product description, specifications, required ingredients as
well as optional ingredients. According to the 21 CFR 135.110 (a)(1), ice cream is defined as a
food produced by freezing, while stirring, a pasteurized mix. It contains not less than 1.6 pounds
of total solids to the gallon, and weighs not less than 4.5 pounds to the gallon. It contains not less
than 10 percent milkfat, nor less than 10 percent nonfat milk solids.
Because of these set guidelines the product being developed for this thesis cannot be
called ice cream, given that it does not contain any dairy ingredients. Our new type of product is
to be called “frozen dessert” or “frozen novelty.”
The reference amounts customarily consumed (RACC) per eating occasion are also set by
the FDA and can be found in Table 2 of the 21 CFR 101.12. The FDA calculated the RACC for
ice cream for persons 4 years of age or older to reflect the amount of food customarily consumed
per eating occasion by persons in this population group. This RACC is based on the data set forth
7
in appropriate national food consumption surveys. The RACC for ice cream and frozen novelties
is set at ½ cup (4 oz.).
The 21 CFR (2003) contains specific guidelines for labeling of products. Certain label
statements about the nature of a product are not nutrient content claims unless such statements
are made in a context that would make them an implied claim under 21 CFR 101.13(b)(2). The
following type of label statement is generally not implied nutrient content claim and, as such, is
not subject to the requirements of the nutrient content claim section of the 21 CFR: A claim that
a specific ingredient or food component is absent from a product, provided that the purpose of
such claim is to facilitate avoidance of the substances because of food allergies, food intolerance,
religious beliefs, or dietary practices such as vegetarianism or other non-nutrition related reason,
e.g., “100 percent milk free.”
The FDA also sets guidelines for such things as health claims in food products. By
definition, a health claim means any claim made on the label that expressly or by implication
characterizes the relationship of any substance to a disease or health related condition (21 CFR
101.14(a)(1). Implied claims include those statements, symbols, vignettes, or other forms of
communication that suggest, within the context in which they are presented, that a relationship
exists between the presence or level of a substance in the food and a disease or health-related
condition. The health claim originally targeted for our new product was that for soy protein and
risk of coronary heart disease (CHD). Scientific evidences demonstrate that diets low in saturated
fat and cholesterol may reduce the risk of CHD. Other evidences demonstrate that the addition of
soy protein to a diet that is low in saturated fat and cholesterol may also help reduce the risk of
CHD (21 CFR 101.82(a)(3), 2003). The requirements for a food to be eligible to fall under this
particular health claim are as follow: 1) the food must contain at least 6.25g of soy protein per
8
reference amount customarily consumed of the food product; 2) The food shall meet the nutrient
content requirements for a “low saturated fat” and “low cholesterol” food; and 3) the food shall
meet the nutrient content requirement for a “low fat” food, unless it consists of or is derived from
whole soybeans and contains no fat in addition to the fat, inherently present in the whole
soybeans it contains or from which it is derived (21 CFR 101.82(c)(iii), 2003). The requirements
for foods with “low saturated fat,” “low cholesterol,” and “low fat” can be found in 21 CFR
101.62, 2003. For a food to fall under the “low fat” category, the food must have a RACC greater
than 30g or greater than 2 tablespoons and contains 3g or less of fat per RACC. The term “low
saturated fat” can only be used in foods that contain 1g or less of saturated fatty acids per serving
and not more than 15 percent of calories from saturated fatty acids. And finally, the term “low
cholesterol” can only be used in foods containing 20mg or less of cholesterol per serving and 2g
or less of saturated fatty acids per RACC. So, although all formulations developed for our new
product contain at least 6.25g of soy protein per serving, a health claim cannot be made because
the formulations do not meet the requirements for a “low saturated fat” or “low fat” foods.
2.4 Soy Protein
Soy is a remarkably versatile bean. While it has traditionally been used mostly in Asia, it
is increasingly found in foods throughout the world. Soy is sometimes added to foods like
breads, cereals and meat products, and even used as a meat substitute in products such as burgers
and hotdogs for people who prefer vegetarian foods. Many soyfoods such as tofu, soy sauce, soy
flour and soybean oil can be found in most supermarkets in the United States. Due to its
versatility and health benefits, including high protein and low carbohydrate content, soyfoods
have been gaining popularity in recent years. As companies have looked into developing
soyfoods that appeal to western tastes, advances in processing has allowed for foods to be made
9
from components of soybeans such as soy protein concentrates and isolates. These technology
advances have led to a wide range of second-generation soyfoods that appeal to people across the
United States.
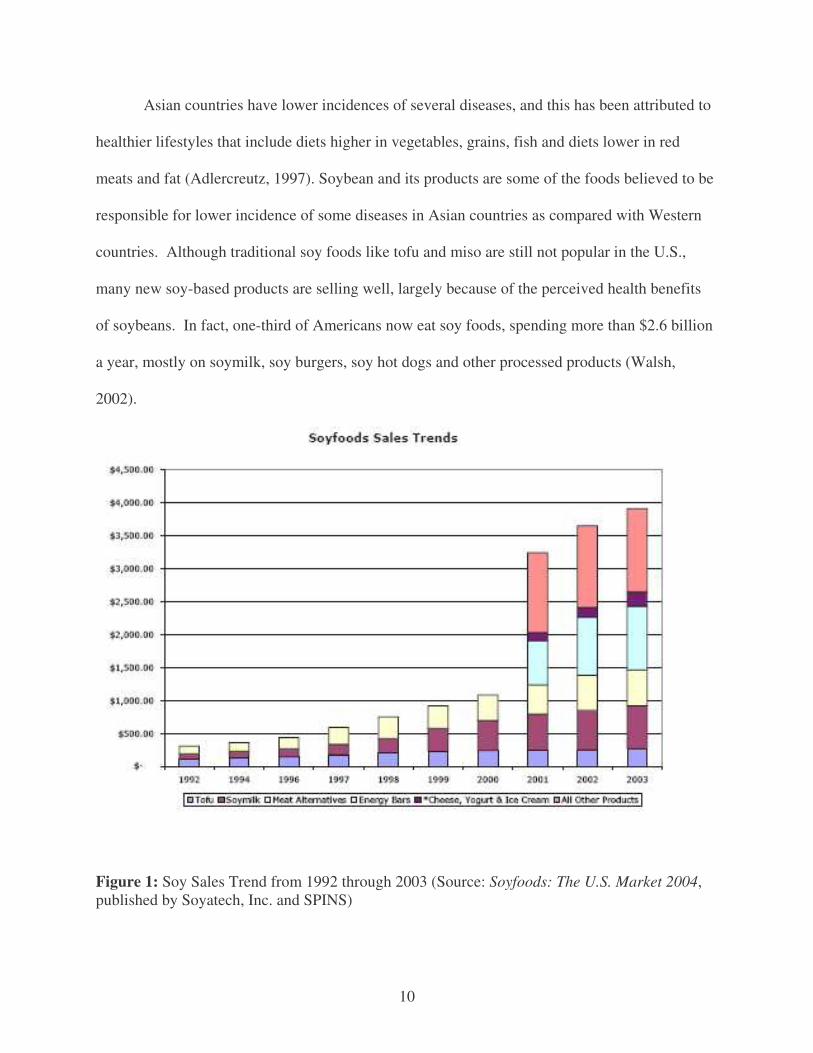
According to the Soyfoods Association of North America, from 1992 to 2003, soyfoods
sales have experienced a 15% compound annual growth rate, increasing from $300 million to
$3.9 billion over 11 years, as new soyfood categories have been introduced, soyfoods have been
repositioned in the market place, and new customers have selected soy for health and
philosophical reasons. Figure 1 illustrates this dramatic increase in sales. Between 2002 and
2003 there was a 7% increase in overall soyfoods sales. Since many consumers have now
incorporated soy into their diets and supermarkets have brought soyfoods to their shelves, new
growth spurts for soy will come with more consumers making a commitment to following
healthier diets and more consensus evidence linking soy with disease prevention.
From 2001 to 2004, food manufacturers in the US introduced over 1,600 new foods with
soy as an ingredient, averaging 400 new products per year. The 1999 FDA approved health claim
for soy and heart health brought many new introductions, leading to 460 new products in 2001,
321 in 2002, 386 in 2003, and 443 in 2004, according to the Mintel’s Global New Products
Database. In 2004, the food categories with the most new soy containing product introductions
were sauces and seasonings (84), followed by processed fish, meat or egg products (81), snacks
(58), and dairy (33). Soy-based energy bars comprise the largest soyfood category (41%),
followed by soy-based dairy alternatives (23%), soy-based meat alternatives (14%), soy-based
cereals (11%), and soy condiments (5%), according to the Mintel, December Soy-based Food
and Drink report.
10
Asian countries have lower incidences of several diseases, and this has been attributed to
healthier lifestyles that include diets higher in vegetables, grains, fish and diets lower in red
meats and fat (Adlercreutz, 1997). Soybean and its products are some of the foods believed to be
responsible for lower incidence of some diseases in Asian countries as compared with Western
countries. Although traditional soy foods like tofu and miso are still not popular in the U.S.,
many new soy-based products are selling well, largely because of the perceived health benefits
of soybeans. In fact, one-third of Americans now eat soy foods, spending more than $2.6 billion
a year, mostly on soymilk, soy burgers, soy hot dogs and other processed products (Walsh,
2002).
Figure 1: Soy Sales Trend from 1992 through 2003 (Source: Soyfoods: The U.S. Market 2004, published by Soyatech, Inc. and SPINS)
11
Researchers still do not know which of several soybean components provide soy’s
important health benefits, but the most studied ones include isoflavones, protease inhibitors,
phytates, phytosterols, saponins, phenolic acids, lecithin and omega-3 fatty acids. Clinical and
animal studies suggest significant putative health benefits of consuming soybeans and
components of soybeans, including soy protein isolate (SPI) (Badger et al., 2004). Isoflavones
are the most widely studied of the soy phytochemicals and are considered major bioactive
constituents associated with SPI. Isoflavones are thought to block human estrogens that may
encourage the growth of hormone-sensitive cancers. The naturally occurring isoflavones in soy
include genistein and daidzien, plus, to a lesser extent, glycitein. The amount of these
isoflavones varies depending on the variety and the growing conditions. Soy foods naturally
contain about two milligrams of isoflavones for every gram of soy protein. Unfortunately,
processed foods rich in soy protein are not always rich in isoflavones, because isoflavones are
often lost during processing. Conversely, isoflavone supplements sold to relieve menopausal
symptoms or as bone supplements, may not contain protein.
Although isoflavones in foods containing SPI are known to be both bioavailable and
bioactive, little is known about other phytochemicals bound to SPI, mainly because standards for
these compounds are not readily available to allow for easy identification and quantitation
(Badger et al., 2004). According to a study by Badger et al (2004) soy saponins are present in
SPI at three times the levels of isoflavones (9.04 vs 2.8mg/g). While these compounds have
been reported to have several bioactivities, including effects on cholesterol reduction, colon
cancer, protection against chemical hepatotoxicity, estrogen actions and cell proliferation, they
are not well-absorbed; thus, their abilities to reach target tissues at biologically relevant levels is
questionable (Rao et al., 2002; Badger et al., 2002; Potter, 1995). However, saponins are present
12
in high concentrations in the gastrointestinal (GI) tract after a soy meal, and thus, they could be
biologically important in GI tract development, GI function/health by interacting with the
endothelial cell lining or through actions on gut microflora, or other physiologic or metabolic
systems by acting indirectly through other mediators.
Heart disease has been the leading cause of death in the United States since 1918.
According to the American Heart Association, 60,800,000 Americans have one or more types of
cardiovascular disease (CVD) and 949,619 lives were lost in 1998 due to this devastating
disease. The National Cholesterol Education Program (NCEP) recommends a multifaceted
lifestyle approach to decrease the risk of heart disease, which includes reducing intakes of
saturated fat to no more than seven percent of total calories and cholesterol to 300 mg/day
maximum. Soyfoods are an excellent choice for a heart healthy diet. Because cholesterol is
found only in animal foods, soybeans contain no cholesterol. Soybeans also provide very high
quality protein, equivalent to animal sources of protein such as meat and milk (McDonough et
al., 1990; Young, 1991). Additionally, soybeans are low in saturated fat. In fact, approximately
85 percent of the fat in soybeans is unsaturated. Most importantly, however, dozens of human
clinical trials have demonstrated that soy consumption can lower both total and low-density
lipoprotein (LDL) cholesterol, better known as the “bad” cholesterol (Carrol, 1991). Because of
soy’s effectiveness in lowering the major blood lipids associated with an increased risk of heart
disease, on October 26, 1999, the FDA approved a health claim for the relationship between the
consumption of soy protein and reduced risk of coronary heart disease (CHD). In addition to the
FDA-approved health claim for soy, the American Heart Association recently issued a statement
for healthcare professionals which recommended including soy protein foods in a diet low in
saturated fat and cholesterol to promote heart health (Erdman, 2000).
13
Much of the early enthusiasm about the health benefits of soy had to do with its potential
role in reducing breast cancer risk (United Soybean Board, 2005). According to the United
Soybean Board (2005), the lower breast cancer mortality rates among soyfood consuming
populations (five to seven fold less than in the U.S.) such as the Japanese, in conjunction with
data showing that weak estrogens can function as antiestrogens, prompted initial speculation that
soy might reduce breast cancer risk. Greater lifelong exposure to estrogen is associated with
increased breast cancer risk; this is why earlier age at menses, later age at menopause and
hormone replacement therapy usage are considered to be risk factors for breast cancer
development (Pike, 2000). Since estrogen increases breast cancer risk, certain antiestrogens such
as the drug tamoxifen, can decrease risk. The first animal study showing that genistein (the main
isoflavone in soybeans) possessed antiestrogenic activity was published in 1966 (Folman, 1966).
During the past ten years, research has identified several different mechanisms by which soy
could exert antiestrogenic effects. These include: 1) competing with estrogen for binding to the
estrogen receptor, 2) down-regulating estrogen receptors, 3) increasing serum levels of sex
hormone binding globulin (SHBG) and 4) favorably altering estrogen metabolism (Anderson et
al., 2000; Duncan et al., 2000). Despite the plethora of possible antiestrogenic mechanisms, the
most excitement over the anticancer effects of soy is based on the ability of genistein to inhibit
the activity of key enzymes and to influence cellular molecules, such as transforming growth
factor beta, that lead to the inhibition of cancer cell growth (Constantinou and Huberman, 1995).
One recent study found that miso acted synergistically with the breast cancer drug
tamoxifen, to inhibit the development of mammary tumors in rats. The study found that the
combination of miso and tamoxifen inhibited the growth of existing mammary tumors, whereas
tamoxifen by itself was ineffective (Dohi et al., 1998). There has been particular interest in
14
research showing that genistein exposure for just a few days very early in life reduces mammary
cancer development later in life by as much as 50 percent (Lamartiniere, 2000).
2.5 Coconut Milk Although oil recovery remains the major concern in the coconut industry, there appears to
be increasing demand for the aqueous extract of the solid endosperm, commonly called coconut
milk, for use in the home and in the food industry. It has been estimated that 25% of the world’s
output of coconut is consumed as coconut milk (Gwee, 1988).
The extraction of coconut milk begins with labor-intensive operations such as shelling
and paring of fully mature coconuts. Paring removes the brown testa, which imparts a brown
color and slight bitter taste to the extracted milk. The coconut flesh or meat is then washed,
drained and grated by machined (Gwee, 1997). According to Cancel (1979), there are several
procedures that have been recommended for the extraction of coconut milk on an industrial or
commercial scale. It primarily involves variations in the amount and temperature of the water
added prior to pressing the grated coconut using a hydraulic or screw press. The milk is then
filtered through a cloth filter or centrifuged at low speed (using a basket centrifuge) to remove
finely comminuted particles of coconut pulp without breaking the emulsion.
It would be expected that the chemical composition of coconut milk would show very
wide variations because of differences in factors such as variety, geographical location, cultural
practices, maturity of the nut, method of extraction, and the degree of dilution with added water
or liquid endosperm (Cancel, 1979). The main carbohydrates present in the coconut milk are
sugars (primarily sucrose) and some starch. The major minerals found in raw coconut milk
appear to be phosphorous, calcium, and potassium. Freshly extracted milk will very likely
contain small amounts of water-soluble B vitamins and ascorbic acid (Gwee, 1997). Based on
15
their solubility characteristics, at least 80% of proteins in coconut endosperm would be classified
as albumins and globulins (Samson et al., 1971; Balachandran and Arumughan, 1992). These
would also be the predominant proteins in coconut milk. The protein content of undiluted milk
ranges from 5 to 10% (on dry basis). Although coconut is high in saturated fat, as saturated fat is
made up of fatty acids known as medium chain triglycerides (MTC’s), coconut fat is smaller than
the standard storage unit and is burned for energy rather than stored as body fat. Approximately
50% of the fatty acids in coconut fat are lauric acid. Lauric acid has been recognized for its
unique properties in food use, which are related to its antiviral, antibacterial, and antiprotozoal
functions. Another one of the coconut’s antimicrobial components is capric acid. This is another
medium chain fatty acid that has a similar benefit to lauric acid. Approximately 6-7% of the
fatty acids in coconut fat are capric acid.
Researchers in the Phillipines have been at the forefront of efforts to develop new dairy
foods using a combination of skim (cow’s) milk and coconut milk (Davide et al., 1990).
Amongst the products developed, flavored filled milk beverages, soft and blue cheeses, and low-
fat fruit yogurt appear to show good commercial potential. Other products that have been
developed over the years include soy/coconut milk, a butter-like product, and a Lactobacillus-
fermented beverage. The addition of certain levels of coconut milk has also been suggested as a
simple, but effective means of increasing the caloric density of tofu without affecting the
acceptability of the product (Escueta et al., 1985).
2.6 Lactose Intolerance An estimated 30% of Americans and approximately 65-75% of people worldwide have
decreased intestinal lactase levels, which may lead to lactose intolerance and difficulty digesting
dairy products (Vesa et al., 2000; Suarez et al., 1998). Lactose malabsorption occurs when
16
lactose, the primary sugar in dairy products, is not completely digested and absorbed in the small
bowel. Lactase, the enzyme required to hydrolyze lactose for intestinal absorption, is found
primarily in tips of the villi in the jejunum (McCray, 2003). If lactase activity is decreased as a
result of primary deficiency, altered anatomy, or an underlying disease process, malabsorption of
lactose may occur. When unabsorbed lactose reaches the colon, colonic bacteria use this
substrate for fermentation, producing gas and short chain fatty acids. The unabsorbed lactose
also affects osmolality, causing water to be drawn into the bowel and accelerating the intestinal
transit time (Vesa et al., 2000). The symptoms of lactose intolerance may include bloating,
diarrhea, flatulence, abdominal pain, distention and cramping. The primary goals for treatment
of lactose intolerance include symptom relief and ensuring adequate nutritional status. Many
patients who wish to continue to consume dairy products can do so by adjusting the type, amount
and timing of intake.
2.7 Vegetarianism
Perceiving plant foods as beneficial because they are high in dietary fiber and, generally,
lower in saturated fat than animal foods, many people turn to vegetarian diets. According to the
latest poll by Baltimore-based Vegetarian Resource Group (VRG), 2.5 percent of Americans are
vegetarians, meaning they do not consume red meat, poultry, or fish. That is an increase of
nearly 1.5 percent since 1997. Asian Americans are among the most likely to be vegetarians, and
8.1 percent of Asian Americans avoid meat. Following Asian Americans come African
Americans at 3.5% and Caucasians follow at a considerable distance at 1.6% (Fetto, 2000).
Women shun meat more than men, with 3.2 percent steering clear of the meats, versus just 1.7
percent of men.
17
Health benefits are not the only reason vegetarian diets attract followers. Certain people,
such as Seventh-Day Adventists, choose a vegetarian diet because of religious beliefs. Others
give up meat because they feel eating animals is unethical. Some believe it is a better use of the
Earth's resources to eat low on the food chain, that is, to eat plants, rather than the animals that
eat the plants. And many people eat plants simply because they are less expensive than meats
(Farley, 1995).
At the other end of the spectrum are vegans, who are people who do not eat red meat,
poultry, fish, dairy products, eggs, or honey. According to Fetto (2000), these consumers account
for only 0.9 percent of the American population, but that number is up as much as 270 percent
from 1997. Vegans are more likely to reside in large cities (1.9 percent) and in the East (1.9
percent).
18
CHAPTER 3. DEVELOPMENT AND CHARACTERIZATION OF CONSUMER SENSORY QUALITY OF A NON-DAIRY FROZEN DESSERT PREPARED WITH COCONUT MILK AND SOY PROTEIN ISOLATE
3.1 Introduction Ice cream has long been a favorite of American consumers. In fact, it ranks second to
cookies as the favorite dessert of Americans. According to the United States Department of
Agriculture (USDA), the total U.S. production of ice cream and related frozen desserts in 2004
amounted to about 1.6 billion gallons, translating to about 21.5 quarts per person.
There are specific guidelines set by the Food and Drug Administration (FDA) as to what
can be called ice cream. According to the CFR, ice cream is defined as a food produced by
freezing, while stirring, a pasteurized mix. It contains not less than 1.6 pounds of total solids to
the gallon, and weighs not less than 4.5 pounds to the gallon. It contains not less than 10 percent
milkfat, nor less than 10 percent nonfat milk solids.
There is a large market for ice cream in the United States. However, since ice cream
contains dairy ingredients, a number of Americans are not able to consume it because of dietary
habits due to religious beliefs, lactose intolerance, vegetarianism or other related ideologies. For
years, these groups of consumers have been able to substitute ice cream with frozen desserts
containing soy protein as a substitute for milk protein, but never in the United States have
companies used a mixture of the soy protein with coconut milk in ice cream or frozen dessert
formulations.
The objectives of this study were to develop a non-dairy frozen dessert prepared with
soy protein and coconut milk and to identify consumer sensory attributes driving consumer
acceptance and purchase intent.
19
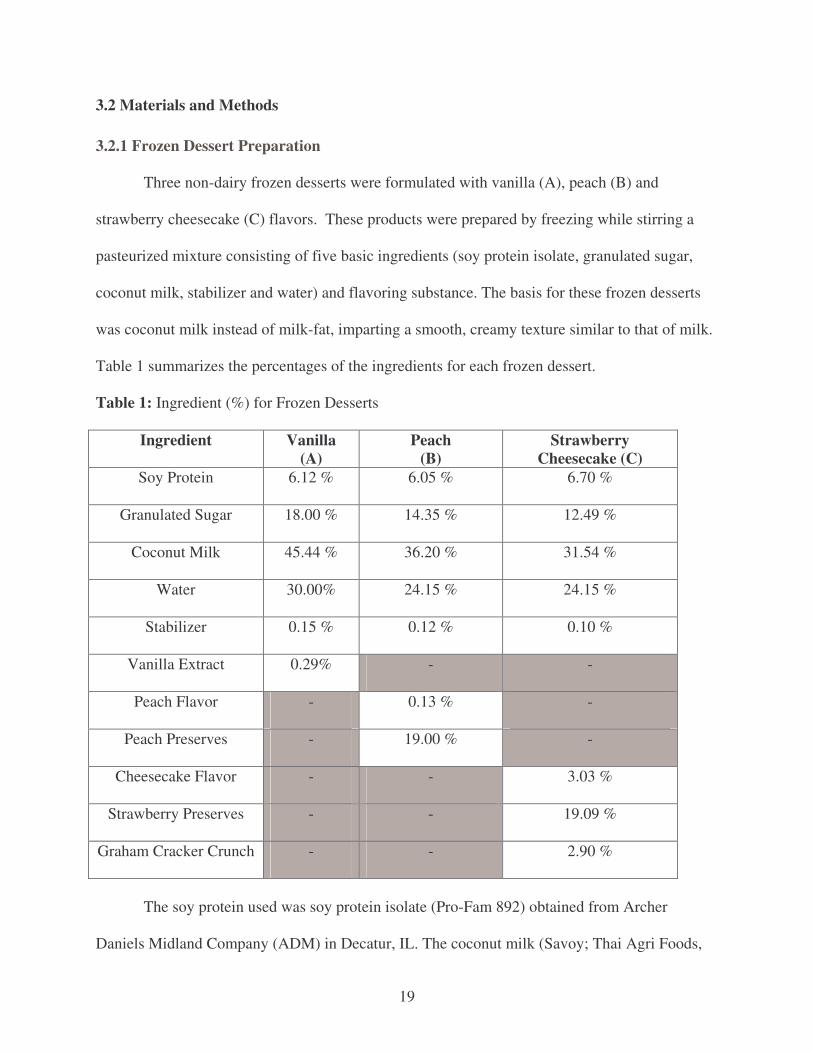
3.2 Materials and Methods
3.2.1 Frozen Dessert Preparation
Three non-dairy frozen desserts were formulated with vanilla (A), peach (B) and
strawberry cheesecake (C) flavors. These products were prepared by freezing while stirring a
pasteurized mixture consisting of five basic ingredients (soy protein isolate, granulated sugar,
coconut milk, stabilizer and water) and flavoring substance. The basis for these frozen desserts
was coconut milk instead of milk-fat, imparting a smooth, creamy texture similar to that of milk.
Table 1 summarizes the percentages of the ingredients for each frozen dessert.
Table 1: Ingredient (%) for Frozen Desserts
Ingredient Vanilla (A)
Peach (B)
Strawberry Cheesecake (C)
Soy Protein 6.12 % 6.05 % 6.70 %
Granulated Sugar 18.00 % 14.35 % 12.49 %
Coconut Milk 45.44 % 36.20 % 31.54 %
Water 30.00% 24.15 % 24.15 %
Stabilizer 0.15 % 0.12 % 0.10 %
Vanilla Extract 0.29% - -
Peach Flavor - 0.13 % -
Peach Preserves - 19.00 % -
Cheesecake Flavor - - 3.03 %
Strawberry Preserves - - 19.09 %
Graham Cracker Crunch - - 2.90 %
The soy protein used was soy protein isolate (Pro-Fam 892) obtained from Archer
Daniels Midland Company (ADM) in Decatur, IL. The coconut milk (Savoy; Thai Agri Foods,
20
Public Co., Ltd., Thailand) was purchased from a local market. Per serving size (0.5 cup) the
coconut milk contained 14g saturated fat, 0g trans fat, and 0mg cholesterol.The vanilla extract
was purchased from R.R. Lochhead Mfg Company in Paso Robles, CA. The PGX-1 stabilizer
was obtained from Danisco USA Company in St. Joseph, MO. The peach background flavor was
purchased from Sensient Flavors Inc, in Amboy, IL. Finally, the cheesecake flavor base,
strawberry preserves, peach preserves, and the graham cracker crunch were obtained from
Dippin’ Flavor in St. Louis, MO.
The first step in making our frozen desserts was measuring of all the ingredients: soy
protein isolate, coconut milk, sugar, stabilizer and water. The coconut milk and water were
placed into a clean container. Then, all the dry ingredients were sifted and mixed together to
avoid clumping of the soy protein isolate, and were then gradually added to the coconut milk and
water mixture while mixing to provide a uniform mixture. The mixture was then transferred into
stainless steel cylinders and put into a water bath and heated until it reached approximately 49°C
(120°F). The mixture was then transferred into the homogenizer (Model 300 DJF 4 2PS,
Manton-Gaulin Mfg. Co. Inc, Everett, MA) operated under pressure of approximately 13,800
Kpa (2000 psi) to ensure there were no clumps and that a homogeneous mixture was obtained.
The mixture was placed back into the stainless steel cylinders and put into a water bath for
pasteurization. For our products a low-temperature long-time pasteurization was done at 71°C
(160°F) for 30 minutes. The pasteurization step was performed to destroy any microorganisms
that may be present in the mixture. After pasteurization the mixture was cooled until it reached
24°C (75°F). After cooling, each flavor underwent a different process (Figure 2) and then placed
into a Model 20LA batch freezer (Emerson Thompson, Machine & Supply Co. in Bronx, NY).
The batch freezer is designed with a dasher that whips and aerates the mixture; that is, as it
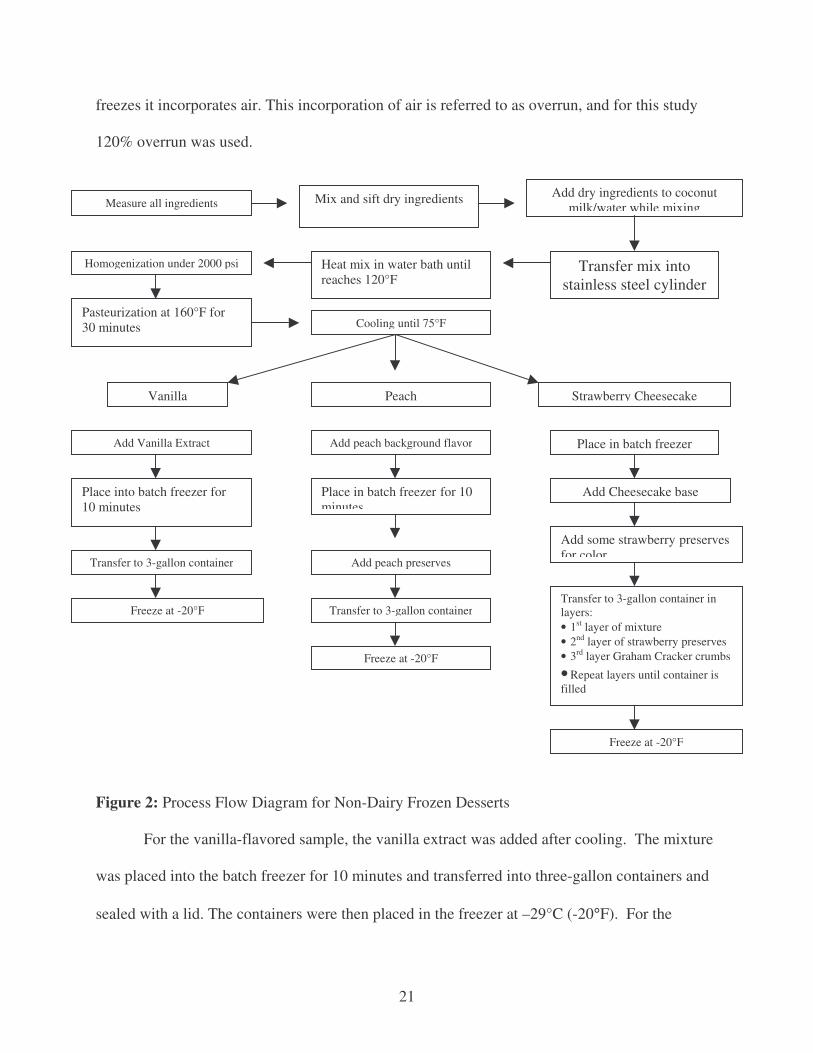
21
freezes it incorporates air. This incorporation of air is referred to as overrun, and for this study
120% overrun was used.
Figure 2: Process Flow Diagram for Non-Dairy Frozen Desserts
For the vanilla-flavored sample, the vanilla extract was added after cooling. The mixture
was placed into the batch freezer for 10 minutes and transferred into three-gallon containers and
sealed with a lid. The containers were then placed in the freezer at –29°C (-20°F). For the
Measure all ingredients Mix and sift dry ingredients Add dry ingredients to coconut milk/water while mixing
Transfer mix into stainless steel cylinder
Heat mix in water bath until reaches 120°F
Homogenization under 2000 psi
Pasteurization at 160°F for 30 minutes Cooling until 75°F
Add Vanilla Extract
Place into batch freezer for 10 minutes
Transfer to 3-gallon container
Freeze at -20°F
Add peach background flavor
Place in batch freezer for 10 minutes
Add peach preserves
Transfer to 3-gallon container
Freeze at -20°F
Place in batch freezer
Add Cheesecake base
Add some strawberry preserves for color
Transfer to 3-gallon container in layers: • 1st layer of mixture • 2nd layer of strawberry preserves • 3rd layer Graham Cracker crumbs
• Repeat layers until container is filled
Freeze at -20°F
Vanilla Peach Strawberry Cheesecake
22
peach-flavored sample, the peach background flavor was added to the mixture after cooling, and
put into the batch freezer. During the batch freezing, a portion of the peach preserves was added
at the beginning, and the rest was added at the end to preserve bigger pieces of peach. After
approximately ten minutes in the batch freezer, the mixture was then transferred into three-gallon
containers, sealed with a lid, and placed in the freezer -29°C (-20°F). For the strawberry
cheesecake-flavored sample, the mixture was placed directly into the batch freezer and the
cheesecake base was added. A small portion of the strawberry preserves was added to the
mixture to give it a slight pink color. After approximately 10 minutes, the mixture was poured
into three-gallon containers in layers until the container was filled. The first layer consisted of
the frozen dessert mixture, followed by a layer of strawberry preserves, and finally with a thin
layer of graham cracker crunch. The layers were slightly swirled. These steps were repeated until
the three-gallon container was full. Once the container was full, it was covered with a lid, and
placed into the freezer at -29°C (-20°F).
3.2.2 Consumer Acceptance Test
One hundred and nine untrained consumers participated in the consumer acceptance test.
The consumers were randomly chosen from the Louisiana State University campus using the
following criteria for recruitment: (1) they were at least 18 years of age, (2) they were not
allergic to soy, coconut, sugar, vanilla, and strawberries, (3) and that they were willing and
available for participation and for the completion of the survey.
Consumers were presented with 3 2-oz samples, which were coded according to the
flavor: sample A (Vanilla), sample B (Peach) and sample C (Strawberry Cheesecake). Each
consumer was also provided with room temperature water and unsalted, plain crackers to cleanse
their palate in between each sample. Consumers were asked to answer demographic questions
23
such as age and gender. Each consumer evaluated each sample for acceptability of appearance,
color, texture, flavor, coconut flavor, sweetness and overall liking using the 9-point hedonic
scale (1= dislike extremely, 5= neither dislike nor like, 9= like extremely). The binomial type
questions (yes/no) were used to evaluate overall product acceptance, purchase intent and
purchase intent after being provided with additional health benefit information about soy protein.
A series of these binomial questions were compared to see changes in purchase intent before and
after additional health information about the products was provided to the consumers. Table 2
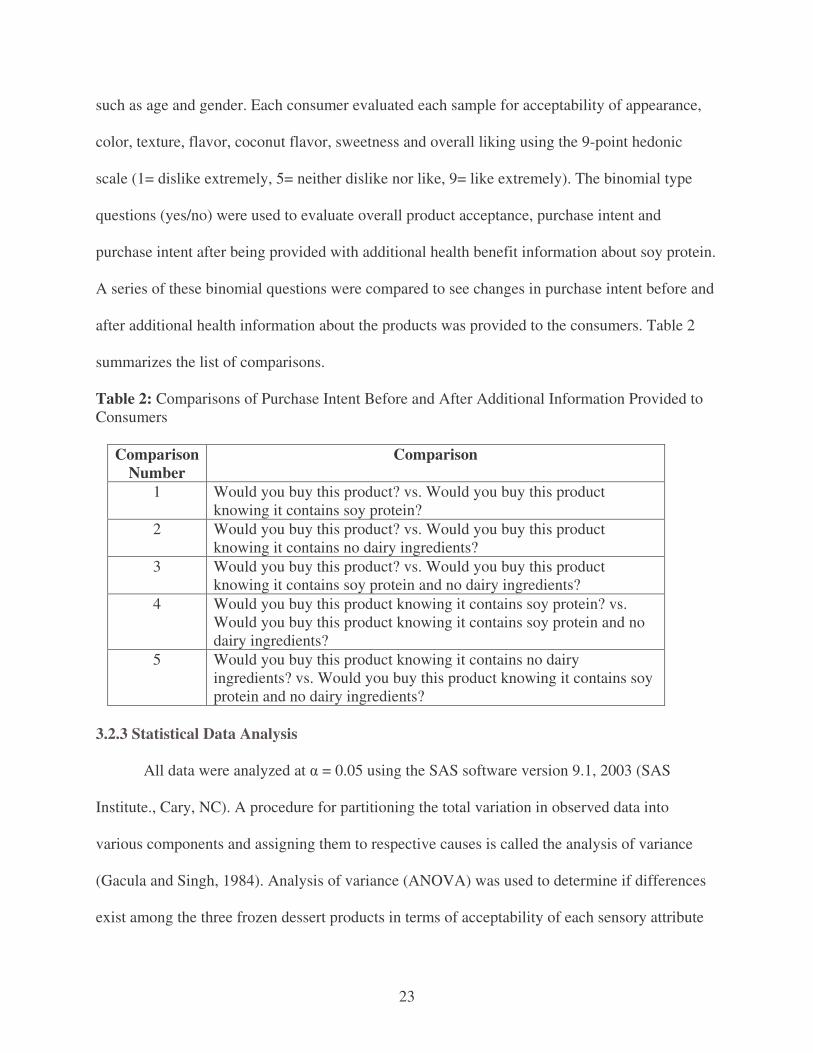
summarizes the list of comparisons.
Table 2: Comparisons of Purchase Intent Before and After Additional Information Provided to Consumers
Comparison Number
Comparison
1 Would you buy this product? vs. Would you buy this product knowing it contains soy protein?
2 Would you buy this product? vs. Would you buy this product knowing it contains no dairy ingredients?
3 Would you buy this product? vs. Would you buy this product knowing it contains soy protein and no dairy ingredients?
4 Would you buy this product knowing it contains soy protein? vs. Would you buy this product knowing it contains soy protein and no dairy ingredients?
5 Would you buy this product knowing it contains no dairy ingredients? vs. Would you buy this product knowing it contains soy protein and no dairy ingredients?
3.2.3 Statistical Data Analysis
All data were analyzed at � = 0.05 using the SAS software version 9.1, 2003 (SAS
Institute., Cary, NC). A procedure for partitioning the total variation in observed data into
various components and assigning them to respective causes is called the analysis of variance
(Gacula and Singh, 1984). Analysis of variance (ANOVA) was used to determine if differences
exist among the three frozen dessert products in terms of acceptability of each sensory attribute
24
as well as overall liking. ANOVA, as a technique for statistical inference requires certain
assumption to be theoretically valid. For theoretical validity of ANOVA in a parametric setup, it
must be assumed that observations follow the normal distribution and that the error terms are
independently distributed with mean zero and common variance �2. The Tukey’s studentized
range test was conducted to locate the differences. The multivariate analysis of variance
(MANOVA) was also used and it is normally performed after ANOVA. MANOVA is used to
reveal whether significant differences exist between treatments when all attributes are compared
simultaneously (Lawless and Heymann, 1998). Descriptive discriminant analysis (DDA) was
used after ANOVA to determine which attributes were responsible for the underlying differences
among the three samples (Huberty, 1994).
Predictive Discriminative Analysis, PDA, (Huberty, 1994) and logistic regression were
performed to identify sensory attributes critical to overall acceptance and purchase intent. PDA
works with classification of products based on several variables simultaneously. It is an analog
of a regression analysis. A fitted set of data to a mathematical function will give an observation
its highest probability of being assigned to the known correct population whereas minimizing the
probability that the same observation will be misclassified (Resurreccion, 1998). The odds ratio
estimate was used to identify critical attributes for acceptability and purchase intent. The odds
are a nonnegative number with a value that is greater than 1.0 when a success is more likely to
occur than a failure (Agresti, 1996).
The McNemar test represents a comparison of dependent proportions for binary response
variables. It is a two-related sample difference test that follows a Chi-square distribution with df
= 1. The McNemar test was used to analyze the change in probability of consumer purchase
25
intent before and after they had been given additional health information about the product in
question. The sample proportion was calculated using the following formula:
Pij = nij/N
Where N = the total number of responses, nij = the number of subjects making response i before
and response j after knowing about product health benefits.
A 95% confidence interval for the difference of proportions was also calculated using the
following formula:
(p+1 – p1+) ± Z�/2 (ASE)
Where (p+1 – p1+) represents the difference in proportions between consumers who answer yes
after given the additional information (p+1) and those who answered yes before given the
additional information (p1+). Z�/2 denotes the standard normal percentile having a right-tail
probability equal to �/2, which in this case equals 1.96. ASE is the estimated standard error for
the proportion difference (estimated variance) and was calculated using the below formula to
follow:
ASE = {[ p1+(1 - p1+) + p+1 (1 - p+1) – 2(p11p22 – p12p21)]/N}1/2
Where p11 = the proportion of consumers who answer yes before and yes after having been given
additional health information about the product, p12 = the proportion of consumers who answer
yes before and no after given additional information, p21 = the proportion of consumers who
answer no before and yes after knowing about health benefits of the product and p22 = the
proportion of consumers who answer no before and no after receiving additional health
information about the product.
26
3.3 Results and Discussion 3.3.1 Demographic Information
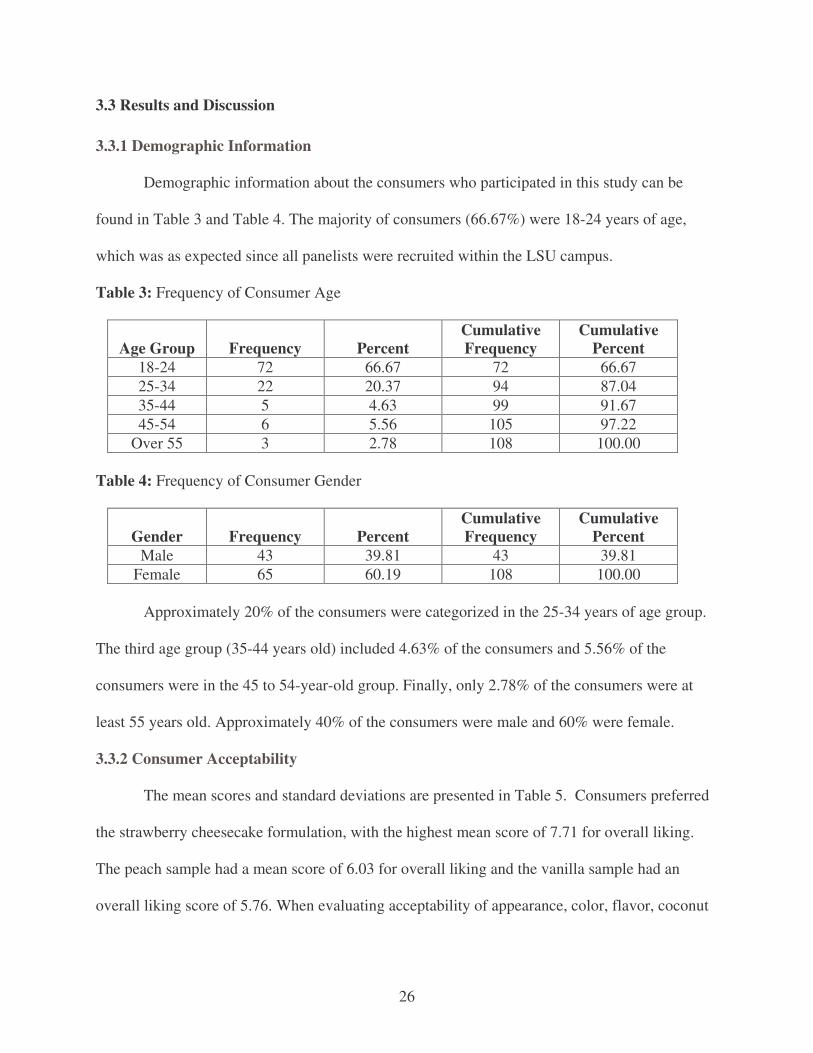
Demographic information about the consumers who participated in this study can be
found in Table 3 and Table 4. The majority of consumers (66.67%) were 18-24 years of age,
which was as expected since all panelists were recruited within the LSU campus.
Table 3: Frequency of Consumer Age
Age Group Frequency Percent Cumulative Frequency
Cumulative Percent
18-24 72 66.67 72 66.67 25-34 22 20.37 94 87.04 35-44 5 4.63 99 91.67 45-54 6 5.56 105 97.22
Over 55 3 2.78 108 100.00 Table 4: Frequency of Consumer Gender
Gender Frequency Percent Cumulative Frequency
Cumulative Percent
Male 43 39.81 43 39.81 Female 65 60.19 108 100.00
Approximately 20% of the consumers were categorized in the 25-34 years of age group.
The third age group (35-44 years old) included 4.63% of the consumers and 5.56% of the
consumers were in the 45 to 54-year-old group. Finally, only 2.78% of the consumers were at
least 55 years old. Approximately 40% of the consumers were male and 60% were female.
3.3.2 Consumer Acceptability
The mean scores and standard deviations are presented in Table 5. Consumers preferred
the strawberry cheesecake formulation, with the highest mean score of 7.71 for overall liking.
The peach sample had a mean score of 6.03 for overall liking and the vanilla sample had an
overall liking score of 5.76. When evaluating acceptability of appearance, color, flavor, coconut
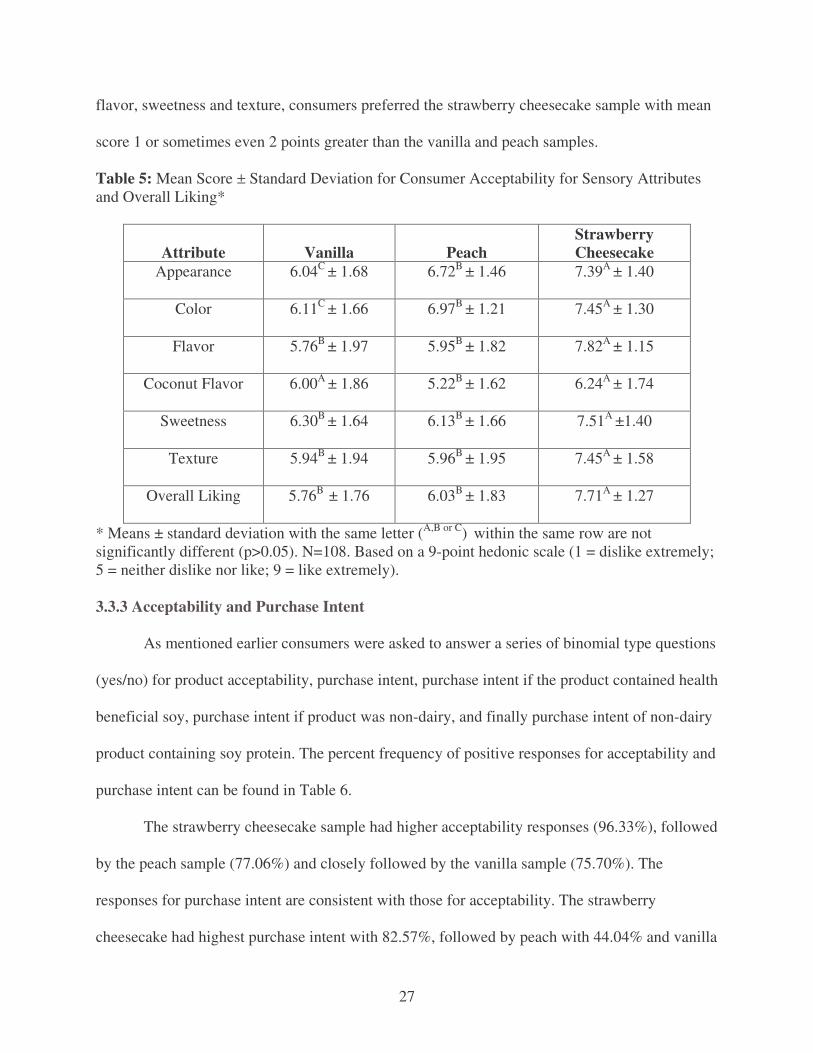
27
flavor, sweetness and texture, consumers preferred the strawberry cheesecake sample with mean
score 1 or sometimes even 2 points greater than the vanilla and peach samples.
Table 5: Mean Score ± Standard Deviation for Consumer Acceptability for Sensory Attributes and Overall Liking*
Attribute Vanilla Peach Strawberry Cheesecake
Appearance 6.04C ± 1.68 6.72B ± 1.46 7.39A ± 1.40
Color 6.11C ± 1.66 6.97B ± 1.21 7.45A ± 1.30
Flavor 5.76B ± 1.97 5.95B ± 1.82 7.82A ± 1.15
Coconut Flavor 6.00A ± 1.86 5.22B ± 1.62 6.24A ± 1.74
Sweetness 6.30B ± 1.64 6.13B ± 1.66 7.51A ±1.40
Texture 5.94B ± 1.94 5.96B ± 1.95 7.45A ± 1.58
Overall Liking 5.76B ± 1.76 6.03B ± 1.83 7.71A ± 1.27
* Means ± standard deviation with the same letter (A,B or C) within the same row are not significantly different (p>0.05). N=108. Based on a 9-point hedonic scale (1 = dislike extremely; 5 = neither dislike nor like; 9 = like extremely).
3.3.3 Acceptability and Purchase Intent
As mentioned earlier consumers were asked to answer a series of binomial type questions
(yes/no) for product acceptability, purchase intent, purchase intent if the product contained health
beneficial soy, purchase intent if product was non-dairy, and finally purchase intent of non-dairy
product containing soy protein. The percent frequency of positive responses for acceptability and
purchase intent can be found in Table 6.
The strawberry cheesecake sample had higher acceptability responses (96.33%), followed
by the peach sample (77.06%) and closely followed by the vanilla sample (75.70%). The
responses for purchase intent are consistent with those for acceptability. The strawberry
cheesecake had highest purchase intent with 82.57%, followed by peach with 44.04% and vanilla
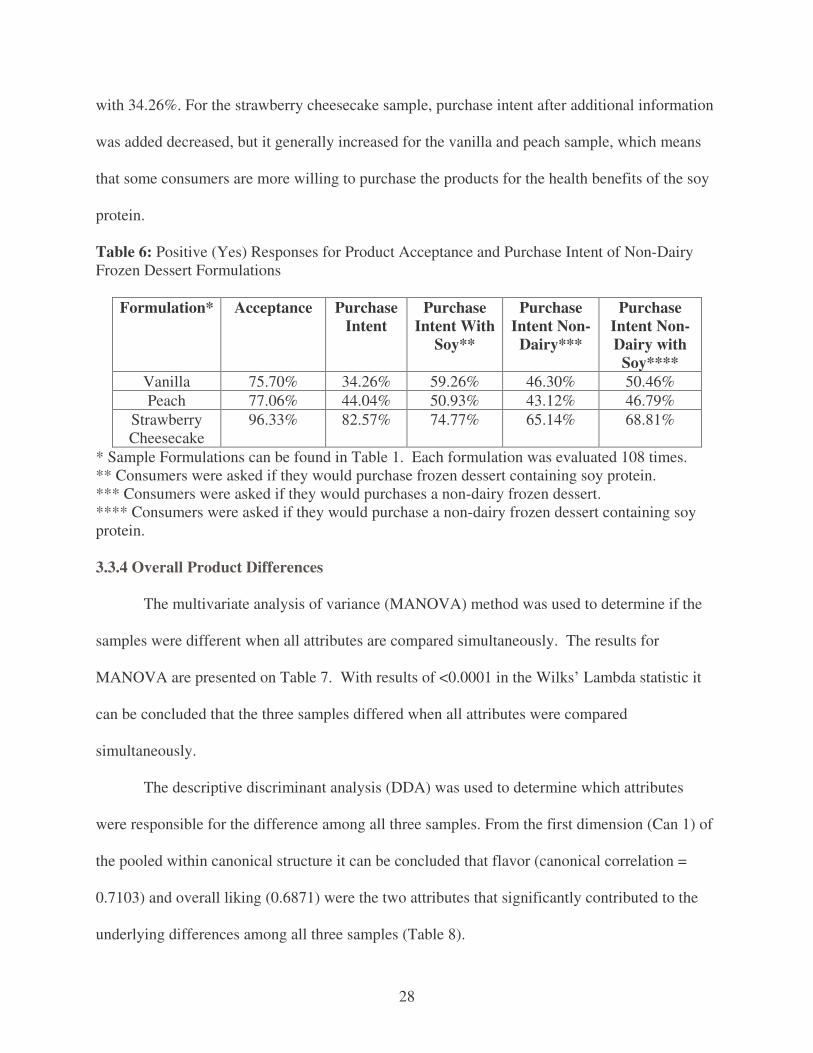
28
with 34.26%. For the strawberry cheesecake sample, purchase intent after additional information
was added decreased, but it generally increased for the vanilla and peach sample, which means
that some consumers are more willing to purchase the products for the health benefits of the soy
protein.
Table 6: Positive (Yes) Responses for Product Acceptance and Purchase Intent of Non-Dairy Frozen Dessert Formulations
Formulation* Acceptance Purchase Intent
Purchase Intent With
Soy**
Purchase Intent Non-
Dairy***
Purchase Intent Non-Dairy with
Soy**** Vanilla 75.70% 34.26% 59.26% 46.30% 50.46% Peach 77.06% 44.04% 50.93% 43.12% 46.79%
Strawberry Cheesecake
96.33% 82.57% 74.77% 65.14% 68.81%
* Sample Formulations can be found in Table 1. Each formulation was evaluated 108 times. ** Consumers were asked if they would purchase frozen dessert containing soy protein. *** Consumers were asked if they would purchases a non-dairy frozen dessert. **** Consumers were asked if they would purchase a non-dairy frozen dessert containing soy protein. 3.3.4 Overall Product Differences
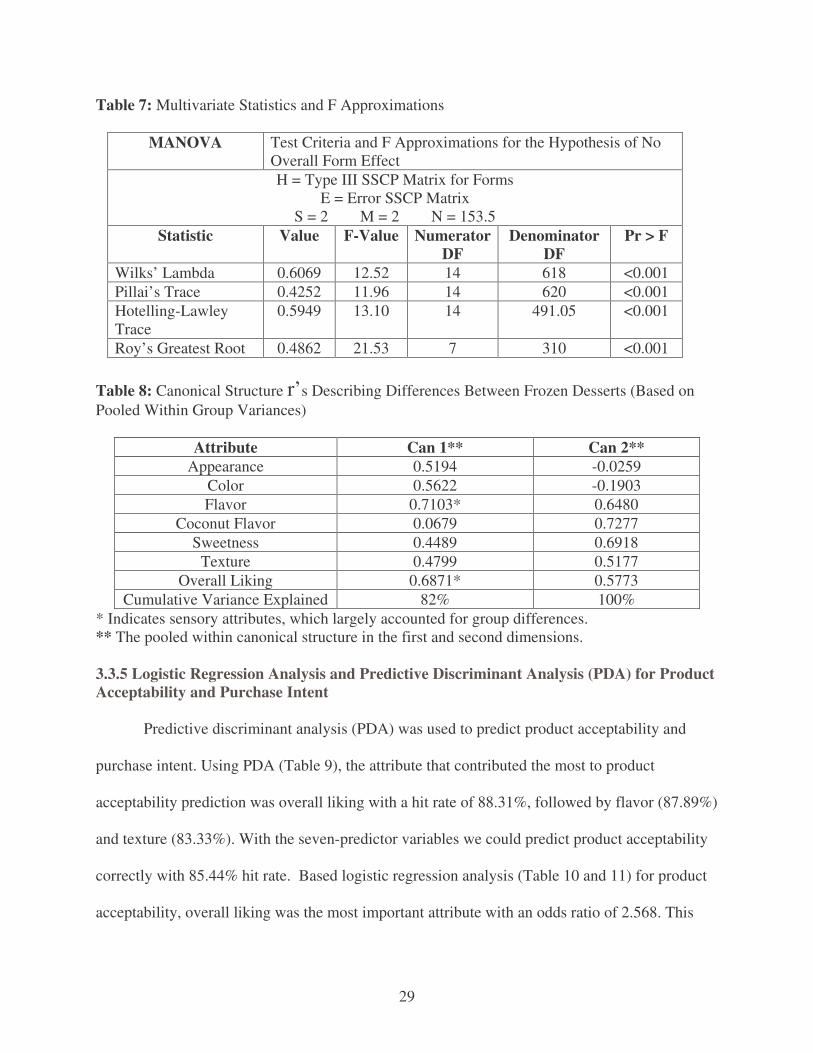
The multivariate analysis of variance (MANOVA) method was used to determine if the
samples were different when all attributes are compared simultaneously. The results for
MANOVA are presented on Table 7. With results of <0.0001 in the Wilks’ Lambda statistic it
can be concluded that the three samples differed when all attributes were compared
simultaneously.
The descriptive discriminant analysis (DDA) was used to determine which attributes
were responsible for the difference among all three samples. From the first dimension (Can 1) of
the pooled within canonical structure it can be concluded that flavor (canonical correlation =
0.7103) and overall liking (0.6871) were the two attributes that significantly contributed to the
underlying differences among all three samples (Table 8).
29
Table 7: Multivariate Statistics and F Approximations
MANOVA Test Criteria and F Approximations for the Hypothesis of No Overall Form Effect H = Type III SSCP Matrix for Forms
E = Error SSCP Matrix S = 2 M = 2 N = 153.5
Statistic Value F-Value Numerator DF
Denominator DF
Pr > F
Wilks’ Lambda 0.6069 12.52 14 618 <0.001 Pillai’s Trace 0.4252 11.96 14 620 <0.001 Hotelling-Lawley Trace
0.5949 13.10 14 491.05 <0.001
Roy’s Greatest Root 0.4862 21.53 7 310 <0.001 Table 8: Canonical Structure r’s Describing Differences Between Frozen Desserts (Based on Pooled Within Group Variances)
Attribute Can 1** Can 2**
Appearance 0.5194 -0.0259 Color 0.5622 -0.1903 Flavor 0.7103* 0.6480
Coconut Flavor 0.0679 0.7277 Sweetness 0.4489 0.6918
Texture 0.4799 0.5177 Overall Liking 0.6871* 0.5773
Cumulative Variance Explained 82% 100% * Indicates sensory attributes, which largely accounted for group differences. ** The pooled within canonical structure in the first and second dimensions.
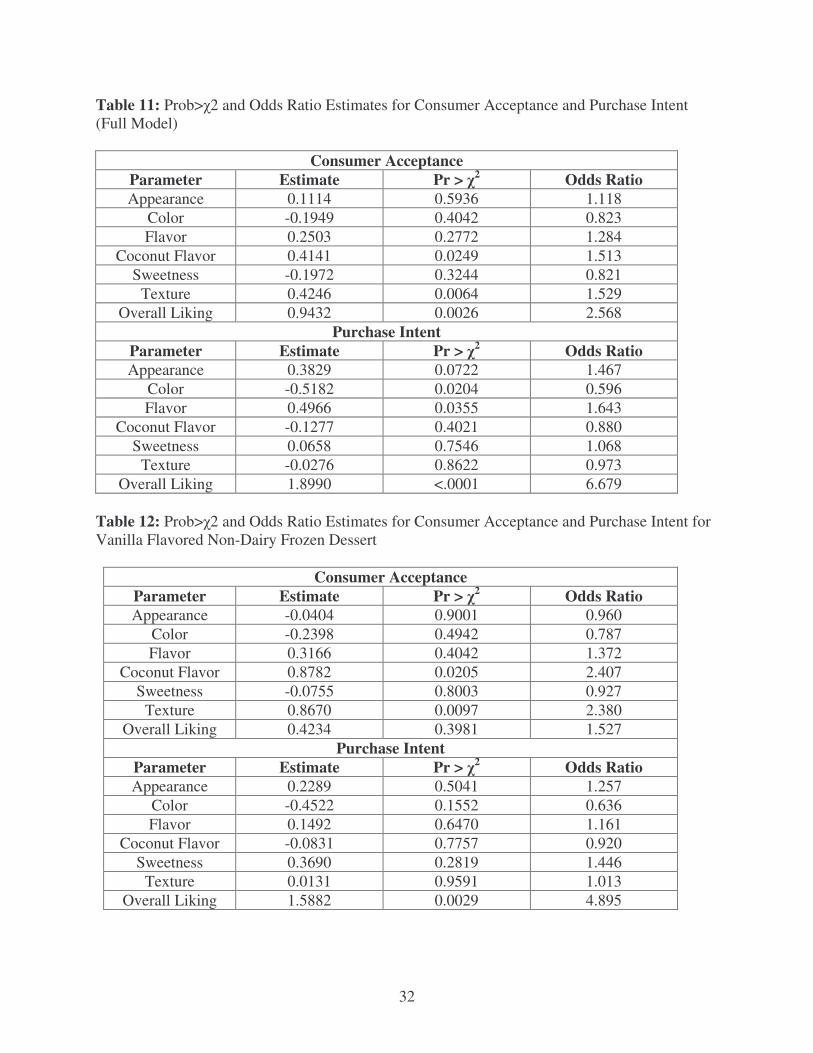
3.3.5 Logistic Regression Analysis and Predictive Discriminant Analysis (PDA) for Product Acceptability and Purchase Intent
Predictive discriminant analysis (PDA) was used to predict product acceptability and
purchase intent. Using PDA (Table 9), the attribute that contributed the most to product
acceptability prediction was overall liking with a hit rate of 88.31%, followed by flavor (87.89%)
and texture (83.33%). With the seven-predictor variables we could predict product acceptability
correctly with 85.44% hit rate. Based logistic regression analysis (Table 10 and 11) for product
acceptability, overall liking was the most important attribute with an odds ratio of 2.568. This
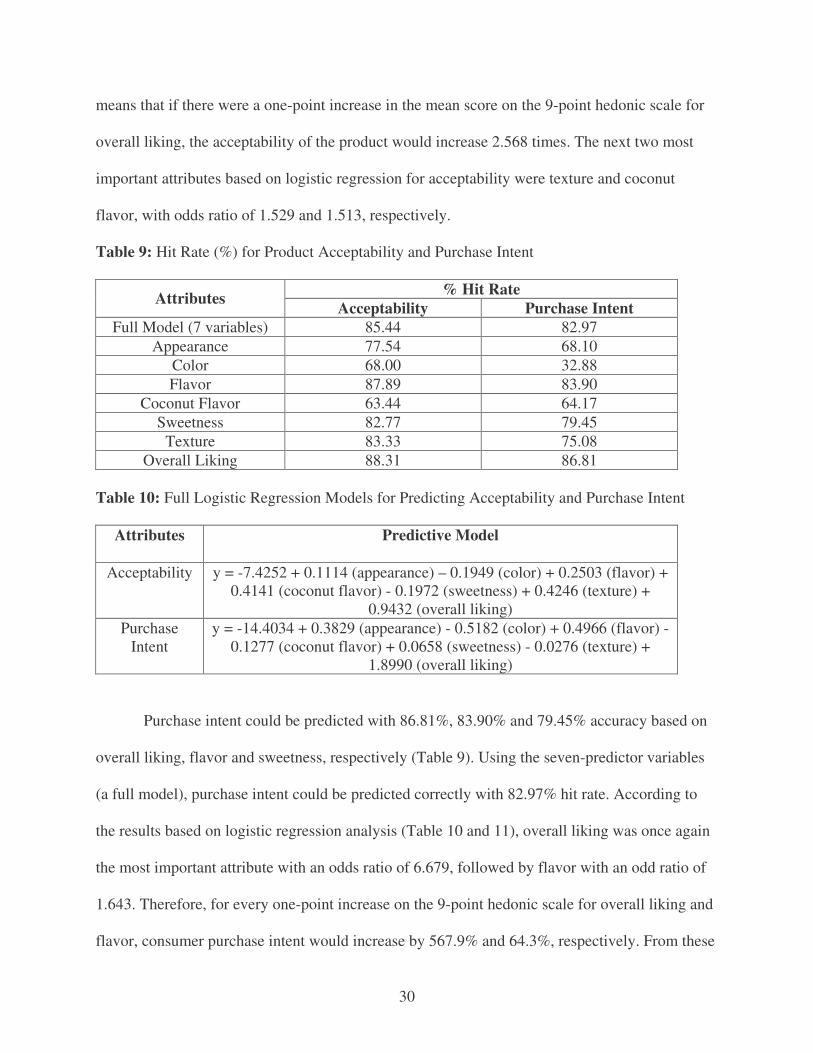
30
means that if there were a one-point increase in the mean score on the 9-point hedonic scale for
overall liking, the acceptability of the product would increase 2.568 times. The next two most
important attributes based on logistic regression for acceptability were texture and coconut
flavor, with odds ratio of 1.529 and 1.513, respectively.
Table 9: Hit Rate (%) for Product Acceptability and Purchase Intent
% Hit Rate Attributes Acceptability Purchase Intent Full Model (7 variables) 85.44 82.97
Appearance 77.54 68.10 Color 68.00 32.88 Flavor 87.89 83.90
Coconut Flavor 63.44 64.17 Sweetness 82.77 79.45
Texture 83.33 75.08 Overall Liking 88.31 86.81
Table 10: Full Logistic Regression Models for Predicting Acceptability and Purchase Intent
Attributes Predictive Model
Acceptability y = -7.4252 + 0.1114 (appearance) – 0.1949 (color) + 0.2503 (flavor) + 0.4141 (coconut flavor) - 0.1972 (sweetness) + 0.4246 (texture) +
0.9432 (overall liking) Purchase
Intent y = -14.4034 + 0.3829 (appearance) - 0.5182 (color) + 0.4966 (flavor) -
0.1277 (coconut flavor) + 0.0658 (sweetness) - 0.0276 (texture) + 1.8990 (overall liking)
Purchase intent could be predicted with 86.81%, 83.90% and 79.45% accuracy based on
overall liking, flavor and sweetness, respectively (Table 9). Using the seven-predictor variables
(a full model), purchase intent could be predicted correctly with 82.97% hit rate. According to
the results based on logistic regression analysis (Table 10 and 11), overall liking was once again
the most important attribute with an odds ratio of 6.679, followed by flavor with an odd ratio of
1.643. Therefore, for every one-point increase on the 9-point hedonic scale for overall liking and
flavor, consumer purchase intent would increase by 567.9% and 64.3%, respectively. From these
31
results it can be concluded that when trying to optimize product formulations these particular
attributes must be the ones to focus all attention on.
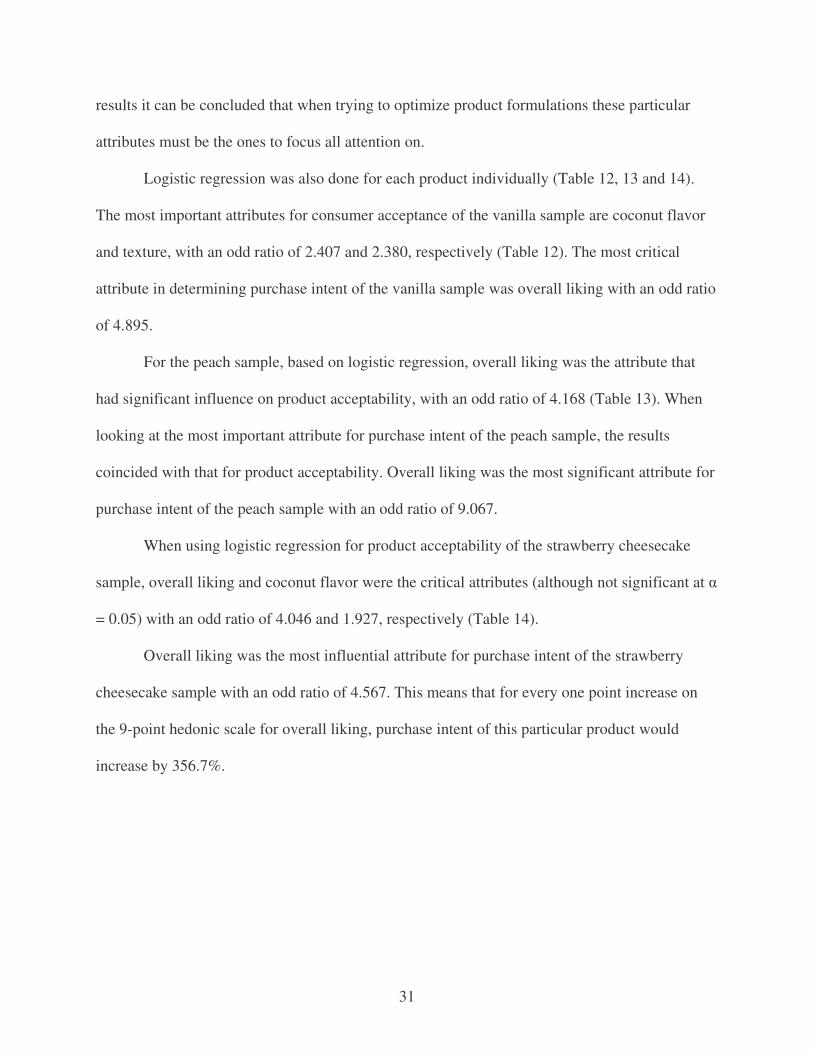
Logistic regression was also done for each product individually (Table 12, 13 and 14).
The most important attributes for consumer acceptance of the vanilla sample are coconut flavor
and texture, with an odd ratio of 2.407 and 2.380, respectively (Table 12). The most critical
attribute in determining purchase intent of the vanilla sample was overall liking with an odd ratio
of 4.895.
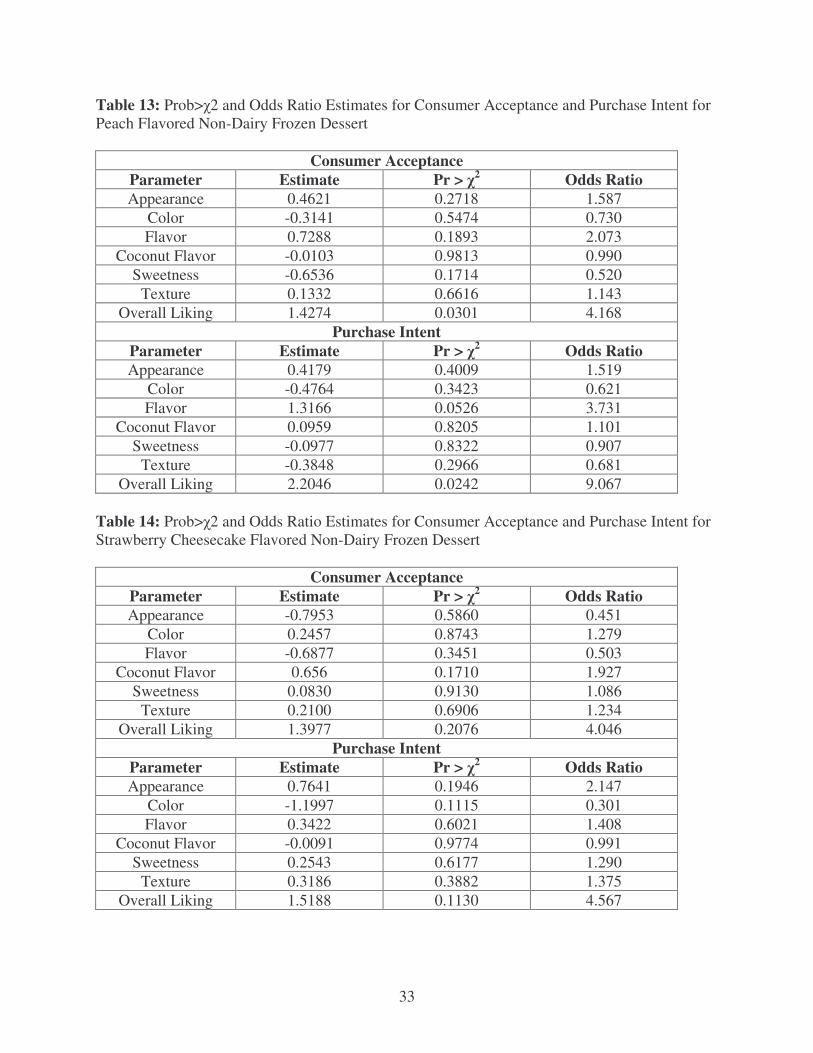
For the peach sample, based on logistic regression, overall liking was the attribute that
had significant influence on product acceptability, with an odd ratio of 4.168 (Table 13). When
looking at the most important attribute for purchase intent of the peach sample, the results
coincided with that for product acceptability. Overall liking was the most significant attribute for
purchase intent of the peach sample with an odd ratio of 9.067.
When using logistic regression for product acceptability of the strawberry cheesecake
sample, overall liking and coconut flavor were the critical attributes (although not significant at �
= 0.05) with an odd ratio of 4.046 and 1.927, respectively (Table 14).
Overall liking was the most influential attribute for purchase intent of the strawberry
cheesecake sample with an odd ratio of 4.567. This means that for every one point increase on
the 9-point hedonic scale for overall liking, purchase intent of this particular product would
increase by 356.7%.
32
Table 11: Prob>�2 and Odds Ratio Estimates for Consumer Acceptance and Purchase Intent (Full Model)
Consumer Acceptance Parameter Estimate Pr > �2 Odds Ratio Appearance 0.1114 0.5936 1.118
Color -0.1949 0.4042 0.823 Flavor 0.2503 0.2772 1.284
Coconut Flavor 0.4141 0.0249 1.513 Sweetness -0.1972 0.3244 0.821
Texture 0.4246 0.0064 1.529 Overall Liking 0.9432 0.0026 2.568
Purchase Intent Parameter Estimate Pr > �2 Odds Ratio Appearance 0.3829 0.0722 1.467
Color -0.5182 0.0204 0.596 Flavor 0.4966 0.0355 1.643
Coconut Flavor -0.1277 0.4021 0.880 Sweetness 0.0658 0.7546 1.068
Texture -0.0276 0.8622 0.973 Overall Liking 1.8990 <.0001 6.679
Table 12: Prob>�2 and Odds Ratio Estimates for Consumer Acceptance and Purchase Intent for Vanilla Flavored Non-Dairy Frozen Dessert
Consumer Acceptance Parameter Estimate Pr > �2 Odds Ratio Appearance -0.0404 0.9001 0.960
Color -0.2398 0.4942 0.787 Flavor 0.3166 0.4042 1.372
Coconut Flavor 0.8782 0.0205 2.407 Sweetness -0.0755 0.8003 0.927
Texture 0.8670 0.0097 2.380 Overall Liking 0.4234 0.3981 1.527
Purchase Intent Parameter Estimate Pr > �2 Odds Ratio Appearance 0.2289 0.5041 1.257
Color -0.4522 0.1552 0.636 Flavor 0.1492 0.6470 1.161
Coconut Flavor -0.0831 0.7757 0.920 Sweetness 0.3690 0.2819 1.446
Texture 0.0131 0.9591 1.013 Overall Liking 1.5882 0.0029 4.895
33
Table 13: Prob>�2 and Odds Ratio Estimates for Consumer Acceptance and Purchase Intent for Peach Flavored Non-Dairy Frozen Dessert
Consumer Acceptance Parameter Estimate Pr > �2 Odds Ratio Appearance 0.4621 0.2718 1.587
Color -0.3141 0.5474 0.730 Flavor 0.7288 0.1893 2.073
Coconut Flavor -0.0103 0.9813 0.990 Sweetness -0.6536 0.1714 0.520
Texture 0.1332 0.6616 1.143 Overall Liking 1.4274 0.0301 4.168
Purchase Intent Parameter Estimate Pr > �2 Odds Ratio Appearance 0.4179 0.4009 1.519
Color -0.4764 0.3423 0.621 Flavor 1.3166 0.0526 3.731
Coconut Flavor 0.0959 0.8205 1.101 Sweetness -0.0977 0.8322 0.907
Texture -0.3848 0.2966 0.681 Overall Liking 2.2046 0.0242 9.067
Table 14: Prob>�2 and Odds Ratio Estimates for Consumer Acceptance and Purchase Intent for Strawberry Cheesecake Flavored Non-Dairy Frozen Dessert
Consumer Acceptance Parameter Estimate Pr > �2 Odds Ratio Appearance -0.7953 0.5860 0.451
Color 0.2457 0.8743 1.279 Flavor -0.6877 0.3451 0.503
Coconut Flavor 0.656 0.1710 1.927 Sweetness 0.0830 0.9130 1.086
Texture 0.2100 0.6906 1.234 Overall Liking 1.3977 0.2076 4.046
Purchase Intent Parameter Estimate Pr > �2 Odds Ratio Appearance 0.7641 0.1946 2.147
Color -1.1997 0.1115 0.301 Flavor 0.3422 0.6021 1.408
Coconut Flavor -0.0091 0.9774 0.991 Sweetness 0.2543 0.6177 1.290
Texture 0.3186 0.3882 1.375 Overall Liking 1.5188 0.1130 4.567
34
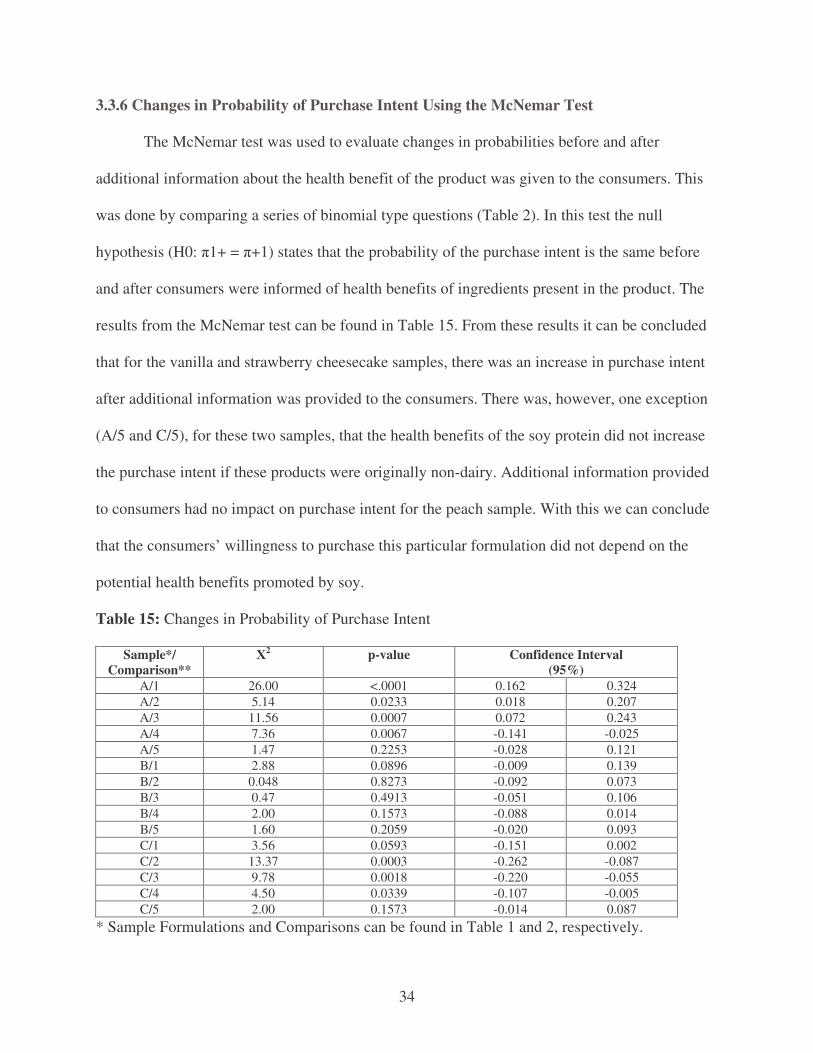
3.3.6 Changes in Probability of Purchase Intent Using the McNemar Test
The McNemar test was used to evaluate changes in probabilities before and after
additional information about the health benefit of the product was given to the consumers. This
was done by comparing a series of binomial type questions (Table 2). In this test the null
hypothesis (H0: �1+ = �+1) states that the probability of the purchase intent is the same before
and after consumers were informed of health benefits of ingredients present in the product. The
results from the McNemar test can be found in Table 15. From these results it can be concluded
that for the vanilla and strawberry cheesecake samples, there was an increase in purchase intent
after additional information was provided to the consumers. There was, however, one exception
(A/5 and C/5), for these two samples, that the health benefits of the soy protein did not increase
the purchase intent if these products were originally non-dairy. Additional information provided
to consumers had no impact on purchase intent for the peach sample. With this we can conclude
that the consumers’ willingness to purchase this particular formulation did not depend on the
potential health benefits promoted by soy.
Table 15: Changes in Probability of Purchase Intent
Sample*/ Comparison**
�2 p-value Confidence Interval
(95%) A/1 26.00 <.0001 0.162 0.324 A/2 5.14 0.0233 0.018 0.207 A/3 11.56 0.0007 0.072 0.243 A/4 7.36 0.0067 -0.141 -0.025 A/5 1.47 0.2253 -0.028 0.121 B/1 2.88 0.0896 -0.009 0.139 B/2 0.048 0.8273 -0.092 0.073 B/3 0.47 0.4913 -0.051 0.106 B/4 2.00 0.1573 -0.088 0.014 B/5 1.60 0.2059 -0.020 0.093 C/1 3.56 0.0593 -0.151 0.002 C/2 13.37 0.0003 -0.262 -0.087 C/3 9.78 0.0018 -0.220 -0.055 C/4 4.50 0.0339 -0.107 -0.005 C/5 2.00 0.1573 -0.014 0.087
* Sample Formulations and Comparisons can be found in Table 1 and 2, respectively.
35
3.4 Conclusions
Consumer preferred the strawberry cheesecake formulation with the highest overall liking
mean score of 7.71. It also received highest positive response percentages for acceptability and
purchase intent of 96.33% and 82.57%, respectively. With a Wilks’ Lambda p-value of 0.0001, it
was concluded that all three samples were different when comparing all attributes
simultaneously. Using descriptive discriminant analysis it was determined that overall liking and
flavor were the two attributes the contributed mostly to the underlying differences among the
three samples. Overall liking followed by texture and coconut flavor were the most important
attributes influencing product acceptability with an odd ratio of 2.568, 1.529 and 1.513,
respectively. Overall liking and flavor were the most critical attributes in determining purchase
intent with an odd ratio of 6.679 and 1.643, respectively. Providing additional product
information to consumers potentially enhances purchase intent of these frozen dessert products
containing soy protein and coconut milk.
36
CHAPTER 4. DEVELOPMENT AND CHARACTERIZATION OF CONSUMER SENSORY QUALITY OF A NON-DAIRY STRAWBERRY CHEESECAKE FROZEN DESSERT PREPARED WITH COCONUT MILK AND SOY PROTEIN ISOLATE
4.1 Introduction
According to the International Dairy Foods Association, in 2002, the total U.S. sales of
ice cream and frozen desserts reached $20.5 billion. Of that total, $8.1 billion was spent on
products for "at home" consumption, while $12.5 billion was spent on "away from home" frozen
dessert purchases (scoop shops, foodservice and other retail sales outlets).
The physical, functional and sensory properties of ice cream influence the consumer’s
perception and acceptance of an ice cream. A desirable ice cream has good flavor, body and
texture, color, and melting characteristics and should be of good microbial quality (Rothwell,
1985; Marshall and Arbuckle, 1996). Today, consumers are demanding healthy foods. In the
US, more than 12 million people are vegetarians, and 30% of the American population is lactose
intolerant. To satisfy demands of these consumers, a new type of non-dairy frozen desserts with
coconut milk and soy protein was developed. When developing new ice cream products, or
frozen desserts, it is critical to maintain the quality of certain sensory attributes, such as texture
and flavor, to ensure product acceptability.
One of the objectives of this study was to add a health claim for the soy protein content.
The requirements for a food to be eligible to fall under this particular health claim are as follow:
1) the food must contain at least 6.25g of soy protein per reference amounts customarily
consumed of the food product; 2) The food shall meet the nutrient content requirements for a
“low saturated fat” and “low cholesterol” food; and 3) the food shall meet the nutrient content
requirement for a “low fat” food, unless it consists of or is derived from whole soybeans and
37
contains no fat in addition to the fat inherently present in the whole soybeans it contains or from
which it is derived (21 CFR 101.82(c)(iii), 2003).
The other objectives of this study were to refine the formulation of the non-dairy
strawberry cheesecake frozen dessert and to identify the sensory attributes that would greatly
contribute for the success of this product in terms of overall consumer acceptability and purchase
intent.
4.2 Materials and Methods 4.2.1 Non-Dairy Strawberry Cheesecake Frozen Dessert Preparation
Based on the results from the first study, it was concluded that the strawberry cheesecake
formulation was the one with highest acceptability. For this reason the strawberry cheesecake
formulation was chosen for refinement during the second study. Since one of the original goals
for this study was to meet the FDA soy protein requirements to have a health claim, it was
decided that the minimum amount of soy protein would have to be 6.12% of the total
formulation in order to attain the 6.25 grams of soy protein per serving required by the FDA (21
CFR 101.82(a)(3), 2003). The other two varying ingredients that were chosen were water and
coconut milk. For the minimum amount of water to be used, it was decided that the level below
35.21% of the total formulation would result in a thick, pasty mixture that would not pass
through the pipes in the homogenizer. Finally, when deciding the limits for the coconut milk to
be used it was decided that the level above 30% of the total formulation resulted in undesirable
levels of saturated fat; and the level below 20% coconut milk of the total formulation adversely
affected the texture (creaminess) of the frozen dessert, due to the fact that coconut milk was the
only source of fat. Consequently, nine different mixtures were formulated following the three-
component coordinates mixture design.
38
These products were prepared by freezing, while stirring a pasteurized mixture consisting
of five basic ingredients (soy protein isolate, granulated sugar, coconut milk, stabilizer and
water) as well as flavoring substance. The basis for these frozen desserts was coconut milk
instead of milk-fat, imparting a smooth, creamy texture similar to that of milk.
The soy protein used was soy protein isolate (Pro-Fam 892) obtained from Archer
Daniels Midland Company (ADM) in Decatur, IL. The coconut milk (Savoy; Thai Agri Foods,
Public Co., Ltd., Thailand) was purchased from a local market. Per serving size (0.5 cup) the
coconut milk contained 14g saturated fat, 0g trans fat, and 0mg cholesterol. The PGX-1 stabilizer
was obtained from Danisco USA Company in St. Joseph, MO. The cream cheese flavor (72-047
Natural Cream Cheese Type Flavor) was obtained from Givaudan Flavors Corporation
(Oconomowoc, WI). The strawberry preserves, and the graham cracker crunch were obtained
from Dippin’ Flavor (St. Louis, MO).
The first step in making our frozen desserts was measuring of all the ingredients: soy
protein isolate, coconut milk, sugar, stabilizer and water. The coconut milk and water were
placed into a clean container. Then, all the dry ingredients were sifted and mixed together to
avoid clumping of the soy protein isolate, and were then gradually added to the coconut milk and
water mixture while mixing to provide a uniform mixture. The mixture was then transferred into
stainless steel cylinders and put into a water bath and heated until it reached 49°C (120°F). The
mixture was then transferred into a Model 300 DJF 4 2PS homogenizer (Manton-Gaulin Mfg.
Co. Inc., Everett, MA) operated under pressure of approximately 13,800 Kpa (2000 psi) to
ensure there were no clumps and that a homogeneous mixture was obtained. The mixture was
placed back into the stainless steel cylinders and put into a water bath for pasteurization. For our
products a low-temperature long-time pasteurization was done at 71°C (160°F) for 30 minutes.
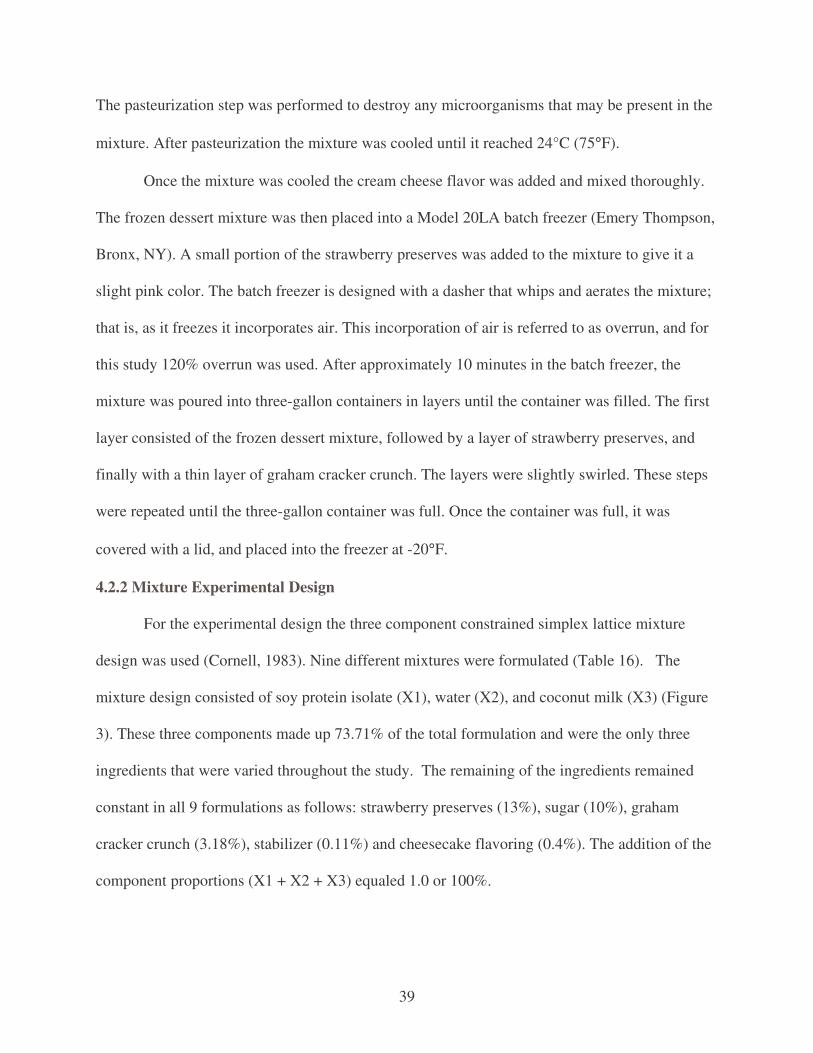
39
The pasteurization step was performed to destroy any microorganisms that may be present in the
mixture. After pasteurization the mixture was cooled until it reached 24°C (75°F).
Once the mixture was cooled the cream cheese flavor was added and mixed thoroughly.
The frozen dessert mixture was then placed into a Model 20LA batch freezer (Emery Thompson,
Bronx, NY). A small portion of the strawberry preserves was added to the mixture to give it a
slight pink color. The batch freezer is designed with a dasher that whips and aerates the mixture;
that is, as it freezes it incorporates air. This incorporation of air is referred to as overrun, and for
this study 120% overrun was used. After approximately 10 minutes in the batch freezer, the
mixture was poured into three-gallon containers in layers until the container was filled. The first
layer consisted of the frozen dessert mixture, followed by a layer of strawberry preserves, and
finally with a thin layer of graham cracker crunch. The layers were slightly swirled. These steps
were repeated until the three-gallon container was full. Once the container was full, it was
covered with a lid, and placed into the freezer at -20°F.
4.2.2 Mixture Experimental Design
For the experimental design the three component constrained simplex lattice mixture
design was used (Cornell, 1983). Nine different mixtures were formulated (Table 16). The
mixture design consisted of soy protein isolate (X1), water (X2), and coconut milk (X3) (Figure
3). These three components made up 73.71% of the total formulation and were the only three
ingredients that were varied throughout the study. The remaining of the ingredients remained
constant in all 9 formulations as follows: strawberry preserves (13%), sugar (10%), graham
cracker crunch (3.18%), stabilizer (0.11%) and cheesecake flavoring (0.4%). The addition of the
component proportions (X1 + X2 + X3) equaled 1.0 or 100%.
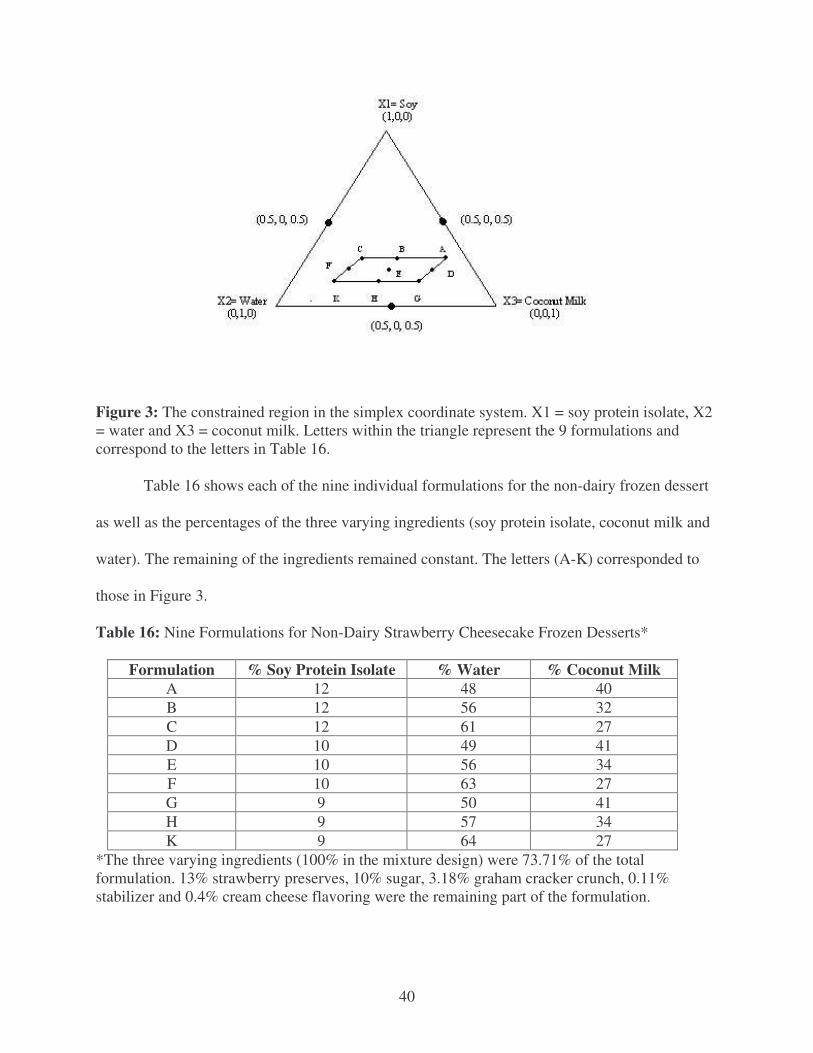
40
Figure 3: The constrained region in the simplex coordinate system. X1 = soy protein isolate, X2 = water and X3 = coconut milk. Letters within the triangle represent the 9 formulations and correspond to the letters in Table 16.
Table 16 shows each of the nine individual formulations for the non-dairy frozen dessert
as well as the percentages of the three varying ingredients (soy protein isolate, coconut milk and
water). The remaining of the ingredients remained constant. The letters (A-K) corresponded to
those in Figure 3.
Table 16: Nine Formulations for Non-Dairy Strawberry Cheesecake Frozen Desserts*
Formulation % Soy Protein Isolate % Water % Coconut Milk A 12 48 40 B 12 56 32 C 12 61 27 D 10 49 41 E 10 56 34 F 10 63 27 G 9 50 41 H 9 57 34 K 9 64 27
*The three varying ingredients (100% in the mixture design) were 73.71% of the total formulation. 13% strawberry preserves, 10% sugar, 3.18% graham cracker crunch, 0.11% stabilizer and 0.4% cream cheese flavoring were the remaining part of the formulation.
41
4.2.3 Consumer Acceptance Test
Four hundred and thirty two untrained consumers participated in the consumer
acceptance test. The consumers were randomly chosen from the Louisiana State University
campus using the following criteria for recruitment: (1) they were at least 18 years of age, (2)
they were not allergic to soy, coconut, sugar, and strawberries, (3) and that they were willing and
available for participation and for the completion of the survey.
Consumers were presented with two two-ounce coded samples that followed the
Balanced Incomplete Block design, plan 11.3a (t=9, k=2, r=8, b=36, �= 1, E=.56, Type II)
(Cochran, 1957). With this plan each consumer tasted two out of the 9 formulations, which is a
large number of samples for a consumer to evaluate at one time (Meilgaard et al., 1999). Each
consumer was also provided with room temperature water and unsalted, plain crackers to cleanse
their palate between samples. Consumers were asked demographic questions such as age and
gender. Each consumer evaluated each sample for acceptability of appearance, color, texture,
flavor, coconut flavor, sweetness and overall liking using the 9-point hedonic scale (1= dislike
extremely, 5= neither dislike nor like, 9= like extremely). The JAR type questions were used to
evaluate the intensity of coconut flavor and sweetness (too weak, just about right and too strong).
The binomial type questions (yes/no) were used to evaluate overall product acceptance, purchase
intent and purchase intent after being provided with additional health benefit information about
soy protein. A series of these binomial questions were compared to see changes in purchase
intent before and after additional health information about the products was provided to the
consumers (Table 2).
42
4.2.4 Statistical Data Analysis
All data were analyzed at � = 0.05 using the SAS software version 9.1, 2003 (SAS
Institute., Cary, NC). The analysis of variance (ANOVA) was used to determine if differences
exist in consumers’ acceptability as well as overall liking among the non-dairy strawberry
cheesecake frozen dessert formulations. The post-hoc multiple comparisons using Tukey’s
studentized range test were performed.
The multivariate analysis of variance (MANOVA) was also used and it was performed
after ANOVA. In this process, more than one variable was tested to detect differences in groups
across multiple dependent variables at the same time (Pavon, 2003). Descriptive discriminant
analysis (DDA) was used to determine which attributes were responsible for the underlying
differences among the nine samples. Predictive discriminant analysis (PDA) was used to
determine both product acceptance and purchase decision based on % hit rate (Huberty, 1994).
Both logistic regression analysis and PDA can be used to determine both product acceptance and
purchase decision (Bond, 2004).
The McNemar test was used in order to determine changes in purchase intent before and
after additional product information was given to the consumers. In this test, the null hypothesis
(H0: �1+ = �+1) states that the probability of the purchase intent is the same before and after
consumers were informed of health benefits of soy ingredients present in the product. The aim
was to learn if participants were influenced or not by the fact that they were informed about
health benefits of the soy product, and, therefore, their opinions changed from a “before” status
to an “after” status (Pavon, 2003). Details of equations for the McNemar Test can be found in
Agresti (1996).
43
4.2.4.1 Principal Component Analysis
Principal component analysis (PCA) is a method of extracting structure from the
variance-covariance or correlation matrix (Federer, 1987). Its objective is the interpretation of
data relationships (Popper et al., 1997). The PCA technique simplifies
data structure and aids in interpretation by forming the original dependent attributes into new
uncorrelated dimensions which results in a data map that graphically illustrates interrelationships
among variables (Lawless and Heymann, 1998).
PCA takes n variables and finds combinations of these variables to produce indices Z1,
Z2, …, Zp that are uncorrelated. A lack of correlation between the variables means that the
indices are measuring different dimensions in the data (Manly, 1986). These indices are ordered
where the largest amount of variation is displayed by Z1, and so forth. The Zi are called the
principal components. If the variances of most of the indices are extremely low, then the
variation in the data can be described by only a few Z variables that are not negligible (Bond,
2004). According to Manly (1986), when the original variables are highly correlated (either
positively or negatively), then the best results are obtained with principal component analysis
because this means that the important principal components measure the underlying dimensions
in the data set. In this study, PCA was used to illustrate interrelationship among variables, and
relationship between variables and products was illustrated using a bi-plot of product-attribute.
4.3 Results and Discussion 4.3.1 Demographic Information
A summary of demographic information is detailed in Table 17 and Table 18. The
majority of the participating consumers were in the age range of 18-24 years old (77.91%),
followed by those in the age range of 25-34 years old (15.12%). The lesser number of
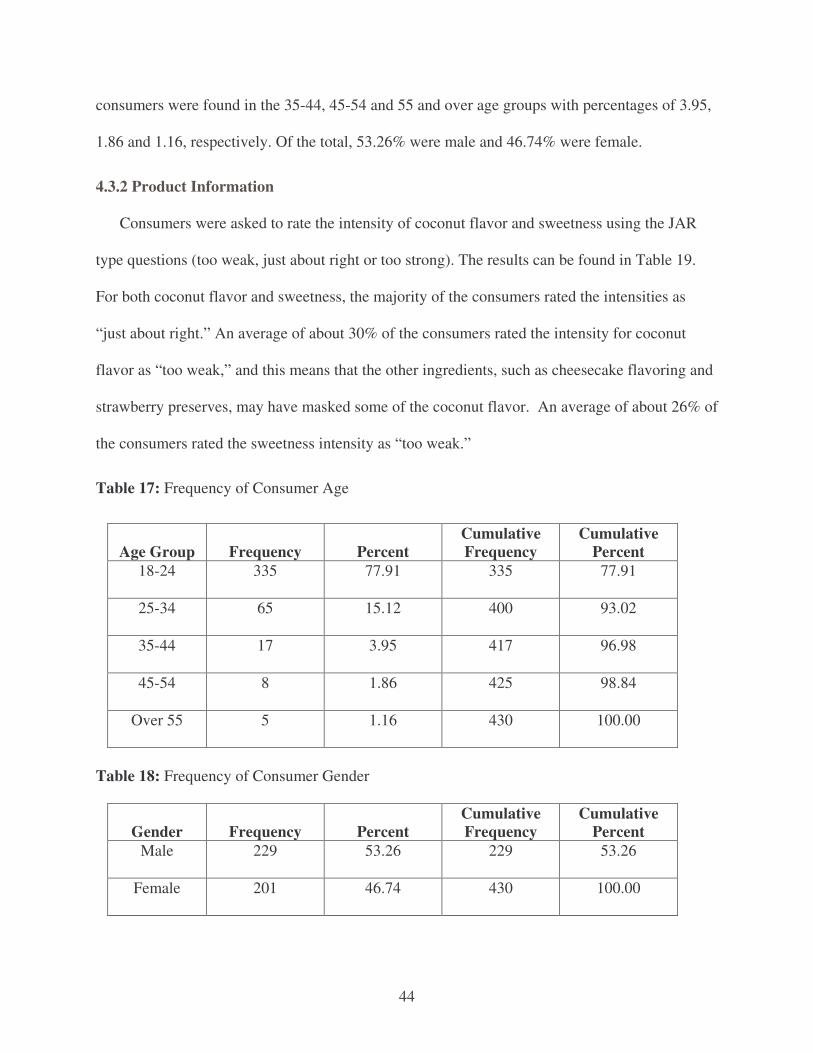
44
consumers were found in the 35-44, 45-54 and 55 and over age groups with percentages of 3.95,
1.86 and 1.16, respectively. Of the total, 53.26% were male and 46.74% were female.
4.3.2 Product Information
Consumers were asked to rate the intensity of coconut flavor and sweetness using the JAR
type questions (too weak, just about right or too strong). The results can be found in Table 19.
For both coconut flavor and sweetness, the majority of the consumers rated the intensities as
“just about right.” An average of about 30% of the consumers rated the intensity for coconut
flavor as “too weak,” and this means that the other ingredients, such as cheesecake flavoring and
strawberry preserves, may have masked some of the coconut flavor. An average of about 26% of
the consumers rated the sweetness intensity as “too weak.”
Table 17: Frequency of Consumer Age
Age Group Frequency Percent Cumulative Frequency
Cumulative Percent
18-24 335 77.91 335 77.91
25-34 65 15.12 400 93.02
35-44 17 3.95 417 96.98
45-54 8 1.86 425 98.84
Over 55 5 1.16 430 100.00
Table 18: Frequency of Consumer Gender
Gender Frequency Percent Cumulative Frequency
Cumulative Percent
Male 229 53.26 229 53.26
Female 201 46.74 430 100.00
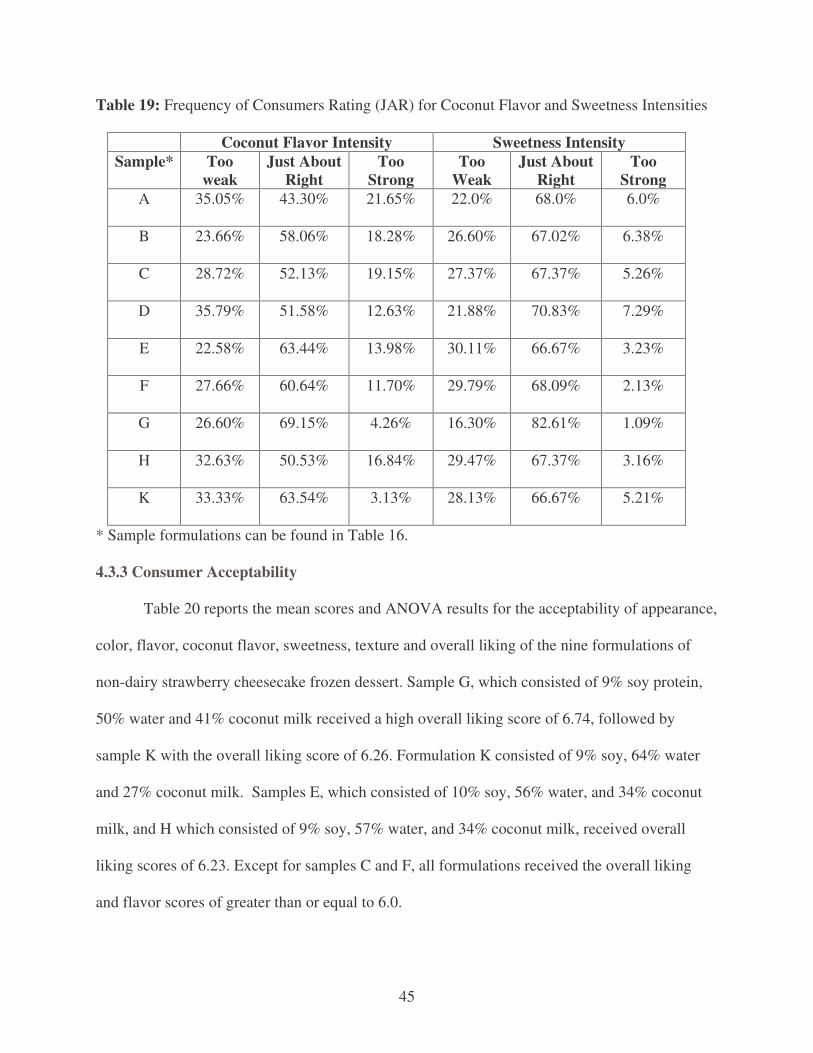
45
Table 19: Frequency of Consumers Rating (JAR) for Coconut Flavor and Sweetness Intensities
Coconut Flavor Intensity Sweetness Intensity Sample* Too
weak Just About
Right Too
Strong Too
Weak Just About
Right Too
Strong A 35.05% 43.30% 21.65% 22.0% 68.0% 6.0%
B 23.66% 58.06% 18.28% 26.60% 67.02% 6.38%
C 28.72% 52.13% 19.15% 27.37% 67.37% 5.26%
D 35.79% 51.58% 12.63% 21.88% 70.83% 7.29%
E 22.58% 63.44% 13.98% 30.11% 66.67% 3.23%
F 27.66% 60.64% 11.70% 29.79% 68.09% 2.13%
G 26.60% 69.15% 4.26% 16.30% 82.61% 1.09%
H 32.63% 50.53% 16.84% 29.47% 67.37% 3.16%
K 33.33% 63.54% 3.13% 28.13% 66.67% 5.21%
* Sample formulations can be found in Table 16. 4.3.3 Consumer Acceptability
Table 20 reports the mean scores and ANOVA results for the acceptability of appearance,
color, flavor, coconut flavor, sweetness, texture and overall liking of the nine formulations of
non-dairy strawberry cheesecake frozen dessert. Sample G, which consisted of 9% soy protein,
50% water and 41% coconut milk received a high overall liking score of 6.74, followed by
sample K with the overall liking score of 6.26. Formulation K consisted of 9% soy, 64% water
and 27% coconut milk. Samples E, which consisted of 10% soy, 56% water, and 34% coconut
milk, and H which consisted of 9% soy, 57% water, and 34% coconut milk, received overall
liking scores of 6.23. Except for samples C and F, all formulations received the overall liking
and flavor scores of greater than or equal to 6.0.
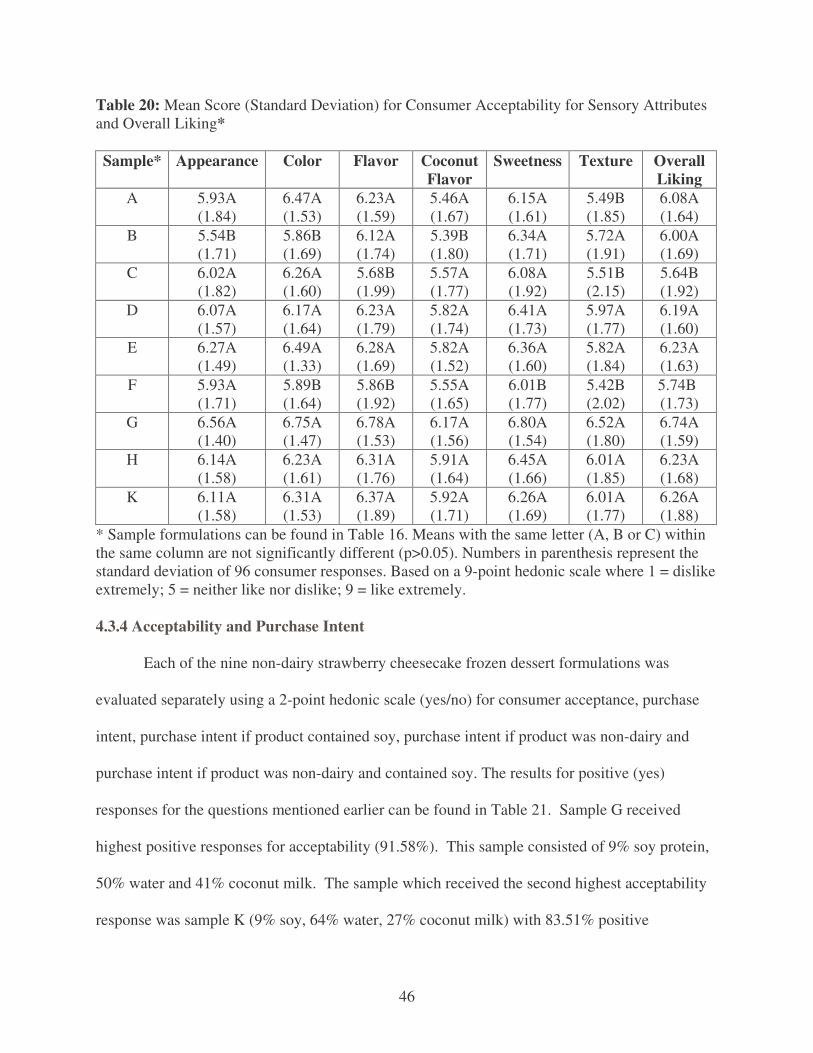
46
Table 20: Mean Score (Standard Deviation) for Consumer Acceptability for Sensory Attributes and Overall Liking* Sample* Appearance Color Flavor Coconut
Flavor Sweetness Texture Overall
Liking A 5.93A
(1.84) 6.47A (1.53)
6.23A (1.59)
5.46A (1.67)
6.15A (1.61)
5.49B (1.85)
6.08A (1.64)
B 5.54B (1.71)
5.86B (1.69)
6.12A (1.74)
5.39B (1.80)
6.34A (1.71)
5.72A (1.91)
6.00A (1.69)
C 6.02A (1.82)
6.26A (1.60)
5.68B (1.99)
5.57A (1.77)
6.08A (1.92)
5.51B (2.15)
5.64B (1.92)
D 6.07A (1.57)
6.17A (1.64)
6.23A (1.79)
5.82A (1.74)
6.41A (1.73)
5.97A (1.77)
6.19A (1.60)
E 6.27A (1.49)
6.49A (1.33)
6.28A (1.69)
5.82A (1.52)
6.36A (1.60)
5.82A (1.84)
6.23A (1.63)
F 5.93A (1.71)
5.89B (1.64)
5.86B (1.92)
5.55A (1.65)
6.01B (1.77)
5.42B (2.02)
5.74B (1.73)
G 6.56A (1.40)
6.75A (1.47)
6.78A (1.53)
6.17A (1.56)
6.80A (1.54)
6.52A (1.80)
6.74A (1.59)
H 6.14A (1.58)
6.23A (1.61)
6.31A (1.76)
5.91A (1.64)
6.45A (1.66)
6.01A (1.85)
6.23A (1.68)
K 6.11A (1.58)
6.31A (1.53)
6.37A (1.89)
5.92A (1.71)
6.26A (1.69)
6.01A (1.77)
6.26A (1.88)
* Sample formulations can be found in Table 16. Means with the same letter (A, B or C) within the same column are not significantly different (p>0.05). Numbers in parenthesis represent the standard deviation of 96 consumer responses. Based on a 9-point hedonic scale where 1 = dislike extremely; 5 = neither like nor dislike; 9 = like extremely. 4.3.4 Acceptability and Purchase Intent
Each of the nine non-dairy strawberry cheesecake frozen dessert formulations was
evaluated separately using a 2-point hedonic scale (yes/no) for consumer acceptance, purchase
intent, purchase intent if product contained soy, purchase intent if product was non-dairy and
purchase intent if product was non-dairy and contained soy. The results for positive (yes)
responses for the questions mentioned earlier can be found in Table 21. Sample G received
highest positive responses for acceptability (91.58%). This sample consisted of 9% soy protein,
50% water and 41% coconut milk. The sample which received the second highest acceptability
response was sample K (9% soy, 64% water, 27% coconut milk) with 83.51% positive
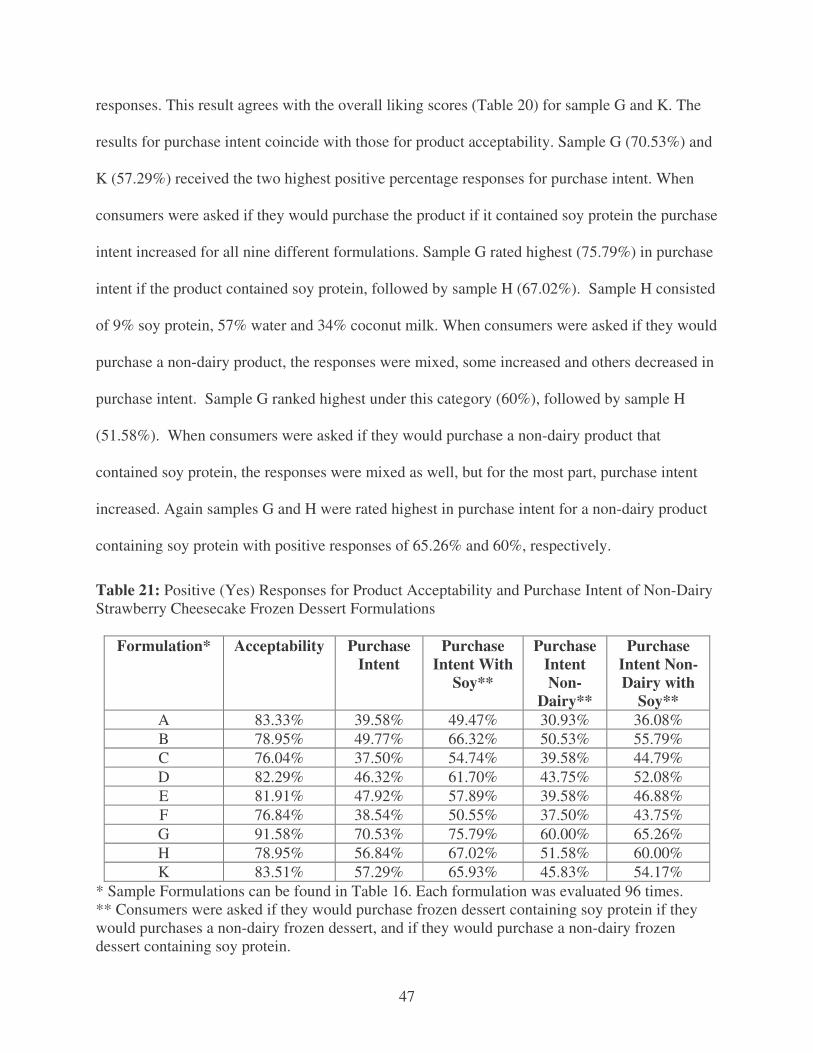
47
responses. This result agrees with the overall liking scores (Table 20) for sample G and K. The
results for purchase intent coincide with those for product acceptability. Sample G (70.53%) and
K (57.29%) received the two highest positive percentage responses for purchase intent. When
consumers were asked if they would purchase the product if it contained soy protein the purchase
intent increased for all nine different formulations. Sample G rated highest (75.79%) in purchase
intent if the product contained soy protein, followed by sample H (67.02%). Sample H consisted
of 9% soy protein, 57% water and 34% coconut milk. When consumers were asked if they would
purchase a non-dairy product, the responses were mixed, some increased and others decreased in
purchase intent. Sample G ranked highest under this category (60%), followed by sample H
(51.58%). When consumers were asked if they would purchase a non-dairy product that
contained soy protein, the responses were mixed as well, but for the most part, purchase intent
increased. Again samples G and H were rated highest in purchase intent for a non-dairy product
containing soy protein with positive responses of 65.26% and 60%, respectively.
Table 21: Positive (Yes) Responses for Product Acceptability and Purchase Intent of Non-Dairy Strawberry Cheesecake Frozen Dessert Formulations
Formulation* Acceptability Purchase
Intent Purchase
Intent With Soy**
Purchase Intent Non-
Dairy**
Purchase Intent Non-Dairy with
Soy** A 83.33% 39.58% 49.47% 30.93% 36.08% B 78.95% 49.77% 66.32% 50.53% 55.79% C 76.04% 37.50% 54.74% 39.58% 44.79% D 82.29% 46.32% 61.70% 43.75% 52.08% E 81.91% 47.92% 57.89% 39.58% 46.88% F 76.84% 38.54% 50.55% 37.50% 43.75% G 91.58% 70.53% 75.79% 60.00% 65.26% H 78.95% 56.84% 67.02% 51.58% 60.00% K 83.51% 57.29% 65.93% 45.83% 54.17%
* Sample Formulations can be found in Table 16. Each formulation was evaluated 96 times. ** Consumers were asked if they would purchase frozen dessert containing soy protein if they would purchases a non-dairy frozen dessert, and if they would purchase a non-dairy frozen dessert containing soy protein.
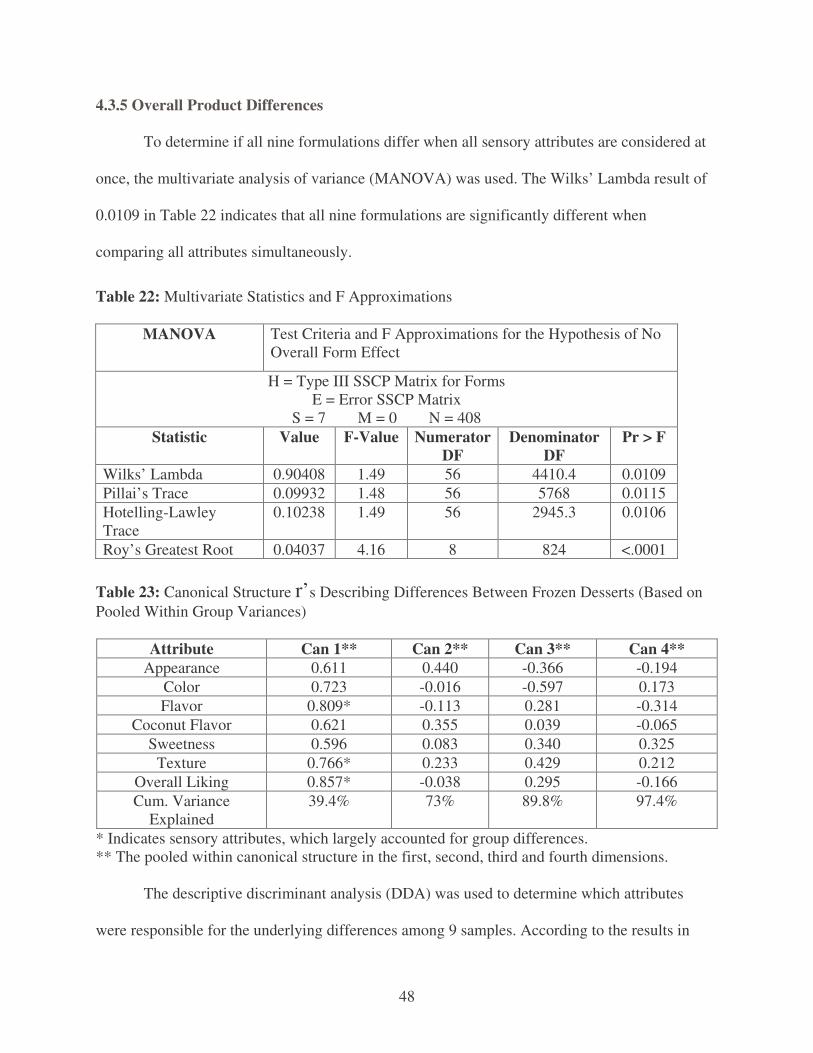
48
4.3.5 Overall Product Differences
To determine if all nine formulations differ when all sensory attributes are considered at
once, the multivariate analysis of variance (MANOVA) was used. The Wilks’ Lambda result of
0.0109 in Table 22 indicates that all nine formulations are significantly different when
comparing all attributes simultaneously.
Table 22: Multivariate Statistics and F Approximations
MANOVA Test Criteria and F Approximations for the Hypothesis of No Overall Form Effect
H = Type III SSCP Matrix for Forms E = Error SSCP Matrix
S = 7 M = 0 N = 408 Statistic Value F-Value Numerator
DF Denominator
DF Pr > F
Wilks’ Lambda 0.90408 1.49 56 4410.4 0.0109 Pillai’s Trace 0.09932 1.48 56 5768 0.0115 Hotelling-Lawley Trace
0.10238 1.49 56 2945.3 0.0106
Roy’s Greatest Root 0.04037 4.16 8 824 <.0001
Table 23: Canonical Structure r’s Describing Differences Between Frozen Desserts (Based on Pooled Within Group Variances)
Attribute Can 1** Can 2** Can 3** Can 4** Appearance 0.611 0.440 -0.366 -0.194
Color 0.723 -0.016 -0.597 0.173 Flavor 0.809* -0.113 0.281 -0.314
Coconut Flavor 0.621 0.355 0.039 -0.065 Sweetness 0.596 0.083 0.340 0.325
Texture 0.766* 0.233 0.429 0.212 Overall Liking 0.857* -0.038 0.295 -0.166 Cum. Variance
Explained 39.4% 73% 89.8% 97.4%
* Indicates sensory attributes, which largely accounted for group differences. ** The pooled within canonical structure in the first, second, third and fourth dimensions.
The descriptive discriminant analysis (DDA) was used to determine which attributes
were responsible for the underlying differences among 9 samples. According to the results in
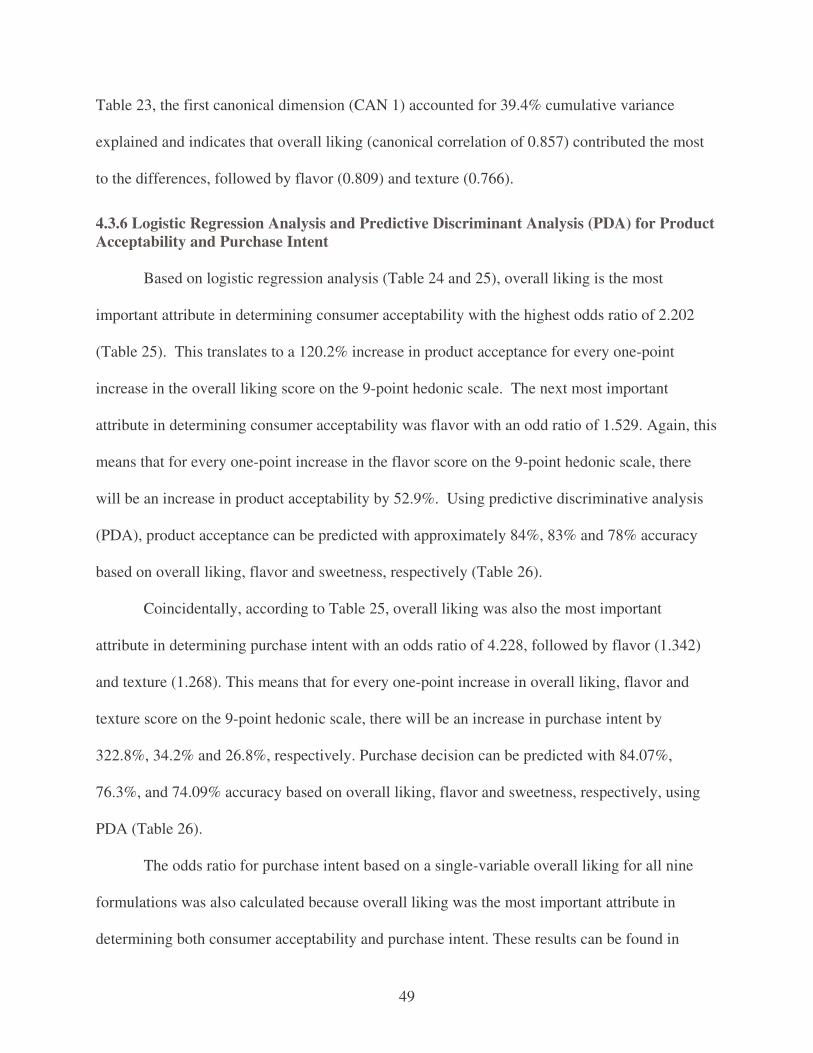
49
Table 23, the first canonical dimension (CAN 1) accounted for 39.4% cumulative variance
explained and indicates that overall liking (canonical correlation of 0.857) contributed the most
to the differences, followed by flavor (0.809) and texture (0.766).
4.3.6 Logistic Regression Analysis and Predictive Discriminant Analysis (PDA) for Product Acceptability and Purchase Intent
Based on logistic regression analysis (Table 24 and 25), overall liking is the most
important attribute in determining consumer acceptability with the highest odds ratio of 2.202
(Table 25). This translates to a 120.2% increase in product acceptance for every one-point
increase in the overall liking score on the 9-point hedonic scale. The next most important
attribute in determining consumer acceptability was flavor with an odd ratio of 1.529. Again, this
means that for every one-point increase in the flavor score on the 9-point hedonic scale, there
will be an increase in product acceptability by 52.9%. Using predictive discriminative analysis
(PDA), product acceptance can be predicted with approximately 84%, 83% and 78% accuracy
based on overall liking, flavor and sweetness, respectively (Table 26).
Coincidentally, according to Table 25, overall liking was also the most important
attribute in determining purchase intent with an odds ratio of 4.228, followed by flavor (1.342)
and texture (1.268). This means that for every one-point increase in overall liking, flavor and
texture score on the 9-point hedonic scale, there will be an increase in purchase intent by
322.8%, 34.2% and 26.8%, respectively. Purchase decision can be predicted with 84.07%,
76.3%, and 74.09% accuracy based on overall liking, flavor and sweetness, respectively, using
PDA (Table 26).
The odds ratio for purchase intent based on a single-variable overall liking for all nine
formulations was also calculated because overall liking was the most important attribute in
determining both consumer acceptability and purchase intent. These results can be found in
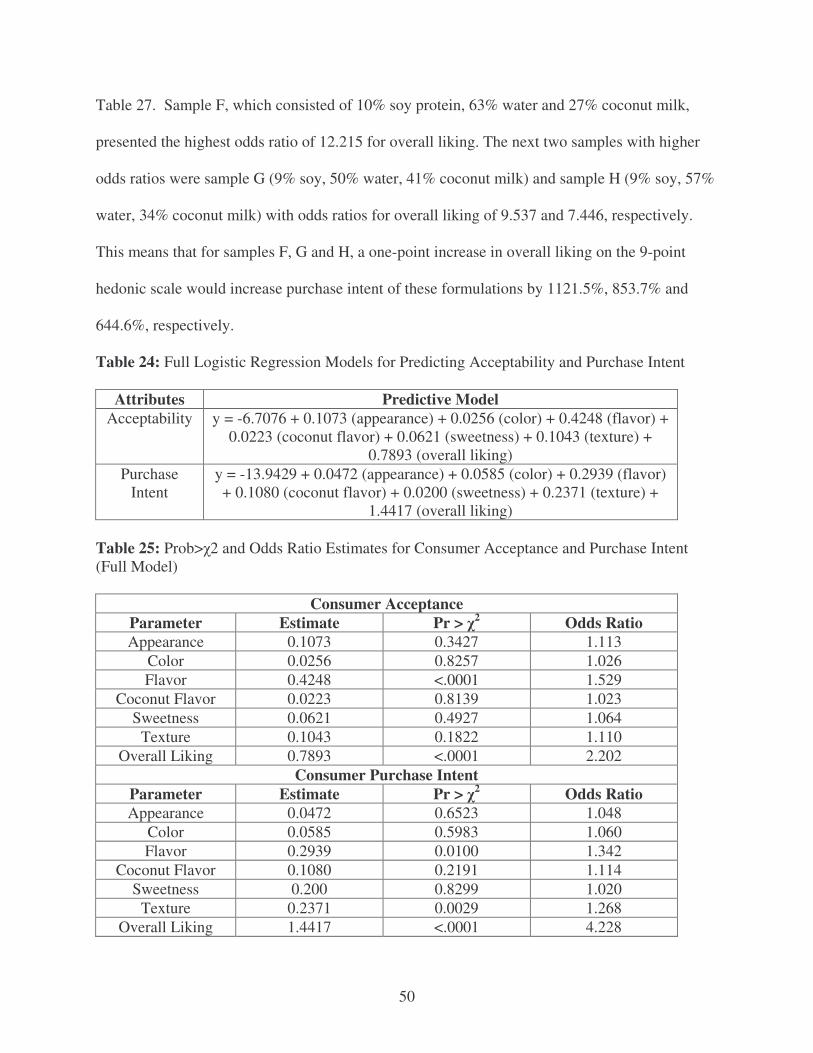
50
Table 27. Sample F, which consisted of 10% soy protein, 63% water and 27% coconut milk,
presented the highest odds ratio of 12.215 for overall liking. The next two samples with higher
odds ratios were sample G (9% soy, 50% water, 41% coconut milk) and sample H (9% soy, 57%
water, 34% coconut milk) with odds ratios for overall liking of 9.537 and 7.446, respectively.
This means that for samples F, G and H, a one-point increase in overall liking on the 9-point
hedonic scale would increase purchase intent of these formulations by 1121.5%, 853.7% and
644.6%, respectively.
Table 24: Full Logistic Regression Models for Predicting Acceptability and Purchase Intent
Attributes Predictive Model Acceptability y = -6.7076 + 0.1073 (appearance) + 0.0256 (color) + 0.4248 (flavor) +
0.0223 (coconut flavor) + 0.0621 (sweetness) + 0.1043 (texture) + 0.7893 (overall liking)
Purchase Intent
y = -13.9429 + 0.0472 (appearance) + 0.0585 (color) + 0.2939 (flavor) + 0.1080 (coconut flavor) + 0.0200 (sweetness) + 0.2371 (texture) +
1.4417 (overall liking)
Table 25: Prob>�2 and Odds Ratio Estimates for Consumer Acceptance and Purchase Intent (Full Model)
Consumer Acceptance Parameter Estimate Pr > �2 Odds Ratio Appearance 0.1073 0.3427 1.113
Color 0.0256 0.8257 1.026 Flavor 0.4248 <.0001 1.529
Coconut Flavor 0.0223 0.8139 1.023 Sweetness 0.0621 0.4927 1.064
Texture 0.1043 0.1822 1.110 Overall Liking 0.7893 <.0001 2.202
Consumer Purchase Intent Parameter Estimate Pr > �2 Odds Ratio Appearance 0.0472 0.6523 1.048
Color 0.0585 0.5983 1.060 Flavor 0.2939 0.0100 1.342
Coconut Flavor 0.1080 0.2191 1.114 Sweetness 0.200 0.8299 1.020
Texture 0.2371 0.0029 1.268 Overall Liking 1.4417 <.0001 4.228
51
Table 26: % Hit Rate for Product Acceptability and Purchase Intent
% Hit Rate Attributes Acceptability Purchase Intent Full Model 85.83% 79.95% Appearance 68.61% 63.13%
Color 72.47% 60.51% Flavor 82.96% 76.31%
Coconut Flavor 64.80% 67.95% Sweetness 78.08% 74.09%
Texture 68.72% 72.91% Overall Liking 83.84% 84.07%
Table 27: Odds Ratio Based on Overall Liking for Purchase Intent (A Single Variable Model)
Sample Odds Ratio A 7.125 B 3.967 C 6.855 D 2.437 E 4.355 F 12.215 G 9.537 H 7.446 K 7.339
4.3.7 Changes in Probability of Purchase Intent
The changes in probability of purchase intent were calculated for overall combined
fomrulations (Table 28) and each of the nine formulations (Table 29) using the comparisons
listed in Table 2. According to Table 29, consumers’ purchase intent did not change when they
were asked if they would purchase a non-dairy product, except for sample K (p = 0.0218).
However, there was a significant decrease in purchase intent when consumers were asked if they
would purchase a soy product versus buying a non-dairy product containing health beneficial soy
protein for all nine formulations with the exception of sample H (p = 0.0522). This means
consumers are willing to sacrifice the dairy for the health benefits of the soy protein. Also, a
significant increase in purchase intent was found on formulations B, C, D, F and H when
52
consumers were asked if they would purchase the product, versus buying the product containing
health beneficial soy protein. For formulations H and K a significant increase in purchase intent
was found when consumers were asked if they would purchase a non-dairy product versus
purchasing a non-dairy product containing health beneficial soy.
The changes in probability of purchase intent were also calculated overall for all nine
formulations combined. According to Table 28, there was no significant difference in purchase
intent, when consumers were asked if they would purchase the product versus purchasing a non-
dairy product containing soy. The positive increase in purchase intent was significant when
consumers were asked if they would purchase the product versus would they purchase the
product not knowing that it contained soy.
Table 28: Changes in Probability of Purchase Intent using the McNemar Test Comparison* �
2 p-value Confidence Interval (95%)
1 47.545 <.0001 0.084 0.148 2 7.475 0.0063 -0.084 -0.014 3 0.875 0.3496 -0.018 0.050 4 56.903 <.0001 -0.124 -0.074 5 30.943 <.0001 0.043 0.089
* Comparisons can be found in Table 2
Table 29: Changes in Probability of Purchase Intent using the McNemar Test
Sample*/ Comparison**
�2 p-value Confidence Interval (95%)
A/1 2.613 0.1060 -0.019 0.210 A/2 2.286 0.1306 -0.190 0.023 A/3 0.290 0.5900 -0.145 0.082 A/4 9.000 0.0027 -0.205 -0.048 A/5 2.273 0.1317 -0.015 0.118 B/1 11.636 0.0006 0.078 0.259 B/2 0.030 0.8618 -0.108 0.129 B/3 1.500 0.2207 -0.037 0.163 B/4 5.556 0.0184 -0.190 -0.020 B/5 1.923 0.1655 -0.021 0.126 C/1 10.667 0.0011 0.073 0.264 C/2 0.250 0.6171 -0.061 0.102 C/3 2.333 0.1266 -0.020 0.165 C/4 7.364 0.0067 -0.160 -0.029
53
(Table 29 Cont’d) C/5 2.273 0.1317 -0.015 0.119 D/1 6.533 0.0106 0.039 0.262 D/2 0.154 0.6949 -0.126 0.084 D/3 1.000 0.3173 -0.050 0.155 D/4 4.765 0.0290 -0.180 -0.012 D/5 3.556 0.0593 -0.002 0.168 E/1 3.522 0.0606 -0.002 0.192 E/2 2.000 0.1573 -0.198 0.031 E/3 0.034 0.8527 -0.120 0.100 E/4 6.250 0.0124 -0.185 -0.025 E/5 3.769 0.0522 0.001 0.145 F/1 6.000 0.0143 0.030 0.234 F/2 0.040 0.8415 -0.112 0.092 F/3 0.862 0.3532 -0.057 0.162 F/4 4.455 0.0348 -0.147 -0.007 F/5 3.600 0.0578 -0.001 0.126 G/1 1.923 0.1655 -0.021 0.126 G/2 3.333 0.0679 -0.216 0.006 G/3 1.087 0.2971 -0.151 0.046 G/4 10.000 0.0016 -0.167 -0.044 G/5 2.778 0.0956 -0.008 0.114 H/1 5.556 0.0184 0.021 0.192 H/2 1.087 0.2971 -0.151 0.046 H/3 0.429 0.5127 -0.063 0.126 H/4 3.769 0.0522 -0.148 -0.001 H/5 6.400 0.0114 0.021 0.147 K/1 2.882 0.0896 -0.010 0.164 K/2 5.261 0.0218 -0.210 -0.019 K/3 0.429 0.5127 -0.125 0.062 K/4 8.333 0.0039 -0.181 -0.039 K/5 6.400 0.0114 0.021 0.146
* Sample Formulations can be found in Table 1. ** Comparisons can be found in Table 2. 4.3.8 Principal Component Analysis
The bi-plot (product – attribute) spaces using principal components 1 and 2 and principal
components 1 and 3 are shown in Figures 3 and 4, respectively. In both figures, it can be seen
that the discriminating attributes for the non-dairy strawberry cheesecake frozen desserts are
appearance, color, flavor and texture. Both figures coincide in that the quadrant with the
discriminating attributes contains only samples H and K. These results coincide somewhat with
those of the descriptive discriminant analysis (DDA) result, where the pooled within canonical
structure in the first dimension identified texture, flavor and color as the three attributes
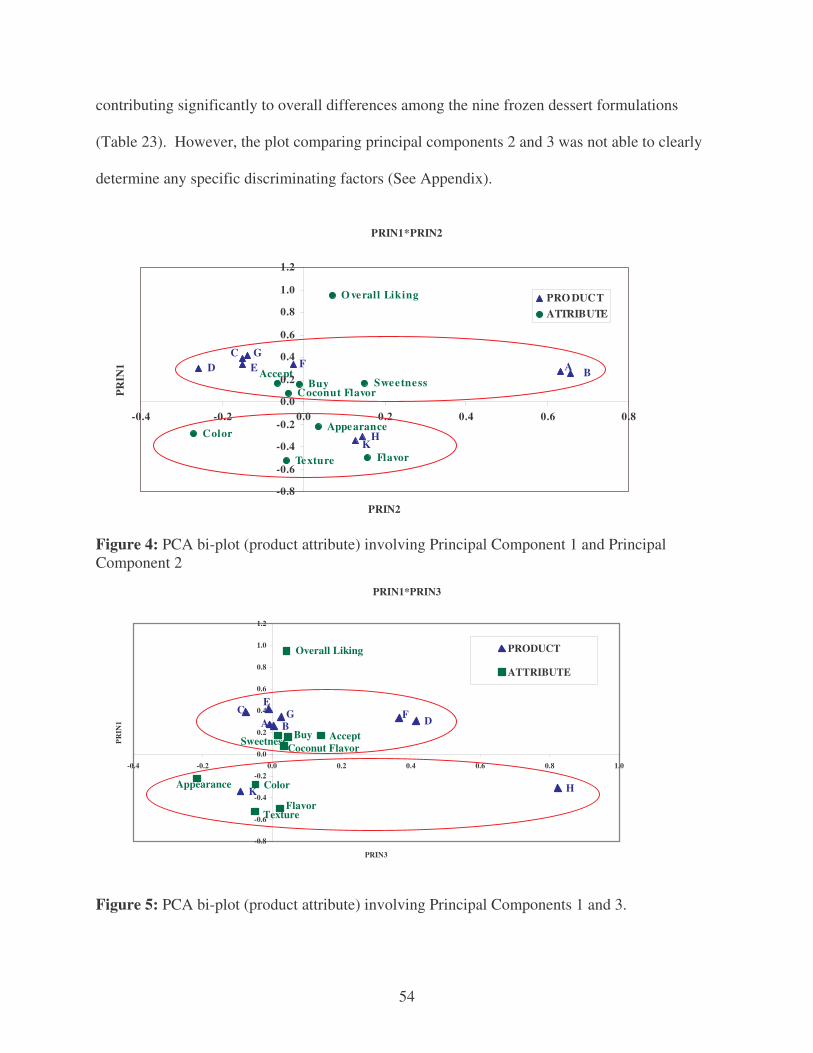
54
contributing significantly to overall differences among the nine frozen dessert formulations
(Table 23). However, the plot comparing principal components 2 and 3 was not able to clearly
determine any specific discriminating factors (See Appendix).
PRIN1*PRIN2
GF
HK
EDC
BA
Flavor
Appearance
Sweetness
O verall Liking
Color
Coconut FlavorBuy
Accept
Texture
-0.8
-0.6
-0.4
-0.2
0.0
0.2
0.4
0.6
0.8
1.0
1.2
-0.4 -0.2 0.0 0.2 0.4 0.6 0.8
PRIN2
PRIN
1
PRO DUCTATTRIBUTE
Figure 4: PCA bi-plot (product attribute) involving Principal Component 1 and Principal Component 2
PRIN1*PRIN3
K
G F
H
E
DC
BA
Appearance Color
TextureFlavor
Sweetness BuyCoconut Flavor
Accept
Overall Liking
-0.8
-0.6
-0.4
-0.2
0.0
0.2
0.4
0.6
0.8
1.0
1.2
-0.4 -0.2 0.0 0.2 0.4 0.6 0.8 1.0
PRIN3
PRIN
1
PRODUCT
ATTRIBUTE
Figure 5: PCA bi-plot (product attribute) involving Principal Components 1 and 3.
55
4.4 Conclusions
This study identified specific sensory attributes driving acceptance and purchase intent of
non-dairy strawberry cheesecake frozen dessert containing soy protein meeting the requirements
of the FDA for health benefits. Four hundred and thirty two consumers participated in this study.
Results of the multivariate analysis showed significant differences among formulations.
Descriptive discriminant analysis showed that overall liking, texture and flavor were the
attributes responsible for the underlying differences among the nine formulations. Logistic
regression results showed that overall liking and flavor were the two most important factors in
determining both consumer acceptance and purchase intent. Principal component analysis bi-
plots confirmed that discriminating attributes included flavor, texture, color and appearance.
Results from the analysis of variance show consumers preferred formulation G, which consisted
of 9% soy protein, 50% water and 41% coconut milk. Formulation G had high mean scores on
the 9-point hedonic scale for all attributes. Formulation G also received the most positive
responses for consumer acceptability (91.58%), purchase intent (70.53%), purchase intent of soy
product (75.79%), purchase intent of non-dairy product (60%) and purchase intent of non-dairy
product containing soy protein (65.26%).
Therefore, the formulation G may have great potential for commercialization with
success. Further consumer and market tests should be conducted to warrant the demand of this
product.
56
CHAPTER 5. SUMMARY AND CONCLUSIONS
Two consumer studies were performed to determine consumer sensory acceptabilities of a
non-dairy frozen dessert containing soy protein and coconut milk. During the first study three
formulations of the frozen dessert were prepared: vanilla, peach and strawberry cheesecake. Each
consumer (n=109) evaluated the three formulations for acceptability of appearance, flavor, color,
coconut flavor, sweetness, texture and overall liking on a 9-point hedonic scale. Product
acceptability and purchase intent were evaluated using binomial type questions (yes/no). On this
first study consumers preferred the strawberry cheesecake formulation with the highest overall
liking mean score of 7.71. It also received highest positive response percentages of 96.33% and
82.57% for acceptability and purchase intent, respectively. With a Wilks’ Lambda p-value of
0.0001, it was concluded that all three samples were different when comparing all attributes
simultaneously. Descriptive discriminant analysis determined overall liking and flavor as the
important attributes responsible for the differences among the three formulations. For product
acceptability overall liking, texture and coconut flavor were the most influential attributes with
an odd ratio of 2.568, 1.529 and 1.513, respectively. Overall liking and flavor were the critical
attributes in determining purchase intent with an odd ratio of 6.679 and 1.643, respectively.
There was a significant difference in purchase intent when consumers were given health
information about soy ingredients in the frozen dessert.
The formulation with highest acceptability (strawberry cheesecake) was chosen to be
furthered analyzed during the second study. Nine different formulations were developed with
varying percentages of soy protein (9%-12%), water (48%-64%) and coconut milk (27%-41%).
According to the Balanced Incomplete Block Design, each consumer (n = 432) evaluated two of
the nine formulations for acceptability of appearance, color, flavor, coconut flavor, sweetness,
57
texture and overall liking on a 9-point hedonic scale. Consumers were also asked to rate the
intensity of the coconut flavor and sweetness as “too weak,” “just about right” and “too strong.”
Product acceptability and purchase intent were determined using binomial type questions
(yes/no). Also, a series of binomial type questions were compared regarding purchase intent
when providing additional information to the consumers. This was performed to determine
changes in probability of purchase intent. For the second study, results proved consumers
preferred formulation G (9% soy protein, 50% water, 41% coconut milk). This formulation
received high mean scores on the 9-point hedonic scale for all attributes. It also received the
highest positive responses for consumer acceptability (91.58%), purchase intent (70.53%),
purchase intent of soy product (75.79%), purchase intent of non-dairy product (60%) and
purchase intent of non-dairy product containing soy protein (65.26%). Multivariate analysis
results showed significant differences among formulations (Wilks’ lambda = 0.0109). DDA
determined overall liking, texture and flavor as the attributes responsible for the differences
among the nine formulations. Overall liking and flavor were the two most important factors in
determining both consumer acceptance and purchase intent. Principal component analysis bi-
plots confirmed that discriminating attributes included flavor, texture, color and appearance.
Consumer purchase intent presented no significant differences when consumers were asked if
they would purchase a frozen dessert versus purchasing a non-dairy frozen dessert. However,
there were significant differences in probability of purchase intent when consumers were asked if
they would purchase a non-dairy product versus purchasing a non-dairy product containing
health beneficial soy protein.
A non-dairy frozen dessert containing coconut milk and FDA required soy protein has not
been commercially developed. Product refinement of this product would ensure higher consumer

58
acceptability and maybe lower the content of saturated fat in order to meet the requirements set
by the FDA to add a health claim for the soy protein contained in this product.
59
REFERENCES
Adlercreutz, H. and Mazur, W. 1997. Phyto-estrogens and Western diseases. Ann. Med. (29) 95-120.
Agresti, A. 1996. An Introduction to Categorical Data Analysis. Wiley and Sons. New York.
312pp. American Heart Association. 2001 Heart and Stroke Statistical Update. Dallas, Texas: American
Heart Association, 2000. Anderson, K.E., Cree, M., Grady, J.J., Josyula, S. Lu, L.J. and Nagamani, M. 2000. Increased
urinary excretion of 2-hydroxyestrone but not 16alpha-hydroxyestrone un premenopausal women during a soya diet containing isoflavones. Cancer Res. 60, 1299-1305.
Augustin, M.A. and Udabage, P. 2003. Dairy ingredients in ice cream. The Australian Journal of
Dairy Technology. 58 (1), 21-25. Badger, T.M., Berhow, M.A. and Rowlands, J.C. 2002. Estrogenic and antiproliferative
properties of soy sapogenols in human breast cancer cells in vitro. Food Chem. Toxicol. 40, 1767-1774.
Badger, T.M., Fang, N., Yu, S. 2004. Comprehensive Phytochemical Profile of Soy Protein
Isolate. J. Agric. Food Chem. 52 (12), 4012-4020. Balachandran, C. and Arumughan, C. 1992. Solubility and electrophoretic characterisitics of
proteins in dfferent regions of coconut endosperm. Journal of Food Science and Technology. 29, 91-96.
Berger, K.G. 1990. Ice Cream. In Food Emulsions. 2nd Ed. Marcel Deker Inc, New York, NY. pp
367-444. Bond, A. 2004. Consumer Sensory Characteristics of Butter Cake Made from Wheat and Rice
Flours. Thesis. Louisiana State University. Baton Rouge. Louisiana. http://etd.lsu.edu/docs/available/etd-07072004-130134
Cancel, L.E. 1979. Coconut food products and bases. In: Coconuts: Production, Processin,
Products. 2nd ed. AVI. Westport, CN. pp209-239. Carrol, K.K. 1991. Review of clinical studies on cholesterol-lowerin response to soy protein. J.
Am. Diet Assoc. 91, 820-827. Cochran, W. G. and Cox, G. M. 1957. Experimental Designs, 2nd Ed. John Wiley & Sons, New
York, NY.
60
Constantinou, A. and Huberman, E. 1995. Genistein as an inducer of tumor cell differentiation: possible mechanisms of action. Proc. Soc. Exp. Biol. Med. 208, 109-115.
Cornell, J. A. 1983. How to Run Mixture Experiments for Product Quality. American Society for
Quality Control. Milwaukee, WS. Davide, C.L., Peralta, C.N., Sarmago, I.G. and Sarmago, LJ. 1990. Yogurt production from a
dairy blend of coconut milk and skim milk powder. Philippine Journal of Coconut Studies. 11, 51-58.
Dohi, K., Yamada, K., Ito, A., Yin, H., Kataoka, T. and Gotoh, T. 1998. Chemoprevention of N-
nitroso-N-methylurea-induced rat mammary cancer by miso and tamoxifen, alone and in combination. Jpn. J. Cancer Res. 89, 487-495.
Duncan, A.M., Jurzer, M.S., Wangen, K.E. and Xu, X. 2000. Soy consumption alters
endogenous estrogen metabolism in postmenopausal women. Cancer Epidemiol. Biomarkers Prev. 9, 781-786.
Edrman, J.W. 2000. Soy protein and cardiovascular disease. A statement for healthcare
professionals form the Nutrition Committee of the AHA. Circulation. 102, 2555-2559. Escueta, E.E., Bourne, M.C., and Hood, L.F. 1985. Effect of coconut cream addition to soymilk
on the composition, texture and sensory properties of tofu. Journal of Food Science. 50, 887-890.
Farley, D. 1995. More people trying vegetarian diets. FDA Consumer. 29 (8), 10-14. Federer, W.T., McCulloch, C.E., and Miles-McDermott, N.J. 1987. Illustrative examples of
principal component analysis. J. Sensory Studies 2(1):37 Fetto, J. 2000. It ain’t easy eating green. American Demographics. 22 (5), 13. Folman, Y. and Pope, G.S. 1966. The interaction in the immature mouse of potent oestrogens
with coumestrol, genistein and other utero-vaginotrophic compounds of low potency. J. Endocrinol. 34, 215-225.
Gacula, M.C. and Singh, J. 1984. Statistical Methods in Food and Consumer Research.
Academic Press, Inc. New York, NY. Gwee, C.N. and Seow, C.C. 1997. Review. Coconut Milk: Chemistry and technology.
International Journal of Food Science and Technology. 32, 189-201. Health Claims: General Requirements. Title 21, Code of Federal Regulations 2003;101:62-65. Health Claims: Soy Protein and Risk of Coronary Heart Disease (CHD). Title 21, Code of
Federal Regulations 2003;101:145-147.
61
Huberty, C. J. 1994. Applied Discriminant Analysis. Wiley and Sons New York. 496 pp. Ice Cream and Frozen Custard. Title 21, Code of Federal Regulations 2003;135:360-363. Implied Nutrient Content Claims and Related Label Statements. Title 21, Code of Federal
Regulations 2003;101: 113-117. International Dairy Foods Association. 2005. www.idfa.org Krog, N. 1991. Thermodynamicsof interfacial films in food emulsions. In Microemulsions and
Emulsions in Foods. ACS Symposium Series 448, pp138-146. Lamartiniere, C.A. 2000. Protection against breast cancer with genistein: a component of soy.
Am. J. Clin. Nutr. 71, 1705S-1707S. Lawless, H. T., and Heyman, H. Sensory Evaluation of Food: Principles and Practices. Chapman
& Hall/International Thomson Pub. New York. 608pp. Lipsch, M. 1986. Ice cream Flavoring. Dairy Ind. Int. 51 (11), 21-25. Loewenstein, M. and Haddad, G.S. 1972a. High temperature short time and ultra high
termperature pasteurization of ice cream. Amer. Dairy Rev. 34 (9), 82, 84, 90, 92, 117, 119.
Loewenstein, M. and Haddad, G.S. 1972b. HTST and UHT pasteurization of ice cream. Part ii:
The influence of varying heat treatments on the effectiveness of some stabilizing agents. Amer. Dairy Rev. 34 (10), 42-46, 52-53.
Marshall, R., H.D. Goff, and R.W. Hartel. 2003. Ice Cream. Kluwer Academic Press, New York,
NY. Marshall, R.T. and Arbuckle, W.S. 1996. Ice Cream. Chapman & Hall, New York, NY. McCray, S. 2003. Lactose Intolerance: Considerations for the Clinician. Practical
Gastroenterology. February, 21-39. McDonough, F.E. and Sarwar, G. 1990. Evaluation of protein digestibility-corrected amino acid
score method for assessing protein quality of foods. J. Assoc. Off. Anal. Chem. 73, 347-356.
Meilgaard, M., Civille, G. V., and Carr, B. T. 1999. Attribute Difference Tests. In Sensory
Evaluation Techniques, 3rd Edition, CRC Press, Boca Raton, Florida. 119pp. Mintel International Group Ltd. 2005. www.marketresearch.com
62
Nutrient Content Claims for Fat, Fatty Acid, and Cholesterol Content of Foods. Title 21, Code of Federal Regulations 2003;101:104-113.
Nutrient Content Claims—General Principles. Title 21, Code of Federal Regulations
2003;101:56-64. Pavon, N. 2003. Sensory Characteristics of Flavored Milk Candies. Thesis. Louisiana State University. Baton Rouge, LA. http://etd.lsu.edu/docs/available/etd-0703103-120331/. Pike, M.C. and Ross, R.K. 2000. Progestins and menopause: epidemiological studies of risks of
endometrial and breast cancer. Steroids. 65, 659-664. Popper, R., Heymann, H., and Rossi, F. 1997. Three multivariate approaches to relating
consumer to descriptive data. In Relating Consumer, Descriptive, and Laboratory Data. A. Munoz, ed. ASTM, West Conshohocken, PA. pp.39-61.
Potter, S. M. 1995. Overview of proposed mechanisms for the hypocholesterolemic effect of soy.
J. Nutr. 125, 606S-611S. Rao, A. and Sung, M.K. 1995. Saponins as anticarcinogens. J. Nutr. 125, 717S-724S. Reference Amounts Customarily Consumed Per Eating Occasion: General Foods. Title 21, Code
of Federal Regulations 2003;101:48-53. Resurreccion, A.V. 1998. Consumer Sensory Testing for Product Development. Aspen
Publishers, Inc. Gaithersburg, Maryland. 254pp. Rothwell, J. 1985. Ice Cream Making. A Practical Booklet. Reading University, UK, pp86-92. SAS version 9.1, 2003. SAS Institute, Inc., Cary, NC. Suarez, F.L., Adshead, J., Furne, J.K., Levitt, M.D. 1998. Lactose maldigestion is not an
impediment to the intake of 1500 mg of calcium daily as dairy products. Am. Jour. Clin. Nutr. 68, 1118-1122.
Sutherland, J.P. and Varnan, A.H. 2001. Milk and Milk Product. Technology, Chemistry and
Microbiology. Aspen Publication, Gaithersburg, Maryland, pp 387-429. United Soybean Board. 2005. www.unitedsoybean.org Vera, T.H., Marteau, P., Korpela, R. 2000. Lactose Intolerance. J. Am. Coll. Nutr. 19, 165S-
175S. Waker, J. 2002. Development of Low-Fat Sugar-Free Orange Sherbet Containing Soy Protein.
Thesis. Louisiana State University. Baton Rouge. Louisiana. http://etd.lsu.edu:8085/docs/available/etd-1108102-173656.

63
Walsh, J. 2002. How Soy Fares In Fight Against Cancer, Heart Disease, Osteoporosis. Environmental Nutrition. 25(5), 4-6.
Young, V.R. 1991. Soy protein in relation to human protein and amino acid nutrition. J. Am.
Diet Assoc. 91, 828-835.
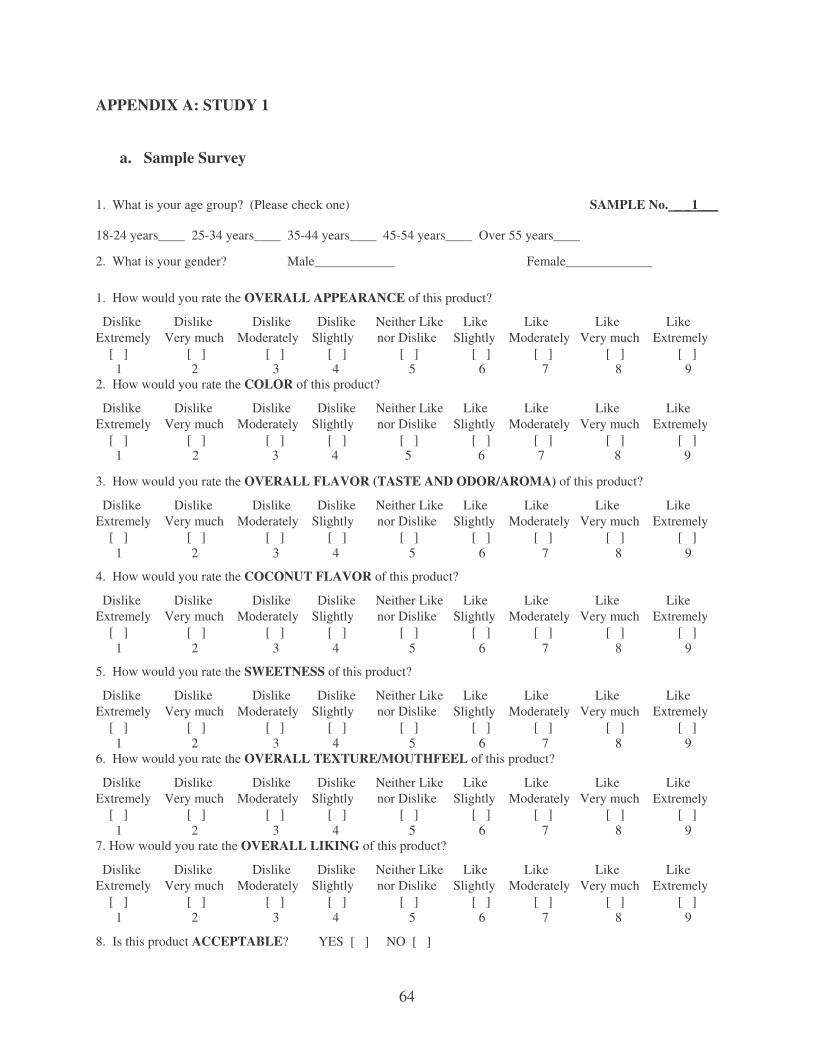
64
APPENDIX A: STUDY 1
a. Sample Survey 1. What is your age group? (Please check one) SAMPLE No. _ _1___ 18-24 years____ 25-34 years____ 35-44 years____ 45-54 years____ Over 55 years____ 2. What is your gender? Male____________ Female_____________ 1. How would you rate the OVERALL APPEARANCE of this product?
Dislike Dislike Dislike Dislike Neither Like Like Like Like Like Extremely Very much Moderately Slightly nor Dislike Slightly Moderately Very much Extremely [ ] [ ] [ ] [ ] [ ] [ ] [ ] [ ] [ ] 1 2 3 4 5 6 7 8 9 2. How would you rate the COLOR of this product?
Dislike Dislike Dislike Dislike Neither Like Like Like Like Like Extremely Very much Moderately Slightly nor Dislike Slightly Moderately Very much Extremely [ ] [ ] [ ] [ ] [ ] [ ] [ ] [ ] [ ] 1 2 3 4 5 6 7 8 9 3. How would you rate the OVERALL FLAVOR (TASTE AND ODOR/AROMA) of this product?
Dislike Dislike Dislike Dislike Neither Like Like Like Like Like Extremely Very much Moderately Slightly nor Dislike Slightly Moderately Very much Extremely [ ] [ ] [ ] [ ] [ ] [ ] [ ] [ ] [ ] 1 2 3 4 5 6 7 8 9 4. How would you rate the COCONUT FLAVOR of this product?
Dislike Dislike Dislike Dislike Neither Like Like Like Like Like Extremely Very much Moderately Slightly nor Dislike Slightly Moderately Very much Extremely [ ] [ ] [ ] [ ] [ ] [ ] [ ] [ ] [ ] 1 2 3 4 5 6 7 8 9 5. How would you rate the SWEETNESS of this product?
Dislike Dislike Dislike Dislike Neither Like Like Like Like Like Extremely Very much Moderately Slightly nor Dislike Slightly Moderately Very much Extremely [ ] [ ] [ ] [ ] [ ] [ ] [ ] [ ] [ ] 1 2 3 4 5 6 7 8 9 6. How would you rate the OVERALL TEXTURE/MOUTHFEEL of this product?
Dislike Dislike Dislike Dislike Neither Like Like Like Like Like Extremely Very much Moderately Slightly nor Dislike Slightly Moderately Very much Extremely [ ] [ ] [ ] [ ] [ ] [ ] [ ] [ ] [ ] 1 2 3 4 5 6 7 8 9 7. How would you rate the OVERALL LIKING of this product?
Dislike Dislike Dislike Dislike Neither Like Like Like Like Like Extremely Very much Moderately Slightly nor Dislike Slightly Moderately Very much Extremely [ ] [ ] [ ] [ ] [ ] [ ] [ ] [ ] [ ] 1 2 3 4 5 6 7 8 9
8. Is this product ACCEPTABLE? YES [ ] NO [ ]
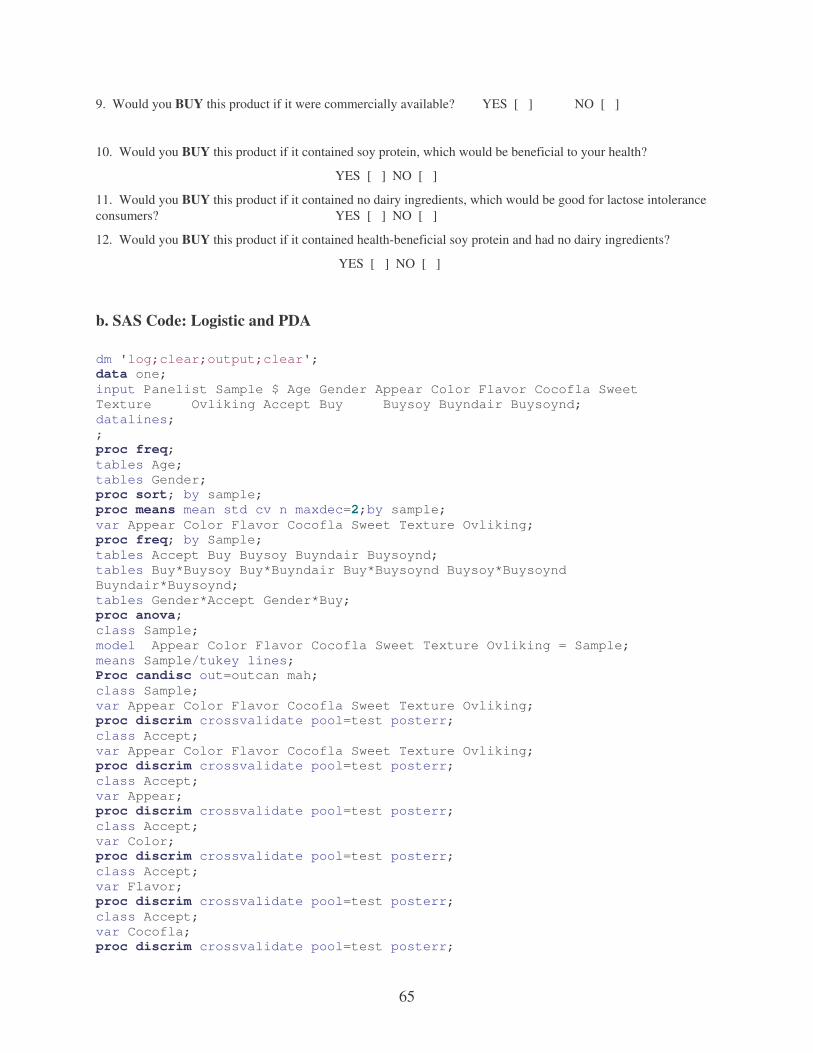
65
9. Would you BUY this product if it were commercially available? YES [ ] NO [ ]
10. Would you BUY this product if it contained soy protein, which would be beneficial to your health?
YES [ ] NO [ ]
11. Would you BUY this product if it contained no dairy ingredients, which would be good for lactose intolerance consumers? YES [ ] NO [ ]
12. Would you BUY this product if it contained health-beneficial soy protein and had no dairy ingredients?
YES [ ] NO [ ]
b. SAS Code: Logistic and PDA
dm 'log;clear;output;clear'; data one; input Panelist Sample $ Age Gender Appear Color Flavor Cocofla Sweet Texture Ovliking Accept Buy Buysoy Buyndair Buysoynd; datalines; ; proc freq; tables Age; tables Gender; proc sort; by sample; proc means mean std cv n maxdec=2;by sample; var Appear Color Flavor Cocofla Sweet Texture Ovliking; proc freq; by Sample; tables Accept Buy Buysoy Buyndair Buysoynd; tables Buy*Buysoy Buy*Buyndair Buy*Buysoynd Buysoy*Buysoynd Buyndair*Buysoynd; tables Gender*Accept Gender*Buy; proc anova; class Sample; model Appear Color Flavor Cocofla Sweet Texture Ovliking = Sample; means Sample/tukey lines; Proc candisc out=outcan mah; class Sample; var Appear Color Flavor Cocofla Sweet Texture Ovliking; proc discrim crossvalidate pool=test posterr; class Accept; var Appear Color Flavor Cocofla Sweet Texture Ovliking; proc discrim crossvalidate pool=test posterr; class Accept; var Appear; proc discrim crossvalidate pool=test posterr; class Accept; var Color; proc discrim crossvalidate pool=test posterr; class Accept; var Flavor; proc discrim crossvalidate pool=test posterr; class Accept; var Cocofla; proc discrim crossvalidate pool=test posterr;

66
class Accept; var Sweet; proc discrim crossvalidate pool=test posterr; class Accept; var Texture; proc discrim crossvalidate pool=test posterr; class Accept; var Ovliking; proc discrim crossvalidate pool=test posterr; class Buy; var Appear Color Flavor Cocofla Sweet Texture Ovliking; proc discrim crossvalidate pool=test posterr; class Buy; var Appear; proc discrim crossvalidate pool=test posterr; class Buy; var Color; proc discrim crossvalidate pool=test posterr; class Buy; var Flavor; proc discrim crossvalidate pool=test posterr; class Buy; var Cocofla; proc discrim crossvalidate pool=test posterr; class Buy; var Sweet; proc discrim crossvalidate pool=test posterr; class Buy; var Texture; proc discrim crossvalidate pool=test posterr; class Buy; var Ovliking; proc sort; by sample; Proc logistic data = one; by sample; model Accept = Appear Color Flavor Cocofla Sweet Texture Ovliking/ ctable pprob= .5 clparm=wald clodds=wald clparm=pl clodds=pl rsquare lackfit; Proc logistic data = one; by sample; model Accept = Appear/ ctable pprob= .5 clparm=wald clodds=wald clparm=pl clodds=pl rsquare lackfit; Proc logistic data = one; by sample; model Accept = Color/ ctable pprob= .5 clparm=wald clodds=wald clparm=pl clodds=pl rsquare lackfit; Proc logistic data = one; by sample; model Accept = Flavor/ ctable pprob= .5 clparm=wald clodds=wald clparm=pl clodds=pl rsquare lackfit; Proc logistic data = one; by sample; model Accept = Cocofla/ ctable pprob= .5 clparm=wald clodds=wald clparm=pl clodds=pl rsquare lackfit; Proc logistic data = one; by sample; model Accept = Sweet/ ctable pprob= .5 clparm=wald clodds=wald clparm=pl clodds=pl rsquare lackfit;

67
Proc logistic data = one; by sample; model Accept = Texture/ ctable pprob= .5 clparm=wald clodds=wald clparm=pl clodds=pl rsquare lackfit; Proc logistic data = one; by sample; model Accept = Ovliking/ ctable pprob= .5 clparm=wald clodds=wald clparm=pl clodds=pl rsquare lackfit; Proc logistic data = one; model Buy = Appear Color Flavor Cocofla Sweet Texture Ovliking/ ctable pprob= .5 clparm=wald clodds=wald clparm=pl clodds=pl rsquare lackfit; run; Proc logistic data = one; by sample; model Buy = Appear/ ctable pprob= .5 clparm=wald clodds=wald clparm=pl clodds=pl rsquare lackfit; Proc logistic data = one; by sample; model Buy = Color/ ctable pprob= .5 clparm=wald clodds=wald clparm=pl clodds=pl rsquare lackfit; Proc logistic data = one; by sample; model Buy = Flavor/ ctable pprob= .5 clparm=wald clodds=wald clparm=pl clodds=pl rsquare lackfit; Proc logistic data = one; by sample; model Buy = Cocofla/ ctable pprob= .5 clparm=wald clodds=wald clparm=pl clodds=pl rsquare lackfit; Proc logistic data = one; by sample; model Buy = Sweet/ ctable pprob= .5 clparm=wald clodds=wald clparm=pl clodds=pl rsquare lackfit; Proc logistic data = one; by sample; model Buy = Texture/ ctable pprob= .5 clparm=wald clodds=wald clparm=pl clodds=pl rsquare lackfit; Proc logistic data = one; by sample; model Buy = Ovliking/ ctable pprob= .5 clparm=wald clodds=wald clparm=pl clodds=pl rsquare lackfit; run;
c. SAS Code: McNemar options nodate nonumber; Data one; Input sample$ BUY BUYKNOW count; datalines; ; run; proc sort; by sample; proc freq; weight count; tables buy*buyknow/agree;by sample;

68
run;
69
APPENDIX B: STUDY 2
a. Research Consent Form
RESEARCH CONSENT FORM I, _____________________, agree to participate in the research entitled “Consumer Acceptance of Non-Dairy Frozen Dessert,” which is being conducted by Dr. Witoon Prinyawiwatkul, Professor of the Department of Food Science at Louisiana State University, phone number (225) 578-5188. I understand that participation is entirely voluntary and whether or not I participate will not affect how I am treated on my job. I can withdraw my consent at any time without penalty or loss of benefits to which I am otherwise entitled and have the results of the participation returned to me, removed from the experimental records, or destroyed. Four hundred and thirty two consumers will participate in this research. For this particular research, about 15-minute participation will be required for each consumer. The following points have been explained to me: 1. In any case, it is my responsibility to report prior participation to the investigators any allergies I may
have. 2. The reason for the research is to gather information on consumer sensory acceptability of non-dairy
ice cream containing soy protein. The benefit that I may expect from it is a satisfaction that I have contributed to solution and evaluation of problems relating to such examinations.
3. The procedures are as follows: Four coded samples will be placed in front of me, and I will evaluate
them by normal standard methods and indicate my evaluation on score sheets. All procedures are standard methods as published by the American Society for Testing and Materials and the Sensory Evaluation Division of the Institute of Food Technologists.
4. Participation entails minimal risk: The only risk that can be envisioned is that of an allergic reaction
to soy products, sugar, coconut, and strawberries. However, because it is known to me beforehand that the foods to be tested contain common food ingredients, the situation can normally be avoided.
5. The results of this study will not be released in any individual identifiable form without my prior
consent unless required by law. 6. The investigator will answer any further questions about the research, either now or during the course
of the project. The study has been discussed with me, and all of my questions have been answered. I understand that additional questions regarding the study should be directed to the investigators listed above. In addition, I understand the research at Louisiana State University AgCenter that involves human participation is carried out under the oversight of the Institutional Review Board. Questions or problems regarding these activities should be addressed to Dr. David Morrison, Associate Vice Chancellor of LSU AgCenter at 578-8236. I agree with the terms above. _______________________________ ________________________________ Signature of Investigator Signature of Participant
Date: __________________________ Witness: _________________________
70
b. Sample Survey
1. What is your age group? (Please check one) SAMPLE No. _ _1___ 18-24 years____25-34 years____35-44 years____45-54 years____ Over 55 years____ 2. What is your gender? Male____________ Female_____________ 1. How would you rate the OVERALL APPEARANCE of this product?
Dislike Dislike Dislike Dislike Neither Like Like Like Like Like Extremely Very much Moderately Slightly nor Dislike Slightly Moderately Very much Extremely [ ] [ ] [ ] [ ] [ ] [ ] [ ] [ ] [ ] 1 2 3 4 5 6 7 8 9 2. How would you rate the COLOR of this product?
Dislike Dislike Dislike Dislike Neither Like Like Like Like Like Extremely Very much Moderately Slightly nor Dislike Slightly Moderately Very much Extremely [ ] [ ] [ ] [ ] [ ] [ ] [ ] [ ] [ ] 1 2 3 4 5 6 7 8 9 3. How would you rate the OVERALL FLAVOR (TASTE AND ODOR/AROMA) of this product?
Dislike Dislike Dislike Dislike Neither Like Like Like Like Like Extremely Very much Moderately Slightly nor Dislike Slightly Moderately Very much Extremely [ ] [ ] [ ] [ ] [ ] [ ] [ ] [ ] [ ] 1 2 3 4 5 6 7 8 9 4. How would you rate the COCONUT FLAVOR of this product?
Dislike Dislike Dislike Dislike Neither Like Like Like Like Like Extremely Very much Moderately Slightly nor Dislike Slightly Moderately Very much Extremely [ ] [ ] [ ] [ ] [ ] [ ] [ ] [ ] [ ] 1 2 3 4 5 6 7 8 9 5. How would you rate the COCONUT FLAVOR of this product? [ ] Too Weak [ ] Just About Right [ ] Too Strong 6. How would you rate the SWEETNESS of this product?
Dislike Dislike Dislike Dislike Neither Like Like Like Like Like Extremely Very much Moderately Slightly nor Dislike Slightly Moderately Very much Extremely [ ] [ ] [ ] [ ] [ ] [ ] [ ] [ ] [ ] 1 2 3 4 5 6 7 8 9 7. How would you rate the SWEETNESS of this product? [ ] Too Weak [ ] Just About Right [ ] Too Strong 8. How would you rate the OVERALL TEXTURE/MOUTHFEEL of this product?
Dislike Dislike Dislike Dislike Neither Like Like Like Like Like Extremely Very much Moderately Slightly nor Dislike Slightly Moderately Very much Extremely [ ] [ ] [ ] [ ] [ ] [ ] [ ] [ ] [ ] 1 2 3 4 5 6 7 8 9 9. How would you rate the OVERALL LIKING of this product?
Dislike Dislike Dislike Dislike Neither Like Like Like Like Like Extremely Very much Moderately Slightly nor Dislike Slightly Moderately Very much Extremely [ ] [ ] [ ] [ ] [ ] [ ] [ ] [ ] [ ] 1 2 3 4 5 6 7 8 9
71
10. Is this product ACCEPTABLE? YES [ ] NO [ ]
11. Would you BUY this product if it were commercially available? YES [ ] NO [ ]
12. Would you BUY this product if it contained soy protein, which would be beneficial to your health?
YES [ ] NO [ ]
13. Would you BUY this product if it contained no dairy ingredients, which would be good for lactose intolerance consumers? YES [ ] NO [ ]
14. Would you BUY this product if it contained health-beneficial soy protein and had no dairy ingredients?
YES [ ] NO [ ]
c. SAS Code: PCA
dm 'log;clear;output;clear'; data one; input Panelist Sample $ Age Gender Appear Color Flavor Cocofla Jarcocon Sweet Jarsweet Texture Ovliking Accept Buy Buysoy Buyndair Buysoynd; datalines; ; proc princomp out = prin; var Appear Color Flavor Cocofla Sweet Texture Ovliking Accept Buy; proc sort; by Sample; proc print; by Sample; var prin1 prin2 prin3; proc means; by Sample; var prin1 prin2 prin3; run;
d. SAS Code: Logistic Regression, PDA, ANOVA, MANOVA, DDA dm 'log;clear;output;clear'; data one; input Panelist Sample $ Age Gender Appear Color Flavor Cocofla Jarcocon Sweet Jarsweet Texture Ovliking Accept Buy Buysoy Buyndair Buysoynd; datalines; ; proc sort; by Sample; proc means mean std cv n maxdec=2;by Sample; var Appear Color Flavor Cocofla Sweet Texture Ovliking; proc freq;by Sample; tables Age Gender Jarcocon Jarsweet Accept Buy Buysoy Buyndair Buysoynd; tables Buy*Buysoy Buy*Buyndair Buy*Buysoynd Buysoy*Buysoynd Buyndair*Buysoynd; proc anova; class Sample; model Appear Color Flavor Cocofla Sweet Texture Ovliking = Sample;

72
means Sample/tukey lines; Proc candisc out=outcan mah; class Sample; var Appear Color Flavor Cocofla Sweet Texture Ovliking; proc discrim crossvalidate pool=test posterr; class Accept; var Appear Color Flavor Cocofla Sweet Texture Ovliking; proc discrim crossvalidate pool=test posterr; class Accept; var Appear; proc discrim crossvalidate pool=test posterr; class Accept; var Color; proc discrim crossvalidate pool=test posterr; class Accept; var Flavor; proc discrim crossvalidate pool=test posterr; class Accept; var Cocofla; proc discrim crossvalidate pool=test posterr; class Accept; var Sweet; proc discrim crossvalidate pool=test posterr; class Accept; var Texture; proc discrim crossvalidate pool=test posterr; class Accept; var Ovliking; proc discrim crossvalidate pool=test posterr; class Buy; var Appear Color Flavor Cocofla Sweet Texture Ovliking; proc discrim crossvalidate pool=test posterr; class Buy; var Appear; proc discrim crossvalidate pool=test posterr; class Buy; var Color; proc discrim crossvalidate pool=test posterr; class Buy; var Flavor; proc discrim crossvalidate pool=test posterr; class Buy; var Cocofla; proc discrim crossvalidate pool=test posterr; class Buy; var Sweet; proc discrim crossvalidate pool=test posterr; class Buy; var Texture; proc discrim crossvalidate pool=test posterr; class Buy; var Ovliking; Proc logistic data = one; model Accept = Appear Color Flavor Cocofla Sweet Texture Ovliking/ ctable pprob= .5 clparm=wald clodds=wald clparm=pl clodds=pl rsquare lackfit; Proc logistic data = one;
73
model Buy = Appear Color Flavor Cocofla Sweet Texture Ovliking/ ctable pprob= .5 clparm=wald clodds=wald clparm=pl clodds=pl rsquare lackfit; Proc sort; by Sample; Proc logistic data = one; by Sample; model Buy = Appear Color Flavor Cocofla Sweet Texture Ovliking/ ctable pprob= .5 clparm=wald clodds=wald clparm=pl clodds=pl rsquare lackfit; run;
e. SAS Code: McNemar Test
options nodate nonumber; Data one; Input sample$ BUY BUYKNOW count; */A1: Buy vs. Buysoy, A2: Buy vs. Buynodairy, A3: Buy vs. Buysoynodairy, A4:Buysoy vs. Buysoynodairy, A5: Buynodairy vs. Buysoynodairy/*; datalines; ; run; proc sort; by sample; proc freq; weight count; tables buy*buyknow/agree;by sample; run;
f. PCA bi-plot (product attribute) involving Principal Component 2 and Principal Component 3
PRIN2*PRIN3
AB
C
D
E
F
G
HK
Appearance
Color
Flavor
Coconut Flavor
Sweetness
Accept
Overall LikingBuy
Texture
-0.4
-0.2
0.0
0.2
0.4
0.6
0.8
-0.4 -0.2 0.0 0.2 0.4 0.6 0.8 1.0
PRIN3
PRIN
2
PRODUCTATTRIBUTE
74
VITA
Luciana Soler was born on May 30th, 1978 in San Jose, Costa Rica. At the age of twelve,
she moved to Joao Pessoa, Brazil where she graduated from high school. In May 2001 she
graduated from Nicholls State University in Thibodaux, Louisiana, receiving a Bachelor of
Science in agricultural business with a double minor in business administration and plant
science. She is a candidate for a Master of Science from the Department of Food Science at
Louisiana State University and Agricultural and Mechanical College in December 2005.


![35387938 925 the Ultimate Frozen Dessert Book[1]](https://img.pdfslide.us/doc/110x75/577cd9f71a28ab9e78a48c90/35387938-925-the-ultimate-frozen-dessert-book1.jpg)