Embed Size (px)
Citation preview

Vol 9, Issue 1, 2016 ISSN - 0974-2441
DEVELOPMENT OF MULTIPARTICULATE FORMULATION AND EVALUATION OF COLON TARGETED DRUG DELIVERY SYSTEM OF KETOPROFEN: IN VIVO STUDY WITH INDUCED
COLITIS MODEL IN RATS AND GAMMA SCINTIGRAPHY
NALANDA TULSIRAM RANGARI1*, PRASHANT K PURANIK2
1Department of Pharmacy, Swami Ramanand Teerth Marathwada University, Nanded, Maharashtra, India. 2Department of Pharmaceutical Sciences Rashtrasant Tukadoji Maharaj Nagpur University, Maharashtra, India. Email: [email protected]
Received: 26 August 2015, Revised and Accepted: 07 October 2015
ABSTRACT
Objectives: To develop a multiparticulate containing chitosan and guar gum for the treatment of ulcerative colitis.
Methods: The formulation of multiparticulate was done by extrusion spheronization method using Eudragit L-100 and Eudragit S-100 as a coating solution and Ketoprofen as a model drug.
Results: Preliminary trial batches were previously assessed for physicochemical characterization, in vitro release, ex vivo mucoadhesion study, swelling studies, and in vivo evaluation and showed that the formulations appeared to be a good candidate to deliver the drug to the colon. Box-Behnken design was used to statistically optimize the formulation parameters and evaluate the main effects, interaction effects, and quadratic effects of the process parameters of enteric coated multiparticulate on drug polymer ratio and coat composition. In this work, the effectiveness of optimized batch (K10) in the treatment of inflammatory bowel disease was evaluated. Experimentally, colitis was induced by rectal instillation of 2, 4, 6, trinitrobenzene sulfonic acid into male Wistar rats. The histological evaluations were done as inflammatory indices. In vivo gamma scintigraphy studies of multiparticulate without drug demonstrate degradation of multiparticulate whenever they reach the colon.
Conclusion: Results of studies like Gamma Scintigraphy and Histological study of optimized formulation (K10) clearly indicate that there is a great potential in the delivery of Ketoprofen to the colonic region. The animals treated with Ketoprofen (K10) formulation had an improvement in pathology and may be useful for the treatment of inflammatory bowel disease.
Keywords: Chitosan, Guar gum, Ketoprofen, Gamma scintigraphy, Histology, Ulcerative colitis, Box-Behnken design.
INTRODUCTION
Colon targeting has application in several therapeutic areas such as colon cancer, ulcerative colitis, irritable bowel syndrome, or the administration of drugs that are adversely affected by the upper gastrointestinal (GI) tract. The colon is an ideal site for protein and peptide absorption. Acidic and enzymatic degradation are major obstacles in the oral administration of peptide drugs but by targeting to the colon the proteolysis can be minimized. There has been considerable research in the design of colonic delivery systems and targeting has been achieved by several ways. The primary approaches to the colonic delivery of the drugs included prodrugs, coating with pH-sensitive, and time-dependent polymers. Eudragit L-100 and Eudragit S-100 are used as an enteric coating material to keep the multiparticulates intact and not to release the drug in stomach and or upper intestine. Natural polysaccharides, such as pectin chitosan xylan and guar gum, are not digested in the human stomach or small intestine but are degraded in the colon by resident bacteria. Chitosan is a cationic natural copolymer of glucosamine, obtained from the deacetylation of chitin which is the second most abundant polysaccharide after cellulose in the world. It has been widely used in the several pharmaceutical formulations as controlled release carrier systems such as beads, gels, films, sponges, and multiparticulates for its many unique properties such as low-toxicity, biocompatibility and biodegradability Chitin is a polysaccharide composed of β-(1-4) linked N-acetyl D glucosamine unit. Chitosan is a weak base and is insoluble in water and organic solvents, however, it is soluble in dilute aqueous acidic solution (pH <6.5), which can convert the glucosamine unit to R-NH+ 3. In pharmaceutical formulations, chitosan is used as a vehicle for directly compressed tablets disintegrating, binding and granulating agent [1].
Ketoprofen, chemically 2-(4-isobutylphenyl) propionic acid, is a non-steroidal anti-inflammatory and analgesic drug used widely in the treatment of patients with rheumatic diseases. It acts by inhibiting cyclooxygenase-1 (COX-1) and COX-2 activities and thereby inhibiting the synthesis of prostaglandin. The rationale in the development of a polysaccharide-based delivery system for colon is the ability of the colonic microflora to degrade various types of polysaccharides that escape small bowel digestion. Ketoprofen is one of the most widely used therapeutic substances due to its analgesic, antipyretic and anti-inflammatory properties. Despite the proliferation in the development of new non-steroidal anti-inflammatory drugs (NSAIDs), Ketoprofen remains one of the most effective “over-the-counter” drugs in the treatment of rheumatoid arthritis disease. The aim of the present investigation was to target the enteric coated multiparticulate of Ketoprofen to colon for the successful treatment of ulcerative colitis using experimental designs which allows systematic optimization procedures carried out by selecting an objective function, finding the most important or contributing factors and investigating the relationship between responses and factors by the so-called response surface methodology (RSM).
METHODS
MaterialsChitosan of medium molecular weight, Ketoprofen and Guar Gum were obtained from Space Lab (Nasik, Maharashtra, India). 2, 4, 6, trinitrobenzene sulfonic acid were purchased from Vishal Chem (Mumbai, Maharashtra, India). Eudragit L-100 and Eudragit S-100 were obtained as a gift sample from Concept Pharmaceutical (Aurangabad, Maharashtra, India).
Research Article

Asian J Pharm Clin Res, Vol 9, Issue 1, 2016, 219-237 Rangari and Puranik
220
Preparation of multiparticulate of ciprofloxacinThe multiparticulate of Ketoprofen was prepared using the extrusion-spheronization technique (RIMEK, Kalweka HD410AC, Gujarat, India). Briefly, Chitosan and Guar gum were the first mixed using a laboratory blender (LB100 Laboratory Blender; REMI, Mumbai, India) for 10 minutes, and deionized water was added with further mixing (15 minutes) for the production of wet mass. The wet mass was extruded with an extruder (sieve opening 1 mm; screen thickness 3.25 mm; 15 rpm; extrudate cut off at a length of approximately 2-3 mm) and spheronization of the extrudate in a spheronizer (spheronization speed 2200 rpm; spheronization time about 5 minutes) [2]. Multiparticulate in the size fraction 1.1-1.4 mm (N75% yield in this size range) was used in the subsequent studies. The resultant multiparticulate were dried in a fluidized bed dryer at 30°C until the loss on drying, was <2.5 wt % (Labultima, LU222 Advanced, Mumbai, India). Table 1 trial batches.
Coating of multiparticulateThe enteric coating was done using conventional coating pan. About 10% (w/w) solutions of polymethacrylates (Eudragit L100 and Eudragit S100) were prepared in isopropyl alcohol:water (9:1) mixture. The ratios of Eudragit S100:Eudragit L100 was 1:1 the enteric coating was done using conventional coating pan, and 10% (w/w) solutions of polymethacrylates (Eudragit L100 and Eudragit S100) were prepared in isopropyl alcohol:water (9:1) mixture. The ratios of Eudragit S100:Eudragit L100 was 1:1 The solution was plasticized with castor oil (20%, w/w, with respect to dry polymer), titanium dioxide (0.05%w/v), and then talc was added as glidant (5%, w/w, related to dry polymer). The enteric coating dispersion was passed through a 0.3 mm sieve before use. Throughout the coating process, the coating dispersion was stirred using a magnetic stirrer. The parameters of
the film-coating process were as follows: pan rotating speed 20 rpm, atomizing air pressure 2 bar, inlet air temperature 60-70°C, outlet air temperature 35-40°C, multiparticulate bed temperature 38°C; the coating solution was applied through a 1.1 mm spray nozzle. The film-coated multiparticulate was not removed from the pan until complete weight gain was achieved. All the multiparticulate was stored in a vacuum desiccator at room temperature until used. A series of coated products with different film thicknesses were produced, quantified by the percentage total weight gain, by varying the amount of coating solution sprayed [3].
Experimental design for optimization [4-6]RSM is a widely practiced approach in the development and optimization of drug delivery devices. Based on the principle of design of experiments, the methodology encompasses the use of various types of experimental designs, generation of polynomial equations, and mapping of the response over the experimental domain to determine the optimum processing variables. The technique requires minimum experimentation and time, thus proving to be far more effective and cost-effective than the conventional methods of formulating dosage forms. Box-Behnken design was used to statistically optimize the formulation parameters and evaluate the main effects, interaction effects, and quadratic effects of the process parameters of enteric coated multiparticulate on drug polymer ratio and coat composition Table 2. A 3-factor, the 3-level design was used to explore the quadratic and linear response surfaces using Design Expert Software (Version 9.0.1, Stat-Ease Inc., and Minneapolis, MN). The statistical validity of the polynomials was established on the basis of analysis of variance (ANOVA) provision in the design expert software. The level of significance was considered at p<0.05. The best fitting mathematical model was selected based on the comparison of several statistical parameters, including the coefficient of variation (CV), the multiple correlation coefficients (R2), the adjusted R2 (adjusted R2), and the predicted residual sum of squares (PRESS), provided by the software. PRESS indicates how well the model fits the data, and for the chosen model, it should be small relative to the other models under consideration. The 3-D response surface graphs and the 2-D contour plots were also generated by the Design Expert software. These plots are very useful to see interaction effects of the factors on responses. The experimental design was done for, optimization of polymer optimization of coat composition (Eudragit S and L 100). Box-Behnken design was applied in the present study by considering chitosan, guar gum and coat composition (Eudragit S and L 100) as independent variables and entrapment efficiency, mucoadhesion, percent drug release at 9 hrs, 12 hrs, 18 hrs, and 24 hrs as dependent variables.
Table 1: Preliminary trial batches of multiparticulate
Batch code for Ketoprofen
Drug: Polymer ratio (wt/wt)
Polymer ratio (CH: GG) wt/wt
K1a 1:1 1:1K2a 1:1 1:1.5K3a 1:1 1.5:1K4a 1:1 1:2K5a 1:1 2:1K1b 1:1 1:1K2b 1:1 1:1.5K3b 1:1 1.5:1K4b 1:1 1:2K5b 1:1 2:1Coat composition: a=10%, b=15%
Table 2: Factorial batches for Ketoprofen
Batch code
Variable level A
Variable level B
Variable level C
Chitosan (mg)
Guar gum (mg)
Coat composition (%)
K1 0 −1 1 70 50 15K2 0 0 0 70 70 12.5K3 0 0 0 70 70 12.5K4 0 0 0 70 70 12.5K5 0 1 1 70 100 15K6 1 1 0 100 100 12.5K7 0 0 0 70 70 12.5K8 0 1 −1 70 100 10K9 −1 0 −1 50 70 10K10 1 0 −1 100 70 10K11 −1 0 1 50 70 15K12 −1 1 0 50 100 12.5K13 0 0 0 70 70 12.5K14 1 0 1 100 70 15K15 0 −1 −1 70 50 10K16 1 −1 0 100 50 12.5K17 −1 −1 0 50 50 12.5Variable level: Low (−1), Medium (0), High (1)

Asian J Pharm Clin Res, Vol 9, Issue 1, 2016, 219-237 Rangari and Puranik
221
The following table shows the different variables and its levels used in the optimization design. Using these variables at different three levels, the trials were designed.
Assay of KetoprofenAn accurately weighed quantity of about 10 mg of a pure drug of Ketoprofen was dissolved in methanol and diluted to 100 ml. Further dilutions carried out to get a final concentration of 100 µg/ml. Concentrations of sample solution were observed in multipoint calibration curve of quantitative mode at 254 nm by linear regression equation method. Ketoprofen contains not <98.5% and not more than 101% of C16H14O3 calculated on dried basis.
UV spectroscopy (determination of λmax) for KetoprofenAppropriate dilutions were prepared for drug from the standard stock solution and scanned in the spectrum mode from 400 nm to 200 nm. Ketoprofen showed absorbance maxima at 254 nm.
Standard calibration curve of KetoprofenFrom the standard stock solution of Ketoprofen, appropriate aliquots were pipette out into 10 ml volumetric flasks, and dilutions were made with methanol to obtain working standard solutions of concentrations 05-30 µg/ml. Absorbance for these solutions were measured at 254 nm, and a calibration curve of absorbance against concentration was plotted.
Drug excipient compatibility studyInfrared (IR) spectrum interpretation for KetoprofenThe IR absorption spectrum of pure Ketoprofen and the physical mixture of Ketoprofen polymer samples were recorded on Fourier transform-IR spectrophotometer (Model-8400S, Perkin Elmer, Japan), and the spectrum analysis was done for functional groups and drug excipient compatibility.
Differential scanning calorimetry (DSC) for KetoprofenThe DSC thermograms of pure drug Ketoprofen, multiparticulate and its physical mixture were carried out to investigate any possible interaction between the drug and the utilized mucoadhesive polymer. The temperature range was selected from 40°C to 390°C at an increase in 10°C per minute (Figs. 19-21).
Evaluation of multiparticulateMicromeritics studies of multiparticulates: 64, 65The multiparticulates were characterized by their Micromeritics properties, such as particle size, bulk density, tapped density, Carr’s compressibility index, Hausner ratio, and flow property.
Particle size determinationThe particle size was determined using an optical microscope under the regular polarized light, and the mean particle size was calculated by measuring 50-100 particles with the help of a calibrated ocular micrometer.
Determination of bulk densities, tapped densities, and angle of reposeBulk densityThe bulk density was obtained by dividing the mass of powder by the bulk volume in cm3. The sample of about 10 cm3 of powder was carefully introduced into a 25 ml graduated cylinder. The cylinder was dropped at 2-second intervals onto a hard wood surface 3 times from a height of 1 inch. The bulk density of each formulation was then obtained by dividing the weight of the sample in grams by the final volume in cm3 of the sample contained in the cylinder. It was calculated using equation given below:
Df = M/Vp
Where,Df = Bulk densityM = Weight of samples in gramsVp = Final volumes of granules in cm3.
Tapped densityThe tapped density was obtained by dividing the mass of powder by the tapped volume in cm3. The sample of about 10 cm3 of powder is carefully introduced into a 25 ml graduated cylinder. The cylinder was dropped at 2-second intervals onto a hard wood surface 100 times from a height of 1 inch. The tapped density of each formulation was then obtained by dividing the weight of the sample in grams by the final tapped volume in cm3 of the sample contained in the cylinder. It was calculated using equation given below:
Do = M/Vp
Where,Do = bulk densityM = weight of samples in gramsVp = final tapped volumes of granules in cm3.
The angle of reposeThe angle of repose (θ), i.e., flow property of the multiparticulates, which measures the resistance to particle flow, was calculated as:
Tan θ = 2H/D
Where, 2H/D is the surface area of the freestanding height of the multiparticulates heap that is formed after making the multiparticulates flow from the glass funnel.
Swelling studies of multiparticulates [7,8]A known weight (100 mg) of various multiparticulates without drug was placed in phosphate buffer, pH 7.4 and allowed to swell for the required period of time at 37±0.5°C using the USP dissolution apparatus with the dissolution basket assembly at 100 rpm. The multiparticulate particles were periodically removed blotted with filter paper and their changes in weight were measured during the swelling until equilibrium was attained. Finally, the weight of the swollen multiparticulate particles was recorded after a time period of 4 hrs and the swelling ratio (SR) was then calculated from the formula:
SR = (We-Wo)/Wo
Where Wo “is the initial weight of the dry multiparticulate” and we “is the weight of the swollen multiparticulate at equilibrium swelling” in the media. Each experiment was repeated 3 times and the average value/standard deviation was taken as the SR value.
Percentage yield (i.e., recovery) of multiparticulates formedThe percentage yield of multiparticulate was determined by weighing after drying. The measured weight of prepared multiparticulates was divided by the total amount of all the non-volatile components used for the preparation of the multiparticulates, which gave the total percentage yield of multiparticulates.
% yield = (Actual weight of product/total weight of excipient and drug) × 100
Drug content determinationMultiparticulates equivalent to 150 mg of the drug ciprofloxacin was taken for evaluation. The amount of drug entrapped was estimated by crushing the multiparticulates and extracting in 100 ml methanol. After 24 hrs, the extract was transferred to a 100 ml volumetric flask, and the volume was made up using methanol. The solution was filtered, and the absorbance was measured after suitable dilution spectrophotometrically at 254 nm against methanol as a blank.

Asian J Pharm Clin Res, Vol 9, Issue 1, 2016, 219-237 Rangari and Puranik
222
The amount of drug entrapped in the multiparticulates was calculated by the following formula.
% Drug entrapmentCalculated drug concentration
Theoretical=
drug concentration×100
Placebo multiparticulates were used as a reference.
Ex vivo mucoadhesion studyThe mucoadhesive property of the multiparticulate is evaluated on goat’s intestinal mucosa by using phosphate buffer, as per monograph. Weighed microspheres are spread onto wet rinsed tissue specimen and immediately thereafter the slides are hung onto the arm of a USP tablet disintegrating test machine with suitable support at 37°C. The weight of microspheres leached out at different intervals is measured. The % mucoadhesion is calculated by the following equation.
% Mucoadhesion = Wa-W1/Wa × 100
Where,Wa is the weight of multiparticulate appliedW1 is the weight of multiparticulate leached out
Dissolution test (in-vitro drug release) of multiparticulatesIn vitro dissolution test was conducted in USP 2 apparatus at 50 rpm and a temperature of 37±0.5°C. Sampling was done at predetermined time intervals and the same were estimated for drug content after suitable dilution by using double beam UV-VIS spectrophotometer. Initial drug release studies were conducted in 900 ml of 0.1N HCl for 2 hrs followed by 900 ml of 7.4 potassium phosphate buffer solution for next 3 hrs. Then, 900 ml of 6.8 potassium phosphate buffer solution for rest of the time 16. Samples were filtered and assayed by ultraviolet spectrophotometry at 254 nm. The concentration of each sample was determined from a predetermined calibration curve for Ketoprofen.
OptimizationOn the basis of evaluation parameters such as entrapment efficiency, percent yield, swelling studies, ex vivo mucoadhesion and dissolution characteristics of the factorial batches of Ketoprofen, which has shown the best results was optimized and selected for formulation of final dosage form (capsule) and advanced studies such as X-ray diffraction (XRD), DSC, scanning electron microscopy (SEM), in-vivo studies (gamma scintigraphy), and histopathological evaluation was performed.
Advanced studies on optimized batch of multiparticulatesXRD studyXRD measurements were made using Make: BRUKER, Germany, Model: D8 Advance, Source: 2.2 KW Cu Anode, Dermic X-ray tube, Detector: Lynux Eye Detector, Beta Filter: Ni Filter Sample Holder: Zero Background and PMMA. The X-ray generator was operated at 40 kV and 30 m A, using the Cu K line at 1.540600 Å as the radiation source.
Each powdered specimen was packed in a specimen holder made of glass. In setting up the specimen and apparatus, coplanarity of the specimen surface with the specimen holder surface, and the setting of the specimen holder at the position of symmetric reflection geometry were ensured. The powders were passed through a 100 mesh sieve and were placed into the sample holder by the side drift technique. The holder consisted of a central cavity. To prepare a sample for analysis, a glass slide was clipped to the top face of the sample holder so as to form a wall. The powder sample was filled into the holder, gently tapped and used for XRD measurement. 10 mg of each sample was scanned at 25°C from 10° to 70° and in step size of 0.019724 and count time of 46.5 s, using an automatic divergence slit assembly and a proportional detector. Relative intensities were read from the strip charts and corrected to fixed slit values.
DSC studies of optimized multiparticulates
Thermogram of samples was obtained by a Perkin-Elmer DSC. Samples of 10 mg were accurately weighed into aluminum pans and then hermetically sealed with aluminum lids. The thermograms of samples were obtained at a scanning rate of 10°C/minutes over a temperature range of 40-390°C.
Morphological study using SEMThe surface topography of the coated (optimized) multiparticulate examined under an FEI-Philips XL-30 analytical electron microscope (IIT, Pawai). The sample was loaded on the copper sample holder and sputter coated with platinum.
In vivo gamma scintigraphy study [9]The experiment was conducted in the laboratory of Spect Lab Nuclear Medicine, PUNE. The study reported here adheres to the principle of Laboratory Animal care and were approved by the Institutional Ethical Committee permitted by the IAEC with the CPCSEA registration number AVCOP/IAEC/1153/01. Wistar rats, weighing 200-250 g were taken for the study. The animals were fasted for 12 hrs prior to the commencement of the experiment. Radiolabled (>90%) multiparticulates (50 mg) of the formulation without drug was administered orally to the animals with the help of feeding tube, followed by sufficient volume of drinking water. All four legs of rat were tied over a piece of plywood, and the location of the formulation in GI tract was monitored keeping the subject in front of gamma camera. The total radiation dosimetry for each rat was 0.1 mSv. Scintigraphy image was captured using a Siemens E-Cam gamma camera fitted with a LEHR collimator. The image schedule was as follows: Immediate, 15 minutes, 30 minutes, 60 minutes, 120 minutes, 180 minutes, 240 minutes, 300 minutes, and 360 minutes. During the gamma scintigraphy scanning, the animals were freed and allowed to move and carry out normal activity.
Histopathology evaluationThe study reported here adheres to the principle of laboratory animal care and were approved by the Institutional Ethical Committee AVCOP/IAEC/1153/01.
Induction of inflammation by 2, 4, 6, trinitrobenzene sulfonic acid [10]These studies were carried out on Wistar male rats aged 8-12 weeks and weighing 230-250 g. Animals were housed in an air-conditioned room at 22±3°C, 55±5% humidity, 12 hrs light/dark cycles and allowed free access to water and laboratory chow for the duration of the studies. To induce the model of chronic inflammation in the rat colon, the method described by Morris et al. (1989) was followed with some modification. Briefly, rats were arbitrarily separated into treatment groups, fasted for 48 hrs with free access to water and then anesthetized with ketamine.
In our studies, 0.5 ml of solution of 2, 4, 6, trinitrobenzene sulfonic acid at a dosage of 81 mg/kg-body weight dissolved in 50% ethanol (v/v) was inserted rectally into the colon using graduated rubber cannula such that the tip was 8 cm proximal to the anus was instilled into the lumen of the colon through rubber probe for 12 weeks consecutively. On the 12th week, the rat was sacrificed with overdose of anesthesia. The development of inflammation was evaluated with respect to colon/body weight ratio and histological changes.
Experimental design12 Wistar male rats were used in this study. The Rats were randomized and divided into four groups of four animals each.
Group I: Vehicle control (normal saline)Group II: Disease control (2, 4, 6, trinitrobenzene sulfonic acid 81 mg/kg- body weight)Group III: Disease Group II + Ketoprofen multiparticulate (150 mg/kg/day)

Asian J Pharm Clin Res, Vol 9, Issue 1, 2016, 219-237 Rangari and Puranik
223
in the range of 1-1.5 mm for the drug Ketoprofen (Table 4). The particle size of multiparticulate varies with composition of polymer added in the formulation. The chitosan concentration, its molecular weight and its viscosity affect the size range of multiparticulate. The decrease in Chitosan concentration decreases the size of multiparticulate. The tapped density value ranged from 0.49 to 0.55 g/cm3 for trial batches of Ketoprofen. The bulk density in between 0.4 and 0.53 g/cm3 for trial batches of Ketoprofen. Factorial batches show tapped density in the ranges of 0.5-0.55 g/cm3 for Ketoprofen. Bulk density for all the factorial batches for drug Ketoprofen was in the range of 0.45-0.54 g/cm3. All formulation showed good flowability as expressed in terms of angle of repose was found within the range of 25-35°, which is an appreciable limit for multiparticulate to show flow property while formulating in the dosage form.
Swelling studies of multiparticulate of trial batchesSwelling index was calculated with respect to time (Fig. 3). Swelling index increased with weight gain by the multiparticulate was increased proportionally with the rate of hydration. Multiparticulate swelling is influenced by the environmental pH, being generally greater at lower rather than higher pH value. For the trial batches of Ketoprofen, the swelling ratio of K3a, K5a, K3b and K5b is comparatively high then the other batches. For factorial batches batch K10 shows the highest swelling ratio, i.e., 1.79±0.08 then the other formulations (Table 6). This might be due to increase in the concentration of chitosan in the formulation (Fig. 4). Initially, all the batches swell slowly but achieve maximum swelling among other concentration (Table 5).
Percentage yield of multiparticulate formed of trial batchesThe prepared multiparticulate gives good percentage yield. The percentage yield of multiparticulate was determined by weighing after drying. The maximum percentage yield was found for trial batches K3a, K5a, K3b, and K5b of Ketoprofen (Fig. 5), was found 92.48±1.24, 94.32±0.65, 93.55±2.12, and 93.60±2.18%, respectively, shown in Table 7.
Prepared factorial batches were also shows good percentage yield for batch K6, K10, K14 and K16 (Fig. 6) (93.62±1.16%, 95.42±2.15%,
The multiparticulate of 150 mg/kg/day of Ketoprofen (Group III) calculated from the dose from humans (70 kg) (Sandborn and Hanaure, 2003) were also administered by oral gavage once a day for 3-day in the period when inflammation developed in the colon area after the 12th week.
Histopathological study [11,12]The tissue sample were appropriately trimmed and washed under running water and processed in different grades of isopropanol, passed through xylene clearance, and molten paraffin. Paraffin blocks were prepared, 3-5 µ thick section from each block were cut and stained with the hematoxylene and eosin stain. After mounting with DPX mountant, the slides were cleaned and evaluated under a light microscope.
RESULTS AND DISCUSSION
The assay was performed to analyze the percentage purity of Ketoprofen and was found to be 97.45% pure. Appropriate dilutions were prepared for the drug from the standard stock solution and scanned in the spectrum mode from 400 nm to 200 nm (Fig. 1). Ketoprofen showed absorbance maxima at 254 nm.
Selection of analytical concentration rangesFrom the standard stock solution of Ketoprofen, appropriate aliquots were pipette out into 10 ml volumetric flasks and dilutions were made with methanol to obtain working standard solutions of concentrations 05-30 µg/ml (Table 3). Absorbance for these solutions were measured at 254 nm and a calibration curve of absorbance against concentration was plotted (Fig. 2).
Evaluation for multiparticulateMicromeritics studies of trial batches of multiparticulateThe various batches (trial and factorial) have the average particle size
Fig. 1: UV spectrum of Ketoprofen
Fig. 2: Calibration curve of Ketoprofen
Fig. 3: Swelling studies of multiparticulate of trial batch of Ketoprofen
Fig. 4: Swelling studies of multiparticulate of factorial batch of Ketoprofen

Asian J Pharm Clin Res, Vol 9, Issue 1, 2016, 219-237 Rangari and Puranik
224
92.62±2.15% and 94.16±2.16%) out of this four formulation batch K10 (95.42±2.15%) shows the highest percentage yield as given in Table 8.
Drug entrapment of trial batchesThe prepared multiparticulate was evaluated for drug entrapment study. The % drug entrapment of drug Ketoprofen in all formulation was found to be good, i.e., above 60%. The multiparticulate of trial batches of Ketoprofen (K3a, K5a, K3b, and K5b) in Table 9 shows 72.17±1.13%, 83.68±1.12%, 76.31±1.13%, and 82.06±1.70% (Fig. 7) drug entrapment, respectively. This can be attributed to the polymer composition of Chitosan: Guar Gum in 2:1 ratio.
Prepared factorial batches of multiparticulate also show good % drug entrapment in the range of 60-80%. For Ketoprofen, batch K10 have 81.42±0.42% entrapment as compared with the other formulated batches (Fig 8). From this data, it is clear that increase in polymer concentration specially chitosan increases the entrapment of drug as shown in Table 10.
Ex vivo mucoadhesion study of trial batchesThe mucoadhesive properties of the multiparticulate were evaluated by
Fig. 5: Percentage yield of multiparticulate of trial batch of Ketoprofen
Fig. 6: Percentage yield of multiparticulate of factorial batch of Ketoprofen
Fig. 7: % Drug entrapped of trial batches of Ketoprofen
Fig. 8: % Drug entrapped of factorial batches of Ketoprofen
Table 3: Standard calibration for Ketoprofen
S. No For Ketoprofen
Concentration (µg/ml) Abs.* at 254 nm1. 5 0.3714±4.82. 10 0.744±5.23. 15 1.2304±5.44. 20 1.7085±3.25. 25 2.1367±4.66. 30 2.5834±7.1*Each sample was analyzed in triplicate (n=3)
Table 4: Micromeritics studies of trial batches
Batch code
Average particle size (mm)
Bulk density (g/cm3)
Tapped density (g/cm3)
Angle of repose (q)
K1a 1.4±5.6 0.52±0.07 0.54±0.04 29°74’K2a 1.6±3.4 0.51±0.04 0.53±0.05 29°82’K3a 1.5±8.7 0.51±0.02 0.55±0.03 30°21’K4a 1.8±2.2 0.48±0.03 0.51±0.02 29°74’K5a 1.6±7.5 0.48±0.06 0.52±0.03 28°34’K1b 1.5±1.3 0.49±0.01 0.50±0.07 29°76’K2b 1.4±5.4 0.52±0.09 0.53±0.06 30°21’K3b 17±1.2 0.53±0.04 0.52±0.04 29°69’K4b 1.1±6.4 0.49±0.04 0.51±0.07 29°74’K5b 1.1±1.3 0.51±0.06 0.53±0.03 28°47’*Each sample was analyzed in triplicate (n=3), K: Ketoprofen, Coat composition a=10%, b=15%
Fig. 9: % Mucoadhesion of trial batches of Ketoprofen
Fig. 10: % Mucoadhesion of factorial batches of Ketoprofen

Asian J Pharm Clin Res, Vol 9, Issue 1, 2016, 219-237 Rangari and Puranik
225
ex-vivo mucoadhesion study. After the intervals of 12 hrs, the weight of microspheres leached out was measured.
K5a and K5b trial batch of Ketoprofen shows 80.35±0.28 and 79.64±0.37% adhesion, respectively Table 11. Factorial batches batch K10 shows 98.63±1.06% adhesion, i.e. best among the other Table 12. From this result, we can conclude that increase in polymer concentration (especially chitosan) increases the adhesion of multiparticulate because of increase in molecular weight of chitosan and increased viscosity then Guar Gum (Figs. 9 and 10).
In-vitro drug release studies for trial batchesIn-vitro dissolution study was conducted to understand in-vitro drug release profile of coated multiparticulate. The purpose of this formulation was to avoid release of drug in gastric and upper intestinal region but to release the drug slowly in the lower part of the intestine maximizing drug concentration in the colon. Accordingly, the in-vitro drug release study was conducted in pH change method as per USP protocol (2 hrs in SGF, 2-6 hrs in SIF and 6-24 hrs in simulated colon fluid [SCF]) and the results are shown in Table 13.
Enteric coated multiparticulate, coated with a coat composition of Eudragit S and L 100 (10%, and 15%) showed no drug release in
simulated gastric fluid up to 2 hrs indicating the intactness of the applied coat. Dissolution studies were continued for a further 4-hrs period in simulated intestinal media showing relatively low drug release, i.e., up to 20-25%. The release of drug beyond 6 hrs in SCF was very substantial with over 95% release in 24 hrs for both trial and factorial batches of Ketoprofen. Analyzing the overall drug release profile of the coated multiparticulate, it is evident that the multiparticulate retained their integrity up to 24 hrs releasing the drug slowly and consistently. Considering the average transit time for orally administered solid formulations (particularly small particulates) as approximately 2 hrs in stomach, 6-8 hrs in the small intestine and up to 24 hrs in the colon. Eudragit coated multiparticulate resisted drug release in the stomach, released 8-30 % in the small intestine for trial batches of Ketoprofen, the remaining 64-92% for Ketoprofen trial batch and 72-96% for Ketoprofen factorial batch in the colon (Fig. 11).
For factorial batches, absorbance of sample of dissolution study was done after 6 hrs by consider the data from trial batches, i.e., negligible release (30%) of drug up to 6 hrs. analysis was done on samples of 9, 12, 18, and 24 hrs (Fig. 12). The results show that K10 batch of Ketoprofen gives 96.75±0.41% maximum release as compared to other formulations Table 14.
Table 5: Swelling studies of multiparticulate of trial batch of Ketoprofen
Batch code
Swelling studies of multiparticulate adhering to the tissue
In pH 7.4
Time/hrs
0 1 2 4 6 8 10 12K1a 0 0.40±0.05 0.51±0.05 0.64±0.06 0.75±0.01 0.86±0.01 1.19±0.15 1.28±0.01K2a 0 0.45±0.14 0.53±0.13 0.63±0.05 0.92±0.09 1.23±0.04 1.30±0.01 1.51±0.08K3a 0 0.42±0.03 0.65±0.05 0.76±0.05 0.84±0.1 0.92±0.03 1.22±0.015 1.42±0.02K4a 0 0.48±0.05 0.54±0.01 0.68±0.01 0.86±0.14 1.36±0.05 1.41±0.03 1.50±0.01K5a 0 0.32±0.02 0.47±0.05 0.66±0.01 0.73±0.06 0.84±0.14 1.41±0.05 1.70±0.05K1b 0 0.34±0.04 0.58±0.15 0.73±0.01 0.87±0.05 0.94±0.03 1.23±0.01 1.28±0.03K2b 0 0.45±0.04 0.52±0.01 0.88±0.05 0.94±0.04 1.33±0.02 1.42±0.52 1.54±0.14K3b 0 0.38±0.05 0.62±0.06 0.75±0.03 0.83±0.04 0.92±0.05 1.25±0.05 1.45±0.05K4b 0 0.47±0.04 0.58±0.03 0.72±0.02 0.87±0.04 1.56±0.06 1.62±0.02 1.52±0.05K5b 0 0.36±0.05 0.46±0.06 0.68±0.04 0.75±0.04 0.93±0.03 1.31±0.07 1.65±0.04*Each sample was analyzed in triplicate (n=3)
Table 6: Swelling studies of multiparticulate of factorial batch of Ketoprofen
Batch code
Swelling studies of multiparticulate adhering to the tissue
In pH 7.4
Time/hrs
0 1 2 4 6 8 10 12K1 0 0.49±0.04 0.63±0.04 0.74±0.03 0.85±0.06 0.96±0.01 1.19±0.15 1.58±0.01K2 0 0.47±0.50 0.54±0.17 0.63±0.04 0.92±0.09 1.23±0.06 1.35±0.05 1.56±0.08K3 0 0.46±0.16 0.65±0.05 0.76±0.06 0.83±0.16 0.92±0.03 1.24±0.01 1.52±0.02K4 0 0.48±0.08 0.54±0.08 0.66±0.01 0.86±0.14 1.36±0.05 1.40±0.03 1.54±0.03K5 0 0.42±0.07 0.55±0.05 0.67±0.04 0.74±0.03 0.84±0.14 0.94±0.05 1.51±0.05K6 0 0.45±0.03 0.58±0.14 0.73±0.01 0.97±0.05 1.34±0.03 1.50±0.05 1.69±0.03K7 0 0.45±0.06 0.52±0.08 0.79±0.05 0.91±0.05 1.32±0.06 1.42±0.50 1.54±0.14K8 0 0.38±0.02 0.62±0.06 0.75±0.05 0.98±0.05 1.26±0.04 1.44±0.05 1.60±0.05K9 0 0.47±0.03 0.58±0.06 0.72±0.07 0.87±0.03 1.26±0.03 1.44±0.09 1.52±0.05K10 0 0.46±0.05 0.56±0.06 0.78±0.05 0.85±0.06 0.95±0.03 1.68±0.04 1.79±0.08K11 0 0.49±0.05 0.63±0.05 0.73±0.06 0.85±0.01 0.96±0.01 1.19±0.15 1.58±0.06K12 0 0.47±0.47 0.54±0.17 0.63±0.06 0.92±0.09 1.23±0.04 1.34±0.01 1.56±0.05K13 0 0.47±0.04 0.65±0.05 0.76±0.03 0.84±0.18 0.92±0.03 1.30±0.05 1.52±0.02K14 0 0.48±0.06 0.54±0.08 0.66±0.05 0.86±0.14 1.36±0.03 1.61±0.03 1.74±0.05K15 0 0.42±0.02 0.58±0.06 0.67±0.01 0.84±0.04 0.97±0.14 0.94±0.05 1.51±0.05K16 0 0.45±0.03 0.55±0.15 0.73±0.06 0.87±0.05 0.94±0.03 1.24±0.05 1.48±0.03K17 0 0.45±0.04 0.56±0.08 0.77±0.07 0.84±0.04 1.32±0.06 1.42±0.5 1.54±0.14*Each sample was analyzed in triplicate (n=3)

Asian J Pharm Clin Res, Vol 9, Issue 1, 2016, 219-237 Rangari and Puranik
226
It was interesting to observe negligible release profiles of coated multiparticulate in GIT. This could be due to the cross-linking of chitosan which did not disintegrate under the influence of colon enzymes and thus can be stated that the multiparticulate retained their integrity. The release could be by diffusion and/or by erosion of the multiparticulate matrix.
Release kineticsThe release rate constant was calculated from the slope of appropriate equations, and the correlation coefficient (R) was determined for all the formulations (Table 15). The release profile and the entrapment efficiency of the formulation of factorial batches K10 for Ketoprofen was found to be satisfactory in comparison to other formulation, the discussion on the kinetics of other formulations was not considered further.
In-vitro drug release of K10 was best explained by k-peppas equation with the highest linearity R2 = 0.9904 followed by Higuchi’s equation, R2 = 0.9833 and the first order R2 = 0.9821. This indicates that the drug was diffused from polymeric matrix. The drug release was found to be closed to Higuchi kinetics which indicates that the drug diffuses at a comparatively slower rate as the distance of diffusion increases. Further the value of ‘n’ from Korsmeyer-Peppas equation for K10 (n=0.8815) indicates a purely relaxed controlled delivery which is referred to as Case II transport. Occasionally, values of n>0.89 have been observed, which has been regarded as Super Case II kinetics. Our results clearly advocate the non-Fickian diffusion owing to the coupling of diffusion process with the mechanical response of the polymer chitosan and guar gum.
Factorial design data analysisExperimental design analysisUse of experimental design allows systematic optimization procedures which carried out by selecting an objective function, finding the most important or contributing factors and investigating the relationship between responses and factors by the so-called response surface methodology. The objective function for the present study was selected as maximizing the polymer concentration and polymer coating, i.e., coat composition efficiency while studying its effect on entrapment efficiency, mucoadhesion, and drug release at 9, 12, 18, and 24 hrs for ciprofloxacin, Ketoprofen, and 5-flurouracil.
Box-behnken design was used to statistically optimize the processing parameters and evaluate the main effects, interaction effects and quadratic effects of the processing parameters on the polymer concentration and enteric coating on formulations. A 3-factor, 3-level design was used to explore the quadratic response surfaces and for constructing second order polynomial models using design expert (version 9.0.5.1, Stat-Ease Inc., and Minneapolis, MN). The box-behnken design was specifically selected since it requires fewer runs than a central composite design, in cases of three or four variables. This cubic design is characterized by set of points lying at the midpoint of each edge of a multidimensional cube and center point replicates (n=1). A design matrix was constructed with 17 experimental runs, for which the linear computer generated quadratic model for responses like entrapment efficiency (R1), mucoadhesion (R2); drug release at 9 (R3), 12 (R4), 18 (R5), and 24 (R6) was give as
R1 = 80.402 + 1.2675 × A 0.71 × B 0.065 × C − 1.165 × AB -1.165 × AC − 0.13 × BC − 0.8985 × A2 0.1365 × B2 − 0.6235 × C2
R2 = 95.608 + 2.5075 * A 1.8425 * B − 0.2575 * C 0.65 * AB − 0.155 * AC 1.275 * BC − 0.4515 * A2 − 1.8315 * B2 − 0.1035 * C2
R3= 75.818 + 2.8425 × A 0.14625 × B 0.20875 × C 0.0425 × AB − 0.0775 × AC 0.19 × BC 0.451 × A2 − 0.9965 × B2 − 0.4565 × C2
R4 = 84.556 + 1.16875 × A 0.58875 × B 0.0425 × C − 0.255 × AB − 0.2025 × AC − 0.0025 × BC 0.6345 × A2-0.9055 × B2 − 0.363 × C2
R5 = 90.728 + 1.505 × A 0.90375 × B 0.00625 × C − 0.3725 × AB 0.0375 × AC 0.055 × BC 0.631 × A2 − 0.6965 × B2 0.0285 × C2
Fig. 11: % cumulative release of trial batches of Ketoprofen
Fig. 12: % cumulative release of factorial batches of Ketoprofen
Fig. 13: 3-D response curve of drug release at 24 hrs for colon targeted multiparticulate
Fig. 14: Contour plot for drug release at 24 hrs for colon targeted multiparticulate

Asian J Pharm Clin Res, Vol 9, Issue 1, 2016, 219-237 Rangari and Puranik
227
R6 = 91.324 + 2.1825 × A 0.9375 × B − 0.265 × C 0.85 × AB − 0.06 × AC 0.485 × BC 1.1655 × A2 − 0.5395 × B21.2855 × C2
For Ketoprofen response, R1 80.402 is an intercept and 1.267, 0.71, 0.065, −1.165, −1.165, −0.13, −0.8985, 0.1365, −0.6235 are regression coefficient computed from the observed experimental values of R1 from experimental runs; and A, B, and C are the coded levels of independent variables. The term AB, AC, BC, and A2, B2, C2 represents the interaction and quadratic terms, respectively. Same is for the responses R2, R3, R4, R5, and R6.
Independent variable studied were polymer concentration, i.e., chitosan (A), guar gum (B), and coat composition of Eudragit L and
S 100 (C). The dependent variables were the entrapment efficiency (R1), mucoadhesion (R2); drug release at 9 (R3), 12 (R4), 18 (R5), and 24 (R6). The range of independent variables under study is shown in
Table 8: Percentage yield of multiparticulate of factorial batch of Ketoprofen
Batch code % yieldK1 92.20±1.11K2 93.23±1.15K3 92.48±1.24K4 91.21±2.42K5 92.11±2.65K6 93.62±1.16K7 92.16±1.15K8 94.55±1.12K9 93.62±1.42K10 95.42±2.15K11 93.16±2.14K12 92.17±1.15K13 94.35±1.12K14 92.62±1.22K15 92.30±1.16K16 94.16±2.16K17 92.12±1.15*Each sample was analyzed in triplicate (n=3)
Table 9: Percentage drug entrapped of trial batches of Ketoprofen
Batch no
Drug entrapment efficiency
Drug concentration (mg) % drug entrapmentK1a 150 73.78±1.41K2a 150 70.43±1.13K3a 150 72.17±1.13K4a 150 74.56±1.43K5a 150 83.68±1.12K1b 150 74.68±1.60K2b 150 75.43±2.61K3b 150 76.31±1.13K4b 150 70.31±2.41K5b 150 82.06±1.70*Each sample was analyzed in triplicate (n=3)
Table 7: Percentage yield of multiparticulate of trial batch of Ketoprofen
Batch code % yieldK1a 91.20±1.12K2a 91.73±2.14K3a 92.48±1.24K4a 91.01±2.42K5a 94.32±0.65K1b 93.16±2.16K2b 92.16±1.15K3b 93.55±2.12K4b 93.42±2.42K5b 93.60±2.18*Each sample was analyzed in triplicate (n=3)
Table 12: Ex vivo mucoadhesion study of factorial batches of Ketoprofen
Batch code
Wt. of applied multiparticulate (mg)
Wt. of leached multiparticulate after 12 hrs (mg)
% Mucoadhesion
K1 330±0.52 30±0.13 90.47±2.17K2 310±0.41 15±0.21 95.64±1.12K3 325±0.35 17±0.26 95.54±2.15K4 320±0.44 16±0.33 95.53±1.19K5 280±0.33 6±0.36 96.74±1.08K6 330±0.27 6±0.16 97.84±1.03K7 315±0.20 15±0.37 95.62±2.02K8 375±0.41 16±0.22 94.74±1.22K9 300±0.36 19±0.11 92.37±1.17K10 285±0.49 5±0.53 98.63±1.06K11 315±0.60 23±0.71 92.2±1.09K12 375±0.33 28±0.36 92.46±1.06K13 300±0.32 17±0.62 95.71±2.32K14 285±0.30 6±0.52 97.84±1.15K15 315±0.51 22±0.35 93.57±1.10K16 375±0.11 28±0.82 92.89±1.14K17 300±0.32 30±0.25 90.11±2.60*Each sample was analyzed in triplicate (n=3)
Table 11: Ex vivo mucoadhesion study of trial batches of Ketoprofen
Batch code
Wt. of applied multiparticulate (mg)
Wt. of leached multiparticulate after 12 hrs (mg)
% Mucoadhesion
K1a 330±0.22 75±0.16 77.27±0.20K2a 310±0.42 74±0.15 76.12±0.32K3a 325±0.25 78±0.24 76.00±0.37K4a 320±0.40 75±0.30 76.56±0.35K5a 280±0.31 55±0.32 80.35±0.28K1b 330±0.14 74±0.17 77.57±0.24K2b 315±0.28 75±0.42 76.19±0.35K3b 375±0.33 85±0.29 77.33±0.22K4b 300±0.32 78±0.20 74.00±0.23K5b 285±0.30 58±0.62 79.64±0.37*Each sample was analyzed in triplicate (n=3)
Table 10: Percentage drug entrapped of factorial batches of Ketoprofen
Batch no
Drug entrapment efficiency
Drug concentration (mg) % drug entrapmentK1 150 80.23±1.32K2 150 80.57±0.45K3 150 80.43±0.62K4 150 80.4±0.72K5 150 80.04±0.19K6 150 81.11±0.52K7 150 80.34±1.33K8 150 79.86±0.12K9 150 76.52±0.43K10 150 81.42±0.42K11 150 78.67±1.12K12 150 80.94±0.62K13 150 80.27±0.58K14 150 78.91±2.12K15 150 79.53±0.11K16 150 80.67±1.19K17 150 75.84±0.11*Each sample was analyzed in triplicate (n=3)

Asian J Pharm Clin Res, Vol 9, Issue 1, 2016, 219-237 Rangari and Puranik
228
Tables 12 and 13 along with their low, medium and high levels, which were selected based on the results from preliminary experimentation. The polymer concentration, i.e., chitosan (A), guar gum (B) and coat composition of Eudragit L and S 100 (C) used to prepare the 17 experimental formulations. The polynomial equations can be used to draw conclusion after considering the magnitude coefficient and the mathematical sign that the coefficient carries. A high positive or
negative value in the equation represent that by making a minor change in the setting of that factor one may obtain a significant change in the dependent variable.
The statistical validity of the polynomials was established on the basis of ANOVA provision in the design expert software. The level of significance was considered at >F <0.05. The best-fitting mathematical model was
Table 15: Kinetic parameters of Ketoprofen release from factorial batches of multiparticulate
Batch code
Zero-order First-order Higuchi Hixson-Crowell k-Peppas
K0 R2 K1 R2 KH R2 KHC R2 Kp R2 np
K1 3.9571 0.8169 0.1106 0.9172 21.7170 0.8950 −0.1167 0.8852 1.0328 0.8999 0.8463K2 4.0053 0.8089 0.1170 0.9036 22.0150 0.8889 −0.1211 0.8741 1.0520 0.8892 0.8147K3 4.0060 0.8077 0.1165 0.9017 22.0123 0.8871 −0.1208 0.8724 1.0456 0.8870 0.8221K4 4.0354 0.8108 0.1180 0.9067 22.1393 0.8878 −0.1220 0.8766 1.0293 0.8935 0.8476K5 4.0610 0.8229 0.1235 0.9287 22.2259 0.8966 −0.1255 0.8971 1.0463 0.8965 0.8108K6 4.1853 0.8210 0.1419 0.9552 22.84857 0.8900 −0.1368 0.9145 1.0287 0.8901 0.8499K7 4.0051 0.8088 0.1173 0.9070 21.9877 0.8868 −0.1213 0.8763 1.0556 0.8792 0.7936K8 4.0669 0.8272 0.1235 0.9316 22.2168 0.8979 −0.1256 0.9010 1.0417 0.8967 0.8014K9 3.9819 0.8245 0.1139 0.9197 21.8089 0.8997 −0.1190 0.8916 1.0428 0.9011 0.8081K10 4.2580 0.8216 0.1530 0.9821 23.1856 0.9833 −0.1431 0.8862 1.0045 0.9904 0.8815K11 3.9982 0.8211 0.1144 0.9155 21.8889 0.8952 −0.1194 0.8870 1.0295 0.8976 0.8261K12 3.9865 0.8216 0.1145 0.9162 21.8572 0.8984 −0.1194 0.8879 1.0423 0.9013 0.8176K13 4.0203 0.8096 0.1179 0.9071 22.0795 0.8883 −0.1218 0.8766 1.0400 0.8897 0.8352K14 4.2192 0.8222 0.1510 0.9630 23.0400 0.8918 −0.1417 0.9225 1.0324 0.8933 0.8576K15 0.8280 4.0285 0.1181 0.9428 21.9923 0.8976 −0.1218 0.9073 1.0215 0.8983 0.8423K16 4.0600 0.7992 0.1204 0.8853 22.2921 0.8764 −0.1237 0.8593 1.0248 0.8779 0.8505K17 3.93020 0.8196 0.1083 0.9141 21.5394 0.8955 −0.1150 0.8848 1.0396 0.8929 0.8049
Table 13: Percentage cumulative release of trial batches of Ketoprofen
Batch code
Time/hrs
0 2 4 6 9 12 18 24K1a 0 19.15±0.43 27.14±0.12 30.02±0.44 67.03±0.28 75.13±0.52 78.54±0.42 83.00±0.53K2a 0 20.11±0.52 26.18±0.13 30.12±0.31 66.08±0.48 75.74±0.42 82.07±0.21 84.04±0.51K3a 0 20.15±0.46 27.14±0.14 29.43±0.41 65.56±0.32 76.16±0.17 80.34±0.63 82.52±0.43K4a 0 19.16±0.42 26.15±0.11 30.22±0.42 77.89±0.32 81.05±0.14 83.52±0.64 85.07±0.28K5a 0 20.17±0.55 28.16±0.43 30.36±0.33 74.02±0.43 85.10±0.62 90.25±0.43 92.74±0.51K1b 0 19.25±0.51 28.14±0.14 30.42±0.42 66.50±0.45 78.15±0.51 81.62±0.33 82.15±0.43K2b 0 20.25±0.46 28.16±0.53 30.12±0.41 76.80±0.43 80.01±0.52 82.19±0.48 84.45±0.33K3b 0 20.13±0.32 27.16±0.17 30.42±0.52 68.14±0.63 75.27±0.53 79.67±0.38 82.39±0.51K4b 0 19.11±0.52 24.18±0.13 29.52±0.06 64.36±0.44 71.46±0.58 78.91±0.26 84.75±0.33K5b 0 19.15±0.63 28.35±0.42 30.32±0.44 76.32±0.36 84.49±0.25 88.12±0.51 90.15±0.42*Each sample was analyzed in triplicate (n=3)
Table 14: Percentage cumulative release of factorial batches of Ketoprofen
Batch code
Time/hrs
0 2 4 6 9 12 18 24K1 0 18.23±0.23 27.73±0.33 30.53±0.22 74.53±1.28 82.49±0.22 88.64±0.45 90.56±0.03K2 0 19.29±0.24 28.26±0.30 30.33±0.30 75.84±0.26 84.63±0.37 90.74±0.16 91.23±1.23K3 0 18.86±0.20 28.82±0.16 29.62±0.32 75.79±0.25 84.62±0.13 90.67±0.23 91.12±0.58K4 0 18.42±0.21 27.43±0.14 30.22±0.24 75.8±0.09 84.63±1.02 90.76±0.11 91.43±0.28K5 0 19.27±0.12 27.94±0.15 30.46±0.25 74.91±0.52 84.11±0.51 91.47±1.09 92.59±0.26K6 0 18.57±0.13 28.42±0.22 29.46±0.20 78.2±0.50 85.42±0.12 92.26±1.32 95.63±0.32K7 0 19.51±0.22 29.07±0.20 28.92±0.11 75.84±0.08 84.28±0.29 90.72±0.24 91.38±1.20K8 0 19.25±0.24 27.66±0.24 30.04±0.15 73.82±1.06 84.09±0.23 91.37±0.31 92.61±1.09K9 0 18.74±0.12 28.44±0.25 30.19±0.20 72.58±1.24 83.24±1.12 89.92±0.55 90.87±0.53K10 0 17.82±0.33 27.63±0.12 28.94±0.21 78.92±1.25 86.27±1.40 92.82±0.42 96.75±0.41K11 0 18.11±0.24 28.68±0.13 29.38±0.33 72.86±0.23 83.79±1.20 89.88±0.31 90.92±0.55K12 0 18.55±0.21 28.78±0.25 30.36±0.32 72.93±0.25 83.88±1.24 89.96±0.20 90.96±1.18K13 0 18.47±0.25 29.13±0.26 29.63±0.30 75.82±1.21 84.62±1.25 90.75±0.23 91.46±1.07K14 0 18.57±0.22 28.88±0.24 30.06±0.26 78.89±1.25 86.01±0.25 92.93±0.16 96.56±0.25K15 0 17.96±0.12 28.13±0.20 29.18±0.25 74.2±0.26 82.46±1.21 88.76±1.07 92.52±0.24K16 0 18.18±0.10 28.54±0.16 28.36±0.22 77.53±1.07 85.2±1.23 92.11±0.07 91.24±0.25K17 0 18.50±0.11 28.84±0.21 28.96±0.21 72.43±1.28 82.64±0.23 88.32±0.25 89.97±0.30*Each sample was analyzed in triplicate (n=3)

Asian J Pharm Clin Res, Vol 9, Issue 1, 2016, 219-237 Rangari and Puranik
229
selected based on the comparison of several statistical parameters, including the CV, the multiple correlation coefficient (R2), the adjusted multiple correlation coefficient (adjusted R2), and the PRESS, provided by the software. PRESS indicates how well the model fits the data, and for the chosen model, it should be small relative to the other models under consideration. The 3-D response surface graphs and the 2-D contour plots were also generated by the Design Expert® software. These plots are very useful to see interaction effects of the factors on responses.
Full and reduced model assessment for the dependent variablesThe result of responses R1 to R6 was 95% for Ketoprofen. All the responses observed for seventeen processing variables were fitted to various models using Design Expert® software. It was observed that the best fitted models were quadratic for ciprofloxacin, Ketoprofen, and 5-Flurouracil. The values of R2, adjusted R2, predicted R2, SD and % CV are given in Table 16, along with the regression equation generated for each response. It was observed that the independent variable viz. A (chitosan) had a positive effect on drug release (R). Another independent variables viz. B (guar gum) and C (coat composition) had a negligible effect (R).
For Ketoprofen response R1 (Entrapment efficiency), A negative “Pred R2” implies that the overall mean is a better predictor of your response than the current model. “Adeq Precision” measures the signal to noise ratio. A ratio >4 is desirable. Your ratio of 8.710 indicates an adequate signal. This model can be used to navigate the design space. Response R2 (Mucoadhesion). The “Pred R2” of 0.7285 is not as close to the “Adj R2” of 0.9608 as one might normally expect or a possible problem with your model and/or data. Things to consider are a model reduction, response transformation, outliers, etc. All empirical models should be tested by doing confirmation runs. “Adeq Precision” measures the signal to noise ratio. A ratio >4 is desirable. Your ratio of 22.522 indicates an adequate signal. This model can be used to navigate the design space. Response R3 (drug release at 9 hrs) The “Pred R2” of 0.8129 is in reasonable agreement with the “Adj R2” of 0.9732, i.e. the difference is <0.2. “Adeq precision” measures the signal to noise ratio. A ratio >4 is desirable. Your ratio of 24.252 indicates an adequate signal. This model can be used to navigate the design space. Response R4 (drug release at 12 hrs) The “Pred R2” of 0.5415 is not as close to the “Adj R2”
of 0.9248 as one might normally expect or a possible problem with your model and/or data. Things to consider are a model reduction, response transformation, outliers, etc. All empirical models should be tested by doing confirmation runs. “Adeq Precision” measures the signal to noise ratio. A ratio greater than 4 is desirable. Your ratio of 16.388 indicates an adequate signal. This model can be used to navigate the design space. Response R5 (drug release at 18 hrs) The “Pred R2” of 0.1225 is not as close to the “Adj R2” of 0.8743 as one might normally expect or a possible problem with your model and/or data. Things to consider are model reduction, response transformation, outliers, etc. All empirical models should be tested by doing confirmation runs. “Adeq precision” measures the signal to noise ratio. A ratio >4 is desirable. Your ratio of 13.478 indicates an adequate signal. This model can be used to navigate the design space. Response R6 (drug release at 24 hrs) A negative “Pred R2” implies that the overall mean is a better predictor of your response than the current model. “Adeq Precision” measures the signal to noise ratio. A ratio greater than 4 is desirable. Your ratio of 9.517 indicates an adequate signal. This model can be used to navigate the design space.
Statistical validation of the polynomial equations generated by Design Expert and estimation of the significance of the models was established on the basis of analysis of variance provision of the software as shown in Table 17.
For response R1 (entrapment efficiency), the model F-value of 6.63 implies the model is significant. There is only a 1.04% chance that a “model F-value” this large could occur due to noise. Values of “Prob > F” <0.0500 indicate model terms are significant. In this case A, B, AB, AC, A++2± are significant model terms. Values >0.1000 indicate the model terms are not significant. If there are many insignificant model terms (not counting those required to support hierarchy), the model reduction may improve your model. The “lack of fit F-value” of 101.82 implies the lack of fit is significant. There is only a 0.03% chance that a “lack of fit F-value” this large could occur due to noise. In Table 17, p values for response R1 (entrapment efficiency) represent that the contribution of (A, B and C) is significant to model term and the linear contribution (C) is non-significant model term. The values obtained for main effects of the independent variables from equation indicate that chitosan (A) at high level (1) have positive effect on the response R1
Table 16: Summary of results of regression analysis for Ketoprofen responses R1-R6
Responses Models R2 Adjusted R2 Predicted R2 Adequate precision SD % CV PressR1 Quadratic 0.8949 0.7599 −0.6605 8.7102 0.7454 0.9347 61.5129R2 Quadratic 0.9828 0.9607 0.7284 22.5224 0.5036 0.5324 28.0884R3 Quadratic 0.9882 0.9732 0.8128 24.2524 0.3472 0.4609 13.4788R4 Quadratic 0.9671 0.9248 0.5414 16.3879 0.3089 0.3667 9.3173R5 Quadratic 0.9450 0.8743 0.1225 13.4783 0.4890 0.5390 26.7083R6 Quadratic 0.9174 0.8112 −0.3041 9.5173 0.9045 0.9807 90.4293SD: Standard deviation, CV: Coefficient of variation
Table 17: Analysis of variance for response R1 (Entrapment efficiency) for Ketoprofen
Source Sum of squares df Mean square F value p-value P>F SignificanceModel 33.15487 9 3.683874 6.629199 0.010391 SignificantA-CH 12.85245 1 12.85245 23.12822 0.001946B-GG 4.0328 1 4.0328 7.257097 0.030911C-CC 0.0338 1 0.0338 0.060824 0.812275AB 5.4289 1 5.4289 9.769405 0.016712AC 5.4289 1 5.4289 9.769405 0.016712BC 0.0676 1 0.0676 0.121647 0.73751A2 3.399167 1 3.399167 6.116864 0.042631B2 0.078452 1 0.078452 0.141175 0.718243C2 1.636852 1 1.636852 2.945544 0.129822Residual 3.88993 7 0.555704Lack of fit 3.83965 3 1.279883 101.8205 0.000312Pure error 0.05028 4 0.01257 SignificantCor total 37.0448 16

Asian J Pharm Clin Res, Vol 9, Issue 1, 2016, 219-237 Rangari and Puranik
230
(entrapment efficiency). From the Figures 13 and 14 of the response curve of entrapment efficiency for multiparticulate, it is observed that high (1) concentration of chitosan (A) is significant for entrapment efficiency (Figs 13 and 14). From equation indicate that concentrations of guar gum (B) at medium level (0) are effective for response R1 (entrapment efficiency). On the other hand, the coat composition at low-level (−1) is sufficient to reach the multiparticulate to the colon.
For response R2 (Mucoadhesion) the model F-value of 44.54 implies the model is significant. There is only a 0.01% chance that a “model F-value” this large could occur due to noise. Values of “Prob > F” <0.0500 indicate model terms are significant. In this case, A, B, AB, BC, B++2± are significant model terms. Values >0.1000 indicate the model terms are not significant. If there are many insignificant model terms (not counting those required to support hierarchy), the model reduction may improve your model. The “lack of fit F-value” of 104.93 implies the lack of fit is significant. There is only a 0.03% chance that a “lack of fit F-value” this large could occur due to noise. In Table 18, p values for response R2 (Mucoadhesion) represents that the linear contribution (A, B, and C) is the significant model term. The values obtained for main effects of the independent variables from Equation indicate that chitosan (A) and guar gum (B) has positive effect on the response R2 (Mucoadhesion). From the Figures 15 and 16 of the response curve of mucoadhesion for multiparticulate, it is observed that as the chitosan (A) concentration at a high-level (1) increases entrapment efficiency of multiparticulate increases significantly. From equation indicate that concentrations of guar gum (B) at medium level (0) are effective for response R2 (Mucoadhesion). On the other hand, the coat composition at low-level (−1) is sufficient to reach the multiparticulate to the colon (Figs. 15 and 16).
For response R3 (drug release at 9 hrs), the Model F-value of 65.58 implies the model is significant. There is only a 0.01% chance that a “model F-value” this large could occur due to noise. Values of “Prob >
F” <0.0500 indicate model terms are significant. In this case, A, A++2±, B++2±, C++2± are significant model terms. Values >0.1000 indicate the model terms are not significant. If there are many insignificant model terms (not counting those required to support hierarchy), the model reduction may improve your model. The “lack of fit F-value” of 539.89 implies the lack of fit is significant. There is only a 0.01% chance that a “lack of fit F-value” this large could occur due to noise. In Table 19, p values for response R3 (drug release at 9 hrs) represent that the contribution (A, B and C) is significant to model term. The values obtained for main effects of the independent variables from Equation indicate that chitosan (A) at the high level (1) have a positive effect on the response R3 (drug release at 9 hrs). From the Figures 17 and 18 of the response curve of drug release at 9 hrs for multiparticulate, it is observed that high (1) concentration of chitosan (A) releases the drug at 9 hrs significantly. From equation indicate that concentrations of guar gum (B) at medium level (0) are effective for response R3 (drug release
Table 18: Analysis of variance for response R2 (Mucoadhesion) for Ketoprofen
Source Sum of squares df Mean square F value p-value P>F SignificanceModel 101.6715 9 11.29683 44.53507 2.35E-05 SignificantA-CH 50.30045 1 50.30045 198.2976 2.16E-06B-GG 27.15845 1 27.15845 107.0657 1.71E-05C-CC 0.53045 1 0.53045 2.091173 0.191397AB 1.69 1 1.69 6.662424 0.03641AC 0.0961 1 0.0961 0.378851 0.557692BC 6.5025 1 6.5025 25.63456 0.001458A2 0.858325 1 0.858325 3.383744 0.108425B2 14.12376 1 14.12376 55.67956 0.000142C2 0.045104 1 0.045104 0.177813 0.685907Residual 1.77563 7 0.253661Lack of fit 1.75335 3 0.58445 104.9282 0.000294 SignificantPure error 0.02228 4 0.00557Cor total 103.4471 16
Table 19: Analysis of variance for response R3 (drug release at 9 hrs) for Ketoprofen
Source Sum of squares df Mean square F value p-value P>F SignificanceModel 71.18928 9 7.90992 65.57991 6.29E-06 SignificantA-CH 64.63845 1 64.63845 535.9072 7.12E-08B-GG 0.171113 1 0.171113 1.418667 0.272439C-CC 0.348613 1 0.348613 2.890291 0.132912AB 0.007225 1 0.007225 0.059901 0.813672AC 0.024025 1 0.024025 0.199187 0.668857BC 0.1444 1 0.1444 1.197198 0.310098A2 0.856425 1 0.856425 7.100487 0.032248B2 4.181104 1 4.181104 34.66488 0.000607C2 0.877441 1 0.877441 7.274726 0.030765Residual 0.844305 7 0.120615Lack of fit 0.842225 3 0.280742 539.8878 1.14E-05 SignificantPure error 0.00208 4 0.00052Cor total 72.03359 16
Fig. 15: Contour plot for mucoadhesion for colon targeted multiparticulate

Asian J Pharm Clin Res, Vol 9, Issue 1, 2016, 219-237 Rangari and Puranik
231
at 9 hrs). On the other hand, the coat composition at low level (−1) is sufficient to reach the multiparticulate to the colon (Figs. 17 and 18).
For Response R4 (drug release at 12 hrs) the model F-value of 22.87 implies the model is significant. There is only a 0.02% chance that a “model F-Value” this large could occur due to noise. Values of “Prob > F” <0.0500 indicate model terms are significant. In this case A, B, A++2±, B++2±, C++2± are significant model terms. Values >0.1000 indicate the model terms are not significant. If there are many insignificant model terms (not counting those required to support hierarchy), the model reduction may improve your model. The “lack of fit F-value” of 8.02 implies the lack of fit is significant. There is only a 3.63% chance that a “lack of fit F-value” this large could occur due to noise. In Table 20, p values for response R4 (drug release at 12 hrs) represent that the contribution of (A, B and C) is significant to model term. The values obtained for main effects of the independent variables from equation indicate that chitosan (A) at the high level (1) have the positive effect on the response R4 (drug release at 12 hrs). From the Figures 19 and 20 of
the response curve of drug release at 9 hrs for multiparticulate, it is observed that high (1) concentration of chitosan (A) releases the drug at 12 hrs significantly. From equation indicate that concentrations of guar gum (B) at medium level (0) are effective for response R4 (drug release at 12 hrs). On the other hand, the coat composition at low level (−1) is sufficient to reach the multiparticulate to the colon (Figs. 19 and 20).
For response R4 (drug release at 18 hrs) the model F-value of 13.37 implies the model is significant. There is only a 0.12% chance that a “Model F-Value” this large could occur due to noise. Values of “Prob > F” >0.0500 indicate model terms are significant. In this case A, B, A++2±, B++2± are significant model terms. Values >0.1000 indicate the model terms are not significant. If there are many insignificant model terms (not counting those required to support hierarchy), the model reduction may improve your model. The “lack of fit F-value” of 438.00 implies the lack of fit is significant. There is only a 0.01% chance that a “lack of fit F-value” this large could occur due to noise. In Table 21, p values for response R5 (drug release at 18 hrs) represent that the contribution of (A, B and C) is significant to model term. The values obtained for main effects of the independent variables from Equation
Fig. 16: 3-D response curve of mucoadhesion for colon targeted multiparticulate
Fig. 17: 3-D response curve of drug release at 9 hrs for colon targeted multiparticulate
Fig. 18: Contour Plot for drug release at 9 hrs for colon targeted multiparticulate
Fig. 19: Contour Plot for drug release at 12 hrs for colon targeted multiparticulate
Fig. 20: 3-D response curve of drug release at 12 hrs for colon targeted multiparticulate
Fig. 21: Contour Plot for drug release at 18 hrs for colon targeted multiparticulate

Asian J Pharm Clin Res, Vol 9, Issue 1, 2016, 219-237 Rangari and Puranik
232
indicate that chitosan (A) at the high level (1) have the positive effect on the response R5 (drug release at 18 hrs). From the Figures 21 and 22 of the response curve of drug release at 9 hrs for multiparticulate, it is observed that high (1) concentration of chitosan (A) releases the drug at 18 hrs significantly. From equation indicate that concentrations of guar gum (B) at medium level (0) are effective for response R5 (drug release at 18 hrs). On the other hand, the coat composition at low level (−1) is sufficient to reach the multiparticulate to the colon (Figs. 21 and 22 ficient to reach th).
For response R6 (drug release at 24 hr) the Model F-value of 8.64 implies the model is significant. There is only a 0.48 % chance that a “model F-value” this large could occur due to noise. Values of “Prob > F” <0.0500 indicate model terms are significant. In this case A, B, A++2±, C++2± are significant model terms. Values >0.1000 indicate the model
terms are not significant. If there are many insignificant model terms (not counting those required to support hierarchy), the model reduction may improve your model. The “lack of fit F-value” of 90.31 implies the Lack of Fit is significant. There is only a 0.04% chance that a “lack of fit F-value” this large could occur due to noise. In Table 22, p values for response R6 (drug release at 24 hrs) represent that the contribution of (A, B and C) is significant to model term, and the linear contribution (C) is non-significant model term. The values obtained for main effects of the independent variables from Equation indicate that chitosan (A) at the high level (1) have the positive effect on the response R6 (drug release at 24 hrs). From the Figures 23 and 24 of the response curve of drug release at 24 hrs for multiparticulate, it is observed that high (1) concentration of chitosan (A) releases the drug at 24 hrs significantly. From equation indicate that concentrations of guar gum (B) at medium level (0) are effective for response R6 (drug release at 24 hrs). On the
Table 20: Analysis of variance for response R4 (drug release at 12 hrs) for Ketoprofen
Source Sum of squares df Mean square F value p-value P>F SignificanceModel 19.65116 9 2.183462 22.86878 0.00022 SignificantA-CH 10.92781 1 10.92781 114.4539 1.37E-05B-GG 2.773013 1 2.773013 29.04351 0.00102C-CC 0.01445 1 0.01445 0.151344 0.708817AB 0.2601 1 0.2601 2.724192 0.142823AC 0.164025 1 0.164025 1.717938 0.231321BC 2.5E-05 1 2.5E-05 0.000262 0.987541A2 1.695117 1 1.695117 17.75403 0.003968B2 3.452338 1 3.452338 36.15852 0.000535C2 0.554817 1 0.554817 5.810948 0.046733Residual 0.668345 7 0.095478Lack of fit 0.573025 3 0.191008 8.015457 0.036274 SignificantPure error 0.09532 4 0.02383Cor total 20.31951 16
Table 21: Analysis of variance for response R5 (drug release at 18 hrs) for Ketoprofen
Source Sum of squares df Mean square F value p-value P>F SignificanceModel 28.76404 9 3.196004 13.36557 0.001247 SignificantA-CH 18.1202 1 18.1202 75.77801 5.3E-05B-GG 6.534112 1 6.534112 27.32542 0.001216C-CC 0.000312 1 0.000312 0.001307 0.972172AB 0.555025 1 0.555025 2.321094 0.171451AC 0.005625 1 0.005625 0.023524 0.882431BC 0.0121 1 0.0121 0.050602 0.828445A2 1.676467 1 1.676467 7.010925 0.033046B2 2.042578 1 2.042578 8.541986 0.022255C2 0.00342 1 0.00342 0.014302 0.908166Residual 1.673855 7 0.239122Lack of fit 1.668775 3 0.556258 437.9987 1.73E-05 SignificantPure error 0.00508 4 0.00127Cor total 30.43789 16
Table 22: Analysis of variance for response R6 (drug release at 24 hrs) for Ketoprofen
Source Sum of squares df Mean square F value p-value P>F SignificanceModel 63.61237 9 7.068041 8.639098 0.004786 SignificantA-CH 38.10645 1 38.10645 46.57661 0.000248B-GG 7.03125 1 7.03125 8.594129 0.021975C-CC 0.5618 1 0.5618 0.686675 0.434639AB 2.89 1 2.89 3.532378 0.102247AC 0.0144 1 0.0144 0.017601 0.898189BC 0.9409 1 0.9409 1.15004 0.319114A2 5.719538 1 5.719538 6.990855 0.033229B2 1.225517 1 1.225517 1.49792 0.260584C2 6.957938 1 6.957938 8.504522 0.02246Residual 5.72702 7 0.818146Lack of fit 5.6437 3 1.881233 90.31365 0.000395Pure error 0.08332 4 0.02083 8.639098 0.004786 SignificantCor total 69.33939 16
Asian J Pharm Clin Res, Vol 9, Issue 1, 2016, 219-237 Rangari and Puranik
233
other hand, the coat composition at low level (−1) is sufficient to reach the multiparticulate to the colon (Figs. 23 and 24).
Advanced studies on optimized batch of multiparticulates
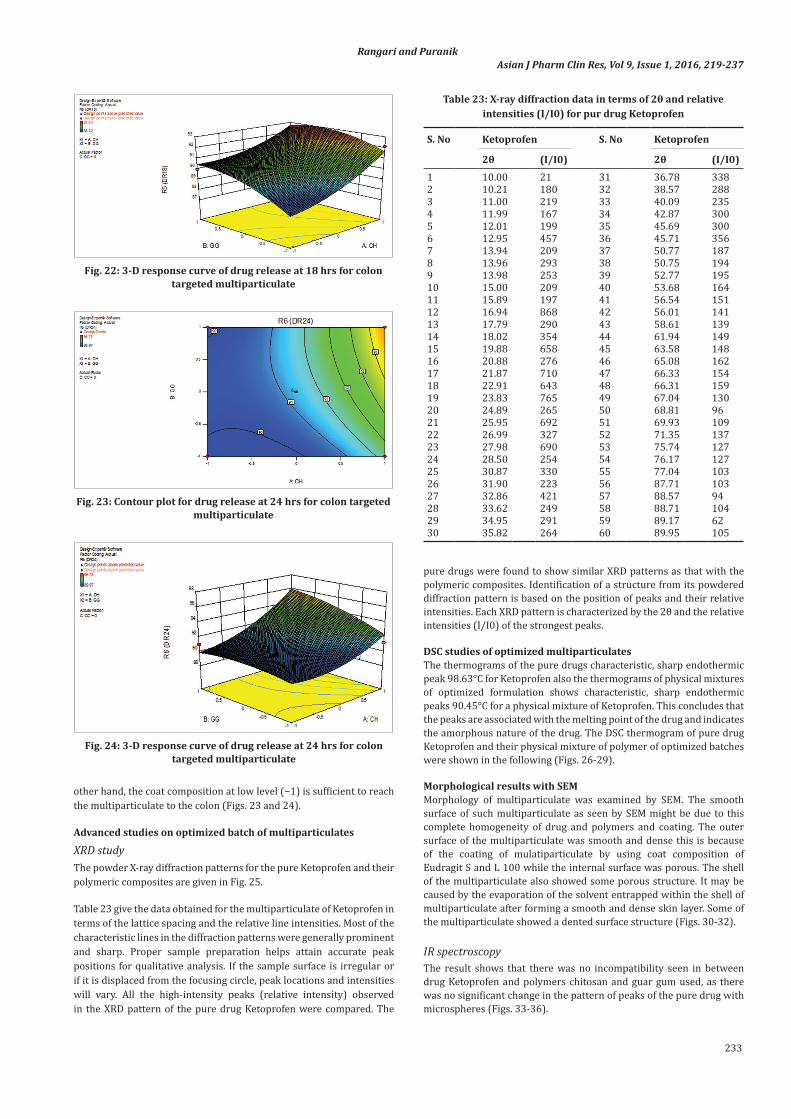
XRD studyThe powder X-ray diffraction patterns for the pure Ketoprofen and their polymeric composites are given in Fig. 25.
Table 23 give the data obtained for the multiparticulate of Ketoprofen in terms of the lattice spacing and the relative line intensities. Most of the characteristic lines in the diffraction patterns were generally prominent and sharp. Proper sample preparation helps attain accurate peak positions for qualitative analysis. If the sample surface is irregular or if it is displaced from the focusing circle, peak locations and intensities will vary. All the high-intensity peaks (relative intensity) observed in the XRD pattern of the pure drug Ketoprofen were compared. The
pure drugs were found to show similar XRD patterns as that with the polymeric composites. Identification of a structure from its powdered diffraction pattern is based on the position of peaks and their relative intensities. Each XRD pattern is characterized by the 2θ and the relative intensities (I/I0) of the strongest peaks.
DSC studies of optimized multiparticulatesThe thermograms of the pure drugs characteristic, sharp endothermic peak 98.63°C for Ketoprofen also the thermograms of physical mixtures of optimized formulation shows characteristic, sharp endothermic peaks 90.45°C for a physical mixture of Ketoprofen. This concludes that the peaks are associated with the melting point of the drug and indicates the amorphous nature of the drug. The DSC thermogram of pure drug Ketoprofen and their physical mixture of polymer of optimized batches were shown in the following (Figs. 26-29).
Morphological results with SEMMorphology of multiparticulate was examined by SEM. The smooth surface of such multiparticulate as seen by SEM might be due to this complete homogeneity of drug and polymers and coating. The outer surface of the multiparticulate was smooth and dense this is because of the coating of mulatiparticulate by using coat composition of Eudragit S and L 100 while the internal surface was porous. The shell of the multiparticulate also showed some porous structure. It may be caused by the evaporation of the solvent entrapped within the shell of multiparticulate after forming a smooth and dense skin layer. Some of the multiparticulate showed a dented surface structure (Figs. 30-32).
IR spectroscopyThe result shows that there was no incompatibility seen in between drug Ketoprofen and polymers chitosan and guar gum used, as there was no significant change in the pattern of peaks of the pure drug with microspheres (Figs. 33-36).
Fig. 22: 3-D response curve of drug release at 18 hrs for colon targeted multiparticulate
Fig. 23: Contour plot for drug release at 24 hrs for colon targeted multiparticulate
Fig. 24: 3-D response curve of drug release at 24 hrs for colon targeted multiparticulate
Table 23: X‑ray diffraction data in terms of 2θ and relative intensities (I/I0) for pur drug Ketoprofen
S. No Ketoprofen S. No Ketoprofen
2θ (I/I0) 2θ (I/I0)1 10.00 21 31 36.78 3382 10.21 180 32 38.57 2883 11.00 219 33 40.09 2354 11.99 167 34 42.87 3005 12.01 199 35 45.69 3006 12.95 457 36 45.71 3567 13.94 209 37 50.77 1878 13.96 293 38 50.75 1949 13.98 253 39 52.77 19510 15.00 209 40 53.68 16411 15.89 197 41 56.54 15112 16.94 868 42 56.01 14113 17.79 290 43 58.61 13914 18.02 354 44 61.94 14915 19.88 658 45 63.58 14816 20.88 276 46 65.08 16217 21.87 710 47 66.33 15418 22.91 643 48 66.31 15919 23.83 765 49 67.04 13020 24.89 265 50 68.81 9621 25.95 692 51 69.93 10922 26.99 327 52 71.35 13723 27.98 690 53 75.74 12724 28.50 254 54 76.17 12725 30.87 330 55 77.04 10326 31.90 223 56 87.71 10327 32.86 421 57 88.57 9428 33.62 249 58 88.71 10429 34.95 291 59 89.17 6230 35.82 264 60 89.95 105

Asian J Pharm Clin Res, Vol 9, Issue 1, 2016, 219-237 Rangari and Puranik
234
In vivo gamma scintigraphy studyThe gamma scintigraphy study in rat showed that the multiparticulate were intact in the hostile environment of the stomach at 1 minutes and 15 minutes duration but whenever they reached to the colonic region they stars degradation due to the presence of anaerobic bacteria present in the colon (Figs. 37).
Table 24: Changes in body weight of Wister male rat during study
S. No Groups Initial body weight (g)
Final body weight (g)
Weight gain (g)
1 Group I 237.13±2.13 236.06±2.23 242.21±1.133 Group II 235.21±3.23 229.34±1.13 237.45±1.036 Group III 244.12±1.43 248.20±3.43 250.04±1.08*Each sample was analyzed in triplicate (n=3)
Fig. 25: Comparative graph of Ketoprofen, chitosan, guar gum, and polymer composite of optimized batch
Fig. 26: Differential scanning calorimetry of pure drug Ketoprofen
Fig. 27: Differential scanning calorimetry of polymer chitosan
Fig. 28: Differential scanning calorimetry of polymer guar gum
Fig. 29: Differential scanning calorimetry of optimized batch of Ketoprofen
Fig. 30: Scanning electron microscopy of blank multiparticulate of polymer (guar gum and chitosan) coated with Eudragit L
and S 100
Fig. 31: Scanning electron microscopy of blank multiparticulate of polymer (guar gum and chitosan) without coating

Asian J Pharm Clin Res, Vol 9, Issue 1, 2016, 219-237 Rangari and Puranik
235
Histopathology evaluationDuring the experimental period (84 days), the inflammatory agent exposed rats (Group II) exhibited a significantly low gain in body weight and growth rate throughout the experimental period as compared to Group I and Group III. To the Group III (multiparticulates containing 150 mg/kg/day of Ketoprofen) was administered which shows significantly increased in weight gain when compared with Group II (Table 24).
Histopathological observations of the colon from control group animals Group I (Figs. 38 and 39) showed normal structure of the villi. 2, 4, 6, trinitrobenzene sulfonic acid administered colons showed
Fig. 32: Scanning electron microscopy of optimized batch of Ketoprofen (K10)
Fig. 33: Infrared of pure drug Ketoprofen
Fig. 34: Infrared of polymer chitosan
Fig. 35: Infrared of polymer guar gum
Fig. 36: Physical mixture of optimized batch of Ketoprofen (K10)
Fig. 37: In vivo Gamma scintigraphy study
Fig. 38: Group I show normal Villi. (H and E, ×20)
Fig. 39: Photograph of colon after sacrifice (Group I)

Asian J Pharm Clin Res, Vol 9, Issue 1, 2016, 219-237 Rangari and Puranik
236
inflammatory changes as the presence of inflammatory cells in submucosal area and distortion of villi (Group II) (Figs. 40 and 41). Treatment with Ketoprofen multiparticulate (Group III) (Figs. 42 and 43) has showed reduction in the infiltration of inflammatory cells and villi appeared normal.
CONCLUSION
Targeted drug delivery into the colon is highly desirable for local treatment of a variety of bowel diseases such as ulcerative colitis, Crohn’s disease, amebiosis, colonic cancer, local treatment of colonic pathologies, and systemic delivery of protein and peptide drugs. Specifically, mucoadhesive multiparticulate systems appear to be an exploitable delivery system for colon release of drugs, and hence we have selected this topic for our research. For this, we have selected three categories of drug, i.e. non-steroidal anti-inflammatory agents Ketoprofenas these categories of the drug generally used to cure diseases related to the colon. To prepare mucoadhesive colon targeted multiparticulate system we have used natural polymers like Chitosan and Guar gum together with Eudragit S and L 100 for coating of multiparticulate. The drugs and excipient were subjected to compatibility testing before formulation, i.e. IR, DSC, and XRD. The result of drug excipient compatibility testing reveals that there is no sign of incompatibility in peaks for respective analysis.
The preliminary trial batches were prepared and evaluated, out of which for Ketoprofen K3a, K5a, K3b and K5b show good entrapment efficiency, swelling index, ex vivo mucoadhesion and in vitro drug release then other formulation. Factorial batches were also prepared using “Design Expert Software,” and formulations were also evaluated for same as like
for preliminary trials. For formulated factorial batches, of Ketoprofen K10 batch shows good entrapment efficiency, swelling index, ex vivo mucoadhesion and in vitro drug release and was considered as an optimized formulation and further subjected to advance study like SEM, in-vivo evaluation (gamma scintigraphy), histopathological study and accelerated stability analysis for 3 months at 40±2°C/75±5% RH. The results obtained revealed that the dissolution profile of formulations after 3 months of storage at accelerated condition was similar with the initial dissolution profile of formulation. Based on the results it was considered that the formulation is stable after 3 months of storage at accelerated stability conditions.
The results of study clearly indicate that there is a great potential in the delivery of Ketoprofen to the colonic region. The study showed that the manipulation of polymer concentration and coat composition influence particle size of multiparticulate, flow property, drug release profile, etc. From the above study it concluded that high concentration of chitosan together with guar gum retard the drug release, may be due to the cross-linking of chitosan which did not disintegrate under the influence of colon enzymes and also coating with Eudragit S and L 100 composition prevents its release in GIT and helps to target the drug in colon. Formulation K10 for Ketoprofen was the best formulation for controlling the drug release to the colon. The efficiency of Ketoprofen as a NSAID was also evaluated successfully with 2, 4, 6, trinitrobenzeen sulfonic acid colitis in a rat model. The formulation K10 of Ketoprofen confirmed to serve as a new drug delivery system to treat inflammatory bowel disease.
Gamma scintigraphy and histological study of optimized formulation K10 for Ketoprofen showed that the formulation can specifically delivered the drug to the site of action; the animals treated with this
Fig. 40: Photograph of colon after sacrifice (Group II)
Fig. 41: 2, 4, 6 Trinitrobenzene sulfonic acid induced inflammations (Group II): Note distortion of villi, presence of sub
mucosal inflammatory cells (arrow). (H and E, ×20)
Fig. 42: Photograph of colon after sacrifice (Group III)
Fig. 43: Ketoprofen (Group III): Note marked reduction in sub mucosal inflammatory cells. (H and E, ×20)

Asian J Pharm Clin Res, Vol 9, Issue 1, 2016, 219-237 Rangari and Puranik
237
formulation had an improvement in pathology, and may be useful for the treatment of inflammatory bowel disease and colon cancer.
ACKNOWLEDGEMENT
Author wish to express their sincere thanks to Dr. P.K.Puranik, Professor, Department of Pharmaceutical Sciences RTM Nagpur University, Maharashtra, India, for their valuable guidance time to time during commencement of the research work. Furthermore, author expresses their great gratitude towards Dr. T.M. Kalyankarr, Swami Ramanand Teerth Marathwada University, Nanded, Maharashtra, India, for their constant encouragement and support.
REFERENCES
1. Philip AK, Dabas S, Pathak K. Optimized prodrug approach: A means for achieving enhanced anti-inflammatory potential in experimentally induced colitis. J Drug Target 2009;17(3):235-41.
2. Odeku OA, Fell JT. In-vitro evaluation of khaya and albizia gums as compression coatings for drug targeting to the colon. J Pharm Pharmacol 2005;57(2):163-8.
3. Akala EO, Elekwachi O, Chase V, Johnson H, Lazarre M, Scott K. Organic redox-initiated polymerization process for the fabrication of hydrogels for colon-specific drug delivery. Drug Dev Ind Pharm 2003;29(4):375-86.
4. Akhgari A, Garekani AH, Sadeghi F, Azimaie M. Statistical
optimization of indomethacin pellets coated with pH-dependent methacrylic polymers for possible colonic drug delivery. Int J Pharm 2005;305:22-30.
5. Annadurai G, Sheeja RY. Use of box-behnken design of experiments for the adsorption of verofix red using biopolymer. Bioprocess Eng 1998;18:463-6.
6. Motwani SK, Chopra S, Talegaonkar S, Kohli K, Ahmad FJ, Khar RK, Chitosan–sodium alginate nanoparticles as submicroscopic reservoirs for ocular delivery: Formulation, optimization and in vitro characterization. Eur J Pharm Biopharm 2007;53:235-43.
7. Singh SK, Dodge J, Durrani MJ, Khan MA. Optimization and characterization of controlled release pellets coated with an experimental latex: I. Anionic drug. Int J Pharm 1995;125:243-55.
8. Chourasia MK, Jain SK. Pharmaceutical approaches to colon targeted drug delivery systems. J Pharm Pharm Sci 2003;6(1):33-66.
9. Basit A, Bloor J. Prespectives on colonic drug delivery. Business briefing. Pharmtech 2003;9:185-190.
10. Mura C, Nácher A, Merino V, Merino-Sanjuan M, Carda C, Ruiz A, et al. N-Succinyl-chitosan systems for 5-aminosalicylic acid colon delivery: In vivo study with TNBS-induced colitis model in rats. Int J Pharm 2011;416(1):145-54.
11. Perse M, Crar A. The dimethylhydrazine induced colorectal tumours in rat-experimental colorectal carcinogenesis. Radiol Oncol 2005;39(1):61-70.
12. Salve PS. Development and in vitro evaluation colon targeted drug delivery system using natural gums. Asian J Pharm Res 2011;1(4):91-101.