Embed Size (px)
Citation preview

21
Development of Microsatellite Markers by Data Mining from DNA Sequences
Jingou Tong, Dan Wang and Lei Cheng State Key Laboratory of Freshwater Ecology and Biotechnology
Institute of Hydrobiology, Chinese Academy of Sciences P.R.China
1. Introduction
1.1 What are microsatellites
Microsatellites are tandem repeats of 1-6 nucleotides found at high frequency in the nuclear genomes of most taxa (Beckmann and Weber, 1992). As such, they are also known as simple sequence repeats (SSR), variable number tandem repeats (VNTR) and short tandem repeats (STR). For example, (A)11, (GT)12, (ATT)9, (ATCG)8, (TAATC)6 and (TGTGCA)5 represent mono-, di-, tri-, tetra-, penta- and hexa-nucleotide repeats, respectively. A microsatellite locus typically varies in length between 5 and 40 repeats, but longer strings of repeats are possible. Dinucleotide, trinucleotide and tetranucleotide repeats are the most common choices for molecular genetic studies. Dinucleotides are the dominant type of microsatellite repeats in most vertebrates characterized so far, although trinucleotide repeats are most abundant in plants (Beckmann & Weber, 1992; Chen et al., 2006; Kantety et al., 2002). Despitethe fact that the mechanism of microsatellite evolution and function remains unclear, SSRs were being widely employed in many fields soon after their first description (Litt & Luty1989; Tautz 1989; Weber & May 1989) because of the high variability which makes them very powerful genetic markers. Microsatellites have proven to be an extremely valuable tool for genome mapping in many organisms (Schuler et al., 1996; Knapiket al., 1998), but their applications span over different areas ranging from kinship analysis, to population genetics and conservation/management of biological resources ( Jarne & Lagoda 1996). Microsatellites can be amplified for identification by the polymerase chain reaction (PCR), using two unique sequences which are complementary to the flanking regions as primers. This process results in production of enough DNA to be visible on agarose or polyacrylamide gels; only small amounts of DNA are needed for amplification as thermocycling in this manner creates an exponential increase in the replicated segment. With the abundance of PCR technology, primers that flank microsatellite loci are simple and quick to use, but the development of correctly functioning primers is often a tedious and costly process. However, once they are developed and characterized in an organism, microsatellites are powerful for a variety of applications because of their reproducibility, multiallelic nature, codominant inheritance, relative abundance and good genome coverage (Liu & Cordes, 2004). Unlike conserved flanking regions, microsatellite repeat sequences mutate frequently by slippage and proofreading errors during DNA replication that primarily change the number O
pen
Acc
ess
Dat
abas
e w
ww
.inte
chw
eb.o
rg
Source: Data Mining and Knowledge Discovery in Real Life Applications, Book edited by: Julio Ponce and Adem Karahoca, ISBN 978-3-902613-53-0, pp. 438, February 2009, I-Tech, Vienna, Austria
www.intechopen.com
Data Mining and Knowledge Discovery in Real Life Applications
338
of repeats and thus the length of the repeat string (Eisen 1999). Because alleles differ in length, they can be distinguished by high-resolution gel electrophoresis, which allows rapid genotyping of many individuals at many loci for a fraction of the price of sequencing DNA. Many microsatellites have high-mutation rates (between 10-2 and 10-6 mutations per locus per generation, and on average 5×10⁻⁴ ) that generate the high levels of allelic diversity necessary for genetic studies of processes acting on ecological time scales.
1.2 Progress in the development of microsatellites
As aforemetioned, the major drawback of microsatellites is that they need to be isolated and characterization before to be used for the first time. Generally, microsatellites can be developed by the following approaches: 1. Cross-species amplification Because the sequences of flanking region are generally conserved across individuals of the same species and sometimes of different species, a particular microsatellite locus can often be identified by its flanking sequences. The presence of highly conserved flanking regions has been reported for some microsatellite loci in cetaceans (Schlötterer et al., 1991), turtles (FitzSimmons et al., 1995) and fish (Rico et al., 1996), allowing cross-amplification from species that diverged as long as 470 million years ago (Ma). In this way, the first step is to search published literature and public databases for any existing microsatellite primers for the target species or closely-related species. The availability of microsatellite markers for a given species will be a combination of past interest in that species (and related species) and the inherent success rate of microsatellite development for that taxon. There are clear differences in the frequency of microsatellite regions in the genomes of plants, animals, fungi and prokaryotes (Toth et al. 2000), and the success rate of isolating microsatellite markers often scales with their frequency in the genome (Zane et al. 2002). Currently, many microsatellite markers are reported as primer notes in a specialized journal “Molecular Ecology Notes” (now changed as ”Molecular Ecology Resources”). There is a searchable database online for any microsatellite primers published in this journal (http://tomato.bio.trinity.edu/). The sequences themselves are archived in GenBank, and are often submitted long before their use appears in published studies. GenBank can be searched with a web-based engine run by the National Center for Biotechnology Information (http://www.ncbi.nlm.nih.gov/) by typing in the species, genus or family name, the term microsatellite and selecting the Nucleotide database (Benson et al. 2008; Wheeler 2008). 2. Genomic library- based method Traditionally, microsatellite loci have been isolated from partial genomic libraries (selected for small insert size) of the species of interest, screening several thousands of clones through colony hybridization with repeat-containing probes (Rassmann et al. 1991). Although relatively simple, especially for microsatellite-rich genomes, this approach can turn out to be extremely tedious and inefficient for species with low microsatellite frequencies. Therefore, several alternative strategies have been devised in order to reduce the time invested in microsatellite isolation and to significantly increase yield. Conventional library–screening methods, established before 2000, had low efficiency and they could be time-consuming. A repeat-enriched method by using an AFLP procedure, named as FIASCO, was reported and increased the efficiency of microsatellite isolation significantly (Zane et al. 2002).
www.intechopen.com

Development of Microsatellite Markers by Data Mining from DNA Sequences
339
1.3 Mining microsatellites from nucleotide sequences
Methods of SSR-mining have gone through a rapid evolution during the past few years. The first approaches relied on visual inspection of sequence. Although manual comparison of a small number of sequences is feasible, standard accuracy criteria are hard to establish, and this method does not scale well for multiple sequences and many microsatellite location. The efficiency of visual inspection is increased when it is performed aided by computer programs that are capable of displaying sequence traces. Computer-aided manual examination was used in the analysis of overlapping regions of genomic clone sequences to detect microsatellites. Although visual inspection remains an integral part of software testing and tuning, demands for fast and reliable detection in large data sets have necessitated the development of automated, computational methods of microsatellites discovery. Once batches of nucleotide sequences with the length higher than approximate 200 base pairs have been accumulated in a species, mining microsatellites from them would be a cheapest way. Recently, with the great progress in genomics and bioinformatics, many in silico approaches are increasingly being used for the development of microsatellite markers in many species. Structured, classified and easy to use microsatellite data have been compiled in various microsatellite databases that have been developed and made available online by various institutions in recent years (Table 1). Many of these resources are dedicated to mine microsatellites, although they are sometimes by-products of completed or ongoing genome-sequencing projects. A number of algorithms already existed which either directly or indirectly detect tandem repeats, all suffer from significant limitations. One group of algorithms was based on computing alignment matrices, and their primary limitation was excessive running time. Another group of algorithms found tandem repeats indirectly using methods from the field of data compression, which may require that the approximate pattern size and a range for the number of copies be specified. Benson (1999) overviewed microsatellite-finding softwares and presented a new algorithm for finding tandem repeats which works without the need to specify either the pattern or pattern size. The algorithm presented in this paper is designed to overcome many of the aforementioned limitations: (i) it uses the method of k-tuple matching to avoid the need for full scale alignment matrix computations; (ii) it requires no a priori knowledge of the pattern, pattern size or number of copies; (iii) there are no restrictions on the size of the repeats that can be detected; (iv) it uses percentage differences between adjacent copies and treats substitutions and indels separately; (v) it determines a consensus pattern for the smallest repetitive unit in the tandem repeat. The program has already been used as a preprocessor in a new alignment algorithm where tandem duplication augments the standard mutation set of insertion, deletion and substitution. This chapter aims to give readers basic concept and know-how about the development of microsatellite markers by data mining from DNA sequences.
Database Species Host Description Weblink
Mouse Microsatellite Database of Japan (MMDBJ)
Mouse
National Institute of Genetics, Japan
Collection of 6119 microsatellites. Also includes PCR conditions for all entries of primer sets and keyword searches for the information
www.shigen. nig.ac.jp/mouse/ mmdbj/
www.intechopen.com

Data Mining and Knowledge Discovery in Real Life Applications
340
Simple- Sequence Repeat Database (SSRD)
Human
Center for Cellular and Molecular Biology, India
Provides summary and detailed view of SSRs, the flanking genomic regions and their associations with genes and sequence tagged sites (STS) markers
www.ccmb.res.in/ ssr
Satellog Human
Michael Smith Genome Science Center, Canada
Catalogs 1–16 repeat-unit perfect repeats in the human genome
http://satellog. bcgsc.ca
Microsat2006 Human
King’s College, UK
Catalogs human microsatellite repeats
www.microsatellites.org/db_search.php
Molecular Mycology SSR Database
Nine fungal genomes
Westmead Hospital, UK
Mono- to hexa-nucleotide repeats of fungal genomes with complete or draft sequences available
www.mmrl.med.usyd.edu.au/ssr.html
TRBase
Human
University of Exeter, UK
Perfect and imperfect repeats of 1–2000 bp unit lengths from human-sequence data and annotation files for 11 chromosomes
http://trbase.ex.ac.uk
InSatdb
Five fullysequenced insect genomes
Center for DNA Fingerprinting and Diagnostics, India
Microsatellite information according to size, genomic location, nature and sequence composition (repeat motif and GC%) as well as microsatellite cluster
http://210.212.212.8/PHP/INSATDB/ home.php
TRDB
Data imported from genome.ucsc.edu
Center for Advanced Genome Technology (CAGT), Boston University, USA
Microsatellite collection along with information on their primers, marker potential, etc., in addition to the facility to screen user’s sequence resources, while enabling a user to store and organize their data in allocated 100 Mb of storage space
http://cagt.bu.edu/page/TRDB_about
Table 1. Some online microsatellite resources (from Prakash 2007)
www.intechopen.com
Development of Microsatellite Markers by Data Mining from DNA Sequences
341
2. Mining microsatellites from nucleotide sequences
2.1 Sources of the data
Sequences from both genomic DNA and cDNA can be used for microsatellite mining. Though some researchers produced DNA sequences and kept them in their own laboratories, publicly accessible nucleotide databases are the major source in many studies today including microsatellite mining. The GenBank sequence database is an annotated collection of all publicly available nucleotide sequences and their protein translations. This database is produced at National Center for Biotechnology Information (NCBI) as part of an international collaboration with the European Molecular Biology Laboratory (EMBL) Data Library from the European Bioinformatics Institute (EBI) and the DNA Data Bank of Japan (DDBJ). GenBank and its collaborators receive sequences produced in laboratories throughout the world from more than 100,000 distinct organisms. GenBank continues to grow at an exponential rate, doubling every 10 months. Release 134, produced in February 2003, contained over 29.3 billion nucleotide bases in more than 23.0 million sequences. GenBank is built by direct submissions from individual laboratories, as well as from bulk submissions from large-scale sequencing centers. GenBank nucleotide records are located in separate databases that must be searched independently. These include dbEST and dbGSS, plus multiple databases for the CoreNucleotide division, including nr, htgs, wgs and env_nt. ESTs [http://www.ncbi.nlm.nih.gov/dbEST/] are generally short (<1 kb), single-pass cDNA sequences from a particular tissue and/or developmental stage. However, they can also be longer sequences that are obtained by differential display or Rapid Amplification of cDNA Ends (RACE) experiments. ESTs are particularly attractive for marker development since they represent coding regions of the genome and putative function can often be deduced by homology searches although little is known about many of the ESTs. While ESTs provide means for the identification of genes, microsatellites provide high level of polymorphism. Microsatellites identified in ESTs are typically referred to as EST-SSRs or genic SSRs, contrasting to type II SSRs which come from random sequences of the genome. The identification of ESTs has preceded rapidly, with approximately 39 million ESTs sequences now available in public databases (e.g. GenBank 4/2008, all species). As a by-product of EST or BAC sequencing projects in many organisms, microsatellite-mining from SSR-containing ESTs is inexpensive and time-saving, and has proved to be an effective approach to develop microsatellies for genetic map and population genetics studies in animals and plants (e.g. Yue et al., 2004; Wang et al., 2005; Caire et al., 2005). STS [http://www.ncbi.nlm.nih.gov/dbSTS/]s are short genomic landmark sequences (1). They are operationally unique in that they are specifically amplified from the genome by PCR amplification. In addition, they define a specific location on the genome and are, therefore, useful for mapping. GSS [http://www.ncbi.nlm.nih.gov/dbGSS/]s are also short sequences but are derived from genomic DNA, about which little is known. They include, but are not limited to, single-pass GSSs, BAC ends, exon-trapped genomic sequences, and AluPCR sequences. EST, STS, and GSS sequences reside in their respective divisions within GenBank, rather than in the taxonomic division of the organism. The sequences are maintained within GenBank in the dbEST, dbSTS, and dbGSS databases. ESTs are particularly attractive for marker development represent coding regions of the genome and putative function can often be deduced by homology searches. While ESTs provide means for the identification of genes, microsatellites provide high levels of polymorphism.
www.intechopen.com

Data Mining and Knowledge Discovery in Real Life Applications
342
2.2 Finding and characterizing repeat motifs
Traditionally, SSR isolation has relied on the screening of genomic libraries using repetitive probes and sequencing of positive clones in order to develop locus-specific primers. These processes are necessary for many organisms but normally time-consuming and labor-intensive. Mining SSR from public databases has been streamlined with technological advance and protocol optimization to make the process cheaper, more efficient and more successful, and has proved to be an effective approach to develop microsatellies for genetic map and population genetics studies in animals (Serapion et al., 2004; Yue et al., 2004; Wang et al., 2005; Chen et al., 2005; Pérez et al., 2005; Maneeruttanarungroj et al., 2006) and plants (Cordeiro et al., 2001; Kantety et al., 2002; Chen et al., 2006). Here, we demonstrate how to mine SSRs from common carp EST data step by step. 1. Download EST sequences from public databases The target ESTs from the NCBI dbEST database were downloaded into VectorNTI software (InforMax Inc.). First, ‘‘common carp EST’’ was used as a keyword to search nucleotide sequences at the NCBI databases (http://www.ncbi.nlm.nih.gov). EST sequences of common carp were downloaded from GenBank, DDBJ and EMBL databases between January 1, 2002 and October 18, 2005. All matched sequences were downloaded by changing the ‘‘display’’ window to FASTA, and the ‘‘send to’’ window to FILE. A file containing 10,088 sequences was saved as a text file. 2. Tools for microsatellite mining In general, microsatellite-finding tools can be classified broadly into three subcategories based on their architecture: first, such as MISA and TROLL etc; second, Tandem-Repeats Finder (TRF) etc; third, ATR and ETR, etc (Table 2). (Prakash et al., 2007)
Name, acronym and weblink of the tool
Salient features Limitations
Repeatmasker www.repeatmasker.org
Available online and stand-alone; mines perfect, imperfect and compound repeats; accepts data in multiple formats; presents statistical analysis; returns flanking sequences; MaskerAid, a performance enhancement is available
Runs only on Unix/Linux systems; not specific for microsatellites
Sputnik (http://espressosoftware. com/pages/sputnik.jsp and http://cbi.labri.fr/outils/Pise/sputnik.html)
C-language program available online and stand-alone; mines perfect, imperfect and compound repeats; accepts data in multiple formats; improved versions include Modified Sputnik-I and Modified Sputnik-II
Automated statistical analysis files not generated; runs only on Unix/Linux systems; hexanucleotide repeats are not screened
Tandem Repeats Finder (TRF) (http://tandem.bu.edu/trf/trf.html)
Both online and stand-alone versions are GUI; mines perfect, imperfect and compound repeats; platform
Accepts input as fasta files only; automated statistical analysis file not generated (TRAP;
www.intechopen.com

Development of Microsatellite Markers by Data Mining from DNA Sequences
343
independent
www.coccidia.icb.usp.br/trap/ [54] can be used); process limited-size files only; output files are numerous and difficult to manage
Repeatfinder (www.cbcb.umd.edu/software/RepeatFinder/)
Available online and stand-alone; mines perfect, imperfect and compound repeats; accepts multiple formats as input
Runs on Unix/Linux systems; not specific for microsatellites
eTandem and eQuicktandem (http://bioweb.pasteur.fr/ seqanal/interfaces/ etandem.html)
Perl script available online and stand-alone; parts of EMBOSS suite; mines perfect, imperfect and compound repeats; accepts input in multiple formats; generates statistics
Runs only on SGI Irix, Linux, Sun solaris and Tru64 Unix
REPuter (http://bibiserv.techfak. uni-bielefeld.de/reputer/)
Available online and stand-alone; stand-alone version can handle large genomic sequences; output cataloged in a format similar to BLAST; statistical and graphical analysis provided; excellent connectivity to BLAST, FASTA.
Limited capacity of online version; accepts data in fasta/plain format only; runs only on Unix; not specific for microsatellites
Simple-Sequence Repeat Identification Tool (SSRIT) and Clemson University Genomics Institute Simple- Sequence Repeat Tool (CUGIssr) (www.gramene.org/db/ searches/ssrtool)
Perl scripts available online and stand-alone; platform independent (CUGIssr is a modified version of SSRIT)
Finds only perfect repeats; accepts only fasta-formatted files; automated statistical analysis not generated
Tandem Repeats Occurrence Locator (TROLL) (http://wsmartins.net/cgilocal/webtroll/troll.cgi) and WebTROLL (http://wsmartins.net/webtroll/ troll.html)
C++ program available online and stand-alone (TROLL downloadable, WebTROLL web interface); identifies perfect, imperfect and compound repeats; also designs primers
Accepts fasta-formatted files only as input; executes only on Linux systems; statistical analysis not provided
Microsatellite Analysis Server (MICAS)
An exclusively web-based utility
Scans only one file at a time;
www.intechopen.com

Data Mining and Knowledge Discovery in Real Life Applications
344
(http://210.212.212.7/MIC/index.html)
compound and imperfect repeats are not identified; statistical analysis is not performed
MISA (http://pgrc.ipkgatersleben.de/misa/)
Perl script executing only offline; large sequences are handled easily; statistical analysis is generated; platform independent; can design primers using Primer3 by running supplementary scripts
Inappropriate clustering of microsatellite motifs in statistical analysis file; only fasta-formatted files are taken as input; identifies only perfect repeats and compound repeats
mreps (http://bioinfo.lifl.fr/mreps/mreps.php and http:// bioweb.pasteur.fr/seqanal/interfaces/mreps.html)
Available online and stand-alone; identifies compound and imperfect repeats; accepts data in multiple formats; platform independent; can design primers
Statistical analysis is not performed
Search for Tandem Repeats in Genomes (STRING) (http://www.caspur.it/ _castri/STRING/)
C-language program available online and stand-alone; finds perfect, imperfect and compound repeats; runs well with large genomic sequences; platform independent
Only fasta files taken as input; no automated statistical analysis
Search for Tandem Approximate Repeats (STAR) (http://atgc.lirmm.fr/star)
Available online and stand-alone; searches for ‘approximate’ tandem repeats of a given motif; platform independent
Does not generate statistical analysis
MicrosatDesign (http://daphnia.cgb.indiana.edu/wfleabase/software)
Perl scripts executing as a stand-alone tool; builds database and designs primers from the nascent DNA-sequencer outputs; DNA-sequence trace files are taken as an input; combination of phredPhrap, Primer 3 and GCG software/eTandem software; identifies compound repeats and imperfect repeats as well
Specific in its use; does not generate statistical analysis
Poly (http://bioinformatics.org/ poly/)
Downloadable Python script; statistical analysis is provided; platform independent
Slow
www.intechopen.com
Development of Microsatellite Markers by Data Mining from DNA Sequences
345
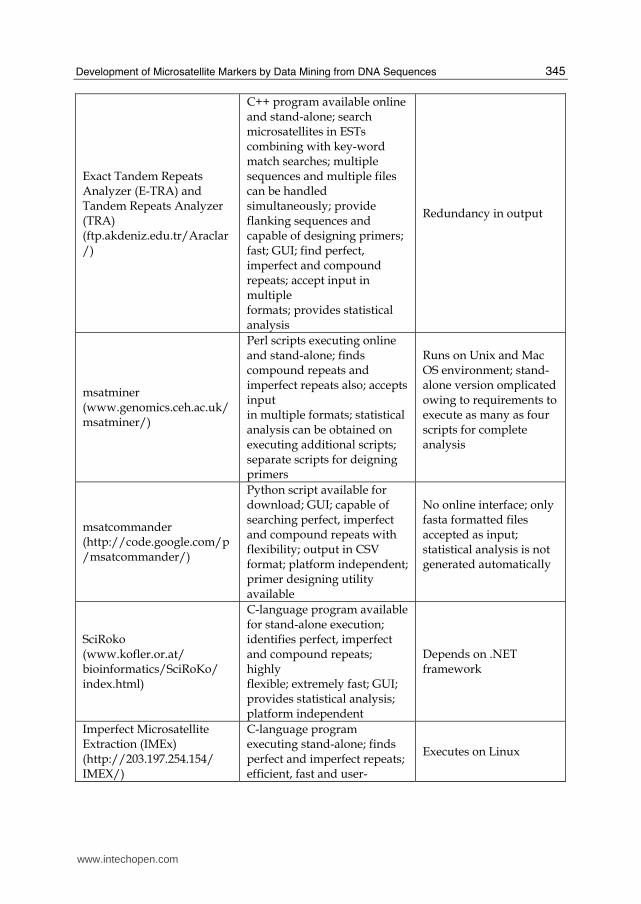
Exact Tandem Repeats Analyzer (E-TRA) and Tandem Repeats Analyzer (TRA) (ftp.akdeniz.edu.tr/Araclar/)
C++ program available online and stand-alone; search microsatellites in ESTs combining with key-word match searches; multiple sequences and multiple files can be handled simultaneously; provide flanking sequences and capable of designing primers; fast; GUI; find perfect, imperfect and compound repeats; accept input in multiple formats; provides statistical analysis
Redundancy in output
msatminer (www.genomics.ceh.ac.uk/ msatminer/)
Perl scripts executing online and stand-alone; finds compound repeats and imperfect repeats also; accepts input in multiple formats; statistical analysis can be obtained on executing additional scripts; separate scripts for deigning primers
Runs on Unix and Mac OS environment; stand-alone version omplicated owing to requirements to execute as many as four scripts for complete analysis
msatcommander (http://code.google.com/p/msatcommander/)
Python script available for download; GUI; capable of searching perfect, imperfect and compound repeats with flexibility; output in CSV format; platform independent;primer designing utility available
No online interface; only fasta formatted files accepted as input; statistical analysis is not generated automatically
SciRoko (www.kofler.or.at/ bioinformatics/SciRoKo/ index.html)
C-language program available for stand-alone execution; identifies perfect, imperfect and compound repeats; highly flexible; extremely fast; GUI; provides statistical analysis; platform independent
Depends on .NET framework
Imperfect Microsatellite Extraction (IMEx) (http://203.197.254.154/ IMEX/)
C-language program executing stand-alone; finds perfect and imperfect repeats; efficient, fast and user-
Executes on Linux
www.intechopen.com

Data Mining and Knowledge Discovery in Real Life Applications
346
friendly; returns the coding/ noncoding information of microsatellites; highly flexible; can design primers as well; statistics are generated
Table 2. Characteristics of some important microsatellite search tools
In our study in common carp (Cyprinus carpio), we use software “Tandem Repeat Finder” (Benson, 1999). All the ESTs were screened for potential microsatellites by using the TRF with the following parameters: match: 2; mismatch 7; indel: 7; PM: mini-score; 30; and max period size 500. Strings of oligo sequences were used to search for microsatellites: 6 repeats for dinucleotides; 4 repeats for trinucleotides, and 3 repeats for tetranucleotides and pentanucleotides as described by Stalling et al (1991). 3. Frequency and distribution of microsatellites A total of 10,088 ESTs of common carp with an average length of 531 bp were downloaded from public databases and subject to bioinformatic analyses. The results showed that 555 (about 5.5%) of these ESTs contained SSRs inside, which is lower than values reported in some aquaculture animals e.g. black tiger shrimp (Penaeus monodon) (13.7%, Maneeruttanarungroj et al., 2006), Japanese pufferfish (Fugu rubripes) (11.5%, Edwards et al., 1998) and channel catfish (11.2%, Serapion et al., 2004), but higher than those in some other species e.g. Chinese shrimp (Fenneropenaeus chinensis) (2.2%, Wang et al., 2005), bay scallop (Argopecten irradians) (3.9%, Zhan et al., 2005), and red sea bream (Chrysophrys major) (4%, Chen et al., 2005). The abundance of EST-derived microsatellites seems to be highly species-specific in aquacultured animals studied.
Fig. 1. Distribution of the repeat types of dinucleotides (a) and trinucleotides (b) in common carp EST-SSRs identified by mining public expressed sequence tags databases.
Most of these common carp EST-SSRs were composed of dinucleotide and trinucleotide repeats. Specifically, the abundance of di-, tri-, tetra-, and penta-nucleotide motifs among these ESTs is 37.2%, 30.8%, 20.4%, and 11.7%, respectively. For dinucleotides, AC/TG is the most abundant (Figure 1a), which is consistent with previous findings for both Type I and Type II microsatellites in fish (Edwards et al., 1998; David et al., 2001; Serapion et al., 2004),
www.intechopen.com
Development of Microsatellite Markers by Data Mining from DNA Sequences
347
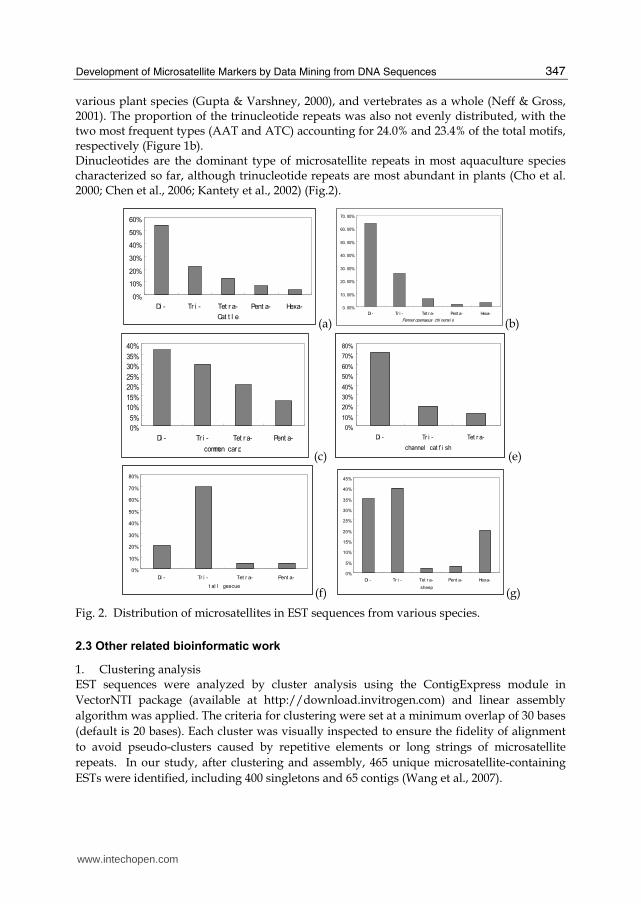
various plant species (Gupta & Varshney, 2000), and vertebrates as a whole (Neff & Gross, 2001). The proportion of the trinucleotide repeats was also not evenly distributed, with the two most frequent types (AAT and ATC) accounting for 24.0% and 23.4% of the total motifs, respectively (Figure 1b). Dinucleotides are the dominant type of microsatellite repeats in most aquaculture species characterized so far, although trinucleotide repeats are most abundant in plants (Cho et al. 2000; Chen et al., 2006; Kantety et al., 2002) (Fig.2).
0%
10%20%
30%
40%50%
60%
Di - Tr i - Tet r a- Pent a- Hexa-Cat t l e
(a)
0. 00%
10. 00%
20. 00%
30. 00%
40. 00%
50. 00%
60. 00%
70. 00%
Di - Tr i - Tet r a- Pent a- Hexa-Fenner openaeus chi nensi s (b)
0%5%
10%15%20%25%30%35%40%
Di - Tr i - Tet r a- Pent a-common car p
(c)
0%10%20%30%40%50%60%70%80%
Di - Tr i - Tet r a-channel cat f i sh
(e)
0%
10%
20%
30%
40%
50%
60%
70%
80%
Di - Tr i - Tet r a- Pent a-t al l gescue
(f)
0%
5%
10%
15%
20%
25%
30%
35%
40%
45%
Di - Tr i - Tet r a- Pent a- Hexa-sheep
(g)
Fig. 2. Distribution of microsatellites in EST sequences from various species.
2.3 Other related bioinformatic work
1. Clustering analysis EST sequences were analyzed by cluster analysis using the ContigExpress module in
VectorNTI package (available at http://download.invitrogen.com) and linear assembly
algorithm was applied. The criteria for clustering were set at a minimum overlap of 30 bases
(default is 20 bases). Each cluster was visually inspected to ensure the fidelity of alignment
to avoid pseudo-clusters caused by repetitive elements or long strings of microsatellite
repeats. In our study, after clustering and assembly, 465 unique microsatellite-containing
ESTs were identified, including 400 singletons and 65 contigs (Wang et al., 2007).
www.intechopen.com
Data Mining and Knowledge Discovery in Real Life Applications
348
2. Identification of the known genes The unique ESTs were then subjected to BLASTx search against the GenBank (protein
database) for putative identification of gene function. When accumulated probability of
sequence similarity was less than 1×10⁴, the tentative identities were established. The
BLASTx results revealed that about 165 of these ESTs showed similarity to genes or proteins
of known function (Wang et al., 2007).
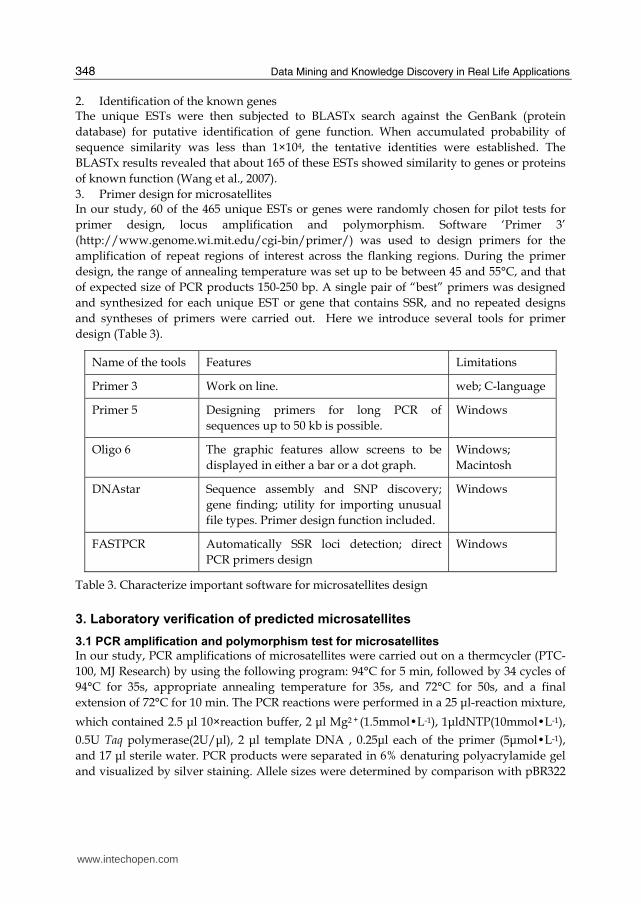
3. Primer design for microsatellites In our study, 60 of the 465 unique ESTs or genes were randomly chosen for pilot tests for
primer design, locus amplification and polymorphism. Software ‘Primer 3’
(http://www.genome.wi.mit.edu/cgi-bin/primer/) was used to design primers for the
amplification of repeat regions of interest across the flanking regions. During the primer
design, the range of annealing temperature was set up to be between 45 and 55°C, and that
of expected size of PCR products 150-250 bp. A single pair of “best” primers was designed
and synthesized for each unique EST or gene that contains SSR, and no repeated designs
and syntheses of primers were carried out. Here we introduce several tools for primer
design (Table 3).
Name of the tools Features Limitations
Primer 3 Work on line. web; C-language
Primer 5 Designing primers for long PCR of
sequences up to 50 kb is possible.
Windows
Oligo 6 The graphic features allow screens to be
displayed in either a bar or a dot graph.
Windows;
Macintosh
DNAstar Sequence assembly and SNP discovery;
gene finding; utility for importing unusual
file types. Primer design function included.
Windows
FASTPCR Automatically SSR loci detection; direct
PCR primers design
Windows
Table 3. Characterize important software for microsatellites design
3. Laboratory verification of predicted microsatellites
3.1 PCR amplification and polymorphism test for microsatellites
In our study, PCR amplifications of microsatellites were carried out on a thermcycler (PTC-
100, MJ Research) by using the following program: 94°C for 5 min, followed by 34 cycles of
94°C for 35s, appropriate annealing temperature for 35s, and 72°C for 50s, and a final
extension of 72°C for 10 min. The PCR reactions were performed in a 25 μl-reaction mixture,
which contained 2.5 μl 10×reaction buffer, 2 μl Mg2+(1.5mmol�L-1), 1μldNTP(10mmol�L-1),
0.5U Taq polymerase(2U/μl), 2 μl template DNA , 0.25μl each of the primer (5μmol�L-1),
and 17 μl sterile water. PCR products were separated in 6% denaturing polyacrylamide gel
and visualized by silver staining. Allele sizes were determined by comparison with pBR322
www.intechopen.com

Development of Microsatellite Markers by Data Mining from DNA Sequences
349
DNA/Msp I markers (Sino-American, Luoyang, China) combined with image analysis as
described previously (Tong et al., 2005).
Out of the 60 common carp EST-SSRs for which primers were designed, 54 primers worked
(25 polymorphic, 11 monomorphic, 18 with multiple bands) and 6 failed in the common
carp. Some of polymorphic EST-SSRs are shown in Fig 3.
(TTCAA) 7 (TAA) 10 (TATC) 17 (TC) 14 (TTA) 9 (CT) 7
Fig 3. Polymorphism test for parts of EST-SSRs in common carp (Wang et al. 2007).
Twenty-five of the 60 EST-SSRs were found to be polymorphic in a common carp population. The observed heterozygosity of these polymorphic loci ranged from 0.13 to 1.00, and expected heterozygosity ranged from 0.12 to 0.91. The number of alleles of the polymorphic EST-SSRs in common carp ranged from 3 to 17 (mean 7). Of the 60 common carp EST-SSRs, 10 (17%) of them showed polymorphism in a pilot panel
in crucian carp (Carassius auratus). In silver carp (Hypophthalmichthys molitrix), only 3 (5%) of
these loci were found to be polymorphic. In general, these loci are less polymorphic in
crucian carp and silver carp than in their source species (common carp).
3.2 Hardy-Weinberg Equilibrium (HWE)
In our study, when the frequencies and distributions of the alleles and genotypes were compared under the HWE expectation for an ideal population (random mating, no mutation, no drift, and no migration), 6 of the 25 loci showed significant departure after Bonferroni correction (P<0.002), and the remaining 19 EST-SSRs were in HWE. A heterozygote excess (also known as homozygote deficit) occurs when the data set contains
fewer homozygotes than expected under HWE, and a heterozygote deficit (also known as
homozygote excess) occurs when there are more homozygotes than expected under HWE.
Currently, tests used to determine statistically significant deviation from HWE have low
power when allelic diversity is high and sample sizes are moderate (Guo & Thompson
1992). However, failure to meet HWE is not typically grounds for discarding a locus.
Heterozygote deficit, the more common direction of HWE deviation, can be due to
biological realities of violating the criteria of an ideal population, such as strong inbreeding
or selection for or against a certain allele. Alternatively, when two genetically distinct
groups are inadvertently lumped into a single sampling unit, either because they co-occur
but rarely interbreed (unbeknownst to the sampler), or because the spatial scale chosen for
sampling a site is larger than the true scale of a population, there will be more homozygotes
than expected under HWE. This phenomenon is called a Wahlund effect and may be a
common cause of heterozygote deficit in population genetic studies. Both of these causes of
heterozygote deficit should affect all loci, instead of just one or a few.
www.intechopen.com

Data Mining and Knowledge Discovery in Real Life Applications
350
3.3 Null alleles
Null alleles are those that fail to amplify in a PCR, either because the PCR conditions are not
ideal or the primer-binding region contains mutations that inhibit binding. In our study,
primers of the six loci failed to amplify in the common carp, and primers of some other loci
could not amplify specific products. This could be due to one or both primers being
designed across the junction of the spliced ends of exons in the EST sequence, which in
genomic DNA is interrupted by an intron (Cordeiro et al., 2001), or due to the inaccuracy of
some EST sequences.
As a result of null alleles, some heterozygotes are genotyped as homozygotes and a few
individuals may fail to amplify any alleles. Often the mutations that cause null alleles will
only occur in one or a few populations, so a heterozygote deficit might not be apparent
across all populations. A simple way to identify a null allele problem is to determine if any
individuals repeatedly fail to amplify any alleles at just one locus while all other loci amplify
normally (suggesting the problem is not simply poor quality DNA). If re-extraction and
amplification still fail to produce any alleles at that locus, it is likely that the individual is
homozygous for a null allele. In addition, a statistical approach to identifying null alleles can
match the pattern of homozygote excess to the expected signatures of several different
causes of homozygote excess and estimate the frequency of null alleles for each locus. The
software MICROCHECKER (Van Oosterhout et al. 2004) is designed for this aim. A more
technical way to detect null alleles is to examine patterns of inheritance in a pedigree (e.g.
Paetkau & Strobeck 1995). Redesigning primers to bind to a different region of the flanking
sequence, or adjusting PCR conditions can often ameliorate null allele problems. Many
researchers are quick to use highly stringent PCR conditions without considering the
downside that it inflates the chances for null alleles. A low incidence of null alleles is usually
only a minor source of error for most types of analyses, but for certain analyses e.g.
parentage analysis, even rare null alleles can confound results and any loci with strong
evidence of null alleles should be excluded.
3.4 Mendelian inheritance
Mendelian inheritance of alleles is a requirement for almost all population genetic
analyses for diploid vertebrate species (Jarne & Lagoda 1996). Because relatively few
studies report tests for Mendelian inheritance, it is still unclear how common non-
Mendelian inheritance is across taxa. Potential causes of true non-Mendelian behaviour
are sex linkage, physical association with genes under strong selection, centres of
recombination, transposable elements, or processes during meiosis such as non-
disjunction or meiotic drive (segregation distortion). These processes can have severe
effects, such as only one parental allele being passed on to all offspring. Performing
defined crosses and genotyping a large number of offspring can be quite challenging or
impractical in some species, and straightforward in others, such as those that brood their
young. Microsatellite loci in any polyploidy species have a high likelihood of occurring
multiple times throughout the genome and this will confound analysis, so in particular
inheritance should always be examined for polyploidy. Even in diploid or haploid
species, duplication of loci can be common and potentially problematic. Any case of a
locus displaying more than two alleles per individual (that is not traceable to cross
www.intechopen.com
Development of Microsatellite Markers by Data Mining from DNA Sequences
351
contamination of samples) should be discarded from most analyses. It is important to note
that automated sequencers are set by default to call only two alleles per locus, and will
return apparently valid allele calls regardless of the actual number of amplification
products produced; for this reason, automated sequencer allele calling should always be
double checked by an experienced operator.
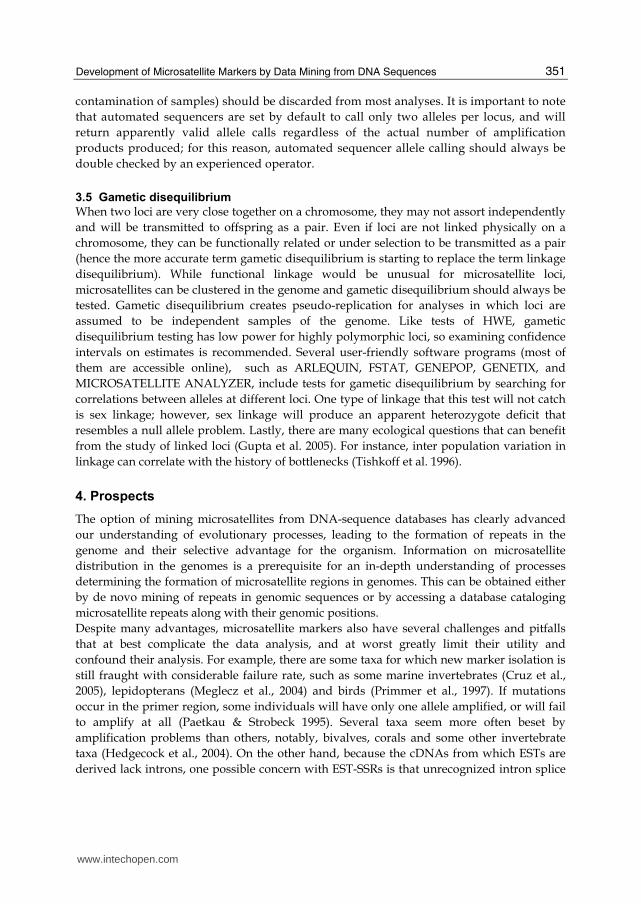
3.5 Gametic disequilibrium
When two loci are very close together on a chromosome, they may not assort independently
and will be transmitted to offspring as a pair. Even if loci are not linked physically on a
chromosome, they can be functionally related or under selection to be transmitted as a pair
(hence the more accurate term gametic disequilibrium is starting to replace the term linkage
disequilibrium). While functional linkage would be unusual for microsatellite loci,
microsatellites can be clustered in the genome and gametic disequilibrium should always be
tested. Gametic disequilibrium creates pseudo-replication for analyses in which loci are
assumed to be independent samples of the genome. Like tests of HWE, gametic
disequilibrium testing has low power for highly polymorphic loci, so examining confidence
intervals on estimates is recommended. Several user-friendly software programs (most of
them are accessible online), such as ARLEQUIN, FSTAT, GENEPOP, GENETIX, and
MICROSATELLITE ANALYZER, include tests for gametic disequilibrium by searching for
correlations between alleles at different loci. One type of linkage that this test will not catch
is sex linkage; however, sex linkage will produce an apparent heterozygote deficit that
resembles a null allele problem. Lastly, there are many ecological questions that can benefit
from the study of linked loci (Gupta et al. 2005). For instance, inter population variation in
linkage can correlate with the history of bottlenecks (Tishkoff et al. 1996).
4. Prospects
The option of mining microsatellites from DNA-sequence databases has clearly advanced
our understanding of evolutionary processes, leading to the formation of repeats in the
genome and their selective advantage for the organism. Information on microsatellite
distribution in the genomes is a prerequisite for an in-depth understanding of processes
determining the formation of microsatellite regions in genomes. This can be obtained either
by de novo mining of repeats in genomic sequences or by accessing a database cataloging
microsatellite repeats along with their genomic positions.
Despite many advantages, microsatellite markers also have several challenges and pitfalls
that at best complicate the data analysis, and at worst greatly limit their utility and
confound their analysis. For example, there are some taxa for which new marker isolation is
still fraught with considerable failure rate, such as some marine invertebrates (Cruz et al.,
2005), lepidopterans (Meglecz et al., 2004) and birds (Primmer et al., 1997). If mutations
occur in the primer region, some individuals will have only one allele amplified, or will fail
to amplify at all (Paetkau & Strobeck 1995). Several taxa seem more often beset by
amplification problems than others, notably, bivalves, corals and some other invertebrate
taxa (Hedgecock et al., 2004). On the other hand, because the cDNAs from which ESTs are
derived lack introns, one possible concern with EST-SSRs is that unrecognized intron splice
www.intechopen.com

Data Mining and Knowledge Discovery in Real Life Applications
352
sites could disrupt priming sites, resulting in failed amplification. Alternatively, large
introns could fall between the primers, resulting in a product that is either too large or, in
extreme cases, failed amplification. In some cases, it may be possible to redesign the primers
to exclude troublesome introns.
A large amount of organisms on the earth are directly or indirectly important to human life.
However, only a small fraction of them are under comprehensive studies using modern
science and technology. Due to the limitation of investment and funding, only a very low
percentage of organisms have enough DNA or protein sequences, although they may be
economically or ecologically important. Sequence data are expected to accumulate in more
diverse species.
An optimistic trend in recent years is that with the advance in sequencing technique (e.g.
454 sequencing by Roche) and the increase of invest by government and private
companies, full genomic sequences, EST or BAC sequences, have been increasing rapidly,
especially in some domestic animals and plants as well as some model organisms.
The recent trend is to cross-amplify molecular markers across a set of closely related
genomes. Microsatellites associated with quantitative trait loci (QTLs) and agronomically
important genes remain a good candidate for the development of specific markers. The low
cost of their generation and ease in documentation are two of the important relative
advantages of these sequences over equally promising single nucleotide polymorphisms
(SNPs). Microsatellites can thus firmly be expected to have an important role in genomics
research in the future and mining microsatellites from DNA databases is likely to take center
stage to come.
5. Conclusion
With the increasing accumulation of the nucleotide sequence data in both private and public
databases, and the invention of more efficient computer-based tools, mining some valuable
biological resources, such as microsatellites and SNPs, from the raw DNA data, has become
one of the most popular areas of biological studies today, bioinformatics. Development of
SSRs by data mining from sequence data is a relatively easy and cost-saving strategy for any
organisms with enough DNA data. This is a very good example from data to knowledge,
and from knowledge to basic and applied studies for biology, production, conservation and
management of many organisms.
6. References
Beckmann J.S. & Weber J.L. (1992) Survey of human and rat microsatellites. Genomics, 12,
627–631.
Benson D.A., Karsch-Mizrachi I., Lipman D.J., Ostell J. & Wheeler D.L. (2008) GenBank.
Nucleic Acids Research, 36 (Database issue), 25-30.
Benson G. (1999) Tandem repeats finder: a program to analyze DNA Sequences. Nucleic
Acids Research, 1999, 27, 573-580.
Chen, C.X., Zhou, P., Choi, Y.A., Huang, S., Gmitter, F.G., 2006. Mining and characterizing
microsatellites from citrus ESTs. Theor. Appl. Genet. 112, 1248-1257.
www.intechopen.com
Development of Microsatellite Markers by Data Mining from DNA Sequences
353
Chen, S.L., Liu, Y.G., Xu, M.Y., Li, J., 2005. Isolation and characterization of polymorphic
microsatellite loci from an EST-library of red sea bream (Chrysophrys major) and
cross-species amplification. Mol. Ecol. Notes 5, 215-217.
Cho, Y.G., Ishii, T., Temnykh, S., Chen, X., Lipovich, L., McCouch, S.R., Park, W.D., Ayres,
N., Cartinhour, S., 2000. Diversity of microsatellites derived from genomic
libraries and GenBank sequences in rice (Oryza sativa L.). Theor. Appl. Genet. 100,
713–722.
Cordeiro, G.M., Casu, R., McIntyre, C.L., Manners, J.M., Henry, R.J., 2001. Microsatellite
markers from sugarcane (Saccharum spp.) ESTs cross transferable to erianthus and
sorghum. Plant Sci. 160, 1115-1123.
Cruz, F., Perez, M. & Presa, P. (2005). Distribution and abundance of micosatellites in the
genome of bivalves. Gene, 346, 241–247.
David, L., Rajasekaran, P., Fang, J., Hillel, J., Lavi, U., 2001. Polymorphism in ornamental
and common carp strains (Cyprinus carpio L.) as revealed by AFLP analysis and a
new set of microsatellite marker. Mol. Genet. Genomics 266, 353-362.
Edwards, Y.J., Elgar, G., Clark, M.S., Bishop, M.J., 1998. The identification and
characterization of microsatellites in the compact genome of the Japanese
pufferfish, Fugu rubripes: perspectives in functional and comparative genomic
analyses. J.Mol.Biol. 278, 843-854.
Eisen, J.A. 1999. Mechanistic basis for microsatellite instability. In: Microsatellites: Evolution
and applications (eds Goldstein, D.B. & Schlötterer, C.). Oxford University Press,
Oxford, UK, pp.34-48.
FitzSimmons N.N., Moritz C. & Moore S.S. (1995) Conservation and dynamics of
microsatellite loci over 300 million years of marine turtle evolution. Molecular
Biology and Evolution, 12, 432-440.
Guo, S.W., Thompson, E.A., 1992. Performing the exact test of Hardy-Weinberg proportion
for multiple alleles. Biometrics 48, 361-372.
Gupta, P.K., Varshney, R.K., 2000. The development and use of microsatellite markers for
genetic analysis and plant breeding with emphasis on bread wheat. Euphytica 113,
163-185.
Hedgecock, D., Li, G., Hubert, S., Bucklin, K. & Ribes, V. (2004). Widespread null alleles and
poor cross-species amplification of microsatellite DNA loci cloned from the Pacific
oyster, Crassostrea gigas. J. Shellfish Res., 23, 379–385.
Jarne P. & Lagoda P.J.L. (1996) Microsatellites, from molecules to populations and back.
Trends in Ecology and Evolution, 11, 424-429.
Kantety, R.V., Rota, M. L., Matthews, D.E., Sorrells, M.E., 2002. Data mining for simple
sequence repeats in expressed sequence tags from barley, maize, rice, sorghum and
wheat. Plant Mol. Biol. 48, 501-510.
Knapik E.W., Goodman A., Ekker M., Chevrette M., Delgado J., Neuhauss S., Shimoda N.,
Driever W., Fishman M.C. & Jacob H.J. (1998) A microsatellite genetic linkage map
for zebrafish (Danio rerio). Nature Genetics, 18, 338-343.
Litt, M. & Luty, J.A. (1989) A hypervariable microsatellite revealed by in vitro amplification
of a dinucleotide repeat within the cardiac muscle actin gene. American Journal of
Human Genetics, 44, 397-401.
www.intechopen.com

Data Mining and Knowledge Discovery in Real Life Applications
354
Liu, Z.J., Cordes, J.F., 2004. DNA marker technologies and their applications in aquaculture
genetics. Aquaculture 238, 1-37.
Maneeruttanarungroj, C., Pongsomboon, S., Wuthisuthimethavee, S., Klinbunga, S.,
Wilson, K.J., Swan, J., Li, Y., Whan, V., Chu, K.H., Li, C.P., Tong, J., Glenn, K.,
Rothschild, M., Jerry, D., Tassanakajon, A., 2006. Development of polymorphic
expressed sequence tag-derived microsatellites for the extension of the genetic
linkage map of the black tiger shrimp (Penaeus monodon). Anim. Genet. 37, 363-
368.
Meglecz, E., Petenian, F., Danchin, E., D’Acier, A.C., Rasplus, J.-Y. & Faure, E. (2004). High
similarity between flanking regions of different microsatellites detected within each
of two species of Lepidoptera: Parnassius apollo and Euphydryas aurinia. Mol.
Ecol., 13, 1693–1700.
Neff, B.D., Gross, M.R., 2001. Microsatellite evolution in vertebrates: inference from AC
dinucleotide repeats. Evolution 55, 1717-1733.
Nonneman, D., Waldbieser, G.C., 2005. Isolation and enrichment of abundant microsatellites
from a channel catfish (Ictalurus punctatus) brain cDNA library. Anim. Biotechnol.
16, 103-116.
Paetkau, D. & Strobeck, C. (1995). The molecular-basis and evolutionary history of a
microsatellite null allele in bears. Mol. Ecol., 4, 519–520.
Pérez, F., Ortiz, J., Zhinaula, M., Gonzabay, C., Calderón, J., Volckaert, F.A.M.J., 2005.
Development of EST-SSR markers by data mining in three species of shrimp:
Litopenaeus vannamei, Litopenaeus stylirostris, and Trachypenaeus birdy. Mar.
Biotechnol. 7, 554-569.
Prakash C., 2007. Mining microsatellites in eukaryotic genomes. Trends in
biotechnology.
Primmer, C.R.; Raudsepp, T; Chowdhary, B.P.; Moller, A.P.; Ellegren, H. 1997. Low
frequency of microsatellites in the avian genome. Genome Research. 7, 471-482.
Rassmann K., Schl.tterer C. & Tautz D. (1991) Isolation of simple sequence loci for use
in polymerase chain reaction-based DNA fingerprinting. Electrophoresis, 12, 113-
118.
Rexroad, C.E.3rd., Rodriguez, M.F., Coulibaly, I., Gharbi, K., Danzmann, R.G., Dekoning, J.,
Phillips, R., Palti, Y., 2005. Comparative mapping of expressed sequence tags
containing microsatellites in rainbow trout (Oncorhynchus mykiss). BMC Genomics
6, 54.
Schlötterer, C., Amos B. & Tautz D. (1991) Conservation of polymorphic simple sequence
loci in cetacean species. Nature, 354, 63-65.
Schuler G.D., Boguski M.S., Stewart E.A., Stein L.D., Gyapay G., Rice K., White R.E.,
Rodriguez-Tom P., Aggarwal A., Bajorek E., Bentolila S., Birren B.B., Butler A.,
Castle A.B., Chiannilkulchai N., Chu A., Clee C., Cowles S., Day P.J.R., Dibling T.,
East C., Drouot N., Dunham I., Duprat S., Edwards C., Fan J.B., Fang N., Fizames
C., Garrett C., Green L., Hadley D., Harris M., Harrison P., Brady S., Hicks A.,
Holloway E., Hui L., Hussain S., Louis-Dit-Sully C., Ma J., MacGilvery A., Mader
C., Maratukulam A., Matise T.C., McKusick K.B., Morissette J., Mungall A.,
Muselet D., Nusbaum H.C., Page D.C., Peck A., Perkins S., Piercy M., Qin F.,
www.intechopen.com

Development of Microsatellite Markers by Data Mining from DNA Sequences
355
Quackenbush J., Ranby S., Reif T., Rozen S., Sanders C., She X., Silva J., Slonim
D.K., Soderlund C., Sun W.L., Tabar P., Thangarajah T., Vega-Czarny N., Vollrath
D., Voyticky S., Wilmer T., Wu X., Adams M.D., Auffray C., Walter N.A.R.,
Brandon R., Dehejia A., Goodfellow P.N., Houlgatte R., Hudson J.R., Jr., Ide S.E.,
Iorio K.R., Lee W.Y., Seki N., Nagase T., Ishikawa K., Nomura N., Phillips C.,
Polymeropoulos M.H., Sandusky M., Schmitt K., Berry R., Swanson K., Torres R.,
Venter J.C., Sikela J.M., Beckmann J.S., Weissenbach J., Myers R.M., Cox D.R.,
James M.R., Bentley D., Deloukas P., Lander E.S. & Hudson T.J. (1996) A Gene
Map of the Human Genome. Science, 274, 540-546.
Serapion, J., Kucuktas, H., Feng, J.N., Liu, Z.J., 2004. Bioinformatic mining of type I
microsatellites from expressed sequence tags of channel catfish (Ictalurus punctatus).
Mar. Biotechnol. 6, 364-377.
Stallings, R.L., Ford, A.F., Nelson, D., Torney, D.C., Hildebrand, C.E., Moyzis, R.K., 1991.
Evolution and distribution of (GT)n repetitive sequences in mammalian genomes.
Genomics 10, 807-815.
Tautz D. (1989) Hypervariability of simple sequences as a general source for polymorphic
DNA markers. Nucleic Acids Research, 17, 6463-6471.
Tishkoff, S.A., Dietzsch, E., Speed, W., Pakstis, A.J., Kidd, J.R., Cheung, K. et al. (1996).
Global patterns of linkage disequilibrium at the CD4 locus and modern human
origins. Science, 271, 1380–1387.
Tong, J., Yu, X., Liao, X., 2005. Characterization of a highly conserved microsatellite marker
with utility potentials in cyprinid fishes. J. Appl. Ichthyol. 21, 232-235.
Toth, G., Gaspari, Z. & Jurka, J. (2000). Microsatellites in different eukaryotic genomes:
survey and analysis. Genome Res., 10, 967–981.
Van Oosterhout C., Hutchinson W.F., Wills D.P.M., Shipley P. (2004). MICRO-CHECKER:
software for identifying and correcting genotyping errors in microsatellite data.
Molecular Ecology Notes, 4, 535-538.
Wang D, Liao XL, Cheng L, Yu XM, Tong J. (2007). Development of novel EST-SSR markers
from common carp by data mining from public EST sequences. Aquaculture 271:
558-574.
Wang, H.X., Li, F.H., Xiang, J.H., 2005. Polymorphic EST-SSR markers and their mode of
inheritance in Fenneropenaeus chinensis. Aquaculture 249, 107-114.
Weber J.L. & May P.E. (1989) Abundant class of human DNA polymorphisms which can be
typed using the polymerase chain reaction. American Journal of Human Genetics, 44,
388-396.
Wheeler D.L., Barrett T., Benson D.A., Bryant S.H., Canese K., Chetvernin V., Church
D.M., DiCuccio M., Edgar R., Federhen S., Feolo M., Geer L.Y., Helmberg W.,
Kapustin Y., Khovayko O., Landsman D., Lipman D.J., Madden T.L., Maglott
D.R., Miller V., Ostell J., Pruitt K.D., Schuler G.D., Shumway M., Sequeira E.,
Sherry S.T., Sirotkin K., Souvorov A., Starchenko G., Tatusov R.L., Tatusova T.A.,
Wagner L. & Yaschenko E. (2008) Database resources of the National Center for
Biotechnology Information. Nucleic Acids Research, 36 (Database issue), 13-21.
Yue, G.H., Ho, M.Y., Orban, L., Komen, J., 2004. Microsatellites within genes and ESTs of
common carp and their applicability in silver crucian carp. Aquaculture 234, 85-98.
www.intechopen.com

Data Mining and Knowledge Discovery in Real Life Applications
356
Zane, L., Bargelloni, L. & Patarnello, T. (2002). Strategies for microsatellite isolation: a
review. Mol. Ecol., 11, 1–16.
Zhan, A.B., Bao, Z.M., Wang, X.L., Hu, J.J., 2005. Microsatellite markers derived from
bay scallop Argopecten irradians expressed sequence tags. Fisheries Sci. 71, 1341-
1346.
www.intechopen.com
Data Mining and Knowledge Discovery in Real Life ApplicationsEdited by Julio Ponce and Adem Karahoca
ISBN 978-3-902613-53-0Hard cover, 436 pagesPublisher I-Tech Education and PublishingPublished online 01, January, 2009Published in print edition January, 2009
InTech EuropeUniversity Campus STeP Ri Slavka Krautzeka 83/A 51000 Rijeka, Croatia Phone: +385 (51) 770 447 Fax: +385 (51) 686 166www.intechopen.com
InTech ChinaUnit 405, Office Block, Hotel Equatorial Shanghai No.65, Yan An Road (West), Shanghai, 200040, China
Phone: +86-21-62489820 Fax: +86-21-62489821
This book presents four different ways of theoretical and practical advances and applications of data mining indifferent promising areas like Industrialist, Biological, and Social. Twenty six chapters cover different specialtopics with proposed novel ideas. Each chapter gives an overview of the subjects and some of the chaptershave cases with offered data mining solutions. We hope that this book will be a useful aid in showing a rightway for the students, researchers and practitioners in their studies.
How to referenceIn order to correctly reference this scholarly work, feel free to copy and paste the following:
Jingou Tong, Dan Wang and Lei Cheng (2009). Development of Microsatellite Markers by Data Mining fromDNA Sequences, Data Mining and Knowledge Discovery in Real Life Applications, Julio Ponce and AdemKarahoca (Ed.), ISBN: 978-3-902613-53-0, InTech, Available from:http://www.intechopen.com/books/data_mining_and_knowledge_discovery_in_real_life_applications/development_of_microsatellite_markers_by_data_mining_from_dna_sequences

© 2009 The Author(s). Licensee IntechOpen. This chapter is distributedunder the terms of the Creative Commons Attribution-NonCommercial-ShareAlike-3.0 License, which permits use, distribution and reproduction fornon-commercial purposes, provided the original is properly cited andderivative works building on this content are distributed under the samelicense.