Embed Size (px)
Citation preview
Development of Micro Tensile Testing Method in an FIB System
for Evaluating Grain Boundary Strength
Katsuhiko Fujii and Koji Fukuya
Institute of Nuclear Safety System, Inc., Mihama, Fukui 919-1205, Japan
A micro tensile testing method for evaluating grain boundary strength was developed. Specimens of 2� 2� 10mm having one grainboundary were made by focused ion beam (FIB) micro-processing and tensioned in an FIB system. The load was measured from the deflection ofthe Si cantilever and the displacement was also monitored in situ. The method was applied to aged and unaged Fe-Mn-P alloy specimens withdifferent grain boundary P segregation. The load at intergranular fracture decreased with increasing P segregation.[doi:10.2320/matertrans.M2010320]
(Received September 14, 2010; Accepted October 21, 2010; Published December 8, 2010)
Keywords: grain boundary strength, grain boundary segregation, ion alloys, micro tensile test, focused ion beam micro-processing
1. Introduction
The degradation of grain boundary strength induced bycorrosion, thermal ageing and irradiation is one of the causesof intergranular cracking. The decrease in grain boundarystrength or grain boundary cohesion could occur due to (1)the grain boundary segregation of impurities or soluteelements, including hydrogen, helium and oxygen atoms;(2) oxide formation; (3) vacancies and micro-void formation;and (4) helium bubble formation. However, it is difficult tomeasure properties such as micro compositions and micro-structures and strength of an individual grain boundary at thesame time by using conventional measurement techniques forchemical composition, microstructure and mechanical prop-erties. The direct measurement of a quantitative relationbetween characteristics and strength of the individual grainboundary has been rarely preformed.
Recently, measurements of mechanical properties of smalldimension materials have become possible by improvementof the focused ion beam (FIB) technique and advancement oftest techniques for specimens sized in the micrometer andsub-micrometer range.1) The frequently used techniques arenano-indentation, atomic force microscopy (AFM) and theircombination, based mainly on their relatively simple setupand commercial availability. However, computer simulationssuch as finite element analysis are often necessary for theevaluation of strain and stress distributions in bent orcompressed specimen. Technological developments of themicro- and nano-scale tensile testing, which provides asimpler method evaluating stress and strain in specimens andcan correlate easily with macroscopic mechanical testing,have been advanced, and the tensile and compressivemechanical responses of various materials in the micrometerand sub-micrometer size volumes have been determined.2,3)
Micro- and nano-scale tensile testing has helped furtherunderstanding of how small volumes of materials deform.The microscopic mechanical properties of biological attach-ment devices have been studied using an FIB system as anin situ laboratory for specimen preparation, fixation, andtesting at the micrometer scale, and the Young’s modulusand ultimate strength have been reported.4) In the present
study, a method to measure the strength of an individualgrain boundary together with its detailed characteristicswas developed using FIB micro-processing for specimenpreparation.
2. Experimental Procedure
2.1 Material and grain boundary characterizationThe alloy of Fe-1.27Mn-0.042P was used as a test alloy
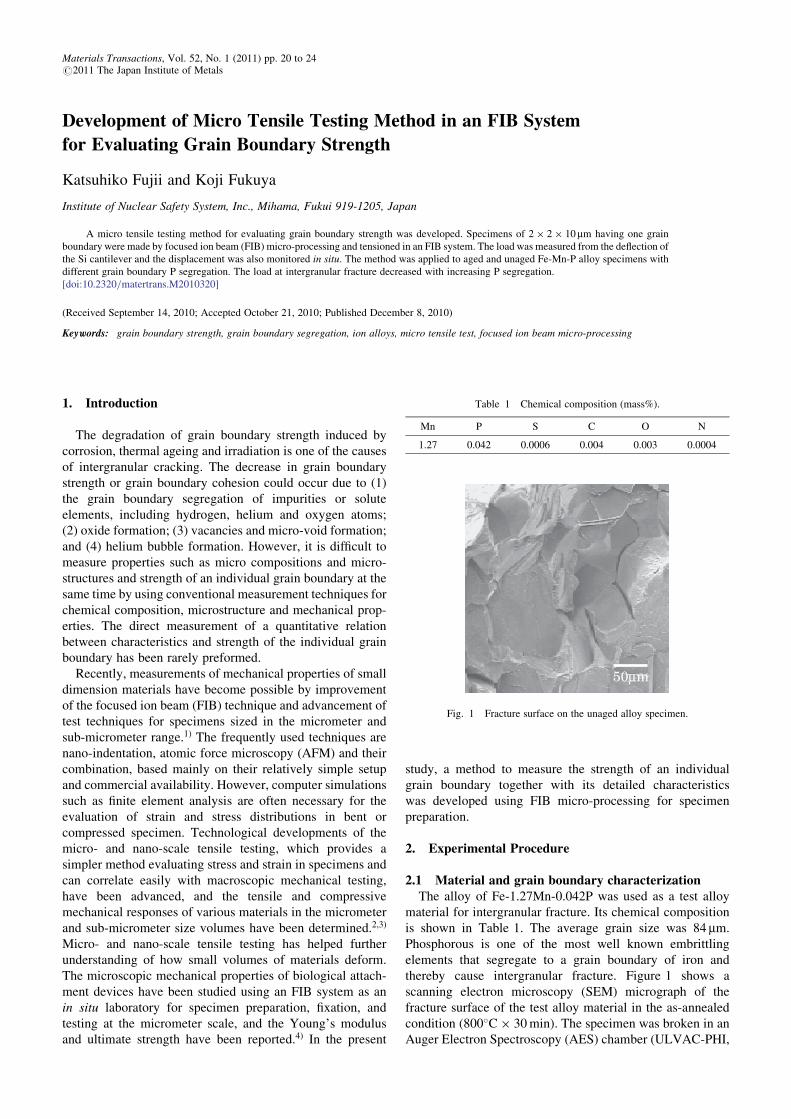
material for intergranular fracture. Its chemical compositionis shown in Table 1. The average grain size was 84 mm.Phosphorous is one of the most well known embrittlingelements that segregate to a grain boundary of iron andthereby cause intergranular fracture. Figure 1 shows ascanning electron microscopy (SEM) micrograph of thefracture surface of the test alloy material in the as-annealedcondition (800�C� 30min). The specimen was broken in anAuger Electron Spectroscopy (AES) chamber (ULVAC-PHI,
Table 1 Chemical composition (mass%).
Mn P S C O N
1.27 0.042 0.0006 0.004 0.003 0.0004
50µm
Fig. 1 Fracture surface on the unaged alloy specimen.
Materials Transactions, Vol. 52, No. 1 (2011) pp. 20 to 24#2011 The Japan Institute of Metals
Inc. Model SAM640) at around �100�C in a vacuum of1� 10�8 Pa. Intergranular fracture surface can be seen. TheAES measurements were carried out for the intergranularfracture surface to obtain the concentration of phosphorus atgrain boundaries. The average concentration of phosphorusat the grain boundaries was 0.18 phosphorus monolayercoverage. In order to examine the relation between thephosphorus concentration and grain boundary strength,unaged and aged condition (475�C� 1000 h) specimenswere used.
SEM, electron backscattering diffraction (EBSD) meas-urements, transmission electron microscopy (TEM), andenergy dispersive spectroscopy (EDS) were used for theselection of a grain boundary and determination of itscharacteristics. A high-angled grain boundary was selectedby the SEM and EBSD measurements. A small sample block(about 20� 20� 5 mm) containing the selected grain bound-ary was cut by FIB micro-processing with Ga ions of 30 kV.This block was further separated into two smaller sampleblocks by FIB micro-processing. One was used for TEM andEDS measurements and the other was used for a micro tensiletest in the FIB system (Hitachi FB-2000A). Specimens forTEM and EDS measurements were also prepared by FIBmicro-processing, and the microstructure and composition ofthe grain boundary were analyzed by using a TEM (HitachiHF-3000) equipped with a field emission gun of 300 kV and aNoran EDS detector.
2.2 Micro tensile testing method2.2.1 Specimen preparation
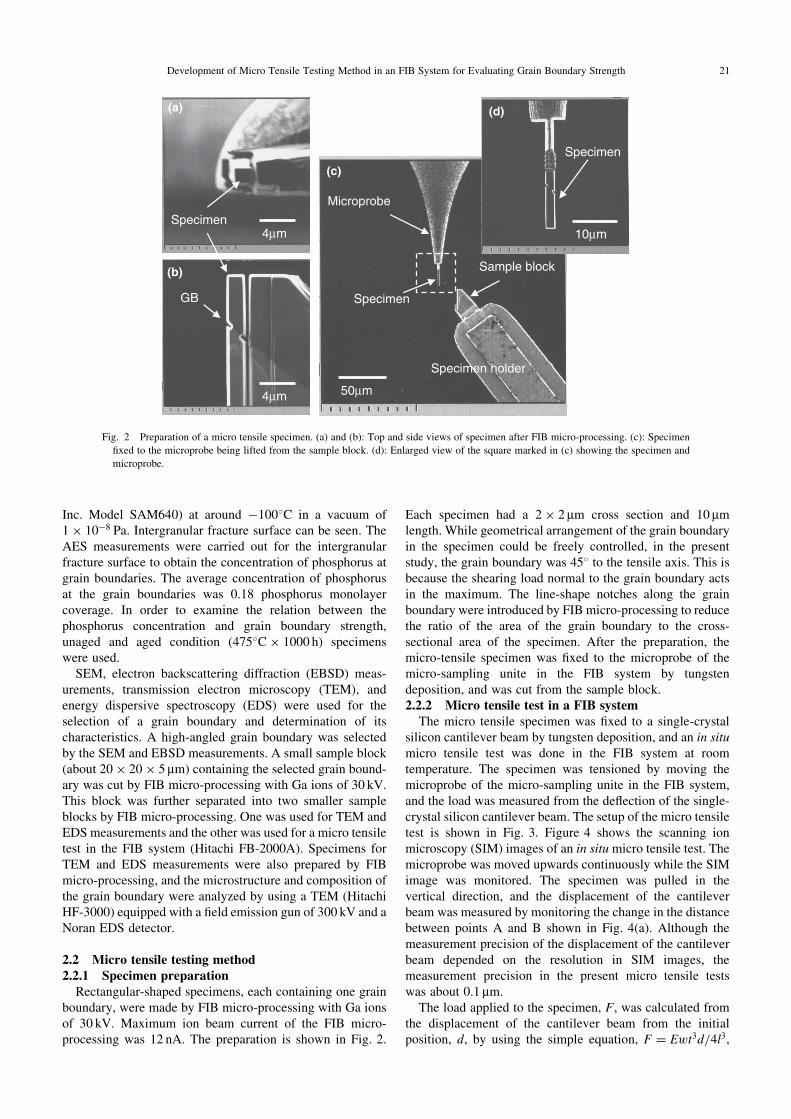
Rectangular-shaped specimens, each containing one grainboundary, were made by FIB micro-processing with Ga ionsof 30 kV. Maximum ion beam current of the FIB micro-processing was 12 nA. The preparation is shown in Fig. 2.
Each specimen had a 2� 2 mm cross section and 10 mmlength. While geometrical arrangement of the grain boundaryin the specimen could be freely controlled, in the presentstudy, the grain boundary was 45� to the tensile axis. This isbecause the shearing load normal to the grain boundary actsin the maximum. The line-shape notches along the grainboundary were introduced by FIB micro-processing to reducethe ratio of the area of the grain boundary to the cross-sectional area of the specimen. After the preparation, themicro-tensile specimen was fixed to the microprobe of themicro-sampling unite in the FIB system by tungstendeposition, and was cut from the sample block.2.2.2 Micro tensile test in a FIB system
The micro tensile specimen was fixed to a single-crystalsilicon cantilever beam by tungsten deposition, and an in situmicro tensile test was done in the FIB system at roomtemperature. The specimen was tensioned by moving themicroprobe of the micro-sampling unite in the FIB system,and the load was measured from the deflection of the single-crystal silicon cantilever beam. The setup of the micro tensiletest is shown in Fig. 3. Figure 4 shows the scanning ionmicroscopy (SIM) images of an in situmicro tensile test. Themicroprobe was moved upwards continuously while the SIMimage was monitored. The specimen was pulled in thevertical direction, and the displacement of the cantileverbeam was measured by monitoring the change in the distancebetween points A and B shown in Fig. 4(a). Although themeasurement precision of the displacement of the cantileverbeam depended on the resolution in SIM images, themeasurement precision in the present micro tensile testswas about 0.1 mm.
The load applied to the specimen, F, was calculated fromthe displacement of the cantilever beam from the initialposition, d, by using the simple equation, F ¼ Ewt3d=4l3,
4µm
4µm
GB
Specimen
(a)
(b)
10µm
50µm
Specimen
Specimen
Microprobe
Specimen holder
(c)
(d)
Sample block
Fig. 2 Preparation of a micro tensile specimen. (a) and (b): Top and side views of specimen after FIB micro-processing. (c): Specimen
fixed to the microprobe being lifted from the sample block. (d): Enlarged view of the square marked in (c) showing the specimen and
microprobe.
Development of Micro Tensile Testing Method in an FIB System for Evaluating Grain Boundary Strength 21
based on linear elasticity theory, where l, w, t and E are thelength, width, thickness and Young’s modulus of the canti-lever beam, respectively. Single-crystal cantilever beamswere made from a silicon wafer by FIB micro-processing andthen their dimensions were measured by SEM observations.Average dimension of the cantilever beams was 120 mm long,15 mm wide and 6 mm thick. The direction of the cantileverbeams along these length and width was the same as theh110i and h001i orientation, and thus the Young’s modulus ofpure silicon was 170GPa.5) The ratio of the load versusdisplacement of each cantilever beam was calculated by itsown dimension, and was estimated to be 80–90 mN/mm. Thecalibration of the ratio of the load versus displacement wascarried out for a cantilever beam experimentally using anultra-micro hardness tester (Elionix ENT1100). Figure 5shows results of the load versus displacement measured byindenting the position at 5 mm from the point of the cantileverbeam. The straight line was fitted to the points, to obtain theratio of the load versus displacement of the cantilever beamform its slope. The ratio of the load versus displacement ofthe cantilever beam was measured to be 170 mN/mm in thedisplacement range from 1 to 5 mm. This result was twice thevalue of 80 mN/mm estimated using the Young’s modulus ofpure silicon, and indicated a large Young’s modulus of thesilicon wafer in the present study. Thus the value thatdoubled the estimated ratio for each cantilever beam by linear
elasticity theory was used. However a new calibration needsfor cantilever beams in which dimensions and materialsdiffer from the present one.
3. Results and Discussion
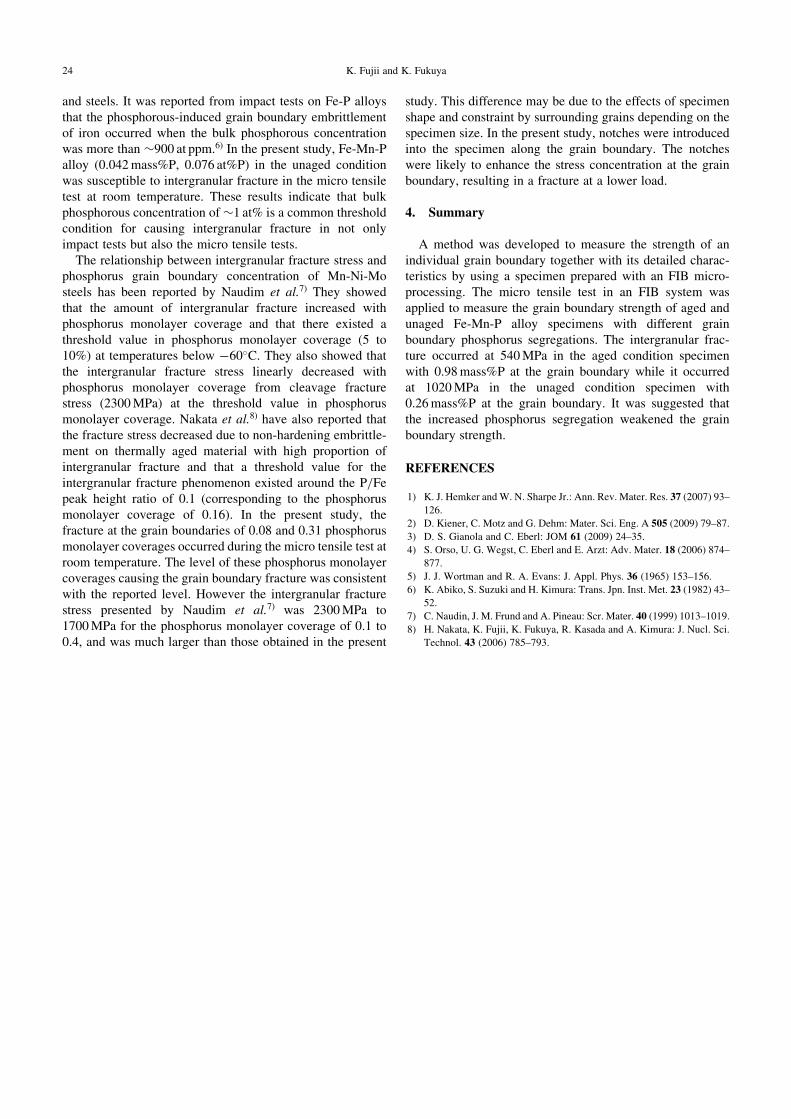
Figure 6 shows the SIM images before and after the microtensile test for the aged condition specimen having the high-angled grain boundary of 39� rotation angle. Figure 7 showsthe result of the load versus displacement curve of the microtensile test. The displacement was measured by monitoringthe change in the length of the specimen. The specimenfractured at the grain boundary in a brittle manner whileslight plastic deformation was observed in the grains. Thepart where the final fracture occurred, as shown in Fig. 6(b),was flat and kept the original length of the grain boundary.The displacement of the cantilever beam at the specimenfracture was 8.6 mm and the corresponding load wascalculated as 1380 mN. The cantilever beam was brokendue to impact at the time of the specimen fracture. The microtensile test of the unaged condition specimen having thehigh-angled grain boundary of 51� rotation angle was carriedout for the same specimen shape and setup as the agedcondition specimen. The displacement of the cantilever at thespecimen fracture was 15.0 mm and the corresponding loadwas calculated as 2640 mN. While the amount of the plastic
50µm
Si cantilever Specimen
Microprobe
<110>
<001>
Fig. 3 Setup of a micro tensile test.
10µm
(c)(b)(a)
GBSpecimen
Microprobe
Cantilever A B
Fig. 4 SIM images of an in situ micro tensile test.
0 1 2 3 4 5 60
0.5
1.0
Displacement, d / µm
Load
, F /
mN
Fig. 5 Results of the load versus displacement measured by indenting the
position at 5mm from the point of the cantilever beam.
22 K. Fujii and K. Fukuya
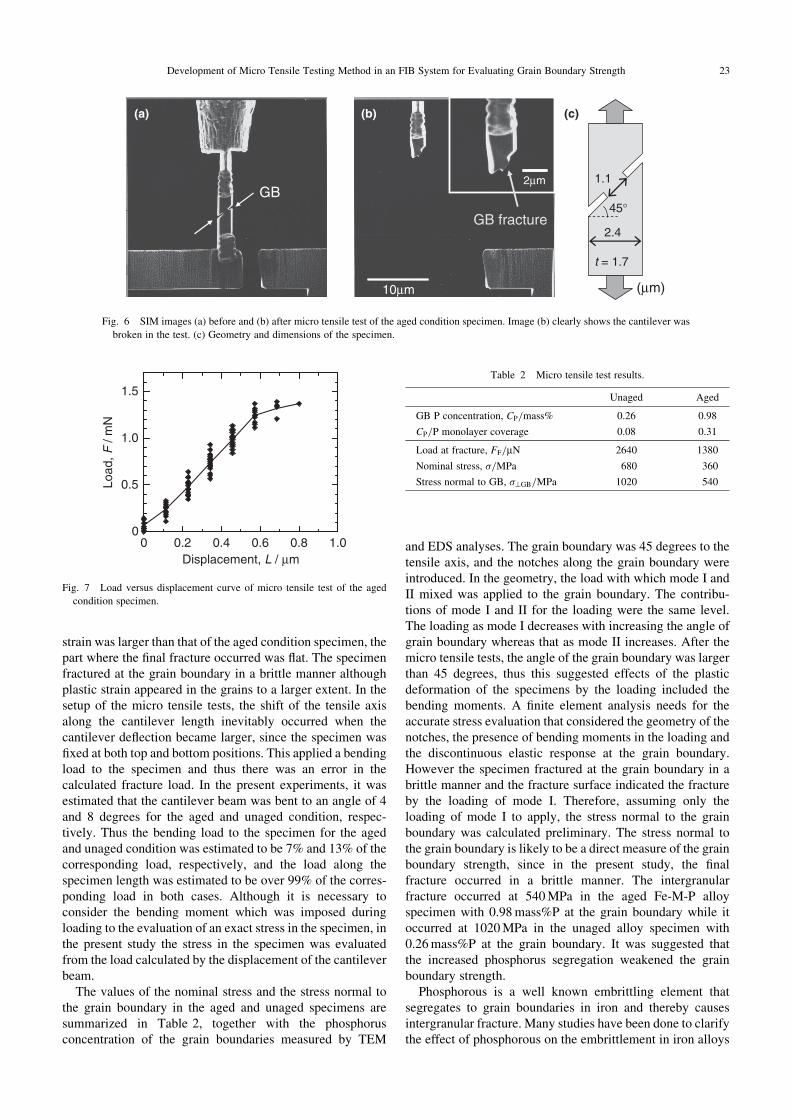
strain was larger than that of the aged condition specimen, thepart where the final fracture occurred was flat. The specimenfractured at the grain boundary in a brittle manner althoughplastic strain appeared in the grains to a larger extent. In thesetup of the micro tensile tests, the shift of the tensile axisalong the cantilever length inevitably occurred when thecantilever deflection became larger, since the specimen wasfixed at both top and bottom positions. This applied a bendingload to the specimen and thus there was an error in thecalculated fracture load. In the present experiments, it wasestimated that the cantilever beam was bent to an angle of 4and 8 degrees for the aged and unaged condition, respec-tively. Thus the bending load to the specimen for the agedand unaged condition was estimated to be 7% and 13% of thecorresponding load, respectively, and the load along thespecimen length was estimated to be over 99% of the corres-ponding load in both cases. Although it is necessary toconsider the bending moment which was imposed duringloading to the evaluation of an exact stress in the specimen, inthe present study the stress in the specimen was evaluatedfrom the load calculated by the displacement of the cantileverbeam.
The values of the nominal stress and the stress normal tothe grain boundary in the aged and unaged specimens aresummarized in Table 2, together with the phosphorusconcentration of the grain boundaries measured by TEM
and EDS analyses. The grain boundary was 45 degrees to thetensile axis, and the notches along the grain boundary wereintroduced. In the geometry, the load with which mode I andII mixed was applied to the grain boundary. The contribu-tions of mode I and II for the loading were the same level.The loading as mode I decreases with increasing the angle ofgrain boundary whereas that as mode II increases. After themicro tensile tests, the angle of the grain boundary was largerthan 45 degrees, thus this suggested effects of the plasticdeformation of the specimens by the loading included thebending moments. A finite element analysis needs for theaccurate stress evaluation that considered the geometry of thenotches, the presence of bending moments in the loading andthe discontinuous elastic response at the grain boundary.However the specimen fractured at the grain boundary in abrittle manner and the fracture surface indicated the fractureby the loading of mode I. Therefore, assuming only theloading of mode I to apply, the stress normal to the grainboundary was calculated preliminary. The stress normal tothe grain boundary is likely to be a direct measure of the grainboundary strength, since in the present study, the finalfracture occurred in a brittle manner. The intergranularfracture occurred at 540MPa in the aged Fe-M-P alloyspecimen with 0.98mass%P at the grain boundary while itoccurred at 1020MPa in the unaged alloy specimen with0.26mass%P at the grain boundary. It was suggested thatthe increased phosphorus segregation weakened the grainboundary strength.
Phosphorous is a well known embrittling element thatsegregates to grain boundaries in iron and thereby causesintergranular fracture. Many studies have been done to clarifythe effect of phosphorous on the embrittlement in iron alloys
2µm
10µm
GB
GB fracture
(a) (b)
t = 1.7
2.4
1.1
45°
(µm)
(c)
Fig. 6 SIM images (a) before and (b) after micro tensile test of the aged condition specimen. Image (b) clearly shows the cantilever was
broken in the test. (c) Geometry and dimensions of the specimen.
0 0.2 0.4 0.6 0.8 1.00
0.5
1.0
1.5
Displacement, L / µm
Load
, F /
mN
Fig. 7 Load versus displacement curve of micro tensile test of the aged
condition specimen.
Table 2 Micro tensile test results.
Unaged Aged
GB P concentration, CP/mass% 0.26 0.98
CP/P monolayer coverage 0.08 0.31
Load at fracture, FF/mN 2640 1380
Nominal stress, �/MPa 680 360
Stress normal to GB, �?GB/MPa 1020 540
Development of Micro Tensile Testing Method in an FIB System for Evaluating Grain Boundary Strength 23
and steels. It was reported from impact tests on Fe-P alloysthat the phosphorous-induced grain boundary embrittlementof iron occurred when the bulk phosphorous concentrationwas more than �900 at ppm.6) In the present study, Fe-Mn-Palloy (0.042mass%P, 0.076 at%P) in the unaged conditionwas susceptible to intergranular fracture in the micro tensiletest at room temperature. These results indicate that bulkphosphorous concentration of �1 at% is a common thresholdcondition for causing intergranular fracture in not onlyimpact tests but also the micro tensile tests.
The relationship between intergranular fracture stress andphosphorus grain boundary concentration of Mn-Ni-Mosteels has been reported by Naudim et al.7) They showedthat the amount of intergranular fracture increased withphosphorus monolayer coverage and that there existed athreshold value in phosphorus monolayer coverage (5 to10%) at temperatures below �60�C. They also showed thatthe intergranular fracture stress linearly decreased withphosphorus monolayer coverage from cleavage fracturestress (2300MPa) at the threshold value in phosphorusmonolayer coverage. Nakata et al.8) have also reported thatthe fracture stress decreased due to non-hardening embrittle-ment on thermally aged material with high proportion ofintergranular fracture and that a threshold value for theintergranular fracture phenomenon existed around the P/Fepeak height ratio of 0.1 (corresponding to the phosphorusmonolayer coverage of 0.16). In the present study, thefracture at the grain boundaries of 0.08 and 0.31 phosphorusmonolayer coverages occurred during the micro tensile test atroom temperature. The level of these phosphorus monolayercoverages causing the grain boundary fracture was consistentwith the reported level. However the intergranular fracturestress presented by Naudim et al.7) was 2300MPa to1700MPa for the phosphorus monolayer coverage of 0.1 to0.4, and was much larger than those obtained in the present
study. This difference may be due to the effects of specimenshape and constraint by surrounding grains depending on thespecimen size. In the present study, notches were introducedinto the specimen along the grain boundary. The notcheswere likely to enhance the stress concentration at the grainboundary, resulting in a fracture at a lower load.
4. Summary
A method was developed to measure the strength of anindividual grain boundary together with its detailed charac-teristics by using a specimen prepared with an FIB micro-processing. The micro tensile test in an FIB system wasapplied to measure the grain boundary strength of aged andunaged Fe-Mn-P alloy specimens with different grainboundary phosphorus segregations. The intergranular frac-ture occurred at 540MPa in the aged condition specimenwith 0.98mass%P at the grain boundary while it occurredat 1020MPa in the unaged condition specimen with0.26mass%P at the grain boundary. It was suggested thatthe increased phosphorus segregation weakened the grainboundary strength.
REFERENCES
1) K. J. Hemker andW. N. Sharpe Jr.: Ann. Rev. Mater. Res. 37 (2007) 93–
126.
2) D. Kiener, C. Motz and G. Dehm: Mater. Sci. Eng. A 505 (2009) 79–87.
3) D. S. Gianola and C. Eberl: JOM 61 (2009) 24–35.
4) S. Orso, U. G. Wegst, C. Eberl and E. Arzt: Adv. Mater. 18 (2006) 874–
877.
5) J. J. Wortman and R. A. Evans: J. Appl. Phys. 36 (1965) 153–156.
6) K. Abiko, S. Suzuki and H. Kimura: Trans. Jpn. Inst. Met. 23 (1982) 43–
52.
7) C. Naudin, J. M. Frund and A. Pineau: Scr. Mater. 40 (1999) 1013–1019.
8) H. Nakata, K. Fujii, K. Fukuya, R. Kasada and A. Kimura: J. Nucl. Sci.
Technol. 43 (2006) 785–793.
24 K. Fujii and K. Fukuya


![RUNNING TIME ANALYSIS - GitHub Pages · Running time analysis of the iterative algorithm function F(n) Create an array fib[1..n] fib[1] = 1 fib[2] = 1 for i = 3 to n: fib[i] = fib[i-1]](https://img.pdfslide.us/doc/110x75/5e95ef9e965d8c2b7e7f1cbb/running-time-analysis-github-pages-running-time-analysis-of-the-iterative-algorithm.jpg)