Embed Size (px)
Citation preview
DEVELOPMENT OF MACHINE-VISION TECHNOLOGY FOR INSPECTION OF RAILROAD TRACK
BY
STEVEN VEERAPON SAWADISAVI
THESIS
Submitted in partial fulfillment of the requirements for the degree of Master of Science in Civil Engineering
in the Graduate College of the University of Illinois at Urbana-Champaign, 2010
Urbana, Illinois
Advisers:
Professor Christopher P. L. Barkan Lecturer J. Riley Edwards
ii
ABSTRACT
Railroad engineering practices and Federal Railroad Administration (FRA) regulations
require track to be inspected for physical defects at specified intervals, which may be as often as
thrice per week. These inspections are conducted visually by railroad track inspectors, but due to
practical considerations, only a certain level of detail and consistency can be obtained.
Enhancements are possible using machine-vision technology, which consists of recording digital
images of track elements and analyzing those images using custom algorithms to identify defects
or their symptoms.
Based on analysis of FRA accident data, discussion with railroad track engineering
experts, consultation with Association of American Railroads researchers, and review of existing
inspection technologies and methods, this project focuses on developing a machine-vision-based
system to detect irregularities and defects in wood-tie fasteners, rail anchors, crib ballast, and
turnout components. A Video Track Cart was developed for initial video data acquisition, and
algorithms were developed to consistently detect the rail, tie plates, ties, cut spikes, rail anchors,
and ballast using a global-to-local algorithmic approach. Using the detection algorithms on
panoramas generated from the videos further increases their accuracy, with added benefit in
using the panoramas to manually confirm the severity of defects if results are in doubt.
Once defects have been detected and catalogued by the system, a quantitative comparison
of data from different runs is possible, opening up possibilities for defect growth trending and
predictive maintenance scheduling. Ultimately, this system will provide consistent, quantitative
track inspection data for not only increasing current inspection capabilities, but also deepening
the understanding of track health over time.

iii
ACKNOWLEDGEMENTS
I would like to thank all of the people who have made this thesis possible. I am grateful
to David Davis of Transportation Technology Center, Inc. for his input and assistance in my
research. I am also grateful to Dr. Narendra Ahuja, Sinisa Todorovic, Esther Resendiz, and John
M. Hart from the Computer Vision and Robotics Laboratory (CVRL) at the Beckman Institute
for Advanced Science and Technology, which represented the machine-vision side of this
multidisciplinary project and without whose help I would not have been able to do this research.
I also must thank my peers John Zeman, Brennan Caughron, Michael Wnek, and Adam Borhart
of the Railroad Engineering Program at the University of Illinois for their assistance and
cooperation with my research. Principal support for this research was from the Association of
American Railroads Technology Scanning Program.
I am grateful to my classmates for their advice and time regarding this thesis as well as
their friendship over the past years. I would also like to think my advisers, Dr. Christopher P. L.
Barkan and J. Riley Edwards, for their encouragement and guidance throughout this research
project. Finally, I am grateful to my parents, who always supported me no matter what I chose
to do.

iv
To Atkavi and Sutaporn Sawadisavi
v
TABLE OF CONTENTS CHAPTER 1: INTRODUCTION ............................................................................................. 1
CHAPTER 2: BACKGROUND ............................................................................................... 2
2.1 OPTIMAL LOCATIONS FOR IMPLEMENTATION OF MACHINE-VISION TRACK INSPECTION CONSIDERING TRAFFIC DENSITY AND SPEED ......................................2
2.2 CLASSIFICATIONS OF RAILROADS AND TRACK .....................................................3
2.3 OVERVIEW OF SELECTED TRACK COMPONENTS...................................................5
CHAPTER 3: SELECTION OF INSPECTION TASKS ...................................................... 11
3.1 PRIORITIZATION BASED ON FRA ACCIDENT STATISTICS .................................. 11
3.2 DEFECT SEVERITY CLASSIFICATION ...................................................................... 12
3.3 SURVEY OF INSPECTION TECHNOLOGIES ............................................................. 14
3.4 INSPECTION ITEMS ..................................................................................................... 15
CHAPTER 4: INSPECTION REQUIREMENTS ................................................................. 20
4.1 RAILROAD TRACK STANDARDS .............................................................................. 20
4.2 FRA TRACK SAFETY STANDARDS ........................................................................... 23
4.3 SUMMARY OF DIFFERENCES IN REQUIREMENTS ................................................ 26
4.4 PROJECT IMPLICATIONS ............................................................................................ 26
CHAPTER 5: TRACK INSPECTION TECHNOLOGIES AND METHODS .................... 28
5.1 CURRENT TECHNOLOGIES ........................................................................................ 28
5.2 EMERGING TECHNOLOGIES ...................................................................................... 31
5.3 INSPECTION FREQUENCY LEVELS .......................................................................... 39
CHAPTER 6: IMAGE ACQUISITION SYSTEM ................................................................ 42
6.1 OVERVIEW OF COMPONENTS ................................................................................... 42
6.2 CAMERA CONSIDERATIONS ..................................................................................... 42
6.3 COMPUTER CONSIDERATIONS AND RESULTING SPECIFICATIONS .................. 50
6.4 POWER SUPPLY CONSIDERATIONS ......................................................................... 51
6.5 RECORDING PLATFORM CONSIDERATIONS .......................................................... 52
6.6 LIGHTING CONSIDERATIONS ................................................................................... 55
CHAPTER 7: DATA COLLECTION .................................................................................... 58
7.1 STILL IMAGES .............................................................................................................. 58
7.2 VIRTUAL TRACK MODEL ........................................................................................... 65
7.3 VIDEO RECORDING ..................................................................................................... 66
CHAPTER 8: ALGORITHM DEVELOPMENT .................................................................. 70
vi
8.1 OVERVIEW .................................................................................................................... 70
8.2 TIE-BASED ALGORITHM ............................................................................................ 71
8.3 RAIL-BASED ALGORITHMS ....................................................................................... 72
8.4 FUTURE ALGORITHM CONSIDERATIONS ............................................................... 80
CHAPTER 9: DISCUSSION .................................................................................................. 81
9.1 SYSTEM USES AND IMPLEMENTATION .................................................................. 81
9.2 INSPECTION ITEMS BEYOND THE CURRENT PROJECT SCOPE ........................... 82
CHAPTER 10: SUMMARY ................................................................................................... 88
10.1 OBJECTIVE OF THIS RESEARCH ............................................................................. 88
10.2 TRACK INSPECTION GUIDELINES .......................................................................... 88
10.3 DATA COLLECTION AND SYSTEM DEVELOPMENT ............................................ 89
10.4 ALGORITHM DEVELOPMENT .................................................................................. 89
10.5 FUTURE APPLICATIONS ........................................................................................... 90
10.6 CONCLUSION ............................................................................................................. 90
REFERENCES ........................................................................................................................ 92
1
CHAPTER 1: INTRODUCTION
The research recorded in this thesis was a multidisciplinary project between the
Computer Vision and Robotics Laboratory (CVRL) at the Beckman Institute for Advanced
Science and Technology and the Railroad Engineering Program at the University of Illinois at
Urbana-Champaign. Its objective was to investigate new methods of using machine-vision
technology to enable more effective inspections of railroad track. It focused on the development
of a machine-vision system to inspect Class I railroad mainline and siding tracks, as these tracks
generally experience the highest traffic densities. High traffic density causes increased wear,
leading to more frequent inspection and maintenance requirements while providing less time to
accomplish it. With time at a premium on these lines, new, more efficient, but more capital-
intensive inspection technologies, such as machine vision, become cost-effective.
Machine-vision provides many potential advantages to track inspection. At a minimum,
track components can be objectively and quantitatively inspected, as the system does not suffer
from fatigue or the subjectivity inherent with human inspectors. Given the digital nature of the
data collection, archiving inspection results and trending of the data also become feasible,
leading to more advanced failure prediction models for maintenance scheduling and a more
thorough understanding of track structure behavior.
The collection of objective data alone increases the value obtained from inspections, and
could shorten inspection times as well, leading to gains in track time. Moreover, the system
would allow inspectors to focus on more critical defects, or perhaps allow reallocation of
inspector resources into other areas, leading to more effective use of labor. Finally, the data
trending and failure prediction models would enable effective, long-term maintenance planning,
possibly reducing the number of track-related service failures, leading to improved service.
2
CHAPTER 2: BACKGROUND
In this chapter, I review the fundamentals regarding the classification of railroads and
their track, as well as the specific track environment in which machine-vision track inspection
will be applied. These include which types of railroads are most likely to implement the
technology, the track classification system used by the Federal Railroad Administration (FRA),
and the principal elements of the track structure that the initial machine-vision inspection system
is intended to address.
2.1 OPTIMAL LOCATIONS FOR IMPLEMENTATION OF MACHINE-VISION TRACK
INSPECTION CONSIDERING TRAFFIC DENSITY AND SPEED
Machine-vision track inspection is likely to be most cost effective on routes that combine
both high traffic density and high operating speed. High traffic density, especially with the
heavy axle-loads typical of North American freight operation, leads to rapid deterioration of
certain track components and overall track condition. Higher operating speeds dictate more
stringent maintenance standards (FRA, 2007). Combining these two factors leads to increased
maintenance costs due to rapid track degradation while requiring tighter geometric tolerances.
Consequently, the value of automated inspection systems is enhanced, as they have the potential
to identify incipient problems. By doing so, these technologies enable more efficient
maintenance scheduling, thereby reducing maintenance cost and impact on network operations.
Moreover, line capacity can be increased with improved track inspection. Many routes
that carry high-density traffic are at or near their maximum capacity. The increasing need for
capacity on the North American railroad network provides further value to inspection
technologies that reduce the need for track time to perform inspections and maintenance. A
3
reduction in track time can occur by either reducing the time needed for inspection or by
scheduling maintenance more effectively through earlier detection or trending of problems.
2.2 CLASSIFICATIONS OF RAILROADS AND TRACK
The following subsections provide background on the classification systems used by the
Surface Transportation Board (STB) for railroad companies and the FRA for specific segments
of railroad track. These classifications are used for our definition of high-speed, high-density
track, and provide context for the development of the machine-vision track inspection system.
2.2.1 Railroad Classes as defined by the STB
The STB defines three classes of railroad carriers based on their inflation-adjusted annual
operating revenue, ranging from the smallest, Class III, to the largest, Class I (Table 2.1)
(Surface Transportation Board, 2007).
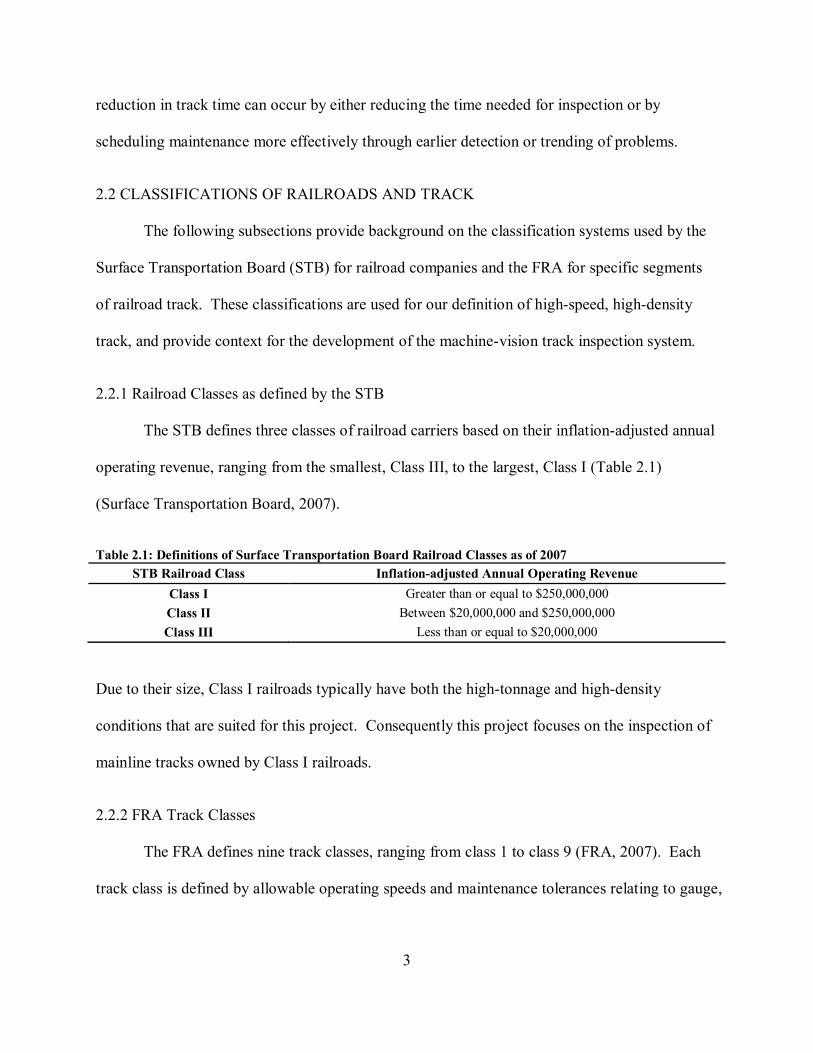
Table 2.1: Definitions of Surface Transportation Board Railroad Classes as of 2007 STB Railroad Class Inflation-adjusted Annual Operating Revenue
Class I Greater than or equal to $250,000,000 Class II Between $20,000,000 and $250,000,000 Class III Less than or equal to $20,000,000
Due to their size, Class I railroads typically have both the high-tonnage and high-density
conditions that are suited for this project. Consequently this project focuses on the inspection of
mainline tracks owned by Class I railroads.
2.2.2 FRA Track Classes
The FRA defines nine track classes, ranging from class 1 to class 9 (FRA, 2007). Each
track class is defined by allowable operating speeds and maintenance tolerances relating to gauge,
4
cross-level, alignment, and other parameters (Table 2.2). If any track parameters are not within
the ranges specified in the FRA Track Safety Standards—meaning that there is a FRA-defined
defect—either those parameters must be brought into compliance or the track must be
downgraded to a lower track class, for which the parameters are acceptable, or taken out of
service. Downgrading the track class is not conducive to railroad operational efficiency as the
corresponding reduction of the maximum allowable train speed will reduce track capacity and
overall throughput for the particular section of track. Similarly, removing a track from service
will have even greater repercussions to the operational efficiency.
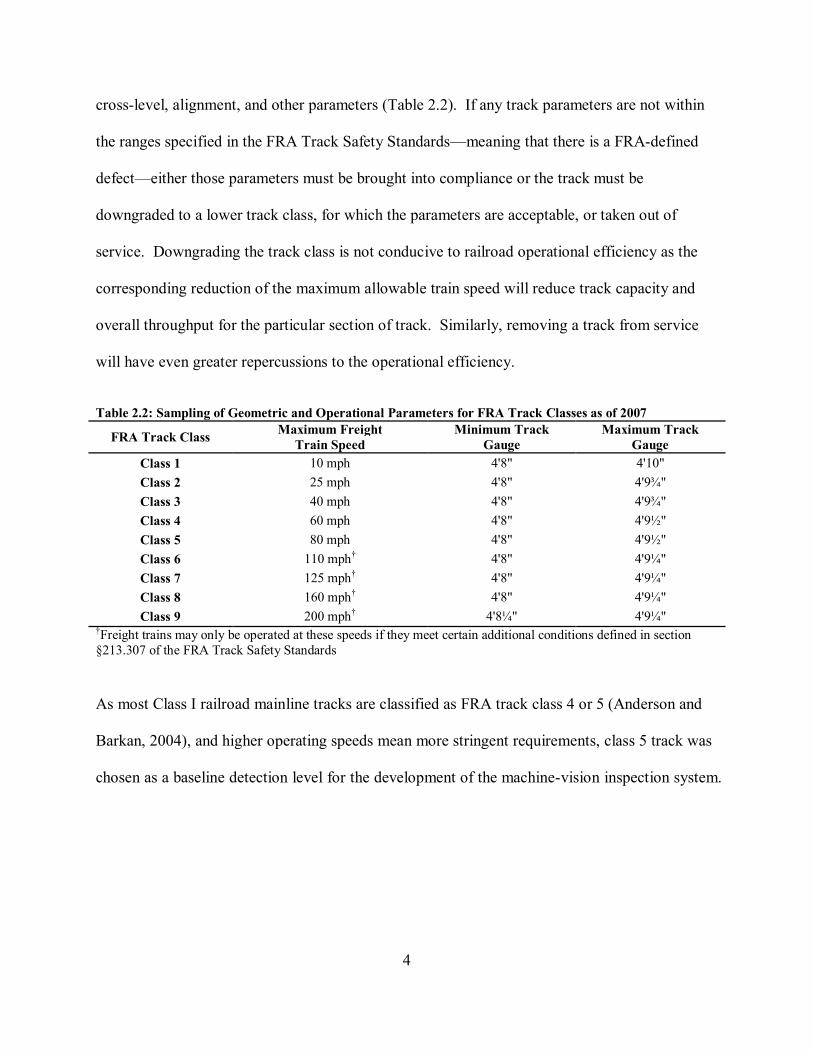
Table 2.2: Sampling of Geometric and Operational Parameters for FRA Track Classes as of 2007
FRA Track Class Maximum Freight Train Speed
Minimum Track Gauge
Maximum Track Gauge
Class 1 10 mph 4'8" 4'10" Class 2 25 mph 4'8" 4'9¾" Class 3 40 mph 4'8" 4'9¾" Class 4 60 mph 4'8" 4'9½" Class 5 80 mph 4'8" 4'9½" Class 6 110 mph† 4'8" 4'9¼" Class 7 125 mph† 4'8" 4'9¼" Class 8 160 mph† 4'8" 4'9¼" Class 9 200 mph† 4'8¼" 4'9¼"
†Freight trains may only be operated at these speeds if they meet certain additional conditions defined in section §213.307 of the FRA Track Safety Standards
As most Class I railroad mainline tracks are classified as FRA track class 4 or 5 (Anderson and
Barkan, 2004), and higher operating speeds mean more stringent requirements, class 5 track was
chosen as a baseline detection level for the development of the machine-vision inspection system.

5
2.3 OVERVIEW OF SELECTED TRACK COMPONENTS
The four elements of railroad track that this project is primarily concerned with are:
ballast, rail anchors, cut spikes, and turnout components. The following subsections provide an
introduction to the functions and typical design of these components.
2.3.1 Ballast
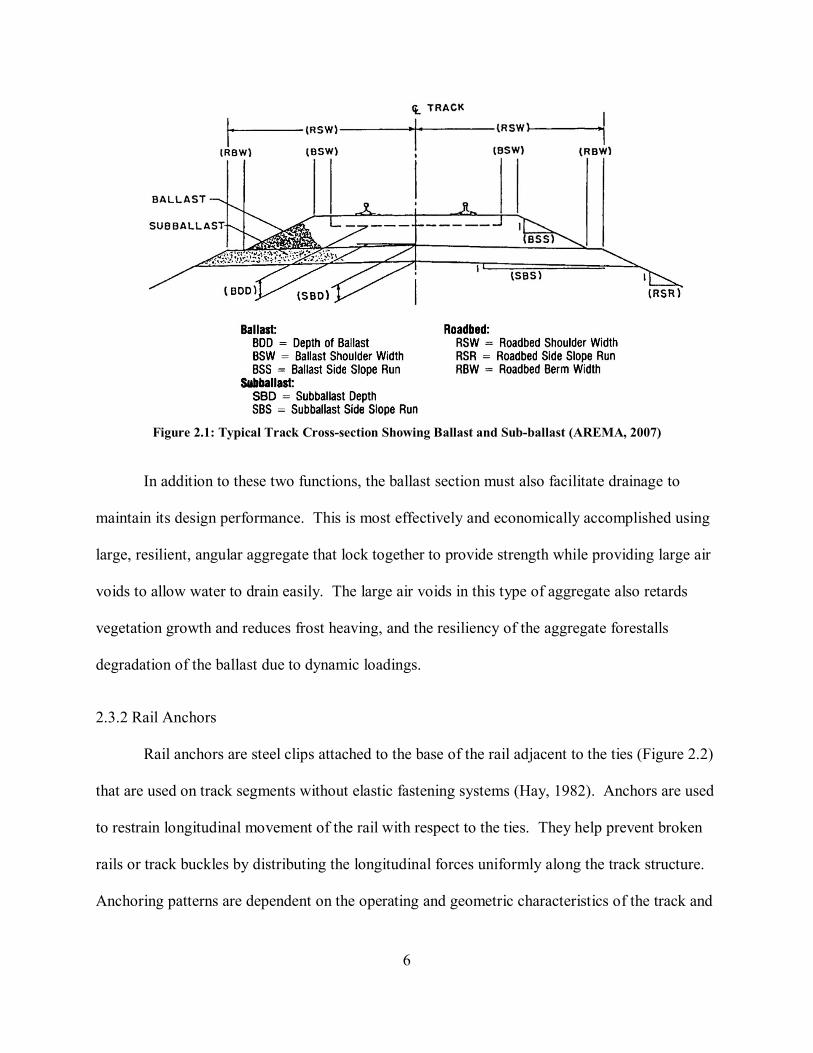
Ballast is a layer of crushed aggregate (Figure 2.1) used to support and stabilize most
North American railroad track (Hay, 1982). The two primary functions of ballast are to receive
and distribute track loads into the sub-ballast and subgrade, and to provide longitudinal and
lateral stability for the track. The former is accomplished by using ballast of a specific design
thickness and strength that effectively distributes the wheel loads to prevent overloading of the
subgrade. The latter is accomplished by packing ballast between and at the ends of ties. The
ballast between the ties, referred to as crib ballast, resists longitudinal movement of the track
structure primarily through the addition of mass. The ballast at the ends of the ties, referred to as
shoulder ballast, resists lateral movement through the same principle, and provides stability and
rigidity for withstanding buckling forces due high thermal stresses that may build up in the rail.
Finally, both the crib and shoulder ballast provide a small amount of vertical resistance through
friction against the tie. If ballast fails to provide adequate resistance, especially in the
longitudinal direction, there is increased likelihood of excessive rail movement, which can lead
to a broken rail or track buckle.
6
Figure 2.1: Typical Track Cross-section Showing Ballast and Sub-ballast (AREMA, 2007)
In addition to these two functions, the ballast section must also facilitate drainage to
maintain its design performance. This is most effectively and economically accomplished using
large, resilient, angular aggregate that lock together to provide strength while providing large air
voids to allow water to drain easily. The large air voids in this type of aggregate also retards
vegetation growth and reduces frost heaving, and the resiliency of the aggregate forestalls
degradation of the ballast due to dynamic loadings.
2.3.2 Rail Anchors
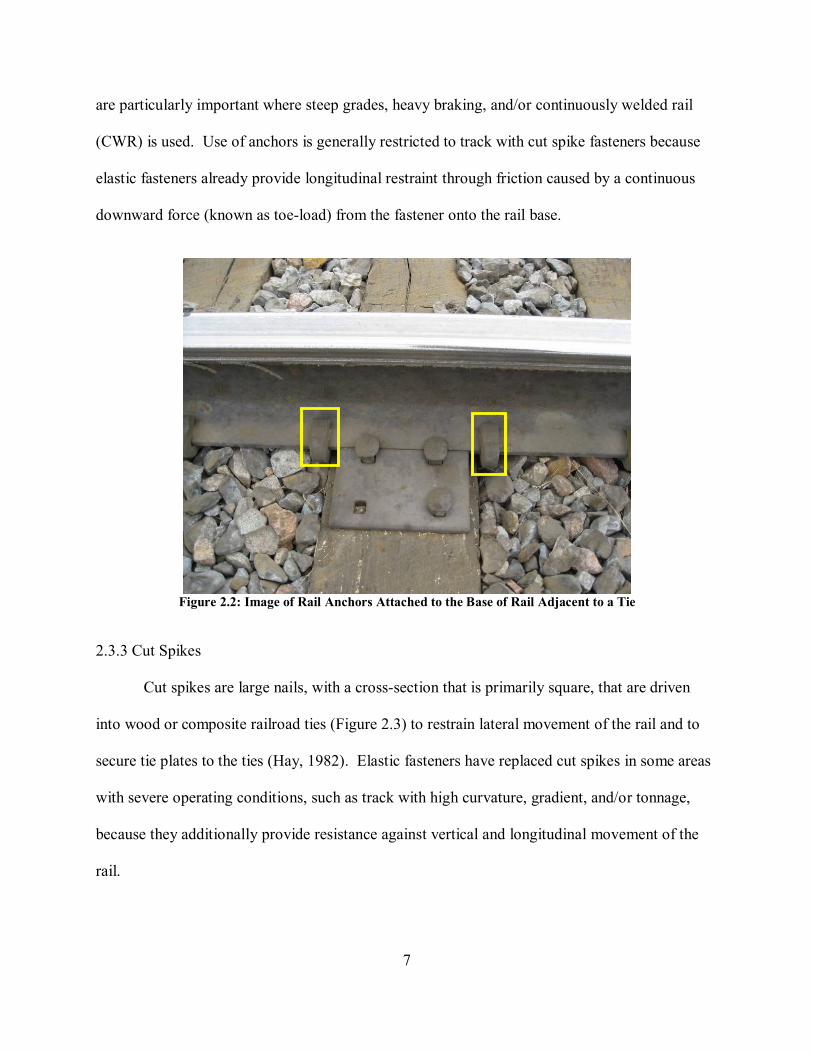
Rail anchors are steel clips attached to the base of the rail adjacent to the ties (Figure 2.2)
that are used on track segments without elastic fastening systems (Hay, 1982). Anchors are used
to restrain longitudinal movement of the rail with respect to the ties. They help prevent broken
rails or track buckles by distributing the longitudinal forces uniformly along the track structure.
Anchoring patterns are dependent on the operating and geometric characteristics of the track and
7
are particularly important where steep grades, heavy braking, and/or continuously welded rail
(CWR) is used. Use of anchors is generally restricted to track with cut spike fasteners because
elastic fasteners already provide longitudinal restraint through friction caused by a continuous
downward force (known as toe-load) from the fastener onto the rail base.
Figure 2.2: Image of Rail Anchors Attached to the Base of Rail Adjacent to a Tie
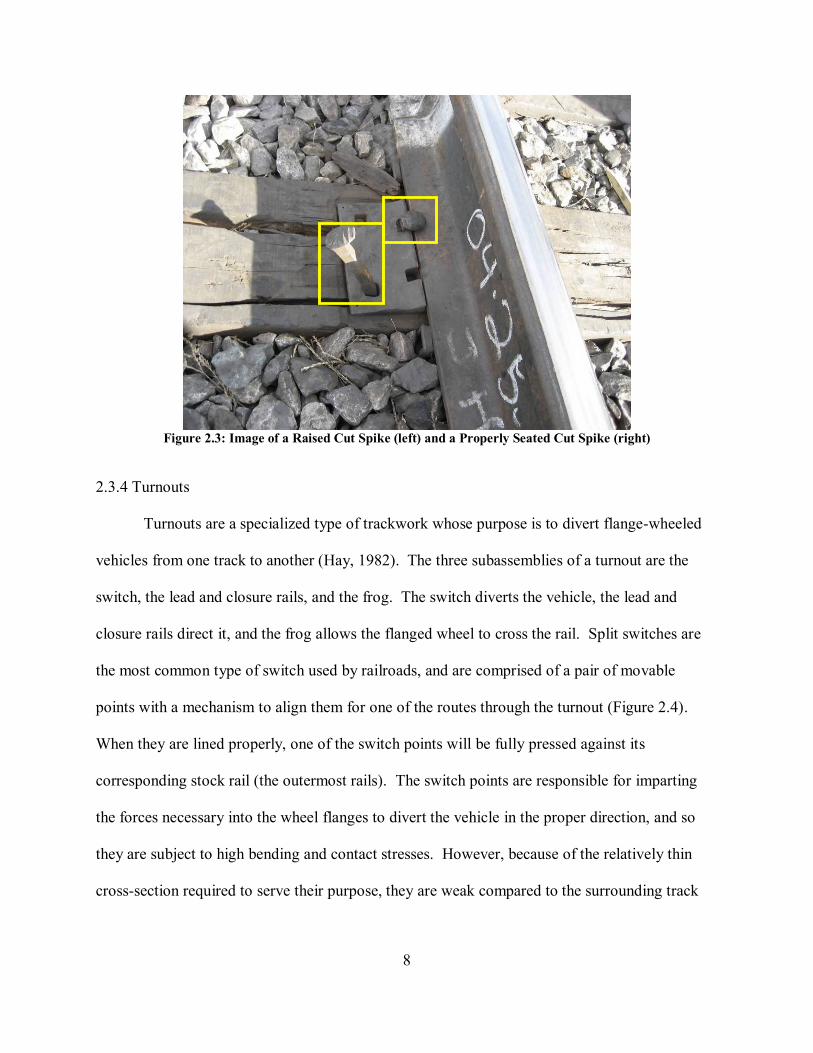
2.3.3 Cut Spikes
Cut spikes are large nails, with a cross-section that is primarily square, that are driven
into wood or composite railroad ties (Figure 2.3) to restrain lateral movement of the rail and to
secure tie plates to the ties (Hay, 1982). Elastic fasteners have replaced cut spikes in some areas
with severe operating conditions, such as track with high curvature, gradient, and/or tonnage,
because they additionally provide resistance against vertical and longitudinal movement of the
rail.
8
Figure 2.3: Image of a Raised Cut Spike (left) and a Properly Seated Cut Spike (right)
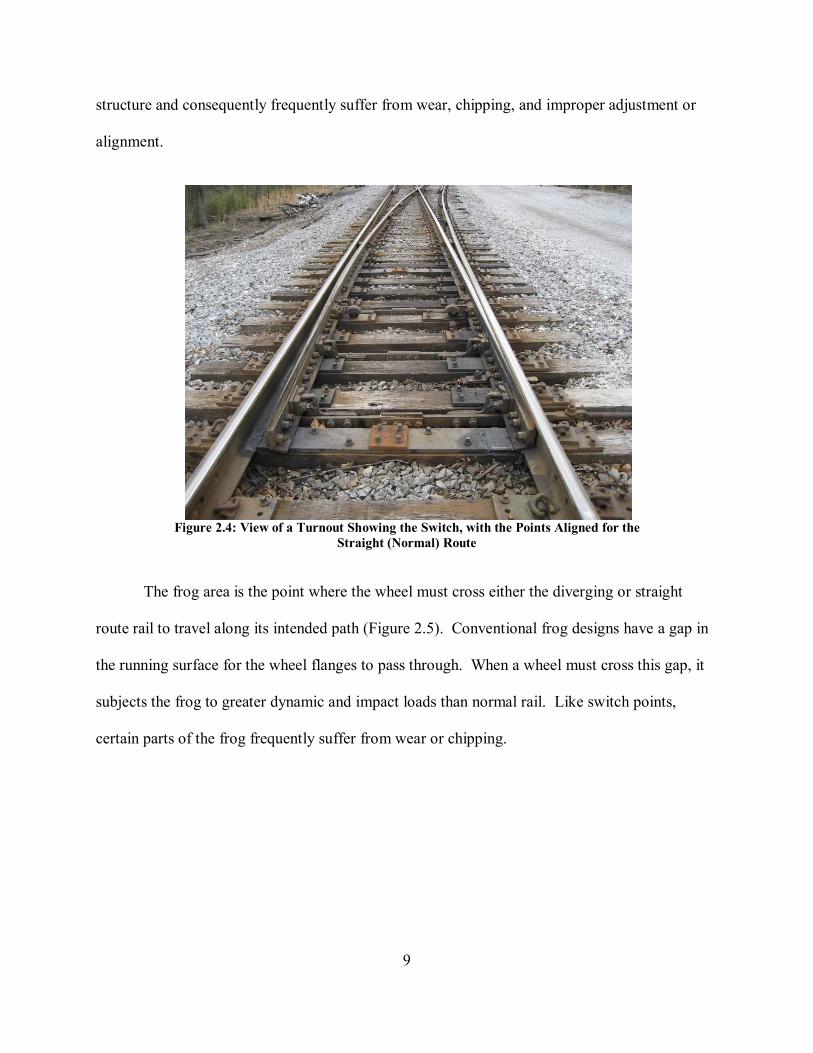
2.3.4 Turnouts
Turnouts are a specialized type of trackwork whose purpose is to divert flange-wheeled
vehicles from one track to another (Hay, 1982). The three subassemblies of a turnout are the
switch, the lead and closure rails, and the frog. The switch diverts the vehicle, the lead and
closure rails direct it, and the frog allows the flanged wheel to cross the rail. Split switches are
the most common type of switch used by railroads, and are comprised of a pair of movable
points with a mechanism to align them for one of the routes through the turnout (Figure 2.4).
When they are lined properly, one of the switch points will be fully pressed against its
corresponding stock rail (the outermost rails). The switch points are responsible for imparting
the forces necessary into the wheel flanges to divert the vehicle in the proper direction, and so
they are subject to high bending and contact stresses. However, because of the relatively thin
cross-section required to serve their purpose, they are weak compared to the surrounding track
9
structure and consequently frequently suffer from wear, chipping, and improper adjustment or
alignment.
Figure 2.4: View of a Turnout Showing the Switch, with the Points Aligned for the
Straight (Normal) Route
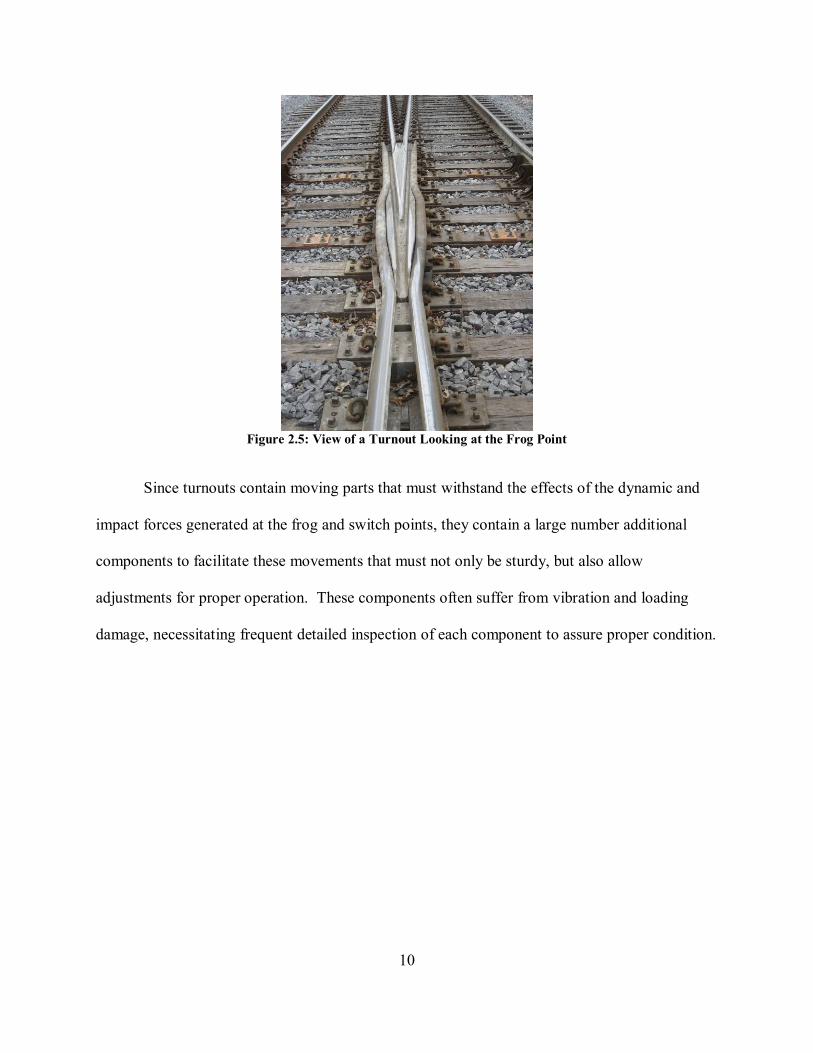
The frog area is the point where the wheel must cross either the diverging or straight
route rail to travel along its intended path (Figure 2.5). Conventional frog designs have a gap in
the running surface for the wheel flanges to pass through. When a wheel must cross this gap, it
subjects the frog to greater dynamic and impact loads than normal rail. Like switch points,
certain parts of the frog frequently suffer from wear or chipping.
10
Figure 2.5: View of a Turnout Looking at the Frog Point
Since turnouts contain moving parts that must withstand the effects of the dynamic and
impact forces generated at the frog and switch points, they contain a large number additional
components to facilitate these movements that must not only be sturdy, but also allow
adjustments for proper operation. These components often suffer from vibration and loading
damage, necessitating frequent detailed inspection of each component to assure proper condition.

11
CHAPTER 3: SELECTION OF INSPECTION TASKS
In the selection of the inspection tasks for this project, I took into account the lack of
available technology, severity of defects, and their potential contribution to accident prevention.
I also reviewed input from Class I railroad track engineering and maintenance managers, track
inspectors, and experts in track-related research. The result of this process was the selection of
ballast, rail anchors, cut spikes, and turnouts as the items of interest. This chapter details the
selection method and identifies the specific inspection tasks for each of the components
described in Chapter 2.
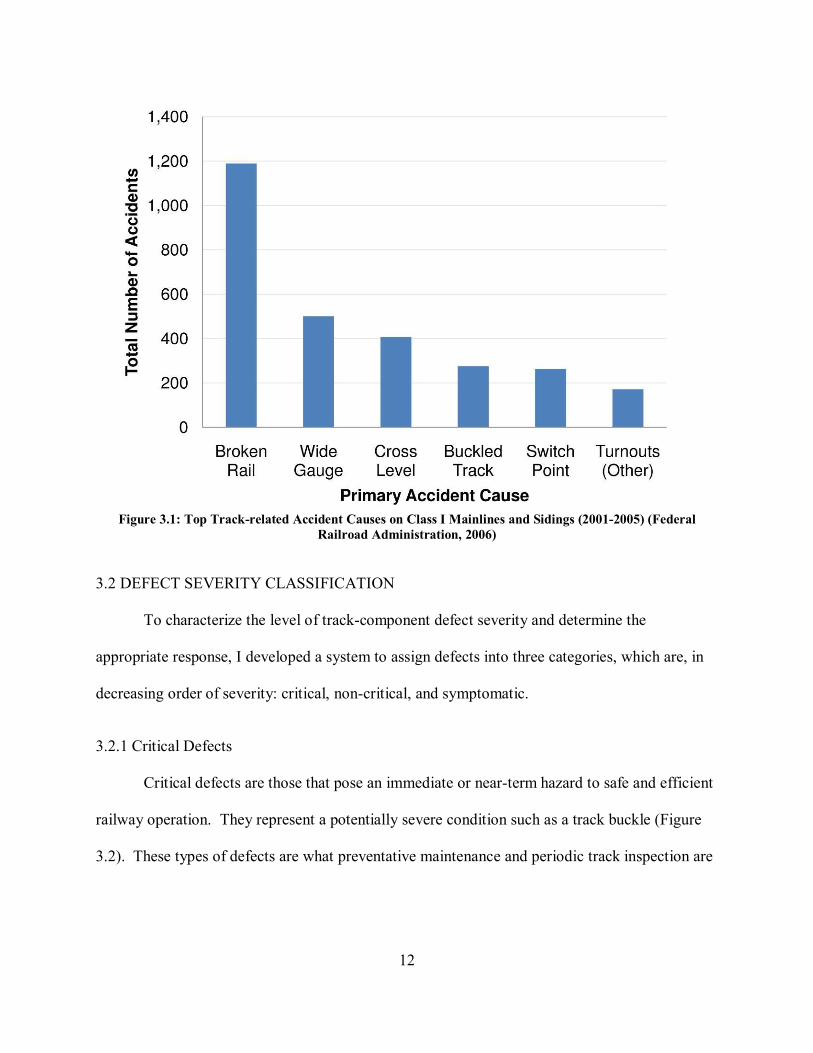
3.1 PRIORITIZATION BASED ON FRA ACCIDENT STATISTICS
I analyzed the FRA Accident Database to identify the most frequent causes of track-
related railroad accidents from 2001-2005 (Federal Railroad Administration, 2006). I did this to
help prioritize the track inspection tasks selected for machine-vision inspection. The FRA
database contains train accident and incident data that railroads are required to report to the FRA
so that the FRA can analyze the safety of railroad operations and monitor trends.
The three most common causes of accidents are broken rail, wide gauge, and improper
cross-level (Figure 3.1). However, defects leading to these accident causes are either not
amenable to, or were deemed a lower priority for machine-vision inspection due to availability or
ongoing development of other satisfactory technologies. By contrast, monitoring and prevention
of buckled track, switch point defects, and other turnout defects relies primarily on manual,
visual inspection. Use of machine vision has the potential to automate and substantially improve
manual visual inspection processes such as these and so they were selected for further
consideration.
12
Figure 3.1: Top Track-related Accident Causes on Class I Mainlines and Sidings (2001-2005) (Federal
Railroad Administration, 2006)
3.2 DEFECT SEVERITY CLASSIFICATION
To characterize the level of track-component defect severity and determine the
appropriate response, I developed a system to assign defects into three categories, which are, in
decreasing order of severity: critical, non-critical, and symptomatic.
3.2.1 Critical Defects
Critical defects are those that pose an immediate or near-term hazard to safe and efficient
railway operation. They represent a potentially severe condition such as a track buckle (Figure
3.2). These types of defects are what preventative maintenance and periodic track inspection are

13
intended to prevent. A major objective of the machine-vision inspection system would be to
identify sub-optimal track conditions before defects such as these develop.
Figure 3.2: Example of Track Buckle at a Turnout
3.2.2 Non-critical Defects
Non-critical defects are those that cause sub-optimal track structure conditions but do not
present an immediate hazard to train operations. An example of a non-critical defect is low crib
ballast between a single pair of ties (Figure 3.3). Such a condition may result in a small loss of
longitudinal stability of the track, but it is unlikely to pose an immediate hazard. However, if
low crib ballast persists along an extended segment of track, longitudinal stability may be
reduced to the point where, in combination with high stresses in the rail, a track buckle may
occur. Non-critical defects are among the ones this machine-vision system is intended to detect.
Figure 3.3: Example of Low Crib Ballast between a Pair of Ties
14
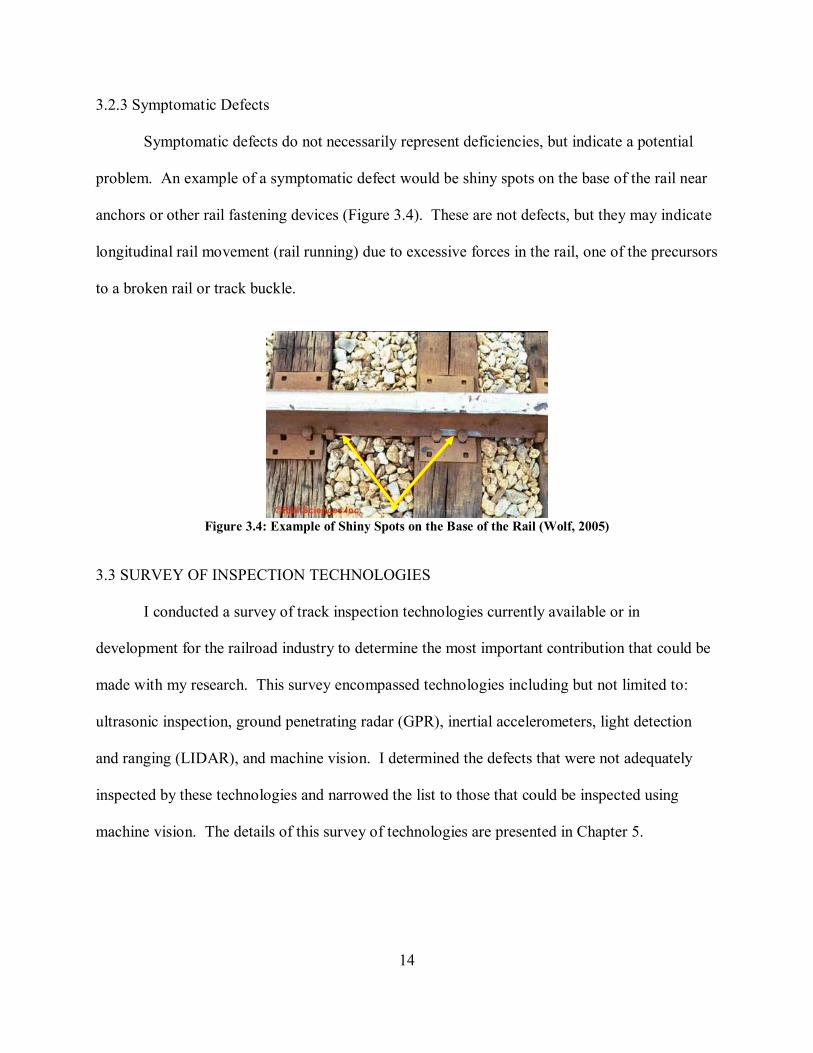
3.2.3 Symptomatic Defects
Symptomatic defects do not necessarily represent deficiencies, but indicate a potential
problem. An example of a symptomatic defect would be shiny spots on the base of the rail near
anchors or other rail fastening devices (Figure 3.4). These are not defects, but they may indicate
longitudinal rail movement (rail running) due to excessive forces in the rail, one of the precursors
to a broken rail or track buckle.
Figure 3.4: Example of Shiny Spots on the Base of the Rail (Wolf, 2005)
3.3 SURVEY OF INSPECTION TECHNOLOGIES
I conducted a survey of track inspection technologies currently available or in
development for the railroad industry to determine the most important contribution that could be
made with my research. This survey encompassed technologies including but not limited to:
ultrasonic inspection, ground penetrating radar (GPR), inertial accelerometers, light detection
and ranging (LIDAR), and machine vision. I determined the defects that were not adequately
inspected by these technologies and narrowed the list to those that could be inspected using
machine vision. The details of this survey of technologies are presented in Chapter 5.
15
3.4 INSPECTION ITEMS
The selection process ultimately yielded the following inspection tasks:
1. Excessive lateral curve displacement and insufficient crib ballast
2. Shifted or missing anchors, and inappropriate anchoring patterns
3. Raised or missing cut spikes and inappropriate spiking patterns
4. Condition of switch points and other turnout components
The following sections detail each of these inspection tasks and their importance in maintaining
safe and efficient railroad track and train operation.
3.4.1 Ballast Inspection
Given the importance of preventing rail breaks and track buckles, a number of ballast
conditions were considered for inspection. These conditions include excessive lateral curve
displacement, low crib ballast, and gaps between the ballast and ties.
The evaluation of shoulder ballast with respect to determining excessive lateral curve
displacement must take into account several factors. While lateral displacement is unacceptable
for tangent track, some amount of lateral displacement is normal in curves due to track loading
and the expansion and contraction of the rail. The most critical problem with lateral curve
displacement occurs when the track contracts inward, but is unable to revert to its original
position, leading to stress buildup in the rail.
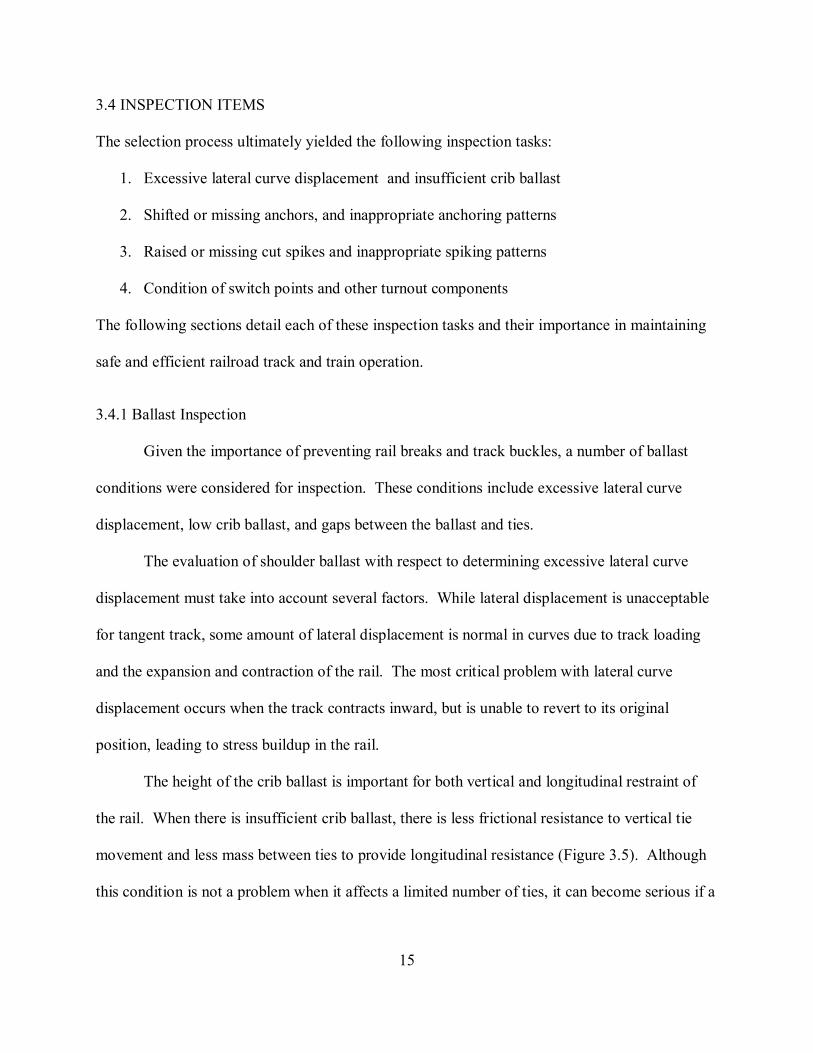
The height of the crib ballast is important for both vertical and longitudinal restraint of
the rail. When there is insufficient crib ballast, there is less frictional resistance to vertical tie
movement and less mass between ties to provide longitudinal resistance (Figure 3.5). Although
this condition is not a problem when it affects a limited number of ties, it can become serious if a
16
longer segment of track is affected. Gaps between the ballast and ties are another inspection
priority, and cause the same lack of vertical and longitudinal restraint as insufficient ballast.
Figure 3.5: Another Example of Low Crib Ballast
3.4.2 Rail Anchor Inspection
The primary rail anchor inspection focus is detecting if they have shifted away from the
tie, are missing, or are not in correct patterns. These conditions contribute to loss of longitudinal
rail resistance, which can lead to its movement. The result may be excess tensile or compressive
forces, potentially resulting in a track buckle or broken rail.
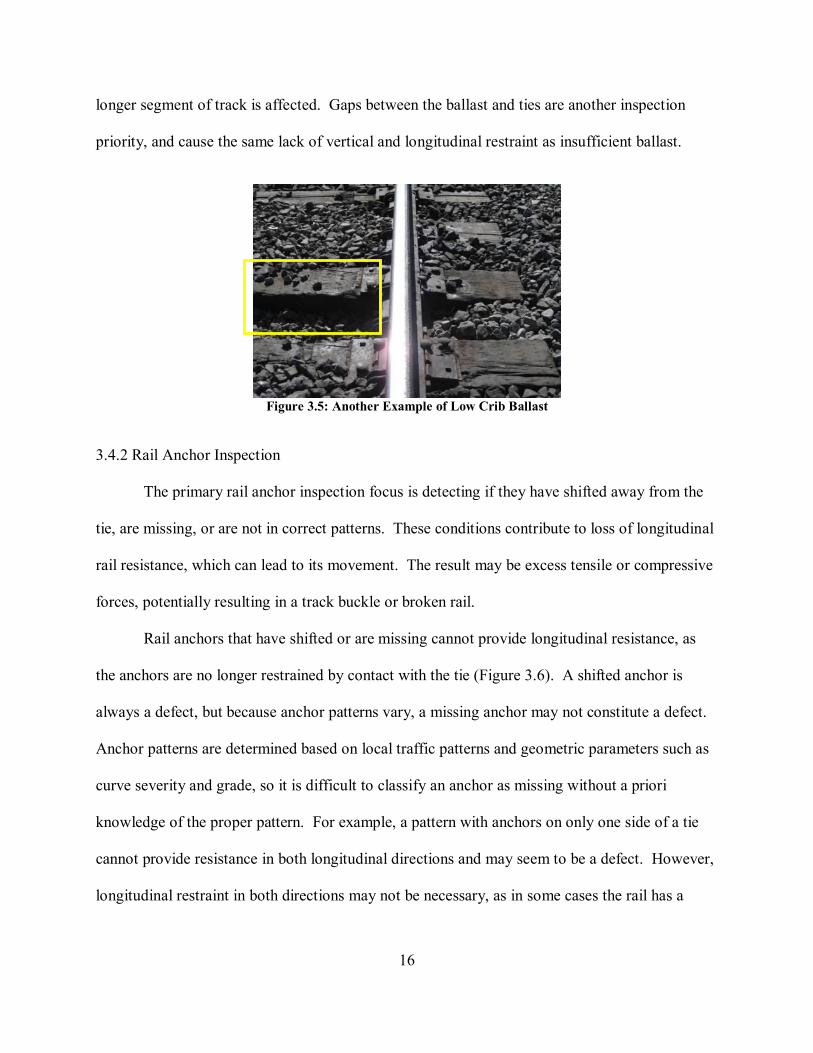
Rail anchors that have shifted or are missing cannot provide longitudinal resistance, as
the anchors are no longer restrained by contact with the tie (Figure 3.6). A shifted anchor is
always a defect, but because anchor patterns vary, a missing anchor may not constitute a defect.
Anchor patterns are determined based on local traffic patterns and geometric parameters such as
curve severity and grade, so it is difficult to classify an anchor as missing without a priori
knowledge of the proper pattern. For example, a pattern with anchors on only one side of a tie
cannot provide resistance in both longitudinal directions and may seem to be a defect. However,
longitudinal restraint in both directions may not be necessary, as in some cases the rail has a
17
tendency to move only in one direction. This generally occurs in situations where the traffic
moves predominately in one direction, or on grades (Hay, 1982). This illustrates the importance
of knowing the appropriate anchor patterns for specific segments of track to ensure proper defect
classification. Anchor pattern information may be obtained by using track charts to determine
traffic and geometric data.
Figure 3.6: Example of Shifted Rail Anchors
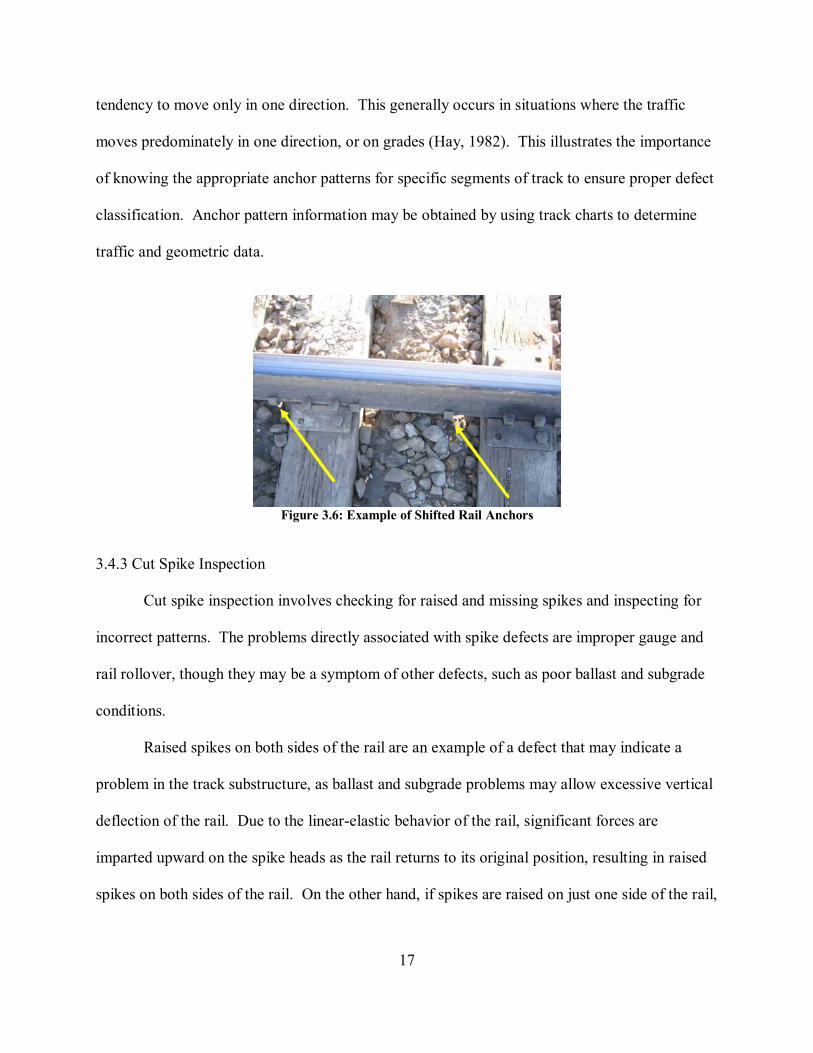
3.4.3 Cut Spike Inspection
Cut spike inspection involves checking for raised and missing spikes and inspecting for
incorrect patterns. The problems directly associated with spike defects are improper gauge and
rail rollover, though they may be a symptom of other defects, such as poor ballast and subgrade
conditions.
Raised spikes on both sides of the rail are an example of a defect that may indicate a
problem in the track substructure, as ballast and subgrade problems may allow excessive vertical
deflection of the rail. Due to the linear-elastic behavior of the rail, significant forces are
imparted upward on the spike heads as the rail returns to its original position, resulting in raised
spikes on both sides of the rail. On the other hand, if spikes are raised on just one side of the rail,
18
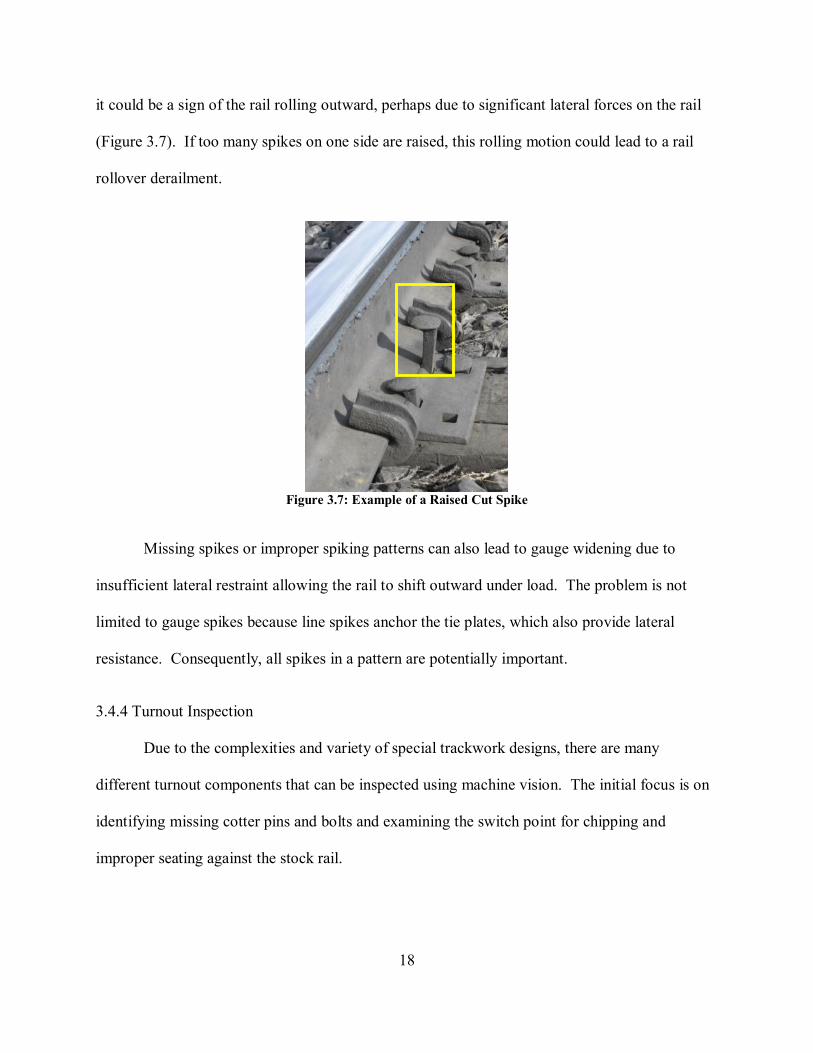
it could be a sign of the rail rolling outward, perhaps due to significant lateral forces on the rail
(Figure 3.7). If too many spikes on one side are raised, this rolling motion could lead to a rail
rollover derailment.
Figure 3.7: Example of a Raised Cut Spike
Missing spikes or improper spiking patterns can also lead to gauge widening due to
insufficient lateral restraint allowing the rail to shift outward under load. The problem is not
limited to gauge spikes because line spikes anchor the tie plates, which also provide lateral
resistance. Consequently, all spikes in a pattern are potentially important.
3.4.4 Turnout Inspection
Due to the complexities and variety of special trackwork designs, there are many
different turnout components that can be inspected using machine vision. The initial focus is on
identifying missing cotter pins and bolts and examining the switch point for chipping and
improper seating against the stock rail.
19
Since cotter pins are used to ensure that nuts are securely attached to bolts, missing pins
could be the first step to a potentially serious turnout malfunction. Such a malfunction could
cause a loss of correspondence in traffic control territory, misdirection of a train, or at worst, a
derailment.
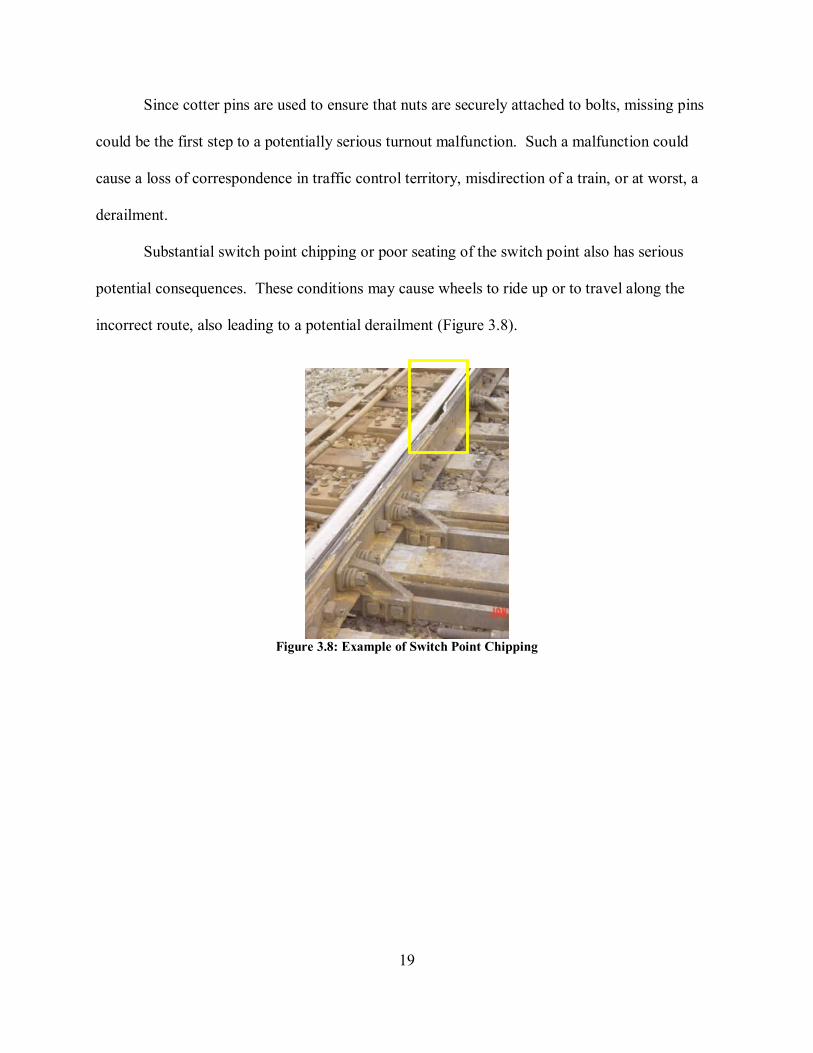
Substantial switch point chipping or poor seating of the switch point also has serious
potential consequences. These conditions may cause wheels to ride up or to travel along the
incorrect route, also leading to a potential derailment (Figure 3.8).
Figure 3.8: Example of Switch Point Chipping
20
CHAPTER 4: INSPECTION REQUIREMENTS
Railroad track inspection requirements are specified by individual railroad engineering
departments with some elements prescribed by FRA regulations. Railroads maintain track
standards internally to ensure safe and effective operations, while the FRA Track Safety
Standards are the minimum standards to which most railroad track must be maintained in the
United States (U.S.). Specific requirements are based on the desired speed, and thus FRA track
class, for a given segment of track. Both FRA and railroad track standards provide guidelines for
how to repair defects in the track structure and pertain specifically to track geometry, rail defects,
and broken and missing components.
4.1 RAILROAD TRACK STANDARDS
Track standards maintained by individual railroads are stricter than the FRA Track Safety
Standards and provide additional guidelines on inspection methods and remedial actions. This
section contains a sampling of these standards from a Class I railroad’s engineering track
standards with specific focus on the inspection items of interest in this research (CN, 2007).
4.1.1 Crib Ballast
According to sections TS 4.0.18 and TS 1.3.29 of the CN standards, under ideal
conditions, the level of ballast in the crib between the ties must be within 1" of the top of the ties
and ballast must not be on top of the ties, spikes, and tie plates. For inspection, crib ballast is
deemed insufficient if it is half-empty for six or more consecutive ties and when track surface or
alignment deviations exceed 75% of the allowable threshold for the track’s particular FRA track
class. This definition only applies when ambient temperature exceeds or is forecasted to exceed
85 degrees F within the next 24 hours. Crib ballast is inspected for displacement caused by the
21
ties that indicate longitudinal track movement (referred to as “plowing”), and shoulder ballast is
inspected for gaps at the ends of ties that indicate lateral track movement and may suggest an
incipient track buckle condition.
4.1.2 Rail Anchors
Sections TS 3.1 and TS 1.3.29 instruct that rail anchors be applied to the rail in a uniform
pattern immediately against the ties. To prevent tie skewing, anchors must be installed in the
same pattern on each rail for a given tie. The anchors must be installed from the gauge side of
the rail unless this is impractical. Anchors are not to be installed within 1 inch of a plant or field
weld nor opposite to rail joints. For jointed rail in class 4 and 5 track, there must be at least 10
evenly spaced anchors for every 39 feet of track. For CWR, anchors must be installed in a box
pattern (i.e. an anchor on both sides of the tie on both rails) on every other tie except at
permanent joints, the transition between jointed rail and CWR, turnouts, non-glued insulated
joints, and crossing frogs. Every tie must be box anchored for at least 200 feet in each direction
from a turnout or joint. Turnouts must be anchored to the greatest extent possible. When using
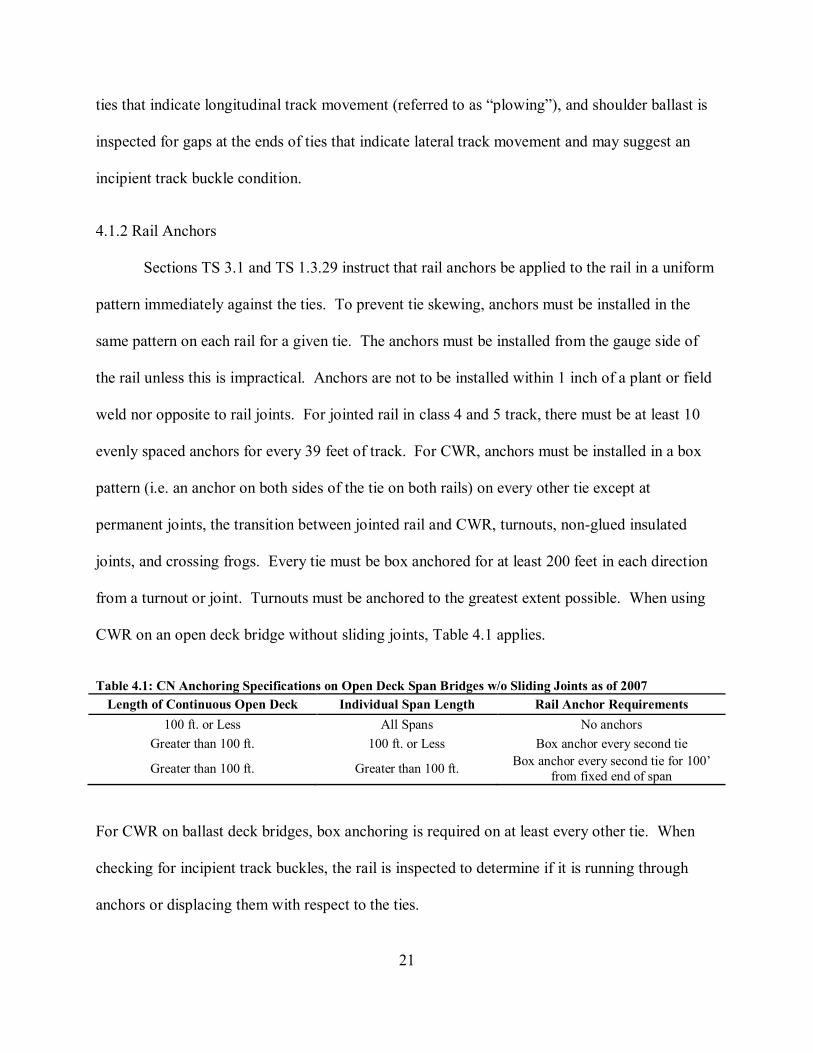
CWR on an open deck bridge without sliding joints, Table 4.1 applies.
Table 4.1: CN Anchoring Specifications on Open Deck Span Bridges w/o Sliding Joints as of 2007 Length of Continuous Open Deck Individual Span Length Rail Anchor Requirements
100 ft. or Less All Spans No anchors Greater than 100 ft. 100 ft. or Less Box anchor every second tie
Greater than 100 ft. Greater than 100 ft. Box anchor every second tie for 100’ from fixed end of span
For CWR on ballast deck bridges, box anchoring is required on at least every other tie. When
checking for incipient track buckles, the rail is inspected to determine if it is running through
anchors or displacing them with respect to the ties.
22
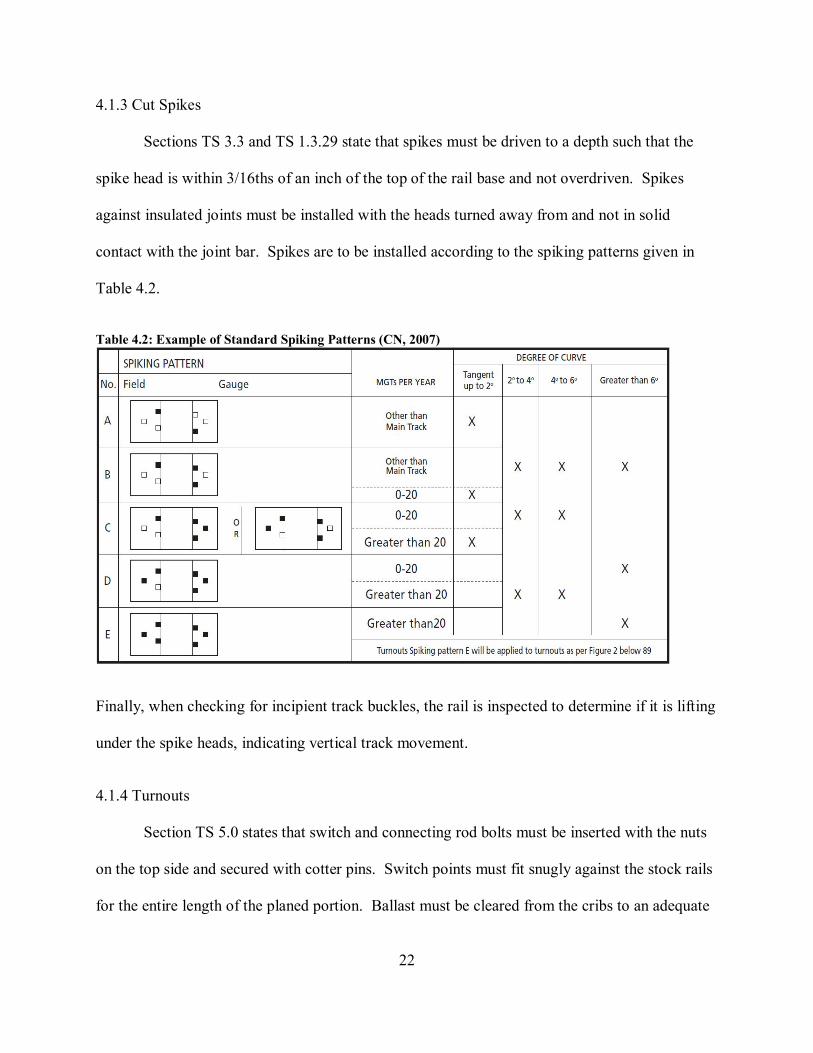
4.1.3 Cut Spikes
Sections TS 3.3 and TS 1.3.29 state that spikes must be driven to a depth such that the
spike head is within 3/16ths of an inch of the top of the rail base and not overdriven. Spikes
against insulated joints must be installed with the heads turned away from and not in solid
contact with the joint bar. Spikes are to be installed according to the spiking patterns given in
Table 4.2.
Table 4.2: Example of Standard Spiking Patterns (CN, 2007)
Finally, when checking for incipient track buckles, the rail is inspected to determine if it is lifting
under the spike heads, indicating vertical track movement.
4.1.4 Turnouts
Section TS 5.0 states that switch and connecting rod bolts must be inserted with the nuts
on the top side and secured with cotter pins. Switch points must fit snugly against the stock rails
for the entire length of the planed portion. Ballast must be cleared from the cribs to an adequate
23
depth to both prevent contact with switch rods and to facilitate winter switch maintenance and
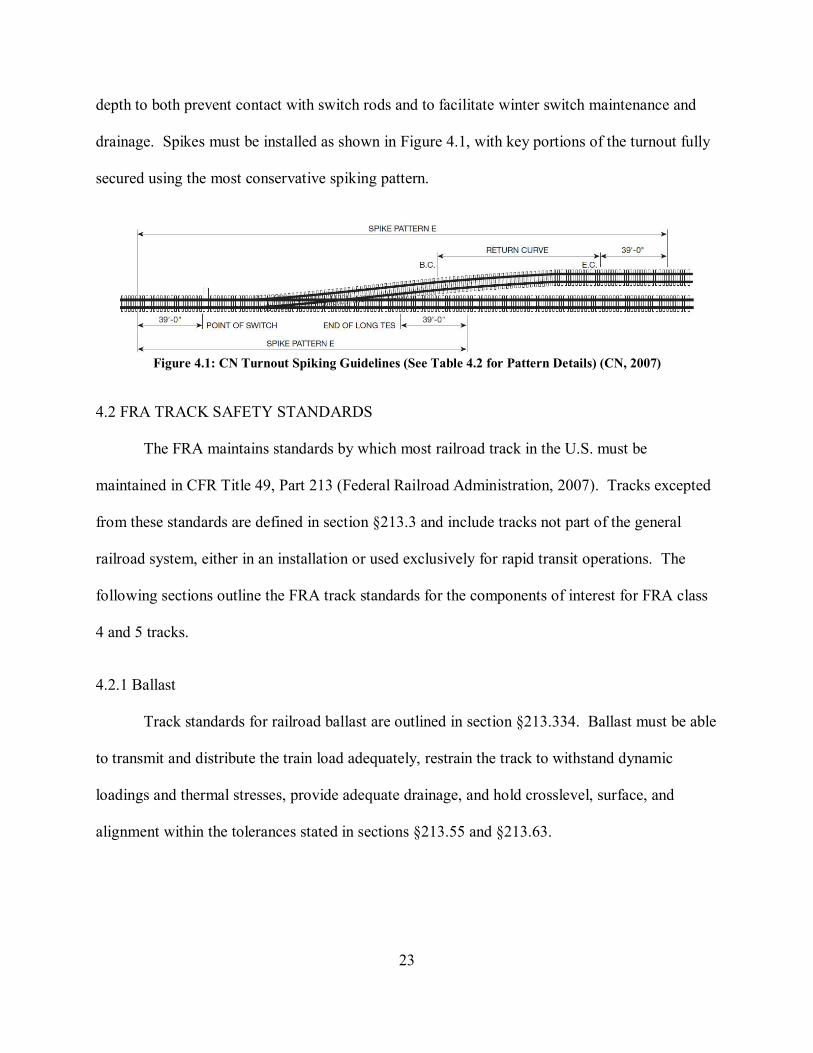
drainage. Spikes must be installed as shown in Figure 4.1, with key portions of the turnout fully
secured using the most conservative spiking pattern.
Figure 4.1: CN Turnout Spiking Guidelines (See Table 4.2 for Pattern Details) (CN, 2007)
4.2 FRA TRACK SAFETY STANDARDS
The FRA maintains standards by which most railroad track in the U.S. must be
maintained in CFR Title 49, Part 213 (Federal Railroad Administration, 2007). Tracks excepted
from these standards are defined in section §213.3 and include tracks not part of the general
railroad system, either in an installation or used exclusively for rapid transit operations. The
following sections outline the FRA track standards for the components of interest for FRA class
4 and 5 tracks.
4.2.1 Ballast
Track standards for railroad ballast are outlined in section §213.334. Ballast must be able
to transmit and distribute the train load adequately, restrain the track to withstand dynamic
loadings and thermal stresses, provide adequate drainage, and hold crosslevel, surface, and
alignment within the tolerances stated in sections §213.55 and §213.63.
24
4.2.2 Rail Anchors
Rail anchors are discussed in the section on general guidance for CWR in section
§213.119(b). Anchors must secure the rail to prevent longitudinal movement to the best extent
practical. Bridges, bridge approaches, and other areas where train movement would be
conducive to longitudinal rail movement require special attention.
4.2.3 Rail Fasteners
Rail fasteners are discussed in section §217.127. This section requires track to be
fastened such that it holds the gauge within the limits defined in section §213.53(b).
4.2.4 Turnouts
Standards for turnouts are in sections §213.133 through §213.143, and state that turnouts
be fully anchored, and that fasteners must be maintained so as to keep all components securely in
place. Frogs, switches and guardrails must be kept clear to allow free passage of wheels, and
flangeways must be at least 1.5 inches wide. Switches must have the stock rails securely seated
in the switch plates, and the switch points must fit their respective stock rail to ensure that when
in either position, the wheels take their intended path. The switch must be maintained to prevent
the outer edges of wheels from contacting the gauge side of the stock rails, and the heel of each
switch rail must be kept secure with its bolts tight. The switch stand and rod must be securely
fastened and operable without excessive lost motion that could allow undesired movement of the
points. Finally, excessively worn and chipped switch points must be repaired or replaced.
Frogs must have a flange depth of 1.5 inches from the wheel-bearing area. Flange-
bearing frogs are allowed to be less than 1-3/8ths inches deep if they are operated at speeds less
than 10 mph. Trains cannot be operated at more than 10 mph over a frog point worn, chipped, or
25
broken more than 5/8ths of an inch deep and 6 inches back from the actual frog point. Also, if
the tread of a cast frog is worn more than 3/8ths of an inch below its original contour, trains must
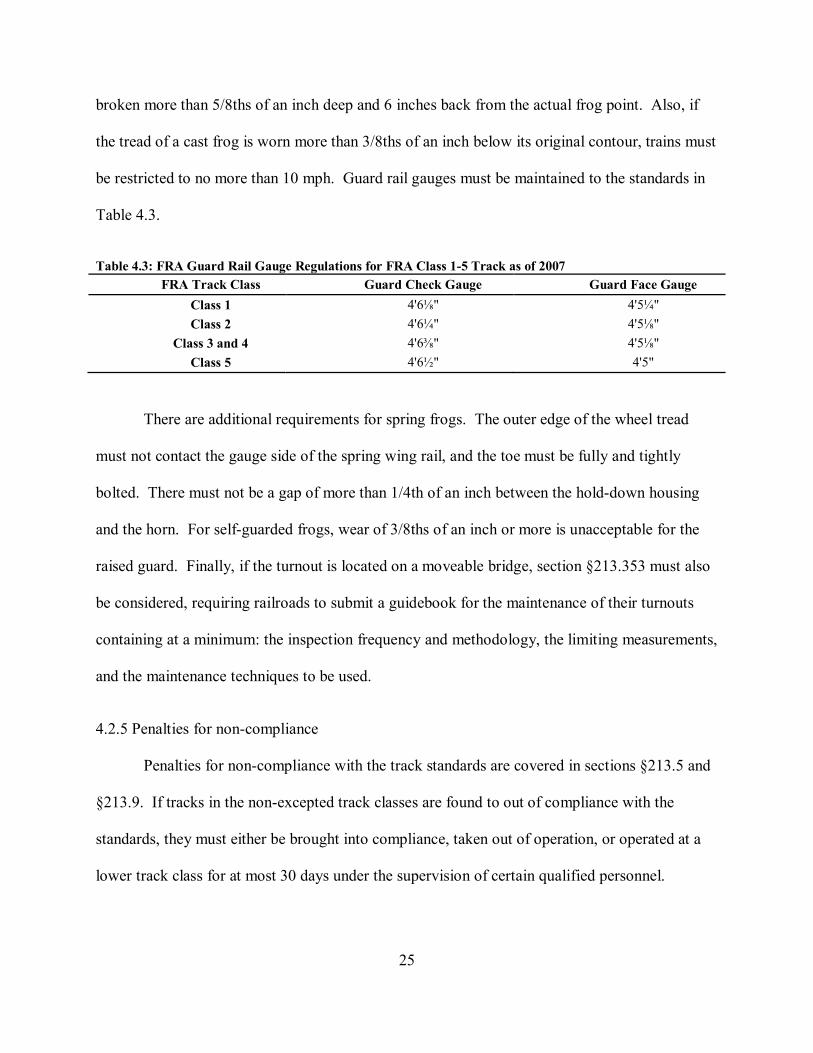
be restricted to no more than 10 mph. Guard rail gauges must be maintained to the standards in
Table 4.3.
Table 4.3: FRA Guard Rail Gauge Regulations for FRA Class 1-5 Track as of 2007 FRA Track Class Guard Check Gauge Guard Face Gauge
Class 1 4'6⅛" 4'5¼" Class 2 4'6¼" 4'5⅛"
Class 3 and 4 4'6⅜" 4'5⅛" Class 5 4'6½" 4'5"
There are additional requirements for spring frogs. The outer edge of the wheel tread
must not contact the gauge side of the spring wing rail, and the toe must be fully and tightly
bolted. There must not be a gap of more than 1/4th of an inch between the hold-down housing
and the horn. For self-guarded frogs, wear of 3/8ths of an inch or more is unacceptable for the
raised guard. Finally, if the turnout is located on a moveable bridge, section §213.353 must also
be considered, requiring railroads to submit a guidebook for the maintenance of their turnouts
containing at a minimum: the inspection frequency and methodology, the limiting measurements,
and the maintenance techniques to be used.
4.2.5 Penalties for non-compliance
Penalties for non-compliance with the track standards are covered in sections §213.5 and
§213.9. If tracks in the non-excepted track classes are found to out of compliance with the
standards, they must either be brought into compliance, taken out of operation, or operated at a
lower track class for at most 30 days under the supervision of certain qualified personnel.
26
Qualified personnel are defined by the FRA as an employee with a minimum of one year of
supervisory experience in track maintenance.
4.3 SUMMARY OF DIFFERENCES IN REQUIREMENTS
For each of the items covered in the FRA Track Safety Standards, the example standards
from CN provide a greater level of detail in their internal track inspection standards. In terms of
the ballast section, CN includes specifications on ballast height and condition. For rail anchors,
CN provides installation guidelines for anchoring a wide variety of conditions and inspection
guidelines to help detect incipient track buckles. As for cut spikes, CN provides detailed
installation guidelines including parameters such as spike height and patterns for different
applications. Finally, CN provides specific spike installation guidelines for turnouts, and for
certain turnout components, detailed inspection guidelines. In general, internal railroad track
inspection standards are more prescriptive than the FRA track standards.
4.4 PROJECT IMPLICATIONS
While both FRA and railroad inspection requirements are very detailed in a number of
areas, most defects addressed in this research project associated with the initial components (cut
spikes and rail anchors) lack specificity in the requirements. This project measures track
parameters that are nearly impossible to effectively measure on a large scale using manual,
visual inspection methods. Thus, the standards for these parameters have not been easy to
develop. General inspection guidelines exist to help detect certain track conditions, but few
specific numbers or thresholds are defined due to the limitations of current inspection technology.
The best example of the types of thresholds that must be defined is CN’s definition of
insufficient ballast. This definition states that crib ballast should not be less than half the tie

27
height, but that this condition is only significant when it persists across six or more consecutive
ties in certain situations. In general however, specific tolerances are not included for such things
as distance of rail anchors from ties or how far spikes can safely be raised from the rail.
Moreover, given that these defects are non-critical, the conditions under which these defects
would be considered critical must also be defined. This would depend on a number of factors
such as tonnage, curvature, grade, etc. Given the new information that the machine-vision
system will gather regarding certain track conditions, it may become possible to define a more
effective set of guidelines based on a greater understanding of how the newly measured
parameters affect track performance.
28
CHAPTER 5: TRACK INSPECTION TECHNOLOGIES AND METHODS
Current track inspection technologies and methods were introduced in Chapter 3 to
explain the selection process for the initial inspection tasks to be developed in this research. In
this chapter, I provide the details of my survey of these technologies and methods, discuss their
specific applications to track inspection, and address the advantages and disadvantages of each. I
then discuss inspection vehicles and their frequency and how this applies to a future system
implementation.
5.1 CURRENT TECHNOLOGIES
5.1.1 Ultrasonic Rail Flaw Testing
Ultrasonic testing is the most widely used method of rail-flaw detection in the United
States. It is currently the most efficient and effective technology to detect internal defects.
Ultrasonic systems produce ultrasonic waves that are transmitted into the specific medium being
tested, which in this application is the rail. Discontinuities in the material alter the wave paths
and a transducer is used to detect these reflected waves to find flaws or boundaries in the
material. Current technology requires physical contact between the ultrasonic wave source and
the material being inspected; however, recent developments include using lasers to produce
ultrasonic waves and air-coupled transducers to allow non-contact inspection (Cerniglia, et al.,
2009). Ultrasonic testing has a number of advantages because of its deeper scanning depth than
other current non-destructive testing (NDT) methods and accuracy in determining the position,
size, and shape of defects. Disadvantages include the need for significant skill and training to
analyze the results and great difficulty associated with inspecting non-homogeneous materials
(NDT Resource Center, n.d.b). Defects beneath another defect closer to the surface may be

29
difficult to detect, because the waves are reflected by the closer defect, thereby obscuring the
ones below. In addition, defects oriented parallel to the path of the waves are difficult to detect.
Multiple wave generators have been used to partially overcome these limitations. In terms of rail
inspection, ultrasonic testing is used primarily to find internal rail-flaws, including, but not
limited to: split heads, head and web separations, bolt-hole breaks, detail fractures, transverse
fissures, and transverse compound fissures. Many products have been developed to perform
ultrasonic testing, ranging from hand-held testers to self-propelled automated cars.
5.1.2 Eddy Current
Eddy current inspection is also used for rail-flaw defect detection. Eddy current uses the
principle of electromagnetic induction, where an alternating current is passed through one
conductor, generating a magnetic field that induces an electric current (the eddy current) in the
second conductor. Flaws in the second conductor change the magnetic field produced by the
eddy current, enabling detection of defects. Among the advantages of this approach are the
ability to inspect without contact, sensitivity to small cracks and other defects, and equipment
portability. Disadvantages include a limited inspection depth that only allows detection of
surface or near-surface defects and the inability to inspect non-conductive materials or detect
flaws that are parallel to the probe coil winding and probe scan direction (NDT Resource Center,
n.d.a). It is used for finding surface defects in the rail head, rail base, rail welds, bolt holes, and
the side of the rail.
5.1.3 Radiography
Radiography is used to detect defects in certain sections of the rail, such as bolt holes or
thermite welds. The radiographic procedure creates images of the rail section using x-rays or
30
gamma rays, which have a much shorter wavelength than visible light. These shorter
wavelengths allow inspection through thick materials with complex geometry while still
maintaining a high level of sensitivity (NDT Resource Center, n.d.c). The advantage of this
method is that it can penetrate completely through the rail to provide an image of the internal
structure. Unfortunately, radiographic techniques require either a powerful electrical generator
to produce x-rays or a radioactive isotope (with its associated health and safety concerns) to
produce gamma rays (American Welding Society, 2004).
5.1.4 Split-load Axle
Split-load axle technology is used for the measurement of gauge restraint. It uses a
specially designed, hydraulically-powered wheelset capable of applying variable vertical and
horizontal loads to the rails. As a vehicle equipped with this technology moves along the track,
it uses the powered wheelset to apply a set of vertical and horizontal forces to the rails, and
measures the resulting changes in gauge (Clouse and Kesler, 2003). If too much gauge change is
observed—indicating poor lateral restraint—a problem with the ties or fasteners is likely. An
advantage of this method is that it is a performance-based test. However, to properly test gauge
restraint, loading conditions similar to those occurring in regular service must be replicated,
making it impossible to use this technology on small inspection vehicles such as high-rail
vehicles. In addition to split-load axle technology, there exist portable, handheld gauge-restraint
measurement systems that can be used to verify results from a split-load axle. Still, these
handheld systems only provide loading in the horizontal direction and cannot be used to get a
true measure of gauge holding performance under normal field conditions.
31
5.2 EMERGING TECHNOLOGIES
5.2.1 Accelerometers
Inertial accelerometers are used to determine track geometry, such as alignment, surface,
and cross-level, and provide ride-quality measurements (Jamieson et al., 2001). They use
sensors that measure accelerations, which are mounted on an inspection vehicle, standard railcar,
or a locomotive. Poor geometry often causes undesirable movement of the vehicle, which causes
accelerations that are detected by the accelerometers. This technology, like the split-load axle,
has the advantage of being a performance-based test, but the disadvantage of being less useful on
lighter vehicles such as high-rail inspection cars, as their inertial characteristics are not
representative of most rolling stock.
5.2.2 Ground Penetrating Radar
Ground Penetrating Radar (GPR) is used to inspect railroad ballast. Inspection entails
first transmitting radio waves into the ballast. The differing electromagnetic characteristics of
ballast layers affect the reflection of the radio waves, which when analyzed, then provides a
profile of the ballast. This profile supplies information on the thickness and lateral and
longitudinal extent of the ballast layers, giving insight into several different track problems,
including the effects of trapped water, weak substructure conditions, and inadequate substructure
layer thickness (Fateh, 2005; Al-Qadi et al., 2007).
5.2.3 Light Detection and Ranging
Light Detection and Ranging (LIDAR) uses a laser to reflect light off of the objects to be
inspected. The properties of the scattered, reflected light are then analyzed to determine the
object’s distance from the source. LIDAR systems in use by the railroads employ a rotating laser
32
emitter that has high cross-sectional resolution due to the large number of sampling points along
the inspection arc. However, the longitudinal resolution along the track is dependent on the
speed of the inspection vehicle (Plasser American Corporation, 2008). To allow for greater
resolution at high speeds, LIDAR systems have been improving their laser emitters to use
multiple beams or to rotate at higher speeds; however, these features also increase the cost. An
advantage of this technology is the ability to accurately measure an entire cross section at high
speed irrespective of light level. Disadvantages include the relatively low longitudinal resolution
at high speeds, and the inability to obtain measurements from objects at oblique angles or from
wet surfaces.
Plasser American has developed a clearance/ballast measuring system that uses LIDAR
to measure tunnel clearances and the profile of the shoulder ballast section (Plasser American
Corporation, 2008). Their system uses a laser mirror scanner that operates using an electro-
optical range detection method and has an accuracy of 25 mm (0.98 in). This rotating laser array
covers a 350 degree range, with a ten-degree gap in the measurements at the center of the track
that is used for system calibration. As of 2007, it was being used by the New York City Transit
Authority, Long Island Rail Road, Taipei Transit, Union Pacific Railroad, and CSX
Transportation (Plasser American Corporation, 2008).
5.2.4 Machine Vision
Machine-vision systems are currently in use or under development for a variety of
inspection tasks, both wayside and mobile, including inspection of joint bars, surface cracks in
the rail, rail profile, gauge, intermodal loading efficiency, railcar structural and mechanical
components, and railcar safety appliances. Machine-vision systems have three main sub-systems.
33
The first element is the data acquisition system, in which digital cameras are used to obtain
images or video in the visible or infrared spectrum. The next element is the image analysis
system, where the images or videos are processed using machine-vision algorithms to detect and
identify items of interest and assess the condition of the detected items. The last element is the
data analysis system, which is used to verify whether the condition of items complies with the
appropriate specified parameters.
The advantages of machine vision include greater objectivity and consistency compared
to manual, visual inspection, and the ability to record and organize large quantities of visual data
in a quantitative format. These features, combined with data archiving and recall capabilities,
provide powerful trending capabilities in addition to the enhanced inspection capability itself.
Some disadvantages of machine vision include difficulties in coping with unusual or unforeseen
circumstances and the need to control and augment lighting conditions.
5.2.4.1 Joint bars
The FRA began development of a machine-vision-based joint bar inspection system in
2002 (Berry et al., 2008). The system uses high resolution, line-scan cameras along with high-
powered xenon lights to record images of joint bars from a high-rail vehicle travelling at speeds
up to 65 mph (105 km/hr). ENSCO has incorporated this technology into their VisiRail™ Joint
Bar Inspection system, which is currently undergoing development and testing. The system
primarily finds external cracks in joint bars, and under good track conditions, can detect joints
with 98% accuracy and cracks with 80% accuracy. However, under non-ideal track conditions,
especially when the rail is wet, the joint detection accuracy rate declines to 85%, and false-
positive crack detections increase, although half of the false crack detections are due to the
34
increase in false joint detections. The system currently in use requires manual interpretation to
determine true joint condition. ENSCO is continuing to work on improvements to their
algorithms to increase the crack detection rate without also increasing false positives. Planned
enhancements to this system include the capability to detect missing bolts and rail batter, and to
measure rail-gap width.
5.2.4.2 Elastic rail clips
The National Taiwan University of Science and Technology, in cooperation with the
Taiwan Ministry of Transportation and Communications, is developing a machine-vision system
to inspect elastic rail clips (Hsieh et al., 2007). This system is capable of inspecting the German
VOSSLOH clip, which is the most prevalent type of fastener in use on Taiwanese rapid transit
lines. The system uses area-scan cameras with a resolution of 640x480 pixels. It can accurately
detect clips on concrete or ballasted track with 77% accuracy, and it can inspect these clips to
determine if they are broken. Future work includes improving the lighting system and image
processing algorithms, and inspection of the bolts that secure the elastic rail clips.
5.2.4.3 Rail and track
A variety of machine-vision systems have been developed to inspect rail and track,
including systems from the University of Central Florida, Georgetown Rail Equipment Company
and MER MEC. The University of Central Florida, in association with the Florida Department
of Transportation, is developing a machine-vision system to inspect for surface cracks in the rail,
missing or misaligned tie plates, the presence of fasteners, and improper gauge (Sullivan, n.d.).
Initially, they used a small, self-propelled track cart to gather video data and are now adapting
the system for use on a high-rail vehicle. A downward-facing, high frame-rate, 640x480

35
resolution, area-scan camera is used in combination with strobe lights, lasers, and sun shields to
gather the video data. Images are recorded approximately every 1.5 feet, with the exact interval
determined using a Global Positioning System (GPS) receiver.
Georgetown Rail has developed their Aurora system to inspect wood and concrete ties for
items such as rail seat abrasion, the presence of fasteners, and improper gauge (Georgetown Rail
Equipment Company, n.d.). This system is mounted on a high-rail vehicle and can be operated
at speeds of up to 30 mph (48 km/hr). Wood tie inspection includes determination of the size,
length, and location of cracks in the tie, as well as an estimation of tie “roughness” and a
measurement of vertical plate cutting. Fastener detection can recognize and catalog cut spikes as
well as Pandrol E-clips, Fast Clips and Safelock clips with 85%-90% accuracy.
MER MEC has developed a track inspection system, known as the “Track Surface
Detection System” that uses line-scan cameras and has three separate modules that can be
installed to detect different track defects (MER MEC, n.d.). MER MEC states that the system
can be installed on any track vehicle and will function properly at speeds up to 160 km/hr (99
mph). With all three modules installed, the system can detect tie type and movement, inspect
and classify rail fastenings and surface defects, measure rail gap, check for ballast irregularities
and vegetation, determine tie plate condition, and determine the structural condition of several
pieces of on-track equipment (e.g. transponders for the European Train Control System).
5.2.4.4 Wheel and rail profile
Wheel and/or rail profile measurement systems are offered by several companies
including ENSCO and Beena Vision (ENSCO Inc., n.d.a; Beena Vision, n.d.). Profile
measurement systems operate by projecting a line of light from a laser onto the wheel or the rail
36
to outline it, and using cameras to record this outline to determine the profile. Most rail-profile
systems also have the ability to measure gauge as well as rail profile information. Wheel-profile
systems are generally designed for use in the shop, where a single stationary laser and camera are
sufficient for recording the entire profile of a wheel. This is in contrast to more expensive track-
based systems for recording the entire wheel profile that need either a set of moving lasers and
cameras or an entire array of stationary cameras and lasers.
5.2.4.5 Air hoses and coupler height
Progressive Rail Technologies (PRT) has developed a system that detects low-hanging
air hoses and coupler height mismatches (Progressive Rail Technologies, 2008). It uses a single
wayside camera enclosure, and has the ability to distinguish between air hoses and auxiliary
hoses to minimize false alarms. ENSCO has also developed a system to detect low-hanging and
worn air hoses (ENSCO Inc., n.d.b). There are two major elements to this system, the first is an
above-grade, wayside phototransistor array that detects both the presence and height of air hoses.
The second element is a below-grade imaging system with an upward view for detection of
damage marks and excessive wear on hoses.
5.2.4.6 Wheel and journal bearing temperature
Several systems have been developed to measure the temperature of wheels and journal
bearings. Those that are machine-vision-based use infrared cameras (Lagnebäck, 2007). The
video taken from these cameras is analyzed to determine the temperature of wheels or journals
and bearings. Wheels that are too cold relative to other wheels on the car indicate poor brake
performance. Wheels that are too hot indicate a locked-up wheel caused by a stuck brake.
Locked wheels are detected by determining if the heat distribution across the edge of the wheel is
37
relatively uniform, indicative of normal braking, or if it is concentrated at the wheel/rail interface,
suggesting a sliding wheel, which is indicative of a locked brake. As for journal bearings, the
concern is if they are overheating, as this is symptomatic of bearing failure, which can cause a
derailment.
5.2.4.7 Railcar performance
Wayside Inspection Devices Inc. developed a wayside machine-vision and laser-based
system to measure the angle of attack of the wheels and to track their position in relation to the
rail (Lagnebäck, 2007). This is accomplished by projecting a line of dots using a laser onto the
side of the wheel, and analyzing the profile recorded by the camera. If multiple systems are used
to measure several wheels simultaneously, they have the ability to detect hunting.
5.2.4.8 University of Illinois machine-vision systems
The University of Illinois at Urbana-Champaign (UIUC) has been involved in several
railroad machine-vision projects sponsored by the Association of American Railroads (AAR),
BNSF Railway, the Transportation Research Board High-Speed Rail IDEA Program, and
NEXTRANS. A number of the concepts, algorithms, and hardware systems from these projects
are being adapted for the track inspection project, and this section will serve to review previous
work.
The first UIUC machine-vision project involved the development of a system to
determine the condition of several components on railcar trucks (Hart et al., 2004). This system
has the ability to locate the brakes, bearings, and spring set. Images of railcar trucks were taken
using a view that was perpendicular to the cars and encompassed half of the truck. Several
38
algorithms were developed that could identify the wheel, the angle of compression of the spring
set, and the presence or absence of the bearing end-cap bolts.
The next UIUC project was about developing a system to inspect safety appliances on
railcars, such as ladder rungs, handholds, and brake wheels (Edwards, 2006; Edwards et al.,
2007). An area-scan camera was placed alongside the track and was used to record images of
cars passing by at up to 25 mph (40 km/hr) at 30 frames per second. A virtual model of an open-
top hopper car was used to train the algorithms. Use of the virtual model provided a large
quantity and variety of simulated safety appliance defects, thereby enabling more rapid training
of the algorithms. Data were also gathered in the field, with video taken under differing natural
and artificial lighting conditions. The algorithms that were developed could identify deformed
ladder rungs, handholds, and brake wheels; preliminary work on identifying sill steps and
uncoupling levers was also completed.
UIUC researchers then developed a system that uses visible and infrared cameras to
enable multi-spectral, machine-vision inspection of passenger car undercarriages (Hart et al.,
2008; Schlake et al., 2009). The system focused on detection of overheated, missing, or
damaged components, and foreign objects. Both the visible and infrared spectrum cameras were
area-scan cameras. These cameras were placed below rail level, between the rails in inspection
pits, and video was recorded as trains passed overhead. The videos were then separated into
individual frames that were used to create panoramic images of the undercarriage in both spectra.
Machine-vision algorithms were then used to process the train panoramas to separate them into
individual car and locomotive panoramas through identification of the couplers. Each vehicle
was analyzed to detect visible and thermal anomalies, which include incipient failures not
normally detected during manual inspections. This project was built upon for a later project
39
sponsored by the AAR in which the visual spectrum aspect of this project was applied to the
inspection of the structural components of railroad freight cars (Schlake et al., 2010).
A current project involves using machine vision to monitor the aerodynamic efficiency of
intermodal train loading (Lai et al., 2007). As with the undercarriage inspection, a panoramic
image is used to analyze the train, but in this case, it is necessary to first separate the train from
the background in the images. This posed a significant challenge due to the dynamic nature of
the natural background, with problems arising from such things as flying birds, moving clouds,
and locomotive exhaust. Once the background is successfully removed, algorithms are used to
determine the length of the gaps between the intermodal loads in trains. The system
automatically records trains passing at up to 70 mph (113 km/hr) and provides information to the
railroad that allows them to assess the aerodynamic properties of the train to determine if the
loading pattern could be improved to enhance energy efficiency.
5.3 INSPECTION FREQUENCY LEVELS
There are three main levels of vehicles and rolling stock that inspection technologies are
implemented on, and these are defined by their inspection frequency. The first level consists of
geometry cars, which provide track geometry information for the railroads. The FRA does not
specify an inspection frequency for geometry cars on track classes lower than class 7, so these
cars inspect track as necessary on the order of once or twice per year, depending on tonnage and
other factors. There are a relatively small number of these cars, allowing the technologies
implemented on them to be very specialized and expensive, with cars often incorporating
additional technologies to measure items such as ride quality, rail profile and track gauge
restraint. The high level of technical sophistication of the geometry car leads to an operating
40
crew that is technically proficient in order to maintain and troubleshoot the inspection hardware
and software. The low inspection frequency of the geometry car is not conducive to trending the
deterioration of the components of interest, making it the least ideal platform for both system
development and final implementation.
The next inspection frequency level includes defect detector cars. These cars perform
internal rail flaw detection, typically using ultrasonic testing. These cars are operated on the
basis of tonnage, so their inspection frequency varies widely. The FRA mandates that
inspections for internal rail flaws on FRA class 4 and 5 track are conducted either every 40 MGT
or once a year, whichever is shorter. Generally, rail defect detector cars are operated more often
than geometry cars, with an average inspection frequency of once per month for FRA class 4 and
5 track according to one Class I railroad. The training necessary to interpret ultrasonic data and
maintain the inspection equipment leads to these cars being staffed by personnel with a high
level of technical proficiency. This inspection level is the most likely candidate for an initial
field implementation of this system due to a relatively high inspection frequency and a crew that
would be more accustomed to handling advanced inspection equipment, especially during its
developmental phases.
Finally, the last and most frequent level of inspections are conducted using high-rail
vehicles. These have the advantage of running the most frequently: twice per week for class 4
and 5 tracks as required by the FRA. These vehicles are occasionally equipped with advanced
inspection systems, such as ENSCO’s joint bar inspection system, but are primarily used to allow
a track inspector to visually inspect the track and its components. High-rail vehicles are staffed
with crew members that are well-trained for their specific duties, but in general are not as
technologically proficient as those that operate geometry cars and rail defect detector cars.

41
Ultimately, the intention to implement UIUC’s machine-vision track inspection system on a
high-rail vehicle, so both ease of use and ease of maintenance must be considered during the
development of the inspection system.

42
CHAPTER 6: IMAGE ACQUISITION SYSTEM
Machine-vision inspection systems are typically divided into three sub-systems: the
image acquisition system, the image analysis system, and the data analysis system. In this
chapter, I discuss the work that has been done in the development and implementation of the
image acquisition system used to obtain field data for this project. This system was developed in
collaboration with researchers from both the Railroad Engineering Program and the Computer
Vision and Robotics Laboratory (CVRL).
6.1 OVERVIEW OF COMPONENTS
The image acquisition system consists of the cameras, computer, power source, recording
platform and lighting system. The camera and computer directly affect the feasible data
collection speeds and image resolutions. The power source must be mobile and provide
continuous and steady power during data collection. The recording platform must be stable and
operable at a controlled speed for consistent data collection. The lighting system must allow
consistent image acquisition in a wide variety of natural lighting and environmental conditions to
ensure that the algorithms can accurately identify and process track components in the images.
Finally, the outdoor, moving environment requires that all these system components be resistant
to dust, precipitation, and vibration.
6.2 CAMERA CONSIDERATIONS
6.2.1 Placement
The most important consideration in the development of the image acquisition system
was camera placement. Cameras must be placed to provide optimal views for the machine-
vision algorithms to consistently and reliably detect the components of interest. To expedite the
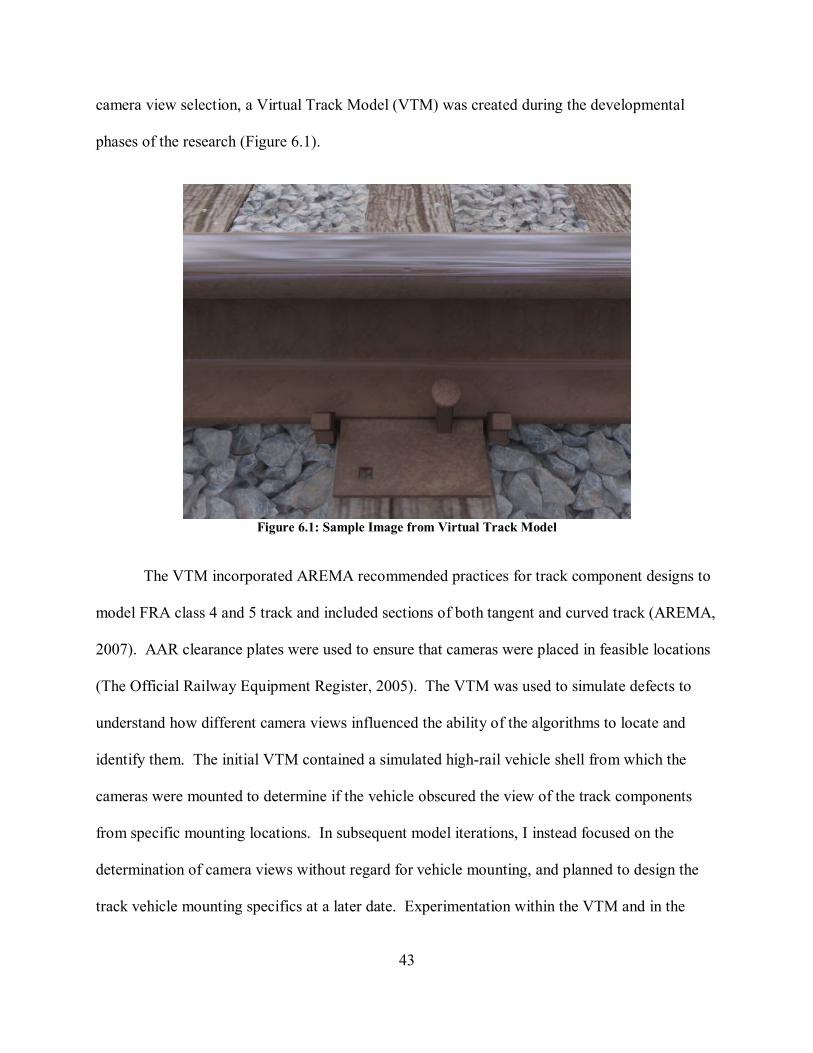
43
camera view selection, a Virtual Track Model (VTM) was created during the developmental
phases of the research (Figure 6.1).
Figure 6.1: Sample Image from Virtual Track Model
The VTM incorporated AREMA recommended practices for track component designs to
model FRA class 4 and 5 track and included sections of both tangent and curved track (AREMA,
2007). AAR clearance plates were used to ensure that cameras were placed in feasible locations
(The Official Railway Equipment Register, 2005). The VTM was used to simulate defects to
understand how different camera views influenced the ability of the algorithms to locate and
identify them. The initial VTM contained a simulated high-rail vehicle shell from which the
cameras were mounted to determine if the vehicle obscured the view of the track components
from specific mounting locations. In subsequent model iterations, I instead focused on the
determination of camera views without regard for vehicle mounting, and planned to design the
track vehicle mounting specifics at a later date. Experimentation within the VTM and in the
44
field resulted in the selection of three initial camera views: the ballast view, the raised spikes
view, and the lateral view.
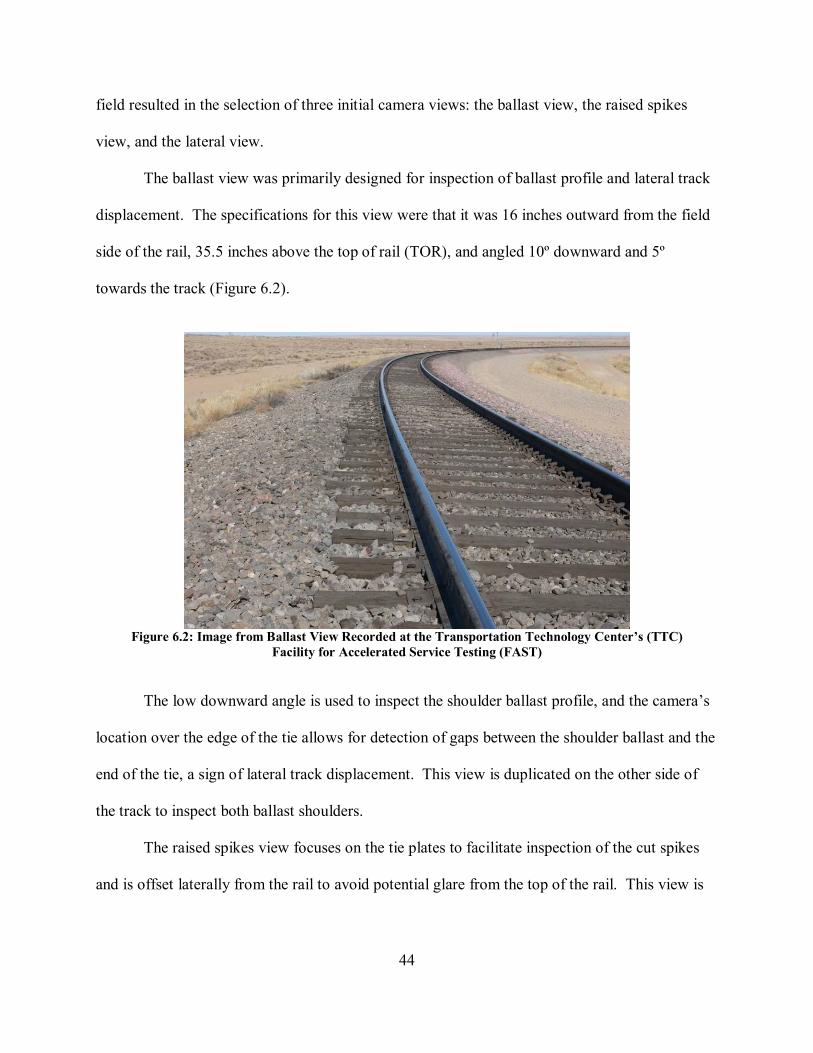
The ballast view was primarily designed for inspection of ballast profile and lateral track
displacement. The specifications for this view were that it was 16 inches outward from the field
side of the rail, 35.5 inches above the top of rail (TOR), and angled 10º downward and 5º
towards the track (Figure 6.2).
Figure 6.2: Image from Ballast View Recorded at the Transportation Technology Center’s (TTC)
Facility for Accelerated Service Testing (FAST)
The low downward angle is used to inspect the shoulder ballast profile, and the camera’s
location over the edge of the tie allows for detection of gaps between the shoulder ballast and the
end of the tie, a sign of lateral track displacement. This view is duplicated on the other side of
the track to inspect both ballast shoulders.
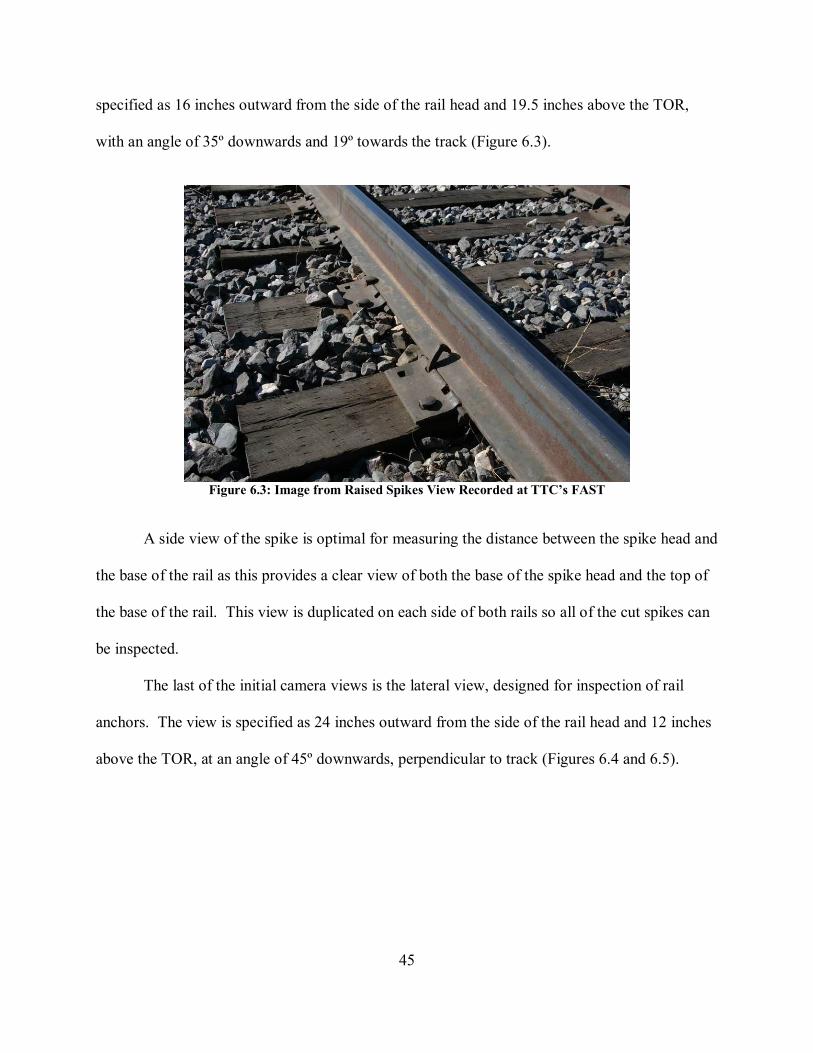
The raised spikes view focuses on the tie plates to facilitate inspection of the cut spikes
and is offset laterally from the rail to avoid potential glare from the top of the rail. This view is
45
specified as 16 inches outward from the side of the rail head and 19.5 inches above the TOR,
with an angle of 35º downwards and 19º towards the track (Figure 6.3).
Figure 6.3: Image from Raised Spikes View Recorded at TTC’s FAST
A side view of the spike is optimal for measuring the distance between the spike head and
the base of the rail as this provides a clear view of both the base of the spike head and the top of
the base of the rail. This view is duplicated on each side of both rails so all of the cut spikes can
be inspected.
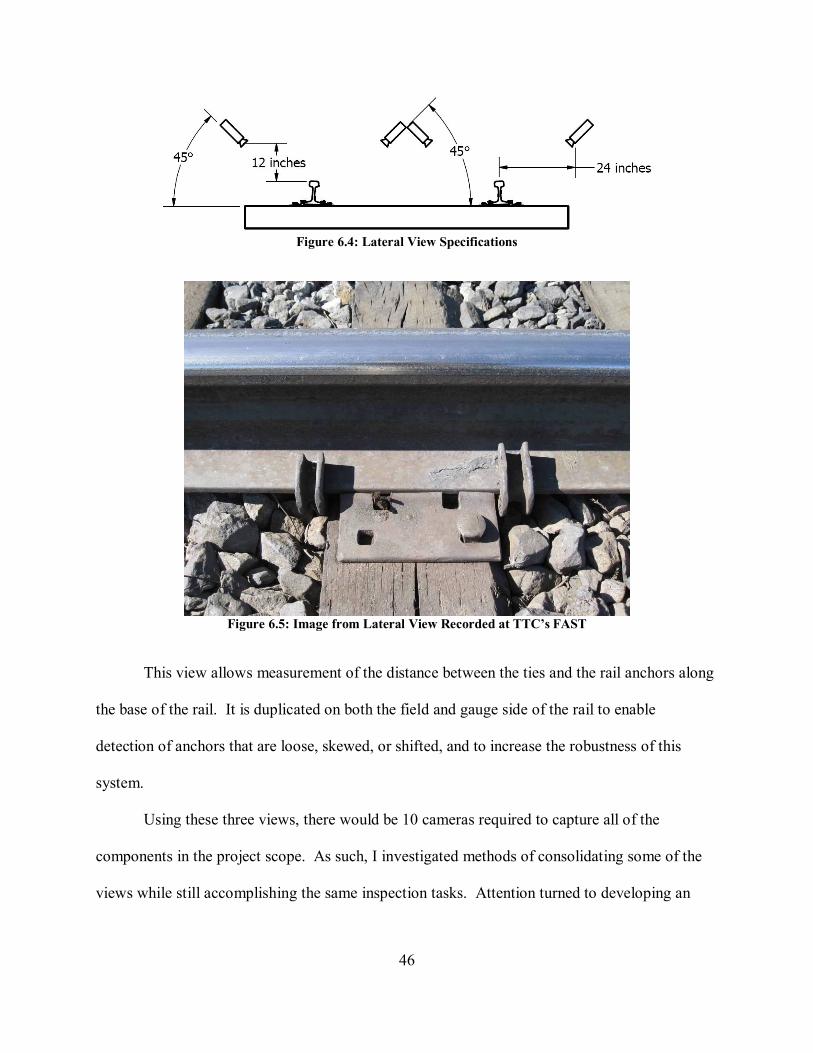
The last of the initial camera views is the lateral view, designed for inspection of rail
anchors. The view is specified as 24 inches outward from the side of the rail head and 12 inches
above the TOR, at an angle of 45º downwards, perpendicular to track (Figures 6.4 and 6.5).
46
Figure 6.4: Lateral View Specifications
Figure 6.5: Image from Lateral View Recorded at TTC’s FAST
This view allows measurement of the distance between the ties and the rail anchors along
the base of the rail. It is duplicated on both the field and gauge side of the rail to enable
detection of anchors that are loose, skewed, or shifted, and to increase the robustness of this
system.
Using these three views, there would be 10 cameras required to capture all of the
components in the project scope. As such, I investigated methods of consolidating some of the
views while still accomplishing the same inspection tasks. Attention turned to developing an
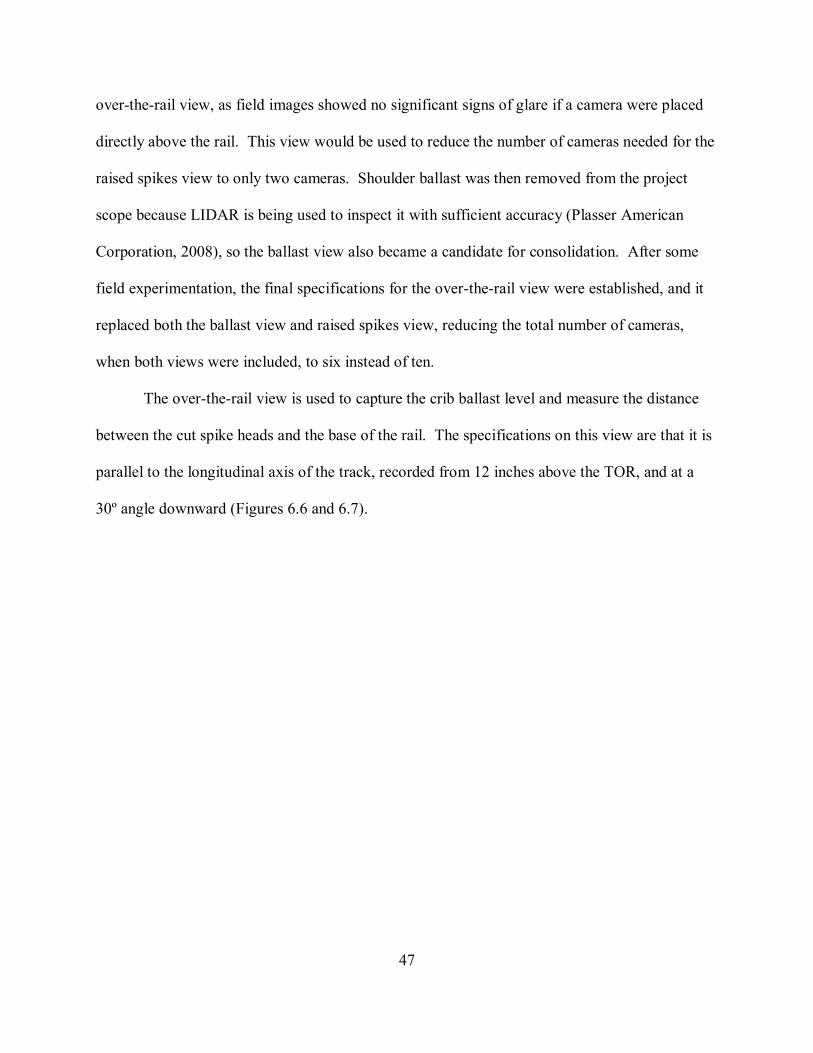
47
over-the-rail view, as field images showed no significant signs of glare if a camera were placed
directly above the rail. This view would be used to reduce the number of cameras needed for the
raised spikes view to only two cameras. Shoulder ballast was then removed from the project
scope because LIDAR is being used to inspect it with sufficient accuracy (Plasser American
Corporation, 2008), so the ballast view also became a candidate for consolidation. After some
field experimentation, the final specifications for the over-the-rail view were established, and it
replaced both the ballast view and raised spikes view, reducing the total number of cameras,
when both views were included, to six instead of ten.
The over-the-rail view is used to capture the crib ballast level and measure the distance
between the cut spike heads and the base of the rail. The specifications on this view are that it is
parallel to the longitudinal axis of the track, recorded from 12 inches above the TOR, and at a
30º angle downward (Figures 6.6 and 6.7).
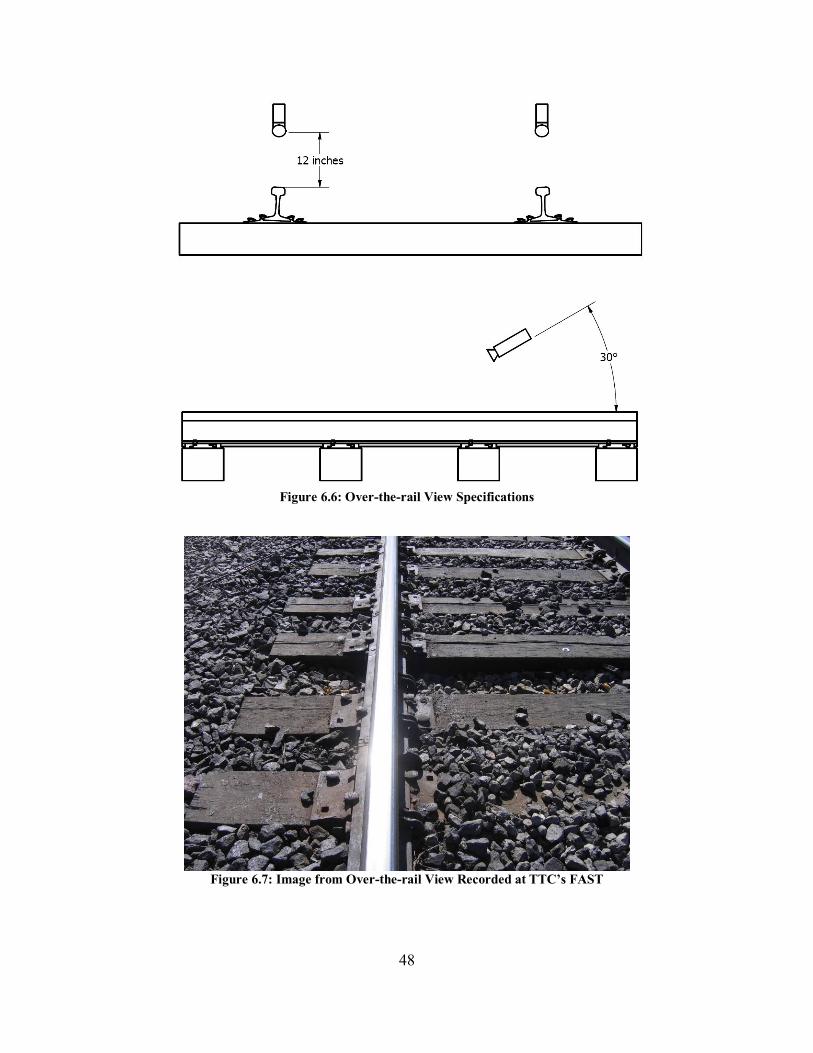
48
Figure 6.6: Over-the-rail View Specifications
Figure 6.7: Image from Over-the-rail View Recorded at TTC’s FAST
49
This view has a low downward angle to view both the distance between the spike heads
and the base of the rail, and the profile of the crib ballast. It also requires a camera over both
rails.
The final views in use for this phase of the project are the lateral view and the over-the-
rail view. Although the primary drivers for the selection of these views were the inspection of
ballast, anchors, and cut spikes, I also considered the capability of these views for inspection of
turnout components, such as the switch points and the frog.
6.2.2 Camera Specifications
The three major parameters that must be considered in determining the camera
specifications are frame rate, shutter speed, and image resolution. The values necessary for
frame rate and shutter speed are dependent on the inspection vehicle speed, but for initial
algorithm development at low speeds, a camera capable of 30 frames per second (fps), a shutter
speed of at least 1/500th of a second (field testing had shown this to be sufficient to prevent
motion blur at walking speed), and an image resolution of 640x480 pixels is sufficient. The
majority of the video data collection uses a Dragonfly2 DR2-COL camera. This camera has an
image resolution of 640x480 pixels and can record video at up to 60 fps with shutter speeds as
fast as 1/100,000th of a second (Point Grey Research, 2009).
Several factors were considered during lens selection, such as distance of the camera
from the subject, depth-of-field requirements, lens distortion, and viewable area. In the
developmental phases of this research, I used a focal length that could be approximated with
handheld cameras for circumstances when using the image acquisition system would be
impractical. I also considered that the cameras needed to be placed at a distance practical for
50
track vehicle mounting, while covering an acceptable viewing area. A large depth-of-field was
required for use in the over-the-rail view due to the varying distances of the components of
interest, and it was also important that the lens did not induce significant distortion. With these
considerations in mind, a 6 mm lens was selected.
6.3 COMPUTER CONSIDERATIONS AND RESULTING SPECIFICATIONS
Data are recorded in the field through a laptop computer. Many factors were considered
in the selection of this computer to ensure adequate performance while traveling along track in
the outdoor environment. The most important factor was the ability to record video without
losing any of the individual images that compose the video (e.g. frames). To ensure that the
hardware would not be the limiting factor in frame acquisition, the computer needed fast hard
drive access, while also fulfilling the manufacturer-recommended system requirements for the
camera. For the Dragonfly2 camera, the manufacturer’s recommended system requirements are:
Microsoft Windows XP SP1, 512 MB of RAM, and an Intel® Pentium 4 2.0 GHz or compatible
processor (Point Grey Research, 2009). In addition to that, I decided a high-performance, single-
level-cell, solid-state hard drive would be necessary as it provides reliability, low power
consumption, speed, and low access times in a moving environment. In contrast, standard hard
drives use magnetic platters, are not designed for high-vibration environments, and also suffer
from reduced performance when fragmented. A high-contrast screen is necessary for working in
bright outdoor environments, and a degree of ruggedness is required to reliably use the
equipment in a variety of field conditions. The laptop’s performance must not decrease
significantly when running on its own battery power, and the battery must last for two hours or
more while recording data.
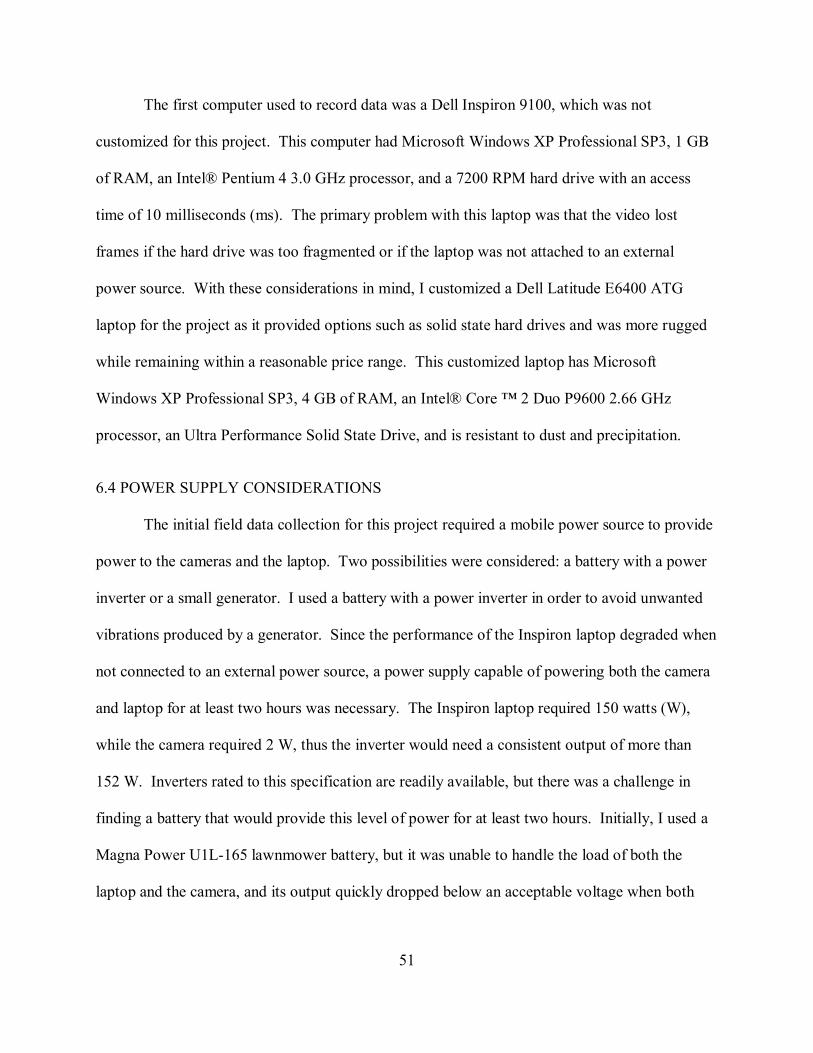
51
The first computer used to record data was a Dell Inspiron 9100, which was not
customized for this project. This computer had Microsoft Windows XP Professional SP3, 1 GB
of RAM, an Intel® Pentium 4 3.0 GHz processor, and a 7200 RPM hard drive with an access
time of 10 milliseconds (ms). The primary problem with this laptop was that the video lost
frames if the hard drive was too fragmented or if the laptop was not attached to an external
power source. With these considerations in mind, I customized a Dell Latitude E6400 ATG
laptop for the project as it provided options such as solid state hard drives and was more rugged
while remaining within a reasonable price range. This customized laptop has Microsoft
Windows XP Professional SP3, 4 GB of RAM, an Intel® Core ™ 2 Duo P9600 2.66 GHz
processor, an Ultra Performance Solid State Drive, and is resistant to dust and precipitation.
6.4 POWER SUPPLY CONSIDERATIONS
The initial field data collection for this project required a mobile power source to provide
power to the cameras and the laptop. Two possibilities were considered: a battery with a power
inverter or a small generator. I used a battery with a power inverter in order to avoid unwanted
vibrations produced by a generator. Since the performance of the Inspiron laptop degraded when
not connected to an external power source, a power supply capable of powering both the camera
and laptop for at least two hours was necessary. The Inspiron laptop required 150 watts (W),
while the camera required 2 W, thus the inverter would need a consistent output of more than
152 W. Inverters rated to this specification are readily available, but there was a challenge in
finding a battery that would provide this level of power for at least two hours. Initially, I used a
Magna Power U1L-165 lawnmower battery, but it was unable to handle the load of both the
laptop and the camera, and its output quickly dropped below an acceptable voltage when both
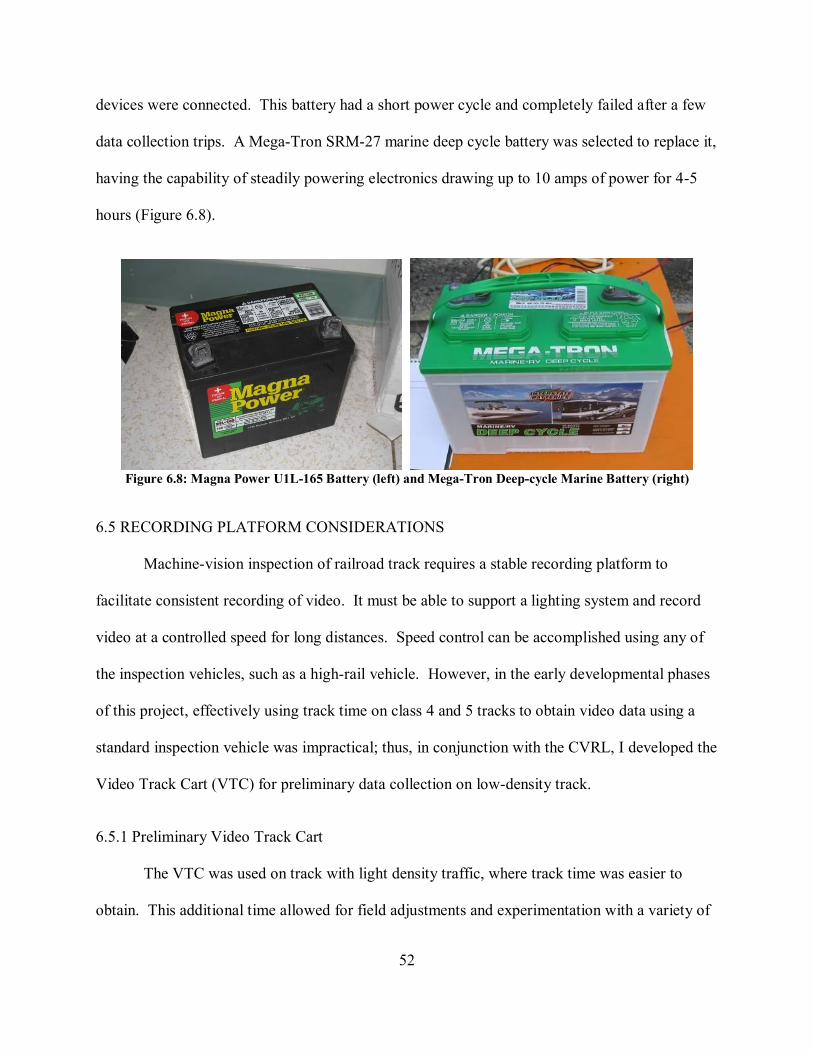
52
devices were connected. This battery had a short power cycle and completely failed after a few
data collection trips. A Mega-Tron SRM-27 marine deep cycle battery was selected to replace it,
having the capability of steadily powering electronics drawing up to 10 amps of power for 4-5
hours (Figure 6.8).
Figure 6.8: Magna Power U1L-165 Battery (left) and Mega-Tron Deep-cycle Marine Battery (right)
6.5 RECORDING PLATFORM CONSIDERATIONS
Machine-vision inspection of railroad track requires a stable recording platform to
facilitate consistent recording of video. It must be able to support a lighting system and record
video at a controlled speed for long distances. Speed control can be accomplished using any of
the inspection vehicles, such as a high-rail vehicle. However, in the early developmental phases
of this project, effectively using track time on class 4 and 5 tracks to obtain video data using a
standard inspection vehicle was impractical; thus, in conjunction with the CVRL, I developed the
Video Track Cart (VTC) for preliminary data collection on low-density track.
6.5.1 Preliminary Video Track Cart
The VTC was used on track with light density traffic, where track time was easier to
obtain. This additional time allowed for field adjustments and experimentation with a variety of
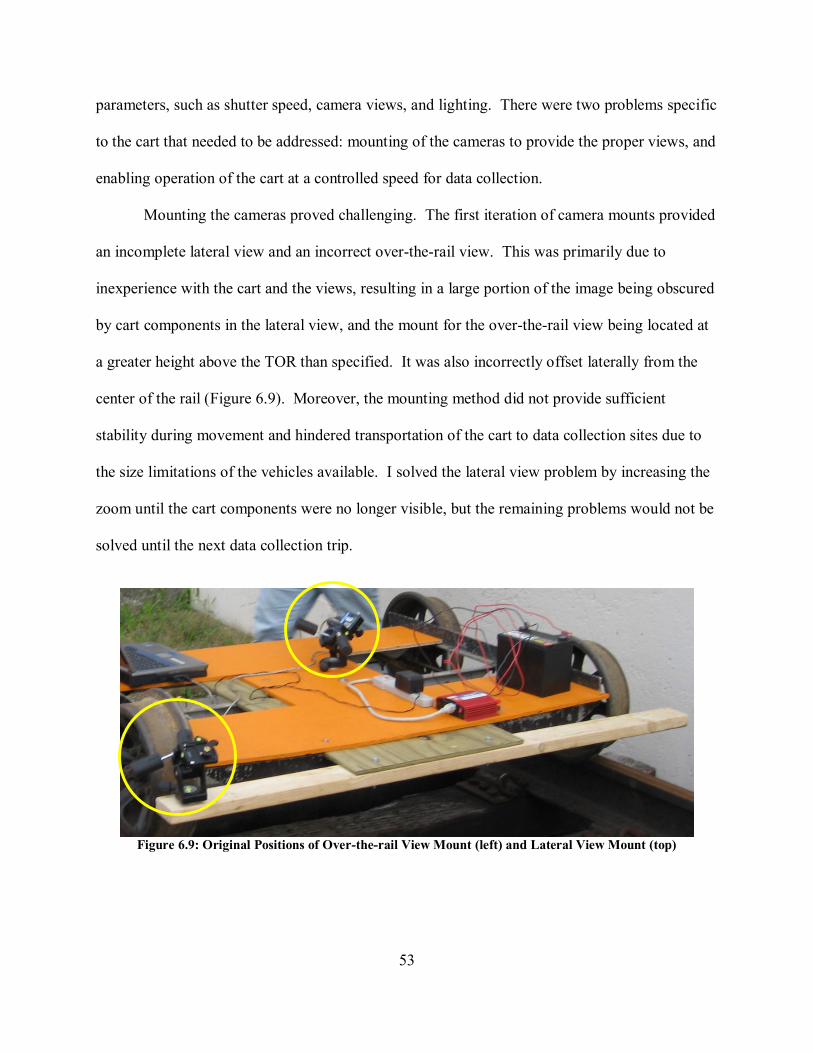
53
parameters, such as shutter speed, camera views, and lighting. There were two problems specific
to the cart that needed to be addressed: mounting of the cameras to provide the proper views, and
enabling operation of the cart at a controlled speed for data collection.
Mounting the cameras proved challenging. The first iteration of camera mounts provided
an incomplete lateral view and an incorrect over-the-rail view. This was primarily due to
inexperience with the cart and the views, resulting in a large portion of the image being obscured
by cart components in the lateral view, and the mount for the over-the-rail view being located at
a greater height above the TOR than specified. It was also incorrectly offset laterally from the
center of the rail (Figure 6.9). Moreover, the mounting method did not provide sufficient
stability during movement and hindered transportation of the cart to data collection sites due to
the size limitations of the vehicles available. I solved the lateral view problem by increasing the
zoom until the cart components were no longer visible, but the remaining problems would not be
solved until the next data collection trip.
Figure 6.9: Original Positions of Over-the-rail View Mount (left) and Lateral View Mount (top)
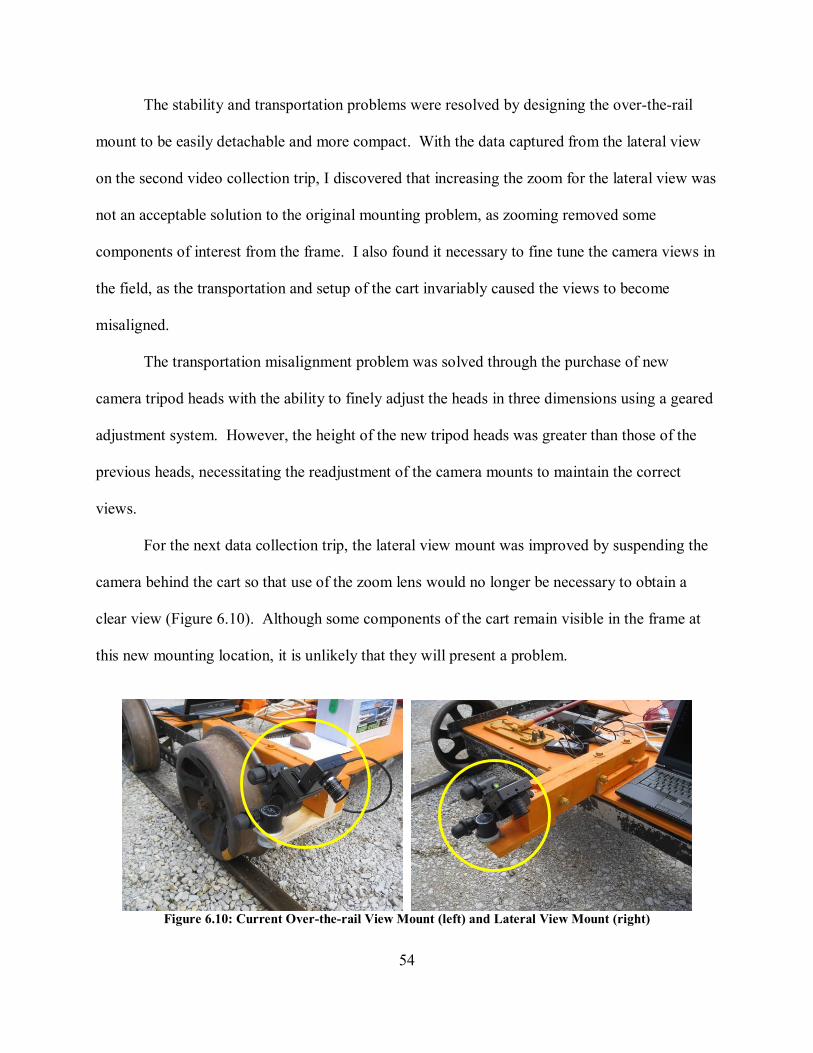
54
The stability and transportation problems were resolved by designing the over-the-rail
mount to be easily detachable and more compact. With the data captured from the lateral view
on the second video collection trip, I discovered that increasing the zoom for the lateral view was
not an acceptable solution to the original mounting problem, as zooming removed some
components of interest from the frame. I also found it necessary to fine tune the camera views in
the field, as the transportation and setup of the cart invariably caused the views to become
misaligned.
The transportation misalignment problem was solved through the purchase of new
camera tripod heads with the ability to finely adjust the heads in three dimensions using a geared
adjustment system. However, the height of the new tripod heads was greater than those of the
previous heads, necessitating the readjustment of the camera mounts to maintain the correct
views.
For the next data collection trip, the lateral view mount was improved by suspending the
camera behind the cart so that use of the zoom lens would no longer be necessary to obtain a
clear view (Figure 6.10). Although some components of the cart remain visible in the frame at
this new mounting location, it is unlikely that they will present a problem.
Figure 6.10: Current Over-the-rail View Mount (left) and Lateral View Mount (right)
55
The problem of providing a controlled data collection speed was solved by attaching a
cylindrical rod on a ball joint to the cart. This provided a firm attachment to the cart that
improved control of the VTC’s speed. Even so, there were still challenges in maintaining a
steady speed, and the system is impractical for data collection over long distances. If the need
should arise to overcome these problems before a track-vehicle-mounted system is developed, an
electric motor may be added to drive the wheels of the cart.
6.5.2 Future System Implementation
Future implementations of this system will be on track inspection vehicles such as defect
detector cars and high-rail vehicles. These vehicles travel at faster speeds than the VTC and are
thus subject to additional considerations. The higher speeds lead to the system components
being subject to greater shock and vibration due to irregularities and transitions in the track. The
system components must be protected by either ensuring that these impacts are dampened, or by
filling the voids inside the components with a non-conductive solid compound to prevent
dislocation of the internal components. All the views would be securely mounted, and speed
control would be provided by the inspection vehicle itself.
6.6 LIGHTING CONSIDERATIONS
The experiences gained from this machine-vision project and others at UIUC (Chapter 5),
as well as input from other machine-vision system developers, have shown that lighting typically
presents a formidable challenge in system development. The lighting system must provide
illumination that allows the cameras to capture consistent images. This is complicated by the
variable outdoor environment, where there are changing light intensities, shifting shadows, and
weather conditions such as rain and snow that alter how light is reflected. Moreover, the use of
56
area-scan cameras in this system, along with views that record large areas of track, add further
challenges, as these large areas must be lighted uniformly and with sufficient intensity. The
problem of lighting is unique to each system’s characteristics, and has been addressed using
different techniques in machine-vision systems developed at UIUC and elsewhere. Specifically,
lighting experience for this project can be gained by studying and adapting the work of other
vehicle-mounted machine-vision inspection systems, as these most closely resemble this system.
The inspection system developed by the University of Central Florida (UCF) uses a
camera system similar to UIUC’s and utilizes sun shields for lighting control. In the dimmed
environment provided by these shields, timed strobe lights and lasers are used to illuminate the
components of interest. The areas of interest in UIUC’s camera views are too large to be
accommodated by sun shields, thus the UCF lighting solution was infeasible. Moreover,
representatives from a machine-vision technology vendor indicated that sun shields are
ineffective and impractical for large-scale track inspection use due to the difficulties in
maintaining a consistently shielded environment across a variable track profile.
ENSCO’s joint bar inspection system initially used sun shields to help control lighting,
but these were discarded in favor of high-powered xenon lights. These lights only need to
illuminate the small area recorded by their line-scan cameras and typically work well regardless
of the state of the natural lighting due to their high-intensity. However, they must still overcome
difficulties presented by the different reflective properties of wet vs. dry rail, and the algorithms
are being modified to overcome these difficulties.
Georgetown Rail’s Aurora system uses laser profiling of the track to obtain the data
required for the 3D reconstruction of the track used in their analysis of track defects. The only
lighting necessary is the system of lasers used to outline the profile of the track structure. To

57
ensure that only the laser light is recorded, the cameras are equipped with light filters that filter
out all wavelengths other than that of the laser light. This has worked well under most track
conditions, but difficulties arise when inspecting areas with limestone ballast, as the wavelengths
of light produced by natural light reflecting off the ballast include the wavelength used for the
laser.
The lighting solutions vary greatly between each of the systems mentioned above due to
the needs imposed by their specific data collection methods and camera views. The system
being developed for this project has the unique feature of using area-scan cameras with views
that cover several square feet while requiring the lighting to sufficiently illuminate a large
portion of said area. As mentioned before, this large area would make implementation of sun
shields difficult, meaning that a new lighting solution would likely involve high-powered lights.
However, high-powered lights alone may not be sufficient to eliminate problems due to natural
lighting, so light filters might also be implemented to increase system robustness. Further
development of the machine-vision algorithms might reveal that, based on our image analysis
techniques, only certain portions of the views must be well illuminated, perhaps leading to a
simpler illumination system. This amalgamation of ideas from the other machine-vision systems
provides a starting point for the implementation of a lighting solution; field testing will be
necessary to further develop and refine the solution.
58
CHAPTER 7: DATA COLLECTION
Collecting visual data is necessary for developing robust machine-vision algorithms for
the inspection of railroad track. During initial data collection, I used handheld cameras to record
still images from the same camera views later to be used for video recording. Additionally, to
expedite algorithm development, video data were produced from the Virtual Track Model
(VTM) while the Video Track Cart (VTC) was used to provide the stable moving platform
necessary to record video data in the field. In this chapter I describe the objectives of the field
data collection trips, the information gained about the track structure and components, and the
refinement of the data collection methods based this information.
7.1 STILL IMAGES
7.1.1 Transportation Technology Center Visit #1
The first field data collection trip was on March 14, 2007 at the Facility for Accelerated
Service Testing (FAST) at the Transportation Technology Center (TTC) in Pueblo, Colorado. I
accompanied experienced track inspectors as they identified defects and their potential causes.
Substantial data were collected on concrete ties to identify possible machine-vision inspection
approaches for the detection of rail seat abrasion (RSA) (Figure 7.1). In addition to images of
concrete ties and their fastening systems, images of other track components and defects were
collected for consideration as future inspection tasks. The data gained on this trip provided an
initial look at the type of track (i.e. FRA class 4 and higher) that would typically be inspected by
this system after full development.
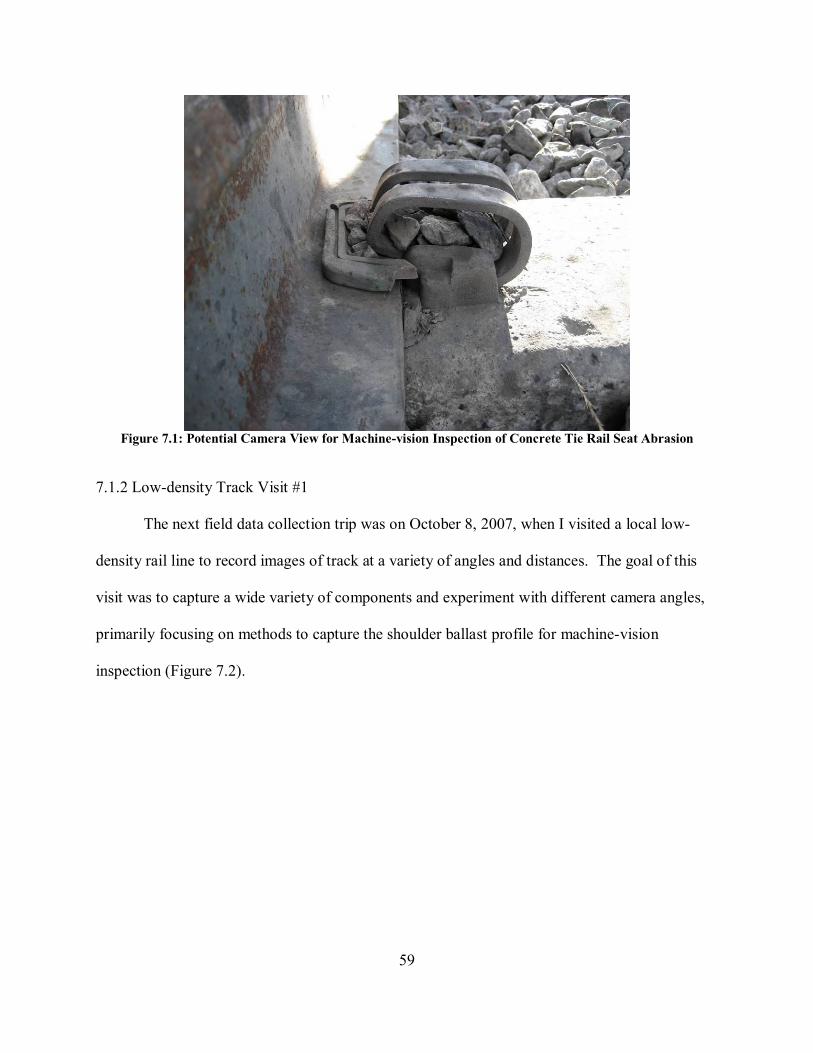
59
Figure 7.1: Potential Camera View for Machine-vision Inspection of Concrete Tie Rail Seat Abrasion
7.1.2 Low-density Track Visit #1
The next field data collection trip was on October 8, 2007, when I visited a local low-
density rail line to record images of track at a variety of angles and distances. The goal of this
visit was to capture a wide variety of components and experiment with different camera angles,
primarily focusing on methods to capture the shoulder ballast profile for machine-vision
inspection (Figure 7.2).
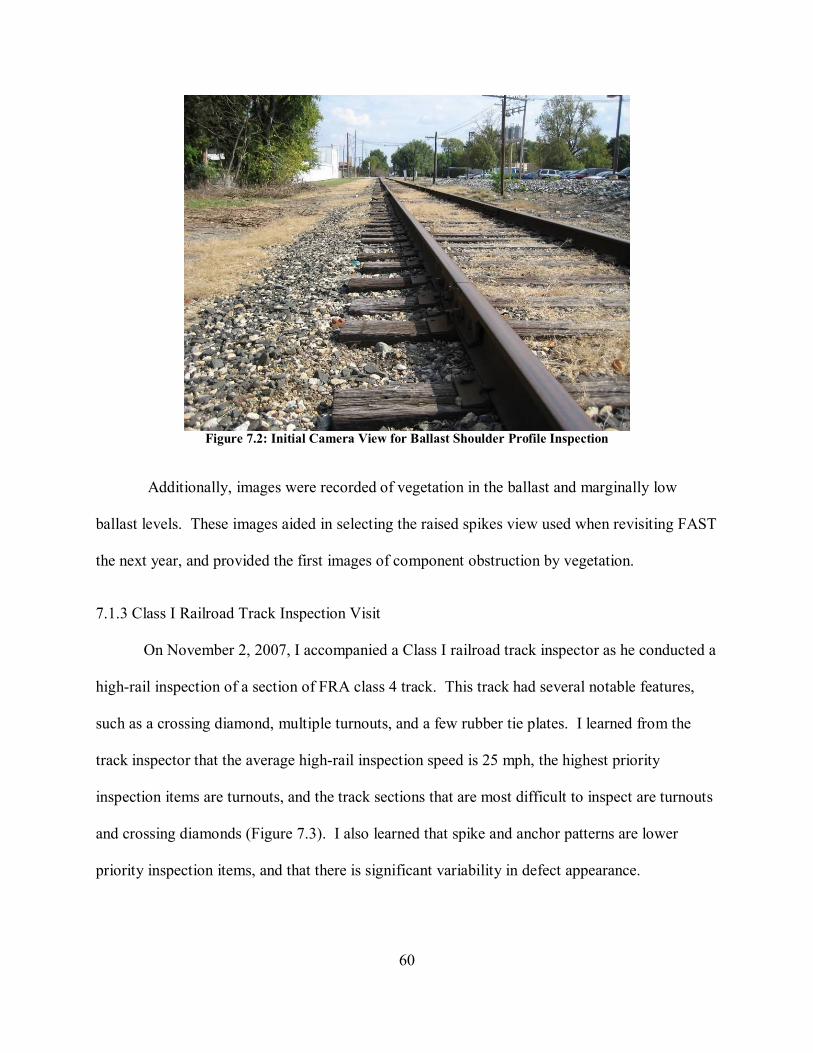
60
Figure 7.2: Initial Camera View for Ballast Shoulder Profile Inspection
Additionally, images were recorded of vegetation in the ballast and marginally low
ballast levels. These images aided in selecting the raised spikes view used when revisiting FAST
the next year, and provided the first images of component obstruction by vegetation.
7.1.3 Class I Railroad Track Inspection Visit
On November 2, 2007, I accompanied a Class I railroad track inspector as he conducted a
high-rail inspection of a section of FRA class 4 track. This track had several notable features,
such as a crossing diamond, multiple turnouts, and a few rubber tie plates. I learned from the
track inspector that the average high-rail inspection speed is 25 mph, the highest priority
inspection items are turnouts, and the track sections that are most difficult to inspect are turnouts
and crossing diamonds (Figure 7.3). I also learned that spike and anchor patterns are lower
priority inspection items, and that there is significant variability in defect appearance.
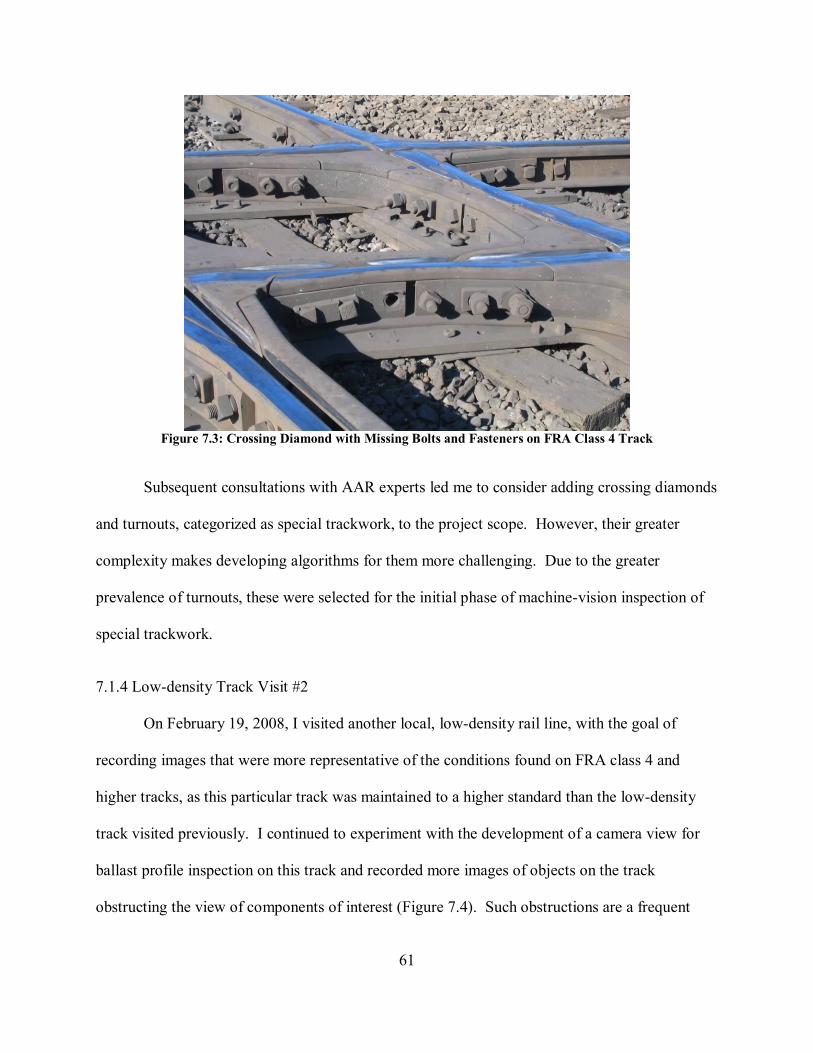
61
Figure 7.3: Crossing Diamond with Missing Bolts and Fasteners on FRA Class 4 Track
Subsequent consultations with AAR experts led me to consider adding crossing diamonds
and turnouts, categorized as special trackwork, to the project scope. However, their greater
complexity makes developing algorithms for them more challenging. Due to the greater
prevalence of turnouts, these were selected for the initial phase of machine-vision inspection of
special trackwork.
7.1.4 Low-density Track Visit #2
On February 19, 2008, I visited another local, low-density rail line, with the goal of
recording images that were more representative of the conditions found on FRA class 4 and
higher tracks, as this particular track was maintained to a higher standard than the low-density
track visited previously. I continued to experiment with the development of a camera view for
ballast profile inspection on this track and recorded more images of objects on the track
obstructing the view of components of interest (Figure 7.4). Such obstructions are a frequent
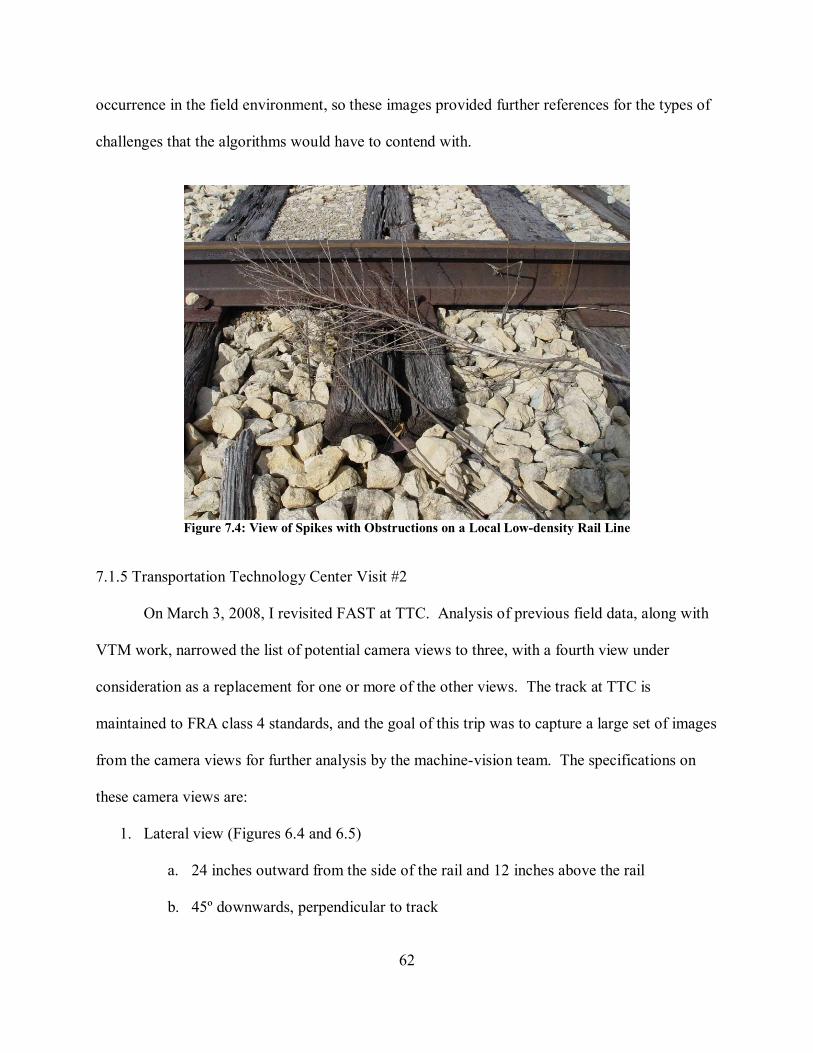
62
occurrence in the field environment, so these images provided further references for the types of
challenges that the algorithms would have to contend with.
Figure 7.4: View of Spikes with Obstructions on a Local Low-density Rail Line
7.1.5 Transportation Technology Center Visit #2
On March 3, 2008, I revisited FAST at TTC. Analysis of previous field data, along with
VTM work, narrowed the list of potential camera views to three, with a fourth view under
consideration as a replacement for one or more of the other views. The track at TTC is
maintained to FRA class 4 standards, and the goal of this trip was to capture a large set of images
from the camera views for further analysis by the machine-vision team. The specifications on
these camera views are:
1. Lateral view (Figures 6.4 and 6.5)
a. 24 inches outward from the side of the rail and 12 inches above the rail
b. 45º downwards, perpendicular to track
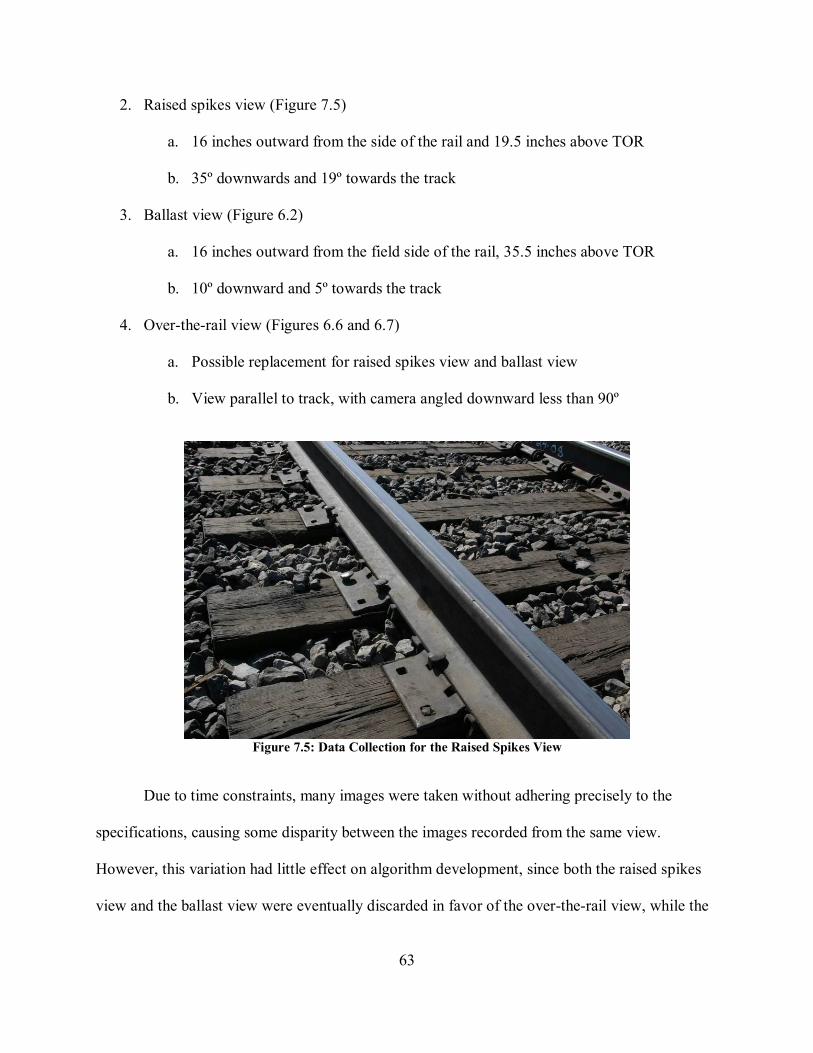
63
2. Raised spikes view (Figure 7.5)
a. 16 inches outward from the side of the rail and 19.5 inches above TOR
b. 35º downwards and 19º towards the track
3. Ballast view (Figure 6.2)
a. 16 inches outward from the field side of the rail, 35.5 inches above TOR
b. 10º downward and 5º towards the track
4. Over-the-rail view (Figures 6.6 and 6.7)
a. Possible replacement for raised spikes view and ballast view
b. View parallel to track, with camera angled downward less than 90º
Figure 7.5: Data Collection for the Raised Spikes View
Due to time constraints, many images were taken without adhering precisely to the
specifications, causing some disparity between the images recorded from the same view.
However, this variation had little effect on algorithm development, since both the raised spikes
view and the ballast view were eventually discarded in favor of the over-the-rail view, while the

64
data from the lateral view were recorded with a high level of consistency. A wide variety of
images were recorded from the over-the-rail view, and additional field experimentation to
finalize this view was performed on the next data collection trip. This data set was subject to
higher intensity lighting than previous data sets, illustrating the variability in component
appearance caused by lighting changes. It became evident that a robust lighting solution would
be necessary for a completed system to be functional in the field.
7.1.6 Low-density Track Visit #3
On May 30, 2008, I revisited the initial local low-density track for the purpose of
finalizing the specifications on the over-the-rail view. I experimented with the camera in a
position directly above the rail, and recorded images at various distances and angles in order to
obtain the optimal view for inspecting spike heights and determining crib ballast height across
the width of the crib (Figure 7.6). After consulting the machine-vision team with the results of
this experimentation, I determined the final specification of the over-the-rail view, which was
already discussed in Chapter 6.
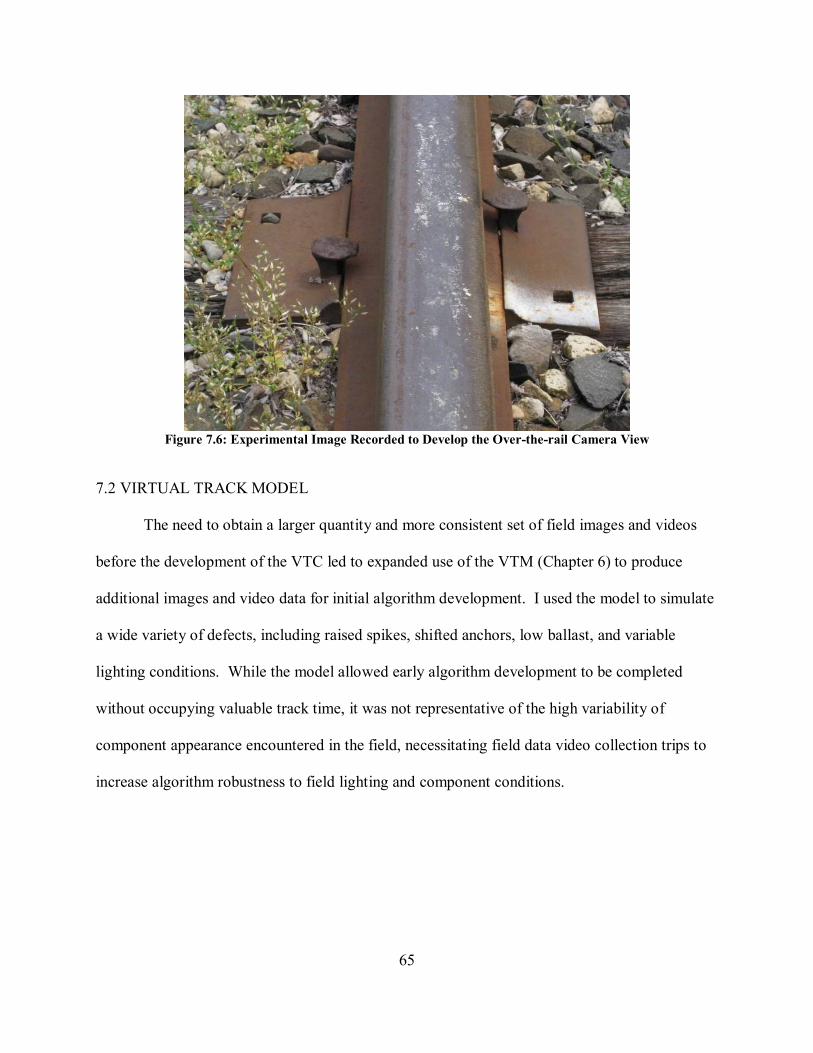
65
Figure 7.6: Experimental Image Recorded to Develop the Over-the-rail Camera View
7.2 VIRTUAL TRACK MODEL
The need to obtain a larger quantity and more consistent set of field images and videos
before the development of the VTC led to expanded use of the VTM (Chapter 6) to produce
additional images and video data for initial algorithm development. I used the model to simulate
a wide variety of defects, including raised spikes, shifted anchors, low ballast, and variable
lighting conditions. While the model allowed early algorithm development to be completed
without occupying valuable track time, it was not representative of the high variability of
component appearance encountered in the field, necessitating field data video collection trips to
increase algorithm robustness to field lighting and component conditions.
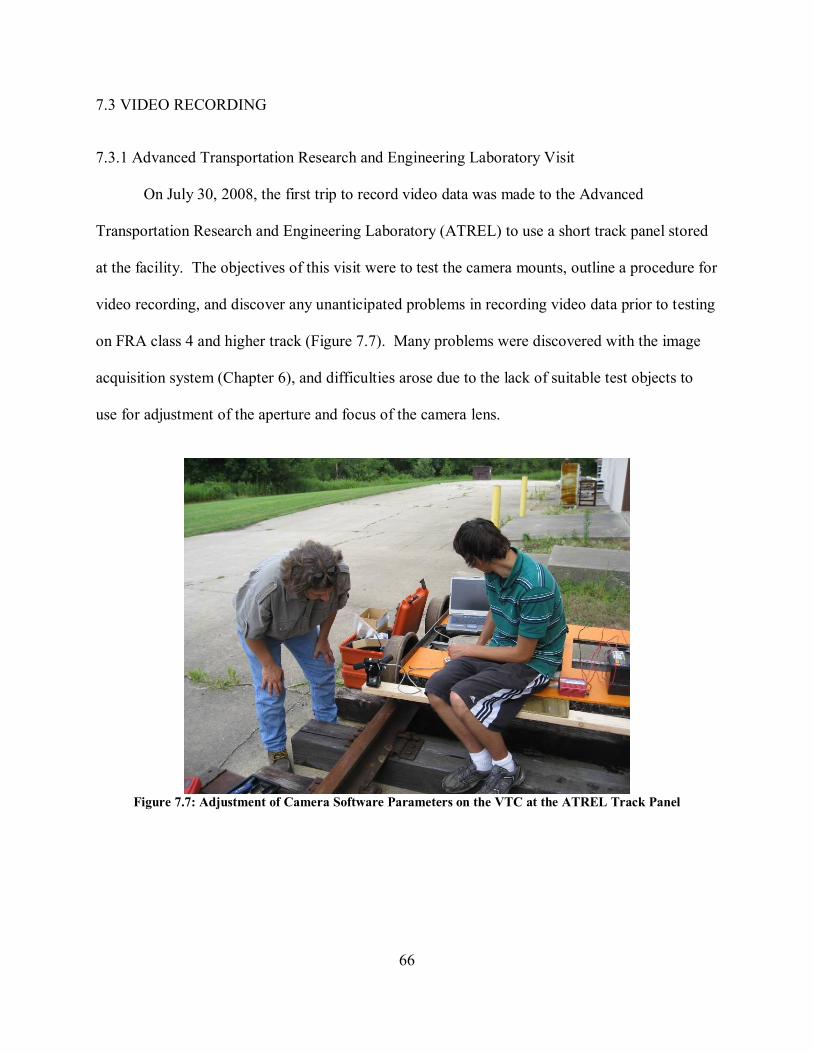
66
7.3 VIDEO RECORDING
7.3.1 Advanced Transportation Research and Engineering Laboratory Visit
On July 30, 2008, the first trip to record video data was made to the Advanced
Transportation Research and Engineering Laboratory (ATREL) to use a short track panel stored
at the facility. The objectives of this visit were to test the camera mounts, outline a procedure for
video recording, and discover any unanticipated problems in recording video data prior to testing
on FRA class 4 and higher track (Figure 7.7). Many problems were discovered with the image
acquisition system (Chapter 6), and difficulties arose due to the lack of suitable test objects to
use for adjustment of the aperture and focus of the camera lens.
Figure 7.7: Adjustment of Camera Software Parameters on the VTC at the ATREL Track Panel
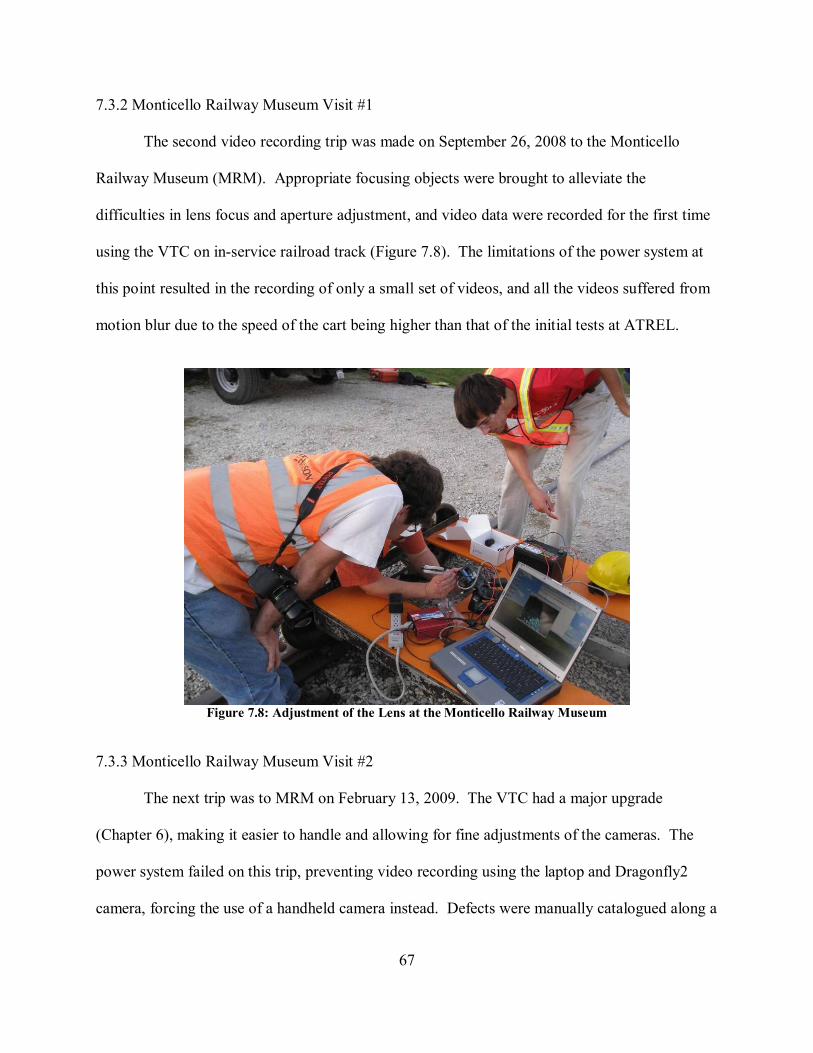
67
7.3.2 Monticello Railway Museum Visit #1
The second video recording trip was made on September 26, 2008 to the Monticello
Railway Museum (MRM). Appropriate focusing objects were brought to alleviate the
difficulties in lens focus and aperture adjustment, and video data were recorded for the first time
using the VTC on in-service railroad track (Figure 7.8). The limitations of the power system at
this point resulted in the recording of only a small set of videos, and all the videos suffered from
motion blur due to the speed of the cart being higher than that of the initial tests at ATREL.
Figure 7.8: Adjustment of the Lens at the Monticello Railway Museum
7.3.3 Monticello Railway Museum Visit #2
The next trip was to MRM on February 13, 2009. The VTC had a major upgrade
(Chapter 6), making it easier to handle and allowing for fine adjustments of the cameras. The
power system failed on this trip, preventing video recording using the laptop and Dragonfly2
camera, forcing the use of a handheld camera instead. Defects were manually catalogued along a
68
section of track for later use in algorithm verification, and I recorded digital videos of the track
using a handheld camera attached to the VTC. The handheld camera did not allow the setting of
the shutter speed, so some parts of the video data exhibit motion blur, which made those portions
unusable for algorithm development.
7.3.4 Monticello Railway Museum Visit #3
Having solved the hardware problems with the VTC since the last trip, another trip was
made to MRM on April 15, 2009 to record video data. However, though there were no hardware
problems, a software bug in the version of the video recording driver installed on the laptop
caused the capture program to freeze when adjusting the white balance at a frame rate of 30
frames per second (fps), requiring the computer to be restarted. To ensure that this bug would
not affect the data collection on this trip, all videos were recorded at 15 fps. The shutter speed
was fixed at 2.47 milliseconds to prevent motion blur, and there were minimal difficulties in
properly adjusting the lens focus and aperture. Cart speed was catalogued in terms of wheel
revolutions per second to provide for a consistent data collection speed (Figure 7.9). It was
found during the machine-vision analysis that the cart velocity was too high on this trip, meaning
that for the next trip, data would need to be collected at either a lower cart velocity, or a higher
frame rate.
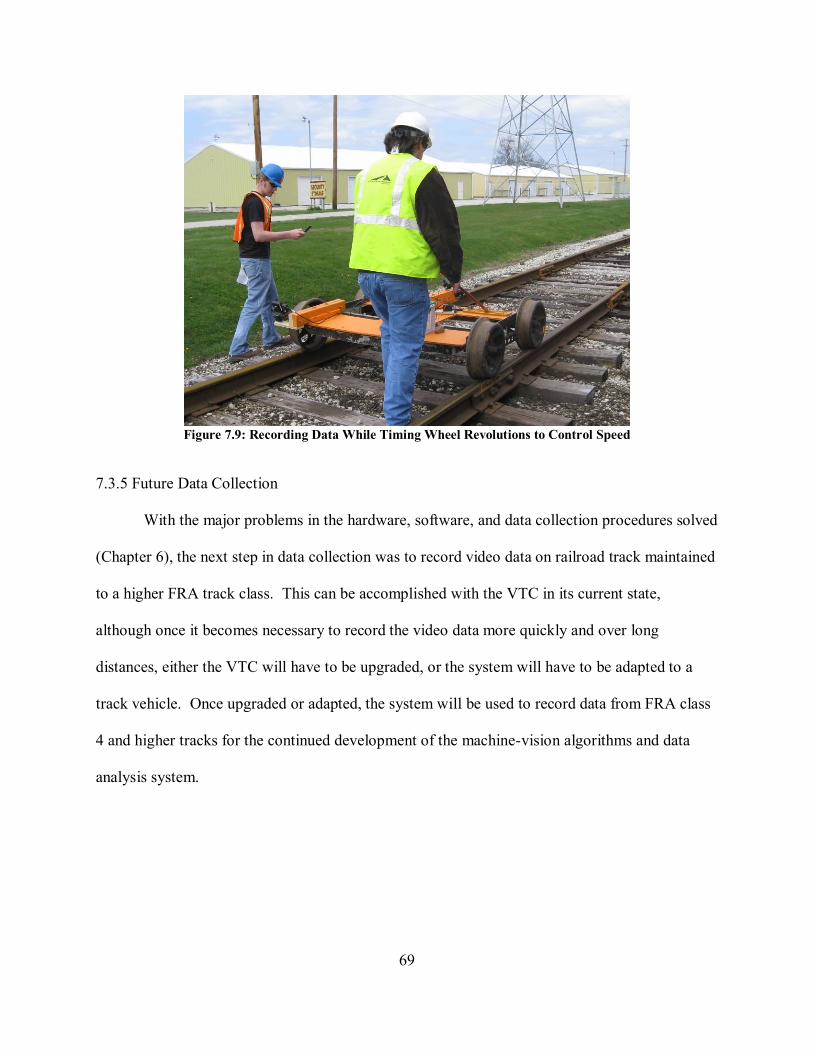
69
Figure 7.9: Recording Data While Timing Wheel Revolutions to Control Speed
7.3.5 Future Data Collection
With the major problems in the hardware, software, and data collection procedures solved
(Chapter 6), the next step in data collection was to record video data on railroad track maintained
to a higher FRA track class. This can be accomplished with the VTC in its current state,
although once it becomes necessary to record the video data more quickly and over long
distances, either the VTC will have to be upgraded, or the system will have to be adapted to a
track vehicle. Once upgraded or adapted, the system will be used to record data from FRA class
4 and higher tracks for the continued development of the machine-vision algorithms and data
analysis system.
70
CHAPTER 8: ALGORITHM DEVELOPMENT
The machine-vision algorithms for this project were developed in collaboration with
researchers from the Railroad Engineering Program and the Computer Vision and Robotics
Laboratory (CVRL). Initial algorithm development was completed by Sinisa Torovodic, and
subsequent algorithm development for the recognition of cut spikes and rail anchors was
completed by Esther Resendiz. In addition, as part of the UIUC Railroad Engineering Program, I
supplied railroad domain knowledge and field data to facilitate the development of machine-
vision technology for railway track inspection applications.
8.1 OVERVIEW
The algorithms developed in collaboration with the CVRL use a course-to-fine approach
for the detection of the components of interest (Resendiz, 2010). A course-to-fine approach
initially locates objects with minimal variability in appearance and predictable locations, fixing
them as reference points, and then locates objects that are subject to high appearance variability
in subsequent stages of the algorithm. To increase robustness to changing environmental
conditions and object appearance (e.g. differing types or material corrosion), the reference point
detection does not rely on a specific spatial template (e.g. component shape), but rather a
configuration of low-level (i.e. simple and local) features that are known to be valuable in
classification, such as edges. Spatial templates are used in the final algorithm stages for
component detection after search areas have been sufficiently narrowed. Later advances in the
algorithm development increased accuracy by adding Gabor features to the detection set to
delineate restricted search areas for certain components. Gabor filters produce low-level texture
features, enabling texture differentiation (Forsyth and Ponce, 2003).Within these restricted
71
search areas, a strong response to the spatial template is not required for component detection,
increasing the robustness of the algorithms.
8.2 TIE-BASED ALGORITHM
The initial algorithm developed for this track inspection application was tie-based,
meaning that the tie was used as the most reliably detected track component. The tie-based
approach was used due to the close proximity of each component of interest relative to the tie, as
the inspection items were cut spikes, rail anchors and the state of the ballast adjacent to the ties.
Edges were employed as low-level features used to detect the presence of the tie (Figure 8.1).
Edges are frequently used by machine-vision algorithms to detect objects since object boundaries
often generate sharp contrasts in brightness (Forsyth and Ponce, 2003). Next, spatial templates
were used to detect the presence of anchors and spikes. Deficiencies in this approach arose due
to the variety of conditions that alter the tie’s appearance. The ties could be skewed, degraded,
or partially occluded, preventing consistent detection. The inability to accurately detect the tie
prevents the algorithm from securing the reference point necessary to inspect the components
associated with it. Another challenge in consistent tie detection was the presence of shadows at
the edges of the ties. Although shadows can be controlled through artificial lighting, the
previous problems led to development of a rail-based approach for component recognition. The
rail is a more reliably detected and consistent component of the track structure and it has more
limited shapes and orientations with respect to the camera views.
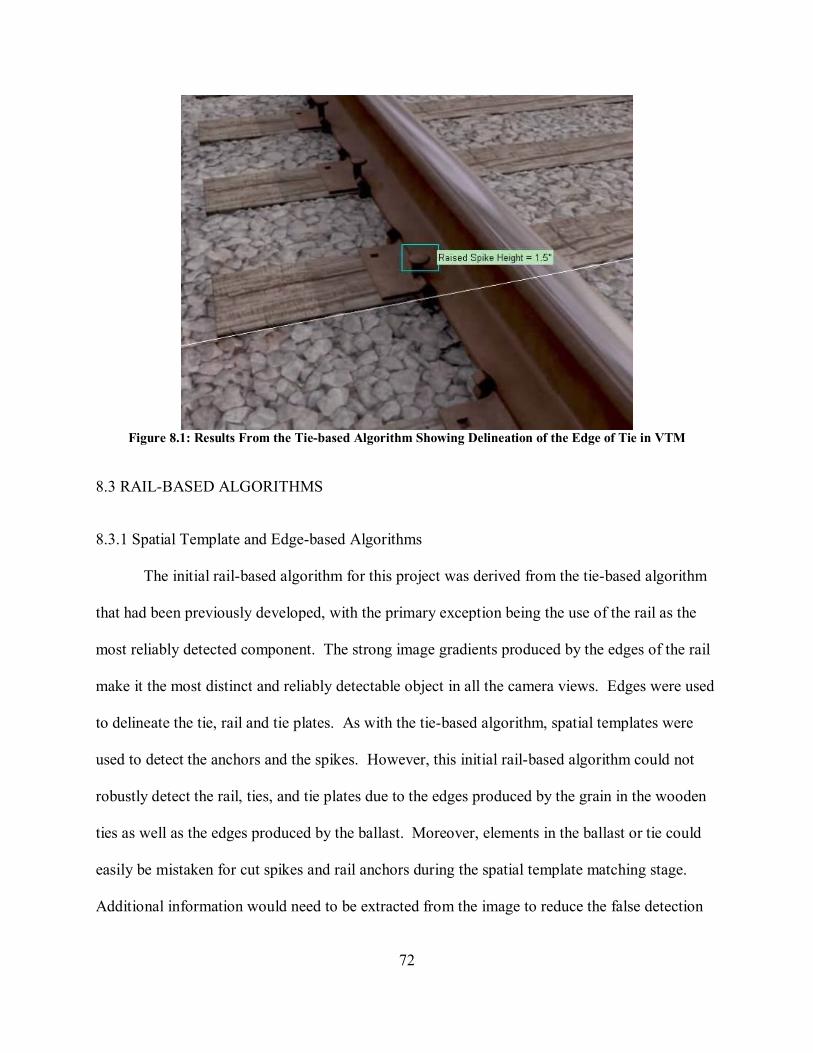
72
Figure 8.1: Results From the Tie-based Algorithm Showing Delineation of the Edge of Tie in VTM
8.3 RAIL-BASED ALGORITHMS
8.3.1 Spatial Template and Edge-based Algorithms
The initial rail-based algorithm for this project was derived from the tie-based algorithm
that had been previously developed, with the primary exception being the use of the rail as the
most reliably detected component. The strong image gradients produced by the edges of the rail
make it the most distinct and reliably detectable object in all the camera views. Edges were used
to delineate the tie, rail and tie plates. As with the tie-based algorithm, spatial templates were
used to detect the anchors and the spikes. However, this initial rail-based algorithm could not
robustly detect the rail, ties, and tie plates due to the edges produced by the grain in the wooden
ties as well as the edges produced by the ballast. Moreover, elements in the ballast or tie could
easily be mistaken for cut spikes and rail anchors during the spatial template matching stage.
Additional information would need to be extracted from the image to reduce the false detection
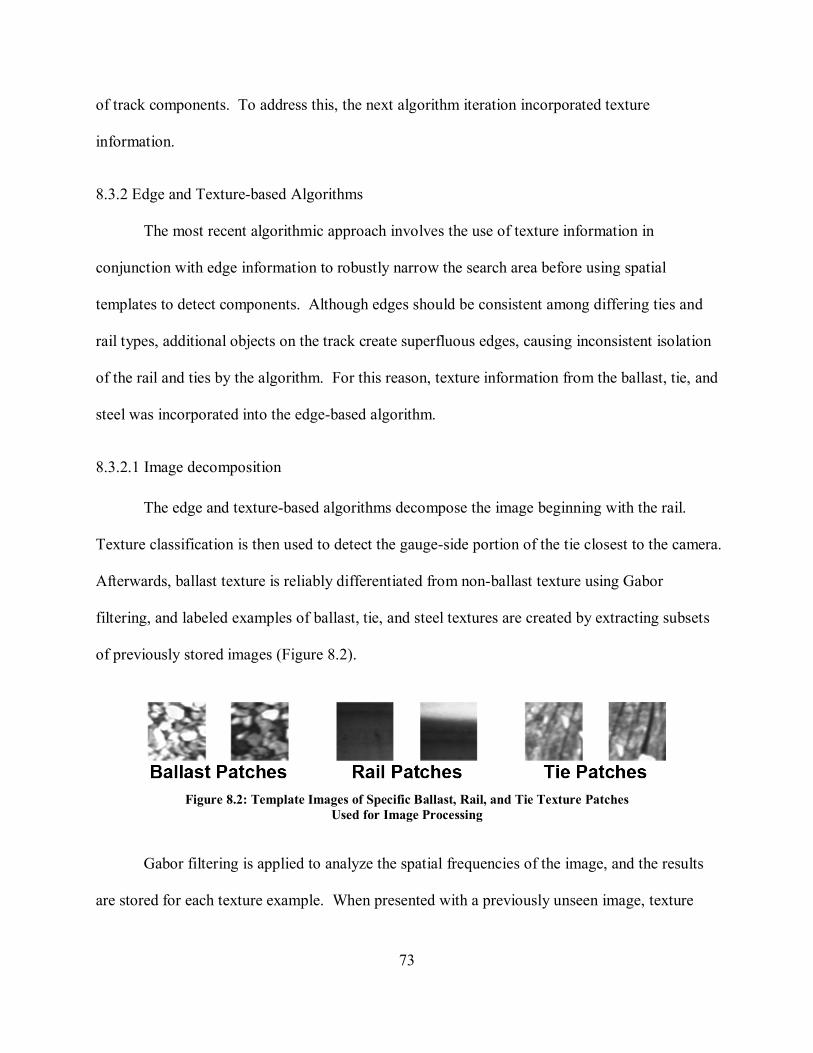
73
of track components. To address this, the next algorithm iteration incorporated texture
information.
8.3.2 Edge and Texture-based Algorithms
The most recent algorithmic approach involves the use of texture information in
conjunction with edge information to robustly narrow the search area before using spatial
templates to detect components. Although edges should be consistent among differing ties and
rail types, additional objects on the track create superfluous edges, causing inconsistent isolation
of the rail and ties by the algorithm. For this reason, texture information from the ballast, tie, and
steel was incorporated into the edge-based algorithm.
8.3.2.1 Image decomposition
The edge and texture-based algorithms decompose the image beginning with the rail.
Texture classification is then used to detect the gauge-side portion of the tie closest to the camera.
Afterwards, ballast texture is reliably differentiated from non-ballast texture using Gabor
filtering, and labeled examples of ballast, tie, and steel textures are created by extracting subsets
of previously stored images (Figure 8.2).
Figure 8.2: Template Images of Specific Ballast, Rail, and Tie Texture Patches
Used for Image Processing
Gabor filtering is applied to analyze the spatial frequencies of the image, and the results
are stored for each texture example. When presented with a previously unseen image, texture
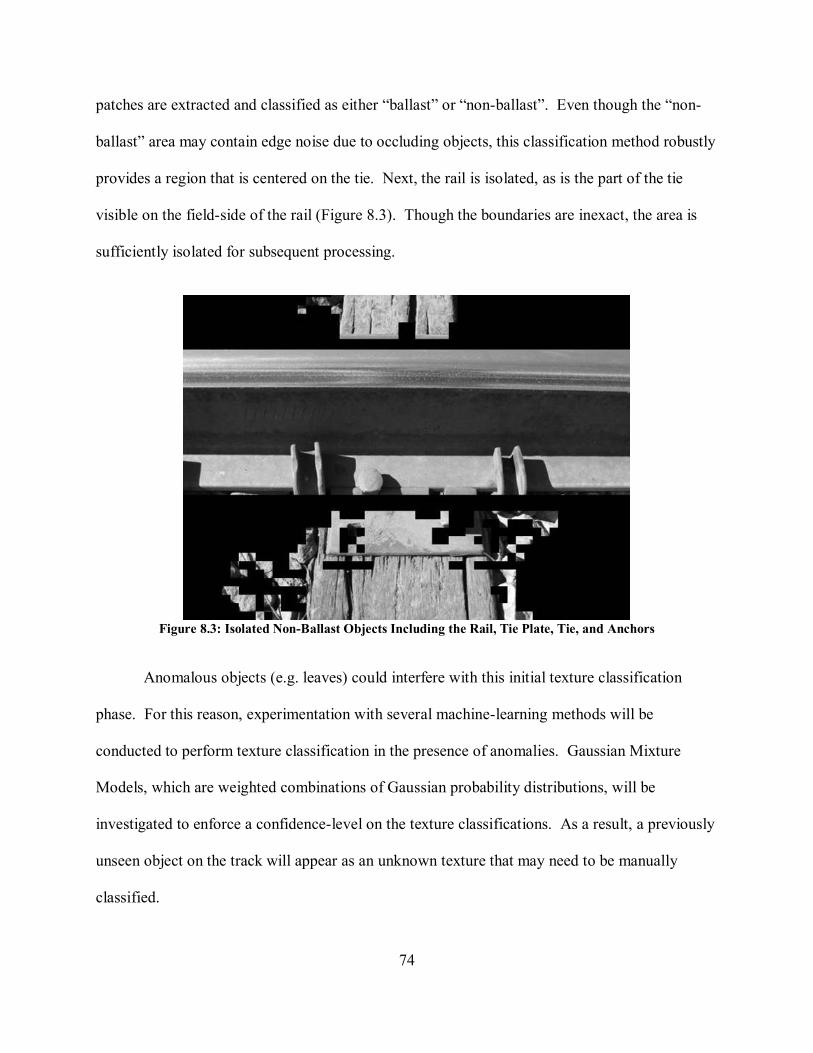
74
patches are extracted and classified as either “ballast” or “non-ballast”. Even though the “non-
ballast” area may contain edge noise due to occluding objects, this classification method robustly
provides a region that is centered on the tie. Next, the rail is isolated, as is the part of the tie
visible on the field-side of the rail (Figure 8.3). Though the boundaries are inexact, the area is
sufficiently isolated for subsequent processing.
Figure 8.3: Isolated Non-Ballast Objects Including the Rail, Tie Plate, Tie, and Anchors
Anomalous objects (e.g. leaves) could interfere with this initial texture classification
phase. For this reason, experimentation with several machine-learning methods will be
conducted to perform texture classification in the presence of anomalies. Gaussian Mixture
Models, which are weighted combinations of Gaussian probability distributions, will be
investigated to enforce a confidence-level on the texture classifications. As a result, a previously
unseen object on the track will appear as an unknown texture that may need to be manually
classified.
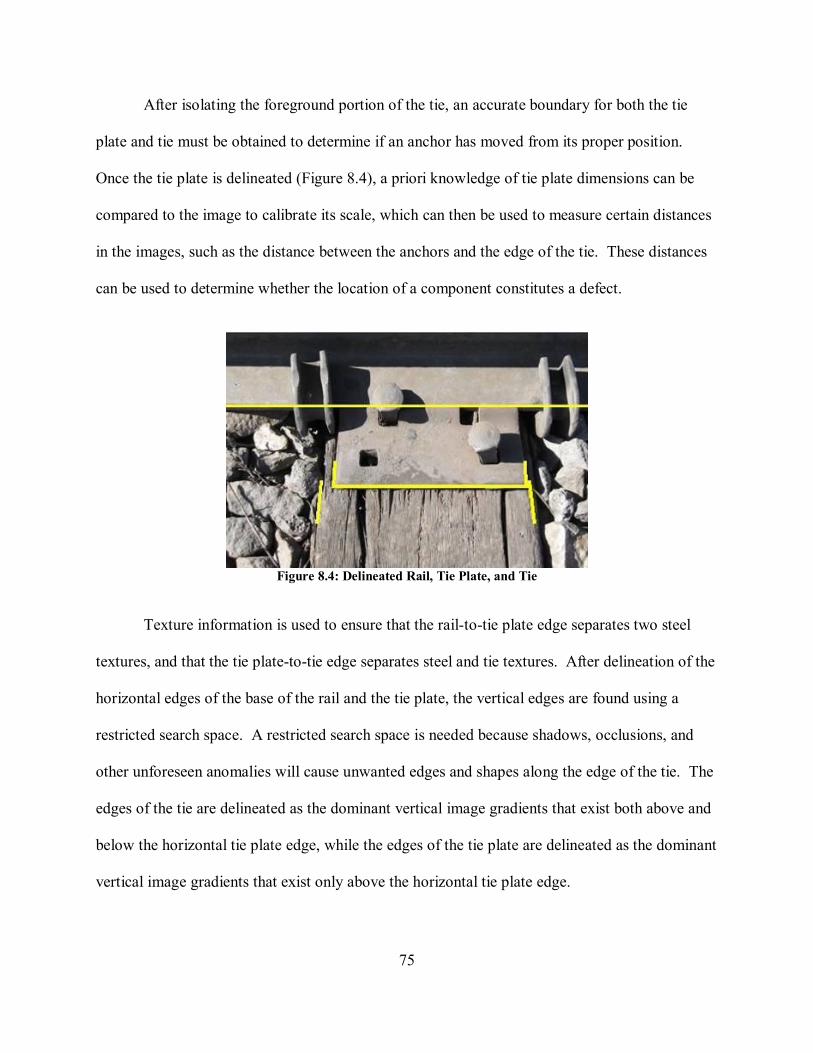
75
After isolating the foreground portion of the tie, an accurate boundary for both the tie
plate and tie must be obtained to determine if an anchor has moved from its proper position.
Once the tie plate is delineated (Figure 8.4), a priori knowledge of tie plate dimensions can be
compared to the image to calibrate its scale, which can then be used to measure certain distances
in the images, such as the distance between the anchors and the edge of the tie. These distances
can be used to determine whether the location of a component constitutes a defect.
Figure 8.4: Delineated Rail, Tie Plate, and Tie
Texture information is used to ensure that the rail-to-tie plate edge separates two steel
textures, and that the tie plate-to-tie edge separates steel and tie textures. After delineation of the
horizontal edges of the base of the rail and the tie plate, the vertical edges are found using a
restricted search space. A restricted search space is needed because shadows, occlusions, and
other unforeseen anomalies will cause unwanted edges and shapes along the edge of the tie. The
edges of the tie are delineated as the dominant vertical image gradients that exist both above and
below the horizontal tie plate edge, while the edges of the tie plate are delineated as the dominant
vertical image gradients that exist only above the horizontal tie plate edge.
76
Future experiments will refine the texture classifiers based on the conditions and
appearance of the specific track under inspection to further improve robustness to anomalous
component appearances. The training on an initial set of videos will be done using labeled
texture data and labeled components provided by a user through a process known as supervised
learning. In the field, without the benefit of user-labeled data and user interaction, the model
will be updated based on the appearance of the detected components. For example, as ties are
detected, the tie texture model can be updated dynamically so low-level texture values for the
ties, tie plates and other components are accurate for the particular segment of track being
inspected. This iterative process is critical in the development of a robust algorithm due to the
fact that deteriorating conditions may affect several ties in the same location. To ensure that the
algorithm is not accepting erroneous updates, it will only update the low-confidence texture areas
of the particular component model after multiple instances of the new textures have been
confirmed over a certain track length.
8.3.2.2 Spike inspection
Spikes are located with spatial correlation techniques using a previously developed
template (Figure 8.5). This is possible since the search area for the spikes is limited after the tie
plate and rail are both delineated and because spikes will only be found in certain locations
within the search area. These locations include a row of line spikes next to the base of the rail
and another row of hold-down spikes further from the rail. Since the search space is restricted
for finding spikes, a low detection threshold can be set for the template response. This approach
allows a spike with an anomalous appearance to now be detected, since the threshold has been
lowered for a template match. Missing spikes are detected by a two-dimensional filter that
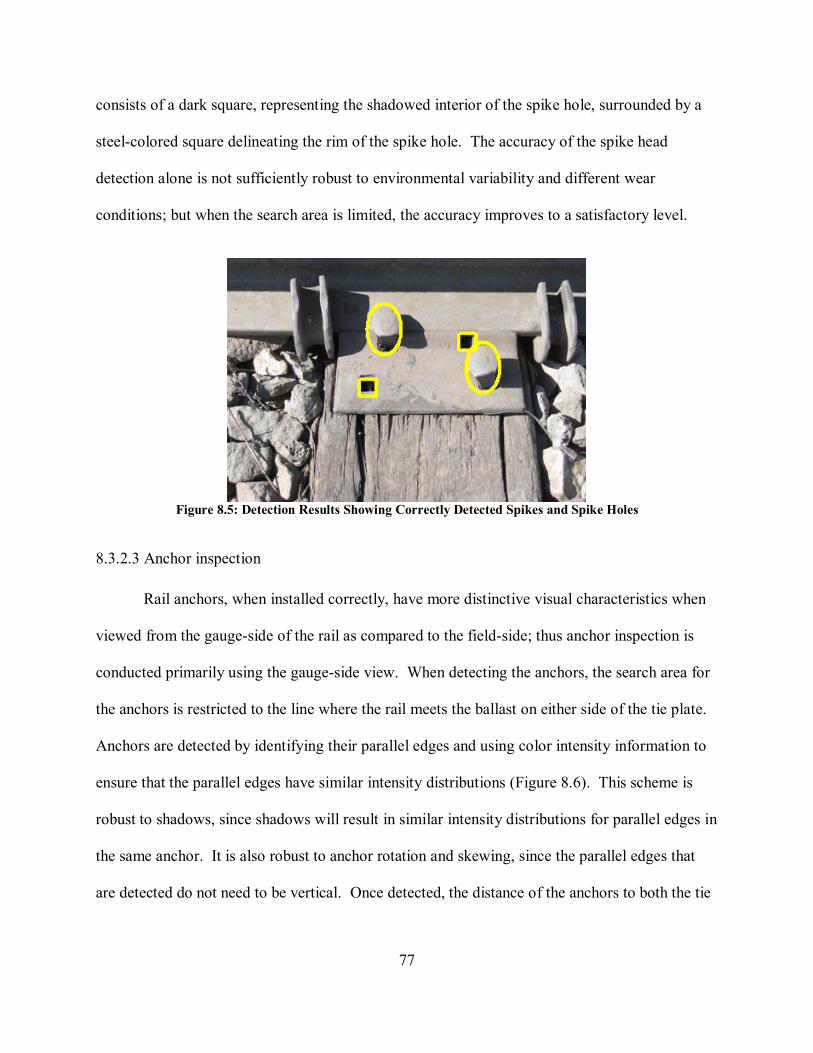
77
consists of a dark square, representing the shadowed interior of the spike hole, surrounded by a
steel-colored square delineating the rim of the spike hole. The accuracy of the spike head
detection alone is not sufficiently robust to environmental variability and different wear
conditions; but when the search area is limited, the accuracy improves to a satisfactory level.
Figure 8.5: Detection Results Showing Correctly Detected Spikes and Spike Holes
8.3.2.3 Anchor inspection
Rail anchors, when installed correctly, have more distinctive visual characteristics when
viewed from the gauge-side of the rail as compared to the field-side; thus anchor inspection is
conducted primarily using the gauge-side view. When detecting the anchors, the search area for
the anchors is restricted to the line where the rail meets the ballast on either side of the tie plate.
Anchors are detected by identifying their parallel edges and using color intensity information to
ensure that the parallel edges have similar intensity distributions (Figure 8.6). This scheme is
robust to shadows, since shadows will result in similar intensity distributions for parallel edges in
the same anchor. It is also robust to anchor rotation and skewing, since the parallel edges that
are detected do not need to be vertical. Once detected, the distance of the anchors to both the tie
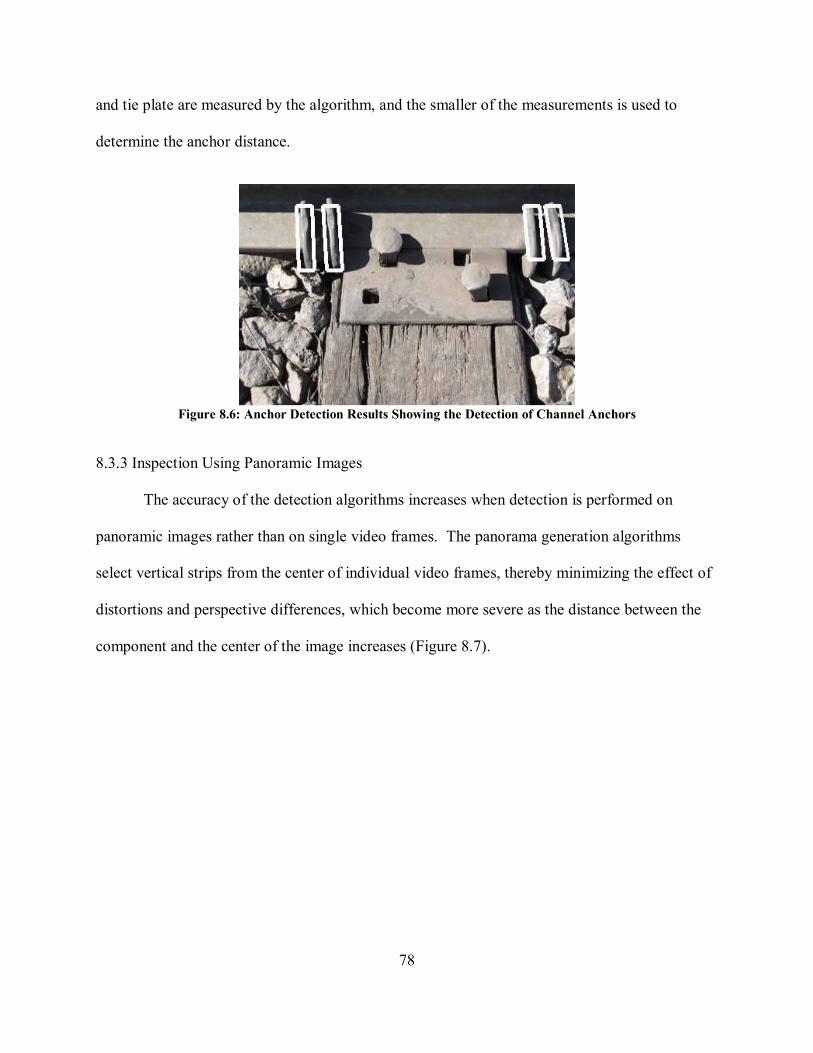
78
and tie plate are measured by the algorithm, and the smaller of the measurements is used to
determine the anchor distance.
Figure 8.6: Anchor Detection Results Showing the Detection of Channel Anchors
8.3.3 Inspection Using Panoramic Images
The accuracy of the detection algorithms increases when detection is performed on
panoramic images rather than on single video frames. The panorama generation algorithms
select vertical strips from the center of individual video frames, thereby minimizing the effect of
distortions and perspective differences, which become more severe as the distance between the
component and the center of the image increases (Figure 8.7).
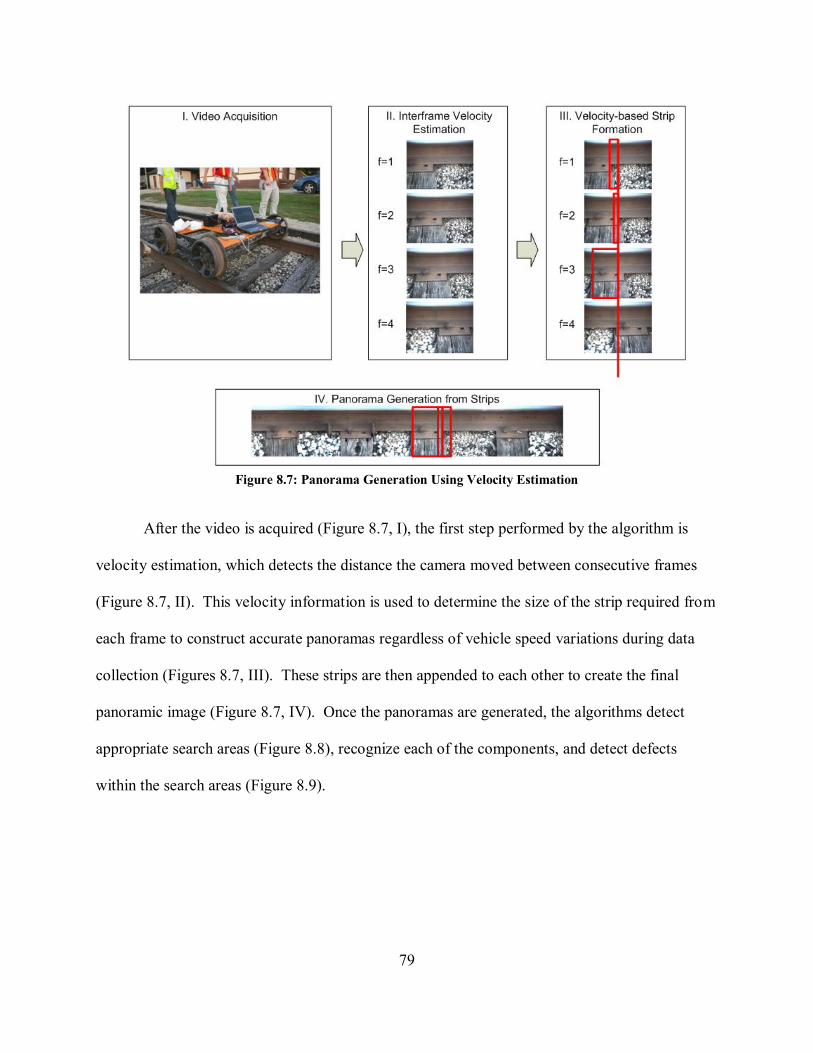
79
Figure 8.7: Panorama Generation Using Velocity Estimation
After the video is acquired (Figure 8.7, I), the first step performed by the algorithm is
velocity estimation, which detects the distance the camera moved between consecutive frames
(Figure 8.7, II). This velocity information is used to determine the size of the strip required from
each frame to construct accurate panoramas regardless of vehicle speed variations during data
collection (Figures 8.7, III). These strips are then appended to each other to create the final
panoramic image (Figure 8.7, IV). Once the panoramas are generated, the algorithms detect
appropriate search areas (Figure 8.8), recognize each of the components, and detect defects
within the search areas (Figure 8.9).
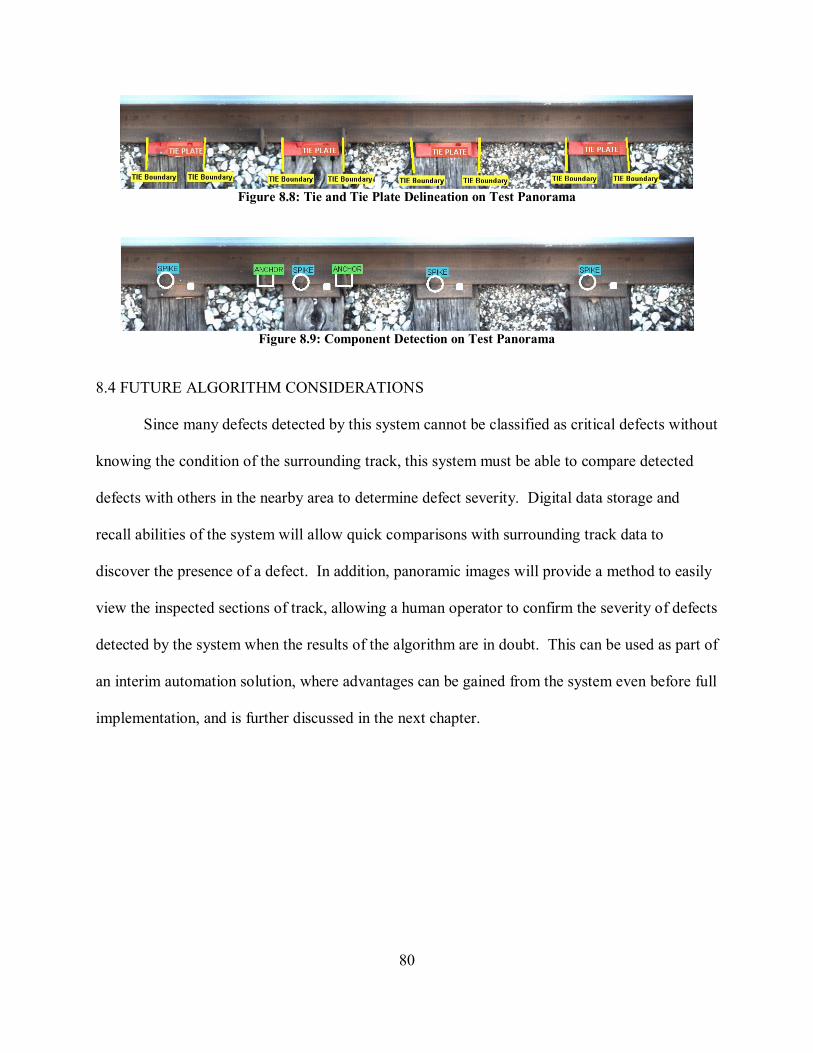
80
Figure 8.8: Tie and Tie Plate Delineation on Test Panorama
Figure 8.9: Component Detection on Test Panorama
8.4 FUTURE ALGORITHM CONSIDERATIONS
Since many defects detected by this system cannot be classified as critical defects without
knowing the condition of the surrounding track, this system must be able to compare detected
defects with others in the nearby area to determine defect severity. Digital data storage and
recall abilities of the system will allow quick comparisons with surrounding track data to
discover the presence of a defect. In addition, panoramic images will provide a method to easily
view the inspected sections of track, allowing a human operator to confirm the severity of defects
detected by the system when the results of the algorithm are in doubt. This can be used as part of
an interim automation solution, where advantages can be gained from the system even before full
implementation, and is further discussed in the next chapter.
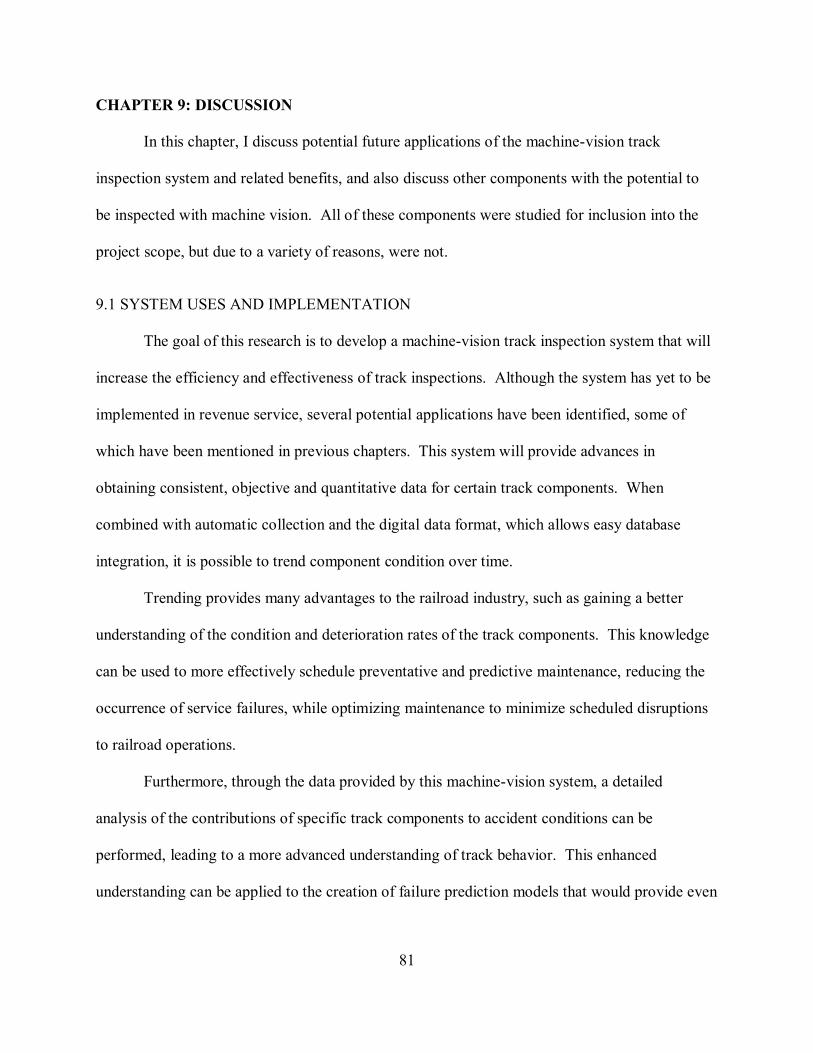
81
CHAPTER 9: DISCUSSION
In this chapter, I discuss potential future applications of the machine-vision track
inspection system and related benefits, and also discuss other components with the potential to
be inspected with machine vision. All of these components were studied for inclusion into the
project scope, but due to a variety of reasons, were not.
9.1 SYSTEM USES AND IMPLEMENTATION
The goal of this research is to develop a machine-vision track inspection system that will
increase the efficiency and effectiveness of track inspections. Although the system has yet to be
implemented in revenue service, several potential applications have been identified, some of
which have been mentioned in previous chapters. This system will provide advances in
obtaining consistent, objective and quantitative data for certain track components. When
combined with automatic collection and the digital data format, which allows easy database
integration, it is possible to trend component condition over time.
Trending provides many advantages to the railroad industry, such as gaining a better
understanding of the condition and deterioration rates of the track components. This knowledge
can be used to more effectively schedule preventative and predictive maintenance, reducing the
occurrence of service failures, while optimizing maintenance to minimize scheduled disruptions
to railroad operations.
Furthermore, through the data provided by this machine-vision system, a detailed
analysis of the contributions of specific track components to accident conditions can be
performed, leading to a more advanced understanding of track behavior. This enhanced
understanding can be applied to the creation of failure prediction models that would provide even
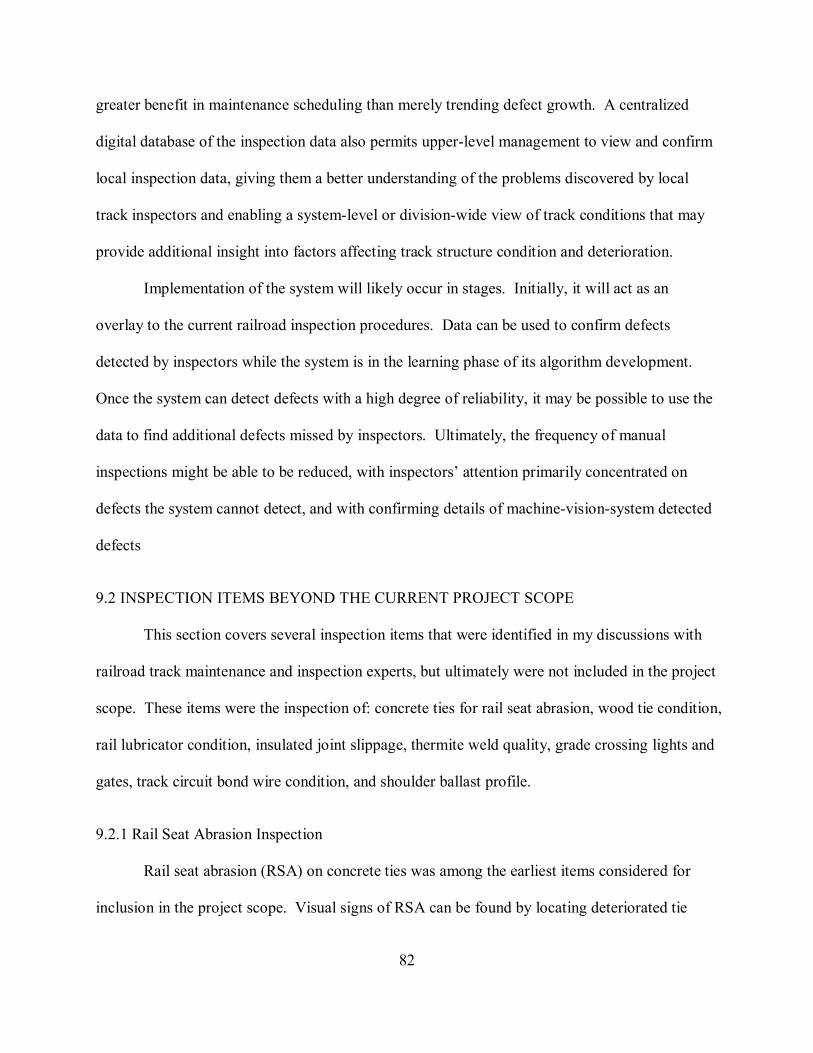
82
greater benefit in maintenance scheduling than merely trending defect growth. A centralized
digital database of the inspection data also permits upper-level management to view and confirm
local inspection data, giving them a better understanding of the problems discovered by local
track inspectors and enabling a system-level or division-wide view of track conditions that may
provide additional insight into factors affecting track structure condition and deterioration.
Implementation of the system will likely occur in stages. Initially, it will act as an
overlay to the current railroad inspection procedures. Data can be used to confirm defects
detected by inspectors while the system is in the learning phase of its algorithm development.
Once the system can detect defects with a high degree of reliability, it may be possible to use the
data to find additional defects missed by inspectors. Ultimately, the frequency of manual
inspections might be able to be reduced, with inspectors’ attention primarily concentrated on
defects the system cannot detect, and with confirming details of machine-vision-system detected
defects
9.2 INSPECTION ITEMS BEYOND THE CURRENT PROJECT SCOPE
This section covers several inspection items that were identified in my discussions with
railroad track maintenance and inspection experts, but ultimately were not included in the project
scope. These items were the inspection of: concrete ties for rail seat abrasion, wood tie condition,
rail lubricator condition, insulated joint slippage, thermite weld quality, grade crossing lights and
gates, track circuit bond wire condition, and shoulder ballast profile.
9.2.1 Rail Seat Abrasion Inspection
Rail seat abrasion (RSA) on concrete ties was among the earliest items considered for
inclusion in the project scope. Visual signs of RSA can be found by locating deteriorated tie
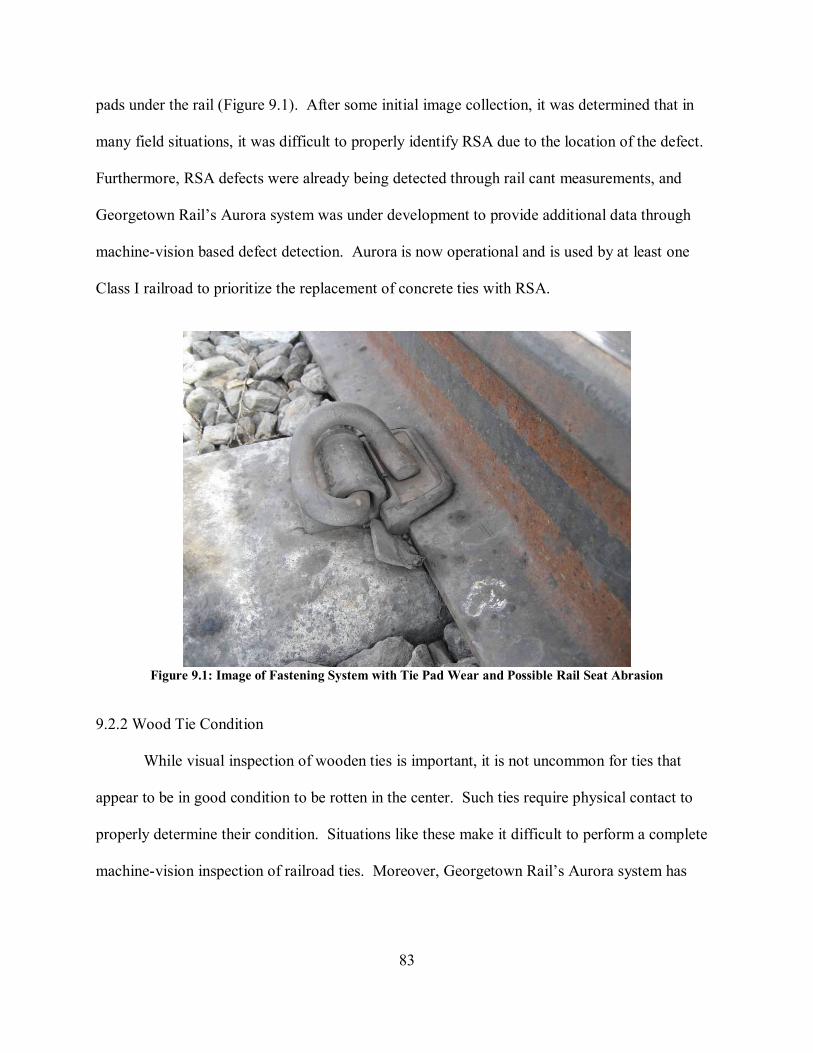
83
pads under the rail (Figure 9.1). After some initial image collection, it was determined that in
many field situations, it was difficult to properly identify RSA due to the location of the defect.
Furthermore, RSA defects were already being detected through rail cant measurements, and
Georgetown Rail’s Aurora system was under development to provide additional data through
machine-vision based defect detection. Aurora is now operational and is used by at least one
Class I railroad to prioritize the replacement of concrete ties with RSA.
Figure 9.1: Image of Fastening System with Tie Pad Wear and Possible Rail Seat Abrasion
9.2.2 Wood Tie Condition
While visual inspection of wooden ties is important, it is not uncommon for ties that
appear to be in good condition to be rotten in the center. Such ties require physical contact to
properly determine their condition. Situations like these make it difficult to perform a complete
machine-vision inspection of railroad ties. Moreover, Georgetown Rail’s Aurora system has
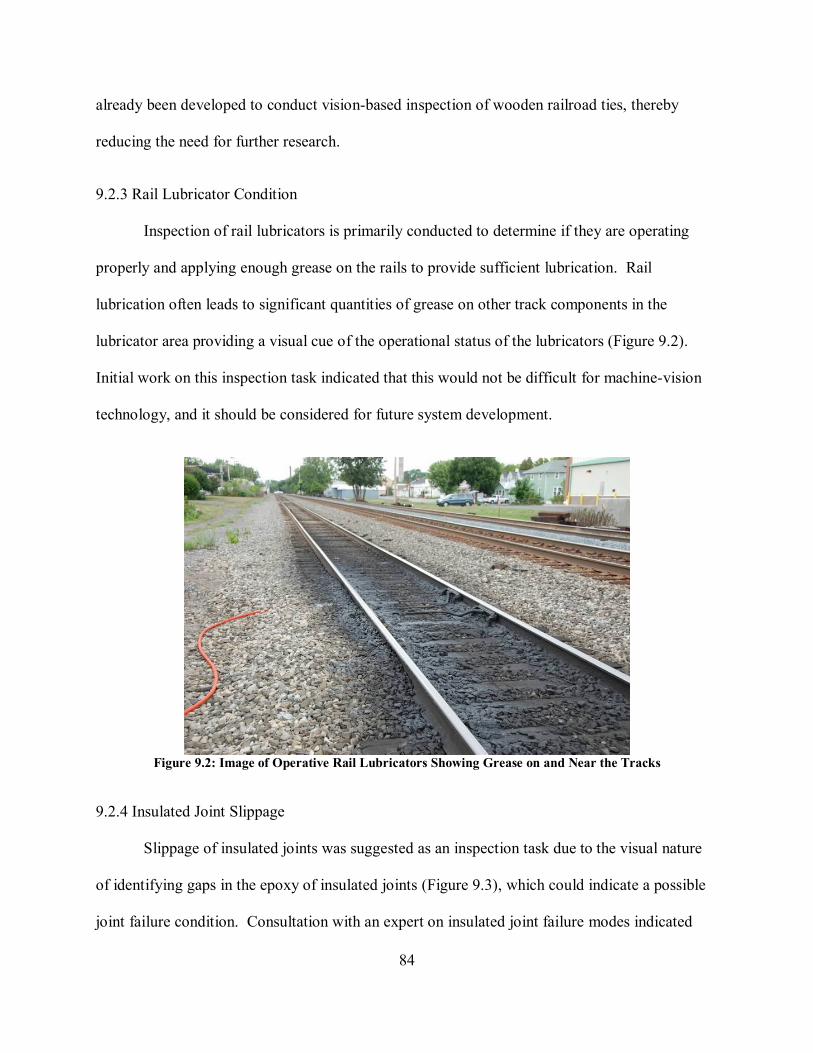
84
already been developed to conduct vision-based inspection of wooden railroad ties, thereby
reducing the need for further research.
9.2.3 Rail Lubricator Condition
Inspection of rail lubricators is primarily conducted to determine if they are operating
properly and applying enough grease on the rails to provide sufficient lubrication. Rail
lubrication often leads to significant quantities of grease on other track components in the
lubricator area providing a visual cue of the operational status of the lubricators (Figure 9.2).
Initial work on this inspection task indicated that this would not be difficult for machine-vision
technology, and it should be considered for future system development.
Figure 9.2: Image of Operative Rail Lubricators Showing Grease on and Near the Tracks
9.2.4 Insulated Joint Slippage
Slippage of insulated joints was suggested as an inspection task due to the visual nature
of identifying gaps in the epoxy of insulated joints (Figure 9.3), which could indicate a possible
joint failure condition. Consultation with an expert on insulated joint failure modes indicated
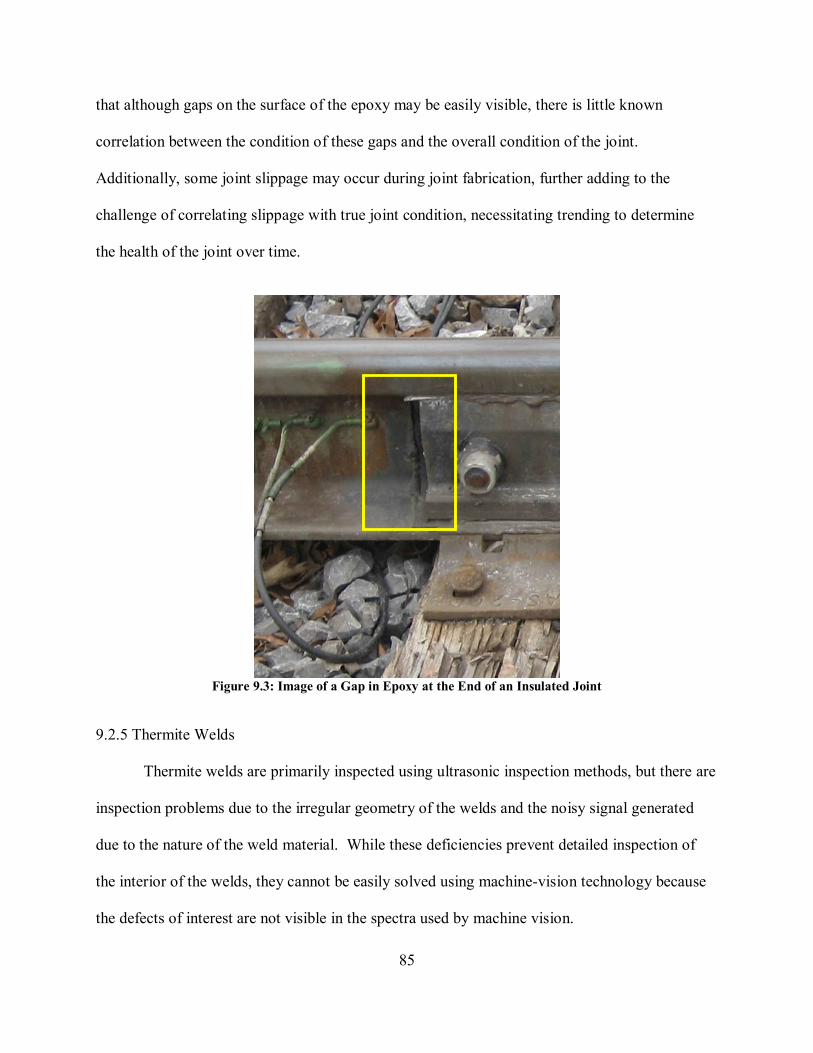
85
that although gaps on the surface of the epoxy may be easily visible, there is little known
correlation between the condition of these gaps and the overall condition of the joint.
Additionally, some joint slippage may occur during joint fabrication, further adding to the
challenge of correlating slippage with true joint condition, necessitating trending to determine
the health of the joint over time.
Figure 9.3: Image of a Gap in Epoxy at the End of an Insulated Joint
9.2.5 Thermite Welds
Thermite welds are primarily inspected using ultrasonic inspection methods, but there are
inspection problems due to the irregular geometry of the welds and the noisy signal generated
due to the nature of the weld material. While these deficiencies prevent detailed inspection of
the interior of the welds, they cannot be easily solved using machine-vision technology because
the defects of interest are not visible in the spectra used by machine vision.

86
9.2.6 Grade Crossing Components
Lights, gates and other grade crossing components were initially under consideration for
addition to the project scope. These components are distant from the track in comparison with
other elements of the track structure, making lighting more difficult. Moreover, it would be
extremely difficult to inspect all the grade crossing components of interest due to the limited
perspective available from mobile vehicle-mounted system. Although a very challenging
inspection item, it would not have the same kind of applicability toward track maintenance
scheduling and train accident prevention.
9.2.7 Track Circuit Bond Wires
Track circuit bond wires are used provide electrical continuity across joints so that the
signal system can function properly (Figure 9.4). These wires can become loose or detached,
causing service disruptions such as falsely displaying a stop signal aspect. This inspection task
was not deemed critical enough to focus on with the current scope, as there are significant
portions of FRA class 4 and 5 track that are CWR, but it may be feasible as a future inspection
task, given the current camera views.
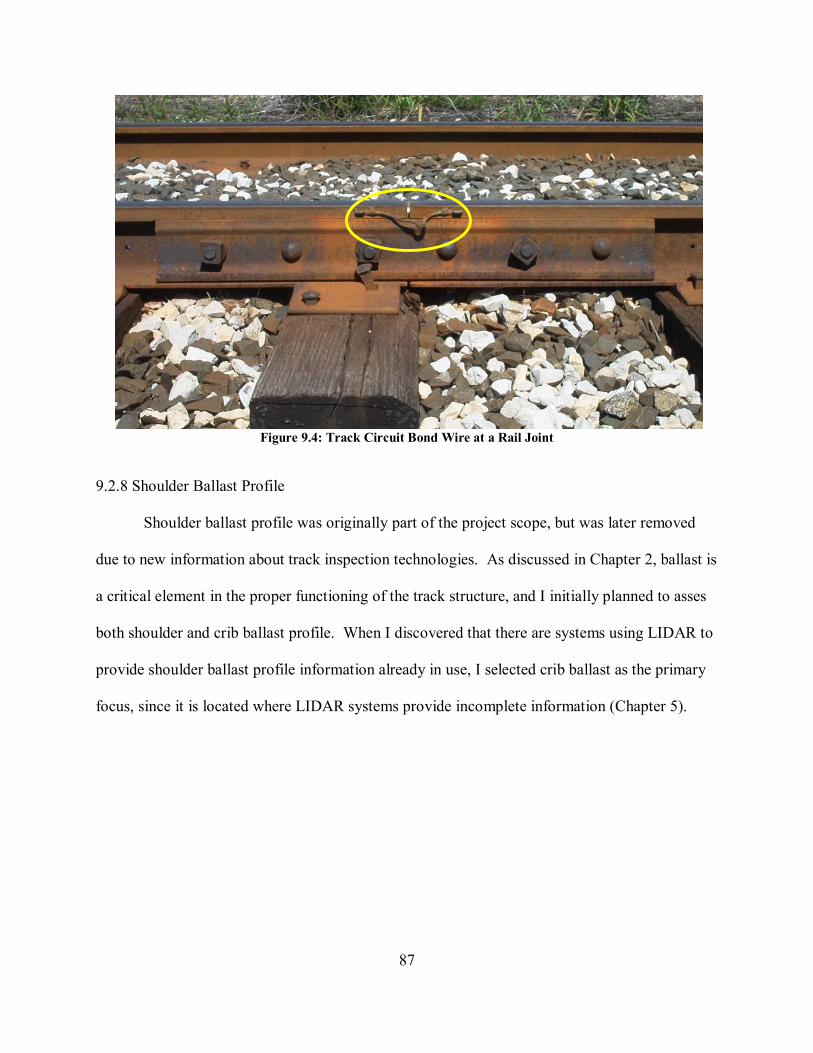
87
Figure 9.4: Track Circuit Bond Wire at a Rail Joint
9.2.8 Shoulder Ballast Profile
Shoulder ballast profile was originally part of the project scope, but was later removed
due to new information about track inspection technologies. As discussed in Chapter 2, ballast is
a critical element in the proper functioning of the track structure, and I initially planned to asses
both shoulder and crib ballast profile. When I discovered that there are systems using LIDAR to
provide shoulder ballast profile information already in use, I selected crib ballast as the primary
focus, since it is located where LIDAR systems provide incomplete information (Chapter 5).
88
CHAPTER 10: SUMMARY
Currently, the inspection of many railroad track components is primarily conducted using
manual, visual inspections that are both labor intensive and lack the ability to easily archive
component health data for performing trend analyses. Moreover, inspections are conducted by
many different individuals; thus they are subject to variability and subjectivity. It is impractical
to manually catalogue the health of the large number of visually-inspected track components,
making it difficult to develop a quantitative understanding of exactly how non-critical or
symptomatic defects may contribute to the occurrence of critical defects.
10.1 OBJECTIVE OF THIS RESEARCH
The objective behind the development of this machine-vision system for track inspection
is to supplement current visual inspection methods by enabling consistent, objective inspection
of a large number of track components. Based on analysis of railroad accident statistics, input
from subject-matter experts, and review of existing inspection technologies and methods, I
focused my initial research and development efforts on inspection of cut spikes, rail anchors, crib
ballast, and turnout components. Specifically, track will be inspected for raised or missing cut
spikes, shifted or missing anchors, improper spiking or anchoring patterns, improper track
breathing, insufficient crib ballast, and switch point chipping.
10.2 TRACK INSPECTION GUIDELINES
Individual railroads maintain a set of internal guidelines for the inspection and
maintenance of track components to ensure safe and efficient operation of their railroad. These
guidelines expand upon the minimum standards given in the FRA Track Safety Standards.
Given the challenges in consistent, objective, and quantitative inspection of these components
89
through manual, visual inspection, there is a lack of specificity regarding the inspection of
certain components within both the FRA Track Safety Standards and the internal guidelines of
individual railroads. An enhanced understanding of track health and failure modes enabled by
the machine-vision system would enable improvement of the current guidelines.
10.3 DATA COLLECTION AND SYSTEM DEVELOPMENT
I developed an image acquisition system to supply the digital video data necessary for
algorithm development. This system consists of a camera, computer, power source, recording
platform, and lighting solution. Experiments were performed both in the field and with the
Virtual Track Model (VTM) to determine the optimal camera views to use for consistent and
reliable detection of the track components by the algorithms, leading to the selection of the over-
the-rail view and the lateral view. In the development of the temporary recording platform, the
Video Track Cart (VTC), I addressed several hardware problems. These included camera
mounting, speed control, and the selection of a computer and power supply with the performance
characteristics necessary for reliable and consistent data collection. Lighting challenges have yet
to be fully resolved, although the lighting systems of similar machine-vision systems have been
studied. Once past the initial algorithm development, the image acquisition system will no
longer use the VTC and instead be adapted for a track vehicle such as a high-rail vehicle, which
comes with its own unique challenges, such as increased vibrations due to higher inspection
speeds.
10.4 ALGORITHM DEVELOPMENT
The machine-vision algorithms were initially tie-based, and exclusively used edge
detection and spatial templates to detect track components. The tie was found to be unreliable as
90
an initial reference point, so the algorithms were adapted to use the rail instead. However, edge
detection alone was not robust enough to sufficiently narrow the search area for the consistent
and accurate detection of cut spikes and anchors. Therefore, the current algorithms use both
edge detection and texture information to provide a robust means of detecting rail, ties, and tie
plates to narrow the search area. Within this restricted area, knowledge of probable component
locations allow the algorithms to consistently and accurately determine the presence and
locations of spikes and rail anchors. Additional work is being completed on using panoramic
images created from field video data to increase the accuracy of component detection, since the
algorithms used for panoramic image creation minimize the distortions and perspective
differences created by the lens. The next phases in the algorithm development are to improve the
detection of cut spikes and rail anchors, and begin experimenting with different approaches to
inspection of crib ballast and turnout components.
10.5 FUTURE APPLICATIONS
Data provided by this machine-vision inspection system has future applications in track
component health monitoring and trending, system-wide defect tracking by upper management,
and improved maintenance planning. Additionally, the data can be used as part of an enhanced
failure prediction model based on an enhanced understanding of track behavior that can be used
to most effectively schedule preventative maintenance to minimize interruptions to railroad
operations, as well as improve current guidelines for track inspection.
10.6 CONCLUSION
Although this machine-vision track inspection system is still in the developmental stages,
significant hurdles have been overcome and a proof-of-concept system has been developed and

91
tested. A need for machine-vision technology in the field of track inspection was established,
several data collection problems were addressed, and promising algorithmic component
detection techniques have been developed and continue to improve with the addition of more
data. The future development of systems for machine-vision track inspection appears promising,
and these systems will provide railroads with more track component health knowledge and
maintenance planning flexibility than ever before.
92
REFERENCES
Al-Qadi, I.L., Xie, W., Roberts, R., 2007. Scattering Analysis of Railroad Ballast Using Ground Penetrating Radar. Paper #07-2273, Proceedings of the Transportation Research Board 86th Annual Meeting, Washington D.C.
American Welding Society, 2004. Inspecting Welds in Rail. American Welding Society –
Inspection Trends. <http://www.aws.org/w/s/itrends/2004/06/019/> Accessed 9 June 2007.
Anderson, R.T., Barkan, C.P.L., 2004. Railroad Accident Rates for Use in Transportation Risk
Analysis. Transportation Research Record: Journal of the Transportation Research Board 1863, Transportation Research Board of the National Academies, Washington, D.C., pp. 88-98.
American Railway Engineering and Maintenance-of-Way Association (AREMA), 2007.
AREMA Manual for Railway Engineering, Vol. 1. American Railway Engineering and Maintenance-of-Way Association, Landover, Maryland.
Beena Vision, n.d.. WheelView Description. Beena Vision – Machine vision technology in train
monitoring and railroad industry. <http://www.beenavision.com/WheelViewDescription.htm> Accessed July 2008.
Berry, A., Nejikovsky, B., Gilbert, X., Tajaddini A., 2008. High Speed Video Inspection of Joint
Bars Using Advanced Image Collection and Processing Techniques. Proceedings of the 2008 World Congress on Railway Research, World Congress on Railway Research, Seoul, Korea.
Cerniglia, D., Garcia, G., Girardi, G., Kalay, S., 2009. The Development and Commissioning of
a Laser-Based Ultrasonic Rail Inspection System. Proceedings of the 9th International Heavy Haul Conference, World Congress on Railway Research, International Heavy Haul Association, Shanghai, China.
Clouse, A.L., Kesler, K., 2003. Advancements in Track Inspection. Proceedings of the AREMA
2003 Annual Conference, American Railway Engineering and Maintenance-of-Way Association, Chicago, Illinois.
CN, 2007. Engineering Track Standards. March. Edwards, J.R., 2006. Improving the Efficiency and Effectiveness of Railcar Safety Appliance
Inspections Using Machine Vision Technology. MS Thesis, University of Illinois at Urbana-Champaign, Urbana, Illinois.
93
Edwards, J.R., Hart, J.M., Todorovic, S., Barkan, C.P.L., Ahuja, N., Chua, Z., Kocher, N., Zeman J., 2007. Development of Machine Vision Technology for Railcar Safety Appliance Inspection. Proceedings of the International Heavy Haul Conference Specialist Technical Session - High Tech in Heavy Haul, International Heavy Haul Conference, Kiruna, Sweden, pp. 745-752.
ENSCO Inc., n.d.a. Laser Gauge & Rail Profile Measurement Systems. Track Inspection
Systems, Railroad Track Inspection – ENSCO’s Rail Technologies. <http://www.ensco.com/Products-Services/Rail-Technologies/Track-Inspection-Systems.htm> Accessed July 2008.
ENSCO Inc., n.d.b. Wayside Vehicle Inspection. Vehicle Testing & Evaluation – ENSCO’s Rail
Technologies. <http://www.ensco.com/Products-Services/Rail-Technologies/Vehicle-Testing-Evaluation.htm> Accessed July 2008.
Fateh, M., 2005. Non-Destructive Evaluation of Railway Track Using Ground Penetrating Radar.
Federal Railroad Administration Research Results RR05-06, Federal Railroad Administration, October.
Federal Railroad Administration, 2006. Federal Railroad Administration Office of Safety
Analysis: 3.03 – Download Accident Data. <http://safetydata.fra.dot.gov/officeofsafety/publicsite/on_the_fly_download.aspx?itemno=3.03> Accessed June 2006.
Federal Railroad Administration, 2007. Code of Federal Regulations, Title 49, Volume 4: Part
213 - Track Safety Standards. <http://frwebgate3.access.gpo.gov/cgi-bin/PDFgate.cgi?WAISdocID=263821734+5+1+0&WAISaction=retrieve> Accessed July 2008.
Forsyth, D.A., Ponce, J., 2003. Computer Vision: A Modern Approach, Prentice Hall, Upper
Saddle River, New Jersey. Georgetown Rail Equipment Company, n.d.. AURORA: The future of track inspection is here.
Georgetown Rail Equipment Company. <http://www.georgetownrail.com/aurora/index.php> Accessed Nov 2008.
Hart, J.M., Ahuja, N., Barkan, C.P.L., Davis, D.D., 2004. A Machine Vision System for
Monitoring Railcar Health: Preliminary Results. Technology Digest: TD-04-008, Association of American Railroads, Pueblo, Colorado.
Hart, J.M., Resendiz, E., Freid, B., Sawadisavi, S., Barkan, C.P.L., Ahuja, N., 2008. Machine
Vision Using Multi-Spectral Imaging for Undercarriage Inspection of Railroad Equipment. Proceedings of the 8th World Congress on Railway Research, World Congress on Railway Research, Seoul, Korea.
94
Hay, W.W., 1982. Railroad Engineering, Second Edition, John Wiley & Sons, New York, New York.
Hsieh, H.Y., Chen, N., Liao, C.L., 2007. Visual Recognition System of Elastic Rail Clips for
Mass Rapid Transit Systems. JRCICE2007-40080, Proceedings of the ASME/IEEE Joint Rail Conference & Internal Combustion Engine Spring Technical Conference, ASME/IEEE, Pueblo, Colorado.
Jamieson, D., Bloom, J., Kelshaw, R., 2001. T-2000: A Railroad Track Geometry Inspection
Vehicle For the 21st Century. Proceedings of the AREMA 2001 Annual Conference, American Railway Engineering and Maintenance-of-Way Association, Chicago, Illinois.
Lagnebäck, R., 2007. Evaluation of wayside condition monitoring technologies for condition-
based maintenance of railway vehicles. Licentiate Thesis, Luleå University of Technology, Luleå, Sweden.
Lai, Y.C., Barkan, C.P.L., Drapa, J., Ahuja, N., Hart, J.M., Narayanan, P.J., Jawahar, C.V.,
Kumar, A., Milhon, L.R., Stehly, M.P., 2007. Machine vision analysis of the energy efficiency of intermodal freight trains. Journal of Rail and Rapid Transit 221, pp. 353-364.
MER MEC, n.d.. Track Surface Defect Detection.
<http://www.mermec.com/MermecFE/LocalizationResource/contents/products/TrackSurfaceDefectsDetection.pdf> Accessed Nov 2008.
NDT Resource Center, n.d.a. Basic Principles of Eddy Current Inspection. Basic Principles of
ET. <http://www.ndt-ed.org/EducationResources/ CommunityCollege/EddyCurrents/Introduction/IntroductiontoET.htm> Accessed 4 Jun 2007.
NDT Resource Center, n.d.b. Basic Principles of Ultrasonic Testing. Introduction to Ultrasonic
Testing. <http://www.ndt-ed.org/EducationResources/ CommunityCollege/Ultrasonics/Introduction/description.htm> Accessed 4 Jun 2007.
NDT Resource Center, n.d.c. Introduction to Radiographic Testing. Community College
Penetrant Testing. <http://www.ndt-ed.org/EducationResources/ CommunityCollege/Radiography/cc_rad_index.htm> Accessed 9 Jun 2007.
Plasser American Corporation, 2008. High Speed Tunnel/Clearance Measuring System "Take
the challenge of oversized freight", Via e-mail from David P. White, Received 11 March 2008.
Point Grey Research, 2009. Dragonfly2.
<http://www.ptgrey.com/products/dragonfly2/dragonfly2.pdf> Accessed Feb 2009.
95
Progressive Rail Technologies, 2008. Brake Hose/Coupler Height Inspector. Brake Hose/Coupler Height Inspector. <http://www.prt-inc.net/php/lahmvServ.php> Accessed July 2008.
Resendiz, E.I., 2010. Computer Vision for Railroad Track Inspection. Ph.D. dissertation,
University of Illinois at Urbana-Champaign, Urbana, Illinois. Schlake, B.W., Edwards, J.R., Hart, J.M., Barkan, C.P.L., Todorovic, S., Ahuja, N.,
2009. Automated Inspection of Railcar Underbody Structural Components Using Machine Vision Technology. Proceedings of the TRB 88th Annual Meeting, Washington, DC.
Schlake, B.W., Todorovic, S., Edwards, J.R., Hart, J.M., Ahuja, N., Barkan, C.P.L., 2010.
Machine Vision Condition Monitoring of Heavy-Axle Load Railcar Structural Underframe Components. Proceedings of the Institution of Mechanical Engineers, Part F: Journal of Rail and Rapid Transit 224: 499-511.
Sullivan, M.D., n.d.. Automated visual inspection of railroads.
<http://www.cs.ucf.edu/~mikel/Research/Automated%20visual%20inspection%20of%20Railroads.html> Accessed 7 Nov 2007.
Surface Transportation Board, 2007. Code of Federal Regulations, Title 49: Part 1201 – Railroad
Companies. <http://edocket.access.gpo.gov/cfr_2007/octqtr/pdf/49cfr1201.pdf> Accessed April 2009.
The Official Railway Equipment Register, 2005. Vol. 120, No. 3, R. E. R. Publishing
Corporation, East Windsor, New Jersey. Wolf, G., 2005. Preventing Track Buckles. Interface - The Journal of Wheel/Rail Interaction,
<http://www.interfacejournal.com/features/03-05/track_buckling/1.html> Accessed March 2008.