Embed Size (px)
Citation preview
DEVELOPMENT OF LIGHTWEIGHT FERROCEMENT SANDWICH
PANELS FOR MODULAR HOUSING AND INDUSTRALIZED
BUILDING SYSTEM
SALIHUDDIN RADIN SUMADI
MAHYUDDIN RAMLI
RESEARCH VOTE NO:
73311
Jabatan Struktur dan Bahan
Fakulti Kejuruteraan Awam
Universiti Teknologi Malaysia
2008

ii
ACKNOWLEDGEMENTS
First and foremost the authors wish to invoke The All Mighty Allah for His forgiveness and thank Him for His Mercy and Blessings to enable the authors in completing this humble research. The authors wish to register their sincere gratitude to all those who have rendered their assistance especially the research assistants and students namely Lenny and Noor Ahmad Memon during this piece of research. Special thanks are due to all the technical staff of Materials and Structures Laboratory of Civil Engineering Faculty. A special acknowledgement is due to Construction Industry Development Baord, CIDB, and Research Management Centre, RMC of Universiti Teknologi Malaysia for the allocation of research grant, and the management and coordination of the research activities respectively.
iii
ABSTRACT
(Keywords: Lightweight, pre-fabricated, aerated concrete sandwich ferrocement)
The development and construction of lightweight pre-fabricated sandwich structural elements in building construction is a growing trend in construction industry all over the world due to its high strength-to-weight ratio, reduced weight, and good thermal insulation characteristics. Sandwich construction element consists of thin face sheets or encasement of high performance material and a thick, lightweight and low strength material as core. Ferrocement is regarded as highly versatile thin material possessing superior properties which cannot be matched by other conventional thin materials. Aerated concrete is a cellular lightweight material which exhibits relatively higher strength than the conventional core materials such as foam. Additionally, sandwich construction deals with the problem of delamination of face sheets leading to their premature failure. This can be avoided by providing encasement over the core. This study was focused on the development of ferrocement encased aerated concrete sandwich wall elements, where ferrocement thin box encases a thick core of lightweight aerated concrete. The study was conducted in two phases. First phase involved the development of high workability and high performance slag-cement based mortar mix to cast proposed ferrocement encasement. The developed mortar was aimed to replace the traditional manual method of plastering the wire mesh by a mechanized casting method. The performance of mortar was investigated in terms of compressive strength, strength development, unit weight, effect of curing regime, and partial replacement of cement by weight with 50% and 60% of slag. The second phase of the study embarked on the development and investigation of the characteristics of ferrocement encased lightweight aerated concrete sandwich wall elements. To achieve the objective, about 600 specimens including large size wall elements were cast and tested. Ferrocement encasement was maintained at 12mm throughout the study. The parameters studied were compressive strength, flexural strength, failure mode, load-deflection behaviour, load-deformation behaviour, load-strain behaviour, unit weight, water absorption, initial surface absorption uniformity, and role of type and layers of the wire meshes. The results revealed the potential application of ferrocement encasement of lightweight aerated concrete to produce lightweight structural elements which leads towards the industrialization of building system. Finally, two mathematical models were developed to predict compressive strength of high workability slag-cement based mortars and the ultimate load of ferrocement encased aerated concrete sandwich wall elements. The values predicted from the mathematical models were 95%-100% accurate to the experimental results.
Key researchers :
Prof. Dr. Salihuddin Radin Sumadi(Head)
Noor Ahmed Memon
E-mail : [email protected]
Tel. No. : 07-5531967
Vote No. : 73311
iv
ABSTRAK Pembangunan serta penghasilan anggota struktur apit pasang siap ringan untuk binaan
adalah merupakan suatu tren yang mengembang dalam industri pembinaan seluruh dunia disebabkan oleh nisbah kekuatan-berat yang tinggi, berat yang berkurangan, dan ciri-ciri penebatan haba yang baik. Anggota pembinaan apit terdiri dari lapisan muka nipis atau bahan salut berprestasi tinggi yang menyaluti bahagian anggota teras yang tebal, ringan tetapi berkekuatan rendah. Simenfero dikenali sebagai bahan serba guna nipis yang mempunyai ciri-ciri kelebihan yang tidak dimiliki oleh bahan-bahan konvensional yang lain. Manakala konkrit ringan berudara adalah merupakan bahan ringan selular yang mempamirkan kekuatan lebih tinggi secara perbandingan dengan teras konvensional seperti bahan berbusa. Seterusnya pembinaan melibatkan penggunaan bahan apit biasanya berhadapan dengan permasalahan pemisahan atau pengupasan lapisan muka yang menjurus kepada kegagalan sebelum waktunya (premature). Fenomena ini boleh dielakkan dengan penyediaan salut menyelaputi teras. Maka kajian ini tertumpu kepada pembangunan anggota dinding apit konkrit ringan diselaputi kekotak simenfero. Kajian ini telah dijalankan dalam dua fasa. Fasa pertama melibatkan pembangunan bancuhan mortar berasaskan sangga-simen berkebolehkerjaan serta perprestasi tinggi untuk dijadikan bahan salut simenfero yang dicadangkan untuk anggota tersebut. Mortar berkenaan yang dituang secara mekanikal adalah untuk menggantikan bahan mortar konvensional yang digunakan dalam proses melepa secara tradisional dalam pembikinan simenfero. Prestasi mortar telah dikaji dari sudut kekuatan mampatan, perkembangan kekuatan, berat unit, kesan regim pengawetan, serta kesan penggunaan gantian separa simen oleh sangga. Pasa kedua pula melibatkan pembangunan serta penyiasatan ciri-ciri anggota dinding apit konkrit berudara ringan bersalut simenfero. Untuk tujuan ini sejumlah spesimen termasuk anggota dinding bersaiz besar telah disediakan dan diuji. Salut simenfero ditetapkan dengan ketebalan 12mm dalam keseluruhan kajian. Parameter yang telah dikaji adalah kekuatan mampatan, kekuatan lenturan, mod kegagalan, kelakuan bebanan-pesongan, kelakuan bebanan-ubahbentuk, kelakuan bebanan-keterikan, berat unit, penyerapan air, ujian serapan permukaan awal, keseragaman, dan peranan serta kesan jenis serta jumlah lapisan jejaring yang digunakan untuk simenfero. Kajian ini mendapati bahawa kaedah penggunaan konkrit apit seperti dalam kajian ini amat berpotensi dalam pembikinan anggota struktur ringan yang seterusnya selangkah ke hadapan dalam perlaksanaan sistem binaan berindustri. Akhirnya dua model matematik telah dibangunkan bagi mentaksir kekuatan mampatan motar berkebolehkerjaan serta perprestasi tinggi yang berasaskan sangga-simen, serta kekuatan muktamad anggota apit tersebut. Di mana nilai taksiran diperolehi dari model sangat hampir dengan keputusan ujikaji.
v
CONTENTS
CHAPTER TITLE PAGE
1 INTRODUCTION 1
2 LITERATURE REVIEW 7
3 RESEARCH METHODOLOGY 39
4 EXPERIMENTAL RESULTS AND DISCUSSIONS 69
ON MORTAR
5 EXPERIMENTAL RESULTS AND DISCUSSIONS 89
ON FERROCEMENT SANDWICH
6 CONCLUSIONS AND RECOMMENDATIONS 129
REFERENCES 134
List of Publications 147
CHAPTER 1
INTRODUCTION
1.1 General Appraisal
The concept of industrialization of the construction technology has emerged as
well accepted and preferred option in the field of building construction now a days, in
order to reduce insitu construction up to maximum extent. This could be achieved by
employing a number of strategies including the application of newly developed cement
based composites for structural applications. Cement based composites perform better
than conventional plain concrete. The development of new construction materials and
technology can partly relieve pressures on the existing building material supply and
help to arrest the spiraling rise in cost of these materials and also may reduce insitu
construction activities (Abang, 1995).
Ferrocement is one of the relatively new cementitious composite considered as a
construction material. It is a type of thin walled reinforced concrete commonly consists
of cement mortar reinforced with closely spaced layers of continuous and relatively
small wire mesh (ACI 549R, 1997; ACI 549 2R, 2004). The closely-spaced and
uniformly-distributed reinforcement in ferrocement, transforms the otherwise brittle
material into a superior ductile composite. Thus, ferrocement has been regarded as
highly versatile construction material possessing unique properties of strength and
serviceability. Its advantageous properties such as strength, toughness, water tightness,
lightness, durability, fire resistance, and environmental stability cannot be matched by
any other thin construction material (Naaman, 2000). Ferrocement is the promising
composite material for prefabrication and industrialization of the building industry
(Suresh, 2004; Austriaco, 2006). However, as an alternative construction material,
ferrocement has not gained widespread acceptance in both; developed countries in
general and developing countries in particular. Its acceptance is hindered mainly due to
its small thickness and labor intensive method of production (Abang, 1995; Naaman,
2001). In order to cope with the problem of thickness, one of the options currently
suggested is to develop ferrocement sandwich elements. This technique provides not
2
only the thickness but makes the sandwich element lightweight and good heat
insulating.
Sandwich panel is a three-layer element comprising of two thin, flat facing
plates of relatively higher strength material and between which a thick core of relatively
lower strength and density is encased or it could consists of thin skin box of relatively
higher strength material in-filled with relatively weaker and lower density material
known as core. These have been used in the aerospace industry for many years and
more recently they are being used as load bearing members in naval structures (Mahfuz
et al., 2004). Presently, it has gained attention to be used as an effective structural form
in the building and construction industries. Sandwich construction form has distinct
advantages over conventional structural sections, because it promises high stiffness and
high strength to weight ratios (Tat and Qian, 2000; Arafa and Balaguru, 2006). Hence,
it is only natural that currently almost every field of industry resorts to the use of
sandwich material in building and construction. The introduction of new materials such
as laminated composites; ferrocement, for the face sheets/skin box and low density
materials like aerated concrete, for the core presents new possibilities in the design of
sandwich construction.
Aerated concrete is either cement or lime mortar, classified as lightweight
concrete, in which air-voids are entrapped in the mortar matrix by means of suitable
aerating agent (Arreshvhina, 2002; Narayanan and Ramamurthy, 2000a). Aerated
concrete refers to concrete having excessive amounts of air voids. These air bubbles are
created to reduce the density of the concrete and to make it lightweight, which provides
good thermo-acoustic insulation too. However, aerated concrete, which is a porous
material and classified as cellular construction material exhibits low compressive
strength and high rate of water absorption (Arreshvhina 2002; Arreshvhina and Zakaria,
2002). It can be used as a potential material for core in sandwich composite because of
its relatively more compressive strength compared to the traditional lightweight core
materials like foam. Attention has not been paid in order to investigate its suitability as
core material in sandwich construction. Most recently, its application as core material in
FRP-AAC sandwich panels has been reported so far (Nasim et al., 2006; Juan et al.,
2007). However, the literature is silent about its application as core in cement-based
sandwich composite structural panels.
It is therefore, this study is aimed to develop a cement based ferrocement-
aerated sandwich wall elements by encasing the aerated concrete with ferrocement.
3
1.2 Background and Rationale
In Malaysia the pace of development and construction activity achieved since
last three decades was even beyond the expectations rather dreams three decades ago. It
has spurred the demand for fast, cost-effective and quality residential buildings
(Zakaria, 1999). The supply of houses by both the public and private sectors is still far
from meeting the demand (Waleed et al., 2004). In this age of rising cost of building
materials and labor is another problem which makes it imperative to study the economic
and systematic application of new construction materials and systems.
Industrialization of the building system by developing efficient prefabricated
composite cellular structural elements may deal with the problem amicably where the
fabrication of the elements takes place in factory and the elements are installed with
minimum time period and labor at the site. This may also lead to the reduction in the
foreign labor engaged in the construction industry of the country causing economical
and social problems.
1.3 Statement of the Problem
The development of lightweight, industrialized and sustainable housing system
in Malaysia as per modular coordination system is a need of the day. The present
modular coordination system usually focus on the use of cement or concrete blocks for
the infill or to certain extent as load bearing walls which are heavy in weight.
Ferrocement structural elements are widespread as lightweight, high performance
composite material which can replace its counterpart conventional materials. However,
these could not gain popular acceptance here due to its thin section causing noise and
heat transfer and also the perceived corrosion problem particularly in the tropical
environment of Malaysia. Moreover, the psychological factor coined with buildings
constructed with such thin sections would be perceived as unsafe to live, is also another
factor which hinders the application of ferrocement.
Thus, sandwich composite construction system, presents one of the potential
solution, where, ferrocement is applied as face sheets/encasement and lightweight
aerated concrete is adopted as core. The problem of the labor intensive production of
ferrocement may be addressed by developing mechanized system of casting identical to
that of the ordinary RC sections. The structural sandwich elements should be as per the
4
standard size leading towards the industrialization of building system, in order to reduce
the insitu construction which is associated with social and economy problems.
1.4 Aim and Objectives of the Study
The main aim of this research investigation is to manufacture and study the
behaviour and properties of ferrocement encased aerated concrete sandwich wall
elements.
Towards achieving the above mentioned aim, the related objectives associated
were identified as follows:
1. To investigate the minimum flow value (flow table) of cement mortar
capable to be poured during the casting of thin ferrocement encasement.
2. To establish the optimum high workability and high performance mortar
with slag and superplasticizer.
This pertained to the compressive strength, strength development,
unit weight, curing regime, water absorption and ISAT (permeability) as
parameters of study
3. To study the behaviour of ferrocement encased aerated concrete
sandwich specimens.
This part of study was focused on, to optimize the various
variables; in compression as principal testing and in flexure as additional
testing.. The variables investigated were, type and number of wire mesh
layers, overall unit weight, core dimensions (core-encasement volumetric
ratio) to achieve lightweight sandwich, and the encasement direction
(parallel or perpendicular to the loading direction) effective in terms of
compressive strength. Water absorption and ISAT tests were also
included in this part of study. A variety of specimens of standard size;
cubes, blocks and prism beams were cast and tested.
4. To investigate the behaviour of ferrocement encased lightweight aerated
concrete wall elements of relatively large size particularly in
compression with additional flexural and ultrasonic pulse velocity (UPV)
tests.
5. To develop mathematical models.
This was final step towards this research study during which two
mathematical models were developed to predict:
5
(a) Compressive strength of high workability slag cement based
mortar for ferrocement.
(b) Ultimate load of ferrocement encased aerated concrete sandwich
wall elements in compression.
1.5 Scope and Limitations of the Study
The study is almost experimental in nature. The study consists of two-phase
study scheme. First phase of the present research focuses on development of optimum,
high workability and high performance mortar, which should be capable to be poured
during the casting of ferrocement skin boxes over aerated concrete, in single operation.
The performance of the mortar was investigated in terms of compressive strength,
strength development, water absorption, and unit weight. The specimens were cured in
three curing regimes namely water, air, and natural weather in order to determine the
appropriate curing regimes to be adopted for sandwich specimens. The effect of slag as
cement replacement in mortar to make it low cost is also included.
During the second phase of the experimental programme, behaviour of sandwich
specimens; cubes, blocks prism beams and wall elements of relatively large size, were
investigated under compression as major parameter and under bending as additional
parameter. To achieve the main aim, a stepwise strategy was adopted by addressing a
number of variables. Two types of wire mesh namely square welded wire mesh, and
chicken wire mesh were incorporated in ferrocement box by varying the number of
layers; 0, 1, 2, 3 and 4. The performance of the sandwich specimens were studied in
terms of ultimate compressive strength and flexural strength (modulus of rupture), unit
weight load-axial deformation, and load-lateral deformation under compression along
with load-deflection and load-strain relationship under bending. The failure mode and
composite action of sandwich elements under both the loading conditions were also
studied. In addition, efforts were made that it should be low cost, lightweight, and
water resistant. To investigate the material uniformity of sandwich wall elements
applying UPV test was also included in the scope of this study. Aerated concrete
previously developed in UTM (Arreshvhina, 2002) and subsequently improvised were
used as core during this study. Finally mathematical models were developed which
were related to both the phases of this study. The mathematical models developed were
applicable to predict compressive strength of high workability slag-cement based mortar
and ferrocement encased lightweight aerated concrete sandwich wall elements.
6
1.6 Significance of Research
The research and its findings will encourage the use of the new approach to
produce lightweight composite wall elements for industrialized building system and
hence promoting better quality construction and innovative system in our construction
industry. The study surely is a step forward in the right direction to achieve quality
products.
This current project is able:
1. To produce a new potential structural composite, that is an integration of
ferrocement and aerated concrete for modern industries of modular
housing and building system.
2. To develop a novel method of prefabrication ferrocement sandwich wall
element for use in modular housing and building system which can be
developed and marketed nationally and internationally.
3. To help solve the problem of low and middle income earners to own
houses.
7
CHAPTER 2
LITERATURE REVIEW
2.1 General Appraisal
The world is witnessing a revolution in construction practices along with a new
phase of development fuelled by the rapid economic growth and the high rate of
urbanization. Construction provides the direct means for the development, expansion,
improvement and maintenance of urban settlements (Suresh, 2004). The construction
industry is entering in an era of globalization where the utilization of the latest
technology and material shall no longer recognize national borders (Abang, 1999).
Thus, the construction industry must keep up with the advanced technology and systems
to cope with the modern trends and demands. The growing need for affordable houses
is a much discussed subject because due to spiraling construction cost, housing today is
not an affordable proposition for the common people even on the international scene.
Malaysia also is not spared from the problem of inadequate housing. There is still a
very high demand for affordable houses in the country (Mahyuddin and Wahab, 1994;
Abang, 1995; Waleed et al., 2004). Especially in the case of developing countries, the
gap between demand and supply of adequate housing is continuously increasing
(Shaikh, 1999; Arif et al., 2001; Waleed et al., 2004). The duration of construction is
vital in this regard. In order to minimize the time span of the construction,
prefabrication is generally preferred.
Prefabricated structures are also preferred for rapid construction of tourism
facilities such as, transportation utilities, communication units, hotels etc. In order to
satisfy the ascending demand for rapid construction of the structures mentioned, the
method of prefabrication is remarkably employed now days (Korkmaz and Tankut,
2005). Precast concrete members offer various advantages in service and quality over
their cast-in-place correspondents; such as their higher allowance for quality control
(Seckin and Fu, 1990; Soubra et al., 1991; Soubra et al., 1993), the ready supply of
good quality aggregates, much higher strength due to better batching and quality control
of the concrete achieved through the use of a specialized labour force under factory
conditions and results in the reduced construction activities at the site (Korkmaz and
8
Tankut, 2005). In this context, there is need for the adoption of cost-effective and
environmentally appropriate technology and materials.
Recent years has seen a renewed interest in the development of precast
composite structural elements by adopting the technique of sandwich. Precast sandwich
elements present a series of possibilities for the solution of housing problems.
2.2 Sandwich Structural Elements/Members
2.2.1 Introduction
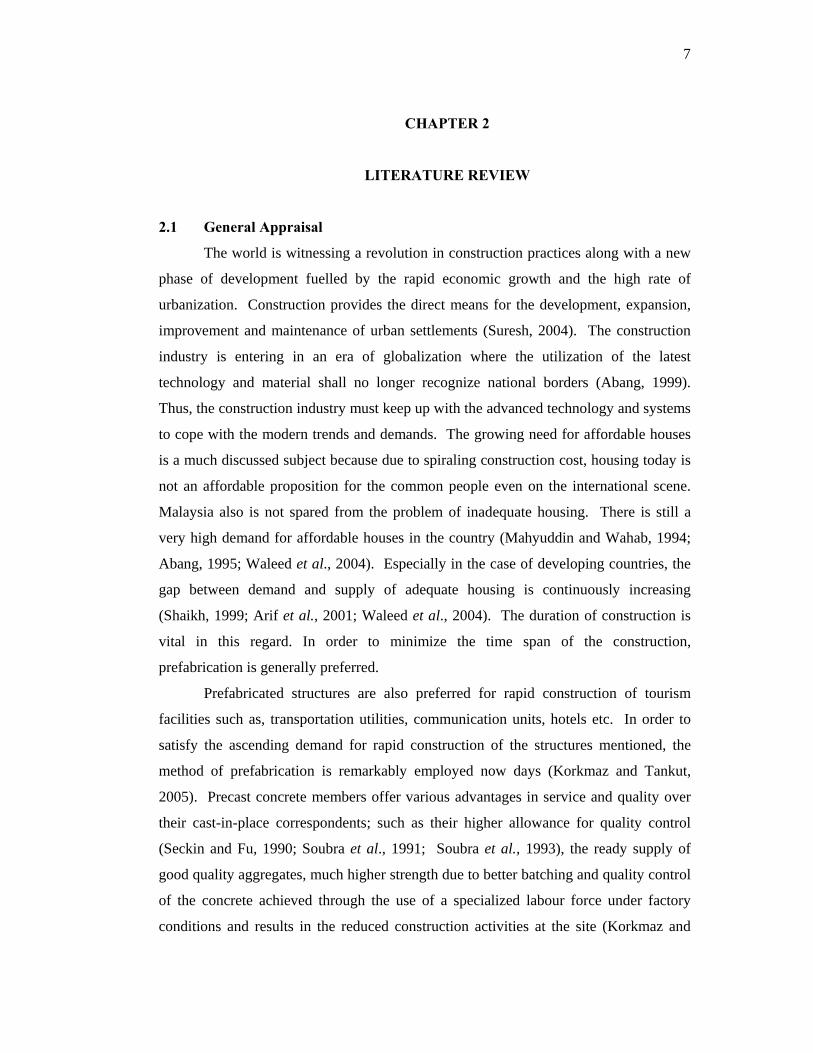
A sandwich panel is a three-layer element, comprising two thin, flat facing
plates of high-strength material and between which a thick lightweight core of low
average strength is attached. Figure 2.1 presents a few types of sandwich panel
elements. Such sandwich structures have gained widespread acceptance within the
aerospace, naval/marine, automotive and general transportation industries as an
excellent way to obtain extremely lightweight components and structures with very high
bending stiffness, high strength and high buckling resistance (Mahfuz et al., 2004;
Liang and Chen, 2006).
(a) foam core sandwich
(b) Honeycomb sandwich
(c) web core sandwich
(d) Truss core sandwich
Figure 2.1: Types of sandwich elements (An, 2004)
9
2.2.2 Advantages of Sandwich
Sandwich construction form has distinct advantages over conventional structural
sections because it promises high stiffness and high strength-to-weight ratio (Tat and
Qian, 2000; Araffa and Balaguru, 2006) as compared with a solid member. Sandwich
composite structure possesses excellent flexural and shear properties. Their inherent
lightweight characteristics make them ideal structural components where weight
reduction is desirable (Serrano et al., 2007). Thus structural sandwich panels are
becoming important elements in modern lightweight construction.
In concrete construction, self-weight of structure itself represents a very large
proportion of the total load on the structures (Mouli and Khelafi, 2006) thus, reduction
in the self-weight of the structures by adopting an appropriate approach results in the
reduction of element cross-section, size of foundation and supporting elements thereby
reduced overall cost of the project. The lightweight structural elements can be applied
for construction of the buildings on soils with lower load-bearing capacity (Carmichael,
1986).
Reduced self weight of the structures using lightweight concrete reduces the risk
of earthquake damages to the structures because the earth quake forces that will
influence the civil engineering structures and buildings are proportional to the mass of
the structures and building. Thus reducing the mass of the structure or building is of
utmost importance to reduce their risk due to earthquake acceleration (Ergul et al.,
2004).
Among the other advantages, its good thermal insulation due to the cellular thick
core makes it an ideal external construction component (Bottcher and Lange, 2006).
Some recent investigations suggest their excellent energy-absorbing characteristics
under high-velocity impact loading conditions (Villanueva and Cantwell, 2004).
Sandwich structures have been considered as potential candidate to mitigate impulsive
(short duration) loads (Nemat-Nasser et al., 2007).
2.2.6 Precast Concrete Sandwich Panels
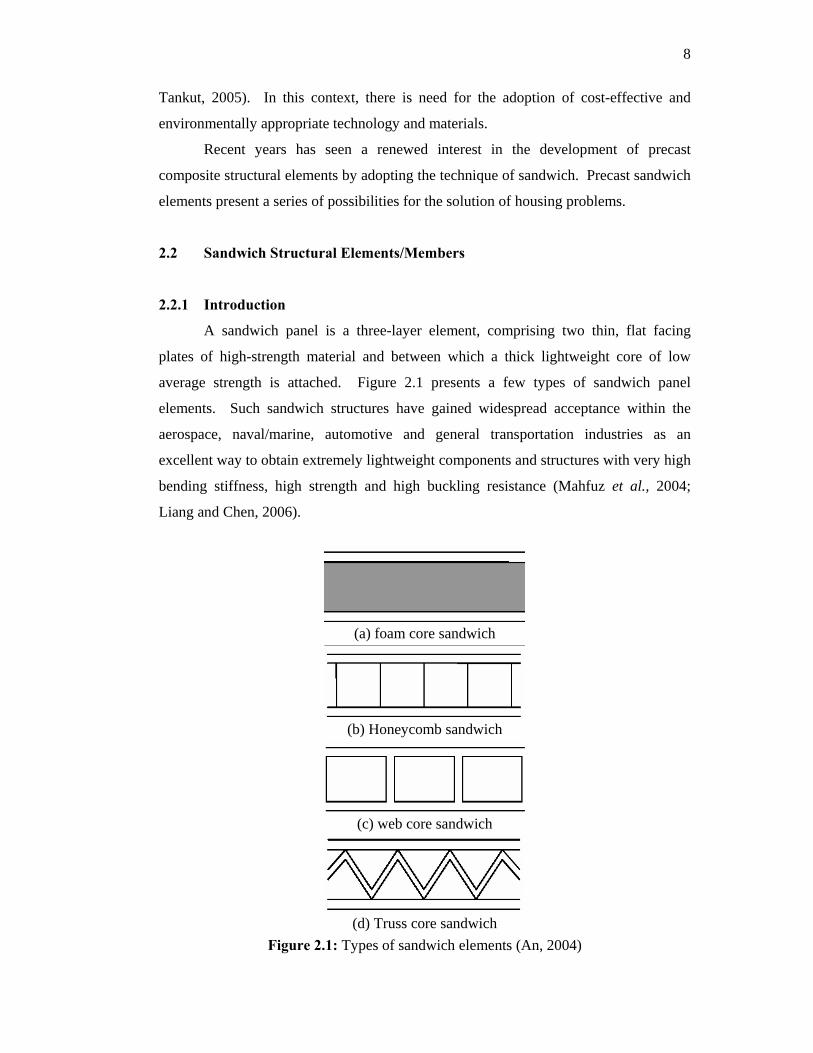
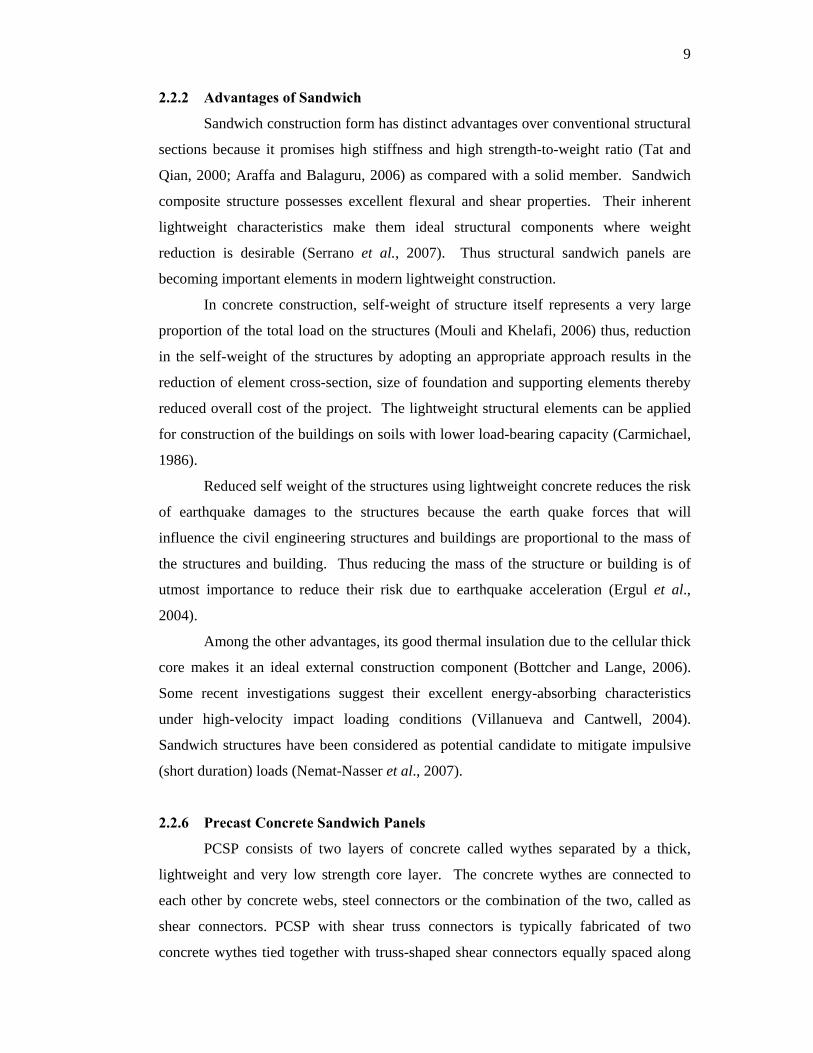
PCSP consists of two layers of concrete called wythes separated by a thick,
lightweight and very low strength core layer. The concrete wythes are connected to
each other by concrete webs, steel connectors or the combination of the two, called as
shear connectors. PCSP with shear truss connectors is typically fabricated of two
concrete wythes tied together with truss-shaped shear connectors equally spaced along
10
the length of the panel as depicted in Figure 2.2, while Figure 2.3 shows the PCSP,
where the wythes are connected by webs.
It is generally accepted that this type of panels has been in use for more than 40
years in North America. Their application, however, has been restricted as cladding
panels. Now a days, many sandwich panels in use in the North America and Europe are
proprietary but very limited is available, because the producers are reluctant to share
information with their competitors (PCI, 1997; Bush and Zhigi, 1999).
The first prefabricated panels were of non-composite type and consisted of a
structural wythe (layer) and a non-structural wythe separated by a layer of insulation,
whereas composite type panels were manufactured later (Benayoune et al., 2007a).
Figure 2.2: Sections of PCSP with shear connectors (Lindsay, 2003)
Figure 2.3: Sandwich elements with webs
11
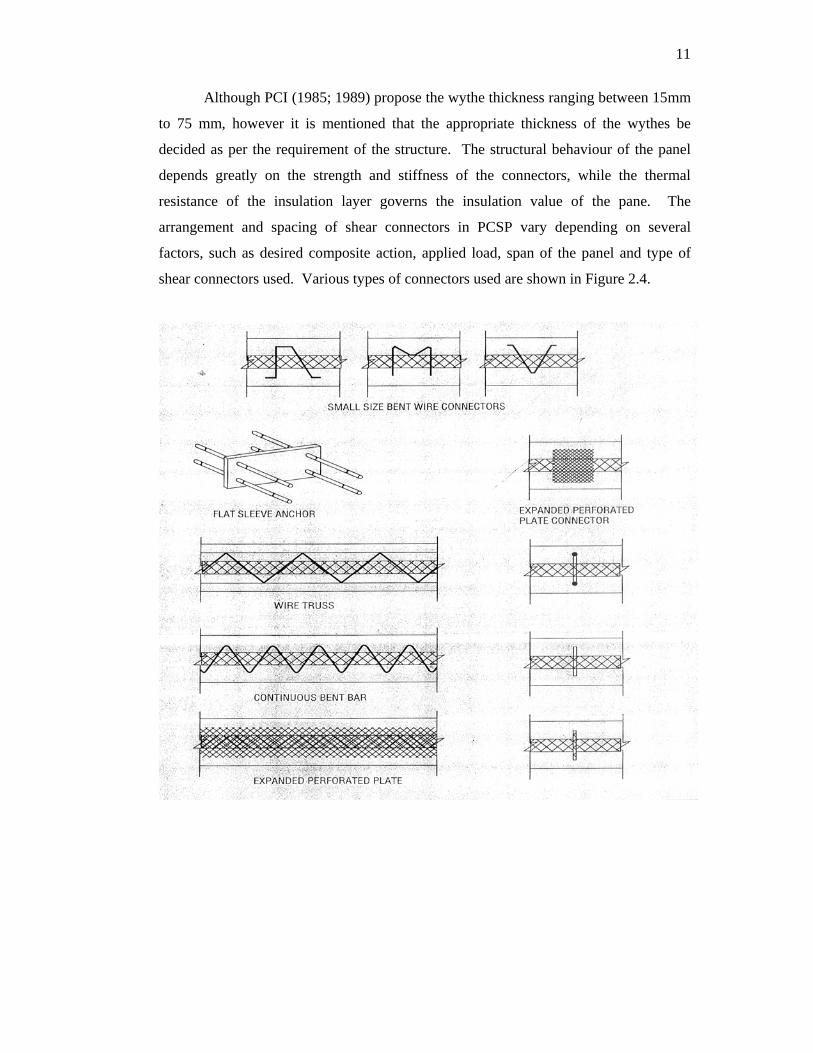
Although PCI (1985; 1989) propose the wythe thickness ranging between 15mm
to 75 mm, however it is mentioned that the appropriate thickness of the wythes be
decided as per the requirement of the structure. The structural behaviour of the panel
depends greatly on the strength and stiffness of the connectors, while the thermal
resistance of the insulation layer governs the insulation value of the pane. The
arrangement and spacing of shear connectors in PCSP vary depending on several
factors, such as desired composite action, applied load, span of the panel and type of
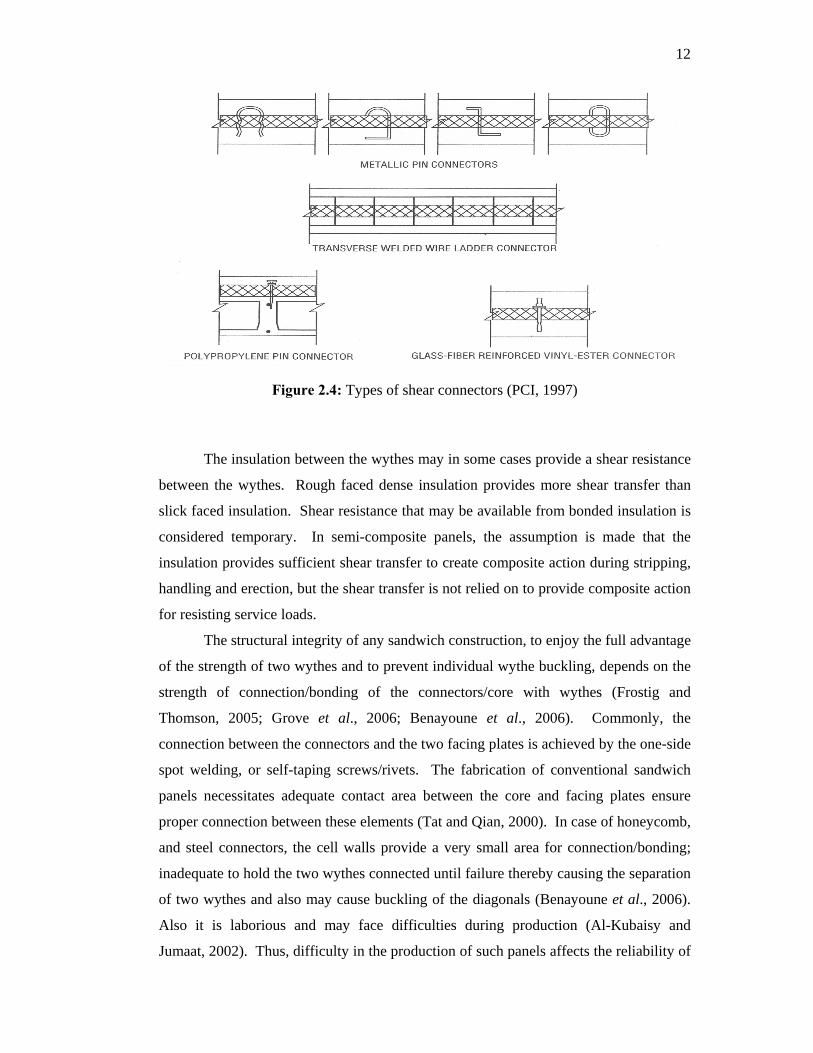
shear connectors used. Various types of connectors used are shown in Figure 2.4.
12
Figure 2.4: Types of shear connectors (PCI, 1997)
The insulation between the wythes may in some cases provide a shear resistance
between the wythes. Rough faced dense insulation provides more shear transfer than
slick faced insulation. Shear resistance that may be available from bonded insulation is
considered temporary. In semi-composite panels, the assumption is made that the
insulation provides sufficient shear transfer to create composite action during stripping,
handling and erection, but the shear transfer is not relied on to provide composite action
for resisting service loads.
The structural integrity of any sandwich construction, to enjoy the full advantage
of the strength of two wythes and to prevent individual wythe buckling, depends on the
strength of connection/bonding of the connectors/core with wythes (Frostig and
Thomson, 2005; Grove et al., 2006; Benayoune et al., 2006). Commonly, the
connection between the connectors and the two facing plates is achieved by the one-side
spot welding, or self-taping screws/rivets. The fabrication of conventional sandwich
panels necessitates adequate contact area between the core and facing plates ensure
proper connection between these elements (Tat and Qian, 2000). In case of honeycomb,
and steel connectors, the cell walls provide a very small area for connection/bonding;
inadequate to hold the two wythes connected until failure thereby causing the separation
of two wythes and also may cause buckling of the diagonals (Benayoune et al., 2006).
Also it is laborious and may face difficulties during production (Al-Kubaisy and
Jumaat, 2002). Thus, difficulty in the production of such panels affects the reliability of
13
the connection between the elements resulting in uncertain role of connectors and
interaction between various components. This is why, it continues to be a problem for
investigators and fabricators alike (Tat and Qian, 2000; Benayoune et al., 2006 ).
Moreover, the connectors pass from one concrete wythe to the other concrete
wythe through the insulation layer. Thus, the placement of the connectors interrupts the
continuous insulation layer. These interruptions are known as thermal bridges.
Depending upon the material used to make the connectors in a panel, the thermal
performance of panel may be decreased; in some cases as much as 40% by the large
quantities of heat conducted through the shear connectors passing through the insulation
(Lee and Pessiki, 2006).
On the other hand, the foam cores are bonded with the wythes by means of
various types of bonding agents. Although the foam cores provide a large area in
contact with the wythes, however it entirely depend upon the type, quality, an efficiency
of bonding material along with the skills adopted during the bonding process. Flaws in
the form of debond between the wythes and the core are likely to prevail, and if the
flaws propagate they may impart effect on the load-bearing capacity of the structure
because of the loss of load transfer between the facings (Prasad, 1993).
In addition, it has been demonstrated time and again that during flexural loading
be static or cyclic, core (foam cores) basically controls the failure of the sandwich
structures. Interfacial delaminating in a sandwich panel represents a severe defect that
affects the overall integrity and safety of the structure. It typically begins as a
delamination crack at the core–skin interface near the loading point, advances towards
the support along the sub-interface (Mahfuz et al., 2004; Frostig and Thomson 2005;
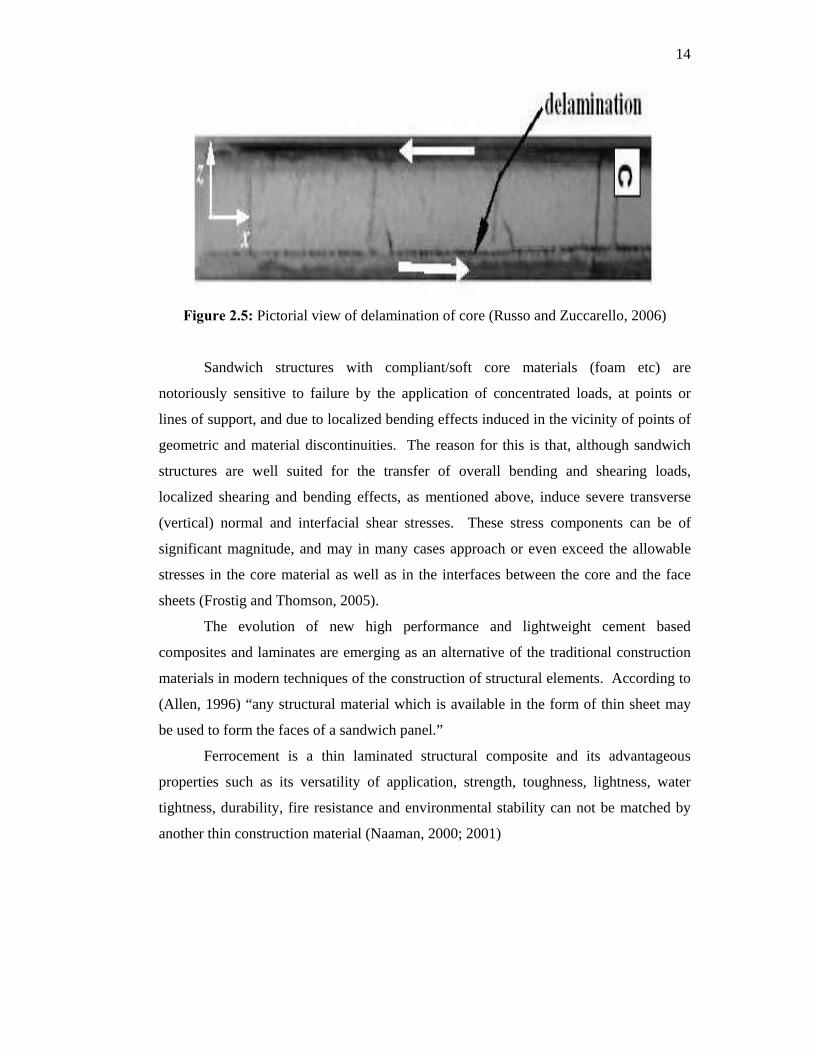
Russo and Zuccarello, 2006) kinks into the core. Figure 2.5 shows the interfacial
delamination between core and wythes. Thus, in any event, it is clear that the
delamination at the sub-interface region and the shear strength of the core in essence
dictate the performance of the sandwich composites under flexure.
14
Figure 2.5: Pictorial view of delamination of core (Russo and Zuccarello, 2006)
Sandwich structures with compliant/soft core materials (foam etc) are
notoriously sensitive to failure by the application of concentrated loads, at points or
lines of support, and due to localized bending effects induced in the vicinity of points of
geometric and material discontinuities. The reason for this is that, although sandwich
structures are well suited for the transfer of overall bending and shearing loads,
localized shearing and bending effects, as mentioned above, induce severe transverse
(vertical) normal and interfacial shear stresses. These stress components can be of
significant magnitude, and may in many cases approach or even exceed the allowable
stresses in the core material as well as in the interfaces between the core and the face
sheets (Frostig and Thomson, 2005).
The evolution of new high performance and lightweight cement based
composites and laminates are emerging as an alternative of the traditional construction
materials in modern techniques of the construction of structural elements. According to
(Allen, 1996) “any structural material which is available in the form of thin sheet may
be used to form the faces of a sandwich panel.”
Ferrocement is a thin laminated structural composite and its advantageous
properties such as its versatility of application, strength, toughness, lightness, water
tightness, durability, fire resistance and environmental stability can not be matched by
another thin construction material (Naaman, 2000; 2001)
15
2.2 Ferrocement
2.3.1 Introduction
“Ferrocement is a type of thin wall reinforced concrete commonly constructed
of hydraulic cement mortar reinforced with closely spaced layers of continuous and
relatively small diameter wire mesh; the mesh may be made of metallic or other suitable
materials” (ACI 549R, 1997; ACI-549 2R, 2004).
2.3.3 Constituents of Ferrocement
Ferrocement is defined as being made of cement-based mortar mix and steel
wire mesh reinforcement. However, a broader definition of ferrocement includes the
use of skeletal steel in addition to the mesh system.
2.3.3.1 Mortar Mix
The hydraulic cement mortar mix consists of Portland cement, fine aggregate
(sand), water and various admixtures as per the requirement. The materials should
satisfy standards similar to those used for quality reinforced concrete construction, with
particular attention paid to the type of application (IFS-10, 2001). Naaman (2000)
proposed that the actual mix design should be optimized, whenever possible, with
respect to the available local materials and environmental conditions.
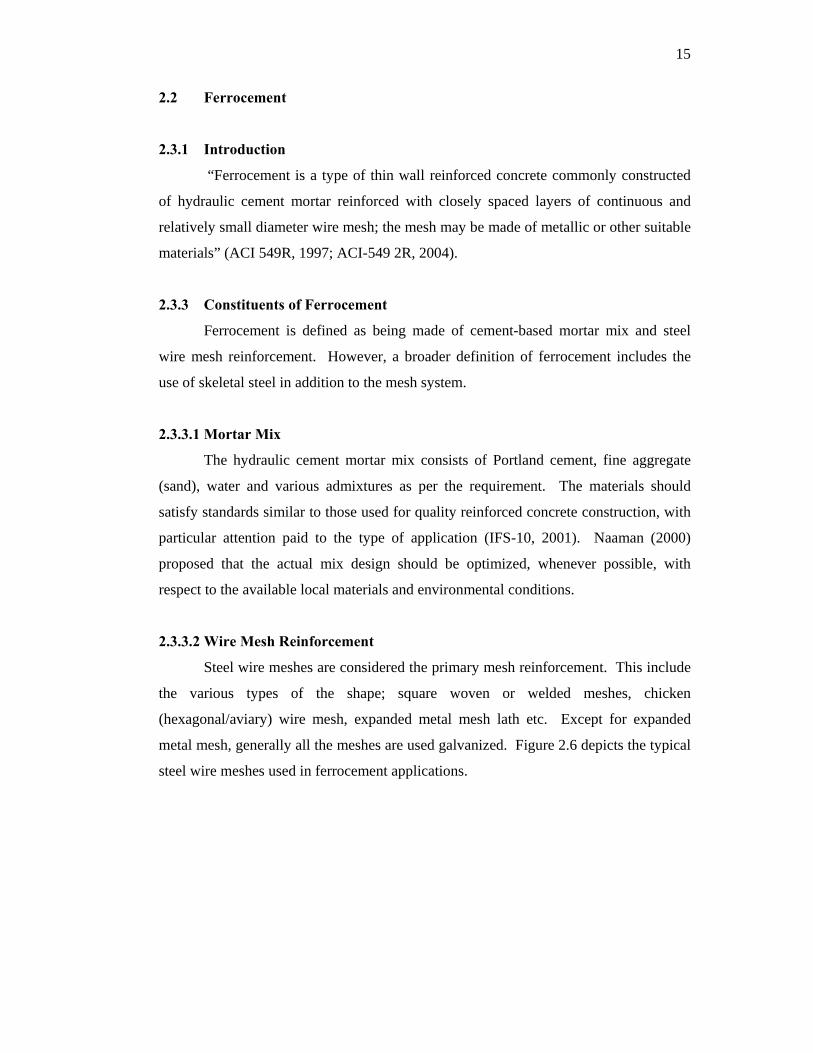
2.3.3.2 Wire Mesh Reinforcement
Steel wire meshes are considered the primary mesh reinforcement. This include
the various types of the shape; square woven or welded meshes, chicken
(hexagonal/aviary) wire mesh, expanded metal mesh lath etc. Except for expanded
metal mesh, generally all the meshes are used galvanized. Figure 2.6 depicts the typical
steel wire meshes used in ferrocement applications.
16
Figure 2.6: Typical steel meshes used in ferrocement (IFS-10, 2001)
2.3.3.3 Skeletal Steel
Skeletal steel used in ferrocement is in form of welded fabric as a grid of steel
rods, strands of small diameters. Skeletal reinforcement is needed to form the shape of
the structure to be built; around mesh layers are attached. Skeletal steel is only used
when the thickness of the ferrocement element allows.
2.3 4 Ferrocement versus Reinforced Concrete (Distinct Characteristics)
As stated in the definition, ferrocement is a type of reinforced concrete
construction. While, such a definition implies many similarities between ferrocement
and reinforced concrete, there is a number of differentiating factors sufficiently
important to explain the differences in their behaviour.
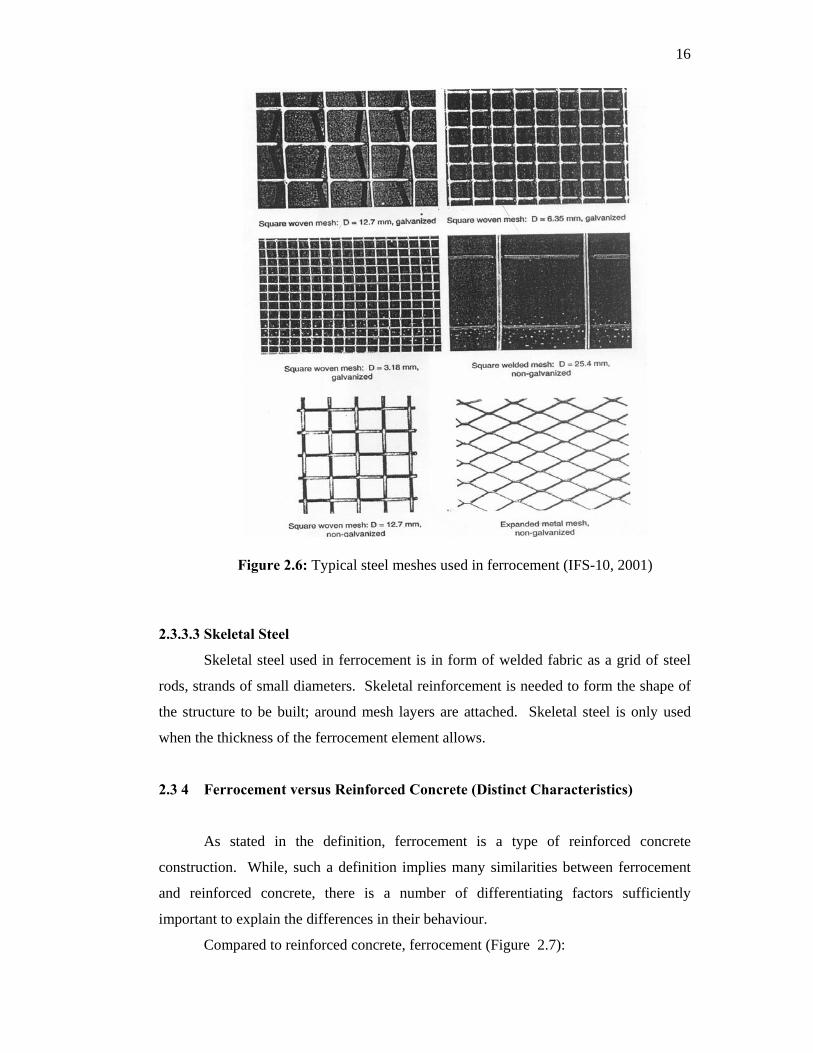
Compared to reinforced concrete, ferrocement (Figure 2.7):
17
• Is a thinner material.
• Has distributed reinforcement.
• Is reinforced in two directions (transverse and longitudinal).
• Has matrix made of fine mortar or paste instead of concrete which
contains larger size aggregates (the maximum size of the particles in
ferrocement is controlled by the average opening of the stack of mesh
system to be encapsulated).
Figure 2.7: Typical cross section of ferrocement versus reinforced
concrete (Naaman, 2000)
2.3.5 Ferrocement: A Composite and a Member of the Structural Concrete
Family
Cement-based composites are generally viewed as two-component materials: the
cement-based matrix and the reinforcement. In fact, the matrix alone (which generally
comprises cement, sand, water, and other additives) may be considered a composite by
itself; while steel reinforcement is not a composite material. A composite is a material
made of at least two different components, resulting in a synergism where the
composite property of interest for a particular application is better than either of
components taken separately.
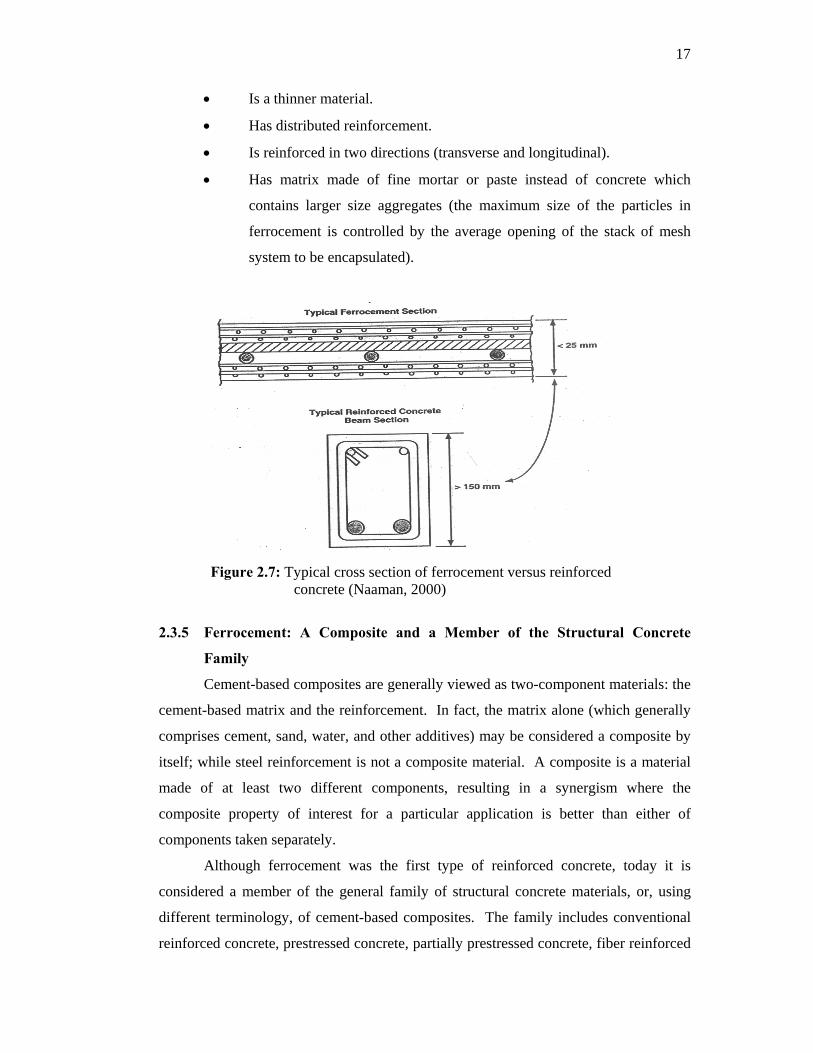
Although ferrocement was the first type of reinforced concrete, today it is
considered a member of the general family of structural concrete materials, or, using
different terminology, of cement-based composites. The family includes conventional
reinforced concrete, prestressed concrete, partially prestressed concrete, fiber reinforced
18
concrete, and several of their combinations. The flow chart in Figure 2.8 attempts to
place ferrocement in this family and shows that each member can stand alone or in
combination with other members. Applications where a combination of materials or
concepts is used include, for instance, where ferrocement is applied as a jacket to
confine reinforced concrete columns, or where discontinuous fibers are added to
ferrocement to provide a hybrid composite with improved properties.
Figure 2.8: Ferrocement as a member of structural concrete family (Naaman, 2000)
2.3.7 Mechanical Properties
Many of the properties unique to ferrocement derive from the relatively large
amount of two-way reinforcement made up of relatively small elements with much
higher surface area than conventional reinforcement.
In the words of Nervi (ACI 549R, 1997), who first used the term ferrocement, its
most notable characteristics are “greater elasticity and resistance to cracking given to
the cement mortar by the extreme subdivision and distribution of the reinforcement.
Where, volume fraction and the specific surface area are the two factors that recognize
the definition of extreme subdivision and distribution of reinforcement in ferrocement.
19
2.3.7.1 Tensile Strength
Ferrocement is often described in the professional literature as a wonder material
that does not crack and that has a variety of marvelous properties. In fact, ferrocement
can be considered a small-scale model of a super reinforced concrete; it does indeed
crack, but cracking in ferrocement under service loads can be so fine that it is not visible
to the naked eye. Ferrocement possesses a distinct behaviour in tension compared to
that of reinforced concrete.
The behaviour of ferrocement in tension is extremely interesting since
ferrocement seems to adapt slowly to increasing load by increasing its extensibility.
When cracks keep forming, crack width does not increase proportionately to the applied
load, and thus crack widths tend to remain smaller than otherwise in reinforced
concrete. The stress, at which no more new cracks formed, is called the stabilization
stress. Beyond the stabilization stress (at crack saturation), the width of the existing
cracks increases with loading and the behaviour of the composite is controlled.
However, crack widths in ferrocement can be one or two orders of magnitude smaller
than in reinforced concrete by that of the reinforcement (Arif et al., 1999; Naaman,
2000).
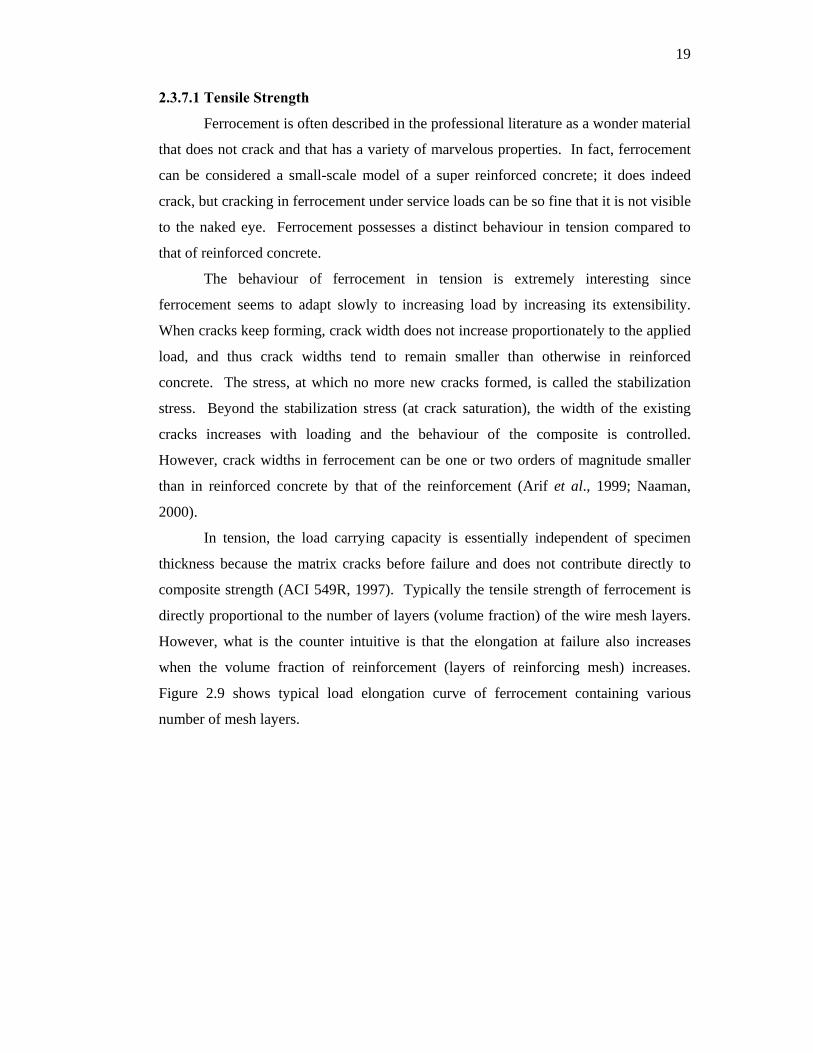
In tension, the load carrying capacity is essentially independent of specimen
thickness because the matrix cracks before failure and does not contribute directly to
composite strength (ACI 549R, 1997). Typically the tensile strength of ferrocement is
directly proportional to the number of layers (volume fraction) of the wire mesh layers.
However, what is the counter intuitive is that the elongation at failure also increases
when the volume fraction of reinforcement (layers of reinforcing mesh) increases.
Figure 2.9 shows typical load elongation curve of ferrocement containing various
number of mesh layers.
20
Figure 2.9: Typical load-elongation curve of ferrocement.(Naaman, 2000)
One of the key characteristics of ferrocement when compared to reinforced
concrete is its substantially higher (one to two orders of magnitude) specific surface of
reinforcement for a volume fraction of reinforcement of about the same order. This
leads to a number of features particular to ferrocement behaviour, as observed in
numerous experimental investigations. The studies have observed that, everything else
being equal, the tensile strength at first cracking in ferrocement is directly proportional
to the specific surface of reinforcement (Swamy and Shaheen, 1990; Somayaji and
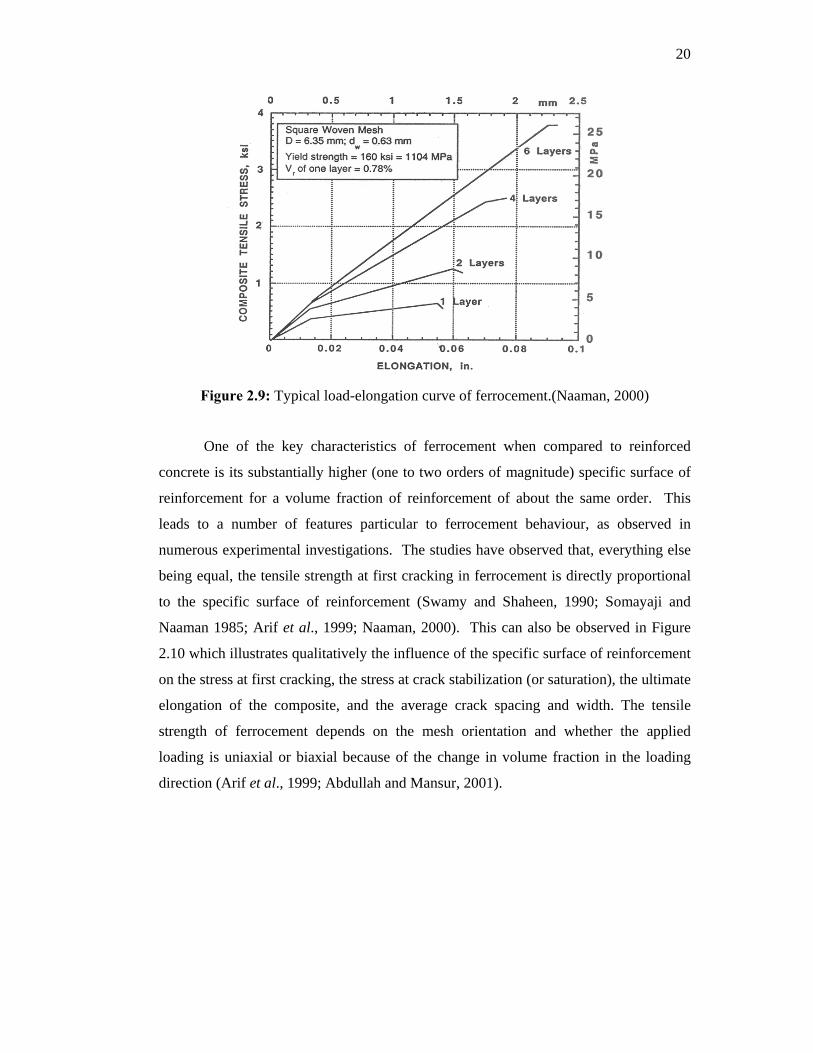
Naaman 1985; Arif et al., 1999; Naaman, 2000). This can also be observed in Figure
2.10 which illustrates qualitatively the influence of the specific surface of reinforcement
on the stress at first cracking, the stress at crack stabilization (or saturation), the ultimate
elongation of the composite, and the average crack spacing and width. The tensile
strength of ferrocement depends on the mesh orientation and whether the applied
loading is uniaxial or biaxial because of the change in volume fraction in the loading
direction (Arif et al., 1999; Abdullah and Mansur, 2001).
21
Figure 2.10: Typical qualitative influence of specific surface of
reinforcement on properties of ferrocement (Naaman, 2000)
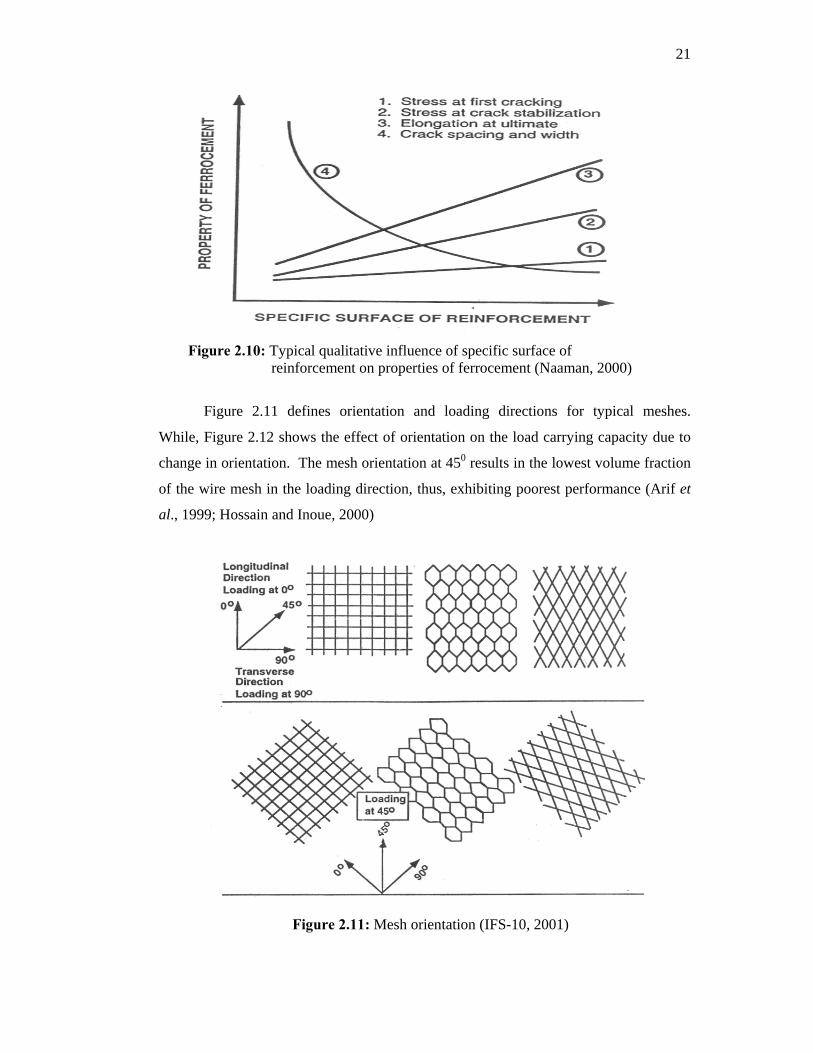
Figure 2.11 defines orientation and loading directions for typical meshes.
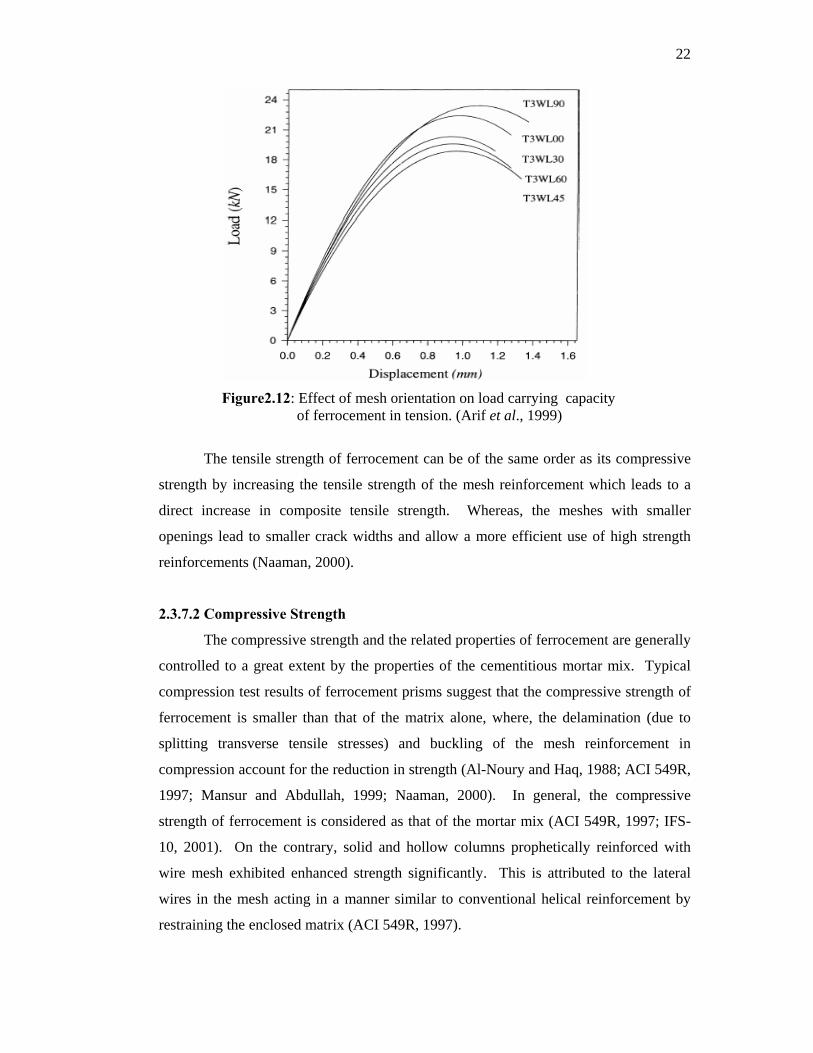
While, Figure 2.12 shows the effect of orientation on the load carrying capacity due to
change in orientation. The mesh orientation at 450 results in the lowest volume fraction
of the wire mesh in the loading direction, thus, exhibiting poorest performance (Arif et
al., 1999; Hossain and Inoue, 2000)
Figure 2.11: Mesh orientation (IFS-10, 2001)
22
Figure2.12: Effect of mesh orientation on load carrying capacity of ferrocement in tension. (Arif et al., 1999)
The tensile strength of ferrocement can be of the same order as its compressive
strength by increasing the tensile strength of the mesh reinforcement which leads to a
direct increase in composite tensile strength. Whereas, the meshes with smaller
openings lead to smaller crack widths and allow a more efficient use of high strength
reinforcements (Naaman, 2000).
2.3.7.2 Compressive Strength
The compressive strength and the related properties of ferrocement are generally
controlled to a great extent by the properties of the cementitious mortar mix. Typical
compression test results of ferrocement prisms suggest that the compressive strength of
ferrocement is smaller than that of the matrix alone, where, the delamination (due to
splitting transverse tensile stresses) and buckling of the mesh reinforcement in
compression account for the reduction in strength (Al-Noury and Haq, 1988; ACI 549R,
1997; Mansur and Abdullah, 1999; Naaman, 2000). In general, the compressive
strength of ferrocement is considered as that of the mortar mix (ACI 549R, 1997; IFS-
10, 2001). On the contrary, solid and hollow columns prophetically reinforced with
wire mesh exhibited enhanced strength significantly. This is attributed to the lateral
wires in the mesh acting in a manner similar to conventional helical reinforcement by
restraining the enclosed matrix (ACI 549R, 1997).
23
Everything else being equal, the mesh type (expanded or hexagonal versus
square) and its orientation (such as 45 versus 0 or 90 degrees) also influence the
compressive strength The hexagonal and expanded metal meshes oriented in the
direction of loading are less effective than similarly oriented welded square wire
meshes. Meshes oriented at 45 degrees are also less effective than meshes aligned
along the loading direction (ACI 549R, 1997; Hossain and Inoue, 2000).
There is initial and final non-linearity of strain-stress plots of ferrocement with
non-linearity in between. Generally 50-60% of the ultimate strength, ferrocement
exhibits the linearity (Rao and Rao, 1986; Rao, 1992; Hossain and Inoue, 2000).
2.3.7.3 Bending (Flexure)
Bending reflects the combined influence of parameters controlling both tensile
and compression properties, such as mortar compressive strength, mesh type, mesh
properties and mesh orientation. Moreover, it is believed that the two-way nature of the
mesh reinforcement generally imparts some additional strength and safety when
bending is considered in one direction only (one-way bending). Similar to the case of
tension, ferrocement exhibits typical behaviour in bending also.
The ferrocement with the mesh layers even bundled at the centre of the cross-
section behaves similar to that of the plane mortar under bending. Thus, in ferrocement
bending elements, as in reinforced concrete, the most efficient layer of mesh is that
closest to the extreme fiber or face of the element (Paramasivam and Ravindarajah,
1988). The specific surface of reinforcement does not have as strong an influence on
the cracking behaviour in bending as in tension. The average crack width in
ferrocement bending elements is primarily a function of the tensile strain in the extreme
layer of mesh and the transverse wire spacing (Naaman, 2000)
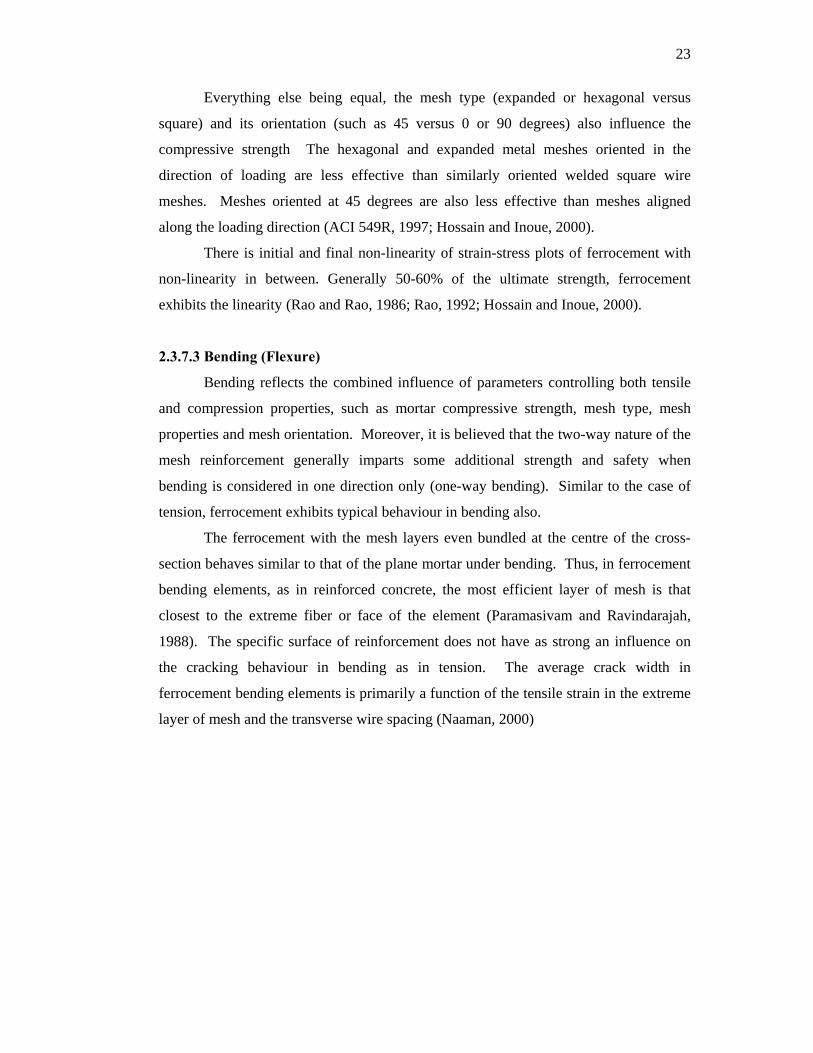
24
Figure 2.13: Load versus various mesh layers of
ferrocement in flexure. (Arif et al., 1999)
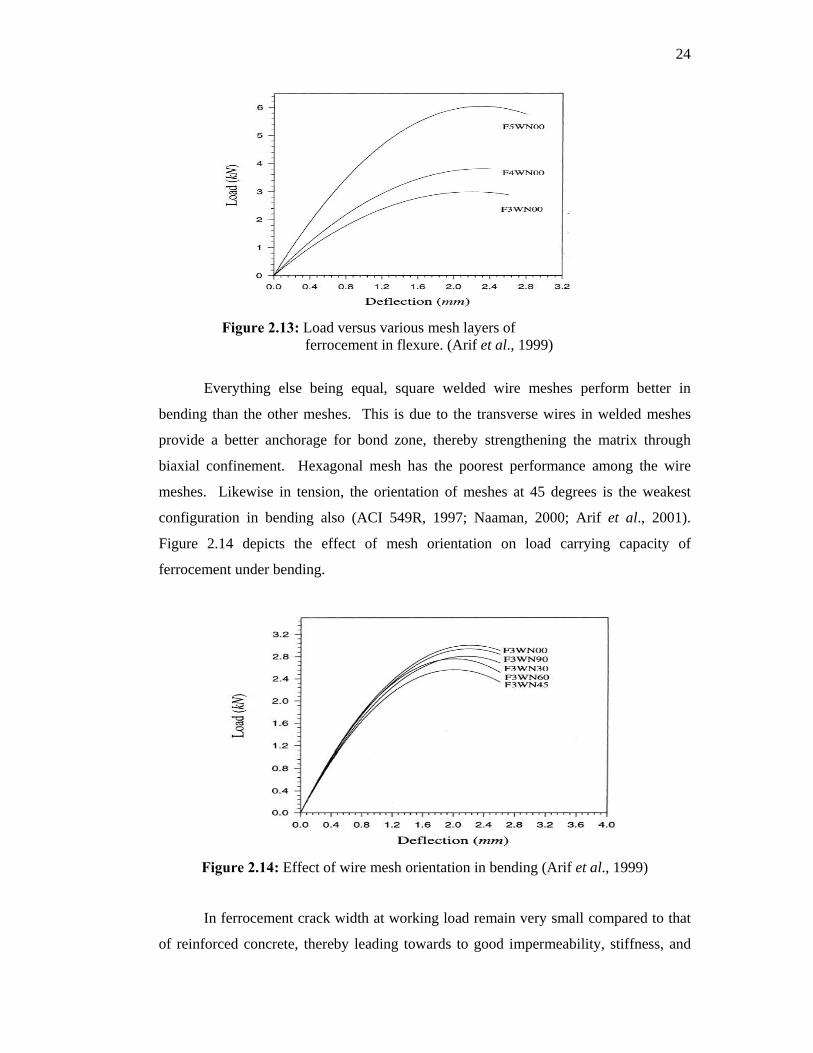
Everything else being equal, square welded wire meshes perform better in
bending than the other meshes. This is due to the transverse wires in welded meshes
provide a better anchorage for bond zone, thereby strengthening the matrix through
biaxial confinement. Hexagonal mesh has the poorest performance among the wire
meshes. Likewise in tension, the orientation of meshes at 45 degrees is the weakest
configuration in bending also (ACI 549R, 1997; Naaman, 2000; Arif et al., 2001).
Figure 2.14 depicts the effect of mesh orientation on load carrying capacity of
ferrocement under bending.
Figure 2.14: Effect of wire mesh orientation in bending (Arif et al., 1999)
In ferrocement crack width at working load remain very small compared to that
of reinforced concrete, thereby leading towards to good impermeability, stiffness, and
25
durability (Onet et al., 1992; Suksawang et al., 2006) However, the compressive
strength of mortar does not seem to have much influence on the bending resistance of
ferrocement beams. Everything else being equal, an 80 percent increase in mortar
compressive strength led to an average increase of only 11% in bending strength
(Montesinos and Naaman, 2004; Suksawang et al., 2006).
2.3.7.4 Shear
The shear strength of ferrocement is reported to be approximately equal to 32
percent of its equivalent bending strength regardless the type and content of mesh or
mortar strength used (Mansur and Ong, 1987). However, in general, shear failure is
preceded by the attainment of flexural capacity of ferrocement (Mansur and Ong, 1991).
Whereas, cracking shear strength of ferrocement is reported to increase with the
decrease in span-to-depth ratio and increase in mesh layers and mortar strength (Al-
Kubaisy and Nedwell, 1999).
Ferrocement beams behave in a manner similar to conventional concrete beam,
except for demonstrating excellent crack control characteristics in shear. Furthermore,
unlike the beams failing in flexure, the beams failing in shear exhibits little sign of
impending failure besides the formation of a large number of diagonal cracks and a
negligible plastic behaviour after the multiple cracking (Alsulaimani and
Basunbal,1991; Mansur and Kiritharan, 2001)
2.3.7.5 Impact Resistance
Resistance to impact is often measured by the amount of energy absorbed during
the impact loading. Reports attesting to the favourable characteristics of ferrocement in
collisions between boats or with the rocks are numerous (ACI 549R, 1997).
Ferrocement is very adequate to resist the impact, due to its higher ability of absorbing
impact energy as compared with the conventional reinforced concrete, and the damage
is localized at the impact zone (Al-Rifai, 2006). While, the impact energy to cause the
failure of ferrocement due to repeated impact loading is 60% more than the concrete
compared and 25% larger cracking resistance (Eswaramoorthi and Subramanian, 2006).
Ferrocement wall panels could resist blast load effectively, and posses high
deformability. Ferrocement walls of 20 mm thickness exhibited higher blast resistance
capabilities then the 100 mm thick conventional plastered brick and block masonry
walls (Pheerphan et al., 2006).
26
The impact strength of ferrocement increases with the volume fraction and the
specific surface of reinforcement. The thickness of the ferrocement is a vital factor
affecting impact resistance, which also depends on the type of mesh system used.
Impact results in the fracture of the mortar on the back face of resulting from the
reflected tensile wave. This is accompanied by spalling of the inside mortar, and
possible delamination of the mesh layers (Naaman, 2000).
An increase in fracture energy and reduction in total crack width and maximum
displacement of slabs were observed with the increase in wire mesh layers when the
slabs were subjected projectile load by dropping hemispherical hammer from a height of
4m (Khan et al., 1999)
2.3.8 Durability
Durability can be defined as the resistance to deterioration of properties when
the ferrocement composite is subjected to various loading and environmental exposures.
Although the measures required to ensure durability in conventionally reinforced
concrete also apply to ferrocement, two other factors which affect durability are unique
to ferrocement,
(a) The cover of mortar to the mesh reinforcement is small and consequently
it is relatively easy for corrosive liquids to reach the reinforcement.
(Mansur et al., 1996; Nedwell, 2000).
(ii) The surface area of the reinforcement is unusually high; so that area of
contact over which corrosion can take place, and the resulting rate of
corrosion are potentially high (Naaman, 2000).
However, these factors assume varying degrees of importance, depending on
exposure conditions. An adequate cover should essentially be provided during the
construction of ferrocement elements. The armature cover in compressed regions could
be as much as 6mm, however in case of medium aggressive environments this value
must be at least 10mm. (Mansur et al., 1996; Liborio and Hanai, 1992). An OPC mortar
cover of 5mm is reported to provide sufficient protection for the galvanized weldmesh
against corrosion for a simulated load-marine corrosion environment (Xiong, 1997)
Ferrocement subjected to180 drying and wet cycles in fresh water showed
unaffected strength of ferrocement elements in flexure, rather, the continued hydration
27
of cement and resulting increase in the maturity of the mortar contributed to an
improvement in the first crack strength in flexure (Al-Rifai and Al-Shukur, 2001).
Deterioration of wire mesh fabric in ferrocement showed deterioration due to
sustained exposure in saline water casting and curing conditions. However, the strength
of panels under saline casting and saline curing condition is more as compared to panels
under normal casting and saline curing condition because of better pore structure
minimizing the ingress of water, due to the presence of fly ash and the saline water
during casting (Masood et al., 2003). Ferrocement subjected to180 drying and wet
cycles in fresh water showed unaffected strength of ferrocement elements in flexure,
rather, the continued hydration of cement and resulting increase in the maturity of the
mortar contributed to an improvement in the first crack strength in flexure (Al-Rifai and
Al-Shukur, 2001).
2.3.9 Thermal/Sound Conductivity
Thermal conductivity in ferrocement increases with the increase in volume
fraction of reinforcement. However, it is significant when mesh layers are placed along
the direction of heat flow. This rarely exists in ferrocement structures because in the
conventional form of ferrocement construction, the mesh layers are arranged normal to
the anticipated direction of heat flow (Hawaldar, 1990). Ferrocement elements were
found to be thermally acceptable and behaved better in natural calamities of Bangladesh
(Salimullah, 1994)
However, it is believed that, the ferrocement has high thermal and sound
conducting properties due to its small thickness of section. This could be addressed by
providing a cavity insulation or infilling the cavity with low conductivity materials,
when ferrocement elements are produced in hollow sections (Methews et al., 1992;
Kandaswamy and Ramachandraiah, 2002).
2.3.10 Applications of Ferrocement
In its role as a thin reinforced concrete product and as a laminated cement-based
composite, ferrocement can be used in numerous applications. These applications can
be classified in three major categories; marine applications, terrestrial applications, and
repair and strengthening applications.
28
2.3.11 Strengthening /Confinement
Ferrocement is useful for repair of concrete structures. It can restore the
durability of structures which may undergo distress due to aggressive environments
causing the corrosion of embedded reinforcement (Rajamane et al., 2003). Its
application as overlays on masonry walls can increase its total load capacity, tension
and shear strength. It also provides the ductility, and. cracking control. The application
of ferrocement overlays is potential option in the situations where high performance of
the walls is required (Fabiana and De Hanai, 2002).
A significant enhancement in stiffness, strength, and durability can be achieved
under compression when concrete is confined with various degree of ferrocement
confinement. Compressive strength enhancement of the order of 20 to 30% was
achieved by ferrocement confinement (Abdullah and Takiguchi, 2002a).
Ferrocement jacketing of RC columns is a feasible technique to prevent their
shear failure and to provide the ductility when loaded in compression. It enhances the
stiffness, strength, energy dissipation, and ductility significantly, where, the mode of
failure changed from brittle shear failure to ductile flexural failure (Takiguchi and
Abdullah, 2000; Takiguchi and Abdullah, 2004). Ferrocement jackets were produced
by wrapping the required number of wire mesh layers over R/C columns and injecting
the mortar slurry in meshes.
Confinement of high strength concrete in ferrocement shell in addition to
rectangular ties under axial compression indicated that the additional confinement in the
form of ferrocement shell improved ultimate strength, strain, strain at ultimate strength
and the ductility of high strength concrete. It also improved the dimensional stability
(Rajesh, 2001).
Encasement of brick masonry columns by ferrocement considerably increased
the load carrying capacity of column in compression. It changes the brittle behaviour of
the masonry columns in ductile. The mortar strength strongly affected the overall load
carrying capacity of the columns (Al-Rifai and Mohammad, 2000)
Provision of ferrocement shell improves the flexural behaviour of reinforced
concrete beams. It improved peak stress, the corresponding strain and the ductility of
concrete. The improvement in curvatures was also obtained in RC beams irrespective
of type of beam and these curvatures at ultimate were improved with ferrocement shell
confinement (Seshu, 2000).
29
2.3.12 Ferrocement in Sandwich Construction
A very little information is available regarding the application of ferrocement in
sandwich elements especially members under compression. Ferrocement when used as
middle plate in a sandwich panel prevented cracking and disintegration of the middle
plate when subjected to a hard lateral impact (Paramasivam and Santosh, 2006).
The behaviour of sandwich panels under low velocity impacts (Santosh et al.,
2003) showed large permanent deformations in the steel cover plates but no fracture.
Middle plates of normal and high strength concrete cracked into pieces under this kind
of impact but the introduction of a ferrocement layer to the middle plate reduced the
steel strains and also prevented disintegration of the middle plate.
Ferrocement skins of a bolted sandwich panels tested exhibited a significant
increase in the punching shear strength when compared with a corresponding single
skin. The increase in upper skin strength was greater than that of the lower skin which
was of the order of 221% and 119% for the upper and lower skins respectively under
punching (Al-Kubaisy and Jumaat, 2002).
Ferrocement sandwich panels made of two outer ferrocement skins separated by
a polystyrene core with two typical cross sections; with and without web connections
showed a high ductility under bending when those compared to that of asbestos sheets
as skins of sandwich. The load carrying capacity of the sandwich elements with webs
was almost twice of that of the panels without web where as the ultimate load was
proportional to the thickness of the elements (Naaman, 2000).
One of the main factors that have so far hindered the full development and
acceptance of high performance ferrocement is its cost. The relatively high cost of
ferrocement, in comparison to reinforced concrete, is mainly due to the labour intensive
nature of its fabrication (Nedwell, 2000; Naaman, 2001), Since the ferrocement
elements are thin in section ranging between 10mm to 30mm and contains the wire
mesh layers closely spaced inside, this often results in reinforcement congestion and
poor concrete quality in the end product if the elements are produced by the method of
the pouring. This is why; the common method of the construction of ferrocement
elements is by plastering the wire mesh with cement mortar manually in three stages.
This method is not only the labour intensive and time consuming but the quality of the
product too becomes non uniform thus exhibiting poor performance (Naaman, 2000;
2001).
30
The major problem associated with the casting of thin ferrocement elements by
the method of pouring the cement mortar in form work pertains to the workability/flow
of mortar mix. A few researchers adopted the method of pouring by enhancing the w/c
ratio randomly, to ensure the adequate workability of mortar mix (Waliuddin and
Rafeeqi, 1994; Abdullah and Takiguchi, 2002b) resulting the increase in porosity of the
mortar mix thereby increasing the water absorption and decrease in compressive
strength. The porosity of mortar can be controlled by adjusting the water cement ratio
with the corresponding addition of a superplasticizer to maintain the workability. In
fact, the matrix in ferrocement has 95% or more pronounced influence on the behavior
of final product (ACI 549R, 1997; Kumar et al., 2002a; 2002b) which entirely depends
on the composition of the mortar mix. Thus the properties of mortar mix like
compressive strength, water absorption are very important to consider during the design
of ferrocement structural elements. However to the best knowledge of the authors, the
literature is silent about any systematic study to investigate the minimum flow
(workability) required to cast such thin sections with the method of pouring.
As cited before, ferrocement has been used as the face sheets to the sandwich
elements and exhibited better performance. Since, Precast Concrete Sandwich Panels
(PCSP) generally span vertically between foundations and floors or roofs to provide an
insulated outer shell to buildings carrying mostly axial loads (Einea, 1995; PCI, 1997).
In fact, it is also mentioned that the compressive strength of ferrocement is smaller than
that of the matrix alone due to delamination (due to splitting transverse tensile stresses)
and buckling of the mesh reinforcement in compression (Al-Noury and Haq, 1988;
Mansur and Abdullah, 1998). This is because of, generally the mesh reinforcement is
arranged parallel to the applied load in one plane only and it is common to consider that
the compressive strength of ferrocement is the same as that of the mortar mix (Naaman,
2000; IFS-10, 2001).
However, on the contrary solid and hollow columns prophetically reinforced
with wire mesh exhibited enhanced strength significantly (ACI 549R, 1997; Lim et al.,
2000). This is attributed to the lateral wires in the mesh acting as confining
reinforcement and literature review reveals the ferrocement as efficient and preferred
option adopted for the confinement of normal and high strength concrete even in
compression. El Debs et al. (2000) reported the sandwich wall panel produced by
polystyrene foam core encased in ferrocement box, which exhibited better compressive
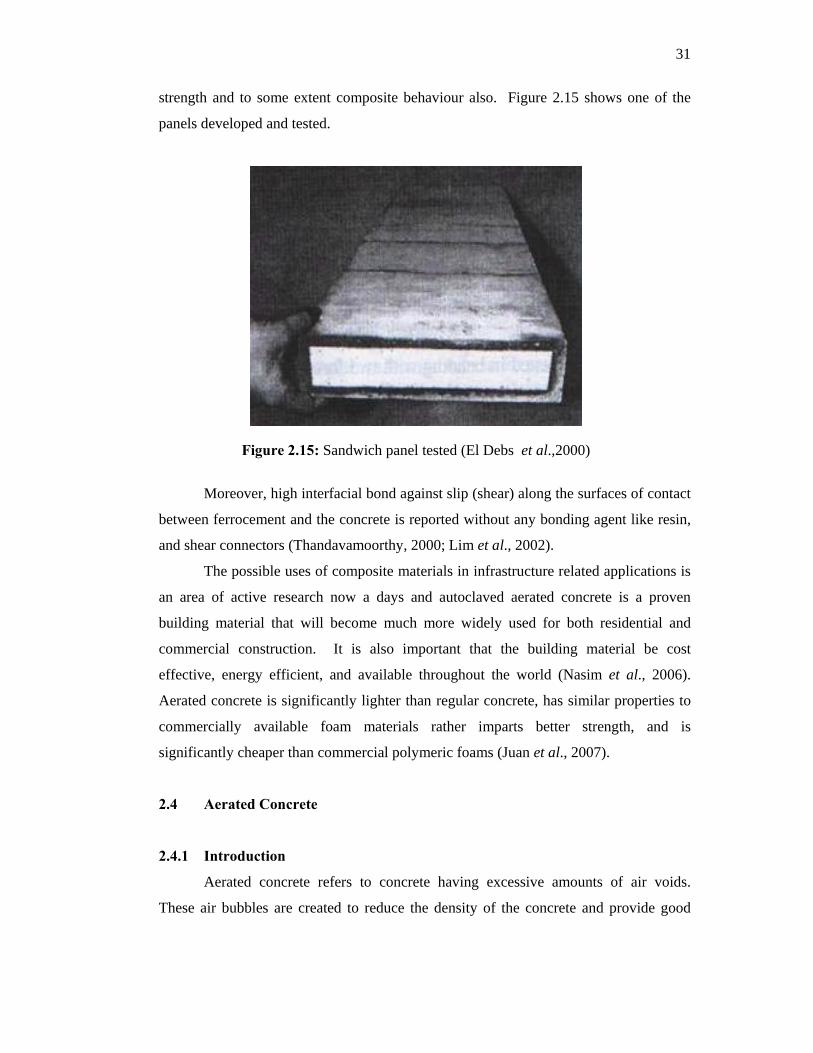
31
strength and to some extent composite behaviour also. Figure 2.15 shows one of the
panels developed and tested.
Figure 2.15: Sandwich panel tested (El Debs et al.,2000)
Moreover, high interfacial bond against slip (shear) along the surfaces of contact
between ferrocement and the concrete is reported without any bonding agent like resin,
and shear connectors (Thandavamoorthy, 2000; Lim et al., 2002).
The possible uses of composite materials in infrastructure related applications is
an area of active research now a days and autoclaved aerated concrete is a proven
building material that will become much more widely used for both residential and
commercial construction. It is also important that the building material be cost
effective, energy efficient, and available throughout the world (Nasim et al., 2006).
Aerated concrete is significantly lighter than regular concrete, has similar properties to
commercially available foam materials rather imparts better strength, and is
significantly cheaper than commercial polymeric foams (Juan et al., 2007).
2.4 Aerated Concrete
2.4.1 Introduction
Aerated concrete refers to concrete having excessive amounts of air voids.
These air bubbles are created to reduce the density of the concrete and provide good
32
thermal insulation. Aerated concrete was first produced in Sweden in 1930s and can
also be referred to as cellular, foamed or gas concrete (Neville, 2003).
In fact the name ‘concrete’ is inappropriate since the material contains no coarse
aggregate. According to Narayanan and Ramamurthy (2000a), aerated concrete is
either a cement or lime mortar, classified as lightweight concrete, in which air-voids are
entrapped in the mortar matrix by means of suitable aerating agent; the air entraining
agents may be chemical (metallic powders like Al, Zn, H2O2) or mechanical (foaming
agents) (Narayanan and Ramamurthy, 2000b). Thus, the manufacturing process of
aerated concrete consists in the creation of macro-porosity (called as induced porosity).
Between 60 to 90% of volume of hardened aerated concrete consists of pores, which are
classified as micro and macro capillaries and artificial air voids (Roels et al.; 2002; Kus
and Carlson, 2003). The aerating agents; among these aluminum powder is most
commonly used, reacts with the water and the lime liberated by the hydration of the
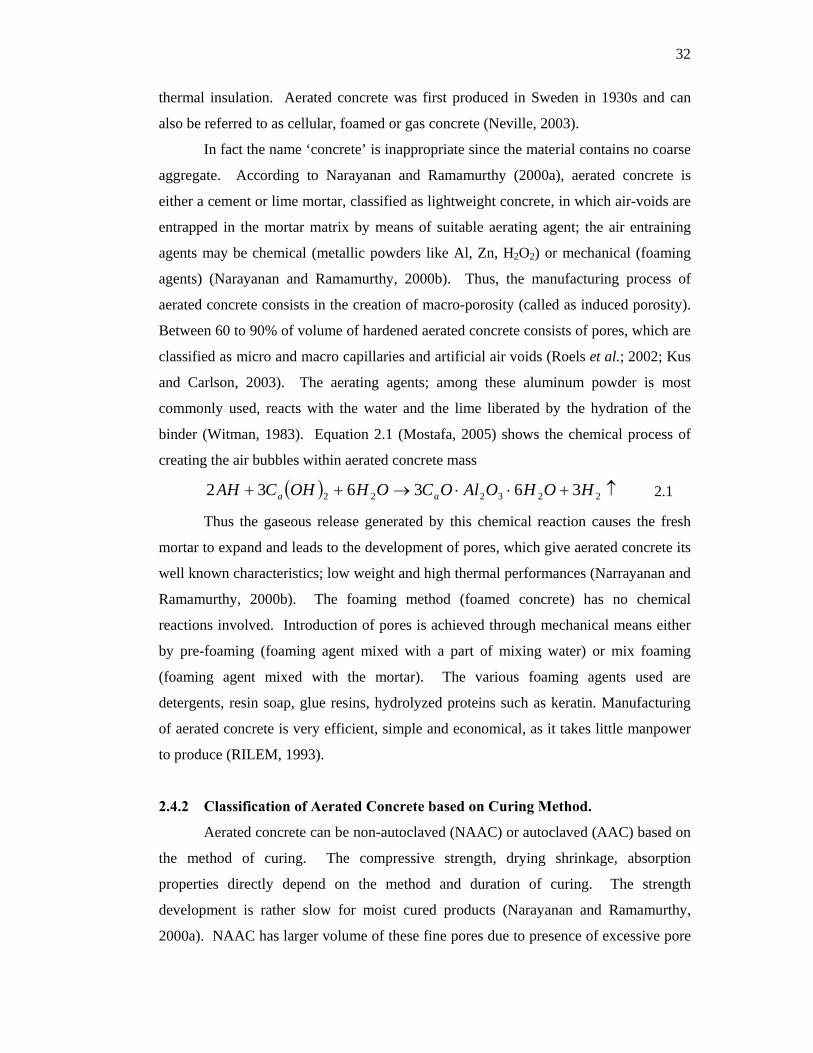
binder (Witman, 1983). Equation 2.1 (Mostafa, 2005) shows the chemical process of
creating the air bubbles within aerated concrete mass
( ) ↑+⋅⋅→++ 223222 363632 HOHOAlOCOHOHCAH aa 2.1
Thus the gaseous release generated by this chemical reaction causes the fresh
mortar to expand and leads to the development of pores, which give aerated concrete its
well known characteristics; low weight and high thermal performances (Narrayanan and
Ramamurthy, 2000b). The foaming method (foamed concrete) has no chemical
reactions involved. Introduction of pores is achieved through mechanical means either
by pre-foaming (foaming agent mixed with a part of mixing water) or mix foaming
(foaming agent mixed with the mortar). The various foaming agents used are
detergents, resin soap, glue resins, hydrolyzed proteins such as keratin. Manufacturing
of aerated concrete is very efficient, simple and economical, as it takes little manpower
to produce (RILEM, 1993).
2.4.2 Classification of Aerated Concrete based on Curing Method.
Aerated concrete can be non-autoclaved (NAAC) or autoclaved (AAC) based on
the method of curing. The compressive strength, drying shrinkage, absorption
properties directly depend on the method and duration of curing. The strength
development is rather slow for moist cured products (Narayanan and Ramamurthy,
2000a). NAAC has larger volume of these fine pores due to presence of excessive pore
33
water (Tada and Nakano, 1983). High porosity of aerated concrete is essential to its
main function, that is its thermal insulation but it leads to poor mechanical strengths.
Hence the most usual technique to make up for this lack of strength is the autoclave
treatment performed under high pressure and temperature, but this one is economically
and environmentally costly (Cabrillac et al., 2006).
2.4.3 Density of Aerated Concrete
Aerated concrete of wide range of densities (300-1800 kg/m3) can be produced
depending upon method of production, thereby offering flexibility in manufacturing
products for specific applications; insulation, partition, and structural grades (Narayanan
and Ramamurthy, 2000a).
The density of aerated concrete is influenced by the water-cement ratio which
controls the aeration process thus, the density. For a given density, water-cement ratio
increases with proportion of sand. Therefore, when pozzolans are used, water-solids
ratio is more important than the water-cement ratio (Arreshvhina, 2002).
For gas concrete, a lesser water-solids ratio leads to insufficient aeration while a
higher one results in rupture of voids, increase in density being consequence in both the
cases (Narayanan and Ramamurthy, 2000a). In fact, the density of aerated concrete is
also greatly dependent on the dosage of the aerating agent; the prime responsible to
induce artificial voids in the mass. The increase in the dosage of aerating agent (Al
powder) decreases the density (Arreshvhina, 2002).
Everything else being equal, the curing method also influences the density of
aerated concrete. The material as delivered from autoclave may be 15-25% heavier than
oven-dry material. This value can be as high as 45% for very low density aerated
concrete (RILEM, 1993).
2.4.4 Porosity
As stated in preceding section, aerated concrete with wide range of densities for
specific applications can be manufactured by varying the method of production;
composition of constituents and type of curing. Cabrillc et al., (2006) reported that an
increase in the cement dosage increases the introduced porosity where as increase of the
sand or lime dosage decreases the introduced porosity.
Whereas, the influence of the water dosage depends on the presence or absence
of lime in the composition; with lime the increase of water dosage increases the
34
introduced porosity, while it does not influence the introduced porosity in the absence
of lime.
Furthermore, the additional autoclaved treatment greatly affected the mechanical
strength rather than the introduced porosity. The high porosity of aerated concrete
allows the penetration by liquids and gases, which may lead to the damage of the matrix
(RILEM, 1993).
2.4.5 Compressive Strength
Generally it is believed that the compressive strength is linearly proportional to
the density of the concrete. However, in case of aerated concrete, the specimen size and
shape, method of pore formation, direction of loading, age, water content,
characteristics of raw material used and method of curing are reported to influence its
compressive strength (Isue et al., 1995; Hanecka et al., 1997; Narayanan and
Ranmamurthy, 2000a). The strength of NAAC increases 30%-80% between 28 days
and 6 months, and marginally beyond this period. A portion of this increase is attributed
to the process of carbonation (Hanecka et al., 1997). Houst et al. (1983) reported the
inverse proportion between compressive strength and moisture content of aerated
concrete. This could be attributed to the pore water which may act as lubricant in the
microstructure of the material.
2.4.6 Drying Shrinkage
Drying shrinkage occurs due to the loss of adsorbed water from the material and
it is significant in aerated concrete because of its high porosity and specific surface of
pores thereby accelerating the drying water within the mass. The decrease in pore size
combined with a higher percentage of smaller size pores is also reported to be
responsible to shrinkage in aerated concrete (Narayanan and Ramamurthy, 2000a).
While, the capillary tension theory of drying shrinkage of porous building materials
states that the water in the pores exit in tension which produces an attractive forces
between the pores of walls, thereby causing shrinkage (Tada and Nakano,1983).
Aerated concrete with only cement as binder is reported to cause higher value of
drying shrinkage than the aerated concrete produced with lime or lime-cement.
Whereas, the duration and method of curing, pressure of autoclaving (in case of AAC),
fineness and chemical composition of mineral admixtures, the size and shape of
specimen affects the drying shrinkage (Schubert, 1983; Narayanan and Ramamurthy,
35
2000a). Due to high level of moisture loss, dry curing influences significantly the
drying shrinkage of aerated concrete than the water curing (Mirza et al., 2002).
ASTM C426-06 (2006) specifies the drying shrinkage or expansion of a
specimen limiting between ±0.15 percent of their initial dimension in consideration.
Drying shrinkage values ranging from 0.06 to over 3% are reported in literature
(Narayanan and Ramamurthy, 2000a).
A higher shrinkage in NAAC is reported due to its larger volume of finer pores
(Tada and Nakano, 1983). However, when the same product is autoclaved, fundamental
changes take place in the mineral constitution, which may reduce shrinkage to one
quarter or even one-fifth of that air-cured product. Nevertheless, Arreshvhina (2002)
found the drying shrinkage of the order of 0.03% of slag-cement based NAAC which is
substantially smaller than those the extreme specifications of ASTM C426-06 (2006).
2.4.7 Water Absorption and Permeability
Aerated concrete is porous material, consists of a substantial portion of its
volume by pores. Therefore, it has strong interaction between water, water vapor and
the porous system. In dry state, pores are empty and the water vapors diffusion
dominates, while some pores are filled in higher humidity regions (if any).
2.4.8 Thermal Conductivity
Thermal conductivity is largely a function of density. In aerated concrete it does
not really matter whether the product is moist cured or autoclaved (Narayanan and
Ramamurthy, 2000a). However, the amount of pores and their distribution are also
critical for thermal insulation; finer the pores better the insulation (Bave, 1980). Other
factors, which could affect the thermal conductivity to some extent, include moisture
content, temperature level, raw materials and pore structures (Loudun, 1983).
2.4.9 Fire Resistance
One of the most remarkable properties of aerated concrete is its fire resistance
capability due to its cellular structure (Nasim et al., 2006). Since the aerated concrete is
relatively homogeneous in nature and independent of coarse aggregates unlike normal
concrete, thereby avoiding the differential rated of expansion, cracking and
disintegration caused by these aggregates (Narayanan and Ramamurthy, 2000a). It also
neither spalls due to fire and nor requires the plastering to achieve good fire resistance
36
(Buekett and Jennings, 1996). The good fire resisting property of aerated concrete is
where its closed pore structure pays rich dividends, as heat transfer through radiation is
an inverse function of the number of air-solid interfaces traversed. Adding this to their
low thermal conductivity and diffusitivity, gives an indication that aerated concrete
possess good fire resisting properties
Most recently autoclaved aerated concrete (AAC) is used as core material in
FRP-AAC sandwich panels and have proven to be structurally efficient combination for
lightweight structural components. AAC-CFRP composites have great excellent
absorbing capabilities under impact force. While the resin infiltrates into the concrete
micro-pores of the AAC panel, additional strengthening is provided. The potential
advantages of panelized construction using AAC core as building material are
lightweight, energy efficient, easy to use, fire resistant, environmental friendly, weather
resistant, pest resistant, durable, acoustically efficient (Juan et al., 2007; Lim and Kang,
2006). Furthermore, if the strength is not the major criteria, then non-autoclaved
aerated concrete is more cost effective and easy to produce possessing almost all other
properties nearest similar to those of AAC as discussed in previous section.
Mouli and Khelafi (2006) reported that the interfacial bond strength of
composite sections is significantly affected by the type of concrete. LWC exhibits
higher results push-loads and thus better composite action than the normal concrete.
Therefore, it is believed that if aerated concrete is used as core with cement based
composite as face sheets to produce sandwich element, a superior interfacial bond can
be achieved between the two without use of any bonding agent. This led to the idea to
use non-autoclaved aerated concrete (NAAC) as core material during this study. This
also will lead to the basic concept of the affordable housing that, the building material
be cost effective, energy efficient, easily available.
2.5 Cost Effectiveness
To reduce the overall construction cost of the building has been the much
focused area of the current period for developed countries in general and for developing
countries in particular. This could be achieved by reducing the material cost by
replacing traditional materials with cheaper materials and also adopting mechanized
construction techniques. Averagely 10-20% of the material cost can be saved compared
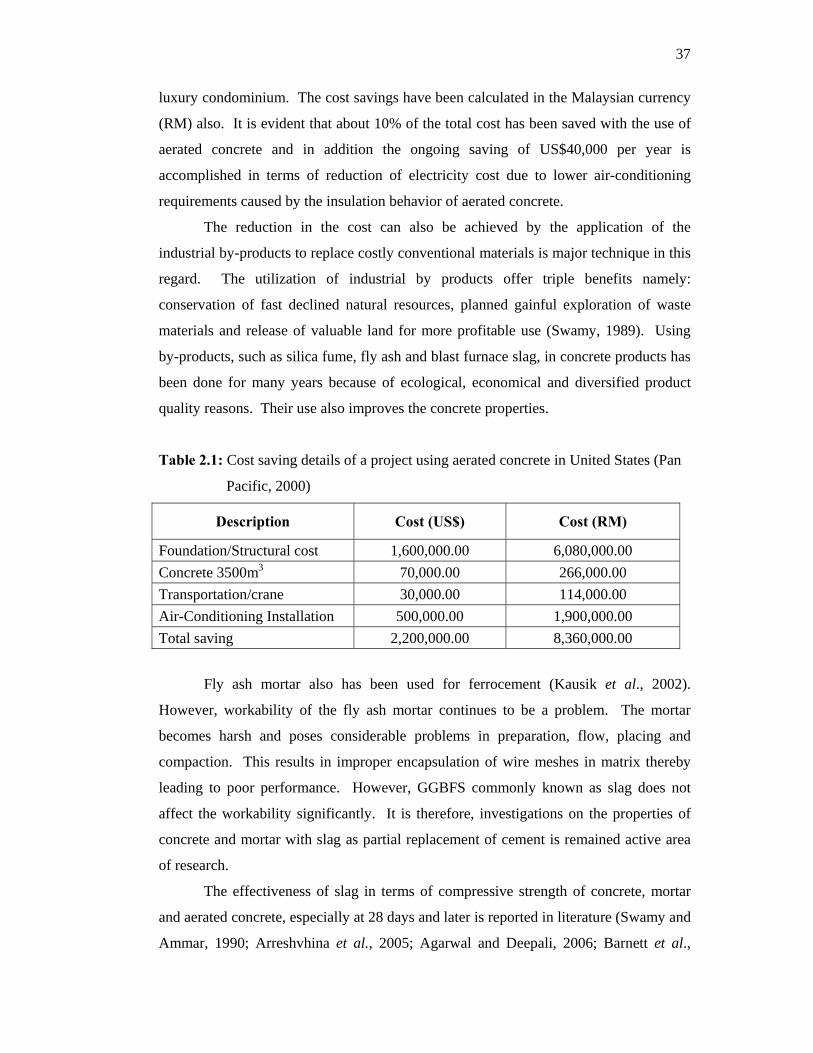
to normal dense concrete when lightweight aerated concrete is used. Table 2.1 shows
an outline of costing for a project in United States. The project was to build 36-story
37
luxury condominium. The cost savings have been calculated in the Malaysian currency
(RM) also. It is evident that about 10% of the total cost has been saved with the use of
aerated concrete and in addition the ongoing saving of US$40,000 per year is
accomplished in terms of reduction of electricity cost due to lower air-conditioning
requirements caused by the insulation behavior of aerated concrete.
The reduction in the cost can also be achieved by the application of the
industrial by-products to replace costly conventional materials is major technique in this
regard. The utilization of industrial by products offer triple benefits namely:
conservation of fast declined natural resources, planned gainful exploration of waste
materials and release of valuable land for more profitable use (Swamy, 1989). Using
by-products, such as silica fume, fly ash and blast furnace slag, in concrete products has
been done for many years because of ecological, economical and diversified product
quality reasons. Their use also improves the concrete properties.
Table 2.1: Cost saving details of a project using aerated concrete in United States (Pan
Pacific, 2000)
Description Cost (US$) Cost (RM)
Foundation/Structural cost 1,600,000.00 6,080,000.00 Concrete 3500m3 70,000.00 266,000.00 Transportation/crane 30,000.00 114,000.00 Air-Conditioning Installation 500,000.00 1,900,000.00 Total saving 2,200,000.00 8,360,000.00
Fly ash mortar also has been used for ferrocement (Kausik et al., 2002).
However, workability of the fly ash mortar continues to be a problem. The mortar
becomes harsh and poses considerable problems in preparation, flow, placing and
compaction. This results in improper encapsulation of wire meshes in matrix thereby
leading to poor performance. However, GGBFS commonly known as slag does not
affect the workability significantly. It is therefore, investigations on the properties of
concrete and mortar with slag as partial replacement of cement is remained active area
of research.
The effectiveness of slag in terms of compressive strength of concrete, mortar
and aerated concrete, especially at 28 days and later is reported in literature (Swamy and
Ammar, 1990; Arreshvhina et al., 2005; Agarwal and Deepali, 2006; Barnett et al.,
38
2006). In most cases, GGBFS slag has been used in proportions of 25 to 70 percent by
mass of total cementitious material but 50% appears to be an optimum blend of GGBFS
slag that produces the greatest strength at 28 days (ACI 226, 1987; Swamy, 1990;
Arreshvhina, 2002). Since each slag, behaves differently with different cements, it is
important to prepare trial mixes with the cement and ground slag to be used, to
determine the correct mix proportions and insure adequate performance of the concrete
(Mantei, 1994).
The overall construction cost of ferrocement elements can further be reduced by
casting the thin ferrocement encasement with a mechanized approach replacing the cost
intensive traditional method of construction, where, wire meshes are plastered in three
stages manually.
2.6 Concluding Remarks
The modern and innovative techniques, approaches and systems are being
adopted by the construction industry to industrialize the building system in order to
coup with the problem. Precast and prefabrication of the lightweight structural
members/elements in factory provides the quality construction, rapid progress of
structure erecting, minimized construction activities at site and the reduced construction
duration of the project. Sandwich form of construction serves the purpose efficiently.
Based on the application of sandwich, it is produced with a wide variety of
alternative core materials, including wood, honeycomb, polymer foams and steel
connectors. Each material has its own advantages and disadvantages, but for buildings
steel connectors and foams are preferred. Whereas, many high performance materials
are in common use to produce face sheets, but the concrete wythes are commonly used
in sandwich elements for the buildings along with the recent attention paid to the
ferrocement due to its high performance compared to the other thin materials.
However, sandwich faces the severe problems pertained to the small area of
connection where shear connectors are connected to the wythes. While, in case of foam
cores bonded with the wythes, the performance of sandwich is governed by the type,
quality and efficiency of the bonding resins which are expensive too. Thus, it was
deemed to adopt a novel technique to produce sandwich composite by encasing
lightweight aerated concrete with high performance ferrocement eliminating the shear
connectors and the bonding materials with a mechanized simultaneous casting of core
and encasement.
39
CHAPTER 3
RESEARCH METHODOLOGY
3.1 General Appraisal
This chapter describes the methodology adopted to achieve the aim and
objectives of the study, details of the materials used, and the experimental procedures
applied to investigate various parameters.
3.2 Experimental Programme of Study
The main aim of the study was to investigate the characteristics of ferrocement
encased aerated concrete sandwich wall element. In order to achieve the aim and the
related objectives mentioned in chapter one, a two-phase experimental study; each
comprised of stepwise strategy was adopted. Following are the details of the two
phases, stepwise research methodology adopted.
3.2.1 Phase-I: To Investigate Optimum High Workability and High
Performance Mortar Mix for encasement
The phase-I was completed in four steps detailed as follows.
3.2.1.1 Minimum Mortar Flow Value
Initially thin ferrocement plates of 6mm, 8mm, 10mm and 12 mm thick
thickness were cast on trial and error method (by adjusting water-binder ratio and
adding superplasticizer). Minimum flow of mortar required to cast the proposed
ferrocement encasing box for sandwich wall elements was determined using flow table
test.
3.2.1.2 Maximum Dosage of Superplasticizer
The maximum dosage of superplasticizer reducing the water-binder ratio by
maintaining the minimum flow determined was also examined. In all three mixes were
selected at random were used. These mixes were of different mix proportion with and
40
without GGBFS. In each mix superplasticizer dosage was utilized with an increment
0.1% of total binder by weight until its further increase did not render desired results.
Throughout this step, mortar flow was maintained at the value determined from
previous step.
3.2.1.3 Flow versus Mix Proportions (A Comprehensive Flow Test Programme)
On the basis of the results of previous two steps a comprehensive test
programme was conducted to establish the criteria between mix proportions, water-
binder ratio, dosage of superplasticizer and partial replacement of cement with GGBFS
at constant mortar flow determined previously. The details of the mix proportion, level
of partial replacement of cement with GGBFS to achieve the economy and the dosage
of the superplasticizer applied to reduce the water-binder ratio at specific flow, are as
follows:
(a) Mix proportion: binder : sand
1: 2, 1: 2.5, 1: 3
(b) GGBFS: 0%, 50% and 60% by weight of the total binder
as partial replacement of cement
(c) Superplasticizer: Used from 0.1%; of total binder by weight up
to maximum dosage determined during
previous step. It was applied in an increment of
0.1% each time
All in all 54 mixes were developed, tested and analyzed during this step, the
details of which are given in chapter 4.
3.2.1.4 Characteristics of High Workability Slag Cement Based Mortar
Initially cube specimens of size 70.6mm x 70.6mm x 70.6mm for all the 54
mixes developed from previous step were cast and tested with following variables
(a) Curing regime Water
(b) Age of Mortar: 28 days.
(c) Tests: Cube crushing strength and
Density of mortar
41
As a step further, based on the strength and density results obtained, seven high
strength (compressive strength > 45MPa) and economical mixes (with GGBFS)
including one control mix were selected and were tested with following variables.
(a) Curing regime : Water (at 27 0C room temperature in
water tank)
(b) Strength development : 3, 7, 28, 90, and 180 days
(c) Water absorption : at 28 days
(d) ISAT (permeability) : at 28 days
As the concluding step, two mixes were selected based on the results from
previous testing, and were tested for effect of curing regime by curing with following
variables
(a) Curing regime: Water (in water tank at 27 0C room temperature
temperature.
Air (inside room at 27 0C room temperature)
Natural whether (ambient environment; outside
the laboratory under open sky at temperature
from 25 0C to 35 0C)
(b) Tests : Compressive strength
(c) Specimens Age: 3, 7, 28, 90, and 180 days
Finally on the bases of the entire results and the discussions made, an optimum
high workability and high performance mortar was selected to cast ferrocement
encasing box to produce ferrocement-aerated sandwich.
3.2.2 PHASE-II: To Investigate Characteristics of Ferrocement Encased
Aerated Concrete Sandwich Wall Elements
This phase of the experimental study was accomplished in two parts. As the
wall elements considered in the final step of this study were of relatively large size,
hence it was deemed necessary to carry an intensive experimental programme with large
number of variables but with small size specimens as per the specifications of various
standards. Throughout the study it was decided to adopt 12mm thick ferrocement
encasement to produce sandwich. The encasement was achieved by producing
ferrocement box around four sides of the entire specimens. The details of the study are
as follows:
42
3.2.2.1 Sandwich Cubes, Blocks and Prism Beams
(a) Shape and size of specimens
Cubes A : 70.6mm x 70.6mm x 70.6mm (Figure 3.1)
Cubes B : 100mm x 100mm x 100mm (Figure 3.2)
Blocks : 400mm x 200mm x 100mm (Figure 3.3)
Prism beams : 500mm x 100mm x 100mm (Figure 3.4)
(b) Variables
Type of mesh: Chicken and square weld wire meshes
Number of mesh layers: 1 to 4 layers in chicken wire mesh and 1 to
3 layers in square weld wire mesh (Since
square weld mesh was of greater diameter
thus the maximum number was limited to 3
in this case)
Curing regime: Water
Age of specimen: 28 days,
Core Volume: Varying with size of specimens
Encasement effectiveness Method of testing the specimen for
compression comprised of
(i) Holding encasement parallel to loading
direction (Figure 3.5a)
(ii) Holding encasement perpendicular to
loading direction (Figure 3.5b)
(c) Tests
Ultimate compressive strength
Flexural strength (Modulus of rupture)
Ductility (Load deflection curves)
Weight comparison
Failure mode (both; under compression and flexure)
Water absorption
ISAT (Permeability)
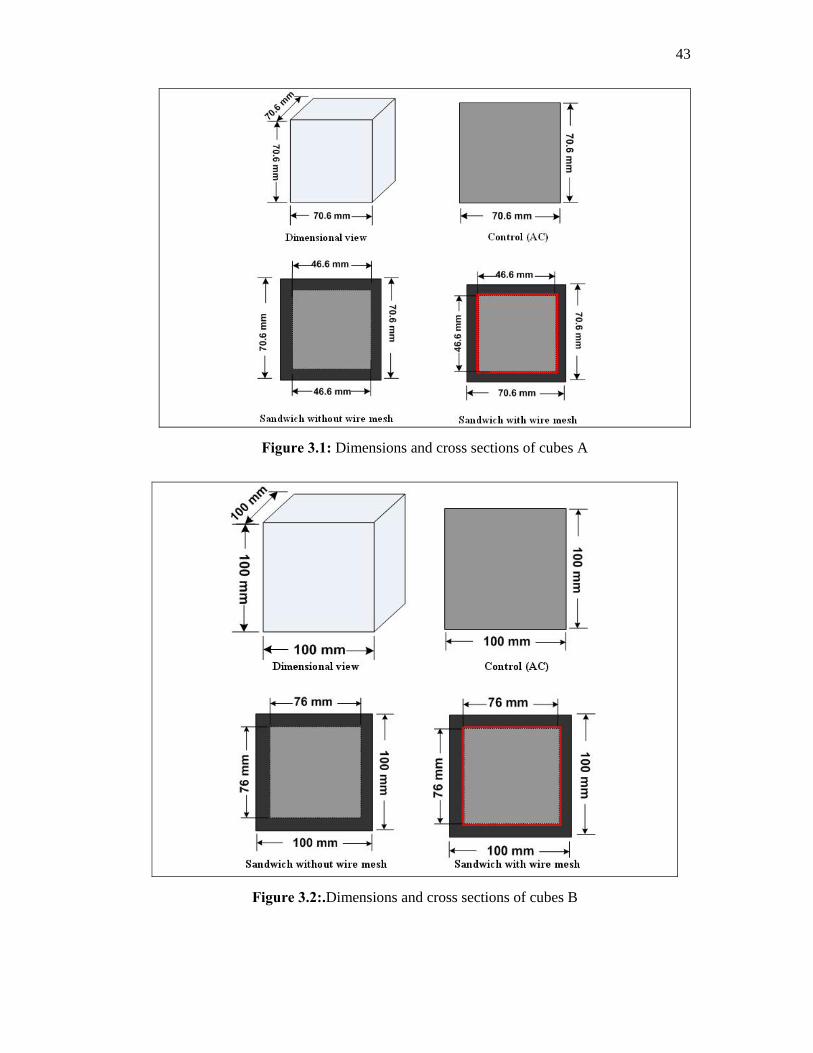
43
Figure 3.1: Dimensions and cross sections of cubes A
Figure 3.2:.Dimensions and cross sections of cubes B
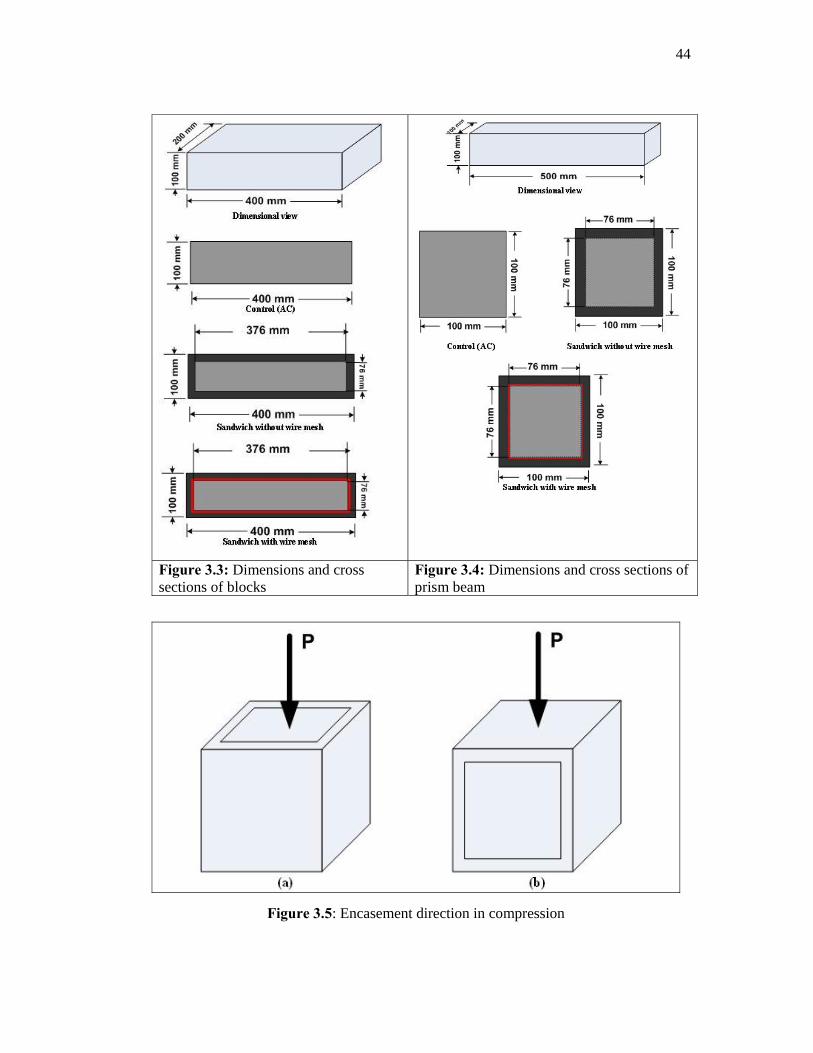
44
Figure 3.3: Dimensions and cross sections of blocks
Figure 3.4: Dimensions and cross sections of prism beam
Figure 3.5: Encasement direction in compression
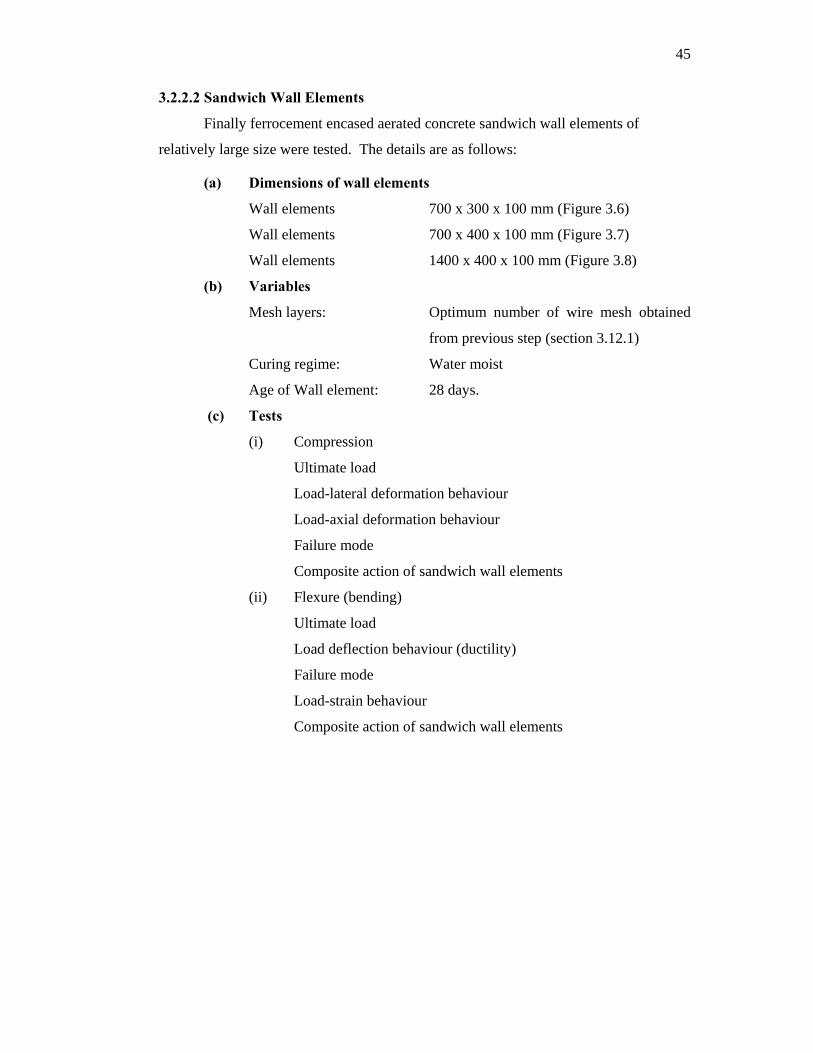
45
3.2.2.2 Sandwich Wall Elements
Finally ferrocement encased aerated concrete sandwich wall elements of
relatively large size were tested. The details are as follows:
(a) Dimensions of wall elements
Wall elements 700 x 300 x 100 mm (Figure 3.6)
Wall elements 700 x 400 x 100 mm (Figure 3.7)
Wall elements 1400 x 400 x 100 mm (Figure 3.8)
(b) Variables
Mesh layers: Optimum number of wire mesh obtained
from previous step (section 3.12.1)
Curing regime: Water moist
Age of Wall element: 28 days.
(c) Tests
(i) Compression
Ultimate load
Load-lateral deformation behaviour
Load-axial deformation behaviour
Failure mode
Composite action of sandwich wall elements
(ii) Flexure (bending)
Ultimate load
Load deflection behaviour (ductility)
Failure mode
Load-strain behaviour
Composite action of sandwich wall elements
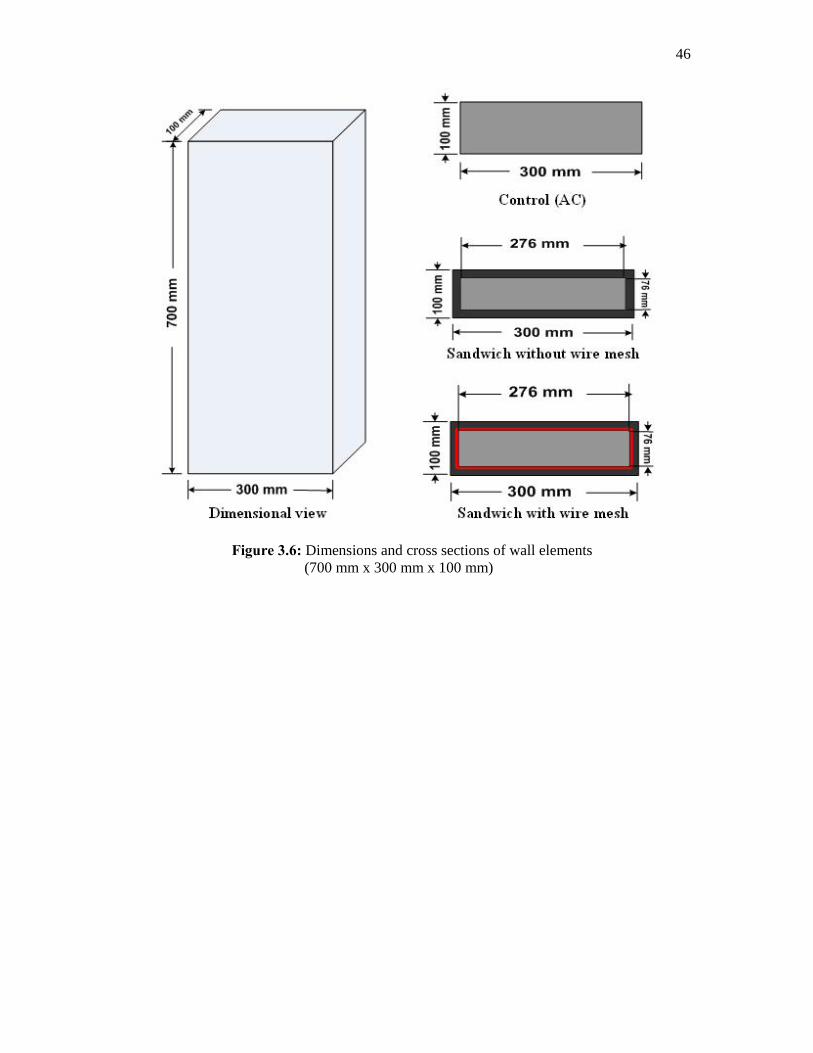
46
Figure 3.6: Dimensions and cross sections of wall elements
(700 mm x 300 mm x 100 mm)
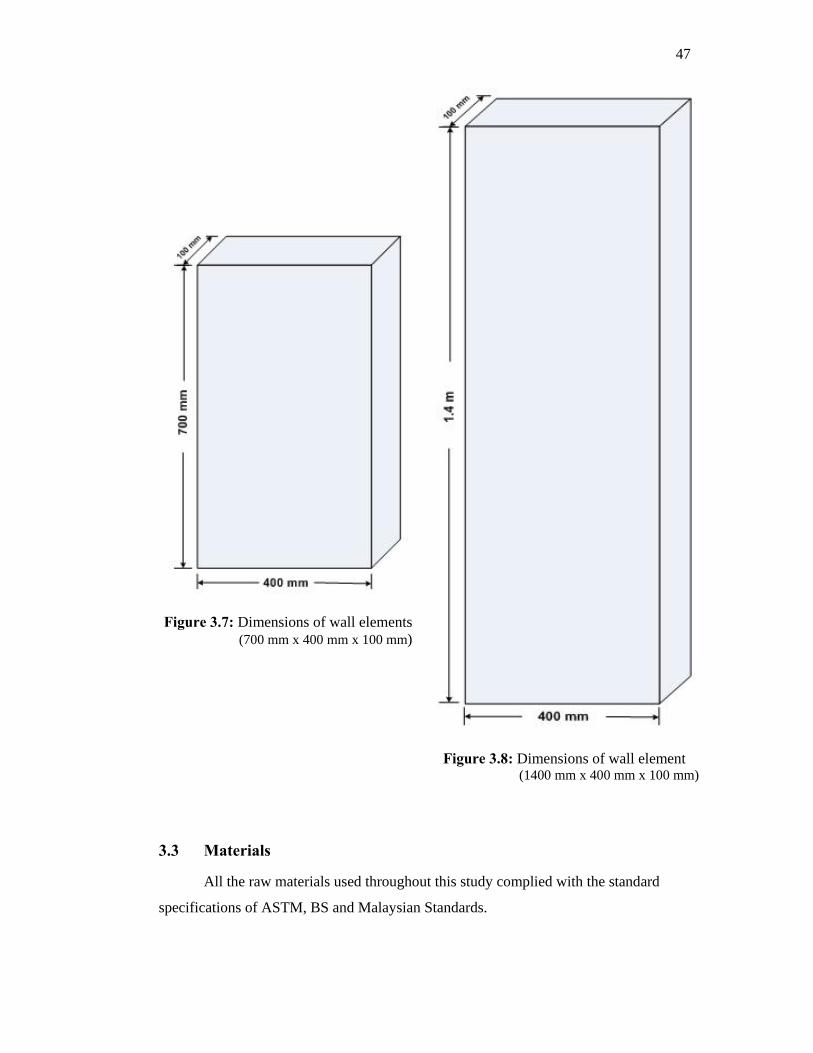
47
Figure 3.7: Dimensions of wall elements (700 mm x 400 mm x 100 mm)
Figure 3.8: Dimensions of wall element (1400 mm x 400 mm x 100 mm)
3.3 Materials
All the raw materials used throughout this study complied with the standard
specifications of ASTM, BS and Malaysian Standards.
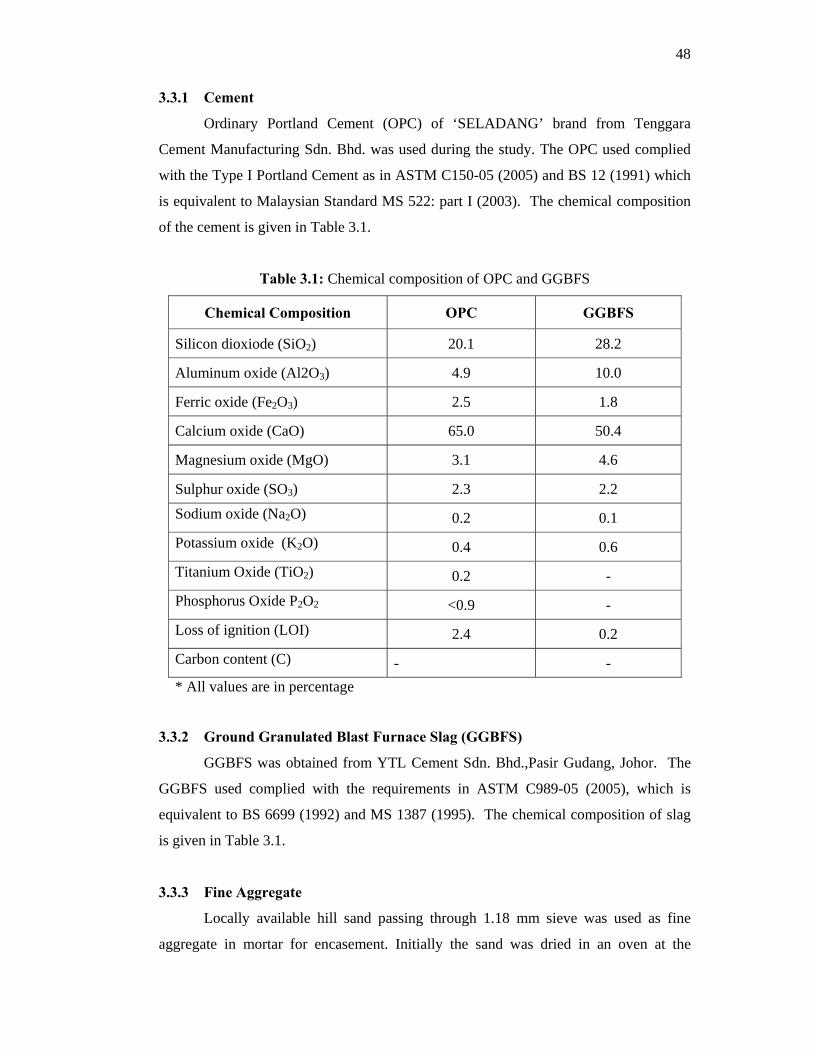
48
3.3.1 Cement
Ordinary Portland Cement (OPC) of ‘SELADANG’ brand from Tenggara
Cement Manufacturing Sdn. Bhd. was used during the study. The OPC used complied
with the Type I Portland Cement as in ASTM C150-05 (2005) and BS 12 (1991) which
is equivalent to Malaysian Standard MS 522: part I (2003). The chemical composition
of the cement is given in Table 3.1.
Table 3.1: Chemical composition of OPC and GGBFS
Chemical Composition OPC GGBFS
Silicon dioxiode (SiO2) 20.1 28.2
Aluminum oxide (Al2O3) 4.9 10.0
Ferric oxide (Fe2O3) 2.5 1.8
Calcium oxide (CaO) 65.0 50.4
Magnesium oxide (MgO) 3.1 4.6
Sulphur oxide (SO3) 2.3 2.2
Sodium oxide (Na2O) 0.2 0.1
Potassium oxide (K2O) 0.4 0.6
Titanium Oxide (TiO2) 0.2 -
Phosphorus Oxide P2O2 <0.9 -
Loss of ignition (LOI) 2.4 0.2
Carbon content (C) - - * All values are in percentage
3.3.2 Ground Granulated Blast Furnace Slag (GGBFS)
GGBFS was obtained from YTL Cement Sdn. Bhd.,Pasir Gudang, Johor. The
GGBFS used complied with the requirements in ASTM C989-05 (2005), which is
equivalent to BS 6699 (1992) and MS 1387 (1995). The chemical composition of slag
is given in Table 3.1.
3.3.3 Fine Aggregate
Locally available hill sand passing through 1.18 mm sieve was used as fine
aggregate in mortar for encasement. Initially the sand was dried in an oven at the
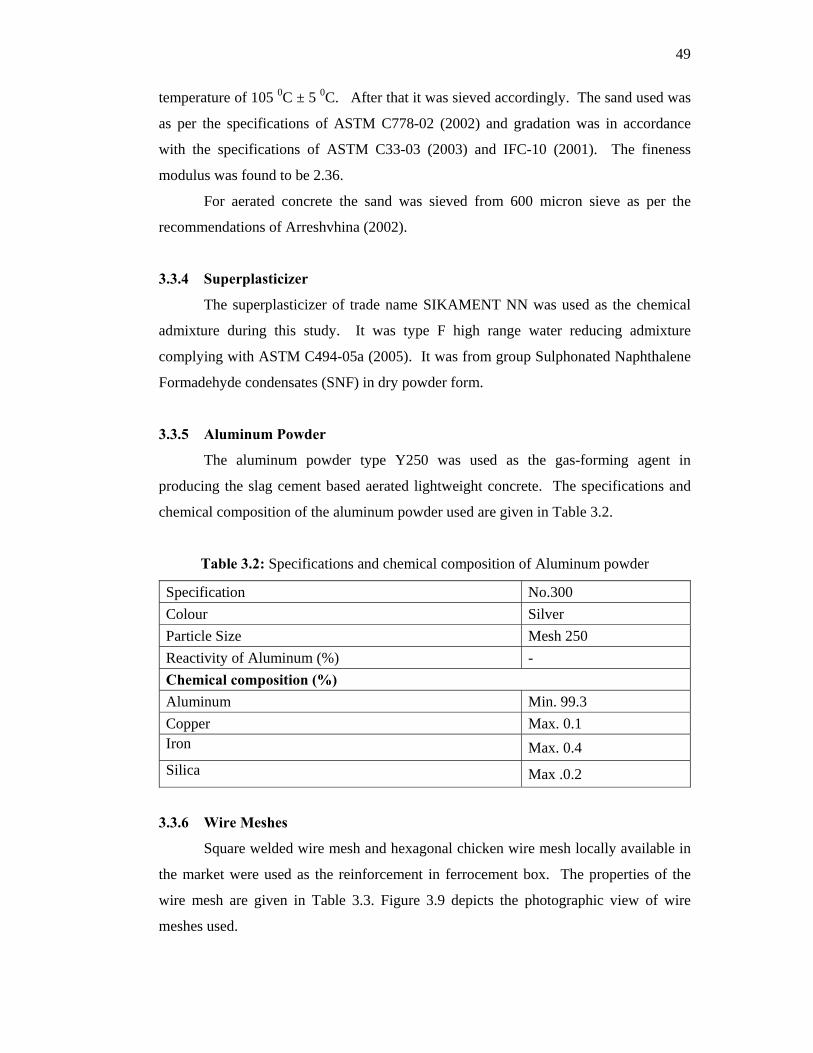
49
temperature of 105 0C ± 5 0C. After that it was sieved accordingly. The sand used was
as per the specifications of ASTM C778-02 (2002) and gradation was in accordance
with the specifications of ASTM C33-03 (2003) and IFC-10 (2001). The fineness
modulus was found to be 2.36.
For aerated concrete the sand was sieved from 600 micron sieve as per the
recommendations of Arreshvhina (2002).
3.3.4 Superplasticizer
The superplasticizer of trade name SIKAMENT NN was used as the chemical
admixture during this study. It was type F high range water reducing admixture
complying with ASTM C494-05a (2005). It was from group Sulphonated Naphthalene
Formadehyde condensates (SNF) in dry powder form.
3.3.5 Aluminum Powder
The aluminum powder type Y250 was used as the gas-forming agent in
producing the slag cement based aerated lightweight concrete. The specifications and
chemical composition of the aluminum powder used are given in Table 3.2.
Table 3.2: Specifications and chemical composition of Aluminum powder
Specification No.300 Colour Silver Particle Size Mesh 250 Reactivity of Aluminum (%) - Chemical composition (%) Aluminum Min. 99.3 Copper Max. 0.1 Iron Max. 0.4 Silica Max .0.2
3.3.6 Wire Meshes
Square welded wire mesh and hexagonal chicken wire mesh locally available in
the market were used as the reinforcement in ferrocement box. The properties of the
wire mesh are given in Table 3.3. Figure 3.9 depicts the photographic view of wire
meshes used.
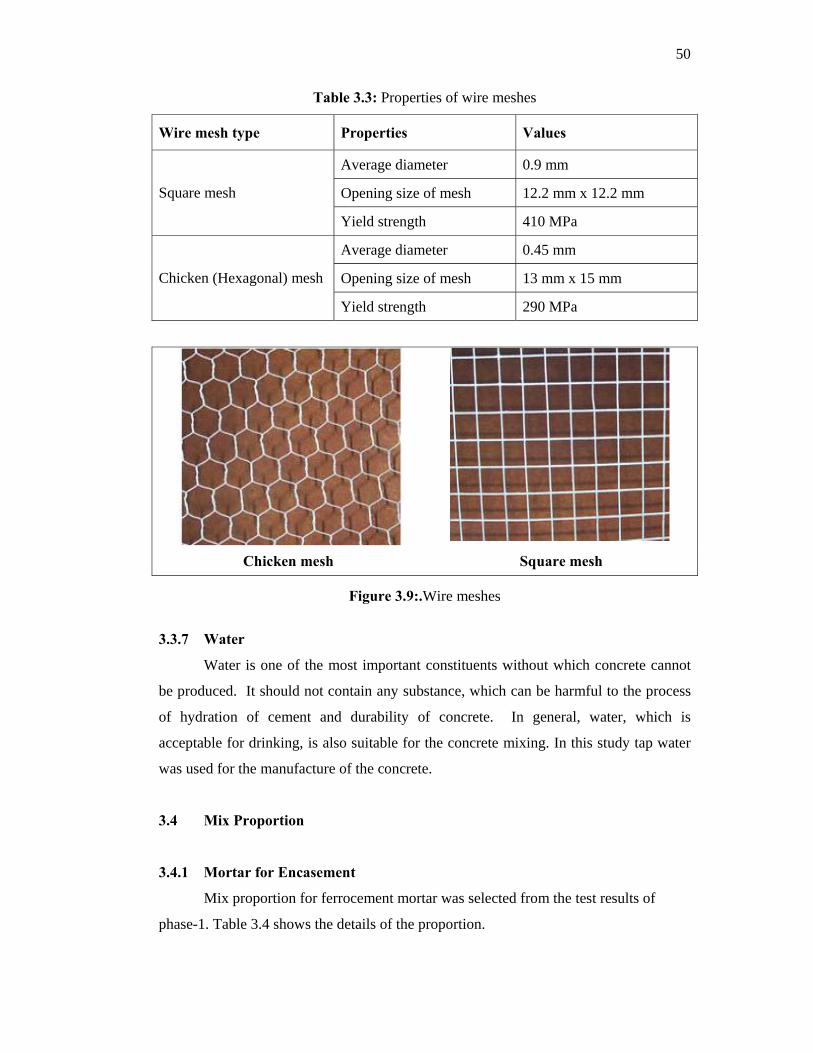
50
Table 3.3: Properties of wire meshes
Wire mesh type Properties Values
Average diameter 0.9 mm
Opening size of mesh 12.2 mm x 12.2 mm Square mesh
Yield strength 410 MPa
Average diameter 0.45 mm
Opening size of mesh 13 mm x 15 mm Chicken (Hexagonal) mesh
Yield strength 290 MPa
Chicken mesh Square mesh
Figure 3.9:.Wire meshes
3.3.7 Water
Water is one of the most important constituents without which concrete cannot
be produced. It should not contain any substance, which can be harmful to the process
of hydration of cement and durability of concrete. In general, water, which is
acceptable for drinking, is also suitable for the concrete mixing. In this study tap water
was used for the manufacture of the concrete.
3.4 Mix Proportion
3.4.1 Mortar for Encasement
Mix proportion for ferrocement mortar was selected from the test results of
phase-1. Table 3.4 shows the details of the proportion.
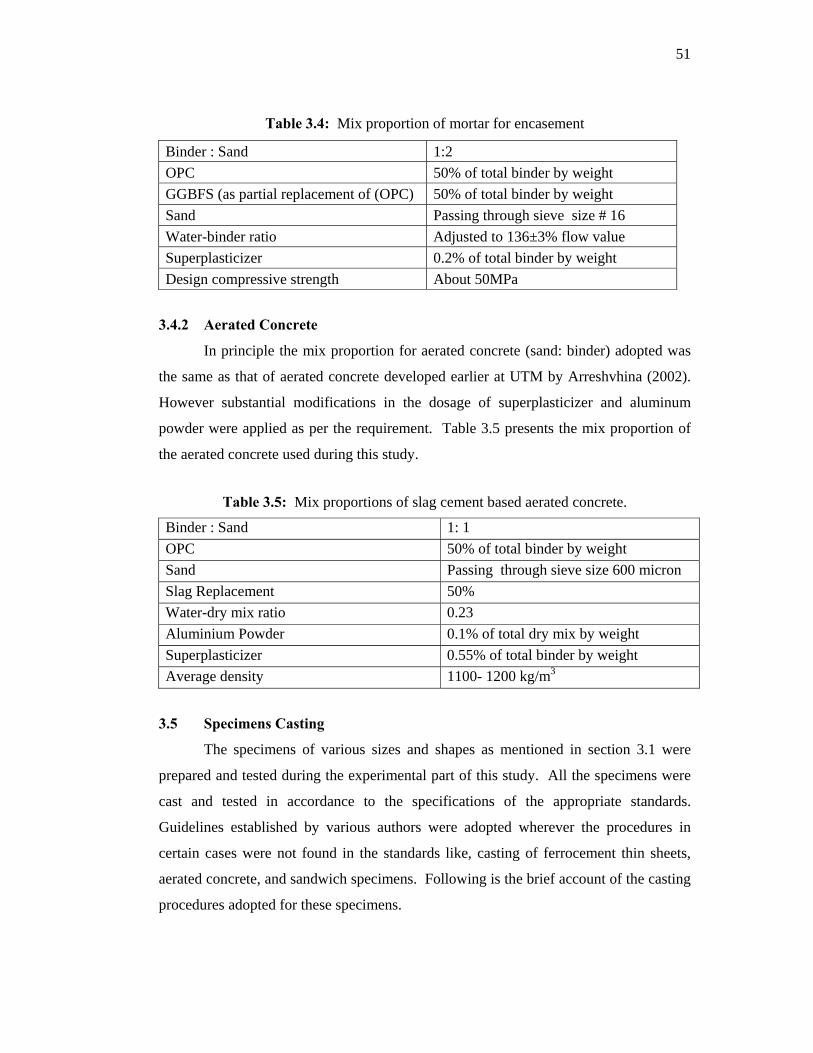
51
Table 3.4: Mix proportion of mortar for encasement
Binder : Sand 1:2 OPC 50% of total binder by weight GGBFS (as partial replacement of (OPC) 50% of total binder by weight Sand Passing through sieve size # 16 Water-binder ratio Adjusted to 136±3% flow value Superplasticizer 0.2% of total binder by weight Design compressive strength About 50MPa
3.4.2 Aerated Concrete
In principle the mix proportion for aerated concrete (sand: binder) adopted was
the same as that of aerated concrete developed earlier at UTM by Arreshvhina (2002).
However substantial modifications in the dosage of superplasticizer and aluminum
powder were applied as per the requirement. Table 3.5 presents the mix proportion of
the aerated concrete used during this study.
Table 3.5: Mix proportions of slag cement based aerated concrete.
Binder : Sand 1: 1 OPC 50% of total binder by weight Sand Passing through sieve size 600 micron Slag Replacement 50% Water-dry mix ratio 0.23 Aluminium Powder 0.1% of total dry mix by weight Superplasticizer 0.55% of total binder by weight Average density 1100- 1200 kg/m3
3.5 Specimens Casting
The specimens of various sizes and shapes as mentioned in section 3.1 were
prepared and tested during the experimental part of this study. All the specimens were
cast and tested in accordance to the specifications of the appropriate standards.
Guidelines established by various authors were adopted wherever the procedures in
certain cases were not found in the standards like, casting of ferrocement thin sheets,
aerated concrete, and sandwich specimens. Following is the brief account of the casting
procedures adopted for these specimens.
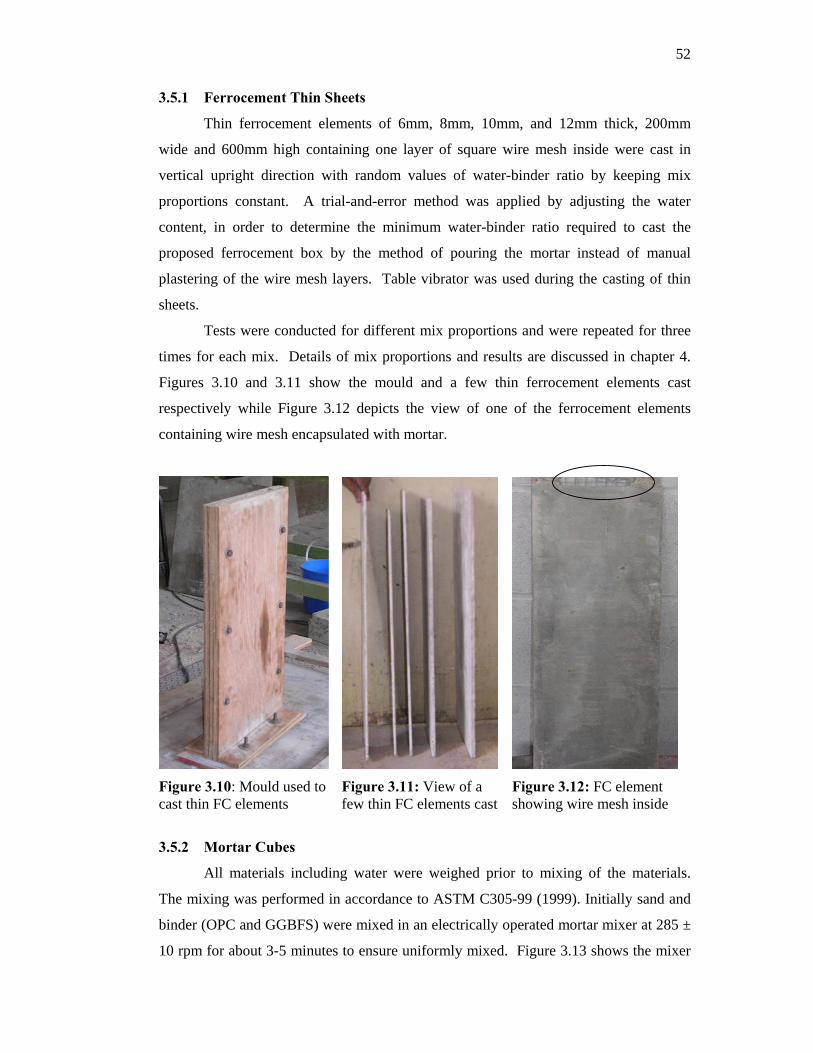
52
3.5.1 Ferrocement Thin Sheets
Thin ferrocement elements of 6mm, 8mm, 10mm, and 12mm thick, 200mm
wide and 600mm high containing one layer of square wire mesh inside were cast in
vertical upright direction with random values of water-binder ratio by keeping mix
proportions constant. A trial-and-error method was applied by adjusting the water
content, in order to determine the minimum water-binder ratio required to cast the
proposed ferrocement box by the method of pouring the mortar instead of manual
plastering of the wire mesh layers. Table vibrator was used during the casting of thin
sheets.
Tests were conducted for different mix proportions and were repeated for three
times for each mix. Details of mix proportions and results are discussed in chapter 4.
Figures 3.10 and 3.11 show the mould and a few thin ferrocement elements cast
respectively while Figure 3.12 depicts the view of one of the ferrocement elements
containing wire mesh encapsulated with mortar.
Figure 3.10: Mould used to cast thin FC elements
Figure 3.11: View of a few thin FC elements cast
Figure 3.12: FC element showing wire mesh inside
3.5.2 Mortar Cubes
All materials including water were weighed prior to mixing of the materials.
The mixing was performed in accordance to ASTM C305-99 (1999). Initially sand and
binder (OPC and GGBFS) were mixed in an electrically operated mortar mixer at 285 ±
10 rpm for about 3-5 minutes to ensure uniformly mixed. Figure 3.13 shows the mixer
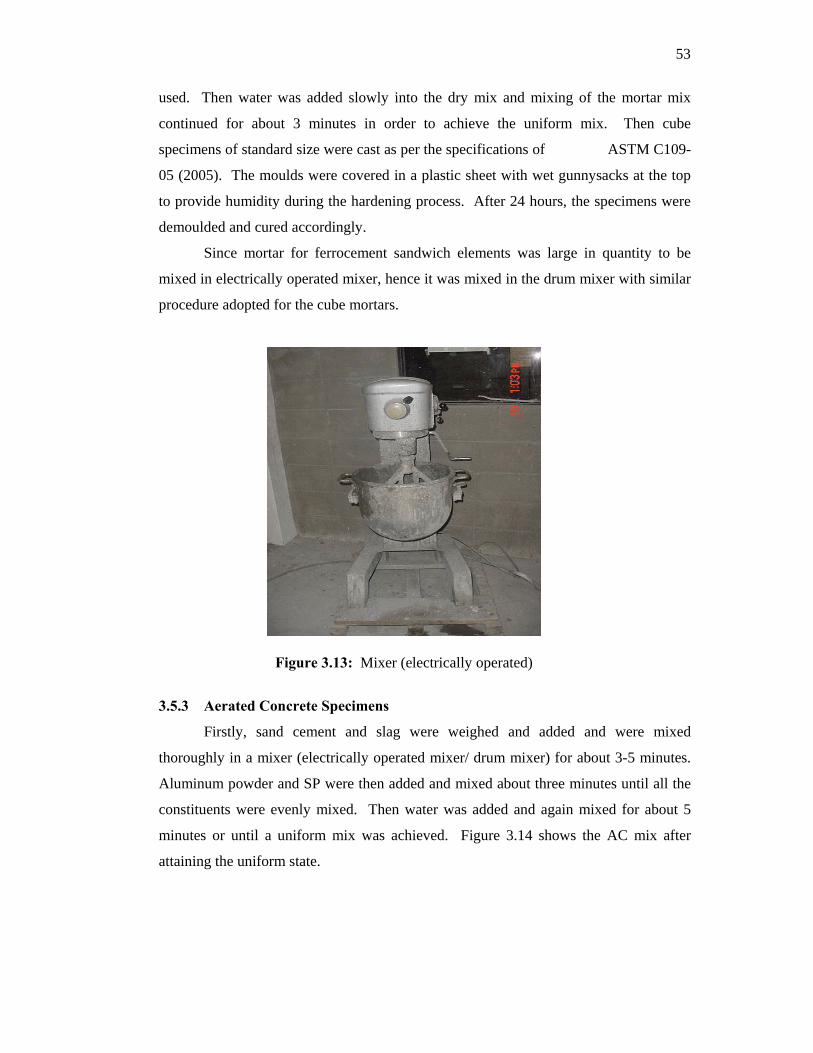
53
used. Then water was added slowly into the dry mix and mixing of the mortar mix
continued for about 3 minutes in order to achieve the uniform mix. Then cube
specimens of standard size were cast as per the specifications of ASTM C109-
05 (2005). The moulds were covered in a plastic sheet with wet gunnysacks at the top
to provide humidity during the hardening process. After 24 hours, the specimens were
demoulded and cured accordingly.
Since mortar for ferrocement sandwich elements was large in quantity to be
mixed in electrically operated mixer, hence it was mixed in the drum mixer with similar
procedure adopted for the cube mortars.
Figure 3.13: Mixer (electrically operated)
3.5.3 Aerated Concrete Specimens
Firstly, sand cement and slag were weighed and added and were mixed
thoroughly in a mixer (electrically operated mixer/ drum mixer) for about 3-5 minutes.
Aluminum powder and SP were then added and mixed about three minutes until all the
constituents were evenly mixed. Then water was added and again mixed for about 5
minutes or until a uniform mix was achieved. Figure 3.14 shows the AC mix after
attaining the uniform state.
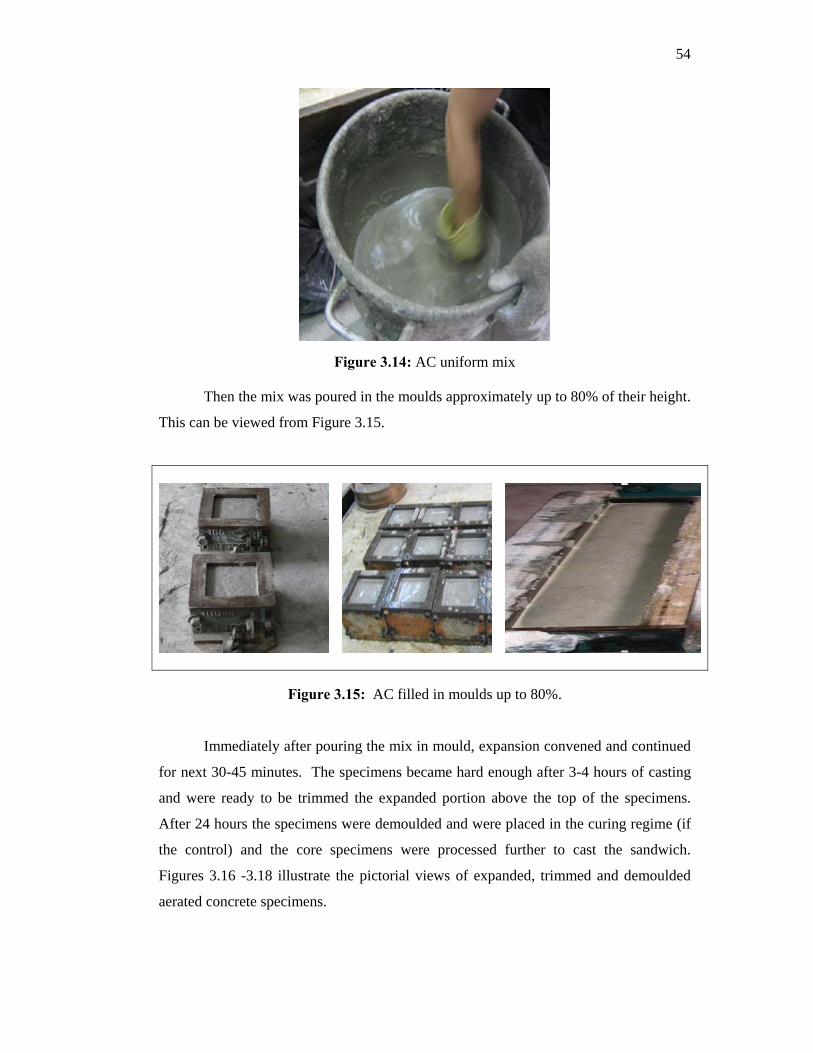
54
Figure 3.14: AC uniform mix Then the mix was poured in the moulds approximately up to 80% of their height.
This can be viewed from Figure 3.15.
Figure 3.15: AC filled in moulds up to 80%. Immediately after pouring the mix in mould, expansion convened and continued
for next 30-45 minutes. The specimens became hard enough after 3-4 hours of casting
and were ready to be trimmed the expanded portion above the top of the specimens.
After 24 hours the specimens were demoulded and were placed in the curing regime (if
the control) and the core specimens were processed further to cast the sandwich.
Figures 3.16 -3.18 illustrate the pictorial views of expanded, trimmed and demoulded
aerated concrete specimens.
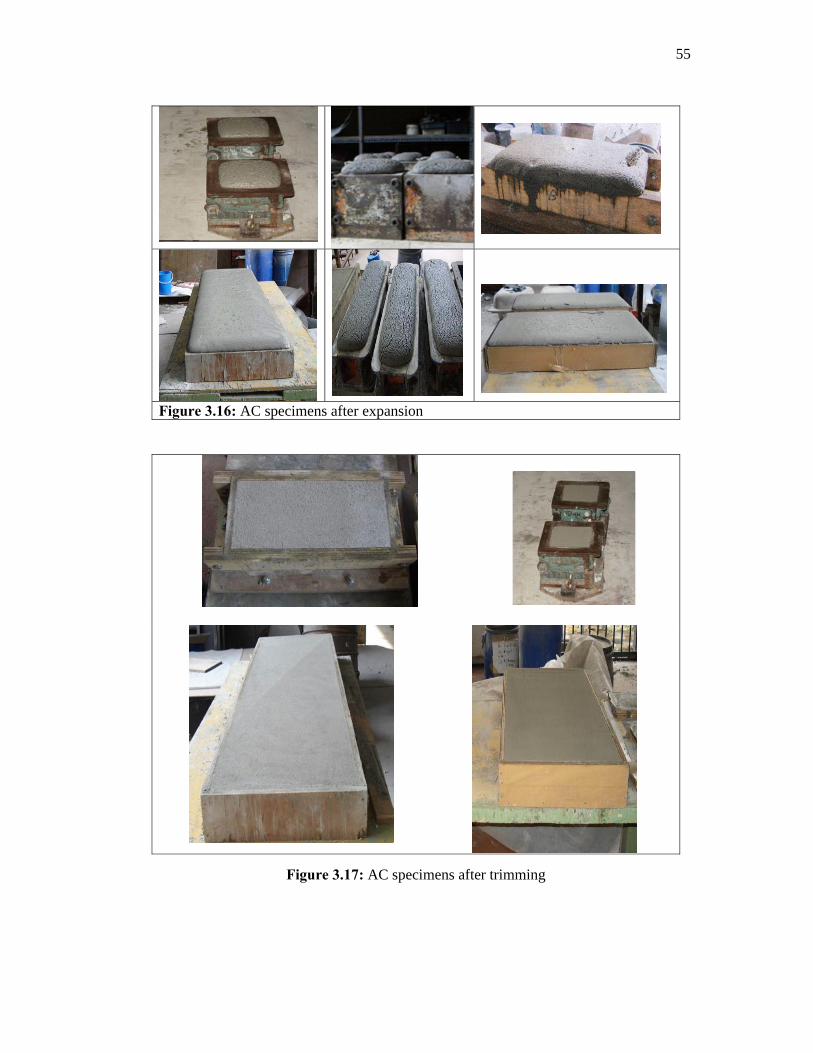
55
Figure 3.16: AC specimens after expansion
Figure 3.17: AC specimens after trimming
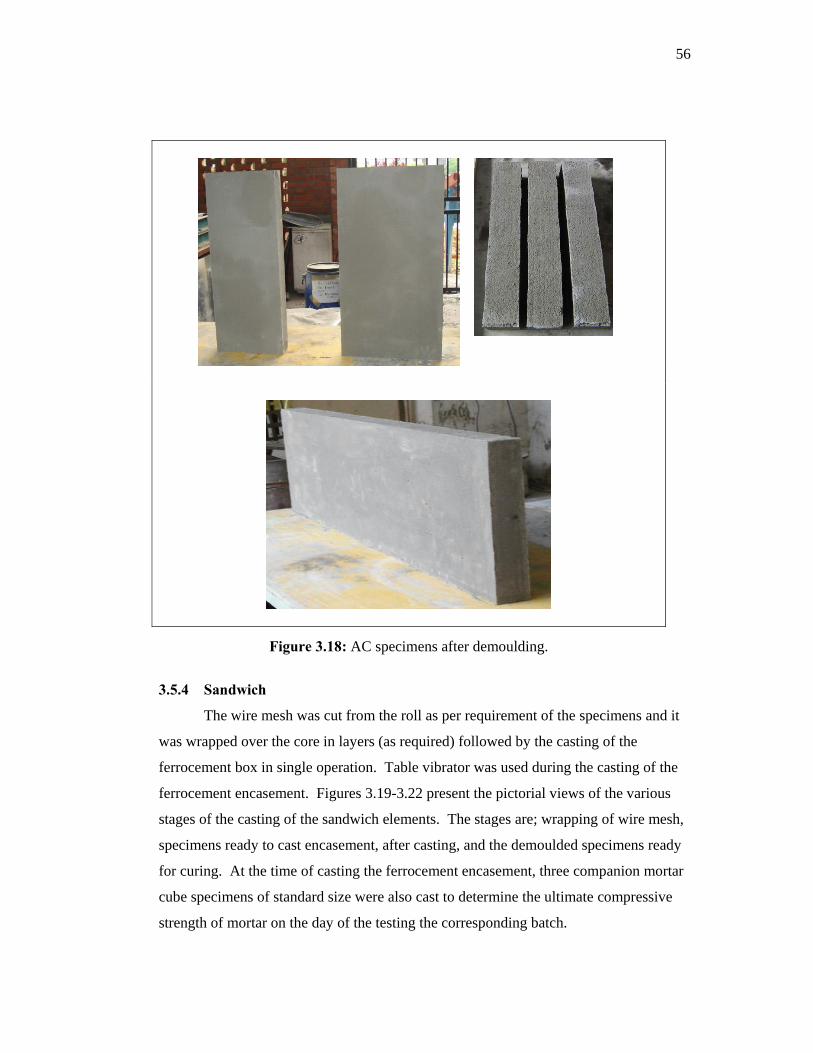
56
Figure 3.18: AC specimens after demoulding.
3.5.4 Sandwich
The wire mesh was cut from the roll as per requirement of the specimens and it
was wrapped over the core in layers (as required) followed by the casting of the
ferrocement box in single operation. Table vibrator was used during the casting of the
ferrocement encasement. Figures 3.19-3.22 present the pictorial views of the various
stages of the casting of the sandwich elements. The stages are; wrapping of wire mesh,
specimens ready to cast encasement, after casting, and the demoulded specimens ready
for curing. At the time of casting the ferrocement encasement, three companion mortar
cube specimens of standard size were also cast to determine the ultimate compressive
strength of mortar on the day of the testing the corresponding batch.
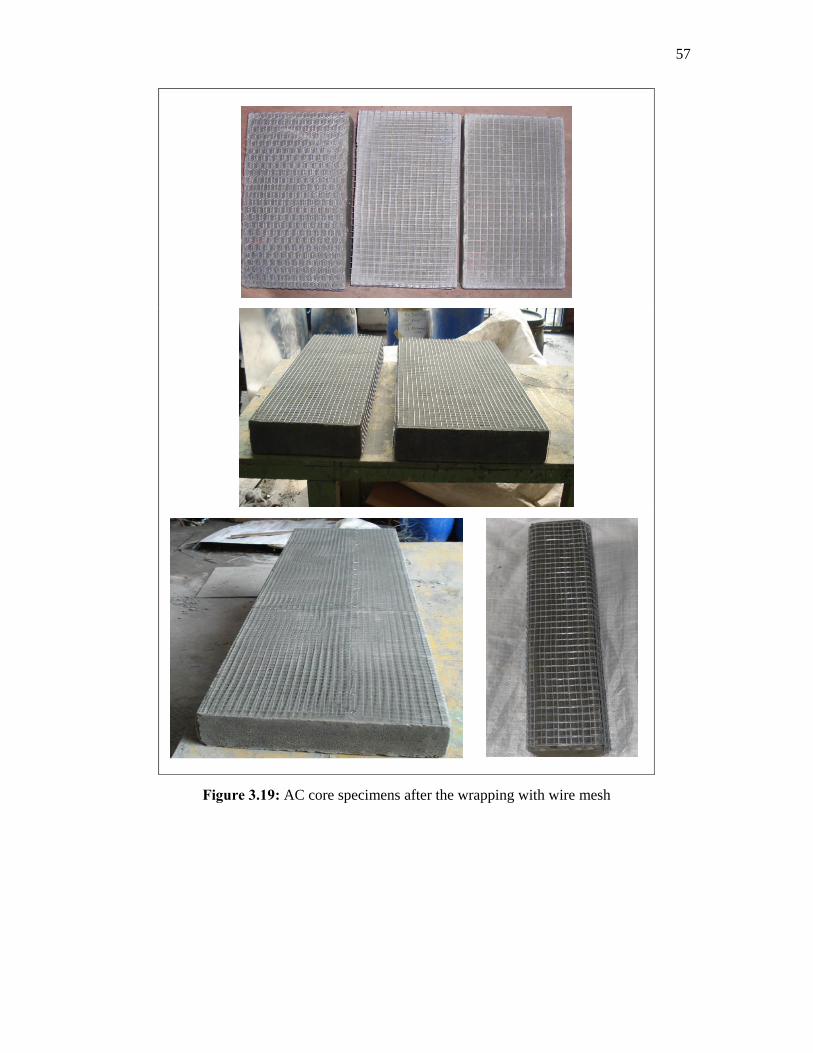
57
Figure 3.19: AC core specimens after the wrapping with wire mesh
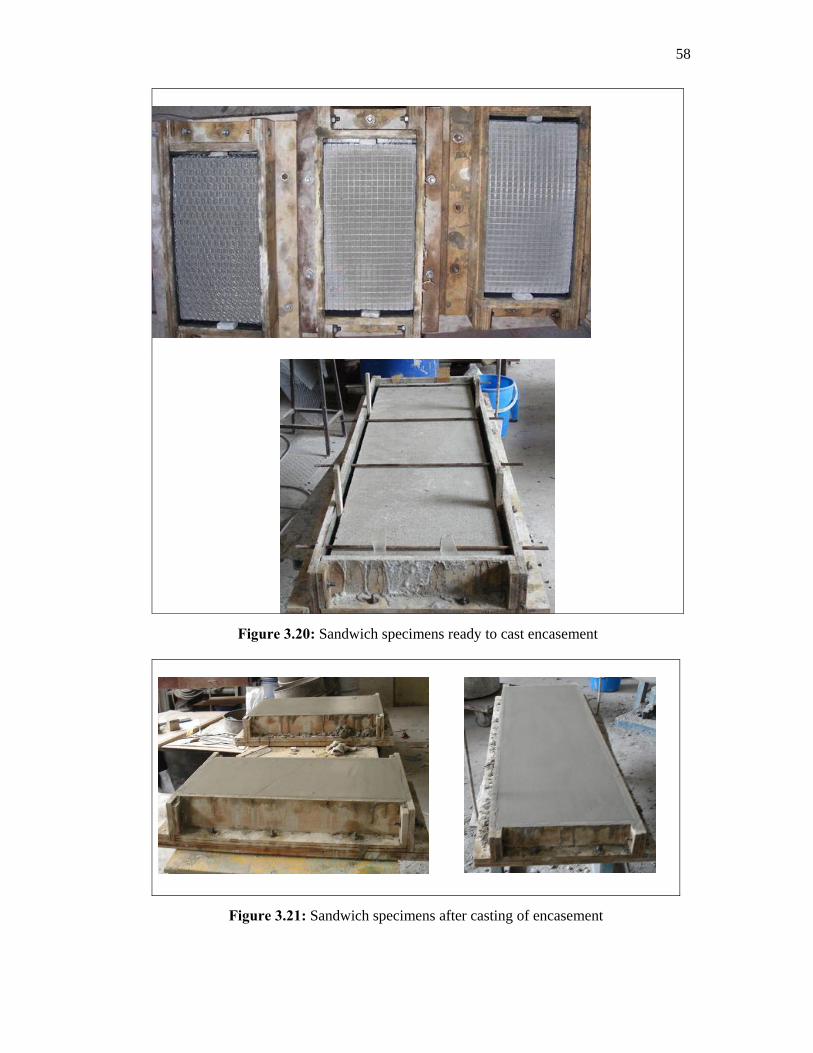
58
Figure 3.20: Sandwich specimens ready to cast encasement
Figure 3.21: Sandwich specimens after casting of encasement
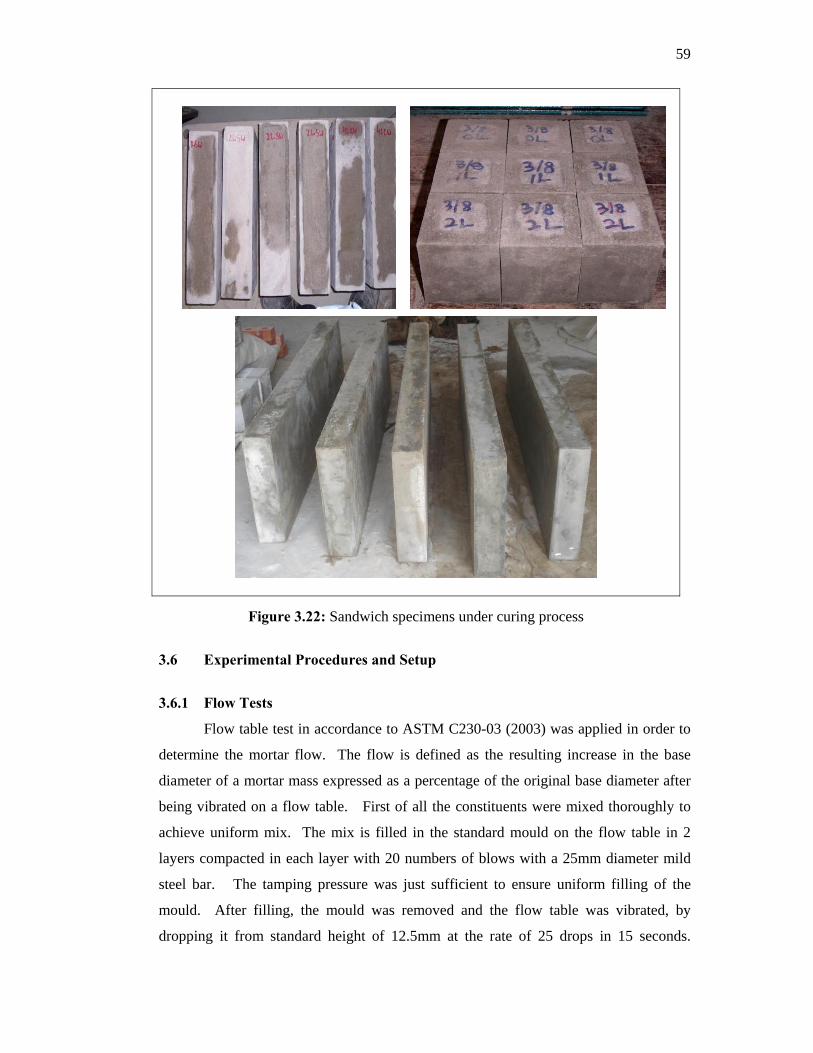
59
Figure 3.22: Sandwich specimens under curing process
3.6 Experimental Procedures and Setup
3.6.1 Flow Tests
Flow table test in accordance to ASTM C230-03 (2003) was applied in order to
determine the mortar flow. The flow is defined as the resulting increase in the base
diameter of a mortar mass expressed as a percentage of the original base diameter after
being vibrated on a flow table. First of all the constituents were mixed thoroughly to
achieve uniform mix. The mix is filled in the standard mould on the flow table in 2
layers compacted in each layer with 20 numbers of blows with a 25mm diameter mild
steel bar. The tamping pressure was just sufficient to ensure uniform filling of the
mould. After filling, the mould was removed and the flow table was vibrated, by
dropping it from standard height of 12.5mm at the rate of 25 drops in 15 seconds.
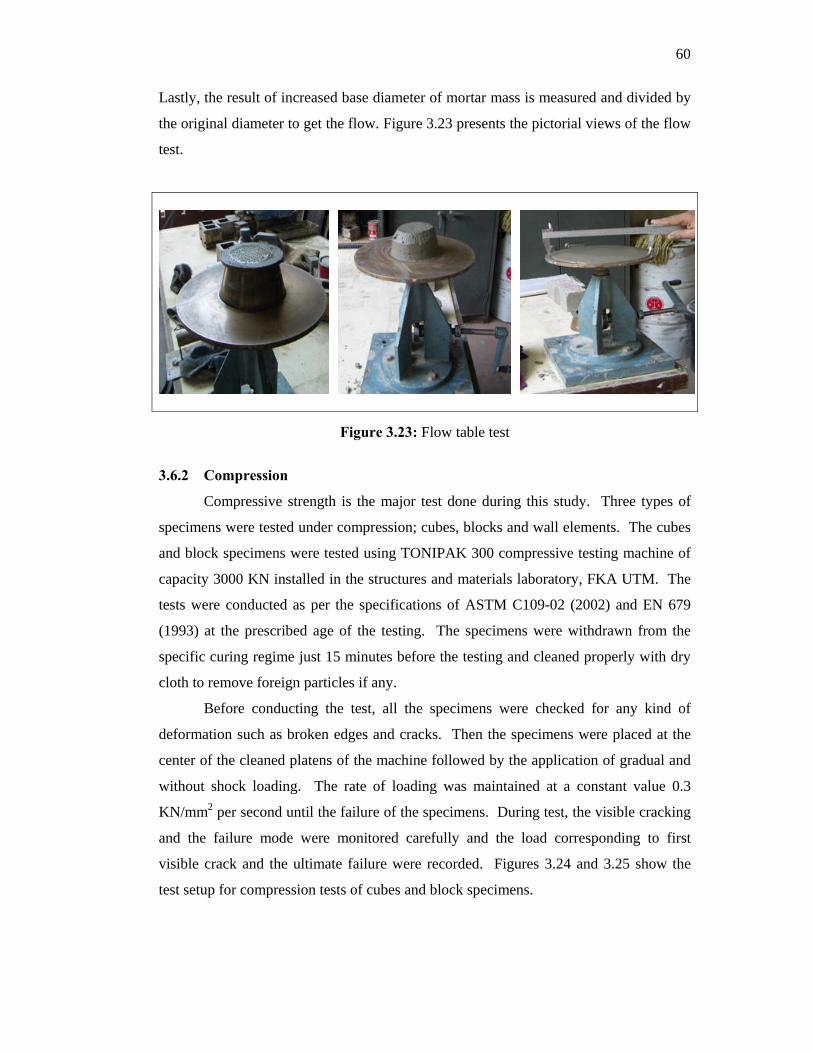
60
Lastly, the result of increased base diameter of mortar mass is measured and divided by
the original diameter to get the flow. Figure 3.23 presents the pictorial views of the flow
test.
Figure 3.23: Flow table test
3.6.2 Compression
Compressive strength is the major test done during this study. Three types of
specimens were tested under compression; cubes, blocks and wall elements. The cubes
and block specimens were tested using TONIPAK 300 compressive testing machine of
capacity 3000 KN installed in the structures and materials laboratory, FKA UTM. The
tests were conducted as per the specifications of ASTM C109-02 (2002) and EN 679
(1993) at the prescribed age of the testing. The specimens were withdrawn from the
specific curing regime just 15 minutes before the testing and cleaned properly with dry
cloth to remove foreign particles if any.
Before conducting the test, all the specimens were checked for any kind of
deformation such as broken edges and cracks. Then the specimens were placed at the
center of the cleaned platens of the machine followed by the application of gradual and
without shock loading. The rate of loading was maintained at a constant value 0.3
KN/mm2 per second until the failure of the specimens. During test, the visible cracking
and the failure mode were monitored carefully and the load corresponding to first
visible crack and the ultimate failure were recorded. Figures 3.24 and 3.25 show the
test setup for compression tests of cubes and block specimens.
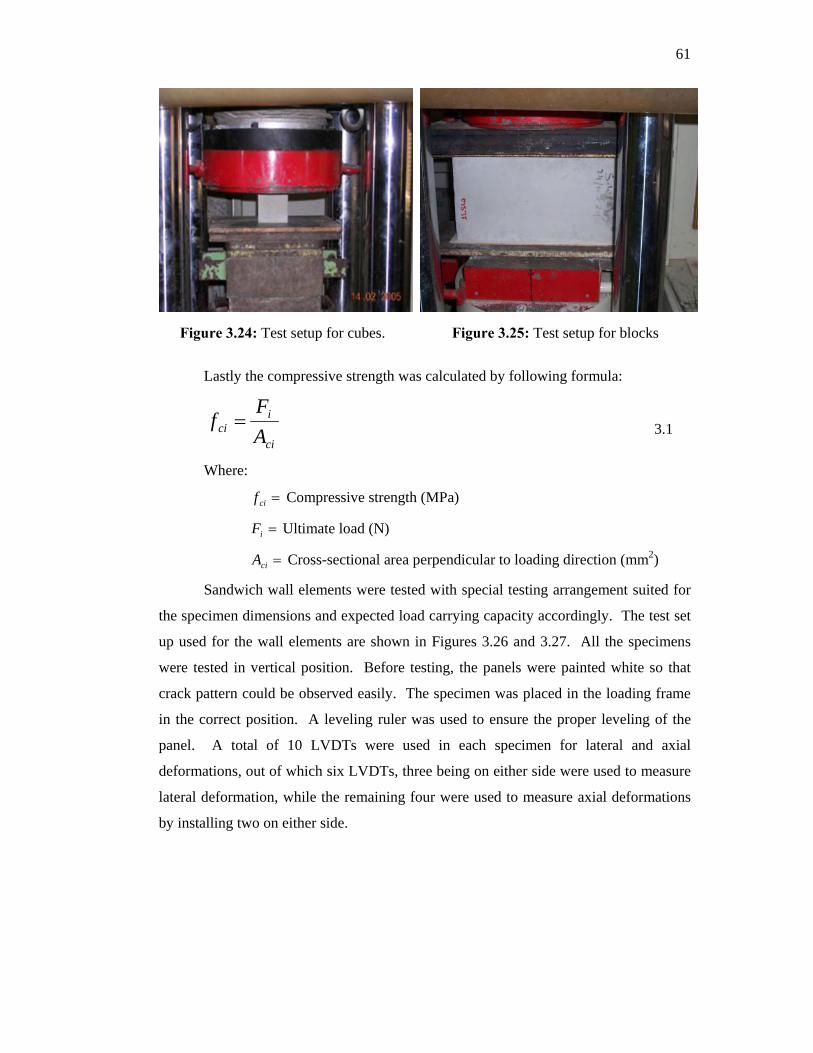
61
Figure 3.24: Test setup for cubes. Figure 3.25: Test setup for blocks
Lastly the compressive strength was calculated by following formula:
ci
ici A
Ff = 3.1
Where:
=cif Compressive strength (MPa)
=iF Ultimate load (N)
=ciA Cross-sectional area perpendicular to loading direction (mm2)
Sandwich wall elements were tested with special testing arrangement suited for
the specimen dimensions and expected load carrying capacity accordingly. The test set
up used for the wall elements are shown in Figures 3.26 and 3.27. All the specimens
were tested in vertical position. Before testing, the panels were painted white so that
crack pattern could be observed easily. The specimen was placed in the loading frame
in the correct position. A leveling ruler was used to ensure the proper leveling of the
panel. A total of 10 LVDTs were used in each specimen for lateral and axial
deformations, out of which six LVDTs, three being on either side were used to measure
lateral deformation, while the remaining four were used to measure axial deformations
by installing two on either side.
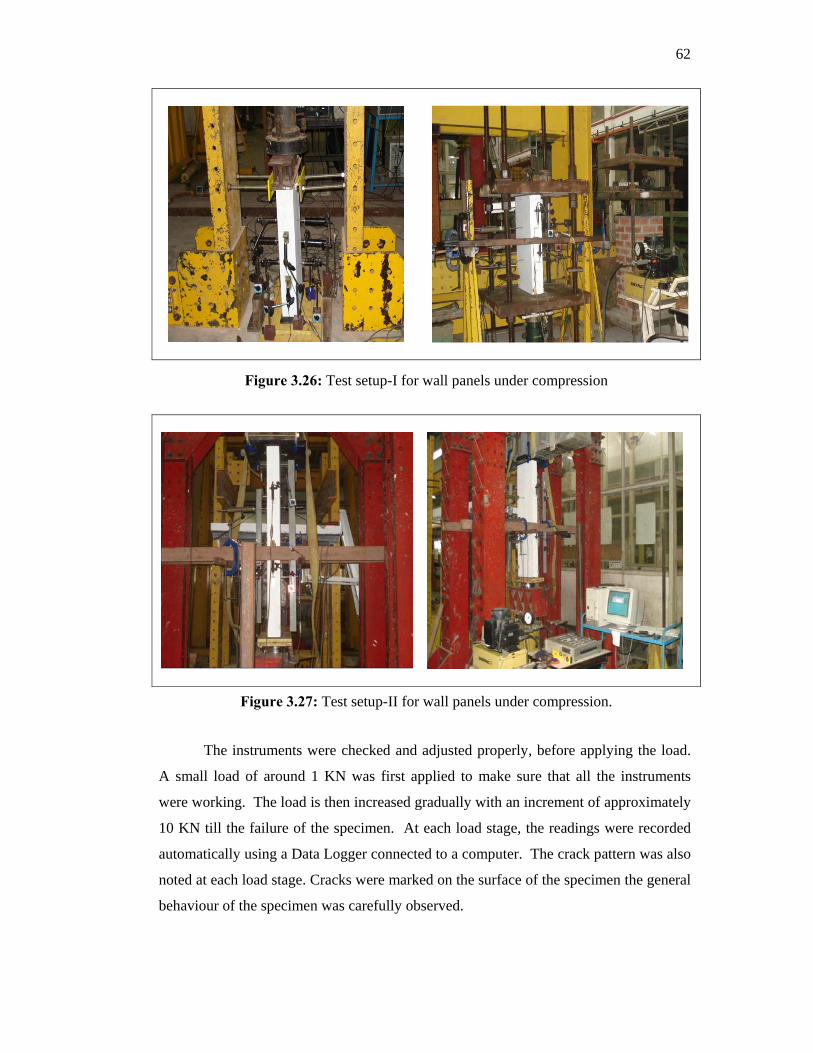
62
Figure 3.26: Test setup-I for wall panels under compression
Figure 3.27: Test setup-II for wall panels under compression.
The instruments were checked and adjusted properly, before applying the load.
A small load of around 1 KN was first applied to make sure that all the instruments
were working. The load is then increased gradually with an increment of approximately
10 KN till the failure of the specimen. At each load stage, the readings were recorded
automatically using a Data Logger connected to a computer. The crack pattern was also
noted at each load stage. Cracks were marked on the surface of the specimen the general
behaviour of the specimen was carefully observed.
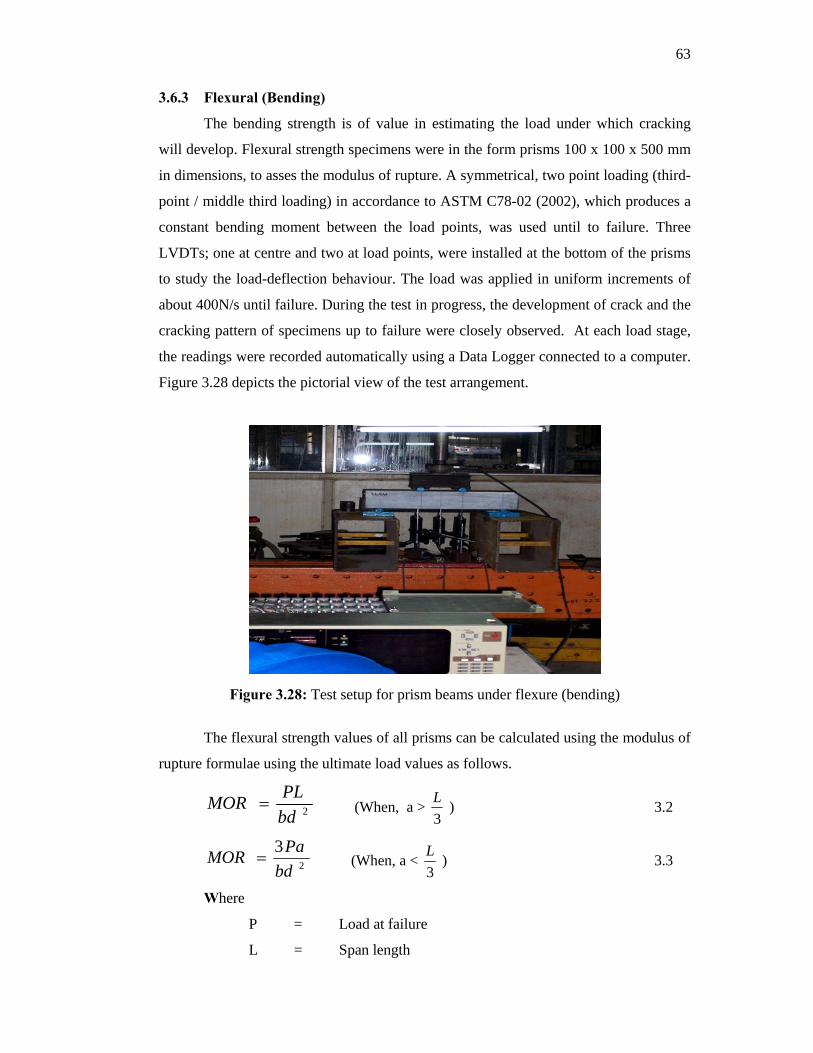
63
3.6.3 Flexural (Bending)
The bending strength is of value in estimating the load under which cracking
will develop. Flexural strength specimens were in the form prisms 100 x 100 x 500 mm
in dimensions, to asses the modulus of rupture. A symmetrical, two point loading (third-
point / middle third loading) in accordance to ASTM C78-02 (2002), which produces a
constant bending moment between the load points, was used until to failure. Three
LVDTs; one at centre and two at load points, were installed at the bottom of the prisms
to study the load-deflection behaviour. The load was applied in uniform increments of
about 400N/s until failure. During the test in progress, the development of crack and the
cracking pattern of specimens up to failure were closely observed. At each load stage,
the readings were recorded automatically using a Data Logger connected to a computer.
Figure 3.28 depicts the pictorial view of the test arrangement.
Figure 3.28: Test setup for prism beams under flexure (bending)
The flexural strength values of all prisms can be calculated using the modulus of
rupture formulae using the ultimate load values as follows.
2bdPLMOR = (When, a >
3L ) 3.2
2
3bd
PaMOR = (When, a < 3L ) 3.3
Where
P = Load at failure
L = Span length
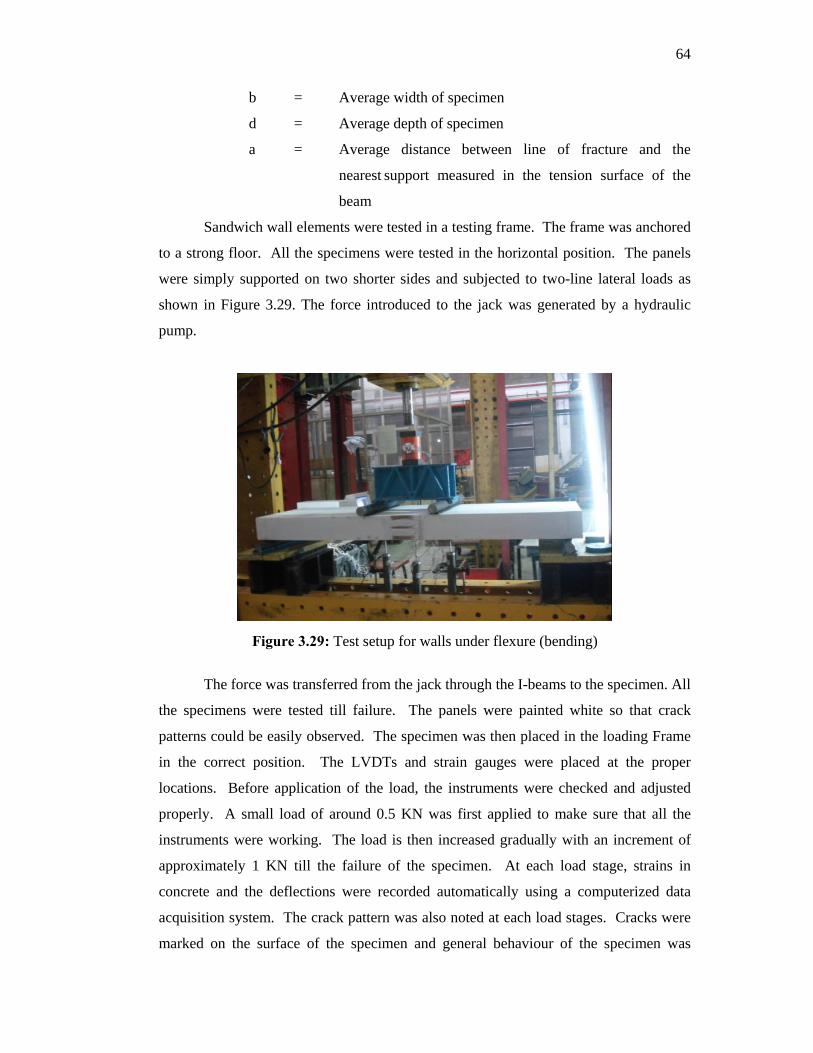
64
b = Average width of specimen
d = Average depth of specimen
a = Average distance between line of fracture and the
nearest support measured in the tension surface of the
beam
Sandwich wall elements were tested in a testing frame. The frame was anchored
to a strong floor. All the specimens were tested in the horizontal position. The panels
were simply supported on two shorter sides and subjected to two-line lateral loads as
shown in Figure 3.29. The force introduced to the jack was generated by a hydraulic
pump.
Figure 3.29: Test setup for walls under flexure (bending)
The force was transferred from the jack through the I-beams to the specimen. All
the specimens were tested till failure. The panels were painted white so that crack
patterns could be easily observed. The specimen was then placed in the loading Frame
in the correct position. The LVDTs and strain gauges were placed at the proper
locations. Before application of the load, the instruments were checked and adjusted
properly. A small load of around 0.5 KN was first applied to make sure that all the
instruments were working. The load is then increased gradually with an increment of
approximately 1 KN till the failure of the specimen. At each load stage, strains in
concrete and the deflections were recorded automatically using a computerized data
acquisition system. The crack pattern was also noted at each load stages. Cracks were
marked on the surface of the specimen and general behaviour of the specimen was
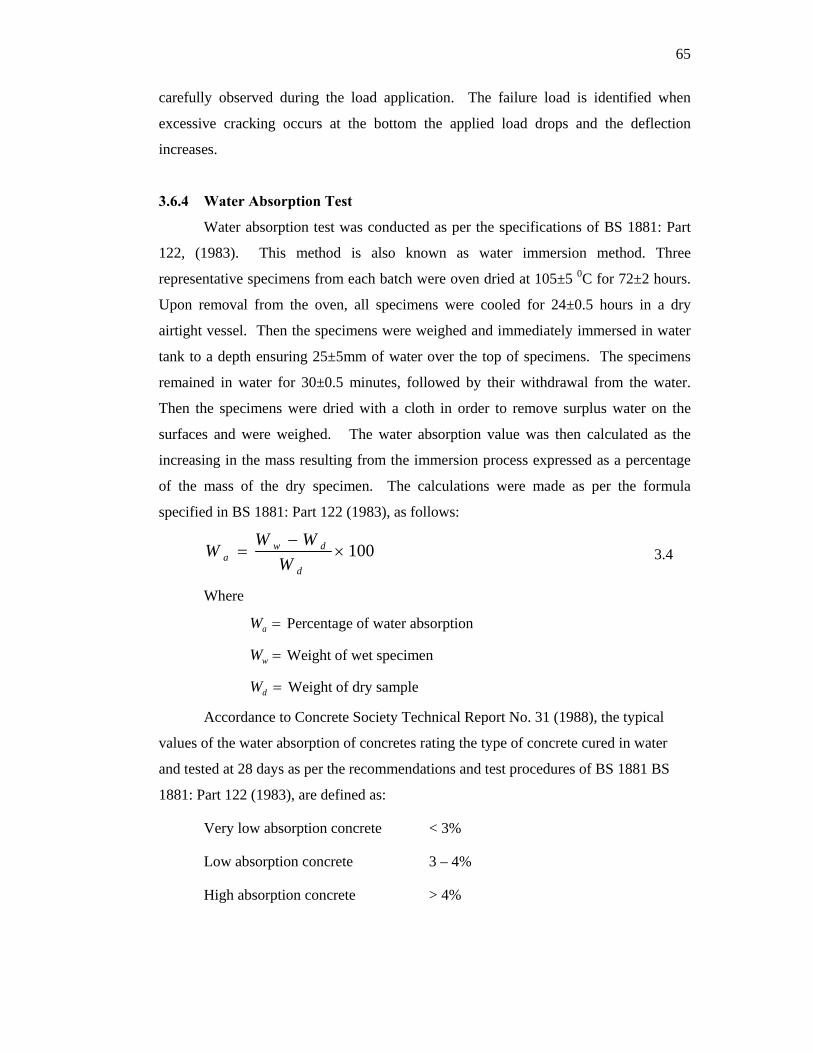
65
carefully observed during the load application. The failure load is identified when
excessive cracking occurs at the bottom the applied load drops and the deflection
increases.
3.6.4 Water Absorption Test
Water absorption test was conducted as per the specifications of BS 1881: Part
122, (1983). This method is also known as water immersion method. Three
representative specimens from each batch were oven dried at 105±5 0C for 72±2 hours.
Upon removal from the oven, all specimens were cooled for 24±0.5 hours in a dry
airtight vessel. Then the specimens were weighed and immediately immersed in water
tank to a depth ensuring 25±5mm of water over the top of specimens. The specimens
remained in water for 30±0.5 minutes, followed by their withdrawal from the water.
Then the specimens were dried with a cloth in order to remove surplus water on the
surfaces and were weighed. The water absorption value was then calculated as the
increasing in the mass resulting from the immersion process expressed as a percentage
of the mass of the dry specimen. The calculations were made as per the formula
specified in BS 1881: Part 122 (1983), as follows:
100×−
=d
dwa W
WWW 3.4
Where
=aW Percentage of water absorption
=wW Weight of wet specimen
=dW Weight of dry sample
Accordance to Concrete Society Technical Report No. 31 (1988), the typical
values of the water absorption of concretes rating the type of concrete cured in water
and tested at 28 days as per the recommendations and test procedures of BS 1881 BS
1881: Part 122 (1983), are defined as:
Very low absorption concrete < 3%
Low absorption concrete 3 – 4%
High absorption concrete > 4%
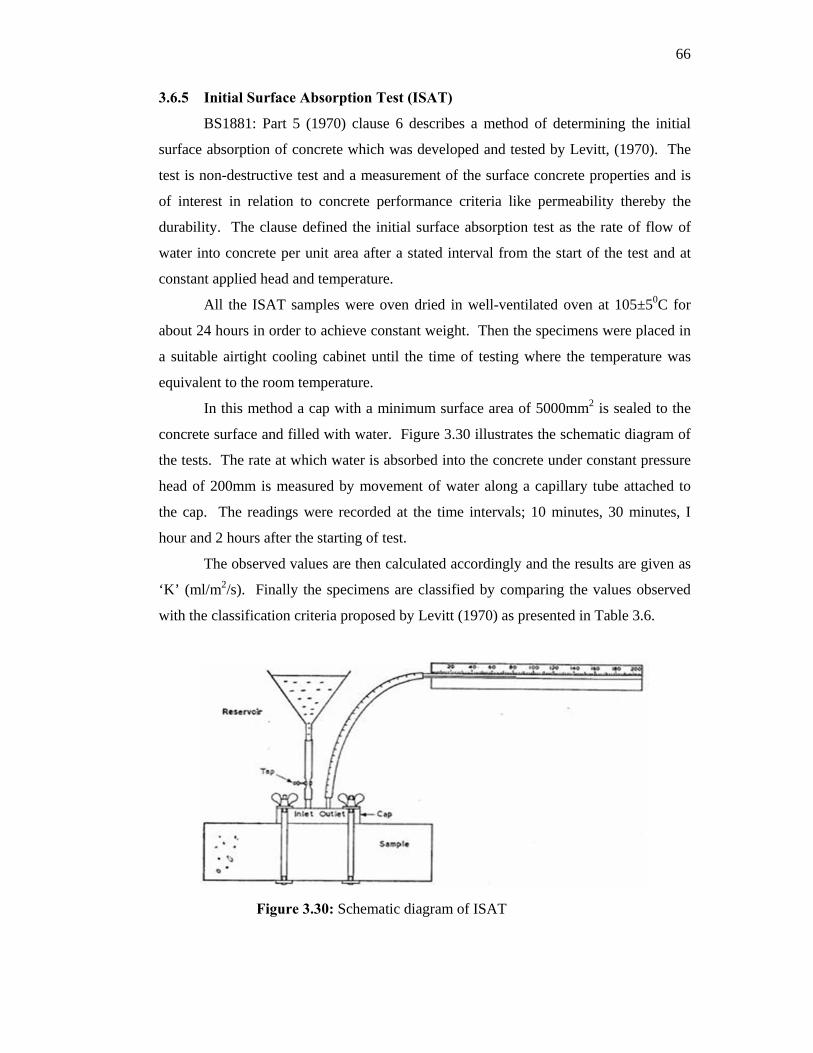
66
3.6.5 Initial Surface Absorption Test (ISAT)
BS1881: Part 5 (1970) clause 6 describes a method of determining the initial
surface absorption of concrete which was developed and tested by Levitt, (1970). The
test is non-destructive test and a measurement of the surface concrete properties and is
of interest in relation to concrete performance criteria like permeability thereby the
durability. The clause defined the initial surface absorption test as the rate of flow of
water into concrete per unit area after a stated interval from the start of the test and at
constant applied head and temperature.
All the ISAT samples were oven dried in well-ventilated oven at 105±50C for
about 24 hours in order to achieve constant weight. Then the specimens were placed in
a suitable airtight cooling cabinet until the time of testing where the temperature was
equivalent to the room temperature.
In this method a cap with a minimum surface area of 5000mm2 is sealed to the
concrete surface and filled with water. Figure 3.30 illustrates the schematic diagram of
the tests. The rate at which water is absorbed into the concrete under constant pressure
head of 200mm is measured by movement of water along a capillary tube attached to
the cap. The readings were recorded at the time intervals; 10 minutes, 30 minutes, I
hour and 2 hours after the starting of test.
The observed values are then calculated accordingly and the results are given as
‘K’ (ml/m2/s). Finally the specimens are classified by comparing the values observed
with the classification criteria proposed by Levitt (1970) as presented in Table 3.6.
Figure 3.30: Schematic diagram of ISAT
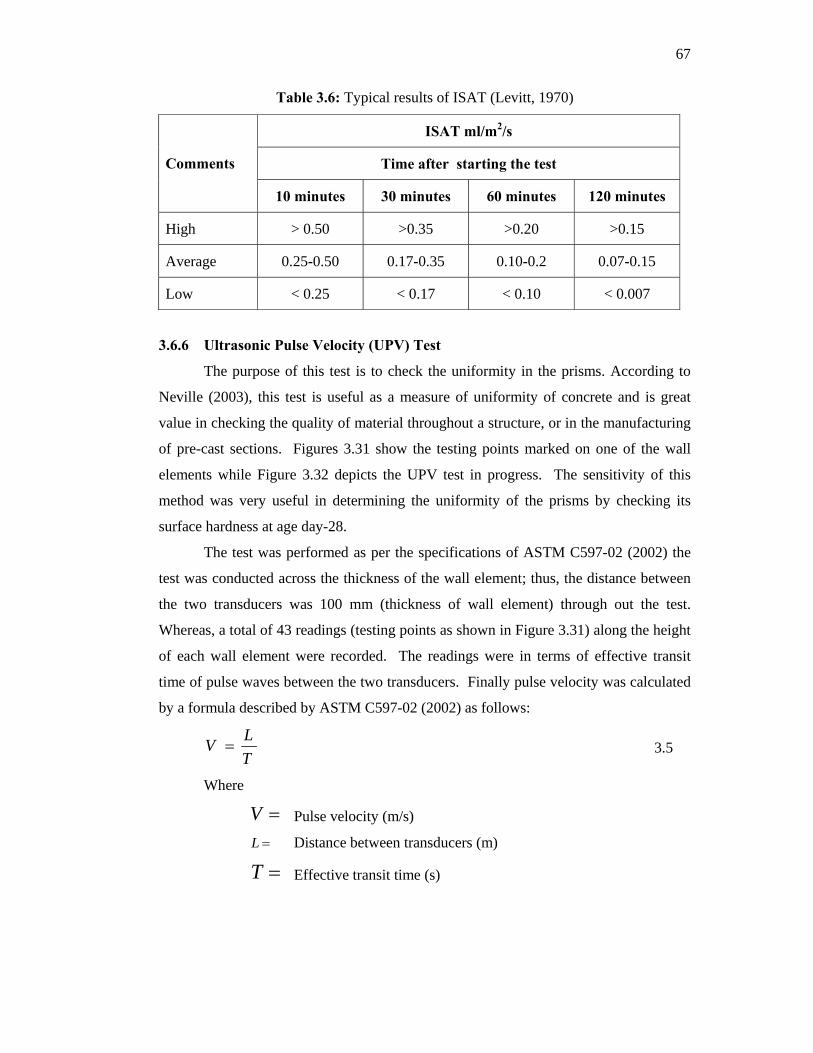
67
Table 3.6: Typical results of ISAT (Levitt, 1970)
ISAT ml/m2/s
Time after starting the test Comments
10 minutes 30 minutes 60 minutes 120 minutes
High > 0.50 >0.35 >0.20 >0.15
Average 0.25-0.50 0.17-0.35 0.10-0.2 0.07-0.15
Low < 0.25 < 0.17 < 0.10 < 0.007
3.6.6 Ultrasonic Pulse Velocity (UPV) Test
The purpose of this test is to check the uniformity in the prisms. According to
Neville (2003), this test is useful as a measure of uniformity of concrete and is great
value in checking the quality of material throughout a structure, or in the manufacturing
of pre-cast sections. Figures 3.31 show the testing points marked on one of the wall
elements while Figure 3.32 depicts the UPV test in progress. The sensitivity of this
method was very useful in determining the uniformity of the prisms by checking its
surface hardness at age day-28.
The test was performed as per the specifications of ASTM C597-02 (2002) the
test was conducted across the thickness of the wall element; thus, the distance between
the two transducers was 100 mm (thickness of wall element) through out the test.
Whereas, a total of 43 readings (testing points as shown in Figure 3.31) along the height
of each wall element were recorded. The readings were in terms of effective transit
time of pulse waves between the two transducers. Finally pulse velocity was calculated
by a formula described by ASTM C597-02 (2002) as follows:
TLV = 3.5
Where
=V Pulse velocity (m/s)
=L Distance between transducers (m)
=T Effective transit time (s)
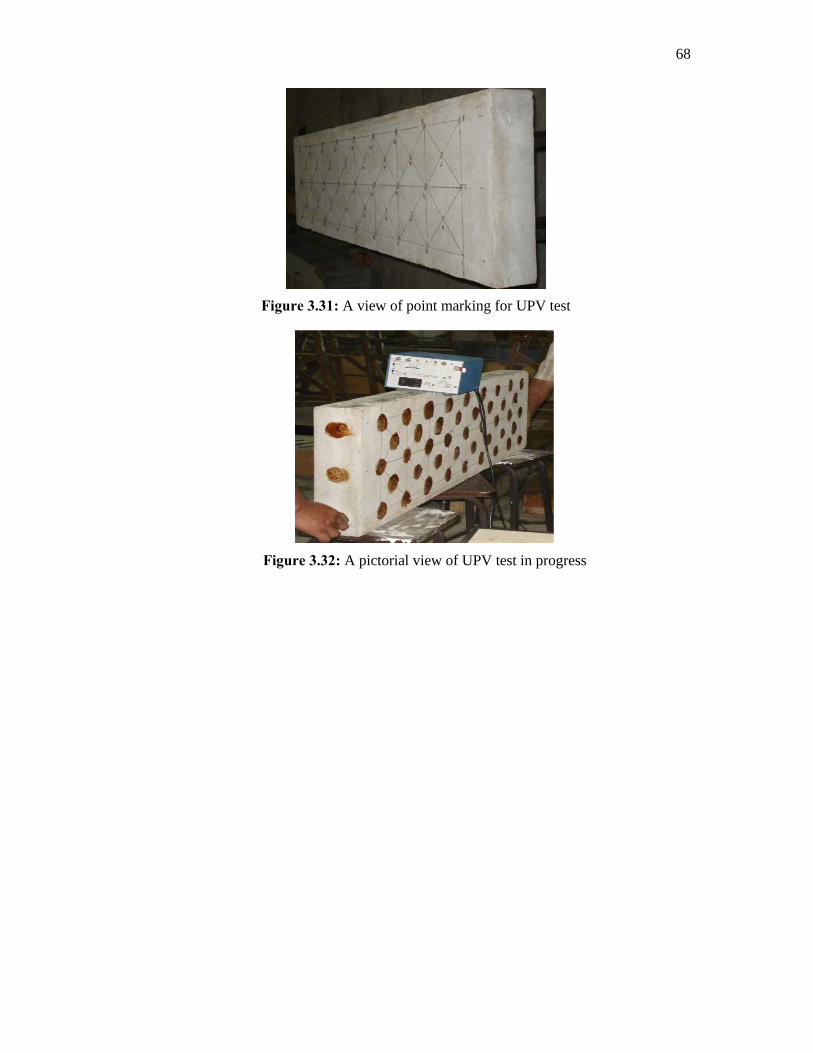
68
Figure 3.31: A view of point marking for UPV test
Figure 3.32: A pictorial view of UPV test in progress
69
CHAPTER 4
EXPERIMENTAL RESULTS AND DISCUSSIONS (PHASE-I)
4.1 General
This chapter discusses the results of phase-I of the experimental program as
described in chapter three. The experimental investigations were aimed to develop high
workability and high performance slag cement based mortar to cast the ferrocement
encasement over aerated concrete core in order to produce proposed ferrocement
encased aerated concrete sandwich wall elements.
A stepwise strategy for this phase of experimental study was adopted, as
mentioned in methodology of the study described in chapter three. The results and their
comparisons are described through tables and figures as following. Finally the
experimental results are summarized at the end of the chapter.
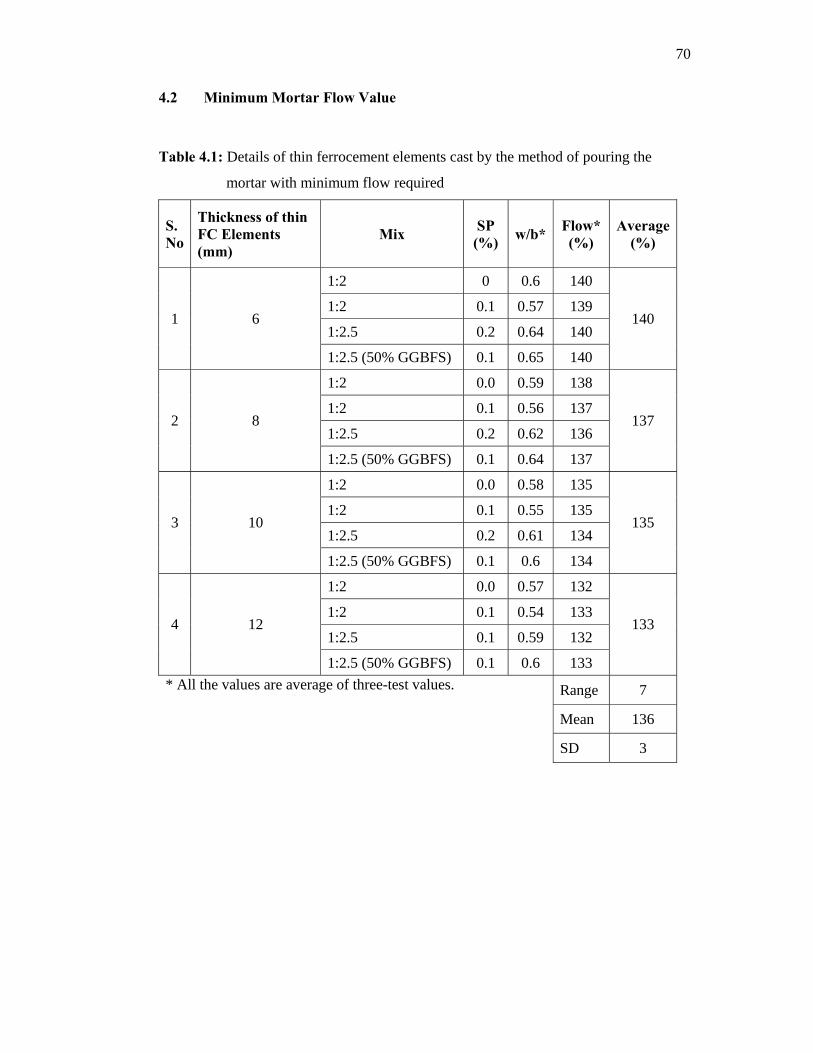
70
4.2 Minimum Mortar Flow Value
Table 4.1: Details of thin ferrocement elements cast by the method of pouring the
mortar with minimum flow required
S. No
Thickness of thin FC Elements (mm)
Mix SP (%) w/b* Flow*
(%) Average
(%)
1:2 0 0.6 140
1:2 0.1 0.57 139
1:2.5 0.2 0.64 140 1 6
1:2.5 (50% GGBFS) 0.1 0.65 140
140
1:2 0.0 0.59 138
1:2 0.1 0.56 137
1:2.5 0.2 0.62 136 2 8
1:2.5 (50% GGBFS) 0.1 0.64 137
137
1:2 0.0 0.58 135
1:2 0.1 0.55 135
1:2.5 0.2 0.61 134 3 10
1:2.5 (50% GGBFS) 0.1 0.6 134
135
1:2 0.0 0.57 132
1:2 0.1 0.54 133
1:2.5 0.1 0.59 132 4 12
1:2.5 (50% GGBFS) 0.1 0.6 133
133
Range 7
Mean 136
* All the values are average of three-test values.
SD 3
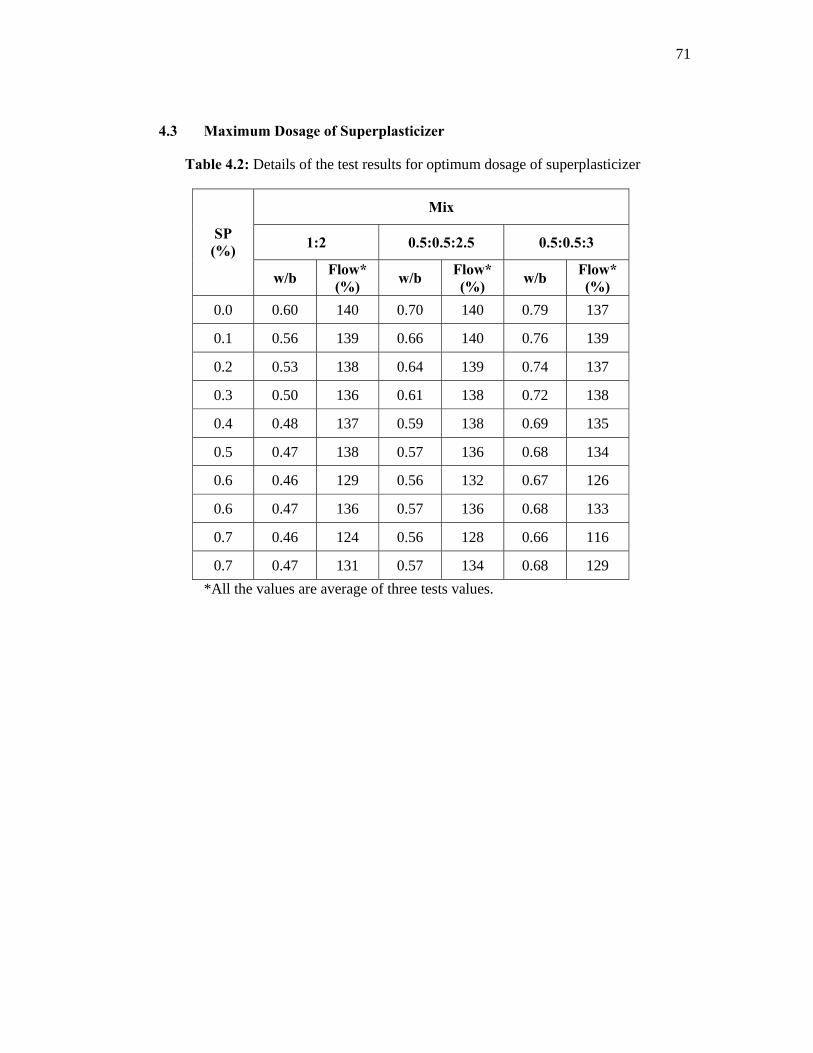
71
4.3 Maximum Dosage of Superplasticizer
Table 4.2: Details of the test results for optimum dosage of superplasticizer
Mix
1:2 0.5:0.5:2.5 0.5:0.5:3 SP (%)
w/b Flow* (%) w/b Flow*
(%) w/b Flow* (%)
0.0 0.60 140 0.70 140 0.79 137
0.1 0.56 139 0.66 140 0.76 139
0.2 0.53 138 0.64 139 0.74 137
0.3 0.50 136 0.61 138 0.72 138
0.4 0.48 137 0.59 138 0.69 135
0.5 0.47 138 0.57 136 0.68 134
0.6 0.46 129 0.56 132 0.67 126
0.6 0.47 136 0.57 136 0.68 133
0.7 0.46 124 0.56 128 0.66 116
0.7 0.47 131 0.57 134 0.68 129 *All the values are average of three tests values.
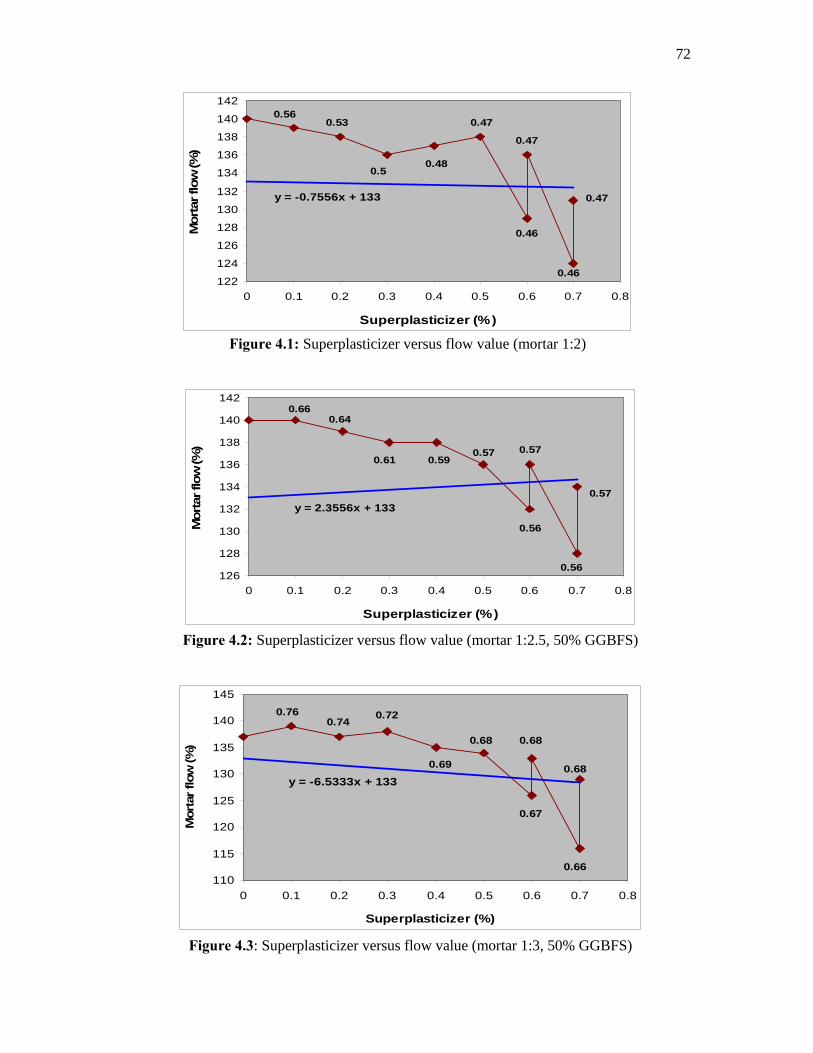
72
y = -0.7556x + 133
122
124
126
128
130
132
134
136
138
140
142
0 0.1 0.2 0.3 0.4 0.5 0.6 0.7 0.8
Superplasticizer (%)
Mor
tar f
low
(%)
0.56
0.5
0.53
0.48
0.47
0.46
0.47
0.46
0.47
Figure 4.1: Superplasticizer versus flow value (mortar 1:2)
y = 2.3556x + 133
126
128
130
132
134
136
138
140
142
0 0.1 0.2 0.3 0.4 0.5 0.6 0.7 0.8
Superplasticizer (%)
Mor
tar f
low
(%)
0.66
0.61
0.64
0.590.57
0.56
0.57
0.56
0.57
Figure 4.2: Superplasticizer versus flow value (mortar 1:2.5, 50% GGBFS)
y = -6.5333x + 133
110
115
120
125
130
135
140
145
0 0.1 0.2 0.3 0.4 0.5 0.6 0.7 0.8
Superplasticizer (%)
Mor
tar f
low
(%)
0.76 0.72 0.74
0.69
0.68
0.67
0.68
0.66
0.68
Figure 4.3: Superplasticizer versus flow value (mortar 1:3, 50% GGBFS)
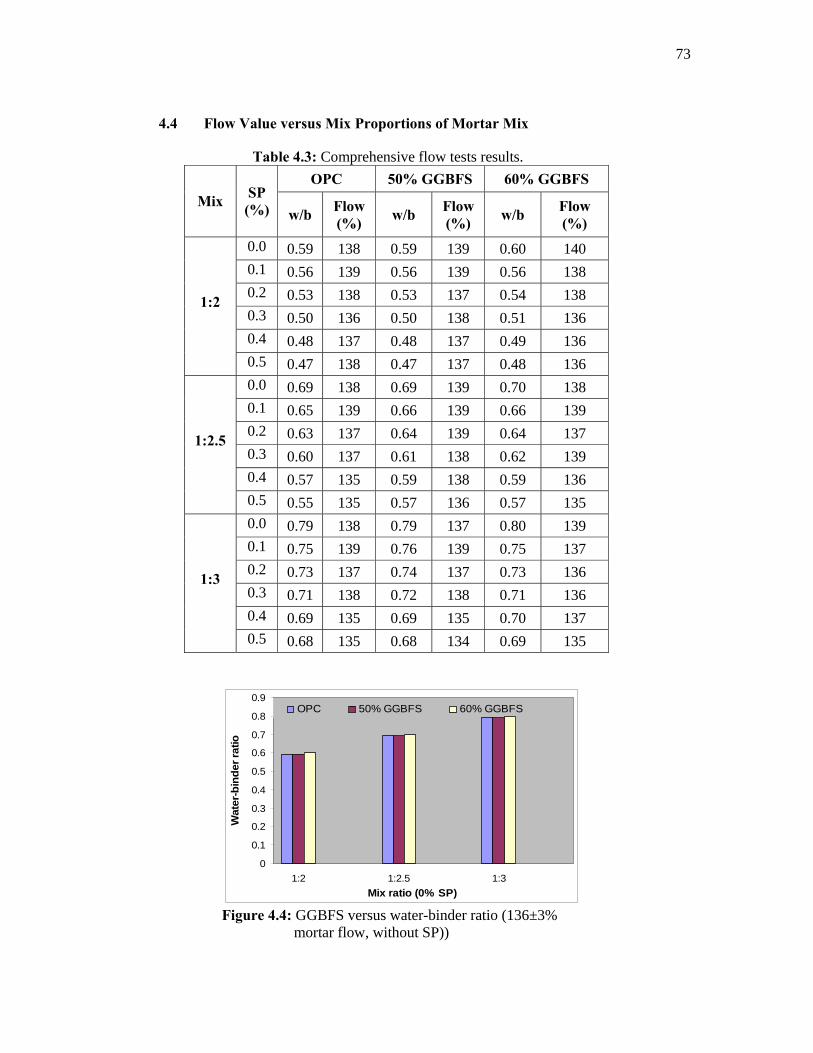
73
4.4 Flow Value versus Mix Proportions of Mortar Mix
Table 4.3: Comprehensive flow tests results. OPC 50% GGBFS 60% GGBFS
Mix SP (%) w/b Flow
(%) w/b Flow (%) w/b Flow
(%) 0.0 0.59 138 0.59 139 0.60 140 0.1 0.56 139 0.56 139 0.56 138 0.2 0.53 138 0.53 137 0.54 138 0.3 0.50 136 0.50 138 0.51 136 0.4 0.48 137 0.48 137 0.49 136
1:2
0.5 0.47 138 0.47 137 0.48 136 0.0 0.69 138 0.69 139 0.70 138 0.1 0.65 139 0.66 139 0.66 139 0.2 0.63 137 0.64 139 0.64 137 0.3 0.60 137 0.61 138 0.62 139 0.4 0.57 135 0.59 138 0.59 136
1:2.5
0.5 0.55 135 0.57 136 0.57 135 0.0 0.79 138 0.79 137 0.80 139 0.1 0.75 139 0.76 139 0.75 137 0.2 0.73 137 0.74 137 0.73 136 0.3 0.71 138 0.72 138 0.71 136 0.4 0.69 135 0.69 135 0.70 137
1:3
0.5 0.68 135 0.68 134 0.69 135
0
0.1
0.2
0.3
0.4
0.5
0.6
0.7
0.8
0.9
1:2 1:2.5 1:3Mix ratio (0% SP)
Wat
er-b
inde
r rat
io
OPC 50% GGBFS 60% GGBFS
Figure 4.4: GGBFS versus water-binder ratio (136±3%
mortar flow, without SP))
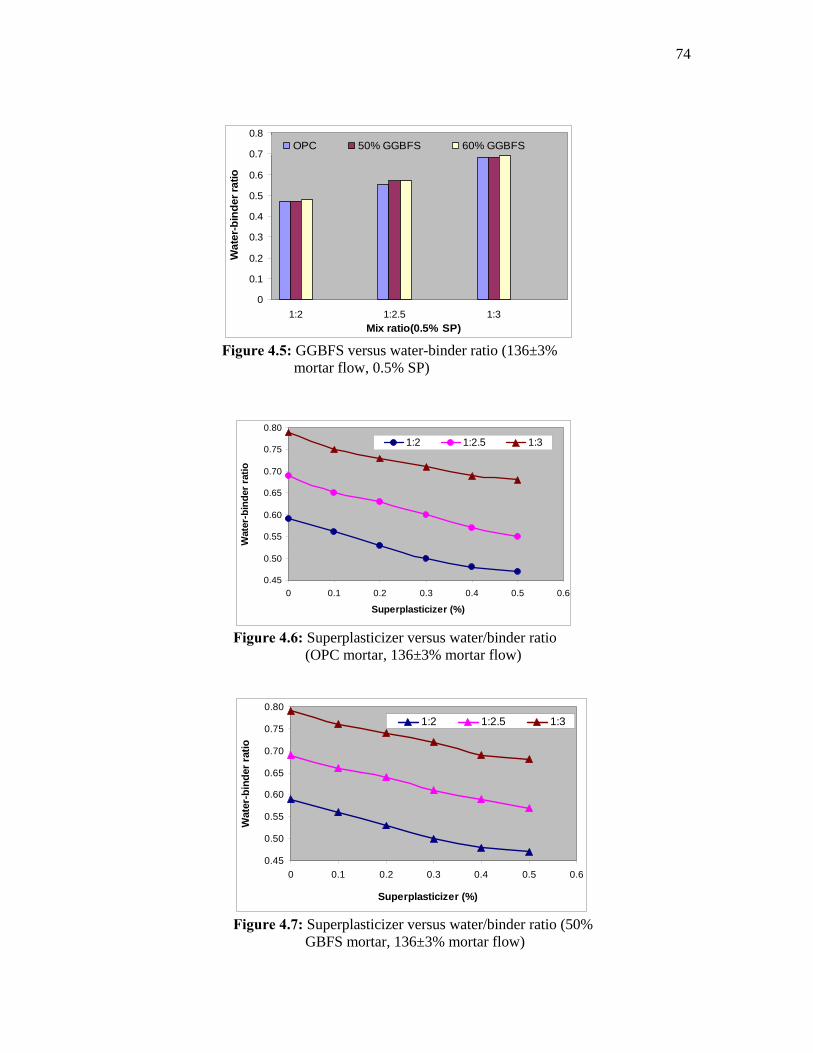
74
0
0.1
0.2
0.3
0.4
0.5
0.6
0.7
0.8
1:2 1:2.5 1:3Mix ratio(0.5% SP)
Wat
er-b
inde
r rat
io
OPC 50% GGBFS 60% GGBFS
Figure 4.5: GGBFS versus water-binder ratio (136±3%
mortar flow, 0.5% SP)
0.45
0.50
0.55
0.60
0.65
0.70
0.75
0.80
0 0.1 0.2 0.3 0.4 0.5 0.6
Superplasticizer (%)
Wat
er-b
inde
r rat
io
1:2 1:2.5 1:3
Figure 4.6: Superplasticizer versus water/binder ratio
(OPC mortar, 136±3% mortar flow)
0.45
0.50
0.55
0.60
0.65
0.70
0.75
0.80
0 0.1 0.2 0.3 0.4 0.5 0.6
Superplasticizer (%)
Wat
er-b
inde
r rat
io
1:2 1:2.5 1:3
Figure 4.7: Superplasticizer versus water/binder ratio (50%
GBFS mortar, 136±3% mortar flow)
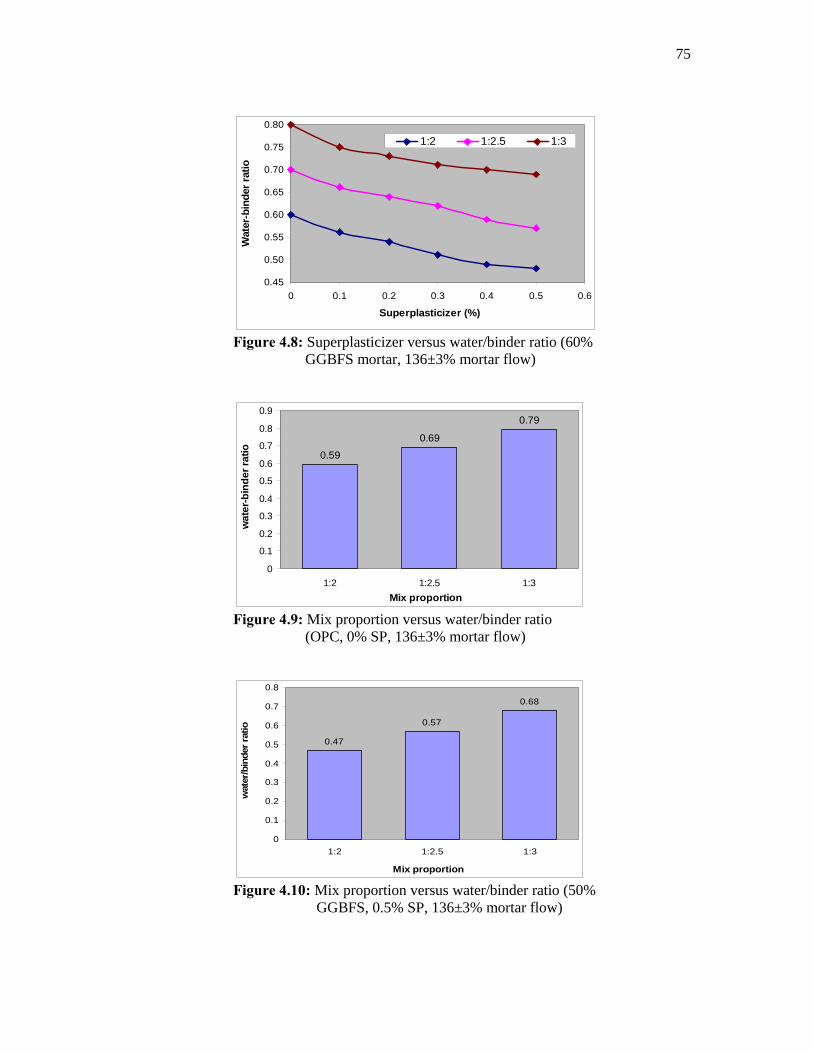
75
0.45
0.50
0.55
0.60
0.65
0.70
0.75
0.80
0 0.1 0.2 0.3 0.4 0.5 0.6
Superplasticizer (%)
Wat
er-b
inde
r rat
io
1:2 1:2.5 1:3
Figure 4.8: Superplasticizer versus water/binder ratio (60%
GGBFS mortar, 136±3% mortar flow)
0.59
0.69
0.79
0
0.1
0.2
0.3
0.4
0.5
0.6
0.7
0.8
0.9
1:2 1:2.5 1:3Mix proportion
wat
er-b
inde
r rat
io
Figure 4.9: Mix proportion versus water/binder ratio
(OPC, 0% SP, 136±3% mortar flow)
0.47
0.57
0.68
0
0.1
0.2
0.3
0.4
0.5
0.6
0.7
0.8
1:2 1:2.5 1:3
Mix proportion
wat
er/b
inde
r rat
io
Figure 4.10: Mix proportion versus water/binder ratio (50%
GGBFS, 0.5% SP, 136±3% mortar flow)
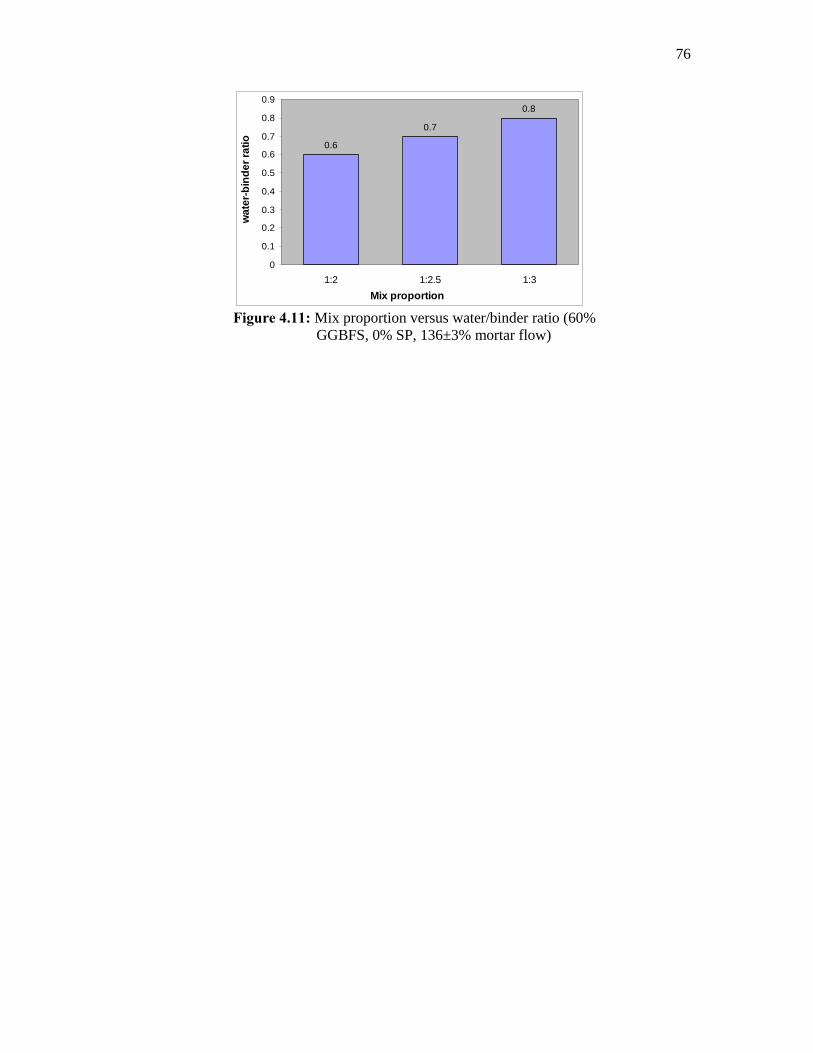
76
0.6
0.7
0.8
0
0.1
0.2
0.3
0.4
0.5
0.6
0.7
0.8
0.9
1:2 1:2.5 1:3Mix proportion
wat
er-b
inde
r rat
io
Figure 4.11: Mix proportion versus water/binder ratio (60%
GGBFS, 0% SP, 136±3% mortar flow)
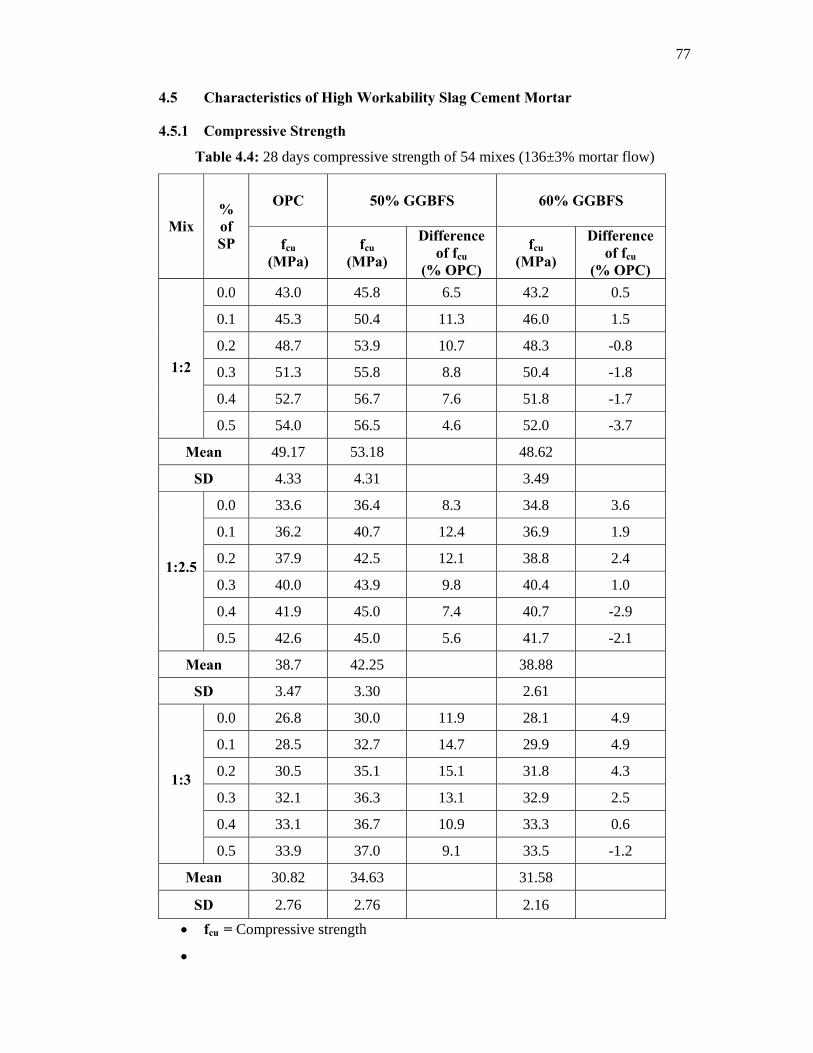
77
4.5 Characteristics of High Workability Slag Cement Mortar
4.5.1 Compressive Strength
Table 4.4: 28 days compressive strength of 54 mixes (136±3% mortar flow)
OPC 50% GGBFS 60% GGBFS
Mix % of SP fcu
(MPa) fcu
(MPa)
Difference of fcu
(% OPC)
fcu (MPa)
Difference of fcu
(% OPC) 0.0 43.0 45.8 6.5 43.2 0.5
0.1 45.3 50.4 11.3 46.0 1.5
0.2 48.7 53.9 10.7 48.3 -0.8
0.3 51.3 55.8 8.8 50.4 -1.8
0.4 52.7 56.7 7.6 51.8 -1.7
1:2
0.5 54.0 56.5 4.6 52.0 -3.7
Mean 49.17 53.18 48.62
SD 4.33 4.31 3.49
0.0 33.6 36.4 8.3 34.8 3.6
0.1 36.2 40.7 12.4 36.9 1.9
0.2 37.9 42.5 12.1 38.8 2.4
0.3 40.0 43.9 9.8 40.4 1.0
0.4 41.9 45.0 7.4 40.7 -2.9
1:2.5
0.5 42.6 45.0 5.6 41.7 -2.1
Mean 38.7 42.25 38.88
SD 3.47 3.30 2.61
0.0 26.8 30.0 11.9 28.1 4.9
0.1 28.5 32.7 14.7 29.9 4.9
0.2 30.5 35.1 15.1 31.8 4.3
0.3 32.1 36.3 13.1 32.9 2.5
0.4 33.1 36.7 10.9 33.3 0.6
1:3
0.5 33.9 37.0 9.1 33.5 -1.2
Mean 30.82 34.63 31.58
SD 2.76 2.76 2.16 • fcu = Compressive strength
•
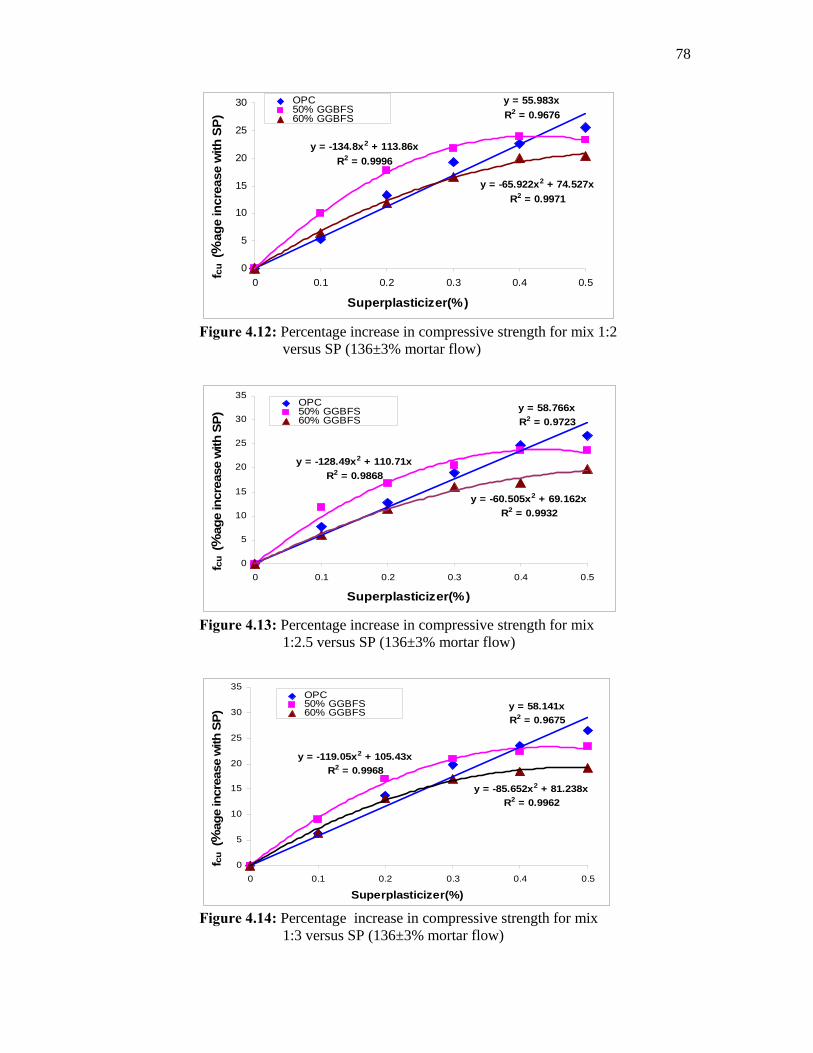
78
y = 55.983xR2 = 0.9676
y = -65.922x2 + 74.527xR2 = 0.9971
y = -134.8x2 + 113.86xR2 = 0.9996
0
5
10
15
20
25
30
0 0.1 0.2 0.3 0.4 0.5
Superplasticizer(%)
fcu
(%ag
e in
crea
se w
ith S
P)
OPC50% GGBFS60% GGBFS
Figure 4.12: Percentage increase in compressive strength for mix 1:2
versus SP (136±3% mortar flow)
y = -128.49x2 + 110.71xR2 = 0.9868
y = 58.766xR2 = 0.9723
y = -60.505x2 + 69.162xR2 = 0.9932
0
5
10
15
20
25
30
35
0 0.1 0.2 0.3 0.4 0.5
Superplasticizer(%)
f cu
(%ag
e in
crea
se w
ith S
P)
OPC50% GGBFS60% GGBFS
Figure 4.13: Percentage increase in compressive strength for mix
1:2.5 versus SP (136±3% mortar flow)
y = -119.05x2 + 105.43xR2 = 0.9968
y = 58.141xR2 = 0.9675
y = -85.652x2 + 81.238xR2 = 0.9962
0
5
10
15
20
25
30
35
0 0.1 0.2 0.3 0.4 0.5
Superplasticizer(%)
f cu
(%ag
e in
crea
se w
ith S
P)
OPC50% GGBFS60% GGBFS
Figure 4.14: Percentage increase in compressive strength for mix
1:3 versus SP (136±3% mortar flow)
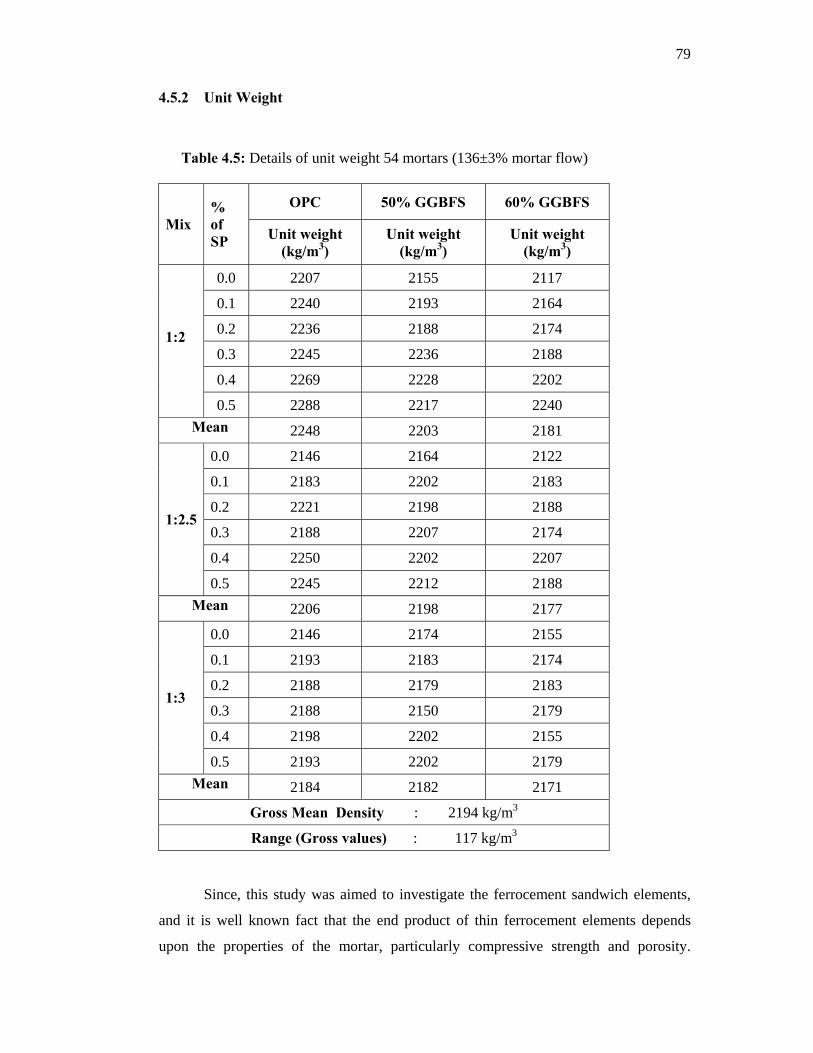
79
4.5.2 Unit Weight
Table 4.5: Details of unit weight 54 mortars (136±3% mortar flow)
OPC 50% GGBFS 60% GGBFS Mix
% of SP Unit weight
(kg/m3) Unit weight
(kg/m3) Unit weight
(kg/m3)
0.0 2207 2155 2117
0.1 2240 2193 2164
0.2 2236 2188 2174
0.3 2245 2236 2188
0.4 2269 2228 2202
1:2
0.5 2288 2217 2240 Mean 2248 2203 2181
0.0 2146 2164 2122
0.1 2183 2202 2183
0.2 2221 2198 2188
0.3 2188 2207 2174
0.4 2250 2202 2207
1:2.5
0.5 2245 2212 2188 Mean 2206 2198 2177
0.0 2146 2174 2155
0.1 2193 2183 2174
0.2 2188 2179 2183
0.3 2188 2150 2179
0.4 2198 2202 2155
1:3
0.5 2193 2202 2179 Mean 2184 2182 2171
Gross Mean Density : 2194 kg/m3
Range (Gross values) : 117 kg/m3
Since, this study was aimed to investigate the ferrocement sandwich elements,
and it is well known fact that the end product of thin ferrocement elements depends
upon the properties of the mortar, particularly compressive strength and porosity.
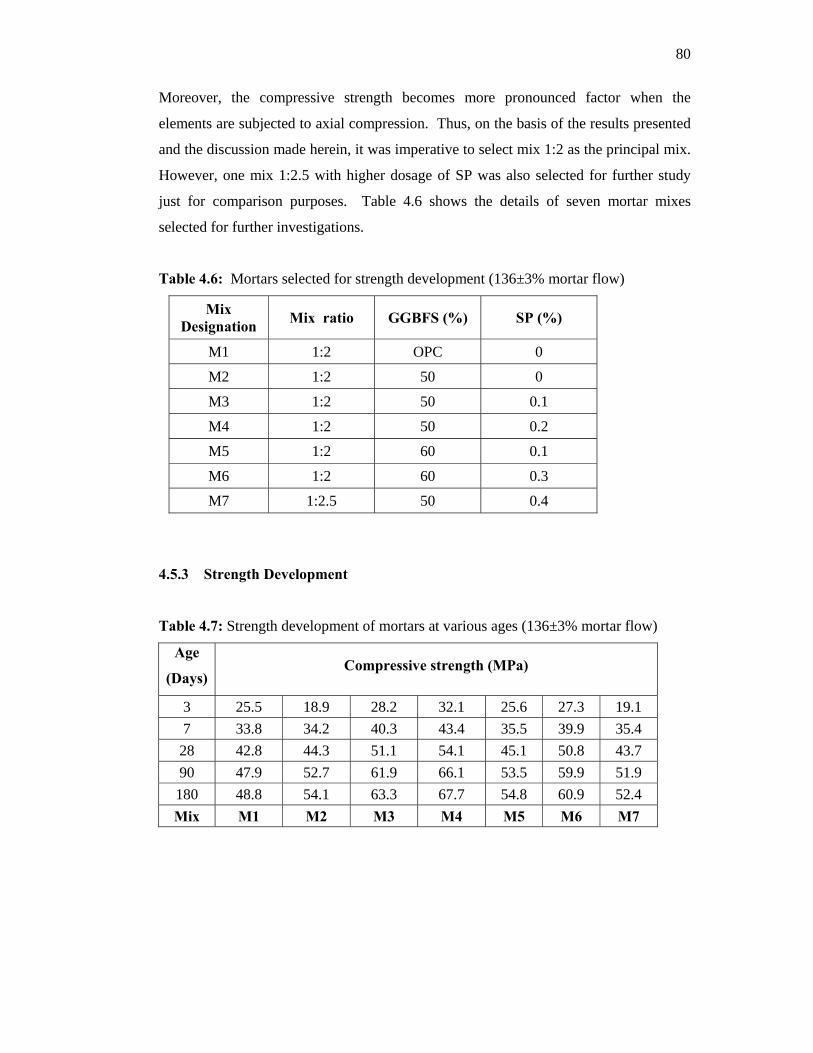
80
Moreover, the compressive strength becomes more pronounced factor when the
elements are subjected to axial compression. Thus, on the basis of the results presented
and the discussion made herein, it was imperative to select mix 1:2 as the principal mix.
However, one mix 1:2.5 with higher dosage of SP was also selected for further study
just for comparison purposes. Table 4.6 shows the details of seven mortar mixes
selected for further investigations.
Table 4.6: Mortars selected for strength development (136±3% mortar flow)
Mix Designation Mix ratio GGBFS (%) SP (%)
M1 1:2 OPC 0
M2 1:2 50 0
M3 1:2 50 0.1
M4 1:2 50 0.2
M5 1:2 60 0.1
M6 1:2 60 0.3
M7 1:2.5 50 0.4
4.5.3 Strength Development
Table 4.7: Strength development of mortars at various ages (136±3% mortar flow)
Age
(Days) Compressive strength (MPa)
3 25.5 18.9 28.2 32.1 25.6 27.3 19.1 7 33.8 34.2 40.3 43.4 35.5 39.9 35.4 28 42.8 44.3 51.1 54.1 45.1 50.8 43.7 90 47.9 52.7 61.9 66.1 53.5 59.9 51.9 180 48.8 54.1 63.3 67.7 54.8 60.9 52.4 Mix M1 M2 M3 M4 M5 M6 M7
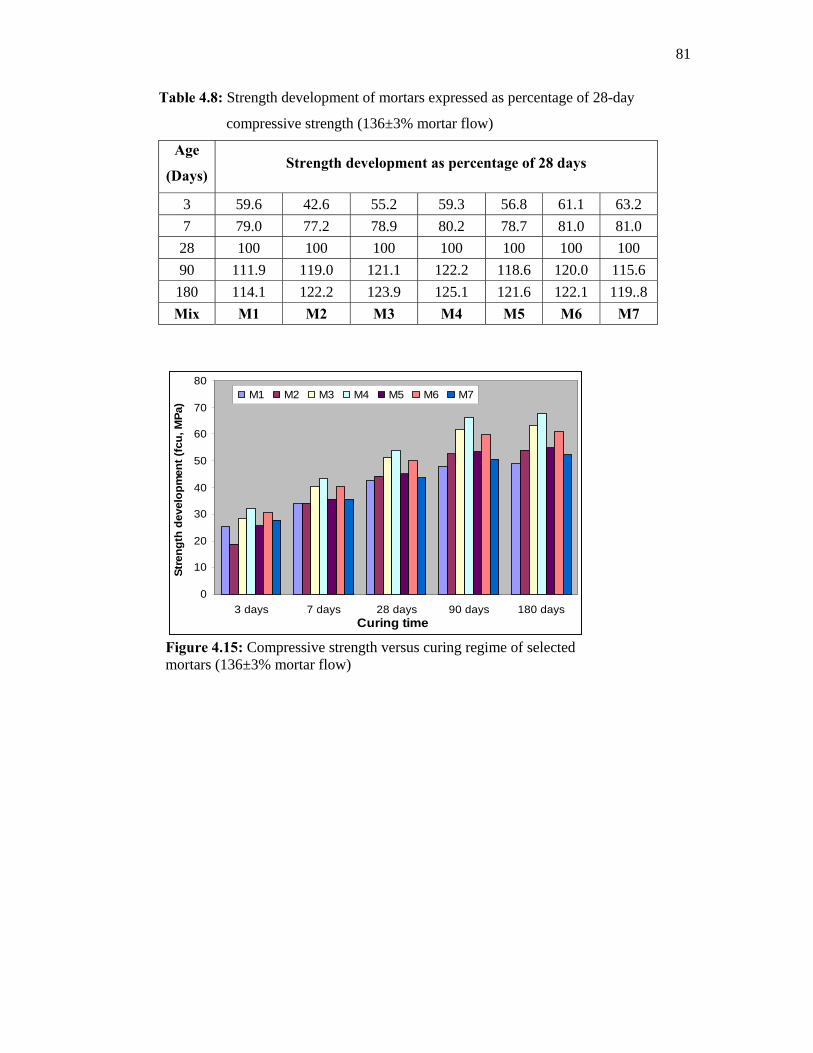
81
Table 4.8: Strength development of mortars expressed as percentage of 28-day
compressive strength (136±3% mortar flow)
Age
(Days) Strength development as percentage of 28 days
3 59.6 42.6 55.2 59.3 56.8 61.1 63.2 7 79.0 77.2 78.9 80.2 78.7 81.0 81.0 28 100 100 100 100 100 100 100 90 111.9 119.0 121.1 122.2 118.6 120.0 115.6 180 114.1 122.2 123.9 125.1 121.6 122.1 119..8 Mix M1 M2 M3 M4 M5 M6 M7
0
10
20
30
40
50
60
70
80
3 days 7 days 28 days 90 days 180 daysCuring time
Stre
ngth
dev
elop
men
t (fc
u, M
Pa)
M1 M2 M3 M4 M5 M6 M7
Figure 4.15: Compressive strength versus curing regime of selected mortars (136±3% mortar flow)
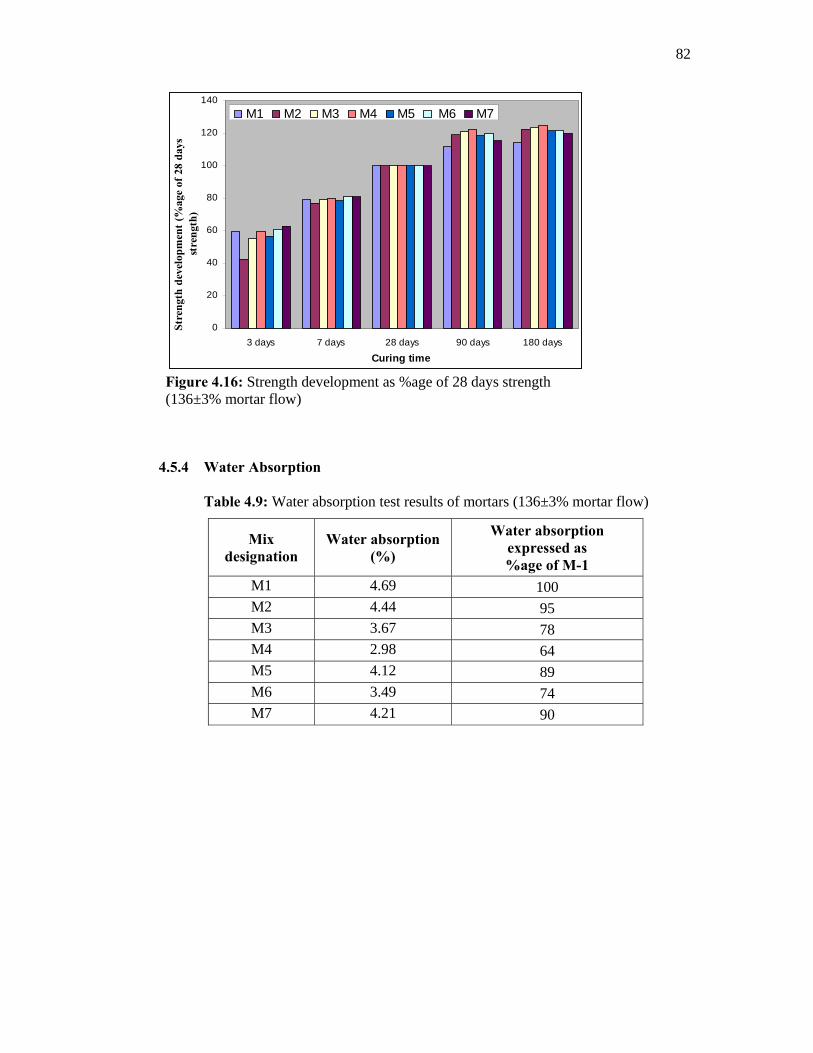
82
0
20
40
60
80
100
120
140
3 days 7 days 28 days 90 days 180 days
Curing time
Stre
ngth
dev
elop
men
t (%
age
of 2
8 da
ys
stre
ngth
)
M1 M2 M3 M4 M5 M6 M7
Figure 4.16: Strength development as %age of 28 days strength (136±3% mortar flow)
4.5.4 Water Absorption
Table 4.9: Water absorption test results of mortars (136±3% mortar flow)
Mix designation
Water absorption (%)
Water absorption expressed as %age of M-1
M1 4.69 100 M2 4.44 95 M3 3.67 78 M4 2.98 64 M5 4.12 89 M6 3.49 74 M7 4.21 90
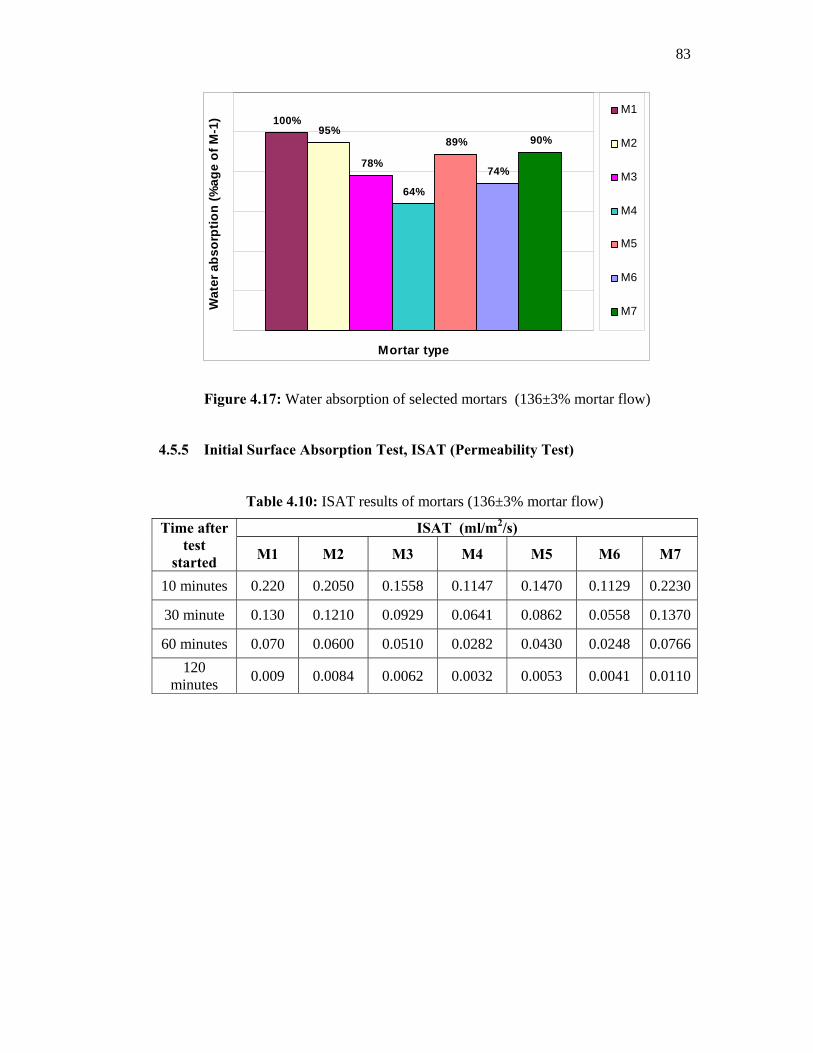
83
100%95%
78%
64%
89%
74%
90%
Mortar type
Wat
er a
bsor
ptio
n (%
age
of M
-1)
M1
M2
M3
M4
M5
M6
M7
Figure 4.17: Water absorption of selected mortars (136±3% mortar flow)
4.5.5 Initial Surface Absorption Test, ISAT (Permeability Test)
Table 4.10: ISAT results of mortars (136±3% mortar flow)
ISAT (ml/m2/s) Time after test
started M1 M2 M3 M4 M5 M6 M7
10 minutes 0.220 0.2050 0.1558 0.1147 0.1470 0.1129 0.2230
30 minute 0.130 0.1210 0.0929 0.0641 0.0862 0.0558 0.1370
60 minutes 0.070 0.0600 0.0510 0.0282 0.0430 0.0248 0.0766120
minutes 0.009 0.0084 0.0062 0.0032 0.0053 0.0041 0.0110
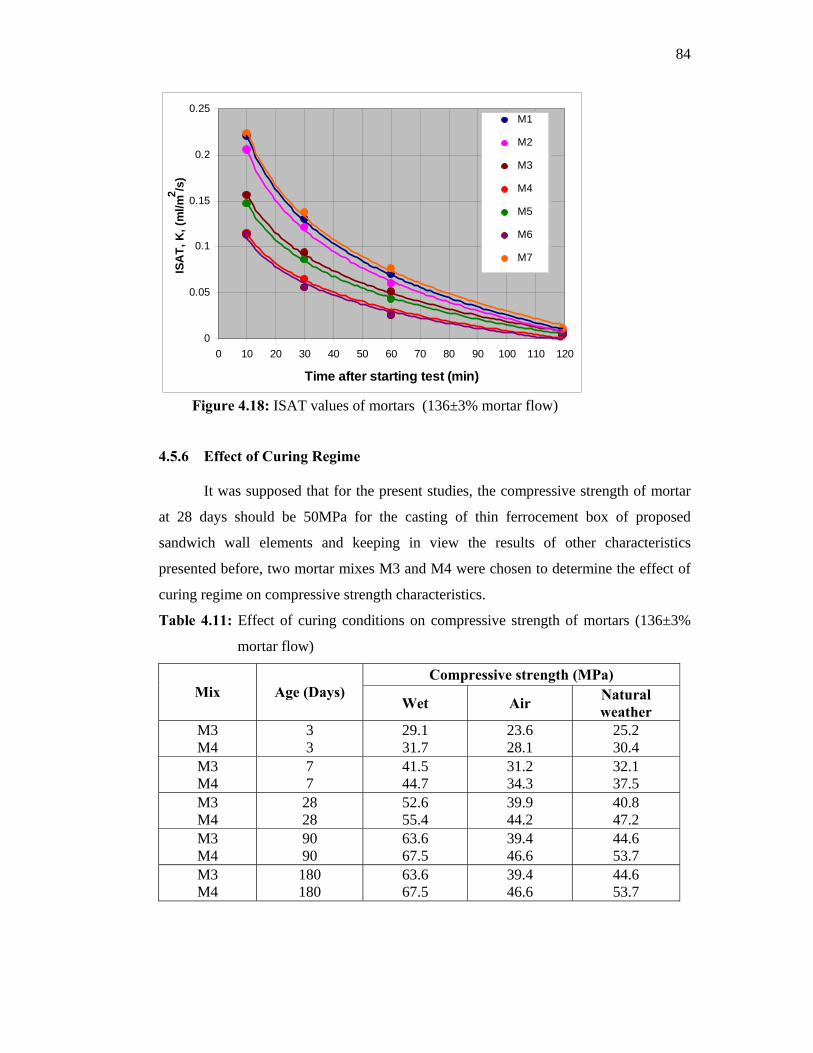
84
0
0.05
0.1
0.15
0.2
0.25
0 10 20 30 40 50 60 70 80 90 100 110 120
Time after starting test (min)
ISA
T, K
, (m
l/m2 /s
)
M1
M2
M3
M4
M5
M6
M7
Figure 4.18: ISAT values of mortars (136±3% mortar flow)
4.5.6 Effect of Curing Regime
It was supposed that for the present studies, the compressive strength of mortar
at 28 days should be 50MPa for the casting of thin ferrocement box of proposed
sandwich wall elements and keeping in view the results of other characteristics
presented before, two mortar mixes M3 and M4 were chosen to determine the effect of
curing regime on compressive strength characteristics.
Table 4.11: Effect of curing conditions on compressive strength of mortars (136±3%
mortar flow)
Compressive strength (MPa) Mix Age (Days)
Wet Air Natural weather
M3 M4
3 3
29.1 31.7
23.6 28.1
25.2 30.4
M3 M4
7 7
41.5 44.7
31.2 34.3
32.1 37.5
M3 M4
28 28
52.6 55.4
39.9 44.2
40.8 47.2
M3 M4
90 90
63.6 67.5
39.4 46.6
44.6 53.7
M3 M4
180 180
63.6 67.5
39.4 46.6
44.6 53.7
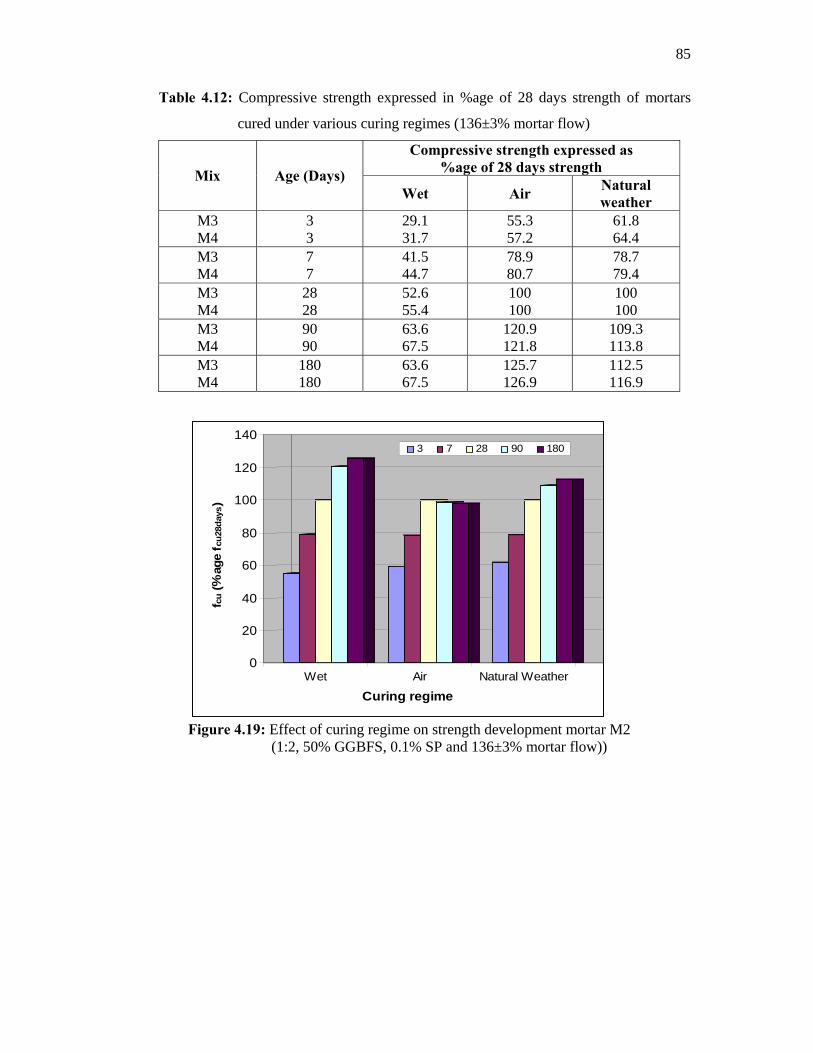
85
Table 4.12: Compressive strength expressed in %age of 28 days strength of mortars
cured under various curing regimes (136±3% mortar flow)
Compressive strength expressed as %age of 28 days strength Mix Age (Days)
Wet Air Natural weather
M3 M4
3 3
29.1 31.7
55.3 57.2
61.8 64.4
M3 M4
7 7
41.5 44.7
78.9 80.7
78.7 79.4
M3 M4
28 28
52.6 55.4
100 100
100 100
M3 M4
90 90
63.6 67.5
120.9 121.8
109.3 113.8
M3 M4
180 180
63.6 67.5
125.7 126.9
112.5 116.9
0
20
40
60
80
100
120
140
f cu
(%ag
e f c
u28d
ays)
Wet Air Natural Weather
Curing regime
3 7 28 90 180
Figure 4.19: Effect of curing regime on strength development mortar M2
(1:2, 50% GGBFS, 0.1% SP and 136±3% mortar flow))
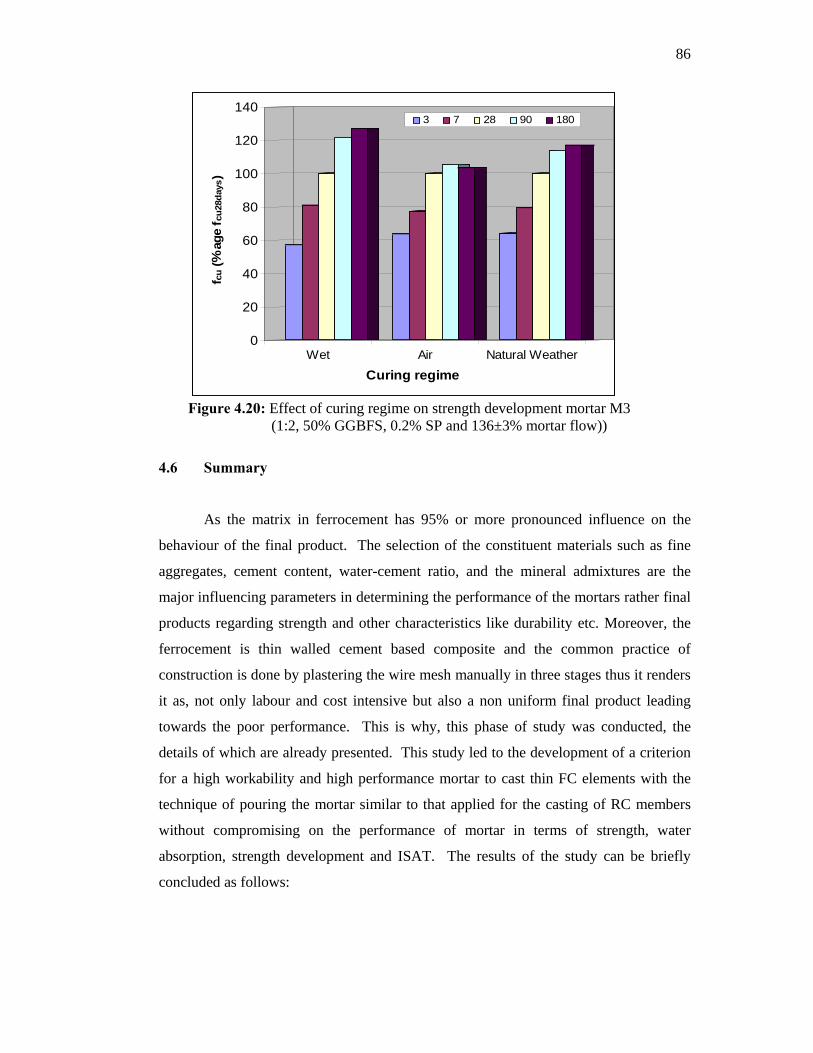
86
0
20
40
60
80
100
120
140
f cu
(%ag
e f c
u28d
ays)
Wet Air Natural Weather
Curing regime
3 7 28 90 180
Figure 4.20: Effect of curing regime on strength development mortar M3
(1:2, 50% GGBFS, 0.2% SP and 136±3% mortar flow))
4.6 Summary
As the matrix in ferrocement has 95% or more pronounced influence on the
behaviour of the final product. The selection of the constituent materials such as fine
aggregates, cement content, water-cement ratio, and the mineral admixtures are the
major influencing parameters in determining the performance of the mortars rather final
products regarding strength and other characteristics like durability etc. Moreover, the
ferrocement is thin walled cement based composite and the common practice of
construction is done by plastering the wire mesh manually in three stages thus it renders
it as, not only labour and cost intensive but also a non uniform final product leading
towards the poor performance. This is why, this phase of study was conducted, the
details of which are already presented. This study led to the development of a criterion
for a high workability and high performance mortar to cast thin FC elements with the
technique of pouring the mortar similar to that applied for the casting of RC members
without compromising on the performance of mortar in terms of strength, water
absorption, strength development and ISAT. The results of the study can be briefly
concluded as follows:
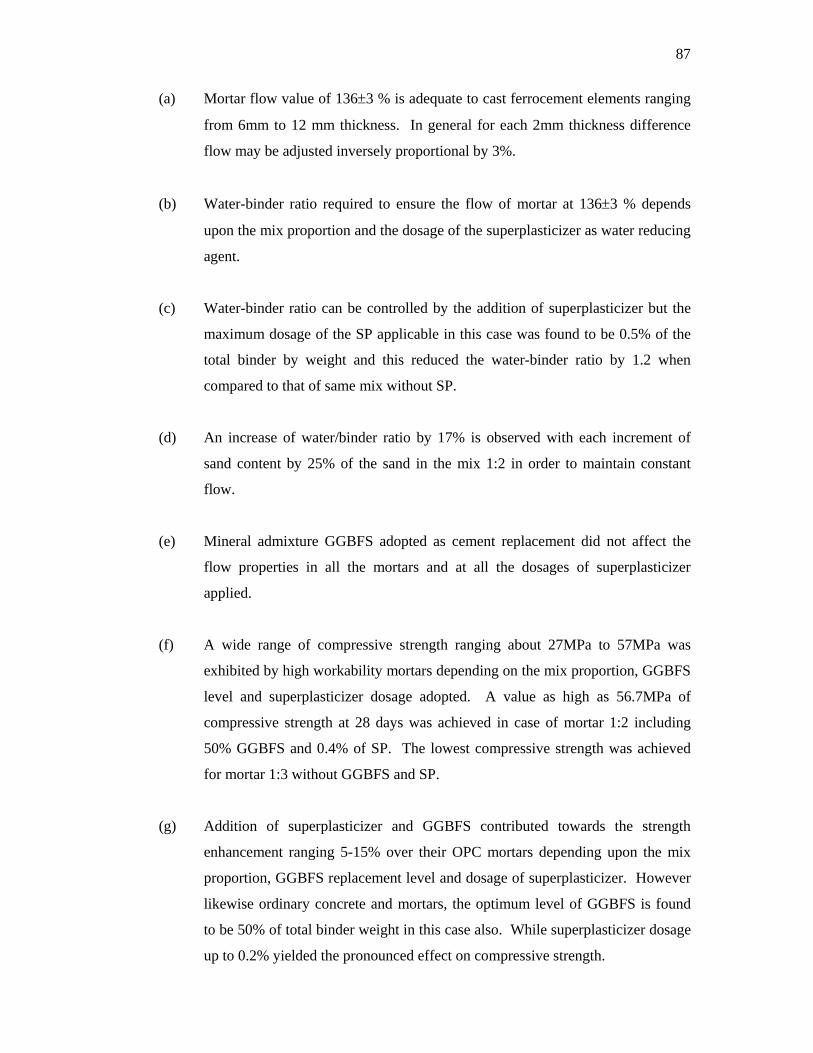
87
(a) Mortar flow value of 136±3 % is adequate to cast ferrocement elements ranging
from 6mm to 12 mm thickness. In general for each 2mm thickness difference
flow may be adjusted inversely proportional by 3%.
(b) Water-binder ratio required to ensure the flow of mortar at 136±3 % depends
upon the mix proportion and the dosage of the superplasticizer as water reducing
agent.
(c) Water-binder ratio can be controlled by the addition of superplasticizer but the
maximum dosage of the SP applicable in this case was found to be 0.5% of the
total binder by weight and this reduced the water-binder ratio by 1.2 when
compared to that of same mix without SP.
(d) An increase of water/binder ratio by 17% is observed with each increment of
sand content by 25% of the sand in the mix 1:2 in order to maintain constant
flow.
(e) Mineral admixture GGBFS adopted as cement replacement did not affect the
flow properties in all the mortars and at all the dosages of superplasticizer
applied.
(f) A wide range of compressive strength ranging about 27MPa to 57MPa was
exhibited by high workability mortars depending on the mix proportion, GGBFS
level and superplasticizer dosage adopted. A value as high as 56.7MPa of
compressive strength at 28 days was achieved in case of mortar 1:2 including
50% GGBFS and 0.4% of SP. The lowest compressive strength was achieved
for mortar 1:3 without GGBFS and SP.
(g) Addition of superplasticizer and GGBFS contributed towards the strength
enhancement ranging 5-15% over their OPC mortars depending upon the mix
proportion, GGBFS replacement level and dosage of superplasticizer. However
likewise ordinary concrete and mortars, the optimum level of GGBFS is found
to be 50% of total binder weight in this case also. While superplasticizer dosage
up to 0.2% yielded the pronounced effect on compressive strength.
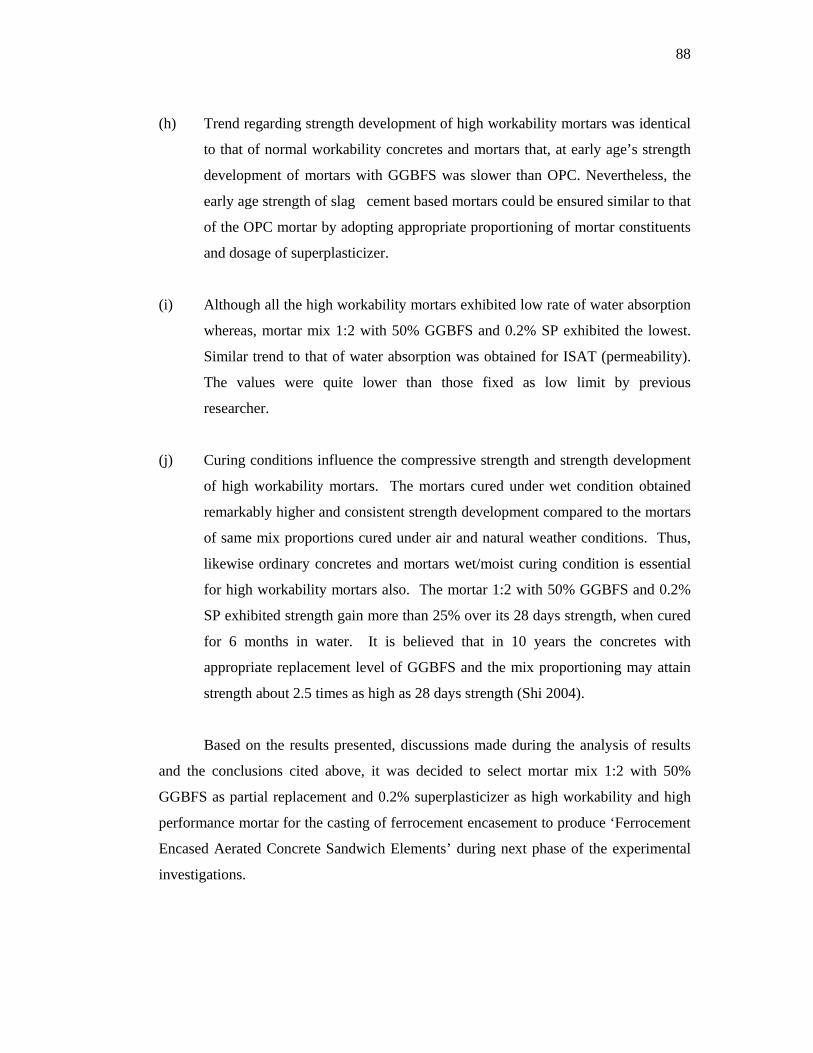
88
(h) Trend regarding strength development of high workability mortars was identical
to that of normal workability concretes and mortars that, at early age’s strength
development of mortars with GGBFS was slower than OPC. Nevertheless, the
early age strength of slag cement based mortars could be ensured similar to that
of the OPC mortar by adopting appropriate proportioning of mortar constituents
and dosage of superplasticizer.
(i) Although all the high workability mortars exhibited low rate of water absorption
whereas, mortar mix 1:2 with 50% GGBFS and 0.2% SP exhibited the lowest.
Similar trend to that of water absorption was obtained for ISAT (permeability).
The values were quite lower than those fixed as low limit by previous
researcher.
(j) Curing conditions influence the compressive strength and strength development
of high workability mortars. The mortars cured under wet condition obtained
remarkably higher and consistent strength development compared to the mortars
of same mix proportions cured under air and natural weather conditions. Thus,
likewise ordinary concretes and mortars wet/moist curing condition is essential
for high workability mortars also. The mortar 1:2 with 50% GGBFS and 0.2%
SP exhibited strength gain more than 25% over its 28 days strength, when cured
for 6 months in water. It is believed that in 10 years the concretes with
appropriate replacement level of GGBFS and the mix proportioning may attain
strength about 2.5 times as high as 28 days strength (Shi 2004).
Based on the results presented, discussions made during the analysis of results
and the conclusions cited above, it was decided to select mortar mix 1:2 with 50%
GGBFS as partial replacement and 0.2% superplasticizer as high workability and high
performance mortar for the casting of ferrocement encasement to produce ‘Ferrocement
Encased Aerated Concrete Sandwich Elements’ during next phase of the experimental
investigations.
89
CHAPTER 5
EXPERIMENTAL RESULTS AND DISCUSSIONS (PHASE-II)
5.1 General
As described in chapter three, this phase of the experimental study comprised of
two parts where the wall elements of relatively large size were manufactured and tested
in the step of this study. Likewise phase-I, stepwise approach was adopted during this
phase of the study too. Following are the details of the results of the experimental study
conducted.
5.2 Results and Discussions of Part I
During this part of the study, an intensive experimental programme with large
number of variables and different sizes of specimens was carried out either to determine
the non-parametric properties like optimizing various variables such as overall weight
of sandwich elements, water absorption, and ISAT, and to optimize the various
variables; core-encasement volumetric ratio and type and number of mesh layers of wire
mesh to be adopted for further studies carried out in part II. The entire specimens were
cast and tested with the standard procedures described in Chapter Three. Following are
the results and discussions.
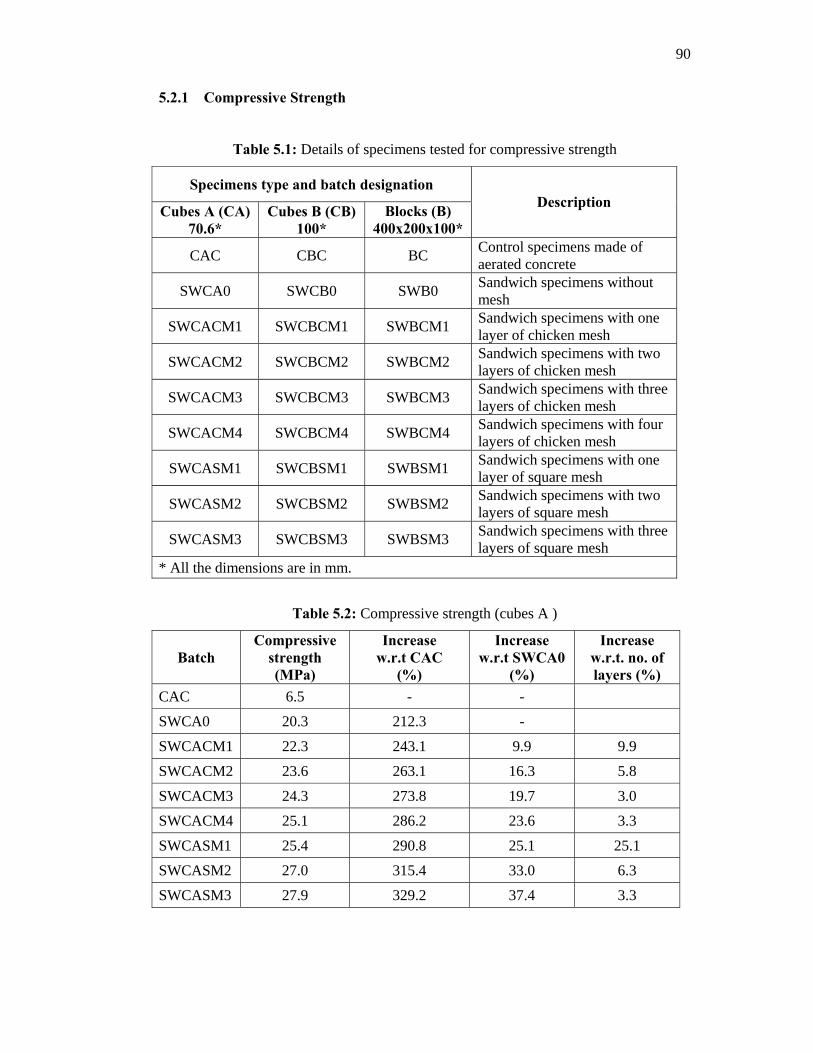
90
5.2.1 Compressive Strength
Table 5.1: Details of specimens tested for compressive strength
Specimens type and batch designation
Cubes A (CA) 70.6*
Cubes B (CB) 100*
Blocks (B) 400x200x100*
Description
CAC CBC BC Control specimens made of aerated concrete
SWCA0 SWCB0 SWB0 Sandwich specimens without mesh
SWCACM1 SWCBCM1 SWBCM1 Sandwich specimens with one layer of chicken mesh
SWCACM2 SWCBCM2 SWBCM2 Sandwich specimens with two layers of chicken mesh
SWCACM3 SWCBCM3 SWBCM3 Sandwich specimens with three layers of chicken mesh
SWCACM4 SWCBCM4 SWBCM4 Sandwich specimens with four layers of chicken mesh
SWCASM1 SWCBSM1 SWBSM1 Sandwich specimens with one layer of square mesh
SWCASM2 SWCBSM2 SWBSM2 Sandwich specimens with two layers of square mesh
SWCASM3 SWCBSM3 SWBSM3 Sandwich specimens with three layers of square mesh
* All the dimensions are in mm.
Table 5.2: Compressive strength (cubes A )
Batch Compressive
strength (MPa)
Increase w.r.t CAC
(%)
Increase w.r.t SWCA0
(%)
Increase w.r.t. no. of layers (%)
CAC 6.5 - -
SWCA0 20.3 212.3 -
SWCACM1 22.3 243.1 9.9 9.9
SWCACM2 23.6 263.1 16.3 5.8
SWCACM3 24.3 273.8 19.7 3.0
SWCACM4 25.1 286.2 23.6 3.3
SWCASM1 25.4 290.8 25.1 25.1
SWCASM2 27.0 315.4 33.0 6.3
SWCASM3 27.9 329.2 37.4 3.3
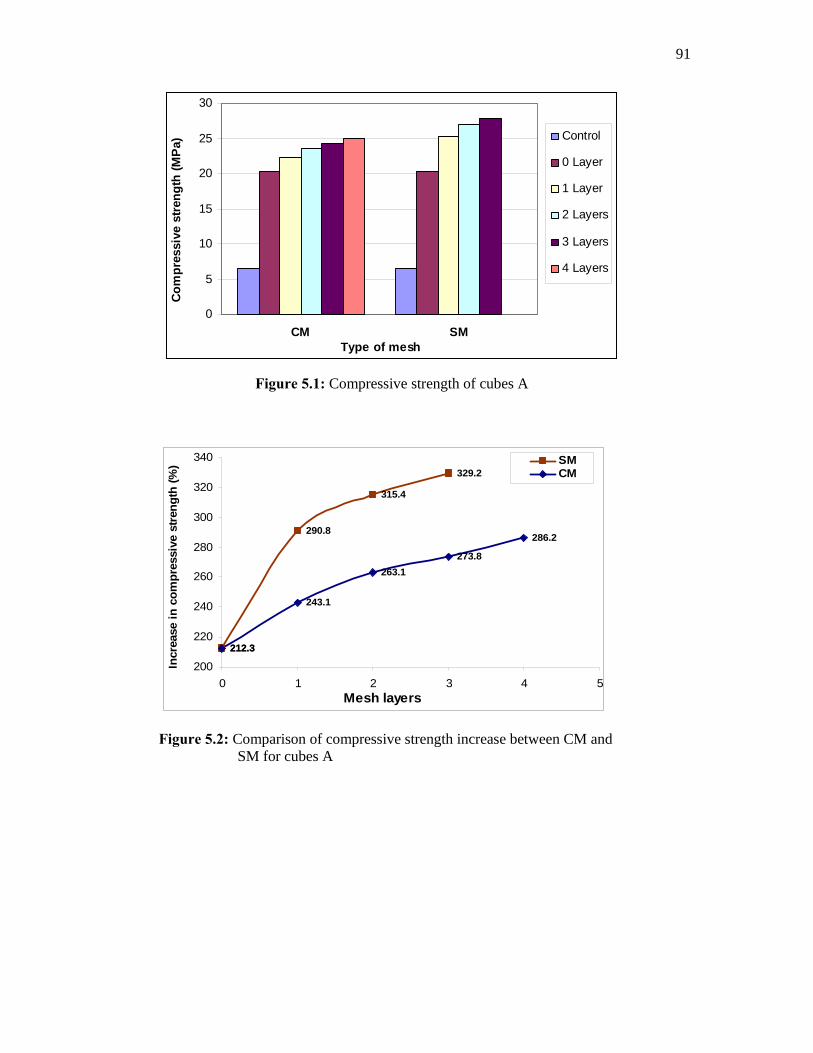
91
0
5
10
15
20
25
30
CM SMType of mesh
Com
pres
sive
str
engt
h (M
Pa) Control
0 Layer
1 Layer
2 Layers
3 Layers
4 Layers
Figure 5.1: Compressive strength of cubes A
212.3
290.8
315.4
329.2
212.3
243.1
263.1273.8
286.2
200
220
240
260
280
300
320
340
0 1 2 3 4 5Mesh layers
Incr
ease
in c
ompr
essi
ve s
tren
gth
(%) SM
CM
Figure 5.2: Comparison of compressive strength increase between CM and SM for cubes A
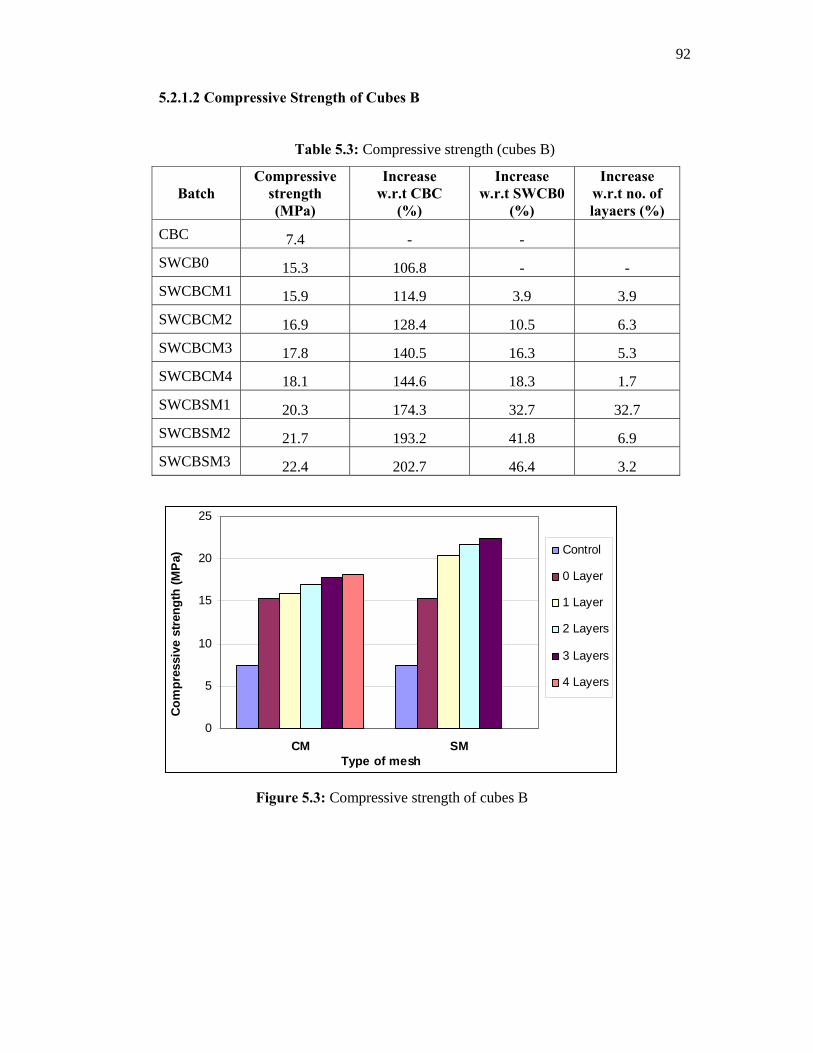
92
5.2.1.2 Compressive Strength of Cubes B
Table 5.3: Compressive strength (cubes B)
Batch Compressive
strength (MPa)
Increase w.r.t CBC
(%)
Increase w.r.t SWCB0
(%)
Increase w.r.t no. of layaers (%)
CBC 7.4 - - SWCB0 15.3 106.8 - - SWCBCM1 15.9 114.9 3.9 3.9 SWCBCM2 16.9 128.4 10.5 6.3 SWCBCM3 17.8 140.5 16.3 5.3 SWCBCM4 18.1 144.6 18.3 1.7 SWCBSM1 20.3 174.3 32.7 32.7 SWCBSM2 21.7 193.2 41.8 6.9 SWCBSM3 22.4 202.7 46.4 3.2
0
5
10
15
20
25
CM SMType of mesh
Com
pres
sive
str
engt
h (M
Pa)
Control
0 Layer
1 Layer
2 Layers
3 Layers
4 Layers
Figure 5.3: Compressive strength of cubes B
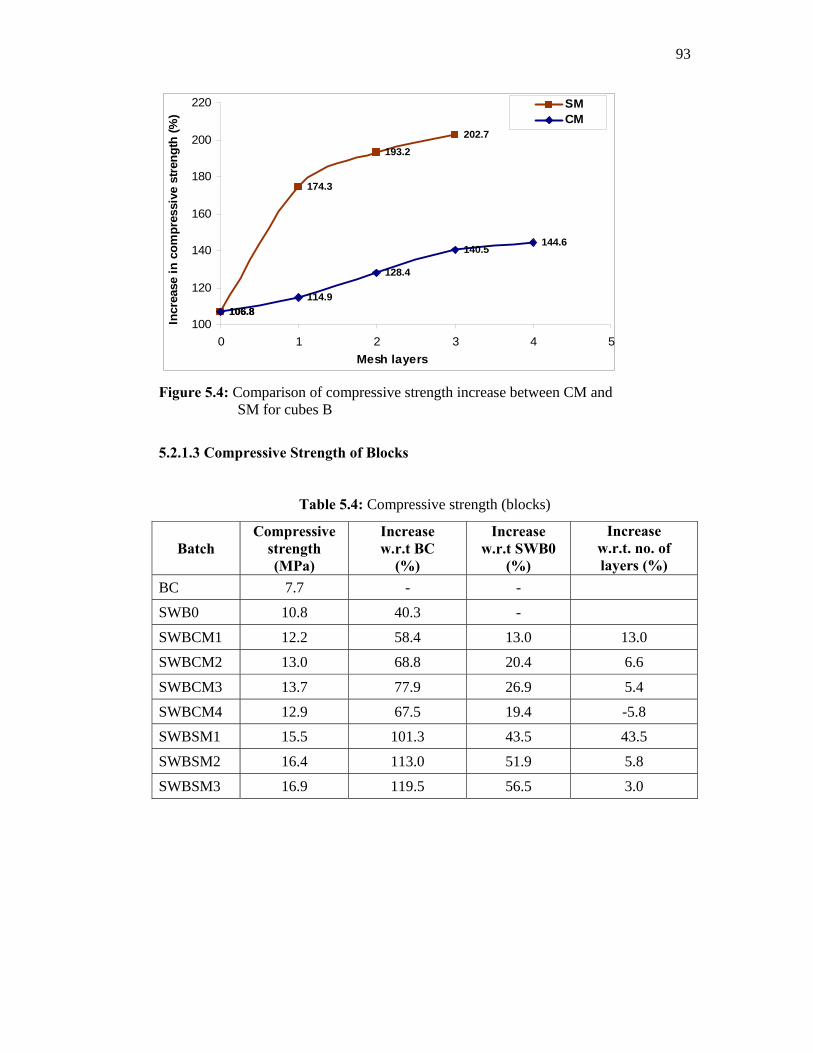
93
106.8
174.3
193.2
202.7
106.8114.9
128.4
140.5144.6
100
120
140
160
180
200
220
0 1 2 3 4 5Mesh layers
Incr
ease
in c
ompr
essi
ve s
treng
th (%
)
SMCM
Figure 5.4: Comparison of compressive strength increase between CM and
SM for cubes B
5.2.1.3 Compressive Strength of Blocks
Table 5.4: Compressive strength (blocks)
Batch Compressive
strength (MPa)
Increase w.r.t BC
(%)
Increase w.r.t SWB0
(%)
Increase w.r.t. no. of layers (%)
BC 7.7 - -
SWB0 10.8 40.3 -
SWBCM1 12.2 58.4 13.0 13.0
SWBCM2 13.0 68.8 20.4 6.6
SWBCM3 13.7 77.9 26.9 5.4
SWBCM4 12.9 67.5 19.4 -5.8
SWBSM1 15.5 101.3 43.5 43.5
SWBSM2 16.4 113.0 51.9 5.8
SWBSM3 16.9 119.5 56.5 3.0
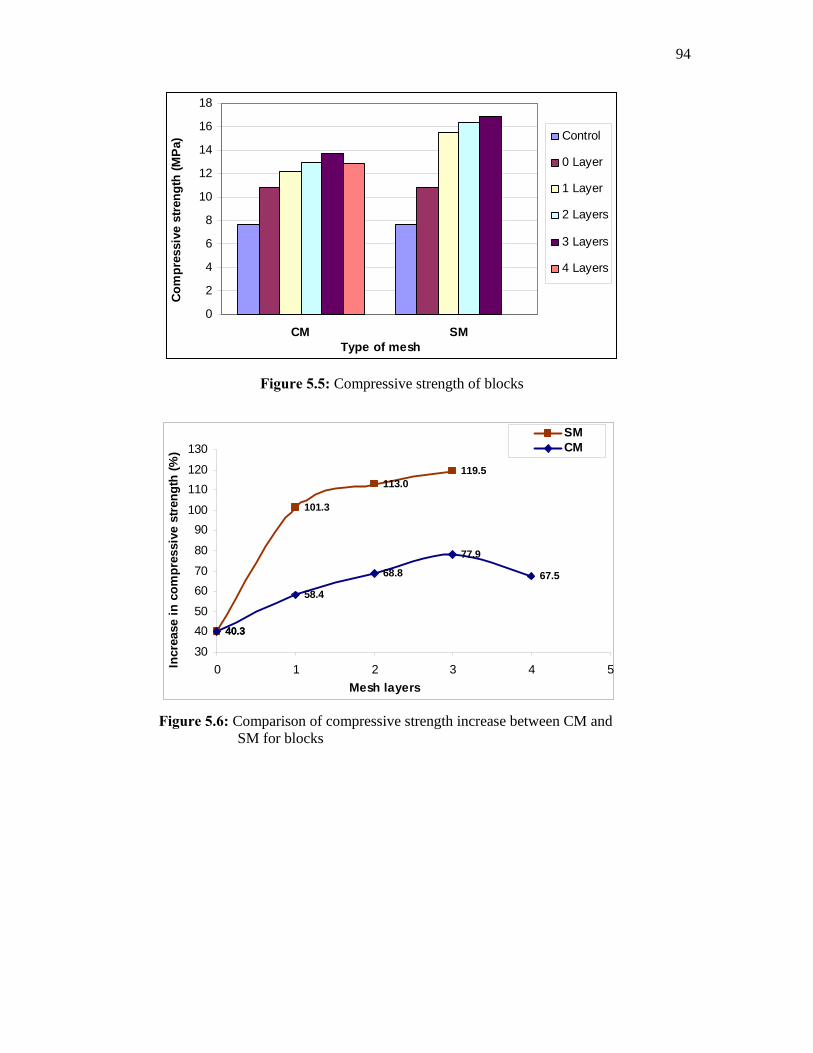
94
0
2
4
6
8
10
12
14
16
18
CM SMType of mesh
Com
pres
sive
str
engt
h (M
Pa) Control
0 Layer
1 Layer
2 Layers
3 Layers
4 Layers
Figure 5.5: Compressive strength of blocks
40.3
101.3
113.0119.5
40.3
58.4
68.8
77.9
67.5
30
4050
6070
80
90100
110120
130
0 1 2 3 4 5Mesh layers
Incr
ease
in c
ompr
essi
ve s
tren
gth
(%)
SMCM
Figure 5.6: Comparison of compressive strength increase between CM and
SM for blocks
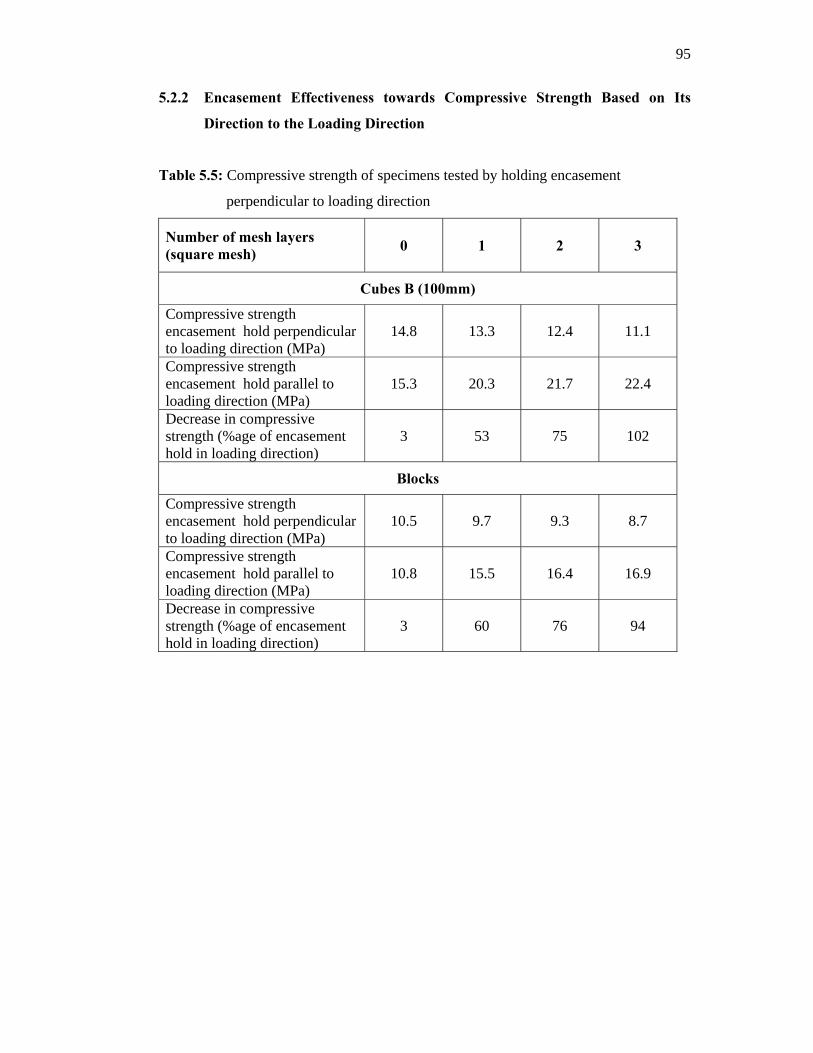
95
5.2.2 Encasement Effectiveness towards Compressive Strength Based on Its
Direction to the Loading Direction
Table 5.5: Compressive strength of specimens tested by holding encasement
perpendicular to loading direction
Number of mesh layers (square mesh) 0 1 2 3
Cubes B (100mm)
Compressive strength encasement hold perpendicular to loading direction (MPa)
14.8 13.3 12.4 11.1
Compressive strength encasement hold parallel to loading direction (MPa)
15.3 20.3 21.7 22.4
Decrease in compressive strength (%age of encasement hold in loading direction)
3 53 75 102
Blocks
Compressive strength encasement hold perpendicular to loading direction (MPa)
10.5 9.7 9.3 8.7
Compressive strength encasement hold parallel to loading direction (MPa)
10.8 15.5 16.4 16.9
Decrease in compressive strength (%age of encasement hold in loading direction)
3 60 76 94
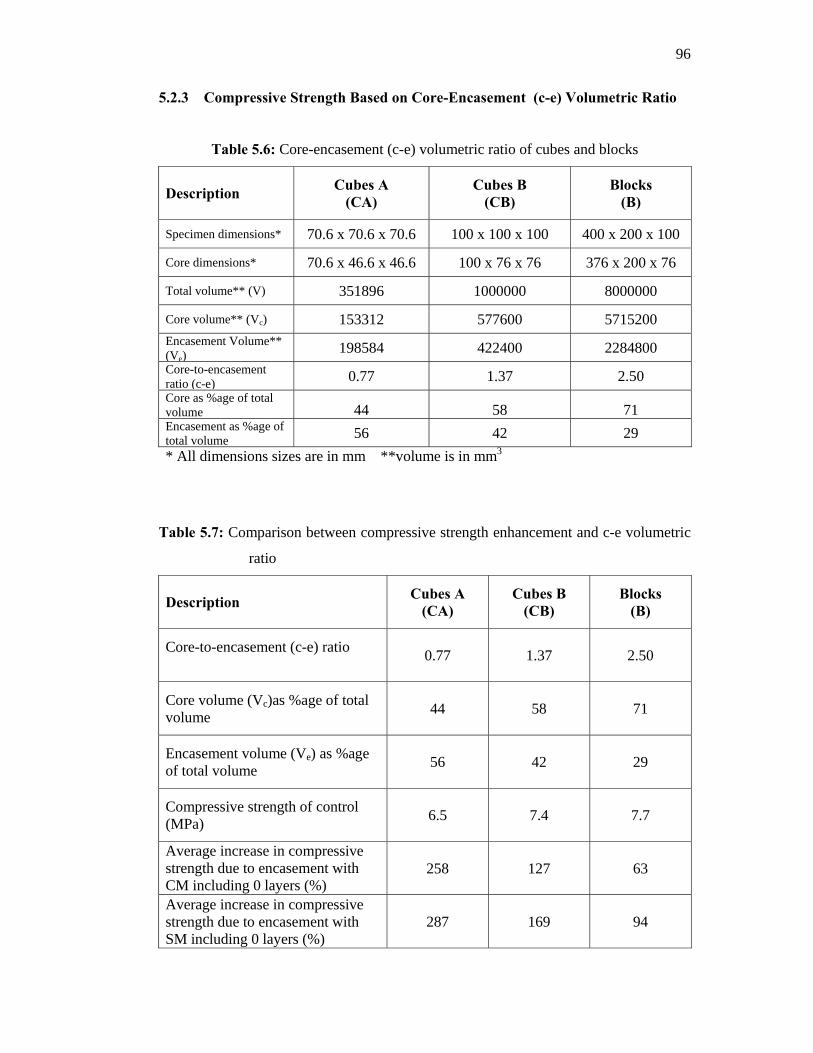
96
5.2.3 Compressive Strength Based on Core-Encasement (c-e) Volumetric Ratio
Table 5.6: Core-encasement (c-e) volumetric ratio of cubes and blocks
Description Cubes A (CA)
Cubes B (CB)
Blocks (B)
Specimen dimensions* 70.6 x 70.6 x 70.6 100 x 100 x 100 400 x 200 x 100
Core dimensions* 70.6 x 46.6 x 46.6 100 x 76 x 76 376 x 200 x 76
Total volume** (V) 351896 1000000 8000000
Core volume** (Vc) 153312 577600 5715200 Encasement Volume** (Ve)
198584 422400 2284800 Core-to-encasement ratio (c-e) 0.77 1.37 2.50 Core as %age of total volume 44 58 71 Encasement as %age of total volume 56 42 29 * All dimensions sizes are in mm **volume is in mm3
Table 5.7: Comparison between compressive strength enhancement and c-e volumetric
ratio
Description Cubes A (CA)
Cubes B (CB)
Blocks (B)
Core-to-encasement (c-e) ratio 0.77 1.37 2.50
Core volume (Vc)as %age of total volume 44 58 71
Encasement volume (Ve) as %age of total volume 56 42 29
Compressive strength of control (MPa) 6.5 7.4 7.7
Average increase in compressive strength due to encasement with CM including 0 layers (%)
258 127 63
Average increase in compressive strength due to encasement with SM including 0 layers (%)
287 169 94
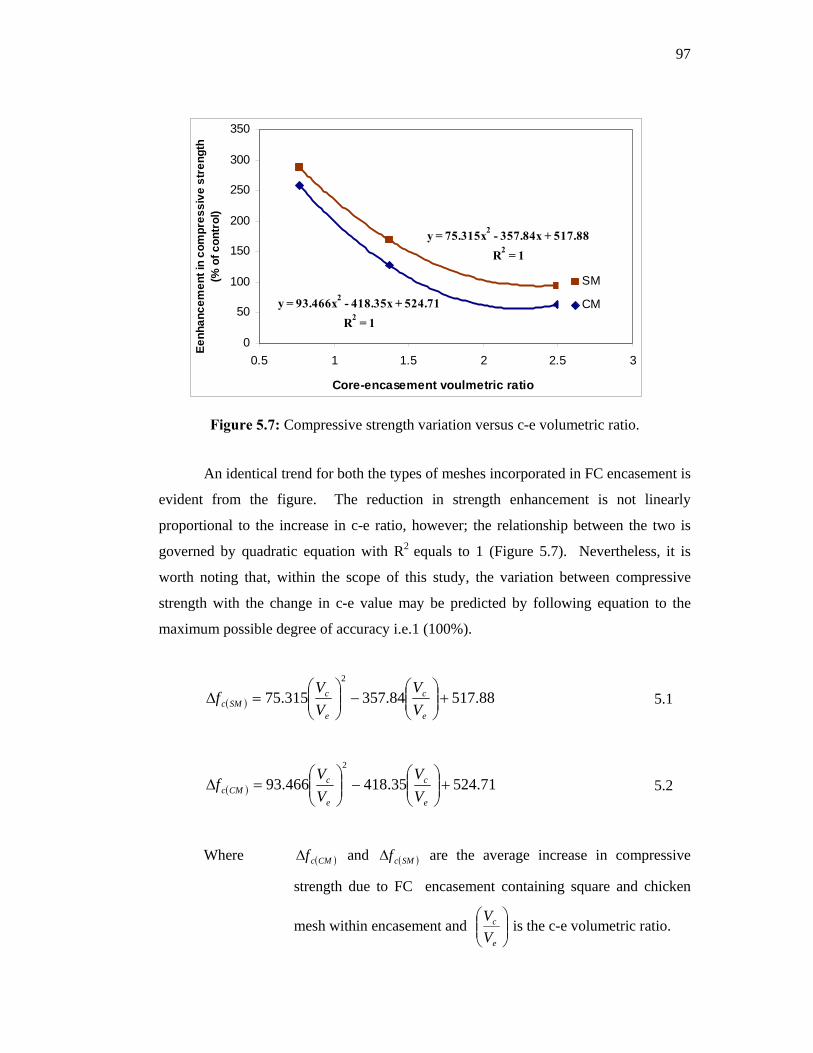
97
y = 75.315x2 - 357.84x + 517.88R2 = 1
y = 93.466x2 - 418.35x + 524.71R2 = 1
0
50
100
150
200
250
300
350
0.5 1 1.5 2 2.5 3
Core-encasement voulmetric ratio
Eenh
ance
men
t in
com
pres
sive
str
engt
h(%
of c
ontr
ol)
SM
CM
Figure 5.7: Compressive strength variation versus c-e volumetric ratio.
An identical trend for both the types of meshes incorporated in FC encasement is
evident from the figure. The reduction in strength enhancement is not linearly
proportional to the increase in c-e ratio, however; the relationship between the two is
governed by quadratic equation with R2 equals to 1 (Figure 5.7). Nevertheless, it is
worth noting that, within the scope of this study, the variation between compressive
strength with the change in c-e value may be predicted by following equation to the
maximum possible degree of accuracy i.e.1 (100%).
( ) 88.51784.357315.752
+⎟⎟⎠
⎞⎜⎜⎝
⎛−⎟⎟
⎠
⎞⎜⎜⎝
⎛=∆
e
c
e
cSMc V
VVV
f 5.1
( ) 71.52435.418466.932
+⎟⎟⎠
⎞⎜⎜⎝
⎛−⎟⎟
⎠
⎞⎜⎜⎝
⎛=∆
e
c
e
cCMc V
VVV
f 5.2
Where ( )CMcf∆ and ( )SMcf∆ are the average increase in compressive
strength due to FC encasement containing square and chicken
mesh within encasement and ⎟⎟⎠
⎞⎜⎜⎝
⎛
e
c
VV
is the c-e volumetric ratio.
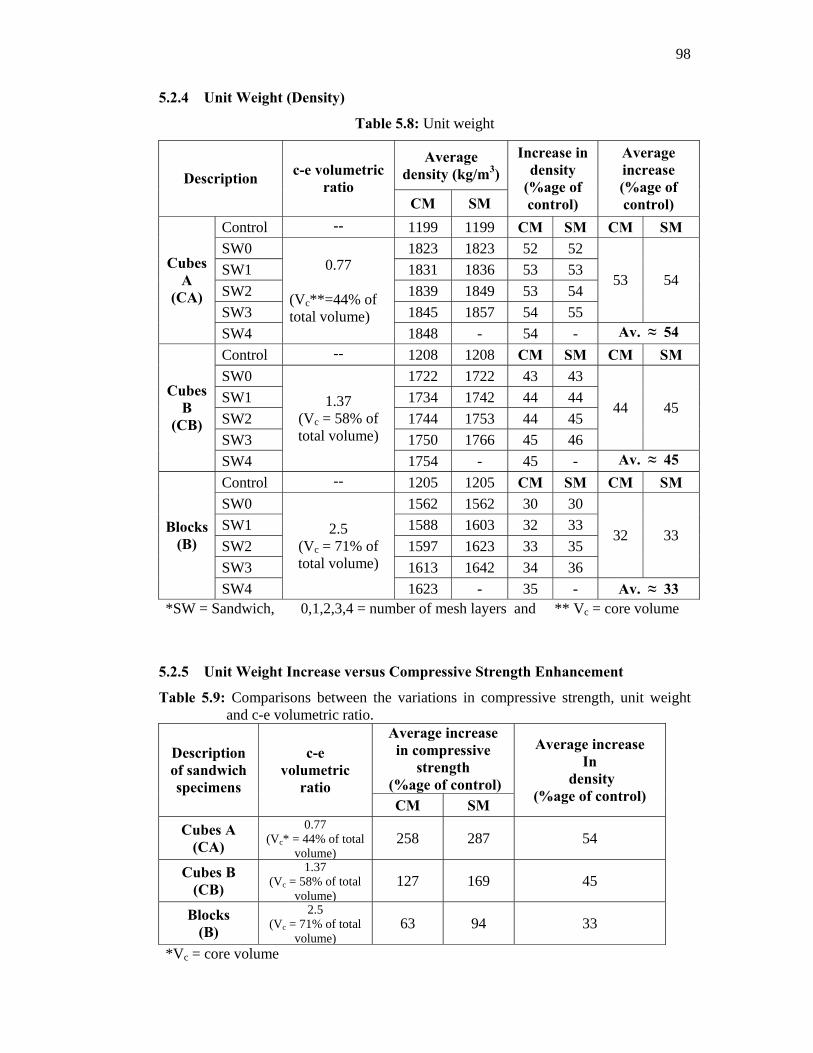
98
5.2.4 Unit Weight (Density)
Table 5.8: Unit weight
Average density (kg/m3) Description c-e volumetric
ratio CM SM
Increase in density
(%age of control)
Average increase (%age of control)
Control -- 1199 1199 CM SM CM SM SW0 1823 1823 52 52 SW1 1831 1836 53 53 SW2 1839 1849 53 54 SW3 1845 1857 54 55
53 54 Cubes
A (CA)
SW4
0.77
(Vc**=44% of total volume)
1848 - 54 - Av. ≈ 54 Control -- 1208 1208 CM SM CM SM SW0 1722 1722 43 43 SW1 1734 1742 44 44 SW2 1744 1753 44 45 SW3 1750 1766 45 46
44 45 Cubes
B (CB)
SW4
1.37 (Vc = 58% of total volume)
1754 - 45 - Av. ≈ 45 Control -- 1205 1205 CM SM CM SM SW0 1562 1562 30 30 SW1 1588 1603 32 33 SW2 1597 1623 33 35 SW3 1613 1642 34 36
32 33 Blocks (B)
SW4
2.5 (Vc = 71% of total volume)
1623 - 35 - Av. ≈ 33 *SW = Sandwich, 0,1,2,3,4 = number of mesh layers and ** Vc = core volume
5.2.5 Unit Weight Increase versus Compressive Strength Enhancement
Table 5.9: Comparisons between the variations in compressive strength, unit weight and c-e volumetric ratio.
Average increase in compressive
strength (%age of control)
Description of sandwich specimens
c-e volumetric
ratio CM SM
Average increase In
density (%age of control)
Cubes A (CA)
0.77 (Vc* = 44% of total
volume)258 287 54
Cubes B (CB)
1.37 (Vc = 58% of total
volume)127 169 45
Blocks (B)
2.5 (Vc = 71% of total
volume)63 94 33
*Vc = core volume
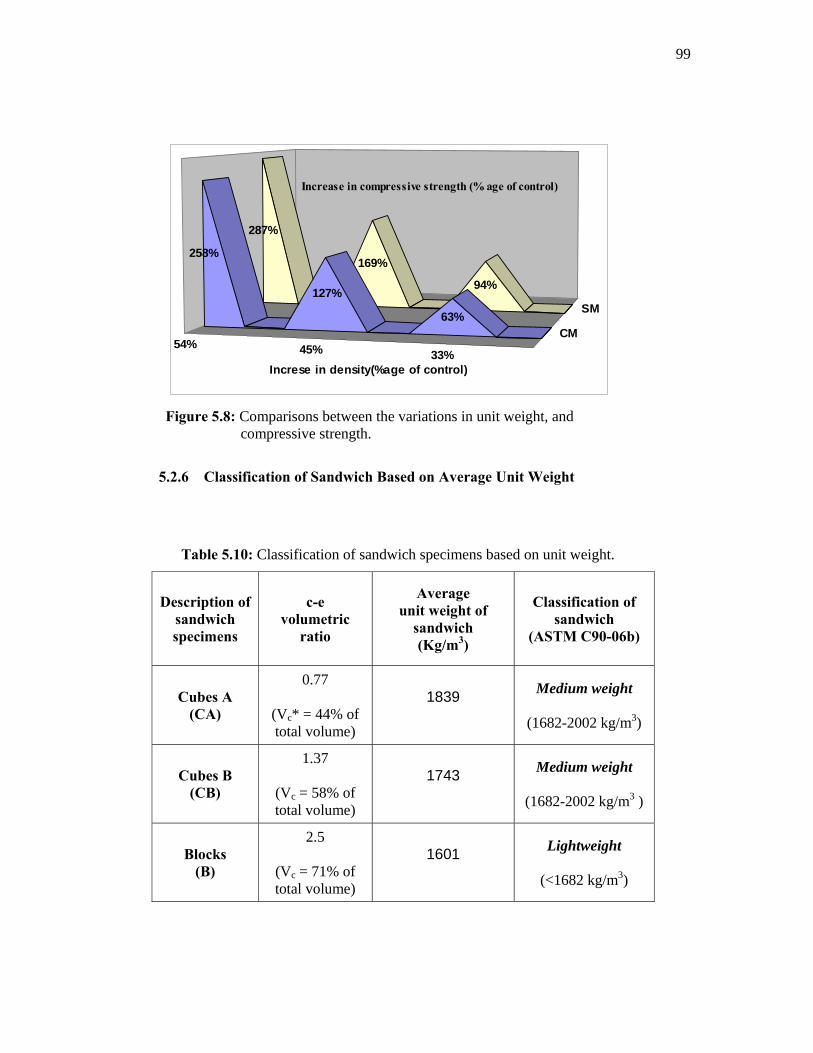
99
54% 45% 33%
CM
SM
287%
169%
94%
258%
127%
63%
Increse in density(%age of control)
Increase in compressive strength (% age of control)
Figure 5.8: Comparisons between the variations in unit weight, and compressive strength.
5.2.6 Classification of Sandwich Based on Average Unit Weight
Table 5.10: Classification of sandwich specimens based on unit weight.
Description of sandwich specimens
c-e volumetric
ratio
Average unit weight of
sandwich (Kg/m3)
Classification of sandwich
(ASTM C90-06b)
Cubes A (CA)
0.77
(Vc* = 44% of total volume)
1839
Medium weight
(1682-2002 kg/m3)
Cubes B (CB)
1.37
(Vc = 58% of total volume)
1743
Medium weight
(1682-2002 kg/m3 )
Blocks (B)
2.5
(Vc = 71% of total volume)
1601
Lightweight
(<1682 kg/m3)
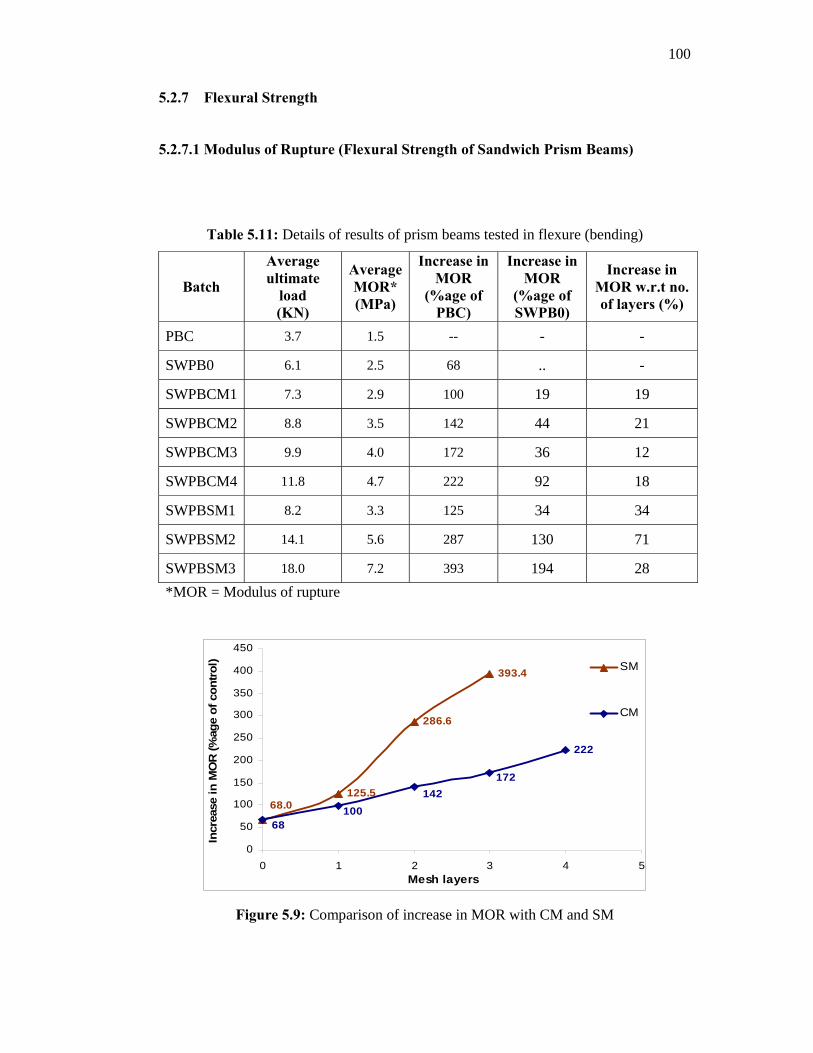
100
5.2.7 Flexural Strength
5.2.7.1 Modulus of Rupture (Flexural Strength of Sandwich Prism Beams)
Table 5.11: Details of results of prism beams tested in flexure (bending)
Batch
Average ultimate
load (KN)
AverageMOR* (MPa)
Increase in MOR
(%age of PBC)
Increase in MOR
(%age of SWPB0)
Increase in MOR w.r.t no. of layers (%)
PBC 3.7 1.5 -- - -
SWPB0 6.1 2.5 68 .. -
SWPBCM1 7.3 2.9 100 19 19
SWPBCM2 8.8 3.5 142 44 21
SWPBCM3 9.9 4.0 172 36 12
SWPBCM4 11.8 4.7 222 92 18
SWPBSM1 8.2 3.3 125 34 34
SWPBSM2 14.1 5.6 287 130 71
SWPBSM3 18.0 7.2 393 194 28 *MOR = Modulus of rupture
125.5
286.6
393.4
222
68.0
172142
10068
0
50
100
150
200
250
300
350
400
450
0 1 2 3 4 5Mesh layers
Incr
ease
in M
OR
(%ag
e of
con
trol) SM
CM
Figure 5.9: Comparison of increase in MOR with CM and SM
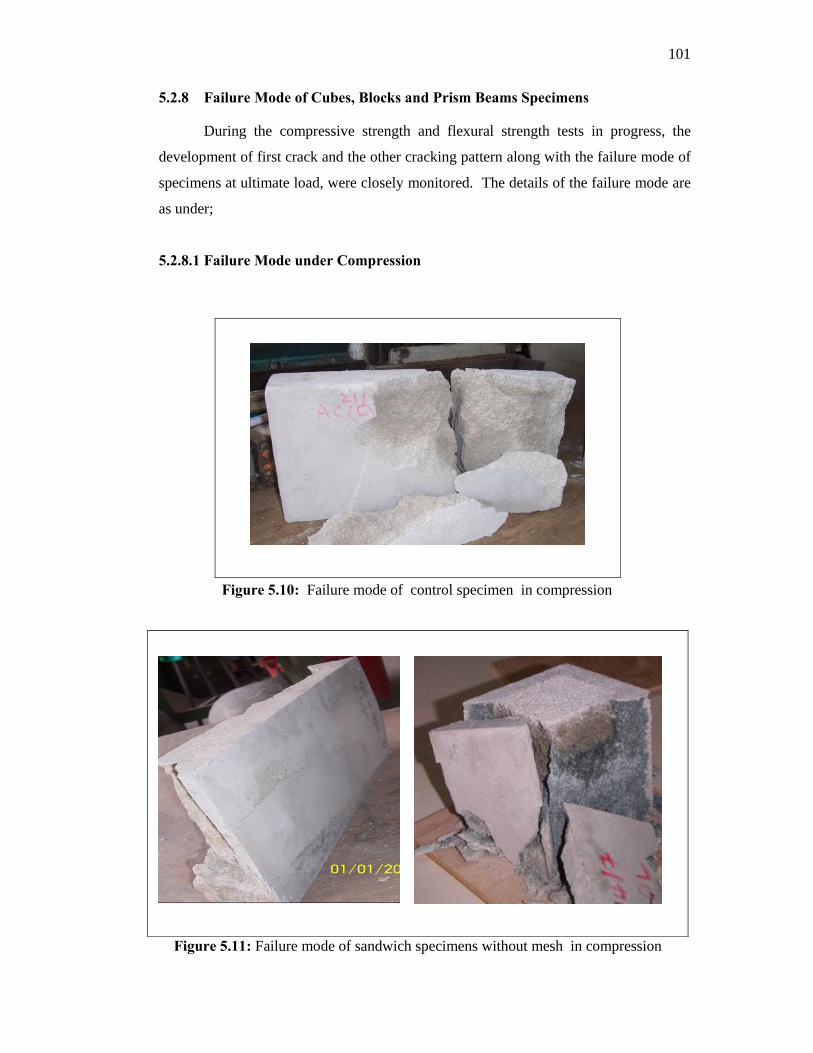
101
5.2.8 Failure Mode of Cubes, Blocks and Prism Beams Specimens
During the compressive strength and flexural strength tests in progress, the
development of first crack and the other cracking pattern along with the failure mode of
specimens at ultimate load, were closely monitored. The details of the failure mode are
as under;
5.2.8.1 Failure Mode under Compression
Figure 5.10: Failure mode of control specimen in compression
Figure 5.11: Failure mode of sandwich specimens without mesh in compression
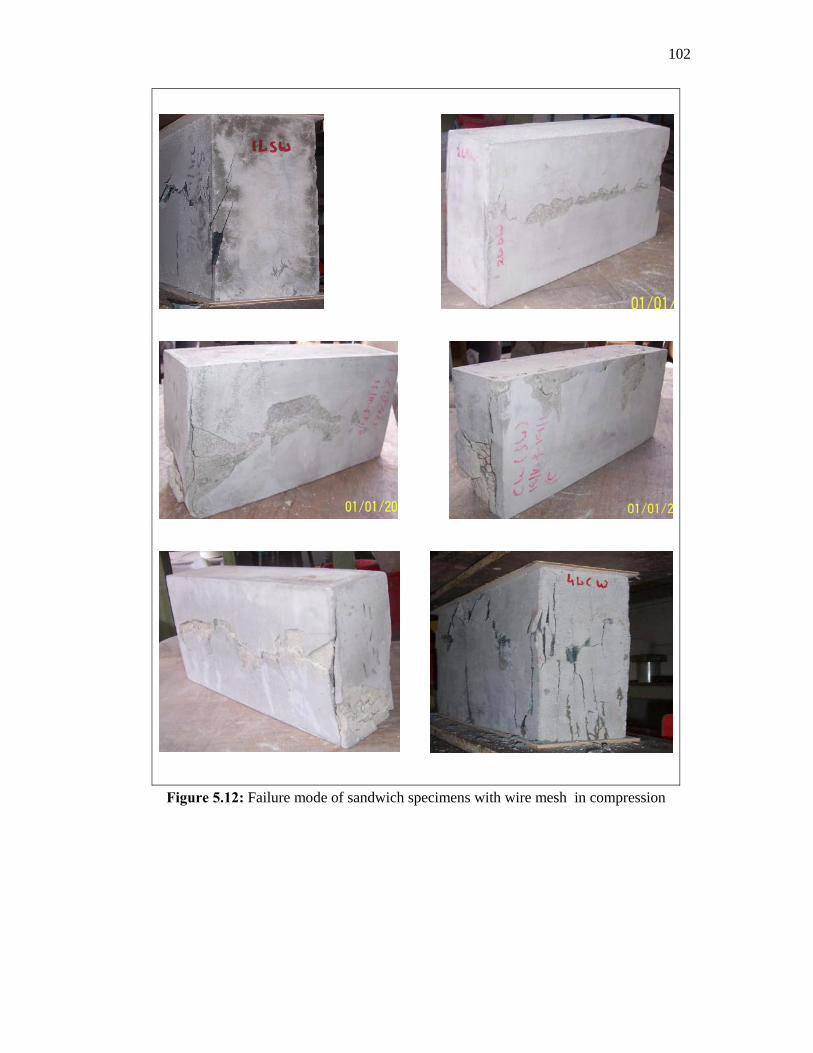
102
Figure 5.12: Failure mode of sandwich specimens with wire mesh in compression
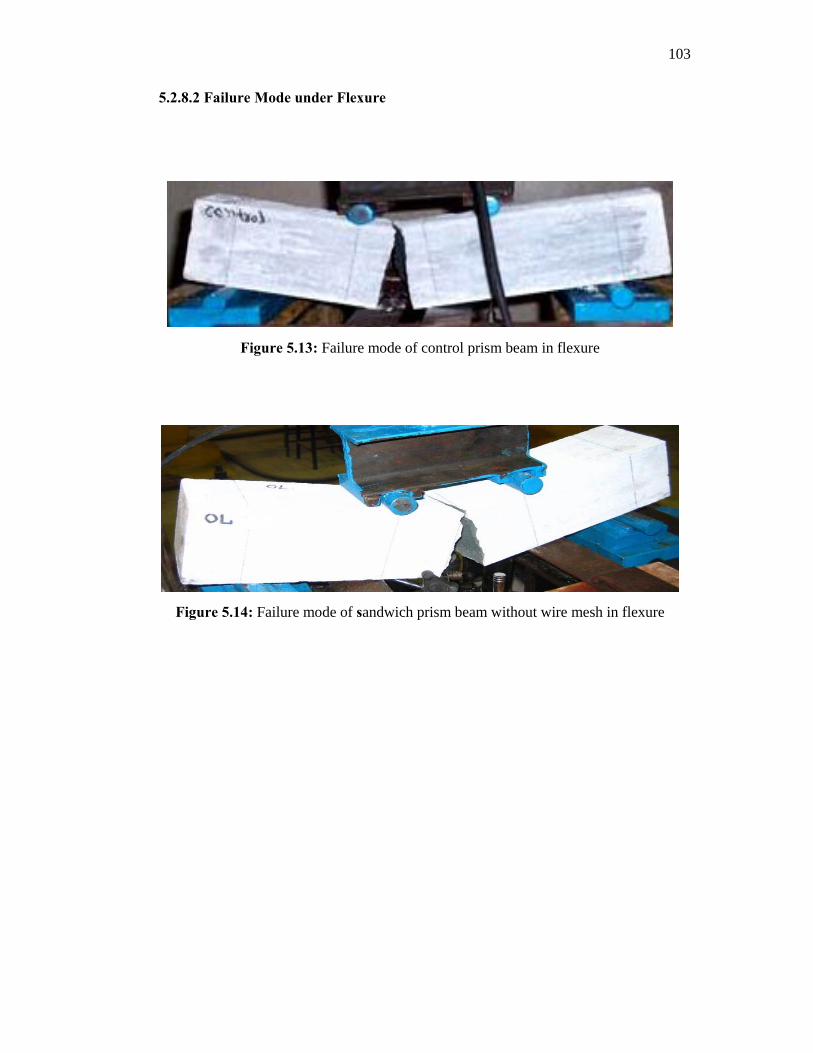
103
5.2.8.2 Failure Mode under Flexure
Figure 5.13: Failure mode of control prism beam in flexure
Figure 5.14: Failure mode of sandwich prism beam without wire mesh in flexure
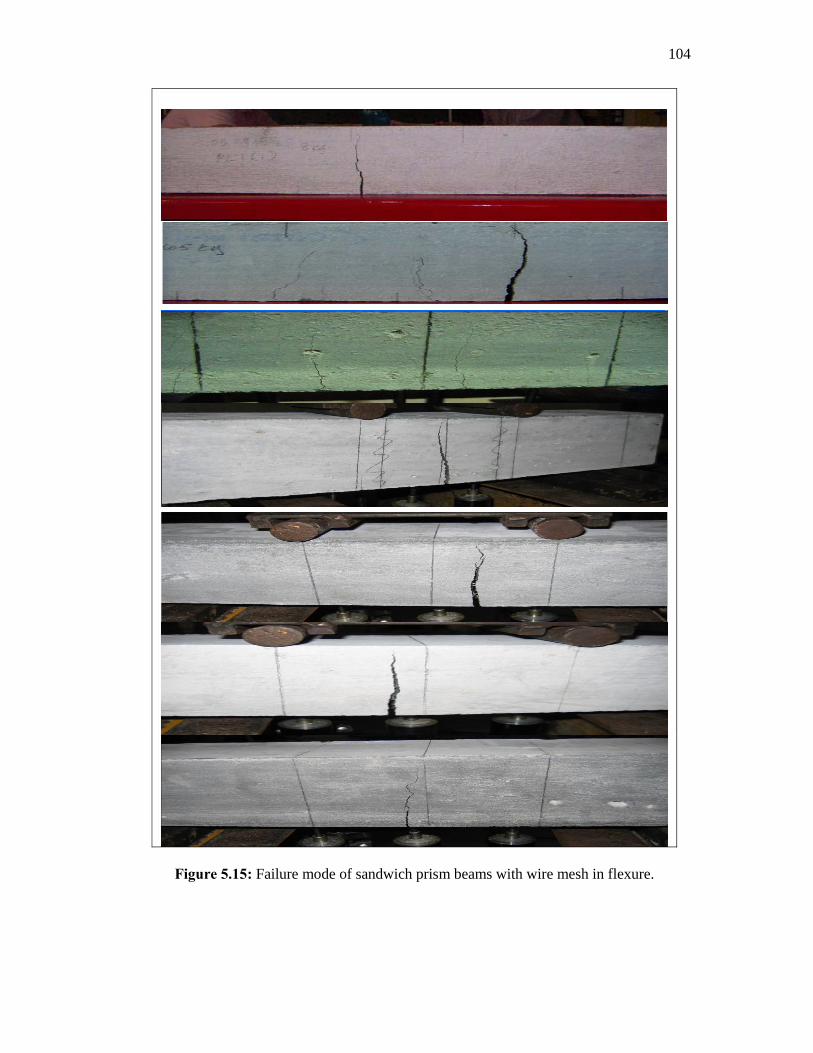
104
Figure 5.15: Failure mode of sandwich prism beams with wire mesh in flexure.
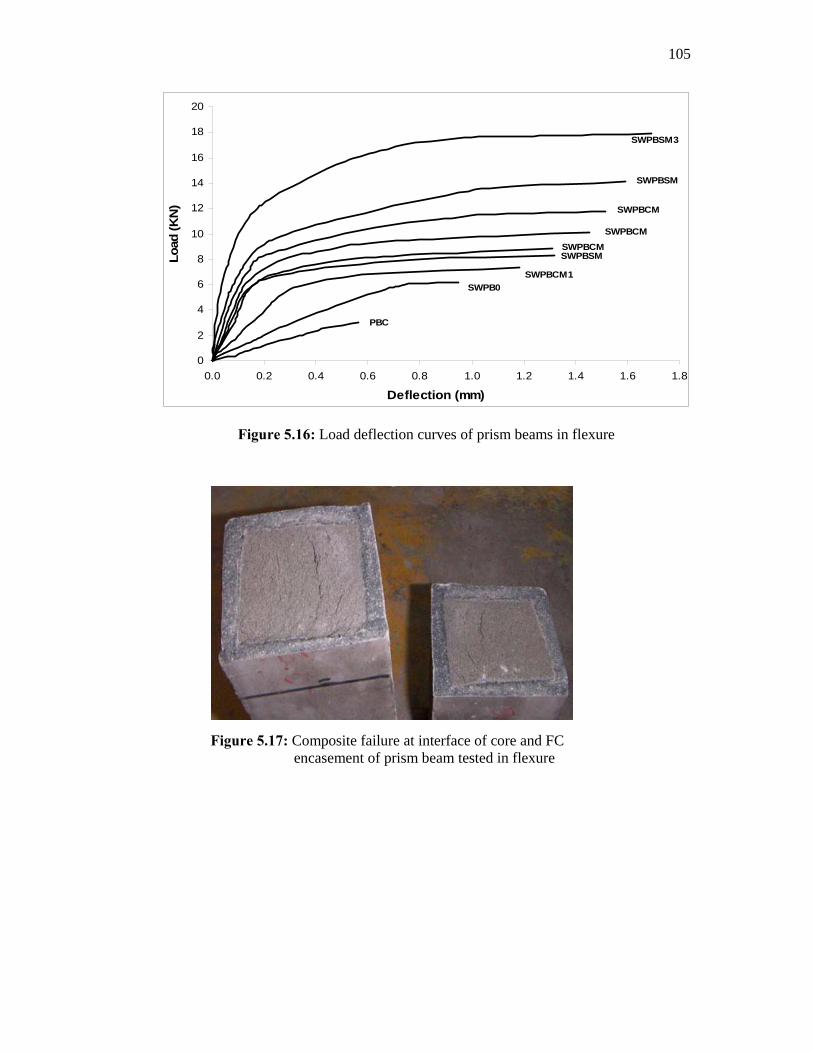
105
0
2
4
6
8
10
12
14
16
18
20
0.0 0.2 0.4 0.6 0.8 1.0 1.2 1.4 1.6 1.8
Deflection (mm)
Load
(KN
)
PBC
SWPB0SWPBCM1
SWPBSMSWPBCM
SWPBCM
SWPBCM
SWPBSM
SWPBSM3
Figure 5.16: Load deflection curves of prism beams in flexure
Figure 5.17: Composite failure at interface of core and FC encasement of prism beam tested in flexure
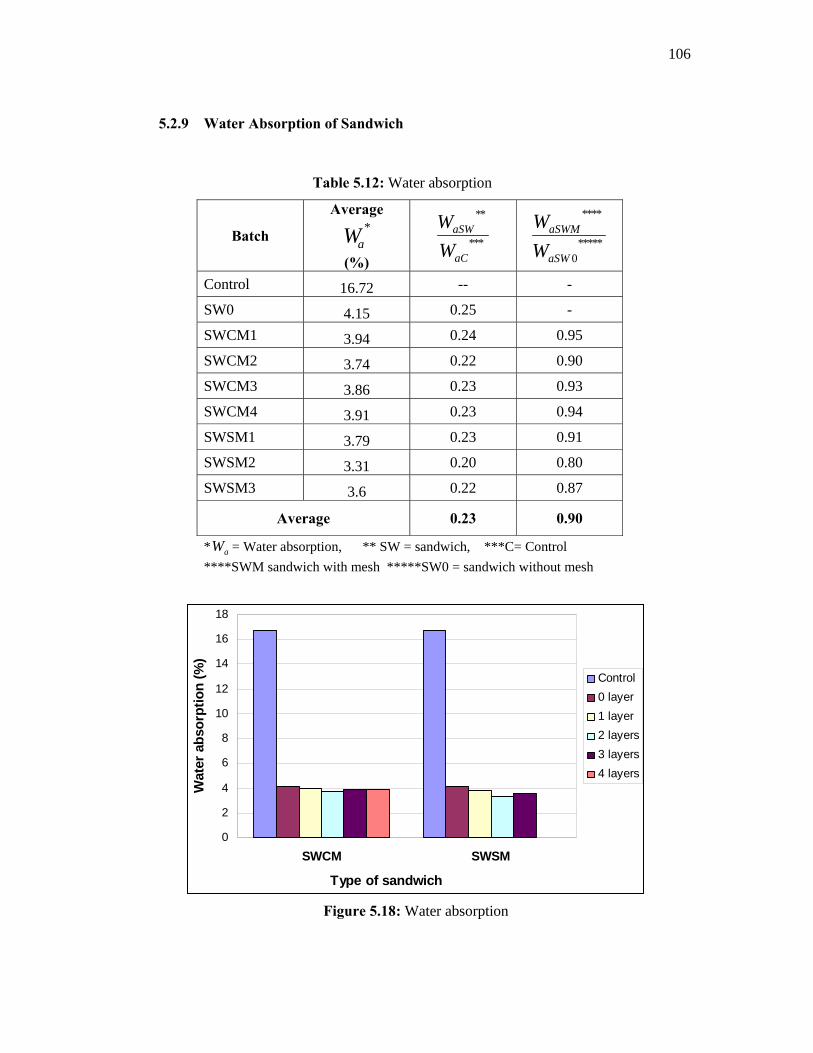
106
5.2.9 Water Absorption of Sandwich
Table 5.12: Water absorption
Batch
Average *
aW (%)
***
**
aC
aSW
WW
*****0
****
aSW
aSWM
WW
Control 16.72 -- -
SW0 4.15 0.25 -
SWCM1 3.94 0.24 0.95
SWCM2 3.74 0.22 0.90
SWCM3 3.86 0.23 0.93
SWCM4 3.91 0.23 0.94
SWSM1 3.79 0.23 0.91
SWSM2 3.31 0.20 0.80
SWSM3 3.6 0.22 0.87
Average 0.23 0.90
* aW = Water absorption, ** SW = sandwich, ***C= Control ****SWM sandwich with mesh *****SW0 = sandwich without mesh
0
2
4
6
8
10
12
14
16
18
SWCM SWSM
Type of sandwich
Wat
er a
bsor
ptio
n (%
)
Control0 layer1 layer2 layers3 layers4 layers
Figure 5.18: Water absorption
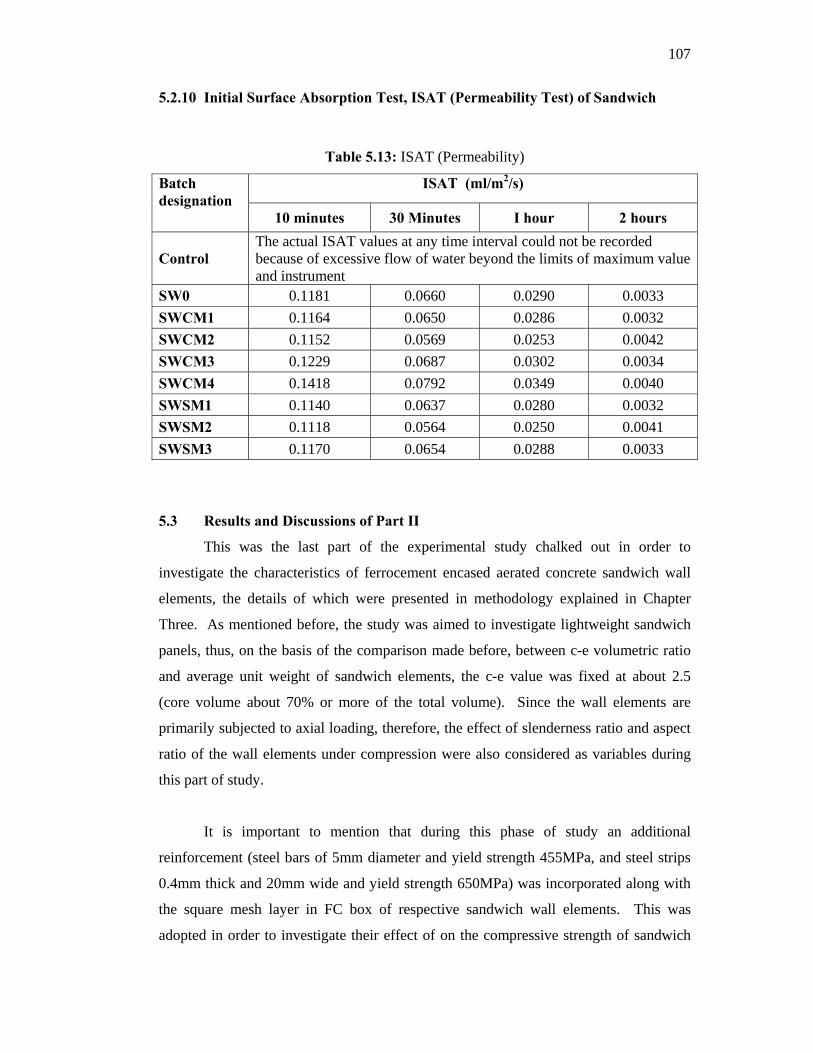
107
5.2.10 Initial Surface Absorption Test, ISAT (Permeability Test) of Sandwich
Table 5.13: ISAT (Permeability)
ISAT (ml/m2/s) Batch designation
10 minutes 30 Minutes I hour 2 hours
Control The actual ISAT values at any time interval could not be recorded because of excessive flow of water beyond the limits of maximum value and instrument
SW0 0.1181 0.0660 0.0290 0.0033 SWCM1 0.1164 0.0650 0.0286 0.0032 SWCM2 0.1152 0.0569 0.0253 0.0042 SWCM3 0.1229 0.0687 0.0302 0.0034 SWCM4 0.1418 0.0792 0.0349 0.0040 SWSM1 0.1140 0.0637 0.0280 0.0032 SWSM2 0.1118 0.0564 0.0250 0.0041 SWSM3 0.1170 0.0654 0.0288 0.0033
5.3 Results and Discussions of Part II
This was the last part of the experimental study chalked out in order to
investigate the characteristics of ferrocement encased aerated concrete sandwich wall
elements, the details of which were presented in methodology explained in Chapter
Three. As mentioned before, the study was aimed to investigate lightweight sandwich
panels, thus, on the basis of the comparison made before, between c-e volumetric ratio
and average unit weight of sandwich elements, the c-e value was fixed at about 2.5
(core volume about 70% or more of the total volume). Since the wall elements are
primarily subjected to axial loading, therefore, the effect of slenderness ratio and aspect
ratio of the wall elements under compression were also considered as variables during
this part of study.
It is important to mention that during this phase of study an additional
reinforcement (steel bars of 5mm diameter and yield strength 455MPa, and steel strips
0.4mm thick and 20mm wide and yield strength 650MPa) was incorporated along with
the square mesh layer in FC box of respective sandwich wall elements. This was
adopted in order to investigate their effect of on the compressive strength of sandwich
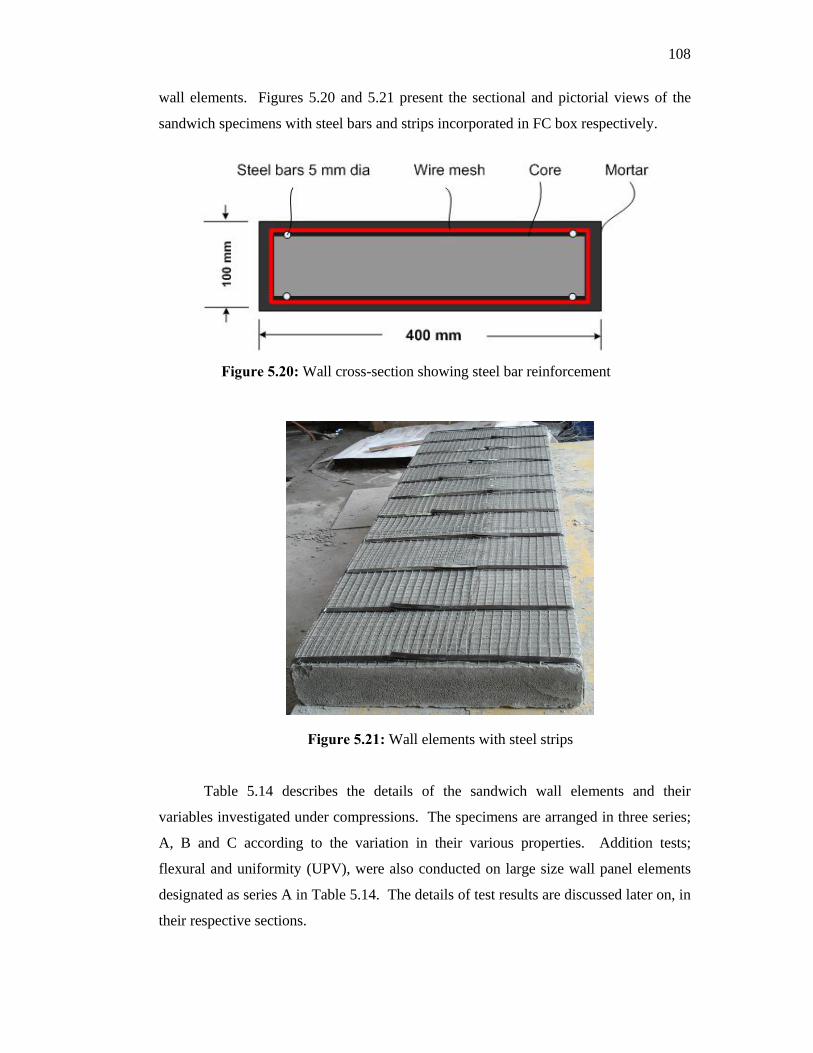
108
wall elements. Figures 5.20 and 5.21 present the sectional and pictorial views of the
sandwich specimens with steel bars and strips incorporated in FC box respectively.
Figure 5.20: Wall cross-section showing steel bar reinforcement
Figure 5.21: Wall elements with steel strips
Table 5.14 describes the details of the sandwich wall elements and their
variables investigated under compressions. The specimens are arranged in three series;
A, B and C according to the variation in their various properties. Addition tests;
flexural and uniformity (UPV), were also conducted on large size wall panel elements
designated as series A in Table 5.14. The details of test results are discussed later on, in
their respective sections.
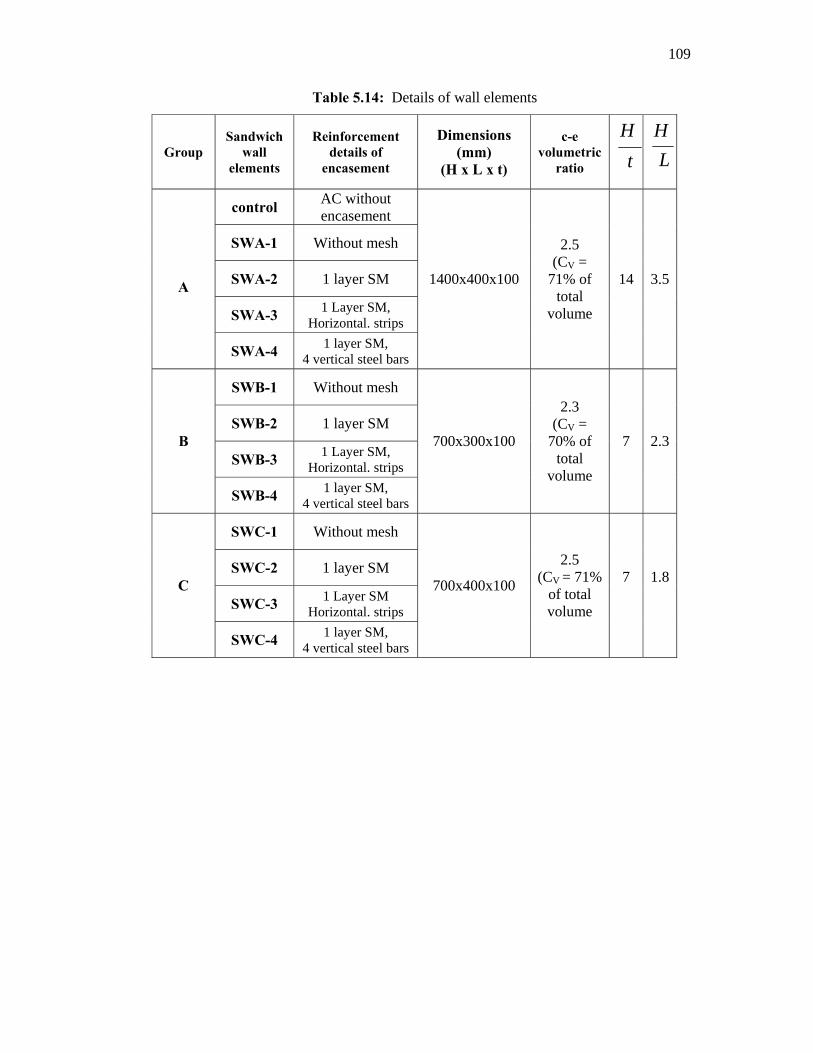
109
Table 5.14: Details of wall elements
Group Sandwich
wall elements
Reinforcement details of
encasement
Dimensions (mm)
(H x L x t)
c-e volumetric
ratio tH
L
H
control AC without encasement
SWA-1 Without mesh
SWA-2 1 layer SM
SWA-3 1 Layer SM, Horizontal. strips
A
SWA-4 1 layer SM, 4 vertical steel bars
1400x400x100
2.5 (CV =
71% of total
volume
14 3.5
SWB-1 Without mesh
SWB-2 1 layer SM
SWB-3 1 Layer SM, Horizontal. strips
B
SWB-4 1 layer SM, 4 vertical steel bars
700x300x100
2.3 (CV =
70% of total
volume
7 2.3
SWC-1 Without mesh
SWC-2 1 layer SM
SWC-3 1 Layer SM Horizontal. strips
C
SWC-4 1 layer SM, 4 vertical steel bars
700x400x100
2.5 (CV = 71%
of total volume
7
1.8
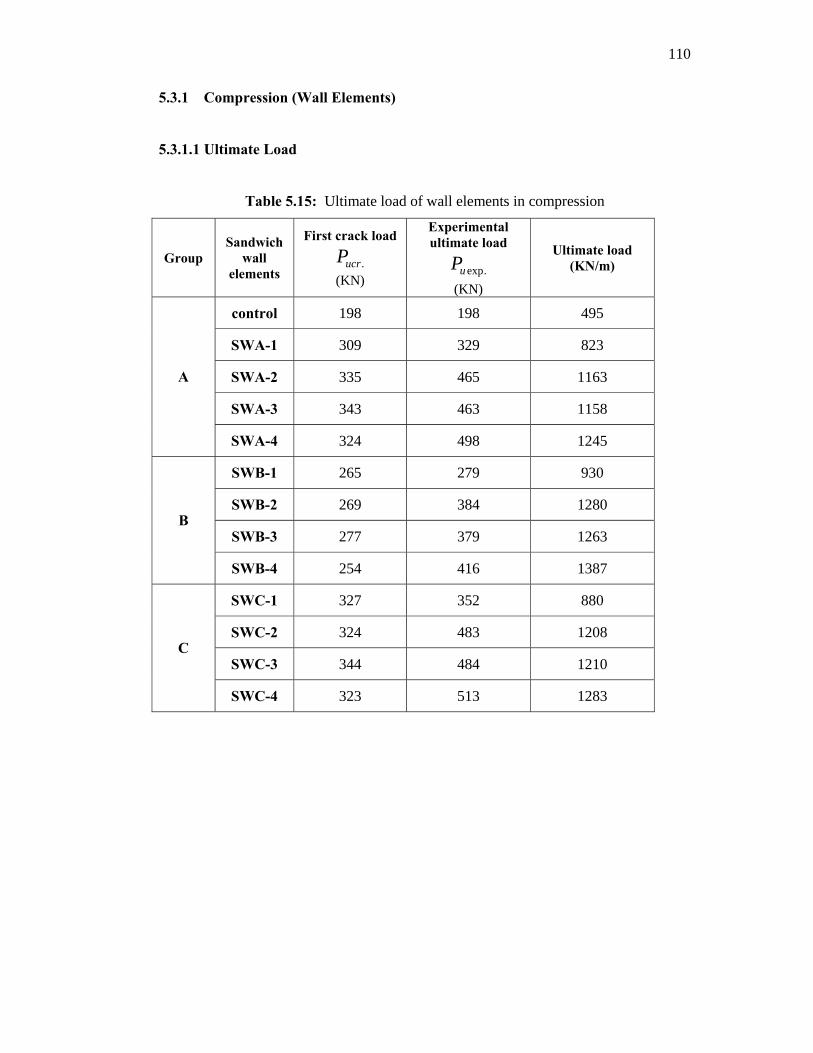
110
5.3.1 Compression (Wall Elements)
5.3.1.1 Ultimate Load
Table 5.15: Ultimate load of wall elements in compression
Group Sandwich
wall elements
First crack load
.ucrP (KN)
Experimental ultimate load
.expuP (KN)
Ultimate load (KN/m)
control 198 198 495
SWA-1 309 329 823
SWA-2 335 465 1163
SWA-3 343 463 1158
A
SWA-4 324 498 1245
SWB-1 265 279 930
SWB-2 269 384 1280
SWB-3 277 379 1263 B
SWB-4 254 416 1387
SWC-1 327 352 880
SWC-2 324 483 1208
SWC-3 344 484 1210 C
SWC-4 323 513 1283
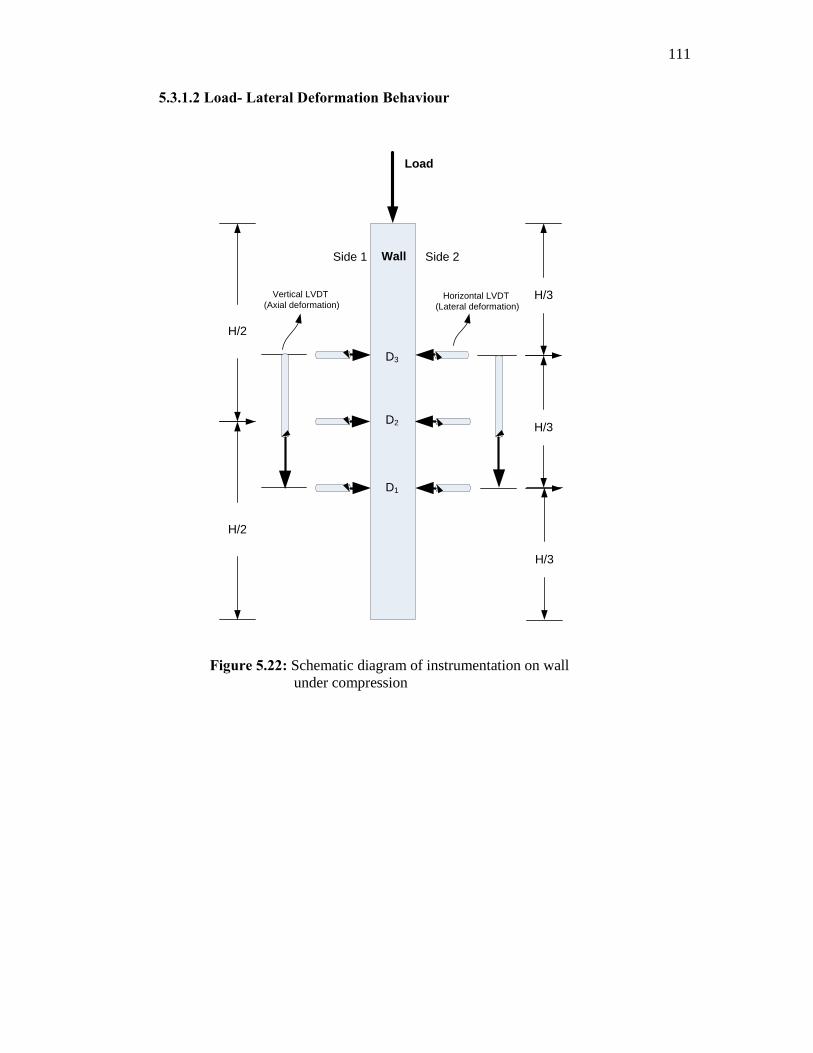
111
5.3.1.2 Load- Lateral Deformation Behaviour
D3D3
D1
D2
H/3
H/3
H/3
H/2
H/2
Vertical LVDT (Axial deformation)
Horizontal LVDT (Lateral deformation)
Side 1 Side 2Wall
Load
Figure 5.22: Schematic diagram of instrumentation on wall under compression
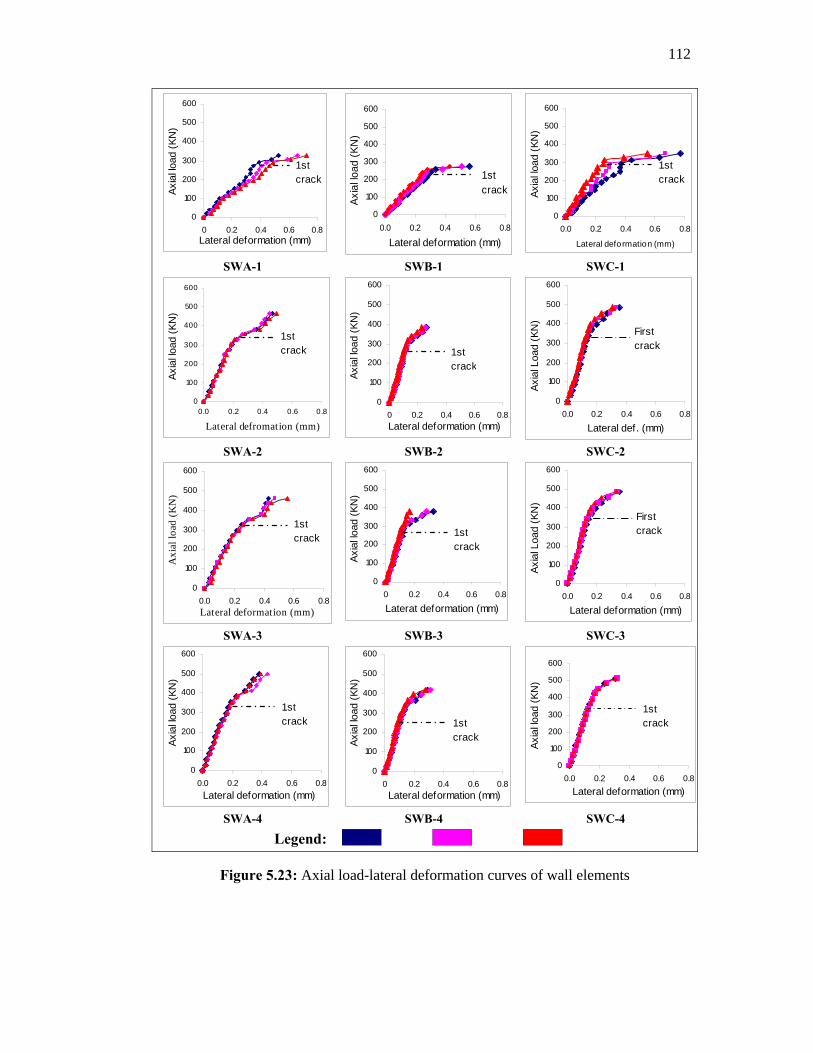
112
0
100
200
300
400
500
600
0 0.2 0.4 0.6 0.8Lateral deformation (mm)
Axia
l load
(KN
)1st crack
0
100
200
300
400
500
600
0.0 0.2 0.4 0.6 0.8
Lateral deformation (mm)
Axia
l load
(KN
)
1st crack
0
100
200
300
400
500
600
0.0 0.2 0.4 0.6 0.8
Lateral deformation (mm)
Axia
l load
(KN
)
1st crack
SWA-1 SWB-1 SWC-1
0
100
200
300
400
500
600
0.0 0.2 0.4 0.6 0.8
Lateral defromation (mm)
Axia
l load
(KN
)
1st crack
0
100
200
300
400
500
600
0 0.2 0.4 0.6 0.8Lateral deformation (mm)
Axia
l load
(KN
)1st crack
0
100
200
300
400
500
600
0.0 0.2 0.4 0.6 0.8
Lateral def. (mm)
Axia
l Loa
d (K
N)
First crack
SWA-2 SWB-2 SWC-2
0
100
200
300
400
500
600
0.0 0.2 0.4 0.6 0.8Lateral deformation (mm)
Axi
al lo
ad (K
N)
1st crack
0
100
200
300
400
500
600
0 0.2 0.4 0.6 0.8
Laterat deformation (mm)
Axia
l load
(KN
)
1st crack
0
100
200
300
400
500
600
0.0 0.2 0.4 0.6 0.8
Lateral deformation (mm)
Axia
l Loa
d (K
N)
First crack
SWA-3 SWB-3 SWC-3
0
100
200
300
400
500
600
0.0 0.2 0.4 0.6 0.8Lateral deformation (mm)
Axia
l load
(KN
)
1st crack
0
100
200
300
400
500
600
0 0.2 0.4 0.6 0.8Lateral deformation (mm)
Axia
l load
(KN
)
1st crack
0
100
200
300
400
500
600
0.0 0.2 0.4 0.6 0.8Lateral deformation (mm)
Axia
l load
(KN
)
1st crack
SWA-4 SWB-4 SWC-4 Legend:
Figure 5.23: Axial load-lateral deformation curves of wall elements
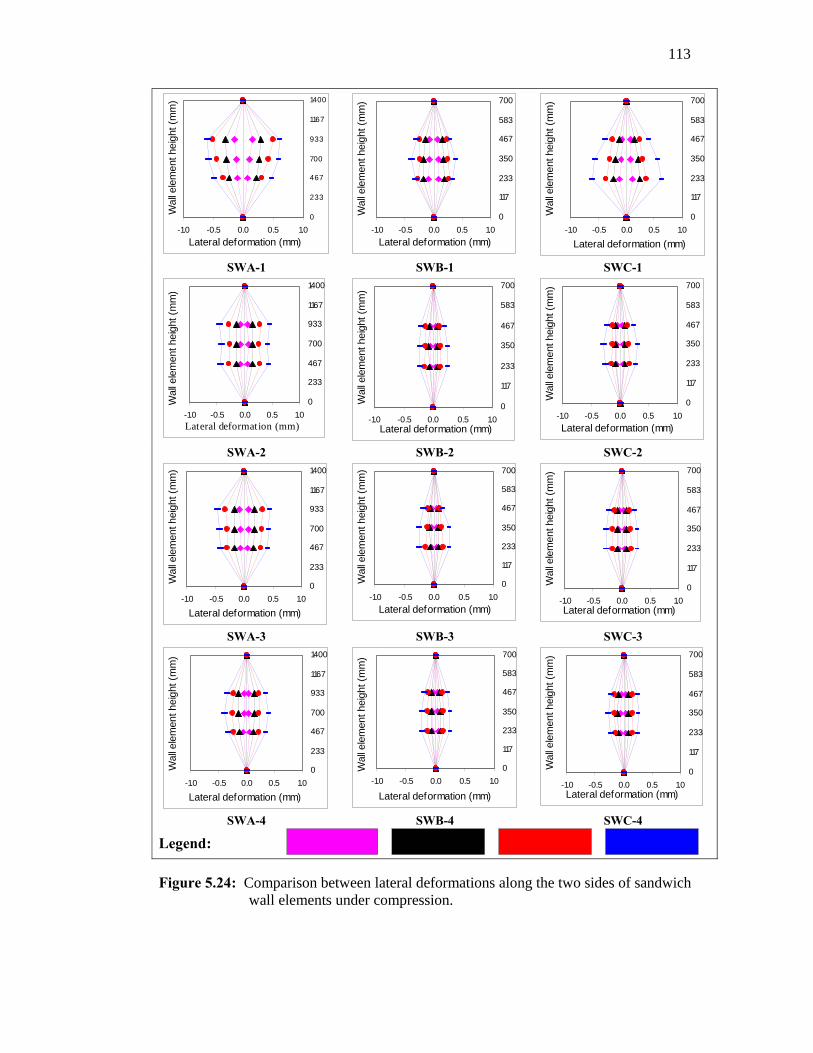
113
0
233
467
700
933
1167
1400
-1.0 -0.5 0.0 0.5 1.0Lateral deformation (mm)
Wal
l ele
men
t hei
ght (
mm
)
0
117
233
350
467
583
700
-1.0 -0.5 0.0 0.5 1.0Lateral deformation (mm)
Wal
l ele
men
t hei
ght (
mm
)
0
117
233
350
467
583
700
-1.0 -0.5 0.0 0.5 1.0
Lateral deformation (mm)
Wal
l ele
men
t hei
ght (
mm
)
SWA-1 SWB-1 SWC-1
0
233
467
700
933
1167
1400
-1.0 -0.5 0.0 0.5 1.0Lateral deformation (mm)
Wal
l ele
men
t hei
ght (
mm
)
0
117
233
350
467
583
700
-1.0 -0.5 0.0 0.5 1.0Lateral deformation (mm)
Wal
l ele
men
t hei
ght (
mm
)
0
117
233
350
467
583
700
-1.0 -0.5 0.0 0.5 1.0Lateral deformation (mm)
Wal
l ele
men
t hei
ght (
mm
)
SWA-2 SWB-2 SWC-2
0
233
467
700
933
1167
1400
-1.0 -0.5 0.0 0.5 1.0
Lateral deformation (mm)
Wal
l ele
men
t hei
ght (
mm
)
0
117
233
350
467
583
700
-1.0 -0.5 0.0 0.5 1.0Lateral deformation (mm)
Wal
l ele
men
t hei
ght (
mm
)
0
117
233
350
467
583
700
-1.0 -0.5 0.0 0.5 1.0Lateral deformation (mm)
Wal
l ele
men
t hei
ght (
mm
)
SWA-3 SWB-3 SWC-3
0
233
467
700
933
1167
1400
-1.0 -0.5 0.0 0.5 1.0
Lateral deformation (mm)
Wal
l ele
men
t hei
ght (
mm
)
0
117
233
350
467
583
700
-1.0 -0.5 0.0 0.5 1.0
Lateral deformation (mm)
Wal
l ele
men
t hei
ght (
mm
)
0
117
233
350
467
583
700
-1.0 -0.5 0.0 0.5 1.0Lateral deformation (mm)
Wal
l ele
men
t hei
ght (
mm
)
SWA-4 SWB-4 SWC-4
Legend:
Figure 5.24: Comparison between lateral deformations along the two sides of sandwich wall elements under compression.
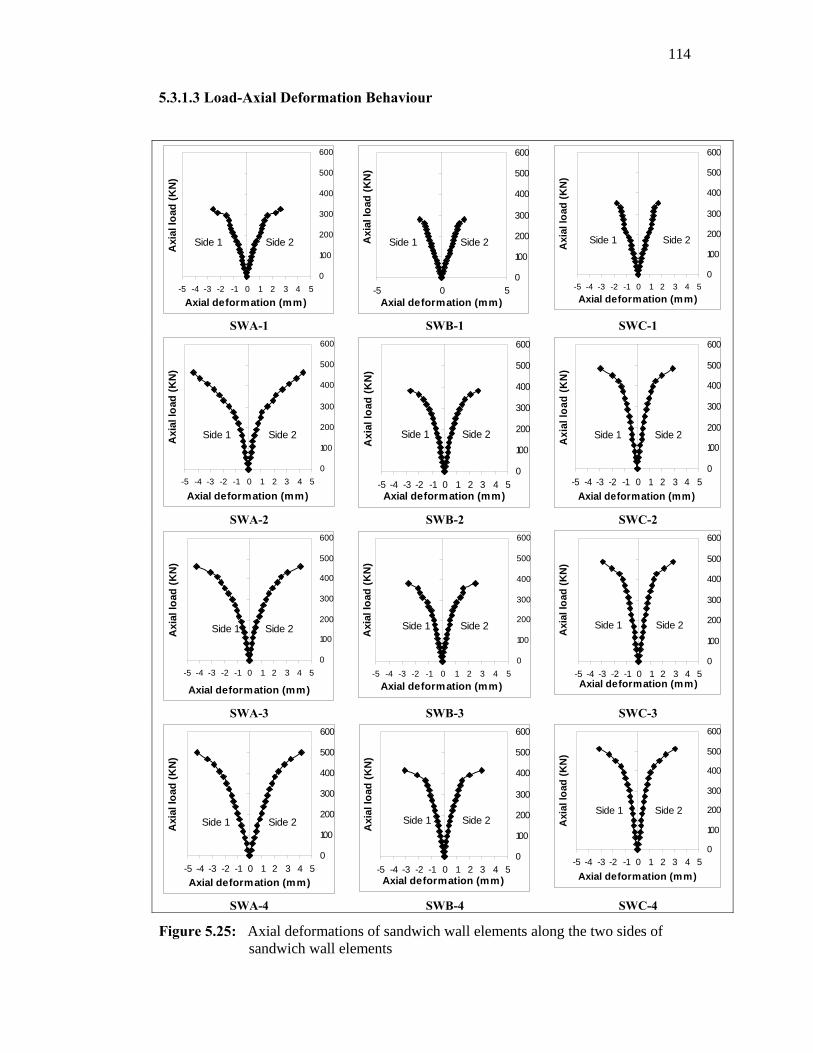
114
5.3.1.3 Load-Axial Deformation Behaviour
0
100
200
300
400
500
600
-5 -4 -3 -2 -1 0 1 2 3 4 5
Axial deformation (mm)
Axi
al lo
ad (K
N)
Side 1 Side 2
0
100
200
300
400
500
600
-5 0 5Axial deformation (mm)
Axi
al lo
ad (K
N)
Side 1 Side 2
0
100
200
300
400
500
600
-5 -4 -3 -2 -1 0 1 2 3 4 5Axial deformation (mm)
Axi
al lo
ad (K
N)
Side 1 Side 2
SWA-1 SWB-1 SWC-1
0
100
200
300
400
500
600
-5 -4 -3 -2 -1 0 1 2 3 4 5
Axial deformation (mm)
Axi
al lo
ad (K
N)
Side 1 Side 2
0
100
200
300
400
500
600
-5 -4 -3 -2 -1 0 1 2 3 4 5Axial deformation (mm)
Axi
al lo
ad (K
N)
Side 1 Side 2
0
100
200
300
400
500
600
-5 -4 -3 -2 -1 0 1 2 3 4 5Axial deformation (mm)
Axi
al lo
ad (K
N)
Side 1 Side 2
SWA-2 SWB-2 SWC-2
0
100
200
300
400
500
600
-5 -4 -3 -2 -1 0 1 2 3 4 5
Axial deformation (mm)
Axi
al lo
ad (K
N)
Side 1 Side 2
0
100
200
300
400
500
600
-5 -4 -3 -2 -1 0 1 2 3 4 5Axial deformation (mm)
Axi
al lo
ad (K
N)
Side 1 Side 2
0
100
200
300
400
500
600
-5 -4 -3 -2 -1 0 1 2 3 4 5Axial deformation (mm)
Axi
al lo
ad (K
N)
Side 1 Side 2
SWA-3 SWB-3 SWC-3
0
100
200
300
400
500
600
-5 -4 -3 -2 -1 0 1 2 3 4 5Axial deformation (mm)
Axi
al lo
ad (K
N)
Side 1 Side 2
0
100
200
300
400
500
600
-5 -4 -3 -2 -1 0 1 2 3 4 5Axial deformation (mm)
Axi
al lo
ad (K
N)
Side 1 Side 2
0
100
200
300
400
500
600
-5 -4 -3 -2 -1 0 1 2 3 4 5Axial deformation (mm)
Axi
al lo
ad (K
N)
Side 1 Side 2
SWA-4 SWB-4 SWC-4
Figure 5.25: Axial deformations of sandwich wall elements along the two sides of sandwich wall elements

115
0
100
200
300
400
500
600
-5 -4 -3 -2 -1 0 1 2 3 4 5
Deformation (mm)
Axi
al L
oad
(KN
)
0
100
200
300
400
500
600
-5 -4 -3 -2 -1 0 1 2 3 4 5
Deformation (mm)
Axi
al L
oad
(KN
)
0
100
200
300
400
500
600
-5 -4 -3 -2 -1 0 1 2 3 4 5Deformation (mm)
Axi
al L
oad
(KN
)
SWA-1 SWB-1 SWC-1
0
100
200
300
400
500
600
-5 -4 -3 -2 -1 1 2 3 4 5Deformation (mm)
Axi
al L
oad
(KN
)
0
100
200
300
400
500
600
-5 -4 -3 -2 -1 0 1 2 3 4 5Deformation (mm)
Axi
al L
oad
(KN
)
0
100
200
300
400
500
600
-5 -4 -3 -2 -1 0 1 2 3 4 5Deformation (mm)
Axi
al L
oad
(KN
)
SWA-2 SWB-2 SWC-2
0
100
200
300
400
500
600
-5 -4 -3 -2 -1 1 2 3 4 5
Deformation (mm)
Axi
al L
oad
(KN
)
0
100
200
300
400
500
600
-5 -4 -3 -2 -1 0 1 2 3 4 5
Deformation (mm)
Axi
al L
oad
(KN
)
0
100
200
300
400
500
600
-5 -4 -3 -2 -1 0 1 2 3 4 5Deformation (mm)
Axi
al L
oad
(KN
)
SWA-3 SWB-3 SWC-3
0
100
200
300
400
500
600
-5 -4 -3 -2 -1 1 2 3 4 5
Deformation (mm)
Axi
al L
oad
(KN
)
0
100
200
300
400
500
600
-5 -4 -3 -2 -1 0 1 2 3 4 5
Deformation (mm)
Axi
al L
oad
(KN
)
0
100
200
300
400
500
600
-5 -4 -3 -2 -1 0 1 2 3 4 5Deformation (mm)
Axi
al L
oad
(KN
)
SWA-4 SWB-4 SWC-4 Axial deformations measured at middle-third of wall element height (average of two sides) Lateral deformations measured at mid-span of wall element height (average of two faces)
Figure 5.26: Comparison between axial and lateral deformations of sandwich wall elements
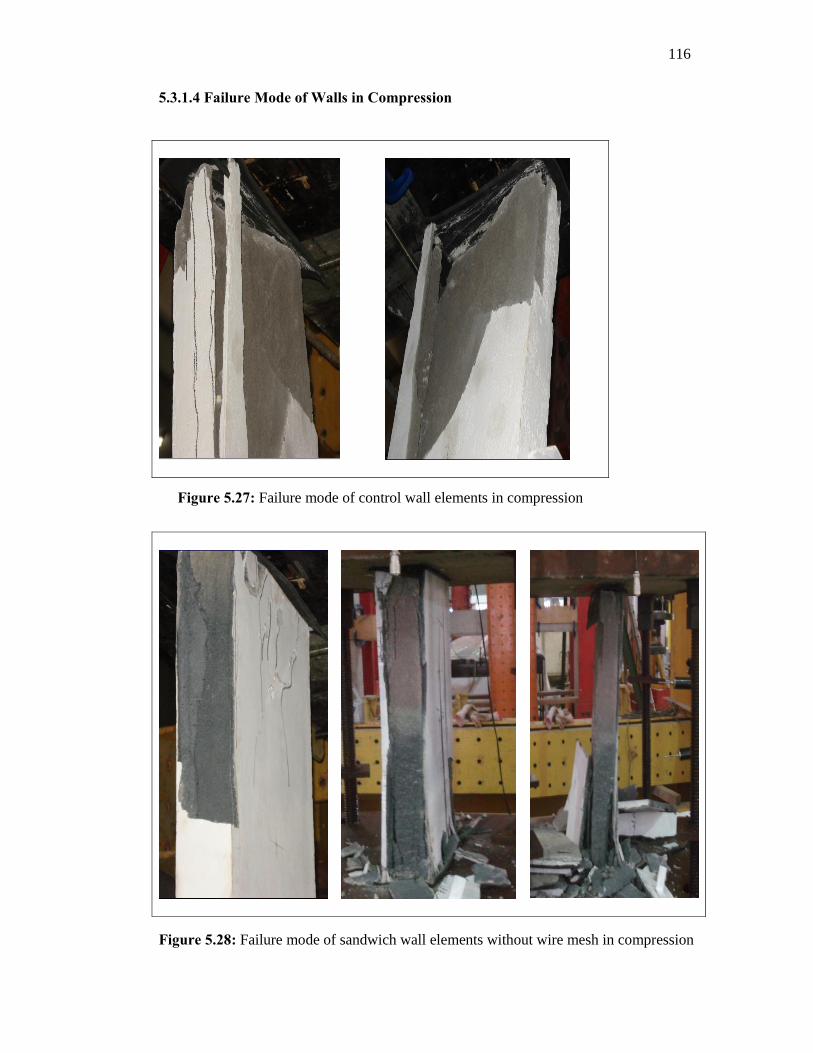
116
5.3.1.4 Failure Mode of Walls in Compression
Figure 5.27: Failure mode of control wall elements in compression
Figure 5.28: Failure mode of sandwich wall elements without wire mesh in compression
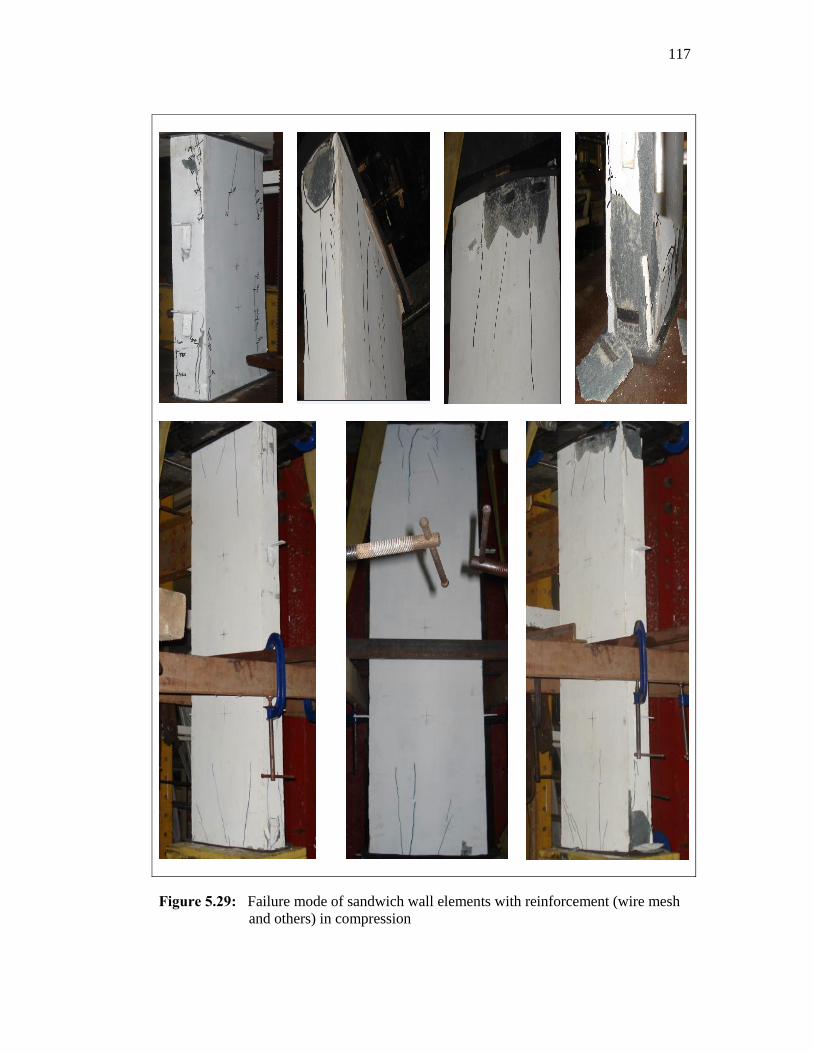
117
Figure 5.29: Failure mode of sandwich wall elements with reinforcement (wire mesh and others) in compression
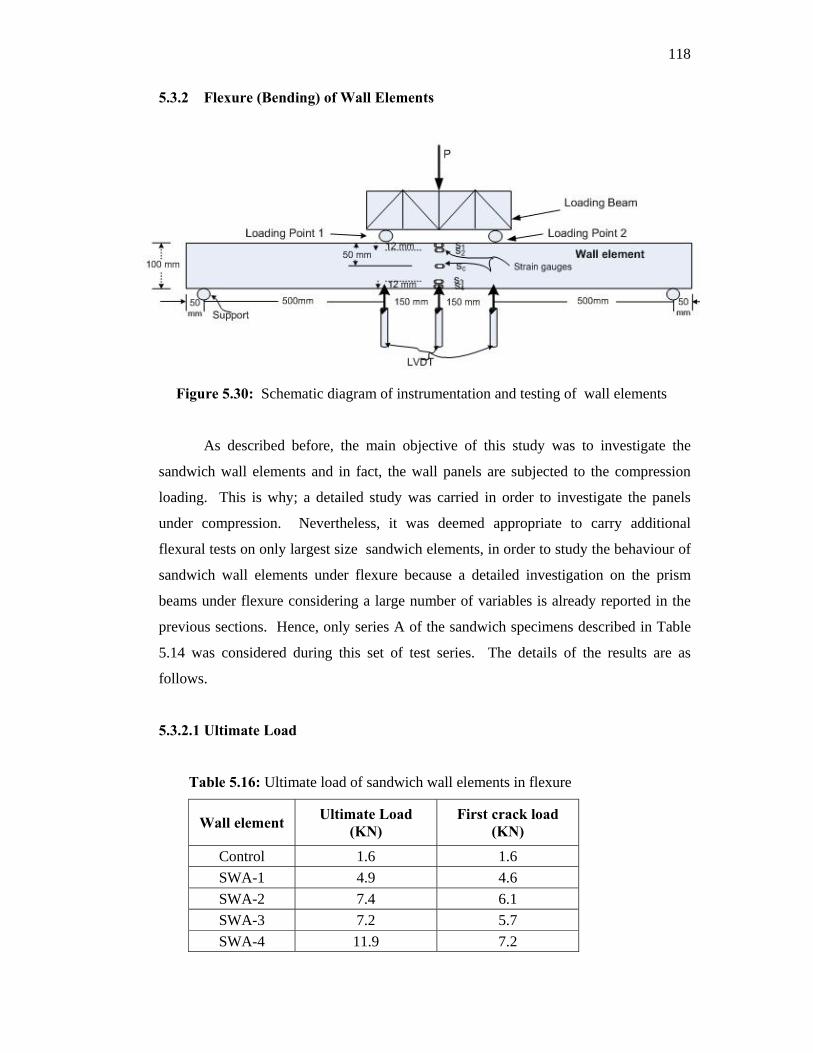
118
5.3.2 Flexure (Bending) of Wall Elements
Figure 5.30: Schematic diagram of instrumentation and testing of wall elements
As described before, the main objective of this study was to investigate the
sandwich wall elements and in fact, the wall panels are subjected to the compression
loading. This is why; a detailed study was carried in order to investigate the panels
under compression. Nevertheless, it was deemed appropriate to carry additional
flexural tests on only largest size sandwich elements, in order to study the behaviour of
sandwich wall elements under flexure because a detailed investigation on the prism
beams under flexure considering a large number of variables is already reported in the
previous sections. Hence, only series A of the sandwich specimens described in Table
5.14 was considered during this set of test series. The details of the results are as
follows.
5.3.2.1 Ultimate Load
Table 5.16: Ultimate load of sandwich wall elements in flexure
Wall element Ultimate Load (KN)
First crack load (KN)
Control 1.6 1.6 SWA-1 4.9 4.6 SWA-2 7.4 6.1 SWA-3 7.2 5.7 SWA-4 11.9 7.2
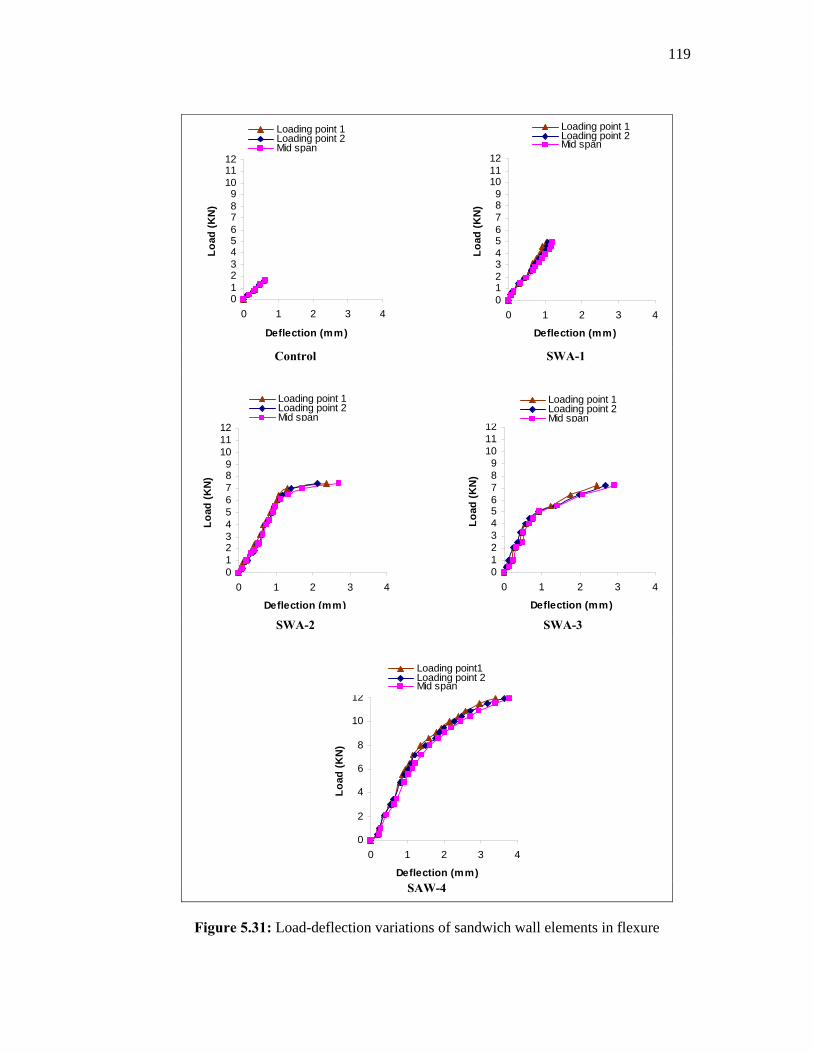
119
0123456789
101112
0 1 2 3 4
Deflection (mm)
Load
(KN
)
Loading point 1Loading point 2Mid span
0123456789
101112
0 1 2 3 4
Deflection (mm)
Load
(KN
)
Loading point 1Loading point 2Mid span
Control SWA-1
0123456789
101112
0 1 2 3 4
Deflection (mm)
Load
(KN
)
Loading point 1Loading point 2Mid span
0123456789
101112
0 1 2 3 4
Deflection (mm)
Load
(KN
)
Loading point 1Loading point 2Mid span
SWA-2 SWA-3
0
2
4
6
8
10
12
0 1 2 3 4
Deflection (mm)
Load
(KN
)
Loading point1Loading point 2Mid span
SAW-4
Figure 5.31: Load-deflection variations of sandwich wall elements in flexure
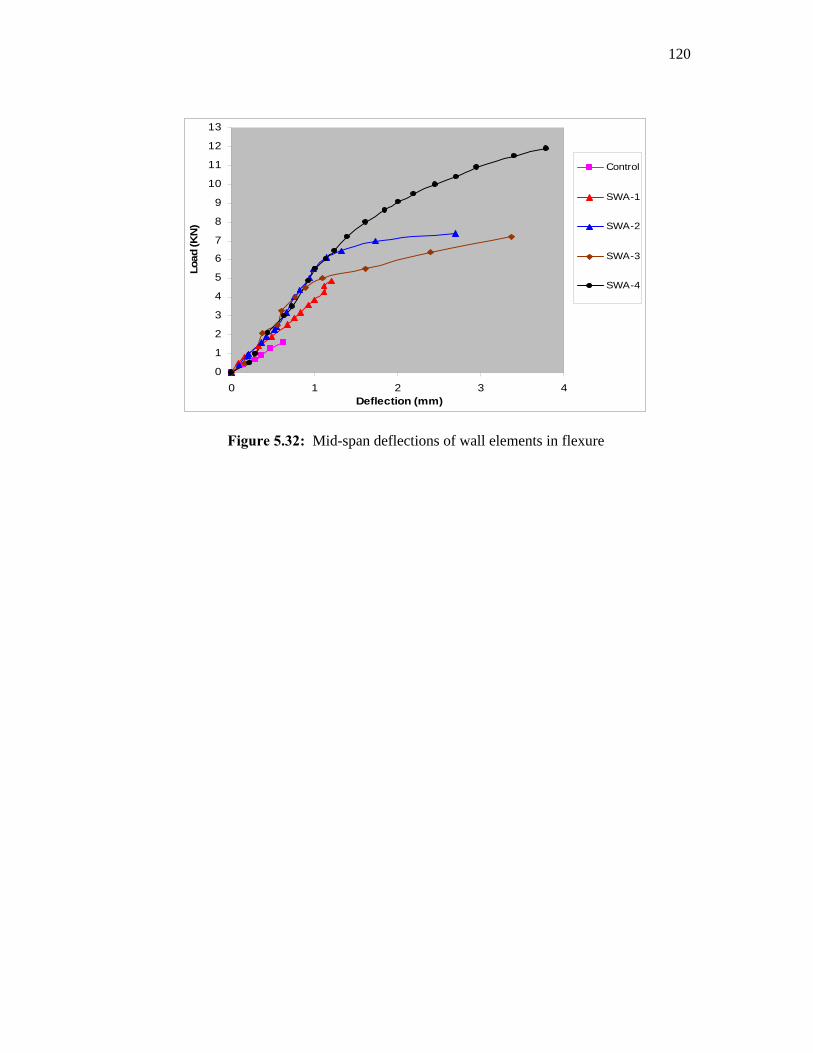
120
0
1
2
3
4
5
6
7
8
9
10
11
12
13
0 1 2 3 4Deflection (mm)
Load
(KN
)
Control
SWA-1
SWA-2
SWA-3
SWA-4
Figure 5.32: Mid-span deflections of wall elements in flexure
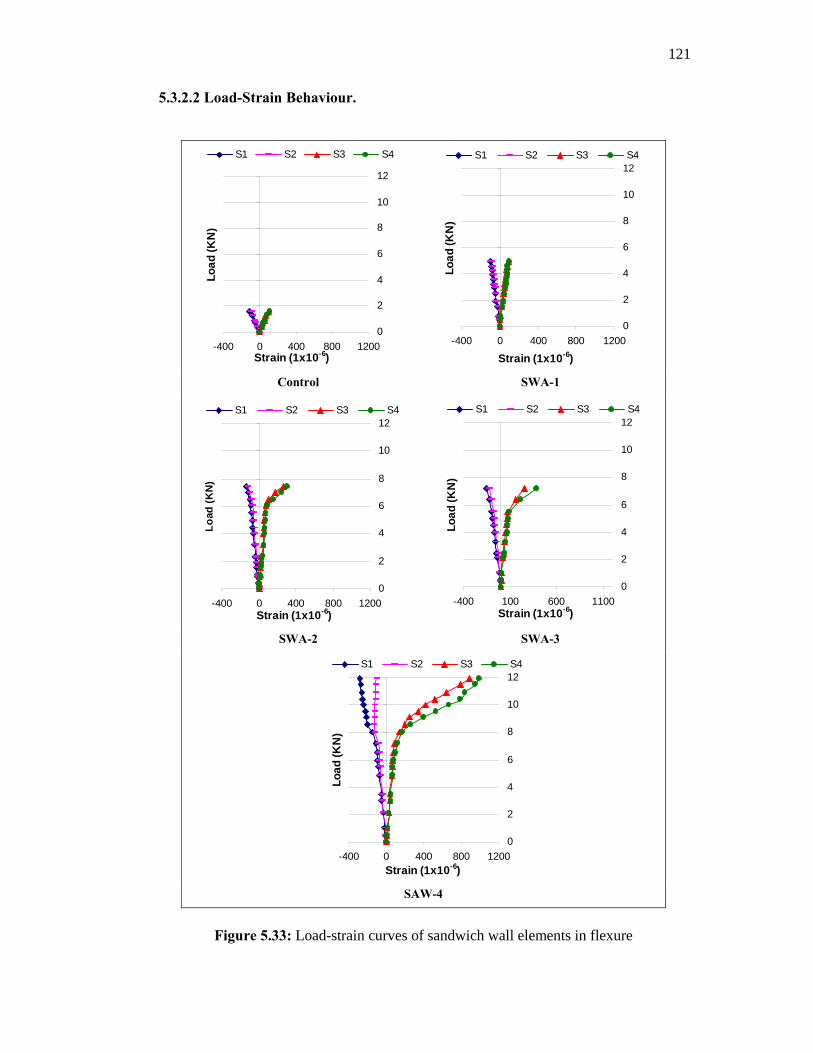
121
5.3.2.2 Load-Strain Behaviour.
0
2
4
6
8
10
12
-400 0 400 800 1200Strain (1x10⁻⁶)
Load
(KN
)
S1 S2 S3 S4
0
2
4
6
8
10
12
-400 0 400 800 1200
Strain (1x10⁻⁶)
Load
(KN
)
S1 S2 S3 S4
Control SWA-1
0
2
4
6
8
10
12
-400 0 400 800 1200Strain (1x10⁻⁶)
Load
(KN
)
S1 S2 S3 S4
0
2
4
6
8
10
12
-400 100 600 1100Strain (1x10⁻⁶)
Load
(KN
)
S1 S2 S3 S4
SWA-2 SWA-3
0
2
4
6
8
10
12
-400 0 400 800 1200Strain (1x10⁻⁶)
Load
(KN
)
S1 S2 S3 S4
SAW-4
Figure 5.33: Load-strain curves of sandwich wall elements in flexure
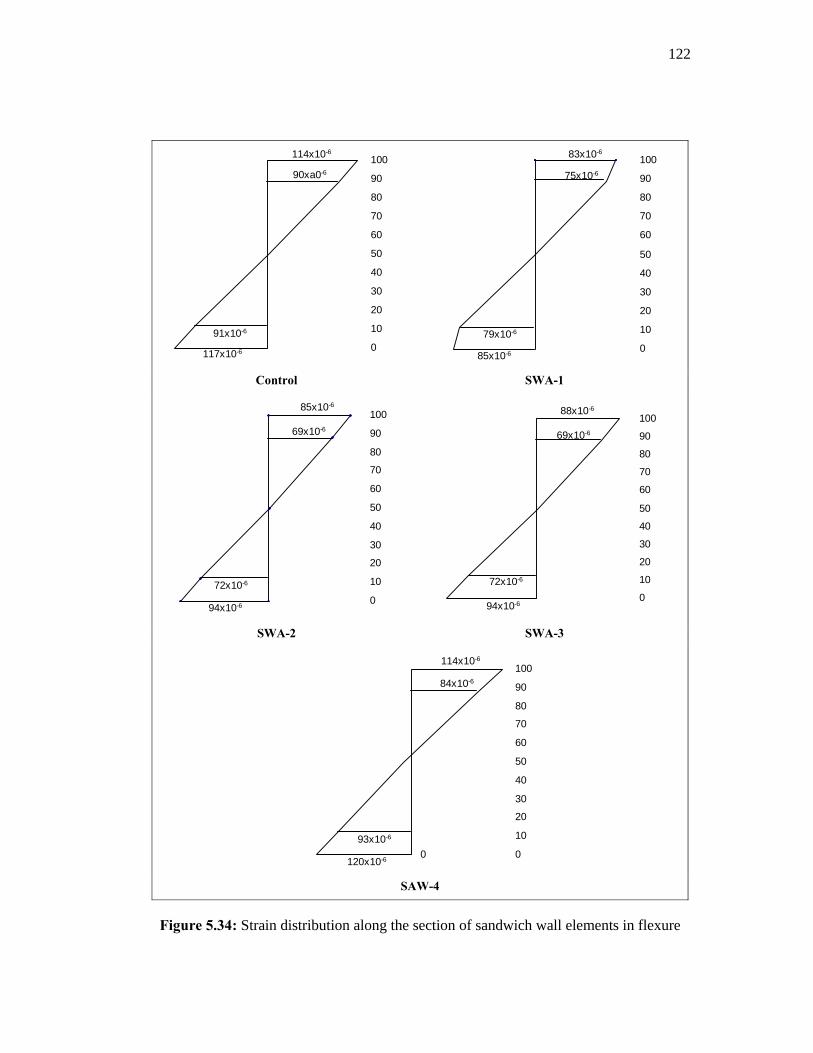
122
117x10-6
90xa0-6
114x10-6
91x10-6
0
10
20
30
40
50
60
70
80
90
100 83x10-6
75x10-6
85x10-6
79x10-6
0
10
20
30
40
50
60
70
80
90
100
Control SWA-1
85x10-6
69x10-6
94x10-6
72x10-6
0
10
20
30
40
50
60
70
80
90
100
94x10-6
69x10-6
88x10-6
72x10-6
0
10
20
30
40
50
60
70
80
90
100
SWA-2 SWA-3
0120x10-6
84x10-6
114x10-6
93x10-6
0
10
20
30
40
50
60
70
80
90
100
SAW-4
Figure 5.34: Strain distribution along the section of sandwich wall elements in flexure
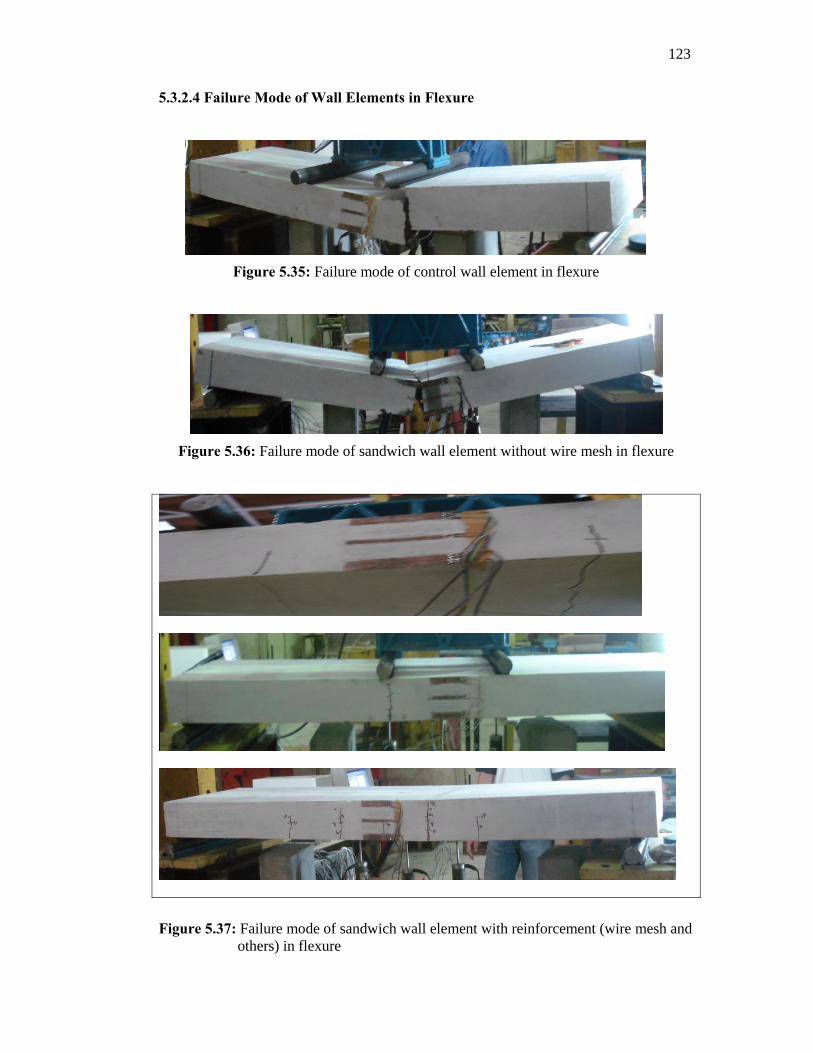
123
5.3.2.4 Failure Mode of Wall Elements in Flexure
Figure 5.35: Failure mode of control wall element in flexure
Figure 5.36: Failure mode of sandwich wall element without wire mesh in flexure
Figure 5.37: Failure mode of sandwich wall element with reinforcement (wire mesh and others) in flexure
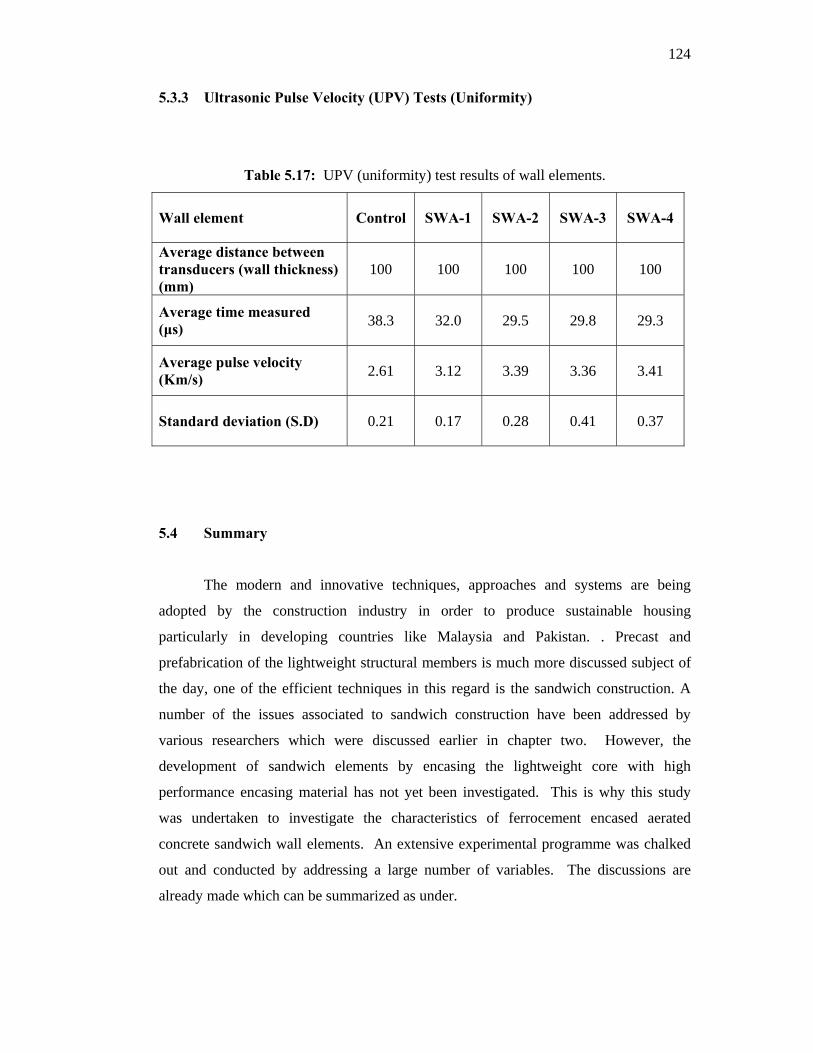
124
5.3.3 Ultrasonic Pulse Velocity (UPV) Tests (Uniformity)
Table 5.17: UPV (uniformity) test results of wall elements.
Wall element Control SWA-1 SWA-2 SWA-3 SWA-4
Average distance between transducers (wall thickness) (mm)
100 100 100 100 100
Average time measured (µs) 38.3 32.0 29.5 29.8 29.3
Average pulse velocity (Km/s) 2.61 3.12 3.39 3.36 3.41
Standard deviation (S.D) 0.21 0.17 0.28 0.41 0.37
5.4 Summary
The modern and innovative techniques, approaches and systems are being
adopted by the construction industry in order to produce sustainable housing
particularly in developing countries like Malaysia and Pakistan. . Precast and
prefabrication of the lightweight structural members is much more discussed subject of
the day, one of the efficient techniques in this regard is the sandwich construction. A
number of the issues associated to sandwich construction have been addressed by
various researchers which were discussed earlier in chapter two. However, the
development of sandwich elements by encasing the lightweight core with high
performance encasing material has not yet been investigated. This is why this study
was undertaken to investigate the characteristics of ferrocement encased aerated
concrete sandwich wall elements. An extensive experimental programme was chalked
out and conducted by addressing a large number of variables. The discussions are
already made which can be summarized as under.
125
• A remarkable enhancement in compressive strength was obtained due to the
encasement of lightweight aerated concrete.
• Although, the compressive strength of the sandwich increased with the increased
number of mesh layers but the relation between the two was not proportional. It
was significant with one and two layers of square and chicken wire meshes
respectively and its effect diminished with the further addition wire mesh layers.
This led to the conclusion that the in terms of compressive strength, the number
of wire mesh layers should be kept at possible minimum number.
• Both the wire meshes; square and chicken wire mesh contributed to the
enhancement of strength; however the enhancement due to square wire mesh
within the FC encasement was more significant to that exhibited by chicken wire
mesh. This observation was in agreement to the previous investigations
reported. This inferred that square wire mesh could be suitable choice between
square and chicken wire mesh in terms of compressive strength.
• The FC encasement direction to the loading direction was found to be as primary
parameter towards the compressive strength enhancement. The enhancement in
compressive strength could only be expected when FC encasement is hold
parallel to the loading direction, otherwise it causes the deterioration of
compressive strength when hold perpendicular to the loading direction.
• Overall unit weight of the sandwich specimens increased due to the encasement.
However, it was independent of any significant effect of wire mesh layers
incorporated in the FC encasement.
• The unit weight was emerged to be a function of core-encasement volumetric
ratio. In other words, the core volume governs the over all unit weight of the
sandwich elements, particularly when those are produced by encasing
lightweight core material where the difference of unit weight between core and
an encasement material is more pronounced.
126
• The classification of sandwich elements based on their weight entirely depends
upon the core-encasement volumetric ratio when lightweight core is encased
with high density FC encasement. Higher the c-e ratio; lower the overall unit
weight of sandwich. In our case, c-e value 2.5 rendered sandwich element to be
classified as lightweight sandwich element.
• Nevertheless, it was worth noting that, due to the encasement, the compressive
enhancement was manifold as compared to the increase in unit weight of
corresponding specimen, when both, the compressive strength and unit weight
increase of same sandwich specimen were compared to the corresponding
control specimen. This implied the suitability of ferrocement encasement in
terms of compressive strength versus unit weight. Where, the compressive
strength enhancement is the major parameter without compromising on unit
weight at large.
• All the control and sandwich specimens without wire mesh exhibited sudden
and brittle failure under compression. However, the sandwich specimens with
wire mesh layers showed significant ductile behaviour where the fine cracks
appeared at about 60%-80% of their ultimate load depending on the type and
layers of wire mesh. This led to the conclusion that, FC encasement over
aerated concrete transforms the otherwise brittle failure mode of aerated
concrete in a ductile failure due to the presence of wire mesh within ferrocement
box. This property is more significant when the design of structural elements in
earthquake prone areas like Pakistan, is in consideration.
• A residual compressive strength of the order of 20%-30% of the corresponding
ultimate load was obtained for FC sandwich specimens which imparts the some
sort of the warning period prior to the complete failure of the elements.
• Identical behavioural trends to that reported for sandwich specimens in
compression were observed when sandwich prism beams were tested in flexure
127
(bending). However, the contribution of number of mesh layers towards MOR
(flexural strength) was more significant compared to that in case of compressive
strength. Where, MOR increased with the increase in mesh layers.
Nevertheless, the effectiveness of mesh layers was dependent on the encasement
thickness, because a large number of mesh layers caused the congestion of the
reinforcement in thin FC section leaving no room for quality casting leading
towards the deterioration in compressive strength. Thus, it was concluded that
the number of mesh layers should be optimized depending upon the thickness of
FC encasement even in the case of flexural strength where steel reinforcement
plays key role in the performance of structural element.
• Water absorption and ISAT values of aerated concrete were drastically reduced
due to its FC encasement. In fact, water absorption and ISAT are considered as
the measure of porosity and permeability. Hence, FC encasement transformed a
very poor aerated concrete into a good material in terms of water absorption,
porosity and permeability and has great viability to be employed in aggressive
and hostile environments like Malaysia.
• Slenderness ratio and aspect ratio factors were found to influence the ultimate
load of sandwich wall elements in compression and these factors should be
accounted when the development of a mathematical model to predict the
ultimate compressive load, is in consideration.
• During the testing of wall elements in compression, the incorporation of steel
bar reinforcement in the direction of loading showed its contribution towards the
ultimate load. However, this parameter could further be investigated properly
with different variables like diameter of bar and the spacing. Nevertheless, it is
important to note that, as the bars were embedded inside the wire mesh without
lateral links but no bending of steel bars was observed in any case. This was
because of the uniform and closely distributed wires of mesh in transverse
direction which acted as the lateral reinforcement around the bar. This deduced
the good combination of wire mesh and steel bar reinforcement in sandwich wall
elements in compression.
128
• The axial and lateral deformations of wall elements in compression were almost
linear in all the cases. However, their magnitude in case of sandwich specimens
without wire mesh was greater than those of the sandwich specimens with wire
mesh. For FC sandwich specimens wire mesh arrested the deformation of the
wall elements thus exhibiting some sort of toughness.
• The lateral deformations obtained on the two sides of the sandwich wall
elements were almost very small and uniform in magnitude which is actually the
sign of composite action exhibited by the wall element. This was due to the
wrapping of the wire mesh. This concludes that the FC encasement could be
suitable option to produce sandwich elements which act as composite element in
compression.
• The load-strain relationship of sandwich wall elements tested in bending was
linear up to first crack load. Except the sandwich wall element without wire
mesh, in all other cases, the strains in tension and compression zone were in
good linear trend up o first crack which was broken with further loading beyond
the first crack load. This indicated the composite behaviour of the sandwich
wall elements with wire mesh in flexure up to the first crack. In fact the
composite action is considered as major parameter along with the strength when
sandwich elements are in consideration to design as structural elements. This
concluded the feasibility of FC encasement of aerated concrete to produce
sandwich element where the wire mesh due to the method of wrapping over AC
renders the sandwich element to act as fully composite up to the first crack.
129
CHAPTER 6
CONCLUSIONS AND RECOMMENDATIONS
6.1 General
This chapter presents the conclusions on the findings including the contribution
of the work to the body-of-knowledge and lastly the recommendations for future work.
Since, the experimental study of this research was undertaken in two phases and the
details of the results and their summary have been presented in Chapter 4 and Chapter
5. Detailed conclusions drawn from the results and discussions of each phase have been
presented in the end of respective chapter. At this stage it is appropriate to identify the
major findings in relation to the original objectives of this research.
6.2 Conclusions
A brief account of the conclusions drawn, in the context of original objectives,
set for this research study, is summarized as follows:
(1) To investigate the minimum flow value (flow table) of cement mortar
capable to be poured during the casting of thin ferrocement encasement.
• Mortar with flow value of 136±3% is adequate to cast 6mm-12mm thick
ferrocement encasement.
• Flow value should be inversely adjusted by 3% with 2mm variation in the
thickness of ferrocement encasement.
• Water-binder ratio required to ensure 36±3% mortar flow is adjustable
depending on mix proportion and superplasticizer dosage.
(2) To establish the optimum high workability and high performance mortar
with slag and superplasticizer.
• High workability mortar of compressive strength ranging between 27MPa
and 57MPa were developed
130
• Mortar mix 1:2 with 50% GGBFS and 0.1%, and 0.2% SP were found to be
high performance in terms of compressive strength, strength development,
water absorption and ISAT (permeability).
• Water curing is the suitable curing regime to achieve high performance of
high workability mortars.
(3) To study the behaviour of ferrocement encased aerated concrete sandwich
specimens.
• Encasement of aerated concrete resulted in pronounced enhancement in
compressive strength and flexural strength.
• Square mesh is the better option amongst the square and chicken wire mesh
to incorporate in ferrocement encasement where layer of the square mesh is
the optimum number of layers for specimen in compression.
• Failure mode transformed from pure brittle and sudden mode to the highly
ductile and gradual mode of failure retaining substantial residual strength
also due to the ferrocement encasement.
• Core-encasement (c-e) volumetric ratio governs the strength and density of
the sandwich.
• Ferrocement encasement produces the lateral confinement to the core of the
sandwich leading to the high compressive strength of sandwich.
(4) To investigate the behaviour of ferrocement encased lightweight aerated
concrete sandwich wall elements of relatively large size in compression with
addition flexural and UPV tests.
• Slenderness ratio and aspect ratio affect the load carrying capacity of the
wall elements.
• Lateral and axial deformations of sandwich specimens particularly with wire
mesh remained very small and uniform.
• Steel bars contributed to the ultimate load of sandwich in compression when
embedded inside the wire mesh within the ferrocement encasement.
131
• Sandwich walls exhibited highly composite behaviour up to 90% of their
ultimate load and fist crack loading subjected to compression and bending
respectively.
• High degree of material uniformity attained by the sandwich due to method
of pouring adopted to cast ferrocement encasement.
• Replacement of the conventional labour intensive manual method of
ferrocement elements manufacture with the new mechanized method of the
pouring the high workability mortar altogether with the partial replacement
of cement with industrial byproduct GGBFS leads to the cost effectiveness
of the final product of sandwich wall elements.
(5) To develop mathematical models
(a) Compressive strength of high workability slag cement based mortar
for ferrocement
In all four mathematical expressions were developed.
( )bwfcm 619.86313.9328 −= (A)
( )bwfcm 322.86402.9728 −= (B)
( )bwfcm 427.80364.9028 −= (C)
( )bwfcm 546.85997.9428 −= (D)
Equations A–C predict the compressive strength of high workability OPC,
50%GGBFS and 60% GGBFS mortars with an accuracy of the values up to about 97%.
Equation D is the generalized equation which predicts the compressive strength of high
workability slag cement based mortars. The predicted values were in good agreement
with the experimental values. The average deviation of predicted values was just about
4.6% of the experimental values.
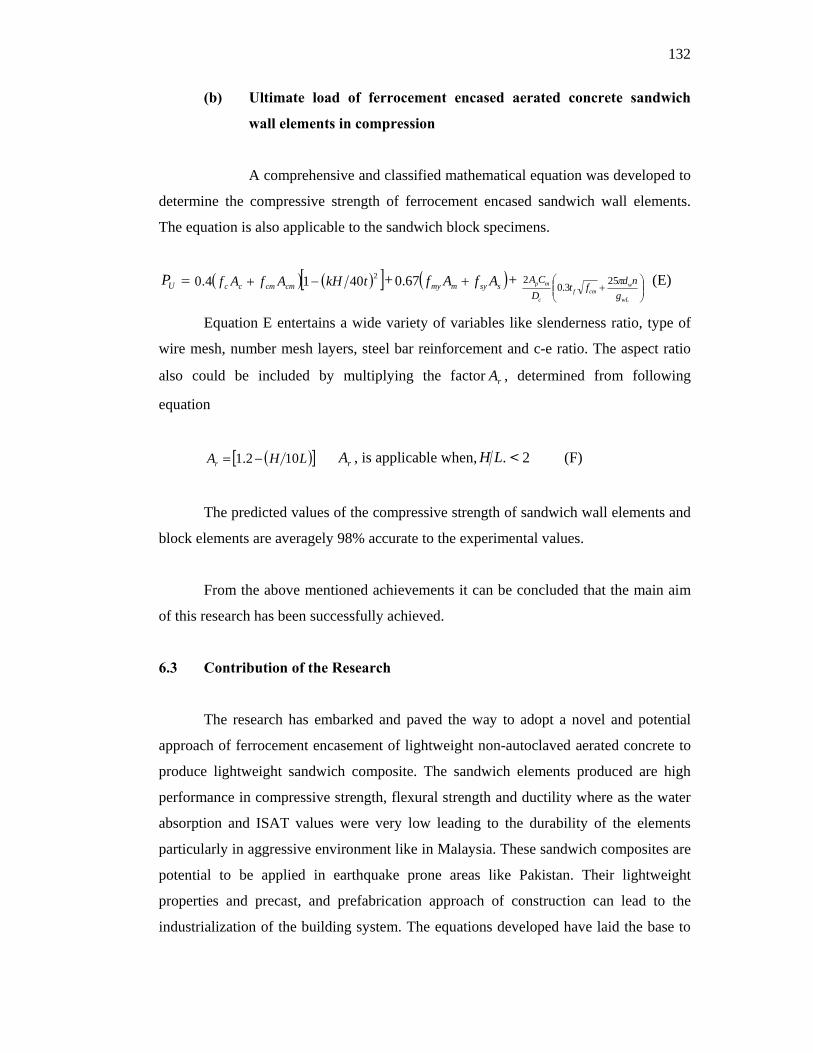
132
(b) Ultimate load of ferrocement encased aerated concrete sandwich
wall elements in compression
A comprehensive and classified mathematical equation was developed to
determine the compressive strength of ferrocement encased sandwich wall elements.
The equation is also applicable to the sandwich block specimens.
=UP ( ) ( )[ ]24014.0 tkHAfAf cmcmcc −+ + ( )ssymmy AfAf +67.0 + ⎟⎟⎠
⎞⎜⎜⎝
⎛+
wL
wcmf
c
mp
gndft
DCA π253.0
2 (E)
Equation E entertains a wide variety of variables like slenderness ratio, type of
wire mesh, number mesh layers, steel bar reinforcement and c-e ratio. The aspect ratio
also could be included by multiplying the factor rA , determined from following
equation
( )[ ]LHAr 102.1 −= rA , is applicable when, LH . < 2 (F)
The predicted values of the compressive strength of sandwich wall elements and
block elements are averagely 98% accurate to the experimental values.
From the above mentioned achievements it can be concluded that the main aim
of this research has been successfully achieved.
6.3 Contribution of the Research
The research has embarked and paved the way to adopt a novel and potential
approach of ferrocement encasement of lightweight non-autoclaved aerated concrete to
produce lightweight sandwich composite. The sandwich elements produced are high
performance in compressive strength, flexural strength and ductility where as the water
absorption and ISAT values were very low leading to the durability of the elements
particularly in aggressive environment like in Malaysia. These sandwich composites are
potential to be applied in earthquake prone areas like Pakistan. Their lightweight
properties and precast, and prefabrication approach of construction can lead to the
industrialization of the building system. The equations developed have laid the base to
133
predict the design values of ultimate loads of encasement mortar and the sandwich
composite in compression without bothering a lot on the experimental studies.
6.4 Recommendations for Future Work
As a result of the work undertaken for this research, it is suggested to extend the
work further with respect to the following aspects,
(a) It is highly recommended that the concept of this study should be extended
towards the development of sandwich elements for their application in floors
and slabs and the extent of the contribution of mesh layers in terms of flexural
strength should be optimized.
(b) Since the steel bar reinforcement was adopted as additional parameter during
this study. A systematic study investigating various variables like diameter of
bars, spacing of bars, is recommended for future work.
(c) It is believed that after a certain value of slenderness ratio, wall elements
experience the lateral instability which affects the load carrying capacity of the
wall elements drastically. Hence, it is highly recommended that an experimental
study based on full height wall elements be planned and the safe limits of the
slenderness ratio against lateral instability of wall elements be characterized
accordingly. Also if necessary, the slenderness factor in the proposed
mathematical model could be modified accordingly.
(d) The mathematical model to predict the compressive strength of high workability
mortars with slag has been developed based on only the results of this research.
The author wishes the further generalization of the model by considering the
effect of other replacement materials like PFA, POFA, and RHA and the slag
replacement levels other than used during this study.
134
REFERENCES
Abang, A.A.A. (1995). Application of Ferrocement as a Low Cost Construction
Material in Malaysia. Journal of Ferrocement. 25(2):123-128.
Abang, A.A.A. (1999). Advances in Construction Systems and Technology.
Proceedings of the Worlds Engineering Congress.99- Specialize Conference on
Industrialized Building System. July 19-22. Kuala Lumpur, Malaysia. UPM. Abdullah, and Mansur, M.A. (2001). Effect of Mesh Orientation on Tensile Response of
Ferrocement. Journal of Ferrocement. 31(4): 289-298. Abdullah, and Takiguchi, K. (2002a). Strength and Behaviour of Concrete Confined by
Ferrocement Boxes. Journal of Ferrocement. 32(3): 193-203.
Abdullah, and Takiguchi, K. (2002b). Strength and Behaviour of Concrete Confined by
Ferrocement Boxes. Journal of Ferrocement. 32(4): 304-314.
ACI Committee 226-87 (1987). Ground Granulated Blast-Furnace Slag as Cementitious
Constituent in Concrete. ACI Materials Journal. 327-342.
ACI Committee 233R (2003). Slag Cement in Concrete and Mortar, American
Concrete Institute, Farmington Hills,ACI 233R-03.
ACI Committee 308 (1998). Recommended Practice for Curing Concrete, MCP,
American Concrete Institute, Farmington Hills, USA, ACI 308-98.
ACI Committee 363 (1984). Satae of the Art report on High strength Concrete, ACI 363
R-84. ACI Materials Journal. 364-41.
ACI Committee 5492R (2004). Report on Thin Reinforced Cementitious Products,
Farmington Hills, Michigan. ACI 5492R-04.
ACI Committee 549R (1997). State-of-the-Art Report on Ferrocement, Manual of
Concrete Practice, ACI, Farmington Hills, Michigan ACI 549R-97. Ahmed, S.F.U. and Nimityogsku,l P. (1998). Improvement of Punching Shear
Resistance in Ferrocement Slabs. Journal of Ferrocement. 28(4): 325-336.
Alkubaisy, M.A. and Jumaat, M.Z. (2002). Punching Shear Strength of Bolted
Ferrocement Sandwich Panels, Journal of Ferrocement. 32(1): 1-17.
Al-Kubaisy, M.A. and Nedwell, P.J. (1999). Behavior and Strength of Ferrocement
Rectangular Beams in Shear. Journal of Ferrocement. 29(1): 1-16
Allen, H.G. (1996). Analysis and Design of Structural Sandwich Panels. London.
Pergamon Press.
135
Al-Noury, S.I and Haq S. (1988). Ferrocement in Axial Tension. Journal of
Ferrocement. 18(2): 111-137.
Al-Rifai, W.N and Mohammad, K.A. (2000). Strength of Ferrocement-Brick Composite
Columns. Journal of Ferrocement. 30(1): 69-83 Al-Rifai, W.N, Al-Shukur, A.H.K. (2001). Effects of Wetting and Drying Cycles in
Fresh Water on the Flexural Strength of Ferrocement. Journal of Ferrocement.
31(2): 101-108.
Al-Rifai, W.N. (2006). Ferrocement Wall: Penetration Testing, Proceedings of Eight
International Symposium and Workshop on Ferrocement and Thin Reinforced
cement Composites. 06-08 February, Bangkok Thailand, IFS, 177-185. Al-Sulaimani, G.J, and Basunbal, I.A. (1991). Behaviour of Ferrocement under Direct
Shear. Journal of Ferrocement. 21(2): 109-117.
American Society for Testing and Materials (1999). Standard Practice for Mechanical
Mixing of Hydraulic Pastes and Mortars of Plastic Consistency. Philadelphia,
ASTM C305-99.
American Society for Testing and Materials (2002). Standard Specifications for
Standard Sand. Philadelphia, ASTM C778-02.
American Society for Testing and Materials (2002) Standard Test Method for Pulse
Velocity Through Concrete. Philadelphia, ASTM C597-02.
American Society for Testing and Materials (2002). Standard Test Method for Flexural
Strength of Concrete (Using Simple Beams with Third-Point Loading)
Philadelphia, ASTM C78-02.
American Society for Testing and Materials (2003). Standard Specifications for
Concrete Aggregates. Philadelphia, ASTM C33-03.
American Society for Testing and Materials (2003) Standard Specifications for flow
Table for Use in Tests of Hydraulic Cement Philadelphia, ASTM C230-03.
American Society for Testing and Materials (2005). Standard Specifications for
Portland Cement, Philadelphia, ASTM C 150-05.
American Society for Testing and Materials (2005) Standard Specifications for Ground
Granulated Blast-Furnace Slag for Use in Concrete and Mortars. Philadelphia,
ASTM C989-05.
American Society for Testing and Materials (2005). Standard Specifications for
Chemical Admixtures for Concrete. Philadelphia, ASTM C494-05a
136
American Society for Testing and Materials (2005). Standard Test Method for
Compressive Strength of Hydraulic Cement Mortars. Philadelphia, ASTM C109-
05.
American Society for Testing and Materials (2006). Standard Specifications for Load
Bearing Concrete Masonry Units. Philadelphia, ASTM C 90-06b.
American Society for Testing and Materials (2006). Standard Test Method for
Linear Drying Shrinkage of Concrete Masonry Units . Philadelphia,
ASTM C426-06.
An, C. (2004). Strength Evaluation of Honeycomb FRP Sandwich Panels with
Sinusoidal Core. Department of Civil and Environmental Engineering West
Virginia University, PhD Thesis.
Araffa, M. and Balaguru, P.N. (2006). Flexural Behaviour of High Strength-High
Temperature Laminate Sandwich Beams. Proceedings of Eight International
Symposium and Workshop on Ferrocement and Thin Reinforced cement
Composites. 06-08 February, Bangkok Thailand, IFS.189-201. Arif, M., Akhtar S., Masood, A., Basi, F. and Garg, M. (2001).. Flexural Behaviour of
Fly Ash Mortar Ferrocement Panels for Low Cost Housing. Journal of
Ferrocement. 31(2): 125-135.
Arif, M., Pamkaj, and Kuasik, S.K. (1999). Mechanical Behavior of Ferrocement
Composites: An Experimental Investigation. Cement and Concrete Composites,
21(4): 301-312.
Arreshvhina, N., Zakaria, F., Warid, H.M. and Roswadi G.S. (2005). Microstructural
Investigations on Slag Cement Based Aerated Concrete. Proceedings of Seminar
Kebangsaan Penyelidikan Kejuruteraan Awam, 5-6 July, JB. Malysia, FKA.UTM.
Arreshvhina, N. (2002). Application of Slag Cement Based Aerated Lightweight
Concrete In Non-Load Bearing Wall Panels. FKA. UTM., Malaysia Masters
Thesis.
Arreshvhina, N. and Zakaria, F. (2002). Drying Shrinkage and Water Absorption of
Slag Cement Based Aerated Lightweight Concrete Wall Panels. Proceedings of
the Research Seminar on Materials and Construction, Johor Bahru.118-134. Ashrabove, A.A. (2006). Structural Behaviour of Eccentrically Loaded Precast
Sandwich Panels. Construction and Building Materials. 20 (9) 713–724.
Austriaco, R.L. (2006). Researches and Innovations on Ferrocement in the New
Millenium: Global perspective. Proceedings of Eight International Symposium
137
and Workshop on Ferrocement and Thin Reinforced cement Composites. 06-08
February, Bangkok Thailand, IFS, 77-86.
Awal, A.S.M.A (1987). Ferrocement: A Unique Material of Construction and Its Use in
Agriculture. Bangladesh Journal of Agricultural Engineering. 1(2): 35-40
Barnett, S.J, Soutsos, M.N., Millard, S.G, and Bungey, J.H. (2006). Strength
development of mortars containing ground granulated blast furnace slag: Effect of
curing temperature and determination of apparent activation energies. Cement and
Concrete Rresearch, 36(3): 434-440.
Bave, G. (1980). Aerated Lightweight Concrete-Current Technology. Proceedings of
the Second International symposium on Lightweight Concretes. London.
Benayoune, A., Samad, A.A.A., Abang, A.A.A. and Trikha, D.N. (2007a). Response of
Precast Reinforced Composite Sandwich Panels to axial Loading. Construction
and Building materials. 21(3): 677-685.
Benayoune, A., Samad, A.A.A., Abang, A.A.A., Trikha, D.N. and Ashrabov, A.A.
(2006). Structural Behaviour of Eccentrically Loaded Precast Sandwich Panels.
Construction and Building Materials. 20 (9): 713-724.
Benayoune, A., Samad, A.A.A., Trikha, D.N., Abang, A.A.A. and. Ellinna, S.H.M.
(2007b). Flexural Behaviour of Pre-Cast Concrete Sandwich Composite Panel-
Experimental and Theoretical Investigation. Construction and Building Materials
In Press, Available online on www.sciencedirect.com. Bhatacharyya, P., Tan, K.H. and Mansur, M.A. (2003). Flexural Moment Capacity of
Ferrocement Hollow Sandwich Panel System. Journal of Ferrocement. 33(3):
183-189.
Bitzer, T. (1997). Honeycomb Technology. London: Chapman and Hall;:
Bottcher, M. and Lange, J. (2006). Sandwich Panels with Openings. Composite
Construction in Steel and Concrete, 186(14): 137-46.
British Standard Institution (1970). Method for Initial Absorption Test. London. BS1881
Part 5.
British Standard Institution (1983). Water Method for Determination of Absorption
Water Immersion Method. London. BS1881 Part 122.
British Standard Institution (1991). Specifications for Portland Cement. London. BS12.
British Standard Institution (1992). Specification for Ground Granulated Blast Furnace
for Use with Cement. London. BS6699.
138
Buekett, J. and Jennings, B.M. (1996). Reinforced Autoclaved Aerated Concrete. The
Concrete Society Technical Report. London. The Concrete Society Limited.
Bush, T.D. and Zhiq, Wu (1998). Flexural Analysis of Prestressed Concrete Sandwich
Panels with Truss Connectors. PCI Journal.43 (5):76–86.
Cabrillac, R., Fiorio, B., Anne-lise, B., Dumontet, H. and Ortola S. (2006).
Experimental Study of the Mechanical Anisotropy of Aerated Concretes and the
Adjustment Parameters of the Introduced Porosity. Construction and Building
Materials. 20(5): 586-295.
Cairncross, C. (1972) Ferrocement Boat Construction. International Marine Publishing
Company, Marine.
Carmichael, J (1986). Pumice Concrete Panels. Concrete International. 8(11): 31–
32.
Christos, G.P (2003). High Temperature Structural Sandwich Panels. The State
University of New Jersey. PhD Thesis.
Einea, A., Salmon, D.C., Tadros, M.K and Culp, T. (1995). Partially Composite
Sandwich Panel Deflection. ASCE Journal of Structural Engineering. 121(4):
778–83.
El Debs, M.K., Machado, J E.F., Hanai, J.B. and Takeya, T. (2000). Ferrocement
Sandwich Walls. Journal of Ferrocement. 30(1): 45-51.
Ergul, Y., Cengiz, D.A., Aleaettin, K. and Hassan, G. (2003). Strength and Properties of
Lightweight Concrete Made with Basaltic Pumice and Fly Ash. Materials Letters.
57(15): 2267-2270.
Escalante, J.I., Go´mez, L.Y., Johal, K.K., Mendoza, G., Mancha,H. and Me´ndez, J.
(2001). Reactivity of Blast-Furnace Slag in Portland Cement Blends Hydrated
Under Different Conditions. Cement and Concrete Research 31(10):
1403– 1409.
Eswaranmoorthi, P. and Subramanian, K. (2006). Impact Resistance of Fibrous
Ferrocement Slabs. Proceedings of Eight International Symposium and Workshop
on Ferrocement and Thin Reinforced cement Composites. 06-08 February,
Bangkok Thailand, IFS, 133-140.
European Standards (1993). Determination of the Compressive Strength of Autoclaved
Aerated Concrete. London. EN 679.
139
Fabiana, L.D.O. and De Hanai, J.B. (2002). Experimental Analysis of Concrete Block
Masonry Walls with Rectangular Openings Strengthened by Ferrocement
Overlays. Journal of Ferrocement. 32(3): 179-191.
Feichtinger, K.A. (1998). Test Methods and Performance of Structural Core Materials-I.
Static Properties. Fourth Annual Aasm International/Engineering Society of
Detroit Conference. Michigan, Detroit.1-11. Frostig, Y. and Thomson, O.T. (2005). Non-Linear Behavior of Delaminated
Unidirectional Sandwich Panels with Partial Contact and a Transversely Flexible
Core. International Journal of Non-Linear Mechanics 40 (5): 633 – 651.
Grove, S.M., Popham, E. and Miles M.E. (2006). An Investigation of the Skin/Core
Bond in Honeycomb Sandwich Structures Using Statistical Experimentation
Techniques. Composites. Part A 37(5) 804–812.
Hago, A.W., Al-Jabri, K.S., Al-Naumi, A.S., Al-Moqbali, H., and Al-Kubaisy, M.A.
(2005). Ultimate and Service Behavior of Ferrocement Roof Slab Panels.
Construction and Building Materials. 19(1): 31-37.
Hanecka, K., Koronthalyova, O. and Matiasovsky, P. (1997). The Carbonation of
Autoclaved Aerated Concrete. Cement and Concrete Research. 27(4): 589-599
Hawalder, M.N.A, Mansur, M.A. and Rahman, M. (1990). Thermal Behaviour of
Ferrocement. Journal of Ferrocement. 20(3): 231-239. Hossainan, M.Z. and Inoue (2000). A Comparison of the Mechanical Properties of
Ferrocement Elements under Compression for Square and Chicken Meshes.
Journal of Ferrocement. 30(4): 319-343.
Houst, Y., Alou, F., and Witman, FH. (1983). Influence of Moisture Content on the
Mechanical Properties of Autoclaved Aerated Concrete. Autoclaved Aerated
Concrete. Moisture and Properties. Elsevier. Amsterdam 219-233.
International Ferrocement Society, (2001). Ferrocement Model Code. Thailand, IFS-
10. Isu, N., Ishida, H. and Mitsuda, T. (1995). Influence of Quartz Particle Size on the
Chemical and Mechanical Properties of Autoclaved Aerated Concrete-
Tobermorite Formation. Cement and Concrete Research. 25(2): 243-248.
Juan, C., Serrano, P., Uday K., Vaidya, A., and Nasim U. (2007). Low Velocity Impact
Response of Autoclaved Aerated Concrete/CFRP Sandwich Plates. Composite
Structures. 80 (4): 621-630.
140
Kandaswamy, S. and Ramachandraiah, A. (2002). Sound Transmission Performance on
Ferrocement Panels. Journal of Ferrocement. 32(1): 59-67. Khan, B.M., Ong, K.C.G. and Paramasivam, P.(1999). Behavior of Ferrocement Slabs
under Low velocity Projectile Impact. Journal of Ferrocement. 29(4): 255-266.
Korkmaz, H.H. and Tankut, T. (2005). Performance of Precast Concrete Beam-to-Beam
Connection Subject to Reverse Cycling Loading. Engineering Structures. 27(9):
1392-1407.
Kus, H. and Carlson, T. (2003). Micro Structural Investigations of Naturally and
Artificially Weathered Autoclaved Aerated Concrete. Cement and Concrete
Research. 33(9): 1423-1432.
Lee, B.J. and Pessiki, S. (2006). Thermal Behavior of Precast Prestressed Concrete
Three-Wythe Sandwich Wall Panels. AEI, ASCE. 190(3): 1-15.
Levitt, M. (1970). Non Destructive Testing of Concrete by the Initial Surface
Absorption Method. Proceedings of Symposium on Non-destructive Testing f
Concrete and Timber, London. ICE.
Liang, S. and Chen, H.L. (2006). Investigation on the Square Cell Honeycomb
Structures under Axial Loading. Composite Structures. 72 (4): 446–454.
Liborio, J.B.L. and Hanai, J.B. (1992). Ferrocement Durability: Some
Recommendations for Design and Production, Journal of Ferrocement. 22(3):
265-271. Lim, C.H.,.Samad, A.A.A, Abang, A.A.A. and Trikha, D.N. (2000). Behaviour of
Ferrocement Shallow Box Beams as Wall Elements. Journal of Ferrocement.
30(1): 19-30.
Lim, C.T.E., Paramasivam, P., and ONG, K.C.G. (2001). Push Out Shear Strength of
Ferrocement-Concrete Interface, Journal of Ferrocement, 31(4): 299-310
Lim, J.H and Kang, K. (2006). Mechanical Behavior of Sandwich Panels with
Tetrahedral and Kagome Truss Cores Fabricated from Wires. International
Journal of Solids and Structures. 43 (17) 5228–5246.
Lindasy, A.D.M. (2003). Partially Composite Sandwich Panels. University of Alberta.
Master Thesis.
Loudun, A.G. (1983). The Effect of Moisture Content on Thermal Conductivity,
Autoclaved Aerated Concrete, Moisture and Properties, RILEM International
Symposium On Autoclaved Aerated Concrete, Swiss Developments In Civil
Engineering, 6:131-142.
141
Mahfuz, H., Muhammad, S.I., Vijaya,,K.R, Mrinal, C.S. and Shaik J. (2004). Response
of Sandwich Composites with Nanophased Cores under Flexural Loading.
Composites: Part B Engineering 35 (6-8): 543–550.
Mahyuddin, R. and Wahab, I. (1994). Ferrocement in Affordable Housing Construction,
the Malaysian Experience. Journal of Ferrocement. 24(1): 17-22
Malaysian Standards (2003) Standard Specifications for Portland Cement: Ordinary
and Rapid Hardening. Malaysia MS 522: Part I.
Malaysian Standards (1995). Standard Specifications for Ground Granualted Blast
Furnace Slag for use with Portland Cement. Malaysia, MS 1387-1993.
Mannan, M.A, Basri, HB, Zain, M.F.M.and Islam, M.N. (2002). Effect of Curing
Conditions on the Properties of OPS-Concrete. Building and Environment
37(11):1167–71.
Mansur, M.A. (1988). Ultimate Strength Design of Ferrocement in Flexure. Journal of
Ferrocement 17(4): 385-395.
Mansur, M.A. and Paramasivam, P. (1986). Cracking Behaviour and Ultimate Strength
of Ferrocement in Flexure. Journal of Ferrocement. 16(4): 405-415.
Mansur, M.A. and Abdullah (1998). Constitutive Laws of Ferrocement under Biaxial
Tension-Compression. Journal of Ferrocement. 28(1): 1-25. Mansur, M.A. and. Kiritharan, T. (2001). Shear Strength of Ferrocement Structural
Sections, Journal of Ferrocement. 31(3): 195-211.
Mansur, M.A., Ahmed, I. and Paramasivam, P. (2001). Punching Shear Strength of
Simply Supported Ferrocement Slabs. ASCE Journal of Materials in Civil
Engineering. 13(6): 418-426. Mansur, M.A., and Ong, K.G.C. (1987). Shear Strength of Ferrocement Beams. ACI
Structural Journal. 84(1):10-17.
Mansur, M.A., and Ong, K.G.C. (1991). Shear Strength of Ferrocement I-Beams. ACI
Structural Journal. 88(3): 458-464.
Mansur, M.A., Paramasivam, P., Wee, T.H., and Lim, H.B. (1996). Durability of
Ferrocement-a Case Study. Journal of Ferrocement. 26(1): 11-19.
Mantei, D.G. (1994). Investigation into the Hydraulic Activity of Five Granulated Blast
Furnace Slags with Eight Different Portland Cements. ACI Materials Journal.
September-October: 471-477.
142
Masood, A., Arif, M., Akhtar, S. and Haque, M. (2003). Performance of Ferrocement
Panels in Different Environments. Cement and Concrete Research.
33(4): 555-562. Mehta, P.K (1980). Durability of Concrete in Marine Environment-A Review.
Performance of Concrete in Marine Environment. ACI, Detroit, 1-20.
Methews, M.S., Sudhakumar, J. and Thomas, A.V. (1992). Behaviour of Ferrocement
Roofing Panels under Periodic Heat Flow Conditions. Journal of Ferrocement.
22(2): 125-133. Mirza, J., Mirza, M.S. and Laponite, R. (2002). Laboratory and Field Performance of
Polymer-Modified Cement-Based Repair Mortars in Cold Climates. Construction
and Building Materials. 16: 365-374. Montesinos, G.P. and Naaman, A.E. (2004). Parametric Evaluation of the Bending
Response of Ferrocement and Hybrid Composites with FRP Reinforcements.
Journal of Ferrocement. 34(2): 341-352.
Mostafa, N.Y. (2005). Influence of Air-Cooled Slag on Physicochemical Properties of
Autoclaved Aerated Concrete. Cement and Concrete Research. 35(7): 1349-
1357. Mouli, M. and Khelafi, H. (2006). Strength of Short Composite Rectangular Hollow
Section Columns Filled with Lightweight Aggregate Concrete. Engineering
Structures. Article in Press, Available Online on www.sciencedirect.com.
Naaman, A.E. (2001). Ferrocement and Thin Fiber Reinforced Cement Composites:
Looking Back, Looking Ahead. Journal of Ferrocement. 31(4): 267-280.
Naaman, AE. (2000). Ferrocement and Laminated Cementitious Composites. Ann
Arbor, Michigan, USA: Techno Press.
Narayanan, N. and Ramamurthy, K. (2000a). Structure and Properties of Aerated
Concrete: A Review. Cement and Concrete Composites. 22(5): 321-329.
Narayanan, N. and Ramamurthy, K. (2000b). Micro Structural Investigation on Aerated
Concrete. Cement and Concrete Research. 30(3): 457-464.
Nasim, U., Shelar, V.K. and Fouad, F. (2006). Impact Response of Autoclaved Aerated
Concrete/FRP Sandwich Structures. Structures Congress USA. ASCE; 201-214.
Nedwell, P.J. (2000). Ferrocement Research at UMIST. Journal of Ferrocement. 30(4):
379-388.
Nedwell, P.J. (2002). National Progress Report –UK. Journal of Ferrocement,
32(4):333-339.
143
Nemat-Nasser, S., Kang, W.J, Mc Gee, J.D., Guo, E.G. and Isaacs (2007). Experimental
Investigation of Energy-Absorption Characteristics of Components of Sandwich
Structures. International Journal of Impact Engineering, 34(6): 1119-1146.
Nervi, M. (1981). Ferrocement Applications in the Developing Countries. Proceedings
of International symposium on Ferrocement, Edited by G.oberti and S.P. Shah,
Bergamo Italy. IFS. A49-A51.
Neville, A.M. (2003). Properties of Concrete. 4th Edition, Essex ,England. Pearson
Education Limited.
Onet, T., Magureanu, C. and Vescan, V. (1992). Aspects Concerning the Behavior of
Ferrocement in Flexure, Journal of Ferrocement. 22(1): 1-9. Paramasivam, P and Santosh, S. (2006). Behaviour of Steel-FRC Sandwich Plates under
Hard Lateral Impact. Proceedings of Eight International Symposium and
Workshop on Ferrocement and Thin Reinforced cement Composites. 06-08
February, Bangkok Thailand, 203-216.
Paramasivam, P. and Ravindrarajah, S.R. (1988). Effect of Arrangements of
Reinforcements on Mechanical Properties of Ferrocement. ACI Structural
Journal. 85(5): 3-11.
Paramasivam, P., Ong K.C.G., Tan, K.H., and Lee, S.L. (1990). Rainwater Storage
Using Ferrocement Tanks in Developing Countries. Journal of Ferrocement.
20(4): 377-384.
Parmasivam, P. and Tan, K.H. (1993). Punching Shear Strength of Ferrocement Slabs.
ACI Structural Journal. 90(3): 294-301.
PCI Committee (1997). Pre-Cast Concrete Sandwich Wall Panels, State of the Art of
Precast/Prestressed Sandwich Wall Panels. PCI 97 PCI Journal. 42(2): 92–133.
Pheerphan, T., Joyklad, P., and Pichai, N. (2006). Experimental Study on Blast Load
Resistance of Ferrocement Panels. Proceedings of Eight International Symposium
and Workshop on Ferrocement and Thin Reinforced cement Composites. 06-08
February, Bangkok Thailand, IFS, 355-364.
Pillai, S.U. and Parthasarathy, C.V. (1977). Ultimate Strength and Design of Concrete
Walls. Building Environment. 9: 12:25.
Prasad, S. (1993). Investigation of Debonding and Crack Kinking in Foam Core
Sandwich Beams. College of Engineering, Florida Atlantic University, Florida,
Masters Thesis.
144
Precast/Prestressed Concrete Institute (1985). Design Handbook-Precast And
Prestressed Concrete. Third Edition, Chicago, PCI-85.
Precast/Prestressed Concrete Institute (1989). Architectural Precast Concrete. Chicago,
PCI-89.
Rajamane, N.P. Ramachandarmurthy, D.S and Ravi, S. (2003). Application of
Ferrocement and Polymeric Materials for Repair of Corrosion Damaged
Hyperboloid Overhead Water Tank Structure, Journal of Ferrocement. 33(1): 43-
54.
Rajesh, G. K. (2001). Behaviour of High Strength Concrete Confined With Ferrocement
Shell in Addition to Lateral Ties. Journal of Ferrocement. 31(3): 213-222.
Rao, P.K. (1992). Stress-Strain Behavior of Ferrocement Elements under Compression.
Journal of Ferrocement. 22(4), 343-352.
Rao, K.C.B. and Rao, K.A. (1986). Stress-Strain Curve in Axial Compression and
Poisson’s Ratio of Ferrocement. Journal of Ferrocement. 16(2): 117-128. RILEM. (1993). Autoclaved Aerated Concrete – Properties, Testing And Design.
Recommended Practice. , London. E&FN SPON Rivas, H.W. (1994). Low Cost
Housing Built with Ferrocement Precast Elements. Journal of Ferrocement. 24(1):
29-34.
Russo, A., and Zuccarello, B. (2006). Experimental and Numerical Evaluation of The
Mechanical Behaviour of GFRP Sandwich Panels. Composite Structures Article
in Press. Available Online on www.Sciencedirect.com.
Salimullah, M. (1994). Ferrocement Roofing Elements: The Solution of the Middle and
Low Income Housing-The Bangladesh Experience. Journal of Ferrocement.
24(1): 51-56.
Santosh, S., Alwis, W..A.M. and.Paramasiwam, P. (2003). Steel-Ferrocement Sandwich
Plates Under Hard Lateral Impact. Journal of Ferrocement. 33(1): 29-41.
Schubert, P. (1983). Shrinkage Behavior of Aerated Concrete, Autoclaved Aerated
Concrete, Moisture and Properties. Proceedings of RILEM International
Symposium On Autoclaved Aerated Concrete, Swiss Developments in Civil
Engineering Switzerland, RILEM 6: 207-218.
Seckin, M. and Fu, H.C. (1990). Beam–Column Connections in Precast Reinforced
Concrete Construction. ACI Structural Journal; 87(3): 252–61.
Sehu, D.R. (2000). Flexural Behaviour of Ferrocement Confined Reinforced Concrete
(FCRC) Simply Supported Beams, Journal of Ferrocement. 30(3): 261-274.
145
Serrano, P. J.C, Uday, K.V. and Nasim, U. (2007). Low Velocity Impact Response of
Autoclaved Aerated Concrete/CFRP Sandwich Plates. Composite Structures.
80(4): 621-630.
Shi, C. (2004). Steel-Slag-Its Production, Processing, Characteristics and Cementitious
Properties. Materials in Civil Engineering. 16(3): 230-236.
Somayaji, S. and Naaman, A.E. (1981). Stress-Strain Response and Cracking of
Ferrocement in Tension, Journal of Ferrocement. 11(2): 127-142. Soubra, K, Wight, J.K. and Naaman, A. E. (1991). Fiber Reinforced Concrete Joints for
Precast Construction in Seismic Areas. ACI Structural Journal. 88(1): 214–21.
Soubra, K, Wight, J.K. and Naaman, A. E. (1993). Cyclic Response of Fibrous Castin-
Place Connections in Precast Beam–Column Subassemblies. ACI Structural
Journal. 90(3): 316–23.
Suksawang, N., Nassif, H.H. and Sanders, M. (2006). Analysis of Ferrocement-
Laminated Concrete Beams. Proceedings of Eight International Symposium and
Workshop on Ferrocement and Thin Reinforced cement Composites. 06-08
February, Bangkok Thailand, IFS, 141-150. Sun, H.L., (1999). Corrosion Protection of Reinforcement in Concrete using Galvanized
Steel Bar and Blended Cements, FKA, UTM Master Thesis.
Suresh, V. (2004). Application of Ferrocement for Cost-Effective Building
Construction. Journal of Ferrocement. 34(4): 445-455.
Swamy, R.N. (1989). Superplasticizers and Concrete Durability, Superplasticizers and
other Chemical Admixtures in Concrete. Proceedings of Third International
Conference Ottawa, Canada: 361-382.
Swamy, R.N. and Ammar, B. (1990). Some Engineering Properties of Slag Concrete as
Influenced by Mix Proportioning and Curing. ACI Materials Journal. 87(3): 210-
220.
Swamy, R.N., and Shaheen, Y.B.I. (1990). Tensile Behaviour of Thin Ferrocement
Plates. Proceedings of Thin-Section Fiber Reinforced Concrete and Ferrocement,
USA. American Concrete Institute, Detroit, MI.
Tada, s. and Nakano, S. (1983). Micro Structural Approach to Properties of Moist
Cellular Concrete, Moisture and Properties. Amsterdam: Elsevier, 71-89.
Takiguchi, K. and Abdullah (2000). Experimental Investigations on Ferrocement as an
Alternative Material to Strengthen Reinforced Concrete Columns Journal of
Ferrocement. 30(2): 177-190.
146
Takiguchi, K.and Abdullah (2004). Ferrocement as Strengthening and Repairing
Material for R/C Columns. Journal of Ferrocement. 34(4): 433-444. Tat, L.S and Qian, H C. (2000). Elastic Stiffness Properties and Behaviour of Truss-
Core Sandwich Panel. ASCE Journal of Structural Engineering. 126(5): 552-
559.
Thandavamoorthy, T.S. (2000) Ferrocement Jacketing for the Repair of Offshore
Platforms. Journal of Ferrocement. 30(4): 363-378.
Villanueva, GR and Cantwell, W.J. (2004). The High Velocity Impact Response of
Composite and FML-Reinforced Sandwich Structures. Composite Science and
Technology 64(1): 35-54. Waleed, A.T., ,Jaafar M.S., Razali, M., Kadir, A., Abang, A.A.A., Trikha, D.N. and
Najm (2004). Development of an Innovative Interlocking Load Bearing Hollow
Block System in Malaysia. Construction and Building Materials. 18(6): 445-
454.
Waliuddin, A.M and Rafeeqi, S.F.A. (1994). Study of the Behaviour of Plain Concrete
Confined with Ferrocement. Journal of Ferrocement. , 24(2): 139-151
Witman, F.H. (1983). Development in Civil Engineering; Autoclaved Aerated Concrete,
Moisture and Properties. Elsevier; Netherlands.
Xiong, J.G., and Singh, G. (1997). Review of the fatigue Behaviour of Ferrocement in a
Corrosive Environment, Journal of Ferrocement. 27(1): 7-18. Zakaria, F. (1997). Engineering Properties and Behaviour of Fiber Reinforced Slag
Cement Mortar. FKA, UTM, Malaysia. PhD Thesis.
147
LIST OF PUBLISHED PAPERS
A. Journal Papers
1. Noor Ahmed, M., Salihuddin R.S., and Mahyuddin R. (2007) “Performance of
High Workability Slag-Cement Mortar for Ferrocement, Building and
Environment, 42(7): 2710-2717.
2. Noor Ahmed, M., Salihuddin R.S., and Mahyuddin R. (2007) “Ferrocement
Encased Lightweight Aerated Concrete: A Novel Approach to Produce
Sandwich Composite”, Materials Letters, 61(19-20): 4035-4038.
3. Noor Ahmed, M., Salihuddin R.S., and Mahyuddin R. (2007) “Study of
Flowability and Strength of Ferrocement Mortar”, Mehran University
Research Journal of Engineering and Technology, 26(2): 157-166.
4.. Noor Ahmed, M., Salihuddin R.S., and Mahyuddin R. (2006) “Lightweight
Aerated Concrete Incorporating Various Percentages of Slag and PFA”,
Journal of Applied Sciences, 6(7):560-1565.
5. Noor Ahmed, M., and Salihuddin S.R. (2006) “Ferrocement: A Versatile
Composite Structural Material” 2006, Mehran University Research Journal of
Engineering and Technology, 25(1): 9-18.
6. Noor Ahmed, M., and Salihuddin S.R. (2006) “Study of Ground Granulated
Blast Furnace Slag as Cementitious Material In Mortar Mix”, Mehran
University Research Journal of Engineering and Technology, 25(2): 89-96.
7. Noor Ahmed, M., Salihuddin R.S., and Mahyuddin R. (2006) “Ferrocement
Encased Lightweight Aerated Concrete Sandwich with Variable Core Size
and Wire Mesh Layers”, Journal of Ferrocement, Accepted for Publication.
8. Noor Ahmed, M., Salihuddin R.S., and Mahyuddin R. (2006) “Strength and
Behaviour of Lightweight Ferrocement-Aerated Concrete Sandwich
Blocks”, Malaysian Journal of Civil Engineering, 18(2): 99-108.
148
B. Conference Papers
9. Noor Ahmed, M., Salihuddin R.S., and Mahyuddin R. (2006) “Strength and
Behaviour of Aerated Concrete Encased with Ferrocement Box”,
Proceedings of Ferro-8, 8th International Symposium and Workshop on
Ferrocement and Thin Reinforced Cement Composites, Bangkok, Thailand,
pp.153-164.
10. Noor Ahmed, M., Salihuddin R.S., and Mahyuddin R. (2006) “Behaviour of
Ferrocement-Aerated Concrete Sandwich Prism Beams”, Proceedings of
6th Asia Pacific Structural Engineering and Construction Conference (APSEC
2006), Kuala Lumpur, Malaysia.
11. Noor Ahmed, M., Salihuddin R.S., Mahyuddin R, and Leney S.J. (2006)
“Suitability of MBC Mortars as Skin to Produce Sandwich Blocks with
Aerated Concrete”, Proceedings of SEPKA 2006, National Seminar on Civil
Engineering Research, Johor, Malaysia, S6: 1-10.
12. Noor Ahmed, M., Salihuddin R.S., and Mahyuddin R. (2006) “Non-Autoclaved
Lightweight Aerated Concrete With PFA And GGBFS”, NRMCA
International concrete convention, Genting Highlands.
13. Noor Ahmed, M. and Salihuddin R.S. (2005) “Evolution of Cement - Based
Composites”, Proceedings of Third International conference on Innovation in
Architecture, Engineering and Construction (AEC), 15-17 June, Rotterdam,
Netherlands. 1: 303-310.
14. Noor Ahmed, M., Salihuddin R.S., and Mahyuddin R. (2005) “Flow
Characteristics of Mortar Mix for Ferrocement”, 2005, Proceedings of Seminar
Kebangsaan Penyelidikan Kejuruteraan Awam, SEPKA 2005, FKA, UTM,
Malaysia, pp. 489-497.