Embed Size (px)
Citation preview

Development of Knowledge Within a Chemical-Toxicological Database
to Formulate Novel Computational Approaches for Predicting Repeated Dose
Toxicity of Cosmetics-Related Compounds
Aleksandra Mostrag-Szlichtyng
March 2017
A thesis submitted in partial fulfilment of the requirements of Liverpool John Moores
University for the degree of Doctor of Philosophy
Acknowledgements
I would like to thank my director of studies, Prof Mark T. Cronin, and my supervisors
and advisors, Dr Chihae Yang, Dr Judy C. Madden, and Prof James Rathman for support,
guidance, and feedback throughout the course of my doctoral studies.
I would also like to thank Prof Vessela Vitcheva (Medical University, Sofia, Bulgaria
and Altamira LLC, Columbus, OH) for valuable discussions during toxicity data harvesting
(described in chapter 6) and liver steatosis data mining (chapter 7).
I would also like to thank all my colleagues from Altamira LLC (Columbus, OH, USA)
and Molecular Networks GmbH (Nüremberg, Germany), as well as my family, for their
continuous support and encouragement.
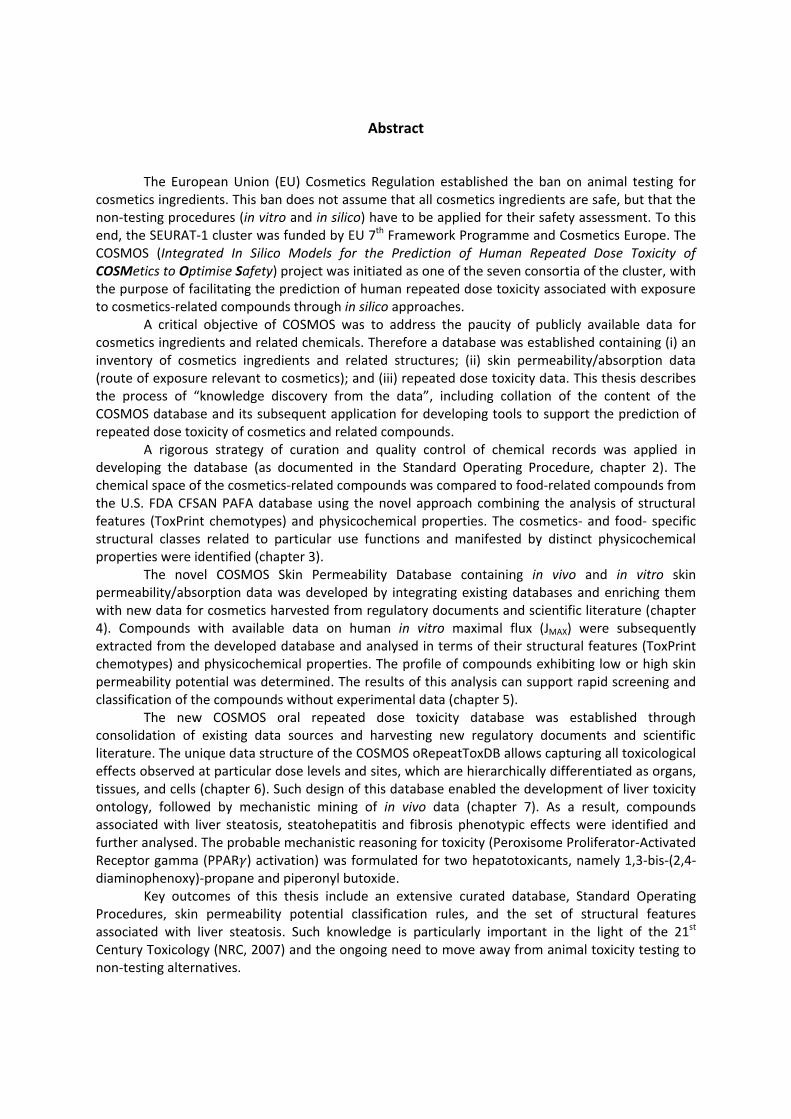
Abstract
The European Union (EU) Cosmetics Regulation established the ban on animal testing for cosmetics ingredients. This ban does not assume that all cosmetics ingredients are safe, but that the non-testing procedures (in vitro and in silico) have to be applied for their safety assessment. To this end, the SEURAT-1 cluster was funded by EU 7th Framework Programme and Cosmetics Europe. The COSMOS (Integrated In Silico Models for the Prediction of Human Repeated Dose Toxicity of COSMetics to Optimise Safety) project was initiated as one of the seven consortia of the cluster, with the purpose of facilitating the prediction of human repeated dose toxicity associated with exposure to cosmetics-related compounds through in silico approaches.
A critical objective of COSMOS was to address the paucity of publicly available data for cosmetics ingredients and related chemicals. Therefore a database was established containing (i) an inventory of cosmetics ingredients and related structures; (ii) skin permeability/absorption data (route of exposure relevant to cosmetics); and (iii) repeated dose toxicity data. This thesis describes the process of “knowledge discovery from the data”, including collation of the content of the COSMOS database and its subsequent application for developing tools to support the prediction of repeated dose toxicity of cosmetics and related compounds.
A rigorous strategy of curation and quality control of chemical records was applied in developing the database (as documented in the Standard Operating Procedure, chapter 2). The chemical space of the cosmetics-related compounds was compared to food-related compounds from the U.S. FDA CFSAN PAFA database using the novel approach combining the analysis of structural features (ToxPrint chemotypes) and physicochemical properties. The cosmetics- and food- specific structural classes related to particular use functions and manifested by distinct physicochemical properties were identified (chapter 3).
The novel COSMOS Skin Permeability Database containing in vivo and in vitro skin permeability/absorption data was developed by integrating existing databases and enriching them with new data for cosmetics harvested from regulatory documents and scientific literature (chapter 4). Compounds with available data on human in vitro maximal flux (JMAX) were subsequently extracted from the developed database and analysed in terms of their structural features (ToxPrint chemotypes) and physicochemical properties. The profile of compounds exhibiting low or high skin permeability potential was determined. The results of this analysis can support rapid screening and classification of the compounds without experimental data (chapter 5).
The new COSMOS oral repeated dose toxicity database was established through consolidation of existing data sources and harvesting new regulatory documents and scientific literature. The unique data structure of the COSMOS oRepeatToxDB allows capturing all toxicological effects observed at particular dose levels and sites, which are hierarchically differentiated as organs, tissues, and cells (chapter 6). Such design of this database enabled the development of liver toxicity ontology, followed by mechanistic mining of in vivo data (chapter 7). As a result, compounds associated with liver steatosis, steatohepatitis and fibrosis phenotypic effects were identified and further analysed. The probable mechanistic reasoning for toxicity (Peroxisome Proliferator-Activated Receptor gamma (PPAR𝛾) activation) was formulated for two hepatotoxicants, namely 1,3-bis-(2,4-diaminophenoxy)-propane and piperonyl butoxide.
Key outcomes of this thesis include an extensive curated database, Standard Operating Procedures, skin permeability potential classification rules, and the set of structural features associated with liver steatosis. Such knowledge is particularly important in the light of the 21st Century Toxicology (NRC, 2007) and the ongoing need to move away from animal toxicity testing to non-testing alternatives.

Abbreviations
ADI Acceptable Daily Intake
ACS American Chemical Society
ANN Artificial Neural Network
AOP Adverse Outcome Pathway
BAS Bulgarian Academy of Science
CAS Chemical Abstract Services
CERES The U.S. FDA CFSAN Chemical Evaluation and Risk Estimation System
CFSAN The U.S. FDA Center for Food Safety and Applied Nutrition
ChEBI Chemical Entities of Biological Interest
CML Chemical Mark-up Language
CMS ID COSMOS database ID
COSING The European Commission’s Cosmetics Ingredients Database
COSMOS Integrated In Silico Models for the Prediction of Human Repeated Dose Toxicity of
Cosmetics to Optimise Safety
CSRML Chemical Subgraphs and Reactions Markup Language
CTAB The atom-bond connection table
DBMS Database management system
DES Data Entry System
DSSTox The U.S. EPA Distributed Structure-Searchable Toxicity Database
EAFUS Everything Added to Food in the United States
EC The European Commission
ECHA European Chemicals Agency
EFSA European Food Safety Authority
EMA European Medicines Agency
EPA The U.S. Environmental Protection Agency
ER The entity relationship
EU The European Union
EURL ECVAM The European Union Reference Laboratory for Alternatives to Animal Testing
FCS Food Contact Substances
FDA The U.S. Food and Drug Administration
GLP Good Laboratory Practice
GO Gene Ontology
GRAS Generally Recognised As Safe
ILSI International Life Sciences Institute
InChI IUPAC International Chemical Identifier
InChIKeys IUPAC International Chemical Identifier Keys
INCI International Nomenclature of Cosmetic Ingredients
IUPAC International Union of Pure and Applied Chemistry
JECFA Joint FAO/WHO Expert Committee on Food Additives
JRC Joint Research Centre
KDD Knowledge discovery from the data
LD proteins Lipid droplet-associated proteins
LJMU Liverpool John Moores University
LO(A)EL The Lowest Observed (Adverse) Effect Level
MDB Microsoft Access file format
MDL Molecular Design Limited

MIE Molecular Initiating Event
MINIS MINImum Study inclusion criteria
MM Molecular Modelling
MoA Mode-of-Action
MOL Molecule File format
MoS Margin of Safety
NO(A)EL The No Observed (Adverse) Effect Level
NTP The U.S. National Toxicology Program
OCSPP The U.S. EPA Office of Chemical Safety and Pollution Prevention
OECD The Organisation for Economic Co-operation and Development
OpenTox An Open Source Predictive Toxicology
OPPTS The U.S. EPA Office of Pollution Prevention and Toxics
oRepeatToxDB COSMOS oral repeated-dose toxicity database
PAFA The U.S. FDA Priority-based Assessment of Food Additives
PBO Piperonyl butoxide
PC Principal Component
PCA Principal Components Analysis
PCPC The U.S. Personal Care Products Council
PPAR𝛾 Peroxisome Proliferator-Activated Receptor gamma
QA Quality Assurance
QC Quality Control
QSAR Quantitative Structure-Activity Relationship
REFNUM Reference Number from the EC COSING database
RN Registry Number
SAR Structure-Activity Relationship
SCCS The European Commission Scientific Committee for Consumer Safety
SDF Structure-Data file format
SED Systemic Exposure Dosage
SEURAT Safety Evaluation Ultimately Replacing Animal Testing
S-IN Soluzioni-Informatiche
SMILES The Simplified Molecular Line Input Entry System
SOM Self-Organising Map
SOP Standard Operating Procedure
TG The OECD Test Guideline
Tox21 Toxicology in the 21st Century
ToxCast The U.S. EPA Toxicity Forecaster
UVCB Unknown or Variable Compositions, Complex Reaction Products and Biological
Materials
WHO World Health Organisation
XLS Microsoft Excel file format
XML Extensible Mark-up Language

Contents
Chapter 1 ....................................................................................................................................... 1 Introduction ................................................................................................................................... 1
1.1. The EU COSMOS project as a response to the current European Cosmetics
Regulation ............................................................................................................................... 1
1.2. Computational alternatives to animal-based toxicity testing ...................................... 2
1.3. The role of a database in reaching the goals of predictive toxicology ......................... 6
1.4. COSMOS database ........................................................................................................ 7
1.5. The present PhD program and its association with the COSMOS project.................. 10
Chapter 2 ...................................................................................................................................... 13 Quality Control of the COSMOS Database Chemical Domain ......................................................... 13
2.1. Background ................................................................................................................. 13
2.1.1. General aspects of the quality of chemical information and structures ........... 13
2.1.2. Compilation of the COSMOS database chemical domain ................................. 16
2.1.3. Final content of the COSMOS database chemical domain ................................ 22
2.2. The aims of chapter 2 ................................................................................................. 23
2.3. Materials and methods ............................................................................................... 23
2.3.1. Development of a controlled vocabulary for compounds and structures
annotations ........................................................................................................................ 23
2.3.2. Development of the Standard Operating Procedure for the Quality Control
(QC) of the COSMOS database chemical domain .............................................................. 24
2.3.3. Conducting the Quality Control (QC) and Quality Assurance (QA) Processes of
the COSMOS database chemical domain .......................................................................... 24
2.4. Results ......................................................................................................................... 25
2.4.1. Controlled vocabularies for chemical compounds and structures annotation . 25
2.4.2. Standard Operating Procedure for the Quality Control (QC) process ............... 30
2.4.3. Results of the QC/QA of the COSMOS database chemical domain ................... 33

2.5. Discussion .................................................................................................................... 34
Chapter 3 ...................................................................................................................................... 36 Chemical Space Analysis of the COSMOS Cosmetics Inventory ...................................................... 36
3.1. Background ................................................................................................................. 36
3.1.1. Curation of chemical structures ......................................................................... 37
3.1.2. Calculation of molecular descriptors ................................................................. 39
3.1.3. Application of relevant statistical methods ....................................................... 40
3.2. The aims of chapter 3 ................................................................................................. 41
3.3. Materials and methods ............................................................................................... 42
3.3.1. Analysed inventories .......................................................................................... 42
3.3.2. Use functions of cosmetics-related compounds ............................................... 42
3.3.3. Structural features (chemotypes) analysis ........................................................ 42
3.3.4. Analysis of physicochemical properties ............................................................. 44
3.4. Results ......................................................................................................................... 45
3.4.1. COSMOS Cosmetics Inventory – use functions analysis .................................... 45
3.4.2. Structural (chemotypes) space analysis ............................................................ 46
3.4.3. Physicochemical properties space analysis ....................................................... 50
3.5. Discussion .................................................................................................................... 54
Chapter 4 ...................................................................................................................................... 57 The COSMOS Skin Permeability Database: Harvesting, Curating and Quality Control of the Data .. 57
4.1. Background ................................................................................................................. 57
4.1.1. Measurement of skin permeability ................................................................... 57
4.1.2. The COSMOS Skin Permeability Database ......................................................... 58
4.1.3. General aspects of the quality of biological data .............................................. 59
4.1.4. Data record reliability in the COSMOS skin permeability database .................. 61
4.2. The aims of chapter 4 ................................................................................................. 63
4.3. Materials and methods ............................................................................................... 64

4.3.1. Data sources ....................................................................................................... 64
4.3.2. Curation and integration of existing databases ................................................. 64
4.3.3. New data harvesting: data entry tool and data entry process .......................... 64
4.3.4. The quality control of COSMOS Skin Permeability Database ............................ 67
4.4. Results ......................................................................................................................... 69
4.5. Discussion .................................................................................................................... 75
Chapter 5 ...................................................................................................................................... 77 Classification of Skin Permeability Potential Following Dermal Exposure to Support the Prediction of Repeated Dose Toxicity of Cosmetics-Related Compounds........................................................ 77
5.1. Background ................................................................................................................. 77
5.1.1. The structure of the skin .................................................................................... 77
5.1.2. Transport of chemicals through the skin ........................................................... 79
5.1.3. Modelling of skin permeability .......................................................................... 81
5.2. The aims of chapter 5 ................................................................................................. 84
5.3. Materials and methods ............................................................................................... 85
5.3.1. Dataset for analysis ............................................................................................ 85
5.3.2. Structural features and physicochemical properties analysis ........................... 86
5.3.3. Defining the classification rules ......................................................................... 87
5.4. Results ......................................................................................................................... 87
5.4.1. Dataset for analysis ............................................................................................ 87
5.4.2. Chemotype analysis ........................................................................................... 88
5.4.3. Physicochemical properties analysis ................................................................. 89
5.4.4. Defining the classification rules ......................................................................... 95
5.5. Discussion .................................................................................................................... 97
Chapter 6 .................................................................................................................................... 100 COSMOS Oral Repeated Dose Toxicity Database (oRepeatToxDB): Harvesting, Curating and Quality Control of the Data ..................................................................................................................... 100
6.1. Background ............................................................................................................... 100

6.1.1. In vivo oral repeated dose toxicity tests .......................................................... 100
6.1.2. COSMOS oRepeatToxDB .................................................................................. 102
6.1.3. Data record reliability in COSMOS oRepeatToxDB .......................................... 103
6.2. The aims of chapter 6 ............................................................................................... 105
6.3. Materials and methods ............................................................................................. 106
6.3.1. Harvesting new oral repeated dose toxicity data for cosmetics-related
compounds ...................................................................................................................... 106
6.3.2. Data entry tool and data entry process ........................................................... 106
6.3.3. The QC/QA of the COSMOS oRepeatToxDB content ....................................... 111
6.4. Results ....................................................................................................................... 112
6.4.1. COSMOS oRepeatToxDB content .................................................................... 112
6.4.2. The QC/QA of COSMOS oRepeatToxDB content ............................................. 115
6.5. Discussion .................................................................................................................. 115
Chapter 7 .................................................................................................................................... 117 Mechanistic, Ontology-based Liver Toxicity Data Mining in COSMOS oRepeatToxDB .................. 117
7.1. Background ............................................................................................................... 117
7.1.1. Overview of the structure and functions of the liver ...................................... 117
7.1.2. Toxicity categories of liver injury: steatosis, steatohepatitis and fibrosis ....... 119
7.2. The aims of chapter 7 ............................................................................................... 121
7.3. Materials and methods ............................................................................................. 121
7.3.1. The development and validation of target organ toxicity ontologies ............. 121
7.3.2. Ontology-based liver toxicity data mining of the COSMOS oRepeatToxDB .... 123
7.3.3. Structural analysis ............................................................................................ 123
7.3.4. Mechanistic reasoning formulation ................................................................. 123
7.4. Results ....................................................................................................................... 124
7.4.1. Ontology-based liver toxicity data mining ....................................................... 124

7.4.2. Structural analysis ............................................................................................ 128
7.4.3. Mechanistic reasoning formulation ................................................................. 130
7.5. Discussion .................................................................................................................. 134
Chapter 8 .................................................................................................................................... 136 Discussion ................................................................................................................................... 136
8.1. Summary of work with respect to the objectives ..................................................... 136
8.1.1. COSMOS Cosmetics Inventory ......................................................................... 136
8.1.2. COSMOS Skin Permeability Database .............................................................. 138
8.1.3. COSMOS oRepeatToxDB .................................................................................. 139
8.2. Final conclusions and perspectives ........................................................................... 140
References .................................................................................................................................. 143

Chapter 1
1
Chapter 1
Introduction
1.1. The EU COSMOS project as a response to the current European Cosmetics Regulation
Since the beginning of time, humans have applied various substances to the skin for
multiple reasons: medicinal, religious, and to enhance beauty. Nowadays, the term
“cosmetics” refers to a range of everyday hygiene and luxury products. According to the
official definition of the European Union (EU), a cosmetic is “any substance or preparation
intended to be placed in contact with the various external parts of the human body (…) or
with the teeth and the mucous membranes of the oral cavity with a view exclusively or
mainly to cleaning them, perfuming them, changing their appearance and/or correcting
body odours and/or protecting them or keeping them in good condition”. The term
“cosmetic product” refers to any cosmetic or mixture of cosmetics, as defined above. The
final formulation of the cosmetic product, which is placed on the market and made available
to the consumer, is named the “finished cosmetic product” (EC, 2003).
Cosmetics and cosmetic products are regulated at the EU level. The Cosmetics
Regulation (which replaced the Cosmetics Directive as of 11 July 2013) established two bans
on animal testing for cosmetics purposes, namely: the testing ban (referring to the testing of
the finished cosmetic products and cosmetic ingredients on animals, completed as of 11
March 2009), and the marketing ban (related to the marketing in the EU of the finished
cosmetic products and ingredients which have been tested on animals, completed as of 11
March 2013) (EC, 2003; EC, 2009). The ban on testing does not assume that all cosmetics
ingredients are safe, but that non-testing procedures (in vitro and in silico) may have to be
applied to assess their safety.
An EU cluster of seven projects, brought together under a Research Cluster entitled
“Safety Evaluation Ultimately Replacing Animal Testing” (SEURAT-1), was formed as a direct
response to this legislation, with the vision of the replacement of traditional animal-based
experiments with predictive toxicology tools. Starting in January 2011, the five-year project
“Integrated In Silico Models for the Prediction of Human Repeated Dose Toxicity of
Cosmetics to Optimise Safety” (COSMOS) was launched within the framework of SEURAT-1,
as a collaboration between major international agencies (the European Commission (EC)

Chapter 1
2
Joint Research Centre (JRC) and the U.S. Food and Drug Administration (FDA)), and a range
of partners from industry and academia (including Altamira LLC, Columbus, OH, USA;
Bulgarian Academy of Science (BAS), Sofia, Bulgaria; Molecular Networks GmbH,
Nüremberg, Germany; Soluzioni Informatiche (S-IN), Vicenza, Italy), and was coordinated by
Prof. M. Cronin from Liverpool John Moores University (LJMU, Liverpool, UK). The COSMOS
project was funded jointly by the EC 7th Framework Programme and Cosmetics Europe (the
industry’s trade association for cosmetics, toiletries and perfumes, formerly Colipa), and
was completed as of December 2015.
The main focus of the COSMOS project was the development of innovative non-
testing (computational) tools and their subsequent integration into publicly available,
transparent workflows to facilitate the complex process of predicting human repeated dose
toxicity associated with exposure to cosmetics and related compounds. At that time, and
still today, the SEURAT-1 cluster was the largest EU initiative undertaken to develop
alternatives to animal-based toxicity testing for the safety assessment of chemicals. The
current PhD program, conducted within the frame of the COSMOS project, supported these
general efforts.
1.2. Computational alternatives to animal-based toxicity testing
In the field of predictive toxicology a range of diverse computational methods is
applied in order to identify, characterise, and evaluate the hazards and risks posed by
chemicals to human health and the environment (Yang et al., 2008; Yang et al., 2009; Hardy
et al., 2012). These methods can be divided into two general categories, namely: prediction
systems (statistical or knowledgebase expert ones) and data mining (Matthews & Contrera,
1998; Johnson et al., 2001; Greene, 2002; Benigni & Zito, 2004; Helma et al., 2004; Yang et
al., 2006). The general principles of the methods relevant to the current thesis are
introduced in the present section1.
Generally, prediction systems are based on the premise that the physicochemical
properties and biological activities of a chemical depend on its intrinsic nature and can be
1 The provided description of the computational methods has been limited to those related to the research conducted within the current PhD program and does not cover all approaches utilised in the COSMOS project (e.g. Threshold of Toxicological Concerns, Physiologically Based Pharmacokinetic Modelling, etc.)

Chapter 1
3
predicted directly from molecular structure or inferred from similar compounds whose
properties and activities are known (Mostrag-Szlichtyng et al., 2010; Worth & Mostrag-
Szlichtyng, 2010). These methods include a range of approaches, such as Structure-Activity
Relationships (SARs), Quantitative Structure-Activity Relationships (QSARs), or chemical
grouping and read-across.
The SAR-based approaches refer to the qualitative identification of the relationship
between molecular structure (or a fragment thereof, i.e. an atom, or group of adjacently
connected atoms in a molecule) and the presence of a particular biological activity, which
may subsequently lead to the determination of structural alerts. SAR can also refer to the
determination of the combination of steric and electronic features of the chemical
compound considered necessary to ensure its intermolecular interaction with a specific
biological target molecule, which results in the manifestation of a particular biological
effect. In this case, SAR may be referred to as a “3-dimensional (3D) SAR” or
“pharmacophore” (Worth & Mostrag-Szlichtyng, 2010).
QSAR-based methods express the relationship quantitatively (frequently in a form of
a regression model) between a biological activity (which may be categorical or continuous)
and one or more molecular descriptor(s), which describe chemical structure in numerical
terms and serve as biological endpoint predictors (Worth & Mostrag-Szlichtyng, 2010;
Todeschini & Consonni, 2009). The principles of the validation of QSAR models were
published by the Organisation for Economic Co-operation and Development (OECD) (OECD,
2005). Guidance on the regulatory application of QSARs were published by the OECD and
European Chemicals Agency (ECHA) providing a framework for using the data derived from
the models as opposed to those derived experimentally (OECD, 2007a; ECHA, 2008).
It has to be highlighted that, traditionally, a range of statistically-based QSAR models
were developed to describe the chemical information for the compounds investigated by
employing a range of molecular descriptors representing relevant structural features.
However, QSAR methods limit the information relating to the associated complex biology by
collapsing it into a single value representing the predicted endpoint which, very often,
imprecisely defines, or covers several different, mechanisms of action. As a consequence,
the association between chemistry and biology, being the basis of the predictive toxicology,
remains unclear and makes the resulting predictions difficult to interpret.

Chapter 1
4
In order to overcome the limitations of traditional, chemistry-oriented QSAR
modelling, identification of groups of chemicals with similar or related biological modes of
action (MoA) can be performed, e.g. through chemical grouping/read-across, or systematic
data-mining of the available biological data (both approaches have been discussed below).
QSAR modelling within MoA-based categories of compounds (MoA QSAR) allows the linkage
of the biological attributes underlying toxicity pathways with chemical structure
frameworks, and addresses, in part at least, the limitations of statistical models.
In order to support the results of QSAR analysis, or to generate estimated data in
the absence of suitable models, the chemical grouping and read-across approaches can be
used. Guidance documents on the application of this method have been published by the
OECD (OECD, 2007b) and ECHA (ECHA, 2008; ECHA, 2010). The term “read-across” refers to
the use of endpoint information for (“source”) chemical(s) to make a prediction of the same
endpoint for another (“target”) chemical, for which no, or inadequate, data may exist. With
respect to the essential concept underlying predictive toxicology, i.e. that similar
compounds (analogues) are expected to yield similar biological activity (Johnson &
Maggiora, 1990), the source and target chemicals have to be considered similar according to
(a set of) relevant characteristic(s) (e.g. structural, mechanistic, metabolic). Depending on
the general data availability for a given endpoint, it may be possible that only a few suitable
analogues can be identified, or, conversely, that a larger group of compounds can be found
and used for a “chemical category” formation. The physicochemical properties and
biological activities of the chemical category constituents are likely to be similar or follow a
regular pattern as a result of relevant similarity characteristics and a common underlying
mechanism or mode-of-action. In general, the application of read-across between analogues
in a mechanistically supported, MoA-based chemical category is considered to be more
reliable than the application of read-across in a smaller group of structural analogues based
on a homologous series (Worth & Mostrag-Szlichtyng, 2010).
MoA-based predictive toxicology supports, and is supported by, the general Adverse
Outcome Pathway (AOP) framework (OECD, 2013). AOPs are a predictive paradigm based on
the upstream sequence of biological events that are determinants of the apical adverse
outcome. An AOP typically starts from the Molecular Initiating Event (MIE), which triggers
the progression of the pathway towards the higher level responses (Key Events, KEs), and

Chapter 1
5
leads to the perturbations observed at the whole organism level. The MoA/AOP approach is
increasingly applied to understand adverse health effects caused by repeated exposure to
chemicals. The MIE delivers mechanistic information on chemical-biological interactions at
the molecular level that can be further associated with structural and physicochemical
characteristics of the chemical compound (Ankley et al., 2010).
The successful application of meaningful MoA-based tools, including chemical
grouping, read-across, and QSAR models, is related to (and heavily relies on) systematic
data-mining of the available biological data. Data mining (also termed “data/pattern
analysis”, “data archaeology” or “data dredging”) can be regarded as a process of
discovering patterns and retrieving knowledge from massive amounts of raw data, or
“knowledge discovery from data” (KDD). This interdisciplinary process is situated at the
crossroads of database technology, statistics, and artificial intelligence and is an iterative
sequence of the following steps (Bramer, 2007; Han et al., 2012):
Data preprocessing – preparation of the raw data for the actual data mining,
involving:
o Data cleaning – identification and removal of inconsistent data,
o Data integration – merging multiple data sources,
o Data selection – retrieval of the data relevant to the scientific question in hand,
o Data transformation – data aggregation and summarisation;
Data patterns discovery – actual data mining involving application of artificial
intelligence techniques to uncover and extract hidden patterns in the data;
Data patterns evaluation – identification of the patterns truly relevant to the
investigated issue;
Presentation of the knowledge developed by utilising visualisation and knowledge
representation techniques.
Data mining allows for the identification of the concealed relationships and patterns
in the data. Thus, it can be utilised as a predictive technique facilitating the objectives of
computational toxicology (Yang et al., 2006).

Chapter 1
6
The usefulness of QSAR- and predictive data mining- based tools to support
regulatory safety assessments has been evaluated and demonstrated over the past decade
(Yang et al., 2006; Yang et al., 2008; Benz, 2007; Mayer et al., 2008). Regardless of the
method applied (i.e. predictive system or data mining), any computational technique relies
to a great extent on the size, quality and availability of the biological data (Yang et al., 2006;
Yang et al., 2009).
1.3. The role of a database in reaching the goals of predictive toxicology
In general, the term “database” refers to the collection of interrelated data.
Together with a set of software programs for data access, management, organisation
(defining the logical structure of the data, i.e. the data model), and update, it forms a
database management system (DBMS) (Han et al., 2012). With respect to the database
design, the commonly used data model is a relational model invented by Edgar F. Codd
(Codd, 1970). The relational database can be defined as a collection of uniquely named,
interrelated tables (relations), consisting of a set of attributes (columns, fields) and storing a
set of tuples (rows, records). Each record (described by a set of field values) represents a
database object identified by a unique key. Frequently, for relational databases semantic
data models are also developed, e.g. the entity-relationship (ER) data model representing
the database as a set of entities and their relationships (Chen, 2002; Han et al., 2012). The
data in the relational database can be accessed via the database queries.
From a predictive toxicology standpoint, a database with a relational structure,
capable of storing chemical structures and toxicity information which can be searched and
retrieved, is a fundamental form of data for mining applications, computational model
development, and read-across of diverse sources and endpoints. Connecting biological
effects and chemicals involved in toxicity pathways can be performed exclusively after
systematic data mining. This requires a database to be equipped with specifically designed
ontologies and controlled vocabularies.
The term ontology refers to the explicit formal representation of a set of concepts
and their relationships within particular domain, linking facts to the related terms in a causal
order (Sowa, 1999; Noy & McGuiness, 2001). The iterative process of ontology development
involves (and leads to) formulating and extending the domain knowledge by interactive
Chapter 1
7
integration of knowledge from diverse domains. It requires (and allows for) abstracting and
generalising information, extracting and formulating rules, and identifying associations with
fundamental principles. An example of a successful mature ontology covering the cell
biology area is the Gene Ontology (GO), widely used in biological databases, annotation
projects, computational analyses for annotating newly sequenced genomes, text mining and
modelling (Hardy et al., 2012).
A mature chemical-toxicological ontology is necessary for the KDD process in
predictive toxicology. The toxic effects and underlying mechanisms can be identified
through precisely categorised terms, which provide the rationale and the basis for further
toxicity prediction (by chemical grouping and MoA QSAR modelling, for instance). Chemical-
toxicological ontology supports existing knowledge applications (by sharing the common
understanding of the information in the scientific community) and extensions (by providing
a well-structured framework).
A chemical-toxicological database meeting the outlined requirements is a pre-
requisite to achieve any of the objectives of predictive toxicology in terms of modelling,
knowledge creation and data management (Yang et al., 2006; Yang et al., 2008; Yang et al.,
2009; Han et al., 2012; Hardy et al., 2012).
1.4. COSMOS database
One of the most critical considerations in reaching the objectives of the COSMOS
project was the paucity of publicly available data for cosmetics and related chemicals. As
such, the construction of a new, high quality chemical-toxicological database with a
cosmetics-oriented domain was crucial.
The majority of publicly available repeated-dose toxicity data refer to the oral route
of exposure and thus do not include cosmetics (and rarely cover cosmetics-related
compounds), which are usually applied topically. However, since the scientific community
has sufficient understanding of oral absorption and skin permeability processes, an
approach using extrapolation (referred to as “oral-to-dermal extrapolation”) utilising this
knowledge and oral repeated-dose toxicity data has been applied to realise the goals of the
COSMOS project. There is an identifiable need to expand knowledge to cosmetics

Chapter 1
8
ingredients and related substances. The content requirements for constructing the COSMOS
database can therefore be summarised as follows2:
An inventory of cosmetics and cosmetics-related compounds populated with high
quality chemical structures and available regulatory information, such as daily intake
estimates or regulation history;
Skin permeability/absorption data for cosmetics and related compounds;
Oral repeated dose toxicity data for cosmetics and related compounds.
The process of collating the required COSMOS database content, as well as the
strategy of dealing with the difficulties and challenges associated with particular information
types, are presented in the current thesis.
In order to serve as a foundation to develop computational tools to predict the
repeated dose toxicity of cosmetics and related chemicals, the COSMOS database had to
accommodate various types of biological data. The data model, capable of handling such a
diverse information types, has been inherited from the risk assessment database of the
Chemical Evaluation and Risk Estimation (CERES) project at the United States Food and Drug
Administration (U.S. FDA) Center for Food Safety and Applied Nutrition (CFSAN). The CERES
database houses the internal regulatory information of the CFSAN, as well as other toxicity
databases, including the chemical records and toxicity data from the legacy U.S. FDA
Priority-based Assessment of Food Additives (PAFA) database (Benz & Irausquin, 1991). The
COSMOS and CERES databases share the same data model, technology, software programs,
and a very similar user interface.
The COSMOS database data model consists of two interconnected data domains
(Figure 1.1): a chemical domain and a biological domain. A very high-level overview of the
main entities is provided in this section.
The central entity of the COSMOS database chemical domain is “Compound”,
meaning that all other entities stored in this part of the database are Compound-related. An
entity “Compound” (a chemical compound or substance) is identified by a unique system
identifier, CMS ID, and represents a chemical composition which may consist of one or more
2 The outlined data needs are limited to the data relevant for the presented PhD program, and do not exhaustively coverthe requirements of the entire COSMOS project

Chapter 1
9
molecules, i.e. “Structure” entities, referring to the molecular structures. Compound may
thus be formed of multiple Structure entities, and, at the same time, a single Structure may
appear in multiple Compounds (many-to-many relationship). Depending on its chemical
composition, Compound may not be related to any Structure (this is discussed more in-
depth in chapter 2). Regardless of the association of the Compound with Structure entities,
multiple Compound-related information items can be stored in the COSMOS database,
including Names, Identifiers, Use Functions, along with attributes further defining their
source, type, etc.
The toxicological part of the data model reflects the diverse and heterogeneous
layout of the COSMOS database content. At the very high level it defines the entity “Study”,
corresponding to a toxicological study, which may consist of a various number of “Test”
instances, representing a series of experiments applied to a “Test System” (which might be a
series of animals, tissues, etc.). The Test System instances reflect all the peculiarities of the
recorded Tests. Each Test entity references a Test Result, reporting the outcomes of the
relevant toxicity experimental series. Finally, a Study references its own Study Result,
aggregating the Test Results. The Study Result is a final outcome of the toxicity endpoint,
which is based on all Test outcomes within a study. Such fine data granularity allows for the
storage of the information regarding each single experimental series and observed
toxicological effects on the one hand, and the summarised, higher-level information (final
Study conclusion, e.g. compiled by the human expert) on the other. It also supports the
development of the ontology sets facilitating the mechanistic data mining of the COSMOS
database (which is discussed more in-depth in chapters 6 and 7).
Figure 1 .1 Simplified schematic diagram of the COSMOS database data model

Chapter 1
10
The first version of the COSMOS database (COSMOS DB v1.0) was made publicly
available in December 2013 and its dump is currently downloadable from
http://cosmosspace.cosmostox.eu. The final version of the COSMOS database (COSMOS DB
v2.0) was released in April 2016 and can be accessed at:
https://cosmosdb.eu/cosmosdb.v2/.
1.5. The present PhD program and its association with the COSMOS project
The main aim of the present PhD program, conducted in conjunction with the
COSMOS project, was the collation of the content, in terms of chemical structures, skin
permeability and toxicological data, within a relational chemical-toxicological database,
and its subsequent application for the development of knowledge to support the
prediction of repeated dose toxicity of cosmetics and related compounds.
This multi-faceted goal has been broken down into the following objectives, realised
in collaboration with other COSMOS partners (please refer to Annex 1 for the detailed
contribution of the author of present thesis), and discussed in depth in the subsequent
chapters of the thesis:
Objective 1: The quality control of the COSMOS database chemical domain, with
particular emphasis on cosmetics ingredients and related compounds
This objective (discussed in chapter 2) has been realised through:
Development of the sets of controlled vocabularies for chemical compounds and
structures annotations, with a specific goal to address the problematic issues related to
the representation and identification of cosmetics related substances. It was a dynamic
process associated with curation of part of the COSMOS database chemical domain (U.S.
EPA DSSTox inventory);
Preparation of the Standard Operating Procedure (SOP) for conducting the Quality
Control/Quality Assurance (QC/QA) process of the COSMOS database chemical domain;
Conducting the QC/QA process.
Objective 2: Characterising the chemical space occupied by cosmetics ingredients
and related chemicals
This objective (discussed in chapter 3) was realised through:

Chapter 1
11
Performing structural features (ToxPrint chemotypes) and physicochemical
properties space analysis of the COSMOS Cosmetics Inventory profiled for the most
abundant use functions within cosmetics domain;
Comparing the chemical space occupied by the cosmetics-related compounds with
the food-related compounds from the U.S. FDA CFSAN PAFA database.
Objective 3: The development of a high quality COSMOS Skin Permeability
Database enriched with cosmetics ingredients and related compounds
This objective (discussed in chapter 4) was realised through:
Curation and integration of existing skin permeability/absorption data sources,
namely the EDETOX and University of Kent databases;
Development of the SOP for harvesting new data;
Harvesting new skin permeability data for cosmetics ingredients and related
compounds from the regulatory and literature sources according to the SOP developed;
Integration of the newly harvested data with the EDETOX and University of Kent
content;
Preparation of a data entry tool for QC of the COSMOS Skin Permeability Database.
Objective 4: Classification of skin permeability potential following dermal exposure
to chemicals to support the safety assessment of cosmetics related chemicals
This objective (discussed in chapter 5) was realised through:
Data mining of the Skin Permeability Database that was constructed, leading to the
collation of the set of compounds with available experimental data on maximal flux (JMAX);
Structural (with ToxPrint chemotypes) profiling of the collated dataset combined
with the analysis of the physicochemical properties of its compounds;
Determination of a set of rules classifying a chemical compound into the category of
low or high skin permeability potential.
Objective 5: Construction of a high quality database for oral repeated dose toxicity
with dose/concentration level information for cosmetics and related compounds
This objective (discussed in chapter 6) was realised through:

Chapter 1
12
Harvesting new oral repeated dose toxicity data for cosmetics and related
compounds from regulatory and literature sources according to the predefined SOP;
Conducting the QC/QA process on the resultant COSMOS oRepeatToxDB that was
constructed.
Objective 6: Mechanistic (ontology-based) liver toxicity data mining of the
COSMOS oRepeatToxDB on the basis of the ontology developed from the collated data
This objective (discussed in chapter 7) was realised through:
Validation of a liver toxicity ontology developed on the basis of the data collated
when the COSMOS oRepeatToxDB was constructed;
Ontology-based liver toxicity (steatosis) data mining of the COSMOS oRepeatToxDB;
Structural (ToxPrint chemotype) analysis of the sets of chemical compounds
obtained and identification of the structural fragments associated with the investigated
endpoint;
Formulation of the mechanistic reasoning for the toxicity of selected compounds on
the basis of an evaluation of the published literature and the results of molecular
modelling analysis (supplied by the collaborating COSMOS project partners from BAS).
As the current PhD program was undertaken within the auspices of the COSMOS
project, it supported the general objectives of the Project to develop alternative (non-
testing) tools to facilitate the safety assessment of cosmetics ingredients and related
chemicals within the European Union. The outcomes of the current PhD program provide a
solid foundation for further knowledge discovery.
Chapter 2
13
Chapter 2
Quality Control of the COSMOS Database Chemical Domain
2.1. Background
2.1.1. General aspects of the quality of chemical information and structures
The COSMOS database is a chemo-centric system integrating data from various
sources into a unified data model (please refer to chapter 1.4). For the development of a
chemistry-aware database, the correct, unambiguous representation of chemical
compounds encoded in a way enabling convenient storing, searching and integrating with
other systems, is of major significance. The power of any cheminformatics tool depends
greatly on the accuracy of the representation of molecular structures and related data, so
that they can be understood by both human scientists and machines. The importance of the
accurate identification of chemical structures for in silico modeling has been also recognised
(Young et al., 2008; Fourches et al., 2010). It has been demonstrated that QSAR models
developed with incorrect structures, or with the structures incorrectly handled by the
computational tools, yield significantly poorer predictive accuracies when compared to the
models developed on the basis of training sets with high quality structures.
Currently, several approaches aiming to address chemical identification and
representation issues are utilised in the chemoinformatics field. Their advantages and
limitations are discussed below.
2.1.1.1. Chemical nomenclature
Chemical nomenclature refers to the set of formalised rules consistently applied to
generate the names of chemical compounds within a particular convention, e.g.
International Union of Pure and Applied Chemistry (IUPAC) names (IUPAC, 2016), or
International Nomenclature of Cosmetic Ingredients (INCI) names (CIRS, 2016). In principle,
chemical nomenclature should ensure unambiguous identification of a chemical compound,
meaning that one chemical name should refer to a single substance. In practice, however,
applying the nomenclature-imposed rules usually leads to very complex names, which
cannot be commonly recognised or used to infer structural information without expertise.
Thus, a variety of other names (trivial, trade, etc.) commonly recognised by the scientific

Chapter 2
14
community is widely used. As they do not conform to any formal rules or system, they
cannot directly serve as unambiguous identifiers of chemical compounds (Brecher, 1999;
Fourches et al., 2010).
2.1.1.2. Chemical identification codes
Chemical identification codes are source-specific identifiers (e.g. digital), without
any chemical significance per se, which may be utilised at a very local scale (e.g. within the
laboratory or a corporate database to identify the compounds tested), or may be recognised
more broadly. An example of internationally used compound identification numbers (albeit
proprietary in their nature) are Registry Numbers (RNs), assigned by American Chemical
Society (ACS) Chemical Abstract Services (CAS) (CAS, 2016). CAS RNs are intended to be
unique numeric identifiers designating only one specific chemical substance and linking
information to it (e.g. references, names, structures). They constitute from up to ten digits,
divided by hyphens into three parts. The right-most digit is a “check digit” used to confirm
the legitimacy and uniqueness of the entire identifier. CAS RNs are not related to any
system of chemical nomenclature, and, as such, can provide a common link between various
nomenclatures used to describe substances. However, it should be noted that a single
chemical compound can be associated with multiple CAS RNs, as several types of CAS RNs
are currently in use. They include alternate, deleted, and generic RNs. An Alternate Registry
Number refers to the second RN generated for a less preferred structural representation of
a substance. A deleted Registry Number is a RN once assigned to a substance, but later
changed to another RN. Such cases may refer to the compounds that once appeared in the
literature with a trade name, but without associated structural information, and which are
later associated with a substance that has been already registered (Stanford University
Libraries, 2016). A generic Registry Number is a RN representing the whole class of
compounds (e.g. CAS RN “1330-20-7” for “xylene”) rather than pointing to the individual
structure (e.g. 1,2-xylene (CAS RN “95-47-6”), or 1,3-xylene (CAS RN “108-38-3”).
2.1.1.3. Line notations
Line notations refer to the representation of chemical structures as linear strings of
characters. The simplest example of a line notation would be the empirical molecular
formula.
Chapter 2
15
The most commonly used line notation system, the Simplified Molecular Line Input
Entry System (SMILES) (Weininger, 1988), is based on a set of rules for converting the
chemical structures into SMILES strings, which are accepted as an input format by the
majority of chemistry software tools. The conversion process is fully automated. Both,
stereochemistry and double bond geometry of molecular structures can be correctly
handled by SMILES, however there are many errors involved in this format, due to the
reality that some tools do not process SMILES correctly, or that many users are not
sufficiently experienced to use them correctly. The other drawback of the SMILES
representation is that multiple strings can be written for a single chemical. This limitation
can be addressed by applying an algorithm for canonical atoms numbering, however it is
successful only when used consistently as a single algorithm. In reality, different software
tools utilise different canonical numbering algorithms, thus, the SMILES strings generated by
them cannot be considered unique.
Another line notation system is the IUPAC International Chemical Identifier (InChI)
codes, developed to provide a standardised format for a formalised version of IUPAC names,
which could be interpreted by humans and conveniently used for searching the chemical
databases. In order to represent a chemical compound, an InChI code contains layers of
information on the atoms, bonds, connectivity, tautomeric forms, isotopes, stereochemistry
and charge (as appropriate to individual chemicals). InChI codes provide truly unique string
identifiers of chemicals. However, interpretation of InChI codes by human scientists requires
a lot of expertise, and InChI codes are currently not accepted by the majority of software
tools. InChIKeys are a version of InChI codes hashed into keys, i.e. strings of characters, in
order to further support the storage and searching in large chemical databases. InChIKeys
comprise of 27 characters, and are not interpretable by humans (Heller et al., 2013). For
InChIKeys, there is a theoretical (albeit statistically unlikely) possibility of duplicates.
2.1.1.4. Coding constitutions
Coding constitutions represent the constitutions of chemical structures explicitly.
The atom-bond connection table (CTAB) is one of the forms of chemical structure
representation, describing the structural relationships and properties of a collection of
atoms. Molecular structure is presented as a topological graph with nodes representing the
atoms linked by edges representing bonds. The atoms in the CTAB may be wholly or partially

Chapter 2
16
connected by bonds. The atom block of the CTAB specifies the atom coordinates (2- or 3-
dimensional), atomic symbols, any mass difference (from mass in periodic table), charge
(including radical state), stereochemistry and associated hydrogens. The bond block
specifies the two atoms connected by the bond, the bond type (single, double, triple,
aromatic), any bond stereochemistry and topology (chain or ring properties). The
connection table is a fundamental part of the Molecular Design Limited (MDL) file format for
the representation and communication of chemical information, including the Molecule
(MOL) and Structure-Data (SD) files (MDL, 2005).
Chemical Mark-up Language (CML) provides a general means to represent chemical
compounds using the Extensible Mark-up Language (XML) schema, allowing for the storage
of the annotations and properties for the chemical compound (CMLC, 2016).
Of the various representation methods, the SD file is one of the most accurate and
reliable for storing tautomer and stereochemistry information. In addition, the 3D chemical
structures required to specify certain preferred conformations can be represented only by
the xyz-coordinates in the connection table of the SD file or in CML atom blocks.
2.1.2. Compilation of the COSMOS database chemical domain
As described in section 1.4, the COSMOS database includes two interconnected
parts: a “Compound”-centred part, referred to herein as “chemical domain”, and “Study”-
centred biological/toxicological part. The chemical domain of the COSMOS database can be
therefore regarded as a collection of compounds (CMS IDs) with specific attributes: registry
numbers, names, structures (and their attributes) and use functions.
2.1.2.1. Chemical structure sources in COSMOS database
The chemistry part of the COSMOS database has been built through integration of
several inventories of compounds (Table 2.1), donated for the COSMOS project by the U.S.
FDA CFSAN CERES, the U.S. EPA DSSTox (ca. 12,000 records), and businesses related to the
COSMOS project (e.g. Procter and Gamble contributed ca. 25,000 structures as a result of its
membership of the Scientific Advisory Board). Multiple structures have been also retrieved
manually by COSMOS consortium partners. At the time of data integration, each available
connection table was assigned a “quality score” with respect to its origin. The values of the
quality scores ranged from 100 (for the highest quality structures from respectable, curated

Chapter 2
17
sources, e.g. the U.S. FDA CFSAN) to 5 (for the structures retrieved from publicly available,
non-curated sources, e.g. the internet). The CAS structures donated from the U.S. FDA
CFSAN CERES have been considered a “gold standard”.
Table 2.1 The source inventories of the COSMOS database chemical domain
Inventory (Owner, Name, Reference)
Inventory content
The U.S. FDA CFSAN CERES, including the Priority-Based Assessment of Food Additives Database (PAFA)
(Benz & Irausquin, 1991)
The U.S. FDA donation of about 70,000 public records from CERES, including the chemical part of the PAFA database.
PAFA is a legacy database of regulatory-relevant chemical records, containing administrative, chemical and toxicological information on direct and indirect food additives, colour additives, and Generally Recognised As Safe (GRAS) and prior-sanctioned substances, as well as over 3,000 substances in an inventory called Everything Added to Food in the United States (EAFUS), being the list of ingredients added directly to food (FDA-approved as food additives), or listed or affirmed as GRAS.
It is noteworthy that the PAFA Chemical Information includes historical data on: population exposure to chemicals, human consumption of the chemical, Acceptable Daily Intake (ADI) values set by the Joint FAO/WHO Expert Committee on Food Additives (JECFA), and a “Technical Effect” descriptor to define chemical use categories.
The U.S. EPA Distributed Structure-Searchable Toxicity Database (EPA DSSTox, 2016)
Repository of publicly available chemical structures, accurately mapped to the associated bioassay and physicochemical property data. About 12,000 DSSTox structures were donated to the COSMOS project by the U.S. EPA.
The U.S. EPA ToxCast Inventory (EPA ToxCast, 2016)
Toxicology in the 21st Century (Tox21) is a collaborative project among the U.S. EPA, NIH and FDA, aiming to develop enhanced methods for toxicity assessment. The Toxicity Forecaster (ToxCast) is one of the EPA’s contributions to Tox21 and refers to the chemical screening results for over 2,000 chemicals conducted in two research phases. The ToxCast inventory has been donated to the COSMOS project by the U.S. EPA.
2.1.2.2. COSMOS Cosmetics Inventory
A special emphasis was placed on cosmetics ingredients and cosmetics-related
chemicals. The repository of them was compiled by merging the EC COSING database
(COSING, 2016), and the U.S. PCPC list (Bailey, 2011) (Table 2.2) and is referred to as the
“COSMOS Cosmetics Inventory”, a fundamental part of the COSMOS database.

Chapter 2
18
Table 2.2 The source inventories of the COSMOS Cosmetics Inventory. The specified counts refer to the status of original, not curated inventories
Inventory (Owner, Name, Reference)
Inventory content
The European Commission COSING Database
Database of information on cosmetic substances and ingredients contained in the EC Cosmetics Regulation (EC, 2009), Cosmetics Directive (EC, 2003), and Inventory of Cosmetic Ingredients (EC, 2006), as well as covered by the opinions on cosmetic ingredients of the Scientific Committee for Consumer Safety, SCCS (SCCS, 2016).
The COSING database was downloaded in April 2011 from the EC COSING database website. The inventory file included:
o 19,391 COSING identifiers (REFNUMs), encoding the chemical compound together with its use functions (the single compound with multiple use functions has been represented by multiple REFNUMs)
o 9,286 CAS RNs
o 19,397 INCI names used in the EU
The International Nomenclature of Cosmetic Ingredients (INCI) system was established in the early 1970s by the PCPC. The INCI names are assigned according to the defined standards by the PCPC and are used in the USA, the EU, China, Japan, and many other countries for listing ingredients on cosmetic product labels. With few exceptions, the INCI labeling names in all countries should remain the same. The current (as of April 2016) list of INCI names is maintained by the PCPC, and includes over 16,000 ingredients (CIRS, 2016).
o 66 chemical use functions
The extensive list of possible functions of ingredients used in cosmetic products and their definitions from the COSING database has been provided in Annex 1.
The U.S. Personal Care Products Council (PCPC) List
The U.S. PCPC inventory has been compiled from a book (Bailey, 2011) published from the PCPC containing a list of cosmetics ingredients available in U.S. market. The inventory contained:
o 3,713 CAS RNs
o 3,512 INCI names used in the U.S
2.1.2.3. Curation needs and integration of the source inventories
The integration of chemical inventories (Tables 2.1 and 2.2) required curating
original records (and chemical structures), identifying and removing duplicate ones, and
joining the inventories on the basis of the common identifier(s). Any of the chemical
representation methods outlined in section 2.1.1 can potentially become a source of errors.
With respect to the chemical structures, the errors may occur either due to the implicit
limitations of line notations and coded constitutions, or due to their incorrect handling by
the software tools, or humans lacking sufficient expertise.

Chapter 2
19
For the COSMOS database, a range of additional quality-related issues had to be
considered. The Cosmetics Inventory largely comprises botanical extracts, oils, mixtures,
dyes, etc., which translate chemically into macromolecules (polymers, peptides), inorganic
compounds, coordination and transition metal complexes, etc. Such compounds frequently
require the Markush type of representation, which is not handled well by currently available
cheminformatics tools. Particularly challenging (if not impossible) is assigning structures to
Unknown or Variable Compositions, Complex Reaction Products and Biological Materials
(UVCB) (EPA, 2016a). A number of such substances could not be represented by CTABs (or
other line notations), and were considered “non-structurable”. Frequently, many of these
types of compounds have not been yet registered in the CAS Registry Database, making the
task of their accurate representation and identification even more complicated.
Due to the reasons outlined, the curation of records from the source inventories was
demanding and required various types of processing. For instance, in case of the U.S. EPA
DSSTox inventory (please refer to Annex 1), the main focus was placed on adopting the
original annotations to the controlled vocabulary of the COSMOS database (dynamically
developed during the curation efforts, please refer to sections 2.3.1 and 2.4.1).
Considering the COSING and PCPC lists contributing to the COSMOS Cosmetics
Inventory, additional processing was necessary. For instance, both INCI names and CAS RNs
should, in principle, uniquely identify the chemical compounds between (and within) the
COSING and PCPC. In practice, due to the generic representations (please refer to section
2.1.1.2) of cosmetics ingredients and related chemicals, single compounds have been
frequently associated with multiple CAS RNs, and conversely, single CAS RNs have been
related to multiple compounds. Actual examples of many-to-many relationships between
CAS RNs and INCI names in original records are presented in Table 2.3. Also, other
nomenclature-related issues were commonly found, e.g. the lack of conformance between
INCI names from COSING or PCPC lists with CAS Index Names, or differences between INCI
names used in the U.S. and EU e.g. both INCI names “oryza sativa bran cera” (COSING) and
“oryza sativa (rice) bran wax” (PCPC) refer to the same botanical compound.
Whilst some inventories (e.g. the U.S. FDA CFSAN CERES, or EPA DSSTox) were
processed into the COSMOS database in a relatively straightforward manner, the COSMOS

Chapter 2
20
Cosmetics Inventory required the development of a specific integration procedure,
presented schematically in Figure 2.1.
Figure 2.1 Integration of the EC COSING and the U.S. PCPC inventories leading to the construction of the COSMOS Cosmetics Inventory. The two lists were combined by two indices: INCI Names and CAS Registry Numbers. The compounds with common INCI Names were assigned a CMS ID in a fully automated process. For the compounds without common INCI Names, CAS RNs were analysed and used to text-mine the name nests. The INCI Names of these nests have been further examined and controlled. Due to many-to-many relationships, abundant between INCI Names and CAS RNs from the source lists, detections of duplicates in overlaps between the two inventories have been performed by direct comparison of InChIKeys for the compounds with available connection tables

Chapter 2
21
Table 2.3 An example of many-to-many relationships between CAS registry numbers and INCI Names found for the compounds from the surfactants class in unprocessed COSING and PCPC inventories*
Source inventory
INCI Name (from source inventory)
CAS RN (from source inventory)
Molecular formula (from source inventory)
CAS index name (for CAS reported in the source inventory)
CAS molecular formula (for CAS reported in the source inventory)
COSING Sodium laureth-12 sulfate
9004-82-4 Not given Poly(oxy-1,2-ethanediyl), α-sulfo-ω-(dodecyloxy)-, sodium salt (1:1)
(C2H4O)nC12H26O4S.Na
PCPC Sodium laureth-12 sulfate
66161-57-7 C36H74O16S.Na 3,6,9,12,15,18,21,24,27,30,33,36-Dodecaoxaoctatetracontan-1-ol, 1-(hydrogen sulfate), sodium salt (1:1)
C36H74O16S.Na
PCPC Sodium laureth-12 sulfate
9004-82-4 (generic) C36H74O16S.Na Poly(oxy-1,2-ethanediyl), α-sulfo-ω-(dodecyloxy)-, sodium salt (1:1)
(C2H4O)nC12H26O4S.Na
COSING Sodium laureth-7 sulfate
9004-82-4 Not given Poly(oxy-1,2-ethanediyl), α-sulfo-ω-(dodecyloxy)-, sodium salt (1:1)
(C2H4O)nC12H26O4S.Na
PCPC Sodium laureth-7 sulfate
9004-82-4 (generic) C26H54O11S.Na Poly(oxy-1,2-ethanediyl), α-sulfo-ω-
(dodecyloxy)-, sodium salt (1:1) (C2H4O)nC12H26O4S.Na
*Inspecting the three records available for sodium laureth-12 sulfate, CAS RN “9004-82-4” (provided in both, COSING and PCPC inventories) is a generic CAS, representing the whole class of polymeric surfactants with dodecyl or C10-C16 range of alkyl chain length with varying number of ethoxy ether groups. This “generic representation” is clearly indicated in the CAS molecular formula by ill-defined number of repeating units (n), and in the CAS index name. On the contrary, CAS RN “66161-57-7” is a specific registry number, referring to the polymeric surfactant with dodecyl alkyl chain and 12 ethoxy ether groups, i.e. sodium laureth-12 sulfate. Whilst a compound with varying composition (such as a polymeric material having a distribution of chain lengths) can be represented by a generic CAS, a compound with specific composition/configuration within such a class should be associated with a specific CAS RN. Considering the example of sodium laureth-7 sulfate with the defined molecular formula: “C26H54O11S.Na”, the specific CAS would be: “66197-75-9” and the corresponding CAS index name: “3,6,9,12,15,18,21-Heptaoxatritriacontan-1-ol, 1-(hydrogen sulfate), sodium salt (1:1)”

Chapter 2
22
2.1.3. Final content of the COSMOS database chemical domain
As a result of merging the inventories identified in Tables 2.1-2.2, the entire COSMOS
v.2.0 database (https://cosmosdb.eu/cosmosdb.v2/accounts/login/?next=/cosmosdb.v2/)
consists of 81,604 chemical records. Connection tables are available for 46,791 (48%)
compounds. The remaining ones largely consist of natural products (biological
macromolecules, botanical oils, extracts, mixtures, etc., minerals) and other non-
structurable substances. The InChI Keys analysis performed on 46,791 COSMOS structures
indicated 44,773 unique CTABs. Structural duplicates in the COSMOS database were allowed
in multiple cases requiring the use of representative structures (please refer also to Table
2.4). Over 72% of all available connection tables were assigned the highest quality score of
100 (section 2.1.2.1). The lowest quality structures, with a score of 5, comprise ca. 8% of all
COSMOS CTABs.
2.1.3.1. COSMOS Cosmetics Inventory
The COSMOS Cosmetics Inventory, compiled from the EU COSING and U.S. PCPC list
(Table 2.2; Figure 2.2), consists of 17,100 unique chemical records (by CMS IDs), associated
with 9,278 unique CAS RNs and 16,111 unique INCI Names. The connection tables are
available for 5,562 Cosmetics Inventory compounds.
Figure 2.2 Venn Diagrams showing the number of chemical records (by assigned CMS IDs, curated CAS RNs or INCI Names) present in both (EU COSING and U.S. PCPC) or only one (EU COSING or U. S. PCPC) of the source inventories

Chapter 2
23
2.2. The aims of chapter 2
As outlined, properly identified chemical compounds represented by high quality
structures are crucial for the successful development of a chemical-biological relational
database and for facilitating the development of any in silico tool for toxicity prediction.
The aims of the present chapter realised in collaboration with the COSMOS
consortium partners (please refer to Annex 1) relate to the objective 1 of the current PhD
program (section 1.5), and include:
Development of the sets of controlled vocabularies for chemical compounds and
structures annotations, with a specific goal to address the problematic issues related to
the representation and identification of cosmetics related substances. It was a dynamic
process associated with curation of part of the COSMOS database chemical domain (U.S.
EPA DSSTox inventory);
Development of a Standard Operating Procedure (SOP) to conduct the Quality
Control/Quality Assurance (QC/QA) process of the COSMOS database chemical domain;
Conducting the QC/QA process.
2.3. Materials and methods
2.3.1. Development of a controlled vocabulary for compounds and structures annotations
In every case of information exchange and integration, it is fundamental to have a
set of common standards with respect to both the format and content of the data.
According to the COSMOS database data model (chapter 1.4), the chemical compounds
registered in the COSMOS database (uniquely identified with CMS IDs) can be associated
with no (for non-structurable compounds), or one or more (for structurable compounds)
connection tables. For each unique CMS ID multiple, non-unique information items may be
stored (e.g. names, use functions, external identifiers). The many-to-many relationships
between compounds and structures have been allowed, e.g. between parent and related
compounds, such as components of mixtures, monomers of polymers, representative
structures, etc. Controlled vocabularies were designed as an integral part of the COSMOS
database data model, providing the terminology and foundation to correctly organise and

Chapter 2
24
handle the complex relationships within the content of the COSMOS database chemical
domain, as well as to deal with a range of problematic cosmetics-related compounds, e.g.
those that are non-structurable and could not be represented by empirical molecular
formulae, other line notations, or connection tables (section 2.1.2.3).
The process of the development of a controlled vocabulary was dynamic. The
preliminary terminology was designed in collaboration with the U.S. FDA, the U.S. EPA, and
Altamira LLC (please refer to Annex 1) at the initial stage of curating and integrating the
source inventories. As the chemistry content curation progressed, the controlled
vocabularies were refined and updated, as needed. The sets of the controlled vocabularies
have been designed for the following compound- and structure-related elements:
stereochemistry, double bond geometry, material type and composition type.
2.3.2. Development of the Standard Operating Procedure for the Quality Control (QC) of the COSMOS database chemical domain
In order to perform the Quality Control of the COSMOS database by several COSMOS
partners with maintained consistency, it was necessary to develop a Standard Operating
Procedure (SOP). It was compiled by Altamira LLC (Annex 1), and covered all the tasks
planned to be conducted during the QC process (including the verification of correctness of
chemical names, registry numbers, structures, and compound and structures annotations).
The initial SOP was systematically updated during the ongoing QC procedure to cover newly
identified issues.
2.3.3. Conducting the Quality Control (QC) and Quality Assurance (QA) Processes of the COSMOS database chemical domain
The Quality Control (QC) process can be defined as the verification of the accuracy of
the database content with respect to the predefined standards, resolving the eventual
deviations and modifying the process as needed. The QC of the COSMOS v.1.0 database
chemistry content was led by LJMU, and has been completed with the effort of five
COSMOS partners (Annex 1). Approximately 1% of structurable (i.e. containing connection
tables) compounds included in the COSMOS database were sampled randomly and evenly
distributed between the QC participants. QC was performed via the COSMOS database Data
Entry System (DES), according to the previously developed SOP (section 2.3.2).

Chapter 2
25
The Quality Assurance (QA) process maintains the quality standards of the database
by sampling the observations at a given confidence level, such that the relevant statistics
(error rates, i.e. the ratios of incorrect records to the total number of sampled records) can
be reported. During the Quality Control process, the main emphasis was placed on assuring
the connection tables, registry numbers and names correctness, as these elements were
subsequently used for the calculation of the QA statistics. The QA statistics have been
derived from the COSMOS DB DES audit trail and by comparing all the QC-ed records to the
original, not QC-ed ones.
2.4. Results
2.4.1. Controlled vocabularies for chemical compounds and structures annotation
Sets of controlled vocabularies were developed to annotate the following
compound- and structure- related elements: stereochemistry, double bond geometry,
material type and composition type.
2.4.1.1. Stereochemistry
Stereochemistry annotations refer to the isomerism of the structure resulting from
the differences in the spatial arrangement of atoms without accompanying differences in
connectivity or bond multiplicity (IUPAC, 2016). The following controlled vocabulary was
designed for the COSMOS database:
Absolute stereochemistry, referring to the chemical structures for which the
absolute configuration of the chiral centre(s) is provided. The structures with a known,
specific, single configuration have the direction of rotation specified, i.e. they were
annotated as “Absolute stereochemistry, rotation (-)”, or “Absolute stereochemistry,
rotation (+)”.
Relative stereochemistry, applicable to the structures for which the relative
configuration of two or more chiral centres was provided (i.e. the relationship to two or
more centres was specified), but the absolute value in their relationship is unknown.
Relative stereochemistry, racemic mixture: The compound is a racemic mixture of
the structure as drawn, and its identical mirror image.

Chapter 2
26
No stereochemistry, meaning that no stereochemistry is associated with the
compound (i.e. the sterochemistry annotation was not applicable).
2.4.1.2. Double bond geometry
Double bond geometry annotations include:
Double bond geometry (E-), referring to structures with single or multiple double
bonds(s), all with trans- geometry.
Double bond geometry (Z-), referring to structures with single or multiple double
bonds(s), all with cis- geometry.
Double bond geometry (E-,Z-), referring to structures with multiple double bonds(s)
representing both (trans-, cis-) types of geometric isomerism.
Double bond geometry unspecified, referring to structures with double bond(s), but
without geometric isomerism specified.
No double bond geometry, relevant for structures that are not associated with any
double bond geometry (i.e. the double bond geometry annotation is not applicable).
2.4.1.3. Material type
Material type refers to the chemical nature of the compound. The following material
types have been recognised in the COSMOS database:
Biological, referring to macromolecules of biological importance, e.g. protein or
nucleic acid sequences, lipids, enzymes, etc. for which it is (usually) difficult to define a
structure, or they are non-structurable.
Botanical, referring to compounds of natural/plant origin, largely comprising of
complex, structurally difficult to define (or non-structurable) mixtures, extracts, oils, etc.
IOM, denoting the entire category of compounds including:
o Inorganic: Chemical structures without organic carbon atoms; elements including
metal atoms and metalloid atoms (boron (B), silicon (Si), germanium (Ge), arsenic
(As), antimony (Sb), tellurium (Te)); ions (e.g. borate, chromate); minerals.
o Organometallic: Chemical structures containing organic carbon(s) directly bonded
to any metal atom other than alkali (I) or alkaline earth (II) metals.

Chapter 2
27
o Organometalloid: Chemical structures containing organic carbon directly bonded
to any metalloid atom.
o Metal complex: Chemical structures containing a central metallic atom covalently
bonded to the total number of ligands, either larger or smaller than indicated by
the central metal atom’s oxidation state.
o Metalloid complex: Chemical structures containing a central metalloid atom
covalently bonded to the total number of ligands, either larger or smaller than
indicated by the central metalloid atom’s oxidation state.
Organic, to annotate the chemical compounds containing organic carbon atom(s)
(i.e. not carbon monoxide, carbon dioxide, carbonates and cyanides), but not being
classified as organometallics or organometalloids.
Polymer, referring to the chemical compounds with polydispersed composition, i.e.
constituted by regularly or irregularly repeated units.
Unspecified, relevant in cases when little or no information was available for a
compound (e.g. exhaust gases, complex reaction products obtained in industrial
processess).
2.4.1.4. Composition type
Composition type corresponds to the chemical constitution of the compound, i.e. the
elements listed in its molecular formula. In the majority of cases, the composition type can
be inferred solely from the molecular formula. However, the information on the
configuration of the chemical compound (e.g. geometric or positional isomers,
stereoisomers) cannot be derived from the molecular formula and has to be inferred from
the compound name or connection table, if applicable. The composition type has been
controlled by the following vocabulary:
Defined formula, referring to chemical compounds with chemical structure fully
represented in the molecular formula (except configuration information, please refer to
the descripton above and to the annotation ”varying isomers” below)
Ill-defined formula, relevant in many cases when chemical structure is only partially
represented in the molecular formula. This composition type can include varying
compositions and/or varying number of repeating units (polydispersion)

Chapter 2
28
o Varying composition, refers to chemical structures in which one or more
components are unknown (unspecified), or the stoichiometric ratios (e.g. in salts)
are unknown.
o Polydispersion, refers to the varying number of repeating units. This term is
relevant for polymers and is usually reflected in the molecular formula (()n),
and/or in the name of the compound (poly-). For instance: C8H8 is a molecular
formula of styrene, whereas (C8H8)n represents polystyrene.
Formulation, for annotating well-defined (usually commercial, possibly proprietary)
compositions of two or more substances.
Unspecified, applicable in cases when little or nothing is known about the
composition of the chemical and, as such, no molecular formula can be derived (e.g.
complex reaction products).
Varying isomers, referring to any type of relevant isomerism (may be geometric,
positional, or stereoisomerism) and is applicable to both, defined and ill-defined
compositions. The information on the isomerism cannot be inferred from the molecular
formula and has to be decided upon after inspection of the name or the structure of the
chemical compound.
2.4.1.5. Application of the annotations scheme
Examples of application of the above controlled vocabularies in the COSMOS
database are presented in Table 2.4. The COSMOS annotations facilitate the compilation of
computational datasets (i.e. the datasets that can be used for the computational analysis;
described in more details in chapter 3).

Chapter 2
29
Table 2.4 An example of application of composition and material type annotations in the COSMOS database. The records 1-2 and 3-5 refer to cases where the composition type of the compound cannot be inferred from the molecular formula alone and the positional isomerism has to be inferred from the compound name. Record 6 demonstrates the case when annotations can be assigned from the molecular formula alone. Cases where the representative structures have been used are also presented
Rec # Molecular Formula
CAS RN CAS Index Name Composition Type Material Type Structure Image Structure note
1 (C2H4O)nC15H24O 26027-38-3 Poly(oxy-1,2-ethanediyl), α-(4-nonylphenyl)-ω-hydroxy-
Ill-defined formula – polydispersed
Organic - polymer
Representative structure for polymer (n=1)
2 (C2H4O)nC15H24O 9016-45-9 Poly(oxy-1,2-ethanediyl), α-(nonylphenyl)-ω-hydroxy-
Ill-defined formula – polydispersed – varying isomers
Organic - polymer
Representative structure for polymer (n=1) and positional isomer (as 4-nonylphenyl)
3 C8H10 1330-20-7 Benzene, dimethyl- Defined formula – varying isomers
Organic
Representative structure for positional isomer (as 1,3-dimethyl)
4 C8H10 108-38-3 Benzene, 1,3-dimethyl- Defined formula Organic
Actual structure
5 C8H10 95-47-6 Benzene, 1,2-dimethyl- Defined formula Organic
Actual structure
6 (C8H17N5)n.xClH 32289-58-0 Poly[iminocarbonimidoyliminocarbonimidoylimino-1,6-hexanediyl], hydrochloride
Ill-defined formula – polydispersed – varying composition
Organic - polymer
Representative structure for polymer (n=1) and composition (x=1)

Chapter 2
30
2.4.2. Standard Operating Procedure for the Quality Control (QC) process
The final SOP (updated and finalised after the QC) is provided in Annex 2. The entire
QC procedure consisted of several steps, as presented in Figure 2.3.
Figure 2.3 An overview of the Quality Control procedure conducted of the COSMOS database chemical domain through Data Entry System. The QC procedure consisted of the following steps:
(1) Logging-in to the COSMOS database Data Entry System with the personal access credentials; (2) Accessing the Data Entry System; (3) Selecting the “Review and QC Existing Structures and Data” option under the “Chemistry”
section of Data Entry System; (4) Searching for the query compound (i.e. the one subjected to the QC) in the COSMOS
database chemical domain; (5) Selecting the compound for QC from the search results list (the outmost right “QC-ed” box is
not checked yet); (6) Selecting the tab corresponding to the QC-ed element: “Structure Annotation”, “Compound
Annotation”, “Registry Numbers and IDs”, or “Names”, and performing the actual quality control tasks. Subsequently saving the results;
(7) Receiving the confirmation of the successful completion of the QC process on the final screen (the outmost right “QC-ed” box is now marked)

Chapter 2
31
The actual tasks performed during the QC of particular elements are discussed in the
following paragraphs.
2.4.2.1. Structure annotation
The Quality Control of “Structure Annotation” (Figure 2.4A) covered the verification
(and correction, if needed) of the following elements:
Connection table (and depiction of the structure’s image). For each connection table
the COSMOS database automatically calculates the InChIKey using the RDKit
chemoinformatics library (RDKit, 2016). For the purpose of the QC process, the “corrected
connection table” has been defined as a connection table which has been sufficiently
modified in the QC process, as to result the creation of a new InChIKey;
Stereochemistry annotation (with respect to the developed controlled vocabularies);
Double bond geometry annotation (with respect to the developed controlled
vocabularies);
The source provided for each structure. This element was subject to correction in
addition to making any changes in the connection table during the QC procedure.
2.4.2.2. Compound annotation
The Quality Control of the “Compound Annotation” (Figure 2.4B) focused on
checking of the correctness of the following elements:
Molecular formula;
Material type annotation (with respect to the developed controlled vocabularies);
Composition type annotation (with respect to the developed controlled
vocabularies).
2.4.2.3. Registry numbers and IDs
The QC of “Registry Numbers and IDs” (Figure 2.4C) focused on the verification (and
resolving any conflicts, if necessary) of:
The correctness of Registry Number(s) assigned to the compound (structure/name
pair correctness);
The correctness of specified RN types (active, alternate, deleted, generic, etc.)
(please refer to section 2.1.1.2);

Chapter 2
32
The correctness of other (external) identifiers, e.g. the EC COSING REFNUMs, the
DSSTox CIDs, etc., by querying them in the source inventories.
2.4.2.4. Names
The Quality Control of the “Names” (Figure 2.4D) covered the verification (and
correction, if needed) of:
The correctness of the chemical names provided for the query compound (also with
respect to the structure, Registry Numbers, identifiers);
The correctness of “Name Type”, as specified, e.g. INCI Name. The “Preferred Name”
in the COSMOS database was not subjected to any changes;
The correctness of “Name Source”, as specified. The “Name Source” should correctly
correspond to the “Name Type”, e.g. for the INCI Name type, the correct sources could
include “COSING” or “PCPC”.
Figure 2.4 Quality Control of the COSMOS database chemical domain though the COSMOS DES: (A) Structure Annotation; (B) Compound Annotation; (C) Registry Numbers and IDs; (D) Names

Chapter 2
33
2.4.3. Results of the QC/QA of the COSMOS database chemical domain
The QC/QA process of the COSMOS v.1.0 database chemistry content was performed
for ca. 1% of structurable (i.e. containing connection tables) compounds randomly sampled
from the database, giving a total number of 442 structures subjected to the QC. The QC
tasks were accomplished through the COSMOS DB Data Entry System (DES), with particular
emphasis placed on the QC of connection tables, Registry Numbers, and compound names,
as these elements were used for the QA statistics determination.
2.4.3.1. Connection tables quality control
The QC of the 442 structures led to the correction of a total of 43 connection tables,
giving an overall error rate of 9.7%. Three specific types of corrections were performed:
Correction of the connectivity and stereochemistry, or protonation state, of the
structure;
Correction of the stereochemistry and protonation state (connectivity unchanged);
Correction of the protonation state (connectivity and stereochemistry unchanged).
Overall, 16 connectivity changes have been made (giving the connectivity error rate
of 3.6%), 24 stereochemistry changes (the error rate of 5.4%) and 3 changes for protonation
states (the error rate of 0.7%).
2.4.3.2. Registry numbers quality control
During the QC cycle only two (out of 442) CAS RNs were identified as being
incorrectly assigned and were thus corrected, giving an error rate of 0.45%. Additionally,
151 new CAS RNs were added to the compounds inspected.
2.4.3.3. Chemical names quality control
The QC process has resulted in correcting ten (out of 442) chemical names, giving an
error rate of 2.2%. Additionally, 732 new names were added to the databases.
Based on the results of the QA on chemical structures, the approximate percentage
of inaccurate structures in COSMOS v.1.0 is 4.3% (if stereochemistry is ignored), and 9.7% (if
stereochemistry is considered). Approximately 2.2% of the names may contain errors and
0.5% of the records may have incorrect registry numbers. The COSMOS database is, by far,

Chapter 2
34
the only publically available database, which chemistry content has been carefully QC-ed
and for which the QA statistics are available.
2.5. Discussion
This chapter describes the process of collation of the COSMOS database chemistry
content, including the COSMOS Cosmetics Inventory. It involved integration of several
chemical inventories into a unified data model, and systematic curation and quality control
of chemical records.
The need for a strategy addressing concerns over the quality of chemical information
and structures was clearly demonstrated. As such, a novel set of controlled vocabularies was
developed with respect to the specific features of cosmetics and related compounds. It
provides the unified terminology systematising the complex relationships within the
cosmetics domain and the framework to deal with a range of non-structurable (or difficult
to structure) compounds. The designed COSMOS annotations may facilitate the compilation
of computational datasets (i.e. the datasets that can be used for the computational analysis)
by enabling fast and convenient identification of non-structurable compounds (e.g.
unspecified compositions or material types), or compounds that are not handled well by the
computational tools (inorganics, metal complexes, organometalloids, polymers, mixtures,
etc.).
The systematic quality control procedure established during the COSMOS database
development was captured as the Standard Operating Procedure (SOP) document (Annex
2), which can serve as a point of reference during future efforts of chemical structures
collation.
The precise identification of chemical compounds within COSMOS Database
supports the populating of the associated toxicological content by enabling accurate
referencing of chemical and biological records. This, in turn, supports the development of
meaningful in silico tools, as their performance is dependent on the accuracy of the
representation of molecular structures and related data.
The COSMOS Database contains 81,604 chemical records. The COSMOS Cosmetics
Inventory is particularly important part of the COSMOS database. It consists of 17,100

Chapter 2
35
unique chemical records, associated with 5,567 chemical structures and is, by far, the
largest publicly available inventory of cosmetics and related compounds. During the
COSMOS project it served as a foundation to realise multiple objectives. After the COSMOS
project, it still has numerous scientific and regulatory applications. As a publicly available,
ready-to-use repository of cosmetics-related compounds with associated toxicological data
it can support data mining, in silico methods development, risk assessment and read-across
tasks (by, for example, enabling identification of structural analogs within cosmetics
domain). The COSMOS Cosmetics Inventory was used in the analysis described in chapter 3,
including the determination of structural features and physicochemical properties
associated with different types of cosmetics and comparison of these characteristics with
food-related compounds.

Chapter 3
36
Chapter 3
Chemical Space Analysis of the COSMOS Cosmetics Inventory
3.1. Background
The chemical space of an inventory of chemicals (or a toxicity database) can be
regarded as the ranges of physicochemical properties and structural features covered by its
constituents. It is an important piece of information for many reasons (Yang et al., 2008;
Worth & Mostrag-Szlichtyng, 2010):
Analysis of chemical space may be a first step towards the development of
meaningful computational methods accurately predicting toxicity by verifying and assuring
sufficient coverage of the relevant chemical space. Utilising relevant means of describing
the physicochemical and structural characteristics of the chemicals across various
inventories ensures that the basic concept underlying predictive chemistry and toxicology
that similar molecules are expected to exhibit similar properties and biological activities is
fulfilled (Johnson and Maggiora, 1990);
The structural and physicochemical properties space of a dataset, analysed together
with the biological activity of its members, may provide insights improving the
understanding of complex toxicological phenomena. It may lead to the identification of the
chemistry-biology associations and facilitate the discovery of structural features linked to
toxicity. Thus, it supports the development of mode-of-action knowledge from the data;
Information on the chemical space covered by the inventory or a dataset is also
particularly important for the successful application of existing computational tools. In
silico models should be applied only to the chemical compounds situated within their
applicability domains, since outside this they are unlikely to give reliable predictions. When
the predictive performance of model is assessed by challenging it with an independent
(external) validation (test) set, it is useful to compare the chemical space of the test set
with that of the training set. When the predictive performance of a model is assessed
against a limited test set, and the conclusions are generalised to a wider dataset (or
chemical inventory), it is important to compare the chemical space of the test set with that
of the wider inventory;

Chapter 3
37
The comparison of the chemical space occupied by diverse inventories representing
various types of compounds (e.g. cosmetics- vs food-related, as in the research discussed
in the present chapter) enables the investigation of the physicochemical and structural
features of the molecules with respect to their specific use types in specific environments.
It allows for the context of where and how the particular molecular characteristics have
been manifested to be investigated.
Performing computational analysis of the chemical space of an inventory of
compounds or a dataset requires the following steps: (i) preparing molecular structures for
the purpose of computational analysis; (ii) calculating relevant molecular descriptors; (iii)
applying appropriate statistical techniques to make the results of calculations interpretable.
Each of these steps is discussed below.
3.1.1. Curation of chemical structures
The importance of appropriate preparation of molecular structures for
computational analysis, so that they can be correctly interpreted and handled by the
software used to compute molecular descriptors, has been widely recognised (Young et al.,
2008; Fourches et al., 2010; Waldman et al., 2015) and outlined in chapter 2. No
standardised sets of procedures that should be applied to curate structures have so far been
formulated, as the computational generation of structures should be always performed with
regard to the aim of the analysis. For instance, the investigation of general structural classes
represented in a given inventory or a dataset requires a different approach than the
calculation of quantum mechanical descriptors for individual compounds. In the first case,
2D structures may be sufficient, whereas in the second one, 3D coordinates of the
investigated molecules have to be provided. General aspects related to the preparation of
computational datasets are listed and discussed in depth in Table 3.1.

Chapter 3
38
Table 3.1 General aspects associated with preparation of molecular structures for computational analysis (Young et al., 2008; Fourches et al., 2010)
Task Description
Identification of IOM compounds (please refer to chapter 2)
The majority of molecular descriptors were designed for organic compounds for which valence-bond structures can be formulated and, as such, cannot be calculated for inorganics. For organometallics and organometalloids, calculations may be also not possible, due to the common lack of necessary calibration for rare earth metals.
Identification of salts The majority of software tools cannot process organic salts, which contain metal counter ions. The properties of salts can vary from the properties of parent compounds. However, in cases when the organic part of the molecule is responsible for its biological activity, the metal counter ions should be removed and the remaining carbo- cations or anions should be neutralised.
Identification and processing of mixtures
Although some approaches to deal with mixtures have been suggested, the majority of available software tools are not capable of handling these types of compounds (consisting of multiple structures) in a transparent and appropriate way. The most common approach is based on automated removal of the mixture constituent(s) with the lowest molecular weights or the smallest number of atoms. However, in cases when the entire mixture has been tested for toxicity, the associated data do not necessarily correspond to the toxicity of individual components. The “smallest fragment” should be therefore removed only in cases when it is clear that the “largest fragment” is responsible for the biological activity of the whole mixture. Such cases refer, for example, to hydrates and hydrochlorides consisting of a large biologically active organic molecule and small inorganic one(s). In case of mixtures consisting of several organic constituents with similar molecular weight, the decision on the fragment removal should be made after careful review.
Validation of chemical structures with respect to the representation of mesomeric (resonance) forms, tautomeric forms and aromatic rings
Resonance structure and aromaticity should be represented in a consistent way as any differences in representation may significantly change the values of calculated properties. For tautomers, the mechanism of action (if known) should be considered prior deciding on the appropriate representation of the compound.
Detection and removal (if desired) of duplicates
Due to nomenclatures, digital identifiers, or SMILES strings limitations repetitions of the same compound (and hence the same structure) in large inventories are relatively common (chapter 2). To detect duplicate structures, InChIKeys comparison can be successfully applied (section2.1.1.3). However, it should be stressed that duplicate structures may also appear as a result of performing some of the above mentioned structure processing steps. For instance, counter ion(s) removal, and subsequent neutralisation of the remaining organic part of the molecule, or small fragments removal, may both lead to a single “computational” structure, represented by a single InChIKey, which actually is a (neutralised) part or a substructure of several tested compounds. On occasions, the experimental results for those records may vary. This could mean that the structure curation procedure had led to the removal of a significant molecular fragment which may be responsible for the activity of the compound tested. Such cases should be reviewed manually by human experts. Generally, the process of the removal of duplicates should be controlled and it should be always possible to relate the resulting computational structure back to the original compound tested.

Chapter 3
39
3.1.2. Calculation of molecular descriptors
“The molecular descriptor is the final result of a logic and mathematical procedure
which transforms chemical information encoded within a symbolic representation of a
molecule into a useful number or the result of some standardised experiment” (Todeschini &
Consonni, 2009).
The selection of relevant molecular descriptors with regard to the aim(s) of the
analysis is essential. In case of chemical space analysis, the selected molecular descriptors
should be capable of capturing the variability of investigated compounds in as broad as
possible manner. As such, several types of descriptors should, ideally, be utilised. Various
descriptors generated by different computational algorithms are, in principle, expected to
derive diverse types of information for the compared sets of molecules. The selected
descriptors should be also transparent and easy to interpret.
Molecular descriptors can be categorised in a range of different ways, for example
with regard to the molecular representation used for the calculations (into zero- to three-
dimensional descriptors), or to the nature (and complexity) of the calculations (into
constitutional, topological, geometrical, electronic, or quantum-mechanical approaches)
(Fara & Oprea, 2016). The example of generic categories of molecular descriptors is
provided in Table 3.2.
Table 3.2 General categories of molecular descriptors
Molecular descriptor category Description
Zero-Dimensional (0D) Descriptors derived directly from the molecular formula of the compound (e.g. molecular weight, number of atoms in the molecule, etc.)
One-Dimensional (1D) Fragment counts (e.g. number of H-bond donor and acceptor atoms)
Two-Dimensional (2D) Topological descriptors, referring to the manner in which the atoms are connected in the molecule and calculated from mathematical graph theory (e.g. topological polar surface area)
Three-Dimensional (3D) Geometrical, electronic and quantum-mechanical descriptors derived from the results of empirical schemes or molecular orbital calculations requiring the 3D structure of the molecule (e.g. dipole moment)
Structural fingerprints comprise another type of descriptors, encoding the molecular
structure in a form of binary digits (bit-strings) representing the presence or absence of

Chapter 3
40
particular substructures in the molecule (Fara & Oprea, 2016). The molecular fragments for
fingerprints generation are, in principle, designed to encode particular chemical
information, which can be interpreted by human scientists. The molecules can be thus
compared through the comparison of their fingerprints.
The 0- to 3-D molecular descriptors, along with the structural fingerprints, provide a
large portion of the information about the molecule. They are well-defined by the available
cheminformatics tools and have been broadly applied throughout the present thesis (in
chapters 3, 5 and 7).
3.1.3. Application of relevant statistical methods
The subsequent step of chemical space analysis requires applying relevant statistical
method(s) to transform the multidimensional space occupied by the studied inventories into
a lower dimensional space, and to visualise it, so it can be interpreted by a human scientist.
Multiple statistical approaches have been successfully applied to this end, including Cluster
Analysis (Cattell, 1943), Artificial Neural Networks (ANN) (Kohonen, 1982; Zupan &
Gasteiger, 1999), or Principal Components Analysis (PCA). The technique broadly utilised in
the present thesis is PCA (this chapter and chapter 5), which is discussed below.
Principal Components Analysis (Pearson, 1901; Wold et al., 1987; Jolliffe, 2002;
Begam & Kumar, 2014) is a multivariate method belonging to the group of statistical
multidimensional factorial methods (Cordella, 2012) that provides a compact view of
variation in a data matrix by defining the orthogonal directions of maximum variance. The
Principal Components-based decomposition of the original data matrix is presented
schematically in Figure 3.1. Briefly, PCA can be performed by eigenvalue decomposition of
the covariance (or correlation) matrix of the data and the first Principal Component (PC) is
the eigenvector (showing the “direction” of the highest variance in the data) with the
highest eigenvalue (specifying the amount of variance in the data in this direction). The
following Principal Components are the directions maximising variance among all directions
orthogonal to the previous Principal Components. Frequently, PCA results are interpreted in
terms of the loadings (the covariance/correlation between the particular Principal
Components and the original variables, providing information on how much of the variation
in a variable is explained by the PC) and scores (defining the positions of each observation in
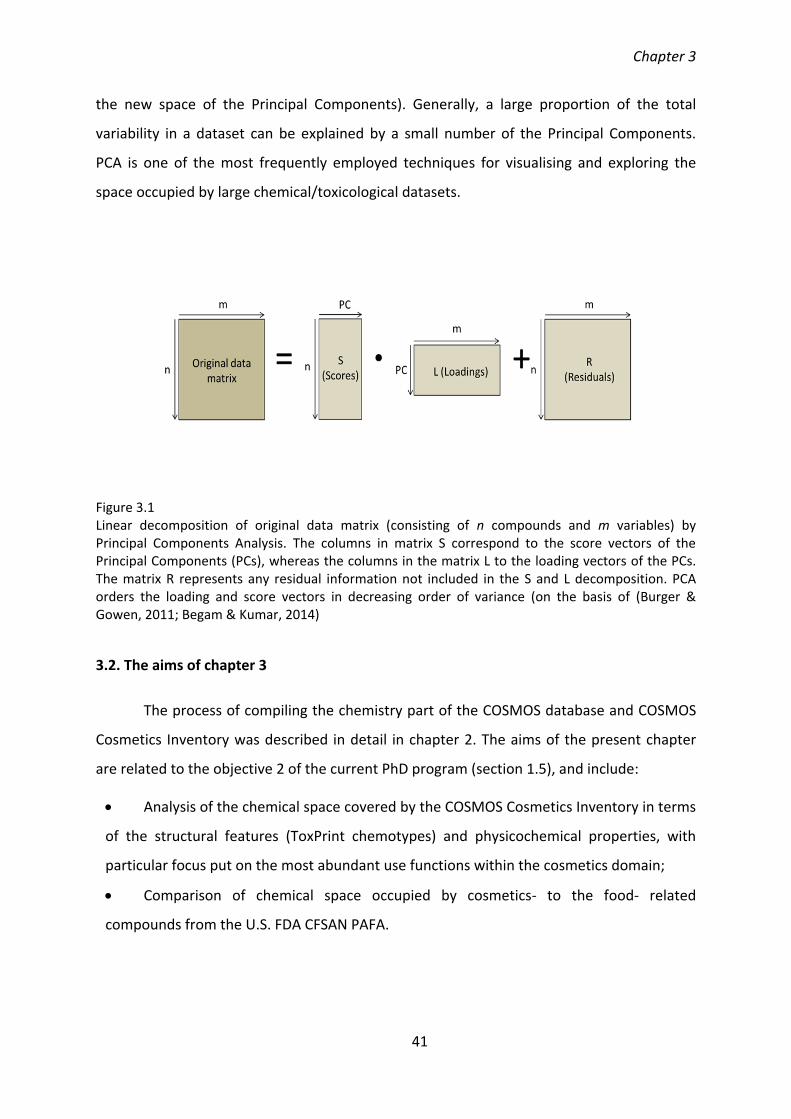
Chapter 3
41
the new space of the Principal Components). Generally, a large proportion of the total
variability in a dataset can be explained by a small number of the Principal Components.
PCA is one of the most frequently employed techniques for visualising and exploring the
space occupied by large chemical/toxicological datasets.
Figure 3.1 Linear decomposition of original data matrix (consisting of n compounds and m variables) by Principal Components Analysis. The columns in matrix S correspond to the score vectors of the Principal Components (PCs), whereas the columns in the matrix L to the loading vectors of the PCs. The matrix R represents any residual information not included in the S and L decomposition. PCA orders the loading and score vectors in decreasing order of variance (on the basis of (Burger & Gowen, 2011; Begam & Kumar, 2014)
3.2. The aims of chapter 3
The process of compiling the chemistry part of the COSMOS database and COSMOS
Cosmetics Inventory was described in detail in chapter 2. The aims of the present chapter
are related to the objective 2 of the current PhD program (section 1.5), and include:
Analysis of the chemical space covered by the COSMOS Cosmetics Inventory in terms
of the structural features (ToxPrint chemotypes) and physicochemical properties, with
particular focus put on the most abundant use functions within the cosmetics domain;
Comparison of chemical space occupied by cosmetics- to the food- related
compounds from the U.S. FDA CFSAN PAFA.
Chapter 3
42
3.3. Materials and methods
3.3.1. Analysed inventories
The chemical space analysis was performed for the two following inventories:
COSMOS Cosmetics Inventory containing 5,562 structures (the collation of the
COSMOS Cosmetics Inventory was described in chapter 2);
Food-related compounds from the U.S. FDA CFSAN PAFA database (Table 2.1)
including 4,337 structures.
The structures comprising both inventories were obtained from the COSMOS
database as 2D SD files (referred to herein as “2D-tested” SDFs). The chemical space analysis
was performed with respect to both, structural features and physicochemical properties.
Each part of the analysis was based on a different methodology, thus required a different
type of original SD files pre-processing.
3.3.2. Use functions of cosmetics-related compounds
Prior to the chemical space analysis, the COSMOS Cosmetics Inventory was
characterised with respect to the 66 chemical use functions associated with cosmetics-
related compounds from the EU COSING database (Table 2.2). The entire list of COSING use
functions along with their definitions is provided in Annex 3. It was expected that specific
use functions will be reflected in the structural characteristics and physicochemical
properties of individual molecules.
3.3.3. Structural features (chemotypes) analysis
The analysis of general structural features represented by cosmetics and food
related compounds was performed using novel approach based on the ToxPrint chemotypes
(Yang et al., 2015), belonging to the structural fingerprints type of descriptors. The term
“chemotype” refers to a means of representing the chemical entities as structural fragments
encoded for connectivity (which may extend beyond a single connected fragment). If
needed, chemotypes may be also encoded for physicochemical properties of atoms, bonds,
fragments, electron systems and even whole molecules. The conceptual graph of the
chemotype is presented in Figure 3.2.

Chapter 3
43
Figure 3.2 Schematic definition of a chemotype
The ToxPrint chemotypes (Yang et al., 2015), which were developed from over
100,000 chemicals present in publicly available chemical inventories and toxicity databases,
cover a range of hierarchically organised structural classes (Table 3.3) and capture broad
chemical spaces of food ingredients, food direct additives, food-contact substances,
pharmaceuticals, agrochemicals, cosmetics ingredients and industrial chemicals. The library
of 729 ToxPrint chemotypes is publicly available at www.toxprint.org and can be
downloaded as a .csrml (Chemical Subgraphs and Reactions Markup Language) file (Yang et
al., 2015).
Table 3.3 Classes of ToxPrint chemotypes (from Yang et al., 2015)
Top class
1st level classes Total # of chemotypes
Atom main group element, metal (group I, II, III, transition metals, metalloid, poor metals)
Bond
C#N, C(∼Z)∼C∼Q, C(=O)N, C(=O)O, C=N, C=O, C=S, CC(=O)C, CN, CNO, COC, COH, CS, CX, metal, N(=O), N[!C], N=[N+]=[N−], N=C=O, N=N, N=O, NC=O, NN, NN=N, NO, OZ, P(=O)N, P=C, P=O, PC, PO, QQ(Q∼O_S), quaternaryN, quaternaryP, quaternaryS, S(=O)N, S(=O)O, S(=O)X, S=O, Se∼Q, X(any), X[(any)_!C], X∼Z
411
Chain alkaneBranch, alkaneCyclic, alkaneLinear, alkeneBranch, alkeneCyclic, alkeneLinear, alkyne, aromaticAlkane, aromaticAlkene, oxy-alkaneBranch, oxy-alkaneLinear
95
Group aminoAcid, carbohydrate, ligand, nucleobase 69
Ring aromatic, fused, hetero, polycycle 144
In the current analysis, the ToxPrint chemotypes were used to explore and compare
the structural space occupied by cosmetics- and food- related compounds. For
comprehensive investigation, it was particularly important to preserve all chemical classes

Chapter 3
44
occurring in both inventories, including inorganics, organometallics, organometals and
metal complexes. Generating the fingerprints using ToxPrint chemotypes in this analysis did
not require 3D computational structures. The salts and IOM compounds were therefore
retained, and “2D-tested” SD files were used as input.
The analysis was performed with the publicly available (www.chemotyper.org)
software application, ChemoTyper (Altamira LLC, Columbus, OH, USA; Molecular Networks
GmbH, Nüremberg, Germany). Using the ChemoTyper, the input structures (imported from
the “2D-tested” SD files) were mapped against the predefined ToxPrint library
(toxprint_V2.0_r711.xml file downloaded at www.toxprint.org). The features describing the
query compounds were subsequently exported in the form of a table of binary chemical
fingerprints. The rows in this data matrix corresponded to particular molecules (structures)
and the columns to particular ToxPrint chemotypes: a value of 1 indicated that the
compound contained a given feature, whereas a value of 0 that it did not.
The frequencies of particular ToxPrint chemotypes (i.e. the number of “matches”
between ToxPrint chemotypes and the query structures) have been investigated. The
structural domains of the analysed inventories were presented in terms of distributions of
the compounds across specified generic structural classes.
3.3.4. Analysis of physicochemical properties
The physicochemical properties space covered by the two inventories was
investigated using diverse types of molecular descriptors. Therefore, this part of the analysis
required pre-processing of original “2D-tested” files and generating 3D-computational
structures. All these steps, as well as descriptors calculations, were conducted in the Corina
Symphony software tool (Molecular Networks GmbH, Nüremberg, Germany).
The salts and IOM compounds identified through the material type and composition
type annotations (section 2.4.1) have been excluded from investigation. The input files
containing only organic compounds were pre-processed with the following options:
desalting and small fragments removal, neutralising charged compounds, detecting and
removing duplicate structures. Subsequently, the 3D coordinates have been generated and
oriented according to their maximal moments of inertia. The resulting SD files (referred to

Chapter 3
45
herein as “3D-computational” SD files) were used to calculate the “global molecular” and
“size and shape” descriptors in Corina Symphony.
The data matrix containing (n) rows corresponding to the chemical compounds and
(m) columns corresponding to the calculated descriptors was subsequently used as input in
the Principal Components Analysis (PCA) performed in the JMP Pro 12.2.0 software tool
(JMP, SAS Institute Inc.). For m standardised original variables (transformed to have zero
mean and unit variance), m PCs were calculated. The first PC was the linear combination of
the standardised original variables that had the greatest possible variance. Each subsequent
PC was the linear combination of the variables that had the greatest possible variance and
was uncorrelated with all previously defined components. The PCs explaining the large
portion of variance in the analysed datasets and having the eigenvalues >1 were considered
in the final analysis. Their scores were projected into 3D plots to visualise the
physicochemical properties space. The most influential properties were identified.
3.4. Results
3.4.1. COSMOS Cosmetics Inventory – use functions analysis
The COSMOS Cosmetics Inventory was characterised with respect to the 66 chemical
use functions from the EU COSING database. The Cosmetics Inventory is very diverse, with
the majority of its constituents associated with multiple (up to 18) functions (for 72% of
Cosmetics Inventory compounds up to three functions have been reported). The most
populated use functions include skin protection and skin conditioning agents, surface-active
agents (surfactants, emulsifiers, emulsion stabilisers, foaming agents and foam boosters),
perfuming agents, and hair fixing and conditioning substances (Figure 3.3). The most
populated use functions in the cosmetics domain have been further characterised with
respect to their structural features and physicochemical properties in the following sections
of this chapter.

Chapter 3
46
Figure 3.3 The most populated COSING use functions in the COSMOS Cosmetics Inventory
3.4.2. Structural (chemotypes) space analysis
The structural features (ToxPrint chemotypes) analysis was performed for cosmetics
related compounds from the COSMOS Cosmetics Inventory (5,562 compounds) and food
related compounds from the U.S. FDA CFSAN PAFA (4,337 compounds). The overlap
between the two inventories (on the basis of the CMS IDs and InChI Keys generated for “2D-
tested” structures) is presented in Figure 3.4.
Figure 3.4 Venn Diagrams demonstrating the overlap between the COSMOS Cosmetics Inventory and food related compounds from the U.S. FDA CFSAN PAFA:
(A) The inventories were compared by CMS IDs of compounds with available structures; 1,773 (out of 8,126) compounds appeared in both inventories; 3,552 was found only in COSMOS Cosmetics Inventory; 2,429 – only among PAFA members;
(B) The original (not processed) 2D structures from both inventories were compared by the InChI Keys. A total of 7,509 unique InChI Keys was present in both inventories (the 617 structural duplicates resulted from using representative structures; please refer also to Table 2.4); 1,725 InChi Keys were common in both inventories

Chapter 3
47
The structural domain of both inventories was covered by a total number of 553 (out
of 729) ToxPrint chemotypes indicating a very sparse structural space. The overlap between
structural features identified in each individual inventory (Figure 3.5) is large: 455 out of 553
ToxPrint chemotypes appeared in both the COSMOS Cosmetics Inventory and PAFA.
However, due to distinctive use functions of cosmetics- and food-related compounds,
several features appearing exclusively in only one of the inventories were also observed
(Figure 3.5). For instance, organotin compounds (appearing in food contact materials) and
dithiocarbamates (food contact substances, antimicrobials, food direct additives) were
found only in PAFA, whereas several transition metals (used as preservatives, buffers or
antimicrobials), metals from group III of periodic table (cosmetics colorants, hair dyes,
antiperspirants, deodorants, also buffering and chelating agents), certain carbohydrates
(skin conditioning, surface active agents, antioxidants), purine/adenine (skin conditioning),
or polyethylene glycols with >10 ethylene oxide (EO) units (surface-active agents) were
present only in the inventory of cosmetics related compounds.
Figure 3.5 Venn diagram showing the overlap of ToxPrint chemotypes between the two investigated inventories
Both analysed inventories had similar proportions of acyclic carboxylic esters,
aromatic carboxylic acids, halides, aromatic aldehydes, aliphatic ketones, benzyl alcohols,
and heterocyclic rings (Figure 3.6).

Chapter 3
48
Figure 3.6 The structural classes (ToxPrint chemotypes) uniformly distributed between the two investigated inventories expressed as ratios of % frequencies (the actual counts of each feature are given on the plot’s bars)
The structural classes appearing more frequently among cosmetics- than food-
related compounds are presented in Figure 3.7. They include: polyethylene glycols,
quaternary ammonium salts, organosilicons, long chain linear and branched alkanes and
diethanolamines (i.e. the classes characteristic for surface active agents), primary,
secondary, and tertiary aromatic amines, nitro- and azo- aromatic compounds (specific for
cosmetics colorants and hair dyes, i.e. relatively reactive compounds that would not be
associated with food), cyclic/heterocyclic and fused rings (present predominantly in
perfuming agents).
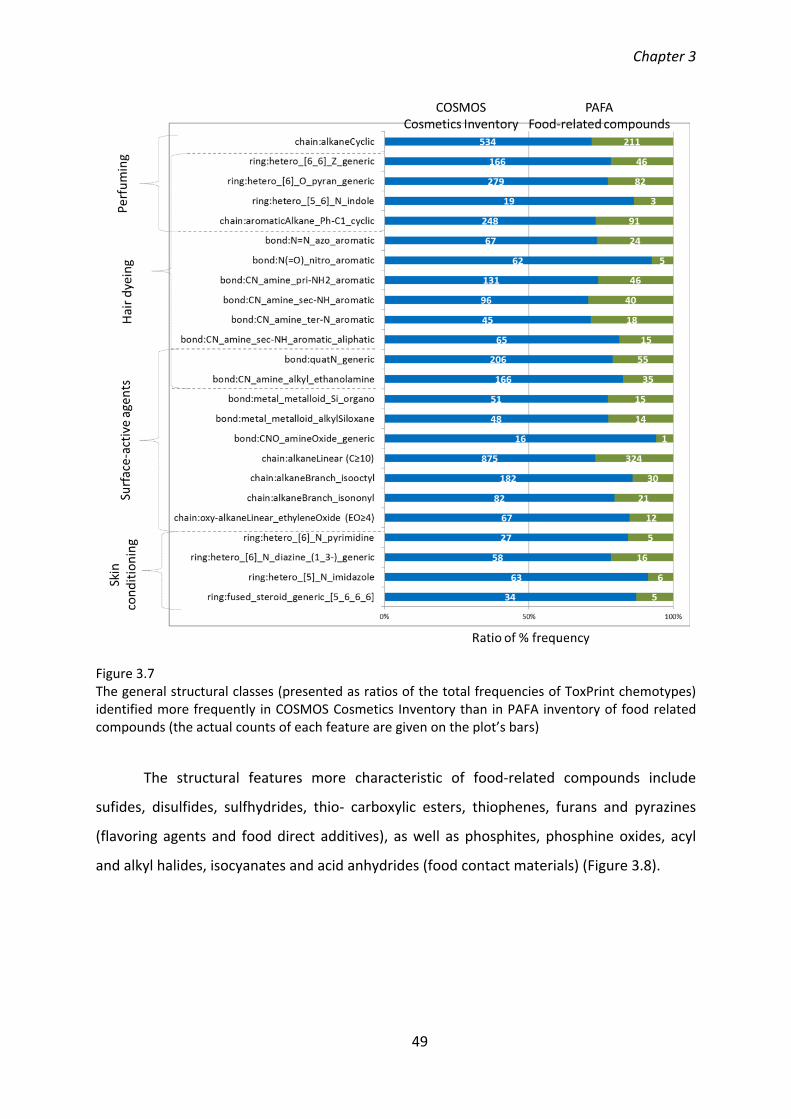
Chapter 3
49
Figure 3.7 The general structural classes (presented as ratios of the total frequencies of ToxPrint chemotypes) identified more frequently in COSMOS Cosmetics Inventory than in PAFA inventory of food related compounds (the actual counts of each feature are given on the plot’s bars)
The structural features more characteristic of food-related compounds include
sufides, disulfides, sulfhydrides, thio- carboxylic esters, thiophenes, furans and pyrazines
(flavoring agents and food direct additives), as well as phosphites, phosphine oxides, acyl
and alkyl halides, isocyanates and acid anhydrides (food contact materials) (Figure 3.8).

Chapter 3
50
Figure 3.8 The general structural classes (presented as ratios of the total frequencies of ToxPrint chemotypes) identified more frequently in PAFA inventory of food related compounds than in the COSMOS Cosmetics Inventory (the actual counts of each feature are given on the plot’s bars)
3.4.3. Physicochemical properties space analysis
The physicochemical properties space occupied by COSMOS Cosmetics Inventory
and food-related compounds from PAFA was analysed with 14 (Table 3.4) Corina Symphony
“global molecular” and “size and shape” descriptors (Molecular Networks, Nüremberg,
Germany). They were calculated for 5,664 3-dimensional computational structures (3,935
cosmetics- and 3,022 food-related compounds) generated after:
Removing IOM compounds (997 from COSMOS Cosmetics Inventory and 1,068 from
PAFA);
Removing small fragments (in 705 compounds from COSMOS Cosmetics Inventory
and 309 from PAFA);
Neutralising charged fragments (in 343 compounds from COSMOS Cosmetics
Inventory and 157 from PAFA);

Chapter 3
51
Removing duplicates (630 from COSMOS Cosmetics Inventory and 247 from PAFA).
The overlap between the two final structure files is presented in Figure 3.9.
Figure 3.9 Venn Diagram demonstrating the overlap between COSMOS Cosmetics Inventory and food related compounds from the U.S. FDA CFSAN PAFA – comparison by unique InChI Keys generated for 3D-computational structures
Table 3.4 CORINA Symphony (Molecular Networks GmbH, Nüremberg, Germany) descriptors utilised in chemical space analysis.
GLOBAL MOLECULAR PROPERTIES
Number of open-chain, single rotatable bonds (BondsRot) [unitless]
Number of hydrogen bonding acceptors derived from the sum of nitrogen and oxygen atoms in the molecule (H-Acc) [unitless]
Molecular weight derived from the gross formula (MW) [Da]
Octanol/water partition coefficient of the molecule following the XlogP approach (Log P) [unitless]
McGowan molecular volume approximated by fragment contributions (McGowan) [mL/mol]
Topological polar surface area of the molecule derived from polar 2D fragments (TPSA) [Å2]
Mean molecular polarisability of the molecule (Polariz) [Å3]
SHAPE DESCRIPTORS
Molecular diameter – maximum distance between two atoms in the molecule (Diameter) [Å]
Molecular eccentricity (Eccentric) [unitless]
Molecular radius of gyration (Rgyr) [Å]
Molecular span – radius of the smallest sphere centred at the centre of mass which completely encloses all atoms in the molecule (Span) [Å]
Principal moment of inertia of 1st principal axis (InertiaX) [Da∙Ų]
Principal moment of inertia of 2nd principal axis (InertiaY) [Da∙Ų]
Principal moment of inertia of 3rd principal axis (InertiaZ) [Da∙Ų]

Chapter 3
52
The Principal Components Analysis reduced the dimensions of 14 molecular
descriptors to 3 representative PCs. The three PCs described a total of 89.73% of the
variance in the defined chemical space. The scree plot (i.e. the plot of eigenvalues vs
number of PCs) and variance explained by each PC are presented in Figure 3.10)
Figure 3.10 Scree plot and % variance explained by each calculated Principal Component. The PCs with eigenvalues >1 were considered. The plot was prepared in JMP Pro 12.2.0 software tool (JMP, SAS Institute Inc.)
The scores of the 3 PCs were used to generate 3D score plots (Figure 3.11) visualising
the physicochemical properties space occupied by the compounds investigated.
Figure 3.11 The 3D score plots visualising the physicochemical properties space of COSMOS Cosmetics Inventory and the U.S. FDA CFSAN PAFA database covered by the three PCs explaining 89.7% of the cumulative variance in both inventories (A). Due to the large number of plotted compounds, additional plots were included: (B) Highlighted COSMOS Cosmetics Inventory compounds; (C) Highlighted compounds present in both, cosmetics inventory and PAFA; (D) Highlighted food-related compounds from the U.S. FDA CFSAN PAFA database. The plots were prepared in JMP Pro 12.2.0 software tool (JMP, SAS Institute Inc.)

Chapter 3
53
The most influential properties associated with each PC are presented in Figure 3.12.
The descriptors related to the flexibility of the molecules (BondsRot), their size and shape
(MW, McGowan Diameter, Inertia, Rgyr, Span), as well as to the hydrophobicity/lipophilicity
(logP) had the most significant impact on PC1. Topological polar surface area and the
hydrogen-bonding (H-Acc) related properties had the highest loadings on the PC2. The
descriptors related to the size and shape of the molecules (Eccentric, InertiaX) were the
most significant in the PC3 (Figure 3.12).
Figure 3.12 The loading bar plots for the three Principal Components characterising physicochemical space occupied by the cosmetics- and food- related compounds. The properties with loadings above (or close to) 0.7 were considered the most influential
The 3D PCs score plot (Figure 3.11) demonstrates that physicochemical properties
space covered by cosmetics- and food- related compounds is very sparse and similar in
shape. It indicates that both inventories cover a broad and similar range of values of utilised
descriptors. This is not unexpected, considering a diversity of structural classes identified
(3.4.2). The results of this analysis however suggest that the physicochemical properties
utilised do not have sufficient power to discriminate between both inventories when
applied alone and that structural features analysis is necessary to identify the differences
between cosmetics- and food- related compounds.
As discussed in sections 3.4.1 and 3.4.2, the COSMOS Cosmetics Inventory is very
diverse and includes cosmetics ingredients associated with multiple use functions. The most

Chapter 3
54
populated use categories were therefore projected in the physicochemical properties space
defined by PC1-PC3 (Figure 3.13). It became apparent that the compounds representing
different use functions occupy very distinct regions represented by unique properties and
are associated with specific structural features (section 3.4.2).
Figure 3.13 Projection of the most populated COSING use functions on the 3D score plot visualising the physicochemical properties space of analysed inventories of compounds. The plots were prepared in JMP Pro 12.2.0 software tool (JMP, SAS Institute Inc.)
3.5. Discussion
The chemical space of the COSMOS Cosmetics Inventory was analysed and compared
with the chemical space of food-related compounds from the U.S. FDA CFSAN PAFA
database. The novel approach of the ToxPrint chemotypes was used to determine the
structural domains of each inventory. Subsequently, the associations between structural
features, physicochemical properties, and use functions (with detailed applications within
cosmetics domain) were identified.
It was demonstrated that cosmetics- and food- related chemicals cover sparse, but
similar in shape, chemical space. The structural domain of both inventories was captured by
a large number of 553 (out of 729) ToxPrint chemotypes, indicating a large variety of the
Chapter 3
55
occurring structural classes. This diversity was reflected also in the broad ranges of the
values covered by investigated physicochemical properties.
Both inventories analysed are broadly represented by carboxylic esters, aromatic
carboxylic acids, halides, aromatic aldehydes, aliphatic ketones, benzyl alcohols, and
heterocyclic rings. Several differentiating characteristics were also identified. The structural
classes dominating among cosmetics-related compounds were associated with specific use
functions and manifested through distinct physicochemical properties. Surfactants,
emollients (softening and smoothing the skin) and humectants (holding and retaining the
moisture) were particularly rich in carboxylic esters, polyethylene glycol esters, ethoxylated
aliphatic alcohols, diethanolamines (DEA) and carboxamides (specific for nonionic
surfactants), carboxylates and alkyl sulfates (anionic surfactants), quaternary ammonium
salts (cationic surfactants), carbohydrate-based structures and long, linear and branched
alkanes and alkenes. Perfuming agents included mostly aliphatic, cyclic and aromatic
ketones, aldehydes, alcohols, diols, ethers and carboxylic acids, alkanes (aromatic with
predominantly short C2-C4 chains attached to phenyl rings and aliphatic with short C2-C4
chains), compounds with polycyclic rings, and heterocyclic compounds with 3- (e.g.
epoxides), 5- (e.g. oxolanes, pyrroles), 6- (e.g. pyranes) and 7-membered (e.g. oxepins) rings.
The compounds used as cosmetics colorants and hair dyes were widely represented by
aromatic and aliphatic amines, azo- compounds, nitro- compounds (multiple nitro- aromatic
amines and nitro- benzenes), compounds with fused (naphthalene, indane, phenanthren,
pyrene) and hetero- aromatic rings. The structural features characteristic for the food
related compounds included sufides, disulfides, sulfhydrides, thio- carboxylic esters,
thiophenes, furans and pyrazines, occurring mostly in in flavoring agents and food direct
additives, as well as phosphites, phosphine oxides, acyl and alkyl halides, isocyanates and
acid anhydrides abundant among food contact substances.
The results of the present analysis demonstrate the utility and relevance of the novel
methodology (ToxPrint chemotypes- and physicochemical properties-based) for the analysis
of the chemical space occupied by large inventories of compounds. It allowed for
identification of the differences between various use classes in the cosmetics domain,
suggesting the need to treat them separately during computational modeling (i.e.
development of different models and/or using different modelling approaches for different
Chapter 3
56
groups). The fact that the analysis performed revealed differences between different use
functions of cosmetics ingredients indicates the usefulness of this approach for chemical
design and toxicity prediction as well as for read-across and category formation.

Chapter 4
57
Chapter 4
The COSMOS Skin Permeability Database: Harvesting, Curating and Quality Control of the
Data
4.1. Background
4.1.1. Measurement of skin permeability
Skin permeability is a complex biological and physicochemical process involving the
transport of chemicals from the outer surface of the skin to the systemic circulation. The
amount of a chemical penetrating the skin at a given time determines whether the chemical
can potentially be bioavailable (i.e. absorbed into the systemic circulation) and, as such,
exert toxicity after topical exposure (it should be noted that systemic absorption can be
preceded by metabolic transformation(s) of a substance within the deeper layers of the
viable skin). The mechanistic and physicochemical basis of skin permeability/absorption as
well as multiple factors influencing its rate is described in more detail in chapter 5.
Experimental measurement of dermal penetration/absorption can be conducted
both in vivo and in vitro. It should be noted that since the implementation of recent EU
legislation (EC, 2009), the testing of new cosmetic ingredients in vivo has been prohibited.
Historically, no standardised experimental protocols for any type of dermal penetration
testing were formulated. Early in vitro models were not associated with any formal
validation program (numerous in-house procedures were used in industry and academia). It
took several decades to publish formally agreed guidelines, however the documents (Table
4.1) remain broad in nature and do not endorse specific protocols or protocol components
(Brain et al., 2005).
Due to the historical lack of standard testing procedures to measure skin
permeability, and the plethora of factors influencing the permeability/absorption process
(e.g. species, sex, application site, dosage regimen, vehicle, occlusion, etc.; please refer also
to chapter 5), experimental results are highly variable (Brain et al., 1995; Walters et al.,
1997; van de Sandt et al., 2004). This presents a major challenge to the development of
computational tools, as data variability is related to a decrease in the statistical validity of
the models developed. The lack of accuracy of the experimental values together with errors

Chapter 4
58
across different datasets contributes to the paucity of high quality data for skin
permeability/absorption modelling.
Table 4.1 Overview of the test guidelines and other relevant documents available for the measurement of skin permeability/absorption
Test method Available guidelines and documents
In vivo
o EC Test Method B.44: Skin Absorption: In Vivo Method (EC, 2008)
o OECD Test Guideline 427: Skin Absorption: In Vivo Method (OECD, 2004a)
o WHO Environmental Health Criteria 235: Dermal Absorption (WHO, 2006)
o EFSA Guidance on Dermal Absorption (EFSA, 2012)
In vitro
o EC Test Method B.45: Skin Absorption: In Vitro Method (EC, 2008)
o OECD Test Guideline 248: Skin Absorption: In Vitro Method (OECD, 2004b)
o WHO Environmental Health Criteria 235: Dermal Absorption (WHO, 2006)
o Basic Criteria for the In Vitro Assessment of Dermal Absorption of Cosmetic Ingredients (SCCS, 2010)
o EFSA Guidance on Dermal Absorption (EFSA, 2012)
4.1.2. The COSMOS Skin Permeability Database
For over a decade the necessity of construction of an accurate, well-curated skin
permeability database has been recognised. The European Union project “Evaluations and
Predictions of Dermal Absorption of Toxic Chemicals” (EDETOX), coordinated by the
University of Newcastle, UK (Project Number: QLKA-2000-00196) was a three-year initiative
launched in 2000, which aimed to address the need for a comprehensive database of skin
permeability values. One of the outcomes of this project was the EDETOX database (publicly
available at: http://edetox.ncl.ac.uk/), containing in vitro and in vivo percutaneous
absorption/penetration studies recorded for 320 chemicals from the published literature.
The EDETOX database provides information on the following skin absorption/permeability
parameters: percentage of dose absorbed, percentage of dose recovered, maximal flux,
permeability coefficient, and lag time, wherever available (please refer to chapter 5 for
definitions of these parameters). Although being a valuable resource of experimental data
on skin permeability/absorption, the EDETOX database alone did not contain sufficient
information on cosmetics ingredients and related chemicals to meet the needs of modellers
in this area (specifically in the COSMOS project). Only about 35% of the substances in the

Chapter 4
59
EDETOX database could be considered cosmetics-related, as they have been also found in
the COSMOS Cosmetics Inventory.
A database was donated to the current data gathering initiative by Dr Taravat
Ghafourian from the Medway School of Pharmacy, University of Kent, Chatham, UK, whose
contribution is gratefully acknowledged. This database is referred to herein simply as “the
Kent database”. It was compiled as an update of the EDETOX database after the exhaustive
survey of over 1,800 recent (2001-2010) literature publications (Samaras et al., 2012).
Although it includes human skin absorption/permeability data from in vitro experiments for
a total number of 254 compounds, it again lacks information on cosmetics ingredients and
related compounds, as its focus was placed mostly on pharmaceuticals.
The COSMOS Skin Permeability Database was therefore developed to address all of
the above issues (please refer to Annex 1). On one hand, a database consolidation approach
was applied for existing data i.e. the merging of the EDETOX and Kent databases. On the
other, new data were harvested from a range of regulatory and literature sources. In
particular, the main emphasis was placed on harvesting skin permeability data published
after the completion of the EDETOX database. Concerns over the accuracy of data were
minimised by establishing a consistent procedure for data curation and quality control.
4.1.3. General aspects of the quality of biological data
The quality of any biological data incorporated into a structured database depends
on many complex aspects, but the most essential are the reliability of the data record and
the data acceptance, both of which are described below.
4.1.3.1. The reliability of the data record
The data reliability refers to the accuracy of database records with respect to the
original data and to the completeness of the original data with regard to the relevant
guidelines. Guideline studies, i.e. the studies that have been performed in compliance with
the protocols specified by internationally accepted documents, e.g. OECD Guidelines for the
Testing of Chemicals, are usually conducted according to the Good Laboratory Practice (GLP)
Regulations (e.g. OECD, 1998) (the exceptions are the guideline studies pre-dating the GLP
regulations). GLP defines a set of principles for planning, performing, monitoring, recording,

Chapter 4
60
reporting and archiving laboratory studies. Guideline, GLP-compliant studies are usually
considered to be of high reliability.
The reliability of the data record can be assessed algorithmically at the time of the
data entry. Each toxicity database defines a set of specific study inclusion criteria, i.e. the
characteristics that the toxicological study must have in order to be included in the database
(accordingly, the exclusion criteria would be the characteristics disqualifying the study from
being included in the database, e.g. missing information on the test species). Compliance of
the data records with the database inclusion criteria can be used to score the data for
reliability. The study inclusion criteria play a particularly significant role in case of toxicity
studies which have not followed any formal guideline document(s), i.e. non-guideline
studies (e.g. old studies preceding the guideline documents). Often, when qualified
according to the database-specific inclusion criteria (usually less stringent than the formal
guideline requirements), such studies can be considered as a usable source of information.
Further, data accuracy can be assessed by the database Quality Control (QC) process
and evaluated statistically by the Quality Assurance (QA) process (as defined in chapter 2).
4.1.3.2. Data acceptance
Data acceptance addresses the issues of the interpretability and relevance of data
with respect to a particular purpose. The accuracy and completeness of recorded
information does not implicitly ensure that this information leads to appropriate
conclusions. Thus, acceptance is a more subjective, and a more difficult to quantify, aspect
of data quality as it has to be evaluated by toxicologists with regard to a specific scientific
question.
4.1.3.3. The Klimisch scoring system for data quality assessment
An example of a broadly applied (e.g. by ECHA) method of ascertaining the quality of
biological data is the scoring system devised by Klimisch et al. (Klimisch et al., 1997). The
Klimisch scheme, originally devised to evaluate the quality of fish acute toxicity data has
been expanded and is currently applied to all toxicity endpoints. Klimisch and co-workers
recognise three aspects of biological data quality: reliability, relevance and adequacy. With
respect to the data reliability, the Klimisch score system has been developed to assign
toxicity data into one of four categories (Table 4.2).

Chapter 4
61
Table 4.2 The Klimisch score system (from Klimisch et al., 1997)
Data quality aspect
Definition
Reliability Evaluating the inherent quality of a test report or publication relating to preferably standardised methodology and the way the experimental procedure and results are described to give evidence of the clarity and plausibility of the findings. The following categories can be distinguished:
(1) reliable without restrictions
“Studies or data from the literature or reports which were carried out or generated according to generally valid and/or internationally accepted testing guidelines (preferably performed according to GLP) or in which the test parameters documented are based on a specific (national) testing guideline (preferably performed according to GLP) or in which all parameters described are closely related/comparable to a method.”
(2) reliable with restrictions
“Studies or data from the literature, reports (mostly not performed according to GLP), in which the test parameters documented do not totally comply with the specific testing guideline, but are sufficient to accept the data or in which investigations are described which cannot be subsumed under a testing guideline, but which are nevertheless well documented and scientifically acceptable.”
(3) not reliable “Studies or data from the literature/reports in which there were interferences between the measuring system and the test substance or in which organisms/test systems were used which are not relevant in relation to the exposure (e.g. unphysiologic pathways of application) or which were carried out or generated according to a method which is not acceptable, the documentation of which is not sufficient for assessment and which is not convincing for an expert judgment.”
(4) not assignable
“Studies or data from the literature, which do not give sufficient experimental details and which are only listed in short abstracts or secondary literature (books, reviews, etc.).”
Relevance Covering the extent to which data and/or tests are appropriate for particular hazard identification or risk characterisation.
Adequacy Defining the usefulness of data for hazard/risk assessment purposes. When there is more than one set of data for each effect, the greatest weight is attached to the most reliable and relevant one.
The controversial point of the Klimisch scoring system is the term “restriction” in the
categories of data quality, as it mixes the paradigms of data record reliability and
acceptance by requiring human expert judgements.
4.1.4. Data record reliability in the COSMOS skin permeability database
The study inclusion criteria (please refer to section 4.1.3.1 for the definition of the
term inclusion criteria) of the COSMOS Skin Permeability Database were established with

Chapter 4
62
respect to its data model, which was defined by the experimental protocols of the in vitro
and in vivo dermal permeability/absorption tests available from the EDETOX database and
described by the OECD test guidelines (OECD, 2004a; OECD, 2004b). The study inclusion
criteria of the EDETOX database required the following information types to be clearly
provided in the source publications: chemical concentration (concentration of chemical
applied), dose volume (volume of chemical applied to the skin), loading (amount of chemical
added per unit area), area (area of skin to which the chemical was applied), vehicle
(application medium), species (species of animal used in the study), exposure time (length
of time the chemical was left on the skin), analytical method (method by which the results
were determined), receptor fluid (medium that bathes the underside of the skin) and
temperature (temperature of the receptor fluid/skin/water bath during in vitro
experiments).
The COSMOS Skin Permeability Database data model (Figure 4.1) was designed with
respect to both in vitro and in vivo percutaneous penetration/absorption studies. The
following information types have been specified for in vitro experiments:
The test system details on skin donor (species, strain, sex, age/weight at the time of
skin harvesting, number of donors) and skin membrane (membrane type, thickness, size
and storage, site from which the skin was obtained);
The test conditions, including the dosage details (vehicle, receptor solutions, dose
levels, exposure time, etc.) and diffusion parameters (diffusion cell types and size, bath
and mounted membrane temperature, flow value, etc.);
The study results for skin permeability/absorption parameters (lag time, steady-state
flux, absorption – as total amount and/or % of dose absorbed permeability coefficient) and
recovery (i.e. amounts and/or % of dose recovered from particular skin layers and receptor
fluid, also washed from the skin surface and remaining on the diffusion cell material).
The criteria relevant to in vivo experiments include:
The test system details on the test animals (species, strain, sex, age/weight at the
study initiation, number of animals) and dosed sites (site and site area);
The test condition details on dosage regimen (dose application method, dose
delivery type, e.g. single or repeated dose, vehicle, dose levels, exposure duration, etc.);
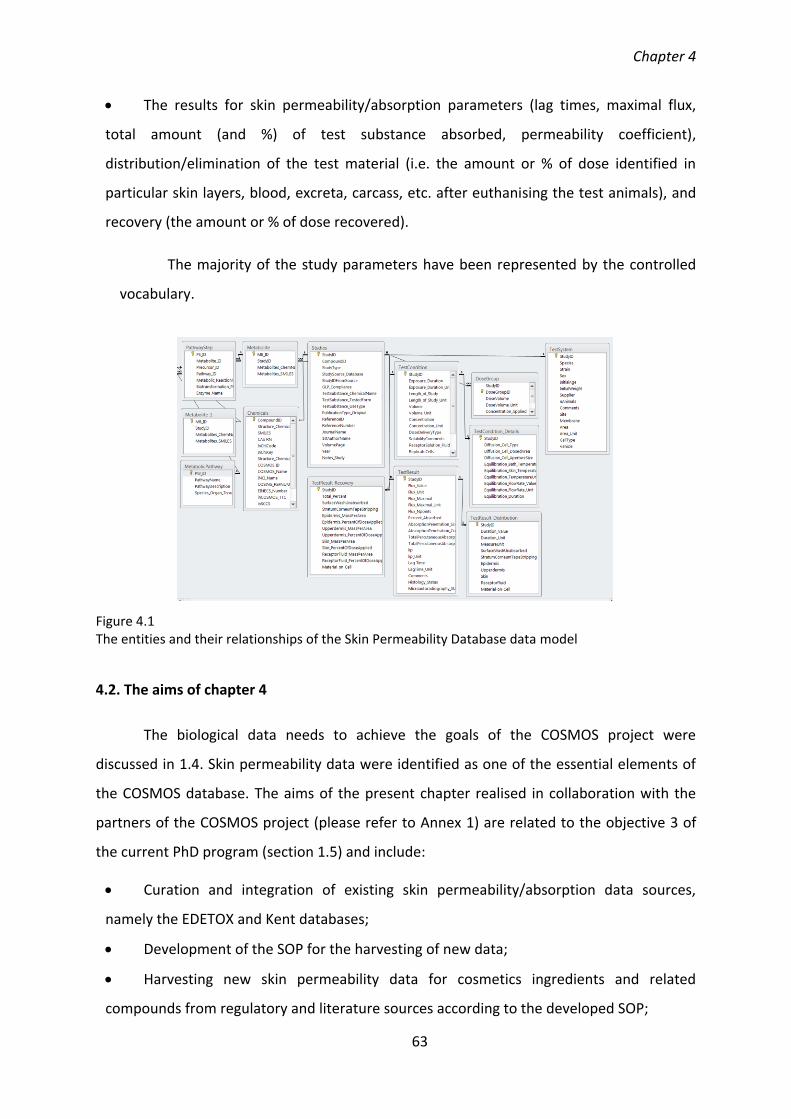
Chapter 4
63
The results for skin permeability/absorption parameters (lag times, maximal flux,
total amount (and %) of test substance absorbed, permeability coefficient),
distribution/elimination of the test material (i.e. the amount or % of dose identified in
particular skin layers, blood, excreta, carcass, etc. after euthanising the test animals), and
recovery (the amount or % of dose recovered).
The majority of the study parameters have been represented by the controlled
vocabulary.
Figure 4.1 The entities and their relationships of the Skin Permeability Database data model
4.2. The aims of chapter 4
The biological data needs to achieve the goals of the COSMOS project were
discussed in 1.4. Skin permeability data were identified as one of the essential elements of
the COSMOS database. The aims of the present chapter realised in collaboration with the
partners of the COSMOS project (please refer to Annex 1) are related to the objective 3 of
the current PhD program (section 1.5) and include:
Curation and integration of existing skin permeability/absorption data sources,
namely the EDETOX and Kent databases;
Development of the SOP for the harvesting of new data;
Harvesting new skin permeability data for cosmetics ingredients and related
compounds from regulatory and literature sources according to the developed SOP;

Chapter 4
64
Integration of the newly harvested data with the EDETOX and Kent content;
Preparation of data entry tool for QC of the COSMOS Skin Permeability Database.
4.3. Materials and methods
4.3.1. Data sources
New data harvesting was performed by six COSMOS consortium partners (Altamira,
BAS, U.S. FDA, S-IN, LJMU, and Molecular Networks; Please refer also to Annex 1). The focus
was placed on high priority compounds from the COSMOS Cosmetics Inventory, i.e. the
compounds for which oral repeated dose toxicity data had been identified, but for which
the information on dermal permeability/absorption was missing. The following data sources
were used:
The European Commission Scientific Committee on Consumer Safety (EU SCCS)
opinions on cosmetic ingredients, available at:
https://ec.europa.eu/health/scientific_committees/consumer_safety_en;
The European Chemicals Agency (ECHA) Registered Substances database:
https://echa.europa.eu;
Other relevant data sources: For cases where ECHA or SCCS opinions referenced an
unpublished report as the original data source, the information provided in the ECHA or
SCCS opinion was harvested. However, if the original source of data was a scientific
publication or a book chapter, the original data source was consulted.
4.3.2. Curation and integration of existing databases
The EDETOX content was imported into a Microsoft Access database for further use
as the COSMOS Skin Permeability Database. In order to merge it with the Kent database,
curation and quality control of original Kent records was necessary. Curation was performed
by Altamira/LJMU (Annex 1).
4.3.3. New data harvesting: data entry tool and data entry process
The data harvesters were provided with a data entry tool in the form of .xls file with
several tables corresponding to the COSMOS Skin Permeability Data Model (section 4.1.4),
prepared by Altamira/LJMU (Annex 1). In order to test the relevance of the .xls data entry
Chapter 4
65
tables, two cycles of the pilot data harvesting were conducted prior to the launch of the
final procedure. The pilot studies were accomplished successfully and provided a plethora of
valuable information on how to improve the .xls tables to make the data entry process more
convenient (for instance, the fields for recording specific activity value and unit of
radiolabeled test substances were added).
The final data harvesting was performed according to the Standard Operating
Procedure (SOP) which was prepared by Altamira/LJMU (Annex 1). The data entry tool
consisted of eleven .xls tables. Controlled vocabularies were distributed in the form of drop-
down pick lists and, along with the full SOP document, are provided in Annex 4. The details
of the data entry procedure are summarised in Figures 4.2-4.3, using 1,3-phenylenediamine
(CMS-1149, CAS RN: 108-45-2) as an example. This compound has been tested in vitro (the
EU ECHA database has been harvested) and in vivo (the data from the scientific publication
were harvested).
After finalising the data harvesting process, the results from each participating
COSMOS partner were combined and integrated with the content of EDETOX and Kent
databases by Altamira LLC (Annex 1).

Chapter 4
66
Figure 4.2 An illustration of the .xls data entry tables for skin permeability/absorption data harvesting (part 1): Chemistry (identification of the compound in the COSMOS database); StudySubstance (information on the tested substance, e.g. radiolabeling, tested form); StudyInfo (data quality related information), StudyReference (data origin); Metabolites (metabolism information, if available); and two tables related to the test system, namely TestAnimal and TestSkin. The fields marked in red refer to those controlled by vocabulary that have been not subjected to any changes, whereas the fields marked in green are those that were extended during the data harvesting

Chapter 4
67
Figure 4.3 An illustration of the .xls data entry tables for skin permeability/absorption data harvesting (part 2): TestDose (dosing conditions for each study – one study may be associated with multiple dose groups); TestDiffusion (details about the diffusion system utilised – applicable only for in vitro studies); TestResults (permeability/absorption parameters and distribution in blood/excreta/carcass, etc., in case of in vivo studies), TestRecovery (dose recovery information). The fields marked in red refer to those controlled by vocabulary that have been not subjected to any changes, whereas the fields marked in green refer to those that were extended during the data harvesting
4.3.4. The quality control of COSMOS Skin Permeability Database
During the data harvesting procedure, the data quality issues were addressed by
recording the Klimisch scores and information about the compliance of the studies with the
OECD guidelines (and GLP). This information was retrieved from the original data sources,
i.e. EU ECHA and SCCS. As a first step, the record reliability and accuracy of the data
harvested were reviewed manually (without any tools) at the stage of integrating new data
with the EDETOX/Kent content.

Chapter 4
68
Further, the QC of the COSMOS Skin Permeability Database content was performed
by the COSMOS Expert Group (EG) coordinated by the International Life Sciences Institute-
Europe (ILSI-Europe), including experts in this area: Prof. Mark Cronin (LJMU, Liverpool, UK),
Dr Chihae Yang (Altamira LLC), Prof. Faith Williams (University of Newcastle, Newcastle, UK),
Dr Nancy Monteiro-Riviere (Kansas State University, Manhattan, KS), Dr Gordon Barrett
(Health Canada), Dr Miriam Verwei (TNO), Dr James Plautz (DSM Nutritional Products, Ciba,
Inc., Switzerland) whose contribution is acknowledged. During this process, the experts also
contributed additional information relating to skin metabolism to the database.
Approximately 5% of compounds comprising the COSMOS Skin Permeability Database were
subjected to the QC. The experts were provided with the .xls QC entry tables prepared by
Altamira/ LJMU (with collaboration with the U.S. FDA; Please refer to Annex 1). The
template for the COSMOS Skin Permeability QC tables is presented in Figure 4.4. The QC
comments from the Expert Group were processed and incorporated into the final database.

Chapter 4
69
Figure 4.4 The template of the COSMOS Skin Permeability QC tables
4.4. Results
In order to address the general lack of publically available, good quality skin
permeability/absorption data for cosmetics and related compounds, the COSMOS Skin
Permeability Database was developed. Existing data (EDETOX and Kent databases) were
integrated with newly harvested ones.
The EDETOX database provided a total number of 1,657 records for in vitro studies
(244 unique chemicals) and 844 records for in vivo studies (156 unique chemicals) for 297
unique chemicals (126 cosmetics-related). It was combined with 999 records from the
curated Kent database containing:

Chapter 4
70
436 updated studies for 156 compounds already present in EDETOX;
563 new studies for 128 compounds (88 new compounds and 40 already included in
EDETOX. Out of those 88 new chemicals, only 16 were cosmetics-related).
The COSMOS data harvesting effort contributed 268 in vitro studies (for 85
compounds) and 159 in vivo studies (for 48 compounds) to the Skin Permeability Database.
In total, 103 cosmetics-related compounds were harvested (99 new compounds and 4
already present in the database).
Thus, the final COSMOS Skin Permeability Database contains 484 unique chemical
compounds for which 2488 in vitro and 1003 in vivo studies have been recorded (Figure 4.5).
Figure 4.5 COSMOS Skin Permeability Database: Final content with respect to the data origin
The COSMOS Skin Permeability Database mostly contains defined organic
compounds (only 24 do not fall into this category, please refer to the Table 4.3).
Approximately 46% of its content was in common with the COSMOS Cosmetics Inventory.
With regard to the EU COSING database use functions (Annex 3), the most populated
cosmetics-related chemicals in the Skin Permeability Database include perfuming agents,
antimicrobials, preservatives, antioxidants, colorants and hair dyes, skin and hair
conditioning agents, surfactants and emulsifiers, moisturisers, emollients and humectants,
and UV filters/absorbers. They cover a broad range of chemical classes, mostly alcohols,
carboxylic esters, glycol ethers and parabens.

Chapter 4
71
Table 4.3 COSMOS Skin Permeability Database constituents: composition and material types
Composition type Material type # compounds
Defined formula IOM 13
Defined formula Organic 452
Defined formula – varying isomers IOM 2
Defined formula – varying isomers Organic 8
Ill-defined formula Organic 3
Ill-defined formula – polydispersed Organic - polymer 5
Ill-defined formula – polydispersed – varying isomers Organic - polymer 1
TOTAL 484
As far as experimental data content is concerned, a range of species (human, pig, rat,
mouse, rabbit, minipig, guinea pig, dog, monkey, marmoset, snake), in vitro membrane
types (dermis, epidermis, stratum corneum, full- and split-thickness skin and artificial
membranes), in vivo application sites (abdomen, breast, back, scalp, leg, arm, etc.), and
vehicles were included. The results recorded included flux, absorption, permeability
coefficient and recovery data. The detailed statistics are presented in Table 4.4 and Figures
4.6-4.9.
Information on the distribution (in blood, plasma, carcass, or other organs and
tissues) and elimination (via urine, faeces, exhaled air, etc.) was retrieved for over 40
compounds tested in more than 100 in vivo studies. In addition, information regarding skin
metabolism was captured for 12 cosmetics-related compounds, including information on
the metabolites identified in skin or eliminated after dermal applications, enzymes and
probable pathways.

Chapter 4
72
Table 4.4 Statistics of the COSMOS Skin Permeability Database for human, pig, rat and mouse studies
Species Membrane Type Main Application Site Main Vehicle for reported species
In vitro studies (2488)
Human (1206)
Epidermis (516) Abdomen; Back; Breast (432)
Water (264); Neat (149); Formulation (68)
Split-Thickness Skin (404) Abdomen; Arm; Breast; Leg (302)
Full-Thickness Skin (223) Abdomen; Breast (194)
Stratum Corneum (19) Abdomen (18)
Pig (226) Split-Thickness Skin (186) Back (145) Ethanol (69);
Formulation (25); Acetone (20) Full-Thickness Skin (28) Ear (9); Back (5)
Rat (502)
Full-Thickness Skin (240) Abdomen; Back (199) Acetone (76); Ethanol (52); Water (45); Hydrocarbon (41)
Split-Thickness Skin (195) Back (176)
Epidermis (47) Back (19)
Mouse (306) Full-Thickness Skin (284) Abdomen; Back (259) Saline (115); Saline/ Aqueous Alcohol (45); Acetone (28)
In vivo studies (1003)
Human (300) Not applicable Arm/Axilla/Hand/Palm (210); Abdomen (21); Back (12)
Acetone (129); Ethylene glycol/Surfactant (57); Aqueous Ethanol (34)
Pig (48) Not applicable Back (27); Abdomen (14) Ethanol (31)
Rat (394) Not applicable Back (340); Abdomen (13)
Acetone (120); Aqueous Ethanol (79); Formulation (38); Water (35); Neat (31)
Mouse (43) Not applicable Back (26) Ethanol (11); Neat (9)

Chapter 4
73
Figure 4.6 The in vitro flux data available in the COSMOS Skin Permeability Database, profiled with respect to the species, membrane types, and dominating vehicle types
Figure 4.7 The in vitro permeability coefficient data available in the COSMOS Skin Permeability Database, profiled with respect to the species, membrane types, and dominating vehicle types

Chapter 4
74
Figure 4.8 The in vitro absorption data (including the percentage and amount of the dose absorbed, whichever was provided) available the in COSMOS Skin Permeability Database. The data were profiled with respect to the species, membrane types and vehicles
Figure 4.9 The in vivo absorption data (including the percentage and amount of the dose absorbed, whichever was provided) available in the COSMOS Skin Permeability Database. The data has been profiled with respect to the species and vehicles

Chapter 4
75
4.5. Discussion
This chapter demonstrates the current demand for a database containing high
quality skin permeability/absorption data for cosmetics and related compounds, and
describes the collation of COSMOS Skin Permeability Database satisfying this need. The
novel developed database, containing 2488 in vitro and 1003 in vivo studies for 484
compounds (46% of cosmetics-related ones), can be considered a milestone towards
estimating the human exposure to chemicals via dermal exposure for several reasons.
The data curated from the EDETOX and Kent databases were enriched with the
studies harvested manually from literature and regulatory sources, including SCCS opinions,
which were not previously used for this purpose. The data harvesting procedure was
conducted according to rigorous rules, iteratively developed and refined, as part of this
work, ensuring consistency was maintained across the data harvesters and addressing the
concerns with regard to data quality. These rules were captured in the SOP document
(Annex 4), which may be consulted in the future and used to harvest additional data.
The COSMOS Skin Permeability Database provides information on the test system
details (skin donors, skin membranes, or test animals) and test conditions (including
diffusion experiment parameters of in vitro studies). The available results include lag times,
flux, absorption (total amounts and %), permeability coefficients and recovery or
distribution/elimination information (for in vivo studies) for the test materials. The unique
data model of the skin permeability database enables efficient data mining and fast
identification of the studies available for particular species, membrane types, conducted
with (or without) certain vehicles, etc. This data structure supports the computational
modelling activities.
The COSMOS Skin Permeability database has undergone a QC procedure performed
by the experts from the COSMOS ILSI Expert Group, who added the information on the skin
metabolism (pathways/steps/enzymes) for 12 cosmetics-related compounds.
Overall, the collated COSMOS skin permeability database is the largest database for
this endpoint, with a range of high quality data for diverse types of chemicals (including
cosmetics), that may serve as a solid basis for computational modelling and support the

Chapter 4
76
development of in silico tools for safety/risk assessment of cosmetics and related
compounds. It was a foundation of the analysis discussed in the subsequent chapter.
Chapter 5
77
Chapter 5
Classification of Skin Permeability Potential Following Dermal Exposure to Support the
Prediction of Repeated Dose Toxicity of Cosmetics-Related Compounds
5.1. Background
The safety evaluation of chemicals includes hazard characterisation and the
assessment of potential human exposure. Human exposure to cosmetics and related
compounds occurs primarily via the topical route. Thus, the rate and extent of the transfer
of chemicals across the skin are of particular interest for the safety evaluation of cosmetics
and related compounds.
The skin is a metabolically active, living organ, which can be penetrated by chemicals
through complex biological and physicochemical processes. The skin is also the largest organ
of the body and, as such, may act as a main route of entry of the compound into the
systemic circulation. The multiple factors which influence the rate of percutaneous
permeability have been broadly reported in the literature (Elias et al., 1981; Southwell et al.,
1984; Rougier et al., 1987; Williams et al., 1992; Liu et al., 1993; Cua et al., 1995; Tsai et al.,
2003; Otberg et al., 2004; Chilcott et al., 2005; Akomeah et al., 2007). In general, they are
associated with:
The variability of the structure of the skin, including inter-species differences
(varying lipid content, thickness of the stratum corneum, number of appendageal shunts,
etc.) and individual variations within species (age, sex, race), as well as anatomical site,
skin condition, hydration, temperature and blood flow rate;
The physicochemical nature of the penetrants, i.e. the compound and its vehicle,
including the physical state, size (molecular weight), binding properties, etc.;
The external conditions (experimental design, dosage regimen, etc., in case of
laboratory studies).
5.1.1. The structure of the skin
The skin consists of several heterogenic structural compartments: epidermis (outer
layer), dermis (inner layer), basement membrane (the multilayered structure at the junction

Chapter 5
78
between epidermis and dermis), subcutis (the layer of fat and connective tissue below the
dermis) and multiple appendages (sweat glands, hair follicles, etc.). The epidermis
comprises about 5% of the thickness of the skin. The majority of the epidermal cells
(keratinocytes) are formed by differentiation from one layer of mitotic basal cells (stratum
basale). Nevertheless, several layers of epidermis (Figure 5.1) can be distinguished
according to their cellular characteristics.
The outermost layer of the epidermis, the stratum corneum, is the actual barrier
protecting the body against external influences and excessive water loss. It consists of
multiple layers of non-viable cells, corneocytes, located in the lipid matrix, essential for the
lipid skin barrier function. The structure of the stratum corneum resembles a “brick and
mortar system” (Michaels et al., 1975).
Figure 5.1 The structure of epidermis (adapted from WHO, 2006; Bensouilah & Buck, 2006; Menon et al., 2012; Van Smeden et al., 2014)
Chapter 5
79
The dermis is a tissue of variable thickness (from 0.6 mm on the eyelids to 3.0 mm
on the back, soles and palms), providing the nutritional support for the avascular epidermis.
It consists of a tough, supportive fibrous protein matrix, composed of two layers: papillary
(connecting with epidermis and build from thin collagen fibres) and reticular (including
thicker collagen bundles). The dermis is built up from fibroblasts, producing collagen,
elastin, structural proteoglycans and immunocompetent mast cells and macrophages. The
blood vessels, sensory nerves (pressure, temperature, and pain) and lymphatic cells are
located in the dermis, along with the inner segments of the sweat glands and pilosebaceous
units. The dermis has multiple functions: it provides flexibility, strength, protection from
infections as well as serving as a water storage organ (Bensouilah & Buck, 2006; Dancik et
al., 2012). Derivative structures of the skin include hair, nails, sebaceous and sweat glands.
5.1.2. Transport of chemicals through the skin
The transport of chemicals through the skin can occur via intra- or inter-cellular
transepidermal routes (i.e. across the stratum corneum) or through skin appendages. The
intracellular (transcellular) route refers to the partitioning of chemicals into and out of the
cell membrane of keratin-rich corneocytes. The intercellular process includes transfer of the
chemicals through the lipid-rich matrix in which the corneocytes are embedded. The
appendageal route involves the movements of chemicals through the skin appendages (hair
follicles, sweat glands, and sebaceous glands), bypassing the corneocytes. Appendageal
transport may be significant in particular regions of the skin, e.g. the hair-rich scalp, where
the number of appendageal openings per unit of surface area is relatively large. In addition,
it has been demonstrated that sebaceous glands may serve as a drug reservoir for some
substances (Scheuplein, 1967). The transport of a chemical through the epidermis is
followed by its uptake by the capillary network at the basement membrane
(dermal/epidermal junction) into the cutaneous blood and lymphatic system (resorption).
However, the chemicals can be retained in the viable epidermis, dermis, or in the subcutis if
the blood flow is insufficient (WHO, 2006).
The permeability of a chemical through the skin is considered to be a process of
passive diffusion. The rate of permeability is limited by the layer within the skin with the
highest resistance to diffusion. The stratum corneum is, most commonly, the primary rate-
limiting barrier. However, for very lipophilic substances the diffusion through the

Chapter 5
80
hydrophilic epidermis and dermis can be rate limiting. Diffusion of compounds across a
membrane is described by Fick’s first law (Crank, 1975). For the individual (pseudo-
homogeneous) layers of the skin Fick’s law can be expressed by Equations 5.1-5.7 (WHO,
2006).
𝐽 = −𝐷𝜕𝐶
𝜕𝑥
Equation 5.1 Where: J Flux (the rate of transfer of a chemical per unit area in particular time)
D Diffusion coefficient 𝜕𝐶
𝜕𝑥 Concentration gradient
Over a specific time (the so-called lag time), flux reaches a steady-state value and the
cumulative amount penetrating the skin increases:
𝐽𝑠𝑠 =𝐷(𝐶1−𝐶2)
ℎ
Equation 5.2 Where: Jss Flux at steady-state
h Membrane thickness C1, C2 Chemical concentrations at interface of the two membranes (at x1=0 and
x2=h, respectively)
Assuming a local equilibrium with the vehicle and that the stratum corneum controls
the dermal diffusion process:
𝐶1 = 𝐾𝑚 ∙ 𝐶𝑣
Equation 5.3 Where: C1 Chemical concentration before the diffusion process (at x1=0)
Km Stratum corneum-to-vehicle partition coefficient Cv Concentration of the vehicle
Assuming that after passing through the membrane (x=h) the chemical
concentration is close to zero (so-called sink conditions):
𝐽𝑠𝑠 =𝐷∙𝐾𝑚∙𝐶𝑣
ℎ
Equation 5.4
If:
Chapter 5
81
𝐾𝑃 =𝐾𝑚∙𝐷
ℎ
Equation 5.5 Where: KP Permeability coefficient
Then:
𝐽𝑠𝑠 = 𝐾𝑃 ∙ 𝐶𝑣
Equation 5.6
The maximum steady-state flux through the membrane can be thus be expressed as:
𝐽𝑀𝐴𝑋 =𝐷∙𝑆𝑆𝐶
ℎ= 𝐾𝑃𝑉 ∙ 𝑆𝑉
Equation 5.7 Where: JMAX Maximum steady-state flux
SSC The saturated concentration of solute in the stratum corneum KPV The permeability coefficient of a solute in a vehicle Sv The solubility of the solute in that vehicle
The maximum steady-state flux (JMAX) is a valuable parameter to determine the
percutaneous penetration/absorption of a chemical.
5.1.3. Modelling of skin permeability
5.1.3.1. General overview of the tools and approaches
The computational modelling of skin permeability has been investigated for over two
decades resulting in a plethora of in silico models and tools. A number of comprehensive
reviews have been published in this area (Moss et al., 2002; Geinoz et al., 2004; Degim,
2006; WHO, 2006; Mitragotri et al., 2011, Jepps et al., 2013; Naegel et al., 2013) along with
the comparative studies evaluating the available models (Bouwman et al., 2008; Lian et al.,
2008; Farahmand & Maibach, 2009; Brown et al., 2012).
One of the most significant skin permeability (KP) models was published by Potts and
Guy (Potts & Guy, 1992) for 93 historical permeability coefficients compiled from the
literature by Flynn (Flynn, 1990). The Potts and Guy model accounts solely for the size and
hydrophobicity of the permeant (Eq. 5.8), with a resulting correlation coefficient of 0.67.

Chapter 5
82
𝐿𝑜𝑔𝐾𝑃 =𝐷 ∙ 𝑆𝑆𝐶ℎ
= 0.71𝐿𝑜𝑔𝑃 − 0.061𝑀𝑊 − 6.3
Equation 5.8 Where: Log KP Logarithm of the permeability coefficient
Log P Logarithm of the n-octanol/water partition coefficient MW Molecular weight
The main limitation of this model is the over-prediction of the KP for highly lipophilic
compounds. In order to address this drawback, a modification was proposed (Cleek &
Bunge, 1993; Bunge & Cleek, 1995) that split components representing the stratum
corneum partitioning and diffusivity. The Potts and Guy model has also been further
extended by a number of other workers, e.g. Moss and Cronin used an updated and revised
set of 116 compounds obtaining a correlation coefficient of 0.82 (Moss & Cronin, 2002).
Following the Potts and Guy model, a plethora of multi-parameter QSAR models
have been developed for skin permeability. Diverse types and numbers of descriptors have
been proposed (e.g. over 1,600 descriptors were used by Baert et al., 2007). The most
frequently applied include lipid/water partition coefficients, water solubility, melting point,
molecular size and hydrogen bonding (Abraham et al., 1999; Roberts & Sloan, 1999; Roberts
& Sloan, 2000; Abraham & Martins, 2004; Zhang et al., 2009). The majority of the models
developed were based on the assumption that inter-cellular pathway (i.e. through the lipid
matrix) is the dominant route of transport for a compound and that the corneocytes are not
permeable. Such models, however, tend to under-predict the skin permeability of
hydrophilic compounds.
A further alternative approach to predict skin permeability is based on the use of
mechanistic models. These are derived from the Fick’s laws of diffusion and mass balance
equations, taking into account various diffusion pathways, not being limited to the lipid-
based inter-cellular pathway. A four-pathway model considering the aqueous pores in the
stratum corneum lipid matrix and the appendageal openings as the hydrophilic pathway in
additional to the impermeable corneocytes has been proposed (Mitragotri, 2003). The
model yields good results for both hydrophilic and hydrophobic permeants. Another type of
mechanistic model is based on the “brick and mortar” framework of the stratum corneum.
The two-dimensional (biphasic) microtransport model was developed by Kasting and co-

Chapter 5
83
workers (Wang et al., 2006; Wang et al., 2007) and further extended (Dancik et al., 2012).
This model provides the maximal fluxes, concentrations and distribution details for the
permeant, as well as the amount of permeant prone to removal/evaporation.
5.1.3.2. Computational modelling of maximal flux (JMAX)
As mentioned in section 5.1.2, JMAX is a relevant measure of the skin permeation of
chemical. Relatively few studies, however, have used JMAX as a dependent variable in the
QSPR models. Of these studies, predicting the maximal flux on the basis of the molecular
volume and solubility of the permeant in octanol was proposed for a small dataset of 35
drugs (Kasting et al., 1987). Molecular weight-based simplistic regression models for JMAX
prediction have been developed for the aqueous solutes by Magnusson and co-workers
(Magnusson et al., 2004a). Their model, which used the largest number of compounds (279)
of any of the models, yielded a correlation coefficient of 0.688:
𝐽𝑀𝐴𝑋 = 0.041𝑀𝑊 − 4.52
Equation 5.9 Where: MW Molecular weight
An alternative approach to predict JMAX is based on the determination of the “rules of
thumb” to identify compounds exhibiting high or low skin permeability – a type of
“pass/fail” test for rapid screening of compounds without experimental data (Magnusson et
al., 2004b). “Rules of thumb” for intestinal absorption have been successfully formulated by
Lipinski and coworkers (Lipinski et al., 1997). With respect to skin permeability, this
approach was utilised by Magnusson et al. (Magnusson et al., 2004b). In order to identify
compounds with extreme (high or low) JMAX values, they analysed the following molecular
descriptors: molecular weight (MW), melting point (MP), octanol/water partition coefficient
(Log K), aqueous solubility (Log S) and number of atoms available for hydrogen bonding
(HB), divided into H-bond donors (HB-d) and acceptors (HB-a). The boundary values
reported in their study are presented in Table 5.1. The properties with the highest predictive
power were: MW, HB-a, and Log S. Using the combination of 2 or 3 predictors yielded the
best results.

Chapter 5
84
Table 5.1 The boundary values for “good” (high JMAX) and “bad” (low JMAX) skin permeants (taken from Magnusson et al., 2004b)
JMAX
Descriptors
MW MP HB-d HB-a Log K Log S
Low (“bad” penetrants) > 213 ≥ 223 ≥ 0 ≥ 3 > 1.2 > -1.6
High (“good” penetrants) ≤ 152 ≤ 432 ≤ 2 ≤ 3 < 2.6 ≥-2.3
The work of Magnusson et al., was elaborated further by Xu et al. (Xu et al., 2013)
who reduced the rules to MW and Log P only. The permeants with MW ≥ 400, logP ≤ 1, or
logP ≥ 4 have been considered “bad” penetrants.
The method of estimating dermal absorption (when the experimental data are not
available) on the basis of calculated JMAX values was proposed by Kroes and co-workers
(Kroes et al., 2007). For JMAX values between 0.1 and 10 μg/cm2/h, they recommended
assuming 40% absorption of the applied dose (per 24 hour exposure). For JMAX <0.1, or >10
μg/cm2/h, the percent dose absorbed was suggested to be 10% or 80%, respectively. For
non-reactive chemicals with molecular weights greater than 1000, negligible absorption was
assumed.
5.2. The aims of chapter 5
As maximal flux (JMAX) is a significant parameter in the assessment of the dermal
delivery of the chemical compounds (defining their maximal toxic or systemic effects
resulting from the topical exposure), it has been selected as the endpoint of the present
research. The aims of chapter 5 are related to the objective 4 of the current PhD program
(please refer to section 1.5) and include:
Data mining of the Skin Permeability Database (its development was described in
chapter 4) leading to the collation of a set of compounds with available experimental
maximal flux (JMAX) data;

Chapter 5
85
Structural (ToxPrint chemotypes) profiling of the collated dataset followed by the
analysis of the physicochemical properties of its constituents;
Determination of a set of rules classifying a chemical as having low or high potential
to permeate the skin.
5.3. Materials and methods
5.3.1. Dataset for analysis
The final content of the COSMOS Skin Permeability Database was described in
chapter 4. The database contains measured in vitro JMAX values for over 200 compounds.
Many chemicals were tested in multiple experiments (e.g. as many as 46 studies are
available for diethyltoluamide or salicylic acid), resulting in the total number of data points
for in vitro JMAX exceeding 900. The experiments were performed with a range of skin
membranes (e.g. whole skin, epidermis, stratum corneum, etc.) obtained from various
species (human, pig, mouse, rat, rabbit) and sampling sites (abdomen, breast, back, leg,
neck) using diverse diffusion cells types (static or flow-through) and dose application
regimes (occluded, non-occluded or semi-occluded conditions).
As mentioned previously, experimental measures of skin permeability are highly
variable. The variability of in vitro JMAX measurement results was reported in the scientific
literature (Howes et al., 1996; Benech-Keiffer et al., 2000; Akomeah et al., 2007). It was
demonstrated that for some compounds (e.g. methyl paraben) the variability is as high as
35%, and a difference between the highest and lowest flux values as high as 4-fold can be
obtained, even when the same experimental protocol was applied (Chilcott et al., 2005;
Akomeah et al., 2007). The underlying reasons were attributed to a variety of factors
including human error, differences in experimental design (e.g. receptor chamber volume
and surface area, the type of diffusion cell used), skin morphology (e.g. samples of variable
origin) or the physicochemical properties of tested substance (Elias et al., 1981; Southwell et
al., 1984; Rougier et al., 1987; Williams et al., 1992; Liu et al., 1993; Cua et al., 1995; Tsai et
al., 2003; Otberg et al., 2004; Chilcott et al., 2005; Akomeah et al., 2007).
For the purpose of the present analysis the JMAX values measured in vitro with human
skin samples were utilised. The COSMOS Skin Permeability Database contains a total of 640
in vitro human studies (for 184 compounds) with JMAX provided. The variability of the data

Chapter 5
86
was analysed for all compounds with multiple results from more than a single study. When
JMAX values were highly variable and it was not feasible to make a conclusion regarding the
skin permeability category, all the records for a compound were dropped from the analysis.
For the compounds with multiple studies but low range of JMAX values the means were
calculated. The IOM compounds and mixtures were excluded from the investigation. It
should be noted that only in vitro human data were used, but all membrane types
(epidermis, split-thickness skin, full-thickness skin, etc.) and vehicles were considered.
Once the set of compounds with low variability of in vitro JMAX values was identified,
three initial categories, corresponding to low, medium and high skin permeability potential
were defined using 33.3% and 66.7% quantiles.
5.3.2. Structural features and physicochemical properties analysis
The structures of compounds analysed were prepared for computational analysis in
the Corina Symphony software tool (Molecular Networks GmbH, Nüremberg, Germany)
following the procedure described in detail in chapter 3. Subsequently, the dataset was
analysed with respect to the structural features and molecular properties.
The structural domain of the dataset was characterised by the ToxPrint chemotypes
calculated in the ChemoTyper software tool (Altamira LLC, Columbus, OH; Molecular
Networks GmbH, Nüremberg, Germany) and presented in terms of their distributions across
different skin permeability categories. The in depth description of this methodology is
provided in chapter 3.
The physicochemical profile of the dataset was determined with the “global
molecular” and “size and shape” descriptors calculated in Corina Symphony software tool
(Molecular Networks GmbH, Nüremberg, Germany). For the purpose of the current analysis,
fifteen properties were selected a priori on the basis of knowledge available in the scientific
literature (Table 5.2). The standardised values of the calculated descriptors were used as
variables in the Principal Component Analysis conducted in JMP Pro 12.2.0 software (SAS
Institute Inc.). This technique was discussed in-depth in chapter 3.

Chapter 5
87
Table 5.2 CORINA Symphony (Molecular Networks GmbH, Nüremberg, Germany) descriptors utilized in the present analysis
GLOBAL MOLECULAR PROPERTIES
Number of open-chain, single rotatable bonds (BondsRot) [unitless]
Number of hydrogen bonding acceptors derived from the sum of nitrogen and oxygen atoms in the molecule (H-Acc) [unitless]
Number of hydrogen bonding donors derived from the sum of N-H and O-H groups in the molecule (H-Don) [unitless]
Number of tetrahedral stereocentres in the molecule (Stereo) [unitless]
Solubility of the molecule in water (Log S) [mol/L]
Mean molecular polarisability of the molecule (Polariz) [Å3]
Molecular complexity (Complex) [unitless]
Ring complexity (ComplexRing) [unitless]
Molecular weight derived from the gross formula (MW) [Da]
Octanol/water partition coefficient of the molecule following the XlogP approach (Log P) [unitless]
McGowan molecular volume approximated by fragment contributions (McGowan) [mL/mol]
Topological polar surface area of the molecule derived from polar 2D fragments (TPSA) [Å2]
SHAPE DESCRIPTORS
Molecular diameter – maximum distance between two atoms in the molecule (Diameter) [Å]
Molecular radius of gyration (Rgyr) [Å]
Molecular span – radius of the smallest sphere centred at the centre of mass which completely encloses all atoms in the molecule (Span) [Å]
5.3.3. Defining the classification rules
On the basis of the structural and physicochemical profiles of the dataset, sets of
rules were proposed for skin permeability categories to support the classification of query
compounds without experimental data.
5.4. Results
5.4.1. Dataset for analysis
The dataset compiled consisted of 112 organic compounds (after removing
compounds with high variability of reported JMAX values and compounds which are not
handled well by computational tools used for calculating molecular descriptors). The full

Chapter 5
88
dataset is reported in Annex 5. The summary statistics and distribution of experimental JMAX
values in the entire dataset of 112 compounds analysed are presented in Figure 5.2A. Based
on the 33.3% and 66.7% quantiles, the dataset was divided into the following skin
permeability potential categories (the summary statistics and distributions of log JMAX values
within each category are presented in Figure 5.2B):
Low (36 compounds): JMAX < 0.75 µg/cm2/h (log JMAX < -0.12);
Medium (38 compounds): JMAX between 0.75-10 µg /cm2/h (log JMAX <-0.12, 1>);
High (38 compounds): JMAX > 10 µg/cm2/h (log JMAX > 1).
Figure 5.2 (A) The summary statistics, quantile analysis estimates (mean confidence interval (1-α) of 0.95)
and histogram of log JMAX values distribution for the set of 112 compounds subjected into analysis;
(B) The summary statistics and histograms of log JMAX values distribution for the low, medium, and high skin permeability categories
The plots were prepared in JMP Pro 12.2.0 software tool (JMP, SAS Institute Inc.)
5.4.2. Chemotype analysis
The structural profile of compounds belonging to the low, medium and high skin
permeability categories was analysed with the ToxPrint chemotypes (Figure 5.3). Fused rings

Chapter 5
89
(e.g. steroids), cyclic alkenes and alkanes (C5 and C6), secondary alkyl alcohols, ketones,
aliphatic amines, and neopentyl groups were found in abundance in the low skin
permeability category of compounds. Aliphatic ethers and ethylene oxides were identified
predominantly in compounds with high skin permeability potential. The medium skin
permeability compounds were rich in aromatic rings with hetero atoms, aromatic alkanes,
cyclic alkanes (C3), halides (especially alkyl halides) and halocarbonyls, tertiary alkyl
alcohols, and carboxylic acids.
Figure 5.3 The structural profile of compounds from low, medium and high skin permeability categories, expressed as % frequency of features. The actual counts of each structural feature are provided on the plot’s bars
5.4.3. Physicochemical properties analysis
The physicochemical properties space of a dataset of 112 compounds was
investigated in terms of Principal Components Analysis on the basis of 15 physicochemical
descriptors (Annex 7) selected a priori (as described in 5.3.3) and calculated in Corina
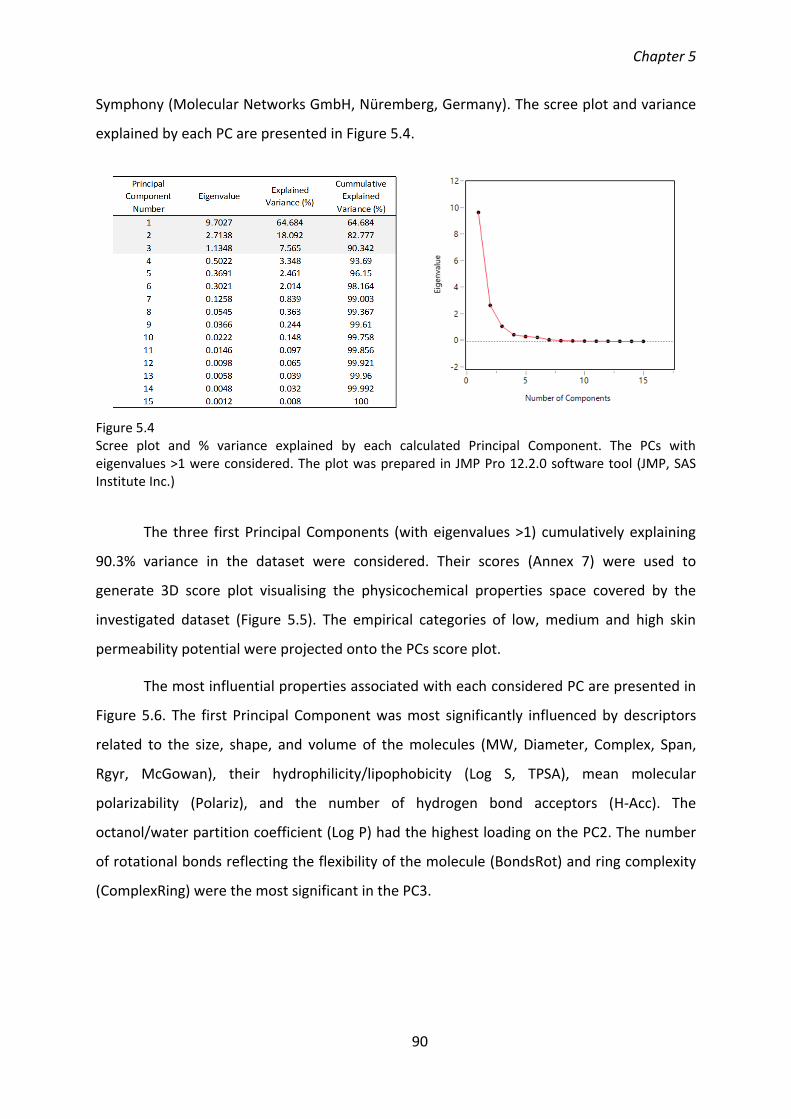
Chapter 5
90
Symphony (Molecular Networks GmbH, Nüremberg, Germany). The scree plot and variance
explained by each PC are presented in Figure 5.4.
Figure 5.4 Scree plot and % variance explained by each calculated Principal Component. The PCs with eigenvalues >1 were considered. The plot was prepared in JMP Pro 12.2.0 software tool (JMP, SAS Institute Inc.)
The three first Principal Components (with eigenvalues >1) cumulatively explaining
90.3% variance in the dataset were considered. Their scores (Annex 7) were used to
generate 3D score plot visualising the physicochemical properties space covered by the
investigated dataset (Figure 5.5). The empirical categories of low, medium and high skin
permeability potential were projected onto the PCs score plot.
The most influential properties associated with each considered PC are presented in
Figure 5.6. The first Principal Component was most significantly influenced by descriptors
related to the size, shape, and volume of the molecules (MW, Diameter, Complex, Span,
Rgyr, McGowan), their hydrophilicity/lipophobicity (Log S, TPSA), mean molecular
polarizability (Polariz), and the number of hydrogen bond acceptors (H-Acc). The
octanol/water partition coefficient (Log P) had the highest loading on the PC2. The number
of rotational bonds reflecting the flexibility of the molecule (BondsRot) and ring complexity
(ComplexRing) were the most significant in the PC3.

Chapter 5
91
Figure 5.5 The 3D score plot of the three first Principal Components (PC1-PC3) defining the properties space of the dataset analysed (cumulatively explaining 90.3% of the variance in the dataset). The plot was prepared in JMP Pro 12.2.0 software tool (JMP, SAS Institute Inc.)
Figure 5.6 The loading bar plots for the three Principal Components characterising physicochemical properties of investigated dataset of 112 compounds. The properties with loadings above 0.7 (or close to) were considered to be the most influential

Chapter 5
92
As presented in Figure 5.5, the regions rich in compounds with high or low skin
permeability potential could be clearly distinguished in the investigated physicochemical
properties space, whereas the compounds from the medium skin permeability category
(evenly distributed across the entire space) did not form a separate cluster. This result
indicates that the set of molecular descriptors utilised was relevant to identify the
differences between low and high skin permeability compounds. The separation of the
medium category compounds was not obtained as they exhibit a range of “mixed” features,
not sufficiently discriminative to be captured solely by the properties used. Thus, the
structural characteristics of “medium” category compounds were projected into the 2D
score plot (PC1 vs PC2) of their physicochemical properties space (Figure 5.7).
It can be observed that the “medium” category compounds with distinctive
structural features (identified in section 5.4.3) form individual clusters in the
physicochemical properties space: a group of naltrexone derivatives, containing fused rings
and cyclopropane moieties is located in the region richer in low skin permeability
compounds, while the cluster abundant in halocarbonyls, alkyl halides, aromatic halides and
medium-length chain aromatic alkanes is situated in the region occupied mostly by high skin
permeability compounds. Therefore, to characterise medium skin permeability category
fully, the structural features have to be considered together with physicochemical
descriptors. The compounds from “low” and “high” skin permeability categories exhibit such
different structural characteristics that the physicochemical properties alone are able to
clearly reflect them (Figure 5.8). Complex molecules containing fused rings, cyclic alkenes
and alkanes (C5 and C6), secondary alkyl alcohols, ketones and aliphatic amines are located`
on the right-hand side of the PC1 vs PC2 plot (Figure 5.8), whereas polyethylene glycol
ethers and short chain alkanes are situated on the left-hand side. For these classes of
compounds, belonging (respectively) to “low” and “high” skin permeability categories, the
boundary values of descriptors were determined in the next step of the analysis.

Chapter 5
93
Figure 5.7 The 2D PCs score plot demonstrating the location of the compounds from the medium skin permeability potential category in the considered physicochemical properties space and their distinctive structural features (grey dots denote the compounds from the “low” and “high” categories). The plot was prepared in JMP Pro 12.2.0 software tool (JMP, SAS Institute Inc.)

Chapter 5
94
Figure 5.8 The 2D PCs score plot demonstrating the good separation between low and high skin permeability potential category compounds in the considered physicochemical properties space and their distinctive structural features (grey dots denote the compounds from the “medium” category). The plot was prepared in JMP Pro 12.2.0 software tool (JMP, SAS Institute Inc.)
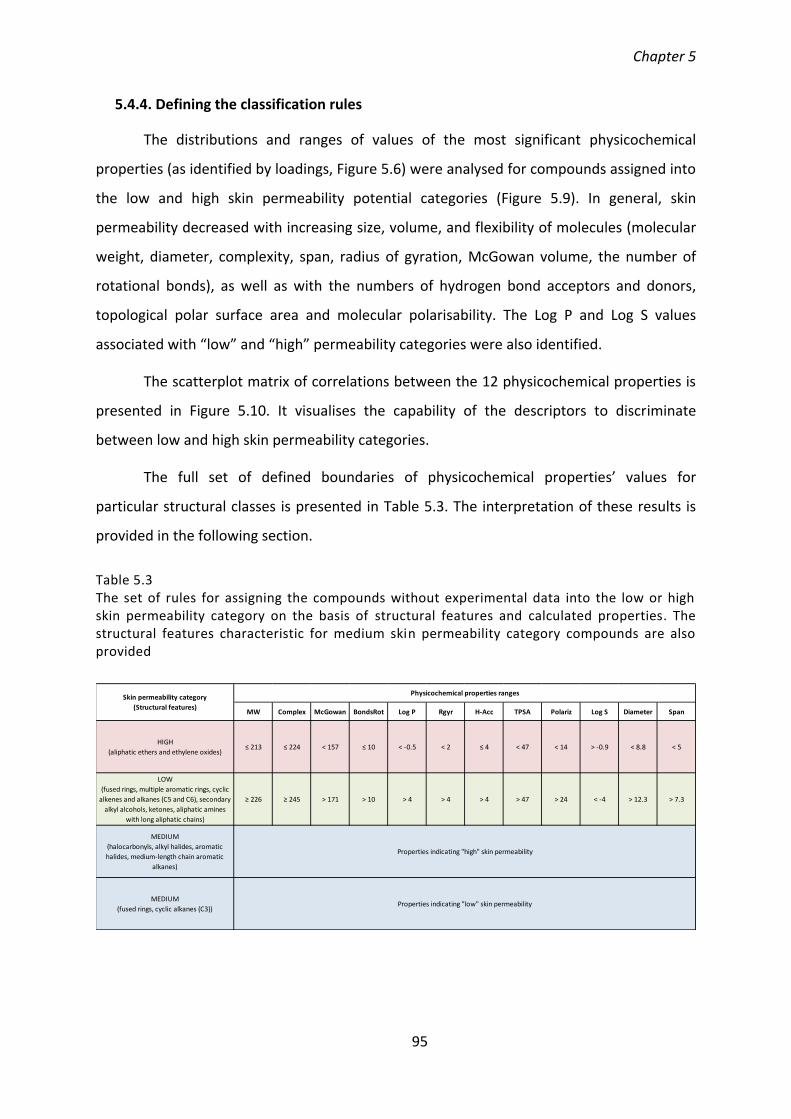
Chapter 5
95
5.4.4. Defining the classification rules
The distributions and ranges of values of the most significant physicochemical
properties (as identified by loadings, Figure 5.6) were analysed for compounds assigned into
the low and high skin permeability potential categories (Figure 5.9). In general, skin
permeability decreased with increasing size, volume, and flexibility of molecules (molecular
weight, diameter, complexity, span, radius of gyration, McGowan volume, the number of
rotational bonds), as well as with the numbers of hydrogen bond acceptors and donors,
topological polar surface area and molecular polarisability. The Log P and Log S values
associated with “low” and “high” permeability categories were also identified.
The scatterplot matrix of correlations between the 12 physicochemical properties is
presented in Figure 5.10. It visualises the capability of the descriptors to discriminate
between low and high skin permeability categories.
The full set of defined boundaries of physicochemical properties’ values for
particular structural classes is presented in Table 5.3. The interpretation of these results is
provided in the following section.
Table 5.3 The set of rules for assigning the compounds without experimental data into the low or high skin permeability category on the basis of structural features and calculated properties. The structural features characteristic for medium skin permeability category compounds are also provided
MW Complex McGowan BondsRot Log P Rgyr H-Acc TPSA Polariz Log S Diameter Span
HIGH
(aliphatic ethers and ethylene oxides)≤ 213 ≤ 224 < 157 ≤ 10 < -0.5 < 2 ≤ 4 < 47 < 14 > -0.9 < 8.8 < 5
LOW
(fused rings, multiple aromatic rings, cyclic
alkenes and alkanes (C5 and C6), secondary
alkyl alcohols, ketones, aliphatic amines
with long aliphatic chains)
≥ 226 ≥ 245 > 171 > 10 > 4 > 4 > 4 > 47 > 24 < -4 > 12.3 > 7.3
MEDIUM
(halocarbonyls, alkyl halides, aromatic
halides, medium-length chain aromatic
alkanes)
MEDIUM
(fused rings, cyclic alkanes (C3))
Properties indicating "high" skin permeability
Properties indicating "low" skin permeability
Skin permeability category
(Structural features)
Physicochemical properties ranges

Chapter 5
96
Figure 5.9 Histograms of distribution of 12 individual molecular properties within particular skin permeability potential categories. The boundary values of physicochemical properties ranges were defined for the “high” and “low” categories; the histograms of “medium” category were depicted to illustrate that the compounds from this group have the “mixed” values of analysed properties. The ranges and mean values for all descriptors are provided in Annex 7. The plots were prepared in JMP Pro 12.2.0 software tool (JMP, SAS Institute Inc.)

chapter 5
97
Figure 5.10 The scatterplot matrix presenting the correlations between individual molecular properties used to discriminate the categories of low (green) and high (red) skin permeability potential. The plot was prepared in JMP Pro 12.2.0 software tool (JMP, SAS Institute Inc.)
5.5. Discussion
The main function of the skin is to act as a physicochemical barrier, and, as such, to
resist the penetration of chemicals. Many molecules, however, can pass this barrier in a
passive diffusion process. As outlined above, the permeability of a chemical through the skin
is limited by the skin layer with the highest resistance to diffusion (stratum corneum, or
hydrophilic epidermis and dermis for very lipophilic substances). In the current analysis, the
structural features and physicochemical properties of compounds exhibiting high and low
skin permeability potential were analysed. The main molecular characteristics determining

chapter 5
98
the skin permeability potential identified were associated with the molecular size (including
volume, dimensions, and complexity of the molecules), hydrophobicity and hydrogen
bonding ability. These findings remain in agreement with the findings of other researchers
(e.g. Cronin et al., 1999, Walters, 2002; Magnusson et al., 2004b; Abraham and Martins,
2004; Zhang et al., 2009; Kupczewska-Dobecka et al., 2010). The molecular size (molecular
weight and diameter), volume (McGowan), complexity (Complex, ComplexRing),
dimensions, and spatial arrangement of atoms in the molecules (Span, Rgyr, Stereo) are all
negatively correlated with the skin permeability potential. Larger and more complex
molecules have more difficulty in passing the corneal layer. This can be related to the steric
hindrance – multiple aromatic rings, or fused rings in complex molecules (e.g. steroids) may
slow diffusion by steric effects. In case of very polar solutes, the polar pathway with a
defined radius for transport is utilised (Walters, 2002). The increasing molecular weight/size
is generally positively correlated with a range of other features, e.g. the number of
rotational bonds, or hydrogen-bonding capabilities of the molecules. High molecular
flexibility (reflected in the number of rotational bonds) is associated with lower permeability
potential. Similarly, the large number of hydrogen bond acceptors and/or donors may slow
diffusion by hydrogen bonding effects. The topological polar surface area (TPSA) (the
surface of polar fragments present in the molecule), octanol/water partition coefficient (Log
P), aqueous solubility (Log S), and polarisability (Polariz) provide information on the
hydrophobicity of the solutes and their partitioning between lipophilic and hydrophilic
regions of the skin membrane. The compounds with large TPSA and high polarizability tend
to be poor skin permeants. Poor skin permeability potential was observed for compounds
with Log P >4 and Log S <-4.
In summary, in the present analysis it was demonstrated that the complex process of
skin permeability expressed as the maximal flux, is governed by molecular size-,
hydrophobicity- and hydrogen bonding-related properties, reflecting the structural features
of the solutes. For the chemical classes identified with the ToxPrint chemotypes, the
boundary values of physicochemical properties capable of distinguishing the groups of
compounds with high and low skin permeability potential was identified (Table 5.3).
The analysis performed utilises a novel methodology (combination of ToxPrint
chemotypes with physicochemical properties) and demonstrates its capability for
chapter 5
99
performing a simultaneous analysis for different groups of chemicals (cosmetics, drugs,
pesticides), exhibiting various properties (e.g. highly lipophilic or highly hydrophilic) and
structural diversity. The approach proposed can be further elaborated and used for the
development of computational models utilising both types of descriptors at once. The
determined profiles of bad and good skin penetrants can be used for rapid screening of
chemicals without experimental data and support assessment of potential human exposure
to chemicals via the topical route. This, in the broader scale, can facilitate the process of
safety evaluation of chemicals, including cosmetics ingredients and related compounds.

Chapter 6
100
Chapter 6
COSMOS Oral Repeated Dose Toxicity Database (oRepeatToxDB): Harvesting, Curating and
Quality Control of the Data
6.1. Background
6.1.1. In vivo oral repeated dose toxicity tests
Repeated dose toxicity is a broad term referring to the general, adverse toxicological
effects resulting from the repeated daily exposure to (or dosing with) a substance for a
specified period of time, up to the expected lifespan of the test species. The main goal of
repeated dose toxicity studies is the characterisation of the toxicological profile of the test
substance including the identification of: the potential target organs of toxicity, the dose-
response relationships for each toxicity endpoint (and margin between toxic and non-toxic
dose), the delayed responses, cumulative effects (and, eventually, their reversibility) and the
responses to toxic metabolites formed in the organism. The information delivered from
repeated dose toxicity testing is essential for safety and risk assessment of any substance,
including industrial chemicals, pharmaceuticals, biocides, and cosmetics ingredients (EMA,
2010; EURL ECVAM, 2016).
The major outcomes of a repeated dose toxicity study are: the No Observed
(Adverse) Effect Level (NO(A)EL) value, referring to the highest dosage of the test substance
for which no (adverse) treatment-related effects have been observed, and the related
Lowest Observed (Adverse) Effect Level (LO(A)EL), i.e. the lowest dosage of the test
substance where (adverse) treatment-related findings have been observed (SCCS, 2012).
The NO(A)EL value is used for systemic toxicity safety assessment, including, for
example, the calculation of the Margin of Safety (MoS)3 for cosmetic substances by the EU
SCCS. For systemic toxicity risk assessment, particularly significant is the “critical toxic
effect”, defined as the first adverse effect (or its known precursor), that occurs at the
3 Margin of Safety (MoS) – uncertainty factor applied at the last stage of the safety evaluation of cosmetic substance, calculated by dividing the lowest NO(A)EL identified for this substance in repeated dose toxicity study by the Systemic Exposure Dosage (SED) value. Generally, minimum MoS value of 100 is necessary to conclude that a substance is safe for use (SCCS, 2012)
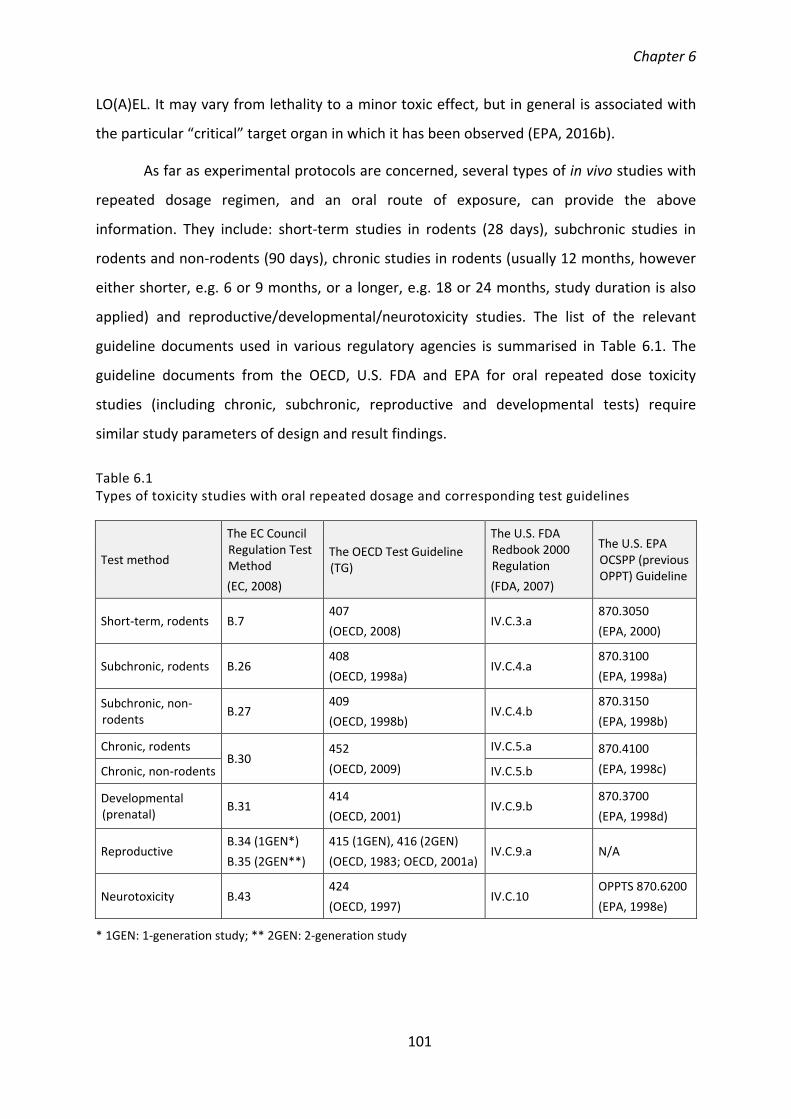
Chapter 6
101
LO(A)EL. It may vary from lethality to a minor toxic effect, but in general is associated with
the particular “critical” target organ in which it has been observed (EPA, 2016b).
As far as experimental protocols are concerned, several types of in vivo studies with
repeated dosage regimen, and an oral route of exposure, can provide the above
information. They include: short-term studies in rodents (28 days), subchronic studies in
rodents and non-rodents (90 days), chronic studies in rodents (usually 12 months, however
either shorter, e.g. 6 or 9 months, or a longer, e.g. 18 or 24 months, study duration is also
applied) and reproductive/developmental/neurotoxicity studies. The list of the relevant
guideline documents used in various regulatory agencies is summarised in Table 6.1. The
guideline documents from the OECD, U.S. FDA and EPA for oral repeated dose toxicity
studies (including chronic, subchronic, reproductive and developmental tests) require
similar study parameters of design and result findings.
Table 6.1 Types of toxicity studies with oral repeated dosage and corresponding test guidelines
Test method
The EC Council Regulation Test Method
(EC, 2008)
The OECD Test Guideline (TG)
The U.S. FDA Redbook 2000 Regulation
(FDA, 2007)
The U.S. EPA OCSPP (previous OPPT) Guideline
Short-term, rodents B.7 407
(OECD, 2008) IV.C.3.a
870.3050
(EPA, 2000)
Subchronic, rodents B.26 408
(OECD, 1998a) IV.C.4.a
870.3100
(EPA, 1998a)
Subchronic, non-rodents
B.27 409
(OECD, 1998b) IV.C.4.b
870.3150
(EPA, 1998b)
Chronic, rodents B.30
452
(OECD, 2009)
IV.C.5.a 870.4100
(EPA, 1998c) Chronic, non-rodents IV.C.5.b
Developmental (prenatal)
B.31 414
(OECD, 2001) IV.C.9.b
870.3700
(EPA, 1998d)
Reproductive B.34 (1GEN*)
B.35 (2GEN**)
415 (1GEN), 416 (2GEN)
(OECD, 1983; OECD, 2001a) IV.C.9.a N/A
Neurotoxicity B.43 424
(OECD, 1997) IV.C.10
OPPTS 870.6200
(EPA, 1998e)
* 1GEN: 1-generation study; ** 2GEN: 2-generation study

Chapter 6
102
6.1.2. COSMOS oRepeatToxDB
For the purpose of constructing the COSMOS Oral Repeated Dose Toxicity Database,
and in order to facilitate the development of in silico tools for target organ toxicity
prediction, detailed information on critical target organ(s), critical toxic effect(s) and
associated LO(A)EL values were absolutely essential. Although a plethora of repeated dose
toxicity databases exist (extensive reviews of these have been published recently, e.g. by
Madden, 2013), there is a general lack of publicly available databases providing organ level
toxicity effect data associated with the LO(A)EL values. Moreover there is a lack of
databases which link this information with accurately identified chemical compounds, and
fewer or no databases that focus on cosmetics and their ingredients at the same time. There
is also a general paucity of mature chemical-toxicological ontologies for target organs
toxicity in the available databases (the importance of the ontologies for data mining has
been described in chapter 1.3). The COSMOS Oral Repeated Dose Toxicity Database
(oRepeatToxDB) was constructed to address these issues (the design of ontologies has been
discussed more in-depth in chapter 7; please refer to Annex 1).
The process of the database development included consolidation of available data
sources and harvesting of new ones. As far as the existing data sources are concerned, two
publicly available databases were found that were relevant for the needs of COSMOS
oRepeatToxDB, namely the U.S. EPA ToxRefDB (EPA DSSTox, 2016) and the public part of the
U.S. FDA CFSAN CERES, including the PAFA database (Benz & Irausquin, 1991).
The majority of ToxRefDB content refers to agrochemicals (pesticides), since the U.S.
EPA does not regulate cosmetics. However, about 15% of the content of ToxRefDB was
found to be in common with the COSMOS Cosmetics Inventory. ToxRefDB content, along
with NOEL/LOEL values, was provided by the U.S. EPA and used as received.
The U.S. FDA CFSAN PAFA (please refer also to Table 2.1) provides oral repeated-
dose toxicity information for several hundred compounds, referencing (as original data
sources) internal U.S. FDA documents, U.S. National Toxicology Program (NTP) study reports
and the scientific literature. Approximately 30% of those chemicals were found to be
common to the COSMOS Cosmetics Inventory. As the PAFA is the legacy database of the
U.S. FDA, in many cases (mostly due to the technical limitations existing at the time of its
construction) it does not provide sufficient level of detail for the toxicity data recorded (e.g.

Chapter 6
103
information on the target organs). Thus, PAFA served more as the repository of cosmetics-
related chemicals for which oral repeated dose toxicity studies have been performed. For
several PAFA compounds the referenced materials have been consulted and either re-
harvested or exchanged with more recent studies.
The main focus of the COSMOS oRepeatToxDB was placed on cosmetics and
cosmetics ingredients. The only exception to this rule was the inclusion of Food Contact
Substances (FCS) and impurities from the U.S. FDA Food Contact Notification program
through collaboration with the CERES project. This was to enable the consideration of
compounds which may be unintentionally present in the final cosmetic products (as a result
of migration from packaging materials, for example).
The new oral repeated dose toxicity data were harvested for the cosmetics and
related compounds from a range of regulatory and literature sources. The concerns over the
accuracy of data incorporated into COSMOS oRepeatToxDB were minimised by establishing
a consistent procedure for data curation and quality control, as described below.
6.1.3. Data record reliability in COSMOS oRepeatToxDB
The general aspects of the quality of biological data in toxicity databases have been
described in detail in chapter 4.1.3. As far as the existing sources of the oral repeated dose
toxicity data are concerned, both the U.S. FDA PAFA and the U.S. EPA ToxRefDB have their
own sets of minimal study inclusion criteria specified for particular study types (chronic,
subchronic, developmental toxicity, etc.). For instance, the U.S. FDA PAFA classifies the
studies for “completeness” using regulatory guidelines from the U.S. FDA Redbook (FDA,
2007) along with its own “core standards” (minimum inclusion criteria). If the study satisfies
the guideline, it is deemed to “meet the current standards” (PAFA completeness score “A”).
When the study is not compliant with the guideline but acceptable to the PAFA inclusion
criteria, it is classified as “not meeting the current standards, but meeting the core
standards” (PAFA completeness score “B”). When the study does not meet the minimum
standard of the database, it is considered “unacceptable by not meeting the core standards”
(PAFA completeness score “C”). For example, the PAFA database allows the entry of a rat
oral subchronic toxicity study using 5 animals at 2 dose levels without the full scale
histopathology descriptions, whereas the FDA Redbook requires the use of 20 animals at

Chapter 6
104
minimum 3 dose levels in a rat oral study and resulting full scale histopathology. Similarly,
the U.S. EPA ToxRefDB “data usability score” classifies studies with respect to the U.S. EPA
OPPT (OCSPP) guidelines and ToxRefDB inclusion criteria. The guideline-compliant studies
are deemed to be either “Acceptable Guideline (post-1998)” (following the GLP regulations)
or “Acceptable Guideline (pre-1998)” (pre-dating the GLP regulations). The non-guideline
studies are classified as “acceptable non-guideline” (when meeting the ToxRefDB standards)
or “unacceptable, deficient evaluation”.
The COSMOS database data model has been described in chapter 1.4. At a very high
level, for each toxicity study recorded for a given compound in COSMOS oRepeatToxDB, a
particular toxicological effect occurring at a particular dose level and at a particular site is
represented precisely. The study design captures all the details for species, sex, routes of
exposure, dose groups (levels and number of animals), control group information and
references. The effects are described by sets of controlled vocabulary and qualified by the
time of the findings, severity, statistical significance, and treatment-relatedness. The sites
are differentiated for organ (system), tissue (segment) and cells (organelles).
In order to represent the study data at this detailed level, the set of MINImum Study
inclusion criteria (COSMOS MINIS) have been established for subchronic, chronic,
reproductive, and developmental toxicity studies. Generally (Table 6.2), the requirements
for the study parameters included specification of the following elements: study duration,
animal species, route of exposure, control group, dose groups, dosage regimen, clinical
signs, water/food consumption, hematology, clinical chemistry, urinalysis, organ weight,
general necropsy/macro pathology and histopathology. Most of the study parameters have
been represented by the controlled vocabularies. With regard to the COSMOS MINIS
criteria, the COSMOS MINIS grade can be calculated algorithmically at the time of entering
data into the database (Table 6.3).

Chapter 6
105
Table 6.2 General overview of the study inclusion criteria established for the COSMOS oRepeatToxDB
Parameters The Study Inclusion Criteria
Study type Subchronic, chronic, carcinogenicity (non-neoplastic effects only), reproductive, developmental, neurotoxicity, immunotoxicity
Species Rat and mouse (all studies); monkey and dog (all studies); rabbit (reproductive/developmental studies)
Duration Greater than or equal to 28 days for subacute and subchronic studies; The requirement of “duration days” was not applied for reproductive, developmental or multi-generation studies
Route of exposure Oral, including dietary, drinking water, gavage (or intubation)
Dose levels and range Repeated dosage (the studies with single dose were not included). All studies with dose level and regimen information are included. At least one control group was required
Effects All effects were recorded according to controlled vocabulary
Reference Regulatory submissions, study reports, published literature (traceable citations)
Table 6.3 The COSMOS MINIS grade specifications
COSMOS MINIS Grade
Description
A Study meets the current standards of the guidelines: OECD, U.S. FDA, or U.S. EPA and the information for all the required COSMOS MINIS criteria is provided
B Study is non-guideline, but meets all COSMOS MINIS criteria
F Study does not meet COSMOS MINIS Criteria
S Assigned when the study data have been harvested from a summarised memo or opinions. Although the data source claims the guideline- or GLP-compliance, only summary data are available, which may lack detailed information
6.2. The aims of chapter 6
The aims of the present chapter realised in collaboration with the COSMOS
consortium partners (please refer to Annex 1) are related to the objective 5 of the current
PhD program (section 1.5) and include:

Chapter 6
106
Harvesting new oral repeated dose toxicity data for cosmetics and related
compounds from the regulatory and literature sources according to the predefined SOP;
Conducting the QC/QA process of the constructed COSMOS oRepeatToxDB.
6.3. Materials and methods
6.3.1. Harvesting new oral repeated dose toxicity data for cosmetics-related compounds
The oral repeated dose toxicity data for over 150 cosmetics-related chemicals were
harvested by Altamira LLC, LJMU and the U.S. FDA (please refer also to Annex 1). The
following data sources were used:
The opinions of the EC SCCS, providing the safety assessments of substances used in
cosmetics and consumer products. For many cosmetics and related compounds (e.g. hair
dyes), SCCS is the only publicly available source of the repeated-dose toxicity information;
The ECHA Registered Substances database, including the data used in a regulatory
setting;
Other relevant data sources: When the SCCS opinions or ECHA database referenced
U.S. National Toxicology Program (NTP) studies or published literature as the data origin,
the full level of detailed toxicity information was captured from the original sources. In
cases where unpublished and not available study reports were used by ECHA or SCCS, the
information presented in the Registered Substances database or in the opinion has been
used.
6.3.2. Data entry tool and data entry process
The data harvesting procedure was performed with respect to the established
COSMOS MINIS criteria, representing the highly detailed data model of the COSMOS
oRepeatToxDB (please refer to section 6.1.3). Only those studies fully compliant with GLP or
Guidelines (or ECHA studies with Klimisch score of 2) and with the COSMOS MINIS criteria
have been harvested (the “unacceptable” ones were not considered).
Data entry was performed by adapting the U.S. EPA ToxRefDB forms to the COSMOS
oRepeatToxDB needs. The data entry tool was delivered to each of the harvesters as a
Microsoft Access (MDB) file, along with an additional XLS file for the treatment group
Chapter 6
107
information upload. The data harvesting was conducted according to the Standard
Operating Procedure document, prepared by Altamira LLC and a toxicologist from the U.S.
FDA CFSAN. Prior to the actual data entry, the following steps were conducted for each
harvested compound:
Identification of the most recent data source providing the safety assessment for a
query compound (e.g. SCCS opinion);
Identification of the NO(A)EL value used to calculate the safety assessment metric
(e.g. the Margin of Safety (MoS) from the SCCS opinion) (please refer to chapter 6.1.1);
Identification of the original toxicity study with oral repeated dosage regimen
(“critical study”), from which the NO(A)EL value (used for the safety assessment) was
derived.
Subsequently, the relevant information was entered via the data entry tool. The data
entry procedure is presented in Figures 6.1-6.2, using the example compound, a hair dye, HC
Yellow No. 10 (CMS-43601, CAS RN: 109023-83-8), for which the SCCS opinion has been
harvested (SCCP, 2007).
In general, several categories of toxicological effects have been recorded (with
respect to the harvested study type) using the available controlled vocabulary lists to specify
the effects-related details and corresponding target sites (please refer to the Study Effect
List in Figure 6.2). The harvested studies were mostly for subchronic and chronic toxicity.
However, several reproductive and/or developmental studies were recorded as well. The
recorded effect types include:
In-Life Observations: Observations recorded at the beginning of the treatment,
during the treatment period and at the end of the treatment, before necropsy. They
included clinical signs (any signs of changes in behaviour, locomotion, appearance,
salivation, lacrimation, etc., that are associated with the treatment), mortality (associated
with the compound), body weight/body weight gain, food consumption/efficacy, water
consumption.
Pathology (Clinical): Blood and urine test results, corresponding to clinical chemistry
(biochemical parameters evaluated from the blood tests, e.g. enzyme activities, lipid

Chapter 6
108
profile, electrolyte levels, etc.), haematology (all the blood parameters) and urinalysis (all
urine tests and parameters).
Pathology (Gross): Gross examination of all organs after the treatment period
referring to the changes in their appearance e.g. discoloration, pigmentation,
enlargement, etc.
Organ Weight: Post-treatment observations including absolute organ weight and
relative (to the body weight and/or to the brain weight) organ weight.
Pathology (Non-neoplastic): Post-treatment observations corresponding to the
plethora of detailed histopathological changes observed in different organs. Each
histopathological effect was recorded for particular target organ (e.g. liver), and further
specified target sites (e.g. centrilobular hepatocytes).
For reproductive/developmental toxicity studies, the effect types refer to:
Maternal toxicity, including in-life observations and necropsy findings (gross
pathology, organ weights (uterine weight, especially), non-neoplastic pathology).
Reproductive toxicity, including the information on the oestrus cycle (number of
corpora lutea), reproductive performance (number of implantations, pre- and post-
implantation losses, resorptions, birth index, gestation index, etc.), offspring survival
(number of live and dead fetuses; litter size, litter viability), reproductive outcome (sex
ratio), foetal/litter weight.
Developmental toxicity, including skeletal malformations or alterations.
Newly harvested data underwent a manual curation process (conducted by Altamira
LLC), prior to being ported into the COSMOS oRepeatToxDB.

Chapter 6
109
Figure 6.1 Screenshots from the COSMOS ToxRefDB data entry tool for oral repeated dose toxicity data harvesting (part 1): Main screen and COSMOS Interim Input Form
Main screen of the COSMOS ToxRefDB
Selecting the harvested compound from the drop-down pick list.
COSMOS Interim Input Form
Entering the information on:
Data entry status (e.g.: complete) and level (e.g.: all observations or summary);
Harvested document (number, source, included references, etc.);
Study design: year; study/data quality; study type; study duration; test animals (species, strain); dosage regimen (route of administration, etc.);
Test material (purity, batch/lot, etc.).
Treatment Group Upload XLS file template
Required fields in blue; Non-obligatory ones in orange
Filling-in the Treatment Group Upload template file using the drop-down pick lists.
Treatment Group List has been uploaded from
Treatment Group Upload XLS file

Chapter 6
110
Figure 6.2 Screenshots and examples COSMOS ToxRefDB as the data entry tool for oral repeated dose toxicity data harvesting (part 2): Study Effect List, Study Effects Input Form, Input Form for Quantitative Data, and Show All Effects Form
Study Effect List
Selecting the Effect Type Target. Specifying the Target Site (where applicable). Providing the Effect Description. Specifying the Effect Direction. Applying the entered information to the relevant treatment groups.
Study Effects Input Form
Specifying the study endpoint, i.e.: LOAEL value.
Entering the details for each recorded effect:
Statistical Significance;
Severity;
Treatment relatedness;
Quantitative data.
Input Form for Quantitative Data
Show All Effects Form
Reviewing the recorded information.
Drop-down pick lists available for each element

Chapter 6
111
6.3.3. The QC/QA of the COSMOS oRepeatToxDB content
During the data harvesting procedure the Klimisch scores and the information on the
study compliance with GLP or guidelines were captured from original data sources, i.e. from
the EC ECHA database and from the SCCS opinions. The data record reliability was
addressed by the COSMOS MINIS grade (please refer to section 6.1.3).
Prior to the public release of the oRepeatToxDB, the COSMOS ToxRefDB entry form
tables were queried from the database for review and QC/QA process (Table 6.4).
Approximately 2% of the toxicity records included in the COSMOS oRepeatToxDB were
selected randomly. In total, 2722 records were checked for correctness/completeness
against the original data sources. The outcome was used to calculate the error rates.
Table 6.4 The tables, fields, and total number of records subjected to the QC/QA procedure of the COSMOS oRepeatToxDB. During the QC/QA the number of incorrect records in particular tables have been recorded and used to provide the QA statistics
Table Fields subjected to the QC/QA procedure Total QC-ed records
Studies Test Substance Name; % Purity; % Active; Tested Form; Test Substance Comments; Study Type; Duration; Route Of Exposure; Species; Strain; Animal Weight Or Age Range; Dose Or Conc. Levels; Dosage Regimen; Vehicle; Dose Comments; Study Design Comments; Data Record Reliability [Source]; Document Source; Document Number; Study Source Type; Study Report; Source; Study Report Number; Study Conducted Year; Journal Publication Citation; Study/Article Title; Year (Report/ Citation)
104
Survival
Sex; # Animals; Concentration Or Dose; Dosing Comments; Assay Type; Sites; Effects; Effects Description; Time Of Findings; Statistical Significance; Treatment Relatedness; Effects Severity; Comments
102
Food/Water consumption 238
Body weight 578
Clinical signs 578
Clinical chemistry 204
Haematology 408
Organ weight 204
Gross pathology 0
Pathology-micro 306
Total in QA 2722

Chapter 6
112
6.4. Results
6.4.1. COSMOS oRepeatToxDB content
The final COSMOS oRepeatToxDB contained 340 in vivo oral repeated dose toxicity
studies for 228 chemicals: 186 cosmetics-related studies (including 100 hair dyes) and 42 for
impurities (originating from the U.S. FDA CFSAN CERES).
As far as the experimental data content are concerned, the COSMOS oRepeatToxDB
was profiled for the species and study types (Figure 6.3).
Figure 6.3 Number of studies per species per study type included in COSMOS oRepeatToxDB
The toxicological effects recorded included: clinical parameters (e.g. body weight
gain, clinical signs, clinical chemistry, mortality, urinalysis), post- sacrifice measurements
(organ weight, necropsy, histopathology) and parental, reproductive and developmental
(pre- natal) toxicity. For each effect recorded the “direction” (increase/decrease/no change)
and “severity” of finding was specified, as well as “treatment-relatedness”, “dose-
dependency”, “statistical significance” and (where applicable) “biological/toxicological
relevance”.
As far as the target organ toxicity was concerned, the organ weight, gross pathology
and/or histopathology effects were recorded for a total number of 41 organs. The ten most
frequently affected (in these three assays) are presented in Figure 6.4.

Chapter 6
113
Figure 6.4 The ten most frequently affected target organs in organ weight, gross pathology and histopathology assays
The organ weight observations (including “decrease”, “increase” or “no change” of
absolute organ weight, and/or relative to brain or body weight organ weight) were recorded
for 18 different organs for the total number of 161 compounds tested in 201 studies. The
gross pathological findings include macroscopic lesions and changes in appearance (mostly
discoloration and size alterations) of 28 organs observed in 65 studies performed for 64
tested compounds. The histopathological lesions were recorded for 36 target organs and
further profiled for the species. It turned out that the most sensitive organs are liver and
kidney, whereas the most sensitive species is rat (Figure 6.5).
The histopathological lesions were recorded with respect to the sites hierarchically
differentiated to the organs (systems), tissues (segments), and cells (organelles). This way of
data recording enabled the further development of ontologies for particular target organs
toxicity (this process is discussed in more depth in chapter 7). Overall, the COSMOS
oRepeatToxDB includes histopathological data for the total number of 118 “organ (system)-
tissue (segment)-cell” sites. The example of sites available for the most sensitive target
organ (i.e. liver) are presented in Figure 6.6.
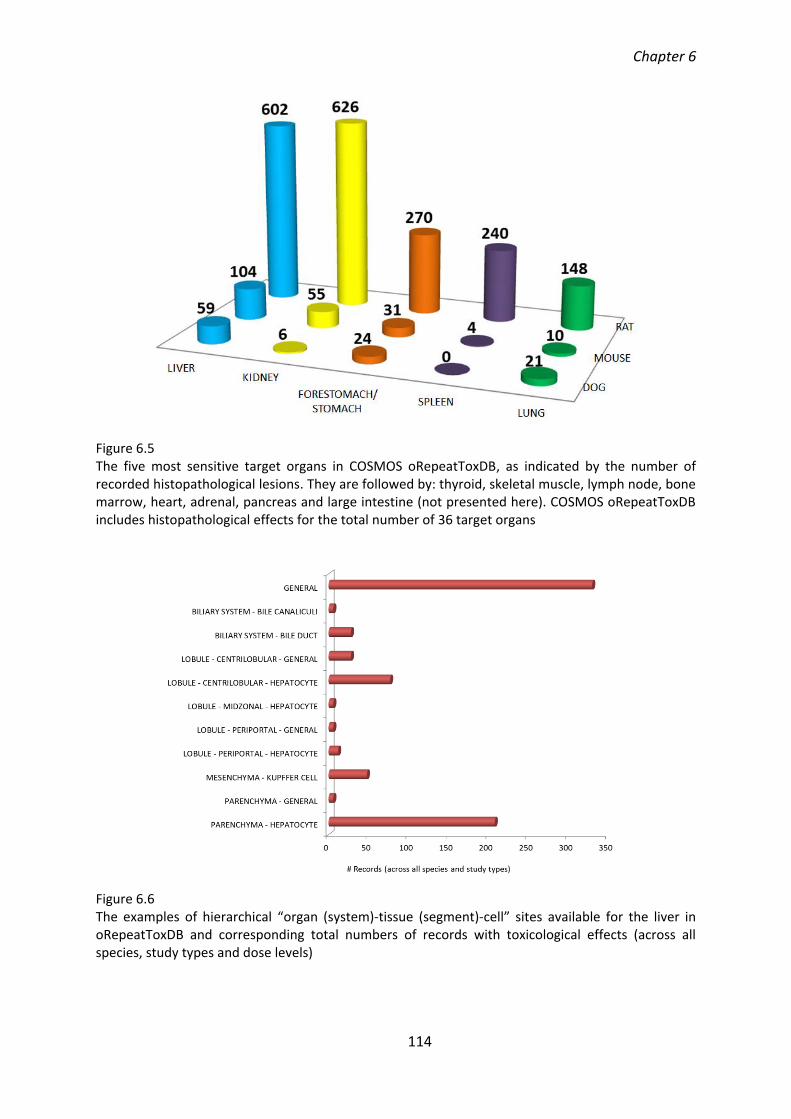
Chapter 6
114
Figure 6.5 The five most sensitive target organs in COSMOS oRepeatToxDB, as indicated by the number of recorded histopathological lesions. They are followed by: thyroid, skeletal muscle, lymph node, bone marrow, heart, adrenal, pancreas and large intestine (not presented here). COSMOS oRepeatToxDB includes histopathological effects for the total number of 36 target organs
Figure 6.6 The examples of hierarchical “organ (system)-tissue (segment)-cell” sites available for the liver in oRepeatToxDB and corresponding total numbers of records with toxicological effects (across all species, study types and dose levels)

Chapter 6
115
6.4.2. The QC/QA of COSMOS oRepeatToxDB content
The results of the QA on the COSMOS oRepeatToxDB indicated 0.57% erroneous
records (e.g. mistake in animal counts or incorrectly inserted effects), and 5.2% missing
records (e.g. effect descriptions).
6.5. Discussion
This chapter outlines the current requirements for publicly available, cosmetics-
enriched, repeated dose toxicity database. In order to fulfil this need, the new oral repeated
dose toxicity data were harvested from a range of scientific literature and regulatory
sources (including SCCS opinions), and incorporated into novel COSMOS oRepeatToxDB. The
high quality of the incorporated data was assured by consistent application of the
established MINImum Study inclusion criteria (COSMOS MINIS) during the data collation,
and rigorous procedure for the data curation and quality control.
The COSMOS oRepeatToxDB includes 340 toxicity studies for 228 chemicals (186
cosmetics-related, including 100 hair dyes and 42 impurities). This is (by far) the largest
publicly available database in which the toxicological effects occurring at particular dose
levels and at given sites are precisely represented for each recorded toxicity study. The
study design captures all of the details for species, sex, routes of exposure, dose groups
(levels and number of animals), control group information, and references. The effects are
described by sets of controlled vocabularies and qualified by the time of findings, severity,
statistical significance, and treatment-relatedness. The sites are hierarchically differentiated
for organs (system), tissues (segment), and cells (organelles). For each relevant numeric
endpoint recorded (e.g. LO(A)EL), the detailed information on the critical effects observed is
included.
The unique data model of the COSMOS oRepeatToxDB and the level of details of the
recorded data enable in vivo data mining and development of chemical-toxicological
ontologies (discussed more in-depth in chapter 7). COSMOS oRepeatToxDB supports the
development of in silico tools for predicting target organ toxicity. As revealed by the analysis
of the database content, the most sensitive target organs (for which the highest number of
toxicological effects was recorded) include liver and kidney, which indicates that future
Chapter 6
116
research will be focused on these areas. The COSMOS oRepeatToxDB provided the
foundation for the analysis described in chapter 7.

Chapter 7
117
Chapter 7
Mechanistic, Ontology-based Liver Toxicity Data Mining in COSMOS oRepeatToxDB
7.1. Background
The importance of mechanistic (mode-of-action-based) data mining in predictive
toxicology was discussed in-depth in chapter 1.2. The fundamental significance of mature
chemical-toxicological ontologies for the successful application of data mining has been also
outlined (chapter 1.3 and chapter 6). Briefly, the ontologies identifying the toxic effects
observed at particular organism levels (organs, tissues, or cells) through precisely
categorised terms can provide the rationale for the MoA-based toxicity prediction.
In general, chemicals exhibiting systemic toxicity do not cause a similar degree of
effects in all organs, but elicit the major toxicity in one or two of them, which are termed
“the target organ(s) for toxicity” (UNL, 2002). The analysis of the COSMOS oRepeatToxDB
content presented in chapter 6.4.1 identified the liver as the most sensitive target organ for
which the highest number of histopathological lesions has been recorded. The liver, as the
largest internal organ and gland in the human body, is highly exposed to a range of
potentially toxic substances entering an organism. Therefore, with regard to the prediction
of repeated-dose toxicity, hepatotoxicity and the mode(s) of action of its potential chemical
inducers are of particular interest.
7.1.1. Overview of the structure and functions of the liver
The liver is located in the right upper quadrant of the abdominal cavity, right of the
stomach and overlying the gallbladder. Gross anatomy divides it into the two lobes, left and
right, separated by the falciform ligament and visible from the parietal surface. The two
additional lobes, the caudate lobe and the quadrate lobe, are visible between the right and
left lobes from the visceral surface (Abdel-Misih & Bloomston, 2010).
The liver is a metabolically active organ associated with multiple functions. It
regulates the levels of most chemicals in the blood and produces and excretes bile.
Physiological functions of the liver cells (hepatocytes) also include synthesis and storage of
protein, synthesis of cholesterol and phospholipids, transformation of carbohydrates,

Chapter 7
118
storage of glycogen and detoxification. Hepatocytes are the primary target of many liver
injuries, including excessive fat accumulation and drug induced liver damage. In order to
understand the hepatotoxic effects, it is necessary to understand the distinctive features of
hepatic vascular and biliary systems and their associations with liver cells’ architecture
(Bowen, 2003; Abdel-Misih & Bloomston, 2010; Krishna, 2013).
The liver vascular system is based on a dual blood supply: hepatic artery providing
arterial oxygenated blood (approx. 25% of liver blood supply), and portal vein, directing the
nutrient-rich venous blood from the stomach, small intestine, pancreas and spleen (75% of
liver blood supply). Terminal branches of the hepatic artery and portal vein mix and drain as
they enter liver sinusoids, i.e. vascular capillaries which are lined with endothelial cells
separating the hepatocytes from the blood flowing through the sinusoids. Sinusoidal
endothelial cells play an important role in hepatic microcirculation. The space between
hepatocytes and sinusoidal endothelial cells contains hepatic stellate (Ito) cells, playing an
essential role in liver regeneration. Stellate cells secrete growth factors and the main
constituent materials of the matrix (e.g. collagen and reticulin) to replace the damaged
hepatocytes and form scar tissue. The sinusoidal lumen contains liver-specific macrophages
(Kupffer cell), which remove debris or aged/damaged erythrocytes in the blood flow and
stimulate the immune system through the secretion of numerous factors and cytokines. The
blood from the sinusoids reaches the central vein of each hepatic lobule (structural unit of
the liver, please see below). Central veins fuse into hepatic veins, which leave the liver and
drain into the vena cava (Bowen, 2003).
The biliary system (biliary tree) of the liver consists of canaliculi (intercellular spaces
between adjacent hepatocytes surrounding the sinusoids) and ducts which transfer the bile
from the liver into the small intestine. Hepatocytes secrete bile into the canaliculi. The bile
flows parallel to the sinusoids, but in the opposite direction to the blood flow. Canaliculi
coalesce into bile ducts lined with epithelial cells, ultimately draining into the common
hepatic duct. It fuses with the cystic duct from the gallbladder and forms the common bile
duct, running to the duodenum, the first section of the small intestine. The distinctive
arrangement of the bile duct, hepatic artery and portal venule in the liver is called a portal
triad (Bowen, 2003).

Chapter 7
119
The liver is covered with a connective tissue (septae), dividing the parenchyma into
very small, structural units – lobules. The hepatic lobule consists of hexagonal plates of
hepatocytes with a central vein (hepatic venule) located in the middle and portal triads
located peripherally. The lobule is divided into the following parts: centrilobular, midzonal,
and periportal. The functional unit of the liver is hepatic acinus, roughly oval mass of
hepatocytes around the hepatic arterioles and portal venules. The hepatic acinus is divided
into the three zones reflecting the distance from the arterial blood supply. Zone 1
(corresponding to the periportal part of the hepatic lobule; surrounding the portal tract and
located closest to the arterioles) consists of the best oxygenated hepatocytes. Acinar zone 2
(corresponding to the midzonal part of the hepatic lobule) and zone 3 (corresponding to the
centrilobular part of the hepatic lobule; surrounding the hepatic venule) contain the poorer
oxygenated hepatocytes, as blood from the portal tract flows though the acinar zones to the
venule being deoxygenated (Bowen, 2003; Abdel-Misih & Bloomston, 2010; Krishna, 2013).
The toxic effect of many drugs on the liver has been linked to the circulatory
dysfunction (Lautt, 2009), and the lesions caused by a range of pathologic processes are
frequently reflected in the acinar structure (Bowen, 2003).
7.1.2. Toxicity categories of liver injury: steatosis, steatohepatitis and fibrosis
Liver steatosis, i.e. excessive accumulation of fatty acids in hepatocytes due to the
impairment of the process of synthesis and elimination of triglycerides, may be a cause of a
chronic liver injury. The pathological changes associated with steatosis include formation of
lipid droplets in the cytoplasm of hepatocytes, lipid vacuolisation, hepatomegaly
(hypertrophy, enlargement of the liver) and lipid deposition (Vitcheva et al., 2013).
When associated with inflammation, the fatty liver progresses to steatohepatitis.
The pathological changes characterising steatohepatitis mostly involve the acinar zone 3 and
include hepatocellular injury and inflammation in the lobular parenchyma. Hepatocellular
injury is manifested by ballooning degeneration of hepatocytes, associated with formation
of Mallory’s hyalines (clumps of damaged material in the hepatocyte cytoplasm),
apoptosis/necrosis, associated with increased hepatocellular expression of the membrane
receptor Fas and megamitochondria in hepatocytes. The cell necrosis evokes an
inflammatory reaction morphologically manifested by the appearance of inflammatory cells

Chapter 7
120
(neutrophils, lymphocytes, macrophages), oedema and congestion around parenchymal
cells (Vitcheva et al., 2013).
The chronic inflammation leads to liver fibrosis, associated with tissue destruction
and simultaneous repair processes, resulting in a lack of balance between the deposition
and degradation of extracellular matrix (ECM) and a change of ECM composition. It can be
characterised by thickening of the liver capsule (due to the excessive accumulation of ECM
proteins, including collagen) and hyperplasia (due to the increased nuclear diameter and
volume and cytoplasmic volume of the hepatocytes) (Bataller & Brenner, 2005; Vitcheva et
al., 2013, Landesmann, 2016). The Adverse Outcome Pathway (Figure 7.1) for liver fibrosis
has been recently proposed (Landesmann, 2016).
Figure 7.1 Schematic representation of the Adverse Outcome Pathway for liver fibrosis (from Landesmann, 2016). The Molecular Initiating Event (MIE) of this AOP is protein alkylation, leading to the following Key Events (KEs):
Cell injury and death;
Activation of Kupffer cells, due to engulfment of apoptotic bodies, i.e. fragmented DNA from apoptotic hepatocytes;
Expression of fibrogenic cytokines, Transforming Growth Factor-β (TGF-β1);
Activation of hepatic stellate cells (HSC), which change from vitamin A-rich phenotype to a myofibroblastic phenotype, exhibiting fibrogenic properties (secretion of pro-inflammatory cytokines and chemokines, synthesis of matrix proteins and of inhibitors of matrix degeneration);
Progressive collagen accumulation and changes in Extracellular Matrix (ECM) composition. The excessive accumulation of ECM proteins progressively affects the whole organ and alters its normal functioning, which corresponds to liver fibrosis, the adverse outcome (AO). The scheme does not include two Key Events, namely inflammation and oxidative stress, which are considered to be present throughout the entire AOP
Liver fibrosis occurring in the majority of types of chronic liver diseases results in
derangement of the liver architecture, portal hypertension and may produce irreversible
circulation changes leading to cirrhosis and, eventually, liver failure and death.

Chapter 7
121
7.2. The aims of chapter 7
The aims of the present chapter realised in collaboration with the COSMOS
consortium partners (please refer to Annex 1) are related to the objective 6 of the current
PhD program (section 1.5), and include:
Validation of the liver toxicity ontology developed on the basis of the data collated at
the stage of the construction of COSMOS oRepeatToxDB;
Ontology-based liver toxicity (steatosis) data mining of COSMOS oRepeatToxDB;
Structural (ToxPrint chemotype) analysis of the chemical compounds obtained as a
result of data mining and identification of the structural fragments associated with the
endpoint investigated;
Formulating the mechanistic reasoning for the selected compounds on the basis of
the literature search and results of molecular modelling analysis delivered by collaborating
COSMOS consortium partners from BAS and S-IN.
7.3. Materials and methods
7.3.1. The development and validation of target organ toxicity ontologies
As mentioned in chapter 6.1.2, mature chemical-toxicological ontologies for target
organ toxicity are lacking in the existing databases. The currently available resources are
limited to the taxonomies, e.g. OpenTox (An Open Source Predictive Toxicology Framework,
available at: http://www.opentox.net/) project dictionaries, describing the relations
between chemical and toxicological data and experiments, or the taxonomy of biologically
relevant chemical entities and their activities proposed in the ChEBI dictionary (Smith et al.,
2007; Hardy et al., 2012).
As discussed in chapter 6, observed toxicity effects have been recorded in COSMOS
oRepeatToxDB with respect to the corresponding target sites structured hierarchically (as
organs/tissues/cells). Thus, it was possible to link the phenotypic effects occurring at very
high (whole organism) level, with the pathological changes observed at various lower levels:
organs, tissues and finally cells. The conceptual scheme representing this hierarchy is shown
in Figure 7.2 (Vitcheva et al., 2013).

Chapter 7
122
Figure 7.2 Conceptual scheme of the COSMOS oRepeatToxDB hierarchical ontology, enabling mapping of the observed pathological changes with high-level phenotypic effects (Vitcheva et al., 2013)
Within this concept, the cell, in which the majority of the biological and chemical
processes occur, can be regarded as the bottom-level intersection where biology, chemistry
and toxicity meet. It is in the information for the cell that interactions can be investigated by
accounting for the proteins and genes involved on one hand and the chemical and biological
roles of the chemical compounds (determined by their physicochemical, electronic, etc.,
properties) on the other. In order to enable linkage of the biological effects with chemicals
involved in toxicity pathways, such ontologies (along with related controlled vocabularies)
have been designed within COSMOS oRepeatToxDB.
The dynamic and iterative process of the development of ontologies actually began
at the data harvesting stage, when the detailed domains and scopes of the ontologies were
defined. The simultaneous inspection and mining of the data collated has led to the
formulation of the initial ontologies. Subsequently, a range of iterative steps were
performed, including:
Further data mining;
Consultations with trained toxicologists;
Enumeration of the important terms in the ontologies;
Re-defining the classes and hierarchies;
Validation and updating of the ontologies.
The focus of the present chapter was placed on the validation of the ontology
developed for liver toxicity. With respect to the molecular mechanisms involved in the
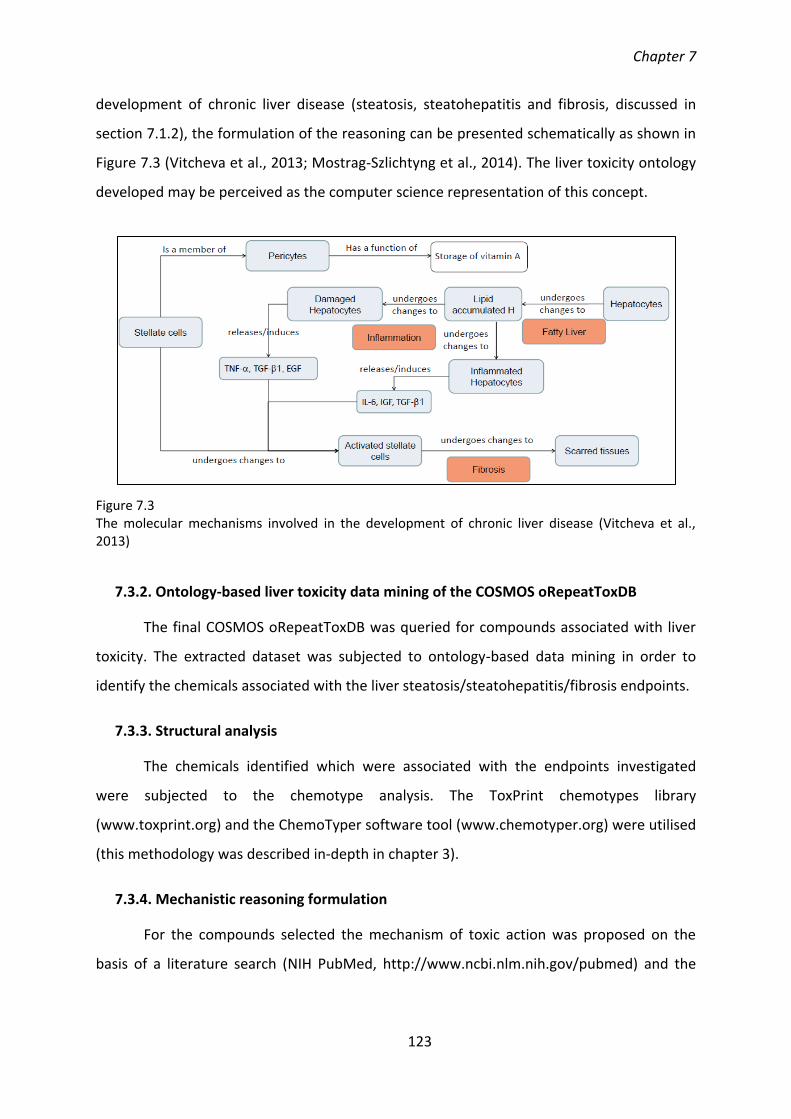
Chapter 7
123
development of chronic liver disease (steatosis, steatohepatitis and fibrosis, discussed in
section 7.1.2), the formulation of the reasoning can be presented schematically as shown in
Figure 7.3 (Vitcheva et al., 2013; Mostrag-Szlichtyng et al., 2014). The liver toxicity ontology
developed may be perceived as the computer science representation of this concept.
Figure 7.3 The molecular mechanisms involved in the development of chronic liver disease (Vitcheva et al., 2013)
7.3.2. Ontology-based liver toxicity data mining of the COSMOS oRepeatToxDB
The final COSMOS oRepeatToxDB was queried for compounds associated with liver
toxicity. The extracted dataset was subjected to ontology-based data mining in order to
identify the chemicals associated with the liver steatosis/steatohepatitis/fibrosis endpoints.
7.3.3. Structural analysis
The chemicals identified which were associated with the endpoints investigated
were subjected to the chemotype analysis. The ToxPrint chemotypes library
(www.toxprint.org) and the ChemoTyper software tool (www.chemotyper.org) were utilised
(this methodology was described in-depth in chapter 3).
7.3.4. Mechanistic reasoning formulation
For the compounds selected the mechanism of toxic action was proposed on the
basis of a literature search (NIH PubMed, http://www.ncbi.nlm.nih.gov/pubmed) and the

Chapter 7
124
results of a molecular modelling analysis delivered by collaborating COSMOS consortium
partners from BAS and S-IN.
7.4. Results
7.4.1. Ontology-based liver toxicity data mining
The ontology developed for liver toxicity covers a range of hierarchical sites and over
30 effects/pathological changes, giving the total number of 53 unique “site-effect” pairs
(Table 7.1).
Querying COSMOS oRepeatToxDB for all histopathological effects recorded for the
liver resulted in the retrieval of a total of 70 compounds with such effects. The terms related
to liver steatosis/steatohepatitis/fibrosis were used to extract the final set of compounds of
interest (please refer to section 7.1.2 for the description of the associated pathological
changes). This analysis led to the identification of 13 relevant combinations of “tissue-cell”
sites and effects (Figure 7.4) covered by 59 chemicals (Table 7.2) (Mostrag-Szlichtyng et al.,
2014).
As an example of the type of compound identified, for allyl hexanoate (CMS-13529,
compound #17 in Table 7.2), oRepeatToxDB contains information on a subchronic study in
rat with the observed effect “fibrosis” and associated site “liver – general”, for
tetrakis(hydroxymethyl)phosphonium sulfate (CMS-1349, compound #8 in Table 7.2)
“cytoplasmic vacuolisation” has been recorded for “lobule – periportal – hepatocyte” in
subchronic studies in rat, etc.

Chapter 7
125
Table 7.1 The “liver-tissue-cell” sites with corresponding effects covered by the ontology in the COSMOS oRepeatToxDB (Vitcheva et al., 2013)
TISSUE CELLS/ ORGANELLES
EFFECT NAMES
LIVER GENERAL
Congestion; Cytological Alterations; Fatty Change; Fibrosis; Firm Areas; Focal Cellular Change; Granuloma; Haematopoiesis; Hepatitis; Hypertrophy; Inflammation; Lesions (Nos); Lipid Deposition; Necrosis; Pigmentation; Proliferation
BILIARY SYSTEM – BILE CANALICULI
Pigmentation
BILIARY SYSTEM - BILE DUCT
Hyperplasia; Proliferation; Vacuolisation
ACINUS – PERIACINAR ZONE
ACINAR CELLS Fibrosis; Hypertrophy; Necrosis
CYTOPLASM Vacuolisation
LOBULE – CENTRILOBULAR
HEPATOCYTES Cytoplasmic Alteration; Distention; Enlargement; Glycogen Loss; Hypertrophy; Necrosis; Vacuolisation
LOBULE – MIDZONAL HEPATOCYTES Hypertrophy; Hyperplasia
LOBULE – PERIPORTAL
HEPATOCYTES Cellular Infiltration; Hypertrophy
MESENCHYMA
STELLATE CELLS Hypertrophy; Lipid Accumulation
KUPFFER CELLS Distention; Hyperplasia; Discoloration; Pigmentation
CYTOPLASM Vacuolisation
PARENCHYMA HEPATOCYTES Cellular Infiltration; Degeneration; Fatty Changes; Hypertrophy; Inflammation; Necrosis; Pigmentation; Proliferation; Vacuolisation

Chapter 7
126
Table 7.2 The 59 compounds for which the histopathological changes related to the liver steatosis/steatohepatitis/fibrosis have been found in COSMOS oRepeatToxDB (Mostrag-Szlichtyng et al., 2014)
# CMS ID CAS RN PREFERRED NAME # CMS ID CAS RN PREFERRED NAME
1 365 108-94-1 CYCLOHEXANONE 16 11422 106990-43-6 N,N'''-1,2-ETHANEDIYLBIS[N-[3-[[4,6-BIS[BUTYL(1,2,2,6,6-PENTAMETHYL-4-PIPERIDINYL)AMINO]-1,3,5-TRIAZIN-2-YL]AMINO]PROPYL]-N',N''-DIBUTYL-N',N''-BIS(1,2,2,6,6-PENTAMETHYL-4-PIPERIDINYL)-1,3,5-TRIAZINE-2,4,6-DIAMINE
2 609 107-21-1 ETHYLENE GLYCOL 17 13529 123-68-2 ALLYL HEXANOATE
3 618 104-76-7 2-ETHYL-1-HEXANOL 18 13782 70624-18-9 POLY(CYANURIC CHLORIDE-CO-TERT-OCTYLAMINE-CO-1,6-BIS(2,2,6,6-TETRAMETHYL-4-PIPERIDYLAMINO)HEXANE)
4 663 98-01-1 FURFURAL 19 14793 7128-64-5 2,2'-(2,5-THIOPHENEDIYL)-BIS (5-TERT-BUTYLBENZOXAZOLE)
5 780 67-63-0 ISOPROPYL ALCOHOL 20 15009 135861-56-2 DIMETHYLDIBENZYLIDENE SORBITOL
6 887 75-09-2 METHYLENE CHLORIDE 21 15014 134701-20-5 2,4-DIMETHYL-6-(1-METHYLPENTADECYL)PHENOL
7 1178 51-03-6 PIPERONYL BUTOXIDE 22 15070 161717-32-4 PHOSPHOROUS ACID, CYCLIC BUTYLETHYL PROPANEDIOL, 2,4,6-TRI-TERT-BUTYLPHENYL ESTER
8 1349 55566-30-8 TETRAKIS(HYDROXYMETHYL)PHOSPHONIUM SULFATE
23 25576 56216-28-5 3,5-DIAMINO-2,6-DIMETHOXYPYRIDINE DIHYDROCHLORIDE
9 2321 131-57-7 OXYBENZONE 24 26324 68391-30-0 C.I. BASIC RED 76
10 3598 108-91-8 CYCLOHEXYLAMINE 25 26325 68391-31-1 C.I. BASIC YELLOW 57
11 3639 111-76-2 ETHYLENE GLYCOL MONOBUTYL ETHER
26 26704 74578-10-2 2,6-XYLIDINE, 4-(2,6-DICHLORO-ALPHA-(4-IMINO-3,5-DIMETHYL-2,5-
12 3681 108-31-6 MALEIC ANHYDRIDE 27 26998 81892-72-0 1,3-BIS-(2,4-DIAMINOPHENOXY)PROPANE
13 3855 96-91-3 PICRAMIC ACID 28 27489 94158-13-1 2,2'-((4-AMINO-3-NITROPHENYL)IMINO)BISETHANOL HYDROCHLORIDE
14 4141 111-77-3 DIETHYLENE GLYCOL MONOMETHYL ETHER
29 27490 94158-14-2 2-(1,3-BENZODIOXOL-5-YLAMINO)ETHANOL HYDROCHLORIDE
15 4291 6197-30-4 OCTOCRYLENE 30 27591 97404-02-9 2-((4-AMINOPHENYL)AZO)-1,3-DIMETHYL-1H-IMIDAZOLIUM CHLORIDE
Continued on the following page

Chapter 7
127
Table 7.2, continued The 59 compounds for which the histopathological changes related to the liver steatosis/steatohepatitis/fibrosis have been found in COSMOS oRepeatToxDB (Mostrag-Szlichtyng et al., 2014)
# CMS ID CAS RN PREFERRED NAME # CMS ID CAS RN PREFERRED NAME
31 4464 93-15-2 EUGENYL METHYL ETHER 46 28451 149591-38-8 BISHYDROXYETHYL BISCETYL MALONAMIDE
32 4878 77-90-7 TRIBUTYL ACETYLCITRATE 47 34877 71786-60-2 N,N-BIS(2-HYDROXYETHYL)ALKYL(C12-C18)AMIDE
33 4879 77-99-6 TRIMETHYLOLPROPANE 48 42308 26125-40-6 POLY(P-DICHLOROBENZENE-CO-SODIUM SULFIDE)
34 4997 107-88-0 1,3-BUTYLENE GLYCOL 49 44734 128729-28-2 HYDROXYPROPYL BIS(N-HYDROXYETHYL-P-PHENYLENEDIAMINE) HYDROCHLORIDE
35 5629 16470-24-9 C.I. FLUORESCENT BRIGHTENER 220
50 46977 16867-03-1 2-AMINO-3-HYDROXYPYRIDINE
36 5805 32687-78-8 1,2-BIS(3,5-DI-TERT-BUTYL-4-HYDROXYHYDROCINNAMOYL)HYDRAZINE
51 50942 3248-91-7 C.I. BASIC VIOLET 2
37 5856 52829-07-9 BIS(2,2,6,6-TETRAMETHYL-4-PIPERIDINYL) SEBACATE
52 56289 59820-63-2 3-METHYLAMINO-4-NITROPHENOXYETHANOL
38 7013 2682-20-4 2-METHYL-4-ISOTHIAZOLIN-3-ONE 53 56847 61693-43-4 3-AMINO-2,4-DICHLOROPHENOL HYDROCHLORIDE
39 8572 128-95-0 C.I. DISPERSE VIOLET 1 54 59879 77061-58-6 2-((4-(DIMETHYLAMINO)PHENYL)AZO)-1,3-DIMETHYL-1H-IMIDAZOLIUM CHLORIDE
40 8676 1777-82-8 2,4-DICHLOROBENZYL ALCOHOL 55 60520 82576-75-8 2-((4-AMINO-2-METHYL-5-NITROPHENYL)AMINO)ETHANOL
41 8750 75-85-4 AMYLENE HYDRATE 56 60750 84540-50-1 5-AMINO-6-CHLORO-O-CRESOL
42 9026 846-70-8 EXT. D&C YELLOW NO. 7 57 67443 78301-43-6 POLY(2,2,4,4-TETRAMETHYL-20-(OXIRANYLMETHYL)-7-OXA-3,20-DIAZADISPIRO(5.1.11.2)HENEICOSAN-21-ONE)
43 10280 125643-61-0 ALKYL(C7-9-BRANCHED) 3,5-DI-TERT-BUTYL-4-HYDROXYHYDROCINNAMATE
58 72013 68391-32-2 BASIC BROWN 17
44 10707 4368-56-3 C.I. ACID BLUE 62 59 72054 23920-15-2 HC BLUE NO. 11
45 10786 142-19-8 ALLYL HEPTANOATE

Chapter 7
128
Figure 7.4 Example of liver “site-phenotypic effect” pairs related to the steatosis/steatohepatitis/fibrosis in COSMOS oRepeatToxDB
7.4.2. Structural analysis
The ToxPrint chemotypes analysis of 59 compounds obtained as a result of data
mining revealed that the most abundant structural classes included alcohols (aliphatic and
aromatic), amines (aromatic and aliphatic), ethanolamines, oxy- alkanes, ethers and
compounds with azo- and nitro- aromatic groups (Figure 7.5) (Mostrag-Szlichtyng et al.,
2014). The example compounds representing identified distinctive structural features are
presented in Table 7.3
Figure 7.5 The structural profile of 59 compounds associated with liver steatosis/steatohepatitis/fibrosis expressed as the frequency of ToxPrint features (the actual counts were provided on the plot’s bars)

Chapter 7
129
Table 7.3 Distinct structural features identified in the set of 59 compounds associated with liver steatosis/steatohepatitis/fibrosis
Structural characteristics Example compounds
Aliphatic alcohols/glycols, glycol ethers
(Di)Ethanolamines, long aliphatic chains
Aromatic nitro- groups, aromatic amines, (di)ethanolamines
Aromatic halides, compounds with azo- aromatic groups, anthraquinones
Furans, thiazoles, cyclohexane derivatives
Rigid rings/cyclic fragments and long flexible chains

Chapter 7
130
7.4.3. Mechanistic reasoning formulation
As outlined in 1.2, mode-of-action-based predictive toxicology approaches support
the Adverse Outcome Pathway (AOP) framework (OECD, 2013). In order to facilitate the
understanding and formulation of the MoA/AOPs involved in the development of chronic
liver disease, ontology based data mining and subsequent structural analysis was combined
with the results of molecular modelling (MM), as performed by the collaborating COSMOS
partners from BAS and S-IN (Mostrag-Szlichtyng et al., 2014; Al Sharif et al., 2016). The
conceptual scheme summarising this approach is shown in Figure 7.6 (Mostrag-Szlichtyng et
al., 2014).
Figure 7.6 Conceptual scheme demonstrating the process of “knowledge discovery from data” (KDD) applied to liver steatosis. The possible associations between phenotypic effects, structural features and molecular mechanisms were identified through in vivo data and existing knowledge mining, combined with molecular modelling
The AOP leading to the liver steatosis was recently proposed (Al Sharif et al., 2014; Al
Sharif et al., 2016), and the Peroxisome Proliferator-Activated Receptor gamma (PPAR𝛾) has
been suggested as one of the receptors involved in the MIE. PPAR𝛾 is responsible for the
regulation of adipogenesis (adipocyte proliferation and differentiation), lipid and glucose
homeostasis, inflammatory responses, vascular functions and placental development. The
MoA/AOP proposed by Al Sharif and co-workers, leading from tissue-specific ligand-
dependent PPAR𝛾 dysregulation to liver steatosis, is shown in Figure 7.7. Within this AOP
the MIE induces up-regulation of target genes for lipid transport/binding proteins, fatty acid
and triglyceride synthesizing enzymes, and lipid droplet-associated proteins (LD proteins).

Chapter 7
131
This AOP covers the entire cascade of key molecular events and the subsequent cytological
and histopathological manifestations of liver steatosis, namely increased number or size of
lipid droplets, deposition of triglycerides in hepatic tissue (instead of in adipose one) and
hepatomegaly (Al Sharif et al., 2014; Al Sharif et al., 2016).
Figure 7.7 Proposed MoA/AOP from tissue-specific ligand-dependent PPAR𝛾 dysregulation to liver steatosis (from Al Sharif et al., 2014)
A pharmacophore model for full PPARγ agonists (Figure 7.8), indicating that
hydrogen bonding and hydrophobic and aromatic structural elements are the most
significant aspects, has also been proposed recently, as a result of a molecular modelling
procedure (Al Sharif et al., 2016).
The structural analysis revealed that the set of chemicals identified contained
potential PPARγ agonists, i.e. compounds with rigid hydrophobic structural fragments and
flexible aliphatic chains (refer to Table 7.3). In order to verify the hypothesis arising from the
in vivo toxicity data mining/structural analysis, the virtual screening procedure developed by
the COSMOS partners (Al Sharif et al., 2016) was applied to the set of 59 compounds with
liver steatosis-associated phenotypic effects (Mostrag-Szlichtyng et al., 2014; Al Sharif et al.,
2016). This procedure involved docking query structures in the binding pocket of PPARγ. As
a result, CMS-26998 (1,3-bis-(2,4-diaminophenoxy)propane; Compound #27 from Table 7.2)
was identified as a partial PPARγ agonist and CMS-1178 (piperonyl butoxide; Compound #7
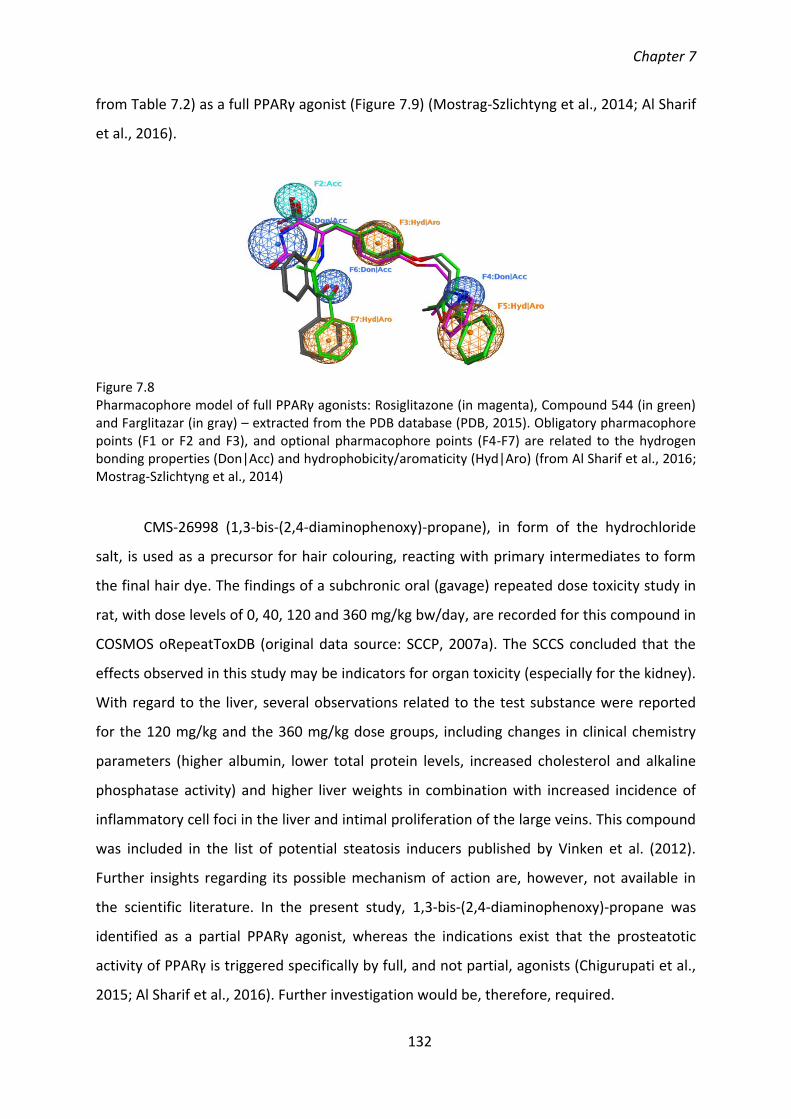
Chapter 7
132
from Table 7.2) as a full PPARγ agonist (Figure 7.9) (Mostrag-Szlichtyng et al., 2014; Al Sharif
et al., 2016).
Figure 7.8 Pharmacophore model of full PPARγ agonists: Rosiglitazone (in magenta), Compound 544 (in green) and Farglitazar (in gray) – extracted from the PDB database (PDB, 2015). Obligatory pharmacophore points (F1 or F2 and F3), and optional pharmacophore points (F4-F7) are related to the hydrogen bonding properties (Don|Acc) and hydrophobicity/aromaticity (Hyd|Aro) (from Al Sharif et al., 2016; Mostrag-Szlichtyng et al., 2014)
CMS-26998 (1,3-bis-(2,4-diaminophenoxy)-propane), in form of the hydrochloride
salt, is used as a precursor for hair colouring, reacting with primary intermediates to form
the final hair dye. The findings of a subchronic oral (gavage) repeated dose toxicity study in
rat, with dose levels of 0, 40, 120 and 360 mg/kg bw/day, are recorded for this compound in
COSMOS oRepeatToxDB (original data source: SCCP, 2007a). The SCCS concluded that the
effects observed in this study may be indicators for organ toxicity (especially for the kidney).
With regard to the liver, several observations related to the test substance were reported
for the 120 mg/kg and the 360 mg/kg dose groups, including changes in clinical chemistry
parameters (higher albumin, lower total protein levels, increased cholesterol and alkaline
phosphatase activity) and higher liver weights in combination with increased incidence of
inflammatory cell foci in the liver and intimal proliferation of the large veins. This compound
was included in the list of potential steatosis inducers published by Vinken et al. (2012).
Further insights regarding its possible mechanism of action are, however, not available in
the scientific literature. In the present study, 1,3-bis-(2,4-diaminophenoxy)-propane was
identified as a partial PPARγ agonist, whereas the indications exist that the prosteatotic
activity of PPARγ is triggered specifically by full, and not partial, agonists (Chigurupati et al.,
2015; Al Sharif et al., 2016). Further investigation would be, therefore, required.

Chapter 7
133
Figure 7.9 The structures, mapping onto the pharmacophore and ToxPrint chemotypes of two compounds identified in the virtual screening procedure involving docking the structures in the binding pocket of PPARγ (Mostrag-Szlichtyng et al., 2014):
(A) Partial PPARγ agonist: CMS-26998 (1,3-bis-(2,4-diaminophenoxy)propane) with two obligatory pharmacophore points: F1 (Don/Acc) and F3 (Hyd/Aro) and one additional pharmacophore point: F6 (Don/Acc);
(B) Full PPARγ agonist: CMS-1178 (piperonyl butoxide) with two obligatory pharmacophore points: F1 (Don/Acc) and F3 (Hyd/Aro) and two additional points: F4 (Don/Acc) and F5 (Hyd/Aro)
CMS-1178 (piperonyl butoxide, PBO) is an insecticide synergist co-applied with
pyrethrins and pyrethroids-like pesticides. It is used as an ingredient in anti-lice shampoos
and is also classified as a skin protectant according to EU COSING use functions. The toxicity
of PBO has been investigated in animal studies and liver was identified as the main target
organ. Two studies for this compound are available in oRepeatToxDB: a 1-year oral (feed)
study in dog (dose levels tested up to 53 mg/kg for males and 71 mg/kg for females), in
which mild changes including liver steatosis and enlargement (hepatocyte hypertrophy)
were observed, and a 90-day oral (feed) study in mouse (high dose levels tested of 10, 30,
100, 300, 1000 mg/kg bw/day), in which more severe effects, including necrosis and liver
cancer, were recorded. The available toxicity studies indicated that severity and type of
hepatotoxic effects depend on the duration of exposure to PBO and/or on the dose levels
tested.

Chapter 7
134
PBO was predicted to be a PPARγ full agonist by the molecular modelling analysis
and PPARγ activation by PBO binding has been suggested as a possible MIE leading to the
liver steatosis upon short-term (low dosage) exposure (observed in the dog study). This has
been attributed specifically to the structural characteristics of the glycol side chain of PBO.
Noteworthy in our research regarding the hepatocarcinogenic effect of PBO
observed in rodents (the mode of action of which remains unclear), was the suggestion that
the mechanism is based on the potential of PBO to generate reactive oxygen species via
metabolic pathways (opening of the methylenedioxy ring) and to induce oxidative stress,
including oxidative DNA damage (Vitcheva et al., 2015).
The integrated application of ontology-based in vivo toxicity data mining and
structural analysis enabled the identification of the set of chemicals associated with liver
steatosis, steatohepatitis, and fibrosis phenotypic effects and containing specific ToxPrint
chemotypes. The molecular modelling provided insights into possible modes of toxic action,
creating the basis for further investigations.
7.5. Discussion
The importance of, and the need for, mature chemical-toxicological ontologies (still
lacking in the current databases) were demonstrated throughout the present thesis (chapter
1.3, 6 and present chapter). This chapter describes the novel ontology developed for liver
toxicity, including 53 unique “site-effect” pairs linking the phenotypic effects observed at
the whole organism level with pathological changes occurring at lower levels (organs,
tissues, cells).
The ontology developed was applied for mechanistic in vivo data mining, which
demonstrated its utility for identifying the chemical compounds associated with liver
steatosis, steatohepatitis, and fibrosis phenotypic effects; 13 relevant combinations of
“tissue-cell” sites and effects from the ontology led to the determination of 59
hepatotoxicants. Their structural characteristics were investigated and the features
associated with liver toxicity were found.
The mechanistic reasoning was discussed for two identified compounds, 1,3-bis-(2,4-
diaminophenoxy)propane and piperonyl butoxide, and the activation of Peroxisome

Chapter 7
135
Proliferator-Activated Receptor gamma (PPAR𝛾) was suggested as a mechanism involved in
the MIE. The studies on the hepatocarcinogenic effect of PBO observed in rodents (the
mode of action of which remains unclear), suggested the mechanism based on the potential
of PBO to generate reactive oxygen species via metabolic pathways (opening of the
methylenedioxy ring) and to induce oxidative stress, including oxidative DNA damage.
It is envisaged that the knowledge developed in this analysis will be further
elaborated and will contribute to the development of structural alerts for liver
steatosis/steatohepatitis/fibrosis. In the present research it was demonstrated that:
Grouping of chemicals according to the precisely described phenotypic effects and
structural analysis can be applied successfully to the discovery of associated chemotypes;
Interactive application of molecular modelling methods can be used to support the
outcome of ontology-based data mining and to provide insights into possible underlying
molecular mechanisms;
Combined approaches of the phenotype classification and molecular mechanisms
investigation can successfully facilitate the process of MoA/AOP development.

Chapter 8
136
Chapter 8
Discussion
8.1. Summary of work with respect to the objectives
As outlined in chapter 1, the three essential building blocks of the COSMOS database
include: the Cosmetics Inventory, Skin Permeability Database and oRepeatToxDB (oral
repeated dose toxicity database). In this thesis, undertaken in collaboration with COSMOS
partners, the entire process of knowledge development has been conducted within each of
these data domains. It covered:
Harvesting, curating and integrating the data into a new relational chemical-
toxicological database;
Realising the scientific objectives formulated through data selection, exploration and
pattern recognition;
Evaluating and presenting the knowledge developed.
Each part of the work described has resulted in measurable outcomes and
knowledge (the curated content of the database, Standard Operating Procedures, skin
permeability potential classification rules, validated liver toxicity ontology, structural
features associated with liver steatosis), supporting the development of computational
methods for toxicity prediction and creating a solid foundation for further improvements in
this area. The achievements of the realised PhD program are particularly significant in light
of the current 21st Century Toxicology approaches (NRC, 2007) and the principles of the
“3Rs” (Replacement, Reduction and Refinement) in toxicology (Russell & Burch, 1959),
aiming to reduce the use of animals in toxicity testing.
8.1.1. COSMOS Cosmetics Inventory
Chapter 2 describes the current demand for a publicly available chemical inventory
containing accurately identified cosmetics ingredients and related compounds and
populated with good quality chemical structures. The need for a strategy addressing
concerns over the quality of chemical information and structures was also highlighted. In
order to satisfy these requirements, the collation of the COSMOS database and COSMOS

Chapter 8
137
Cosmetics Inventory was associated with the establishment of a consistent procedure for
chemical records’ curation and quality control. It resulted in the development of novel
controlled vocabularies for the compounds and structure annotation (stereochemistry,
double bond geometry, material type and composition type) and the SOP document (Annex
2) describing the systematic QC approach (as applied during the collation of the COSMOS
database content). The procedure designed with respect to the characteristic features of
cosmetics-related compounds provided the standardised terminology to organise the
complex relationships within this domain and the framework to deal with a range of non-
structurable substances. The annotation schemes were constructed to enable convenient
identification of chemicals not handled well by cheminformatics methods (inorganics,
compounds containing metal or metalloid atoms, botanicals, biological macromolecules,
polymers, and mixtures), thus facilitating the compilation of computational datasets and
enhancing the development of in silico predictive toxicology tools. The precisely identified
compounds allowed accurate referencing of the associated biological data.
The resulting publicly available (at: https://cosmosdb.eu/cosmosdb.v2) COSMOS
database (81,406 chemical records) includes the largest (by far), quality-controlled inventory
of cosmetics-related compounds (COSMOS Cosmetics Inventory with 17,100 records), which
was necessary for conducting the novel analysis described in the chapter 3 of the present
thesis, as well as for realising the objectives of chapters 4-7.
The chemical space of the collated Cosmetics Inventory was analysed and compared
with the chemical space occupied by food-related compounds from the U.S. FDA CFSAN
PAFA database (chapter 3). The novel approach, combining the ToxPrint chemotypes
structural features and physicochemical properties analysis was successfully applied to
identify the structural classes better represented by cosmetics- and food- related
compounds, and demonstrated their relation to the physicochemical properties and specific
use functions within the cosmetics domain. For instance, COSMOS Cosmetics Inventory was
richer in polyethylene glycols, quaternary ammonium salts, organosilicons and
diethanolamines (characteristic for surfactants, emollients and humectants), and aromatic
amines, nitro- and azo- aromatic groups, specific for cosmetics colorants and hair dyes. The
physicochemical properties specific for particular cosmetic use categories included “global
molecular” and “size and shape” descriptors. The structural classes more abundant among

Chapter 8
138
PAFA food-related compounds included sufides, disulfides, sulfhydrides, thio- carboxylic
esters, thiophenes, furans and pyrazines (flavouring agents and food direct additives), and
phosphites, phosphine oxides, acyl and alkyl halides, isocyanates and acid anhydrides (food
contact materials). In terms of physicochemical properties space, the cosmetics- and food-
related compounds occupied a very broad region of similar shape. It indicated that
physicochemical properties utilised alone do not have sufficient power to discriminate
between large inventories of cosmetics- and food- related compounds, and that structural
features analysis is necessary to identify the differences between them. The analysis
conducted may support further computational modelling efforts within the cosmetics
domain. Large differences in structural and physicochemical features exhibited by different
use categories of cosmetics indicated that, most probably, they should be investigated
independently with different models and/or computational approaches.
The work summarised here achieved the aims of objective 1 (“The quality control of
the COSMOS database chemical domain, with particular emphasis on cosmetics and related
compounds”) and objective 2 (“Characterising the chemical space occupied by cosmetics
and related chemicals”) of this PhD program.
8.1.2. COSMOS Skin Permeability Database
The new COSMOS Skin Permeability Database (chapter 4) was developed in order to
address the need for a database containing high quality skin permeability/absorption data
for cosmetics and related compounds. The existing data sources (EDETOX and Kent
databases) were consolidated with newly data harvested from regulatory documents and
scientific literature according to the specifically developed, and deliberately rigorous,
procedure. This procedure was documented in an SOP (Annex 4) and can support skin
permeability/absorption data harvesting efforts in the future.
The final COSMOS Skin Permeability Database provides in vivo and in vitro skin data
for over 230 cosmetics-related compounds (484 chemical compounds in total), covering a
range of use functions and chemical classes. The quality-controlled content of this database,
along with its unique data structure, enables efficient data mining and supports
computational modelling activities. This database served as a foundation for the research
described in chapter 5. Compiling the set of compounds with available human in vitro JMAX

Chapter 8
139
data was followed by the exploration of their structural features (ToxPrint chemotypes) and
molecular properties (global, size and shape). This analysis led to the determination of
profiles characteristic of compounds exhibiting low and high skin permeability potential. The
obtained results may be applied for rapid screening and classification of compounds without
experimental data.
The work summarised here achieved the aims of objective 3 (“The development of a
high quality COSMOS Skin Permeability Database enriched in cosmetics and related
compounds”) and objective 4 (“Classification of skin permeability potential following dermal
exposure to chemicals to support the safety assessment of cosmetics related chemicals”) of
this PhD program.
8.1.3. COSMOS oRepeatToxDB
The new COSMOS oRepeatToxDB (chapter 6) was compiled after enriching
(integrated) existing data sources (including the U.S. EPA DSSTox and FDA CFSAN PAFA) with
newly data harvested for cosmetics from regulatory documents and scientific literature. The
data harvesting process, conducted with respect to the established MINImum Study
inclusion criteria (COSMOS MINIS) and combined with a consistent strategy of data curation
and quality control, minimised concerns over the data accuracy.
The final COSMOS oRepeatToxDB consists of 340 toxicity studies for 228 chemical
compounds (186 cosmetics-related compounds, including 100 hair dyes and 42 impurities)
and can be considered a milestone in terms of fulfilling the database-related needs of the
21st Century (predictive) Toxicology. Its unique data model enables the recording of the full
level of details on toxicity studies: the toxicological effects occurring at particular dose levels
and at specific, hierarchically represented sites (differentiated as organs, tissues, cells),
NO(A)EL and LO(A)EL values with associated critical effects and target sites, the study design
details (species, sex, routes of exposure, dose group levels, number of animals, control
group information) and references. The effects were recorded with the sets of controlled
vocabulary and qualified by time of findings, severity, statistical significance and treatment-
relatedness. The rigorous curation of the COSMOS database chemistry content (chapter 2)
ensured accurate identification of tested compounds.

Chapter 8
140
The COSMOS oRepeatToxDB is a major improvement in the landscape of the
currently available public databases, with multiple potential applications in safety/risk
assessment, computational models development, and read-across. It was essential for
conducting the research described in chapter 7.
The unique and novel design of the COSMOS oRepeatToxDB enabled the
development of liver toxicity ontology (chapter 7), which was subsequently applied for
mechanistic in vivo data mining, leading to the identification of compounds associated with
liver steatosis, steatohepatitis and fibrosis phenotypic effects. The novel ToxPrint
chemotype-based analysis of these hepatotoxicants led to the identification of associated
structural classes. The probable mechanistic reasoning for toxicity was formulated for two
compounds, namely 1,3-bis-(2,4-diaminophenoxy)-propane and piperonyl butoxide, that
were (respectively) identified as being partial and full agonists of Peroxisome Proliferator-
Activated Receptor gamma (PPAR𝛾) in an interactively applied molecular modelling
procedure. It was demonstrated that combined approaches of the phenotype- and
structure-based classification and molecular mechanisms investigation can facilitate the
process of Mode-of-Action/Adverse Outcome Pathway development.
The work summarised here achieved the aims of objective 5 (“Construction of a high
quality database for oral repeated dose toxicity with dose/concentration level information
for cosmetics and related compounds”) and objective 6 (“Mechanistic (ontology-based) liver
toxicity data mining of the COSMOS oRepeatToxDB on the basis of the ontology developed
from the collated data”) of this PhD program.
8.2. Final conclusions and perspectives
Realising the particular objectives within the present thesis contributed to the
development of the content-related part of the COSMOS database: Cosmos Cosmetics
Inventory (chapter 2), Skin Permeability Database (chapter 4) and oRepeatToxDB (chapter
6), comprising the largest quality-controlled, publicly available
(https://cosmosdb.eu/cosmosdb.v2/) resource with chemical information and data for
cosmetics ingredients and related compounds. The COSMOS database, delivered as a final
outcome of the collaboration of consortium partners, is fundamental for the development
of alternative (non-testing) methods for predicting repeated dose toxicity of cosmetics-
Chapter 8
141
related compounds. It meets the database-related requirements necessary for reaching the
goals of modern predictive toxicology (common with the goals of the 21st Century
Toxicology), as it has a relational design, stores high quality, curated chemical structures and
toxicity information (which can be searched and retrieved), is equipped with controlled
vocabularies and ontologies, and through utilising open-source technology, addresses the
lack of cosmetics-related chemical information and biological data in the public domain.
The particular data domains, constructed within this PhD program as a part of the
COSMOS database, were used to develop knowledge that can be elaborated to facilitate the
further development of in silico tools for risk/safety assessment of cosmetics related
compounds:
The chemical space analysis of the Cosmetics Inventory (chapter 3) provides insights
into the features of cosmetics substances, delivering valuable information that can be
utilised for the development of computational models within this domain. This knowledge
can be used, for example, to select the descriptors appropriate for model building or for
distinguishing structural classes that should be modelled individually;
The rules formulated for the classification of compounds into low and high skin
permeability potential (chapter 5) can support the estimation of bioavailability of
chemicals after topical exposure (and, thus, their potential ability to exert systemic
toxicity). This crucial knowledge for the risk and safety assessment of cosmetics related
compounds can be further implemented into software applications, which can support
rapid screening of compounds without experimental data and further modelling of their
dermal permeability potential;
The COSMOS oRepeatToxDB (chapter 6) by itself can serve as an excellent predictive
toxicology tool for further knowledge development, as it provides toxicity effect data for
“organ-tissue-cell” levels associated with the LO(A)EL values and links this information with
accurately identified chemical compounds. It can be used for mechanistic data mining and
development of ontologies for other (than liver) target organs. In the COSMOS project it
served as a foundation for the compilation of the new non-cancer Threshold of
Toxicological Concern (TTC) database, addressing the repeated-dose toxicity of cosmetics-
related chemicals;

Chapter 8
142
The formulated knowledge on structural characteristics of compounds associated
with liver steatosis, steatohepatitis and fibrosis, and on their potential modes-of-action
(chapter 7), can be elaborated further and used for the development of the liver toxicity
knowledgebase (including the rules and chemotype alerts).
The current PhD project is particularly significant in the light of the current European
Union legislation, i.e. the banning of animal testing for cosmetics purposes, as it contributes
to providing the necessary alternative (non-animal) tools for the risk and safety assessment
associated with the repeated dose exposure to cosmetic ingredients.
Noteworthy, as of March 2016, the COSMOS DataShare Point, a web-based system
for exchanging safety evaluation and toxicity data, has been launched (https://www.mn-
am.com/projects/cosmosdatasharepoint). The COSMOS database will continue to be
developed, maintained and made available to the public, creating a resource for
toxicological data collection and a means to share data with the scientific community.
In conclusion, the main aim of the present PhD program, namely “the collation of the
content within relational chemical-toxicological database and its subsequent application for
development of knowledge to support the prediction of repeated dose toxicity of cosmetics
and related compounds” has been fully achieved.

References
143
References
Abdel-Misih SR, Bloomston M. 2010. Liver anatomy. Surg Clin North Am 90(4): 643-53.
Abraham MH, Chada HS, Martins F, Mitchell RC, Bradbury MW, Gratton JA. 1999. Hydrogen bonding part 46: a
review of the correlation and prediction of transport properties by an LFER method: physicochemical
properties, brain penetration and skin permeability. Pestic Sci 55: 78-88.
Abraham MH, Martins F. 2004. Human skin permeation and partition: general linear free-energy relationship
analyses. J Pharm Sci 93: 1508-1523.
Akomeah FK, Martin GP, Brown MB. 2007. Variability in Human Skin Permeability In Vitro: Comparing
Penetrants with Different Physicochemical Properties. J Pharm Sci 96(4): 824-834.
Al Sharif M, Alov P, Vitcheva V, Pajeva I, Tsakovska I. 2014. Modes-of-Action Related to Repeated Dose
Toxicity: Tissue-Specific Biological Roles of PPAR𝛾 Ligand-Dependent Dysregulation in Nonalcoholic Fatty Liver
Disease. PPAR Research 2014, Article ID 432647, 13 pages.
Al Sharif M, Tsakovska I, Pajeva I, Alov P, Fioravanzo E, Bassan A, Kovarich S, Yang C, Mostrag-Szlichtyng A,
Vitcheva V, Worth AP, Richarz AN, Cronin MT . The application of molecular modelling in the safety assessment
of chemicals: A case study on ligand-dependent PPARγ dysregulation. Toxicology 2016, Feb 4, doi:
10.1016/j.tox.2016.01.009. [Epub ahead of print]
Ankley GT, Bennett RS, Erickson RJ, Hoff DJ, Hornung MW, Johnson RD, Mount DR, Nichols JW, Russom CL,
Schmieder PK, Serrrano JA, Tietge JE, Villeneuve DL. 2010. Adverse outcome pathways: a conceptual
framework to support ecotoxicology research and risk assessment. Environ Toxicol Chem 29(3): 730-41.
Baert B, Deconinck E, Van Gele M, Slodicka M, Stoppie P, Bodé S, Slegers G, Vander Heyden Y, Lambert J,
Beetens J, De Spiegeleer B. 2007. Transdermal penetration behaviour of drugs: CART-clustering, QSPR and
selection of model compounds. Bioorg Med Chem 15(22): 6943-55.
Bailey JE (Ed). Compilation of Ingredients Used in Cosmetics in the United States, 1st Edition. The Personal Care
Products Council, Washington DC. 20036-4702.
Bataller R, Brenner DA. 2005. Liver fibrosis. J Clin Invest 115(2): 209-218.
Begam BF, Kumar JS. 2014. Visualization of Chemical Space Using Principal Component Analysis. World Applied
Sciences Journal 29 (Data Mining and Soft Computing Techniques): 53-59.
Benech-Keiffer F, Wegrich P, Scwarzenbach R, Klecak G, Weber T, Leclaire J, Schaefer H. 2000. Percutaneous
absorption of sunscreens in vitro: Interspecies comparison, skin models and reproducibility aspects. Skin
Pharmacology and Physiology 13: 324-335.
Benigni R, Zito R. 2004. The second National Toxicology Program comparative exercise on the prediction of
rodent carcinogenicity: definitive results. Mutation Research 566(1): 49-63.
Bensouilah J, Buck P. 2006. Aromadermatology: aromatherapy in the treatment and care of common skin
conditions. Radcliffe Publishing.
Benz RD, Irausquin H. 1991. Priority-based assessment of food additives database of the U.S. Food and Drug
Administration Center for Food Safety and Applied Nutrition. Environmental Health Perspectives 96: 85-89.
Benz RD. 2007. Toxicological and clinical computational analysis and the US FDA/CDER. Expert Opinion in Drug
Metabolism & Toxicology 3, 109-124.
References
144
Bowen R. 2003. Pathophysiology of the Digestive System. Colorado State University. Available at: http:
//www.vivo.colostate.edu/hbooks/pathphys/digestion/index.html. [Accessed in February, 2017]
Bouwman T, Cronin MT, Bessems JG, van de Sandt JJ. 2008. Improving the applicability of (Q)SARs for
percutaneous penetration in regulatory risk assessment. Hum Exp Toxicol 27: 269.
Brain KR, Walters KA, James VJ. 1995. Percutaneous penetration of dimethylnitrosamine through human skin
in vitro: Application from cosmetic vehicles. Food Chem Toxicol 33: 315-322.
Brain KR, Walters KA, Green DM. 2005. Percutaneous penetration of diethanolamine through human skin in
vitro: Application from cosmetic vehicles. Food Chem Toxicol 43: 681-690.
Bramer MA. 2007. Principles of data mining. Springer-Verlag, London. ISBN-13: 978-1-84628-765-7.
Brecher J. 1999. Name=Structure: A Practical Approach to the Sorry State of Real-Life Chemical Nomenclature.
Journal of Chemical Information and Modeling 39: 943-950.
Brown MB, Lau CH, Lim ST, Sun Y, Davey N, Moss GP, Yoo SH, De Muynck C. 2012. An evaluation of the
potential of linear and nonlinear skin permeation models for the prediction of experimentally measured
percutaneous drug absorption. J Pharm Pharmacol 64: 566.
Bunge AL, Cleek RL. 1995. A new method for estimating dermal absorption from chemical exposure: 2. Effect
of molecular weight and octanol-water partitioning. Pharm Res. 12(1): 88-95.
Burger J, Gowen A. 2011. Data handling in hyperspectral image analysis. Chemometrics and Intelligent
Laboratory Systems 108: 13-22.
CAS, 2016. Available at: https: //www.cas.org/content/chemical-substances. [Accessed in February, 2017]
Cattell RB. 1943. The description of personality: basic traits resolved into clusters. The Journal of Abnormal and
Social Psychology 38(4): 476-506.
ChemoTyper. Altamira LLC, Columbus, OH, USA, Molecular Networks GmbH, Nüremberg, Germany. Available
at: www.chemotyper.org. [Accessed in February, 2017]
Chen PP. 2002. Entity-Relationship Modeling: Historical Events, Future Trends, and Lessons Learned. In:
Software pioneers. Springer-Verlag, pp. 296-310. ISBN 3-540-43081-4.
Chigurupati S, Dhanaraj SA, Balakumar P. 2015. A step ahead of PPARγ full agonists to PPARγ partial agonists:
therapeutic perspectives in the management of diabetic insulin resistance. Eur J Pharmacol 755: 50-57.
Chilcott RP, Barai N, Beezer AE, Brain SL, Brown MB, Bunge AL, Burgess SE, Cross S, Dalton CH, Dias M, Farinha
A, Finnin BC, Gallagher SJ, Green DM, Gunt H, Gwyther RL, Heard CM, Jarvis CA, Kamiyama F, Kasting GB, Ley
EE, Lim ST, McNaughton GS, Morris A, Nazemi MH, Pellett MA, Du Plessis J, Quan YS, Raghavan SL, Roberts M,
Romonchuk W, Roper CS, Schenk D, Simonsen L, Simpson A, Traversa BD, Trottet L, Watkinson A, Wilkinson SC,
Williams FM, Yamamoto A, Hadgraft J. 2005. Inter- and intra-laboratory variation of in vitro diffusion cell
measurements: an international multicenter study using quasi-standardised methods and materials. J Pharm
Sci 94: 632-638.
CIRS, 2016. Available at: http: //www.cirs-
reach.com/Cosmetic_Inventory/International_Nomenclature_of_Cosmetic_Ingredients_INCI.html. [Accessed
in February, 2017]
Cleek RL, Bunge AL. 1993. A new method for estimating dermal absorption from chemical exposure. 1 General
approach. Pharm Res 10(4): 497-506.
CMLC, 2016. Available at: http: //www.xml-cml.org/. [Accessed in February, 2017]
Codd E. 1970. A relational model for large shared data banks. Communications of the ACM 13: 377-87.

References
145
Cordella CBY. 2012. PCA: The Basic Building Block of Chemometrics. In: Krull IS (Ed). Analytical Chemistry,
InTeCh. ISBN 978-953-51-0837-5.
Corina Symphony. Molecular Networks GmbH, Nüremberg, Germany. .
COSING, 2016. The European Commission COSING Database. Available at: http:
//ec.europa.eu/growth/sectors/cosmetics/cosing/index_en.htm. [Accessed in February, 2017]
Crank J. 1975. The Mathematics of Diffusion (Second Edition), Claredon Press, ISBN 0-19-853344-6, England.
Cronin MTD, Dearden JC, Moss GP, Murray-Dickson G. 1999. Investigation of the mechanism of flux across
human skin in vitro by quantitative structure–permeability relationships. European Journal of Pharmaceutical
Sciences 7: 325-330.
Cua AB, Wilhelm KP, Maibach HI. 1995. Skin surface lipid and skin friction: Relation to age, sex and anatomical
region. Skin Pharmacol 8: 246-251.
Dancik Y, Miller MA, Jaworska J, Kasting GB. 2012. Design and performance of a spreadsheet-based model for
estimating bioavailability of chemicals from dermal exposure. Adv Drug Deliv Rev 65: 221.
Degim IT. 2006. New tools and approaches for predicting skin permeability. Drug Discov Today 11: 517.
EC, 2003. Directive 2003/15/EC of the European Parliament and of the Council (Cosmetics Directive 7th
Amendment. Official Journal of the European Union.
EC, 2006. Commission Decision of 9 February 2006 amending Decision 96/335/EC establishing an inventory
and a common nomenclature of ingredients employed in cosmetic products. .
EC, 2008. Council Regulation (EC. No 440/2008 of 30 May 2008 laying down test methods pursuant to
Regulation (EC. No 1907/2006 of the European Parliament and of the Council on the Registration, Evaluation,
Authorisation and Restriction of Chemicals (REACH). Official Journal of the European Union, L 142/1.
EC, 2009. Regulation (EC. No 1223/2009 Of The European Parliament And Of The Council of 30 November 2009
on cosmetic products.
ECHA, 2008. Guidance on Information Requirements and Chemical Safety Assessment. Chapter R6, European
Chemicals Agency, Helsinki, 2008.
ECHA, 2010. ECHA, Practical guide 6. How to report categories and read-across, European Chemicals Agency,
Helsinki, 2010.
EFSA, 2012. EFSA Panel on Plant Protection Products and their Residues. 2012. Guidance on Dermal
Absorption. EFSA Journal 10(4): 2665.
Elias PM, Cooper ER, Korc A, Brown BE. 1981. Percutaneous transport in relation to stratum corneum structure
and lipid composition. J Invest Dermatol 76: 297-301.
EMA, 2010. European Medicines Agency. 2010. Committee for Human Medicinal Products (CHMP). Guideline
on repeated dose toxicity. CPMP/SWP/1042/99 Rev 1 Corr.
EPA DSSTox, 2016. Available at: https: //www.epa.gov/chemical-research/distributed-structure-searchable-
toxicity-dsstox-database. [Accessed in February, 2017]
EPA ToxCast, 2016. Available at: https: //www.epa.gov/chemical-research/toxicity-forecasting. [Accessed in
February, 2017]
EPA, 1998a. United States Environmental Protection Agency. 1998. Health Effects Test Guidelines. OPPTS
870.3100, 90-Day Oral Toxicity in Rodents. EPA Pub No. 712-C-98-199.
EPA, 1998b. United States Environmental Protection Agency. 1998. Health Effects Test Guidelines. OPPTS
870.3150, 90-Day Oral Toxicity in Nonrodents. EPA Pub No. 712-C-98-200.

References
146
EPA, 1998c. United States Environmental Protection Agency. 1998. Health Effects Test Guidelines. OPPTS
870.4100, Chronic Toxicity. EPA Pub No. 712-C-98-210.
EPA, 1998d. United States Environmental Protection Agency. 1998. Health Effects Test Guidelines. OPPTS
870.3700, Prenatal Developmental Toxicity Study. EPA Pub No. 712-C-98-207.
EPA, 1998e. United States Environmental Protection Agency. 1998. Health Effects Test Guidelines. OPPTS
870.6200, Neurotoxicity Screening Battery. EPA Pub No. 712-C-98-238.
EPA, 2000. United States Environmental Protection Agency. 2000. Health Effects Test Guidelines. OPPTS
870.3050, Repeated Dose 28-Day Oral Toxicity Study in Rodents. EPA Pub No. 712-C-00-366.
EPA, 2016a. Chemical Substances of Unknown or Variable Composition, Complex Reaction Products and
Biological Materials (UVCB Substance. on the Toxic Substances Control Act (TSCA. Chemical Substance
Inventory. Available at: https: //www.epa.gov/tsca-inventory/chemical-substances-unknown-or-variable-
composition-complex-reaction-products-and [Accessed in February, 2017]
EPA, 2016b. Risk Assessment for Noncancer Effects. Available at: https: //www.epa.gov/fera/risk-assessment-
noncancer-effects. [Accessed in February, 2017]
EURL ECVAM, 2016. Available at: https: //eurl-ecvam.jrc.ec.europa.eu/validation-regulatory-
acceptance/systemic-toxicity/repeated-dose-toxicity. [Accessed in February, 2017]
Fara DC, Oprea TI. 2016. Cheminformatics - Basics: Molecular Descriptors and Fingerprints. Available at: http:
//pasilla.health.unm.edu/biomed505/Course/Cheminformatics/basic/descs_fingers/molec_descs_fingerprints.
htm. [Accessed in February, 2017]
Farahmand S, Maibach HI. 2009. Estimating skin permeability from physicochemical characteristics of drugs: A
comparison between conventional models and an in vivo-based approach. Int J Pharm 375: 41.
FDA, 2007. U.S. Department of Health and Human Services, Food and Drug Administration, Center for Food
Safety and Applied Nutrition. 2007 Guidance for Industry and Other Stakeholders Toxicological Principles for
the Safety Assessment of Food Ingredients. Redbook 2000, July 2000, Revised July 2007.
Flynn GL. 1990. Physicochemical determinants of skin absorption. In: Gerrity TR & Henry CJ (Eds). Principles of
route-to-route extrapolation for risk assessment. New York, Elsevier.
Fourches D, Muratov E, Tropsha A. 2010. Trust, but verify: On the importance of chemical structure curation in
cheminformatics and QSAR modeling research. Journal of Chemical Information and Modeling 50(7): 1189-
1204.
Geinoz S, Guy RH, Testa B, Carrupt PA. 2004. Quantitative Structure-Permeation Relationships (QSPeRs) to
Predict Skin Permeation: A Critical Evaluation. Pharm Res 21: 83.
Greene N. 2002. Computer systems for the prediction of toxicity: an update. Adv Drug Deliv Rev 54: 417-431.
Han J, Kamber M, Pei J (Eds). 2012. Data Mining (Third Edition). Elsevier. ISBN: 978-0-12-381479-1.
Hardy B, Apic G, Carthew P, Clark D, Cook D, Dix I, Escher S, Hastings J, Heard DJ, Jeliazkova N, Judson P, Matis-
Mitchell S, Mitic D, Myatt G, Shah I, Spjuth O, Tcheremenskaia O, Toldo L, Watson D, White A, Yang C. 2012.
Food for thought. A toxicology ontology roadmap. ALTEX 29(2): 129-37.
Heller S, McNaught A, Stein S, Tchekhovskoi D, Pletnev I. 2013. InChI - the worldwide chemical structure
identifier standard. Journal of Cheminformatics 5(1): 7.
Helma C, Cramer T, Kramer S, De Raedt L. 2004. Data Mining and Machine Learning Techniques for the
Identification of Mutagenicity Inducing Substructures and Structure Activity Relationships of Noncongeneric
Compounds. J Chem Inf Comput Sci 44: 1402-1411.
References
147
Howes D, Guy RH, Hadgraft J, Heylings J, Hoeck U, Kemper F, Maibach H, Marty JP, Merk H, Parra J, Rekkas D,
Rondelli I, Schaefer H, Tauber U, Verbiese N. 1996. Methods for assessing percutaneous absorption, report and
recommendations of ECVAM workshop 13. ATLA 24: 81-106.
IUPAC, 2016. Available at: http: //goldbook.iupac.org/S05983.html. [Accessed in February, 2017]
Jepps OG, Dancik Y, Anissimov YG, Roberts MS. Modeling the human skin barrier--towards a better
understanding of dermal absorption. Adv Drug Deliv Rev. 2013 65(2): 152-68.
JMP, SAS Institute Inc., 2015 (JMP Pro 12.2.0). .
Johnson AM, Maggiora GM. 1990. Concepts and Applications of Molecular Similarity. New York: John Willey &
Sons.
Johnson DE, Blower PB, Myatt GJ, Wolfgang GHI. 2001. Chem-tox informatics: data mining using a medicinal
chemistry building block approach. Curr Opin Drug Discov Develop 4(1): 92-101.
Jolliffe IT. 2002. Principal Component Analysis, Second edition, Springer Series in Statistics. ISBN- 0-387-95442.
Kasting GB, Smith RL, Cooper ER. 1987. Effect of lipid solubility and molecular size on percutaneous absorption.
In: Shroot B, Schaefer H (Eds). Skin Pharmacokinetics, pp. 138-153.
Klimisch HJ, Andreae M, Tillmann U. 1997. A systematic approach for evaluating the quality of experimental
toxicological and ecotoxicological data. Regul Toxicol Pharmacol 25(1): 1.
Kohonen T. 1982. Self-organized formation of topologically correct feature maps. Biological Cybernetics 43: 59-
69.
Krishna M. 2013. Microscopic anatomy of the liver. Clinical Liver Disease 2(Supp/1): S4-S7.
Kroes R, Renwick AG, Feron V, Galli CL, Gibney M, Greim H, Guy RH, Lhuguenot JC., van de Sandt JJM. 2007.
Application of the threshold of toxicological concern (TTC) to the safety evaluation of cosmetic ingredients.
Food Chem Toxicol 45: 2533.
Kupczewska-Dobecka M, Jakubowski M, Czerczak S. 2010. Calculating the dermal flux of chemicals with OELs
based on their molecular structure: An attempt to assign the skin notation. Environmental Toxicology and
Pharmacology 30: 95-102.
Landesmann B. 2016. OECD Series on Adverse Outcome Pathways, No. 2, OECD Publishing, Paris. Available at:
http: //dx.doi.org/10.1787/5jlsvwl6g7r5-en. [Accessed in February, 2017]
Lautt. 2009. Hepatic Circulation: Physiology and Pathophysiology. San Rafael (CA): Morgan & Claypool Life
Sciences. Available at: https: //www.ncbi.nlm.nih.gov/books/NBK53073/. [Accessed in February, 2017]
Lian G, Chen L, Han L. 2008. An Evaluation of Mathematical Models for Predicting Skin Permeability. J Pharm
Sci 97: 584.
Lipinski CA, Lombardo F, Dominy BW, Feeney PJ. 1997. Experimental and Computational Approaches to
Estimate Solubility and Permeability in Drug Discovery and Development Settings. Adv Drug Delivery Rev 23: 3-
25.
Liu P, Nigthingale JAS, Kurihara-Bergstrom T. 1993. Variation of human skin permeation in vitro: Ionic vs.
neutral compounds. Int J Pharm 90: 171-176.
Madden JC (2013). Sources of chemical information, toxicity data and assessment of their quality. In: Cronin
MTD, Madden JC, Enoch SJ, and Roberts DW (Eds). Chemical Toxicity Prediction Category Formation and Read-
Across. Cambridge, UK, Royal Society of Chemistry.
Magnusson BM, Anissimov YG, Cross SE, Roberts MS. 2004a. Molecular size as the main determinant of solute
maximum flux across the skin. J Invest Dermatol 122(4): 993-9.

References
148
Magnusson BM, Pugh WJ, Roberts MS. 2004b. Simple rules defining the potential of compounds for
transdermal delivery or toxicity. Pharm Res. 1.60208333333333
Matthews EJ, Contrera JF. 1998. A New Highly Specific Method for Predicting the Carcinogenic Potential of
Pharmaceuticals in Rodents Using Enhanced MCASE QSAR-ES Software. Regul Toxicol Pharmacol 28: 242-264.
Mayer J, Cheeseman MA, Twaroski ML. 2008. Structure-activity relationship analysis tools: validation and
applicability in predicting carcinogens. Regulatory Toxicology & Pharmacology 50: 50-58.
MDL, 2005. MDL CTFile Formats. 2005.
Menon GK, Cleary GW, Lane ME. 2012. The structure and function of the stratum corneum. Int J Pharm 435(1):
3-9.
Michaels AS, Chandrasekaran SK, Shaw JE. 1975. Drug permeation through human skin: theory and in vitro
experimental measurement. AIChE J 21: 985-996.
Mitragotri S. 2003. Modeling skin permeability to hydrophilic and hydrophobic solutes based on four
permeation pathways. J Control Release 86: 69.
Mitragotri S. Anissimov YG, Bungec AL, Fraschd HF, Guy RH, Hadgraftf J, Kasting GB, Lane ME, Roberts MS.
2011 Mathematical models of skin permeability: An overview. Int J Pharm 418: 115.
Moss GP, Cronin MTD. 2002. Quantitative structure-permeability relationships for percutaneous absorption:
Re-analysis of steroid data. Int J Pharm 238: 105-9
Moss GP, Dearden JC, Patel H, Cronin MD. 2002. Quantitative structure-permeability relationships (QSPRs) for
percutaneous absorption. Toxicol In Vitro 16: 299.
Mostrag-Szlichtyng A, Zaldívar Comenges JM, Worth AP. 2010. Computational toxicology at the European
Commission's Joint Research Centre. Expert Opin Drug Metab Toxicol. 6(7): 785-92.
Mostrag-Szlichtyng A, Vitcheva V, Nelms MD, Aloiv P, Tsakovska I, Enoch SJ, Worth AP, Cronin MTD, Yang C
(2014. Data Mining Approach to Formulate Alerting Chemotypes for Liver Steatosis / Steatohepatitis / Fibrosis.
Abstract 2254. Poster Presentation at the Society of Toxicolgy (SOT. 53nd Annual Meeting and ToxExpo,
Phoenix, Arizona, USA, 24-27 March 2014.
Naegel A, Heisig M, Wittum G. 2013. Detailed modeling of skin penetration - an overview. Adv Drug Deliv Rev
65: 191.
Noy NF, McGuinness DL. 2001. Ontology Development 101: A Guide to Creating Your First Ontology'. Stanford
Knowledge Systems Laboratory Technical Report KSL-01-05 and Stanford Medical Informatics Technical Report
SMI-2001-0880.
NRC, 2007. The U.S. National Research Council (NRC). 2007 Toxicity Testing in the 21st Century: A Vision and a
Strategy. The National Academies Press, Washington DC.
OECD, 1983. OECD Guidelines for the Testing of Chemicals, Section 4. Test No. 415: One-Generation
Reproduction Toxicity Study. OECD, 26 May 1983. ISBN 9789264070844.
OECD, 1997. OECD Guidelines for the Testing of Chemicals, Section 4. Test No. 424: Neurotoxicity Study in
Rodents. OECD, 21 July 1997. ISBN 9789264071025.
OECD, 1998. OECD Principles of Good Laboratory Practice (as revised in 1997). Available at: http:
//www.oecd.org/chemicalsafety/testing/oecdseriesonprinciplesofgoodlaboratorypracticeglpandcompliancem
onitoring.htm. [Accessed in February, 2017]
OECD, 1998a. OECD Guidelines for the Testing of Chemicals, Section 4. Test No. 408: Repeated Dose 90-Day
Oral Toxicity Study in Rodents. OECD, 21 Sep 1998. ISBN 9789264070707.

References
149
OECD, 1998b. OECD Guidelines for the Testing of Chemicals, Section 4. Test No. 409: Repeated Dose 90-Day
Oral Toxicity Study in Non-Rodents. OECD, 21 Sep 1998. ISBN 9789264070721.
OECD, 2001. OECD Guidelines for the Testing of Chemicals, Section 4. Test No. 414: Prenatal Development
Toxicity Study. OECD, 22 Jan 2001. ISBN 9789264070820.
OECD, 2001a. OECD Guidelines for the Testing of Chemicals, Section 4. Test No. 416: Two-Generation
Reproduction Toxicity. OECD, 22 Jan 2001. ISBN 9789264070868.
OECD, 2004a. TG 427, 2004. Skin absorption: In vivo method. OECD Guidelines for the Testing of Chemicals.
Test No. 427 OECD. Paris, France.
OECD, 2004b. TG 428, 2004. Skin absorption: In vitro method. OECD Guidelines for the Testing of Chemicals.
Test No. 428 OECD. Paris, France.
OECD, 2005. Guidance Document on the Validation and International Acceptance of New or Updated Test
Methods for Hazard Assessment. ENV/JM/MONO(2005)14, Organisation for Economic Cooperation and
Development, Paris, 2005.
OECD, 2007a. Organisation for Economic Co-operation and Development (OECD). Report on the Regulatory
Uses and Applications in OECD Member Countries of (Quantitative. Structure-Activity Relationship [(Q)SAR]
Models in the Assessment of New and Existing Chemicals. ENV/JM/MONO (2006. 25, OECD, Paris, France 2007.
OECD, 2007b. OECD, Guidance on Grouping of Chemicals. ENV/JM/MONO(2007)28, Organisation for Economic
Cooperation and Development, Paris, 2007.
OECD, 2008. OECD Guidelines for the Testing of Chemicals, Section 4. Test No. 407: Repeated Dose 28-day Oral
Toxicity Study in Rodents. OECD, 16 October 2008. ISBN 9789264070684.
OECD, 2009. OECD Guidelines for the Testing of Chemicals, Section 4. Test No. 452: Chronic Toxicity Studies.
OECD, 8 Sep 2009. ISBN 9789264071209.
OECD, 2011. Guidance notes on dermal absorption: Series on Testing and Assessment. No. 156 OECD. Paris,
France.
OECD, 2013. OECD, 2013. Guidance Document on Developing and Assessing Adverse Outcome Pathways,
Series on Testing and Assessment No. 184 OECD, Paris, France.
Otberg N, Richter H, Schaefer H, Blume-Peytavi U, Sterry W, Lademann J. 2004. Variations of hair follicle size
and distribution in different body sites. J Invest Dermatol 122: 14-19.
PDB, 2015. Protein Data Bank, available at: http: //www.rcsb.org/pdb/home/home.do. [Accessed in February,
2017]
Pearson K. 1901. On lines and planes of closest fit. Philosophical Magazine 6(2): 559-572.
Potts RO, Guy RH. 1992. Predicting skin permeability. Pharm Res 9: 663.
RDKit, 2016. Available at: http: //www.rdkit.org/docs/. [Accessed in February, 2017]
Roberts WJ, Sloan KB. 1999. Correlation of aqueous and lipid solubilities with flux for prodrugs of 5‐
fluorouracil, theophylline, and 6‐mercaptopurine: A Potts–Guy approach. J Pharm Sci 88(5): 515-522.
Roberts WJ, Sloan KB. 2000. Prediction of transdermal flux of prodrugs of 5-fluorouracil, theophylline, and 6-
mercaptopurine with a series/parallel model. J Pharm Sci 89: 1415-1431.
Rougier A, Lotte C, Maibach HI. 1987. In vivo percutaneous penetration of some organic compounds related to
anatomic site in humans: Predictive assessment by the stripping method. J Pharm Sci 76: 451-454.
Russell WMS, Burch RL. 1959. The Principles of Humane Experimental Technique. Available at: http:
//altweb.jhsph.edu/pubs/books/humane_exp/het-toc. [Accessed in February, 2017]

References
150
Samaras EG et al. 2012. The Effect of Formulations and Experimental Conditions on in Vitro Human Skin
Permeation-Data From Updated EDETOX Database. Int J Pharm 434: 280.
SCCP, 2007. Scientific Committee on Consumer Products (SCCP) Opinion On HC Yellow No. 10, adopted on 19
June 2007 (SCCP/1080/07).
SCCP, 2007a. Scientific Committee on Consumer Products Opinion On 1,3-bis-(2,4-Diaminophenoxy)propane.
SCCP/1098/07.
SCCS, 2010. Scientific Committee on Consumer Safety (SCCS). 2010. Basic criteria for the in vitro assessment of
dermal absorption of cosmetic ingredients (Adopted June 22, 2010).
SCCS, 2012. Scientific Committee on Consumer Safety. 2012. The SCCS'S notes of guidance for the testing of
cosmetic substances and their safety evaluation, 8th revision. SCCS/1501/12.
SCCS, 2016. Scientific Opinions of the European Commission Scientific Committee for Consumer Safety.
Available at: http: //ec.europa.eu/growth/sectors/cosmetics/cosing/index_en.htm. [Accessed in February,
2017]
Scheuplein RJ. 1967. Mechanism of percutaneous absorption. II. Transient diffusion and the relative
importance of barrier routes of skin penetration. J Invest Dermatol 48: 79.
Smith B, Ashburner M, Rosse C, Bard J, Bug W, Ceusters W, Goldberg LJ, Eilbeck K, Ireland A, Mungall CJ, OBI
Consortium, Leontis N, Rocca-Serra P, Ruttenberg A, Sansone SA, Scheuermann RH, Shah N, Whetzel PL, Lewis
S. 2007. The OBO Foundry: coordinated evolution of ontologies to support biomedical data integration. Nat
Biotechnol 25(11): 1251-5.
Southwell S, Barry BW, Woodford R. 1984. Variations in permeability of human skin within and between
specimens. Int J Pharm 18: 299-309.
Sowa JF. 1999. Knowledge Representation: Logical, Philosophical, and Computational Foundations. Brooks Cole
Publishing Co., CA.
Stanford University Libraries, 2016. Available at: http:
//web.stanford.edu/group/swain/cinf/casreg/snumber.html. [Accessed in February, 2017]
Todeschini R, Consonni V. 2009. Handbook of Molecular Descriptors. WILEY-VCH Verlag GmbH. ISBN 3-52-
29913-0.
Tsai JC, Lin CY, Sheu HM, Lo YL, Huang YH. 2003. Non-invasive characterization of regional variation in drug
transport into human stratum corneum in vivo. Pharm Res 20: 632-638.
UNL, 2002. University of Nebrasca Linclon, Environmental Health and Safety. 2002. Toxicology and Exposure
Guidelines. Available at: http: //ehs.unl.edu. [Accessed in February, 2017]
Van de Sandt JJ, van Burgsteden JA, Cage S, et al. 2004. In vitro predictions of skin absorption of caffeine,
testosterone, and benzoic acid: A multi-centre comparison study. Regul Toxicol Pharmacol 39: 271-281.
Van Smeden J, Janssens M, Gooris GS, Bouwstra JA. 2014. The important role of stratum corneum lipids for the
cutaneous barrier function. Biochim Biophys Acta 1841(3): 295-313.
Vinken M, Pauwels M, Ates G, Vivier M, Vanhaecke T, Rogiers V. 2012. Screening of repeated dose toxicity data
present in SCC(NF)P/SCCS safety evaluations of cosmetic ingredients. Arch Toxicol 86: 405-412.
Vitcheva V, Mostrag-Szlichtyng A, Nelms M, Alov P, Enoch S, Tsakovka I, Rathman J, Cronin M (2013. Data
mining toxicity effects through an ontology approach to investigate toxicity mode of action. Toxicology Letters
221S (2013. S59–S256, P05-5. Poster Presentation at EUROTOX 2013, 49th Congress of the European Societies
of Toxicology, Interlaken, Switzerland, 1-4 September 2013.

References
151
Vitcheva V, Mostrag-Szlichtyng A, Sacher O, Bienfait B, Schwab CH, Richarz AN, Tsakovska I, Al Sharif M, Pajeva
I, Yang C. 2015. In vivo data mining and in silico metabolic profiling to predict diverse hepatotoxic phenotypes:
Case study of piperonyl butoxide. Poster Presentation at EUROTOX 2015, 13-16 September 2015, Porto,
Portugal.
Waldman M, Fraczkiewicz R, Clark RD. 2015. Tales from the war on error: the art and science of curating QSAR
data. Journal of Computer-Aided Molecular Design 29: 897-910.
Walters KA, Brain KR, Dressler WE, et al. 1997. Percutaneous penetration of N-nitroso-N-methyldodecylamine
through human skin in vitro: Application from cosmetic vehicles. Food Chem Toxicol 35: 705-712.
Walters KA (Eds). 2002. Dermatological and Transdermal Formulations. Marcel Dekker, Inc. ISBN: 0-8247-9889-
9.
Wang TF, Kasting GB, Nitsche JM. 2006. A multiphase microscopic diffusion model for stratum corneum
permeability. I. Formulation, solution, and illustrative results for representative compounds. J Pharm Sci 95(3):
620-48.
Wang T, Kasting GB, Nitsche JM. 2007. A multiphase microscopic diffusion model for stratum corneum
permeability. II. Estimation of physicochemical parameters, and application to a large permeability database. J
Pharm Sci 96(11): 3024-51.
Weininger D. 1988. SMILES, a chemical language and information system. 1 Introduction to methodology and
encoding rules. Journal of Chemical Information and Modeling 28(1): 31-6.
WHO, 2006. World Health Organization (WHO). 2006. Dermal absorption. Environmental Health Criteria (EHC
235). ISBN 978 92 4 1572 35 4.
Williams AC, Cornwell PA, Barry BW. 1992. On the non-gaussian distribution of human skin permeabilities. Int J
Pharm 86: 69-77.
Wold S, Esbensen K, Geladi P. 1987. Principal Component Analysis. Chemometrics and Intelligent Laboratory
Systems 2: 37-52.
Worth AP, Mostrag-Szlichtyng A. 2010. Towards a Common Regulatory Framework for Computational
Toxicology: Current Status and Future Perspectives. In: Wilson AGE (Ed): New Horizons in Predictive
Toxicology, Royal Society of Chemistry, Cambridge.
Xu G, Hughes-Oliver JM, Brooks JD, Yeatts JL, Baynes RE. 2013. Selection of appropriate training and validation
set chemicals for modelling dermal permeability by U-optimal design. SAR QSAR Environ Res 24: 135.
Yang C, Richard A, Cross KP. 2006. The Art of Data Mining the Minefields of Toxicity Databases to Link
Chemistry to Biology. Current Computer-Aided Drug Design 2: 135-150.
Yang C, Hasselgren CH, Boyer S, Arvidson K, Aveston S, Dierkes P, Benigni R, Benz RD, Contrera J, Kruhlak NL,
Matthews EJ, Han X, Jaworska J, Kemper RA, Rathman JF, Richard AM. 2008. Understanding genetic toxicity
through data mining: the process of building knowledge by integrating multiple genetic toxicity databases.
Toxicol Mech Methods A18(2-3): 277-95.
Yang C, Valerio LGJ, Arvidson KB. 2009. Computational toxicology approaches at the US Food and Drug
Administration. ATLA 37(5): 523-531.
Yang C, Tarkhov A, Marusczyk J, Bienfait B, Gasteiger J, Kleinoeder T, Magdziarz T, Sacher O, Schwab CH,
Schwoebel J, Terfloth L, Arvidson K, Richard A, Worth A, Rathman J. 2015. New Publicly Available Chemical
Query Language, CSRML, To Support Chemotype Representations for Application to Data Mining and
Modeling. J Chem Inf Model 55: 510-528.
Young D, Martin T, Venkatapathy R, Harten P. 2008. Are the chemical structures in your QSAR correct? QSAR &
Combinatorial Science 27: 1337-1345.

References
152
Zhang Q, Grice JE, Li P, Jepps OG, Wang GJ, Roberts MS. 2009. Skin Solubility Determines Maximum
Transepidermal Flux for Similar Size Molecules. Pharm Res 26: 1974.
Zupan J, Gasteiger J. 1999. Neural Networks in Chemistry and Drug Design. Wiley-VCH, Weinheim, Germany.


![[300-1-2]-1955-6798...ITEM To 6798/55 Ticoresti—stic. de 3/4 lei 21. — Vin de *Peteascae 3/4 lei 21. Vin de Odobesti—stic. 3/4 lei 18. Vin negru I lit—lei 16](https://img.pdfslide.us/doc/110x75/60fe4d4bbeeb9d215b2ce3fe/300-1-2-1955-6798-item-to-679855-ticorestiastic-de-34-lei-21-a-vin.jpg)