Embed Size (px)
Citation preview

JUNE 2004
ECN-C--04-060
DEVELOPMENT OF HORIZONTALLYSTANDARDIZED LEACHING TESTSFOR CONSTRUCTION MATERIALS:A MATERIAL BASED OR RELEASE
BASED APPROACH?Identical leaching mechanisms for different materials
H.A. van der SlootJ.J. Dijkstra

ECN-C--04-060 2
Acknowledgement/Preface
This work is carried out for the Dutch Ministry of Housing, Spatial Planning and the Environment (VROM), Soil, Water and Rural Environment Directorate (project nr. 2003.06.089). Anticipating on the European Construction Products Directive (CPD), and the developments under the Water Framework Directive, etcetera, this report is meant as a basis for further discussions on horizontal standardization and harmonization of leaching tests for building materials on a national as well on a European level. Abstract Currently, in the framework of the development of the Construction Products Directive (CPD), harmonized tests have to be selected or developed for the measurement and risk assessment of "dangerous substances" that may be released from building materials. It is generally recognized that the environmental risks associated with the use of materials for construction purposes is primarily the potential release of contaminants from the material into the environment, due to contact with water ("leaching"). There is a wide range of existing release- based tests that attempt to simulate individual field conditions for each specific material, instead of focusing on the common underlying mechanisms that control the release. Such test methods are typically "conditional", which means that the results of these tests cannot be compared to each other, which makes interpretation and regulation very inefficient. This report comprises a first evaluation if the number of leaching tests can be reduced to a testing framework based on common leaching mechanisms, which allows quantification of release from different construction products under different exposure conditions. The basic assumption is that the number of release controlling processes is limited and similar for a range of (construction) products. Data and knowledge from previous EU projects and from literature indicate that the dominant factors can be identified and quantified in a limited number of test methods, suitable to answer questions of both regulators and producers, for a wide range of (construction) products and a wide range of application scenarios. A hierarchy in testing is suitable to distinguish the more detailed characterization tests from the simple compliance tests for every-day practice. Aspects such as test reproducibility and bandwidth are addressed, as well as the use of test data for environmental impact assessment.
ECN-C--04-060 3
Table of contents 1 INTRODUCTION..................................................................................................5 2 WHICH FACTORS ARE CONTROLLING RELEASE? .......................................8
2.1 Chemical processes ..........................................................................................9 2.2 Physical factors influencing the transport of constituents from the product to the water phase. .........................................................................................................12 2.3 External factors..............................................................................................14 2.4 Organic substances from construction products..............................................14
3 APPLICATION OF AN EXISTING LEACHING TEST FRAMEWORK ON CONSTRUCTION PRODUCTS ..........................................................................16
3.1 How are the release mechanisms reflected in the test protocols?.....................16 3.2 Basic data presentation and interpretation.......................................................16
4 RELEASE MECHANISMS FOR MINERAL CONSTRUCTION PRODUCTS AND OTHER CONSTRUCTION MATERIALS. ................................................21
5 REPEATABILITY AND BAND WIDTH ............................................................26 6 HIERARCHY IN TESTING.................................................................................29
6.1 Example of the relation between characterization tests and compliance tests ..30 7 IMPACT ASSESSMENT .....................................................................................31
7.1 Which questions are relevant, and how to answer them? ................................31 7.2 ENV 12920 – Methodology Guideline ...........................................................36 7.3 Step-Wise Impact Assessment Procedure Applied to Groundwater Quality ....37
8 CONCLUSIONS ..................................................................................................39 Bibliography, sources and references:............................................................................43 APPENDICES ..............................................................................................................45 1. Preserved wood .........................................................................................................46 2. Release of metals and organics from synthetic building materials ..............................48 3. Construction metals (example used: zinc roof materials)............................................51 4. Metal pipes (example: Cu pipes for transport of drinking water) ................................54

ECN-C--04-060 4
ECN-C--04-060 5
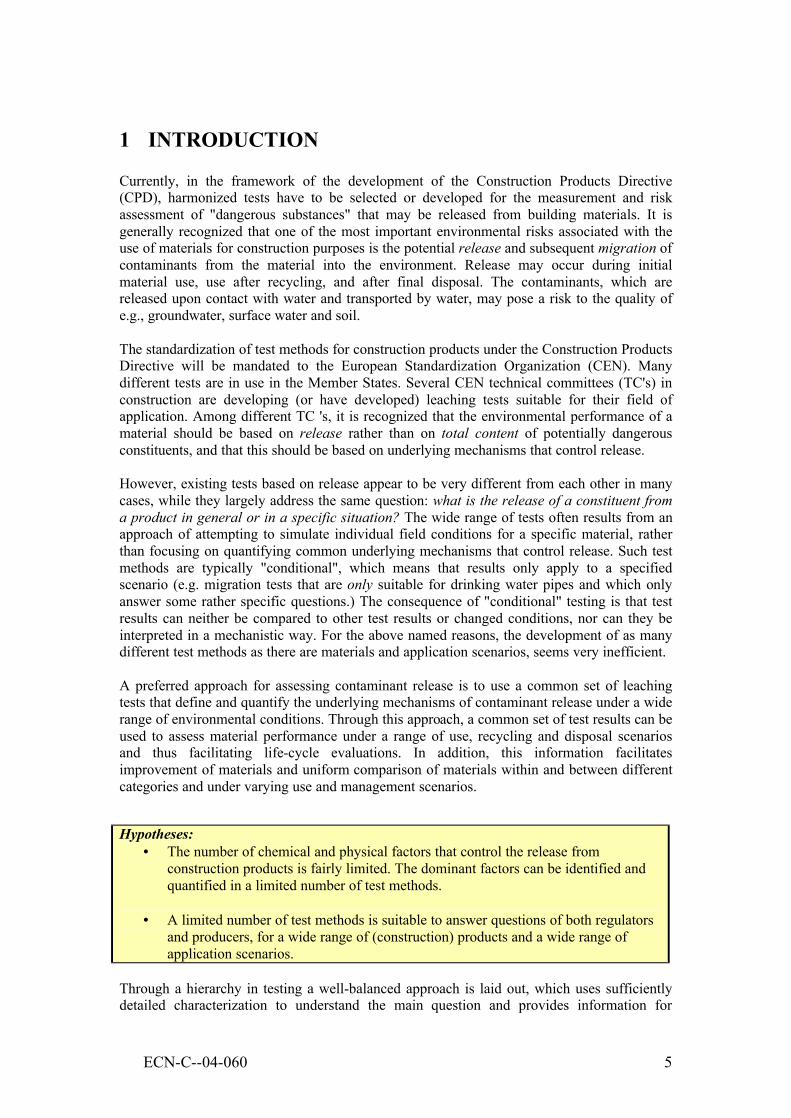
1 INTRODUCTION Currently, in the framework of the development of the Construction Products Directive (CPD), harmonized tests have to be selected or developed for the measurement and risk assessment of "dangerous substances" that may be released from building materials. It is generally recognized that one of the most important environmental risks associated with the use of materials for construction purposes is the potential release and subsequent migration of contaminants from the material into the environment. Release may occur during initial material use, use after recycling, and after final disposal. The contaminants, which are released upon contact with water and transported by water, may pose a risk to the quality of e.g., groundwater, surface water and soil. The standardization of test methods for construction products under the Construction Products Directive will be mandated to the European Standardization Organization (CEN). Many different tests are in use in the Member States. Several CEN technical committees (TC's) in construction are developing (or have developed) leaching tests suitable for their field of application. Among different TC 's, it is recognized that the environmental performance of a material should be based on release rather than on total content of potentially dangerous constituents, and that this should be based on underlying mechanisms that control release. However, existing tests based on release appear to be very different from each other in many cases, while they largely address the same question: what is the release of a constituent from a product in general or in a specific situation? The wide range of tests often results from an approach of attempting to simulate individual field conditions for a specific material, rather than focusing on quantifying common underlying mechanisms that control release. Such test methods are typically "conditional", which means that results only apply to a specified scenario (e.g. migration tests that are only suitable for drinking water pipes and which only answer some rather specific questions.) The consequence of "conditional" testing is that test results can neither be compared to other test results or changed conditions, nor can they be interpreted in a mechanistic way. For the above named reasons, the development of as many different test methods as there are materials and application scenarios, seems very inefficient. A preferred approach for assessing contaminant release is to use a common set of leaching tests that define and quantify the underlying mechanisms of contaminant release under a wide range of environmental conditions. Through this approach, a common set of test results can be used to assess material performance under a range of use, recycling and disposal scenarios and thus facilitating life-cycle evaluations. In addition, this information facilitates improvement of materials and uniform comparison of materials within and between different categories and under varying use and management scenarios.
Through a hierarchy in testing a well-balanced approach is laid out, which uses sufficiently detailed characterization to understand the main question and provides information for
Hypotheses: • The number of chemical and physical factors that control the release from
construction products is fairly limited. The dominant factors can be identified and quantified in a limited number of test methods.
• A limited number of test methods is suitable to answer questions of both regulators
and producers, for a wide range of (construction) products and a wide range of application scenarios.
ECN-C--04-060 6
adequate evaluation. In this hierarchy quick methods for quality control purposes are available, once the work has moved in to a stage of monitoring quality and ensuring compliance with regulation. Such an approach could in principle lead to a "level playing field" of requirements that all types of (construction) materials have to fulfil. Firstly, because legislation based on "release" can be derived from testing information in one consistent way. Secondly, apart from efficiency (in terms of time and finance), an important advantage would be a high flexibility, because many (emerging) impact/exposition scenarios could be treated in a similar way with the same tests. Finally, the approach leads to a rational relationship between perceived risks and the criteria set to provide protection against those risks. In this document, we pose that the release of constituents to the water phase is a function of a limited number of chemical and physical (transport) mechanisms. For each construction product in an application scenario, only a few of those factors are dominant for the release behaviour. These factors can be assessed by a limited number of release test methods. This document has the purpose to briefly address the possibilities for a unified approach of testing across the field of construction products. This will be done below in different steps:
1. by identifying the common (physical and chemical) mechanisms that control release of (regular and alternative) construction products (chapter 2). The focus will be on the release of inorganic contaminants (such as heavy metals). For organic contaminants, less data and knowledge is available at this time. Organic contaminants will not be discussed in this document, however, it is likely that similar principles and mechanisms apply.
2. by showing that it is possible to use an existing test framework, based on release
mechanisms, to answer relevant questions for both regulators as well as producers of construction products (chapter 3 - 7 and appendices).
In several European member states and through EU funded projects, knowledge on leaching issues for a wide range of materials has increased significantly in the last decade. This relates to different fields - soil, sludge, sediments, waste, recycled materials and construction products - as environmental impact is relevant in all of these areas. In the framework of a European project on Harmonisation of leaching/extraction test (van der Sloot et al., 1997), it was found that there are more common aspects than there are fundamental differences in mechanisms and test methods that have been developed for different materials. This is an expected outcome because a common set of physical and chemical phenomena controls the release of contaminants from solid materials to water under a wide range of environmental conditions. Data gathered from these and other projects are used throughout this document for illustration. The range of construction materials for which tests have to be developed is very broad (concrete, brick, lime silicate blocks, asphalt, wood, metal roof materials, plastic materials, etc.) as is the variety in "dangerous substances" (heavy metals, organic contaminants, radio nuclides). Also, the variety in application/impact scenarios is fairly wide (for example, the release of "dangerous" substances to the water-phase in a drinking water pipe, in a road base application with compacted granular materials or in the run-off of rainwater from roof material). The CPD will regulate the use of both “new” products and alternative raw materials in construction. This implies that there is a need to harmonise methods between the Technical Committees in CEN with a construction sector background and those with environmental background. A recent development worth mentioning is a workshop organized by CEN Construction in cooperation with CEN Environment in Coimbra (Portugal) in 2003. This meeting was held to coordinate test development for construction materials, as there are many

ECN-C--04-060 7
(obvious) analogues between the release mechanisms of construction materials, recycled materials and waste materials. The current vertically oriented (material specific) approach in the existing CEN Construction Product TC’s is for the issue of “dangerous” substances changing into a more horizontal approach (i.e., covering a wider range of materials to be characterized by the same release methods). This development coincides with a change to an approach in which the mechanism of release is the primary focus for the adoption/development of methods to quantify release, facilitating the relationship between laboratory data and a range of field conditions. Within the environmental field recently also initiatives were taken to develop more uniform test methods for the environmental sector. The project ‘Horizontal’ is an important exponent of this development, which has to show how such uniform approach may become possible.

ECN-C--04-060 8
2 WHICH FACTORS ARE CONTROLLING RELEASE? In terms of release behaviour, two types of products must be distinguished. These are monolithic and granular materials. Monolithic materials often show diffusion controlled release (release of constituents from the products due to diffusion), whereas granular materials usually show percolation dominated release (release due to percolation of water though the product). Examples of monolithic products are all cementitious products (e.g., concrete, bricks, coated materials). The release of both categories is influenced by material-specific factors as well as environmental factors. This is depicted schematically below, and further explained in the next paragraphs.
Figure 1. Material-specific and external factors (chemical and physical), influencing the release of contaminants from monolithic (concrete, blocks, bricks) material and granular material (sand, sinters, gravel, steel slag), such as used in a road base.
Two overall processes cause the release of constituents from materials to the water phase:
Basic transport mechanisms:
Surface wash-off
diffusion
Erosion
Water, frost
Physical factors:
Permeability
Size/shape
Tortuosity
Porosity Chemical factors:
pH
Buffer capacity
Chemical form (speciation)
Soluble salts
Salt strength
H+ CO2 O2 Cl- intrusion
Basic chemical mechanisms:
Non-reactive (total content)
Solubility control
Road shoulder, soil
Road base material (e.g. alternative construction material)
Precipitation
Physical factors:
Permeability
Particle size
Porosity
Chemical factors:
pH organic matter
Buffer capacity redox
Chemical form (speciation) salt strength
Soluble salts
Major transport mechanisms:
Surface wash-off
percolation Major chemical mechanisms:
Solubility control
adsorption
ECN-C--04-060 9
(1) Chemical processes (dissolution of minerals, adsorption, availability); (2) Physical transport processes (advection, surface wash-off, and diffusion). In practice, generally a combination of (1) and (2) cause the release to the water phase. In the two paragraphs below, these processes and a number of important factors that play a role are briefly explained. Generally, only a few of these factors dominate the release; the relative importance of each of the below listed factors for a number of products will be given in chapter 4. Detailed information on a number of alternative materials is given in the appendices.
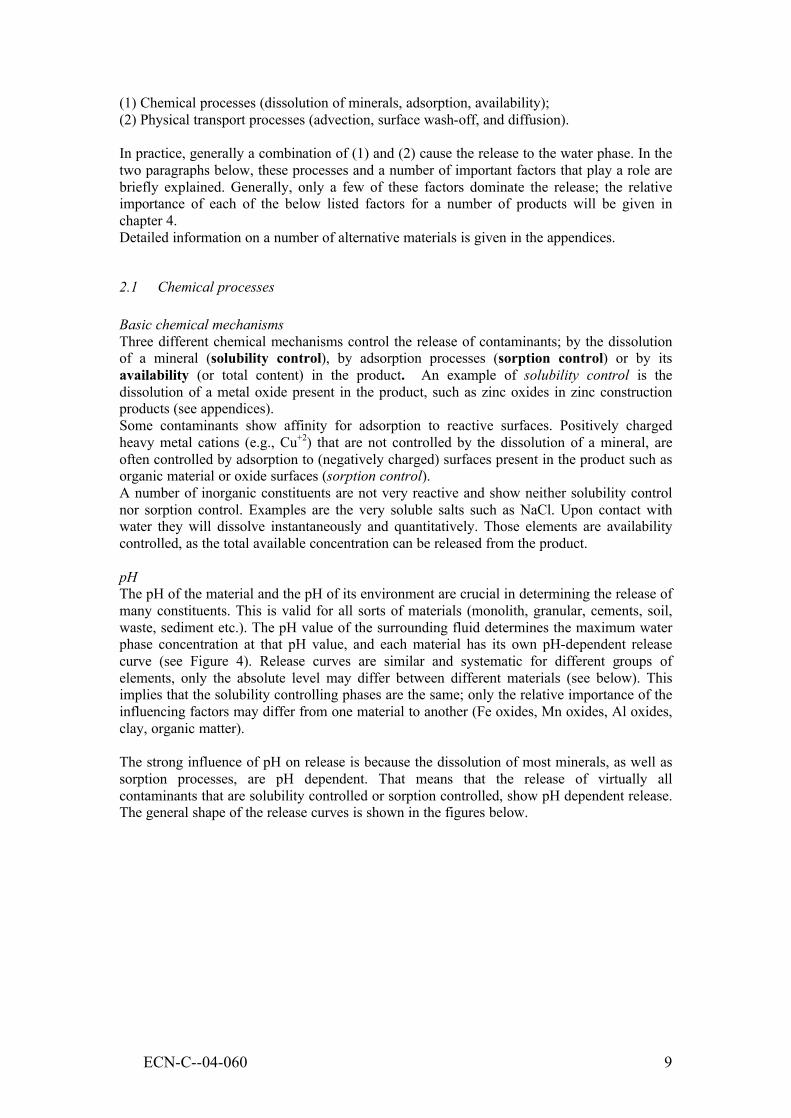
2.1 Chemical processes Basic chemical mechanisms Three different chemical mechanisms control the release of contaminants; by the dissolution of a mineral (solubility control), by adsorption processes (sorption control) or by its availability (or total content) in the product. An example of solubility control is the dissolution of a metal oxide present in the product, such as zinc oxides in zinc construction products (see appendices). Some contaminants show affinity for adsorption to reactive surfaces. Positively charged heavy metal cations (e.g., Cu+2) that are not controlled by the dissolution of a mineral, are often controlled by adsorption to (negatively charged) surfaces present in the product such as organic material or oxide surfaces (sorption control). A number of inorganic constituents are not very reactive and show neither solubility control nor sorption control. Examples are the very soluble salts such as NaCl. Upon contact with water they will dissolve instantaneously and quantitatively. Those elements are availability controlled, as the total available concentration can be released from the product. pH The pH of the material and the pH of its environment are crucial in determining the release of many constituents. This is valid for all sorts of materials (monolith, granular, cements, soil, waste, sediment etc.). The pH value of the surrounding fluid determines the maximum water phase concentration at that pH value, and each material has its own pH-dependent release curve (see Figure 4). Release curves are similar and systematic for different groups of elements, only the absolute level may differ between different materials (see below). This implies that the solubility controlling phases are the same; only the relative importance of the influencing factors may differ from one material to another (Fe oxides, Mn oxides, Al oxides, clay, organic matter). The strong influence of pH on release is because the dissolution of most minerals, as well as sorption processes, are pH dependent. That means that the release of virtually all contaminants that are solubility controlled or sorption controlled, show pH dependent release. The general shape of the release curves is shown in the figures below.
ECN-C--04-060 10
0.01
0.1
1
10
100
1000
2 4 6 8 10 12 14 pH
Leac
hed
(mg/
kg)
salts (Na, K, Cl, Br,..)
0.01
0.1
1
10
100
1000
2 4 6 8 10 12 14 pH
Leac
hed
(mg/
kg) Cations (Ni,
Cu, Zn, Cd, Pb, Al, Fe, )
0.01
0.1
1
10
100
1000
2 4 6 8 10 12 14 pH
Leac
hed
(mg/
kg)
Anions (Mo, Cr(VI), As, Se, Sb, SO4)
Figure 2. General leaching behaviour of three groups of constituents as a function of pH. Cations, anions and soluble salts have a distinct leach pattern, caused by their chemical speciation, and vary orders of magnitude as a function of pH.
0.01
0.1
1
10
100
1000
2 4 6 8 10 12 14
pH
Leac
hed
(mg/
kg)
redox changes DOC
change
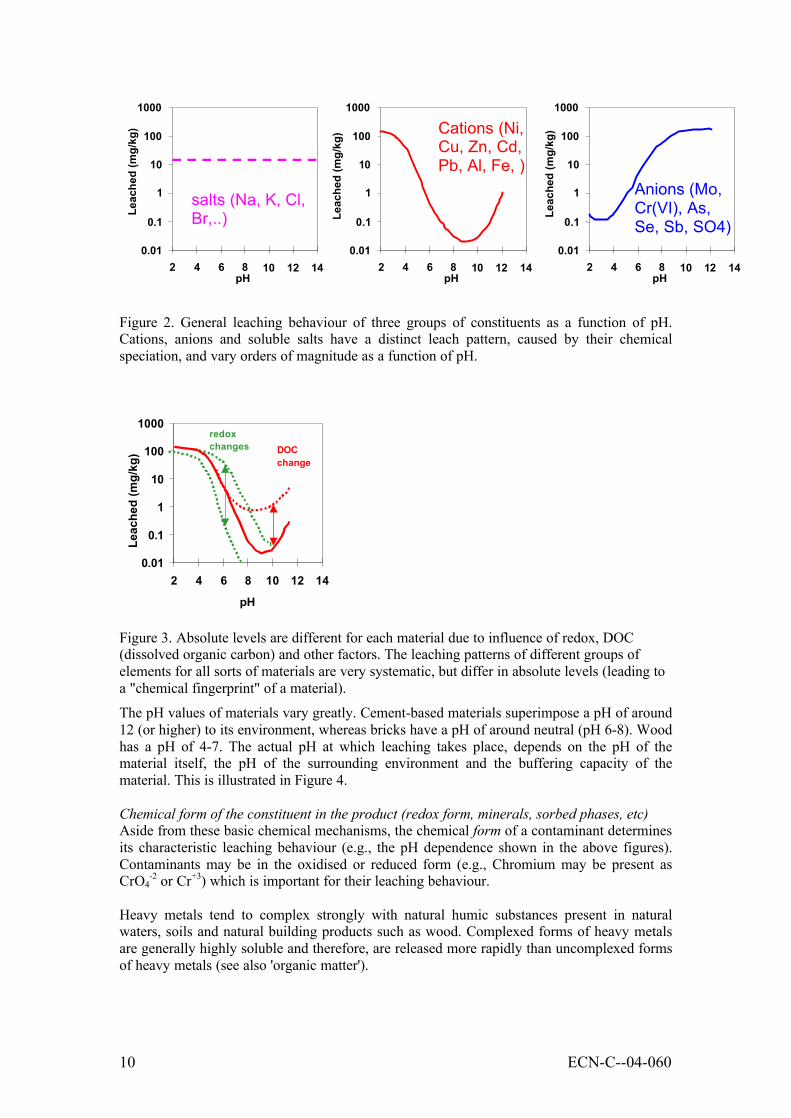
Figure 3. Absolute levels are different for each material due to influence of redox, DOC (dissolved organic carbon) and other factors. The leaching patterns of different groups of elements for all sorts of materials are very systematic, but differ in absolute levels (leading to a "chemical fingerprint" of a material).
The pH values of materials vary greatly. Cement-based materials superimpose a pH of around 12 (or higher) to its environment, whereas bricks have a pH of around neutral (pH 6-8). Wood has a pH of 4-7. The actual pH at which leaching takes place, depends on the pH of the material itself, the pH of the surrounding environment and the buffering capacity of the material. This is illustrated in Figure 4. Chemical form of the constituent in the product (redox form, minerals, sorbed phases, etc) Aside from these basic chemical mechanisms, the chemical form of a contaminant determines its characteristic leaching behaviour (e.g., the pH dependence shown in the above figures). Contaminants may be in the oxidised or reduced form (e.g., Chromium may be present as CrO4
-2 or Cr+3) which is important for their leaching behaviour. Heavy metals tend to complex strongly with natural humic substances present in natural waters, soils and natural building products such as wood. Complexed forms of heavy metals are generally highly soluble and therefore, are released more rapidly than uncomplexed forms of heavy metals (see also 'organic matter').
ECN-C--04-060 11
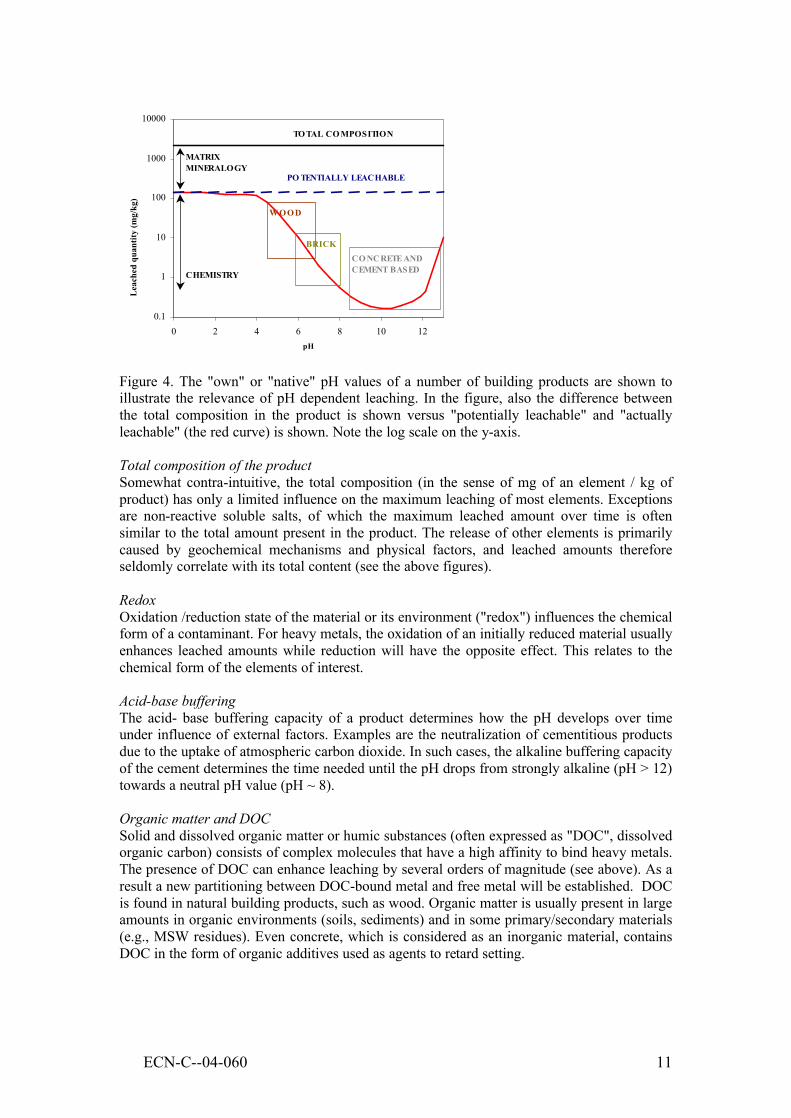
Figure 4. The "own" or "native" pH values of a number of building products are shown to illustrate the relevance of pH dependent leaching. In the figure, also the difference between the total composition in the product is shown versus "potentially leachable" and "actually leachable" (the red curve) is shown. Note the log scale on the y-axis. Total composition of the product Somewhat contra-intuitive, the total composition (in the sense of mg of an element / kg of product) has only a limited influence on the maximum leaching of most elements. Exceptions are non-reactive soluble salts, of which the maximum leached amount over time is often similar to the total amount present in the product. The release of other elements is primarily caused by geochemical mechanisms and physical factors, and leached amounts therefore seldomly correlate with its total content (see the above figures). Redox Oxidation /reduction state of the material or its environment ("redox") influences the chemical form of a contaminant. For heavy metals, the oxidation of an initially reduced material usually enhances leached amounts while reduction will have the opposite effect. This relates to the chemical form of the elements of interest. Acid-base buffering The acid- base buffering capacity of a product determines how the pH develops over time under influence of external factors. Examples are the neutralization of cementitious products due to the uptake of atmospheric carbon dioxide. In such cases, the alkaline buffering capacity of the cement determines the time needed until the pH drops from strongly alkaline (pH > 12) towards a neutral pH value (pH ~ 8). Organic matter and DOC Solid and dissolved organic matter or humic substances (often expressed as "DOC", dissolved organic carbon) consists of complex molecules that have a high affinity to bind heavy metals. The presence of DOC can enhance leaching by several orders of magnitude (see above). As a result a new partitioning between DOC-bound metal and free metal will be established. DOC is found in natural building products, such as wood. Organic matter is usually present in large amounts in organic environments (soils, sediments) and in some primary/secondary materials (e.g., MSW residues). Even concrete, which is considered as an inorganic material, contains DOC in the form of organic additives used as agents to retard setting.
0.1
1
10
100
1000
10000
0 2 4 6 8 10 12pH
Lea
ched
qua
ntity
(mg/
kg)
MATRIX MINERALOGY
TO TAL CO MPOSITION
PO TENTIALLY LEACHABLE
CHEMISTRY
BRICK
WOOD
CO NCRETE AND CEMENT BASED

ECN-C--04-060 12
Composition of the water phase and ionic strength The salt strength of the solution in the product or its environment influences the solubility of other components (generally, a higher salt strength increases the leaching of contaminants). Other components present in the solution may cause enhanced leaching due to complexation, such as metal complexes with chloride or carbonates. Temperature Temperature increase generally leads to a higher solubility. In addition, an increase in temperature has an increasing effect on chemical reaction rates, and thus also an increasing effect on transport by diffusion. Time Time is an important factor for the amount released when a) In general, the time scale that applies to the use of a specific material in a given
application; b) The rate at which processes proceed, which may be limiting for the release in case of slow
reaction kinetics (slow dissolution of minerals) or diffusion. It may not be feasible to allow such reactions to run to completion, as the time to reach that stage may be far too long. In that case, one has to estimate the possible consequences of such slow processes on the overall release.
c) The change of material properties or environmental conditions over time. Examples are the carbonation of alkaline products (altering its release properties) or the increased surface area of a monolith due to erosion.
Test methods that include several steps provide insight in the short and long term effects of leaching. Such tests may give information for interpolation or extrapolation towards shorter or longer leaching periods.
2.2 Physical factors influencing the transport of constituents from the product to the water phase.
Basic transport mechanisms Aside from the chemical processes, physical transport processes determine the transfer of constituents from the material to the water phase. Three basic transport mechanisms can be distinguished that will be introduced briefly below. The process of constituents taken along with the (rain) water percolating through or along the product, is called advection. Water percolating through or along a product is usually caused by rainfall, and plays a major role in the release and impact on soil and groundwater due to the further distribution of the constituents. Percolation through a product is only possible for porous materials (such as granular materials). Diffusion is the transport of constituents solely due to the movement of molecules in the absence of flow. This generally plays a role for compacted materials that have a very low permeability and porosity (the water in the pores will then be stagnant). Still release will occur, but on the basis of transport by diffusion. Under those circumstances, diffusion may be the limiting transport step before constituents can be taken along due to further advection. The rate of diffusion is dependent on the gradient of the constituent between the product and the contacting water phase, and is time dependent. Surface wash-off is a process that is similar to advection. The term surface wash-off is used to define the (initial) wash-off of soluble materials on the outside of monolithic products. After the initial wash-off, diffusion is normally the major transport mechanism in monolithic materials.
ECN-C--04-060 13
Granular/monolithic As mentioned before, it is important to distinguish granular and monolithic products because of the different transport regimes for these two categories. The release behaviour due to contact with water is percolation dominated for granular materials and diffusion dominated for monolithic materials (i.e. the amount released depends on the time-dependent diffusion of constituents from the products towards the water phase). For monolithic materials, initial surface wash-off may play a significant role. In that case, soluble salts present on the surface dissolve rapidly and cause an (initial) elevated release. In some cases, granular material may be compacted or overlain with additional low permeability material in the field, resulting in the granular material also behaving in a manner similar to a monolithic material. Particle size For granular materials, the particle size determines the distance over which a contaminant must travel from the centre of the particle towards the water phase. Reaction and transport is fast for granular materials with a small particle size. The coarser the grain size, the more the transport tends to be limited by diffusion. Porosity The pore space or porosity (ratio of pore space and total volume) is a factor that influences the transport rate of constituents towards the water phase both for monolithic and granular materials.. Transport of water is easier in media with a high porosity than in a low porosity medium; therefore, a higher porosity generally leads to a higher release. Permeability The permeability or hydraulic conductivity determines how "easy" water enters the product, and how fast contaminants will be released over time. Permeability may be an issue for dense, clayey materials or monolithic materials. Water tends to flow around products with a low permeability rather than to enter it; this is why products with a low permeability tend to show diffusion-controlled release. Tortuosity For monoliths showing diffusion-controlled release, a material- specific factor determining the rate of diffusion (effective diffusion) is the tortuosity. It is defined as the ratio between the actual path length, over which a constituent is transported between two points, and the straight line distance between these two points. Materials with a fine channelled, internal pore structure will have a higher tortuosity. This will result in a lower release rate. Monolith size and shape The quantity of a substance leaching from a product by diffusion depends primarily on the size and the geometry of the product. These factors directly relate to the amount of exposed surface area of the product, which is an important factor for diffusion. Diffusion proceeds faster for products with a high exposed surface area per weight unit. Diffusion tests and diffusion formulae are primarily based on monolithic specimens that are thick enough to maintain concentrations of available substances in the centre of the specimen at their original level. As soon as in the core of the specimen the available level of constituents decreases ‘depletion’ effects appear in test results. For thin products or highly porous materials this may appear soon, sometimes even in the test itself. In practice, depletion may not occur for hundreds of years. This difference between test performance and practice is important to realize in the interpretation of test results. Sensitivity for erosion For monolithic materials, physical erosion/abrasion (e.g. influence of water and frost) has an increasing effect of release due to two factors. First, erosion will lead to an increased surface area. Second, due to erosion, new fresh surface is exposed, which leads to a higher gradient of
ECN-C--04-060 14
contaminant concentrations and therefore to a higher release. E.g. in Sweden it was investigated that just transport of all kinds of aggregates and the placement of the aggregates into a road base may lead to more than a doubling of the active surface of the aggregates by the fines created in handling. Salt intrusion Intrusion (diffusion into the product) of salts (e.g., chloride) into steel-enforced concrete structures may be severely damaging, due to oxidation processes of the steel armour. In advanced stages of the oxidation process, the steel enforced concrete may burst. Fresh area is exposed, and the total area is increased. This leads to a higher release.
2.3 External factors Several "external" factors are important for the release behaviour under field conditions. Many of them relate to the amount of water to which the product is exposed in a certain time interval, such as the water flow rate (monolithic materials) and the occurrence of preferential flow paths in granular materials. These external factors are dependent on the application scenario (e.g., covered or uncovered product). Other factors that influence the release are e.g. degradation of organic substances in the product, or the degradation of substances due to the influence of light.
2.4 Organic substances from construction products As stressed before, the focus of this note is on inorganic substances. For the leaching of (hydrophobic) organic substances (e.g., PAH, volatile organics), knowledge is not as far developed as for inorganic substances such as heavy metals. There are, however, a number of processes that are known to be important for the leaching of organics from materials. Important processes are:
• Diffusion • Presence of (dissolved) organic matter (DOC). Due to its hydrophobic nature, also
relevant for binding of organics • pH, redox and salt strength. Because the leaching of DOC (see above) is strongly
dependent on pH, redox and salt strength, this may have indirect effects on the leaching of organics that bind to DOC;
• Volatilisation. A number of organic substances may show release behaviour that is influenced by transmission through the gaseous phase. Examples are volatile solvents or weakeners. (This may also be the case for rather volatile radioactive substances like radon or an inorganic substance like mercury.) Temperature may be a factor that may increase their release (see previous comments).
• Degradation. Many organics tend to degrade (e.g., due to photochemical degradation, microbial degradation). Degradation is time dependent and sometimes fast or extremely slow (e.g., PAH degradation). Degradation is obviously not an issue for inorganic contaminants.
Although for many organics the release processes may be similar to that of inorganics (e.g., diffusion), there is a need for more experience on this topic, in particular for laboratory test protocols. The sorption of (hydrophobic) organics to laboratory material (glass, filters) is an issue for the development of standard test methods.
ECN-C--04-060 15
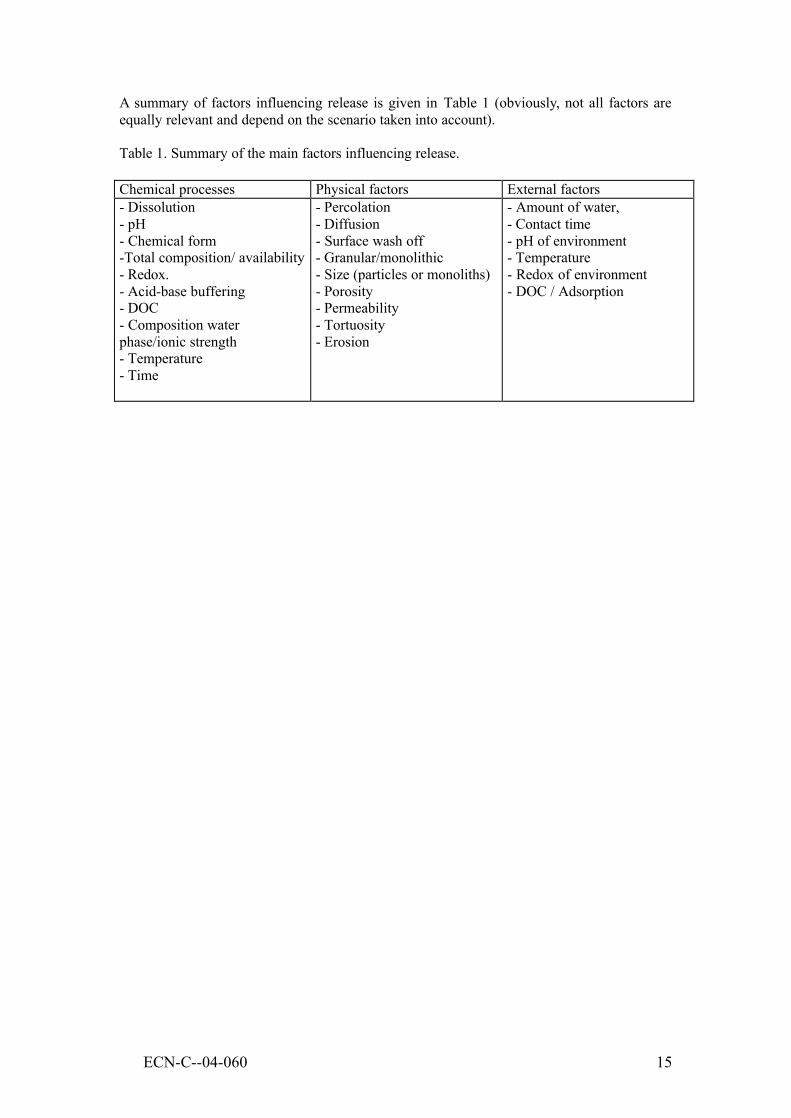
A summary of factors influencing release is given in Table 1 (obviously, not all factors are equally relevant and depend on the scenario taken into account). Table 1. Summary of the main factors influencing release. Chemical processes Physical factors External factors - Dissolution - pH - Chemical form -Total composition/ availability - Redox. - Acid-base buffering - DOC - Composition water phase/ionic strength - Temperature - Time
- Percolation - Diffusion - Surface wash off - Granular/monolithic - Size (particles or monoliths) - Porosity - Permeability - Tortuosity - Erosion
- Amount of water, - Contact time - pH of environment - Temperature - Redox of environment - DOC / Adsorption
ECN-C--04-060 16
3 APPLICATION OF AN EXISTING LEACHING TEST FRAMEWORK ON CONSTRUCTION PRODUCTS
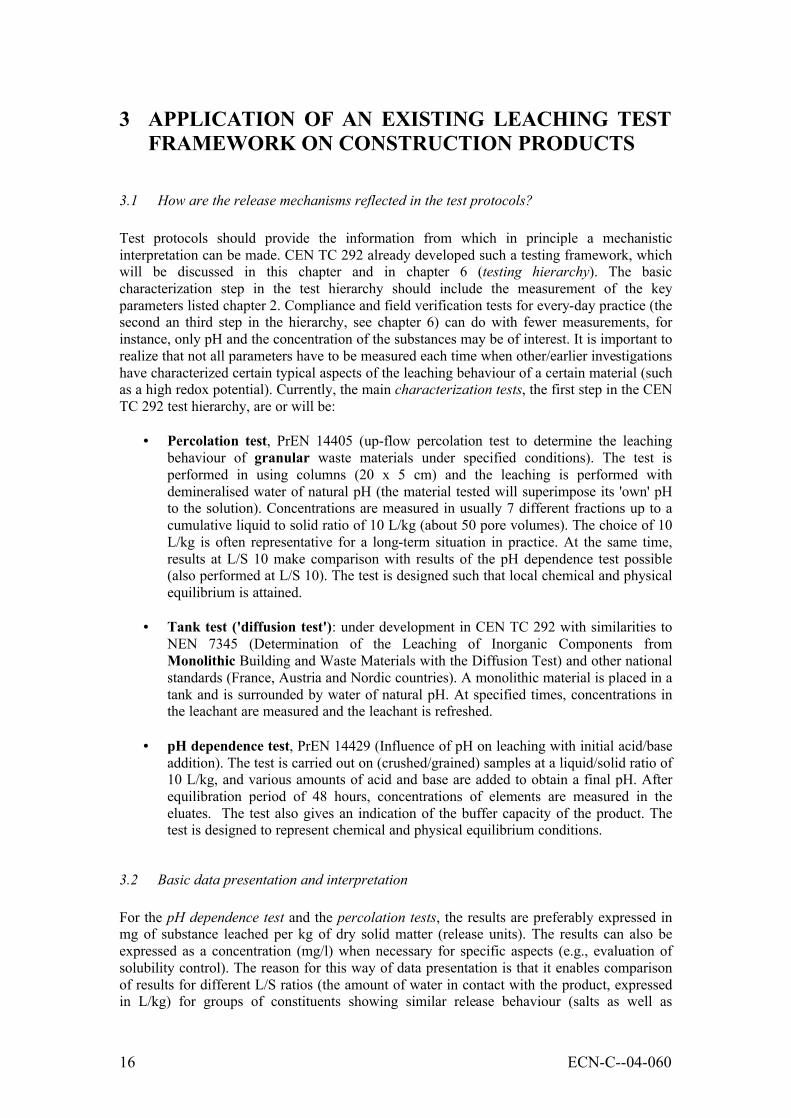
3.1 How are the release mechanisms reflected in the test protocols? Test protocols should provide the information from which in principle a mechanistic interpretation can be made. CEN TC 292 already developed such a testing framework, which will be discussed in this chapter and in chapter 6 (testing hierarchy). The basic characterization step in the test hierarchy should include the measurement of the key parameters listed chapter 2. Compliance and field verification tests for every-day practice (the second an third step in the hierarchy, see chapter 6) can do with fewer measurements, for instance, only pH and the concentration of the substances may be of interest. It is important to realize that not all parameters have to be measured each time when other/earlier investigations have characterized certain typical aspects of the leaching behaviour of a certain material (such as a high redox potential). Currently, the main characterization tests, the first step in the CEN TC 292 test hierarchy, are or will be:
• Percolation test, PrEN 14405 (up-flow percolation test to determine the leaching behaviour of granular waste materials under specified conditions). The test is performed in using columns (20 x 5 cm) and the leaching is performed with demineralised water of natural pH (the material tested will superimpose its 'own' pH to the solution). Concentrations are measured in usually 7 different fractions up to a cumulative liquid to solid ratio of 10 L/kg (about 50 pore volumes). The choice of 10 L/kg is often representative for a long-term situation in practice. At the same time, results at L/S 10 make comparison with results of the pH dependence test possible (also performed at L/S 10). The test is designed such that local chemical and physical equilibrium is attained.
• Tank test ('diffusion test'): under development in CEN TC 292 with similarities to
NEN 7345 (Determination of the Leaching of Inorganic Components from Monolithic Building and Waste Materials with the Diffusion Test) and other national standards (France, Austria and Nordic countries). A monolithic material is placed in a tank and is surrounded by water of natural pH. At specified times, concentrations in the leachant are measured and the leachant is refreshed.
• pH dependence test, PrEN 14429 (Influence of pH on leaching with initial acid/base
addition). The test is carried out on (crushed/grained) samples at a liquid/solid ratio of 10 L/kg, and various amounts of acid and base are added to obtain a final pH. After equilibration period of 48 hours, concentrations of elements are measured in the eluates. The test also gives an indication of the buffer capacity of the product. The test is designed to represent chemical and physical equilibrium conditions.
3.2 Basic data presentation and interpretation For the pH dependence test and the percolation tests, the results are preferably expressed in mg of substance leached per kg of dry solid matter (release units). The results can also be expressed as a concentration (mg/l) when necessary for specific aspects (e.g., evaluation of solubility control). The reason for this way of data presentation is that it enables comparison of results for different L/S ratios (the amount of water in contact with the product, expressed in L/kg) for groups of constituents showing similar release behaviour (salts as well as
ECN-C--04-060 17
solubility controlled release). Also, it makes a direct comparison possible between results from the percolation test and a pH dependence test (example will follow). It must be realised that, the concentrations in the eluate of a leaching can generally not be related directly to the impact of soil, groundwater or surface water. The eluate from a leaching test reflects the release under the conditions imposed in the test. In an actual situation, e.g. the ‘first flush’ till L/S=0,1 or to L/S=0,5 may have much higher concentrations and may be of much more importance to organisms, than the release after a longer period. Furthermore one should realise that many leached substances may be adsorbed first by the soil particles and may later be transported to the ground water. So the concentrations of substances in an eluate directly from a test will often be strongly different from the concentrations of substances in the percolate that enters groundwater. These aspects are addressed below and in chapter 7.
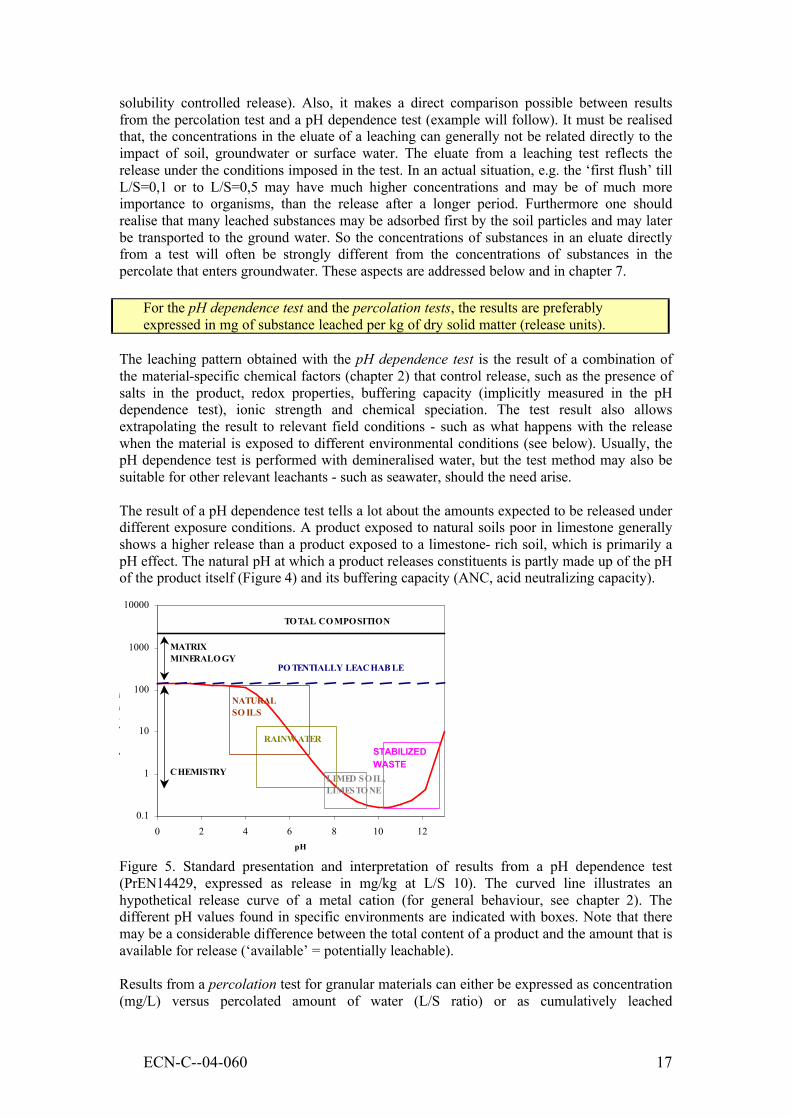
The leaching pattern obtained with the pH dependence test is the result of a combination of the material-specific chemical factors (chapter 2) that control release, such as the presence of salts in the product, redox properties, buffering capacity (implicitly measured in the pH dependence test), ionic strength and chemical speciation. The test result also allows extrapolating the result to relevant field conditions - such as what happens with the release when the material is exposed to different environmental conditions (see below). Usually, the pH dependence test is performed with demineralised water, but the test method may also be suitable for other relevant leachants - such as seawater, should the need arise. The result of a pH dependence test tells a lot about the amounts expected to be released under different exposure conditions. A product exposed to natural soils poor in limestone generally shows a higher release than a product exposed to a limestone- rich soil, which is primarily a pH effect. The natural pH at which a product releases constituents is partly made up of the pH of the product itself (Figure 4) and its buffering capacity (ANC, acid neutralizing capacity).
Figure 5. Standard presentation and interpretation of results from a pH dependence test (PrEN14429, expressed as release in mg/kg at L/S 10). The curved line illustrates an hypothetical release curve of a metal cation (for general behaviour, see chapter 2). The different pH values found in specific environments are indicated with boxes. Note that there may be a considerable difference between the total content of a product and the amount that is available for release (‘available’ = potentially leachable). Results from a percolation test for granular materials can either be expressed as concentration (mg/L) versus percolated amount of water (L/S ratio) or as cumulatively leached
For the pH dependence test and the percolation tests, the results are preferably expressed in mg of substance leached per kg of dry solid matter (release units).
0.1
1
10
100
1000
10000
0 2 4 6 8 10 12pH
Lea
ched
qua
ntity
(mg/
kg)
MATRIX MINERALO GY
TOTAL COMPOSITION
PO TENTIALLY LEACHAB LE
CHEMISTRY
RAINW ATER
NATURAL SO ILS
LIMED SOIL, LIMESTONE
STABILIZED WASTE
carbonated
ECN-C--04-060 18
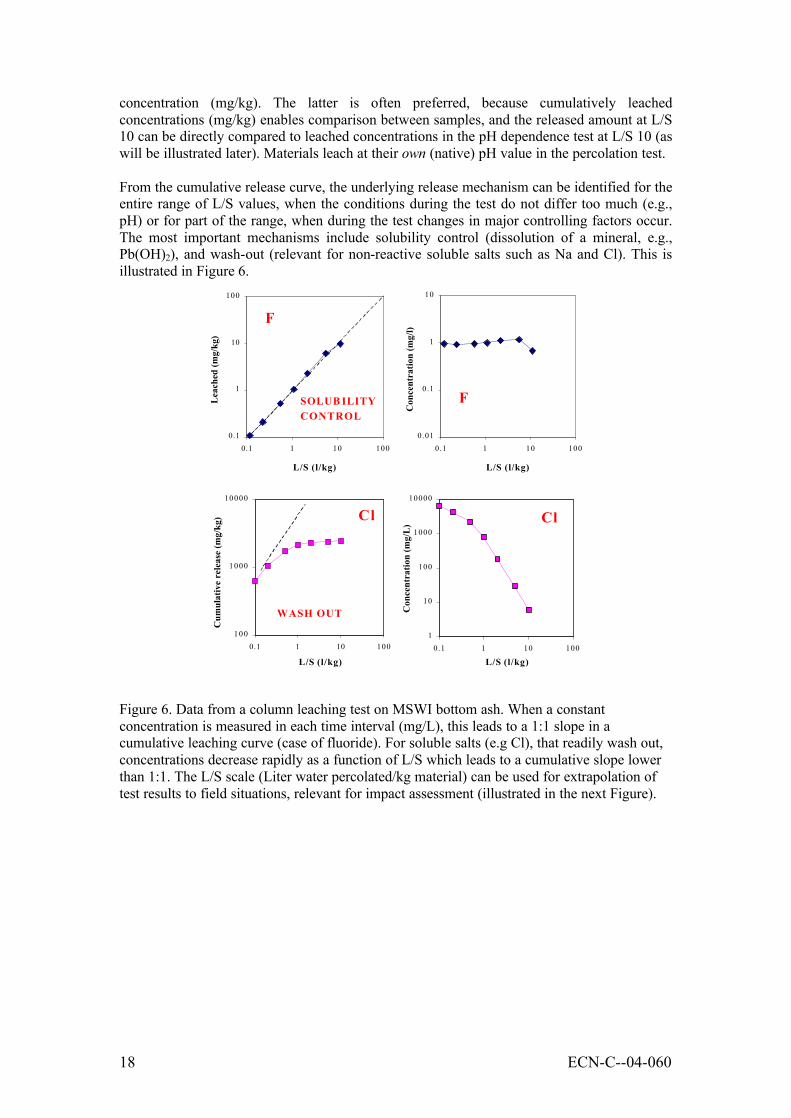
concentration (mg/kg). The latter is often preferred, because cumulatively leached concentrations (mg/kg) enables comparison between samples, and the released amount at L/S 10 can be directly compared to leached concentrations in the pH dependence test at L/S 10 (as will be illustrated later). Materials leach at their own (native) pH value in the percolation test. From the cumulative release curve, the underlying release mechanism can be identified for the entire range of L/S values, when the conditions during the test do not differ too much (e.g., pH) or for part of the range, when during the test changes in major controlling factors occur. The most important mechanisms include solubility control (dissolution of a mineral, e.g., Pb(OH)2), and wash-out (relevant for non-reactive soluble salts such as Na and Cl). This is illustrated in Figure 6.
Figure 6. Data from a column leaching test on MSWI bottom ash. When a constant concentration is measured in each time interval (mg/L), this leads to a 1:1 slope in a cumulative leaching curve (case of fluoride). For soluble salts (e.g Cl), that readily wash out, concentrations decrease rapidly as a function of L/S which leads to a cumulative slope lower than 1:1. The L/S scale (Liter water percolated/kg material) can be used for extrapolation of test results to field situations, relevant for impact assessment (illustrated in the next Figure).
0.1
1
10
100
0.1 1 10 100
L/S (l/kg)
Lea
ched
(mg/
kg)
F
SOLUB ILITY CONTROL
0.01
0.1
1
10
0.1 1 10 100
L/S (l/kg)
Con
cent
ratio
n (m
g/l)
F
100
1000
10000
0.1 1 10 100
L/S (l/kg)
Cum
ulat
ive
rele
ase
(mg/
kg) Cl
WASH OUT
1
10
100
1000
10000
0.1 1 10 100
L/S (l/kg)
Con
cent
ratio
n (m
g/L
) Cl
ECN-C--04-060 19
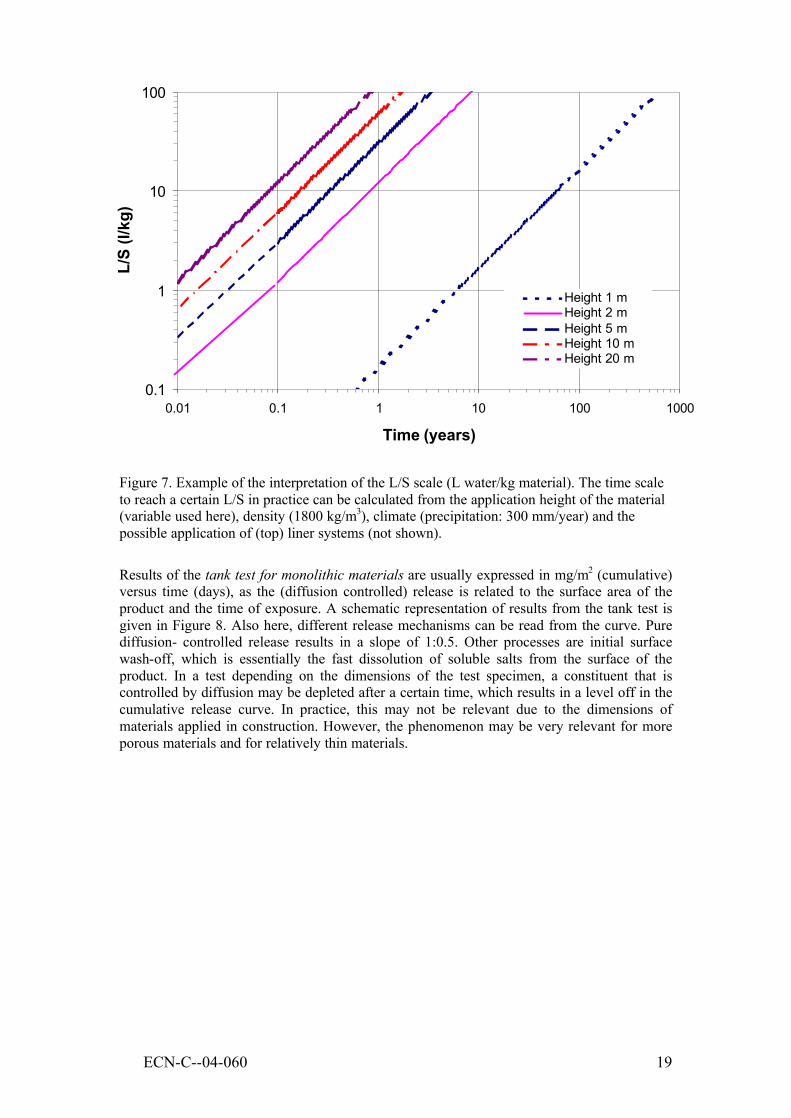
Figure 7. Example of the interpretation of the L/S scale (L water/kg material). The time scale to reach a certain L/S in practice can be calculated from the application height of the material (variable used here), density (1800 kg/m3), climate (precipitation: 300 mm/year) and the possible application of (top) liner systems (not shown).
Results of the tank test for monolithic materials are usually expressed in mg/m2 (cumulative) versus time (days), as the (diffusion controlled) release is related to the surface area of the product and the time of exposure. A schematic representation of results from the tank test is given in Figure 8. Also here, different release mechanisms can be read from the curve. Pure diffusion- controlled release results in a slope of 1:0.5. Other processes are initial surface wash-off, which is essentially the fast dissolution of soluble salts from the surface of the product. In a test depending on the dimensions of the test specimen, a constituent that is controlled by diffusion may be depleted after a certain time, which results in a level off in the cumulative release curve. In practice, this may not be relevant due to the dimensions of materials applied in construction. However, the phenomenon may be very relevant for more porous materials and for relatively thin materials.
0.1
1
10
100
0.01 0.1 1 10 100 1000
Time (years)
L/S
(l/kg
)
Height 1 mHeight 2 mHeight 5 mHeight 10 mHeight 20 m
ECN-C--04-060 20
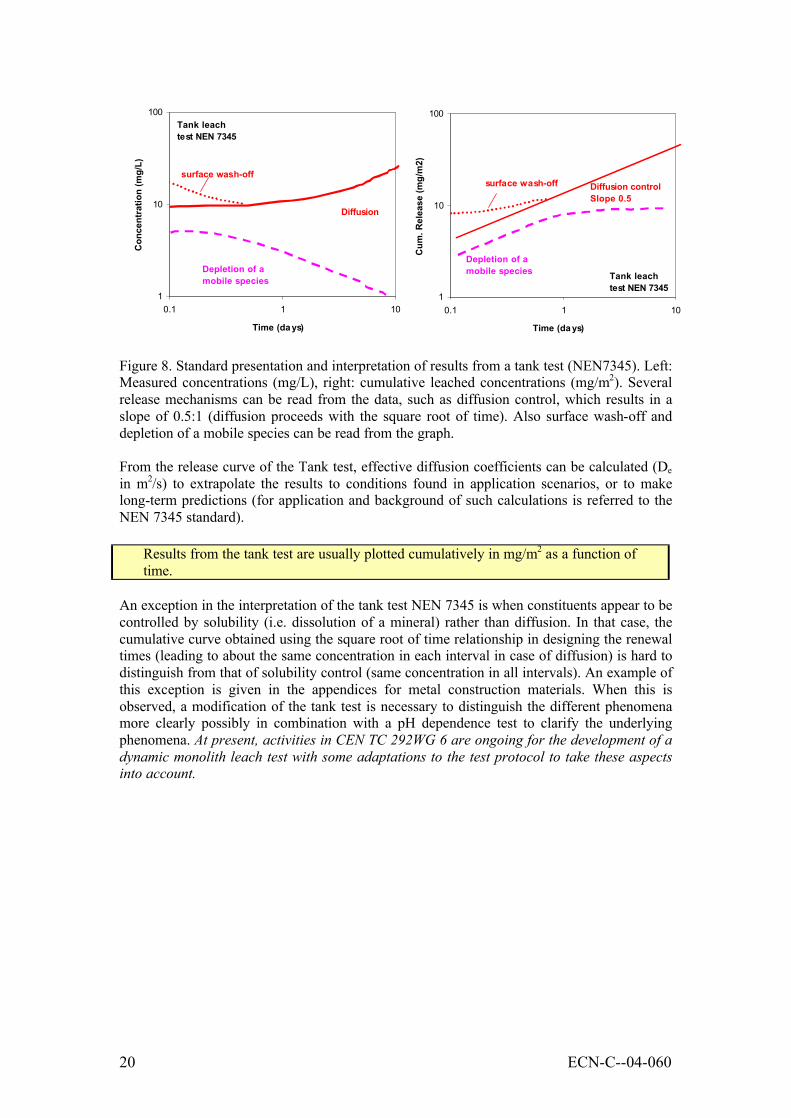
Figure 8. Standard presentation and interpretation of results from a tank test (NEN7345). Left: Measured concentrations (mg/L), right: cumulative leached concentrations (mg/m2). Several release mechanisms can be read from the data, such as diffusion control, which results in a slope of 0.5:1 (diffusion proceeds with the square root of time). Also surface wash-off and depletion of a mobile species can be read from the graph. From the release curve of the Tank test, effective diffusion coefficients can be calculated (De in m2/s) to extrapolate the results to conditions found in application scenarios, or to make long-term predictions (for application and background of such calculations is referred to the NEN 7345 standard).
An exception in the interpretation of the tank test NEN 7345 is when constituents appear to be controlled by solubility (i.e. dissolution of a mineral) rather than diffusion. In that case, the cumulative curve obtained using the square root of time relationship in designing the renewal times (leading to about the same concentration in each interval in case of diffusion) is hard to distinguish from that of solubility control (same concentration in all intervals). An example of this exception is given in the appendices for metal construction materials. When this is observed, a modification of the tank test is necessary to distinguish the different phenomena more clearly possibly in combination with a pH dependence test to clarify the underlying phenomena. At present, activities in CEN TC 292WG 6 are ongoing for the development of a dynamic monolith leach test with some adaptations to the test protocol to take these aspects into account.
Results from the tank test are usually plotted cumulatively in mg/m2 as a function of time.
1
10
100
0.1 1 10
Time (da ys)
Con
cent
ratio
n (m
g/L)
Diffusion
Depletion of a mobile species
Tank leach test NEN 7345
surface wash-off
1
10
100
0.1 1 10
Time (da ys)
Cum
. Rel
ease
(mg/
m2)
Diffusion control Slope 0.5
Depletion of a mobile species Tank leach
test NEN 7345
surface wash-off
ECN-C--04-060 21
4 RELEASE MECHANISMS FOR MINERAL CON-STRUCTION PRODUCTS AND OTHER CONSTRUC- TION MATERIALS.
Below, an outlook will be given on the possibilities for the application of the leaching test framework for construction materials such as concrete and brick, but also asphalt, (preserved) wood, metals used in roof construction or in drinking water applications and synthetic materials. It is hypothesized that the release mechanisms discussed before are not different from the mechanisms that are already addressed; that would allow us to use the same testing framework for these materials also. The next step is to evaluate if the test methods presented here do provide sufficient information to answer specific questions in the different fields of applications; that evaluation is given in chapter 7.
To justify the above hypothesis, we briefly investigated the release behaviour of a number of widely different materials in the laboratory as well as by a literature search. The materials investigated are of the category "monolithic". Where possible, characterization test methods discussed before are used, such as a pH dependence test (PrEN14429) or a tank test (diffusion test) (NEN7345). In some of the examples, exact and complete data were not available at present. In those cases we made a more qualitative interpretation of the data using reported pH values and concentration/time plots. For a number of materials, a more detailed analysis was made, which is given in the appendices. The materials investigated are summarized in Table 2.
Table 2. Construction products that are discussed here and test methods, of which results are shown.
Product Method Where illustrated/discussed: concrete drinking water (dw) pipe NEN 7345 (Tank test) here Regular Portland cement mortar NEN 7345 (Tank test) here and chapter 1 Blast Furnace slag- cement mortar NEN 7345 (Tank test) here and chapter 1 Sintered brick NEN 7345 (Tank test) here Asphalt concrete NEN 7345 (Tank test) here Preserved wood NEN 7345 (Tank test)
+ shower test; EN1250-2 here and appendix 1
Synthetic materials ATA test Appendix 2 Construction metals (roof metals) NEN 7345 (Tank test)
+ field measurements Appendix 3
Copper drinking water pipes NEN 7345 (Tank test) + field measurements
Appendix 4
Hypothesis: The release mechanisms of mineral construction products (concrete, brick, asphalt, aggregates, sand) are the same as those in other materials (synthetic, wood, metal) or alternative materials. This similarity allows the use of similar approaches and similar test methods for these construction products.
ECN-C--04-060 22
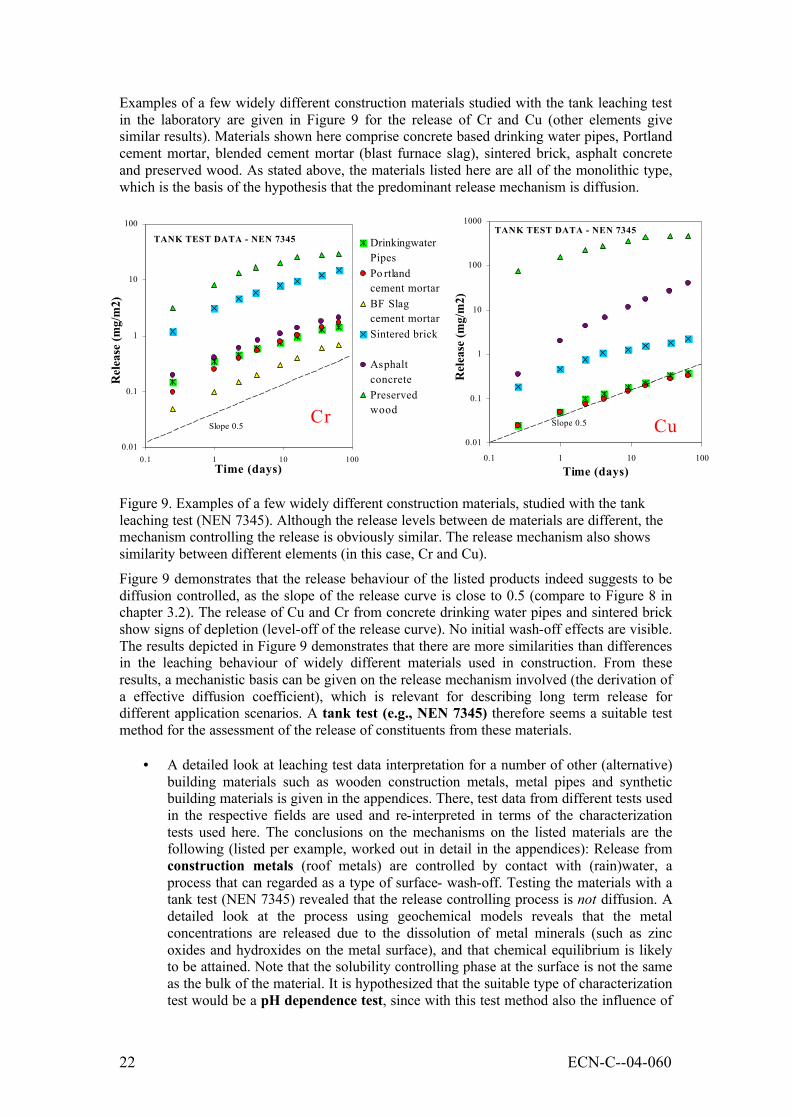
Examples of a few widely different construction materials studied with the tank leaching test in the laboratory are given in Figure 9 for the release of Cr and Cu (other elements give similar results). Materials shown here comprise concrete based drinking water pipes, Portland cement mortar, blended cement mortar (blast furnace slag), sintered brick, asphalt concrete and preserved wood. As stated above, the materials listed here are all of the monolithic type, which is the basis of the hypothesis that the predominant release mechanism is diffusion.
Figure 9. Examples of a few widely different construction materials, studied with the tank leaching test (NEN 7345). Although the release levels between de materials are different, the mechanism controlling the release is obviously similar. The release mechanism also shows similarity between different elements (in this case, Cr and Cu).
Figure 9 demonstrates that the release behaviour of the listed products indeed suggests to be diffusion controlled, as the slope of the release curve is close to 0.5 (compare to Figure 8 in chapter 3.2). The release of Cu and Cr from concrete drinking water pipes and sintered brick show signs of depletion (level-off of the release curve). No initial wash-off effects are visible. The results depicted in Figure 9 demonstrates that there are more similarities than differences in the leaching behaviour of widely different materials used in construction. From these results, a mechanistic basis can be given on the release mechanism involved (the derivation of a effective diffusion coefficient), which is relevant for describing long term release for different application scenarios. A tank test (e.g., NEN 7345) therefore seems a suitable test method for the assessment of the release of constituents from these materials.
• A detailed look at leaching test data interpretation for a number of other (alternative) building materials such as wooden construction metals, metal pipes and synthetic building materials is given in the appendices. There, test data from different tests used in the respective fields are used and re-interpreted in terms of the characterization tests used here. The conclusions on the mechanisms on the listed materials are the following (listed per example, worked out in detail in the appendices): Release from construction metals (roof metals) are controlled by contact with (rain)water, a process that can regarded as a type of surface- wash-off. Testing the materials with a tank test (NEN 7345) revealed that the release controlling process is not diffusion. A detailed look at the process using geochemical models reveals that the metal concentrations are released due to the dissolution of metal minerals (such as zinc oxides and hydroxides on the metal surface), and that chemical equilibrium is likely to be attained. Note that the solubility controlling phase at the surface is not the same as the bulk of the material. It is hypothesized that the suitable type of characterization test would be a pH dependence test, since with this test method also the influence of
0.01
0.1
1
10
100
0.1 1 10 100Time (days)
Rel
ease
(mg/
m2)
DrinkingwaterPipesPo rtlandcement mortarBF Slagcement mortarSintered brick
AsphaltconcretePreservedwoodCr
Slope 0.5
TANK TEST DATA - NEN 7345
0.01
0.1
1
10
100
1000
0.1 1 10 100
Time (days)R
elea
se (m
g/m
2)
CuSlope 0.5
TANK TEST DATA - NEN 7345
ECN-C--04-060 23
factors such as acid components in rain (pH dependence!) can be assessed. Used data sources: RIZA research (RIZA 2003) and experimental data of ECN (unpublished).
• The release of copper in copper drinking water pipes is similar to that of other
construction metals. Also here, copper is released most likely due to the dissolution of copper minerals such as malachite. We suggest that the most suitable type of testing to investigate the maximum concentrations in drinking water is a pH dependence test, as the maximum concentrations that are attained in the (drinking) water are dependent on pH of the water and complexing agents such as (traces of) humic material. The latter can be added to the test water; then, the effect of different water qualities can be investigated by conducting a few pH dependence tests. There is a time effect (concentrations build-up) visible in the data (equilibrium is attained after about 20 hours). Because water producers are interested in these effects, a test that incorporates such processes, as the one applied in the example (see appendix), is still necessary to investigate this process. A tank-test type of test (including a number of refreshments) is suitable for this, but does not give a 1:1 relationship with the plateau concentration as it is established with the test used by the authors. The used data source is KIWA research (KIWA 1990).
• The release of constituents from preservative treated wood is a diffusion controlled
process. The pH dependency of leaching was tested on milled wood samples; it was demonstrated that the pH determines how released concentrations depend on (environmental) pH. Used data source is TNO and ECN research (Esser et al. 2001).
• The release of organics and inorganic substances from synthetic material is probably
diffusion controlled. The most suitable way of testing is a Tank test, possibly adapted to prevent adsorption of organics to laboratory materials (glass etc.). Not much data was available at present, but some valuable examples were found in RIZA (RIZA 2003) and KIWA research reports (KIWA 1990). It is recommended that the release is tested by a Tank test in the laboratory to confirm the applicability of this test method.
From the above, it can be concluded that the release mechanisms are similar for a large group of materials. Of the metals investigated, construction metals (plates, plumbing) appear to be somewhat exceptional. Although their shape and geometry suggest that they can be assessed as "monolithic materials", the release controlling process is not diffusion. Instead, the release is apparently controlled by the dissolution of (metal) minerals upon contact with water (solubility control). The process can therefore be regarded as a specific kind of "surface wash-off". Because the pH of rainwater may vary (RIZA, 2003) and also of drinking water (KIWA, 1990), a pH dependence test provides the necessary information (i.e. concentrations in runoff rainwater or in drinking water). A quantification of the rate at which these processes proceed is necessary; this is in particular relevant for metal drinking water pipes because of the occurrence of "stagnant water" conditions, or a long stay in water metal distribution systems. The major findings regarding the importance of chemical and physical factors that control the release in a number of construction products are summarized in Table 3.

24
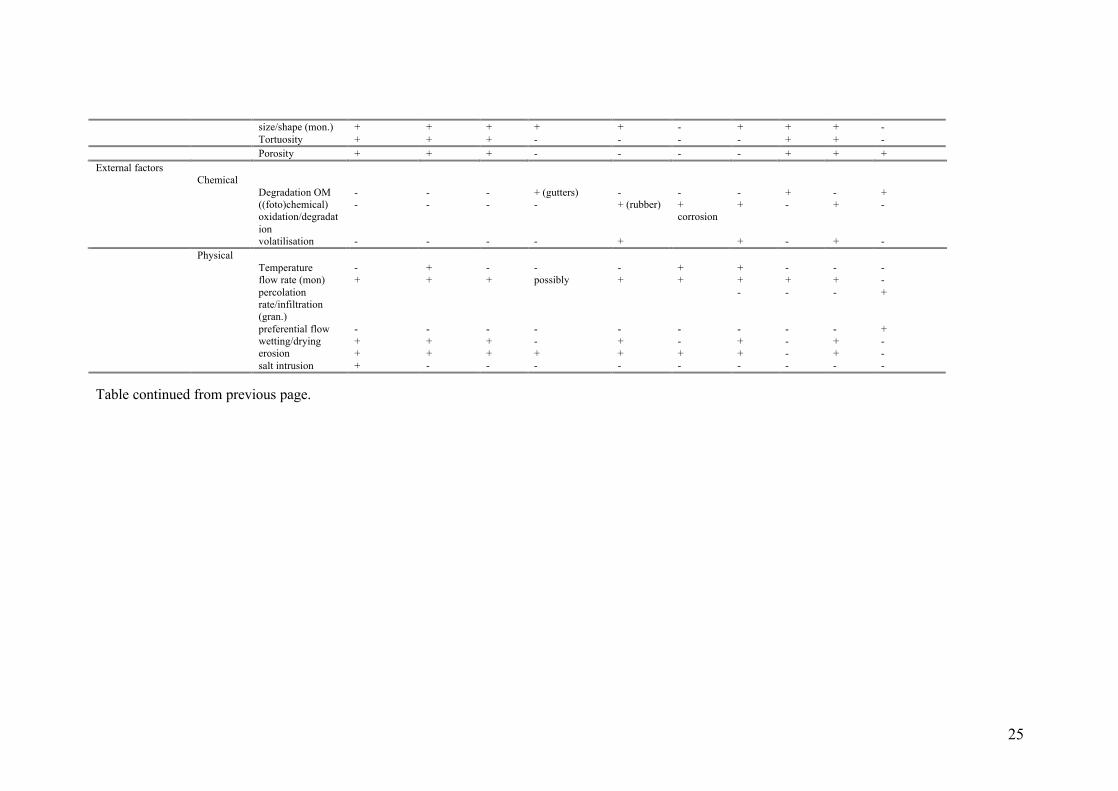
Table 3. Importance of chemical and physical factors on the release of inorganic constituents from a number of construction products (partially based on literature and EU projects). Elements listed at specific factors (e.g., redox) indicate that that factor is of specific importance for that element. The + and - signs indicate when a factor applies to the product and influences all relevant elements.
products >> (armoured) concrete
concr dw pipes brick
metal plates (e.g., roofs)
synthetic plates (e.g., roof material)
metal plumbing (e.g. dw pipes)
synthetic pipes (dw pipes)
treated wood
coated metal
granular (MSWI residue)
Basic Transport mechanism
Relevant elements (examples; other elements can be classified similarly)
Cr, V, As, salts
Cr, Al, V, salts Cr, Mo, Pb, Cu, Zn, Al Pb, Zn
Cu, Zn, Pb Pb, Zn
Cu, As, Cr
Cu, Zn, Cd, Pb
Zn, Mo, Cu, salts
Diffusion Cr, V, As Cr, V, As Cr, Mo - + - + + + - Percolation - - - - - - - - + Surface run-off salts salts - + * + +* - - possibly Basic Chemical mechanism
Solubility control V, Cr, As Cr, Al, V Cr, Mo + - + - - - Zn, Cu, Mo sorption control - - - - possibly - - possibl
y possibly
Zn, Cu, Mo (aged material)
total content salts salts Cr, Mo - + - + + - salts Material and/or environmental factors
Chemical
pH (range) 12-13 6-13 5-8 5-8 - 5-8 - 5-8 - 8-12 ANC carbonation carb. - - - - - - - carbonation redox Cr Cr - - - - - Cr(III) - total composition salts salts Cr, Mo - + - + + + chemical form Cr Cr Cr - - - - - organic matter - Al - + + + - Cu, Cr - Cu, Zn salt strength Cr, V, As Cr, Al, V - - - - - - + time (diffusion or
dissolution kinetics)
salts salts Cr, Mo possibly + + + + + -
Physical Granular - - - - - - - - - + Monolith/plate + + + + + + + + + - part. size (gran.) - - - - - - - - - + permeability
(gran.) - - - - - - - - - +
25
size/shape (mon.) + + + + + - + + + - Tortuosity + + + - - - - + + - Porosity + + + - - - - + + + External factors Chemical Degradation OM - - - + (gutters) - - - + - + ((foto)chemical)
oxidation/degradation
- - - - + (rubber) + corrosion
+ - + -
volatilisation - - - - + + - + - Physical Temperature - + - - - + + - - - flow rate (mon) + + + possibly + + + + + - percolation
rate/infiltration (gran.)
- - - +
preferential flow - - - - - - - - - + wetting/drying + + + - + - + - + - erosion + + + + + + + - + - salt intrusion + - - - - - - - - - Table continued from previous page.

26
5 REPEATABILITY AND BANDWIDTH Repeatability and consistency of test results is an important issue for quality control. Test results for an individual material should be similar each time they are tested (e.g., which may be checked by compliance testing). Absolute differences in test results (but still consistent in behaviour) may be caused by (e.g.):
• Different process conditions during production (e.g., temperature, different installations)
• Different raw materials from which the products are made; • Variety in the properties of (one of) the raw materials from which an individual
product is made. The above demonstrate why repeatability is an important issue not only from environmental and regulatory point of view, but also for producers. As an example, results are shown of the repeatability of the tank test (diffusion test NEN 7245) on standard BCR (Bureau Communotaire de Reference) cement mortars (van der Sloot et al, 1995) in Figure 10. The figure shows graphical results of a 10 times repeated diffusion test for Ba and SO4 (as an example, other elements show a similar repeatability). From the results can be concluded that the repeatability is found to be excellent (standard deviation within 5 - 10 %).
Figure 10. Excellent repeatability of the Tank test (NEN 7345) on standard BCR cement mortars (n = 10).
Table 4 shows the average and standard deviation of the final cumulative released amounts (mg/m2) for a broad spectrum of elements for
• Repeated testing of an individual sample (standard BCR mortar), n = 10; • Test results for different samples but within one cement plant (n = 3); • Test results from different cement mortars of different facilities (n = 29).
The results in Table 4 show that the standard deviation is within 5 - 10% for an individual sample for a wide range of elements (test repeatability). The standard deviation tends to increase when different mortars from one cement plant are investigated up to about 50%; between different facilities, standard deviations of about 100% are found (a factor 2). The observed differences between different samples and facilities are likely to originate from different process conditions and/or different raw materials.
1
10
100
0.01 0.1 1 10 100Time (days)
Cum
. rel
ease
, [B
a] (m
g/m
²)
BCR 1
BCR 10
BCR 2
BCR 3
BCR 4
BCR 5
BCR 6
Ba
10
100
1000
0.01 0.1 1 10 100Time (days)
S as SO4
27
Table 4. Repeatability and bandwidth of tank test results (NEN 7345) for an individual BCR cement mortar (illustrates test repeatability); different mortars from one cement plant and mortars from different cement plants.
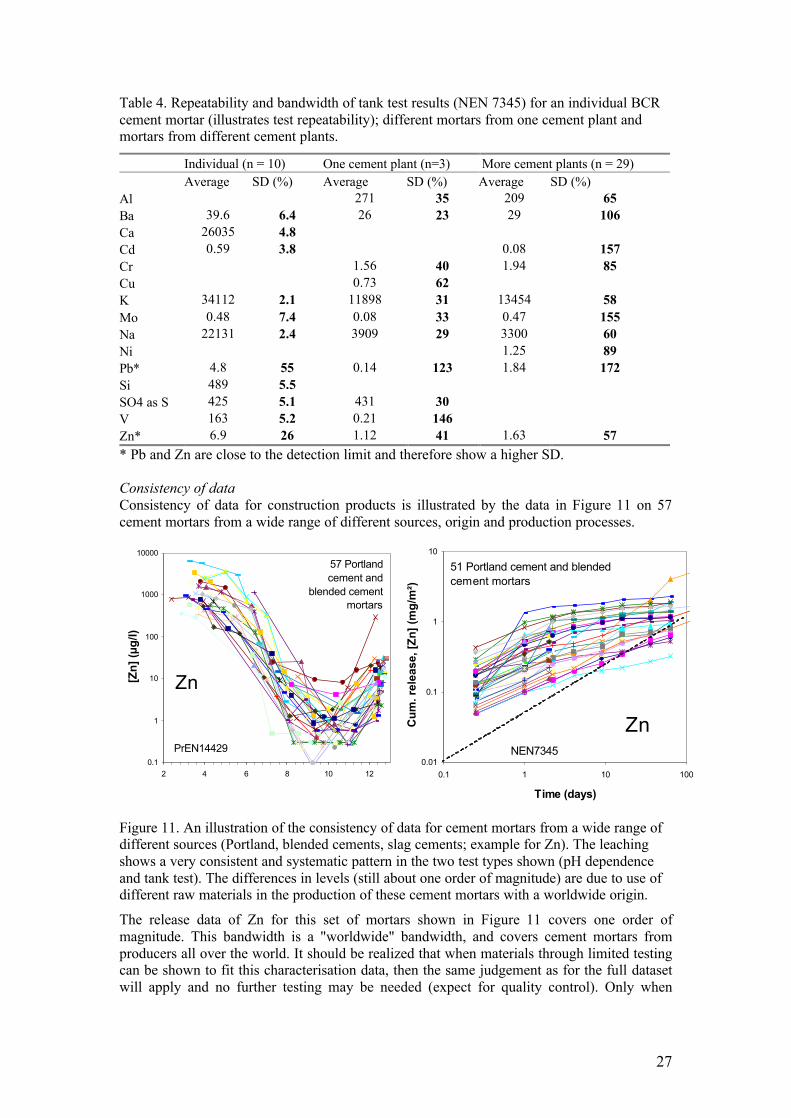
Individual (n = 10) One cement plant (n=3) More cement plants (n = 29) Average SD (%) Average SD (%) Average SD (%) Al 271 35 209 65 Ba 39.6 6.4 26 23 29 106 Ca 26035 4.8 Cd 0.59 3.8 0.08 157 Cr 1.56 40 1.94 85 Cu 0.73 62 K 34112 2.1 11898 31 13454 58 Mo 0.48 7.4 0.08 33 0.47 155 Na 22131 2.4 3909 29 3300 60 Ni 1.25 89 Pb* 4.8 55 0.14 123 1.84 172 Si 489 5.5 SO4 as S 425 5.1 431 30 V 163 5.2 0.21 146 Zn* 6.9 26 1.12 41 1.63 57 * Pb and Zn are close to the detection limit and therefore show a higher SD. Consistency of data Consistency of data for construction products is illustrated by the data in Figure 11 on 57 cement mortars from a wide range of different sources, origin and production processes.
Figure 11. An illustration of the consistency of data for cement mortars from a wide range of different sources (Portland, blended cements, slag cements; example for Zn). The leaching shows a very consistent and systematic pattern in the two test types shown (pH dependence and tank test). The differences in levels (still about one order of magnitude) are due to use of different raw materials in the production of these cement mortars with a worldwide origin.
The release data of Zn for this set of mortars shown in Figure 11 covers one order of magnitude. This bandwidth is a "worldwide" bandwidth, and covers cement mortars from producers all over the world. It should be realized that when materials through limited testing can be shown to fit this characterisation data, then the same judgement as for the full dataset will apply and no further testing may be needed (expect for quality control). Only when
0.1
1
10
100
1000
10000
2 4 6 8 10 12
[Zn]
(µg/
l)
Zn
57 Portland cement and
blended cement mortars
PrEN144290.01
0.1
1
10
0.1 1 10 100
Time (days)
Cum
. rel
ease
, [Zn
] (m
g/m
²)
51 Portland cement and blended cement mortars
ZnNEN7345

28
process conditions or raw materials change, the overall leaching behaviour may change accordingly. The mortars shown in Figure 11 are produced using different raw materials, different process conditions etc. When criteria are set for, e.g., maximum allowed release in a tank test, some of the samples shown may comply and others may not - this depends on the criteria set.
29
6 HIERARCHY IN TESTING The need for methods that provide insight into the underlying release processes of all sorts of materials (including construction products) is growing. Too simple methods, like a single step extraction, lack the finesses needed to make proper judgements, given the complexity of factors that play a role in an environmental impact evaluation. A key element in all areas is the wish to obtain results that reflect as much as possible a measure of true impact on both short and long term. A combination of characterisation of material behaviour, with more simplified testing (compliance testing) for verification and quality control purposes, can provide the necessary understanding and at the same time, limits the need for testing when the level of knowledge is sufficient and/or the variability in quality needs to be assessed (Kosson et al., 2002). The tiered framework of testing methods, developed in CEN TC 292, has proven its applicability for a wide variety of alternative and waste materials to provide the necessary insight. Such a hierarchy in testing would largely be suitable for construction materials as it couples a generic approach at characterisation level with compliance or verification methods at material specific level. 1. Characterization tests are tests primarily used for basic characterization of the release
behaviour of the material. This data allows for the assessment of materials by categories based on common controlling characteristics and therefore reduces the number of materials within a category that require characterization. The data can be used for:
• Judgement if a material in a certain application scenario fulfils criteria; • Insight in the release mechanisms under a variety of environmental conditions
and application scenarios; • Characterisation of potential variability in measured values, by repeating tests on
a certain (type of) material. Knowledge of the chemical and physical factors (chapter 2) may provide insight in the cause of spreading in measurements (relevant for producers).
• Characterisation of the expected range (maximum and minimum) release under "field" conditions (in a certain application scenario);
• Characterisation with the purpose of quality improvement of the product. Characterisation tests, in combination with insight in release mechanisms, provide knowledge with which specific properties of the material can be altered/improved.
• Characterisation of the relation between characterisation tests and compliance tests (see below).
2. Compliance tests have the purpose to "check" whether a material (still) complies with
the behaviour of a reference material (tested with a characterization test) and/or comply with regulations. Because of its simplicity, compliance testing has practical and financial advantages. Once the leaching behaviour has been investigated by a characterization test, a single measurement is sufficient to check whether the material still complies with this behaviour or that the behaviour has undergone significant changes.
3. On-site verification/Quality control tests have the purpose to determine quickly (within a short time) if a material (or conditions) complies with earlier determined or expected behaviour in its practical application. In general only administrative checks will be done and visual control. Quick test methods for on site verification can only give an impression on some specific points. For a real confident chemical check for on site verification , in general at least a full compliance test should be done.
30
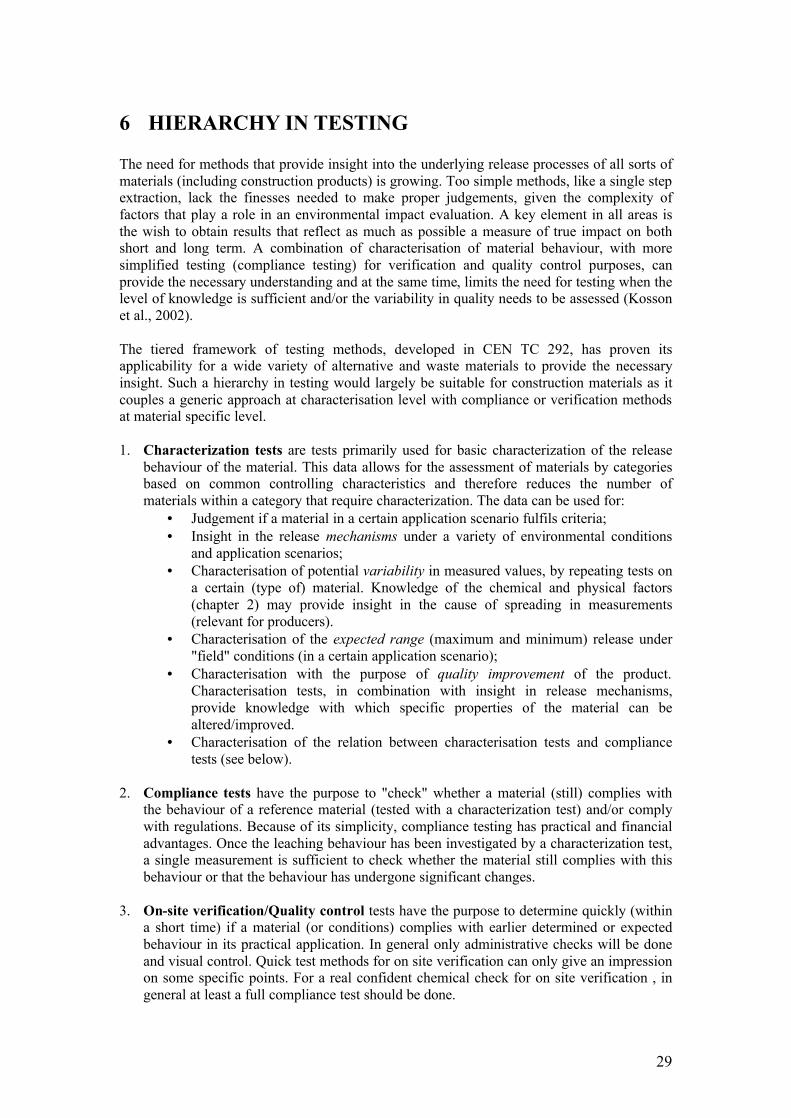
6.1 Example of the relation between characterization tests and compliance tests Once a characterization step as sketched above is done, much more simplified testing (compliance level) can be chosen to verify the consistency of subsequent data with the characterisation test results. This is both time- and cost- efficient. Compliance testing has the purpose to "check" whether a material (still) complies with the behaviour of a reference material (tested with a characterization test) and/or complies with regulations. The compliance test used is EN12457-3 for granular materials, and consists essentially of measuring the leached amount (of Zn in the example) in a two step extraction at the pH imposed by the material itself. A concise leaching test consisting of leaching at low, neutral and high pH and a leaching step at low L/S (van der Sloot et al, 1994) has been carried out as well.
Figure 12. Example of the relationship between characterisation testing (PrEN14429 and PrEN14405) for MSWI bottom ash, the compliance leaching test for granular materials (PrEN12457-3) and a concise leaching test (Van der Sloot et al, 1994). The results of the compliance tests are shown with uncertainty margins derived from validation work (Van der Sloot et al, 2001).
MSW I-bottom-ash0.01
0.10
1.00
2 4 6 8 10 12
pH
Lea
ched
(mg/
kg)
MSWI BA -A < 2mm MSWI BA -A < 4mmBA-B BA-CBA-D BA-E
Mo0.01
0.1
1
0.1 1 10L/S (l/kg)
Lea
ched
mg/
kg (c
umul
ativ
e)
MSWI BA-A MSWI BA -DConcise LS=10 Concise LS=1EN 12457-3
Mo
31
7 IMPACT ASSESSMENT
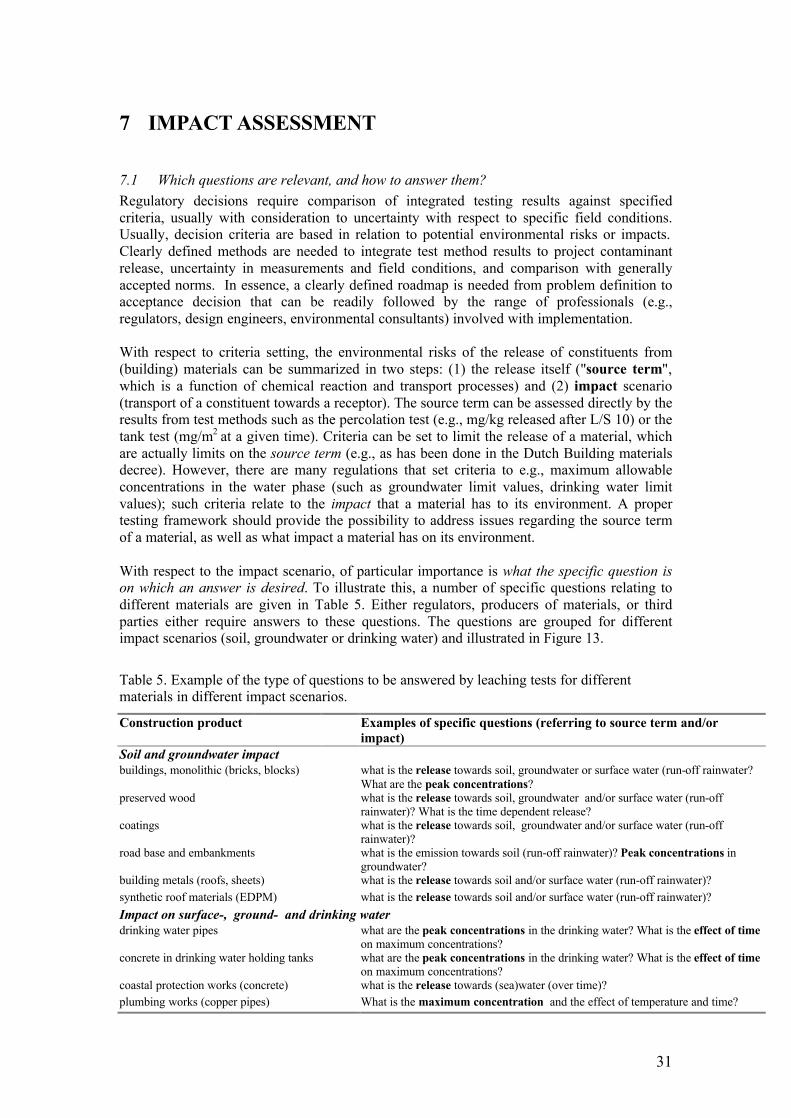
7.1 Which questions are relevant, and how to answer them? Regulatory decisions require comparison of integrated testing results against specified criteria, usually with consideration to uncertainty with respect to specific field conditions. Usually, decision criteria are based in relation to potential environmental risks or impacts. Clearly defined methods are needed to integrate test method results to project contaminant release, uncertainty in measurements and field conditions, and comparison with generally accepted norms. In essence, a clearly defined roadmap is needed from problem definition to acceptance decision that can be readily followed by the range of professionals (e.g., regulators, design engineers, environmental consultants) involved with implementation. With respect to criteria setting, the environmental risks of the release of constituents from (building) materials can be summarized in two steps: (1) the release itself ("source term", which is a function of chemical reaction and transport processes) and (2) impact scenario (transport of a constituent towards a receptor). The source term can be assessed directly by the results from test methods such as the percolation test (e.g., mg/kg released after L/S 10) or the tank test (mg/m2 at a given time). Criteria can be set to limit the release of a material, which are actually limits on the source term (e.g., as has been done in the Dutch Building materials decree). However, there are many regulations that set criteria to e.g., maximum allowable concentrations in the water phase (such as groundwater limit values, drinking water limit values); such criteria relate to the impact that a material has to its environment. A proper testing framework should provide the possibility to address issues regarding the source term of a material, as well as what impact a material has on its environment. With respect to the impact scenario, of particular importance is what the specific question is on which an answer is desired. To illustrate this, a number of specific questions relating to different materials are given in Table 5. Either regulators, producers of materials, or third parties either require answers to these questions. The questions are grouped for different impact scenarios (soil, groundwater or drinking water) and illustrated in Figure 13.
Table 5. Example of the type of questions to be answered by leaching tests for different materials in different impact scenarios.
Construction product Examples of specific questions (referring to source term and/or impact)
Soil and groundwater impact buildings, monolithic (bricks, blocks) what is the release towards soil, groundwater or surface water (run-off rainwater?
What are the peak concentrations? preserved wood what is the release towards soil, groundwater and/or surface water (run-off
rainwater)? What is the time dependent release? coatings what is the release towards soil, groundwater and/or surface water (run-off
rainwater)? road base and embankments what is the emission towards soil (run-off rainwater)? Peak concentrations in
groundwater? building metals (roofs, sheets) what is the release towards soil and/or surface water (run-off rainwater)? synthetic roof materials (EDPM) what is the release towards soil and/or surface water (run-off rainwater)? Impact on surface-, ground- and drinking water drinking water pipes what are the peak concentrations in the drinking water? What is the effect of time
on maximum concentrations? concrete in drinking water holding tanks what are the peak concentrations in the drinking water? What is the effect of time
on maximum concentrations? coastal protection works (concrete) what is the release towards (sea)water (over time)? plumbing works (copper pipes) What is the maximum concentration and the effect of temperature and time?
32
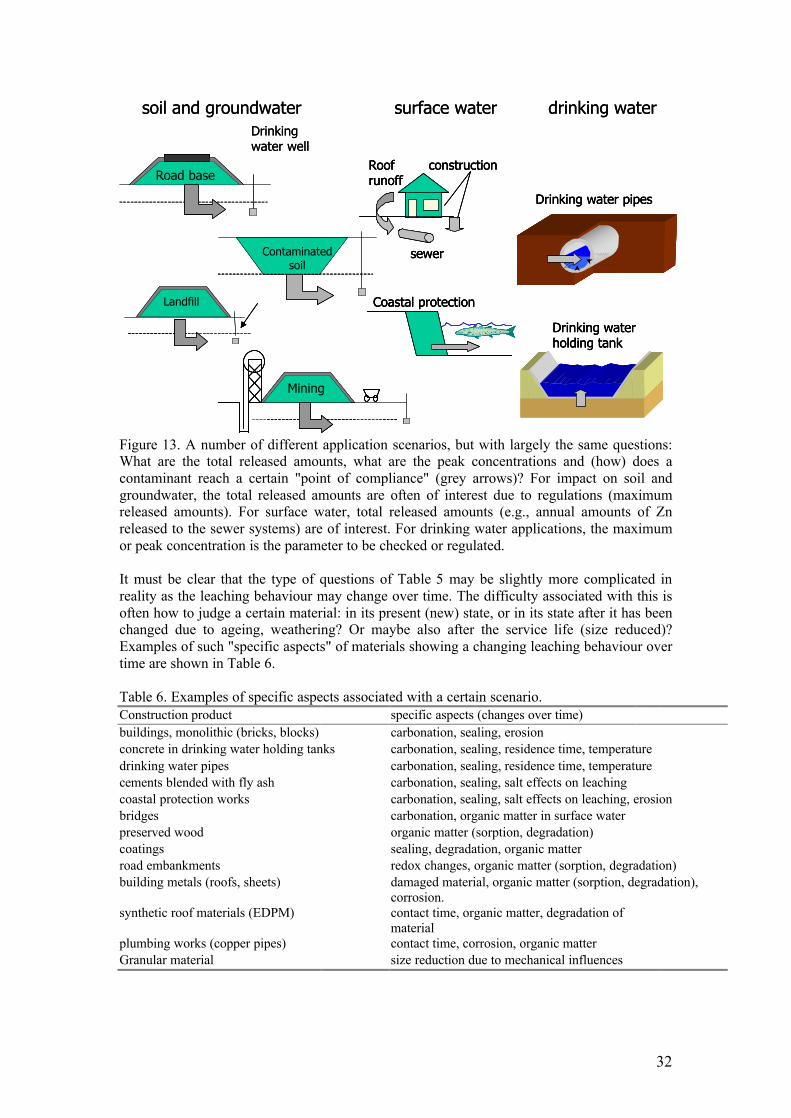
Figure 13. A number of different application scenarios, but with largely the same questions: What are the total released amounts, what are the peak concentrations and (how) does a contaminant reach a certain "point of compliance" (grey arrows)? For impact on soil and groundwater, the total released amounts are often of interest due to regulations (maximum released amounts). For surface water, total released amounts (e.g., annual amounts of Zn released to the sewer systems) are of interest. For drinking water applications, the maximum or peak concentration is the parameter to be checked or regulated. It must be clear that the type of questions of Table 5 may be slightly more complicated in reality as the leaching behaviour may change over time. The difficulty associated with this is often how to judge a certain material: in its present (new) state, or in its state after it has been changed due to ageing, weathering? Or maybe also after the service life (size reduced)? Examples of such "specific aspects" of materials showing a changing leaching behaviour over time are shown in Table 6. Table 6. Examples of specific aspects associated with a certain scenario. Construction product specific aspects (changes over time) buildings, monolithic (bricks, blocks) carbonation, sealing, erosion concrete in drinking water holding tanks carbonation, sealing, residence time, temperature drinking water pipes carbonation, sealing, residence time, temperature cements blended with fly ash carbonation, sealing, salt effects on leaching coastal protection works carbonation, sealing, salt effects on leaching, erosion bridges carbonation, organic matter in surface water preserved wood organic matter (sorption, degradation) coatings sealing, degradation, organic matter road embankments redox changes, organic matter (sorption, degradation) building metals (roofs, sheets) damaged material, organic matter (sorption, degradation),
corrosion. synthetic roof materials (EDPM) contact time, organic matter, degradation of
material
plumbing works (copper pipes) contact time, corrosion, organic matter Granular material size reduction due to mechanical influences
Drinking water well
Landfill
Road base
Coastal protection
Contaminated soil
Mining
constructionRoof runoff
sewer
Drinking water holding tank
Drinking water pipes
surface watersoil and groundwater drinking waterDrinking water well
LandfillLandfill
Road baseRoad baseRoad base
Coastal protectionCoastal protection
Contaminated soil
Contaminated soil
MiningMiningMining
constructionRoof runoff
sewer
constructionRoof runoff
sewer
Drinking water holding tankDrinking water holding tank
Drinking water pipesDrinking water pipes
surface watersoil and groundwater drinking water
33
In this respect, the work of the CEN technical committee TC 292 deserves attention as many of the above named aspects have been discussed and can be 'captured' by the testing framework as discussed in this paper. The vast majority of the questions from Table 5 and Table 6 can already be answered using the results from (combinations of) the existing testing methodology (characterisation and compliance). This will not be illustrated extensively here, but the type of questions that can be answered are those who relate to:
• A leached quantity (mg/m2 or mg/kg material) of a product as function of pH (carbonation)
• A leached quantity (mg/m2 or mg/kg material) of a product as function of percolated water and/or a certain amount of water in contact with the product;
• Peak concentrations of the water in contact with a product (mg/L) after a certain time period or L/S ratio or flow rate (directly from the test results)
• Quality of groundwater below an application with a certain leaching behaviour (Annex II methodology; ENV 12920; see below)
• Effects of chemical changes over time of the product (e.g., carbonation, pH increase/decrease)
Some questions can not be answered directly, and require an adaptation in the test methods and/or geochemical and transport modelling is necessary:
• Effects of chemical changes of the environment (e.g., time scale, increased DOC concentrations, contact with seawater).
• Effects of physical changes of the environment (e.g., wetting/drying cycles) • The effect of "sealing" of concrete (pores on the outside of the product are sealed with
carbonate minerals), which results in a changing diffusivity and pore structure over time.
• Effects of chemical kinetics, such as the slow dissolution of minerals.
Below, an example is given on how an answer can be found for impact assessment using the data from a percolation test (PrEN14405) and a pH dependence test (PrEn 14429) for an application of a (granular) material having its impact on soil. Attention is paid to what the consequences are of material changes over time, due to carbonation. The material applied could for instance be an initially alkaline gravel type, steel slag or a MSWI bottom ash. Example: Impact on soil and groundwater
For impact on soil and groundwater (e.g., environmental impact from concrete structures or a granular road base), regulators may be interested in the total released amount (e.g., mg/m2 concrete surface area or mg/kg granular material) as well as the peak concentrations (mg/l) that may occur in groundwater. The total released amount is a parameter that is suitable to regulate, as it can be easily determined in the laboratory and can be read simply from the test results (tank test or percolation test), see therefore chapter 3. An example is given below.
Drinking water well
Road base
Drinking water well
Road baseRoad baseRoad baseContaminated
soilContaminated
soilLandfillLandfill
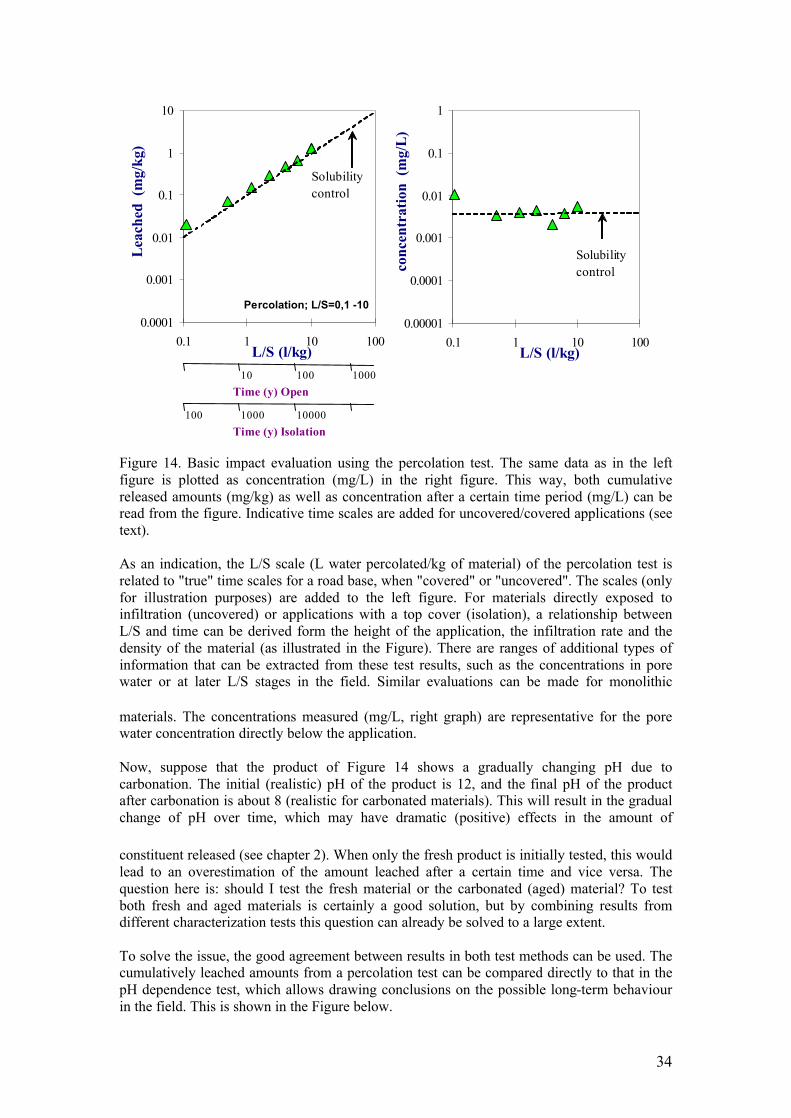
34
0.0001
0.001
0.01
0.1
1
10
0.1 1 10 100L/S (l/kg)
Lea
ched
(m
g/kg
)
Solubilitycontrol
Percolation; L/S=0,1 -10
0.00001
0.0001
0.001
0.01
0.1
1
0.1 1 10 100L/S (l/kg)
conc
entr
atio
n (m
g/L
)
Solubilitycontrol
Time (y) Open
Time (y) Isolation
100
1000
1000
10000
10
100
Figure 14. Basic impact evaluation using the percolation test. The same data as in the left figure is plotted as concentration (mg/L) in the right figure. This way, both cumulative released amounts (mg/kg) as well as concentration after a certain time period (mg/L) can be read from the figure. Indicative time scales are added for uncovered/covered applications (see text). As an indication, the L/S scale (L water percolated/kg of material) of the percolation test is related to "true" time scales for a road base, when "covered" or "uncovered". The scales (only for illustration purposes) are added to the left figure. For materials directly exposed to infiltration (uncovered) or applications with a top cover (isolation), a relationship between L/S and time can be derived form the height of the application, the infiltration rate and the density of the material (as illustrated in the Figure). There are ranges of additional types of information that can be extracted from these test results, such as the concentrations in pore water or at later L/S stages in the field. Similar evaluations can be made for monolithic
materials. The concentrations measured (mg/L, right graph) are representative for the pore water concentration directly below the application. Now, suppose that the product of Figure 14 shows a gradually changing pH due to carbonation. The initial (realistic) pH of the product is 12, and the final pH of the product after carbonation is about 8 (realistic for carbonated materials). This will result in the gradual change of pH over time, which may have dramatic (positive) effects in the amount of
constituent released (see chapter 2). When only the fresh product is initially tested, this would lead to an overestimation of the amount leached after a certain time and vice versa. The question here is: should I test the fresh material or the carbonated (aged) material? To test both fresh and aged materials is certainly a good solution, but by combining results from different characterization tests this question can already be solved to a large extent. To solve the issue, the good agreement between results in both test methods can be used. The cumulatively leached amounts from a percolation test can be compared directly to that in the pH dependence test, which allows drawing conclusions on the possible long-term behaviour in the field. This is shown in the Figure below.
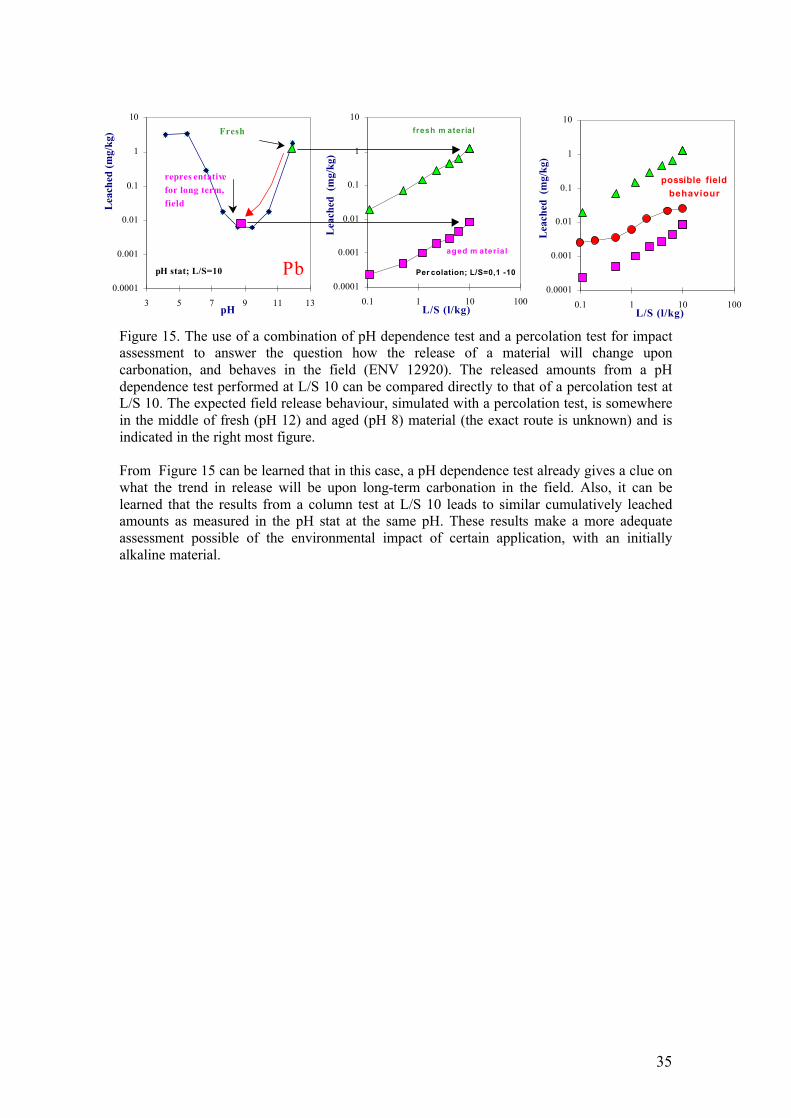
35
Figure 15. The use of a combination of pH dependence test and a percolation test for impact assessment to answer the question how the release of a material will change upon carbonation, and behaves in the field (ENV 12920). The released amounts from a pH dependence test performed at L/S 10 can be compared directly to that of a percolation test at L/S 10. The expected field release behaviour, simulated with a percolation test, is somewhere in the middle of fresh (pH 12) and aged (pH 8) material (the exact route is unknown) and is indicated in the right most figure. From Figure 15 can be learned that in this case, a pH dependence test already gives a clue on what the trend in release will be upon long-term carbonation in the field. Also, it can be learned that the results from a column test at L/S 10 leads to similar cumulatively leached amounts as measured in the pH stat at the same pH. These results make a more adequate assessment possible of the environmental impact of certain application, with an initially alkaline material.
0.0001
0.001
0.01
0.1
1
10
0.1 1 10 100L/S (l/kg)
Lea
ched
(m
g/kg
)
Per colation; L/S=0,1 -10
fresh m aterial
aged m aterial
Pb0.0001
0.001
0.01
0.1
1
10
3 5 7 9 11 13pH
Lea
ched
(mg/
kg)
pH stat; L/S=10
Fresh
repres entative for long term, field
0.0001
0.001
0.01
0.1
1
10
0.1 1 10 100L/S (l/kg)
Lea
ched
(m
g/kg
)
possible field behaviour
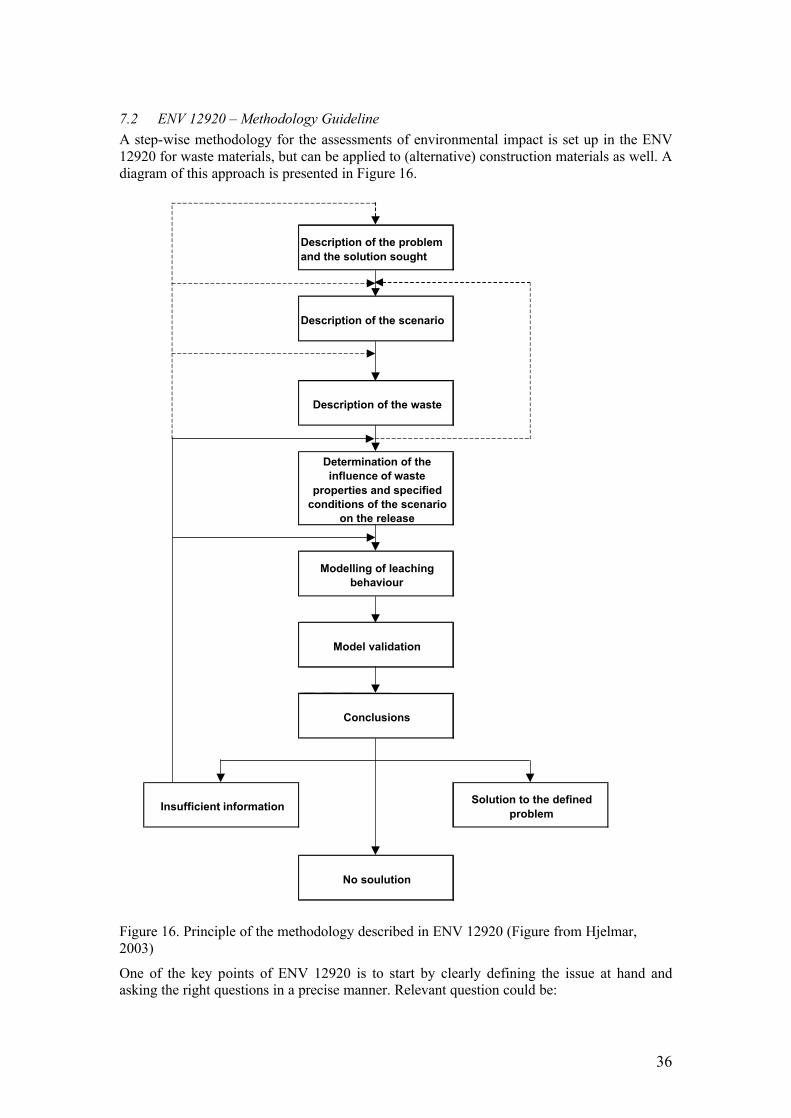
36
7.2 ENV 12920 – Methodology Guideline A step-wise methodology for the assessments of environmental impact is set up in the ENV 12920 for waste materials, but can be applied to (alternative) construction materials as well. A diagram of this approach is presented in Figure 16.
Figure 16. Principle of the methodology described in ENV 12920 (Figure from Hjelmar, 2003)
One of the key points of ENV 12920 is to start by clearly defining the issue at hand and asking the right questions in a precise manner. Relevant question could be:
Solution to the defined problem Insufficient information
Determination of the influence of waste
properties and specified conditions of the scenario
on the release
Modelling of leaching behaviour
Model validation
Conclusions
Description of the problem and the solution sought
Description of the scenario
Description of the waste
No soulution
37
• What is the flux of leached (specified) contaminants from a (specified) material in a (specified) utilisation scenario under (specified) climatic conditions as a function of time?
• How can the relationship between the resulting concentration of a contaminant in the environment and the result of a laboratory leaching test on the material used in the application be established?
Once the main question and the solutions sought are clearly defined, the methodology proceeds with technical descriptions of the application construction scenario and the surrounding environmental and climatic scenario, description of the geotechnical and chemical properties of the material, selection of the correct leaching methods to investigate the leaching properties as a function of L/S and pH as well as the influence of various internal material properties and external factors on the release of contaminants. When the appropriate results of the leaching tests have been procured, a suitable model describing the main question under investigation must be selected/developed, set up and run. If possible, the model should be validated, e.g. by lysimeter test results or field observations, before the final conclusions are drawn. The conclusions may be that the question is answered, that it cannot be solved or that it may be solved if more information is gathered at one or more stages of the procedure.
7.3 Step-Wise Impact Assessment Procedure Applied to Groundwater Quality Hjelmar (2003) presents a simplified step-wise impact assessment procedure (largely following on the ENV 12920), which can establish a direct relationship between the results of a leaching test performed on a alternative raw material to be used in a construction application and the quality of downstream groundwater, which is influenced by leachate from the alternative raw material, is presented. It is evident that many elements of this procedure apply to different types of scenarios as well, albeit with some minor modifications. The method may be used in a “forward mode” for site-specific environmental impact assessments, but it may also be used in a “backwards” mode to develop leaching limit values, which are associated with a certain level of protection of the downstream groundwater. The methodology has been used to develop the European leaching limit values for acceptance of waste at various types of landfills in accordance with the EU Landfill Directive. The method allows some flexibility in terms of choice of test methods, but it is very important that the mechanisms controlling the release of contaminants from the materials in question are identified correctly and that the test methods prescribed or used are consistent with this information. The following is a brief outline of the procedure followed (source: Hjelmar, 2003). In this context, the procedure is used to set limit values for a material to be used in a construction project. Only the impact on groundwater quality is considered. First a decision must be made concerning the primary target(s) or point(s) of compliance (POC), e.g. the downstream point(s) where the groundwater quality criteria must be fulfilled. Quality criteria are then selected for the groundwater and the physical characteristics of the construction project scenario and the environment scenario are selected and described. In the example of impact on groundwater shown before, concentrations measured at a "point of compliance" (e.g., a drinking water well) further downstream the application, are subject to dilution and attenuation in the subsoil. The latter factors determine the peak concentration in the groundwater. The environment scenario includes the net rate of infiltration and a hydro geological description of the unsaturated and saturated (aquifer) zones upstream, below and downstream of the construction application. The source of the various contaminants is subsequently
38
described in terms of the flux of contaminants as a function of time based on leaching data and the hydraulic scenario defined. Then the migration of the contaminants through the unsaturated zone into the groundwater and through the aquifer to the POC(s) is described with particular reference to the applicable Kd-values for each contaminant, which are used to calculate the retardation factors. The next step is to select and fit one or more models that can be used to describe the water flow and transport of contaminants from the base of the landfill through the unsaturated and saturated zones to the POC(s). The model calculations are carried out and “attenuation factors” (for granular materials the ratio between the source peak concentration and the peak concentration as modelled at the groundwater POC) are determined for each contaminant and POC. Next, the attenuation factors are then used for a “backwards” calculation of the values of the source term corresponding to the selected groundwater quality criteria for each contaminant at a particular POC. The final step consists of transforming the resulting source term criteria to a limit value for a specific leaching test. The step-wise procedure is summarised below: 1. Choice of primary target(s) and principles 2. Choice of critical parameters and primary criteria values 3. Description of the material application scenario 4. Description of the environment scenario 5. Description of the source of potential contamination 6. Description and modelling of the migration of the contaminants from the application
to the POC(s) 7. Performance of “forward” modelling to determine attenuation factors 8. Application of the results to criteria setting (“backwards” calculation) 9. Transformation of the source term criteria to limit values at different L/S values It should be noted that the procedure involves numerous simplifications and generalisations of complex and diverse physical-chemical processes. Only inorganic contaminants from largely inorganic materials are, for instance, considered. This is justified by the need to have an operational and relatively simple system, which can be used for the development of general criteria. Many of the technical details involved in this procedure are discussed in more detail in van der Sloot et al (2003) and Hjelmar et al (2001).

39
8 CONCLUSIONS
Leaching mechanisms - Focus on release mechanisms From the need to develop more transparent regulations, it appears to be of importance to emphasize release mechanisms instead of focusing on individual materials for test development. A short number of key mechanisms determine leaching from irrespective what material. For each material and each situation, a limited number of these key mechanisms determine the leaching levels in specific situations Leaching characteristics are not dependent on the formal state of a product or a material. Leaching characteristics are the same for materials used as primary material, used for recycling or materials handled as a waste material. The dominant characteristics may be the same or may differ, depending on the scenario of use of such a material. - Key processes Key processes, which should be identified in the test methods, are the
- Predominant physical transport processes (surface- wash off, diffusion, percolation) and
- Chemical mechanisms such as solubility controlled release (with the associated potential for prediction of long term behaviour).
Determination of leaching in specific situations. - Scenario approaches. To determine or predict leaching levels in specific situations, a ‘scenario description’ should be made for that situation. The leaching levels after a relevant period of time can be calculated/ predicted by including the results from the tests on the mechanisms. It is not necessary and not possible to develop test methods that in detail predict leaching in a certain situation; test results always have to be translated to a specific scenario. So it is not useful to just trying to develop a large number of test methods adapted for specific situations.
For a number of very different construction products, the release mechanisms are similar to that of mineral construction products. This allows the use of a unified approach of testing. A limited set of (existing) test methods, providing the necessary insight in release mechanisms, is recommended. Leaching of substances to soil and water can be explained and predicted for a large number of situations, using data from these leaching tests in combination with scenario approaches.
This report focuses on inorganic substances. Less information and experience is available on leaching of organic substances. However, it is evident that the major release mechanisms (percolation and diffusion) are similar for organics and inorganic substances.
40
- Methodology Many different questions on the release behaviour can already be answered using the existing testing methodology as described in ENV 12920. Harmonisation of test methods for understanding leaching mechanisms and determining leaching levels. Since a relative small number of characteristic mechanisms determine the leaching from materials, it is evident that with a small number of tests the needed information on leaching can be collected in an adequate way. Main leaching tests for understanding leaching mechanisms and determining leaching levels are: - percolation test - tank test - pH-dependence test For specific situations, above mentioned tests can technically be adapted, e.g. to determine the
leaching of (e.g.): - reducing materials or materials in reducing circumstances - volatile substances - disintegrating substances - organic substances, which need special attention due to absorption in the test
equipment, or due to other specific behaviour (e.g. DOC interaction). Key mechanisms and different types of materials. Most experience on leaching is collected by tests on mineral materials; including different types of excavated soil. For other types of materials, much less information and mostly rather ad hoc information on leaching is available. Some information is available from test projects that included testing of different materials with the same test methods. In general one can make the next subdivision in mechanisms: - diffusion: ~monolithic mineral materials
(except very porous blocks and blocks based on very soluble minerals, such as gypsum and several salts.)
~several plastics (artificial products). ~wood ~compacted, very low permeable aggregate materials
(such as low porous clay and bentonite products) - Solubility control: ~metal surfaces ~blocks of soluble materials, such as gypsum - percolation: ~mineral aggregates with small particle sizes
(for substances which absorb to the mineral material ) - surface wash off: ~flush from mineral monoliths
(only if not bound substances are available on the surface; they may provide a quick first flush)
In some cases, a combination of these mechanisms may control release.

41
Hierarchy in testing. - Common test methods Use of common characterization methods that define and quantify mechanism controlling release will facilitate - Improvements in material performance, - Comparison of material performance within and between material categories and
environmental scenarios, - Allow for reduction in the amount of characterization testing needed. - Characterisation and compliance testing. A proper combination of characterisation and compliance testing allows generation of detailed information when needed (for criteria development, evaluation of products and for quality improvement of products, etc) and simple methods when appropriate (check for consistency with previous characterization and stability of production). Compliance testing (the simple methods) is of interest for the industry for it is more simple, efficient and cheaper and it still provides the necessary insight when reported in combination with characterization testing. - ‘Initial type testing’ and ‘Characterisation’. In different EU-Directives both terms ‘Initial type testing’ and ‘Characterisation’ are used. In fact, they mean the same and require the same types of test methods and approaches for determining the leaching characteristics and leaching levels of products. - Database A common database of leaching characteristics for materials would facilitate implementation adequate use of characterisation and compliance testing.. Precision of leaching data - Precision With leaching tests highly repeatable and reproducible data can be produced. However in a number of cases also less precise data are produced; often the differences in final test data can be explained by differences in products and their behaviour, a.o. due to differences in pH or differences in other circumstances. Impact assessment of leaching to soil and groundwater. - Source term calculations The source term description derived from testing provides the input for an impact evaluation program. Based on the comparison of results from forward prediction with quality objectives at a defined target provides a basis for developing acceptance criteria. Recommendations - Optimisation of harmonised test methods. Some of the available general test methods can be used for a wider range of characteristics and situations, but may need some adaptations. - Further investigations for several materials. For a number of construction products, the applicability of the characterization tests is recommended to be further tested in the laboratory. This is in particular the case for construction metals (pH dependence test and investigation of reaction kinetics) and for the release of inorganic substances from wood and synthetic (organic) materials, which is recommended to tested by a diffusion test.

42
- Harmonisation test methods for metals, wood and synthetic materials. Several test methods are in use for metals, wood and synthetic materials, including materials used for drinking water provisions. Since it is concluded that mechanisms and needed information are often comparable, more uniform test methods can be developed, including these and other types of materials. - Organics Further development of leaching tests for organics is possible, but will take more time. Different behaviour of different groups of organics should be taken into account. In general, the same types of characteristics are relevant as selected for inorganics. To develop adequate limit values for leaching of organics, it is also necessary to develop the impact assessment more into detail for organics, to better understand transport behaviour mechanisms of organics - Database It is recommended to develop a general database, which include leaching data and other characteristics of a wide range of materials. The database should be easy accessible for all parties concerned. It would highly facilitate initial type testing and characterisation of product. It would also facilitate selection of tests for compliance testing.
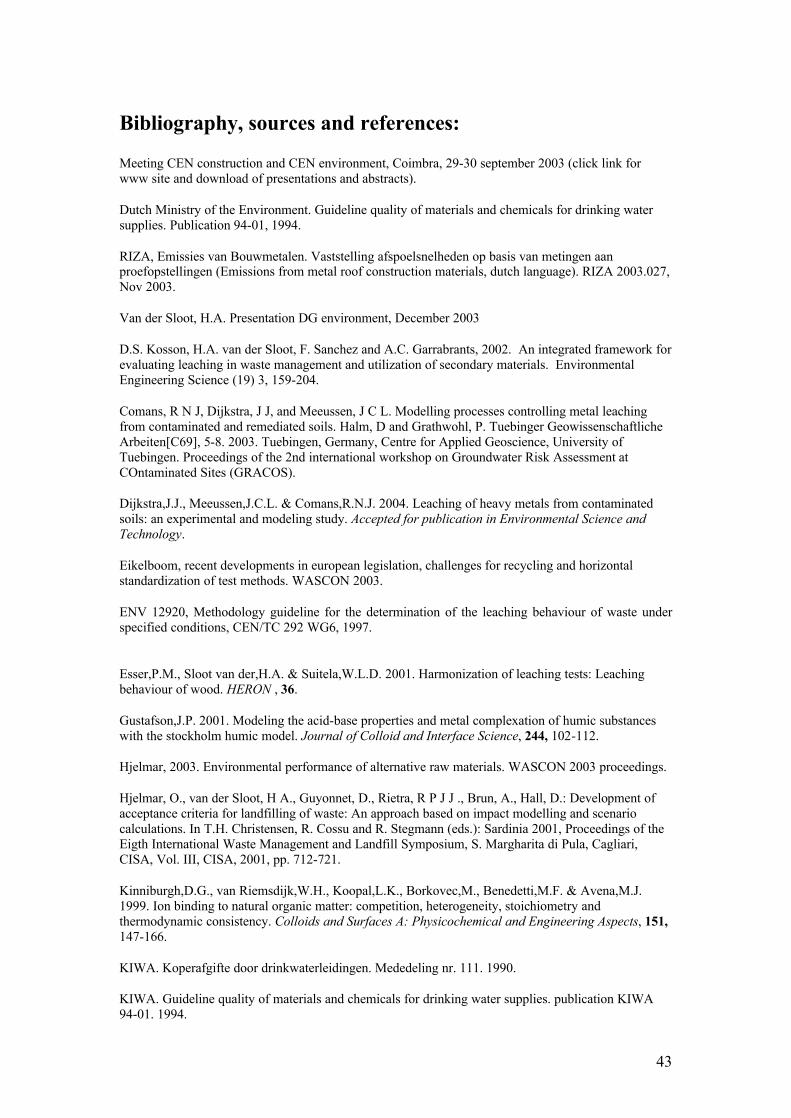
43
Bibliography, sources and references:
Meeting CEN construction and CEN environment, Coimbra, 29-30 september 2003 (click link for www site and download of presentations and abstracts).
Dutch Ministry of the Environment. Guideline quality of materials and chemicals for drinking water supplies. Publication 94-01, 1994.
RIZA, Emissies van Bouwmetalen. Vaststelling afspoelsnelheden op basis van metingen aan proefopstellingen (Emissions from metal roof construction materials, dutch language). RIZA 2003.027, Nov 2003.
Van der Sloot, H.A. Presentation DG environment, December 2003
D.S. Kosson, H.A. van der Sloot, F. Sanchez and A.C. Garrabrants, 2002. An integrated framework for evaluating leaching in waste management and utilization of secondary materials. Environmental Engineering Science (19) 3, 159-204.
Comans, R N J, Dijkstra, J J, and Meeussen, J C L. Modelling processes controlling metal leaching from contaminated and remediated soils. Halm, D and Grathwohl, P. Tuebinger Geowissenschaftliche Arbeiten[C69], 5-8. 2003. Tuebingen, Germany, Centre for Applied Geoscience, University of Tuebingen. Proceedings of the 2nd international workshop on Groundwater Risk Assessment at COntaminated Sites (GRACOS).
Dijkstra,J.J., Meeussen,J.C.L. & Comans,R.N.J. 2004. Leaching of heavy metals from contaminated soils: an experimental and modeling study. Accepted for publication in Environmental Science and Technology.
Eikelboom, recent developments in european legislation, challenges for recycling and horizontal standardization of test methods. WASCON 2003.
ENV 12920, Methodology guideline for the determination of the leaching behaviour of waste under specified conditions, CEN/TC 292 WG6, 1997.
Esser,P.M., Sloot van der,H.A. & Suitela,W.L.D. 2001. Harmonization of leaching tests: Leaching behaviour of wood. HERON , 36.
Gustafson,J.P. 2001. Modeling the acid-base properties and metal complexation of humic substances with the stockholm humic model. Journal of Colloid and Interface Science, 244, 102-112.
Hjelmar, 2003. Environmental performance of alternative raw materials. WASCON 2003 proceedings.
Hjelmar, O., van der Sloot, H A., Guyonnet, D., Rietra, R P J J ., Brun, A., Hall, D.: Development of acceptance criteria for landfilling of waste: An approach based on impact modelling and scenario calculations. In T.H. Christensen, R. Cossu and R. Stegmann (eds.): Sardinia 2001, Proceedings of the Eigth International Waste Management and Landfill Symposium, S. Margharita di Pula, Cagliari, CISA, Vol. III, CISA, 2001, pp. 712-721.
Kinniburgh,D.G., van Riemsdijk,W.H., Koopal,L.K., Borkovec,M., Benedetti,M.F. & Avena,M.J. 1999. Ion binding to natural organic matter: competition, heterogeneity, stoichiometry and thermodynamic consistency. Colloids and Surfaces A: Physicochemical and Engineering Aspects, 151, 147-166.
KIWA. Koperafgifte door drinkwaterleidingen. Mededeling nr. 111. 1990.
KIWA. Guideline quality of materials and chemicals for drinking water supplies. publication KIWA 94-01. 1994.

44
Meima,J.A.& Comans,R.N.J. 1997. Geochemical modelling of weathering reactions in MSWI bottom ash. Environmental Science and Technology, 31, 1269-1276.
Milne,C.J., Kinniburgh,D.G., van Riemsdijk,W.H. & Tipping,E. 2003. Generic NICA-Donnan model parameters for metal-ion binding by humic substances. Environmental Science and Technology, 37, 958-971.
RIZA. Emissies van bouwmaterialen - vaststelling van afspoelsnelheden op basis van metingen an proefopstellingen. RIZA 2003.027. 2003.
Sloot van der,H.A., van der Wegen, G.J.L., Hoede, D., Groot, G.J de, and Quevauviller,Ph. Intercomparison of leaching tests for stabilized waste. Commission of the European Communities, EUR 16133 EN, 1995.
Van der Sloot, H.A., Kosson, D.S., Eighmy, T.T., Comans, R.N.J. and Hjelmar, O. An approach towards international standardization: a concise scheme for testing of granular waste leachability. In: Environmental aspects of Construction with waste materials. Eds. J.J.J.M. Goumans, H.A. van der Sloot, Th.G. Aalbers, Elsevier Science Publishers, Amsterdam, 1994, 453-466.
Sloot van der, H.A., Heasman,L. & Quevauviller,P. 1997. Harmonisation of leaching /extraction tests. Elsevier Science B.V., Amsterdam.
Van der Sloot, H.A. , Hjelmar, O., Bjerre Hansen, J., Woitke, P., Lepom, P., Leschber, R. , Bartet, B., Debrucker, N. (2001): Validation of CEN/TC 292 Leaching Tests and Eluate Analysis Methods PrEN 12457 part 1- 4, ENV 13370 and ENV 12506 in Co-operation with CEN/TC 308. 2001. ECN-C-01-117.
Sloot van der, H.A., Seignette, P., Comans, R N J., Zomeren, A van., Dijkstra, J J., Meeussen, J., Kosson, D., Hjelmar, O. Evalulation of en-vironmental aspects of alternative materials using an integrated approach assisted by a database/expert system. Workshop UNH, Portsmouth NH, 2004
Tipping,E. 1998. Humic ion binding model VI: an improved description of the interactions of protons and metal ions with humic substances. Aquatic Geochemistry, 4, 3-48.
Weng,L., Temminghoff,E.J.M., Lofts,S., Tipping,E. & van Riemsdijk,W.H. 2002. Complexation with dissolved organic matter and solubility control of heavy metals in a sandy soil. Environmental Science and Technology, 36, 4804-4810.
O. Hjelmar. Environmental performance of alternative raw materials. Supporting paper submitted to Workshop CEN Construction/CEN Environment, 29 and 30 of September 2003 (Coimbra, Portugal).

45
APPENDICES 1. Preserved wood 2. Release of metals and organics from synthetic building materials 3. Construction metals (example used: zinc roof materials) 4. Metal pipes (example: Cu pipes for transport of drinking water)
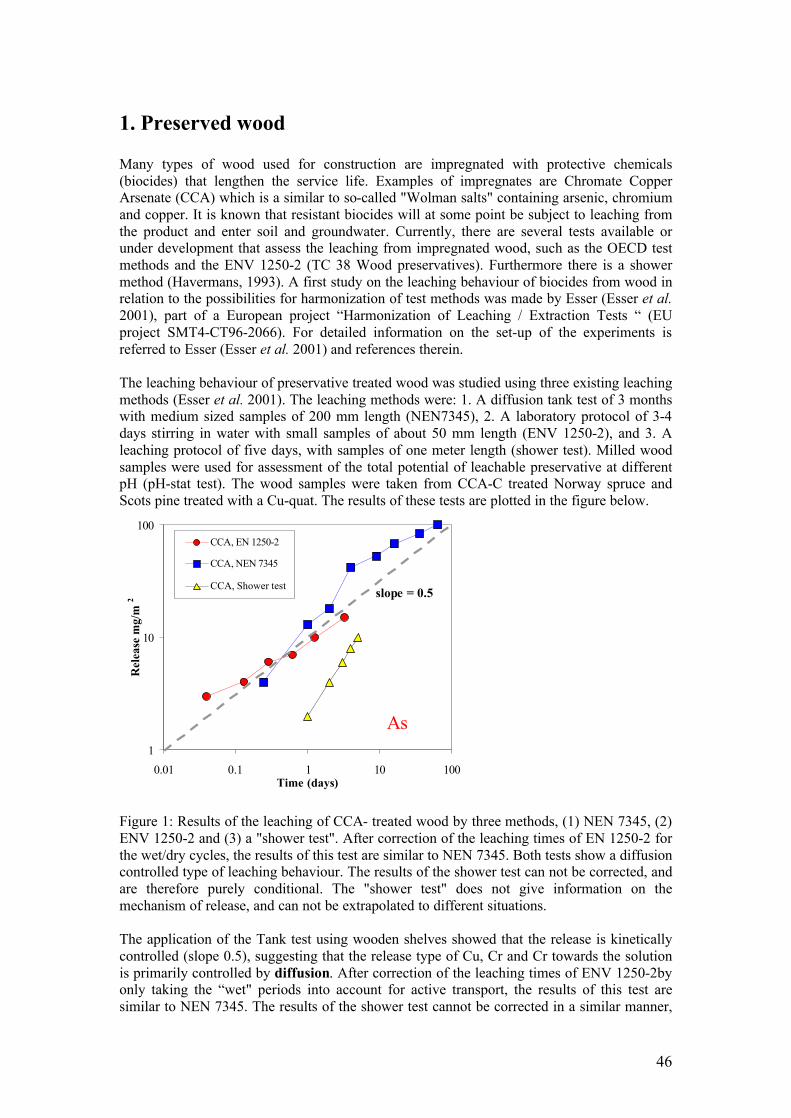
46
1. Preserved wood Many types of wood used for construction are impregnated with protective chemicals (biocides) that lengthen the service life. Examples of impregnates are Chromate Copper Arsenate (CCA) which is a similar to so-called "Wolman salts" containing arsenic, chromium and copper. It is known that resistant biocides will at some point be subject to leaching from the product and enter soil and groundwater. Currently, there are several tests available or under development that assess the leaching from impregnated wood, such as the OECD test methods and the ENV 1250-2 (TC 38 Wood preservatives). Furthermore there is a shower method (Havermans, 1993). A first study on the leaching behaviour of biocides from wood in relation to the possibilities for harmonization of test methods was made by Esser (Esser et al. 2001), part of a European project “Harmonization of Leaching / Extraction Tests “ (EU project SMT4-CT96-2066). For detailed information on the set-up of the experiments is referred to Esser (Esser et al. 2001) and references therein. The leaching behaviour of preservative treated wood was studied using three existing leaching methods (Esser et al. 2001). The leaching methods were: 1. A diffusion tank test of 3 months with medium sized samples of 200 mm length (NEN7345), 2. A laboratory protocol of 3-4 days stirring in water with small samples of about 50 mm length (ENV 1250-2), and 3. A leaching protocol of five days, with samples of one meter length (shower test). Milled wood samples were used for assessment of the total potential of leachable preservative at different pH (pH-stat test). The wood samples were taken from CCA-C treated Norway spruce and Scots pine treated with a Cu-quat. The results of these tests are plotted in the figure below.
Figure 1: Results of the leaching of CCA- treated wood by three methods, (1) NEN 7345, (2) ENV 1250-2 and (3) a "shower test". After correction of the leaching times of EN 1250-2 for the wet/dry cycles, the results of this test are similar to NEN 7345. Both tests show a diffusion controlled type of leaching behaviour. The results of the shower test can not be corrected, and are therefore purely conditional. The "shower test" does not give information on the mechanism of release, and can not be extrapolated to different situations. The application of the Tank test using wooden shelves showed that the release is kinetically controlled (slope 0.5), suggesting that the release type of Cu, Cr and Cr towards the solution is primarily controlled by diffusion. After correction of the leaching times of ENV 1250-2by only taking the “wet" periods into account for active transport, the results of this test are similar to NEN 7345. The results of the shower test cannot be corrected in a similar manner,
1
10
100
0.01 0.1 1 10 100Time (days)
Rel
ease
mg/
m2
CCA, EN 1250-2
CCA, NEN 7345
CCA, Shower test
As
slope = 0.5

47
and are therefore purely conditional. The "shower test" does not give information on the mechanism of release, and can not be extrapolated to (slightly) different situations. Esser et al (Esser et al. 2001) concluded that the NEN7345 diffusion tank test method, which was developed for inorganic building materials, is also suitable for assessment of the leaching behaviour of preservative treated wood. An adaptation of the acidic pH conditions to neutrality of the leaching water used is recommended and has already been adopted. Mechanistic understanding on the concentration level at which the different components are released can be investigated by a pH dependence test on a milled sample.
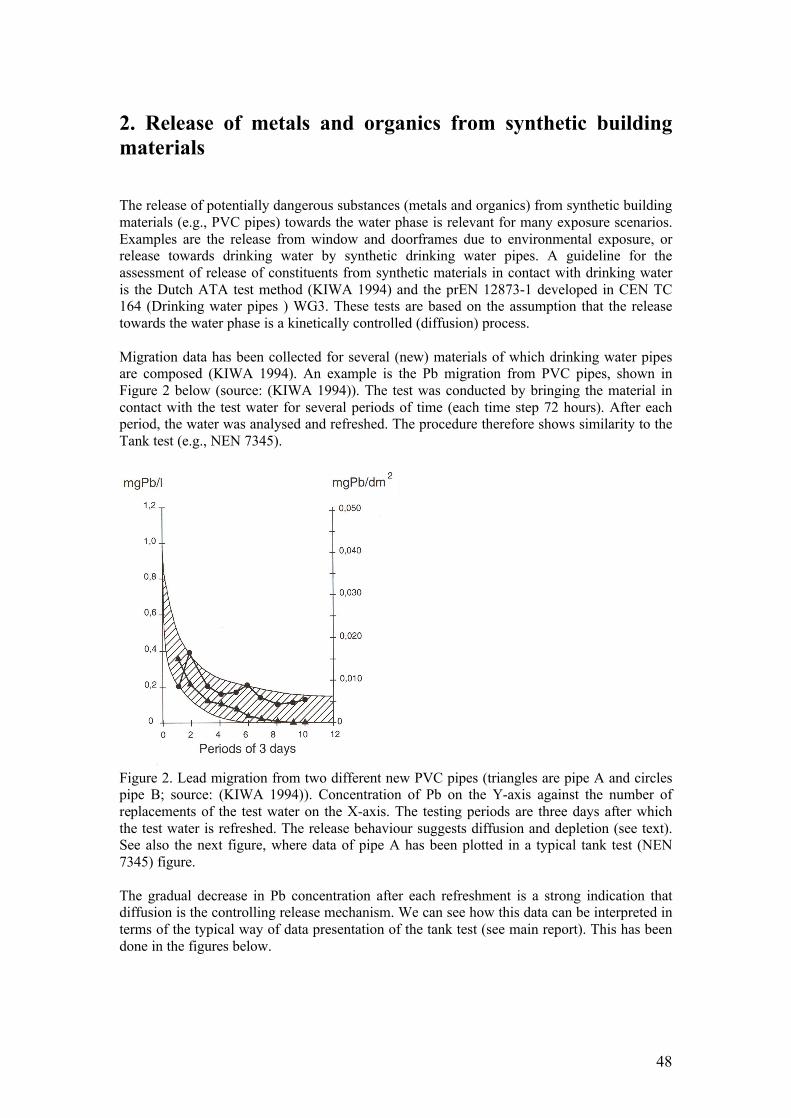
48
2. Release of metals and organics from synthetic building materials The release of potentially dangerous substances (metals and organics) from synthetic building materials (e.g., PVC pipes) towards the water phase is relevant for many exposure scenarios. Examples are the release from window and doorframes due to environmental exposure, or release towards drinking water by synthetic drinking water pipes. A guideline for the assessment of release of constituents from synthetic materials in contact with drinking water is the Dutch ATA test method (KIWA 1994) and the prEN 12873-1 developed in CEN TC 164 (Drinking water pipes ) WG3. These tests are based on the assumption that the release towards the water phase is a kinetically controlled (diffusion) process. Migration data has been collected for several (new) materials of which drinking water pipes are composed (KIWA 1994). An example is the Pb migration from PVC pipes, shown in Figure 2 below (source: (KIWA 1994)). The test was conducted by bringing the material in contact with the test water for several periods of time (each time step 72 hours). After each period, the water was analysed and refreshed. The procedure therefore shows similarity to the Tank test (e.g., NEN 7345).
Figure 2. Lead migration from two different new PVC pipes (triangles are pipe A and circles pipe B; source: (KIWA 1994)). Concentration of Pb on the Y-axis against the number of replacements of the test water on the X-axis. The testing periods are three days after which the test water is refreshed. The release behaviour suggests diffusion and depletion (see text). See also the next figure, where data of pipe A has been plotted in a typical tank test (NEN 7345) figure. The gradual decrease in Pb concentration after each refreshment is a strong indication that diffusion is the controlling release mechanism. We can see how this data can be interpreted in terms of the typical way of data presentation of the tank test (see main report). This has been done in the figures below.
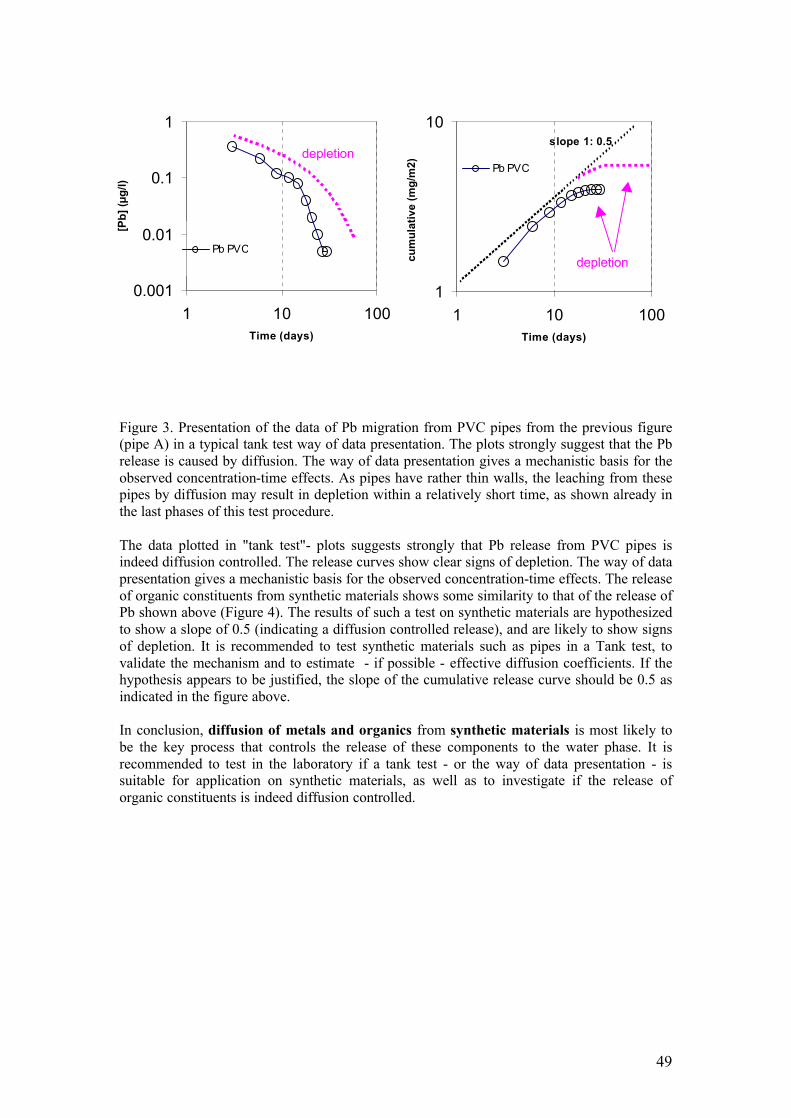
49
Figure 3. Presentation of the data of Pb migration from PVC pipes from the previous figure (pipe A) in a typical tank test way of data presentation. The plots strongly suggest that the Pb release is caused by diffusion. The way of data presentation gives a mechanistic basis for the observed concentration-time effects. As pipes have rather thin walls, the leaching from these pipes by diffusion may result in depletion within a relatively short time, as shown already in the last phases of this test procedure. The data plotted in "tank test"- plots suggests strongly that Pb release from PVC pipes is indeed diffusion controlled. The release curves show clear signs of depletion. The way of data presentation gives a mechanistic basis for the observed concentration-time effects. The release of organic constituents from synthetic materials shows some similarity to that of the release of Pb shown above (Figure 4). The results of such a test on synthetic materials are hypothesized to show a slope of 0.5 (indicating a diffusion controlled release), and are likely to show signs of depletion. It is recommended to test synthetic materials such as pipes in a Tank test, to validate the mechanism and to estimate - if possible - effective diffusion coefficients. If the hypothesis appears to be justified, the slope of the cumulative release curve should be 0.5 as indicated in the figure above. In conclusion, diffusion of metals and organics from synthetic materials is most likely to be the key process that controls the release of these components to the water phase. It is recommended to test in the laboratory if a tank test - or the way of data presentation - is suitable for application on synthetic materials, as well as to investigate if the release of organic constituents is indeed diffusion controlled.
0.001
0.01
0.1
1
1 10 100Time (days)
[Pb]
(µg/
l)
Pb PVC
depletion
1
10
1 10 100Time (days)
cum
ulat
ive
(mg/
m2) Pb PVC
slope 1: 0.5
depletion
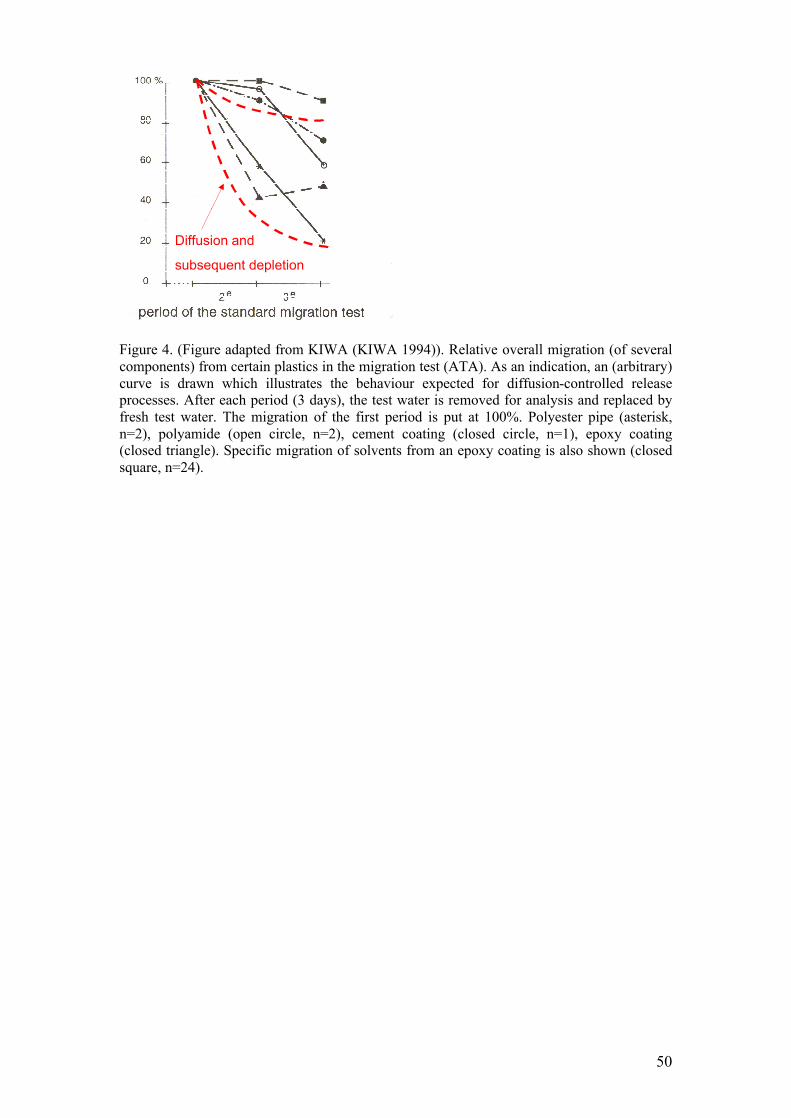
50
Figure 4. (Figure adapted from KIWA (KIWA 1994)). Relative overall migration (of several components) from certain plastics in the migration test (ATA). As an indication, an (arbitrary) curve is drawn which illustrates the behaviour expected for diffusion-controlled release processes. After each period (3 days), the test water is removed for analysis and replaced by fresh test water. The migration of the first period is put at 100%. Polyester pipe (asterisk, n=2), polyamide (open circle, n=2), cement coating (closed circle, n=1), epoxy coating (closed triangle). Specific migration of solvents from an epoxy coating is also shown (closed square, n=24).
Diffusion and
subsequent depletion
Diffusion and
subsequent depletion
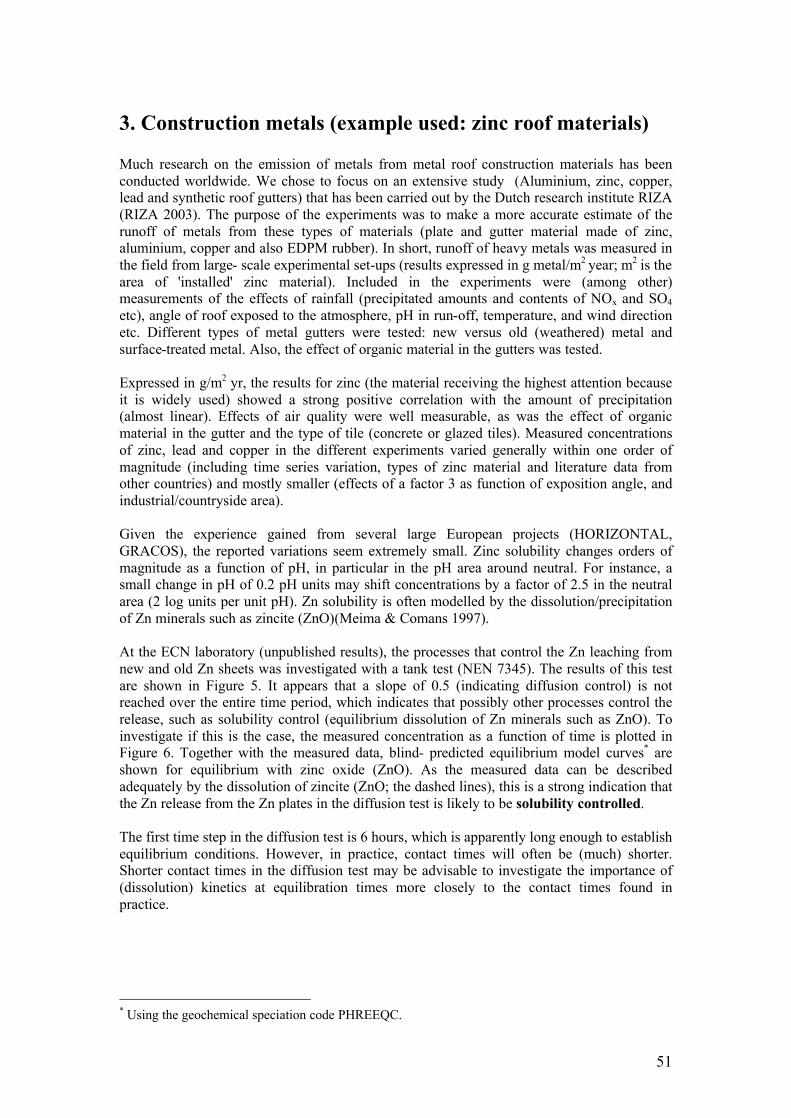
51
3. Construction metals (example used: zinc roof materials) Much research on the emission of metals from metal roof construction materials has been conducted worldwide. We chose to focus on an extensive study (Aluminium, zinc, copper, lead and synthetic roof gutters) that has been carried out by the Dutch research institute RIZA (RIZA 2003). The purpose of the experiments was to make a more accurate estimate of the runoff of metals from these types of materials (plate and gutter material made of zinc, aluminium, copper and also EDPM rubber). In short, runoff of heavy metals was measured in the field from large- scale experimental set-ups (results expressed in g metal/m2 year; m2 is the area of 'installed' zinc material). Included in the experiments were (among other) measurements of the effects of rainfall (precipitated amounts and contents of NOx and SO4 etc), angle of roof exposed to the atmosphere, pH in run-off, temperature, and wind direction etc. Different types of metal gutters were tested: new versus old (weathered) metal and surface-treated metal. Also, the effect of organic material in the gutters was tested. Expressed in g/m2 yr, the results for zinc (the material receiving the highest attention because it is widely used) showed a strong positive correlation with the amount of precipitation (almost linear). Effects of air quality were well measurable, as was the effect of organic material in the gutter and the type of tile (concrete or glazed tiles). Measured concentrations of zinc, lead and copper in the different experiments varied generally within one order of magnitude (including time series variation, types of zinc material and literature data from other countries) and mostly smaller (effects of a factor 3 as function of exposition angle, and industrial/countryside area). Given the experience gained from several large European projects (HORIZONTAL, GRACOS), the reported variations seem extremely small. Zinc solubility changes orders of magnitude as a function of pH, in particular in the pH area around neutral. For instance, a small change in pH of 0.2 pH units may shift concentrations by a factor of 2.5 in the neutral area (2 log units per unit pH). Zn solubility is often modelled by the dissolution/precipitation of Zn minerals such as zincite (ZnO)(Meima & Comans 1997). At the ECN laboratory (unpublished results), the processes that control the Zn leaching from new and old Zn sheets was investigated with a tank test (NEN 7345). The results of this test are shown in Figure 5. It appears that a slope of 0.5 (indicating diffusion control) is not reached over the entire time period, which indicates that possibly other processes control the release, such as solubility control (equilibrium dissolution of Zn minerals such as ZnO). To investigate if this is the case, the measured concentration as a function of time is plotted in Figure 6. Together with the measured data, blind- predicted equilibrium model curves* are shown for equilibrium with zinc oxide (ZnO). As the measured data can be described adequately by the dissolution of zincite (ZnO; the dashed lines), this is a strong indication that the Zn release from the Zn plates in the diffusion test is likely to be solubility controlled. The first time step in the diffusion test is 6 hours, which is apparently long enough to establish equilibrium conditions. However, in practice, contact times will often be (much) shorter. Shorter contact times in the diffusion test may be advisable to investigate the importance of (dissolution) kinetics at equilibration times more closely to the contact times found in practice.
* Using the geochemical speciation code PHREEQC.
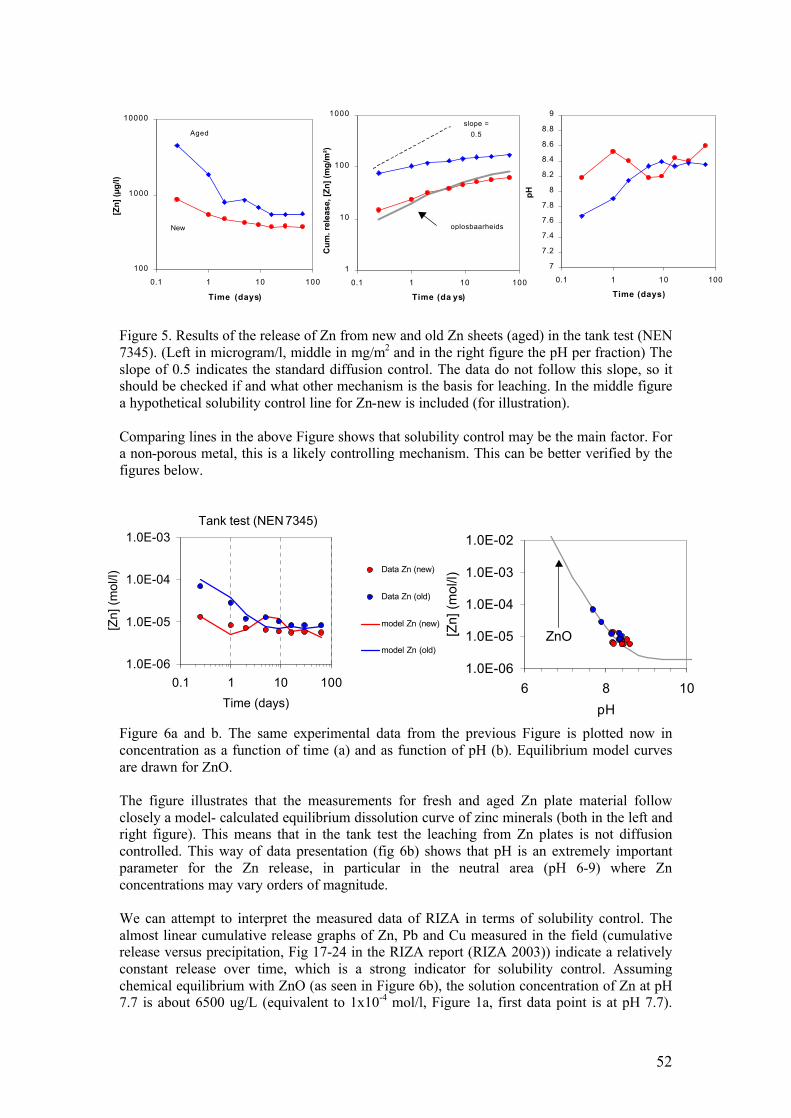
52
Figure 5. Results of the release of Zn from new and old Zn sheets (aged) in the tank test (NEN 7345). (Left in microgram/l, middle in mg/m2 and in the right figure the pH per fraction) The slope of 0.5 indicates the standard diffusion control. The data do not follow this slope, so it should be checked if and what other mechanism is the basis for leaching. In the middle figure a hypothetical solubility control line for Zn-new is included (for illustration). Comparing lines in the above Figure shows that solubility control may be the main factor. For a non-porous metal, this is a likely controlling mechanism. This can be better verified by the figures below.
Figure 6a and b. The same experimental data from the previous Figure is plotted now in concentration as a function of time (a) and as function of pH (b). Equilibrium model curves are drawn for ZnO. The figure illustrates that the measurements for fresh and aged Zn plate material follow closely a model- calculated equilibrium dissolution curve of zinc minerals (both in the left and right figure). This means that in the tank test the leaching from Zn plates is not diffusion controlled. This way of data presentation (fig 6b) shows that pH is an extremely important parameter for the Zn release, in particular in the neutral area (pH 6-9) where Zn concentrations may vary orders of magnitude. We can attempt to interpret the measured data of RIZA in terms of solubility control. The almost linear cumulative release graphs of Zn, Pb and Cu measured in the field (cumulative release versus precipitation, Fig 17-24 in the RIZA report (RIZA 2003)) indicate a relatively constant release over time, which is a strong indicator for solubility control. Assuming chemical equilibrium with ZnO (as seen in Figure 6b), the solution concentration of Zn at pH 7.7 is about 6500 ug/L (equivalent to 1x10⁻⁴ mol/l, Figure 1a, first data point is at pH 7.7).
1
10
100
1000
0.1 1 10 100
Time (da ys)
Cum
. rel
ease
, [Zn
] (m
g/m
²)
oplosbaarheids
slope = 0.5
100
1000
10000
0.1 1 10 100
Time (days)
[Zn]
(µg/
l)
Aged
New
7
7.2
7.4
7.6
7.8
8
8.2
8.4
8.6
8.8
9
0.1 1 10 100
Time (days)
pHTank test (NEN 7345)
1.0E-06
1.0E-05
1.0E-04
1.0E-03
0.1 1 10 100Time (days)
[Zn]
(mol
/l)
Data Zn (new)
Data Zn (old)
model Zn (new)
model Zn (old)
1.0E-06
1.0E-05
1.0E-04
1.0E-03
1.0E-02
6 8 10pH
[Zn]
(mol
/l)
ZnO
53
Assuming a gross precipitation of 800 L/m2 year (average in the Netherlands), and a Zn plate of 1 m2 (flat; 0 degrees with the surface), the Zn release would be 800 L/m2 yr * 6500 ug/L = 5.2 g Zn/ m2 year. This is in the order of magnitude of the release estimated by RIZA (their best estimate is 2.3 g Zn/m2 installed Zn per year). Because both estimates are so close, this suggests that even in practice (near) equilibrium conditions are met. Of course, many factors influence the Zn release (contact angle versus precipitation, the pH, gutters versus plates etc). A direct comparison with measured concentrations of RIZA has not yet been done at the time of writing (april 2004), but is needed to confirm solubility control as the release controlling mechanism under field conditions. It may be that in some cases other Zn minerals may control the solubility in practice (which together make up the "patina", the weathering layer on metal surfaces). Strictly spoken, some consequences of solubility control (possibly the controlling mechanism) for the release are:
- The total amount of Zn released to the environment (g Zn/year) can be approximated by the product of precipitation (L/m2/year), equilibrium concentration (g Zn/L), and exposed surface area (m2). Given constant environmental conditions (such as annual rainfall, pH), the amount of zinc emitted can be expressed in a rather constant number; e.g. 2.3 g Zn/m2 year, as seen from the RIZA measurements..
- As follows from the above, the amount of Zn released (expressed in kg Zn/year) is approximately linear with the exposed surface area (a factor 2 increase in area would double the released amount);
- As follows from the above, the amount of Zn released (expressed in kg Zn/year) is approximately linear with the amount of precipitation (a factor of 2 increase in precipitation would double the released amount).
The above consequences of solubility control largely comply with the findings of RIZA. The cumulative release of Zn versus precipitation only slightly deviates from linear (RIZA, 2003). A near linear cumulative release curve is also found for Pb from Pb sheets, Cu from Cu sheets and Al from Al sheets. The strong binding of Zn to organic matter is possibly the primary reason for the observed increased release of Zn in "dirty" roof gutters as observed by RIZA. The strong complexation of heavy metals to natural organic matter has received much scientific attention during the past decade and has resulted in a number of mechanistic adsorption models (Tipping 1998; Kinniburgh et al. 1999; Gustafson 2001). These have been shown to predict metal leachability successfully in strongly organic systems such as soils (Weng et al. 2002), (Dijkstra et al. 2004). The DOC complexation effect can well be calculated using current modelling capabilities using a number of standard geochemical models. Unfortunately, DOC measurements were not available in the work of RIZA. Although the leaching of Zn was tested here with a tank test (NEN 7345), a pH dependence test would be suitable to further specify the behaviour and to make the further evaluation described above. It may help to specify the potential effects that the above named parameters have on the run-off of metals from building metals. As stated before, the possible effect of dissolution kinetics should be investigated into more detail.
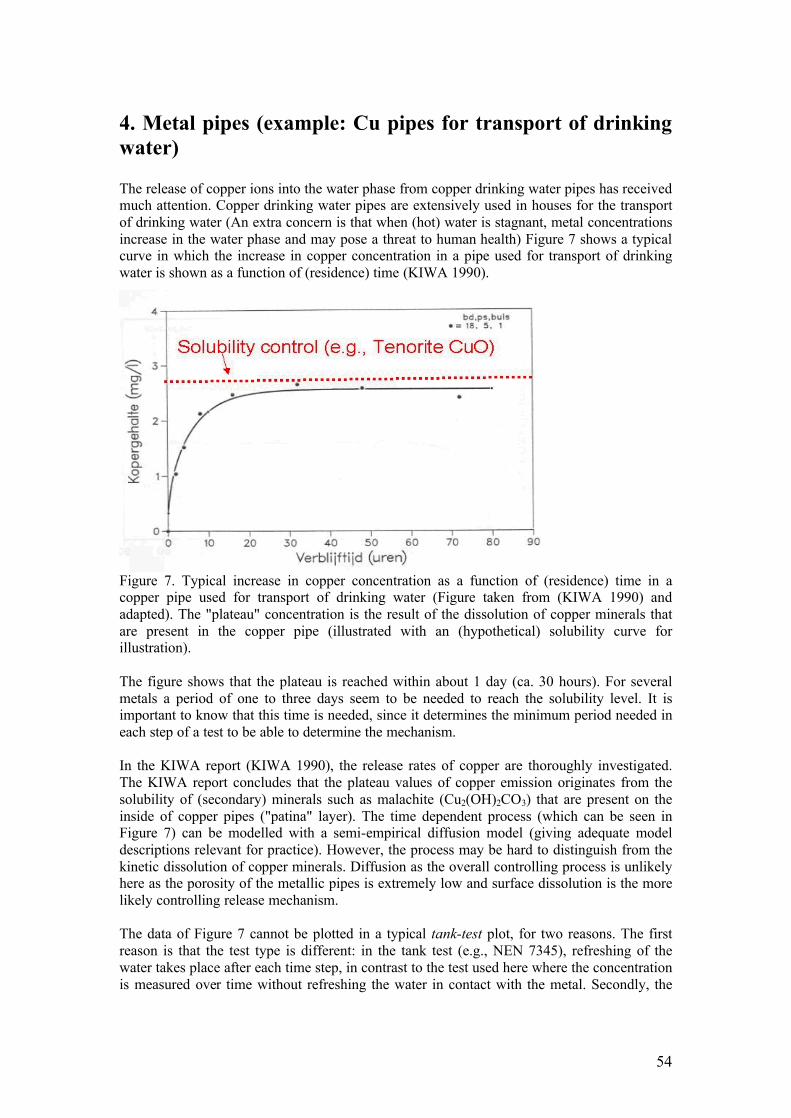
54
4. Metal pipes (example: Cu pipes for transport of drinking water) The release of copper ions into the water phase from copper drinking water pipes has received much attention. Copper drinking water pipes are extensively used in houses for the transport of drinking water (An extra concern is that when (hot) water is stagnant, metal concentrations increase in the water phase and may pose a threat to human health) Figure 7 shows a typical curve in which the increase in copper concentration in a pipe used for transport of drinking water is shown as a function of (residence) time (KIWA 1990).
Figure 7. Typical increase in copper concentration as a function of (residence) time in a copper pipe used for transport of drinking water (Figure taken from (KIWA 1990) and adapted). The "plateau" concentration is the result of the dissolution of copper minerals that are present in the copper pipe (illustrated with an (hypothetical) solubility curve for illustration). The figure shows that the plateau is reached within about 1 day (ca. 30 hours). For several metals a period of one to three days seem to be needed to reach the solubility level. It is important to know that this time is needed, since it determines the minimum period needed in each step of a test to be able to determine the mechanism. In the KIWA report (KIWA 1990), the release rates of copper are thoroughly investigated. The KIWA report concludes that the plateau values of copper emission originates from the solubility of (secondary) minerals such as malachite (Cu2(OH)2CO3) that are present on the inside of copper pipes ("patina" layer). The time dependent process (which can be seen in Figure 7) can be modelled with a semi-empirical diffusion model (giving adequate model descriptions relevant for practice). However, the process may be hard to distinguish from the kinetic dissolution of copper minerals. Diffusion as the overall controlling process is unlikely here as the porosity of the metallic pipes is extremely low and surface dissolution is the more likely controlling release mechanism. The data of Figure 7 cannot be plotted in a typical tank-test plot, for two reasons. The first reason is that the test type is different: in the tank test (e.g., NEN 7345), refreshing of the water takes place after each time step, in contrast to the test used here where the concentration is measured over time without refreshing the water in contact with the metal. Secondly, the
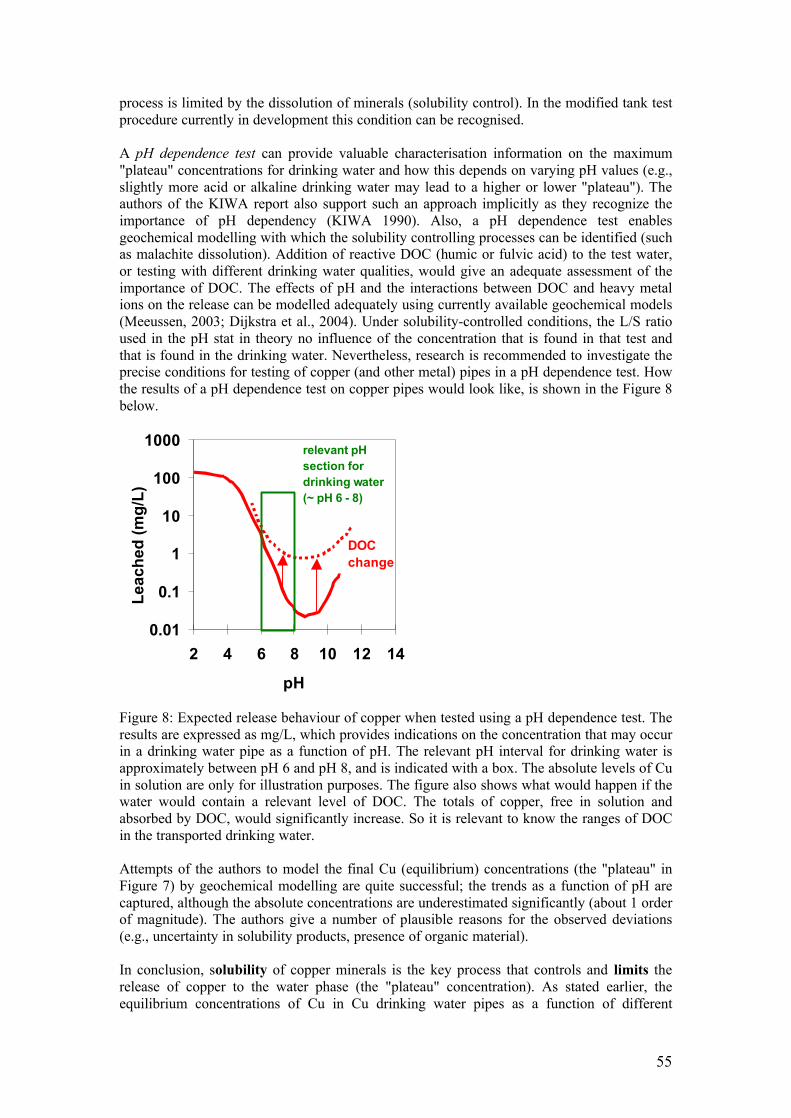
55
process is limited by the dissolution of minerals (solubility control). In the modified tank test procedure currently in development this condition can be recognised. A pH dependence test can provide valuable characterisation information on the maximum "plateau" concentrations for drinking water and how this depends on varying pH values (e.g., slightly more acid or alkaline drinking water may lead to a higher or lower "plateau"). The authors of the KIWA report also support such an approach implicitly as they recognize the importance of pH dependency (KIWA 1990). Also, a pH dependence test enables geochemical modelling with which the solubility controlling processes can be identified (such as malachite dissolution). Addition of reactive DOC (humic or fulvic acid) to the test water, or testing with different drinking water qualities, would give an adequate assessment of the importance of DOC. The effects of pH and the interactions between DOC and heavy metal ions on the release can be modelled adequately using currently available geochemical models (Meeussen, 2003; Dijkstra et al., 2004). Under solubility-controlled conditions, the L/S ratio used in the pH stat in theory no influence of the concentration that is found in that test and that is found in the drinking water. Nevertheless, research is recommended to investigate the precise conditions for testing of copper (and other metal) pipes in a pH dependence test. How the results of a pH dependence test on copper pipes would look like, is shown in the Figure 8 below.
Figure 8: Expected release behaviour of copper when tested using a pH dependence test. The results are expressed as mg/L, which provides indications on the concentration that may occur in a drinking water pipe as a function of pH. The relevant pH interval for drinking water is approximately between pH 6 and pH 8, and is indicated with a box. The absolute levels of Cu in solution are only for illustration purposes. The figure also shows what would happen if the water would contain a relevant level of DOC. The totals of copper, free in solution and absorbed by DOC, would significantly increase. So it is relevant to know the ranges of DOC in the transported drinking water. Attempts of the authors to model the final Cu (equilibrium) concentrations (the "plateau" in Figure 7) by geochemical modelling are quite successful; the trends as a function of pH are captured, although the absolute concentrations are underestimated significantly (about 1 order of magnitude). The authors give a number of plausible reasons for the observed deviations (e.g., uncertainty in solubility products, presence of organic material). In conclusion, solubility of copper minerals is the key process that controls and limits the release of copper to the water phase (the "plateau" concentration). As stated earlier, the equilibrium concentrations of Cu in Cu drinking water pipes as a function of different
0.01
0.1
1
10
100
1000
2 4 6 8 10 12 14
pH
Leac
hed
(mg/
L)
DOC change
relevant pH section for drinking water (~ pH 6 - 8)

56
drinking water pH values can be estimated using a pH dependence test. However, such a test does not provide information on the time dependency of the process, which is clearly relevant (about 30 hours before equilibrium is attained in Figure 7) and which depends on the volume of water in contact with the material. This requires a test method incorporating the time-dependency of the release and a fixed volume to surface area. To understand what time is needed for attaining equilibrium, requires a kind of tank test, as used by the authors, in which the increase in concentration in each time step is measured carefully. This could be done in a standard tank test if so desired. It also shows that, when testing these kinds of materials in a tank test, the duration of separate steps should be at least 2 days and the volume to area ratio be fixed.