Embed Size (px)
Citation preview
Pedro Miguel de Sousa Santos
Licenciado em Ciências de Engenharia Mecânica
Development of FSW to manufacture tailor
welded blanks for lightweight transport
applications
Dissertação para obtenção do Grau de Mestre em
Mestrado Integrado em Engenharia Mecânica
Orientador: Professora Doutora Rosa Maria Mendes Miranda,
Professora Associada com Agregação, FCT-UNL
Co-orientador: Doutor João Pedro Machado da Gandra,
Senior Project Leader, TWI, Ltd.
Setembro 2016

Pedro Miguel de Sousa Santos
Licenciado em Ciências de Engenharia Mecânica
Development of FSW to manufacture tailor
welded blanks for lightweight transport
applications
Dissertação apresentada à Faculdade de Ciências e Tecnologia
da Universidade Nova de Lisboa para a obtenção do grau de
Mestre em Engenharia Mecânica
Orientador:
Professora Doutora Rosa Maria Mendes Miranda
Co-orientador:
Doutor João Pedro Machado da Gandra
Lisboa
2016

i
Development of FSW to manufacture tailor welded blanks for lightweight transport applications
Copyright © 2016 Pedro Miguel de Sousa Santos Faculdade de Ciências e Tecnologia, Universidade Nova de Lisboa
A Faculdade de Ciências e Tecnologia e a Universidade Nova de Lisboa têm o direito, perpétuo e sem
limites geográficos, de arquivar e publicar esta dissertação através de exemplares impressos
reproduzidos em papel ou de forma digital, ou por qualquer outro meio conhecido ou que venha a ser
inventado, e de a divulgar através de repositórios científicos e de admitir a sua cópia e distribuição
com objetivos educacionais ou de investigação, não comerciais, desde que seja dado crédito ao autor
e editor.


iii
Dedico esta dissertação aos meus pais António e Susana, à minha irmã Margarida,
à minha Carolina e à minha querida Avó Nanda

v
Agradecimentos
Este trabalho conclui um dos mais desafiantes e gratificantes capítulos da minha vida académica até à
data. No entanto, não teria chegado a esta etapa sem a ajuda, apoio e confiança de pessoas
importantíssimas.
Em primeiro lugar, quero expressar a minha profunda gratidão à minha orientadora, Professora Rosa
Miranda, por me ter convidado para integrar um projeto tão interessante que me permitiu trabalhar com
um grupo de profissionais experientes numa instituição de prestígio. Agradeço em especial toda a
paciência, orientação e compromisso.
Ao meu co-orientador, Doutor João Gandra, agradeço os seus ensinamentos fundamentais, pelo seu
entusiasmo e pelo constante apoio e paciência durante o meu estágio no TWI, Ltd. Quero agradecer
também a sua amizade e os seus conselhos preciosos.
Esta tese foi realizada no âmbito de um projeto de investigação intitulado “LightBlank – make it lighter,
with less”. O autor reconhece a importância do financiamento concedido pela organização Innovate UK.
Gostaria de agradecer também ao Doutor Mike Russell por me ter aceitado no TWI, Ltd e por me ter
dado a oportunidade de aprofundar o conhecimento sobre FSW onde o processo foi criado. Agradeço
também a todos os trabalhadores da secção de Friction and Forge Processes por todo o apoio prestado
e por me terem recebido no seu grupo. Em particular, um especial agradecimento ao Chris Glazebrook
e ao Bertrand Flipo pela amizade e pelas conversas, ao Stuart Page pelas lições que me transmitiu, à
Helen Everson por todo o seu apoio e ao Doutor Steve Dodds por me convidar a participar noutros
projetos interessantes que me permitiram contactar com outras tecnologias. Gostaria de agradecer
também aos restantes trabalhadores do TWI, Ltd, com quem tive contacto durante o meu estágio e
pelas suas contribuições importantes para este trabalho e para uma incrível experiência.
É com grande gosto que expresso a minha eterna gratidão a toda a minha família, por me terem ajudado
a chegar onde estou hoje e por todo o apoio e carinho. Um agradecimento especial à minha mãe, ao
meu pai, à minha irmã, aos meus avós e aos meus tios que conseguiram arranjar tempo para me visitar
enquanto estive fora, à minha prima Mariana pelos bons tempos passados em Londres e à Amélia por,
agora mais do que nunca, ser um pilar para a família e pelo seu carinho desde a minha infância.
À minha namorada Carolina Ribeiro, quero agradecer-lhe pelo constante apoio, dedicação e amor ao
longo dos anos. Obrigado por sempre acreditares em mim, por fazeres de mim uma pessoa melhor e
mais feliz e por todos os bons momentos que vivemos e que estão para vir.
Aos meus melhores amigos, João Costa e Rita Valentim e aos amigos que fui fazendo ao longo dos
anos, agradeço a amizade, apoio e todos os momentos marcantes que partilhámos.
Quero agradecer à Ana Simões, pela grande amizade, pelo apoio prestado nas alturas mais difíceis do
curso e da vida e por todos os momentos divertidos qua passamos ao longo dos anos. Agradeço
também à sua família pela sua hospitalidade. Sem dúvida uma amiga para a vida.
Aos meus colegas e futuros mestres, agradeço por todo o apoio e pela amizade sempre dedicada.
Em memória e com homenagem à minha avó, Fernanda Gabriel Marques Duarte dos Santos, um
verdadeiro exemplo de vida, que sempre acreditou em mim e para quem estarei eternamente grato por
todo o amor, carinho e empenho que ela me dedicou ao longo da sua vida.

vii
Acknowledgements
This work concludes one of the most challenging and rewarding chapters in my academic life so far. However, I couldn’t have achieved this stage without the help, support and faith from crucial people.
First and foremost, I would like to express my deepest gratitude to my supervisor, Professor Rosa Miranda, for inviting me to join such an interesting project which gave me the opportunity to work with a group of experienced professionals in a remarkable institution. A special thanks for all the patience, guidance and commitment.
To my co-supervisor, Dr. João Gandra, to who I am thankful for his cornerstone teachings, for his enthusiasm and constant support and patience during my time at TWI, Ltd. I would also like to thank for his friendship and valuable advices.
This thesis was conducted in the framework of a research project entitled “LightBlank – make it lighter, with less”. The author acknowledges the importance of the granted funding by Innovate UK organisation.
I would also like to thank Dr. Mike Russell for accepting me at TWI, Ltd and for giving me the opportunity to get a better understanding about FSW where it all began. I sincerely acknowledge all the staff members of the Friction and Forge Processes section for their support and for welcoming me into their group. In particular, a special thanks to Chris Glazebrook and Bertrand Flipo for their close friendship and pep talks, Stuart Page for his teachings, Helen Everson for her support and Dr. Steve Dodds for inviting me to participate in other interesting projects that exposed me to different technologies. I would also like to thank all TWI, Ltd staff members, with whom I had contact during my internship and for their significant contributions for this work and for an incredible experience.
It is with great deal of appreciation that I express my indebtedness to my family, for helping me to arrive where I am today and for all their support and affection. Honest thanks to my mother, father, sister, grandparents and uncles for finding the time to visit me abroad, to my cousin Mariana for the good times spent in London and to Amélia for being a pillar for the family now more than ever and her affection since my early years.
To my girlfriend Carolina Ribeiro, I would like to express my sincere gratitude for her constant support, dedication and love throughout the years. Thank you for always believing in me, for making me a better and happier person and for the good times we had and that are yet to come.
A special thanks goes to my best friends João Costa and Rita Valentim and to the friends I’ve made throughout the years for their friendship, support and the remarkable moments we have shared.
I would like to thank Ana Simões, for her close friendship, for her support in the hard times throughout the course and in life and for all the good times. Also to her family, for their hospitality. Without any doubt a friend for life.
To my classmates and future MSc, I wish to thank you all for your support and friendship.
In loving memory of my grandmother - Fernanda Gabriel Marques Duarte dos Santos, a true life example, who always believed in me and to who I will be forever grateful for all the love, care and dedication she gave me throughout my life.

ix
Sumário
A redução do peso dos veículos constitui uma das soluções mais eficazes para a redução do consumo
de energia e das emissões de CO2 no sector dos transportes. Com os recentes avanços nas novas
tecnologias de fabrico, a produção de Tailor welded blanks (TWBs) em ligas de baixa densidade como
o alumínio tornou-se uma solução viável e económica.
O presente trabalho de investigação foi realizado no âmbito do projeto “LightBlank – make it lighter,
with less”, em curso no The Welding Institute (TWI), que tem como objetivo o desenvolvimento do
processo de soldadura por fricção linear (SFL) para a produção de TWBs em alumínio AA 6082-T6 de
espessuras dissimilares para a indústria automóvel, ferroviária e aeroespacial. Foram estudadas duas
combinações de espessuras: 3 com 5 mm e 2 com 2,5 mm.
Numa primeira fase, foram realizadas diversas soldaduras com combinações distintas de parâmetros
operatórios com o objetivo de identificar a janela de parâmetros mais adequada para cada ligação
dissimilar. Utilizando técnicas de análise metalográfica e ensaios mecânicos, foi possível caracterizar
a influência dos vários parâmetros nos cordões produzidos definindo assim a gama de parâmetros
operatórios que produziam cordões com maior resistência e velocidades de avanço maiores.
Para a combinação de espessuras de 3 com 5 mm, foi avaliada a influência na qualidade da soldadura
quando existe variação no alinhamento da ferramenta com a linha de soldadura e quando se coloca a
chapa mais espessa no lado em avanço, i.e. quando se altera a posição das chapas relativamente à
direção de avanço;
Os resultados obtidos demonstraram que para cada combinação de espessuras, existe um envelope
de parâmetros operatórios que permite a produção de soldaduras de qualidade retendo entre 65 e 85%
da resistência mecânica do material base.

xi
Abstract
Vehicle light-weighting has been identified as the most effective way of addressing the reduction of
energy consumption and CO2 emissions in the transportation industry. With recent advances in
manufacturing technologies, the production of tailor welded blanks (TWBs) from lightweight metal alloy
such as aluminium has become a viable and low cost solution.
The present research work was conducted in the framework of the ongoing project “LightBlank – make
it lighter, with less”, at The Welding Institute (TWI) aiming at the development of the friction stir welding
(FSW) process for the production of TWBs in aluminium AA 6082-T6 with dissimilar thickness for the
automotive, rail and aerospace industries. Two thickness combinations were addressed: 3 to 5 mm and
2 to 2.5 mm.
At first stage, multiple weld beads with different welding parameter combinations were produced in order
to determine the process window for each dissimilar joint. Using metallographic analysis techniques and
mechanical testing, the influence of the parameter combinations on the welded joints was characterized
which allowed to determine the parameter combination that produced the weld beads with the best
quality while maximizing the welding speed.
On the 3 to 5 mm thickness combination, extra tests were conducted to determine the influence in the
quality of the weld of a horizontal offset in the alignment of the tool with the joint line and the thicker
plate in the advancing side, i.e, a change in the plate positioning in relation to the welding direction.
The results have shown that for each thickness combination, there is a process parameter window which
allows the production welds with a suitable quality while retaining between 65 to 80 % of the base
material mechanical properties.

xiii
Palavras-chave
Soldadura dissimilar
Soldadura por fricção linear (SFL)
Tailor welded blanks (TWBs)
AA 6082-T6
Propriedades mecânicas
Keywords
Dissimilar welding
Friction stir welding (FSW)
Tailor welded blanks (TWBs)
AA 6082-T6
Mechanical properties

xv
List of Contents
Agradecimentos ..........................................................................................................................................v
Acknowledgements ................................................................................................................................... vii
Sumário ................................................................................................................................................... ix
Abstract.................................................................................................................................................... xi
Palavras-chave ...................................................................................................................................... xiii
Keywords ............................................................................................................................................... xiii
List of Contents ....................................................................................................................................... xv
List of Figures ....................................................................................................................................... xvii
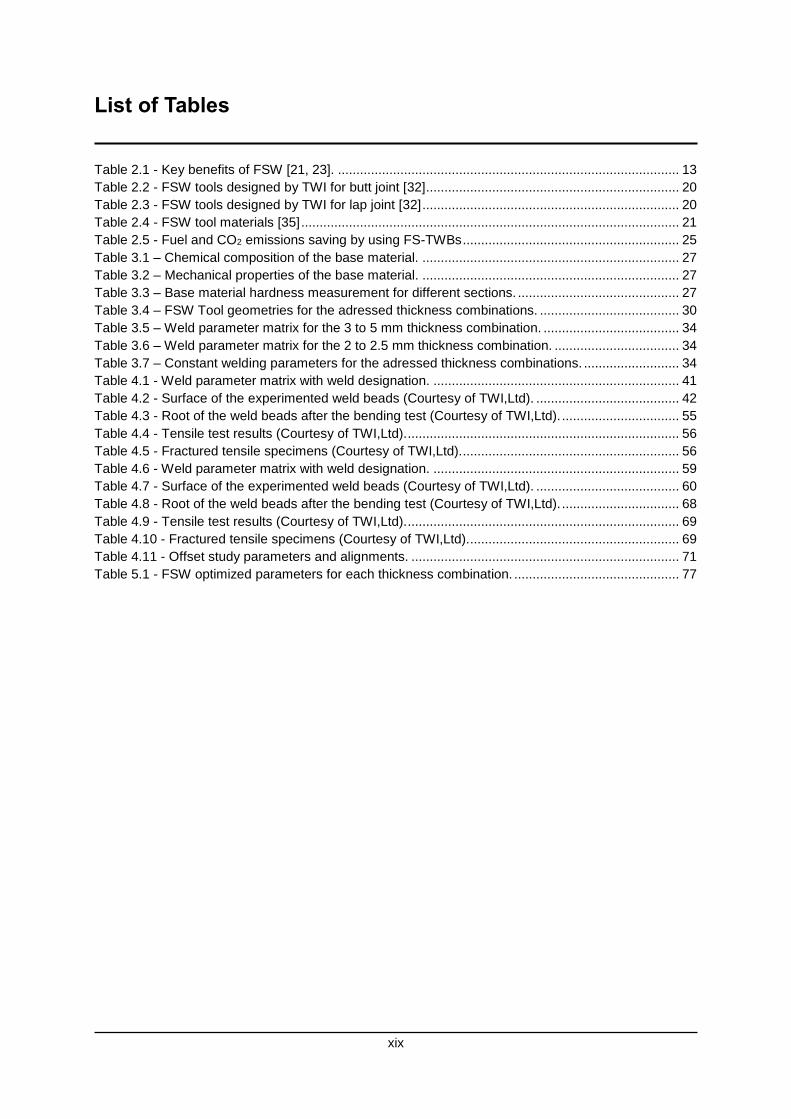
List of Tables ......................................................................................................................................... xix
Abbreviations ......................................................................................................................................... xxi
Symbols ................................................................................................................................................. xxi
Chapter 1 - Introduction ........................................................................................................................... 1
1.1 Motivation ................................................................................................................................ 1
1.2 Objectives ................................................................................................................................ 2
1.3 Structure .................................................................................................................................. 3
Chapter 2 - Literature review ................................................................................................................... 5
2.1 Tailor welded blanks ................................................................................................................ 5
2.1.1 Applications ......................................................................................................................... 6
2.1.2 Production processes: ......................................................................................................... 7
2.1.3 Strengths and weaknesses of TWBs technology ................................................................ 8
2.1.4 Joining processes ................................................................................................................ 9
2.1.5 Lightweight materials to produce TWBs: ........................................................................... 10
2.2 Friction Stir Welding .............................................................................................................. 12
2.2.1 Processed zone ................................................................................................................. 14
2.2.2 Process operating parameters .......................................................................................... 15
2.2.3 FSW Tools ......................................................................................................................... 17
2.2.4 Tool materials .................................................................................................................... 21
2.2.5 Defects ............................................................................................................................... 21
2.2.6 Applications ....................................................................................................................... 23
2.2.7 Feasibility of FSW to join TWBs ........................................................................................ 24
2.2.8 Conclusion ......................................................................................................................... 25
Chapter 3 - Experimental Setup ............................................................................................................ 27
3.1 Base material ......................................................................................................................... 27
3.2 FSW Equipment .................................................................................................................... 28
3.2.1 FW-28 ESAB SuperStirTM ................................................................................................ 28
3.2.2 FW-36 AWEA LP 4025Z .................................................................................................... 29
3.3 Tool materials and design ..................................................................................................... 29
3.4 Fixturing system .................................................................................................................... 31
3.5 Tilting systems ....................................................................................................................... 31
xvi
3.6 Pre-weld procedure ............................................................................................................... 33
3.7 FSW Parameter optimization ................................................................................................. 33
3.8 Characterization techniques .................................................................................................. 36
3.8.1 Visual inspection ................................................................................................................ 36
3.8.2 Metallographic analysis ..................................................................................................... 36
3.8.3 EBSD Mapping .................................................................................................................. 37
3.8.4 Hardness measurement .................................................................................................... 37
3.8.5 Bending tests ..................................................................................................................... 37
3.8.6 Tensile testing .................................................................................................................... 38
3.8.7 SEM Fractography ............................................................................................................. 38
3.8.8 X-Ray inspection................................................................................................................ 38
3.9 Other tests ............................................................................................................................. 38
3.9.1 Offset study ........................................................................................................................ 39
3.9.2 Inverted setup study .......................................................................................................... 39
Chapter 4 - Results and discussion ....................................................................................................... 41
4.1 TWBs 3-5 mm ........................................................................................................................ 41
4.1.1 Visual inspection ................................................................................................................ 41
4.1.2 Metallographic analysis ..................................................................................................... 43
4.1.3 EBSD Mapping .................................................................................................................. 47
4.1.4 Hardness measurement .................................................................................................... 50
4.1.5 Bending tests ..................................................................................................................... 54
4.1.6 Tensile tests ....................................................................................................................... 56
4.1.7 SEM Fractography ............................................................................................................. 57
4.1.8 X-Ray inspection................................................................................................................ 57
4.2 TWBs 2-2.5 mm ..................................................................................................................... 58
4.2.1 Visual inspection ................................................................................................................ 59
4.2.2 Metallographic analysis ..................................................................................................... 61
4.2.3 Hardness measurement .................................................................................................... 64
4.2.4 Bending tests ..................................................................................................................... 67
4.2.5 Tensile tests ....................................................................................................................... 69
4.2.6 SEM Fractography ............................................................................................................. 70
4.2.7 X-Ray inspection................................................................................................................ 70
4.3 Offset study............................................................................................................................ 71
4.3.1 Metallographic analysis ..................................................................................................... 71
4.4 Inverted setup ........................................................................................................................ 73
Chapter 5 - Conclusions and proposals for future work ........................................................................ 77
References ............................................................................................................................................ 79
Appendices ............................................................................................................................................ 83
xvii
List of Figures
Figure 2.1 - Tailored Blanks schematic chart .......................................................................................... 5 Figure 2.2 - Automotive applications for TWBs [1] .................................................................................. 7 Figure 2.3 - Comparison between the conventional process and TWBs process for the production of
formed components ................................................................................................................................. 8 Figure 2.4 - Schematic representation FSW process phases. [22] ....................................................... 13 Figure 2.5 - Typical macrograph of a FSW joint [25]. ............................................................................ 14 Figure 2.6 - (a) Fixed pin, (b) Adjustable pin and (c) Bobbin tool types [32] ......................................... 17 Figure 2.7 - Shouder shapes and features [32] ..................................................................................... 18 Figure 2.8 - FSW tool pins [32] .............................................................................................................. 19 Figure 2.9 - (a) worlTM and (b) MX triflutetm tool [32].............................................................................. 20 Figure 2.10 - FSW deffects: A) Void; B) Joint line remnant; C) Root flaw; D) Surface grove; E) Excessive
flash ....................................................................................................................................................... 22 Figure 3.1 - FW-28 ESAB SuperStirTM Friction Stir Welding machine. ................................................. 28 Figure 3.2 - FW-36 AWEA LP 4025Z Friction Stir Welding machine. ................................................... 29 Figure 3.3 - FSW Tools used for the 3 to 5 mm thickness combination. .............................................. 30 Figure 3.4 - FSW Tools used for the 2 to 2.5 mm thickness combination . .......................................... 30 Figure 3.5 - Fixturing system (Courtesy of TWI,Ltd). ............................................................................ 31 Figure 3.6 - Tilting system used on the FW-28 ESAB SuperStirTM . ..................................................... 32 Figure 3.7 - Tilting system developed for the FW-36 AWEA LP 4025Z . .............................................. 32 Figure 3.8 - Stages of the pre-weld procedure: ..................................................................................... 33 Figure 3.9 - Schematic drawing of the weld sample production............................................................ 35 Figure 3.10 - Welding setup for the 3 to 5 mm thickness combination. ................................................ 35 Figure 3.11 - Welding setup for the 2 to 2.5 mm thickness combination. ............................................. 35 Figure 3.12 - Sample extraction plan. ................................................................................................... 36 Figure 3.13 - Schematic drawing of the microhardness indentation lines for the 3 to 5 mm . .............. 37 Figure 3.14 - Schematic drawing of the microhardness indentation lines for the 2 to 2.5 mm . ........... 37 Figure 3.15 - Schematic drawing of a wrap-around guided bend test machine [Site TWI] ................... 38 Figure 4.1 - Base material macrograph perpendicular to the rolling direction: A) 5 mm and B) 3 mm. 43 Figure 4.2 - Cross section macrograph of sample W5 (𝑣 = 600 mm/min; 𝜔 = 1000 rev/min) with detailed
micrographs ........................................................................................................................................... 43 Figure 4.3 - Cross section macrograph of sample W7 (𝑣 = 480 mm/min; 𝜔 = 800 rev/min) with detailed
micrographs ........................................................................................................................................... 44 Figure 4.4 - Cross section macrograph of sample W8 (𝑣 = 640 mm/min; 𝜔 = 800 rev/min) with detailed
micrographs ........................................................................................................................................... 44 Figure 4.5 - Cross section macrograph of sample W11 (𝑣 = 720 mm/min; 𝜔 = 1200 rev/min) with detailed
micrographs ........................................................................................................................................... 44 Figure 4.6 - Cross section macrograph of sample W14 (𝑣 = 700 mm/min; 𝜔 = 1000 rev/min) with detailed
micrographs ........................................................................................................................................... 45 Figure 4.7 - Cross section macrograph of sample W15 (𝑣 = 560 mm/min; 𝜔 = 800 rev/min) with detailed
micrographs ........................................................................................................................................... 45 Figure 4.8 - Cross section macrograph of sample W17 (𝑣 = 500 mm/min; 𝜔 = 1000 rev/min) with detailed
micrographs ........................................................................................................................................... 45 Figure 4.9 - Cross section macrograph of sample W18 (𝑣 = 600 mm/min; 𝜔 = 1200 rev/min) with detailed
micrographs ........................................................................................................................................... 46 Figure 4.10 - Cross section macrograph of sample W19 (𝑣 = 400 mm/min; 𝜔 = 800 rev/min) with detailed
micrographs ........................................................................................................................................... 46 Figure 4.11 - Cross section macrograph of sample W14 (𝑣 = 700 mm/min; 𝜔 = 1000 rev/min) with EBSD
mapping regions . .................................................................................................................................. 47 Figure 4.12 - EBSD mapping from region A .......................................................................................... 48
xviii
Figure 4.13 - EBSD mapping from region B .......................................................................................... 48 Figure 4.14 - EBSD mapping from region C with respective IPF relative to the surface normal .......... 49 Figure 4.15 - Grain size and intergranular misorientation from posicion A. .......................................... 50 Figure 4.16 - Grain size and intergranular misorientation from posicion B. .......................................... 50 Figure 4.17 - Grain size and intergranular misorientation from posicion B. .......................................... 50 Figure 4.18 - Hardness profile of sample W5 (𝑣 = 600 mm/min; 𝜔 = 1000 rev/min). ........................... 51 Figure 4.19 - Hardness profile of sample W7 (𝑣 = 480 mm/min; 𝜔 = 800 rev/min). ............................. 51 Figure 4.20 - Hardness profile of sample W8 (𝑣 = 640 mm/min; 𝜔 = 800 rev/min). ............................. 51 Figure 4.21 - Hardness profile of sample W11 (𝑣 = 720 mm/min; 𝜔 = 1200 rev/min). ......................... 52 Figure 4.22 - Hardness profile of sample W14 (𝑣 = 700 mm/min; 𝜔 = 1000 rev/min). ......................... 52 Figure 4.23 - Hardness profile of sample W15 (𝑣 = 560 mm/min; 𝜔 = 800 rev/min). ........................... 52 Figure 4.24 - Hardness profile of sample W17 (𝑣 = 500 mm/min; 𝜔 = 1000 rev/min). ......................... 53 Figure 4.25 - Hardness profile of sample W18 (𝑣 = 600 mm/min; 𝜔 = 1200 rev/min). ......................... 53 Figure 4.26 - Hardness profile of sample W19 (𝑣 = 400 mm/min; 𝜔 = 800 rev/min). ........................... 53 Figure 4.27 - A) Fracture surface of sample W14 (𝑣 = 700 mm/min; 𝜔 = 1000 rev/min) and B)
magnification. ........................................................................................................................................ 57 Figure 4.28 - Full welded panel for X-Ray inspection .......................................................................... 58 Figure 4.29 - Radiograph of the beginning of the weld bead . .............................................................. 58 Figure 4.30 - Radiograph of the end of the weld bead . ........................................................................ 58 Figure 4.31 - Base material macrograph perpendicular to the rolling direction: A) 2.5 mm and B) 2 mm.
............................................................................................................................................................... 61 Figure 4.32 - Cross section macrograph of sample W12 (𝑣 = 1200 mm/min; 𝜔 = 2000 rev/min) with
detailed micrographs ............................................................................................................................. 61 Figure 4.33 - Cross section macrograph of sample W13 (𝑣 = 1400 mm/min; 𝜔 = 2000 rev/min) with
detailed micrographs ............................................................................................................................. 62 Figure 4.34 - Cross section macrograph of sample W20 (𝑣 = 1225 mm/min; 𝜔 = 1750 rev/min) with
detailed micrographs ............................................................................................................................. 62 Figure 4.35 - Cross section macrograph of sample W23 (𝑣 = 900 mm/min; 𝜔 = 1500 rev/min) with
detailed micrographs ............................................................................................................................. 62 Figure 4.36 - Cross section macrograph of sample W24 (𝑣 = 1050 mm/min; 𝜔 = 1500 rev/min) with
detailed micrographs ............................................................................................................................. 63 Figure 4.37 - Cross section macrograph of sample W25 (𝑣 = 750 mm/min; 𝜔 = 1500 rev/min) with
detailed micrographs ............................................................................................................................. 63 Figure 4.38 - Cross section macrograph of sample W34 (𝑣 = 1000 mm/min; 𝜔 = 2000 rev/min) with
detailed micrographs ............................................................................................................................. 63 Figure 4.39 - Hardness profile of sample W12 (𝑣 = 1200 mm/min; 𝜔 = 2000 rev/min). ....................... 65 Figure 4.40 - Hardness profile of sample W13 (𝑣 = 1400 mm/min; 𝜔 = 2000 rev/min). ....................... 65 Figure 4.41 - Hardness profile of sample W20 (𝑣 = 1225 mm/min; 𝜔 = 1750 rev/min). ....................... 65 Figure 4.42 - Hardness profile of sample W23 (𝑣 = 900 mm/min; 𝜔 = 1500 rev/min). ......................... 66 Figure 4.43 - Hardness profile of sample W24 (𝑣 = 1050 mm/min; 𝜔 = 1500 rev/min). ....................... 66 Figure 4.44 - Hardness profile of sample W25 (𝑣 = 750 mm/min; 𝜔 = 1500 rev/min). ......................... 66 Figure 4.45 - Hardness profile of sample W34 (𝑣 = 1000 mm/min; 𝜔 = 2000 rev/min). ....................... 67 Figure 4.46 - A) Fracture surface of sample W12 (𝑣 = 1200 mm/min; 𝜔 = 2000 rev/min) and B)
magnification. ........................................................................................................................................ 70 Figure 4.47 - Radiograph of the beginning of the weld bead. ............................................................... 70 Figure 4.48 - Radiograph of the end of the weld bead. ......................................................................... 71 Figure 4.49 - Cross section macrographs of the welds with different alignments. ................................ 72 Figure 4.50 - Surface of the weld bead. ................................................................................................ 73 Figure 4.51 - Weld data from W14 (𝑣 = 700 mm/min; 𝜔 = 1000 rev/min) A) during parameter optimization
and B) during the inverted setup study .................................................................................................. 74 Figure 4.52 - Cross section macrograph of the weld bead produced during the inverted setup study . 75
xix
List of Tables
Table 2.1 - Key benefits of FSW [21, 23]. ............................................................................................. 13 Table 2.2 - FSW tools designed by TWI for butt joint [32] ..................................................................... 20 Table 2.3 - FSW tools designed by TWI for lap joint [32] ...................................................................... 20 Table 2.4 - FSW tool materials [35] ....................................................................................................... 21 Table 2.5 - Fuel and CO2 emissions saving by using FS-TWBs ........................................................... 25 Table 3.1 – Chemical composition of the base material. ...................................................................... 27 Table 3.2 – Mechanical properties of the base material. ...................................................................... 27 Table 3.3 – Base material hardness measurement for different sections. ............................................ 27 Table 3.4 – FSW Tool geometries for the adressed thickness combinations. ...................................... 30 Table 3.5 – Weld parameter matrix for the 3 to 5 mm thickness combination. ..................................... 34 Table 3.6 – Weld parameter matrix for the 2 to 2.5 mm thickness combination. .................................. 34 Table 3.7 – Constant welding parameters for the adressed thickness combinations. .......................... 34 Table 4.1 - Weld parameter matrix with weld designation. ................................................................... 41 Table 4.2 - Surface of the experimented weld beads (Courtesy of TWI,Ltd). ....................................... 42 Table 4.3 - Root of the weld beads after the bending test (Courtesy of TWI,Ltd). ................................ 55 Table 4.4 - Tensile test results (Courtesy of TWI,Ltd). .......................................................................... 56 Table 4.5 - Fractured tensile specimens (Courtesy of TWI,Ltd)............................................................ 56 Table 4.6 - Weld parameter matrix with weld designation. ................................................................... 59 Table 4.7 - Surface of the experimented weld beads (Courtesy of TWI,Ltd). ....................................... 60 Table 4.8 - Root of the weld beads after the bending test (Courtesy of TWI,Ltd). ................................ 68 Table 4.9 - Tensile test results (Courtesy of TWI,Ltd). .......................................................................... 69 Table 4.10 - Fractured tensile specimens (Courtesy of TWI,Ltd).......................................................... 69 Table 4.11 - Offset study parameters and alignments. ......................................................................... 71 Table 5.1 - FSW optimized parameters for each thickness combination. ............................................. 77

xxi
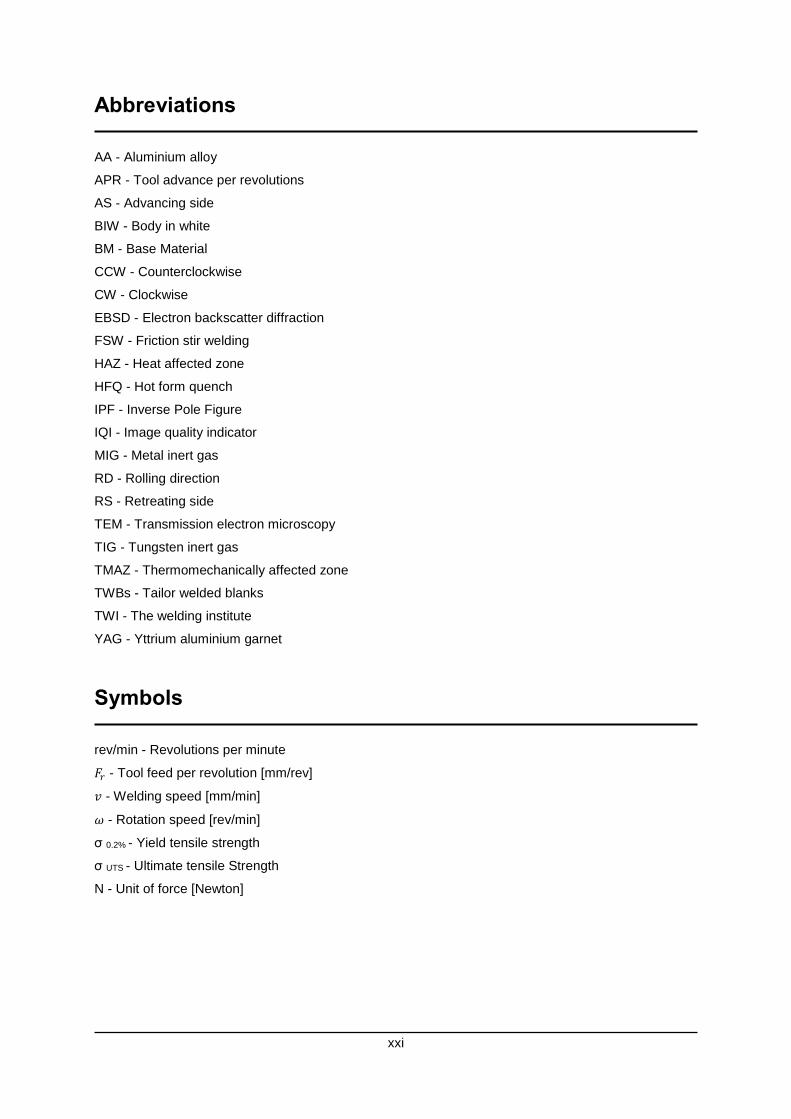
Abbreviations
AA - Aluminium alloy
APR - Tool advance per revolutions
AS - Advancing side
BIW - Body in white
BM - Base Material
CCW - Counterclockwise
CW - Clockwise
EBSD - Electron backscatter diffraction
FSW - Friction stir welding
HAZ - Heat affected zone
HFQ - Hot form quench
IPF - Inverse Pole Figure
IQI - Image quality indicator
MIG - Metal inert gas
RD - Rolling direction
RS - Retreating side
TEM - Transmission electron microscopy
TIG - Tungsten inert gas
TMAZ - Thermomechanically affected zone
TWBs - Tailor welded blanks
TWI - The welding institute
YAG - Yttrium aluminium garnet
Symbols
rev/min - Revolutions per minute
𝐹𝑟 - Tool feed per revolution [mm/rev]
𝑣 - Welding speed [mm/min]
𝜔 - Rotation speed [rev/min]
σ 0.2% - Yield tensile strength
σ UTS - Ultimate tensile Strength
N - Unit of force [Newton]

Chapter 1 – Introduction
1
Chapter 1 - Introduction
1.1 Motivation
Climate changes as a result of human activity might be the most important challenge for society in the
twenty-first century. These environmental concerns have forced governments to impose regulations to
try to revert the trend. In 2009, a new EU regulation on CO2 emission was issued which committed
European car manufacturers to cut the average CO2 emissions for new cars from 130 in 2015 to 95
g/km by 2020. This compelled the automotive manufacturers to research and develop new technologies
to reduce fuel consumption and CO2 emissions to meet new regulations while delivering improved fuel
economy for their customers. Vehicle light-weighting has been identified as one of the most effective
ways to address this challenge.
Tailor welded blanks (TWBs) are semi-finished parts typically produced by joining sheets with different
thicknesses that are subjected to forming processes like drawing or stamping. TWBs can also be
produced by joining dissimilar alloys or materials with different properties and surface coatings. Its use
in the automotive industry in the last decade has increased significantly as a method of minimizing part
weight without compromising the vehicle’s structural integrity and crashworthiness and also improving
its performance and functionality. Amongst the main advantages of using TWBs, manufacturers are
interested in the reduction of vehicle weight and gross raw material costs as well as the ability to tailor
the component to meet the functional requirements more efficiently. The use of structural aluminium
alloys for the production of TWBs is a good alternative to the conventional high strength steel alloys due
to higher strength to density ratio of aluminium and good corrosion resistance, increasing weight savings
per part.
Fusion welding of aluminium alloys can involve numerous challenges in some applications. Hot cracking,
porosity, loss of alloying elements, grain boundary melting in the HAZ and thermal distortions are some
of the main problems that make conventional fusion welding processes of aluminium an unattractive
solution. The inherent properties of aluminium like low melting temperature, surface oxide formation,
high reflectivity, high thermal conductivity and low surface tension when in a molten state also contribute
to other flaws. Laser welding has been developed as a potential solution but the cost of implementing
the technology often limits its application and does not solve the problems mentioned.
Friction stir welding (FSW), invented by Wayne Thomas at TWI in December 1991, is a solid state
process which produces high integrity joints in difficult to weld materials such as aluminium. Since its
invention and due to the intensive research on the process, it is fast becoming the technique of choice
for manufacturing lightweight boats, trains and aeroplanes.
Chapter 1 – Introduction
2
1.2 Objectives
The present thesis was developed within the framework of a 3 year project called “LightBlank – Make It
Lighter with Less” funded by the Innovate UK funding body. The aim of this project is to develop and
fully implement the manufacturing route for the next generation of lighter aluminium alloy sheet metal
panels by combining FSW with a novel forming technology called Heat treatment Forming and in-die
Quenching (HFQ). The “LightBlank” project envisages the development of the HFQ/FSW manufacturing
route mainly with a focus on the auto, rail and aerospace applications.
Within this broad topic, the present thesis focused on developing a FSW procedure to join TWBs made
from: AA 6082-T6, combining sheets with a thickness of 2 to 2.5 mm and 3 to 5 mm. The main objectives
of this study were:
1. To design and test FSW tools for the two case studies under consideration.
2. To design and manufacture panel fixturing systems that allow to demonstrate various approaches
and thicknesses.
3. To investigate the effect of process parameters on joint quality through metallographic analysis
and mechanical testing.
4. To determine the set of parameters for each addressed thickness combination that produced the
joint with the best mechanical properties.
Due to timeline constraints inherent to an MSc thesis, the present work focused only on the development
of FSW technology for the production of the aluminium TWBs. The subsequent forming developments
are outside of the scope of the present thesis and will be addressed as future work.
Chapter 1 – Introduction
3
1.3 Structure
The present thesis was structured as follows:
Chapter 2 provides an overview of the state of the art, summarizing the most relevant findings and
breakthroughs reported in literature as far as FSW is concerned. This chapter aims to establish both a
theoretical basis and a framework for result analysis and discussion throughout the present thesis.
Chapter 3 depicts the experimental methodology and characterization techniques adopted. A brief
description of the base materials is included, as well as, the characterization of the welding equipment,
tool design and clamping system developed. The tested range of process parameters is presented.
Finally, the techniques used to perform metallographic analysis and mechanical testing are described.
Chapter 4 reports discusses the results achieved. This chapter was divided into two main sections,
addressing the results obtained for each thickness combination separately.
Main conclusions are presented in Chapter 5.
Chapter 6 presents proposals for future work developments.


Chapter 2 – Literature review
5
Chapter 2 - Literature review
2.1 Tailor welded blanks
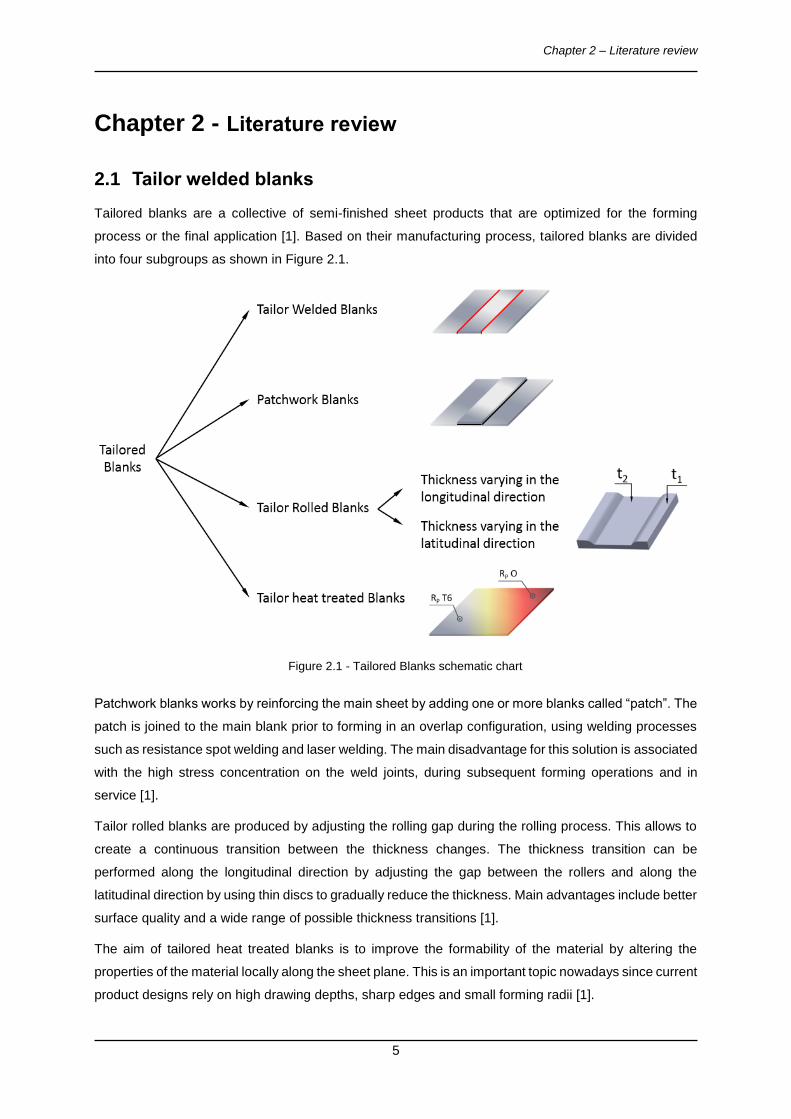
Tailored blanks are a collective of semi-finished sheet products that are optimized for the forming
process or the final application [1]. Based on their manufacturing process, tailored blanks are divided
into four subgroups as shown in Figure 2.1.
Figure 2.1 - Tailored Blanks schematic chart
Patchwork blanks works by reinforcing the main sheet by adding one or more blanks called “patch”. The
patch is joined to the main blank prior to forming in an overlap configuration, using welding processes
such as resistance spot welding and laser welding. The main disadvantage for this solution is associated
with the high stress concentration on the weld joints, during subsequent forming operations and in
service [1].
Tailor rolled blanks are produced by adjusting the rolling gap during the rolling process. This allows to
create a continuous transition between the thickness changes. The thickness transition can be
performed along the longitudinal direction by adjusting the gap between the rollers and along the
latitudinal direction by using thin discs to gradually reduce the thickness. Main advantages include better
surface quality and a wide range of possible thickness transitions [1].
The aim of tailored heat treated blanks is to improve the formability of the material by altering the
properties of the material locally along the sheet plane. This is an important topic nowadays since current
product designs rely on high drawing depths, sharp edges and small forming radii [1].
Chapter 2 – Literature review
6
Tailor welded blanks (TWBs) are semi-finished parts that consist of at least two single sheets which are
characterized by different thicknesses, materials, coatings or material properties. These sheets are
welded together prior to the forming process that brings the assembly to its final structural shape. Tailor
made blanks use the same principle as TWBs but uses other joining methods than welding, e.g.
adhesive bonding [1, 2]. This manufacturing solution allows engineers to make optimal use of the
different mechanical properties of the blank material by applying the suitable material at the location
where it is necessary and to develop more efficient component designs that reduce the weight of the
component and the raw material used for production [3, 4]. In industry sectors where weight saving is a
priority, such as automotive, rail and aerospace manufacturers, this solution has been adopted to reduce
the vehicle kerb weight, reducing its energy consumption without compromising its performance or
crashworthiness [5].
The concept of TWBs was patented in the USA in 1968 by the Budd Company, an automotive parts
manufacturer. In Europe, the first automotive application for TWBs was introduced by the Swedish
automotive manufacturer Volvo in 1979. TWBs were produced by resistance mash seam welding and
later by induction butt-welding process to enhance the design possibilities and the efficiency of
production [6]. In 1983, Thyssen Stahl partnered with Audi to produce an oversized galvanized floor
panels for the Audi 100 using laser welding. The first Japanese car manufacturer to use TWBs
technology in their designs was Toyota to produce sunroof pressings using laser welding in 1986. In the
USA, General motors was an early user and in 1993 acquired a line for producing four- and five piece
body sides. Since then, the use of TWBs in the automotive sector has increased significantly as a
solution to satisfy the demand for more efficient vehicles. In 1998, TWI started a study on aluminium
tailored welded blanks for door panels and demonstrated new concepts for FSW drive shafts and space
frames for BMW, Chrysler, EWI, Ford, General Motors Rover, Tower automotive and Volvo [7]. In 2000
the European market exceeded 50 million TWBs produced followed by the USA and Japanese market
with a production of 30 million TWBs [8]. Current production rates worldwide are estimated to be
between 200 and 250 million laser welded blanks per year [5].
2.1.1 Applications
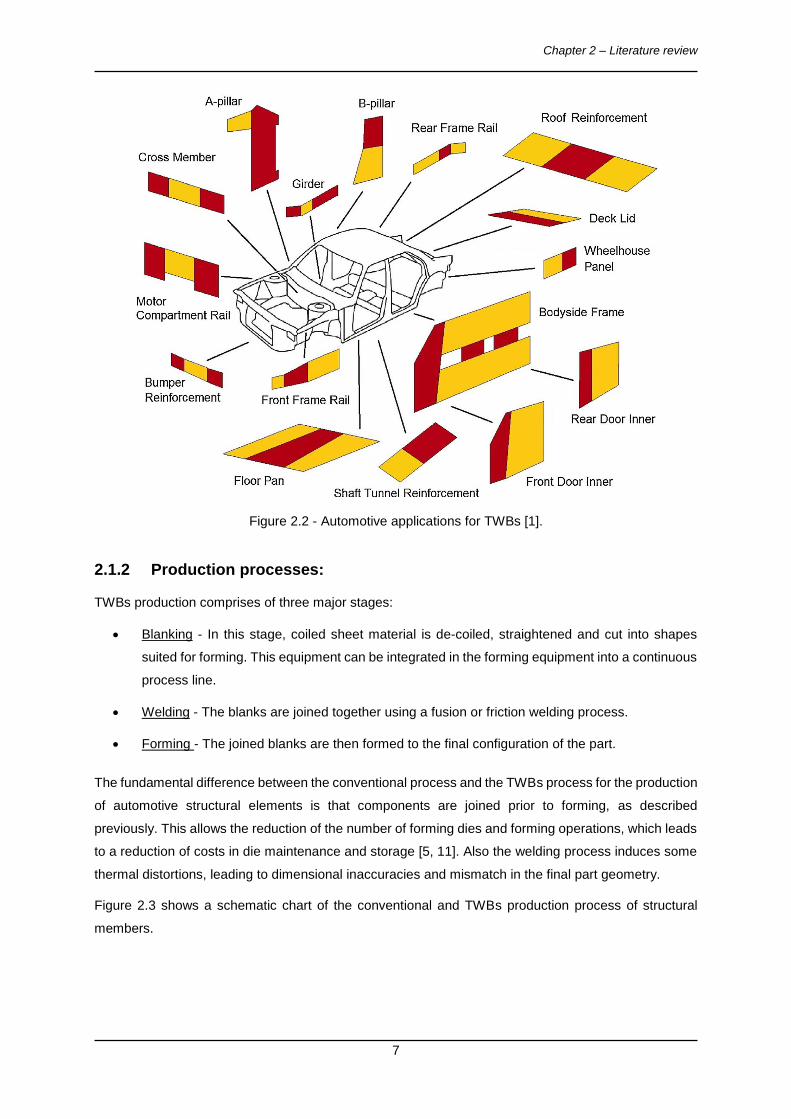
Figure 2.2 shows several typical components where TWBs technology has been used in an automobile.
In the automotive industry, TWBs are mainly applied for the body in white (BIW) structures. The BIW
consists of the various components of the car body joined together, prior the assembly of moving parts
(e.g. doors) the motor, chassis sub-assemblies or trim (e.g. seats, electronics) have been added. The
BIW comprises up to 70% of the overall car weight, so using TWBs in this area has a significant effect
on the vehicle kerb weight [9]. It should be noted that, although only automotive applications are
demonstrated in this picture, other industries such as aerospace and rail incorporate TWBs in to their
designs. In the Airbus A318 and A380 the lower fuselage skin panels are joined with the stringers using
laser welding [10].
Chapter 2 – Literature review
7
Figure 2.2 - Automotive applications for TWBs [1].
2.1.2 Production processes:
TWBs production comprises of three major stages:
Blanking - In this stage, coiled sheet material is de-coiled, straightened and cut into shapes
suited for forming. This equipment can be integrated in the forming equipment into a continuous
process line.
Welding - The blanks are joined together using a fusion or friction welding process.
Forming - The joined blanks are then formed to the final configuration of the part.
The fundamental difference between the conventional process and the TWBs process for the production
of automotive structural elements is that components are joined prior to forming, as described
previously. This allows the reduction of the number of forming dies and forming operations, which leads
to a reduction of costs in die maintenance and storage [5, 11]. Also the welding process induces some
thermal distortions, leading to dimensional inaccuracies and mismatch in the final part geometry.
Figure 2.3 shows a schematic chart of the conventional and TWBs production process of structural
members.
Chapter 2 – Literature review
8
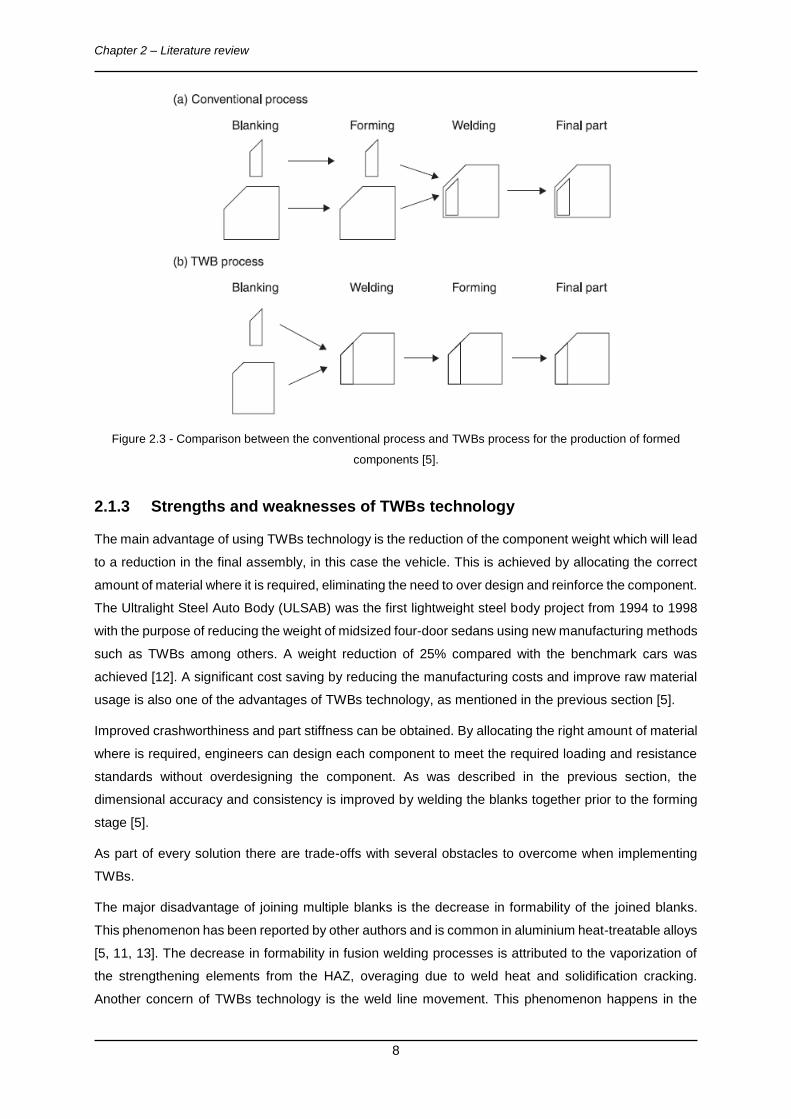
Figure 2.3 - Comparison between the conventional process and TWBs process for the production of formed
components [5].
2.1.3 Strengths and weaknesses of TWBs technology
The main advantage of using TWBs technology is the reduction of the component weight which will lead
to a reduction in the final assembly, in this case the vehicle. This is achieved by allocating the correct
amount of material where it is required, eliminating the need to over design and reinforce the component.
The Ultralight Steel Auto Body (ULSAB) was the first lightweight steel body project from 1994 to 1998
with the purpose of reducing the weight of midsized four-door sedans using new manufacturing methods
such as TWBs among others. A weight reduction of 25% compared with the benchmark cars was
achieved [12]. A significant cost saving by reducing the manufacturing costs and improve raw material
usage is also one of the advantages of TWBs technology, as mentioned in the previous section [5].
Improved crashworthiness and part stiffness can be obtained. By allocating the right amount of material
where is required, engineers can design each component to meet the required loading and resistance
standards without overdesigning the component. As was described in the previous section, the
dimensional accuracy and consistency is improved by welding the blanks together prior to the forming
stage [5].
As part of every solution there are trade-offs with several obstacles to overcome when implementing
TWBs.
The major disadvantage of joining multiple blanks is the decrease in formability of the joined blanks.
This phenomenon has been reported by other authors and is common in aluminium heat-treatable alloys
[5, 11, 13]. The decrease in formability in fusion welding processes is attributed to the vaporization of
the strengthening elements from the HAZ, overaging due to weld heat and solidification cracking.
Another concern of TWBs technology is the weld line movement. This phenomenon happens in the
Chapter 2 – Literature review
9
forming stage if the strain direction is transverse to the weld line, concentrating the material deformation
in the thinner/weaker material. This causes premature failure due to excessive strain and potential
elongation reductions in the HAZ. Weld line movement also limits the possibilities for the automotive
designer to position the material properties in the stamping where desired [5].
2.1.4 Joining processes
The structural integrity of the tailor welded blank is entirely dependent on the integrity of the joint between
the two materials. Nowadays, laser and electron beam welding are the most frequently used fusion
welding process for production of TWBs due to high welding speeds and small HAZ which contribute
for a smaller impact on the material properties. Due to the increasing demand for joining materials that
are not easily welded by fusion processes, FSW has become an attractive solution and one of the most
used processes for the production of TWBs. However other processes such as tungsten inert gas (TIG),
metal inert gas (MIG), resistance spot and mash seam welding have also been used for joining TWBs
[13]. Historically, European automakers seem to prefer solid state welding while the Japanese and
United States automakers use laser welding more frequently [5].
Mash seam welding was one of the first methods used for the production of TWBs, as described
previously, which is gradually becoming obsolete in the automotive industry due to the high productivity
and microstructural qualities of other processes. However, the joints from this process are made at lower
temperatures compared to laser which provides better formability to the blanks. Resistance spot welding
is widely applied in automotive industry and is a process with high productivity. This process is suitable
for joining automotive structural members and for production of TWBs by conventional production
methods as described in Figure 2.3 since it produces a non-continuous joint. However this is not a
suitable joint for subsequent forming and is a prone site for corrosion due to the coating removal during
weld. Arc welding processes, such as TIG and MIG, are quite popular in industry for being flexible
processes, readily available, easily adaptable to robotic automation and the production of low cost
welds. Yet this process is prone to catastrophically defects such as porosity, lack of fusion, undercutting
and material inclusions in the weld bead. [5, 14].
In laser welding, a laser beam is focused and irradiated on the specimen to generate heat. This fusion
welding process features keyhole penetration which delivers highly concentrated energy within a
restricted processing zone, resulting in rapid solidification of the weld metal and producing a high
welding quality-productivity combination. Due to high welding speeds, less heat is released to the base
material resulting in improved mechanical properties. CO2 laser has the highest power and is most
commonly used. YAG laser is also very popular for welding aluminium since the lower frequency
reduces energy loss by light reflection from the workpiece. Diode laser is a high power laser that has
received rapid development in recent years but due to less energy concentration, more heat will disperse
into the base material. Laser welding has been the most frequently used process for producing TWBs
due to the lower cost and greater flexibility compared to electron beam welding. However, laser welding
has some drawbacks such as the formation of intermetallic compounds as a result of high heat input
Chapter 2 – Literature review
10
which affects the formability of the TWBs. Common defects from fusion joining processes such as hot
cracking, porosity and grain boundary melting in the HAZ also arise from laser welding. [5, 14-16].
FSW is a solid state joining process that will be addressed later in this thesis.
2.1.5 Lightweight materials to produce TWBs:
In any product, the greatest weight reduction is achieved by a decrease in density of the used materials.
That said, the use of lightweight materials in the transport industry has increased due to government
regulations, consumer demand and environmental concerns. The term Lightweight materials has
traditionally been given to both aluminium and magnesium since they are frequently used to reduce the
weight of component and structures. Titanium and beryllium are also lightweight materials but its use is
limited to specific applications such as aerospace. These metals have a considerably lower density
compared to steel, which is still the predominantly used metal for the production of automotive body
parts and structural members [17, 18].
Besides the lower density, aluminium has interesting properties for the transport industry such as
superior corrosion resistance due to the presence of surface oxides (Al2O3), natural and chemical
inertness, flexibility both in design and machining, high fracture toughness and energy absorption
capacity. In addition to these properties, aluminium also has high thermal and electrical conductivity,
emissivity, cryogenic toughness and fatigue strength. Aluminium is also highly recyclable and the
remelting of scrap aluminium requires only 5% of the energy needed to extract the same weight of
primary metal from its ore bauxite. Aluminium alloys are widely present in our day-to-day life as thin
foils, beverage cans, structural members in public transport systems, aircraft parts among others [13,
18].
In the automotive sector, both wrought and cast aluminium alloys have been widely used. Cast alloys
are generally used to produce engine blocks and its components, wheels and suspension components
while wrought aluminium alloys are used to produce body structures and panels. The production of
TWBs using aluminium alloys for automotive applications results in a further weight reduction [1, 5, 19].
However, aluminium has a poor weldability by conventional fusion processes due to the presence of
surface oxides (Al2O3), its high reflectivity and thermal conductivity, low molten viscosity and low melting
temperature. This leads to defects like porosity, hot cracking in the fusion zone, loss of alloying elements
by vaporization, grain boundary melting in the HAZ and loss of strength. The current required to weld
aluminium by resistance spot welding is also greater than the one required for steel by a factor of 3. MIG
welding requires high heat transfer which increases the size of the HAZ and can induce thermal
distortions. The high reflectivity of aluminium reduces the efficiency of the laser welding process for
aluminium. To overcome this obstacles, laser absorption has been improved by increasing the power
density of the beam requiring more energy from the machine which produce a wider HAZ and induces
the formation of intermetallics. Intermetallics are most common in dissimilar joining between aluminium
and steel [1, 13, 19]
Chapter 2 – Literature review
11
Friction stir welding (FSW), as a solid-state process, generates less heat in the weld area than fusion
welding since there is no molten material. This allows to create a sound weld between similar or
dissimilar materials by limiting the formation of intermetallics and the loss of material properties in the
HAZ [13]. FSW and its applications will be addressed in greater detail bellow.
Chapter 2 – Literature review
12
2.2 Friction Stir Welding
Friction stir welding (FSW) is a solid-state joining process that was invented and patented at The
Welding Institute (TWI, Ltd) in 1991 by Wayne Thomas [20] and represents a significant breakthrough
in the metal joining technology by producing high integrity joints in materials that are difficult or even
deemed non-weldable by conventional fusion joining processes, particularly the 2XXX and 7XXX series
aluminium alloys. Since its invention and rapid adoption it is fast becoming the technique of choice for
manufacturing lightweight transport vehicles and other structures where high strength, low weight, good
toughness and excellent fatigue life are required [21].
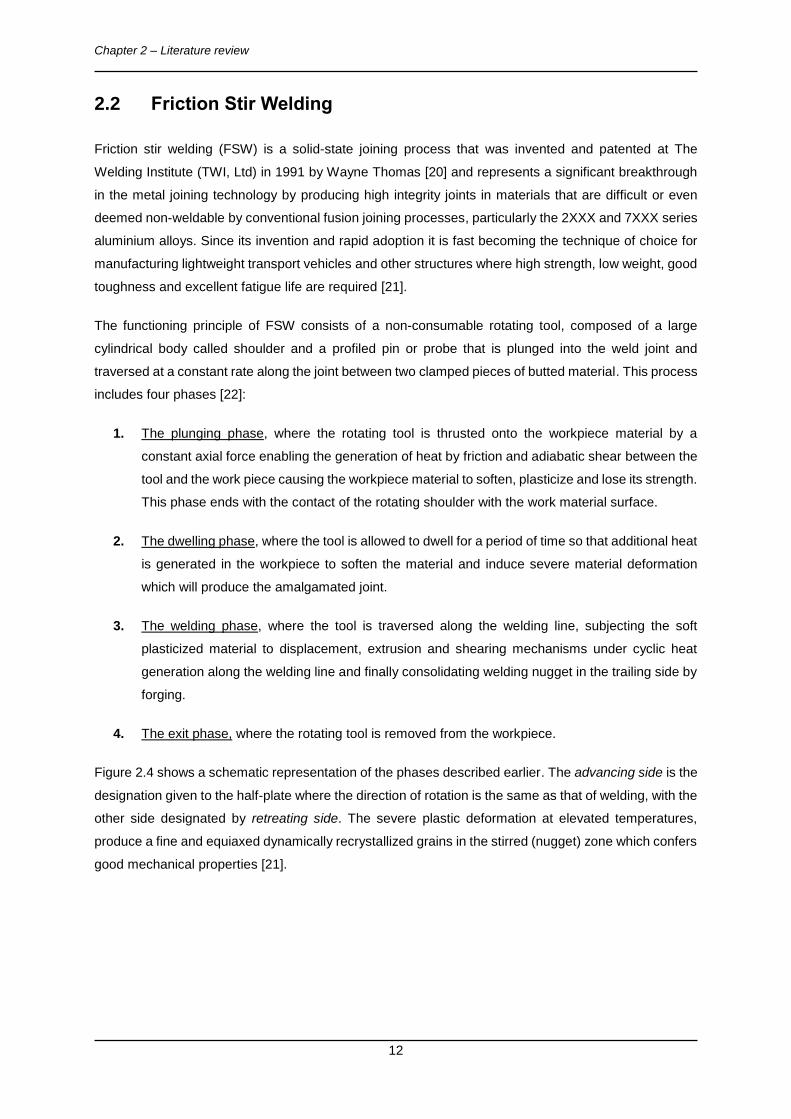
The functioning principle of FSW consists of a non-consumable rotating tool, composed of a large
cylindrical body called shoulder and a profiled pin or probe that is plunged into the weld joint and
traversed at a constant rate along the joint between two clamped pieces of butted material. This process
includes four phases [22]:
1. The plunging phase, where the rotating tool is thrusted onto the workpiece material by a
constant axial force enabling the generation of heat by friction and adiabatic shear between the
tool and the work piece causing the workpiece material to soften, plasticize and lose its strength.
This phase ends with the contact of the rotating shoulder with the work material surface.
2. The dwelling phase, where the tool is allowed to dwell for a period of time so that additional heat
is generated in the workpiece to soften the material and induce severe material deformation
which will produce the amalgamated joint.
3. The welding phase, where the tool is traversed along the welding line, subjecting the soft
plasticized material to displacement, extrusion and shearing mechanisms under cyclic heat
generation along the welding line and finally consolidating welding nugget in the trailing side by
forging.
4. The exit phase, where the rotating tool is removed from the workpiece.
Figure 2.4 shows a schematic representation of the phases described earlier. The advancing side is the
designation given to the half-plate where the direction of rotation is the same as that of welding, with the
other side designated by retreating side. The severe plastic deformation at elevated temperatures,
produce a fine and equiaxed dynamically recrystallized grains in the stirred (nugget) zone which confers
good mechanical properties [21].
Chapter 2 – Literature review
13
Figure 2.4 – Schematic representation FSW process phases. [22]
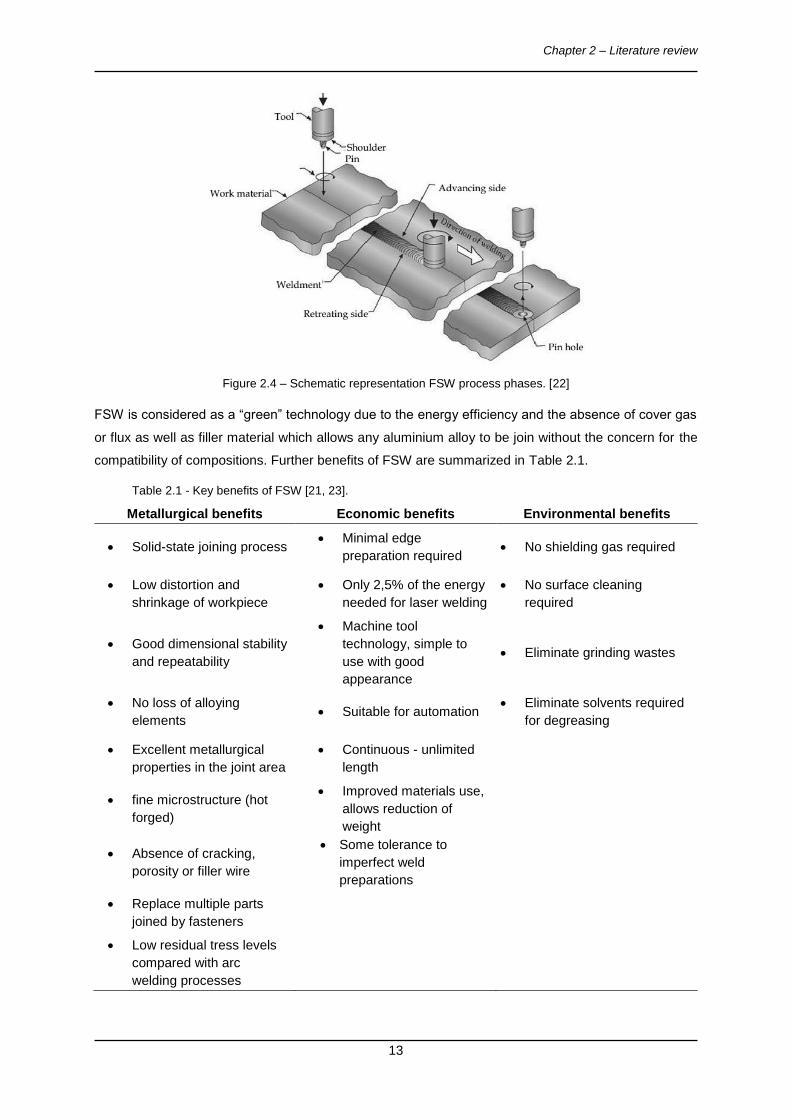
FSW is considered as a “green” technology due to the energy efficiency and the absence of cover gas
or flux as well as filler material which allows any aluminium alloy to be join without the concern for the
compatibility of compositions. Further benefits of FSW are summarized in Table 2.1.
Table 2.1 - Key benefits of FSW [21, 23].
Metallurgical benefits Economic benefits Environmental benefits
Solid-state joining process Minimal edge
preparation required No shielding gas required
Low distortion and
shrinkage of workpiece
Only 2,5% of the energy
needed for laser welding
No surface cleaning
required
Good dimensional stability
and repeatability
Machine tool
technology, simple to
use with good
appearance
Eliminate grinding wastes
No loss of alloying
elements Suitable for automation
Eliminate solvents required
for degreasing
Excellent metallurgical
properties in the joint area
Continuous - unlimited
length
fine microstructure (hot
forged)
Improved materials use,
allows reduction of
weight
Absence of cracking,
porosity or filler wire
Some tolerance to
imperfect weld
preparations
Replace multiple parts
joined by fasteners
Low residual tress levels
compared with arc
welding processes
Chapter 2 – Literature review
14
FSW, like other processes, is not exempt from limitations and disadvantages. Current limitations of the
FSW process are [23, 24]:
Backing anvil required (except bobbin stir);
Low traverse speed;
Tool wear as a limiting factor in high-strength alloys
Application not as flexible as certain arc welding processes.
2.2.1 Processed zone
In a FSW joint, due to the solid-state nature of the process and the use of a mechanical tool, a highly
characteristic and asymmetric microstructure is produced. Through the analysis of macrographs and
micrographs, three distinct zones, based on microstructural characterization of grains and precipitates,
can be identified: the nugget (stirred) zone, the thermo-mechanically affected zone (TMAZ) and the
heat-affected zone (HAZ). The choosing of the process parameters, has a great influence in the
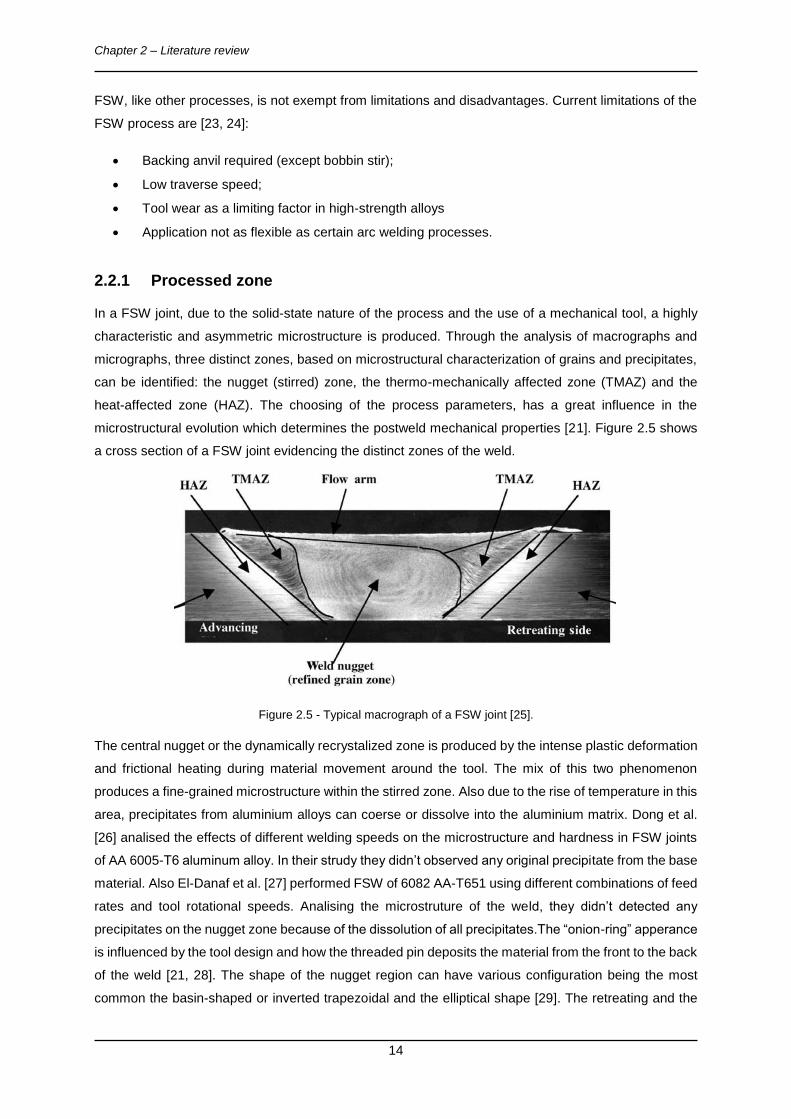
microstructural evolution which determines the postweld mechanical properties [21]. Figure 2.5 shows
a cross section of a FSW joint evidencing the distinct zones of the weld.
Figure 2.5 - Typical macrograph of a FSW joint [25].
The central nugget or the dynamically recrystalized zone is produced by the intense plastic deformation
and frictional heating during material movement around the tool. The mix of this two phenomenon
produces a fine-grained microstructure within the stirred zone. Also due to the rise of temperature in this
area, precipitates from aluminium alloys can coerse or dissolve into the aluminium matrix. Dong et al.
[26] analised the effects of different welding speeds on the microstructure and hardness in FSW joints
of AA 6005-T6 aluminum alloy. In their strudy they didn’t observed any original precipitate from the base
material. Also El-Danaf et al. [27] performed FSW of 6082 AA-T651 using different combinations of feed
rates and tool rotational speeds. Analising the microstruture of the weld, they didn’t detected any
precipitates on the nugget zone because of the dissolution of all precipitates.The “onion-ring” apperance
is influenced by the tool design and how the threaded pin deposits the material from the front to the back
of the weld [21, 28]. The shape of the nugget region can have various configuration being the most
common the basin-shaped or inverted trapezoidal and the elliptical shape [29]. The retreating and the
Chapter 2 – Literature review
15
advancing side are not symetrical, as seen on Figure 2.5. The advancing side has an extended
recrystallized zone that terminates close to the surface of the weld bead and a sharp transition between
the nugget zone and the TMAZ. The explanation for this phenomenon is that in this zone the plastic
deformation is more intense due to a higher relative shear stress between the tool and the workpiece
[21].
The thermo-mechanicaly affected zone (TMAZ) is a transition zone inherent to the FSW process
between the base material and the nugget zone. Characterized by the severe deformation of the grain
struture at high temperatures, the grains tend to elongate in an upward flowing pattern around the nugget
zone on the retreating side. Due to insufficient deformation strain and lower temperatures than the ones
experienced in the nugget zone, recrystallization in the TMAZ does not occur. Since the temperature of
the TMAZ is very high, but lower than the temperature of the nugget, dissolution of some precipitates
can be observed depending on the thermal cycle experienced by the TMAZ [21].
The heat-affected zone (HAZ) is the zone between the base material and the TMAZ. This region has a
similar grain structure as the parent material, since there is no plastic deformation. However, the thermal
cycle in this zone increases the size of the grain and can exert a significant effect on the precipitate
structure for heat-treatable aluminium alloys resulting in the coarsening of the strengthening precipitates
and the increase of the precipitate-free zone (PFZ) [21]. This change in the microstructure produces a
region of reduced hardness with a minimum value at the interface between the TMAZ and the HAZ.
Depending on the welding parameters, this minimum can be found closer or further from the weld nugget
[30].
2.2.2 Process operating parameters
The main FSW process parameters that can be adjusted according to the workpiece material are [23]:
Tool geometry;
Tool rotational speed and direction of spindle;
Tool welding speed along the joint line;
Axial load;
Tilt angle (α);
Work angle (β) for dissimilar thicknesses;
Plunge speed and depth of probe in workpieces;
Preheating or cooling the workpiece;
Clamping systems;
Control during plunge, dwell and weld periods: Force control (Fz ) versus position control;
Weld pitch ratio;
The welding speed, rotational speed, the axial force, the tilt angle and the tool geometry are the main
independent variables that are used to control the FSW process, since the heat generation rate,
temperature field, cooling rate among other factors depend on these variables [28]. In a study performed
Chapter 2 – Literature review
16
by Lakshminarayanan et al. [31], an attempt to determine the effect of the process parameter on tensile
strength of FSW RDE-40 aluminium using the Taguchi method was performed. The results obtained
indicated that the tool rotational speed has 41% contribution, traverse speed has 33% contribution and
axial force has 21% contribution to tensile strength of welded joints.
The weld pitch ratio is empirically related to the heat input from the internal friction and interfacial energy.
This allows to predict some effects and failures in the weld region. Depending on the value of the weld
pitch obtained in Equation 2.1, the weld condition can be considered hot, intermediate or cold. For
aluminium alloys a value of 4 is usually considered an intermediate value. Higher weld pitch values
means that the weld would be produced in a hot condition while lower weld pitch values means that the
weld would be performed in a cold condition. Hot welds are characterized by high rotation speeds and
low welding speeds which leads to a larger HAZ and a smaller TMAZ. The opposite is true for cold
conditions.
𝑊𝑒𝑙𝑑 𝑝𝑖𝑡𝑐ℎ 𝑟𝑎𝑡𝑖𝑜 (rev/mm) =𝜔 (rev/min)
𝑣 (mm/min) [2.1]
Heat generation rate and the stirring and mixing of the material around the pin are greatly influenced by
the tool rotation speed. In general, high rotation speeds lead to more heat generated and thus greater
degree of plasticisation of the metal. The heat generated is only proportional to the rotation speed up
until a certain point at which the material over-softens and friction couple reduces [21, 28].
The welding speed has great influence on the exposure time to higher temperatures and material
viscoplasticity. Higher welding speeds reduces the heat input, peak temperature and exposure time at
high temperatures, which produces a fine grain structure with good tensile properties as showed by
Dong et al. [26]. However, by increasing the welding speed the heat build-up around the tool is reduced,
as is the amount of plasticisation that occurs ahead of the tool. This could lead to tool failure due to high
bending forces.
Axial force affects the quality of the weld by controlling the heat generation and the forging pressure.
High axial forces causes to overheating and thinning of the joint which leads to grain growth and
coarsening during cooling [28]. It also results in excessive plunging in the workpiece creating excessive
flash [21]. Low axial forces leads to insufficient heating and low forging forces which causes the creation
of voids [28].
A suitable tilt of the tool during FSW promotes the contact between the shoulder and the stirred material
from the pin, which results in more efficient stirring and forging on the trailing side of the weld [21]. This
is often performed in tools with simple flat or concave shoulders to reduce the traverse force and to
assist the consolidation of the weld.
Target depth is important to produce sound welds with smooth shoulders and depends of the height of
the pin. Low penetration of the pin results in loss of contact between the shoulder and the workpiece a
leads to low heat generation rate and mixing. High penetration results in a plunging of the shoulder in
Chapter 2 – Literature review
17
the workpiece creating excessive flash, local thinning of the welded plates, material from the backing
bar incorporated in the weld and damage to the backing bar [21].
Tool geometry influences heat generation, plastic flow of the material, the required power for the FSW,
the welding speed and the uniformity of the welded joint. The tool consists on a shoulder that generates
most of the heat and confines the plasticized material and a pin or probe that governs the material
stirring and mixing flow [21, 28]. Also the swept rate is a critical FSW tool design parameter, which is
defined as the ratio between the volume swept by the pin during rotation and the volume of the pin.
Higher swept rate leads to the reduction of voids and the disruption of surface oxides [32].
2.2.3 FSW Tools
FSW tools serve two main purposes: localized heating and induce material flow contained beneath the
shoulder. Due to various geometrical configurations of the tools, the material movement can be
extremely complex and different from one tool to another [32].
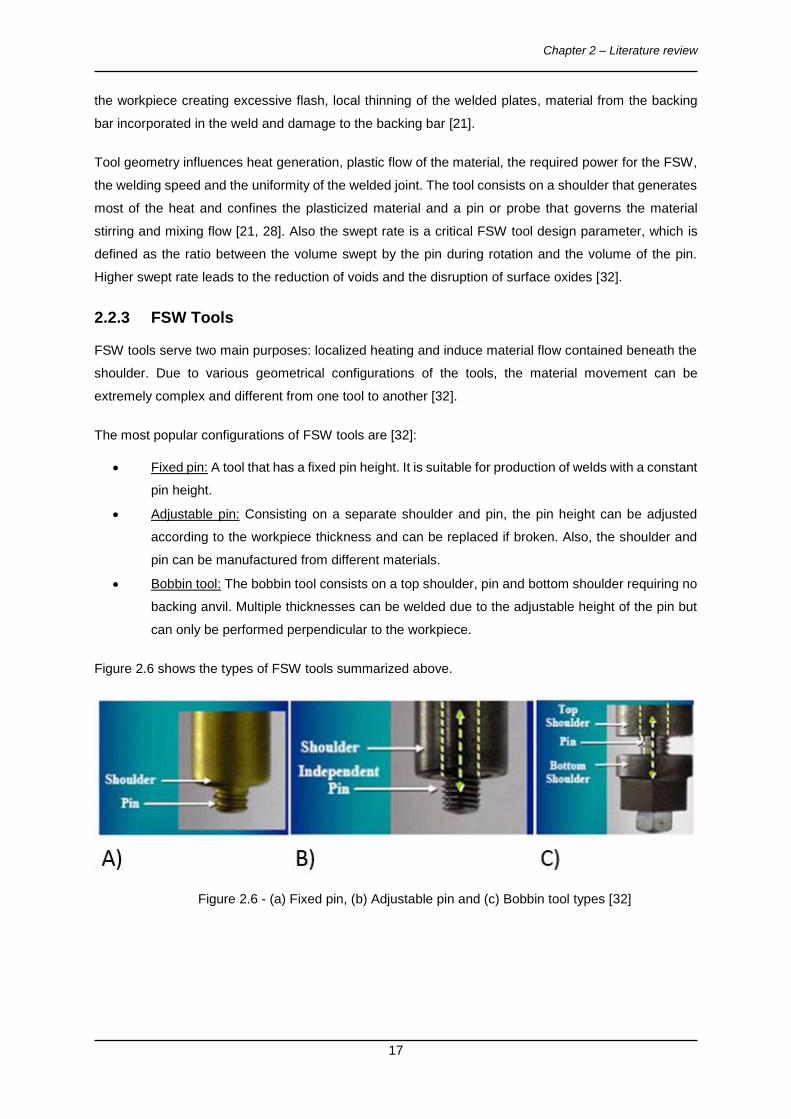
The most popular configurations of FSW tools are [32]:
Fixed pin: A tool that has a fixed pin height. It is suitable for production of welds with a constant
pin height.
Adjustable pin: Consisting on a separate shoulder and pin, the pin height can be adjusted
according to the workpiece thickness and can be replaced if broken. Also, the shoulder and
pin can be manufactured from different materials.
Bobbin tool: The bobbin tool consists on a top shoulder, pin and bottom shoulder requiring no
backing anvil. Multiple thicknesses can be welded due to the adjustable height of the pin but
can only be performed perpendicular to the workpiece.
Figure 2.6 shows the types of FSW tools summarized above.
Figure 2.6 - (a) Fixed pin, (b) Adjustable pin and (c) Bobbin tool types [32]
Chapter 2 – Literature review
18
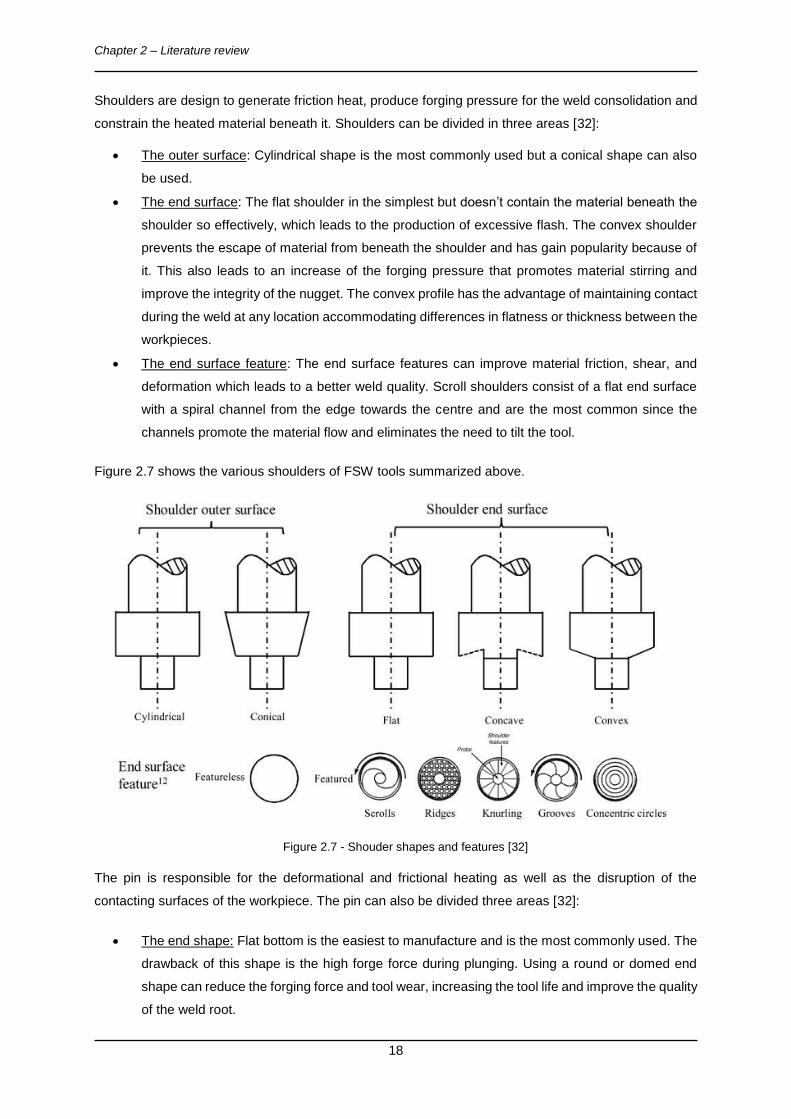
Shoulders are design to generate friction heat, produce forging pressure for the weld consolidation and
constrain the heated material beneath it. Shoulders can be divided in three areas [32]:
The outer surface: Cylindrical shape is the most commonly used but a conical shape can also
be used.
The end surface: The flat shoulder in the simplest but doesn’t contain the material beneath the
shoulder so effectively, which leads to the production of excessive flash. The convex shoulder
prevents the escape of material from beneath the shoulder and has gain popularity because of
it. This also leads to an increase of the forging pressure that promotes material stirring and
improve the integrity of the nugget. The convex profile has the advantage of maintaining contact
during the weld at any location accommodating differences in flatness or thickness between the
workpieces.
The end surface feature: The end surface features can improve material friction, shear, and
deformation which leads to a better weld quality. Scroll shoulders consist of a flat end surface
with a spiral channel from the edge towards the centre and are the most common since the
channels promote the material flow and eliminates the need to tilt the tool.
Figure 2.7 shows the various shoulders of FSW tools summarized above.
Figure 2.7 - Shouder shapes and features [32]
The pin is responsible for the deformational and frictional heating as well as the disruption of the
contacting surfaces of the workpiece. The pin can also be divided three areas [32]:
The end shape: Flat bottom is the easiest to manufacture and is the most commonly used. The
drawback of this shape is the high forge force during plunging. Using a round or domed end
shape can reduce the forging force and tool wear, increasing the tool life and improve the quality
of the weld root.
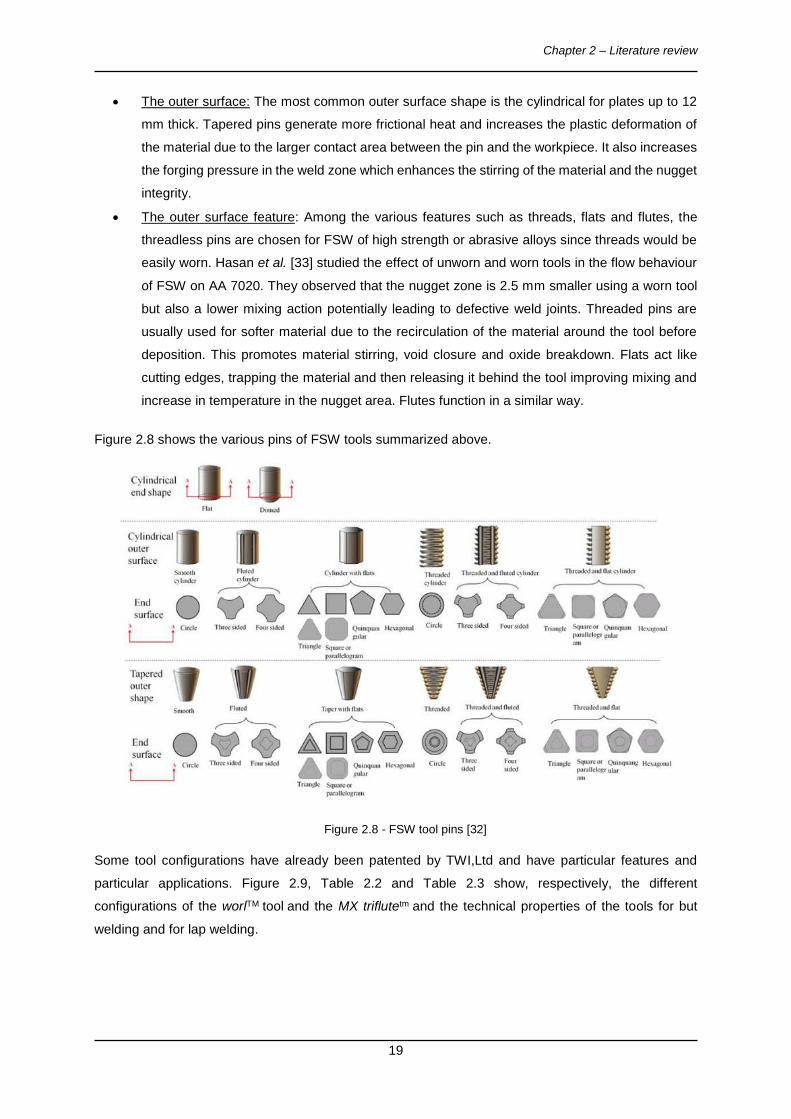
Chapter 2 – Literature review
19
The outer surface: The most common outer surface shape is the cylindrical for plates up to 12
mm thick. Tapered pins generate more frictional heat and increases the plastic deformation of
the material due to the larger contact area between the pin and the workpiece. It also increases
the forging pressure in the weld zone which enhances the stirring of the material and the nugget
integrity.
The outer surface feature: Among the various features such as threads, flats and flutes, the
threadless pins are chosen for FSW of high strength or abrasive alloys since threads would be
easily worn. Hasan et al. [33] studied the effect of unworn and worn tools in the flow behaviour
of FSW on AA 7020. They observed that the nugget zone is 2.5 mm smaller using a worn tool
but also a lower mixing action potentially leading to defective weld joints. Threaded pins are
usually used for softer material due to the recirculation of the material around the tool before
deposition. This promotes material stirring, void closure and oxide breakdown. Flats act like
cutting edges, trapping the material and then releasing it behind the tool improving mixing and
increase in temperature in the nugget area. Flutes function in a similar way.
Figure 2.8 shows the various pins of FSW tools summarized above.
Figure 2.8 - FSW tool pins [32]
Some tool configurations have already been patented by TWI,Ltd and have particular features and
particular applications. Figure 2.9, Table 2.2 and Table 2.3 show, respectively, the different
configurations of the worlTM tool and the MX triflutetm and the technical properties of the tools for but
welding and for lap welding.
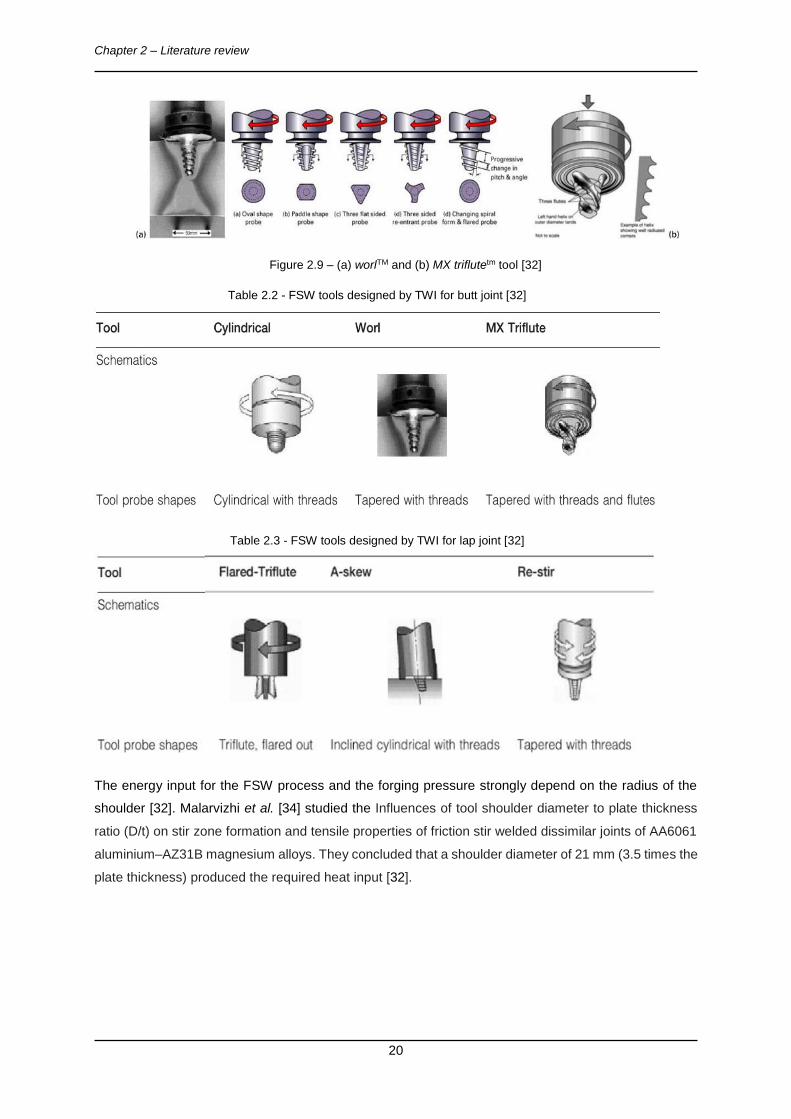
Chapter 2 – Literature review
20
Figure 2.9 – (a) worlTM and (b) MX triflutetm tool [32]
Table 2.2 - FSW tools designed by TWI for butt joint [32]
Table 2.3 - FSW tools designed by TWI for lap joint [32]
The energy input for the FSW process and the forging pressure strongly depend on the radius of the
shoulder [32]. Malarvizhi et al. [34] studied the Influences of tool shoulder diameter to plate thickness
ratio (D/t) on stir zone formation and tensile properties of friction stir welded dissimilar joints of AA6061
aluminium–AZ31B magnesium alloys. They concluded that a shoulder diameter of 21 mm (3.5 times the
plate thickness) produced the required heat input [32].
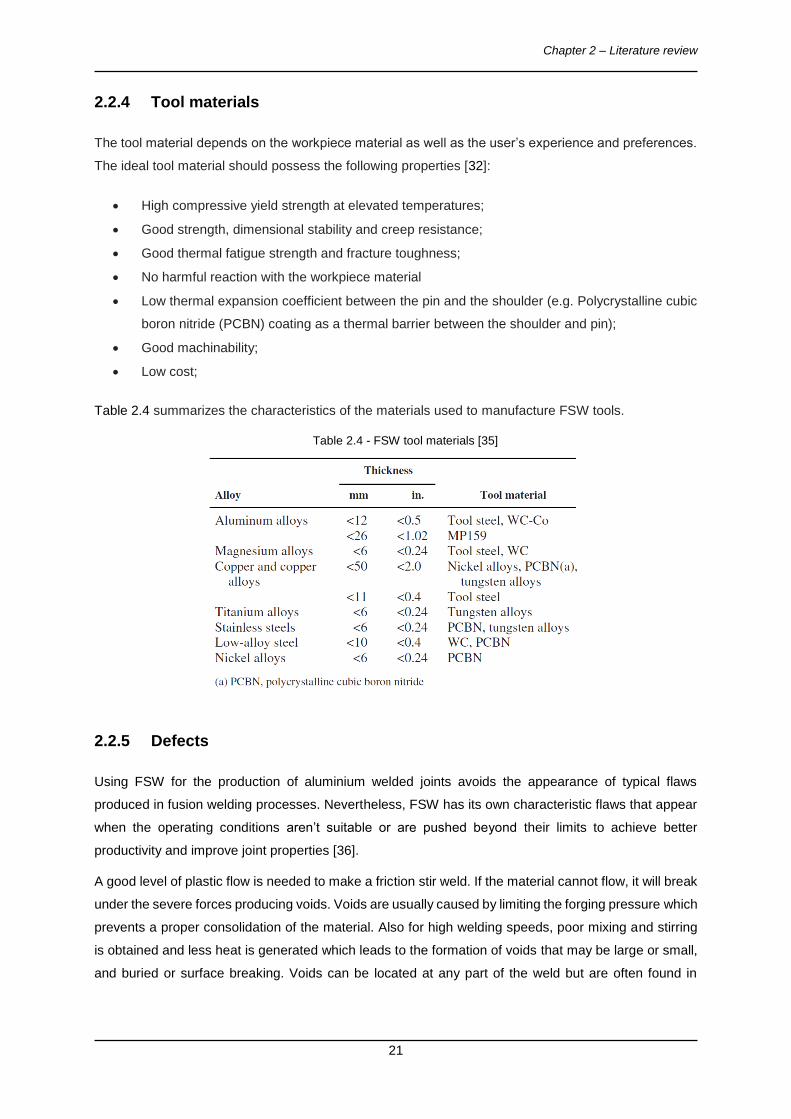
Chapter 2 – Literature review
21
2.2.4 Tool materials
The tool material depends on the workpiece material as well as the user’s experience and preferences.
The ideal tool material should possess the following properties [32]:
High compressive yield strength at elevated temperatures;
Good strength, dimensional stability and creep resistance;
Good thermal fatigue strength and fracture toughness;
No harmful reaction with the workpiece material
Low thermal expansion coefficient between the pin and the shoulder (e.g. Polycrystalline cubic
boron nitride (PCBN) coating as a thermal barrier between the shoulder and pin);
Good machinability;
Low cost;
Table 2.4 summarizes the characteristics of the materials used to manufacture FSW tools.
Table 2.4 - FSW tool materials [35]
2.2.5 Defects
Using FSW for the production of aluminium welded joints avoids the appearance of typical flaws
produced in fusion welding processes. Nevertheless, FSW has its own characteristic flaws that appear
when the operating conditions aren’t suitable or are pushed beyond their limits to achieve better
productivity and improve joint properties [36].
A good level of plastic flow is needed to make a friction stir weld. If the material cannot flow, it will break
under the severe forces producing voids. Voids are usually caused by limiting the forging pressure which
prevents a proper consolidation of the material. Also for high welding speeds, poor mixing and stirring
is obtained and less heat is generated which leads to the formation of voids that may be large or small,
and buried or surface breaking. Voids can be located at any part of the weld but are often found in
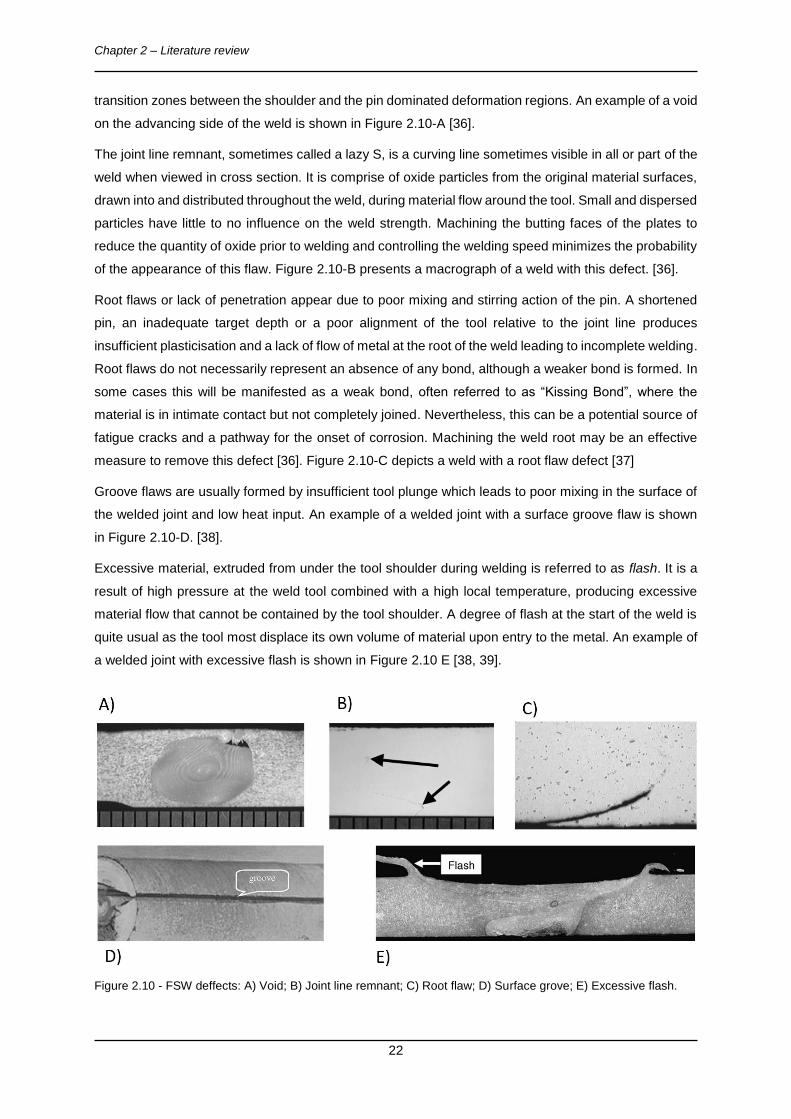
Chapter 2 – Literature review
22
transition zones between the shoulder and the pin dominated deformation regions. An example of a void
on the advancing side of the weld is shown in Figure 2.10-A [36].
The joint line remnant, sometimes called a lazy S, is a curving line sometimes visible in all or part of the
weld when viewed in cross section. It is comprise of oxide particles from the original material surfaces,
drawn into and distributed throughout the weld, during material flow around the tool. Small and dispersed
particles have little to no influence on the weld strength. Machining the butting faces of the plates to
reduce the quantity of oxide prior to welding and controlling the welding speed minimizes the probability
of the appearance of this flaw. Figure 2.10-B presents a macrograph of a weld with this defect. [36].
Root flaws or lack of penetration appear due to poor mixing and stirring action of the pin. A shortened
pin, an inadequate target depth or a poor alignment of the tool relative to the joint line produces
insufficient plasticisation and a lack of flow of metal at the root of the weld leading to incomplete welding.
Root flaws do not necessarily represent an absence of any bond, although a weaker bond is formed. In
some cases this will be manifested as a weak bond, often referred to as “Kissing Bond”, where the
material is in intimate contact but not completely joined. Nevertheless, this can be a potential source of
fatigue cracks and a pathway for the onset of corrosion. Machining the weld root may be an effective
measure to remove this defect [36]. Figure 2.10-C depicts a weld with a root flaw defect [37]
Groove flaws are usually formed by insufficient tool plunge which leads to poor mixing in the surface of
the welded joint and low heat input. An example of a welded joint with a surface groove flaw is shown
in Figure 2.10-D. [38].
Excessive material, extruded from under the tool shoulder during welding is referred to as flash. It is a
result of high pressure at the weld tool combined with a high local temperature, producing excessive
material flow that cannot be contained by the tool shoulder. A degree of flash at the start of the weld is
quite usual as the tool most displace its own volume of material upon entry to the metal. An example of
a welded joint with excessive flash is shown in Figure 2.10 E [38, 39].
Figure 2.10 - FSW deffects: A) Void; B) Joint line remnant; C) Root flaw; D) Surface grove; E) Excessive flash.
Chapter 2 – Literature review
23
2.2.6 Applications
The intense investigation around FSW, due to its results and possibilities, allowed the application of this
process in various industries with special interest in the transportation industry [21, 40, 41].
In the aerospace business, issues like excessive weight and poor quality of joints, are major concerns
for any aerospace company. High-strength aluminium alloys such as 2XXX and 7XXX series, are widely
used in the aerospace industry. Using convectional fusion welding processes, these alloys are difficult
to joint without the occurrence of hot cracking. The first application was in 1998, when NASA began
developing FSW for the production of the space shuttle external tank. Due to its repeatability and
reliability on joining lightweight alloys, FSW was viewed as a very attractive and more robust process
than the previously used (variable polarity plasma arc) enabling a significant reduction of weight. With
this success, it is anticipated that the next-generation of heavy-launch vehicles developed by NASA will
include an extensive use of FSW. Other private companies such as United Launch Alliance (ULA) have
adopted FSW for the manufacture of their own products. The use of FSW as an alternative to riveting
has also gain acceptance, which allows the reduction of weight, parts and costs while improving joint
strength [40]. More recently, Space Exploration Technologies Corporation (SpaceX) in Hawthorne,
California (USA) uses FSW for the production of fuel tanks of their partially reusable launch vehicles
Falcon 1 and Falcon 9 [7].
Eclipse Aviation, a private aviation company based in Albuquerque, New Mexico (USA) decided to use
FSW process due to its high productivity compared to the traditional automated or manual riveting on
the production of the Eclipse 500. This allowed a significant reduction of fasteners and stringers while
improving the mechanical properties such as joint strength and fatigue life of the joint. Commercial
aviation manufactures have also adopted or evaluated the use FSW on their models. Airbus models
A340, A350 and A380 use FSW as replacement for rivets on the longitudinal fuselage. Embraer and
Bombardier also tested the feasibility of FSW [40, 41]. Boing uses FSW to produce the toe nails for the
cargo ramp of their C-17 model mad from AA 7050-T7451. A zero scrap rate had been reported in
February 2006, after all the first produced components had successfully passed non-destructive
inspection [7].
FSW has been used in the shipbuilding and offshore industry for the production of large aluminium
panels, which are made from aluminium extrusions. The first commercial application of FSW was to
manufacture hollow aluminium panels for deep freezing of fish on fishing boats in 1996 at Sapa in
Finspång (Sweden). Minimal distortion and high repeatability made FSW an economic a reliable option.
Sapa reported that more than 3000 km of friction stir welds had been produced by 2010. Pre-fabricated
wide aluminium panels for high-speed ferry boats, cruise ships and patrol vessels have also been
produced using FSW [5].
Modern railway carriages are increasingly produced from longitudinal aluminium extrusions with
integrated stiffeners, leading the railway vehicle industry to increase the use of FSW due to the
combination of cost effectiveness and improved crashworthiness when compared to fusion welding
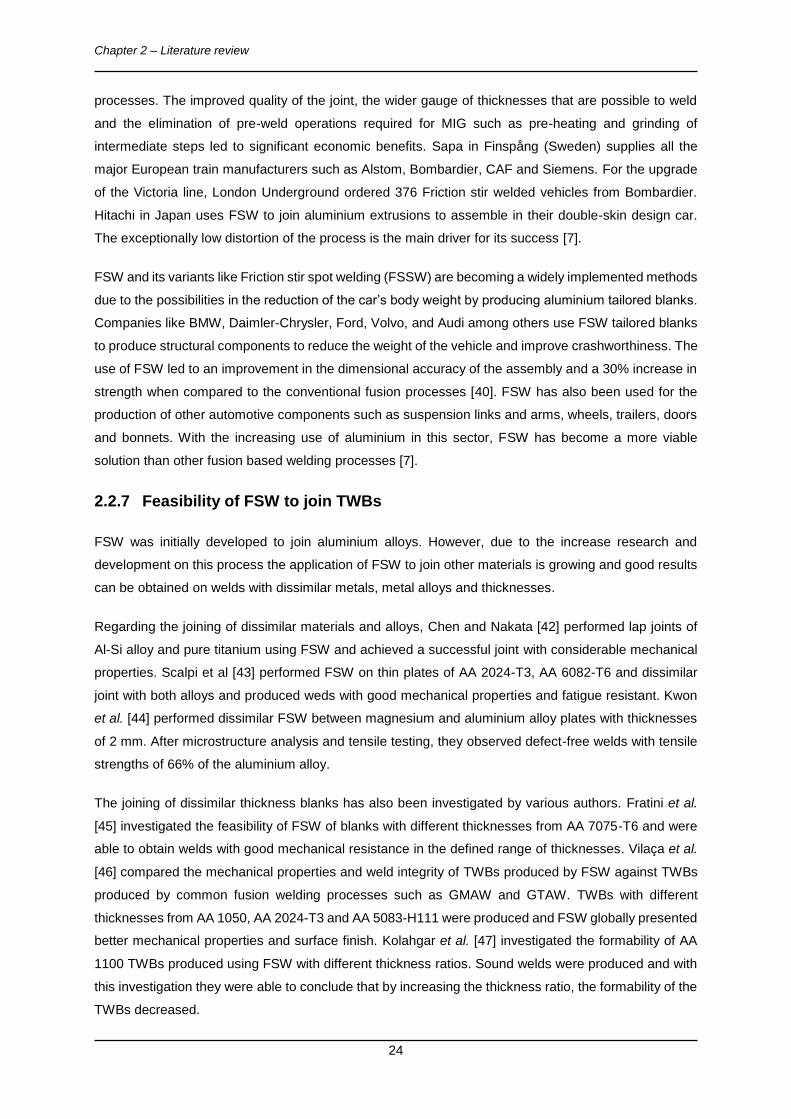
Chapter 2 – Literature review
24
processes. The improved quality of the joint, the wider gauge of thicknesses that are possible to weld
and the elimination of pre-weld operations required for MIG such as pre-heating and grinding of
intermediate steps led to significant economic benefits. Sapa in Finspång (Sweden) supplies all the
major European train manufacturers such as Alstom, Bombardier, CAF and Siemens. For the upgrade
of the Victoria line, London Underground ordered 376 Friction stir welded vehicles from Bombardier.
Hitachi in Japan uses FSW to join aluminium extrusions to assemble in their double-skin design car.
The exceptionally low distortion of the process is the main driver for its success [7].
FSW and its variants like Friction stir spot welding (FSSW) are becoming a widely implemented methods
due to the possibilities in the reduction of the car’s body weight by producing aluminium tailored blanks.
Companies like BMW, Daimler-Chrysler, Ford, Volvo, and Audi among others use FSW tailored blanks
to produce structural components to reduce the weight of the vehicle and improve crashworthiness. The
use of FSW led to an improvement in the dimensional accuracy of the assembly and a 30% increase in
strength when compared to the conventional fusion processes [40]. FSW has also been used for the
production of other automotive components such as suspension links and arms, wheels, trailers, doors
and bonnets. With the increasing use of aluminium in this sector, FSW has become a more viable
solution than other fusion based welding processes [7].
2.2.7 Feasibility of FSW to join TWBs
FSW was initially developed to join aluminium alloys. However, due to the increase research and
development on this process the application of FSW to join other materials is growing and good results
can be obtained on welds with dissimilar metals, metal alloys and thicknesses.
Regarding the joining of dissimilar materials and alloys, Chen and Nakata [42] performed lap joints of
Al-Si alloy and pure titanium using FSW and achieved a successful joint with considerable mechanical
properties. Scalpi et al [43] performed FSW on thin plates of AA 2024-T3, AA 6082-T6 and dissimilar
joint with both alloys and produced weds with good mechanical properties and fatigue resistant. Kwon
et al. [44] performed dissimilar FSW between magnesium and aluminium alloy plates with thicknesses
of 2 mm. After microstructure analysis and tensile testing, they observed defect-free welds with tensile
strengths of 66% of the aluminium alloy.
The joining of dissimilar thickness blanks has also been investigated by various authors. Fratini et al.
[45] investigated the feasibility of FSW of blanks with different thicknesses from AA 7075-T6 and were
able to obtain welds with good mechanical resistance in the defined range of thicknesses. Vilaça et al.
[46] compared the mechanical properties and weld integrity of TWBs produced by FSW against TWBs
produced by common fusion welding processes such as GMAW and GTAW. TWBs with different
thicknesses from AA 1050, AA 2024-T3 and AA 5083-H111 were produced and FSW globally presented
better mechanical properties and surface finish. Kolahgar et al. [47] investigated the formability of AA
1100 TWBs produced using FSW with different thickness ratios. Sound welds were produced and with
this investigation they were able to conclude that by increasing the thickness ratio, the formability of the
TWBs decreased.
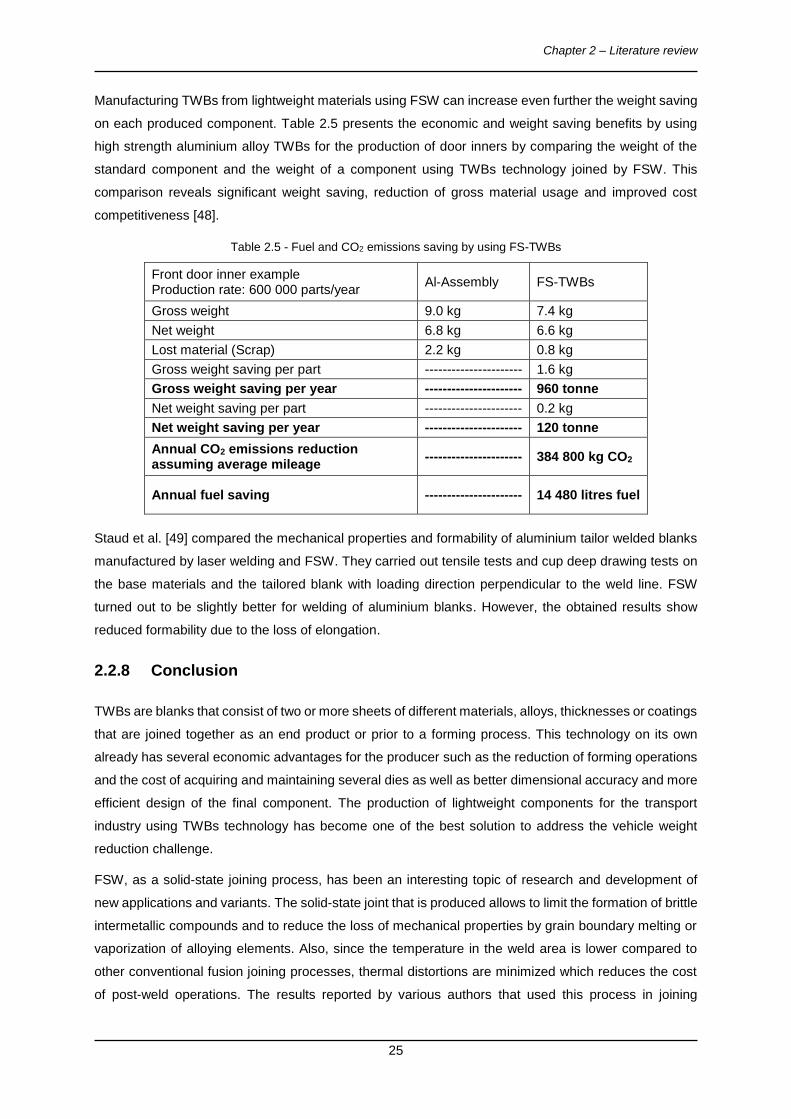
Chapter 2 – Literature review
25
Manufacturing TWBs from lightweight materials using FSW can increase even further the weight saving
on each produced component. Table 2.5 presents the economic and weight saving benefits by using
high strength aluminium alloy TWBs for the production of door inners by comparing the weight of the
standard component and the weight of a component using TWBs technology joined by FSW. This
comparison reveals significant weight saving, reduction of gross material usage and improved cost
competitiveness [48].
Table 2.5 - Fuel and CO2 emissions saving by using FS-TWBs
Front door inner example Production rate: 600 000 parts/year
Al-Assembly FS-TWBs
Gross weight 9.0 kg 7.4 kg
Net weight 6.8 kg 6.6 kg
Lost material (Scrap) 2.2 kg 0.8 kg
Gross weight saving per part ---------------------- 1.6 kg
Gross weight saving per year ---------------------- 960 tonne
Net weight saving per part ---------------------- 0.2 kg
Net weight saving per year ---------------------- 120 tonne
Annual CO2 emissions reduction assuming average mileage
---------------------- 384 800 kg CO2
Annual fuel saving ---------------------- 14 480 litres fuel
Staud et al. [49] compared the mechanical properties and formability of aluminium tailor welded blanks
manufactured by laser welding and FSW. They carried out tensile tests and cup deep drawing tests on
the base materials and the tailored blank with loading direction perpendicular to the weld line. FSW
turned out to be slightly better for welding of aluminium blanks. However, the obtained results show
reduced formability due to the loss of elongation.
2.2.8 Conclusion
TWBs are blanks that consist of two or more sheets of different materials, alloys, thicknesses or coatings
that are joined together as an end product or prior to a forming process. This technology on its own
already has several economic advantages for the producer such as the reduction of forming operations
and the cost of acquiring and maintaining several dies as well as better dimensional accuracy and more
efficient design of the final component. The production of lightweight components for the transport
industry using TWBs technology has become one of the best solution to address the vehicle weight
reduction challenge.
FSW, as a solid-state joining process, has been an interesting topic of research and development of
new applications and variants. The solid-state joint that is produced allows to limit the formation of brittle
intermetallic compounds and to reduce the loss of mechanical properties by grain boundary melting or
vaporization of alloying elements. Also, since the temperature in the weld area is lower compared to
other conventional fusion joining processes, thermal distortions are minimized which reduces the cost
of post-weld operations. The results reported by various authors that used this process in joining

Chapter 2 – Literature review
26
dissimilar alloys, thicknesses and materials demonstrates that this is an effective and suitable process
for the production of TWBs of lightweight material.
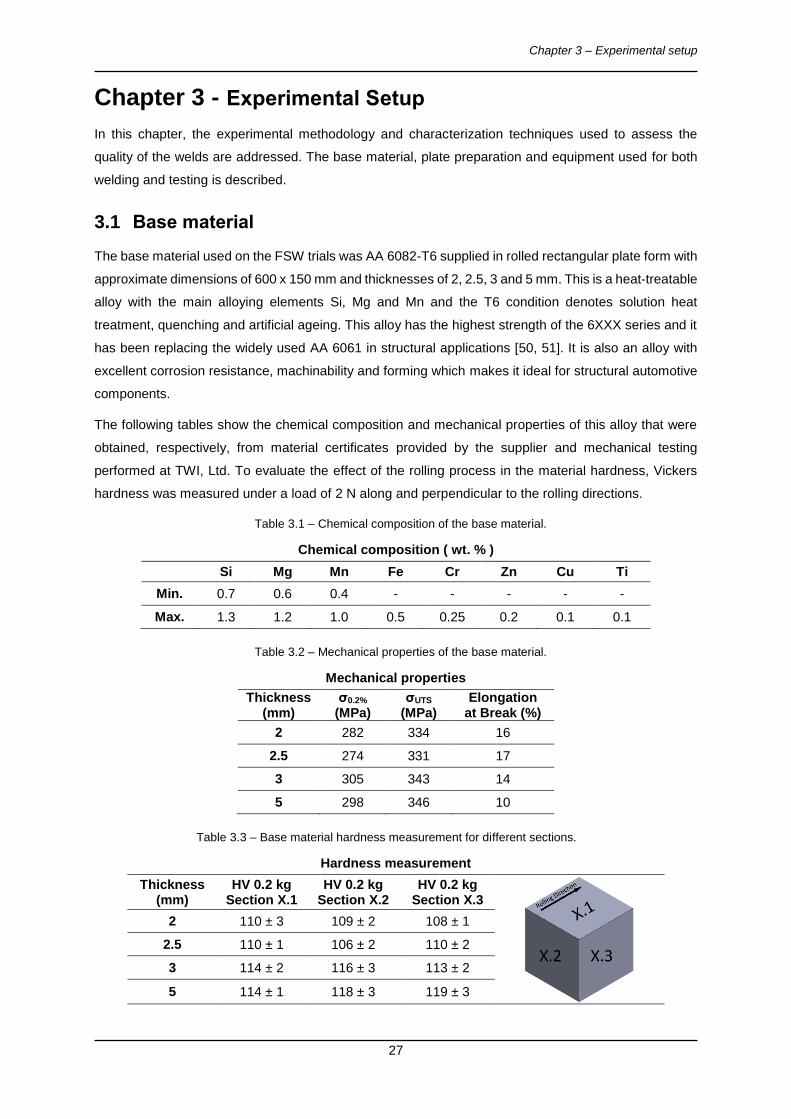
Chapter 3 – Experimental setup
27
Chapter 3 - Experimental Setup
In this chapter, the experimental methodology and characterization techniques used to assess the
quality of the welds are addressed. The base material, plate preparation and equipment used for both
welding and testing is described.
3.1 Base material
The base material used on the FSW trials was AA 6082-T6 supplied in rolled rectangular plate form with
approximate dimensions of 600 x 150 mm and thicknesses of 2, 2.5, 3 and 5 mm. This is a heat-treatable
alloy with the main alloying elements Si, Mg and Mn and the T6 condition denotes solution heat
treatment, quenching and artificial ageing. This alloy has the highest strength of the 6XXX series and it
has been replacing the widely used AA 6061 in structural applications [50, 51]. It is also an alloy with
excellent corrosion resistance, machinability and forming which makes it ideal for structural automotive
components.
The following tables show the chemical composition and mechanical properties of this alloy that were
obtained, respectively, from material certificates provided by the supplier and mechanical testing
performed at TWI, Ltd. To evaluate the effect of the rolling process in the material hardness, Vickers
hardness was measured under a load of 2 N along and perpendicular to the rolling directions.
Table 3.1 – Chemical composition of the base material.
Chemical composition ( wt. % )
Si Mg Mn Fe Cr Zn Cu Ti
Min. 0.7 0.6 0.4 - - - - -
Max. 1.3 1.2 1.0 0.5 0.25 0.2 0.1 0.1
Table 3.2 – Mechanical properties of the base material.
Mechanical properties
Thickness (mm)
σ0.2%
(MPa) σUTS
(MPa) Elongation
at Break (%)
2 282 334 16
2.5 274 331 17
3 305 343 14
5 298 346 10
Table 3.3 – Base material hardness measurement for different sections.
Hardness measurement
Thickness (mm)
HV 0.2 kg Section X.1
HV 0.2 kg Section X.2
HV 0.2 kg Section X.3
2 110 ± 3 109 ± 2 108 ± 1
2.5 110 ± 1 106 ± 2 110 ± 2
3 114 ± 2 116 ± 3 113 ± 2
5 114 ± 1 118 ± 3 119 ± 3
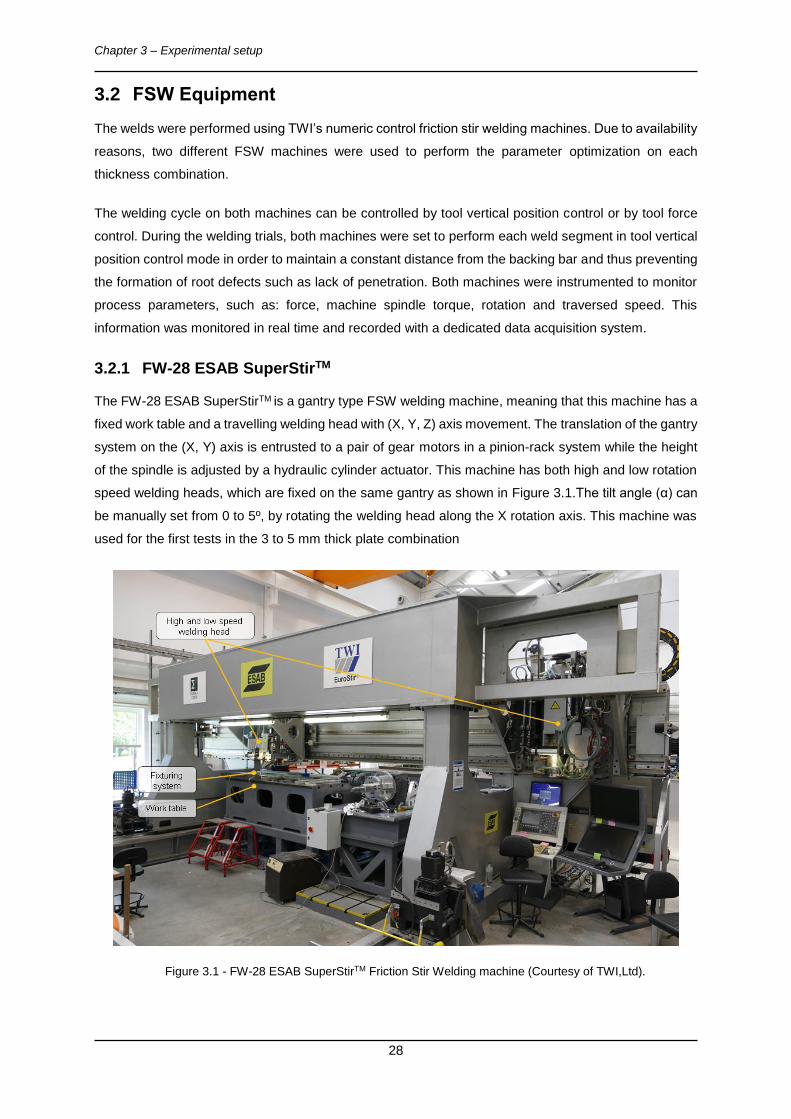
Chapter 3 – Experimental setup
28
3.2 FSW Equipment
The welds were performed using TWI’s numeric control friction stir welding machines. Due to availability
reasons, two different FSW machines were used to perform the parameter optimization on each
thickness combination.
The welding cycle on both machines can be controlled by tool vertical position control or by tool force
control. During the welding trials, both machines were set to perform each weld segment in tool vertical
position control mode in order to maintain a constant distance from the backing bar and thus preventing
the formation of root defects such as lack of penetration. Both machines were instrumented to monitor
process parameters, such as: force, machine spindle torque, rotation and traversed speed. This
information was monitored in real time and recorded with a dedicated data acquisition system.
3.2.1 FW-28 ESAB SuperStirTM
The FW-28 ESAB SuperStirTM is a gantry type FSW welding machine, meaning that this machine has a
fixed work table and a travelling welding head with (X, Y, Z) axis movement. The translation of the gantry
system on the (X, Y) axis is entrusted to a pair of gear motors in a pinion-rack system while the height
of the spindle is adjusted by a hydraulic cylinder actuator. This machine has both high and low rotation
speed welding heads, which are fixed on the same gantry as shown in Figure 3.1.The tilt angle (α) can
be manually set from 0 to 5º, by rotating the welding head along the X rotation axis. This machine was
used for the first tests in the 3 to 5 mm thick plate combination
Figure 3.1 - FW-28 ESAB SuperStirTM Friction Stir Welding machine (Courtesy of TWI,Ltd).
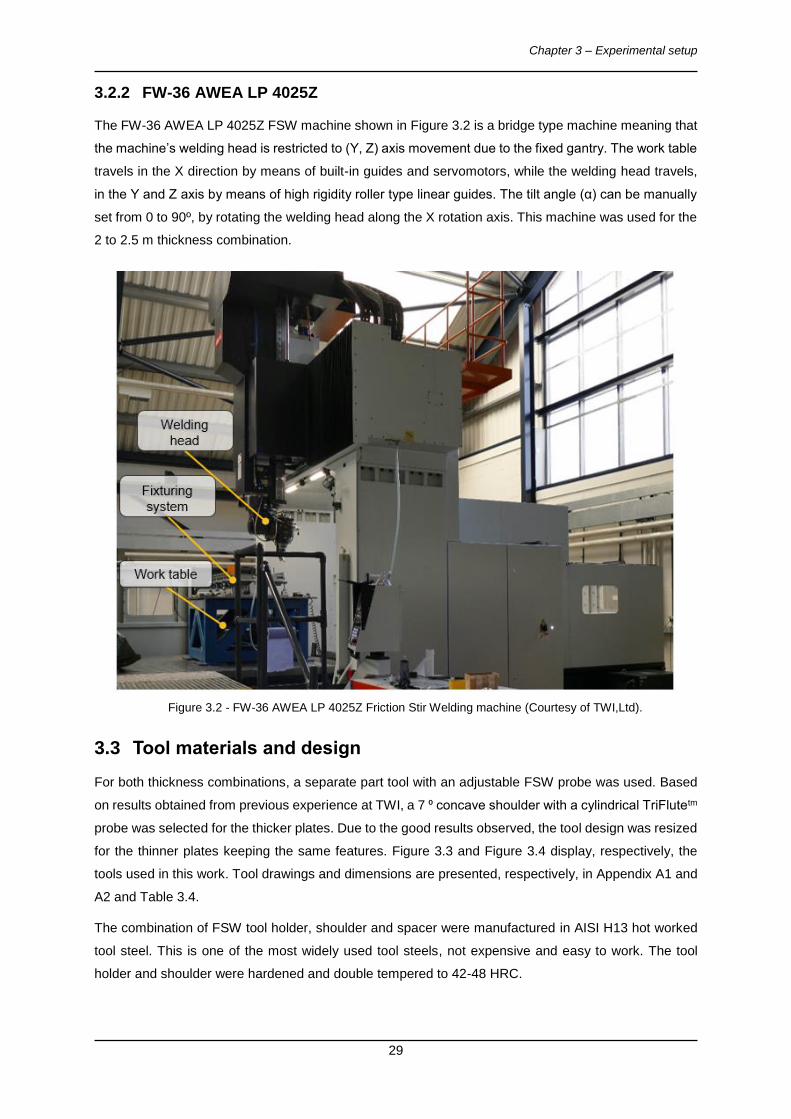
Chapter 3 – Experimental setup
29
3.2.2 FW-36 AWEA LP 4025Z
The FW-36 AWEA LP 4025Z FSW machine shown in Figure 3.2 is a bridge type machine meaning that
the machine’s welding head is restricted to (Y, Z) axis movement due to the fixed gantry. The work table
travels in the X direction by means of built-in guides and servomotors, while the welding head travels,
in the Y and Z axis by means of high rigidity roller type linear guides. The tilt angle (α) can be manually
set from 0 to 90º, by rotating the welding head along the X rotation axis. This machine was used for the
2 to 2.5 m thickness combination.
Figure 3.2 - FW-36 AWEA LP 4025Z Friction Stir Welding machine (Courtesy of TWI,Ltd).
3.3 Tool materials and design
For both thickness combinations, a separate part tool with an adjustable FSW probe was used. Based
on results obtained from previous experience at TWI, a 7 ⁰ concave shoulder with a cylindrical TriFlutetm
probe was selected for the thicker plates. Due to the good results observed, the tool design was resized
for the thinner plates keeping the same features. Figure 3.3 and Figure 3.4 display, respectively, the
tools used in this work. Tool drawings and dimensions are presented, respectively, in Appendix A1 and
A2 and Table 3.4.
The combination of FSW tool holder, shoulder and spacer were manufactured in AISI H13 hot worked
tool steel. This is one of the most widely used tool steels, not expensive and easy to work. The tool
holder and shoulder were hardened and double tempered to 42-48 HRC.
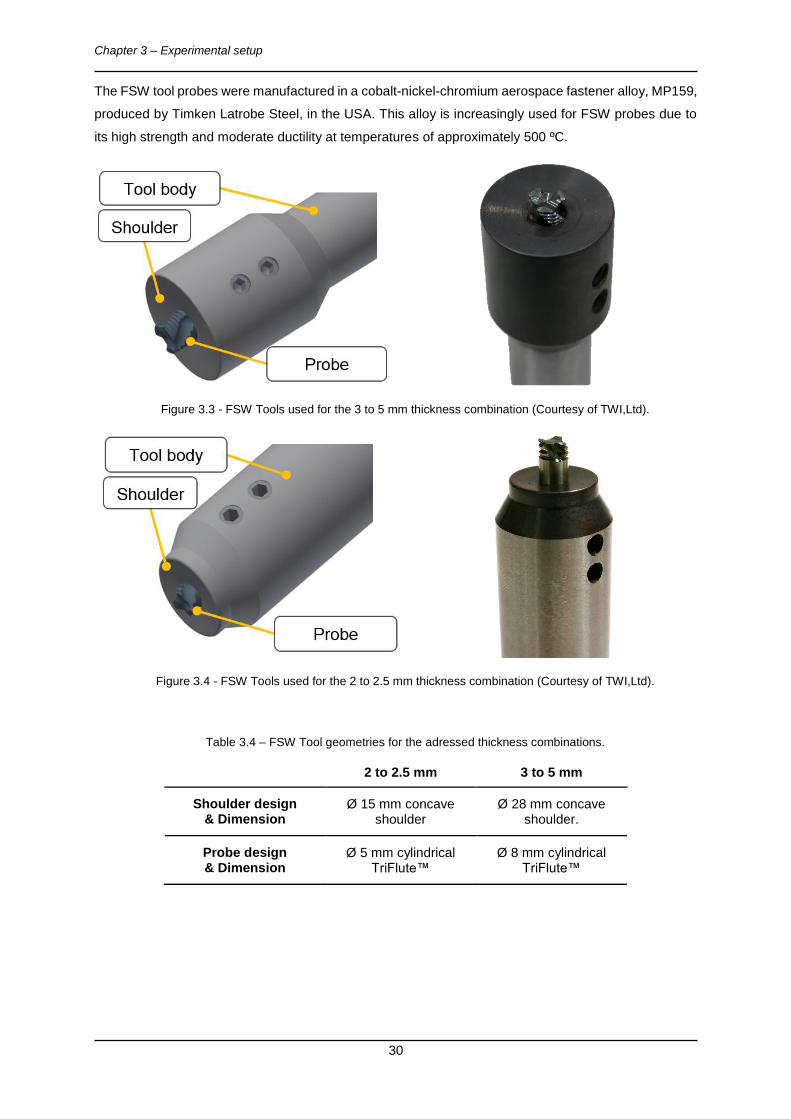
Chapter 3 – Experimental setup
30
The FSW tool probes were manufactured in a cobalt-nickel-chromium aerospace fastener alloy, MP159,
produced by Timken Latrobe Steel, in the USA. This alloy is increasingly used for FSW probes due to
its high strength and moderate ductility at temperatures of approximately 500 ºC.
Figure 3.3 - FSW Tools used for the 3 to 5 mm thickness combination (Courtesy of TWI,Ltd).
Figure 3.4 - FSW Tools used for the 2 to 2.5 mm thickness combination (Courtesy of TWI,Ltd).
Table 3.4 – FSW Tool geometries for the adressed thickness combinations.
2 to 2.5 mm 3 to 5 mm
Shoulder design & Dimension
Ø 15 mm concave shoulder
Ø 28 mm concave shoulder.
Probe design & Dimension
Ø 5 mm cylindrical TriFlute™
Ø 8 mm cylindrical TriFlute™
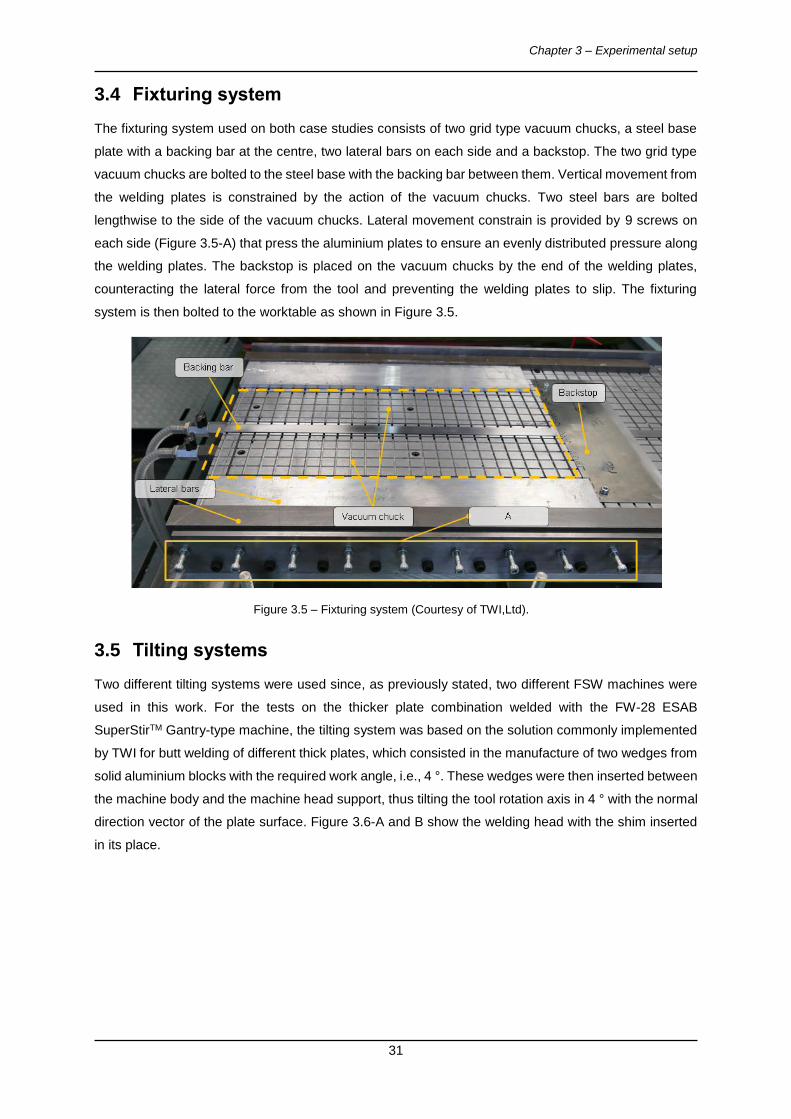
Chapter 3 – Experimental setup
31
3.4 Fixturing system
The fixturing system used on both case studies consists of two grid type vacuum chucks, a steel base
plate with a backing bar at the centre, two lateral bars on each side and a backstop. The two grid type
vacuum chucks are bolted to the steel base with the backing bar between them. Vertical movement from
the welding plates is constrained by the action of the vacuum chucks. Two steel bars are bolted
lengthwise to the side of the vacuum chucks. Lateral movement constrain is provided by 9 screws on
each side (Figure 3.5-A) that press the aluminium plates to ensure an evenly distributed pressure along
the welding plates. The backstop is placed on the vacuum chucks by the end of the welding plates,
counteracting the lateral force from the tool and preventing the welding plates to slip. The fixturing
system is then bolted to the worktable as shown in Figure 3.5.
Figure 3.5 – Fixturing system (Courtesy of TWI,Ltd).
3.5 Tilting systems
Two different tilting systems were used since, as previously stated, two different FSW machines were
used in this work. For the tests on the thicker plate combination welded with the FW-28 ESAB
SuperStirTM Gantry-type machine, the tilting system was based on the solution commonly implemented
by TWI for butt welding of different thick plates, which consisted in the manufacture of two wedges from
solid aluminium blocks with the required work angle, i.e., 4 °. These wedges were then inserted between
the machine body and the machine head support, thus tilting the tool rotation axis in 4 ° with the normal
direction vector of the plate surface. Figure 3.6-A and B show the welding head with the shim inserted
in its place.
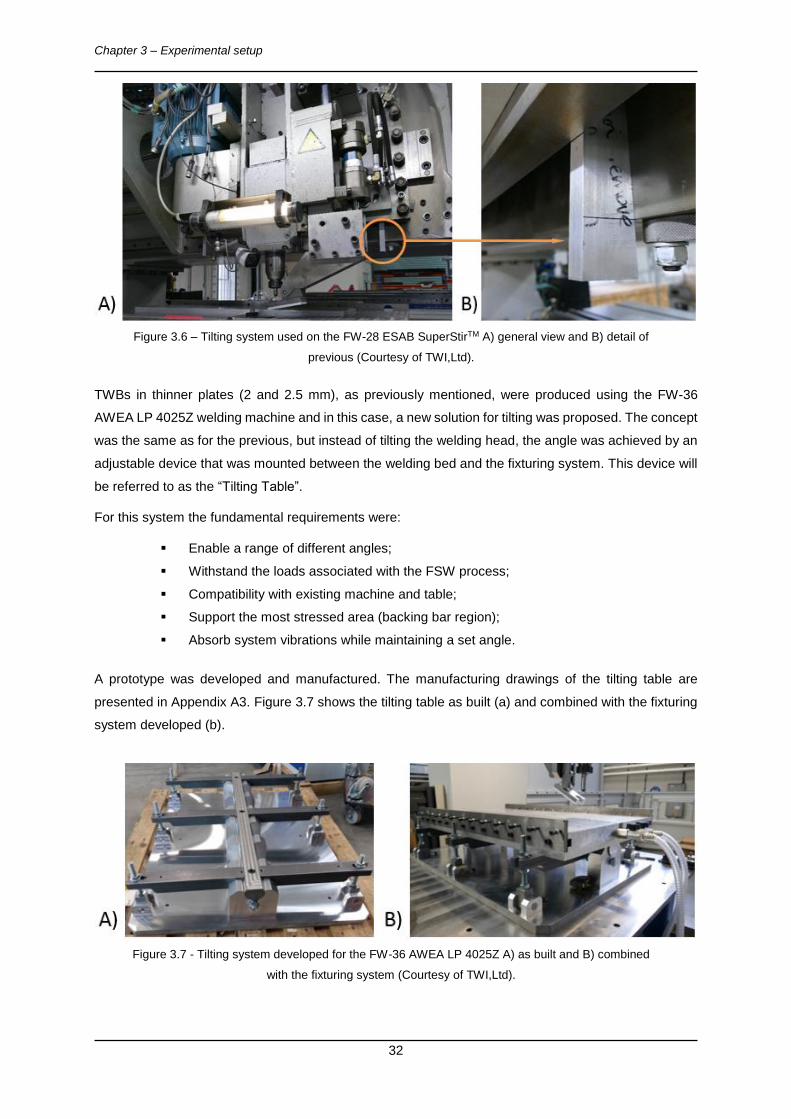
Chapter 3 – Experimental setup
32
Figure 3.6 – Tilting system used on the FW-28 ESAB SuperStirTM A) general view and B) detail of
previous (Courtesy of TWI,Ltd).
TWBs in thinner plates (2 and 2.5 mm), as previously mentioned, were produced using the FW-36
AWEA LP 4025Z welding machine and in this case, a new solution for tilting was proposed. The concept
was the same as for the previous, but instead of tilting the welding head, the angle was achieved by an
adjustable device that was mounted between the welding bed and the fixturing system. This device will
be referred to as the “Tilting Table”.
For this system the fundamental requirements were:
Enable a range of different angles;
Withstand the loads associated with the FSW process;
Compatibility with existing machine and table;
Support the most stressed area (backing bar region);
Absorb system vibrations while maintaining a set angle.
A prototype was developed and manufactured. The manufacturing drawings of the tilting table are
presented in Appendix A3. Figure 3.7 shows the tilting table as built (a) and combined with the fixturing
system developed (b).
Figure 3.7 - Tilting system developed for the FW-36 AWEA LP 4025Z A) as built and B) combined
with the fixturing system (Courtesy of TWI,Ltd).
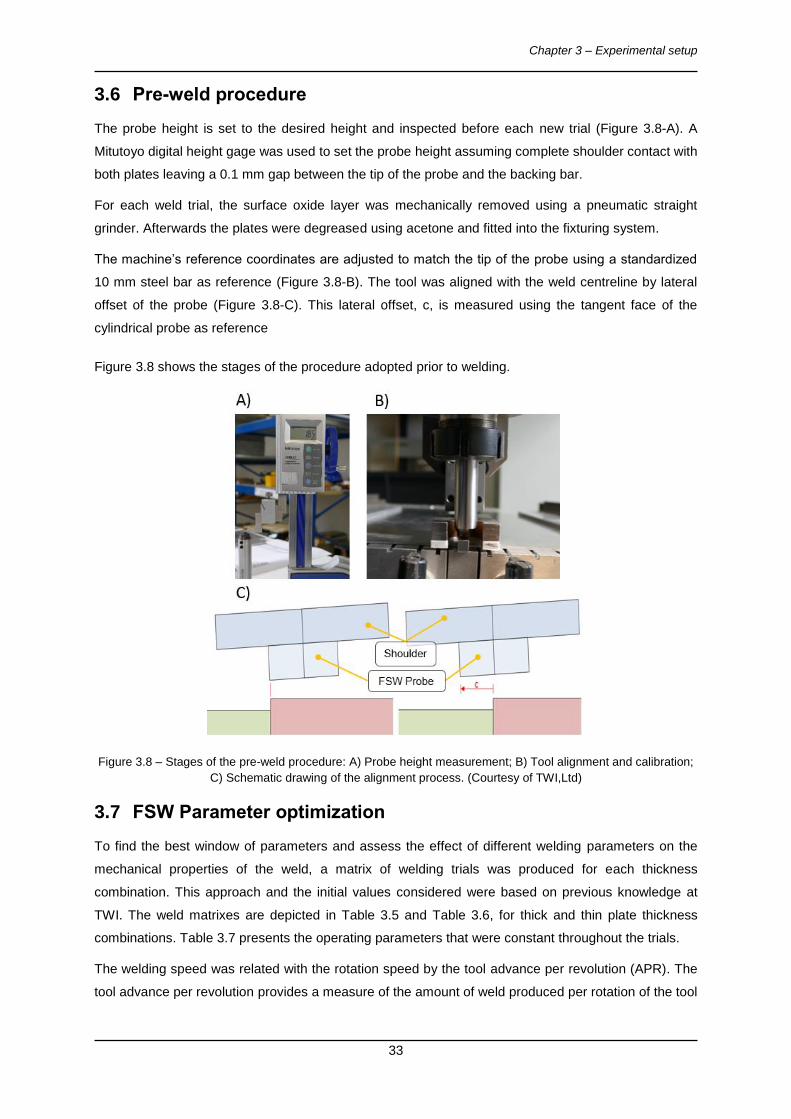
Chapter 3 – Experimental setup
33
3.6 Pre-weld procedure
The probe height is set to the desired height and inspected before each new trial (Figure 3.8-A). A
Mitutoyo digital height gage was used to set the probe height assuming complete shoulder contact with
both plates leaving a 0.1 mm gap between the tip of the probe and the backing bar.
For each weld trial, the surface oxide layer was mechanically removed using a pneumatic straight
grinder. Afterwards the plates were degreased using acetone and fitted into the fixturing system.
The machine’s reference coordinates are adjusted to match the tip of the probe using a standardized
10 mm steel bar as reference (Figure 3.8-B). The tool was aligned with the weld centreline by lateral
offset of the probe (Figure 3.8-C). This lateral offset, c, is measured using the tangent face of the
cylindrical probe as reference
Figure 3.8 shows the stages of the procedure adopted prior to welding.
Figure 3.8 – Stages of the pre-weld procedure: A) Probe height measurement; B) Tool alignment and calibration;
C) Schematic drawing of the alignment process. (Courtesy of TWI,Ltd)
3.7 FSW Parameter optimization
To find the best window of parameters and assess the effect of different welding parameters on the
mechanical properties of the weld, a matrix of welding trials was produced for each thickness
combination. This approach and the initial values considered were based on previous knowledge at
TWI. The weld matrixes are depicted in Table 3.5 and Table 3.6, for thick and thin plate thickness
combinations. Table 3.7 presents the operating parameters that were constant throughout the trials.
The welding speed was related with the rotation speed by the tool advance per revolution (APR). The
tool advance per revolution provides a measure of the amount of weld produced per rotation of the tool
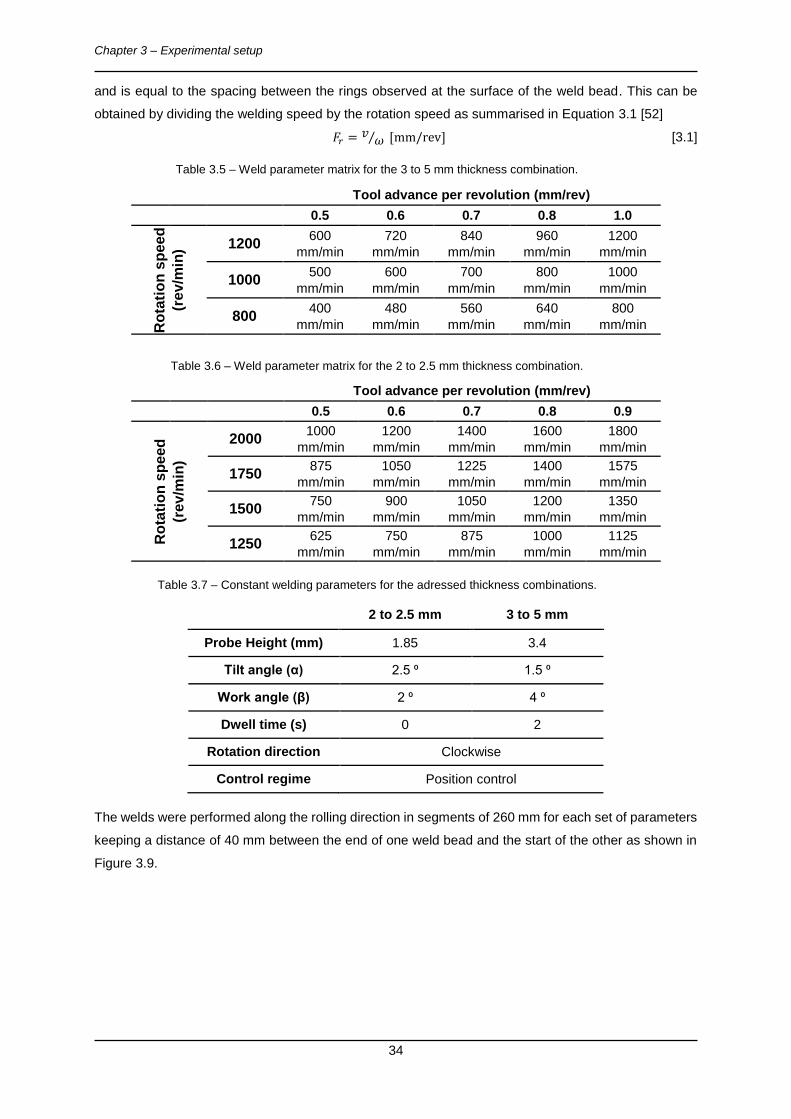
Chapter 3 – Experimental setup
34
and is equal to the spacing between the rings observed at the surface of the weld bead. This can be
obtained by dividing the welding speed by the rotation speed as summarised in Equation 3.1 [52]
𝐹𝑟 = 𝑣𝜔⁄ [mm/rev] [3.1]
Table 3.5 – Weld parameter matrix for the 3 to 5 mm thickness combination.
Tool advance per revolution (mm/rev)
0.5 0.6 0.7 0.8 1.0
Ro
tati
on
sp
eed
(re
v/m
in) 1200 600
mm/min 720
mm/min 840
mm/min 960
mm/min 1200
mm/min
1000 500
mm/min 600
mm/min 700
mm/min 800
mm/min 1000
mm/min
800 400
mm/min 480
mm/min 560
mm/min 640
mm/min 800
mm/min
Table 3.6 – Weld parameter matrix for the 2 to 2.5 mm thickness combination.
Tool advance per revolution (mm/rev)
0.5 0.6 0.7 0.8 0.9
Ro
tati
on
sp
eed
(re
v/m
in)
2000 1000
mm/min 1200
mm/min 1400
mm/min 1600
mm/min 1800
mm/min 1750 875
mm/min 1050
mm/min 1225
mm/min 1400
mm/min 1575
mm/min 1500 750
mm/min 900
mm/min 1050
mm/min 1200
mm/min 1350
mm/min 1250 625
mm/min 750
mm/min 875
mm/min 1000
mm/min 1125
mm/min
Table 3.7 – Constant welding parameters for the adressed thickness combinations.
2 to 2.5 mm 3 to 5 mm
Probe Height (mm) 1.85 3.4 Tilt angle (α) 2.5 ⁰ 1.5 ⁰
Work angle (β) 2 ⁰ 4 ⁰ Dwell time (s) 0 2
Rotation direction Clockwise Control regime Position control
The welds were performed along the rolling direction in segments of 260 mm for each set of parameters
keeping a distance of 40 mm between the end of one weld bead and the start of the other as shown in
Figure 3.9.
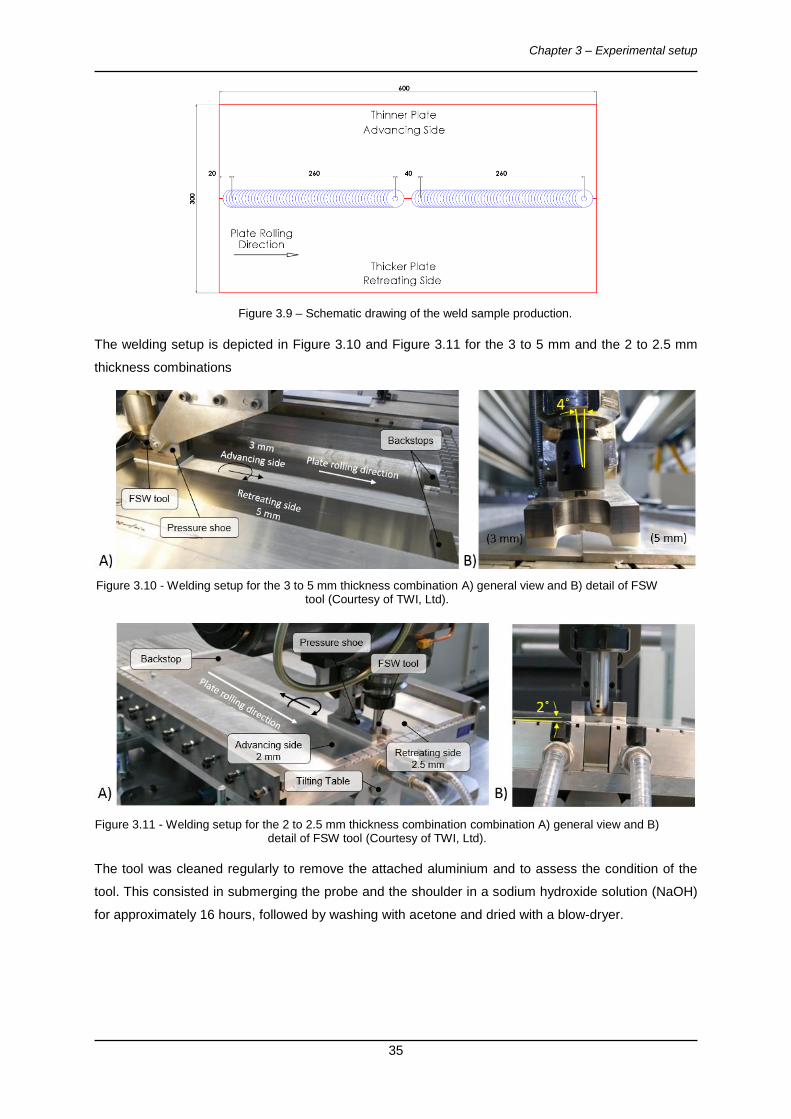
Chapter 3 – Experimental setup
35
Figure 3.9 – Schematic drawing of the weld sample production.
The welding setup is depicted in Figure 3.10 and Figure 3.11 for the 3 to 5 mm and the 2 to 2.5 mm
thickness combinations
Figure 3.10 - Welding setup for the 3 to 5 mm thickness combination A) general view and B) detail of FSW tool (Courtesy of TWI, Ltd).
Figure 3.11 - Welding setup for the 2 to 2.5 mm thickness combination combination A) general view and B) detail of FSW tool (Courtesy of TWI, Ltd).
The tool was cleaned regularly to remove the attached aluminium and to assess the condition of the
tool. This consisted in submerging the probe and the shoulder in a sodium hydroxide solution (NaOH)
for approximately 16 hours, followed by washing with acetone and dried with a blow-dryer.
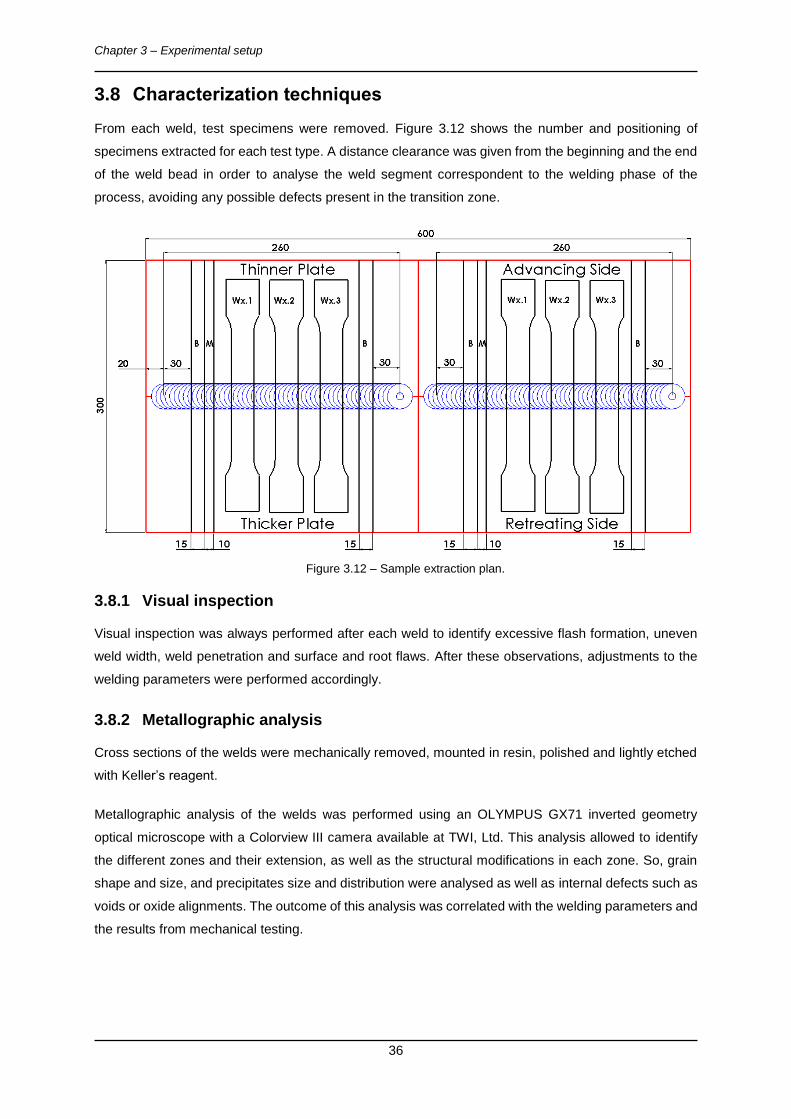
Chapter 3 – Experimental setup
36
3.8 Characterization techniques
From each weld, test specimens were removed. Figure 3.12 shows the number and positioning of
specimens extracted for each test type. A distance clearance was given from the beginning and the end
of the weld bead in order to analyse the weld segment correspondent to the welding phase of the
process, avoiding any possible defects present in the transition zone.
Figure 3.12 – Sample extraction plan.
3.8.1 Visual inspection
Visual inspection was always performed after each weld to identify excessive flash formation, uneven
weld width, weld penetration and surface and root flaws. After these observations, adjustments to the
welding parameters were performed accordingly.
3.8.2 Metallographic analysis
Cross sections of the welds were mechanically removed, mounted in resin, polished and lightly etched
with Keller’s reagent.
Metallographic analysis of the welds was performed using an OLYMPUS GX71 inverted geometry
optical microscope with a Colorview III camera available at TWI, Ltd. This analysis allowed to identify
the different zones and their extension, as well as the structural modifications in each zone. So, grain
shape and size, and precipitates size and distribution were analysed as well as internal defects such as
voids or oxide alignments. The outcome of this analysis was correlated with the welding parameters and
the results from mechanical testing.
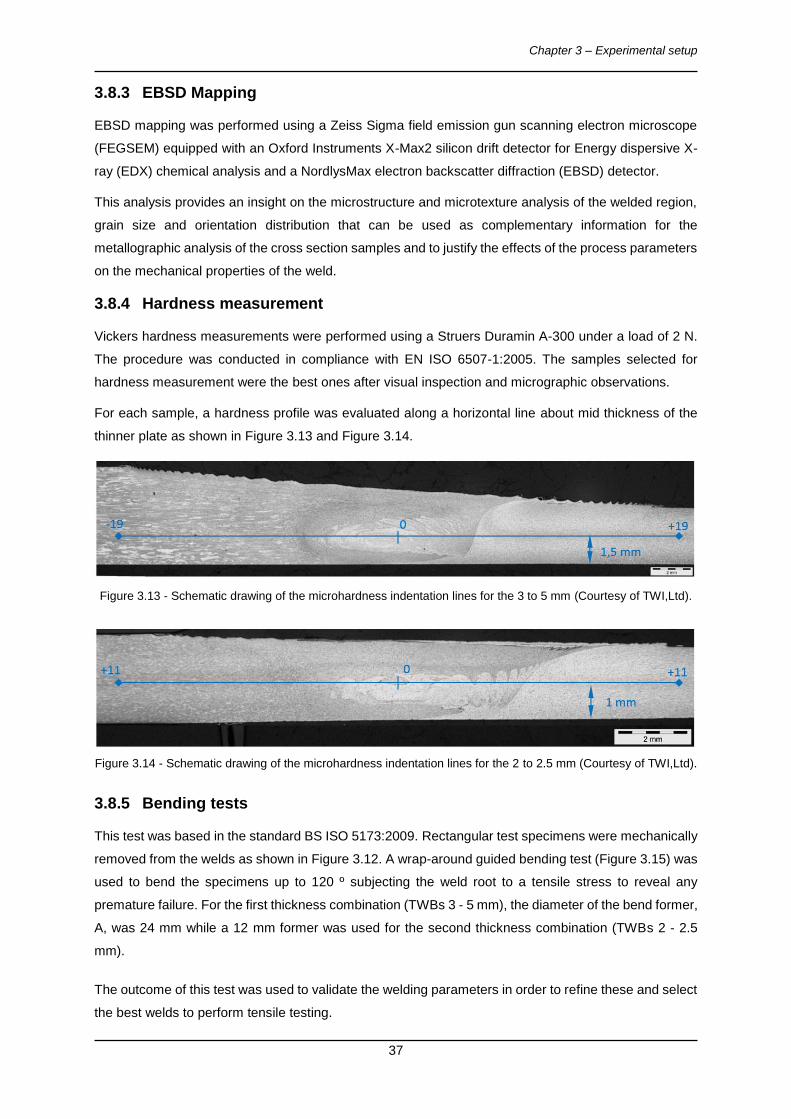
Chapter 3 – Experimental setup
37
3.8.3 EBSD Mapping
EBSD mapping was performed using a Zeiss Sigma field emission gun scanning electron microscope
(FEGSEM) equipped with an Oxford Instruments X-Max2 silicon drift detector for Energy dispersive X-
ray (EDX) chemical analysis and a NordlysMax electron backscatter diffraction (EBSD) detector.
This analysis provides an insight on the microstructure and microtexture analysis of the welded region,
grain size and orientation distribution that can be used as complementary information for the
metallographic analysis of the cross section samples and to justify the effects of the process parameters
on the mechanical properties of the weld.
3.8.4 Hardness measurement
Vickers hardness measurements were performed using a Struers Duramin A-300 under a load of 2 N.
The procedure was conducted in compliance with EN ISO 6507-1:2005. The samples selected for
hardness measurement were the best ones after visual inspection and micrographic observations.
For each sample, a hardness profile was evaluated along a horizontal line about mid thickness of the
thinner plate as shown in Figure 3.13 and Figure 3.14.
Figure 3.13 - Schematic drawing of the microhardness indentation lines for the 3 to 5 mm (Courtesy of TWI,Ltd).
Figure 3.14 - Schematic drawing of the microhardness indentation lines for the 2 to 2.5 mm (Courtesy of TWI,Ltd).
3.8.5 Bending tests
This test was based in the standard BS ISO 5173:2009. Rectangular test specimens were mechanically
removed from the welds as shown in Figure 3.12. A wrap-around guided bending test (Figure 3.15) was
used to bend the specimens up to 120 º subjecting the weld root to a tensile stress to reveal any
premature failure. For the first thickness combination (TWBs 3 - 5 mm), the diameter of the bend former,
A, was 24 mm while a 12 mm former was used for the second thickness combination (TWBs 2 - 2.5
mm).
The outcome of this test was used to validate the welding parameters in order to refine these and select
the best welds to perform tensile testing.
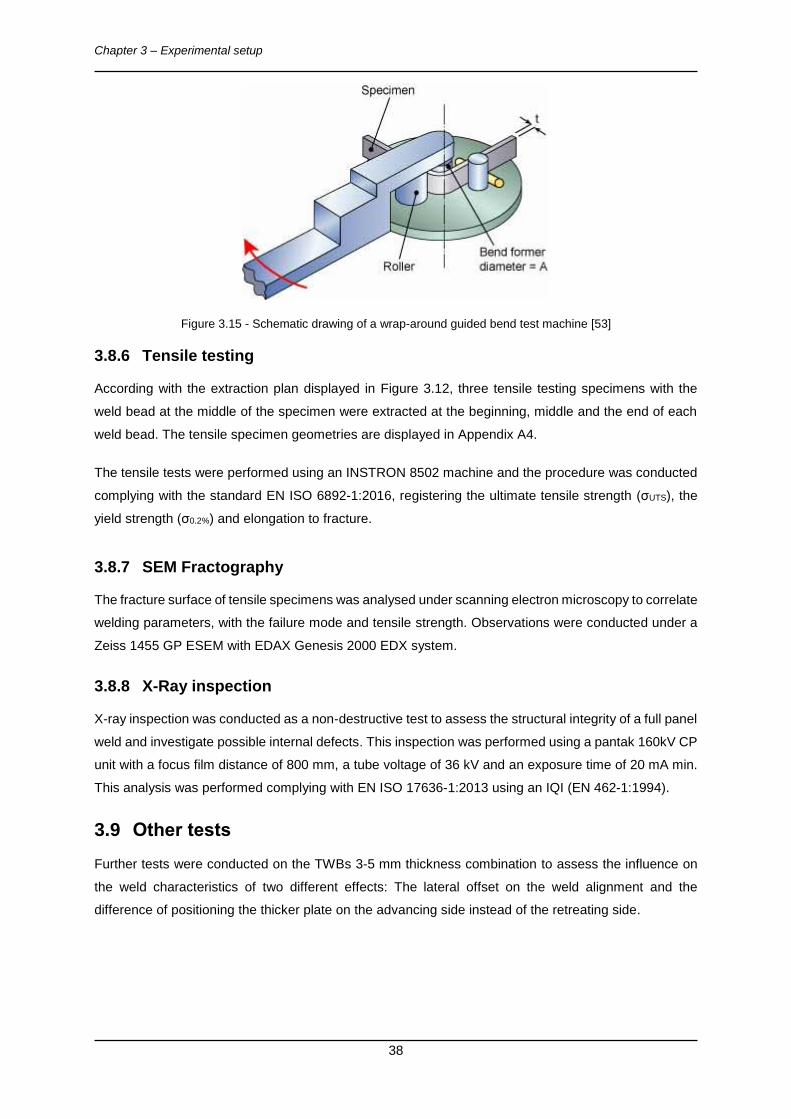
Chapter 3 – Experimental setup
38
Figure 3.15 - Schematic drawing of a wrap-around guided bend test machine [53]
3.8.6 Tensile testing
According with the extraction plan displayed in Figure 3.12, three tensile testing specimens with the
weld bead at the middle of the specimen were extracted at the beginning, middle and the end of each
weld bead. The tensile specimen geometries are displayed in Appendix A4.
The tensile tests were performed using an INSTRON 8502 machine and the procedure was conducted
complying with the standard EN ISO 6892-1:2016, registering the ultimate tensile strength (σUTS), the
yield strength (σ0.2%) and elongation to fracture.
3.8.7 SEM Fractography
The fracture surface of tensile specimens was analysed under scanning electron microscopy to correlate
welding parameters, with the failure mode and tensile strength. Observations were conducted under a
Zeiss 1455 GP ESEM with EDAX Genesis 2000 EDX system.
3.8.8 X-Ray inspection
X-ray inspection was conducted as a non-destructive test to assess the structural integrity of a full panel
weld and investigate possible internal defects. This inspection was performed using a pantak 160kV CP
unit with a focus film distance of 800 mm, a tube voltage of 36 kV and an exposure time of 20 mA min.
This analysis was performed complying with EN ISO 17636-1:2013 using an IQI (EN 462-1:1994).
3.9 Other tests
Further tests were conducted on the TWBs 3-5 mm thickness combination to assess the influence on
the weld characteristics of two different effects: The lateral offset on the weld alignment and the
difference of positioning the thicker plate on the advancing side instead of the retreating side.
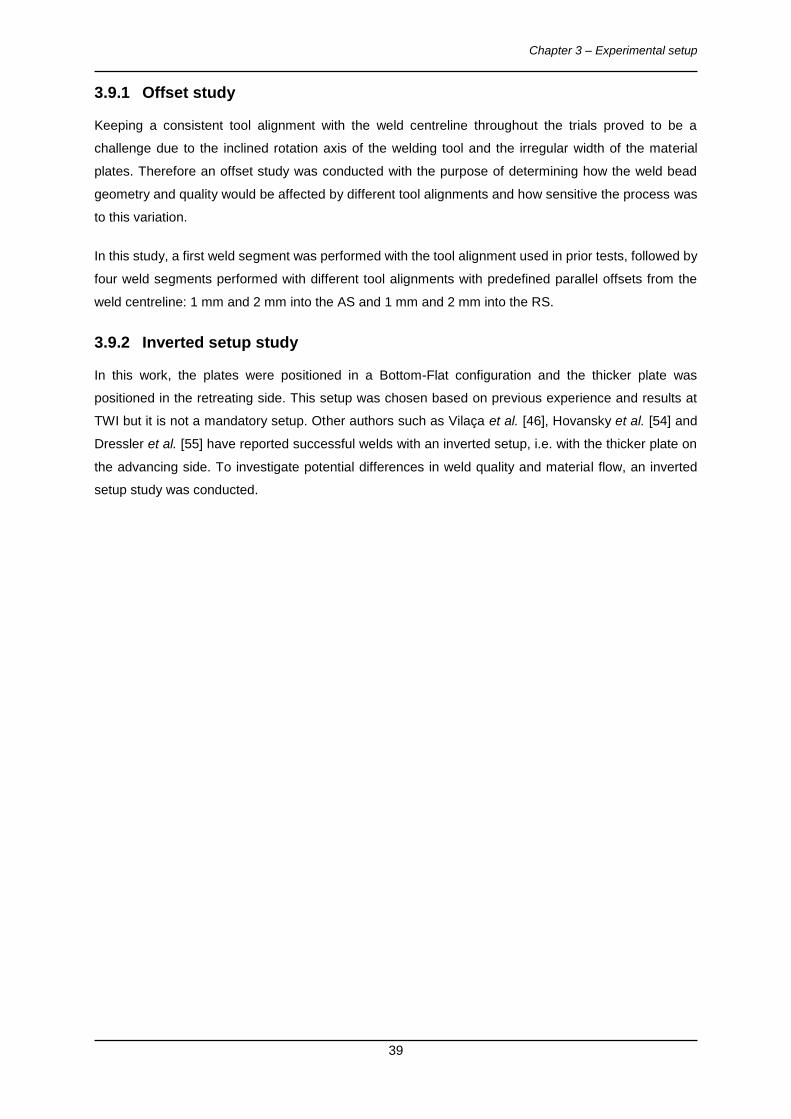
Chapter 3 – Experimental setup
39
3.9.1 Offset study
Keeping a consistent tool alignment with the weld centreline throughout the trials proved to be a
challenge due to the inclined rotation axis of the welding tool and the irregular width of the material
plates. Therefore an offset study was conducted with the purpose of determining how the weld bead
geometry and quality would be affected by different tool alignments and how sensitive the process was
to this variation.
In this study, a first weld segment was performed with the tool alignment used in prior tests, followed by
four weld segments performed with different tool alignments with predefined parallel offsets from the
weld centreline: 1 mm and 2 mm into the AS and 1 mm and 2 mm into the RS.
3.9.2 Inverted setup study
In this work, the plates were positioned in a Bottom-Flat configuration and the thicker plate was
positioned in the retreating side. This setup was chosen based on previous experience and results at
TWI but it is not a mandatory setup. Other authors such as Vilaça et al. [46], Hovansky et al. [54] and
Dressler et al. [55] have reported successful welds with an inverted setup, i.e. with the thicker plate on
the advancing side. To investigate potential differences in weld quality and material flow, an inverted
setup study was conducted.

Chapter 4 – Results and discussion
41
Chapter 4 - Results and discussion
This chapter presents the work performed and a detailed discussion of the results obtained. Since two
different combination of plate thicknesses were studied, each one is discussed separately, though
comparison of results is highlighted whenever appropriate. Tailor Welded Blanks in 3 to 5 mm thick Al
plates are first discussed followed by the 2 to 2.5 mm ones.
4.1 TWBs 3-5 mm
The parameter optimization for the first thickness combination was performed using the welding
parameter combinations presented in Table 3.5, as specified in section 3.7. Each parameter
combination was identified with the letter “W” followed by a number that was assigned by ascending
order for each trial. The first welds performed were used to assess if the probe height, plunge speed
and dwell time were appropriate and were also registered. The designation for each parameter
combination is presented in Table 4.1.
Table 4.1 - Weld parameter matrix with weld designation.
Tool advance per revolution (mm/rev)
0.5 0.6 0.7 0.8 1.0
Ro
tati
on
sp
eed
(re
v/m
in)
1200 W18
600 mm/min W11
720 mm/min W16
840 mm/min W10
960 mm/min
1000 W17
500 mm/min W5
600 mm/min W14
700 mm/min W6
800 mm/min W12
1000 mm/min
800 W19
400 mm/min W7
480 mm/min W15
560 mm/min W8
640 mm/min W13
800 mm/min
4.1.1 Visual inspection
The top face of each weld bead is depicted in Table 4.2. The retreating side of the weld is presented on
the left-hand side of each image. A thin continuous flash of around 0.5 mm thick is observed on the
retreating side of all the welds. This flash could be easily removed by hand, producing a weld bead with
a smooth transition between the weld bead and base material. A regular distribution of the striation
pattern typical of the FSW process can also be seen, which confirms the appropriate shoulder geometry
and plunge depth.
The width of the weld bead was almost constant along the joint line for most of the experimented
parameter combinations. For welding speeds higher than 800 mm/min an evident thinning of the weld
bead was observed, corresponding to a reduction of 14 % compared to the shoulder diameter for the
highest rotation and travel speeds tested.
Regarding the root side of the weld beads, not all of the experimented parameter combinations
evidenced a clear joining between the plates. For welding speeds higher than 800 mm/min, there is no
full penetration which is detrimental for mechanical behaviour under tensile and fatigue conditions, so
this parameter combination was not retained for further tests.
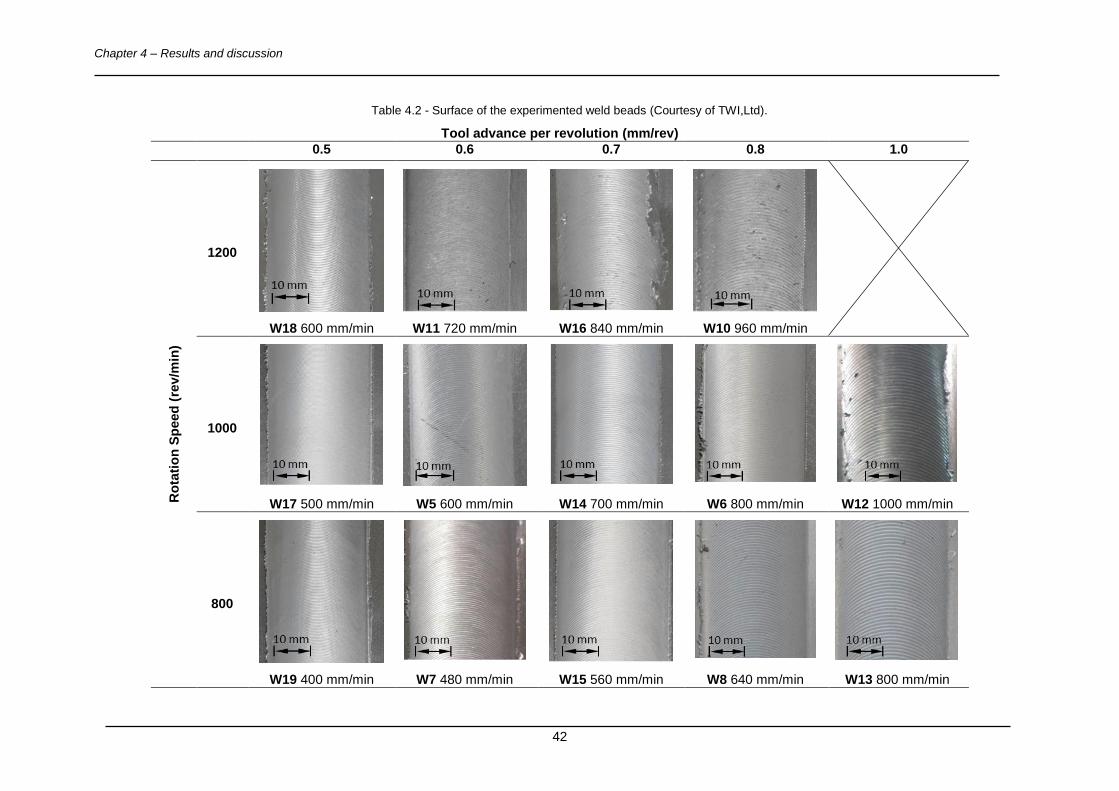
Chapter 4 – Results and discussion
42
Table 4.2 - Surface of the experimented weld beads (Courtesy of TWI,Ltd).
Tool advance per revolution (mm/rev)
0.5 0.6 0.7 0.8 1.0
Ro
tati
on
Sp
eed
(re
v/m
in)
1200
W18 600 mm/min
W11 720 mm/min
W16 840 mm/min
W10 960 mm/min
1000
W17 500 mm/min
W5 600 mm/min
W14 700 mm/min
W6 800 mm/min
W12 1000 mm/min
800
W19 400 mm/min
W7 480 mm/min
W15 560 mm/min
W8 640 mm/min
W13 800 mm/min
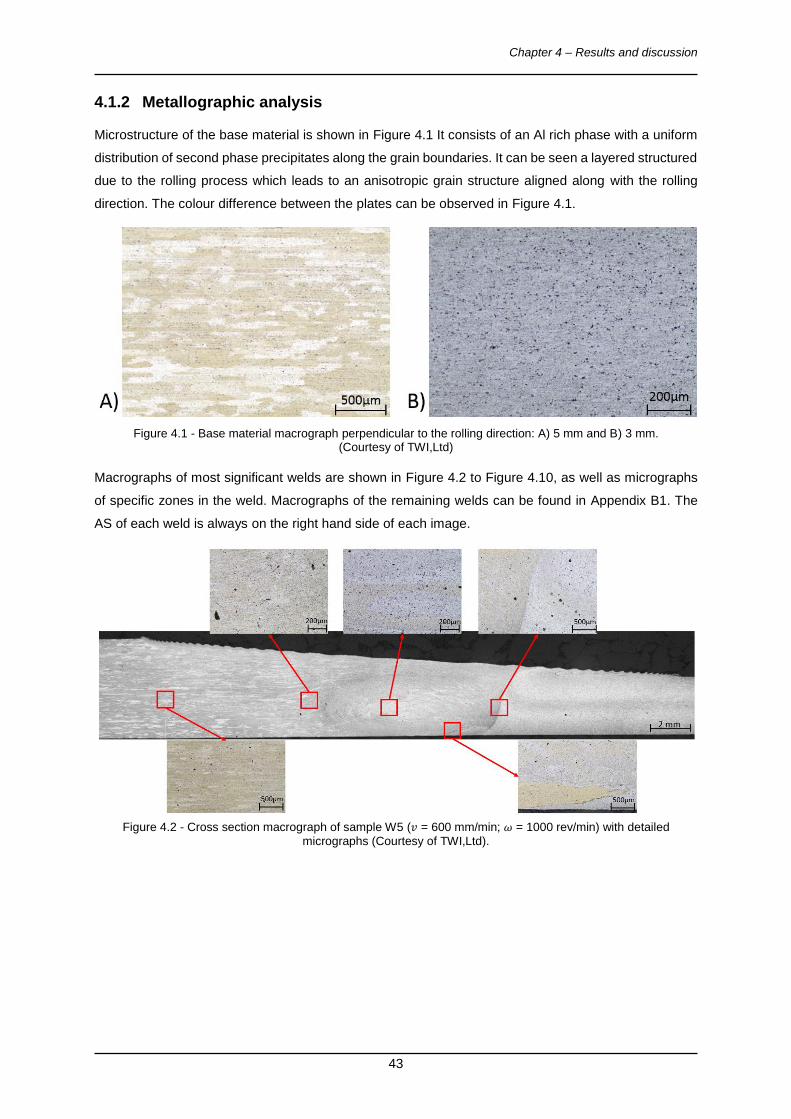
Chapter 4 – Results and discussion
43
4.1.2 Metallographic analysis
Microstructure of the base material is shown in Figure 4.1 It consists of an Al rich phase with a uniform
distribution of second phase precipitates along the grain boundaries. It can be seen a layered structured
due to the rolling process which leads to an anisotropic grain structure aligned along with the rolling
direction. The colour difference between the plates can be observed in Figure 4.1.
Figure 4.1 - Base material macrograph perpendicular to the rolling direction: A) 5 mm and B) 3 mm. (Courtesy of TWI,Ltd)
Macrographs of most significant welds are shown in Figure 4.2 to Figure 4.10, as well as micrographs
of specific zones in the weld. Macrographs of the remaining welds can be found in Appendix B1. The
AS of each weld is always on the right hand side of each image.
Figure 4.2 - Cross section macrograph of sample W5 (𝑣 = 600 mm/min; 𝜔 = 1000 rev/min) with detailed
micrographs (Courtesy of TWI,Ltd).
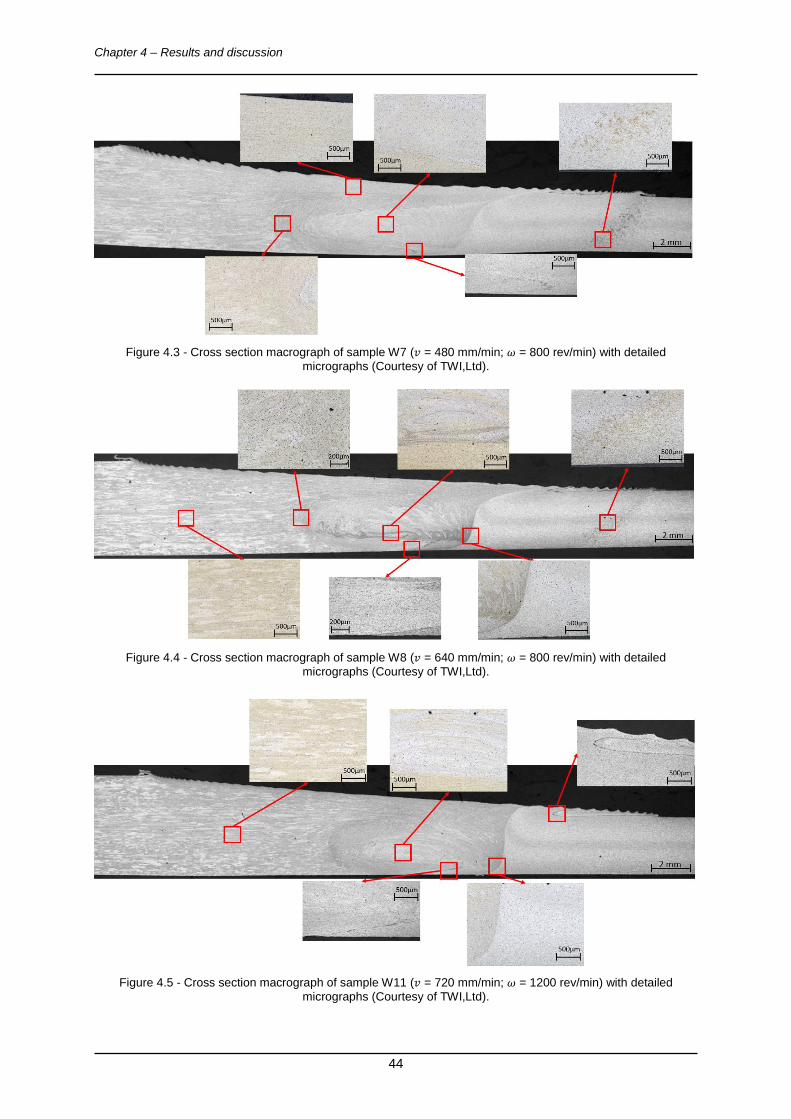
Chapter 4 – Results and discussion
44
Figure 4.3 - Cross section macrograph of sample W7 (𝑣 = 480 mm/min; 𝜔 = 800 rev/min) with detailed
micrographs (Courtesy of TWI,Ltd).
Figure 4.4 - Cross section macrograph of sample W8 (𝑣 = 640 mm/min; 𝜔 = 800 rev/min) with detailed
micrographs (Courtesy of TWI,Ltd).
Figure 4.5 - Cross section macrograph of sample W11 (𝑣 = 720 mm/min; 𝜔 = 1200 rev/min) with detailed
micrographs (Courtesy of TWI,Ltd).
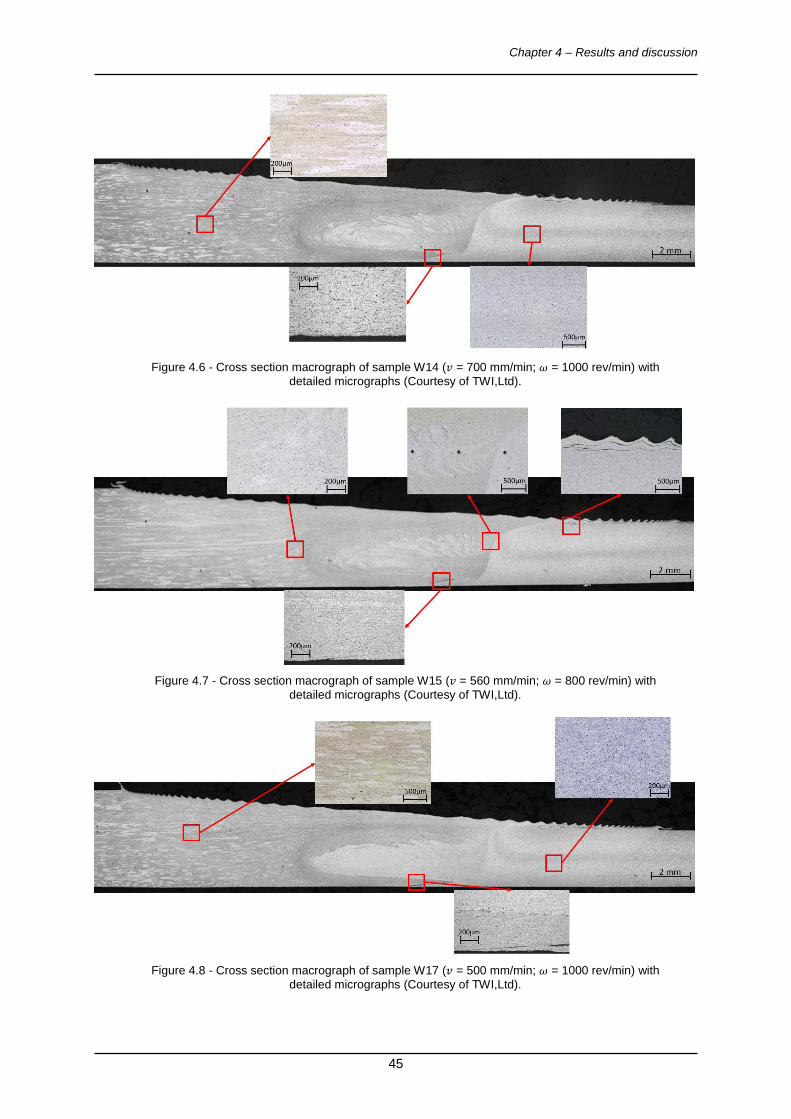
Chapter 4 – Results and discussion
45
Figure 4.6 - Cross section macrograph of sample W14 (𝑣 = 700 mm/min; 𝜔 = 1000 rev/min) with
detailed micrographs (Courtesy of TWI,Ltd).
Figure 4.7 - Cross section macrograph of sample W15 (𝑣 = 560 mm/min; 𝜔 = 800 rev/min) with
detailed micrographs (Courtesy of TWI,Ltd).
Figure 4.8 - Cross section macrograph of sample W17 (𝑣 = 500 mm/min; 𝜔 = 1000 rev/min) with
detailed micrographs (Courtesy of TWI,Ltd).
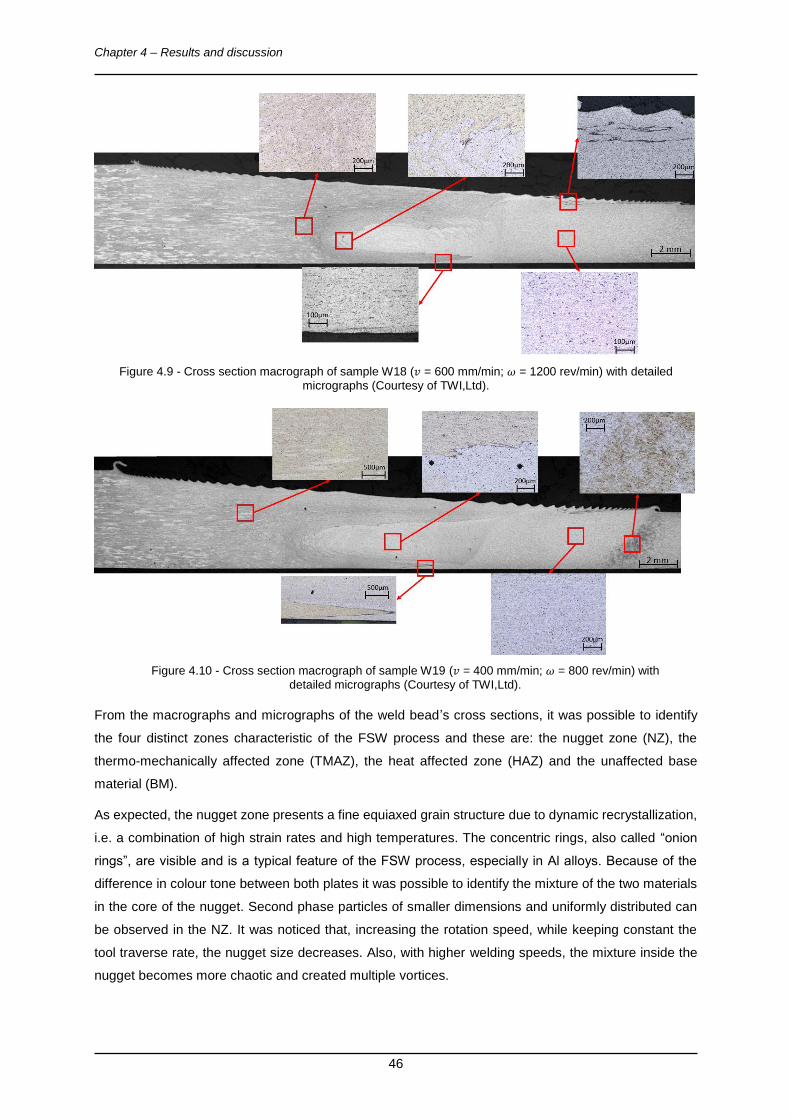
Chapter 4 – Results and discussion
46
Figure 4.9 - Cross section macrograph of sample W18 (𝑣 = 600 mm/min; 𝜔 = 1200 rev/min) with detailed
micrographs (Courtesy of TWI,Ltd).
Figure 4.10 - Cross section macrograph of sample W19 (𝑣 = 400 mm/min; 𝜔 = 800 rev/min) with
detailed micrographs (Courtesy of TWI,Ltd).
From the macrographs and micrographs of the weld bead’s cross sections, it was possible to identify
the four distinct zones characteristic of the FSW process and these are: the nugget zone (NZ), the
thermo-mechanically affected zone (TMAZ), the heat affected zone (HAZ) and the unaffected base
material (BM).
As expected, the nugget zone presents a fine equiaxed grain structure due to dynamic recrystallization,
i.e. a combination of high strain rates and high temperatures. The concentric rings, also called “onion
rings”, are visible and is a typical feature of the FSW process, especially in Al alloys. Because of the
difference in colour tone between both plates it was possible to identify the mixture of the two materials
in the core of the nugget. Second phase particles of smaller dimensions and uniformly distributed can
be observed in the NZ. It was noticed that, increasing the rotation speed, while keeping constant the
tool traverse rate, the nugget size decreases. Also, with higher welding speeds, the mixture inside the
nugget becomes more chaotic and created multiple vortices.
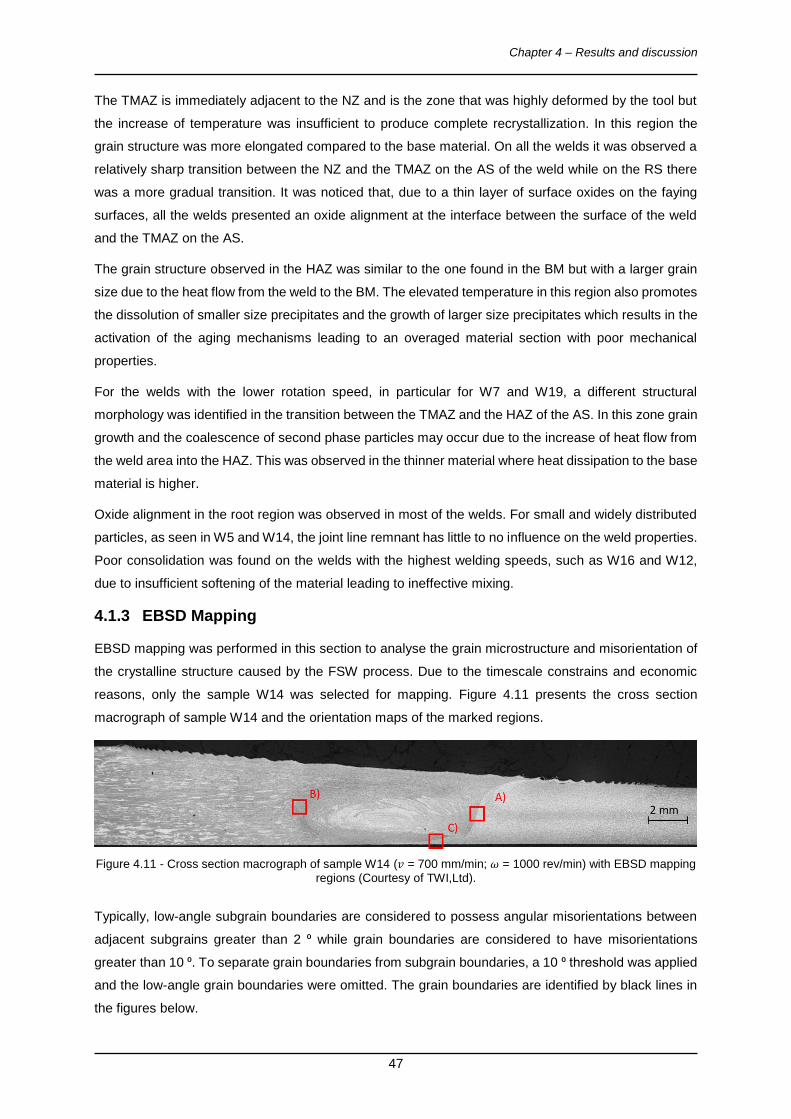
Chapter 4 – Results and discussion
47
The TMAZ is immediately adjacent to the NZ and is the zone that was highly deformed by the tool but
the increase of temperature was insufficient to produce complete recrystallization. In this region the
grain structure was more elongated compared to the base material. On all the welds it was observed a
relatively sharp transition between the NZ and the TMAZ on the AS of the weld while on the RS there
was a more gradual transition. It was noticed that, due to a thin layer of surface oxides on the faying
surfaces, all the welds presented an oxide alignment at the interface between the surface of the weld
and the TMAZ on the AS.
The grain structure observed in the HAZ was similar to the one found in the BM but with a larger grain
size due to the heat flow from the weld to the BM. The elevated temperature in this region also promotes
the dissolution of smaller size precipitates and the growth of larger size precipitates which results in the
activation of the aging mechanisms leading to an overaged material section with poor mechanical
properties.
For the welds with the lower rotation speed, in particular for W7 and W19, a different structural
morphology was identified in the transition between the TMAZ and the HAZ of the AS. In this zone grain
growth and the coalescence of second phase particles may occur due to the increase of heat flow from
the weld area into the HAZ. This was observed in the thinner material where heat dissipation to the base
material is higher.
Oxide alignment in the root region was observed in most of the welds. For small and widely distributed
particles, as seen in W5 and W14, the joint line remnant has little to no influence on the weld properties.
Poor consolidation was found on the welds with the highest welding speeds, such as W16 and W12,
due to insufficient softening of the material leading to ineffective mixing.
4.1.3 EBSD Mapping
EBSD mapping was performed in this section to analyse the grain microstructure and misorientation of
the crystalline structure caused by the FSW process. Due to the timescale constrains and economic
reasons, only the sample W14 was selected for mapping. Figure 4.11 presents the cross section
macrograph of sample W14 and the orientation maps of the marked regions.
Figure 4.11 - Cross section macrograph of sample W14 (𝑣 = 700 mm/min; 𝜔 = 1000 rev/min) with EBSD mapping
regions (Courtesy of TWI,Ltd).
Typically, low-angle subgrain boundaries are considered to possess angular misorientations between
adjacent subgrains greater than 2 ⁰ while grain boundaries are considered to have misorientations
greater than 10 ⁰. To separate grain boundaries from subgrain boundaries, a 10 ⁰ threshold was applied
and the low-angle grain boundaries were omitted. The grain boundaries are identified by black lines in
the figures below.
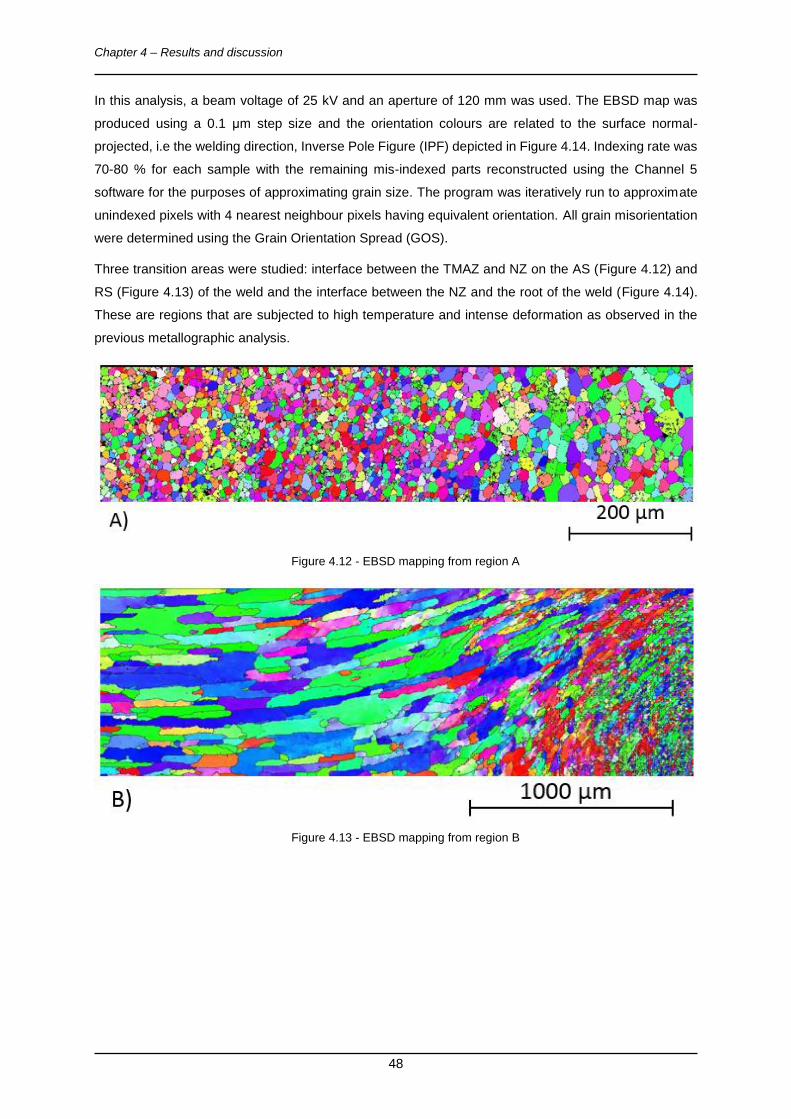
Chapter 4 – Results and discussion
48
In this analysis, a beam voltage of 25 kV and an aperture of 120 mm was used. The EBSD map was
produced using a 0.1 μm step size and the orientation colours are related to the surface normal-
projected, i.e the welding direction, Inverse Pole Figure (IPF) depicted in Figure 4.14. Indexing rate was
70-80 % for each sample with the remaining mis-indexed parts reconstructed using the Channel 5
software for the purposes of approximating grain size. The program was iteratively run to approximate
unindexed pixels with 4 nearest neighbour pixels having equivalent orientation. All grain misorientation
were determined using the Grain Orientation Spread (GOS).
Three transition areas were studied: interface between the TMAZ and NZ on the AS (Figure 4.12) and
RS (Figure 4.13) of the weld and the interface between the NZ and the root of the weld (Figure 4.14).
These are regions that are subjected to high temperature and intense deformation as observed in the
previous metallographic analysis.
Figure 4.12 - EBSD mapping from region A
Figure 4.13 - EBSD mapping from region B
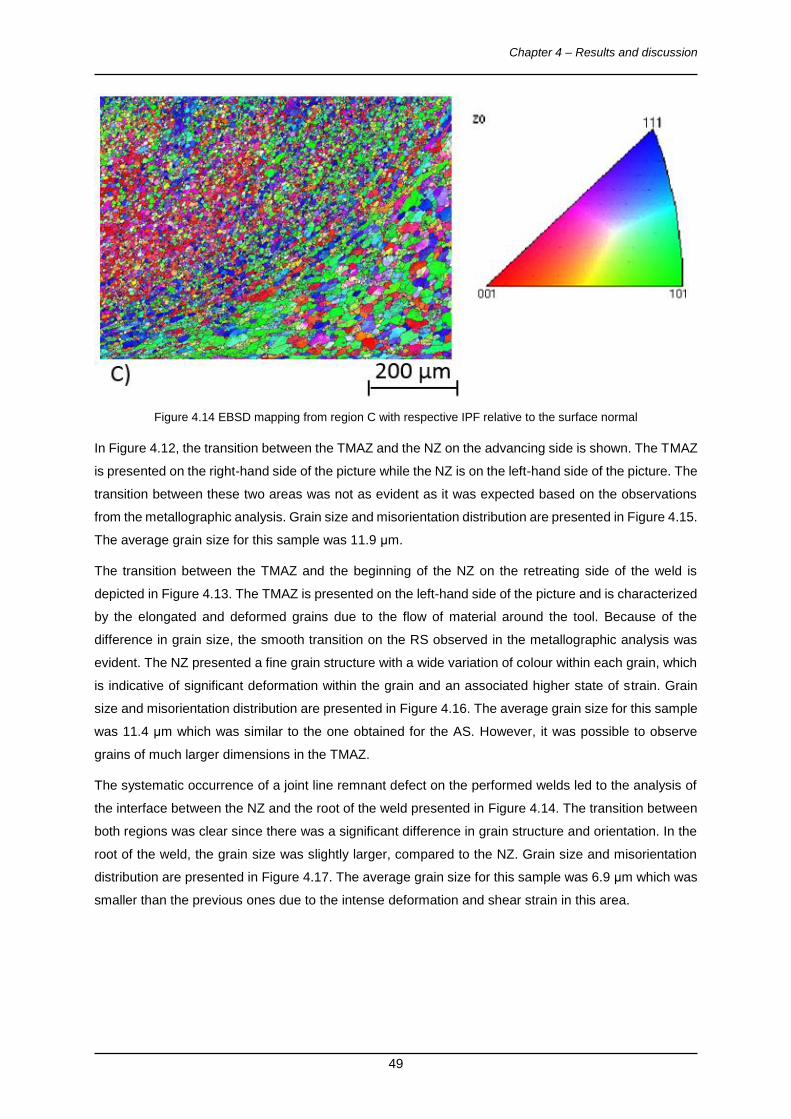
Chapter 4 – Results and discussion
49
Figure 4.14 EBSD mapping from region C with respective IPF relative to the surface normal
In Figure 4.12, the transition between the TMAZ and the NZ on the advancing side is shown. The TMAZ
is presented on the right-hand side of the picture while the NZ is on the left-hand side of the picture. The
transition between these two areas was not as evident as it was expected based on the observations
from the metallographic analysis. Grain size and misorientation distribution are presented in Figure 4.15.
The average grain size for this sample was 11.9 μm.
The transition between the TMAZ and the beginning of the NZ on the retreating side of the weld is
depicted in Figure 4.13. The TMAZ is presented on the left-hand side of the picture and is characterized
by the elongated and deformed grains due to the flow of material around the tool. Because of the
difference in grain size, the smooth transition on the RS observed in the metallographic analysis was
evident. The NZ presented a fine grain structure with a wide variation of colour within each grain, which
is indicative of significant deformation within the grain and an associated higher state of strain. Grain
size and misorientation distribution are presented in Figure 4.16. The average grain size for this sample
was 11.4 μm which was similar to the one obtained for the AS. However, it was possible to observe
grains of much larger dimensions in the TMAZ.
The systematic occurrence of a joint line remnant defect on the performed welds led to the analysis of
the interface between the NZ and the root of the weld presented in Figure 4.14. The transition between
both regions was clear since there was a significant difference in grain structure and orientation. In the
root of the weld, the grain size was slightly larger, compared to the NZ. Grain size and misorientation
distribution are presented in Figure 4.17. The average grain size for this sample was 6.9 μm which was
smaller than the previous ones due to the intense deformation and shear strain in this area.
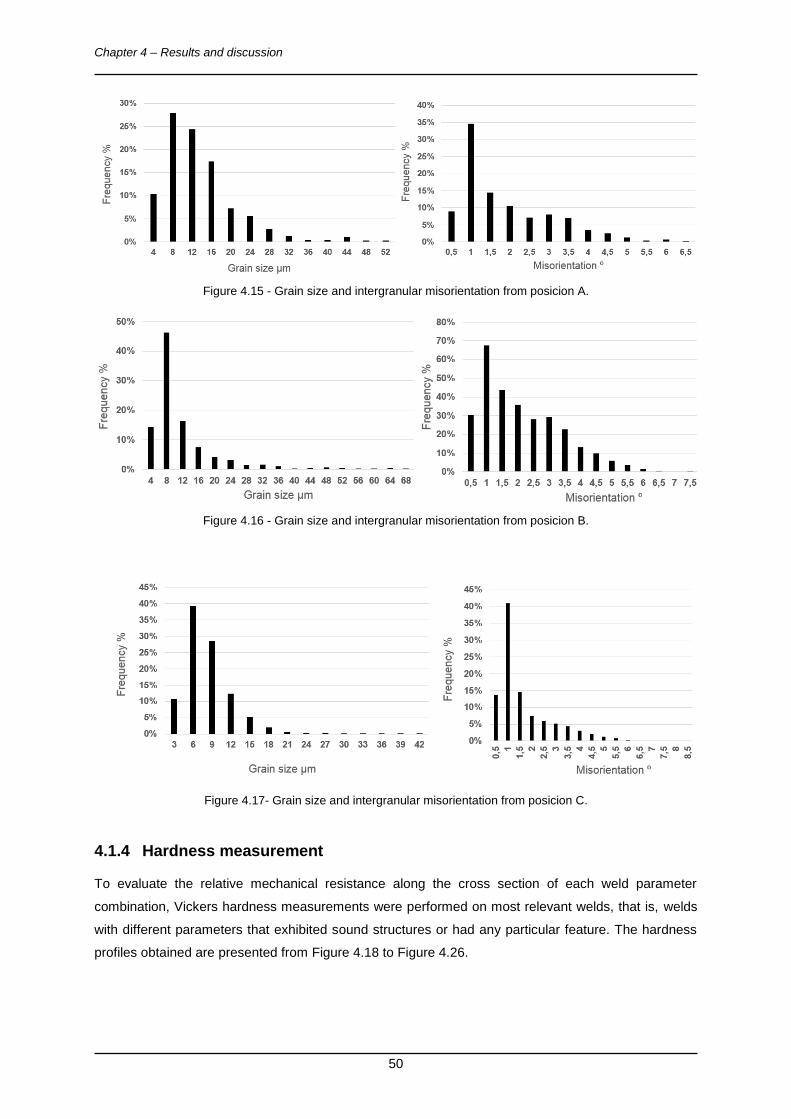
Chapter 4 – Results and discussion
50
Figure 4.15 - Grain size and intergranular misorientation from posicion A.
Figure 4.16 - Grain size and intergranular misorientation from posicion B.
Figure 4.17- Grain size and intergranular misorientation from posicion C.
4.1.4 Hardness measurement
To evaluate the relative mechanical resistance along the cross section of each weld parameter
combination, Vickers hardness measurements were performed on most relevant welds, that is, welds
with different parameters that exhibited sound structures or had any particular feature. The hardness
profiles obtained are presented from Figure 4.18 to Figure 4.26.
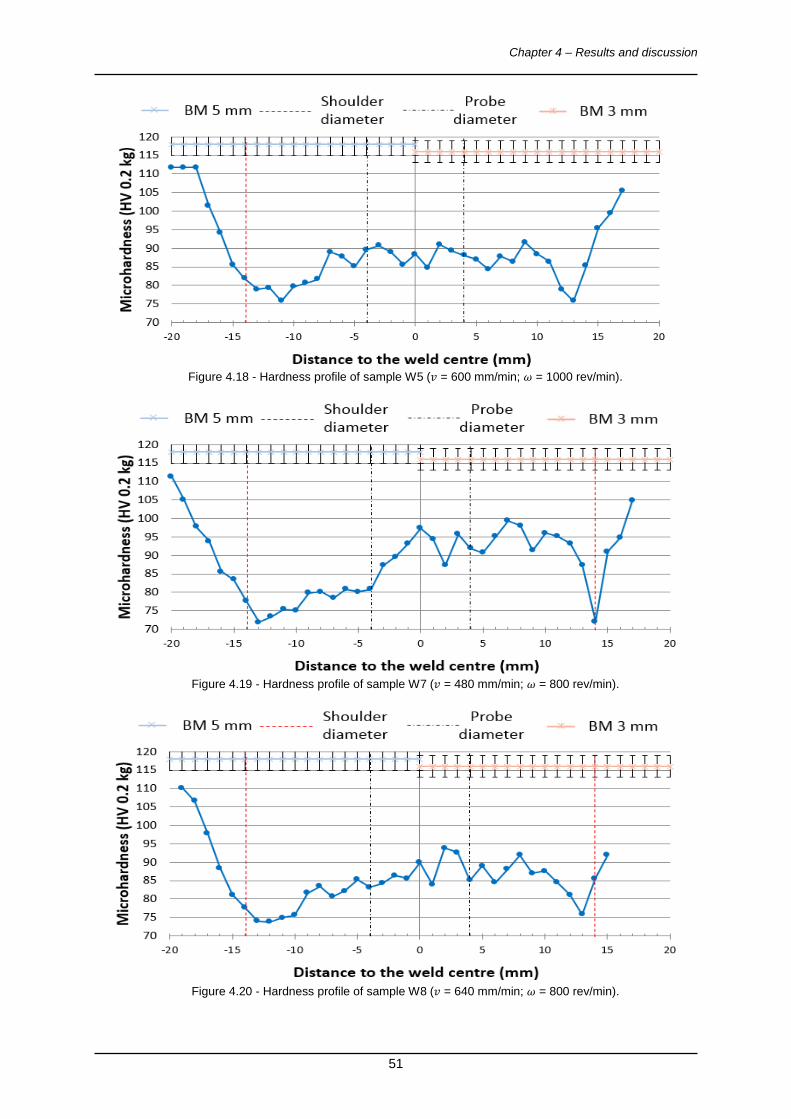
Chapter 4 – Results and discussion
51
Figure 4.18 - Hardness profile of sample W5 (𝑣 = 600 mm/min; 𝜔 = 1000 rev/min).
Figure 4.19 - Hardness profile of sample W7 (𝑣 = 480 mm/min; 𝜔 = 800 rev/min).
Figure 4.20 - Hardness profile of sample W8 (𝑣 = 640 mm/min; 𝜔 = 800 rev/min).
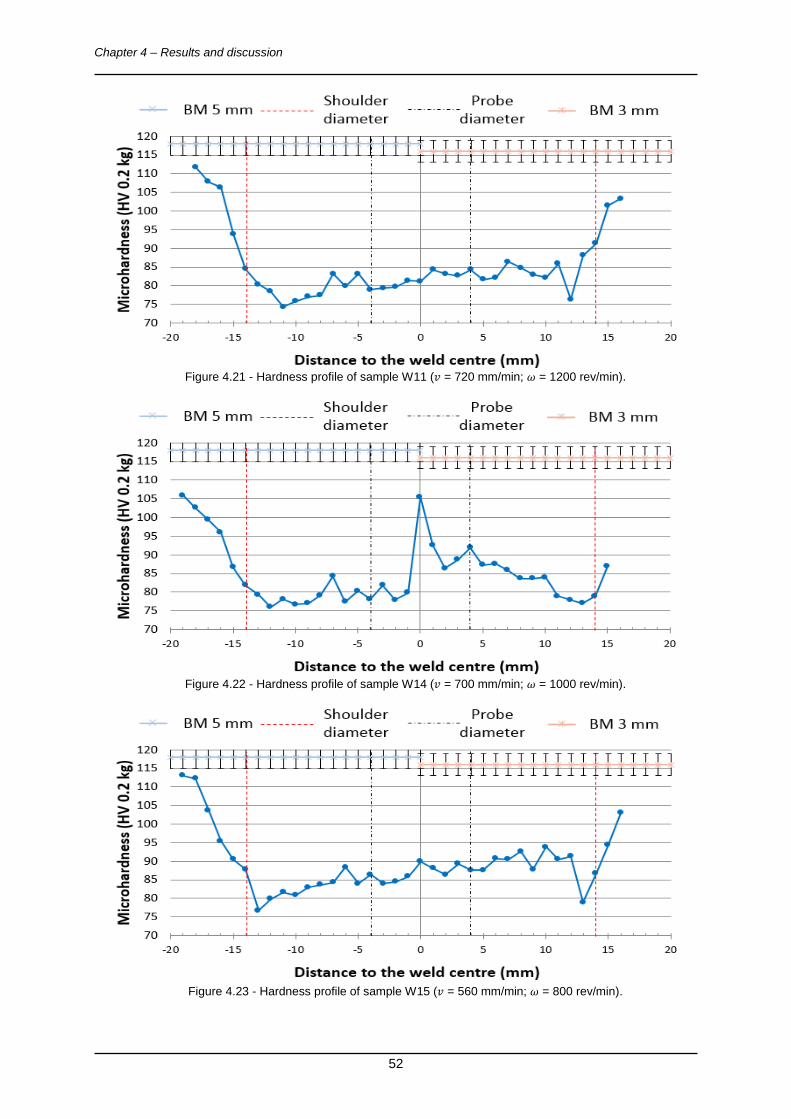
Chapter 4 – Results and discussion
52
Figure 4.21 - Hardness profile of sample W11 (𝑣 = 720 mm/min; 𝜔 = 1200 rev/min).
Figure 4.22 - Hardness profile of sample W14 (𝑣 = 700 mm/min; 𝜔 = 1000 rev/min).
Figure 4.23 - Hardness profile of sample W15 (𝑣 = 560 mm/min; 𝜔 = 800 rev/min).
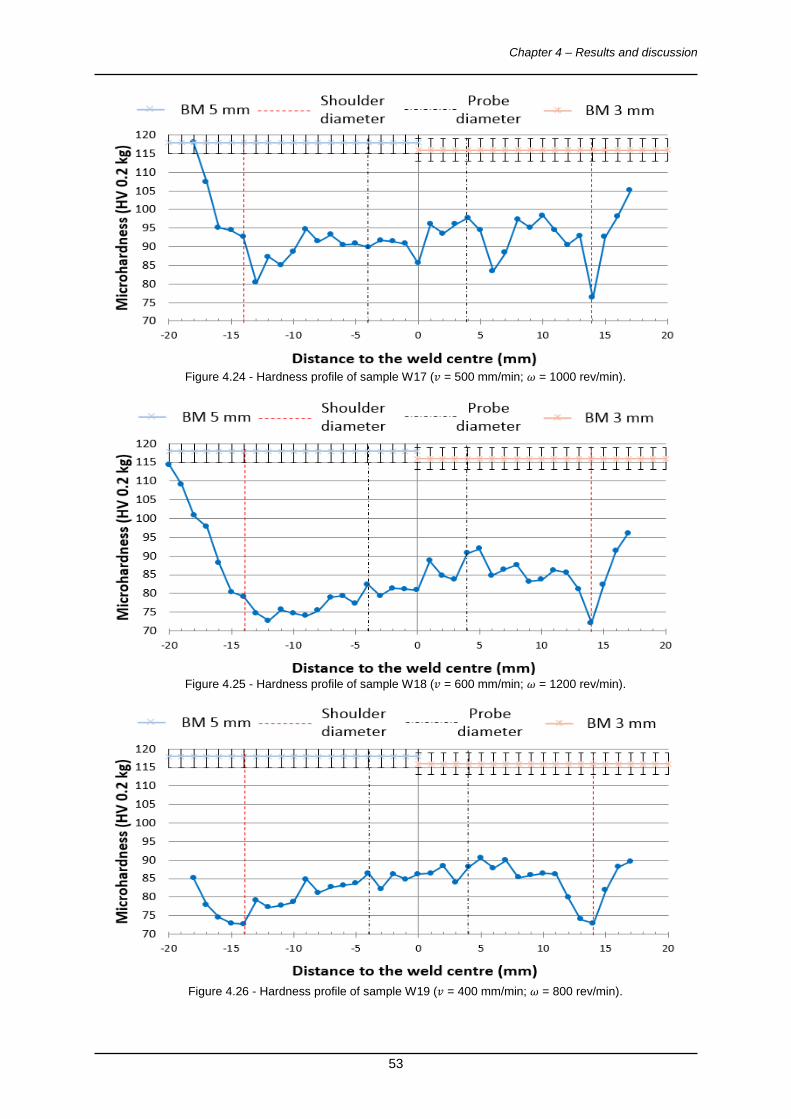
Chapter 4 – Results and discussion
53
Figure 4.24 - Hardness profile of sample W17 (𝑣 = 500 mm/min; 𝜔 = 1000 rev/min).
Figure 4.25 - Hardness profile of sample W18 (𝑣 = 600 mm/min; 𝜔 = 1200 rev/min).
Figure 4.26 - Hardness profile of sample W19 (𝑣 = 400 mm/min; 𝜔 = 800 rev/min).
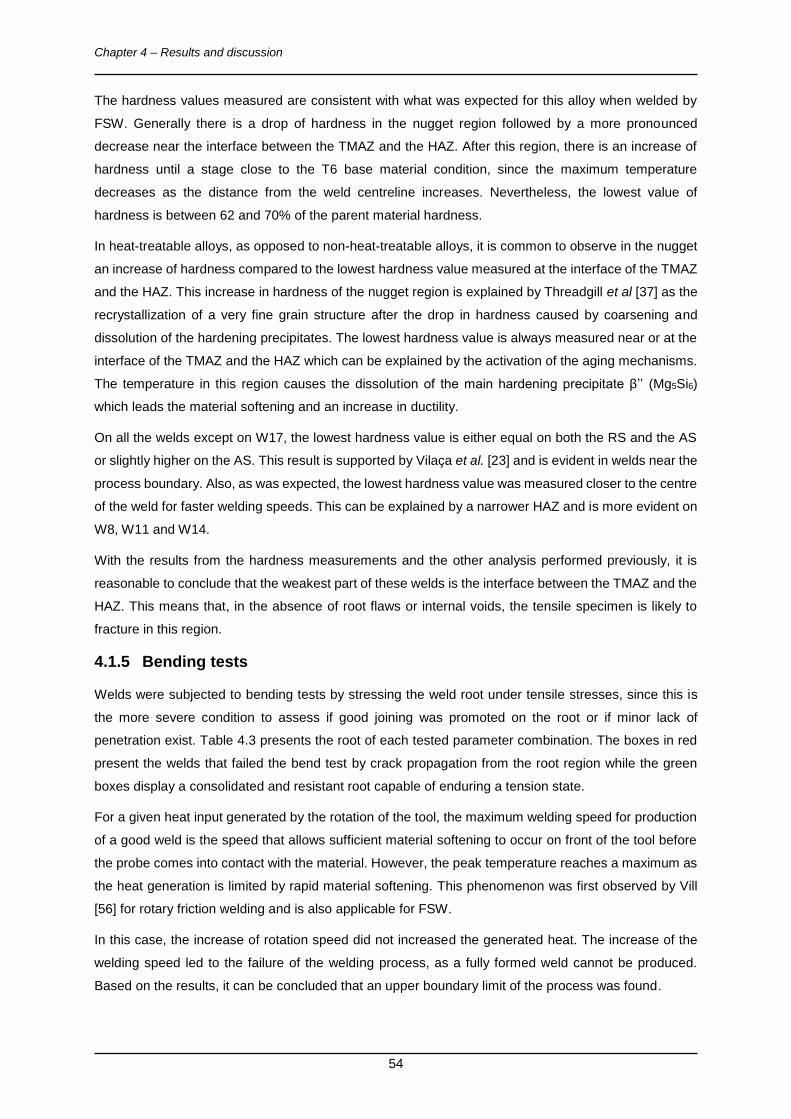
Chapter 4 – Results and discussion
54
The hardness values measured are consistent with what was expected for this alloy when welded by
FSW. Generally there is a drop of hardness in the nugget region followed by a more pronounced
decrease near the interface between the TMAZ and the HAZ. After this region, there is an increase of
hardness until a stage close to the T6 base material condition, since the maximum temperature
decreases as the distance from the weld centreline increases. Nevertheless, the lowest value of
hardness is between 62 and 70% of the parent material hardness.
In heat-treatable alloys, as opposed to non-heat-treatable alloys, it is common to observe in the nugget
an increase of hardness compared to the lowest hardness value measured at the interface of the TMAZ
and the HAZ. This increase in hardness of the nugget region is explained by Threadgill et al [37] as the
recrystallization of a very fine grain structure after the drop in hardness caused by coarsening and
dissolution of the hardening precipitates. The lowest hardness value is always measured near or at the
interface of the TMAZ and the HAZ which can be explained by the activation of the aging mechanisms.
The temperature in this region causes the dissolution of the main hardening precipitate β’’ (Mg5Si6)
which leads the material softening and an increase in ductility.
On all the welds except on W17, the lowest hardness value is either equal on both the RS and the AS
or slightly higher on the AS. This result is supported by Vilaça et al. [23] and is evident in welds near the
process boundary. Also, as was expected, the lowest hardness value was measured closer to the centre
of the weld for faster welding speeds. This can be explained by a narrower HAZ and is more evident on
W8, W11 and W14.
With the results from the hardness measurements and the other analysis performed previously, it is
reasonable to conclude that the weakest part of these welds is the interface between the TMAZ and the
HAZ. This means that, in the absence of root flaws or internal voids, the tensile specimen is likely to
fracture in this region.
4.1.5 Bending tests
Welds were subjected to bending tests by stressing the weld root under tensile stresses, since this is
the more severe condition to assess if good joining was promoted on the root or if minor lack of
penetration exist. Table 4.3 presents the root of each tested parameter combination. The boxes in red
present the welds that failed the bend test by crack propagation from the root region while the green
boxes display a consolidated and resistant root capable of enduring a tension state.
For a given heat input generated by the rotation of the tool, the maximum welding speed for production
of a good weld is the speed that allows sufficient material softening to occur on front of the tool before
the probe comes into contact with the material. However, the peak temperature reaches a maximum as
the heat generation is limited by rapid material softening. This phenomenon was first observed by Vill
[56] for rotary friction welding and is also applicable for FSW.
In this case, the increase of rotation speed did not increased the generated heat. The increase of the
welding speed led to the failure of the welding process, as a fully formed weld cannot be produced.
Based on the results, it can be concluded that an upper boundary limit of the process was found.
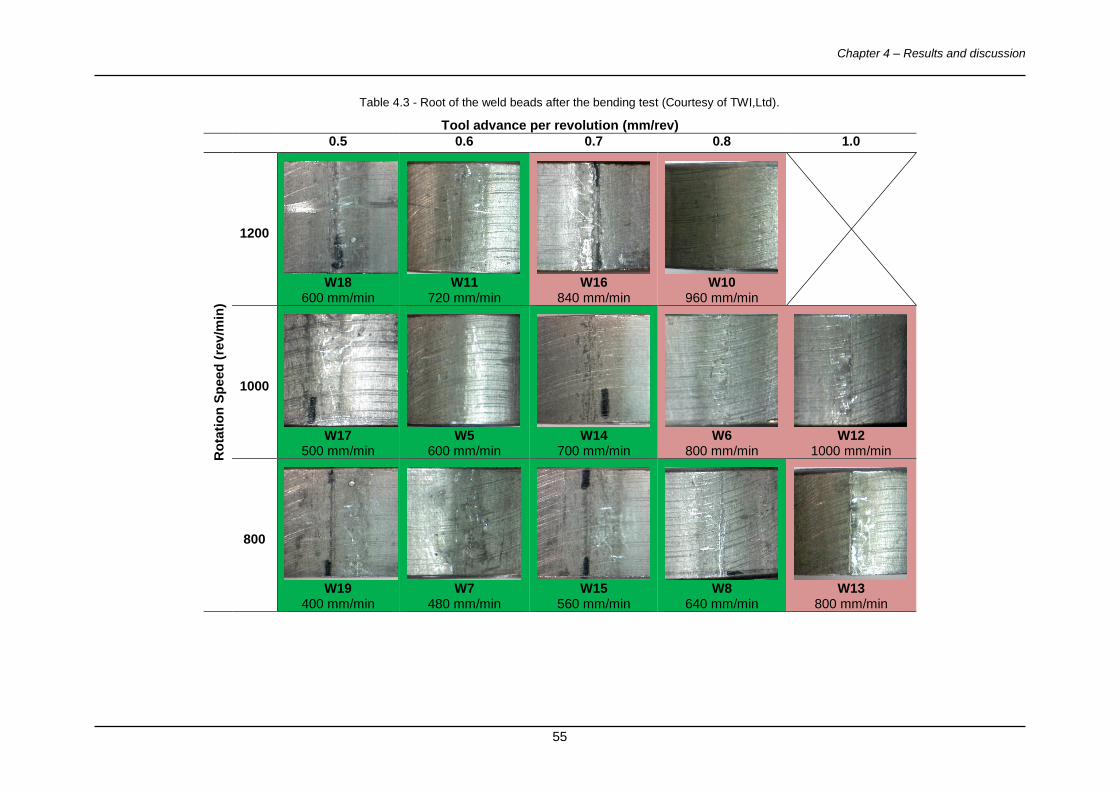
Chapter 4 – Results and discussion
55
Table 4.3 - Root of the weld beads after the bending test (Courtesy of TWI,Ltd).
Tool advance per revolution (mm/rev)
0.5 0.6 0.7 0.8 1.0
Ro
tati
on
Sp
eed
(re
v/m
in)
1200
W18 600 mm/min
W11 720 mm/min
W16 840 mm/min
W10 960 mm/min
1000
W17 500 mm/min
W5
600 mm/min W14
700 mm/min
W6
800 mm/min W12
1000 mm/min
800
W19 400 mm/min
W7
480 mm/min W15
560 mm/min
W8
640 mm/min W13
800 mm/min
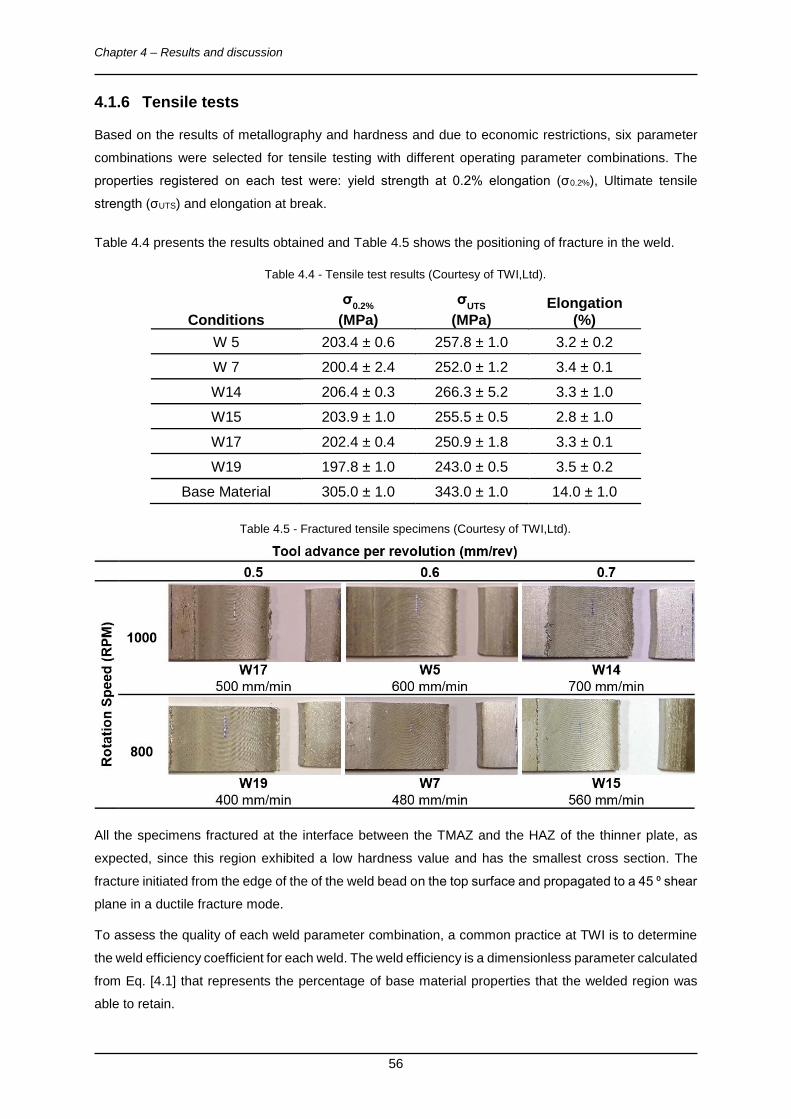
Chapter 4 – Results and discussion
56
4.1.6 Tensile tests
Based on the results of metallography and hardness and due to economic restrictions, six parameter
combinations were selected for tensile testing with different operating parameter combinations. The
properties registered on each test were: yield strength at 0.2% elongation (σ0.2%), Ultimate tensile
strength (σUTS) and elongation at break.
Table 4.4 presents the results obtained and Table 4.5 shows the positioning of fracture in the weld.
Table 4.4 - Tensile test results (Courtesy of TWI,Ltd).
Conditions σ
0.2%
(MPa) σ
UTS
(MPa) Elongation
(%) W 5 203.4 ± 0.6 257.8 ± 1.0 3.2 ± 0.2 W 7 200.4 ± 2.4 252.0 ± 1.2 3.4 ± 0.1 W14 206.4 ± 0.3 266.3 ± 5.2 3.3 ± 1.0 W15 203.9 ± 1.0 255.5 ± 0.5 2.8 ± 1.0 W17 202.4 ± 0.4 250.9 ± 1.8 3.3 ± 0.1 W19 197.8 ± 1.0 243.0 ± 0.5 3.5 ± 0.2
Base Material 305.0 ± 1.0 343.0 ± 1.0 14.0 ± 1.0
Table 4.5 - Fractured tensile specimens (Courtesy of TWI,Ltd).
All the specimens fractured at the interface between the TMAZ and the HAZ of the thinner plate, as
expected, since this region exhibited a low hardness value and has the smallest cross section. The
fracture initiated from the edge of the of the weld bead on the top surface and propagated to a 45 ⁰ shear
plane in a ductile fracture mode.
To assess the quality of each weld parameter combination, a common practice at TWI is to determine
the weld efficiency coefficient for each weld. The weld efficiency is a dimensionless parameter calculated
from Eq. [4.1] that represents the percentage of base material properties that the welded region was
able to retain.
Chapter 4 – Results and discussion
57
𝑊𝑒𝑓𝑓𝑖𝑐𝑖𝑒𝑛𝑐𝑦 = 𝑀𝑎𝑡𝑒𝑟𝑖𝑎𝑙 𝑝𝑟𝑜𝑝𝑒𝑟𝑡𝑦 𝑜𝑓 𝑡ℎ𝑒 𝑇𝑊𝐵
𝑀𝑎𝑡𝑒𝑟𝑖𝑎𝑙 𝑝𝑟𝑜𝑝𝑒𝑟𝑡𝑦 𝑜𝑓 𝑡ℎ𝑒 𝐵𝑀 𝑜𝑓 𝑡ℎ𝑒 𝑡ℎ𝑖𝑛𝑛𝑒𝑟 𝑠ℎ𝑒𝑒𝑡 [4.1]
Based on the results from Equation 4.1, a reduction of 75 to 80% in elongation in all the welds was
observed. This can be explained by the loss of the T6 condition at the interface between the TMAZ and
the HAZ, already observed in the hardness measurement. However, it should be noted that the
mechanical resistance properties registered a weld efficiency value between 65 and 78%.
The lost in elongation was also reported by Mahoney et al. [57]. The different grain sizes and precipitate
size and distribution throughout the weld microstructure are formed by the different temperature
gradients. In heat-treatable alloys this leads to the loss of the heat treatment producing zones with poor
mechanical properties and different strengths and dislocation densities. During tensile testing, strain
concentrates in the softer regions, such as the interface of the TMAZ and the HAZ limiting the total
elongation to the elongation of this area.
4.1.7 SEM Fractography
SEM was used to analyse the fracture surface of the tensile specimen. Figure 4.27 depicts the fracture
surface of weld W14. This is characteristic of a ductile fracture, as shown at higher magnification, where
dimples are clearly seen with considerable plastic deformation along the grain boundaries between the
TMAZ and the HAZ. Microvoids are formed in areas with discontinuous deformation associated with
second phase particles. With the increase of deformation, the microvoids grow and coalesce to form
voids of larger dimensions leading to reduction of resisting cross section, stress concentration and
fracture.
Figure 4.27 - A) Fracture surface of sample W14 and B) magnification (Courtesy of TWI,Ltd).
4.1.8 X-Ray inspection
X-ray inspection was conducted to assess the structural integrity of the weld bead produced by the
parameters correspondent to W14 in a large panel and to inspect voids or other internal defects. Due to
the large size of the panel, the panel was analysed with two incidences. Figure 4.28 shows the analysed
plate marked with A, B and C. In Figure 4.29 is presented the starting and middle of the weld (A and B)
while in Figure 4.30 is presented the middle and end of the weld.
The radiographs show a homogeneous FSW weld bead, with no evident defects.
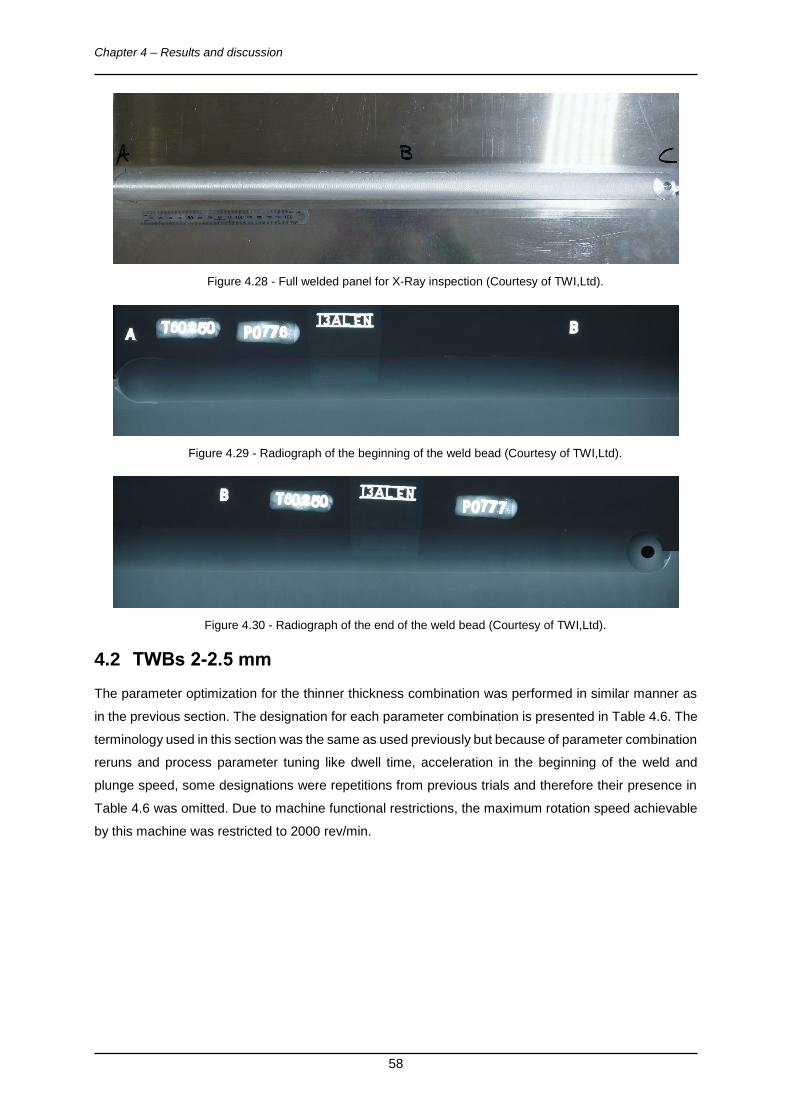
Chapter 4 – Results and discussion
58
Figure 4.28 - Full welded panel for X-Ray inspection (Courtesy of TWI,Ltd).
Figure 4.29 - Radiograph of the beginning of the weld bead (Courtesy of TWI,Ltd).
Figure 4.30 - Radiograph of the end of the weld bead (Courtesy of TWI,Ltd).
4.2 TWBs 2-2.5 mm
The parameter optimization for the thinner thickness combination was performed in similar manner as
in the previous section. The designation for each parameter combination is presented in Table 4.6. The
terminology used in this section was the same as used previously but because of parameter combination
reruns and process parameter tuning like dwell time, acceleration in the beginning of the weld and
plunge speed, some designations were repetitions from previous trials and therefore their presence in
Table 4.6 was omitted. Due to machine functional restrictions, the maximum rotation speed achievable
by this machine was restricted to 2000 rev/min.
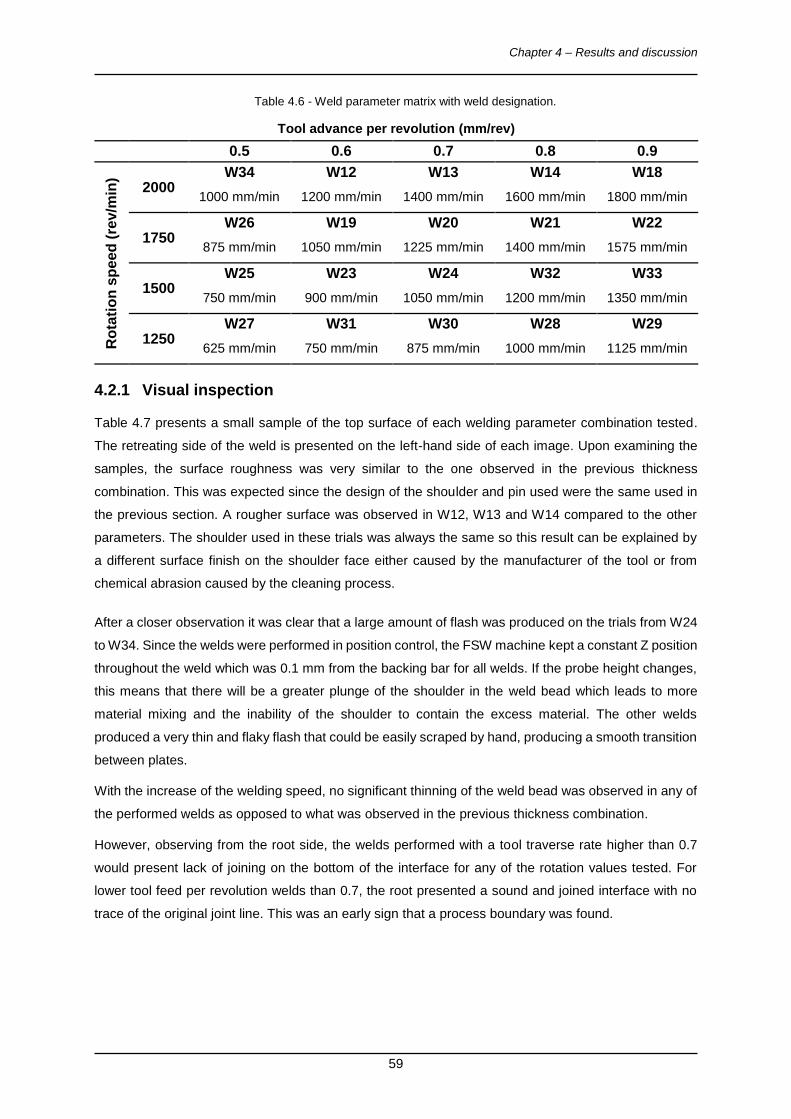
Chapter 4 – Results and discussion
59
Table 4.6 - Weld parameter matrix with weld designation.
Tool advance per revolution (mm/rev) 0.5 0.6 0.7 0.8 0.9
Ro
tati
on
sp
eed
(re
v/m
in)
2000 W34
1000 mm/min W12
1200 mm/min W13
1400 mm/min W14
1600 mm/min W18
1800 mm/min
1750 W26
875 mm/min W19
1050 mm/min W20
1225 mm/min W21
1400 mm/min W22
1575 mm/min
1500 W25
750 mm/min W23
900 mm/min W24
1050 mm/min W32
1200 mm/min W33
1350 mm/min
1250 W27
625 mm/min W31
750 mm/min W30
875 mm/min W28
1000 mm/min W29
1125 mm/min
4.2.1 Visual inspection
Table 4.7 presents a small sample of the top surface of each welding parameter combination tested.
The retreating side of the weld is presented on the left-hand side of each image. Upon examining the
samples, the surface roughness was very similar to the one observed in the previous thickness
combination. This was expected since the design of the shoulder and pin used were the same used in
the previous section. A rougher surface was observed in W12, W13 and W14 compared to the other
parameters. The shoulder used in these trials was always the same so this result can be explained by
a different surface finish on the shoulder face either caused by the manufacturer of the tool or from
chemical abrasion caused by the cleaning process.
After a closer observation it was clear that a large amount of flash was produced on the trials from W24
to W34. Since the welds were performed in position control, the FSW machine kept a constant Z position
throughout the weld which was 0.1 mm from the backing bar for all welds. If the probe height changes,
this means that there will be a greater plunge of the shoulder in the weld bead which leads to more
material mixing and the inability of the shoulder to contain the excess material. The other welds
produced a very thin and flaky flash that could be easily scraped by hand, producing a smooth transition
between plates.
With the increase of the welding speed, no significant thinning of the weld bead was observed in any of
the performed welds as opposed to what was observed in the previous thickness combination.
However, observing from the root side, the welds performed with a tool traverse rate higher than 0.7
would present lack of joining on the bottom of the interface for any of the rotation values tested. For
lower tool feed per revolution welds than 0.7, the root presented a sound and joined interface with no
trace of the original joint line. This was an early sign that a process boundary was found.
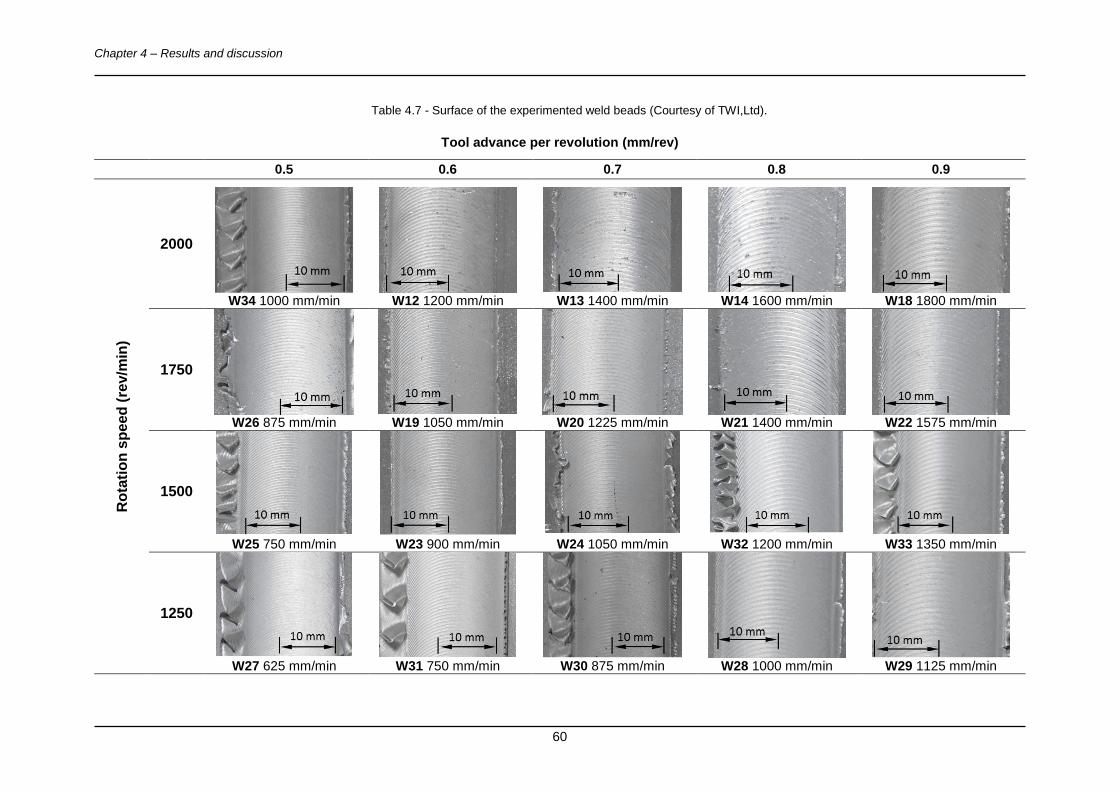
Chapter 4 – Results and discussion
60
Table 4.7 - Surface of the experimented weld beads (Courtesy of TWI,Ltd).
Tool advance per revolution (mm/rev)
0.5 0.6 0.7 0.8 0.9
Ro
tati
on
sp
eed
(re
v/m
in)
2000
W34 1000 mm/min W12 1200 mm/min W13 1400 mm/min W14 1600 mm/min W18 1800 mm/min
1750
W26 875 mm/min W19 1050 mm/min W20 1225 mm/min W21 1400 mm/min W22 1575 mm/min
1500
W25 750 mm/min W23 900 mm/min W24 1050 mm/min W32 1200 mm/min W33 1350 mm/min
1250
W27 625 mm/min W31 750 mm/min W30 875 mm/min W28 1000 mm/min W29 1125 mm/min
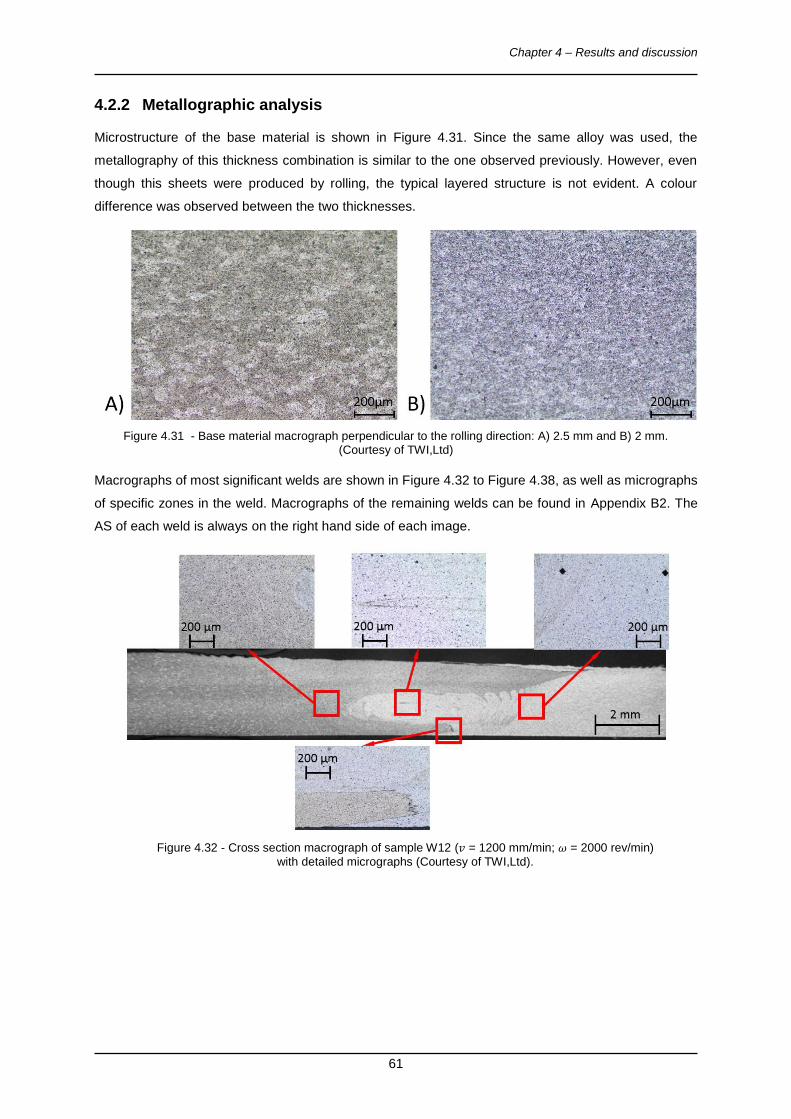
Chapter 4 – Results and discussion
61
4.2.2 Metallographic analysis
Microstructure of the base material is shown in Figure 4.31. Since the same alloy was used, the
metallography of this thickness combination is similar to the one observed previously. However, even
though this sheets were produced by rolling, the typical layered structure is not evident. A colour
difference was observed between the two thicknesses.
Figure 4.31 - Base material macrograph perpendicular to the rolling direction: A) 2.5 mm and B) 2 mm. (Courtesy of TWI,Ltd)
Macrographs of most significant welds are shown in Figure 4.32 to Figure 4.38, as well as micrographs
of specific zones in the weld. Macrographs of the remaining welds can be found in Appendix B2. The
AS of each weld is always on the right hand side of each image.
Figure 4.32 - Cross section macrograph of sample W12 (𝑣 = 1200 mm/min; 𝜔 = 2000 rev/min)
with detailed micrographs (Courtesy of TWI,Ltd).
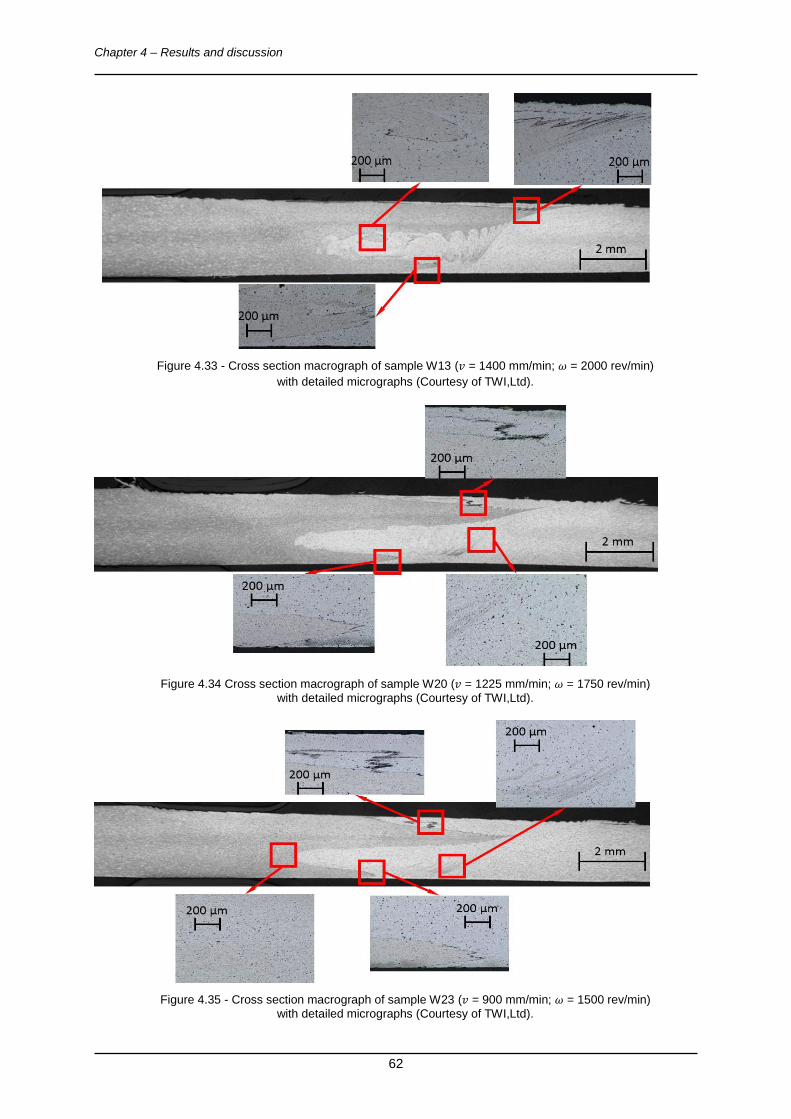
Chapter 4 – Results and discussion
62
Figure 4.33 - Cross section macrograph of sample W13 (𝑣 = 1400 mm/min; 𝜔 = 2000 rev/min)
with detailed micrographs (Courtesy of TWI,Ltd).
Figure 4.34 Cross section macrograph of sample W20 (𝑣 = 1225 mm/min; 𝜔 = 1750 rev/min)
with detailed micrographs (Courtesy of TWI,Ltd).
Figure 4.35 - Cross section macrograph of sample W23 (𝑣 = 900 mm/min; 𝜔 = 1500 rev/min)
with detailed micrographs (Courtesy of TWI,Ltd).
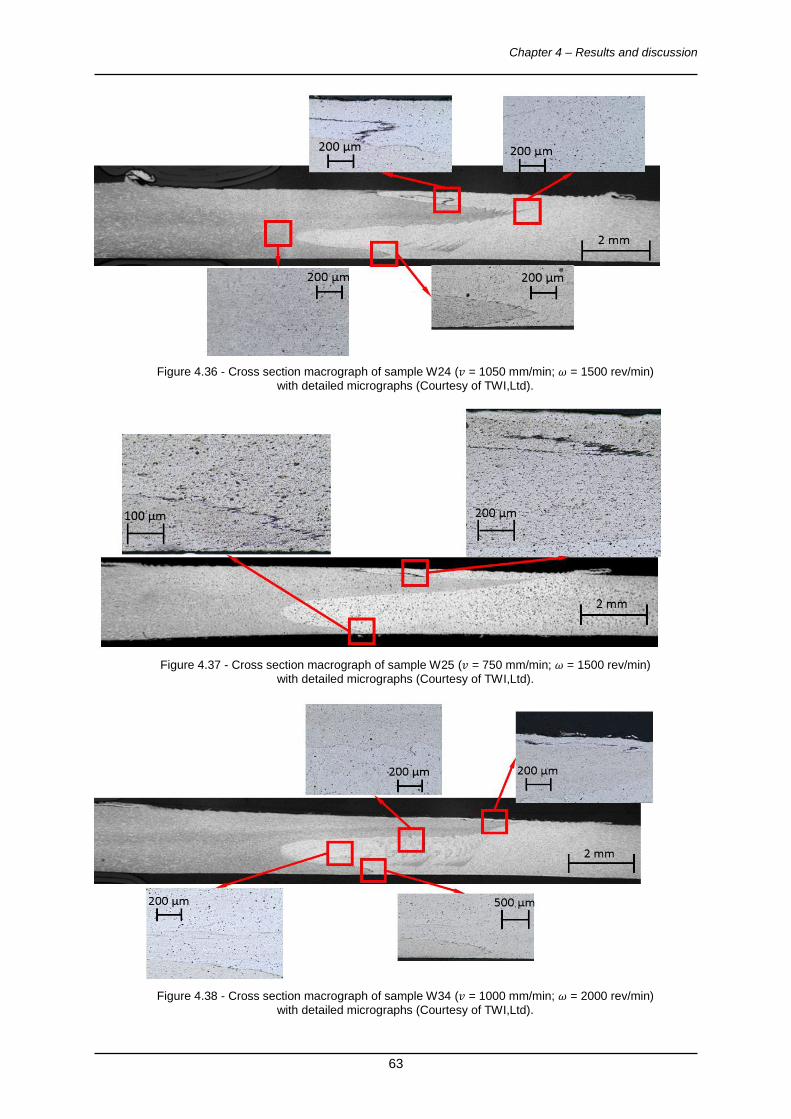
Chapter 4 – Results and discussion
63
Figure 4.36 - Cross section macrograph of sample W24 (𝑣 = 1050 mm/min; 𝜔 = 1500 rev/min)
with detailed micrographs (Courtesy of TWI,Ltd).
Figure 4.37 - Cross section macrograph of sample W25 (𝑣 = 750 mm/min; 𝜔 = 1500 rev/min)
with detailed micrographs (Courtesy of TWI,Ltd).
Figure 4.38 - Cross section macrograph of sample W34 (𝑣 = 1000 mm/min; 𝜔 = 2000 rev/min)
with detailed micrographs (Courtesy of TWI,Ltd).
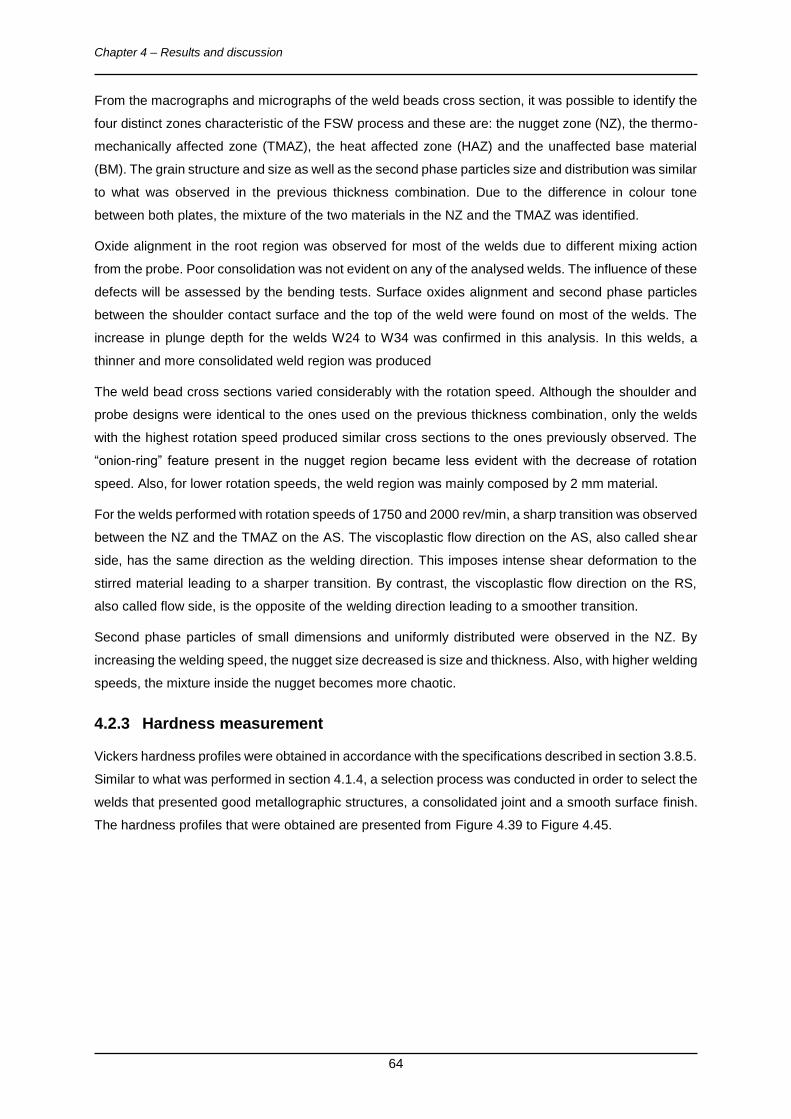
Chapter 4 – Results and discussion
64
From the macrographs and micrographs of the weld beads cross section, it was possible to identify the
four distinct zones characteristic of the FSW process and these are: the nugget zone (NZ), the thermo-
mechanically affected zone (TMAZ), the heat affected zone (HAZ) and the unaffected base material
(BM). The grain structure and size as well as the second phase particles size and distribution was similar
to what was observed in the previous thickness combination. Due to the difference in colour tone
between both plates, the mixture of the two materials in the NZ and the TMAZ was identified.
Oxide alignment in the root region was observed for most of the welds due to different mixing action
from the probe. Poor consolidation was not evident on any of the analysed welds. The influence of these
defects will be assessed by the bending tests. Surface oxides alignment and second phase particles
between the shoulder contact surface and the top of the weld were found on most of the welds. The
increase in plunge depth for the welds W24 to W34 was confirmed in this analysis. In this welds, a
thinner and more consolidated weld region was produced
The weld bead cross sections varied considerably with the rotation speed. Although the shoulder and
probe designs were identical to the ones used on the previous thickness combination, only the welds
with the highest rotation speed produced similar cross sections to the ones previously observed. The
“onion-ring” feature present in the nugget region became less evident with the decrease of rotation
speed. Also, for lower rotation speeds, the weld region was mainly composed by 2 mm material.
For the welds performed with rotation speeds of 1750 and 2000 rev/min, a sharp transition was observed
between the NZ and the TMAZ on the AS. The viscoplastic flow direction on the AS, also called shear
side, has the same direction as the welding direction. This imposes intense shear deformation to the
stirred material leading to a sharper transition. By contrast, the viscoplastic flow direction on the RS,
also called flow side, is the opposite of the welding direction leading to a smoother transition.
Second phase particles of small dimensions and uniformly distributed were observed in the NZ. By
increasing the welding speed, the nugget size decreased is size and thickness. Also, with higher welding
speeds, the mixture inside the nugget becomes more chaotic.
4.2.3 Hardness measurement
Vickers hardness profiles were obtained in accordance with the specifications described in section 3.8.5.
Similar to what was performed in section 4.1.4, a selection process was conducted in order to select the
welds that presented good metallographic structures, a consolidated joint and a smooth surface finish.
The hardness profiles that were obtained are presented from Figure 4.39 to Figure 4.45.
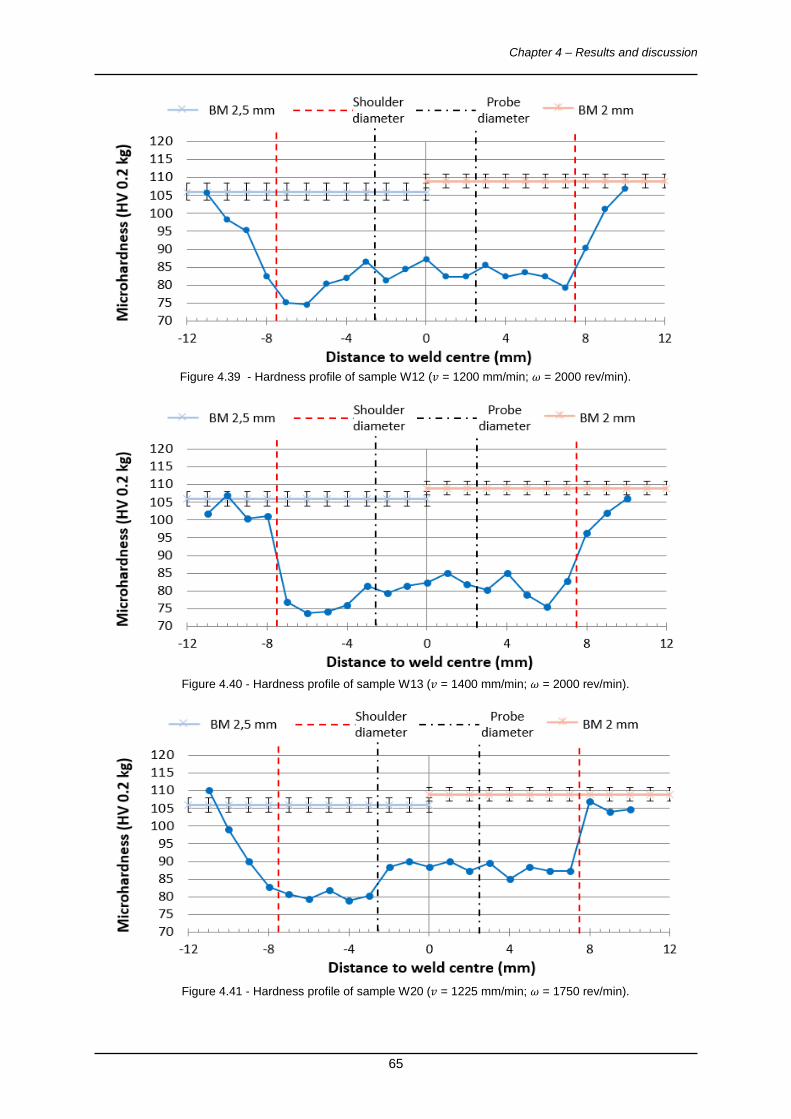
Chapter 4 – Results and discussion
65
Figure 4.39 - Hardness profile of sample W12 (𝑣 = 1200 mm/min; 𝜔 = 2000 rev/min).
Figure 4.40 - Hardness profile of sample W13 (𝑣 = 1400 mm/min; 𝜔 = 2000 rev/min).
Figure 4.41 - Hardness profile of sample W20 (𝑣 = 1225 mm/min; 𝜔 = 1750 rev/min).
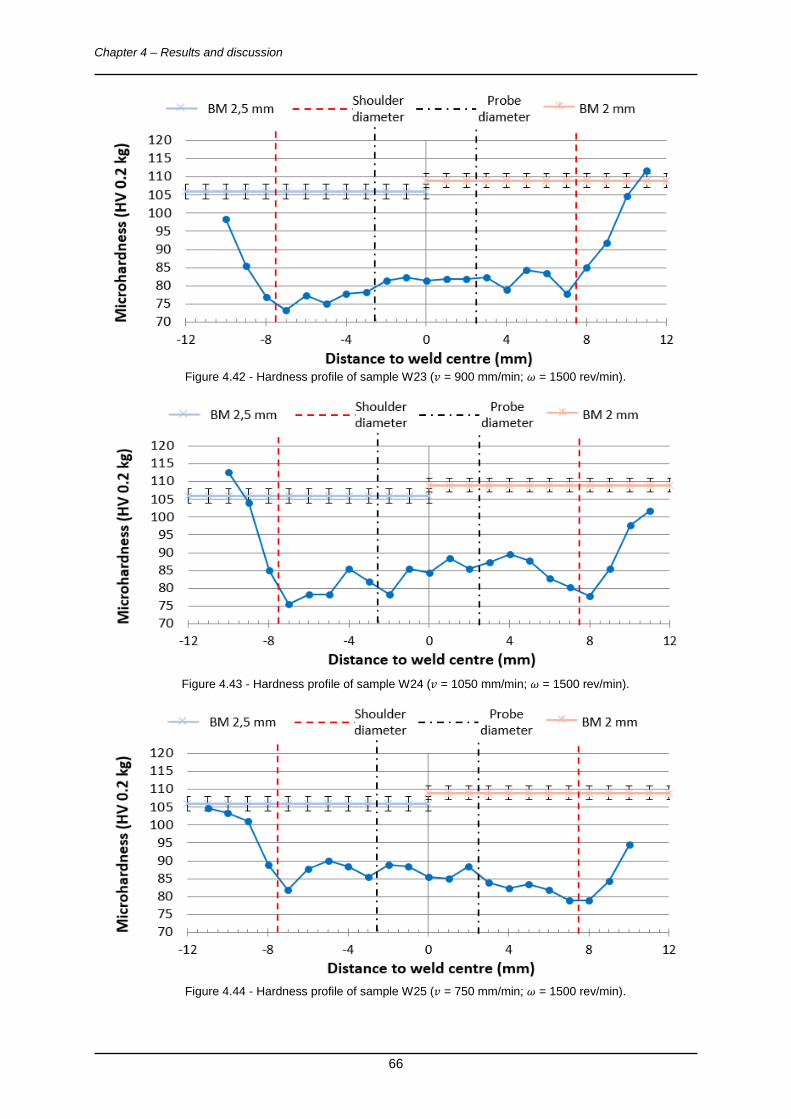
Chapter 4 – Results and discussion
66
Figure 4.42 - Hardness profile of sample W23 (𝑣 = 900 mm/min; 𝜔 = 1500 rev/min).
Figure 4.43 - Hardness profile of sample W24 (𝑣 = 1050 mm/min; 𝜔 = 1500 rev/min).
Figure 4.44 - Hardness profile of sample W25 (𝑣 = 750 mm/min; 𝜔 = 1500 rev/min).
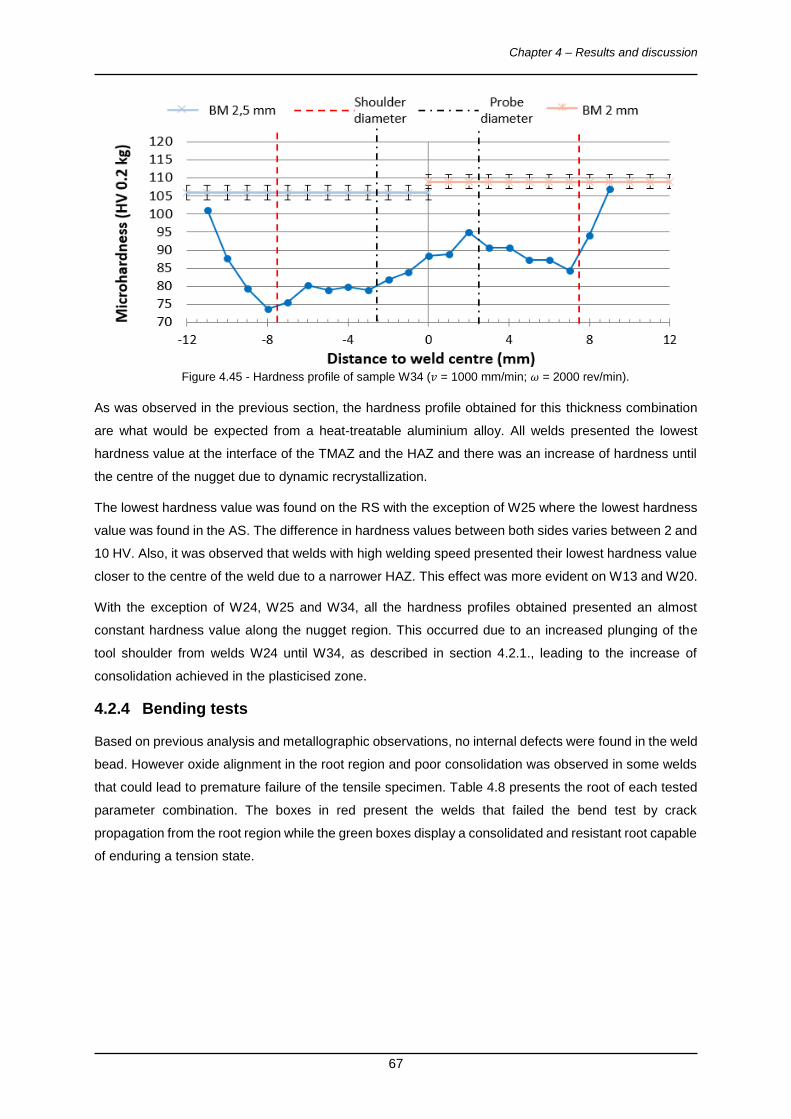
Chapter 4 – Results and discussion
67
Figure 4.45 - Hardness profile of sample W34 (𝑣 = 1000 mm/min; 𝜔 = 2000 rev/min).
As was observed in the previous section, the hardness profile obtained for this thickness combination
are what would be expected from a heat-treatable aluminium alloy. All welds presented the lowest
hardness value at the interface of the TMAZ and the HAZ and there was an increase of hardness until
the centre of the nugget due to dynamic recrystallization.
The lowest hardness value was found on the RS with the exception of W25 where the lowest hardness
value was found in the AS. The difference in hardness values between both sides varies between 2 and
10 HV. Also, it was observed that welds with high welding speed presented their lowest hardness value
closer to the centre of the weld due to a narrower HAZ. This effect was more evident on W13 and W20.
With the exception of W24, W25 and W34, all the hardness profiles obtained presented an almost
constant hardness value along the nugget region. This occurred due to an increased plunging of the
tool shoulder from welds W24 until W34, as described in section 4.2.1., leading to the increase of
consolidation achieved in the plasticised zone.
4.2.4 Bending tests
Based on previous analysis and metallographic observations, no internal defects were found in the weld
bead. However oxide alignment in the root region and poor consolidation was observed in some welds
that could lead to premature failure of the tensile specimen. Table 4.8 presents the root of each tested
parameter combination. The boxes in red present the welds that failed the bend test by crack
propagation from the root region while the green boxes display a consolidated and resistant root capable
of enduring a tension state.
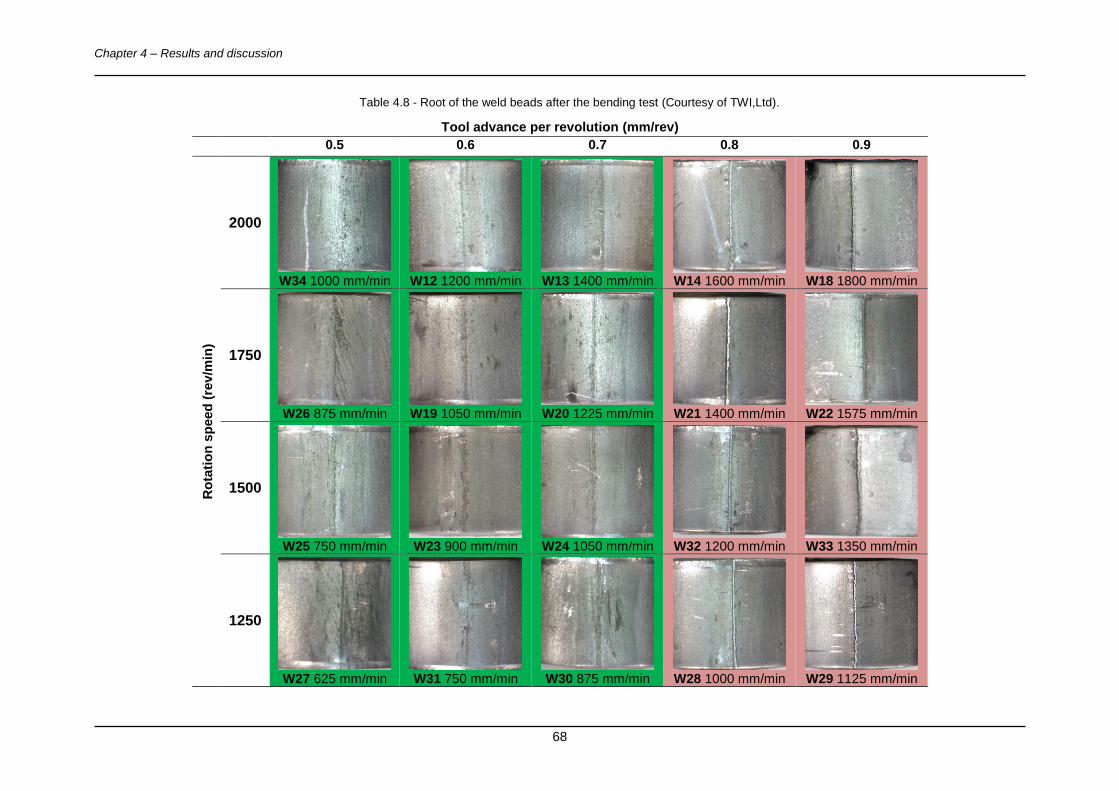
Chapter 4 – Results and discussion
68
Table 4.8 - Root of the weld beads after the bending test (Courtesy of TWI,Ltd).
Tool advance per revolution (mm/rev)
0.5 0.6 0.7 0.8 0.9
Ro
tati
on
sp
eed
(re
v/m
in)
2000
W34 1000 mm/min
W12 1200 mm/min
W13 1400 mm/min
W14 1600 mm/min
W18 1800 mm/min
1750
W26 875 mm/min
W19 1050 mm/min
W20 1225 mm/min
W21 1400 mm/min
W22 1575 mm/min
1500
W25 750 mm/min
W23 900 mm/min
W24 1050 mm/min
W32 1200 mm/min
W33 1350 mm/min
1250
W27 625 mm/min
W31 750 mm/min
W30 875 mm/min
W28 1000 mm/min
W29 1125 mm/min
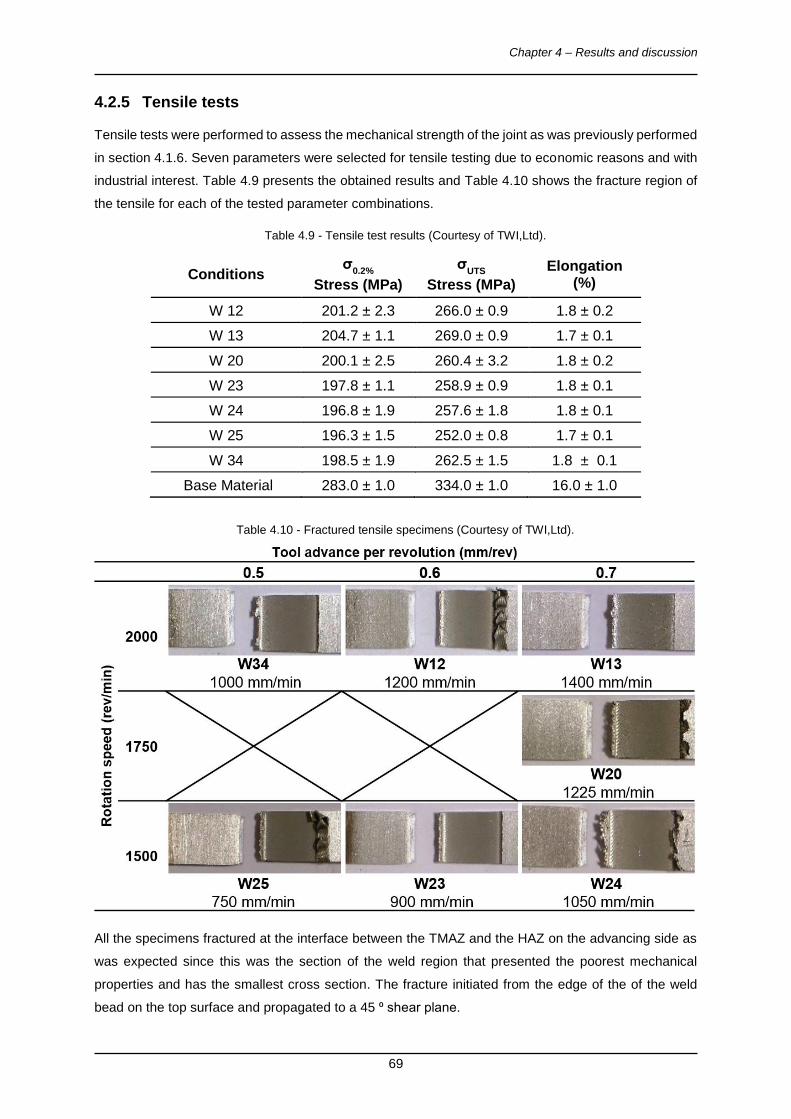
Chapter 4 – Results and discussion
69
4.2.5 Tensile tests
Tensile tests were performed to assess the mechanical strength of the joint as was previously performed
in section 4.1.6. Seven parameters were selected for tensile testing due to economic reasons and with
industrial interest. Table 4.9 presents the obtained results and Table 4.10 shows the fracture region of
the tensile for each of the tested parameter combinations.
Table 4.9 - Tensile test results (Courtesy of TWI,Ltd).
Conditions σ0.2%
Stress (MPa)
σUTS
Stress (MPa)
Elongation (%)
W 12 201.2 ± 2.3 266.0 ± 0.9 1.8 ± 0.2 W 13 204.7 ± 1.1 269.0 ± 0.9 1.7 ± 0.1 W 20 200.1 ± 2.5 260.4 ± 3.2 1.8 ± 0.2 W 23 197.8 ± 1.1 258.9 ± 0.9 1.8 ± 0.1 W 24 196.8 ± 1.9 257.6 ± 1.8 1.8 ± 0.1 W 25 196.3 ± 1.5 252.0 ± 0.8 1.7 ± 0.1 W 34 198.5 ± 1.9 262.5 ± 1.5 1.8 ± 0.1
Base Material 283.0 ± 1.0 334.0 ± 1.0 16.0 ± 1.0
Table 4.10 - Fractured tensile specimens (Courtesy of TWI,Ltd).
All the specimens fractured at the interface between the TMAZ and the HAZ on the advancing side as
was expected since this was the section of the weld region that presented the poorest mechanical
properties and has the smallest cross section. The fracture initiated from the edge of the of the weld
bead on the top surface and propagated to a 45 ⁰ shear plane.
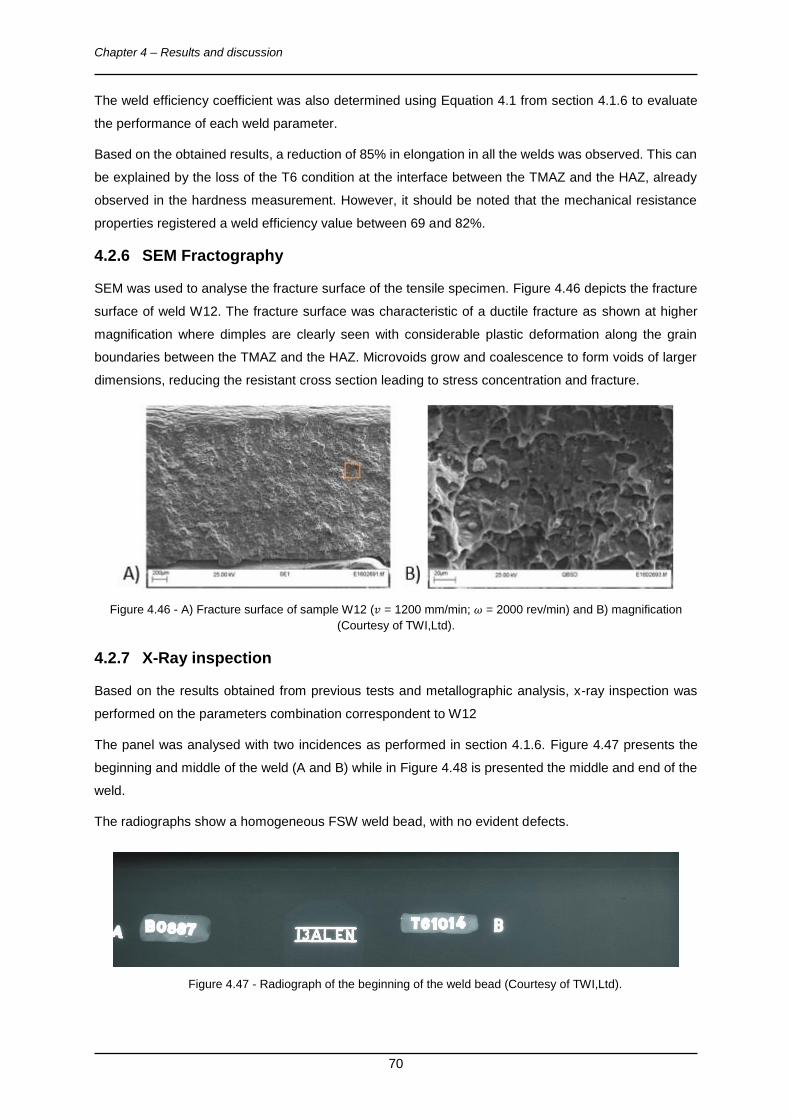
Chapter 4 – Results and discussion
70
The weld efficiency coefficient was also determined using Equation 4.1 from section 4.1.6 to evaluate
the performance of each weld parameter.
Based on the obtained results, a reduction of 85% in elongation in all the welds was observed. This can
be explained by the loss of the T6 condition at the interface between the TMAZ and the HAZ, already
observed in the hardness measurement. However, it should be noted that the mechanical resistance
properties registered a weld efficiency value between 69 and 82%.
4.2.6 SEM Fractography
SEM was used to analyse the fracture surface of the tensile specimen. Figure 4.46 depicts the fracture
surface of weld W12. The fracture surface was characteristic of a ductile fracture as shown at higher
magnification where dimples are clearly seen with considerable plastic deformation along the grain
boundaries between the TMAZ and the HAZ. Microvoids grow and coalescence to form voids of larger
dimensions, reducing the resistant cross section leading to stress concentration and fracture.
Figure 4.46 - A) Fracture surface of sample W12 (𝑣 = 1200 mm/min; 𝜔 = 2000 rev/min) and B) magnification
(Courtesy of TWI,Ltd).
4.2.7 X-Ray inspection
Based on the results obtained from previous tests and metallographic analysis, x-ray inspection was
performed on the parameters combination correspondent to W12
The panel was analysed with two incidences as performed in section 4.1.6. Figure 4.47 presents the
beginning and middle of the weld (A and B) while in Figure 4.48 is presented the middle and end of the
weld.
The radiographs show a homogeneous FSW weld bead, with no evident defects.
Figure 4.47 - Radiograph of the beginning of the weld bead (Courtesy of TWI,Ltd).
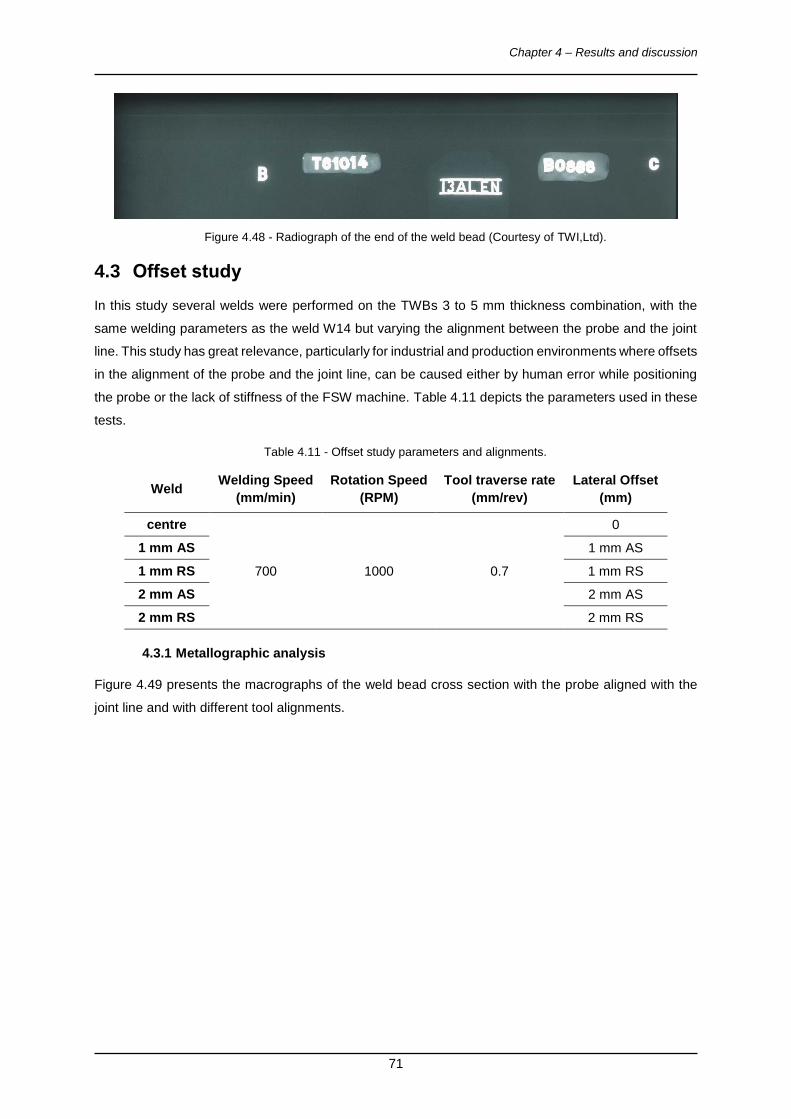
Chapter 4 – Results and discussion
71
Figure 4.48 - Radiograph of the end of the weld bead (Courtesy of TWI,Ltd).
4.3 Offset study
In this study several welds were performed on the TWBs 3 to 5 mm thickness combination, with the
same welding parameters as the weld W14 but varying the alignment between the probe and the joint
line. This study has great relevance, particularly for industrial and production environments where offsets
in the alignment of the probe and the joint line, can be caused either by human error while positioning
the probe or the lack of stiffness of the FSW machine. Table 4.11 depicts the parameters used in these
tests.
Table 4.11 - Offset study parameters and alignments.
Weld Welding Speed
(mm/min)
Rotation Speed
(RPM)
Tool traverse rate
(mm/rev)
Lateral Offset
(mm)
centre
700 1000 0.7
0
1 mm AS 1 mm AS
1 mm RS 1 mm RS
2 mm AS 2 mm AS
2 mm RS 2 mm RS
4.3.1 Metallographic analysis
Figure 4.49 presents the macrographs of the weld bead cross section with the probe aligned with the
joint line and with different tool alignments.
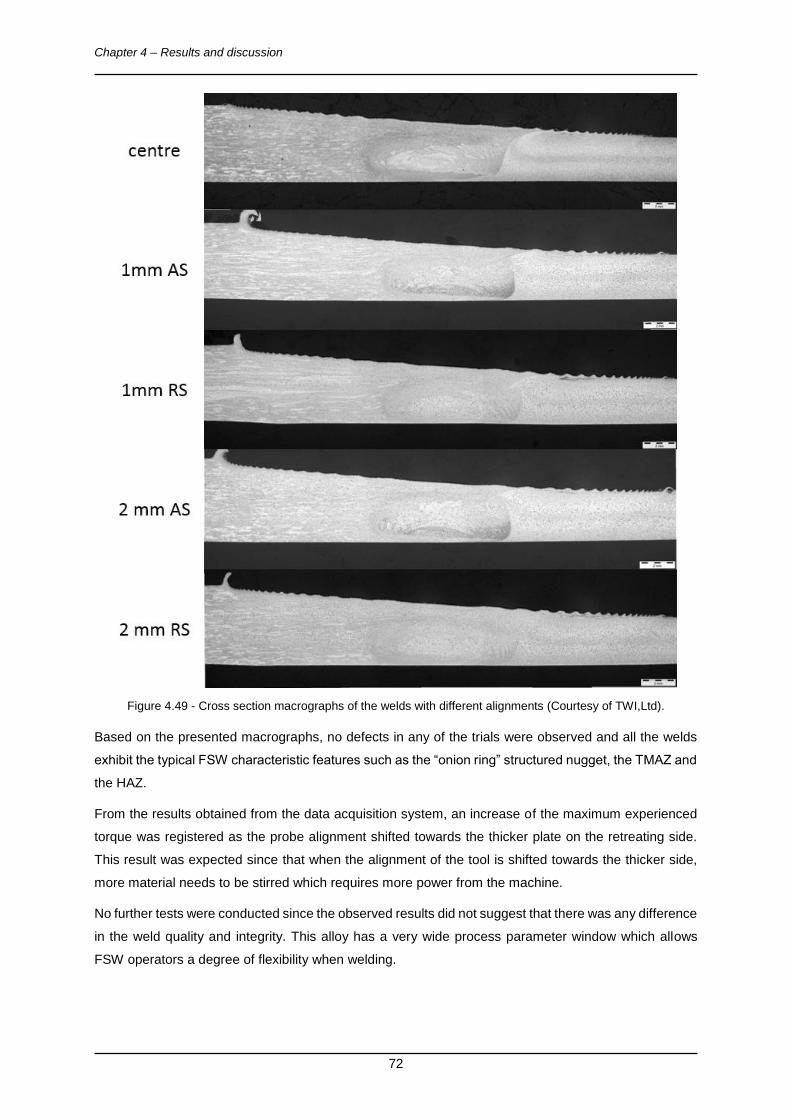
Chapter 4 – Results and discussion
72
Figure 4.49 - Cross section macrographs of the welds with different alignments (Courtesy of TWI,Ltd).
Based on the presented macrographs, no defects in any of the trials were observed and all the welds
exhibit the typical FSW characteristic features such as the “onion ring” structured nugget, the TMAZ and
the HAZ.
From the results obtained from the data acquisition system, an increase of the maximum experienced
torque was registered as the probe alignment shifted towards the thicker plate on the retreating side.
This result was expected since that when the alignment of the tool is shifted towards the thicker side,
more material needs to be stirred which requires more power from the machine.
No further tests were conducted since the observed results did not suggest that there was any difference
in the weld quality and integrity. This alloy has a very wide process parameter window which allows
FSW operators a degree of flexibility when welding.
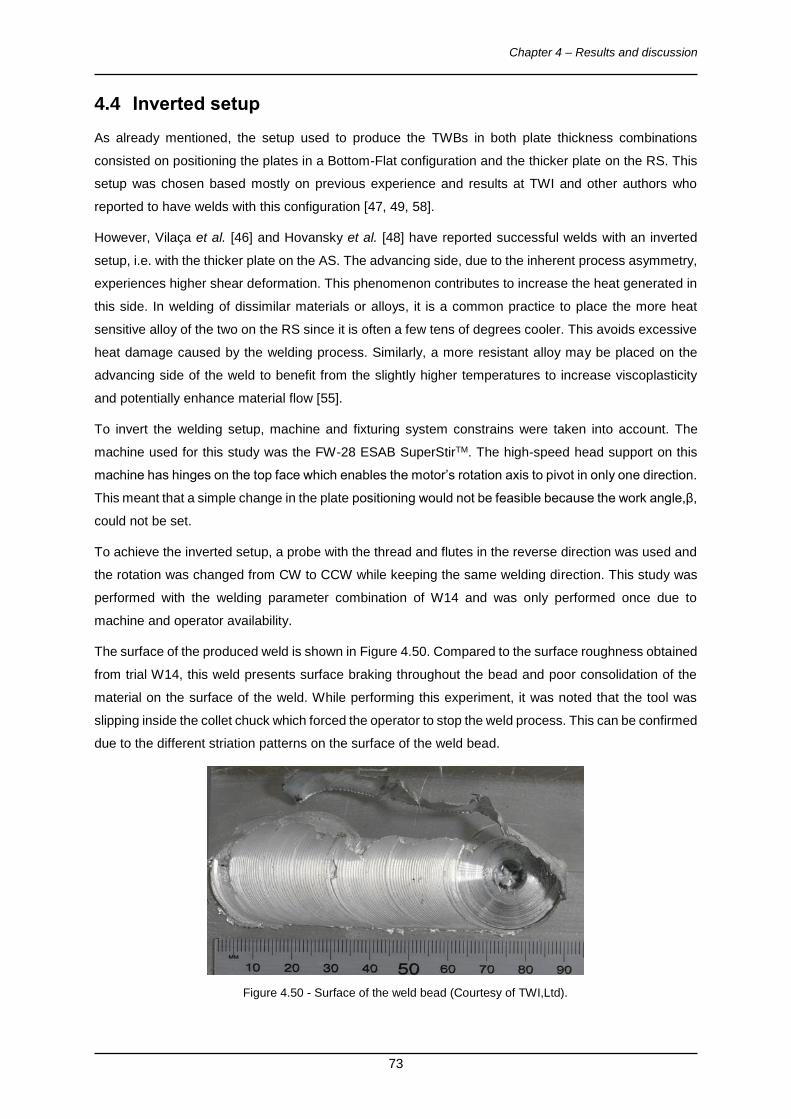
Chapter 4 – Results and discussion
73
4.4 Inverted setup
As already mentioned, the setup used to produce the TWBs in both plate thickness combinations
consisted on positioning the plates in a Bottom-Flat configuration and the thicker plate on the RS. This
setup was chosen based mostly on previous experience and results at TWI and other authors who
reported to have welds with this configuration [47, 49, 58].
However, Vilaça et al. [46] and Hovansky et al. [48] have reported successful welds with an inverted
setup, i.e. with the thicker plate on the AS. The advancing side, due to the inherent process asymmetry,
experiences higher shear deformation. This phenomenon contributes to increase the heat generated in
this side. In welding of dissimilar materials or alloys, it is a common practice to place the more heat
sensitive alloy of the two on the RS since it is often a few tens of degrees cooler. This avoids excessive
heat damage caused by the welding process. Similarly, a more resistant alloy may be placed on the
advancing side of the weld to benefit from the slightly higher temperatures to increase viscoplasticity
and potentially enhance material flow [55].
To invert the welding setup, machine and fixturing system constrains were taken into account. The
machine used for this study was the FW-28 ESAB SuperStirTM. The high-speed head support on this
machine has hinges on the top face which enables the motor’s rotation axis to pivot in only one direction.
This meant that a simple change in the plate positioning would not be feasible because the work angle,β,
could not be set.
To achieve the inverted setup, a probe with the thread and flutes in the reverse direction was used and
the rotation was changed from CW to CCW while keeping the same welding direction. This study was
performed with the welding parameter combination of W14 and was only performed once due to
machine and operator availability.
The surface of the produced weld is shown in Figure 4.50. Compared to the surface roughness obtained
from trial W14, this weld presents surface braking throughout the bead and poor consolidation of the
material on the surface of the weld. While performing this experiment, it was noted that the tool was
slipping inside the collet chuck which forced the operator to stop the weld process. This can be confirmed
due to the different striation patterns on the surface of the weld bead.
Figure 4.50 - Surface of the weld bead (Courtesy of TWI,Ltd).
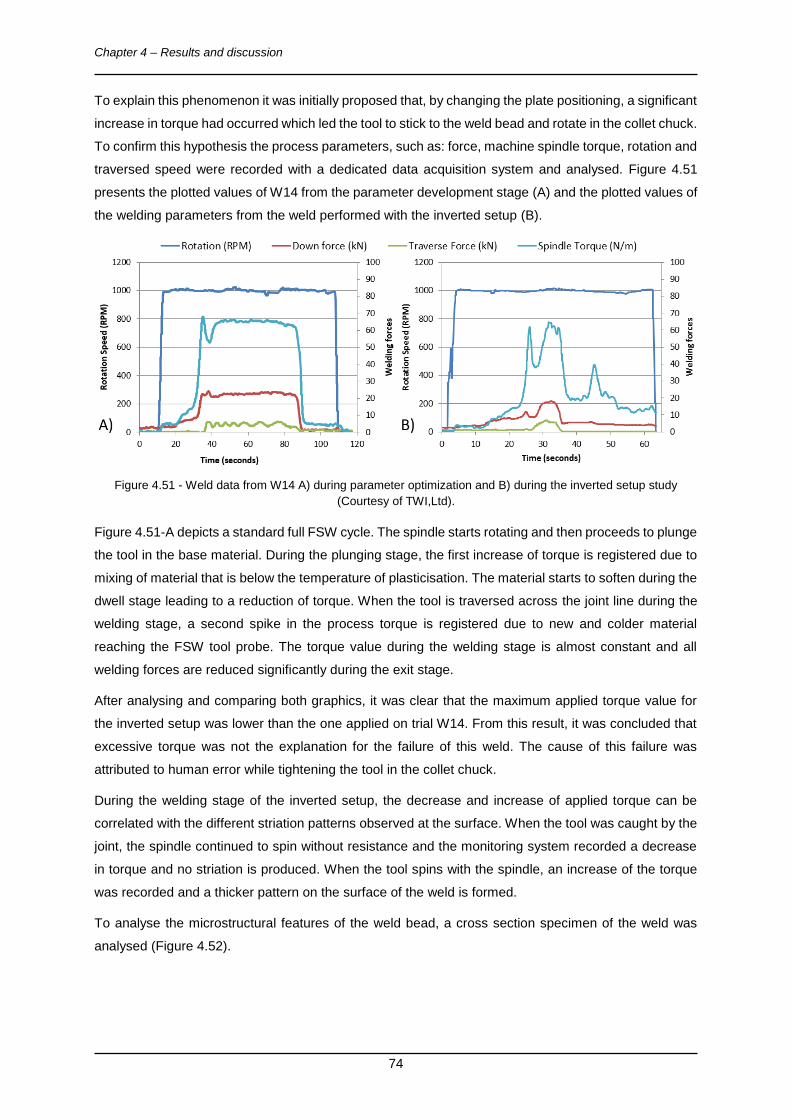
Chapter 4 – Results and discussion
74
To explain this phenomenon it was initially proposed that, by changing the plate positioning, a significant
increase in torque had occurred which led the tool to stick to the weld bead and rotate in the collet chuck.
To confirm this hypothesis the process parameters, such as: force, machine spindle torque, rotation and
traversed speed were recorded with a dedicated data acquisition system and analysed. Figure 4.51
presents the plotted values of W14 from the parameter development stage (A) and the plotted values of
the welding parameters from the weld performed with the inverted setup (B).
Figure 4.51 - Weld data from W14 A) during parameter optimization and B) during the inverted setup study
(Courtesy of TWI,Ltd).
Figure 4.51-A depicts a standard full FSW cycle. The spindle starts rotating and then proceeds to plunge
the tool in the base material. During the plunging stage, the first increase of torque is registered due to
mixing of material that is below the temperature of plasticisation. The material starts to soften during the
dwell stage leading to a reduction of torque. When the tool is traversed across the joint line during the
welding stage, a second spike in the process torque is registered due to new and colder material
reaching the FSW tool probe. The torque value during the welding stage is almost constant and all
welding forces are reduced significantly during the exit stage.
After analysing and comparing both graphics, it was clear that the maximum applied torque value for
the inverted setup was lower than the one applied on trial W14. From this result, it was concluded that
excessive torque was not the explanation for the failure of this weld. The cause of this failure was
attributed to human error while tightening the tool in the collet chuck.
During the welding stage of the inverted setup, the decrease and increase of applied torque can be
correlated with the different striation patterns observed at the surface. When the tool was caught by the
joint, the spindle continued to spin without resistance and the monitoring system recorded a decrease
in torque and no striation is produced. When the tool spins with the spindle, an increase of the torque
was recorded and a thicker pattern on the surface of the weld is formed.
To analyse the microstructural features of the weld bead, a cross section specimen of the weld was
analysed (Figure 4.52).
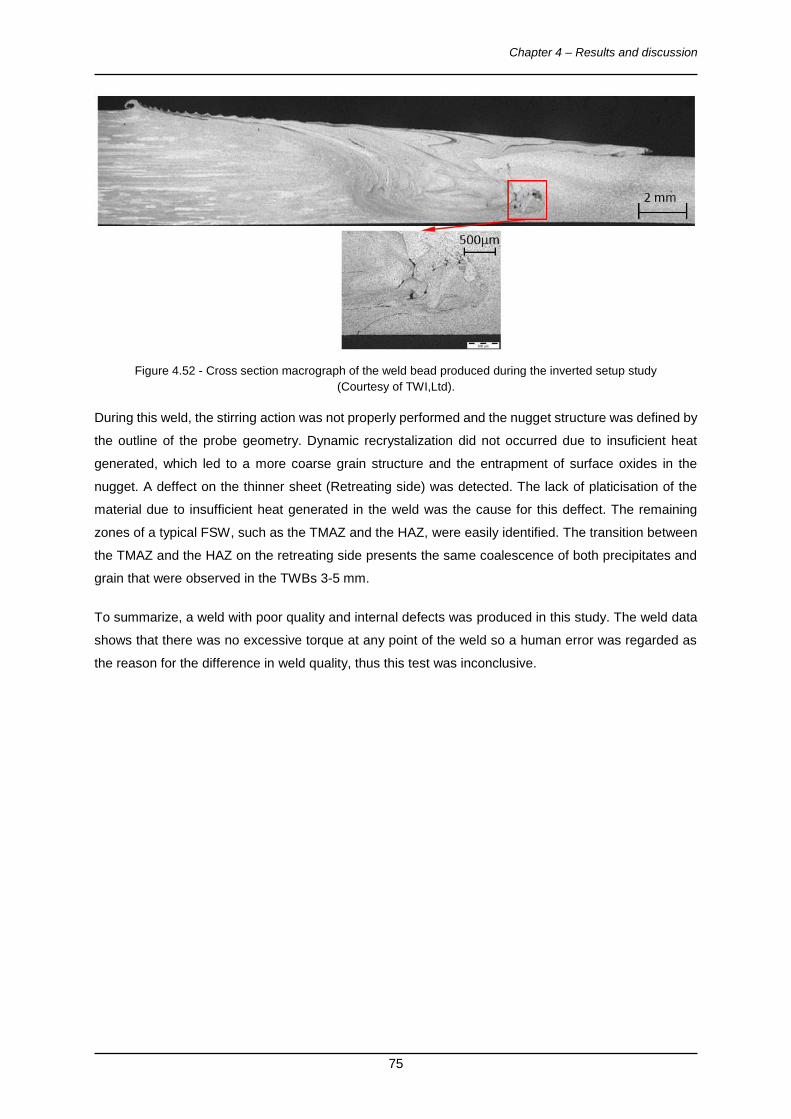
Chapter 4 – Results and discussion
75
Figure 4.52 - Cross section macrograph of the weld bead produced during the inverted setup study
(Courtesy of TWI,Ltd).
During this weld, the stirring action was not properly performed and the nugget structure was defined by
the outline of the probe geometry. Dynamic recrystalization did not occurred due to insuficient heat
generated, which led to a more coarse grain structure and the entrapment of surface oxides in the
nugget. A deffect on the thinner sheet (Retreating side) was detected. The lack of platicisation of the
material due to insufficient heat generated in the weld was the cause for this deffect. The remaining
zones of a typical FSW, such as the TMAZ and the HAZ, were easily identified. The transition between
the TMAZ and the HAZ on the retreating side presents the same coalescence of both precipitates and
grain that were observed in the TWBs 3-5 mm.
To summarize, a weld with poor quality and internal defects was produced in this study. The weld data
shows that there was no excessive torque at any point of the weld so a human error was regarded as
the reason for the difference in weld quality, thus this test was inconclusive.

Chapter 5 – Conclusions and proposals for future work
77
Chapter 5 - Conclusions and proposals for future work
This thesis contributed to a deeper understand of the FSW technology for the production of TWBs for
lightweight applications in the automotive, rail and aerospace industry. Based on the results obtained
the following can be concluded:
Sound welds can be achieved using FSW for the production of TWBs in AA6082-T6 from
dissimilar thickness combinations of 3 to 5 mm and 2 to 2.5 mm.
The results obtained from the lateral offset test performed on the 3 to 5 mm thickness combination
showed that a sound weld can be produced with a misalignment up to 25 % of the probe diameter
for both the advancing and retreating sides of the weld centreline. This is an interesting result for
industry, since it can reduce set up times.
With the tests performed in the parameter optimization stage, it was concluded that the
mechanical properties and the metallographic structure of each weld were affected by the
variation of the rotation and welding speeds. For the thickness combinations studied, the best
window of process parameters was defined, optimized and presented below.
Table 5.1 - FSW optimized parameters for each thickness combination.
2 to 2.5 mm 3 to 5 mm Rotation speed
(rev/min) 2000 1000
Welding speed (mm/min) 1200 700
Probe Height (mm) 1.85 3.4 Tilt angle (α) 2.5 ⁰ 1.5 ⁰
Work angle (β) 2 ⁰ 4 ⁰ Dwell time (s) 0 2
Rotation direction Clockwise
The welding speeds attained for the 2 to 2.5 mm thickness combination are competitive for the
automotive industry since these can be in the range of 1 m/min which was the minimum specified
by industry.
The outcome from the inverted setup test performed was inconclusive since just one trial was
performed due to equipment availability.
The welds produced with different parameter combinations that were tensile tested, all fractured
at the interface between the TMAZ and the HAZ of the thinner plate. In fact, this area has the
poorest mechanical properties and the smallest cross section.
Chapter 5 – Conclusions and proposals for future work
78
Tensile strengths varied between 65 to 80 % of the base material’s yield and ultimate tensile
strength. A severe loss in elongation was seen, up to 90 %. However, this is not critical since
TWBs are formed and heat treated to restore the T6 ageing condition.
The major microstructural zones of the FSW weld bead were easily distinguishable and did not
varied significantly within the range of parameters tested. In fact, in order to increase the welding
speed, all welds were produced with rotation to travel speed ratios bellow 2.
Lack of penetration was found in welds with the highest welding speeds due to insufficient heat
generated which reduce viscoplasticity of the material in the vicinity of the tool.
Second phase particles and oxides alignment were observed in most welds on the weld root and
under the shoulder dispersed and of small size, which did not affect the mechanical strength of
the joint.
The hardness profile showed low values at the interface between the TMAZ and the HAZ on all
the welds. Higher hardness values were observed on the advancing side of the weld.
The surface fracture of tensile specimens was observed in SEM and showed a ductile fracture
mode despite the considerable loss of elongation.
Although the main objectives set by the scope of this work were achieved, many opportunities for further
investigation were identified based on the knowledge gathered. The topics that the author found most
relevant for future investigation are:
A comparison between the mechanical properties obtained with Stationary shoulder FSW
(SSFSW) and the conventional FSW. SSFSW is a variant of the conventional FSW in which the
shoulder is static and just slides over the weld line. This produces a weld bead with a smooth
surface and with a smaller HAZ when compared to conventional FSW.
Determine the wear rate of the current tool geometry. It was observed that the bottom probe
features used in this work would easily erode, producing root flaws. A greater understanding of
the tool wear rate would enable to determine the state at which the loss of the probe features
would affect the quality of the weld and plan for scheduled tool replacement.
Determine the effect of different tool geometries and probe features would have on the weld
quality using the optimised parameters.
Inspect the interface between the TMAZ and the HAZ of the experimented parameter
combinations using TEM to determine the cause of the considerable decrease in elongation of
the tensile specimens that was observed for both thickness combinations.
References
79
References
[1] MERKLEIN, Marion, et al. A review on tailored blanks - Production, applications and
evaluation. Journal of Materials Processing Technology, 2014, 214.2: 151-164.
[2] ZADPOOR, A., SINKE, J. and BENEDICTUS, R. - Numerical simulation modeling of tailor welded
blank forming. In: KINSEY, B. and X. Wu ed. - Tailor welded blanks for advanced manufacturing,
1st ed. Woodhead Publishing Limited, 2011, pp. 68 - 96.
[3] ASADIAN-ARDAKANI, Mohammad Hossein, et al. Theoretical and experimental investigation of
deep drawing of tailor-welded IF steel blanks with non-uniform blank holder forces. Proceedings
of the Institution of Mechanical Engineers, Part B: Journal of Engineering Manufacture, 2015,
0954405415577559.
[4] URBAN, A. and WOHLECKER, R. - Advanced automotive body structures and closures. In
ROWE, J. ed, - Advanced materials in automotive engineering, 1st ed. Woodhead Publishing
Limited, 2012, pp. 230 - 253.
[5] KINSEY, B. - Tailor welded blanks for the automotive industry. In: KINSEY, B. and X. Wu. ed.
- Tailor welded blanks for advanced manufacturing, 1st ed. Woodhead Publishing Limited, 2011,
pp. 164 - 180.
[6] SPÖTTL, Marius; MOHRBACHER, Hardy. A review of laser welding technology for mass
production of tailored blanks. In: Proceedings of the 1st international symposium on automobile
steel, Beijing, China. 2009.
[7] KALLEE, S.W. - Industrial applications of friction sitr welding. in LOHWASSER, D. and C., ZHAN
ed. - Friction stir welding from basics to applications, 1st ed. Woodhead Publishing Limited, 2010,
pp. 118 - 163.
[8] ROOKS, Brian,"Tailor-welded blanks bring multiple benefits to car design", Assembly Automation,
(2001), Vol. 21 Iss 4 pp. 323 - 329.
[9] DE WIT, F. M., POULIS, J. A. - Joining technologies for automotive components. In ROWE, J.
ed, - Advanced materials in automotive engineering, 1st ed. Woodhead Publishing Limited, 2012,
pp. 315 - 329.
[10] KINSEY, B. L. - Mechanics-based modelling of tailor welded blank forming. In: KINSEY, B. and
X. Wu. ed. - Tailor welded blanks for advanced manufacturing, 1st ed. Woodhead Publishing
Limited, 2011, pp. 48 - 67.
[11] DEN UIJL, N. J., CARLESS, L. T. - Advanced metal-forming technologies for automotive
applications. In ROWE, J. ed, - Advanced materials in automotive engineering, 1st ed. Woodhead
Publishing Limited, 2012, pp. 230 - 253.
[12] OKITSU, Y., TSUJI, N. - Nanostructured steel for automotive body structures. In ROWE, J. ed, -
Advanced materials in automotive engineering, 1st ed. Woodhead Publishing Limited, 2012, pp.
57 - 84.
[13] PADMANABHAN, R., OLIVEIRA, M. C., MENEZES, L. F. - Lightweight metal alloy tailor welded
blanks. In: KINSEY, B. and X. Wu. ed. - Tailor welded blanks for advanced manufacturing, 1st
ed. Woodhead Publishing Limited, 2011, pp. 97 - 117.
[14] MATHERS, Gene. The welding of aluminium and its alloys. Woodhead publishing, 2002.
[15] WU, X. - Advanced high-strength steel tailor welded blanks (AHSS-TWBs). In: KINSEY, B. and
X. Wu. ed. - Tailor welded blanks for advanced manufacturing, 1st ed. Woodhead Publishing
Limited, 2011, pp. 118 - 163.
References
80
[16] LI, M. M. - Weld integrity of tailor welded blanks. In: KINSEY, B. and X. Wu ed. - Tailor welded
blanks for advanced manufacturing, 1st ed. Woodhead Publishing Limited, 2011, pp. 1 - 23.
[17] DUCKER WORLDWIDE, L. L. C. North American Light Vehicle Aluminum Content Study. 2014.
[18] POLMEAR, Ian; JOHN, David St. Light alloys: from traditional alloys to nanocrystals. Butterworth-
Heinemann, 2005.
[19] NARASIMHAN, K., NARAYANAN, R. G. - Deformation of tailor welded blanks during forming. In
ROWE, J. ed, - Advanced materials in automotive engineering, 1st ed. Woodhead Publishing
Limited, 2012, pp. 57 - 84.
[20] THOMAS, W., “Friction Stir But Welding, International Patent Application Nº PCT/GB92/02203
and GB Patent Application Nº 9125978.8”, US Patent Nº5,460,317
[21] MISHRA, R.S. and MA, Z. Y. , “Friction stir welding and processing”, Materials Science and
Engineering R, 50, (2005), pp. 1-78.
[22] KHAIRUDDIN, Jauhari T., Jamaluddin Abdullah, Zuhailawati Hussain and Indra Putra Almanar
Principles and Thermo-Mechanical Model of Friction Stir Welding, Welding Processes, Dr.
Radovan Kovacevic (Ed.), (2012). ISBN: 978-953-51-0854-2, InTech, DOI: 10.5772/50156
[23] VILACA, Pedro, João Gandra and Catarina Vidal. Linear Friction Based Processing Technologies
for Aluminum Alloys: Surfacing, Stir Welding and Stir Channelling, Aluminium Alloys - New Trends
in Fabrication and Applications, Prof. Zaki Ahmad (Ed.), (2012) ISBN: 978-953-51-0861-0,
InTech, DOI: 10.5772/52026
[24] THOMAS, W. M., P. L. Threadgill, and E. D. Nicholas. "Feasibility of friction stir welding steel."
Science and Technology of Welding & Joining 4.6 (1999): 365-372.
[25] SCHNEIDER, J. A. - Temperature Distribution and Resulting Metal Flow. in MISHRA, R. S. and
Murray W. Mahoney ed - Friction Stir Welding and Processing, ASM International, (2007), pp. 37
- 49.
[26] DONG, P. et al. "Effects of welding speed on the microstructure and hardness in friction stir
welding joints of 6005A-T6 aluminum alloy." Materials & Design 45 (2013): 524-531.
[27] EL-DANAF, Ehab A. and Magdy M. El-Rayes. "Microstructure and mechanical properties of
friction stir welded 6082 AA in as welded and post weld heat treated conditions." Materials &
Design 46 (2013): 561-572.
[28] NANDAN, R., T. DebRoy and H.K.D.H. Bhadeshia, “Recent advances in friction-stir welding –
Process, weldment structure and properties”, Progress in Materials Science, 53, (2008), pp. 980-
1023.
[29] ELANGOVAN, K., and V. Balasubramanian. "Influences of tool pin profile and tool shoulder
diameter on the formation of friction stir processing zone in AA6061 aluminium alloy." Materials
& design 29.2 (2008): 362-373
[30] REYNOLDS, A. P. - Microstructure Development in Aluminum Alloy Friction Stir Welds. in
MISHRA, R. S. and Murray W. Mahoney ed - Friction Stir Welding and Processing, ASM
International, (2007), pp. 51 - 70.
[31] LAKSHMINARAYANAN, A. K. and V. Balasubramanian. "Process parameters optimization for
friction stir welding of RDE-40 aluminium alloy using Taguchi technique." Transactions of
Nonferrous Metals Society of China 18.3 (2008): 548-554.
[32] ZHANG, Y. N. et al. "Review of tools for friction stir welding and processing." Canadian
Metallurgical Quarterly 51.3 (2012): 250-261.
References
81
[33] HASAN, A. F., C. J. Bennett, and P. H. Shipway. "A numerical comparison of the flow behaviour
in Friction Stir Welding (FSW) using unworn and worn tool geometries." Materials & Design 87
(2015): 1037-1046.
[34] MALARVIZHI, S., and V. Balasubramanian. "Influences of tool shoulder diameter to plate
thickness ratio (D/T) on stir zone formation and tensile properties of friction stir welded dissimilar
joints of AA6061 aluminum–AZ31B magnesium alloys." Materials & Design 40 (2012): 453-460.
[35] FULLER, Christian B. - Friction Stir Tooling: Tool Materials and Designs. in MISHRA, R. S. and
Murray W. Mahoney ed - Friction Stir Welding and Processing, ASM International, (2007), pp. 7
- 35.
[36] LEONARD, A. J. and S. A. Lockyer. "Flaws in friction stir welds." 4th International symposium on
friction stir welding, Park City, USA. 2003.
[37] THREADGILL, P. L., et al. Friction stir welding of aluminium alloys. International Materials
Reviews, 2013.
[38] KIM, Y. G. et al. "Three defect types in friction stir welding of aluminium die casting alloy."
Materials Science and Engineering: A 415.1 (2006): 250-254.
[39] KHAN, N. Z. et al. "Investigations on tunnelling and kissing bond defects in FSW joints for
dissimilar aluminium alloys." Journal of Alloys and Compounds 648 (2015): 360-367.
[40] THOMAS, W. M. and E. D. Nicholas. "Friction stir welding for the transportation industries."
Materials & Design 18.4 (1997): 269-273.
[41] GRIMM, A. et al. "Friction Stir welding of Light Metals for Industrial Applications." Materials Today:
Proceedings 2 (2015): S169-S178.
[42] CHEN, Y. C. and K. Nakata. "Microstructural characterization and mechanical properties in friction
stir welding of aluminium and titanium dissimilar alloys." Materials & Design 30.3 (2009): 469-474.
[43] SCIALPI, A. et al. "Mechanical analysis of ultra-thin friction stir welding joined sheets with
dissimilar and similar materials." Materials & Design 29.5 (2008): 928-936.
[44] KWON, Y. J., I. Shigematsu, and N. Saito. "Dissimilar friction stir welding between magnesium
and aluminium alloys." Materials Letters 62.23 (2008): 3827-3829
[45] FRATINI, L., G. Buffa and R. Shivpuri, “Improving friction stir welding of blanks of different
thicknesses”, Materials Science and Engineering: A, Volume 459, Issues 1–2, 25 June 2007,
Pages 209-215, ISSN 0921-5093
[46] VILAÇA, P., et al. Joining Aluminium Alloys Dissimilar in Thickness by Friction Stir Welding and
Fusion Processes. Welding in the World, 2005, 49.3-4: 56-62.
[47] KOLAHGAR, Sina, et al. Formability of Friction Stir-Welded Blanks with Different Thickness
Ratios. Metallurgical and Materials Transactions A, 2016, 47.5: 2177-2187.
[48] HOVANSKY, Y. - High Speed Joining of Dissimilar Alloy Aluminum Tailor Welded Blanks [PDF]
Retrieved from http://energy.gov/sites/prod/files/2014/07/f17/lm075_hovanski_2014_o.pdf
[49] BUFFA, Gianluca, et al. Investigations on the mechanical properties and formability of friction stir
welded tailored blanks. In: Key Engineering Materials. Trans Tech Publications, 2007. p. 143-
150.
[50] MRÓWKA-NOWOTNIK, G.; SIENIAWSKI, J.; NOWOTNIK, A. Effect of heat treatment on tensile
and fracture toughness properties of 6082 alloy. Journal of Achievements in Materials and
Manufacturing Engineering, 2009, 32.2: 162-170.
[51] MOĆKO, Wojciech; KOWALEWSKI, Zbigniew L. Dynamic properties of aluminium alloys used in
automotive industry. Journal of KONES, 2012, 19: 345-351.
References
82
[52] KUMAR, Nilesh; MISHRA, Rajiv S.; YUAN, Wei. Friction stir welding of dissimilar alloys and
materials. Butterworth-Heinemann, 2015.
[53] http://www.twi-global.com/technical-knowledge/job-knowledge/bend-testing-073/ Accessed on
23rd August 2016
[54] HOVANSKI, Yuri, et al. High-Speed Friction-Stir Welding to Enable Aluminum Tailor-Welded
Blanks. JOM, 2015, 67.5: 1045-1053.
[55] DRESSLER, Ulrike; et al. Friction stir welding of titanium alloy TiAl6V4 to aluminium alloy
AA2024-T3. Materials Science and Engineering: A, 2009, 526.1: 113-117.
[56] Vill, Vadim Ivanovich. Friction welding of metals. Vol. 1. American Welding Society; trade
distributor: Reinhold Pub. Co., 1962.
[57] MAHONEY, M. W., et al. Properties of friction-stir-welded 7075 T651 aluminum.Metallurgical and
materials transactions A, 1998, 29.7: 1955-1964.
[58] REDDY, P. Jayachandra; KAILAS, Satish V.; SRIVATSAN, Tirumalai S. Effect of Tool Angle on
Friction Stir Welding of Aluminum Alloy 5052: Role of Sheet Thickness. In: Advanced Materials
Research. Trans Tech Publications, 2012. p. 196-205.

Appendices
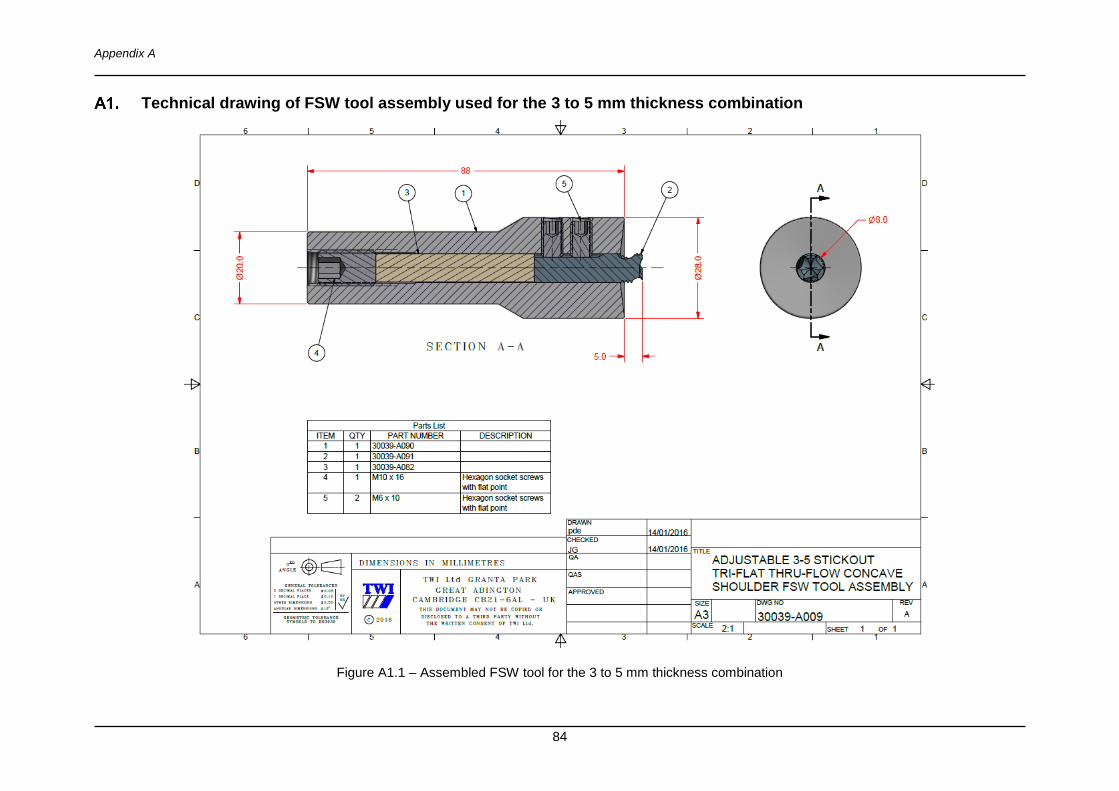
Appendix A
84
Technical drawing of FSW tool assembly used for the 3 to 5 mm thickness combination
Figure A1.1 – Assembled FSW tool for the 3 to 5 mm thickness combination
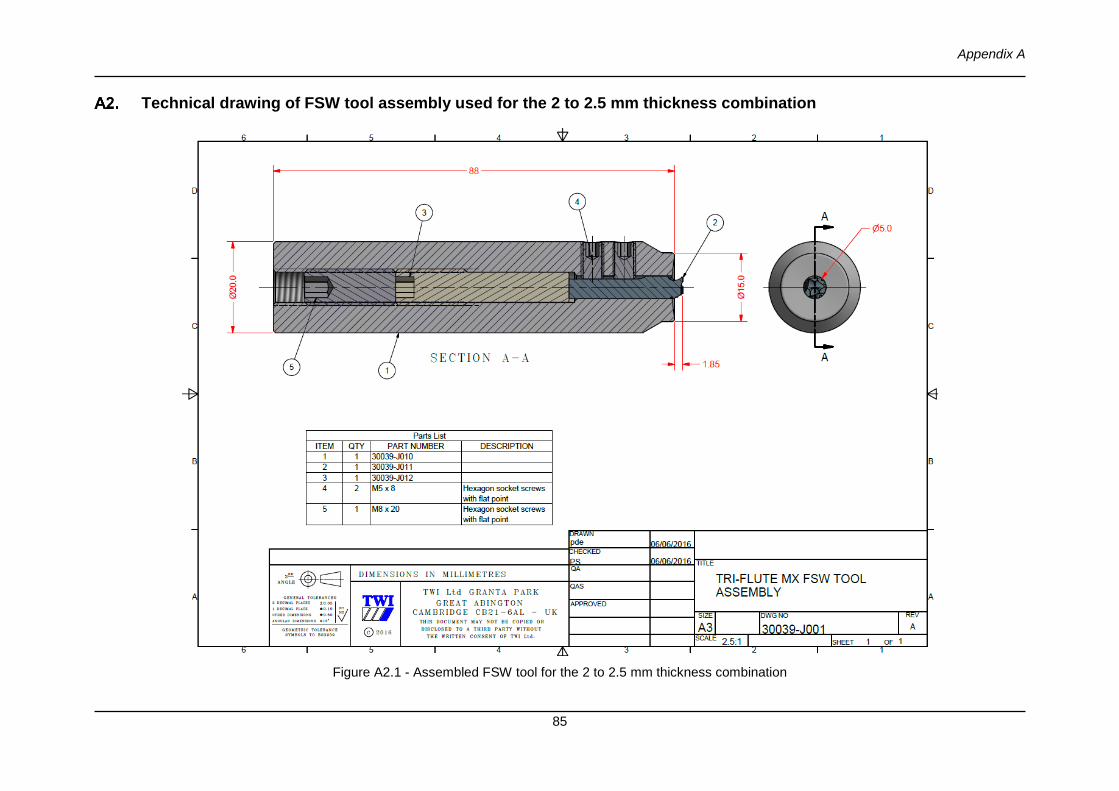
Appendix A
85
Technical drawing of FSW tool assembly used for the 2 to 2.5 mm thickness combination
Figure A2.1 - Assembled FSW tool for the 2 to 2.5 mm thickness combination
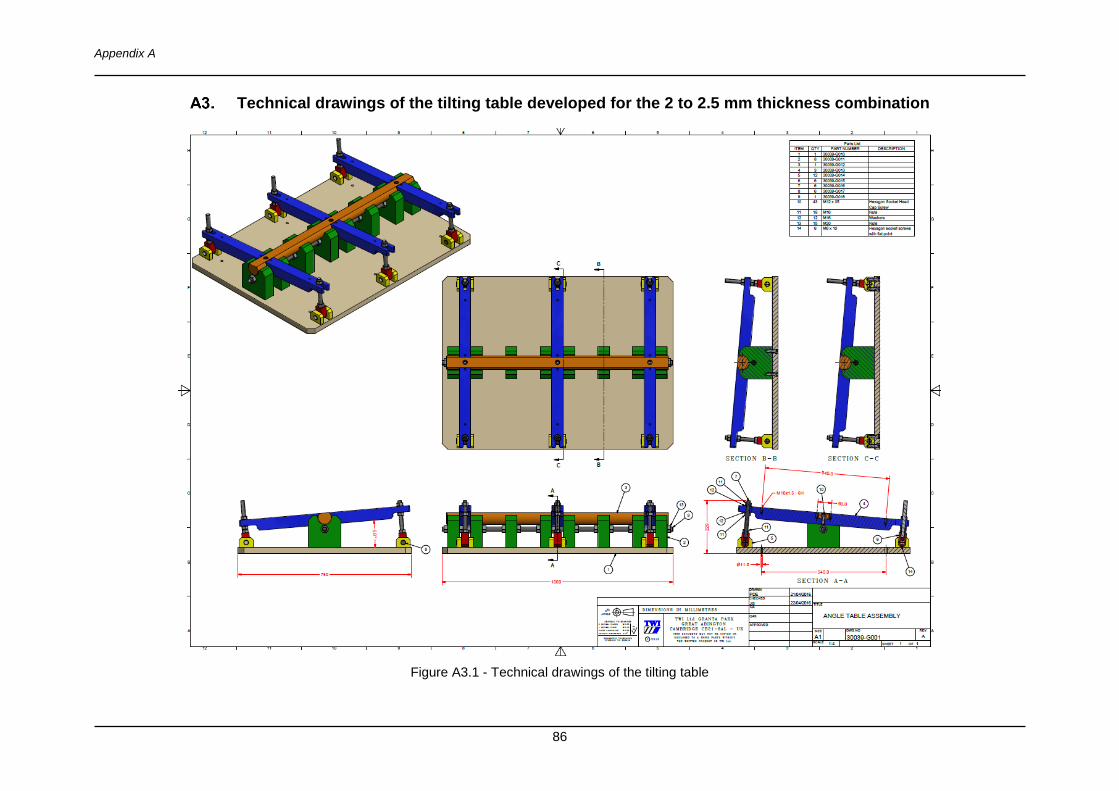
Appendix A
86
Technical drawings of the tilting table developed for the 2 to 2.5 mm thickness combination
Figure A3.1 - Technical drawings of the tilting table
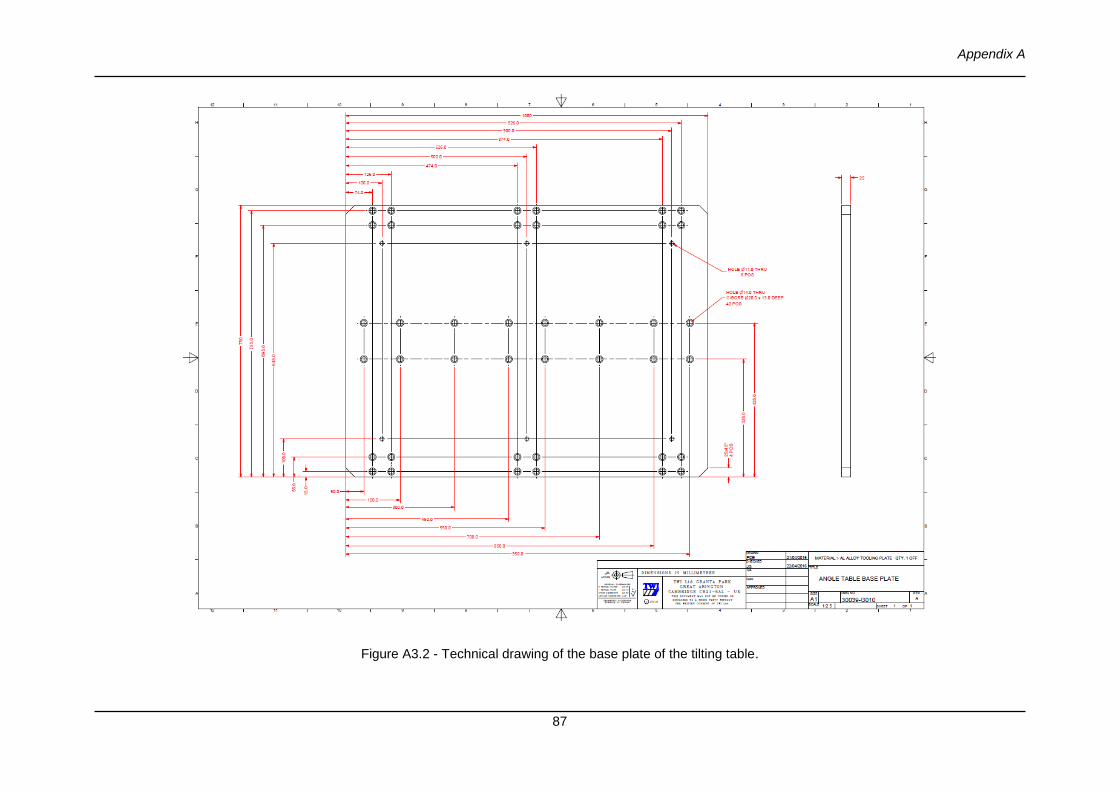
Appendix A
87
Figure A3.2 - Technical drawing of the base plate of the tilting table.
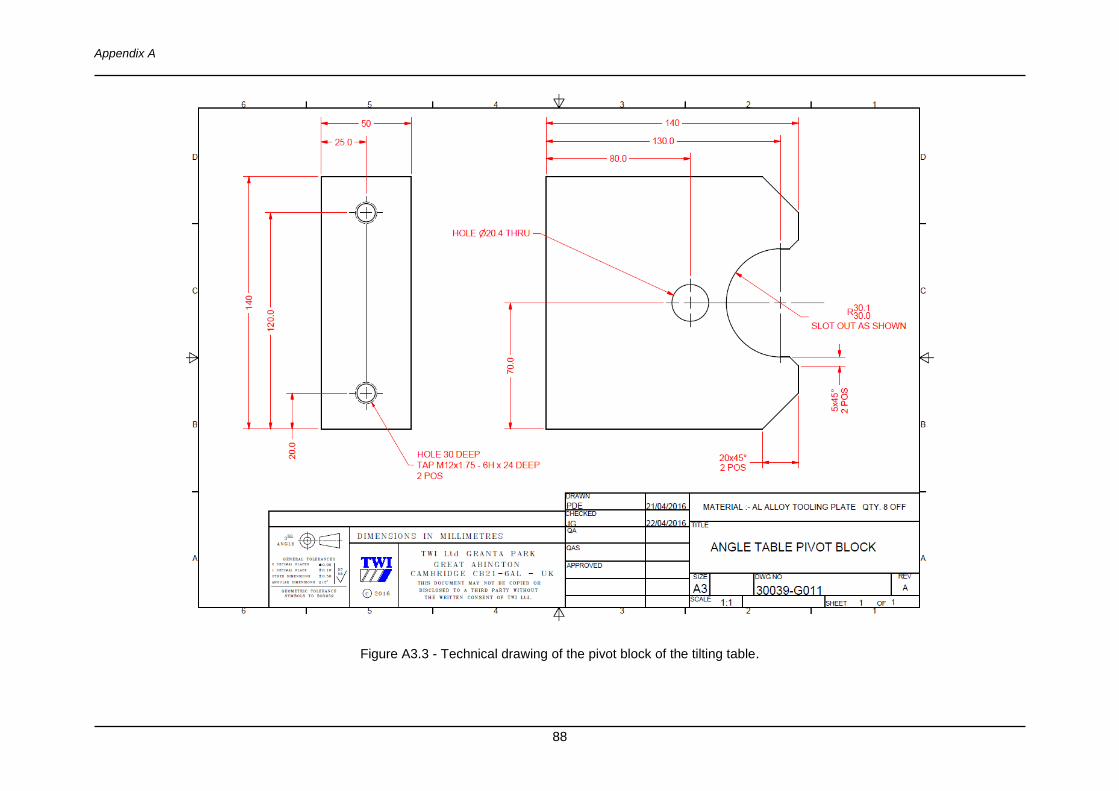
Appendix A
88
Figure A3.3 - Technical drawing of the pivot block of the tilting table.
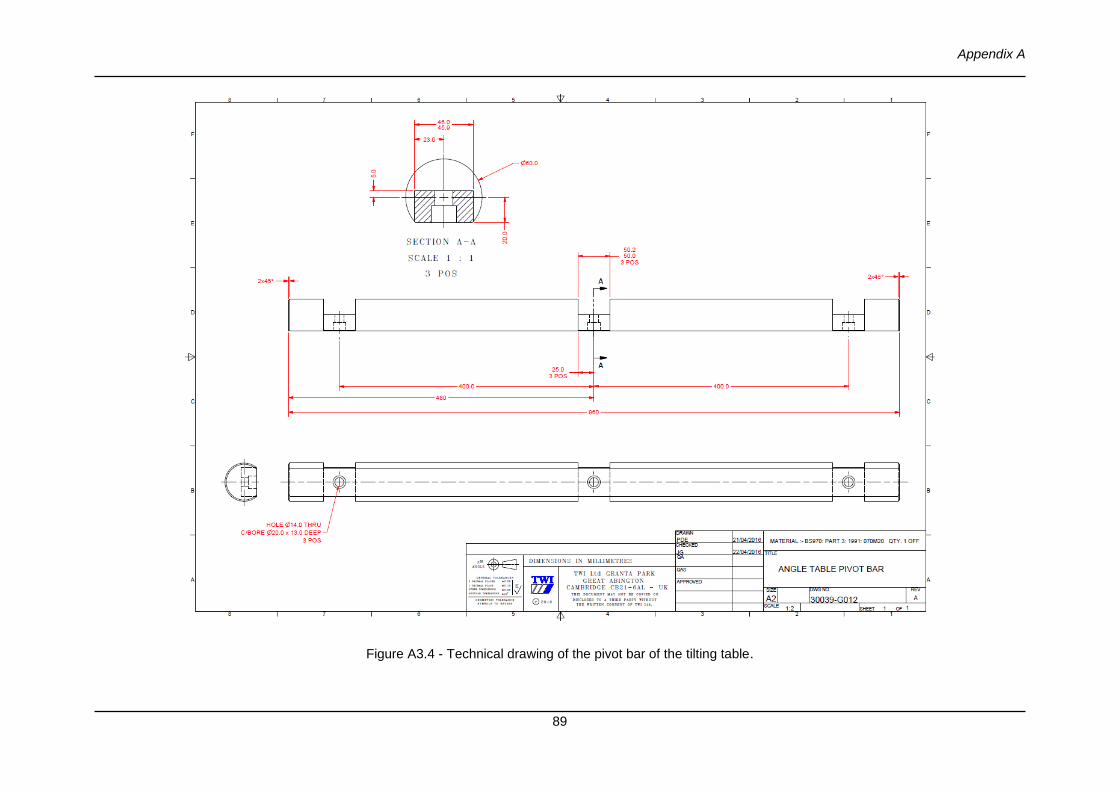
Appendix A
89
Figure A3.4 - Technical drawing of the pivot bar of the tilting table.
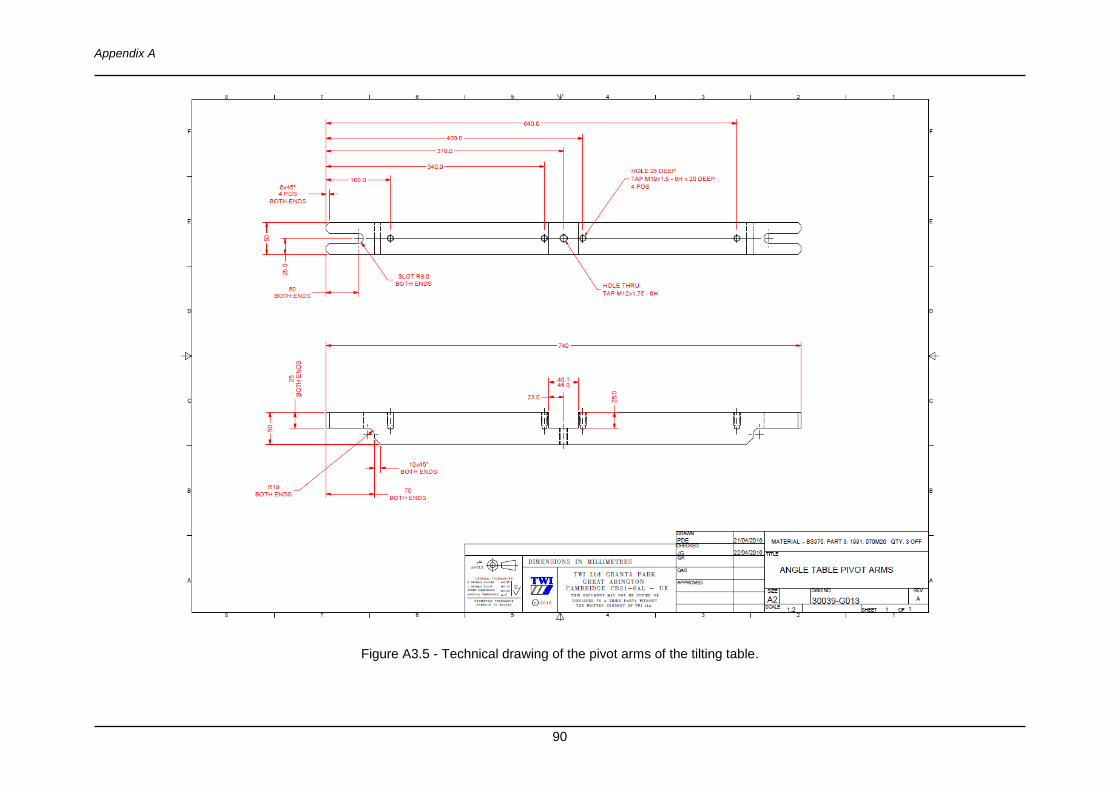
Appendix A
90
Figure A3.5 - Technical drawing of the pivot arms of the tilting table.
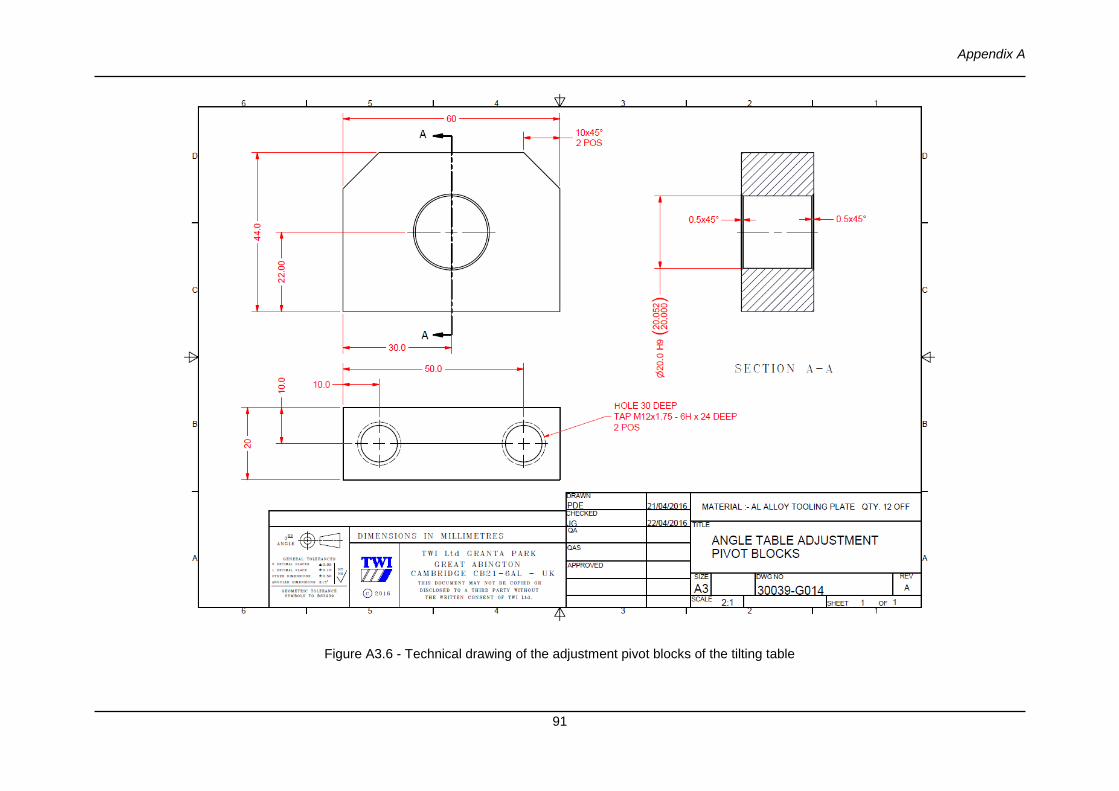
Appendix A
91
Figure A3.6 - Technical drawing of the adjustment pivot blocks of the tilting table
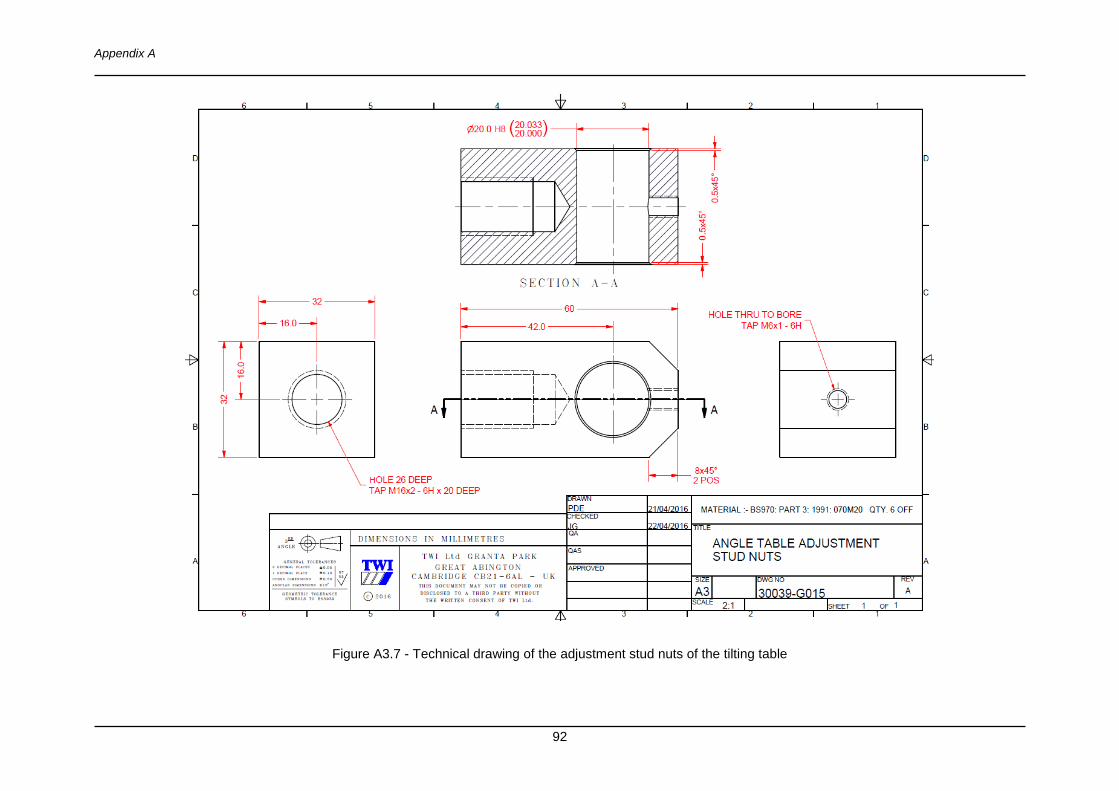
Appendix A
92
Figure A3.7 - Technical drawing of the adjustment stud nuts of the tilting table
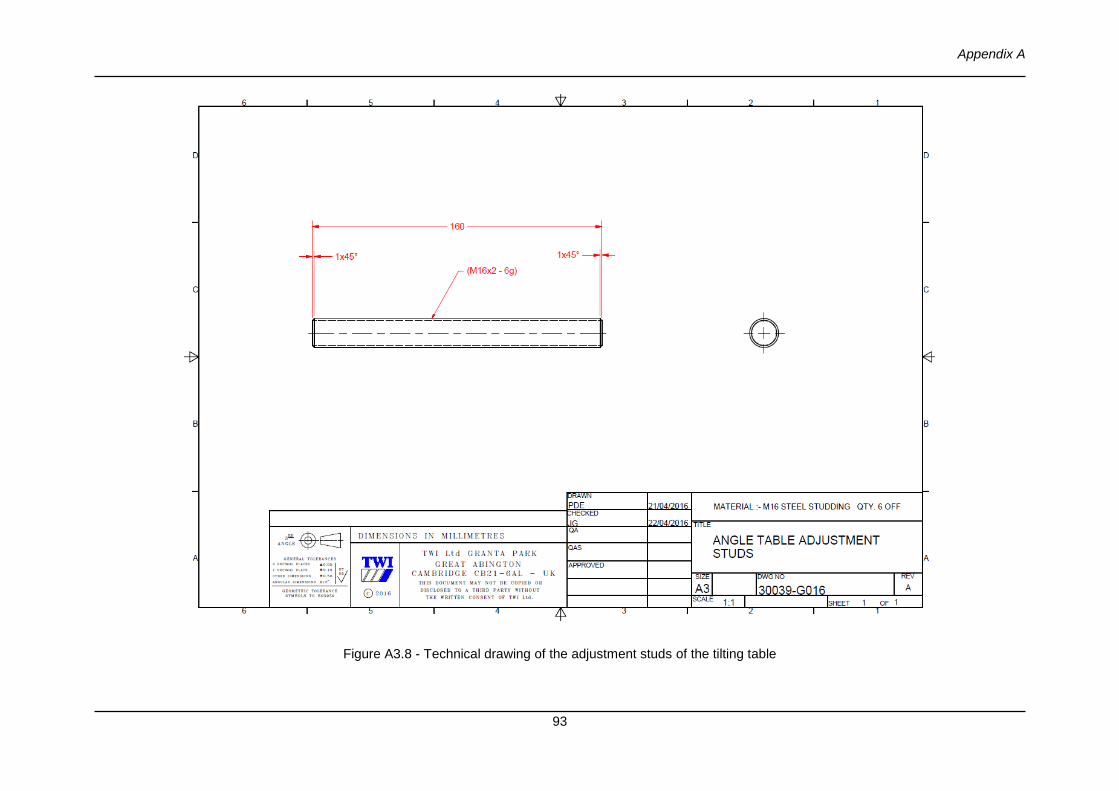
Appendix A
93
Figure A3.8 - Technical drawing of the adjustment studs of the tilting table
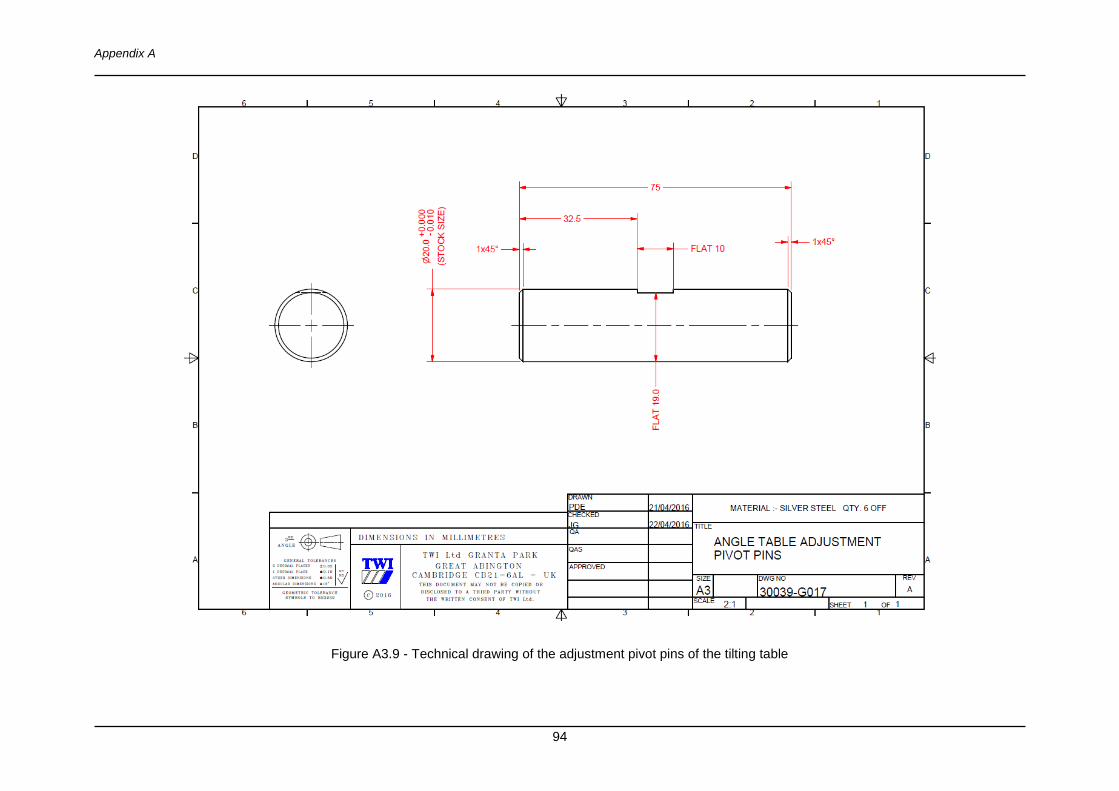
Appendix A
94
Figure A3.9 - Technical drawing of the adjustment pivot pins of the tilting table
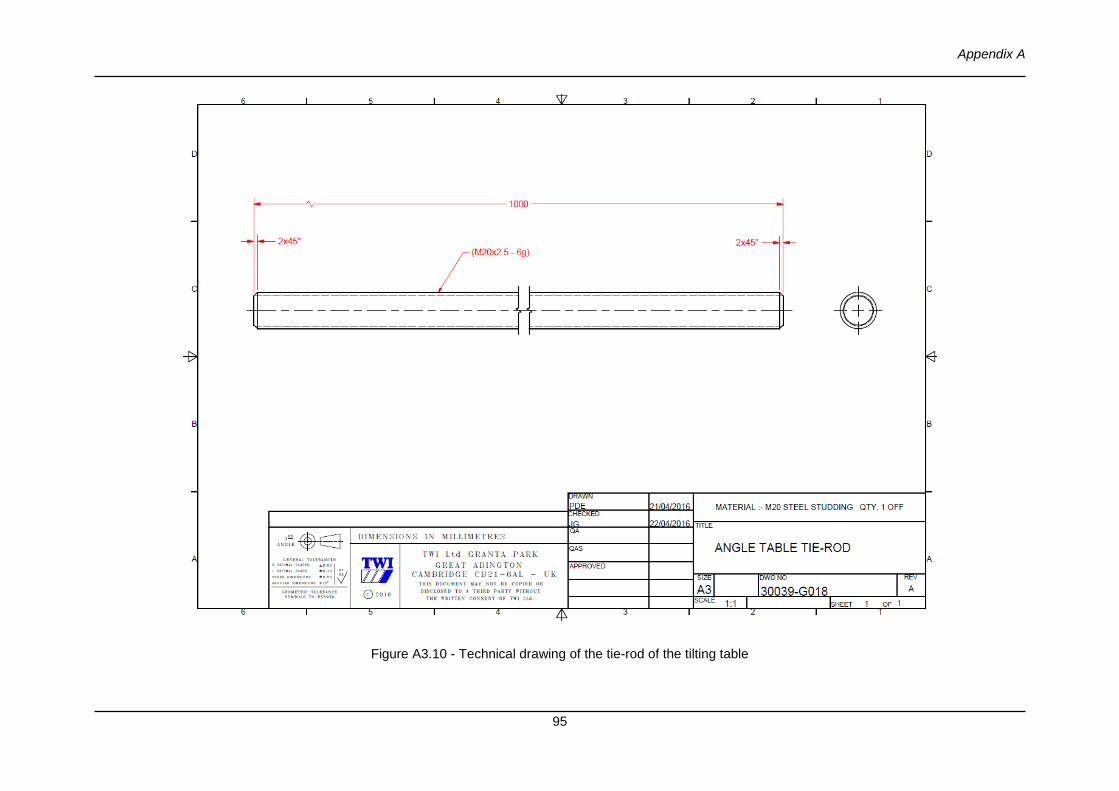
Appendix A
95
Figure A3.10 - Technical drawing of the tie-rod of the tilting table
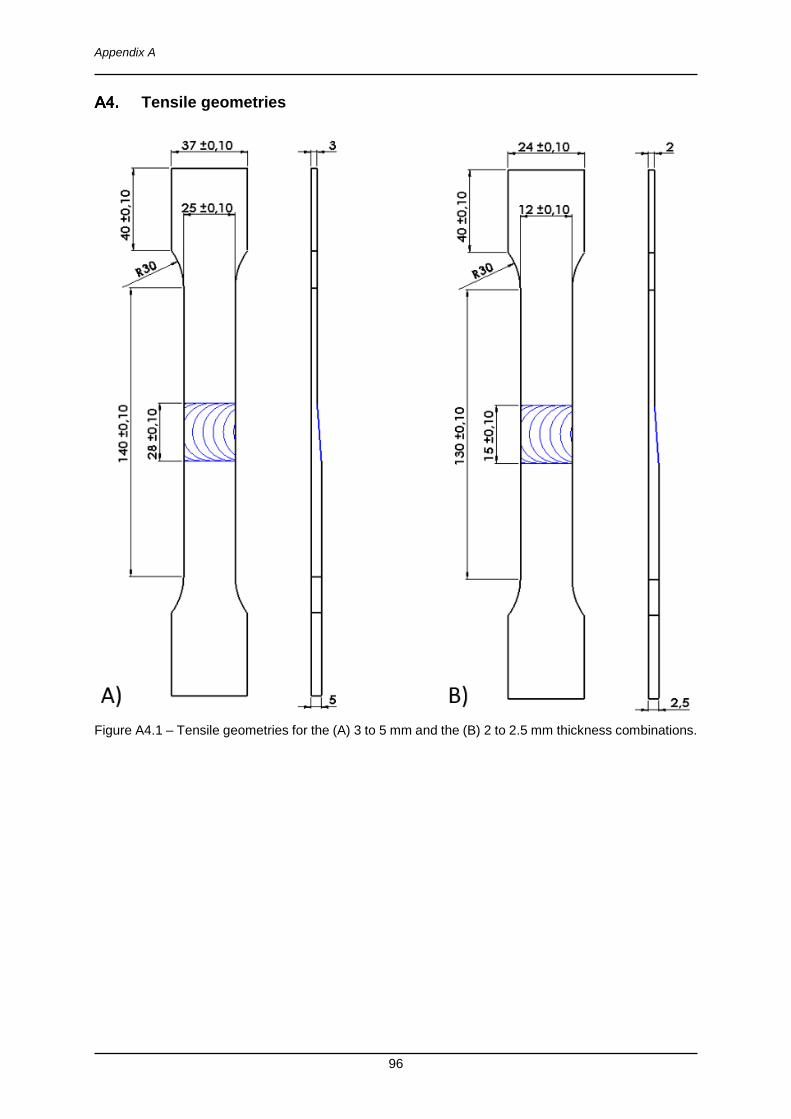
Appendix A
96
Tensile geometries
Figure A4.1 – Tensile geometries for the (A) 3 to 5 mm and the (B) 2 to 2.5 mm thickness combinations.
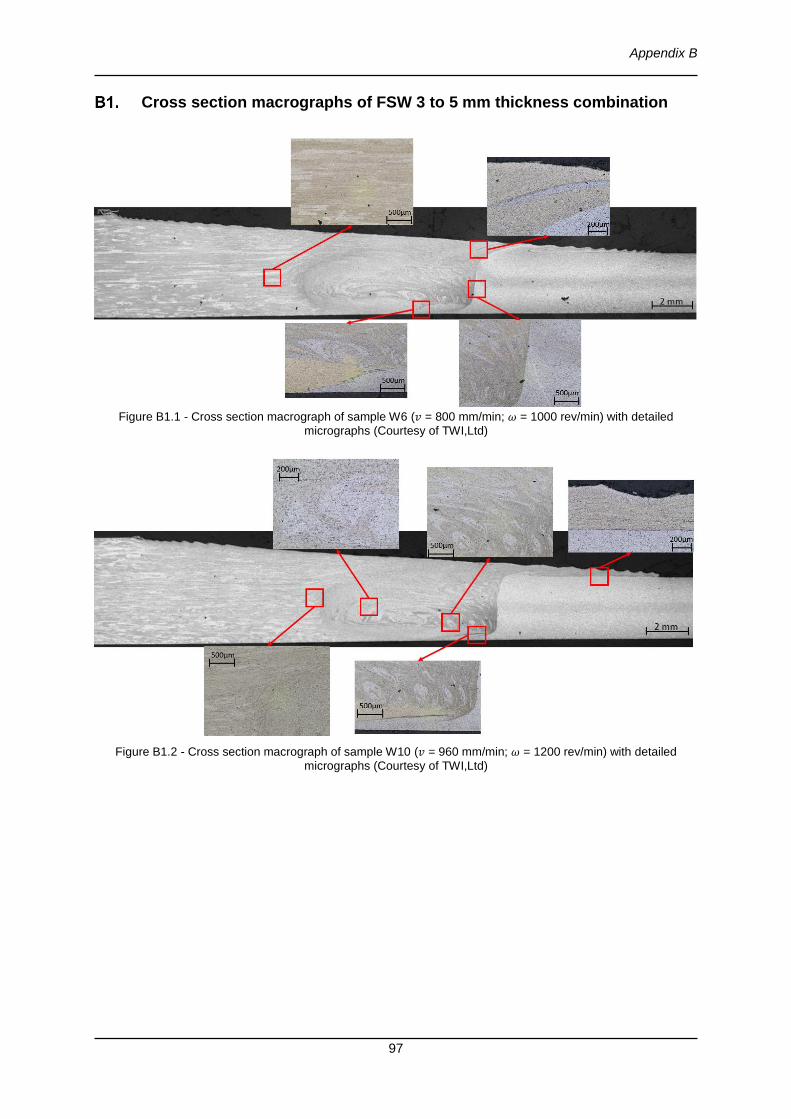
Appendix B
97
Cross section macrographs of FSW 3 to 5 mm thickness combination
Figure B1.1 - Cross section macrograph of sample W6 (𝑣 = 800 mm/min; 𝜔 = 1000 rev/min) with detailed
micrographs (Courtesy of TWI,Ltd)
Figure B1.2 - Cross section macrograph of sample W10 (𝑣 = 960 mm/min; 𝜔 = 1200 rev/min) with detailed
micrographs (Courtesy of TWI,Ltd)
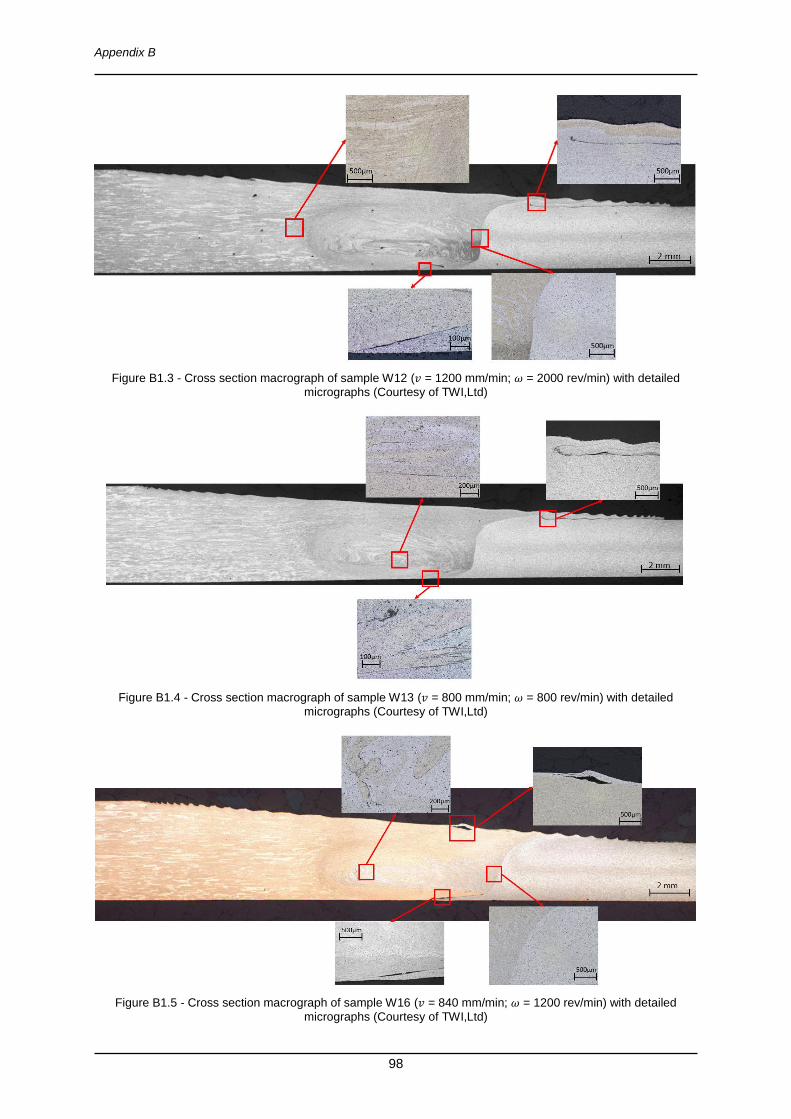
Appendix B
98
Figure B1.3 - Cross section macrograph of sample W12 (𝑣 = 1200 mm/min; 𝜔 = 2000 rev/min) with detailed
micrographs (Courtesy of TWI,Ltd)
Figure B1.4 - Cross section macrograph of sample W13 (𝑣 = 800 mm/min; 𝜔 = 800 rev/min) with detailed
micrographs (Courtesy of TWI,Ltd)
Figure B1.5 - Cross section macrograph of sample W16 (𝑣 = 840 mm/min; 𝜔 = 1200 rev/min) with detailed
micrographs (Courtesy of TWI,Ltd)
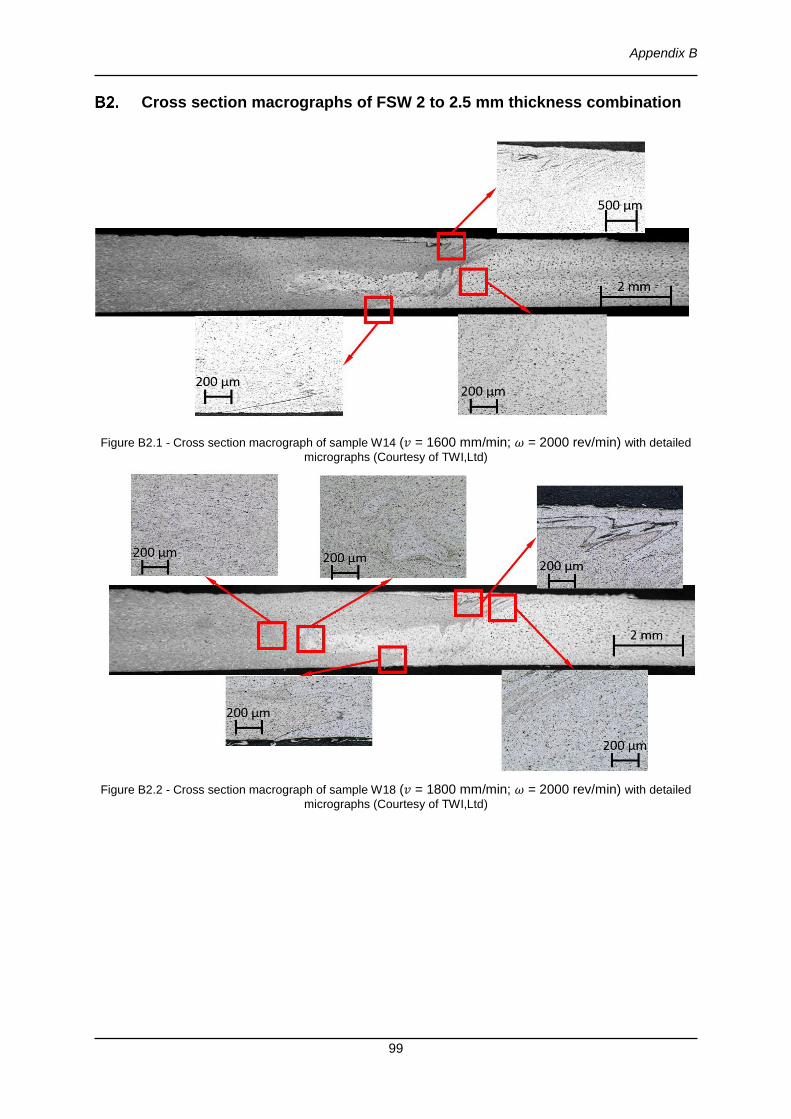
Appendix B
99
Cross section macrographs of FSW 2 to 2.5 mm thickness combination
Figure B2.1 - Cross section macrograph of sample W14 (𝑣 = 1600 mm/min; 𝜔 = 2000 rev/min) with detailed
micrographs (Courtesy of TWI,Ltd)
Figure B2.2 - Cross section macrograph of sample W18 (𝑣 = 1800 mm/min; 𝜔 = 2000 rev/min) with detailed
micrographs (Courtesy of TWI,Ltd)
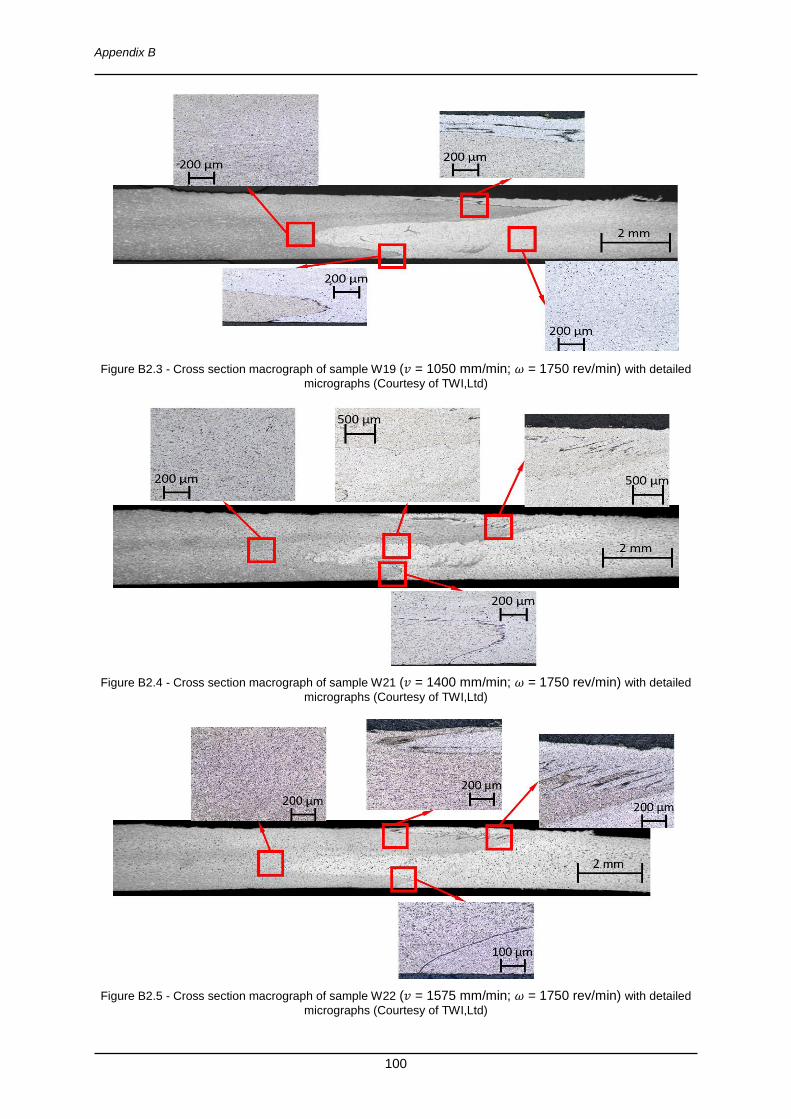
Appendix B
100
Figure B2.3 - Cross section macrograph of sample W19 (𝑣 = 1050 mm/min; 𝜔 = 1750 rev/min) with detailed
micrographs (Courtesy of TWI,Ltd)
Figure B2.4 - Cross section macrograph of sample W21 (𝑣 = 1400 mm/min; 𝜔 = 1750 rev/min) with detailed
micrographs (Courtesy of TWI,Ltd)
Figure B2.5 - Cross section macrograph of sample W22 (𝑣 = 1575 mm/min; 𝜔 = 1750 rev/min) with detailed
micrographs (Courtesy of TWI,Ltd)
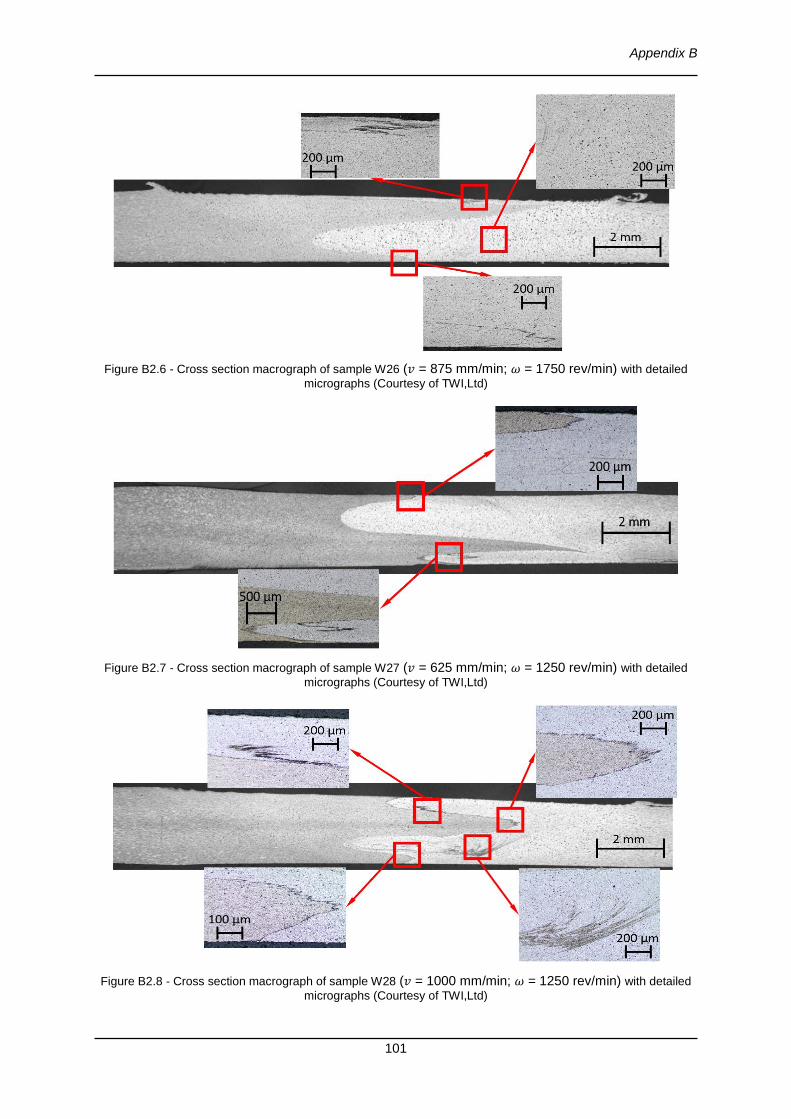
Appendix B
101
Figure B2.6 - Cross section macrograph of sample W26 (𝑣 = 875 mm/min; 𝜔 = 1750 rev/min) with detailed
micrographs (Courtesy of TWI,Ltd)
Figure B2.7 - Cross section macrograph of sample W27 (𝑣 = 625 mm/min; 𝜔 = 1250 rev/min) with detailed
micrographs (Courtesy of TWI,Ltd)
Figure B2.8 - Cross section macrograph of sample W28 (𝑣 = 1000 mm/min; 𝜔 = 1250 rev/min) with detailed
micrographs (Courtesy of TWI,Ltd)
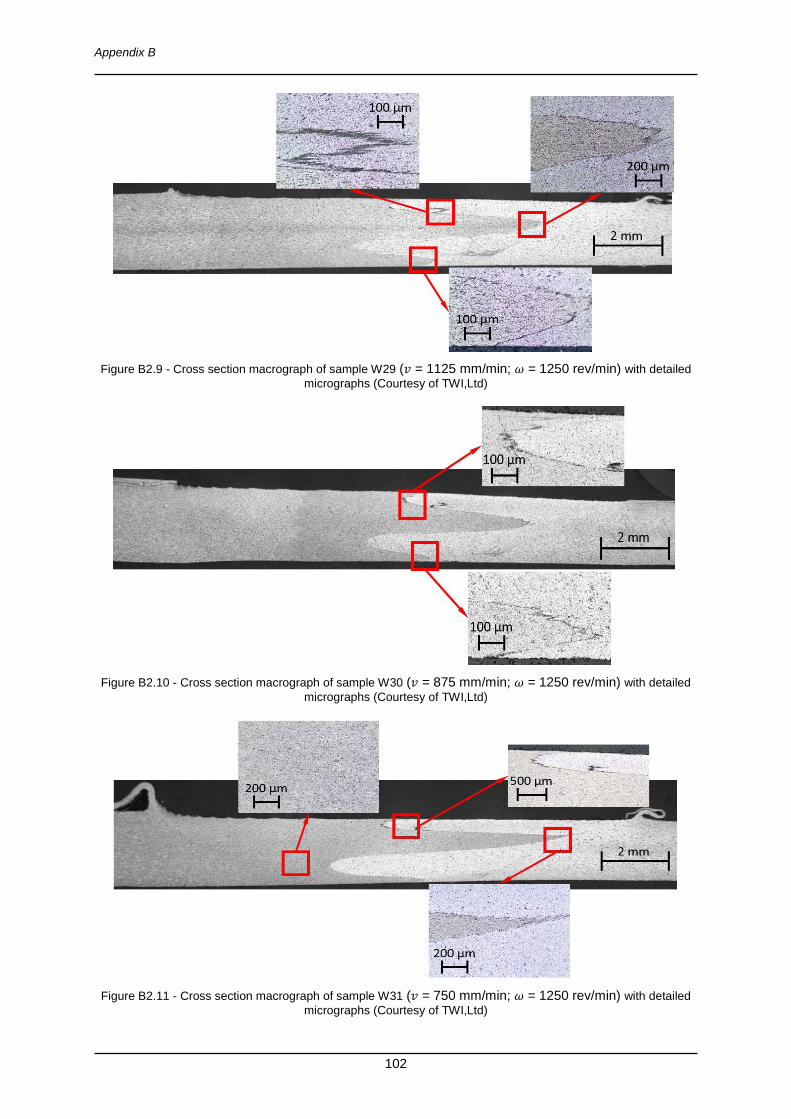
Appendix B
102
Figure B2.9 - Cross section macrograph of sample W29 (𝑣 = 1125 mm/min; 𝜔 = 1250 rev/min) with detailed
micrographs (Courtesy of TWI,Ltd)
Figure B2.10 - Cross section macrograph of sample W30 (𝑣 = 875 mm/min; 𝜔 = 1250 rev/min) with detailed
micrographs (Courtesy of TWI,Ltd)
Figure B2.11 - Cross section macrograph of sample W31 (𝑣 = 750 mm/min; 𝜔 = 1250 rev/min) with detailed
micrographs (Courtesy of TWI,Ltd)
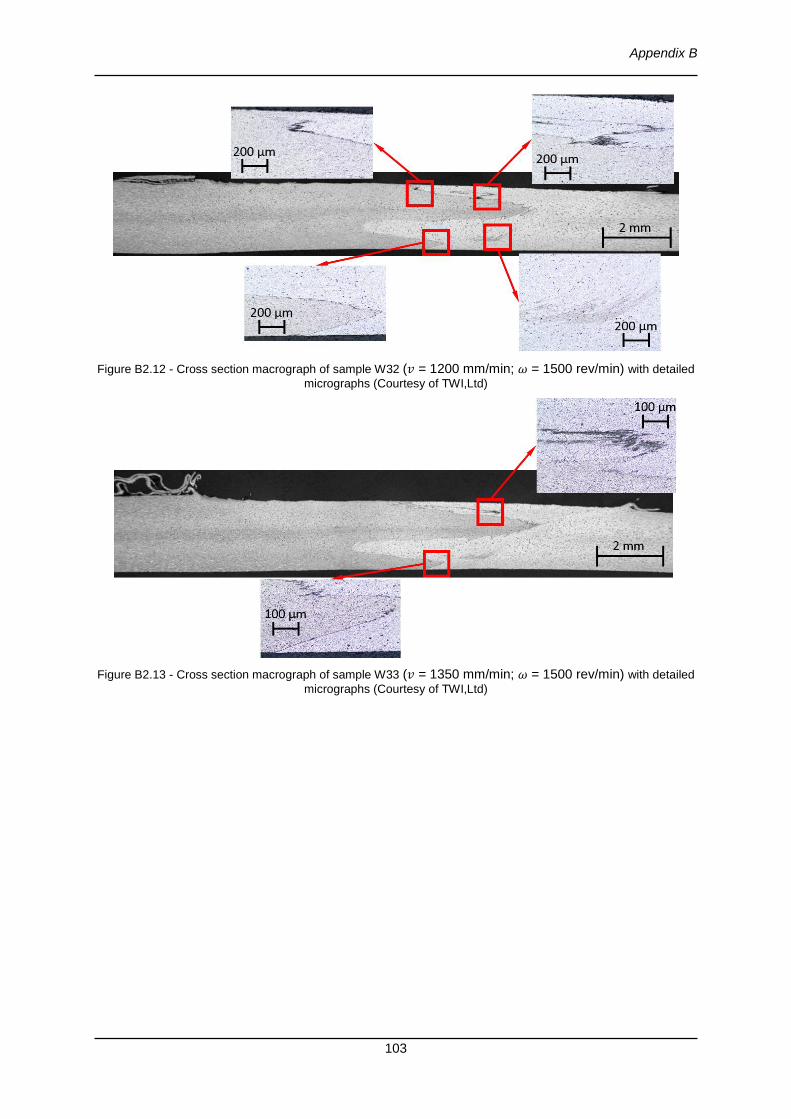
Appendix B
103
Figure B2.12 - Cross section macrograph of sample W32 (𝑣 = 1200 mm/min; 𝜔 = 1500 rev/min) with detailed
micrographs (Courtesy of TWI,Ltd)
Figure B2.13 - Cross section macrograph of sample W33 (𝑣 = 1350 mm/min; 𝜔 = 1500 rev/min) with detailed
micrographs (Courtesy of TWI,Ltd)