Embed Size (px)
Citation preview

Macdonald Campus of McGill University, Ste-Anne de Bellevue, Quebec
Filina Poonolly & Tiff-Annie Kenny
Fall 10
Development of Expert System for Mitigating Occupational Health Impact of Pesticides
2
ACKNOWLEDGEMENT
Several persons have contributed to realizing the project herein described. We would like to give
our gratitude to our classmates for providing input to the project. We would also like to
acknowledge the contribution of our supervisors, Dr. Raghavan- for his passion and commitment to
developing agricultural sustainability in India and to Dr. Clark- for his guidance and expertise
through the project.
EXECUTIVE SUMMARY
Pesticides, as compounds designed to annihilate target organisms, are by their very nature noxious
substances for which exposure must be limited and adverse effects mitigated. Pesticides pose
discernable impact to both human and environmental health. While regulatory structures exist in
developed nations, the frameworks necessary to govern their use and mitigate the associated
detriment in developing nations may not exist or may not be implemented in practical terms.
Insufficient resources in developing nations may hinder best management practices of pesticides.
This disparity is particularly significant given that agricultural workers in developing nations
comprise the largest percentage of the global agricultural workforce. When opportunities to
implement mitigation strategies exist, it is thus critical that they optimize the benefit to workers.
The following report describes the development of an expert system software tool designed to
characterize the risk associated with pesticide usage and to facilitate the choice of management
strategies that best mitigate consequences for occupational health. The report describes the design
principles and methodology used in the development of the expert tool. A framework for project
implementation is also discussed.

3
CONTENTS
Acknowledgement ................................................................................................................................ 2
Executive Summary .............................................................................................................................. 2
Contents .................................................................................................................................................... 3
Table of figures ...................................................................................................................................... 4
Tables ........................................................................................................................................................ 4
Figures ...................................................................................................................................................... 4
Equations ................................................................................................................................................. 4
Introduction ............................................................................................................................................ 6
Problem Statement ............................................................................................................................... 7
Expected Outcomes .............................................................................................................................. 7
Background Information .................................................................................................................... 8 Scope ...................................................................................................................................................................... 8
Economy and Culture ................................................................................. Error! Bookmark not defined. Agriculture ...................................................................................................................................................................... 8 Pesticide Usage ............................................................................................................................................................. 9
Defining Occupational Activities .............................................................................................................. 10 Mixing and Loading .................................................................................................................................................. 11 Application .................................................................................................................................................................... 12
Methodology of Development ......................................................................................................... 13 Design Criteria ................................................................................................................................................ 13 Expert System Defined ................................................................................ Error! Bookmark not defined. Programming Platform ............................................................................... Error! Bookmark not defined. Program Outline ............................................................................................ Error! Bookmark not defined. Target User ...................................................................................................... Error! Bookmark not defined. Data Collection ............................................................................................... Error! Bookmark not defined. Assessing Human Health Risk ................................................................................................................... 15
Intrinsic Toxicity ....................................................................................................................................................... 23 Magnitude of Exposure .......................................................................................................................................... 24 Interpreting Risk Indices Output ..................................................................................................................... 25
Assessing Efficacy of Mitigation Strategies ........................................................................................... 26 Personal Protective Equipment ........................................................................................................................ 29 Agricultural Equipment and Mechanization .............................................................................................. 31
Final Design ........................................................................................................................................... 32

4
Implementation ................................................................................................................................... 35
Limitations of the model ................................................................................................................... 35 No consideration of Financial and Environmental Parameters ...................................................... 36 Limitations in Assessing Toxicology .............................................................................................................. 36 Mitigating of Intrinsic Toxicity Not Considered ....................................................................................... 37
Conclusions ........................................................................................................................................... 38
References ............................................................................................................................................. 38
Appendices ............................................................................................................................................ 40 Appendix A – Risk Characterization Values .......................................................................................... 40
TABLE OF FIGURES
TABLES Table 1, Exposure According to Nature of Formulation- Adapted from NAIS, 2000 ................................. 11 Table 2, Summary of Liquid Spray Equipment- Adapted from PSD-POEM (2003) ................................... 12 Table 3, Summary of Relevant Parameters .................................................... Error! Bookmark not defined. Table 4, Acute Toxicity Determination- Adapted from QPRI (2008) ............................................................... 24 Table 6, Weighing Factor for Application Technique (QPRI, 2008) ................................................................. 25 Table 13, Summary of Representative Literature on Efficacy of Various Controls ................................... 28 Table 12, Reduction Coefficients for PPE (POEM, 2003) ...................................................................................... 31 Table 8, Acute Toxicity Indices ........................................................................................................................................ 40 Table 9, Chronic Toxicity Indices .................................................................................................................................... 41 Table 10, Environmental Persistence and Bioaccumulation Indices ............................................................... 41 Table 11, Weighing Factor for Application Technique .......................................................................................... 41
FIGURES Figure 8, Design Criteria ........................................................................................ Error! Bookmark not defined. Figure 9, Criteria for Programming Platform ............................................... Error! Bookmark not defined. Figure 10, Summary of Program Structure .................................................... Error! Bookmark not defined. Figure 11, User Input Parameters for Risk Computation ........................ Error! Bookmark not defined.
EQUATIONS

5
Equation 1, Risk Described ................................................................................................................................................ 23 Equation 2, Human Health Risk ....................................................................................................................................... 23 Equation 3, Intrinsic Toxicity (QPRI, 2008) ............................................................................................................... 24 Equation 4, Efficiency of Mitigation Strategy ............................................................................................................. 26 Equation 5, Modified Health Risk ................................................................................................................................... 27 Equation 6, Inhalation Exposure ..................................................................................................................................... 28 Equation 7, Occupational Risk Index Considering PPE .......................................................................................... 29 Equation 8, Operator Exposure ....................................................................................................................................... 30 Equation 9, Modified Operator Risk .............................................................................................................................. 31 Equation 10, Mitigation of Engineering Controls ..................................................................................................... 32

6
INTRODUCTION
The intensive use of pesticides has been one of the factors contributing to high crop yields and
lower commodity prices. Farmers employing pesticides have benefited from roughly a four-fold
return on initial pesticide investment due to increased yields (Kellogg et al., 2000). Pesticides
however, as compounds designed to annihilate target organisms, are by their very nature, noxious
substances for which exposure must be limited and adverse effects mitigated. Pesticides have been
identified to contribute to a multitude of human health ailments, both acute (abdominal pain,
headaches, dizziness, nausea, skin irritations etc…) and chronic (repertory illness, cancer, memory
disorders, birth defects, kidney disorders, and neurological defects) in nature (Michael et al., 2004).
The routine and direct nature of occupational exposure renders it the most problematic of human
exposure opportunities. Relevantly, results from field studies have identified that pesticide use has
a negative effect on farmer health and that farmer health has a positive effect on productivity (Antle
& Pingali, 1994). Thus, unless the integrity of farmer’s health is protected, the pest management
technologies introduced to ameliorate crop productivity and financial stability may instead
compromise the efficiency of agricultural and social systems. In addition to the discernable impacts
pesticides impose upon biological organisms and the environment they occupy, pesticides pose
unique risks to farmers- particularly the financially burdening nature of these technologies, as well
as the consequences they imply on future pest levels (Benbrook et al., 2002). While regulatory
structures exist in developed nations, the frameworks necessary to govern their use and mitigate
the associated detriment in developing nations may not exist or may not be implemented in
practical terms. The adoption of best management practices may be further hindered by inadequate
access to knowledgebase, educational and human-expert resources- as limited by factors including
remote locality, constraints of time and monetary resources and inexistent support infrastructures.
This disparity is particularly significant given that agricultural workers in developing nations
comprise the largest percentage of the global agricultural workforce. When opportunities to
implement mitigation strategies exist, it is thus critical that they optimize the benefit to workers.

7
PROBLEM STATEMENT
Navigating the complex socio-economic and technical challenges of optimizing the benefit of
pesticides on crop productivity, while mitigating exposure consequences, inherently requires
expertise in a broad spectrum of disciplines. Furthermore, when amelioration opportunities exist,
tools are necessary to quantify the potential significance of these improvements. Expert-systems
are computational tools designed to facilitate decision making by clarifying uncertainties that
would otherwise require the contribution of various human experts and knowledgebases. The
project herein described aims to characterize risk and facilitate the decision of risk mitigation
regimes to protect occupational health. The design integrates findings of research that remain
otherwise largely inaccessible to the public, including: toxicological profiles, pesticide risk
indicators and mitigation efficacy studies found in scientific literature and technical reports.
The objective of the project is thus to develop a user friendly computational software tool to
characterize the risk associated with pesticide usage for farm specific parameters, and from this
data, facilitates the choice pesticide application strategies and regimes that most effectively
mitigate consequences for human health.
EXPECTED OUTCOMES
The following objectives were defined for the development of the expert-system:
Immediate:
• To develop a system that integrates knowledge of pesticide toxicology, risk assessment and farm specific parameters to characterize the occupational health risk
o To output a clearly displayed diagnostic of risk for current pesticides practices at the farm level
• To optimize the mitigation of occupational risk reduction
o To review all relevant knowledge and scientific literature on the best systems to
mitigate occupational health risk by engineering controls, the use of personal protective equipment (PPE) and alternative biological agricultural systems

8
o To identify important variables which govern occupational exposure to pesticides such that they me considered within the context of risk reduction
Long Term:
• To behave as an educational resource for public health policy
• To develop a tool that can facilitate decision making for the farmer and other land managers in order to mitigate the consequences pesticides impose on workers occupationally
• To promote best management practices of pesticides by encouraging pest management practices that mitigate risk
BACKGROUND INFORMATION
SCOPE
While the methodology herein described is pertinent irrespective of locality, to facilitate the
simplicity of the project, the scope is limited to the context of cotton and wheat production in the
Punjab state of India. Nevertheless, the methodology can readily be adapted to broaden the context
of application for other geographic locations and cropping systems.
Figure 1 Map of Punjab India (http://www.all-indiatravel.com/india-map/ind-map-3.gif)
AGRICULTURE
9
Punjab, India has often been called the bread and rice bowl of India due to its high production of
wheat and rice grains. An area known for its involvement in the start of the Green Revolution, the
state is known for its large agricultural sector. In addition, agriculture has been well documented
within this state historically due to government initiatives. Agriculture is split between two
seasons, the winter Kharif and the spring Rabi season. Most farmers in Punjab alternate between
wheat and rice or wheat and cotton within these seasons.
Agriculture within the region was marked by a shift from organic methods of farming to more
intensive methods. This shift was due to the introduction, during the Green Revolution, of
genetically modified varieties of crops such as wheat and rice and to improved and wider use of
groundwater irrigation practices. The shift also brought on the rapid increase of crop yields within
the region, helping to satisfy increasing food demands brought on by a growing population. As
such, Punjab has become a powerhouse of grain production.
However, within the past decade, issues associated with the unsustainability and adverse effects of
intensive farming practices have come into the forefront. The new grain varieties require
substantial inputs of resources such as fertilizer and pesticides. In addition, irrigation practices are
under scrutiny as the water table drops at a rate of around 30 feet per year.
PESTICIDE USAGE
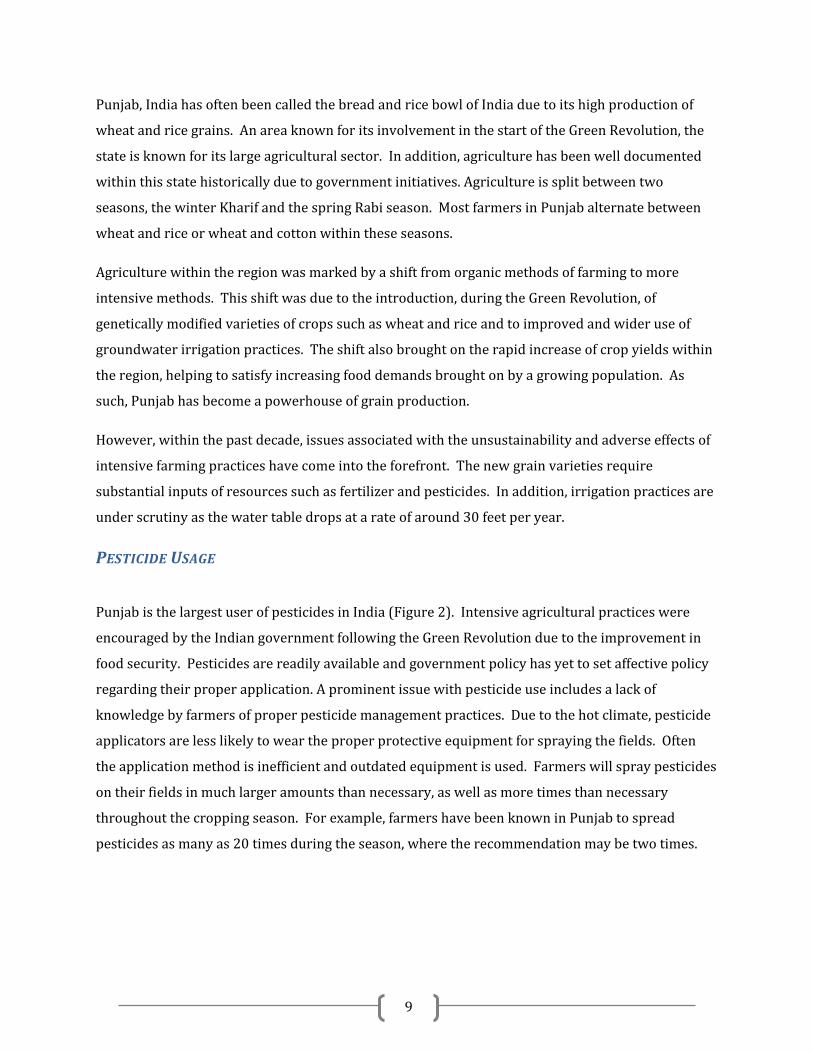
Punjab is the largest user of pesticides in India (Figure 2). Intensive agricultural practices were
encouraged by the Indian government following the Green Revolution due to the improvement in
food security. Pesticides are readily available and government policy has yet to set affective policy
regarding their proper application. A prominent issue with pesticide use includes a lack of
knowledge by farmers of proper pesticide management practices. Due to the hot climate, pesticide
applicators are less likely to wear the proper protective equipment for spraying the fields. Often
the application method is inefficient and outdated equipment is used. Farmers will spray pesticides
on their fields in much larger amounts than necessary, as well as more times than necessary
throughout the cropping season. For example, farmers have been known in Punjab to spread
pesticides as many as 20 times during the season, where the recommendation may be two times.
10
Figure 2 State-wise Consumption of Pesticides in MT (Indiastat, 2009)
Recently, there has been increased media attention regarding the possible link between pesticides
and adverse health effects. This is due to a number of studies that have been conducted linking
villages with heavy pesticide use with higher rates of cancer and other chronic health issues.
DEFINING OCCUPATIONAL ACTIVITIES
Occupational tasks identified to introduce pesticide exposure opportunities include: mixing loading,
application, flagging, harvesting and various other activities such as cleaning equipment (Garreyn,
2003). Pesticide operators- those who mix, load and apply pesticides- have been characterized as
the highest risk group for adverse potential (Garreyn, 2003). It is their exposure that has been most
extensively documented in the literature and accordingly the scope of the project is limited to
mitigating the nature of their exposure opportunities. It has been well documented that the most
important route of operator exposure involves dermal absorption- although inhalation and
ingestion have also been identified as important exposure routes (Krieger, 2001).
The sequence of handling operations constituting the occupational work day of pesticide operators,
is summarized in Figure-1. While the figure describes the sequence relevant to tractor-mounted
liquid-application, application with handheld equipment follows a likewise sequence- differing only
in the respect that dilution of the concentrate may not necessarily be relevant for each
replenishment of the sprayer tank.
0100020003000400050006000700080009000
10000
2008
2007
2006
2005

11
Figure 3 Sequence of Procedures during Spray Application - Adapted from PSD-POEM (2003)
MIXING AND LOADING
Mixing and loading operations constitute applicator activities in which operator exposure to
pesticide concentrate exists (designated above in the deep red coloration). Exposure during mixing
depends on the concentration of the active ingredients in the product, the number of dilutions and
the nature of the formulation (NAIS, 2000). The severity of exposure according to formulation type
is described in the following table:
Table 1, Exposure According to Nature of Formulation- Adapted from NAIS, 2000
Low Exposure High Exposure
• Ready to use products
• Gels
• Granules
• Water soluble tables
• Formulations from water
soluble bags
• Emulsions
• Powders
• Suspensions
• Other soluble concentrates
COLLECT PESTICIDE CONCENTRATE
STORAGE OPEN CONTAINER
MEASURE REQUIRED AMOUNT OF
CONCENTRATE.
PREMIX WITH SMALL VOLUME OF
WATER
TRANSFER CONCENTRATE TO
SPRAY TANK
RINSE CONTAINER AND ADD TO SPRAY
TANK
FILL SPRAY TANK WITH WATER AND
MIX CONTENTS
TRANSPORT DILUTED SPRAY TO APPLICATION SITE
UNFOLD SPRAY BOOMS APPLY DILUTE SPRAY
DEAL WITH BURST PIPES, LEAKS
BLOCKED NOZZLES ETC.
FOLD UP SPRAY BOOMS
RETURN AND REPEAT PROCEDURE
ON COMPLETION OF APPLICATION
RETURN AND WASH OUT SPRAYER

12
Handling pesticide concentrates during mixing and loading operations constitutes the most
significant skin contamination opportunity identified in the literature (POEM, 2003). This exposure
is typically incurred by absorption via the hands.
Time also constitutes an important factor in defining the magnitude of exposure. The time required
to complete the aforedescribed operations using tractor spray technique is determined by a
number of factors including (Matthews, 1979):
• Size of the spray tank
• Bottom width
• Application rate
• Distance between filling point and application site
APPLICATION
Exposure during application depends on parameters including the concentration of the active
ingredients in the applied product, the application rate, the spray area and most significantly, the
application method (NAIS, 2000). Multiple techniques are available for the application of pesticides
to target organisms. The nature of the spray equipment can be summarized as liquid sprays, dry
products and others. Amongst these, liquid spray techniques constitute the most frequently
employed application strategy. Liquid spray techniques may be further categorized according to: a)
tractor operated sprayers- in with both upwards and downwards spray orientations exist, b)
handheld sprayers and finally, c) aerial sprayers. Aerial spray applications are not addressed within
the scope of this report.
Table 2, Summary of Liquid Spray Equipment- Adapted from PSD-POEM (2003)
Tractor Operator Handheld Equipment
• Hydraulic boom sprayer
• Hydraulic air assisted sprayer
• Rotary disk boom sprayer
• Rotary disk air assisted sprayer
• Single nozzle hydraulic sprayer
• Hydraulic knapsack sprayer
• Hydraulic charged sprayer
• Single disk drift sprayer

13
• Rotary disk drift sprayer • Single disk low level sprayer
For tractor mounted spray applications, it has been estimated that the handling of concentrate
occupies a total of roughly one hour of the working day (POEM, 2003). The remaining operations,
designated with the lighter coloration of red, constitute worker interaction with dilute spray. These
activities have been estimated to consume a total of roughly nine hours per work day (POEM,
2003). The most significant route of occupational exposure during tractor operations is manifested
through the dermal exposure of the hands (Lloyd, G. 1985).
Similarly, for handheld spray applications, the spray operation time is unlikely to consume more
than six hours. With consideration however of continuous exposures consequential to matters of
contaminated clothing, the exposure time for handheld sprayers is estimated to be roughly nine
hours daily. The application regime can be further characterized according to the volume of spray
being applied. The spray volumes delivered can vary from less than 5 liters per hectare - Ultra Low
Volume to more than 1000 liters per hectare- High Volume (POEM, 2003).
METHODOLOGY OF DEVELOPMENT
A methodology is presented for the development of the expert system software tool. The design
criteria, as well as the methodologies for computing risk and integrating risk mitigating of risk
within the computational framework are described.
DESIGN CRITERIA
To best meet the objectives previously defined, the following criterion has been established. The
expert-system program should abide to the following:

14
Figure 4 Design Criteria
To satisfy the above-described criteria, the following objectives are described:
• Simplicity:
o Provide a graphical user interface with which the user can interact such that the
user needn’t interact with the computations
o Given the complex nature of human-environment interactions, a simplified
representation of reality adapted to assist in decision making
• Ease of use
o Provide a graphical user interface with which the user can interact
o Minimize opportunities for ambiguity
• Credibility:
o Based on reliable data and results from scientific literature
o Based on reasonable assumption
• Assist the pesticide user in making more appropriate choices:
o Promotes the protection of human health and environmental sustainability
Criteria
Simple
Credible
User Friendly
Reflects Pesticide Specific
Toxicology
Assists User Make Better
Decisions

15
• Reflects pesticide specific toxicology
o Acute and chronic toxicity criteria as well as bioaccumulation potential
o Application techniques and amount of pesticide used
o Pesticides environmental persistence and potential for bioaccumulation
EXPERT SYSTEM An expert system compiles and utilizes an expert base of information to find a solution to a pertinent problem and provides it in an easily accessible and efficient manner to a user. The three tiers of an expert system are seen in the figure below.
PROGRAMMING PLATFORM Criteria influencing the selection of the most appropriate software development platform include:
•Database •Knowledgebase
Expert Base
•General Problem Solving Knowledge •Draws Conclusions
Inference Engine
•Input Problem •Provide Recommendation
User

16
Figure 5 Criteria for Programming Platform
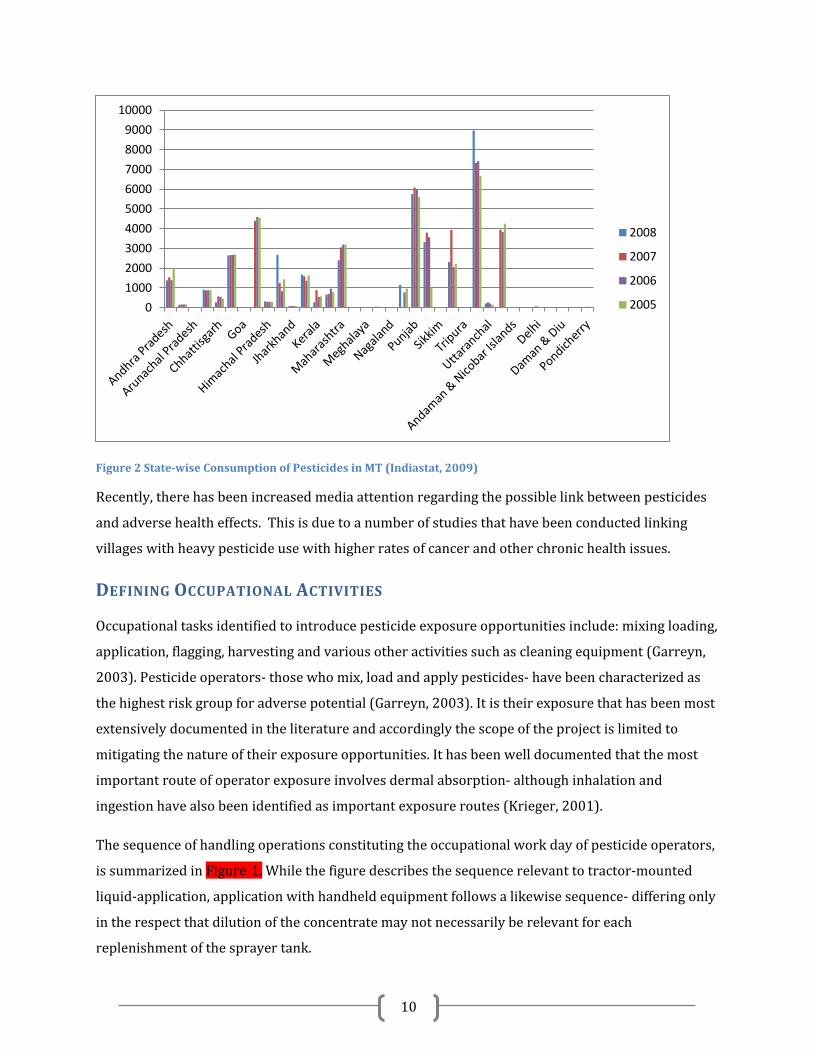
The programming platform utilized in the development of the risk quantifying software is MATLAB.
MATLAB is a high level language for technical computing. Its computing capacity exceeds that of
typical programming languages including C++. In addition, it has a built in platform for creating
user interfaces called Graphical User Interface Development Environment (GUIDE) (seen in Figure
6 below). This platform works by allowing the user to lay out a graphical user interface (GUI)
visually rather than programmatically, easing the creation of the GUI. Various visual objects are
available as tools including buttons, dropdown menus, check boxes, static text and editable text
boxes. After the creation of the visual layout, a script is generated automatically with functions for
the present objects. This script is connected with the previously created layout figure and when the
program is run, will produce a working GUI from which user inputs can be recorded and utilized.
Criteria for Programming
Platform
Accelerated computing potential
Graphical User Interface
Ease of adapting
graphical user interface to computing
Capacity to compile into independent
program
Preferably not a web based application
17
Figure 6 MATLAB GUIDE Platform (Mathworks, 2010)
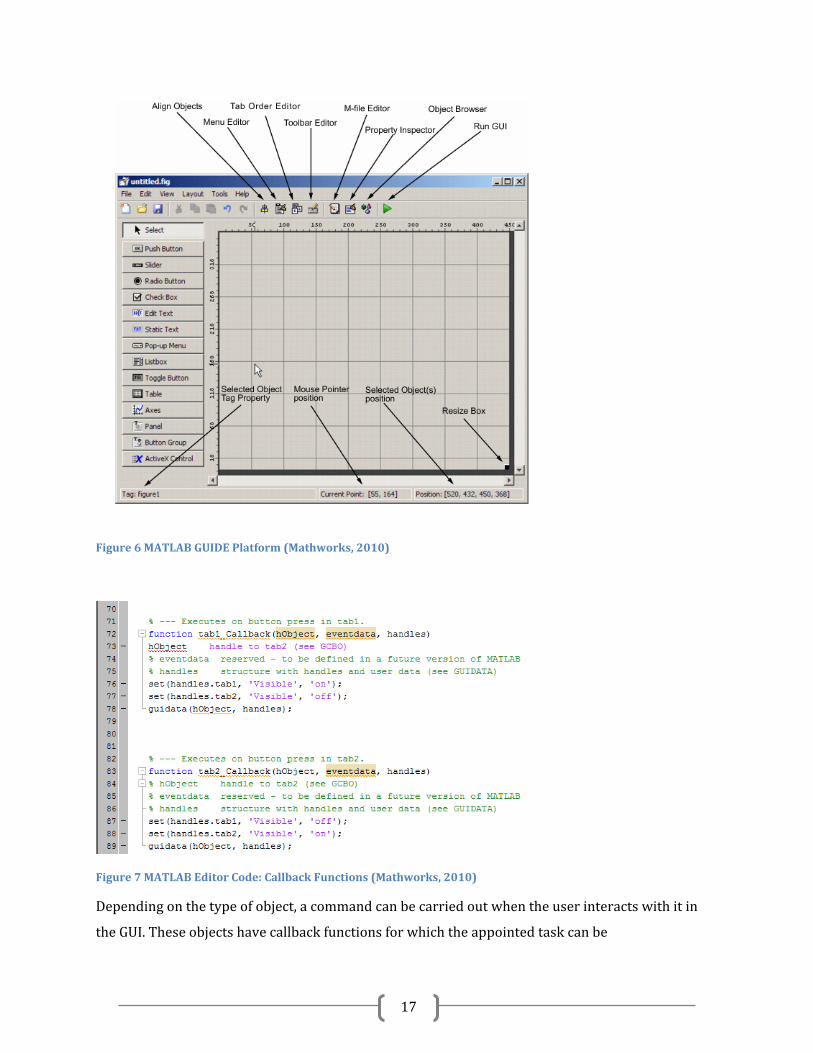
Figure 7 MATLAB Editor Code: Callback Functions (Mathworks, 2010)
Depending on the type of object, a command can be carried out when the user interacts with it in
the GUI. These objects have callback functions for which the appointed task can be

18
programmatically dictated through the code. For example, when a user clicks a button in the GUI, a
task is performed. However, this would not be the case for a static text object. Below is a table of
the various objects that were used in the design of our program, a brief description, and whether
callback functions were available for them.
Table 3 MATLAB GUIDE Objects used in Program
Objects Description Callback
Function (Yes or
No)
Static Text Creates a text box to display
instructions to the user
No
Button Performs task when the user clicks on
object
Yes
Edit Text An editable text box that records user
input
Yes
Check Box Allows the user to choose multiple
predefined options by clicking
Yes
Axes Allows for graph creation within GUI
inside specified bounds
Yes
Dropdown Menu User chooses one of multiple
predefined options
Yes
Values directly inputted by the user, as well as choices made by the user through predefined objects
such as check boxes and dropdown menus, are able to be stored as variables. Variables can have
the exact value entered or be assigned something entirely different according to the purpose of the
program. For example, text options within drop down menus can be assigned numerical values for
computation purposes.
19
Outputs can be programmed into the GUI in several different ways, through the use of various
objects. Each object has its own object handles, which allow the coder to control its properties
within the code. Handles can be used to manipulate objects to display a specified output.
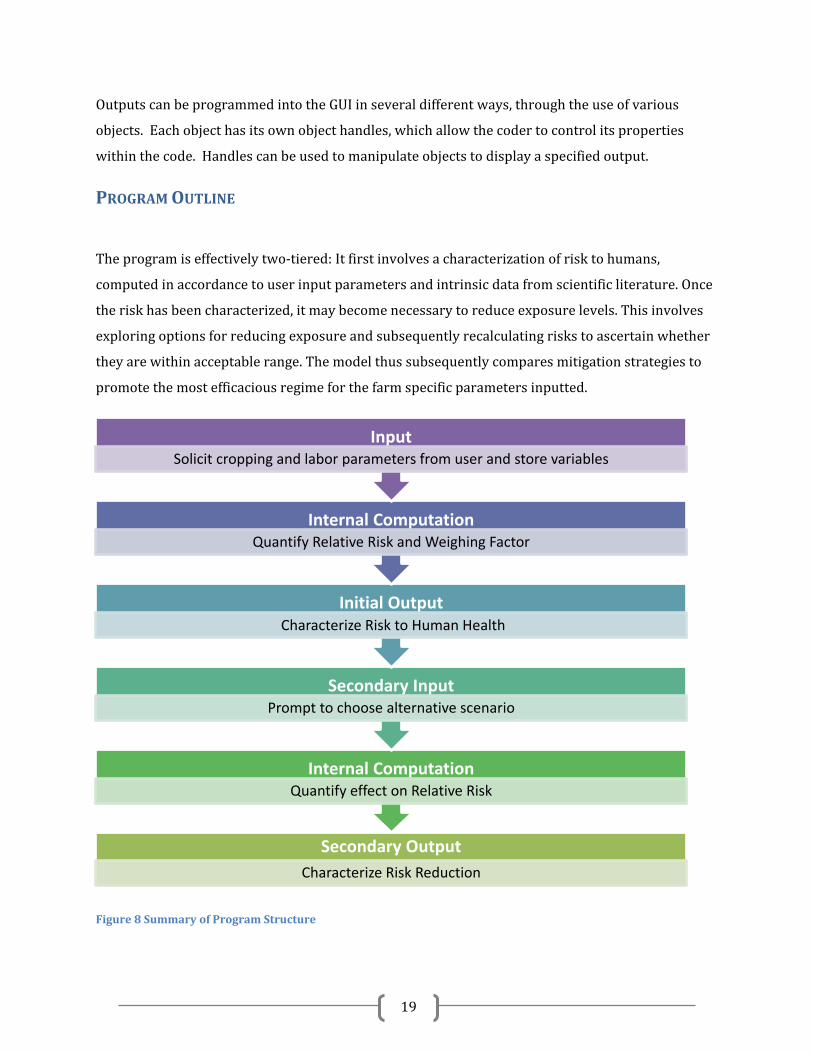
PROGRAM OUTLINE
The program is effectively two-tiered: It first involves a characterization of risk to humans,
computed in accordance to user input parameters and intrinsic data from scientific literature. Once
the risk has been characterized, it may become necessary to reduce exposure levels. This involves
exploring options for reducing exposure and subsequently recalculating risks to ascertain whether
they are within acceptable range. The model thus subsequently compares mitigation strategies to
promote the most efficacious regime for the farm specific parameters inputted.
Figure 8 Summary of Program Structure
Secondary Output Characterize Risk Reduction
Internal Computation Quantify effect on Relative Risk
Secondary Input Prompt to choose alternative scenario
Initial Output Characterize Risk to Human Health
Internal Computation Quantify Relative Risk and Weighing Factor
Input Solicit cropping and labor parameters from user and store variables

20
TARGET USER
The target user dictates how the system should be developed. While ultimately, it is preferred to
develop a system that can be utilized directly by farmers to empower and provide educational
assistance, in many rural regions of India farmers or farming organizations may not speak English,
be literate, or may be unfamiliar with or lack access to the technology. This poses a great
restriction to the usability of our program within the region specified. Certain issues can be
resolved to a point, then, by considering the use of NGO’s and government agencies as
intermediaries through which farmers could have access to the benefits of the program without
having to directly use the software. In this way, policy could be directly targeted.
In addition, the program is also targeted towards larger farm owners, who may be in a different
income bracket than the small farmers and could have access to better resources, including
technology and education. Although large farms make up a small percentage of farmers, the
percentage of overall agricultural area operated through them is substantial.
INTERFACE DESIGN
Certain parameters had to be considered when creating the actual interface in order to optimize the
usability of the program. Namely, the program had to be easily understood by the user without
assistance. Aspects such as ease of navigation and a professional look were heavily considered.

21
Figure 9 User Interface Parameters
DATA COLLECTION
The program was designed to solicit farm-specific cropping parameters from the user. (See Figure
10 below) These parameters are necessary to the health risk computation and entered through the
use of several avenues available in the MATLAB GUIDE platform, each listed in Table 4 below.
Figure 10 User Input Parameters for Risk Computation
Usability
Clarity • Font Size • Instructions
Navigation • Tabs • ‘Next’ Button
Aesthetics • Professional
Risk Computation
Formulation Type
Pesticide Used
Pesticide Application
Rate
Area of Application
Labour Profile
Application Method

22
Table 4, Summary of Relevant Parameters
Parameter Value Input Method
Pesticide Utilized Pre-calculated Weighted Value
Dropdown Menu
Application Equipment Pre-calculated Weighted Value
Dropdown Menu
Application Rate g or mL per hectare User Entered Text
Formulation of Pesticide Pre-calculated Weighted Value
Dropdown Menu
Treatment Area Expressed in hectares User Entered Text
Use of Personal Protective Equipment (PPE)
Pre-calculated Weighted Value
Check boxes with Graphics
Number of Pesticide Operators
Number of People User Entered Text
ASSESSING HUMAN HEALTH RISK
The methodology for the computation of human health risk is inspired by indices reported in the
literature (QPRI, 2008) (Garreyn, 2003) (NAIS, 2003) (POEM, 2003). The potential of the pesticides
to exert negative influences upon health can be defined as ‘risk’. The risk incurred by spray
operators during the application of a pesticide is characterized both by the intrinsic risk potential of
the chemical agent to induce adverse effects, and the magnitude of exposure opportunities. It can be
mathematically described as:

23
Equation 1, Risk Described
𝐓𝐨𝐭𝐚𝐥 𝐑𝐢𝐬𝐤 = (𝐈𝐧𝐭𝐫𝐢𝐧𝐬𝐢𝐜 𝐑𝐢𝐬𝐤) ∗ (𝐌𝐚𝐠𝐧𝐢𝐭𝐮𝐝𝐞 𝐨𝐟 𝐄𝐱𝐩𝐨𝐬𝐮𝐫𝐞)
The potential for the development of adverse health effects consequential to the occupational
exposure to pesticide, otherwise defined as ‘risk’, depends on several factors, but largely is dictated
by the: (a) types of pesticides handled, (b) frequency and duration of application and (c) intensity of
application (Fenske, 2003). The intrinsic risk is therefore defined according to the inherent
toxicology of the pesticide handled and the magnitude of exposure- thus described according to the
frequency, duration and intensity of exposure. Expressed therefore relevant to the context of
occupational pesticide exposure, risk is therefore characterized as:
Equation 2, Human Health Risk
𝐇𝐞𝐚𝐥𝐭𝐡 𝐑𝐢𝐬𝐤 =(𝐓𝐨𝐱𝐢𝐜𝐨𝐥𝐨𝐠𝐢𝐜𝐚𝐥𝐑𝐢𝐬𝐤) ∗ (𝐄𝐱𝐩𝐨𝐬𝐮𝐫𝐞 𝐑𝐢𝐬𝐤)
(𝐒𝐜𝐚𝐥𝐢𝐧𝐠 𝐅𝐚𝐜𝐭𝐨𝐫)
Whereby:
(ToxicologicalRisk) = The intrinsic toxicity of the pesticide
(Exposure Risk)= f (WapplicationType, WApplication Rate, WMitigation Coefficient)
o (WApplicationType) =Weighing factor to consider the application method o (WApplicationRate)= Weighing factor to consider the rate of application o WMitigation Coefficient= Weighing factor to consider use of mitigation
strategies, for the initial risk computation it is assigned a value of 1.
(Scaling Factor)= Factor to reduce the risk index to a value relatable to the user
INTRINSIC TOXICITY
The intrinsic toxicity of the pesticide is defined according to a toxicological risk index (TRI). Various
toxicological risk indicators have been developed and are described in the literature- most
relevantly to the application herein described is: The Globally Harmonized System of Classification
24
and Labeling of Chemicals (GHS, 2005), United States Environmental Protection Agency (EPA,
2005)
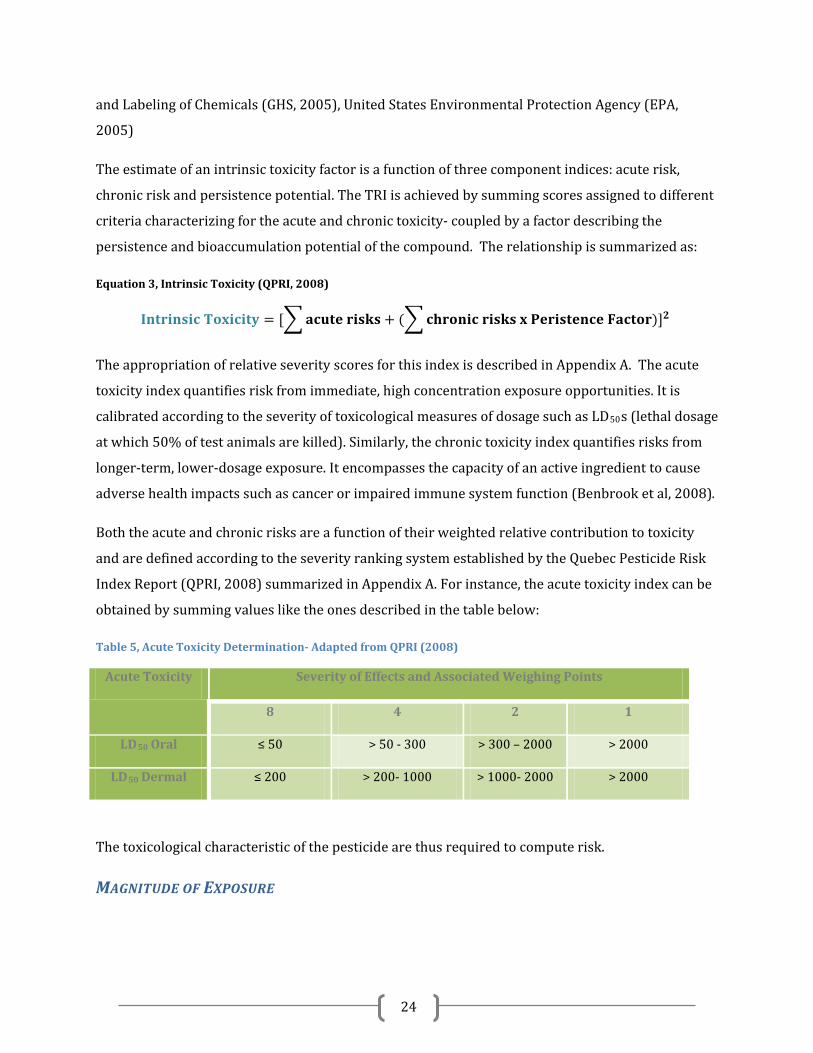
The estimate of an intrinsic toxicity factor is a function of three component indices: acute risk,
chronic risk and persistence potential. The TRI is achieved by summing scores assigned to different
criteria characterizing for the acute and chronic toxicity- coupled by a factor describing the
persistence and bioaccumulation potential of the compound. The relationship is summarized as:
Equation 3, Intrinsic Toxicity (QPRI, 2008)
𝐈𝐧𝐭𝐫𝐢𝐧𝐬𝐢𝐜 𝐓𝐨𝐱𝐢𝐜𝐢𝐭𝐲 = [�𝐚𝐜𝐮𝐭𝐞 𝐫𝐢𝐬𝐤𝐬 + (�𝐜𝐡𝐫𝐨𝐧𝐢𝐜 𝐫𝐢𝐬𝐤𝐬 𝐱 𝐏𝐞𝐫𝐢𝐬𝐭𝐞𝐧𝐜𝐞 𝐅𝐚𝐜𝐭𝐨𝐫)]𝟐
The appropriation of relative severity scores for this index is described in Appendix A. The acute
toxicity index quantifies risk from immediate, high concentration exposure opportunities. It is
calibrated according to the severity of toxicological measures of dosage such as LD50s (lethal dosage
at which 50% of test animals are killed). Similarly, the chronic toxicity index quantifies risks from
longer-term, lower-dosage exposure. It encompasses the capacity of an active ingredient to cause
adverse health impacts such as cancer or impaired immune system function (Benbrook et al, 2008).
Both the acute and chronic risks are a function of their weighted relative contribution to toxicity
and are defined according to the severity ranking system established by the Quebec Pesticide Risk
Index Report (QPRI, 2008) summarized in Appendix A. For instance, the acute toxicity index can be
obtained by summing values like the ones described in the table below:
Table 5, Acute Toxicity Determination- Adapted from QPRI (2008)
Acute Toxicity Severity of Effects and Associated Weighing Points
8 4 2 1
LD50 Oral ≤ 50 > 50 - 300 > 300 – 2000 > 2000
LD50 Dermal ≤ 200 > 200- 1000 > 1000- 2000 > 2000
The toxicological characteristic of the pesticide are thus required to compute risk.
MAGNITUDE OF EXPOSURE
25
Intrinsic toxicity factors alone do not accurately describe risk, for risk is equally influenced by the
magnitude of exposure opportunities. The magnitude of exposure is characterized according to
frequency, intensity and duration of exposure. Consequentially, the nature of the occupational
activity in which an individual engages, dictates the risk he/she is subject to. The frequency and
duration of the application activity are dictated according to factors such as the size of land treated,
the number of workers involved, and the method of application. Similarly, the intensity of exposure
opportunities depends on factors such as the concentration and application rate (Garcia & Almeida,
1991). Amongst the factors described, the method of application is the most significantly
representative of risk and accordingly, a weighing factor must is assigned for inclusion of this
mechanism within the risk computation framework.
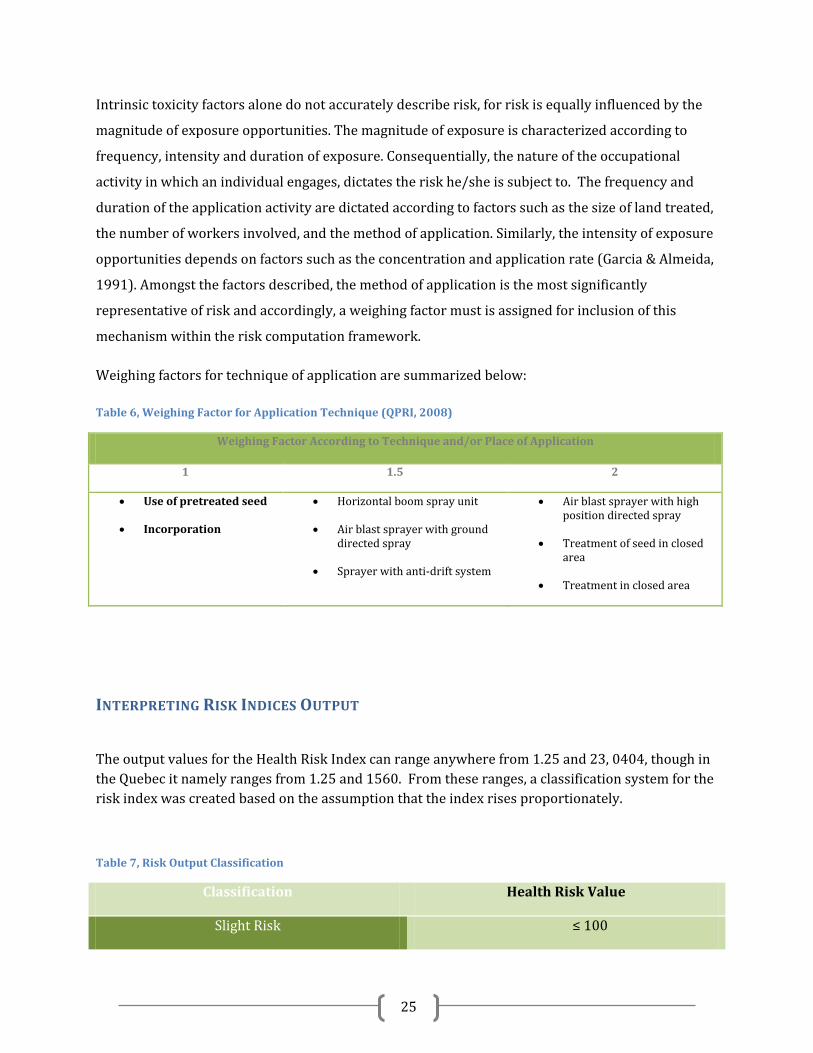
Weighing factors for technique of application are summarized below:
Table 6, Weighing Factor for Application Technique (QPRI, 2008)
Weighing Factor According to Technique and/or Place of Application
1 1.5 2
• Use of pretreated seed
• Incorporation
• Horizontal boom spray unit
• Air blast sprayer with ground directed spray
• Sprayer with anti-drift system
• Air blast sprayer with high position directed spray
• Treatment of seed in closed area
• Treatment in closed area
INTERPRETING RISK INDICES OUTPUT
The output values for the Health Risk Index can range anywhere from 1.25 and 23, 0404, though in the Quebec it namely ranges from 1.25 and 1560. From these ranges, a classification system for the risk index was created based on the assumption that the index rises proportionately.
Table 7, Risk Output Classification
Classification Health Risk Value
Slight Risk ≤ 100

26
Moderate Risk ≥ 101 and ≤500
Strong Risk ≥ 501 and ≤1000
Severe Risk ≥ 1001
ASSESSING EFFICACY OF MITIGATION STRATEGIES
In brief, safety measures should act either to control toxicity or reduce opportunities for exposure.
Strategies employed to mitigate occupational exposure are often expressed as a hierarchy,
emphasizing the pivotal significance of engineering and administrative controls, and as a last resort,
the use of personal protective equipment (Franklin & Worgan, 2005). The matter of administrative
controls exceeds the scope of the development of the expert-system and accordingly is addressed
exclusively in the proceeding discussion of implementation potential. The efficacy of engineering
controls is determined by their potential to reduce interactions between workers and pesticides.
For instance, mild reconfiguring of the design of a conventional pesticide sprayer can significantly
redefine the risk scenario. The simple switching of the spraying unit from the front, to the back of
the worker, coupled by replacing the traditional lance by a longer one reduced the potential dermal
exposure (PDE) of workers by 93.3% (Tunstall et al, 1961).
As no health risk indices were identified in the review of the literature that considered the
efficiency of mitigation strategies, it became necessary to develop a means to integrate these factors
within the aforedescribed computation of risk. The following section describes the methodology
employed for integrating an adjustment factor to account for the efficacy of mitigation strategies to
reduce risk. Refinement in this respect includes introducing models of occupational exposure and
results from engineering control field trials into the computation of risk. The efficiency of a given
risk reduction strategy is defined as follows:
Equation 4, Efficiency of Mitigation Strategy
𝐄𝐟𝐟𝐢𝐜𝐢𝐞𝐧𝐜𝐲 𝐨𝐟 𝐌𝐢𝐭𝐢𝐠𝐚𝐭𝐢𝐨𝐧 𝐒𝐭𝐫𝐚𝐭𝐞𝐠𝐲 = �𝐇𝐑𝟎 − 𝐇𝐑𝐦
𝐇𝐑𝟎� ∗ 𝟏𝟎𝟎
Whereby

27
HR0 = Health Risk for current field practices without mitigation strategies
HRm = Health Risk considering application of mitigation strategy
A modified risk index HRm must therefore be developed. The methodology for achieving the index
is similar to the one described above.
Equation 5, Modified Health Risk
𝐇𝐞𝐚𝐥𝐭𝐡 𝐑𝐢𝐬𝐤 =(𝐓𝐨𝐱𝐢𝐜𝐨𝐥𝐨𝐠𝐢𝐜𝐚𝐥𝐑𝐢𝐬𝐤) ∗ (𝐌𝐨𝐝𝐢𝐟𝐢𝐞𝐝 𝐄𝐱𝐩𝐨𝐬𝐮𝐫𝐞 𝐑𝐢𝐬𝐤)
(𝐒𝐜𝐚𝐥𝐢𝐧𝐠 𝐅𝐚𝐜𝐭𝐨𝐫)
Whereby the parameters are the same as those described above with exception to:
(Modified Exposure Risk)= Factor considering exposure including mitigation strategies
The exposure during specific handling events can be modified by several important factors,
described as follows: (Fenske et al., 2003)
• Type of equipment used
• Formulation and packaging
• Environmental conditions
• Personal protective equipment
• Hygienic behavior
• Duration of activity
Amongst the factors identified, the type of equipment used and the duration of the activity are
managed by engineering controls. No influence can be exerted upon environmental factors, as such
they are not considered further. Formulation and packaging, as well as hygienic behavior can be
modified by the implementation of legislation and education and accordingly exceeds the scope of
expert-system development.
Mitigating the extent of occupational exposure (i.e. reducing the amount of chemicals entering the
body) depends largely upon:
• Reducing the amount of product or dilutes spray entering the breathing zone

28
• Reducing the amount of product or dilute spray contaminating the external surface of the
worker.
In the former, the amount of pesticide (concentrate or dilute spray) inspired into the lungs is a
function of the particle size, amount entering the breathing zone, and amount inhaled:
Equation 6, Inhalation Exposure
𝐈𝐧𝐡𝐚𝐥𝐚𝐭𝐢𝐨𝐧 𝐄𝐱𝐩𝐨𝐬𝐮𝐫𝐞 = 𝐟 (𝐀𝐦𝐨𝐮𝐧𝐭 𝐄𝐧𝐭𝐞𝐫𝐢𝐧𝐠 𝐁𝐫𝐞𝐚𝐭𝐡𝐢𝐧𝐠 𝐙𝐨𝐧𝐞,𝐀𝐦𝐨𝐮𝐧𝐭 𝐈𝐧𝐡𝐚𝐥𝐞𝐝,𝐃𝐫𝐨𝐩𝐥𝐞𝐭 𝐒𝐢𝐳𝐞)
While not all the pesticide entering the breathing zone will be inhaled and furthermore, only a
fraction of the inhaled portion will be respired into the lungs (POEM, 2003), quantifying inhalation
exposure depends on the droplet size entering the breathing zone. As these parameters have not
yet been characterized, it must therefore be assumed that all of the chemical entering the breathing
zone will be relevantly absorbed into the blood stream. In this respect, the inhalation exposure is
defined very similarly to that of dermal exposure. Given the gaps in the literature, appropriating
mitigation strategies for the reduction of inhalation exposure will be estimated as being equivalent
to that for mitigating the amount of dermal absorption. These exposures are therefore reduced
either by implementing personal protective equipment or engineering controls. A summary of
relevant efficacy studies is provided in the table below and the methodology for incorporating these
means into the health risk index is described in the proceeding sections.
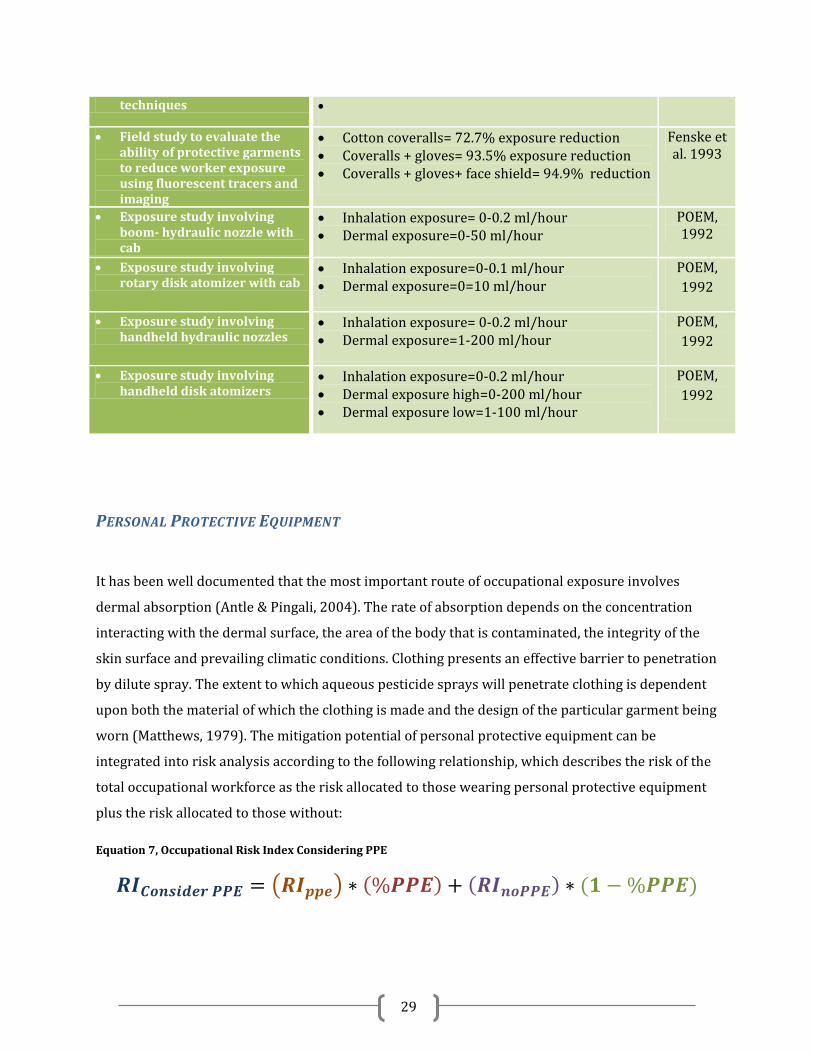
Table 8, Summary of Representative Literature on Efficacy of Various Controls
Summary of Literature on Efficacy of Engineering Controls Mitigation Strategy Conclusions& Comments Author/
Year • Modification to sprayer: V-
Shaped Boom design which offers protection by distance
• Dermal exposure: 1864.7 166.8 mL/hr • Controlled effects of wind • Mean efficiency: 91.0% in the control of worker
drenching • Work more comfortable, lighter and rapid
Neto et al. 1992
• Knapsack sprayer from front to back of body
• Dermal exposure reduced by 95% Tunstall & Matthews, 1965
• Lengthening the spraying lance
• Switching nozzle position to back of sprayer’s body
• Potential dermal exposure: reduced by 35% • Attaching the lance to back of tank reduced it by 98%
Neto et al.,1998
• Compare traditional handheld spray equipment to novel spray application
• Dermal exposure reduced by 20, 60 and 8 times with novel spray techniques relative standard spray gun.
Nuyttens et al. 2008
29
techniques •
• Field study to evaluate the ability of protective garments to reduce worker exposure using fluorescent tracers and imaging
• Cotton coveralls= 72.7% exposure reduction • Coveralls + gloves= 93.5% exposure reduction • Coveralls + gloves+ face shield= 94.9% reduction
Fenske et al. 1993
• Exposure study involving boom- hydraulic nozzle with cab
• Inhalation exposure= 0-0.2 ml/hour • Dermal exposure=0-50 ml/hour
POEM, 1992
• Exposure study involving rotary disk atomizer with cab
• Inhalation exposure=0-0.1 ml/hour • Dermal exposure=0=10 ml/hour
POEM, 1992
• Exposure study involving handheld hydraulic nozzles
• Inhalation exposure= 0-0.2 ml/hour • Dermal exposure=1-200 ml/hour
POEM, 1992
• Exposure study involving handheld disk atomizers
• Inhalation exposure=0-0.2 ml/hour • Dermal exposure high=0-200 ml/hour • Dermal exposure low=1-100 ml/hour
POEM, 1992
PERSONAL PROTECTIVE EQUIPMENT
It has been well documented that the most important route of occupational exposure involves
dermal absorption (Antle & Pingali, 2004). The rate of absorption depends on the concentration
interacting with the dermal surface, the area of the body that is contaminated, the integrity of the
skin surface and prevailing climatic conditions. Clothing presents an effective barrier to penetration
by dilute spray. The extent to which aqueous pesticide sprays will penetrate clothing is dependent
upon both the material of which the clothing is made and the design of the particular garment being
worn (Matthews, 1979). The mitigation potential of personal protective equipment can be
integrated into risk analysis according to the following relationship, which describes the risk of the
total occupational workforce as the risk allocated to those wearing personal protective equipment
plus the risk allocated to those without:
Equation 7, Occupational Risk Index Considering PPE
𝑹𝑰𝑪𝒐𝒏𝒔𝒊𝒅𝒆𝒓 𝑷𝑷𝑬 = �𝑹𝑰𝒑𝒑𝒆� ∗ (%𝑷𝑷𝑬) + (𝑹𝑰𝒏𝒐𝑷𝑷𝑬) ∗ (𝟏 − %𝑷𝑷𝑬)

30
𝑅𝐼𝐴𝑃𝑃𝐿𝐼𝐶𝐴𝑇𝑂𝑅= Applicator risk index with consideration of personal protective equipment
(RIppe)= Risk index coefficient for a specified personal protective equipment
(%𝑃𝑃𝐸𝑘)= Percentage of labor group wearing personal protective equipment
(𝑅𝐼𝑛𝑜𝑃𝑃𝐸)= Risk index coefficient describing absence of personal protective equipment
(%𝑃𝑃𝐸) = Percentage of labor group not wearing personal protective equipment
The availability of compliance data is typically scarce and when available, may often not be
meaningfully interpreted for the application herein described. The risk index is thus
computed upon the assumption that personal protective equipment is worn universally by
all workers. The equation is thus refined to:
𝑹𝑰𝑶𝒑𝒆𝒓𝒂𝒕𝒐𝒓 = �𝑹𝑰𝒑𝒑𝒆� ∗ (%𝟏𝟎𝟎 𝑷𝑷𝑬)
Consequential to the above described assumption, the risk derived by this method will
overestimate the mitigation potential and therefore represents the maximum mitigation
efficacy. We propose employing the following relationship inspired by the equations described by
Equation 8, Operator Exposure
𝐑𝐢𝐬𝐤 𝐎𝐩𝐞𝐫𝐚𝐭𝐨𝐫 = (𝐑𝐦𝐢𝐱𝐥𝐨𝐚𝐝 + 𝐑𝐚𝐩𝐩𝐥𝐢𝐜𝐚𝐭𝐢𝐨𝐧) ∗𝐀𝐑𝐁𝐖
∗ 𝐀𝐫𝐞𝐚𝐭𝐫𝐞𝐚𝐭𝐞𝐝
𝐑𝐦𝐢𝐱𝐥𝐨𝐚𝐝 = [(𝐏𝐏𝐄𝐢 ∗ 𝐀𝐛𝐢) + (𝐏𝐏𝐄𝐡𝐚𝐧𝐝 ∗ 𝐀𝐛𝐝)
𝐑𝐚𝐩𝐩𝐥𝐢𝐜𝐚𝐭𝐢𝐨𝐧=[(𝐏𝐏𝐄𝐢 ∗ 𝐀𝐛𝐢) + (𝐏𝐏𝐄𝐡𝐚𝐧𝐝 ∗ 𝐀𝐛𝐝𝐞) + (𝐏𝐏𝐄𝐛𝐨𝐝𝐲 ∗ 𝐀𝐛𝐝𝐞𝐫𝐦𝐚𝐥)
Whereby
• Ai,AdAb are coefficients defining the differential in absorption between the skin and the protective equipment
• PPEi PPEi PPEi are values defining whether or not personal protective equipment was worn. Wearing was assigned a value=1, Not wearing was assigned a value=2
The 𝐑𝐦𝐢𝐱𝐥𝐨𝐚𝐝 & 𝐑𝐚𝐩𝐩𝐥𝐢𝐜𝐚𝐭𝐢𝐨𝐧 differ only the values of absorption given that mixing and loading applications typically involve concentrates whereas application involves dilute sprays. Representative values of reduction coefficients for personal protective equipment during mixing/loading and application phases.
31
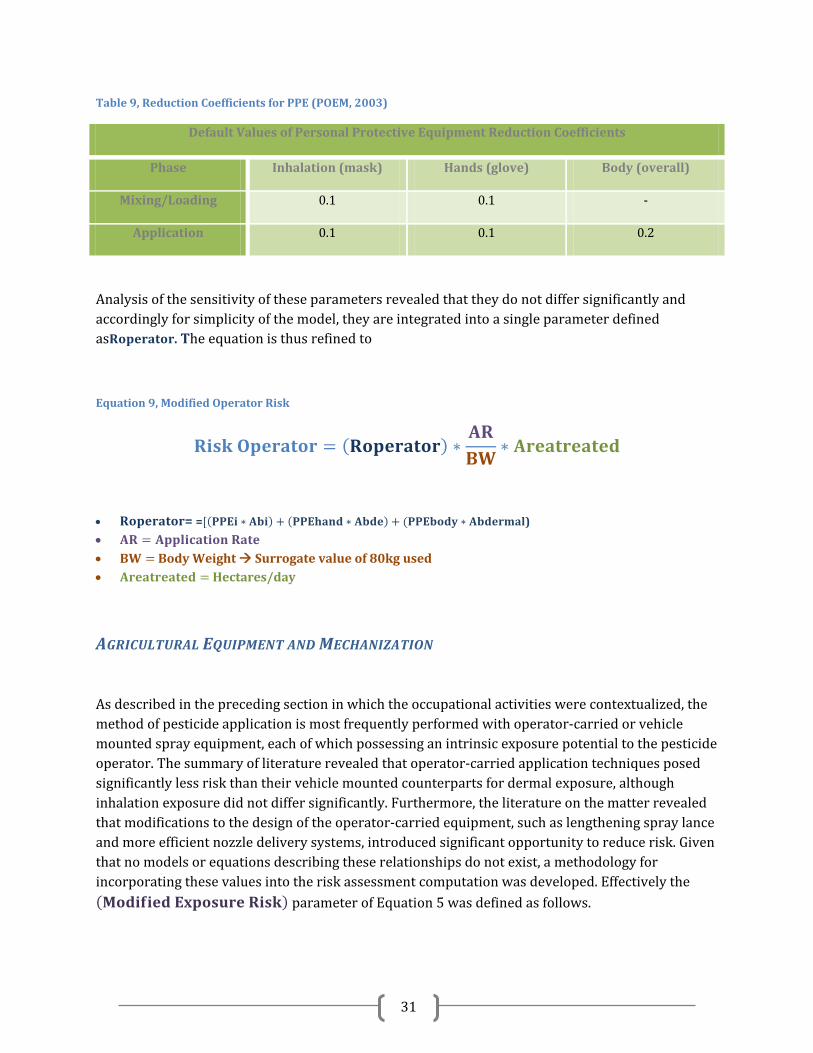
Table 9, Reduction Coefficients for PPE (POEM, 2003)
Default Values of Personal Protective Equipment Reduction Coefficients
Phase Inhalation (mask) Hands (glove) Body (overall)
Mixing/Loading 0.1 0.1 -
Application 0.1 0.1 0.2
Analysis of the sensitivity of these parameters revealed that they do not differ significantly and accordingly for simplicity of the model, they are integrated into a single parameter defined as𝐑𝐨𝐩𝐞𝐫𝐚𝐭𝐨𝐫. The equation is thus refined to
Equation 9, Modified Operator Risk
𝐑𝐢𝐬𝐤 𝐎𝐩𝐞𝐫𝐚𝐭𝐨𝐫 = (𝐑𝐨𝐩𝐞𝐫𝐚𝐭𝐨𝐫) ∗𝐀𝐑𝐁𝐖
∗ 𝐀𝐫𝐞𝐚𝐭𝐫𝐞𝐚𝐭𝐞𝐝
• 𝐑𝐨𝐩𝐞𝐫𝐚𝐭𝐨𝐫= =[(𝐏𝐏𝐄𝐢 ∗ 𝐀𝐛𝐢) + (𝐏𝐏𝐄𝐡𝐚𝐧𝐝 ∗ 𝐀𝐛𝐝𝐞) + (𝐏𝐏𝐄𝐛𝐨𝐝𝐲 ∗ 𝐀𝐛𝐝𝐞𝐫𝐦𝐚𝐥) • 𝐀𝐑 = 𝐀𝐩𝐩𝐥𝐢𝐜𝐚𝐭𝐢𝐨𝐧 𝐑𝐚𝐭𝐞 • 𝐁𝐖 = Body Weight Surrogate value of 80kg used • 𝐀𝐫𝐞𝐚𝐭𝐫𝐞𝐚𝐭𝐞𝐝 = Hectares/day
AGRICULTURAL EQUIPMENT AND MECHANIZATION
As described in the preceding section in which the occupational activities were contextualized, the method of pesticide application is most frequently performed with operator-carried or vehicle mounted spray equipment, each of which possessing an intrinsic exposure potential to the pesticide operator. The summary of literature revealed that operator-carried application techniques posed significantly less risk than their vehicle mounted counterparts for dermal exposure, although inhalation exposure did not differ significantly. Furthermore, the literature on the matter revealed that modifications to the design of the operator-carried equipment, such as lengthening spray lance and more efficient nozzle delivery systems, introduced significant opportunity to reduce risk. Given that no models or equations describing these relationships do not exist, a methodology for incorporating these values into the risk assessment computation was developed. Effectively the (𝐌𝐨𝐝𝐢𝐟𝐢𝐞𝐝 𝐄𝐱𝐩𝐨𝐬𝐮𝐫𝐞 𝐑𝐢𝐬𝐤) parameter of Equation 5 was defined as follows.

32
Equation 10, Mitigation of Engineering Controls
(𝐌𝐢𝐭𝐢𝐠𝐚𝐭𝐢𝐨𝐧 𝐊 ) = (%𝐌𝐢𝐭𝐢𝐠𝐚𝐭𝐢𝐨𝐧 𝐏𝐨𝐭𝐞𝐧𝐭𝐢𝐚𝐥) ∗ (% 𝐨𝐟 𝐓𝐨𝐭𝐚𝐥 𝐓𝐢𝐦𝐞)
Whereby
(%𝐌𝐢𝐭𝐢𝐠𝐚𝐭𝐢𝐨𝐧 𝐏𝐨𝐭𝐞𝐧𝐭𝐢𝐚𝐥)= 𝐓𝐡𝐞 𝐩𝐞𝐫𝐜𝐞𝐧𝐭 𝐫𝐞𝐝𝐮𝐜𝐭𝐢𝐨𝐧 𝐢𝐧 𝐨𝐩𝐞𝐫𝐚𝐭𝐨𝐫 𝐞𝐱𝐩𝐨𝐬𝐮𝐫𝐞 𝐝𝐮𝐞 𝐭𝐨 𝐜𝐨𝐧𝐭𝐫𝐨𝐥, 𝐫𝐞𝐬𝐮𝐥𝐭𝐬 𝐝𝐞𝐫𝐢𝐯𝐞𝐝 𝐟𝐫𝐨𝐦
(% 𝐨𝐟 𝐓𝐨𝐭𝐚𝐥 𝐓𝐢𝐦𝐞)= The parentage of the total occupational time/day the activity for which control was introduced occupies
In this case, the (𝐌𝐨𝐝𝐢𝐟𝐢𝐞𝐝 𝐄𝐱𝐩𝐨𝐬𝐮𝐫𝐞 𝐑𝐢𝐬𝐤) parameter of Equation 5 is therefore defined as follows.
(𝐌𝐨𝐝𝐢𝐟𝐢𝐞𝐝 𝐄𝐱𝐩𝐨𝐬𝐮𝐫𝐞 𝐑𝐢𝐬𝐤) = (𝐓𝐑𝐨) ∗ (𝟏 −𝐌𝐢𝐭𝐢𝐠𝐚𝐭𝐢𝐨𝐧 𝐊)
Whereby
(TRo)= Risk without consideration of mitigation strategies
For instance, a closed-cab mitigation strategy that reduces operator exposure by 95%, in which the
time occupied performing the activity for which the mitigation strategy was employed is 30% of the
total work day, yield a Mitigation K coefficient = (95%)*(30)= 28.5%. implying therefore that the
strategy reduced exposure by 28.5%. Integrating this value into the risk reduction computation
implies that 71.5% of the initial exposure remains.
FINAL DESIGN
The end product incorporates the design criteria into one program able to calculate a relative health risk as well as provide mitigation strategies for users. The final design incorporates the use of tabs through which users can navigate four different sections shown in the figures below. The first two panels solicit information from the user, the third presents the calculated risk outcome, and the fourth allows for the exploration of mitigation strategies.

33
Figure 10, Health Risk Calculator: Field Profile
Figure 11, Health Risk Calculator: Labour Profile

34
Figure 12, Health Risk Calculator: Risk Outcome
Figure 13, Health Risk Calculator: Alternative Scenarios

35
IMPLEMENTATION
Real world implementation of this project requires further work be done in order to perfect the end
product and make it a viable method for risk assessment by farmers in the Indian state of Punjab.
Firstly the program would have to be compiled into an independent program which did not rely on
the MATLAB software to run. This is possible through the use of MATLAB programing toolboxes
through which creation an .exe program is feasible. Once independent of MATLAB, the possibility
for distribution of this program would greatly increase. In addition, usage would not be hindered
by the requirement of already having MATLAB installed, which is not viable considering its limited
use and expense.
A user manual is also necessary that would further explore risk assessment including topics such as
more detailed instructions to the use of the software, background on how calculations are made,
financial advantages of health risk reduction, and educational tools as to the severity of exposure to
pesticides on human health.
The next step would be to translate the program into a more suitable language, such as Punjabi or
Hindi. Further considerations of socio-economic dilemmas may see changes made to the interface
as well to better benefit the target audiences. This could potentially be accomplished with the help
of the Punjab Agricultural University, a world renowned university in its field through collaborative
efforts. The location and expertise of this university would greatly aid in the objective of this
program as a viable tool for mitigation of pesticide exposure.
With these things accomplished, distribution of the program could take place on a wider scale.
NGO’s could play a role in making the program available to marginal farmers who may have less
access to technology. By involving those involved in policy making, the larger goal of promoting
best management practices could be more attainable.
The cost of implementation would be minimal as once the program is independently executable, it
could be made available online for free as open source software. In this manner, improvements
could be made by a larger international community, as well as be redefined for use elsewhere.
LIMITATIONS OF THE MODEL

36
NO CONSIDERATION OF FINANCIAL AND ENVIRONMENTAL PARAMETERS
Although environmental consequences do not constitute the parameter of emphasis for
optimization in the proposed software, consideration of environmental risk factors constitutes an
important realm when developing a health risk mitigation strategy. That is, an optimal pest
management strategy is one that mitigates occupational pesticide exposures while maintaining
ecological integrity. Humans do not exist as a dichotomy with the environment but rather, exist as
permeable members to it. Environmental contamination threatens the integrity of human health
and accordingly, a strategy should not be adopted if it threatens to produce such results. This is true
also of financial risk. The ideal system is one in which the financial, environmental, and financial
risks are mutually optimized for mitigation. Indeed, various environmental and financial risk
assessment models have been developed and the framework for their application within the expert
system could be done in accordance to the methodology described for human health risk.
Furthermore, the programming code necessary to achieve this adoption could readily be adapted
within the existing software system.
LIMITATIONS IN ASSESSING TOXICOLOGY
Another issue of the system involves the fact that currently, no consensus exists in the literature on
the most effective method to measure health impacts from agricultural chemical applications. While
the literature recognizes the potential of these compounds to pose discernable impact to human
health, no agreed upon methodology exists to measure this impact (Greitens & Day, 2007).
Accordingly, the toxicological risk factors and the appropriation of severity scores may not
accurately reflect the true risk. Furthermore, while traditionally pesticide risk assessment models
have been developed on single products, it is increasingly recognized that interactions between
multiple pesticides may pose synergistic consequences. Therefore, risk assessment of pesticides
should more accurately be adapted to consider the toxicology potential of mixtures of chemical
compounds. Furthermore, there is no factor attributed to consider the composition of the
population. The risk for sensitive population groups contributes, as a default, for 5% to the total
risk (Hemmen, 2006). There is no factor in the model to consider either pediatric or gender-
relevant susceptibilities. By applying weighting coefficients to the actual/local parameters that
may affect the likelihood of exposure of the sensitive/susceptible population of susceptible subjects

37
or subgroups will be taken into account. Finally, further in this respect involves the fact that the
efficiency of risk mitigation strategies are based heavily on empirical evidence from field studies.
When such studies are conducted in regions other than the one for which the results are
immediately described, extending their conclusions to the context of Punjabi agriculture may not be
necessarily relevant.
MITIGATING OF INTRINSIC TOXICITY NOT CONSIDERED
While the expert-system herein described principally involved mitigation strategies that sought to
reduce risk by reducing the exposure of the operator to the pesticides, risk could also have been
addressed by adoption of other mitigation strategies involving lesser intrinsic toxicity values-
namely, these involve biological agricultural systems of which organic agriculture and integrated
pest management (IPM) are the most important means. Unfortunately no studies exist in the
literature that characterizes the potential of organic agricultural systems and IPM regimes to
mitigate the intrinsic and exposure risks of pesticide usage. Accordingly, the potential of such
strategies to reduce operator risk could not be evaluated within the scope of the project. However,
very intuitively these systems bear a significantly lesser intrinsic risk and are worthwhile
considering. The following offers a discussion on the matter.
Biological agriculture involves cultivation that is in abidance to production standards that prohibit
the use of synthetic insecticides and herbicides, human waste, food additives, hormones, antibiotics
and may sometimes exclude the cultivation of genetically modified crops. Amongst biological
cropping systems, IPM systems are those favoring biological pest control techniques whose
intrinsic toxicity is lesser than those of conventional synthetic means. IPM systems promote
methods that disrupt pest cycles, including strategies such as insect predators, and biopesticides.
The primary criticism, for which biological agricultural systems have been subject, involves their
ability to adequately meet population food requirements. While concerns of compromised
efficiency and yields are common criticisms of such systems, these claims may not necessarily be
substantiated by results from field studies and scientific literature. Literature on the matter has
produced mixed results. A comprehensive twenty-two year study conducted by the Rodale Institute
compared soybean and corn yields between conventional and organic cropping systems. Results
suggested that corn yields were similar between conventional and organic cropping systems
(Pimentel et al, 2008). Despite the concern for reduced crop outputs, the farmer’s financial integrity

38
need not necessarily be comprised by the adoption of organic cropping practices. Price ranges for
organic produce are typically between 20% -140% higher than conventional produce, and fossil
energy inputs are roughly thirty percent less, thus rendering the differential crop yields
insignificant with respect to matters of finance (Badgley et al, 2007).
CONCLUSIONS The development of the final product was achieved after an extensive design process. It takes into
consideration the design criteria laid out in the initial stages of planning as well as alterations in
later stages. The MATLAB program provided an efficient means through which a successful
program with a working GUI and risk calculator was created.
REFERENCES
Antle, J.M., Pingali, P.L. 1994. Pesticides, Productivity, and Farmer Health: A Philippine Case Study. American Journal of Agricultural Economics 76: 418-430.
Badgley, C., Moghtader, J., Quintero, E., Zakem, E., Chappell, M.J., Aviles-Vazquez, K., Samulon, A., Perfecto, I. 2007. Organic agriculture and the global food supply. Renewable Agriculture and Food Systems 22: 86-108
Benbrook, C.M., Sexson, D.L., Wyman, J. A., Stevenson, W.R., Lynch, S., Wallendal, J., Dierks, S., Van Haren, R., Granadino, C. A. 2002. Developing a pesticide risk assessment tool to monitor progress in reducing reliance on high-risk pesticides. American Journal of Potato Research 79: 183-199
EPA- United States Environmental Protection Agency. 2005. Toxicity Categories and Pesticide Label Statements. Office of Prevention, Pesticides and Toxic Substances.
Fenske, R.A. 2003. Fluorescent Tracer Evaluation of Protective Clothing Performance. United States Environmental Protection Agency. Risk Reduction Engineering Laboratory. Cincinnati, OH.
Franklin, C.A., Worgan, J.P. 2005. Occupational and Residential Assessment for Pesticides. Pest Management Regulatory Agency, Health Canada. John Wiley & Sons, Sussex, England.

39
Garreyn, F., Vagenende, B., Steubuart, W. 2003. Harmonized environmental Indicators for pesticide. Risk Occupational indicators - Operator, worker and bystander. EU: contract number SSPE-CT-2003-501997
GHS: Globally Harmonized System for the Classification and Labeling –Implementation of the GHS in Canada. Health Canada, 2005.
Greitens, T.J., Day, E. 2007. An alternative way to evaluate the environmental effects of integrated pest management: Pesticide risk indicators. Renewable Agricultural and Food Systems 22: 213-222
Indiastat. State-wise Consumption of Pesticides in India (Technical Grade). 2009. Ministry of Statistics and Programme Implementation, Govt. of India
Kellogg, R.L., Nehring, R., Grube, A., Goss, D.W., Plotkin, S. 2000. Environmental indicators of pesticide leaching and runoff from farm fields. United States Department of Agriculture Natural Resources Conservation Service.
Knaak, J.B., Jackson, T., Fredrickson, A.S., Rivera, L. 1981. Safety effectiveness of closed-transfer, mixing-loading, and application equipment in preventing exposure to pesticides. Archives of Environmental Contamination Toxicology9: 231-245
Krieger, R.K. 2001. Handbook of Pesticide Toxicology: Principles. Academic Press. San Diego California.
Lloyd G.A. 1985. Guidelines for the Selection of Protective Gloves used in Operations with Pesticides in Liquid Form" Operator Protection Group Information, Sheet No 18
Matthews, G.A. 1979. Pesticide Application Methods: 2nd edition. Blackwell, Oxford
McGuirk, A., Mundlak, Y. 1987. Incentives and Constrains in the Transformation of Punjab Agriculture. International Food Policy Research Institute.
Michael, C., Hoppin J., Kanel, F. 2004. Health Effects of Chronic Pesticide Exposure: Cancer and Neurotoxicity, Annual Review of Public Health 25: 155-197
NAIS: Norwegian Agricultural Inspection Service. 2000. Pesticide Risk Indicators for Health and Environment – Norway. Retrieved from: http://landbrukstilsynet.mattilsynet.no/dokument_eng.cfm?m_id=201&d_id=0
Pimentel, D., Hepperly, P., Hanson, J., Doud, D., Seidel, D. 2008. Environmental, Energetic, and Economic Comparisons of Organic and Conventional Farming Systems. Bioscience 55 (7): 573-582
POEM UK -Predictive Operator Exposure Model: A User’s Guide. 1992. Pesticides Safety Directorate, York, United Kingdom
QPRI. Quebec Pesticides Risk Indicator; Health and Environment. 2008. Government of Quebec, Canada
40
Revised UK Predictive Operator Exposure Model (POEM): Estimation of Exposure and Absorption of Pesticides by Spray Operators. 2003. PSD, Pesticides Safety Directorate.
Tunstall, L.P., Mathews, G.A., Rhodes, A.K. 1961. A modified knapsack sprayer for the application of insecticides to cotton. Emp. Cotton Grower Review. 38, 22-6.
Van Hemmen, J. 2001. EUROPOEM, a predictive occupational exposure database for registration purposes of pesticides. Applied occupational and environmental hygiene 16 (2): 246-250.
Van Hemmen, J. 2006. Pesticides and The Residential Bystander. The Annals of Occupational Hygiene 50 (7): 651-655
APPENDICES
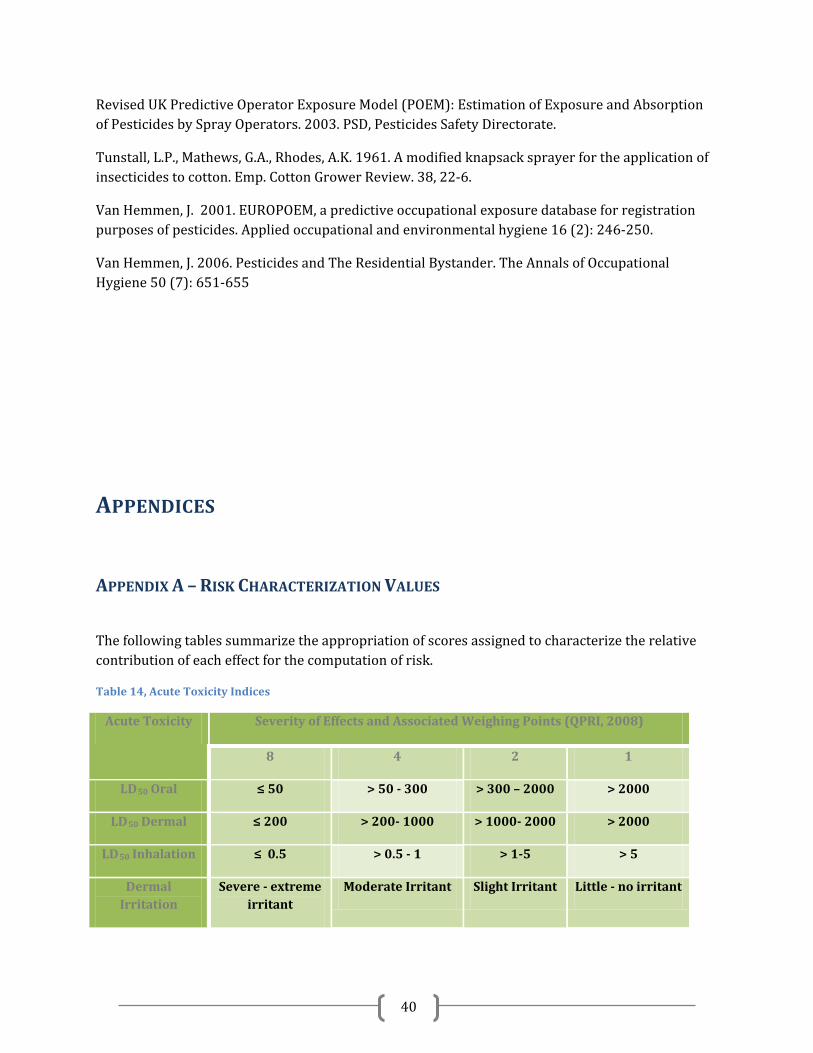
APPENDIX A – RISK CHARACTERIZATION VALUES
The following tables summarize the appropriation of scores assigned to characterize the relative contribution of each effect for the computation of risk.
Table 14, Acute Toxicity Indices
Acute Toxicity Severity of Effects and Associated Weighing Points (QPRI, 2008)
8 4 2 1
LD50 Oral ≤ 50 > 50 - 300 > 300 – 2000 > 2000
LD50 Dermal ≤ 200 > 200- 1000 > 1000- 2000 > 2000
LD50 Inhalation ≤ 0.5 > 0.5 - 1 > 1-5 > 5
Dermal Irritation
Severe - extreme irritant
Moderate Irritant Slight Irritant Little - no irritant

41
Ocular Irritation Severe - extreme irritant
Moderate Irritant Slight Irritant Little- no irritant
Table 15, Chronic Toxicity Indices
Chronic Toxicity Severity of Effects and Weighing Points (QPRI, 2008)
16 8 4 2 1
Carcinogenicity Human Carcinogen
Probable Human Carcinogen
Possible Human
Carcinogen
Cannot assess risk of human
carcinogenicity
Inadequate Data
Genotoxicity - Genotoxicity for humans
Potential Genotoxicity for Humans
- Inadequate Data
Endocrine Disruption
- Evidence of Endocrine Disruption
Potential Endocrine Disruption
- Inadequate Data
Reproductive Effects
Confirmed Human Effects
Suspected Human Effects
Confirmed Animal Effects
Suspected Animal Effects
Inadequate Data
Development Confirmed Human Effects
Suspected Human Effects
Confirmed Animal Effects
Suspected Animal Effects
Inadequate Data
Table 16, Environmental Persistence and Bioaccumulation Indices
Classification of persistence and bioaccumulation potential (QPRI, 2008) FPer
Soil half-life ≥ 60 days 3.0
Soil half-life ≥ 30-60 days 2.5
Soil half-life ≥ 15-30 days 2.0
No data available 1.5
Soil half life < 15 days 1.0
Table 17, Weighing Factor for Application Technique
Weighing Factor According to Technique and/or Place of Application (QPRI, 2008)
1 1.5 2

42
• Use of pretreated seed
• Incorporation
• Horizontal boom spray unit
• Air blast sprayer with ground directed spray
• Sprayer with anti-drift system
• Air blast sprayer with high position directed spray
• Treatment of seed in closed area
• Treatment in closed area