Embed Size (px)
Citation preview

DEVELOPMENT OF EVALUATION
MODEL FOR MINI/MICRO HYDRO
POWER POTENTIAL IN KENYA
Ufa, .33J
p S,C n * ” PFE'J ACCBPTJ f f :
iff.— .THB B F r t _ r
by
& 4££/?£ /?£ ££££iV KANUTHU G_________
A thesis subm itted in part fullillment ot the r e t ire m e n ts tor the award ot the
degree o f M aster o f Science in Electrical Engineering o f the University o f
Nairobi.
UNIVERSITY OF NAIROBI LIBRARY
1999

Declarat ion
This thesis is my original work and to my knowledge it has not been presented for the
award of a degree in any other university.
Candidate : Kaberere K. K. G
Signature : .
Date : ...I.P.
\
Reg no : F56 7025 93
This thesis has been submitted for examination with my approval as the university
supervisor.
Name : Mr. N. £ Walkcide
Signature : * (V
i Date : 1 . O S
11

Dedi ca t i on\
To my parents
For their love and endless efforts in educating me.
N»V'
ill

A cknowledgments
While I can take pride in completing this work, I would be deceiving both the world and
myself to say that it was my lone effort that made it a success. I would therefore like to
pay special tribute to all who in one way or another contributed to its successful
completion .
I wish to express my sincere gratitude to J 1 C A and the administration of 7 K U A T for
having made it possible for me to attend the course, and for their financial support,\
without which it would have been very difficult for me to do this research work.
I am greatly indebted to my supervisor MQ*. y jy . who was a source of
encouragement and help throughout the period of the project. His constant guidance and
supervision as the project developed went a long way in making it a success. I also wish
to thank all the members of staff in the department of Electrical Engineering, University
of Nairobi and their counterparts at J K U A T for their support.
I wish to thank Mr. Henya of Brooke Bond (K) Kericho, Mr. Mosin of Tenwek Mission
Hospital and Mr. Odeny of KP&LCo. for the valuable information and data they availed
to me. Many thanks to Ms. Margaret and Mr. Gitonga of ITDG Kenya and the staff at
the Ministry of Energy for allowing me to use their library facilities.
I also wish to thank my husband Mr. Kaberere for encouraging me when I could not
even see the end of the tunnel.
The list is long but I must end it by thanking Ms. Nancy Gichuhi who did the bulk typing
of this work. To all I say - Thank You very much and God bless.
IV

Notat ions and Symbols
A
AC, DC
ADB
AVR
ATDO
ASEAN
CB
CBS
CT
A-Y
ECC
E/F
ELC
FKAT
GATE
GTZ
HRC
Hz
IGC
ITDG
kg
KPLC
Ksh.
KVA
kW, MW
kWh
LV, MV, HV *
MHP
m/s
m3/s
Amperes
Alternating Current, Direct Current
Asian Development Bank
Automatic Voltage Regulator
Appropriate Technology Development Organisation
Association of South-East Asian NationsN
Circuit breaker
Central bureau of statistics
Current Transformer
Delta-Star
Electronic Current Cut-out
Earth Fault
Electronic Load Controller
Association for Appropriate Technology, Germany
German Agency for Technical Cooperation
German Foundation for International Development
Hangzhou Regional Centre for Small Hydro Power
Hertz
Induction Generator Controller
Intermediate Technology Development Group
kilogram
Kenya Power and Lightning Company (Ltd.)
Kenya shilling
kilovoltampere
kilowatt, megawatt
kilowatthour ^vx
Low voltage, medium voltage, high voltage
Mini/micro Hydro Power
metres per second
cubic metres per second

mm, m, km millimetres, metre, kilometre
MCB Miniature Circuit Breaker
N/M2 Newtons per square metre
NPW Net Present Worth
NRECA National Rural Electric Cooperative Association
0/C Over Current
OLADE Latin American Energy Organisation\
PTC Positive Temperature Coefficient-thermistor
PVC Poly Vinyl Chloride
PW Present Worth
RE Rural Electrification
rpm revolutions per minute
SEF Sensitive Earth Fault
SHP Small Hydro Power
SKAT Swiss Centre for Appropriate Technology
SWER Single Wire Earth Return
UN United Nations
UNDP United Nations Development Program
UNIDO United Nations Industrial Development Organisation
US S United States dollar
UV Ultra Violet
V, KV Volt, kilovolt
s>V '
VI

Abstract
As witnessed by the developed countries, rural electrification (RE) is of paramount
importance for the development of a nation. It serves many social and economic
purposes. Since the majority of the people in developing countries live in the rural areas,
there is a need for these nations to address themselves to the real problems of rural
electrification. The dominant method used for lighting up these areas is national grid
extension which quite often proves to be very expensive due to the dispersed nature of
rural population distribution and very low power consumption Diesel generators have
also been used to serve remote areas but these are not very appropriate because they
require skilled maintenance and their running costs are very high especially where fuel is
imported. Even the oil producing countries do seek alternatives due to the realization
that oil is a depletable resource Cheaper and more appropriate technologies for lighting
up the rural areas must therefore be sought and most countries are turning to renewable
resources. Of all the renewable sources, mini/micro hydroelectric power (MHP) has been
found to be the cheapest and moreover, it raises very little environmental concern.
In this study an evaluation model for MHP has been developed for applications in Kenya.
This model performs the technical design of plants of capacity up to 500kW. It is based
on relevant mathematical formulae and engineering considerations applicable to hydro
power plants of this range The power demand of the potential consumers should be
estimated as a pre-condition for the use of the model. The model matches the discharge
rate corresponding to the potential power demand and the river discharge rate to
determine the design discharge rate. Where the demand surpasses the supply, a 70
percent exceedance design discharge rate is recommended. Storage reservoirs have been
found to increase the project cost drastically due to the fact that a dam would have to be
constructed and the excavation work involved. They should therefore be avoided.
vx<.
The study concentrates on A C. generation, single phase for plants upto lOkW and three
phase above this rating. The choice of an induction generator can be made whenever it
vu

costs less than the equivalent synchronous generator which has been found to be upto
25kW. For plants of capacity up to 200kW, Electronic Load Controllers (ELC) may be
used with synchronous generators and beyond 200kW a speed governor is
recommended. The use of a step-up transformer is only considered when the power to be
transmitted exceeds 40kW.
The effect of interest rate charged on capital and discount rate have also been
investigated and it has been found that the higher these rates are, the lower the Net
Present Worth (NPW) of a project becomes. The unit cost of generation of power
decreases as the annual capacity factor improves and as the useful life of a project
increases. Unit cost of diesel generation was found to be higher than MHP for values of
capacity factor above 17.5% for the plant studied Although the unit cost of generation
for both MHP and diesel decreases individually as the annual capacity factor improves,
the difference in cost between the two sources widens as the annual capacity factor
improves.
V'
VUI

Table o f Contents
Declaration............................................................................................................................................. ii
Dedication............................................................................................................................................. iii
Acknowledgments.................................................................................................................................iv
Notations and Symbols.......................................................................................................................... v
Abstract................................................................................................................................................ vii
Table of Contents..................................................................................................................................ix
List of figures.......................................................................................................................................xii
List of Tables......................................................................................................................................xiii
CHAPTER I ........................................................................................................................................................1
GENERAL INTRODUCTION.........................................................................................................................I
1.1 RURAL ELECTRIFICATION (RE).......................................................................................................... /
1.2 PROBLEM ST A TEMENT........................................................................................................................6
1.3 RESEARCH OBJECTIVE........................................................................................................................ 6
1.4 REASONS FOR THE PROJECT STUDY............................................................................................... 7
CHAPTER 2 ....................................................................................................................................................... 9
LITERATURE REVIEW .................................................................................................................................9
2.1 MINI/MICRO HYDRO POWER (MHP)................................................................................................9
2.2 COMPONENTS OF A MHP PLANT.....................................................................................................11
2.3 DEVELOPMENTS IN MHP TECHNOLOGY.......................................................................................13
2.3.1 Design standardization....................................................................................................................15
2.3.2 Electronic Load Control (ELC).....................................................................................................16
2.3.3 Induction Generators.......................................................................................................................18
2.3.4 New materials.................................................................................................................................23
2.4 OBSTACLES TO VIABLE MHP SCHEMES........................................................................................23
2.4.1 High capital cost per kW of installed capacity............................................................................24
2.4 2 Effects of Seasonal River Flow Variation................................................................................. 25
2.4.3 Attitude/policy of lending agencies............................................................................................... 25
2.4.4 Lack of good hydrological data.................................................................................................... 26
2.5 DISTRIBUTION SYSTEM AND CQ&T REDUCTION OPTIONS FOR RURALN
ELECTRIFY A TION PROJECTS..........................................................................................................26
2.5.1 Introduction..................................................................................................................................... 26
2.5.2 System Configuration..................................................... 27
2.5.3 System cost reduction.................................................................................................................... 30
2.5.4 Metering and billing techniques.................................................................................................... 33
ix

2.6 M1NI/MICR0 HYDRO POWER IN KENYA.......
2.6.1 MHP in Kenya...............................................
2.6.2 MHP sites in Kenya........................................
CHAPTER 3.....................................................................
DESIGN MODEL COMPONENTS
TECHNICAL DESIGN & FINANCIAL ANALYSIS
3.1 INTRODUCTION..................................................
3.2 MODEL DESCRIPTION.......................................
3.2.1 Site Hydrology and Geology.........................
3.2.2 Matching Power Demand and Supply.........
3.2.3 Civil Works....................................................
3.2.3.1 Intake location............................................
3.2.3 2 Intake dimensions......................................
3.2.3.3 Worst Flood discharge flow......................
3.2.3.4 Headrace channel slope and w idth...........
3.2.4 Penstock.........................................................
3 2.4.1 Penstock Material......................................
3 2.4.2 Penstock sizing...........................................
3.2.4 2.1 Choosing penstock diameter..................
3.2.4.2 2 Choosing Penstock Thickness................
3.2.5 Choice of Turbine..........................................
3.2.6 Choice of Governor.....................................
3.2.7 Electrical Design............................................
3.2.7.1 Supply system - AC or D C ........................
3.2.7.2 Single phase or three-phase.....................
3.2.73 Generator..................................................
3.2.7.3.1 Synchronous generator...........................
3.2.7.3 2 Induction Generator (IG)......................
3.2.7 4 Transformer................................................
3.2.8 Protection Scheme.........................................
3.2.8.1 Generator protection..................................
3.2.8.2 Generator - Transformer Protection.........
3.2.8.3 Transformer protection...........................
3.2.9 Switchgear...........................7>>......................
3.3 TECHNICAL DESIGN..........................................
3.3.1 Matching Demand and Supply....................
3.3.2 Civil Works.....................................................
3.3.2.1 Intake dimensions.....................................
.3 5
.35
.38
.42
.4242
44
44
44
45
46
46
48
50
51
52
53
53
53
56
57
57
57
58
58
60
61
62
63
u6
.67
,68
JO
.70
.71)
,70
x

3.3.2 .2 Height of flood barrier and wing walls..................................................................................... 72
3.3 2.3 Headrace channel slope and dimensions...................................................................................73
3.3.2 4 Headrace flood flow .................................................................................................................... 76
3.3 3 Penstock sizing..................... i...................................................................................................... 76
3.3.3.1 Choosing penstock diameter.......................................................................................................76
3.3.3 2 Choosing Penstock thickness................................................................................................... 80
3.3.4 Choice of Governor...................................................................................................................... 82
3 3 5 Electrical Design.......................................................................................................................... 82
3 3.5.1 Generator................................................................................................................................... 82
3.3.5 2 Transformer............................................................................................................................ 84
3 3 6 Protection Schem e.................................................................................................................... 85
3.4 FINANCIAL FEASIBILITY OF VH P PLANTS...............................................................................
3.4.1 Introduction................................................................................................................................ 87
3 4 2 Financial Analysis..................................................................................................................... 89
3 4 3 Comparative analysis between mini/micro hydro and diesel generation.............................. 90
CHAPTER 4 ...................................................................................................................................................... 92
MODEL DEVELOPMENT AND TESTING...............................................................................................92
4.1 INTRODUCTION................................................................................................................................... 92
4.2 COMPl TER PROGRAM ...................................................................................................................... 92
4.3 MODEL TESTING ............................................................................................................................. 99
4.3.1 Test Data.................................................................................................................................. 99
4.3 2. Test Results.......................................... 102
CHAPTER 5 .....................................................................................................................................................114
DISCUSSIONS, CONCLUSIONS AND RECOMMENDATIONS....................................................... 114
5.1 DISCUSSIONS................................................................................................................................. 114
5.1 1 Model results...................................................................................................................... 114
5.1.2 MHP Implementation................................................................................................................ 116
5.2 CONCLUSIONS...................................................................................................................................... 118
5 3 RECOMMENDA TIONS......................................................................................................................... 120
REFEREN CES...................... 121
BIBLIOGRAPHY................................ 129
APPENDIX A...............................................^ ..................................................................................................131V'
APPENDIX B.....................................................................................................................................................151

List o f f i gure s
Fig. 2.3.1 Steady state equivalent circuit of the induction machine with load 20
Fig. 3.2.1 (a) River in section during normal flow 48
Fig. 3.2.1 (b) Side view section through the intake during normal flow 49
Fig. 3.2.1 (c) River section during flood flow 49
Fig. 3.2.2 Canal dimensions 51
Fig. 3.2.3 A star connected IG with delta connected excitation capacitors 60
Fig. 3.2.4 Single phase supply system using th e ‘C-2C’ arrangement 61
Fig. 3.2.5 Rotor E/F protection 63
Fig. 3.2.6 Biased differential protection for the generator-transformer unit 66
Fig. 3.2.7 Circuit breaker locations 68
Fig. 3.3.1 Moody diagram 79
Fig. 4.2.1(a) MAIN 94
Fig. 4.2.1(b) Subroutine CWORKS 95
Fig. 4.2.1(c) Subroutine PEND1M 97
Fig. 4.2.1(d) Subroutine ELECT 98
Fig. 4.2.1(e) Subroutine ECON 99
Fig. 4.3.1 NPW Vs Capacity factor for various values of discount rate 110
Fig. 4.3.2 NPW Vs Capacity factor for various values of interest rate 111
Fig. 4.3.3 Unit cost of energy from MHP for varying plant useful life 112
Fig. 4.3.4 Unit cost of energy for diesel and MHP Vs capacity factor 113
s>
xii

List o f Tables
Table 2.1.1 SHP definition and classification 9
Table 2.5.1 Percentage savings in RE by altering the engineering design 31
Table 2.6.1 Existing and potential MHP sites in Kenya 39
Table 3.2.1 Allowable maximum flow velocity to avoid erosion (m/s) 47
Table 3.2.2 Recommended side slope angles for trapezoidal channels 50
Table 3.2.3 Specific speed for different types of turbine 55
Table 3.2.4 Maximum allowable distance of transmission for various amounts of
power at 11 kV 62
Table 3.3.1 Coefficient of discharge Cw for different weir profiles 73
Table 3.3.2 Manning's roughness coefficient kn' 74
Table 3.3.3 Roughness values, k mm for different materials 78
Table 3.3.4 Turbulence headloss coefficients 80
Table 3.3.5 Summarised Design 86
Table 4.3.1 Design data 102
Table 4.3.2 (a) MHP plant design results - Mau Forest Falls plant 103
Table 4.3.2 (b)MHP plant design results - Proposed Terem Falls Project 104
Table 4.3.3 Present worth table 106
Table 4.3.4 Variation of net present worth with average annual capacity factor 108
Table 4.3.5 Average cost of unit generation for MHP and diesel 109
Table B-l Values of K for the extreme value (type I) distribution 152
*V'
xiii

CHAPTER 1
GENERAL INTRODUCTION
1.1 RURAL ELECTRIFICATION (RE)
As experienced by the developed countries, the implementation of Rural Electrification
programs is a very slow and time consuming process, no matter the efforts and financial
input (Saunier & Mohanty, 1992). For example in the USA, it took half a century to
complete the electrification of the rural areas. Developing countries account for 75% of
the total world population, and more than 50% of this population live in the rural areas
yet, electricity for lighting is only available in the capital city, large provincial towns and
a few other cities. In particular in Kenya, 82% of the total population live in the rural
areas, but rural electrification only accounts for slightly over 3% (CBS, 1996) of the
national electricity supply. This imbalance is partly due to the investment criteria in
electrical generating systems i.e. only large centralised generation is efficient, and thus
restricting power generation to very large hydro electric schemes and thermal/diesel
power plants.
The population distribution in rural areas is sparse and most o f the populace are low
income earners. The electrical load in rural areas is characterised by poor load factor,
low levels o f demand, low load density and high power line losses due to long lines.4.
These factors make the cost of supplying electricity by grid extention quite high.
1

Electricity in rural areas is primarily used for:-
i) Lighting
ii) Commercial and social amenities like hospitals and trading centres.
iii) Economic development i.e. pumping of water and irrigation, small scale agro and
village industries.
Energy in one form or another has been found to be a pre-requisite for rural development
thus making RE a very critical subject. RE on its own does not cause an area to develop
but only acts as a stimulant. Other necessary conditions for economic take off have to be
available. However, there is a direct relationship between efficient and productive RE
and economic development of a country.
Electricity in rural areas serves many social objectives and helps in reducing the
imbalances between rural and urban settings. The main benefits associated with RE
include >
i) If productive use of electricity is enhanced, it encourages modernisation of
agriculture and development of agro and cottage industries hence
ii) Creating employment. This improves the income of the rural community thus
closing the gap between the rich and the poor.
iii) Better standards of living are enjoyed due to the higher income levels. This has
been observed in a study carried out in Peru (Smith, 1995).
iv) Social equity: With electricity in the rural areas, social amenities improve thus
providing an environment almost equal in comfort and convenience as that enjoyedvx
in the urban areas thus mitigating the drift to urban centres.
2

v) With clean energy available in rural areas, there is less use of fuel wood and hence
less degradation of the natural environment.
In a country like Kenya with agriculture as the backbone of the economy, the rural
population gets a very disproportionate share of the benefits accrued from the foreign
exchange earnings of their agricultural produce. There is no clean energy in these areas
and fuel wood accounts for more than 80% of the total fuel consumption (Mbuthia,
1981). The clearing of forests for planting of more cash crops to meet the ever increasing
demand for foreign exchange and the pressure on land due to increase in population, has
deprived the rural community o f their major source of energy and cannot comfortably
meet the very basic necessities of life like cooking. This makes the areas unattractive
resulting in a population drift to the urban centres. This could eventually lead to the
stagnation or decline of the contribution of agriculture to the country’s economy, while
on the other hand urban slums will be on the increase. There is therefore, need to
redistribute the foreign exchange expenditure by providing better services to the rural
areas.
The use of electricity instead of kerosene for lighting and refrigeration in the villages
results in substantial fuel savings to the economy. Fielder and Berrie (1982) observed
that for the same brightness of lighting, fuel cost of a power station, after allowing for
distribution losses, is much less than the cost of kerosene. They note that the savings are
sufficient to pay for power station andsidistribution system particularly if the electricity is\ x
used productively^
3

Utility companies however do face some constraints in connection with RE which
include:-
i) High capital cost. This is due to the characteristics of rural load highlighted earlier.
Substantial savings in investment and maintenance costs can be achieved by careful
selection of maintenance, reliability and technical standards that are appropriate for
the unsophisticated rural load.
ii) High revenue collection costs. The cost o f meter reading, billing, revenue
collection and administration are more than the revenue collected due to the
dispersed nature of the rural load
iii) Low income from existing operation. In some countries the tariff systems are
constrained by historical and political factors (Smith, 1995). The tariffs are low
thus necessitating reduction of operation & maintenance costs and system up
grade. This results in poor quality supply and a reduction in revenue.
iv) Theft and vandalism: Illegal connection to the supply and by passing of meters.
This reduces the return on investment. There is also theft of conductors and
equipment.
On the other hand, rural consumers have their own share of problems. These are>
i) High charge fo r initial connection. The utility companies impose high initial
connection charges in order to recoup part of the investment. Highest charges are
encountered when all or part of the cost of the distribution transformer is met by
the consumer. ^' • A%
u) High cost of*house wiring Most of the rural population are low income earners
who can barely afford the cost of wiring their houses.
4

iii) Distance to payment centre: Due to the dispersed nature of the rural load, utility
companies tend to have payment centres that serve very large geographical areas.
This discourages potential consumers from obtaining a connection while on the
other hand it encourages default on payments.
iv) Poor quality reliability o f supply: Utility companies try to keep the RE costs low
by having simple line designs and protection schemes. Often there is only one line
supplying an area and in case of outage the area is left with no alternative route of
supply. Voltage regulation in most rural areas is also poor.
The diseconomies of electricity distribution have prevented power from large centralised
generation from reaching large rural population and there is evidence to indicate that
(Walkade, 1986) these generating plants can never be economically applied to serve the
very low consumer density of demand in the rural areas. The slow pace ->f
implementation of RE programs has partly been attributed to the over reliance on the
centralised grid supply to the exclusion of several decentralised technologies which could
make a significant difference. These decentralised power supply sources are diesel
stations, wind, solar photovoltaic and mini/micro hydro power (MHP). Of all these
sources MHP has been found to produce electricity more cheaply than all other
competing sources (Chullakesa, 1992). It is therefore important to look into ways and
means of harnessing this renewable source of energy. Initial returns from these projects
hardly cover project costs, but the indirect benefits in saving foreign exchange on food
loss. 1 he unquantifiable social benefits enjoyed as a result of RE can not also be ignored
Therefore, RE should not just be looked at from the point of view of direct returns
5

invested capital, but must also be seen to have an overall major positive impact on the
national economy.
1.2 PROBLEM STATEMENT
Having appreciated the problem of RE by grid extension and the importance of lighting
up the rural areas for the growth of the national economy, and realising that MHP is a
cheap and viable alternative, it is the task of this research project to design the most
suitable evaluation model for mini/micro hydro power schemes for Kenya. This is in line
with the current trend in the world of Small Hydro Power technology of design
standardization in order to achieve cost savings in terms of both specialised engineering
time and equipment. MHP is site specific and hence the need to have a model that is
suitable for Kenya.
The model is to be based on mathematical formulae and engineering considerations found
to be applicable to MHP. It should determine the power potential of a site and match it
with the demand, then come up with the technical design of the various main components
of the MHP plant i.e civil works and the electrical design. Finally the financial analysis of
the proposed plant and comparison of the cost of generation using MHP and an
alternative source should be carried out.
1.3 RESEARCH OBJECTIVEV '
The objective <5f this study is to design the most suitable evaluation model for MHP plants
for use in Kenya.
6

1.4 REASONS FOR THE PROJECT STUDY
This study is a rural electrification project using a renewable energy resource. Rural
electrification by grid connection is prohibitively expensive and so it is very important to
explore the alternative of mini/micro hydro power which is the cheapest known way of
generating power for rural areas (Walkade, 1986). MHP installations have been found to
be economically feasible (Mbuthia, 1981; Blankenberg & Hulscher, 1990). Thus the main
reasons for this study include-:
1. The trend in the world of MHP is design standardisation. However, MHP is very site
specific and a design that may be quite good for one country may be a total failure if
used in another. The outcome of this project would therefore go a long way in9
facilitating the fast design of MHP sites in Kenya. In addition to this, the power
industry is in the process of being liberalised and the developed model will be very
useful to private site developers who need not have thorough engine .ig knowledge
when they have the model.
2. Kenya is already experiencing a power deficit and mini/micro hydro power
technology would come in handy to close the energy gap.
3. Rivers and streams are found in large portions of the country and if their energy
potential can be exploited -which is the main aim of this study-, then the living
standards of the rural population would be improved. If electricity replaces wood
fuel which accounts for more than 80% of the total fuel consumption in rural areas,
there will be (ess degradation of the natural environment.
7

4. The rural community will leap the benefits resulting from mini/micro hydro power
development such as employment opportunities created by having the plants run by
the local people.
5. Unlike large hydros, mini/micro hydro power plants need not be donor funded. They
do not require skilled labour for operation & maintenance and they are cheap to
maintain. The main reason to prefer mini/micro hydro power plants over diesel
generators is that, often the donor provides the generator but not the diesel oil which
is a more urgent problem and especially in Kenya where it has to be imported.
8

CHAPTER 2
LITERATURE REVIEW
2.1 MIN1/M1CRO HYDRO POWER (MHP)
Mini/micro hydro power is a mature technology. It usually refers to a hydraulic turbine-
generator installation for the production of hydro electricity at low power levels
(Monition et al., 1984). The power from such installations ranges between 5 and 5000
kW for heads o f 1 5 - 400 metres and flows ranging from several hundreds of litres per
second to several tens of cubic metres per second. There is no universal definition of
these small scale plants and different organisations and countries have different
classifications which reflect the degree of rural industrial development and the proportion
of hydro power in the whole power sector of a country. Table 2.1.1 gives the
classification used by some organisations and countries.
Table 2.1.1.: SHP Definition and classification.
U N IT: K W
Name of country or organisation Micro Mini Small
UNIDO 100 101-1000 1001-10000
HRC 100 101-500 501-10000
OLADE v 50 51-500 501-5000
China * U 100 101-500 501-25000
Source: SHP SEWS. So. I. 1993
9

However, a common definition uses micro when the power is less than 100 kW and mini
when it is between 100 and 500 kW (Monition et al., 1984). This research project is on
plants of up to 500kW capacity.
Mini/micro hydro power plants are used for providing electricity to locations that are not
served by transmission from larger or conventional generation of which most of these
locations are the rural areas. It has been estimated that (Manwell, 1988), 26% of all
global technically developable sites have capacities less than 1000 kW. The amount of
power generated by a MHP installation depends on the site selected, topography and the
hydrological conditions. The potential output is a function of available head and water
flow rate but is also a result of an optimisation process based on economic and technical
parameters (Shanker & Krause, 1992). The cost of MHP is site specific and therefore
proper site selection is very important.
The factors influencing the feasibility of a MHP plant site include
i) Available head of water.
ii) The river flow rate and its distribution throughout the year
iii) Potential electricity demand in the surrounding area.
iv) Distance between (a) the plant site
(b) the nearest existing grid supply
and the load centre.
v) Existing infrastructure.
10

MHPs have some advantages over both fossil based and large scale hydro power
stations. These exclusive advantages include:-
i) The technology of engineering and construction is relatively simple and they do not
require elaborate civil works. The power generating equipment is simple and can be
manufactured locally.
ii) The small size of individual plants creates widespread potential for MHP schemes
in terms of the number of sites which can be exploited. The decentralised nature of
MHP resources coincides more closely with the dispersed nature of rural
population.
iii) Most of the sites are near the load centre and so the transmission distances are
short.
iv) MHPs require limited tunds and a short period o f time for implementation.
v) They rarely raise environmental concern and their interference with the natural
ecosystem is very small.
vi) Due to their small size, they permit local villager involvement in the full range of
activities from initiation and implementation to operation, maintenance and
management.
2.2 COMPONENTS OF A MHP PLANT
To harness the energy in water flowing in a river/stream, there are various components
that must be provided. The principal ones include a weir, intake, power conduit, forebay,
penstock, power house and the tailrace. Others such as spillway, gates, trash racks &
skimmers and settling basin may be incorporated depending on the conditions at the
MHP site under consideration. The inclusion of unnecessary components leads to an
11

increase in project cost and complexity of implementation and operation of the scheme
On the other hand, if necessary components are omitted, the problems that these
components should address persist. It is important therefore, that only those components
that are necessary at a specific site are incorporated for an efficient and cost effective
scheme. The following gives a brief description of the main components of MHP plants.
/. Weir
Most MHP installations are run-of-river type and they do not have storage. A weir is a
structure constructed across a part or all of the stream to divert the required flow
towards the intake.
2. Intake
This permits a controlled flow of water from a river/stream into a conduit which
eventually conveys it to the turbine The intake should be placed as high as possible
above the turbine to maximise the head. It is normally equipped with a trash rack which
filters out large debris.
3. Power Conduit
The power conduit conveys water a relatively long distance from the stream to the inlet
of the penstock with minimum loss of head and at minimum cost. It is most frequently a
canal excavated in earth which is sometimes lined with concrete, stone masonry or wood.
The canal should very nearly be along^a contour line.
12

4. Forebav
Before descending to the turbine, the water passes through the forebay. This serves as a
settling basin, where suspended particles settle at the bottom, and also as storage to cope
with water demand due to sudden increase in turbine loading. Its size may vary
depending on the quality of water and whether it serves as storage.
5. Penstock.
This is a pipe which conveys water under pressure from the forebay to the turbine. Some
of the materials used for penstock pipe are steel, PVC, polyethylene and fibre-glass
reinforced polyester.
6. Power House
This houses the turbine, generator and other electro-mechanical equipment.
7. Tciilrace
It is a short open canal that guides the water from the turbine back into the river It is a
component of every scheme except for low head plants where the water emerges from a
draft tube directly into the river.
2.3 DEVELOPMENTS IN MHP TECHNOLOGY
Globally, small scale hydro power has been in use for thousands of years with the earliest
form being waterwheels with a mechanical output. These were used for grinding grain
and raising water to higher elevation for irrigation and water supply. In the 1880’s, hydro
turbines were first used to generate hydroelectric power and this took over the
waterwheel. Mini/Micro hydro power technology was developed up to the 1930s.
13

Thereafter until 1970’s, there was a steady trend away from the technology as diesel
generators and subsidised grid electricity provided cheaper alternative supply to the rural
areas. It was not until the first oil crisis of 1973 that both the developed and developing
countries started seeking the alternatives of indigenous energy resources for electricity
generation. Both grid electricity and oil based fuels became increasingly expensive in
most countries and governments encouraged the development of small hydro resources -
being one of the most practical renewable energy technology - thereby reviving the
industry.
The sharpening of ecological issues, improvement of design methods and modernized
equipment have all led to the new development of small scale hydro power technology
which is neither a scale-down of large hydro nor a simple repetition of the original
technology, but a higher type under new economic and technical situation. So small sc<°’ ?
hydro power has received more attention and has been revived after a long period of
negligence. In some countries like China, mini/micro hydro power plants have been used
for flood conti oi and reclamation of the semi-arid and arid land through irrigation and
electricity generation is secondary (Jiandong, 1993). Another example o f a project that
did not have electricity generation as the main objective is the Matutinao mini hydro
scheme in the Phillipines. It was built to improve the livelihood of the people and to
retain the scenic beauty of the area (Small Hydro, 1990).
Some of the developments that hav^come with the renewed interest in mini/micro hydrovx
power are dtscftssed below.
14

2.3.1 Design standardization
The costs of specialised engineering time can be very significant in small schemes. Due to
the fact that mini/micro hydro power is site specific by nature, software packages that
have been developed for the design of MHP plants only act as design tools thus saving
on design time and hence cost. One such software package is the MICROHYP (Kahn et
al. 1992). It helps the designer come up with the least-cost design of a micro hydro plant
(its use is limited to plants of capacity up to lOOkW). It allows the user to study a wide
range of schemes giving alternative layout and component sizes. However, when tested
the model was found to have some short comings. It declared some sites which had been
working satisfactorily for years to be infeasible. This was due to some built-in constraints
like on the penstock sizing and power canal dimensions. The model does not include the
mini hydro plants i.e. plant capacity between 100-500kW. Although it comes up with the
least cost design, it does not include an economic/financial analysis of the plant which is
very important in determining the feasibility of a project.
Standardization of equipment has also received considerable efforts to achieve cost
savings on engineering input, manufacture and the provision of spare parts. China’s
success in developing small hydro sites has been partly due to standardization of
equipment and its quality (Metzler, 1982). She manufactures high quality low-cost
equipment and conducts centralised research and development of turbines. This avoids
the high capital expenditure and personnel requirement that an individual turbine
manufacturing company would requii^e These designs offer lower costs and machines otvx
guaranteed quality and reliability.
15

2.3.2 Electronic Load Control (ELQ
Mini/micro hydro power installations are normally stand-alone plants and they require a
speed governor so as to maintain the frequency of generated voltage within acceptable
limits when the electrical load is varied. Previously, mechanical and electro-hydraulic
speed governors were used to control the water flowing into the turbine. The speed
governor is the single most expensive unit in a hydro electric installation and it is quite
sophisticated.
The load controller is an electronic device that maintains a constant electrical load at the
generator terminals inspite of changing useful load. Solid state electronic voltage or
frequency sensing causes power to be diverted to or from a ballast load connected in
parallel with the main electrical load. This maintains a balance between the total electrical
load torque and the hydraulic input torque thus keeping the water flow and hence the
speed of the turbine-generator set constant. It dispenses the need for a water regulating
device and allows simpler turbine designs. This means that the turbines can be produced
in mass at low unit cost and also permits manufacture in a developing country's
workshop using local labour and readily available materials. Typically, the cost of an
ELC is about one tenth that of the speed governor (Henderson, 1993).
There are basically two commonly used techniques of load goveming:-
1- Phase control - In this method, a single resistive load equal to the generator rating is
connected to the generator via ftiyristors connected to a control circuit. The firing
angle of the thyristors is varied according to the user load connected to the system.
Current flows to the load for a specific period of the voltage cycle and when it is off
16
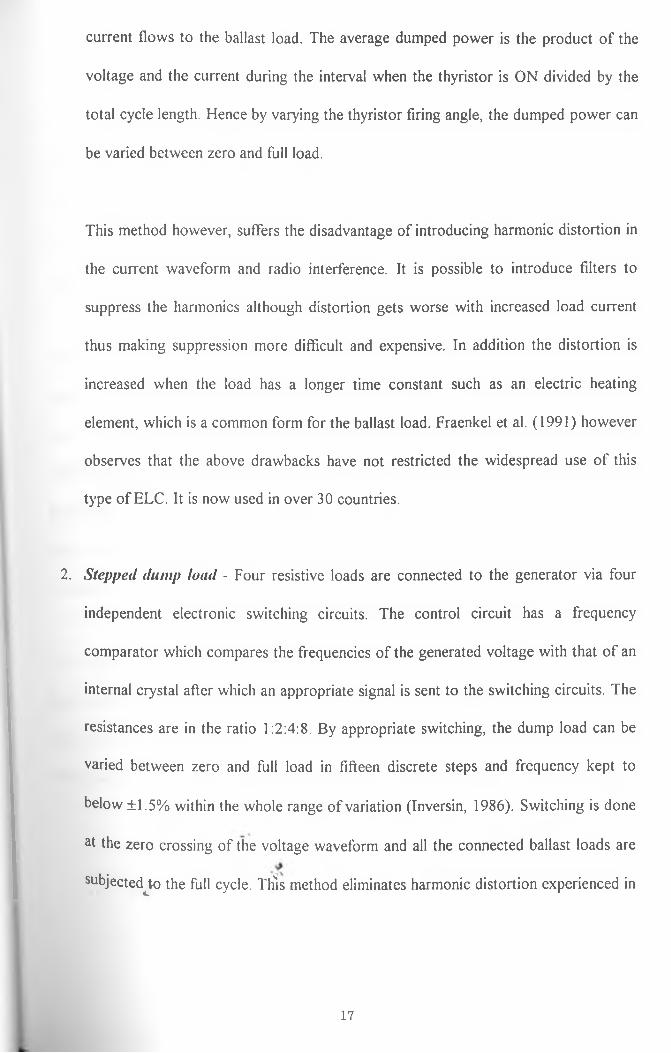
current flows to the ballast load. The average dumped power is the product o f the
voltage and the current during the interval when the thyristor is ON divided by the
total cycle length. Hence by varying the thyristor firing angle, the dumped power can
be varied between zero and full load.
This method however, suffers the disadvantage of introducing harmonic distortion in
the current waveform and radio interference. It is possible to introduce filters to
suppress the harmonics although distortion gets worse with increased load current
thus making suppression more difficult and expensive. In addition the distortion is
increased when the load has a longer time constant such as an electric heating
element, which is a common form for the ballast load. Fraenkel et al. (1991) however
observes that the above drawbacks have not restricted the widespread use o f this
type o f ELC. It is now used in over 30 countries.
2. Stepped dump load - Four resistive loads are connected to the generator via four
independent electronic switching circuits. The control circuit has a frequency
comparator which compares the frequencies o f the generated voltage with that o f an
internal crystal after which an appropriate signal is sent to the switching circuits. The
resistances are in the ratio 1:2:4:8. By appropriate switching, the dump load can be
varied between zero and full load in fifteen discrete steps and frequency kept to
below ±1.5% within the whole range of variation (Inversin, 1986). Switching is done
at the zero crossing of the voltage waveform and all the connected ballast loads are
subjected J o the full cycle. This method eliminates harmonic distortion experienced in
17

the phase control method. It however suffers the drawback o f less accurate
regulation and voltage flickering (Fraenkel et al., 1991).
An automatic voltage regulator (AVR) must be provided in addition to the ELC except
in cases where the useful load is purely resistive. If a load with power factor less than
unity is connected to the generator, it draws reactive current and if the excitation is fixed,
the a.c. output voltage decreases if there is no AVR.
When an ELC is employed, the generator must be oversized by 60% of the normal
requirement. In a phase controlled ELC, when conduction is retarded, the ballast load is
seen by the generator and supply system as a load with lagging power factor (Harvey,
1993). A user load of low power factor combined with the switching effect o f the ballast
load require excessive reactive power from the generator in which case the large currents
may damage the AVR or the generator windings. This is avoided by oversizing the
generator rating.
At El Dormilon in Colombia (Kristoferson & Bokalders, 1986), heat storage cookers
have been used as ballast load in conjunction with MHP installations. Other ballast loads
that have been used else where are space heaters, water heaters, crop drying and
refrigeration.
18

As observed from the foregoing discussion the value o f C has to be as close to Cmin as
possible to avoid:-
i) Low frequency and efficiency
ii) High terminal voltage which can damage machine
iii) High stator and rotor currents which cause overheating of the windings.
It is evident that it is not an easy task to determine the precise value o f C required for a
self-excited generator to operate satisfactorily under varying load conditions. This would
require an accurate knowledge o f the electrical parameters o f the machine, and their
variation with voltage.
Another earlier hindrance to the use of the induction generator for plants working in
isolation from the grid was lack of suitable excitation capacitance control mechanism.
The load on the generator had to be maintained constant or very nearly so at all times to
avoid the need for varying the capacitance. This has however, been overcome by the
development, in recent years, o f the Induction Generator Controller (IGC) (Hydronet,
1995). Its operation is similar to that of an ELC. Unlike in the ELC operation which
senses frequency changes, the IGC operation senses variation of voltage thus dispensing
the need o f an Automatic Voltage Regulator (AVR). When the useful load on the
generator increases, the voltage falls. The IGC senses the drop and compensates by
diverting the power dissipated in the ballast thus maintaining the effective generator load
constant. The use o f IGC dispenses the need for varying the excitation capacitance for
varying load conditions on the generator. Only one value o f capacitance is needed i.e full
load value.
22

2.3.3 Induction Generatorsla
The synchronous generator has traditionally been used for hydroelectric installations of
all sizes. The induction generator however, has several advantages over the synchronous
generator which include -
i) It is cheaper
ii) It is very rugged and less prone to failure
iii) Can handle prolonged overspeed with reduced risk of damage
iv) In case of a short circuit the voltage and hence the excitation collapse rapidly thus
limiting the current
The induction generator is now being used more frequently in small scale hydro power
plants that are connected to a much larger electric grid (SHP, 1993) and is normally
chosen when it is cheaper than the equivalent synchronous generator. When such a plant
is connected to the grid, the generator draws excitation current from the system and the
frequency is automatically regulated by the system hence there is no need for a speed
governor. On the other hand, when used in stand-alone plants, the induction generator
must be supplied with reactive power for it to excite. This can be achieved by the
connection of a capacitor [C] across the machine terminals as shown in fig. 2.3 1.
19

F i g 2 . 3 . 1 : S t e a d y s t a t e e q u i v a l e n t c i r c u i t of t h e i n d u c t i o n m a c h i n e w i t h l o a d
Where
R*, R
x s, x r, x m, x ,x <
h i h i I mi f r i Ic
f,V
Vt
- Stator, rotor (referred to stator) and load
respectively.
- Stator, rotor (referred to stator), magnetising
excitation reactances at base frequency respectively
- Stator, rotor (referred to stator), magnetising
excitation capacitor currents respectively.
- Per unit frequency and speed respectively.
- Terminal voltage.
d istances
load and
l°ad and
However, sizing the suitable capacitor presents problems because its value is tiedu to very
manY factors. The value of capacitorsmust be within certain limits (Cm,n ^ C < r~ ^ x ) to
Sustain self-excif^tion in which case, outside the specified range the machinecannot
e*cite. This range is dependent on machine parameters, speed, power factor anrincl load
20

R 'If - V
F i g 2 . 3 . 1 : S t e a d y s t a t e e q u i v a l e n t c i r c u i t of t h e I n d u c t i o n m a c h i n e w i t h l o a d
Where
R., R., R
X„ Xr, Xm, X, X,
Is, Ir, Im, II, Ic
- Stator, rotor (referred to stator) and load resistances
respectively.
- Stator, rotor (referred to stator), magnetising, load and
excitation reactances at base frequency respectively.
- Stator, rotor (referred to stator), magnetising, load and
excitation capacitor currents respectively.
- Per unit frequency and speed respectively.
- Terminal voltage.
However, sizing the suitable capacitor presents problems because its value is tied to very
many factors. The value o f capacitor rqust be within certain limits (Cmn < C < Cnm) toV '
sustain self-excitation in which case, outside the specified range the machine cannot
excite. This range is dependent on machine parameters, speed, power factor and load
l
20

conditions. In order to reach a steady state generating mode, some remnant magnetism
must be present in the machine core initially (Elder et al., 1984, Tripathy et al, 1993).
The magnetising reactance varies non-linearly with the terminal capacitance and load. To
maintain self-excitation under steady state conditions, X™ < X^x (maximum saturated
magnetising reactance of the machine). There is a minimum load impedance below which
the machine cannot excite irrespective of the value of excitation capacitance This
happens when Xm is greater than X ^ .
The magnitude o f the steady state generated voltage is determined by the value of the
terminal capacitance and the non-linearity of the magnetising inductance. If the voltage is
to remain constant under varying load conditions, then the capacitance must be varied
and this affects other factors differently. If a capacitor o f a higher value than is required
is connected, the terminal voltage rises above the rated value.
Malik & Al-Banrani (1990) in their study of the influence of the terminal capacitor on the
performance characteristics of the self-excited induction generator point out that the
frequency of the generated voltage decreases as the capacitor value increases. They
further note that when the machine is on no-load and C = Cmw , f = v/2. Under this
condition the rotor circuit impedance [Ry(f-v)+ jX,] becomes small and the machine
looses excitation. The stator, rotor and capacitor currents (I$, Ir, Ic) are strongly
influenced by C, rising to a maximurp and then falling off as C increases. This causesvx
increased machifre losses (hence poor efficiency) and consequential heating of the
windings.
21

If the load has an inductive component, the frequency increases to compensate for this
load but the rise is typically less than 10% for an overall load power factor of 0.9 (Smith,
1994). Reactive loads may be supplied provided the load power factor is not below 0.8
lagging.
In Nepal alone, more than 100 induction generators on micro hydro schemes had been
installed in 1994 (Smith, 1994) and they had proved to be considerably more reliable
than synchronous generators.
Harvey (1993) gives two methods of calculating the approximate value of capacitance
required which have been found to be sufficient (section 3.8 3.2) for MHP installations.
The turbine speed is adjusted until the required voltage is obtained.
2.3.4 New materials
For heads below 150m, high density PVC and polyethylene pipes are commonly used to
replace the more expensive and heavier steel penstocks which were formerly used (SHP
News, 1993). They also have good corrosion resistance. Fibre-glass reinforced polyester
has also been successfully used as a penstock pipe material.
Research is underway on the use of bursting discs for surge attenuation in the penstock
(Hydronet, 1995). This is a barrier between the pressurized penstock and the
atmosphere, designed to rupture at a pressure typical of that caused by a jet blockage or
excessively fast valve closure. The potential benefit to be accrued from the use of this
simple but effective form of surge attenuation, is cost reduction without compromising
23

the performance or reliability of the penstock. Penstock material cost can be reduced by
reducing the safety factor and even the penstock thickness as the disc offers reliable
protection.
2.4 OBSTACLES TO VIABLE MHP SCHEMES
There are many obstacles that hinder the development of viable MHP schemes most of
which have been overcome through innovative designs and proper dissemination of the
technology. These obstacles include -
2.4.1 High capital cost per A W of installed capacity
Inversin (1986) sites the employment of engineering firms engaged in large hydro power
projects to implement small schemes as one of the causes of high capital costs. These
firms simply scale down the large hydros instead o f considering the unique aspects of
small hydro power thus resulting in excessive increase in costs due to economies of scale.
He however notes that a growing awareness of the problem and the availability of more
cost effective designs and approaches to construction make MHP development an
attractive alternative Capital costs may be reduced by having MHP installations that do
not require elaborate construction works or expensive power houses and highly
optimised electromechanical equipment. A good example is Pakistan which produces the
cheapest MHP in the world at US$ 350-500 per kW of installed capacity (Kristoferson &
Bokalders, 1986) - 1981 figures. This very low cost has been attributed to the utilisation
°f local materials, designs suited to lopal situations and community involvement at all
stages of implementation and utilisation.
24

Blankenberg & Hulscher (1990) report that the feasibility of MHP plants is not only a
comparison with other alternatives but also the analysis of the elements that influence the
price of the plant. These elements in order of importance include:-
i) Load factor
ii) Economic lifetime of the plant
iii) Operation and maintenance cost
iv) Capital cost.
They found that an improvement of the load factor from 19% to 35% and prolonging the
economic life from 20-30 years reduces unit cost by 70%. In addition if capital and
operation & maintenance costs are reduced by 50% and 60% respectively, it results in a
17% cost reduction, thus making it possible to reduce costs by 87%.
2.4.2 Effects of Seasonal River Flow Variation
The plants that have a design flow rate equal to or lower than the annual minimum river
flow rate have power supply to meet the demand throughout the year resulting in the best
solution. However, this is not always possible because most rivers/streams have very high
flow during the wet season and low flow in the dry season. This leads to a demand/supply
mismatch during the dry season. This has in some cases hindered the harnessing of
potential MHP sites. However, it can be remedied by a load management program and a
suitable power utilisation schedule can be worked out. Since rural electrification by grid
connection is expensive, and diesel generators require highly skilled maintenance rendering*
them inappropriate. Therefore all year round supply requirement should not hinder the
installation of MHP schemes
L 25

2.4.3 Attitude/policy of lending agencies
Lending institutions/agencies -the World Bank being one of them- tend to favour
investment in a few large hydro power schemes rather than in many small ones. Where
loans are available, Santos (1992) highlights that the numerous bank requirements and
bureaucracy result in increased project costs and delay in implementation. If the policies
of self-construction -capital investment, material, labour and land are locally supplied-
and self-management -plant run by local authority or organisation that built it- are
adopted, these projects being of harambee/co-operative nature may not require donor
funding. These policies have been adopted in China which has been very successful in
SHP development.
2.4.4 Lack of good hydrological data
Santos (1992) notes that in most developing countries, hydrological data is either
unavailable or unreliable. This results in poorly designed schemes with under-estimated
project costs and over-estimated energy potential in the early stages of planning. Going
by this kind of misleading data may result in flooding and submergence of the power
plant and/or closure during the dry season.
The government could play a major role in the promotion of these programmes by giving
special grants/subsidies, fax benefits and low-interest long-term loans. This would go a
long way in making MHP affordable even by the very poor of the society.
V*'
26

2.5 DISTRIBUTION SYSTEM AND COST REDUCTION OPTIONS FOR
RURAL ELECTRIFICATION PROJECTS
2.5.1 IntroductionAs earlier discussed, the overall cost of MHP - including cost of the plant, transmission
& distribution and revenue collection- should remain as low as is practically possible.
This ensures that MHP remains competitive against other alternatives and affordable.
The main problem faced by utility companies in connection with rural electrification is
the dispersed nature of the rural load resulting in unusually long lines This makes the
cost of the transmission & distribution systems and revenue collection very high. This
section discusses some of the factors that may be considered to reduce these costs.
2.5.2 System Configuration
Since the rural load is simple, the distribution system used should be a simple radial
system to reduce on costs. Wyatt and Dingley (1995) in their report on the financial
comparison of 3-phase and 1-phase rural electricity distribution note that the costs of
medium voltage (MV) lines may be reduced by using 1-phase instead of 3-phase lines.
The system configurations in use are
3-phase. 3-wire system
In this system, all the distribution lines and transformers are 3-phase. The low voltage
(LV) lines are also 3-phase and customers are supplied with either 3 or 1-phase
depending on their preference. This system has the advantages o f availing the consumer
a choice between 1- and 3-phase, the load is well balanced amongst the phases of
27

the MV lines and it supports sensitive earth fault (SEF) protection (Wyatt & Dingley,
1995). It is however quite expensive.
2. 3-phase with l-phase, phase-to-phase lines
The backbone system is a 3-phase 3 wire system with single phase lines taken between
two phases of the 3-phase lines. Loads are supplied via single phase distribution
transformers e g. 1 l/.24kV, 33/.24kV. This system is cheaper than the 3-phase system
but suffers the disadvantage of unbalanced loading of the 3-phase lines from which it is
tapped and customers can not make their own choice as regards the number of phases
required.
3. 3-phase. 4 wire system
The backbone distribution system is Y-connected with three phase con ' ictors and a
neutral. One phase conductor is extended from the main system with a neutral conductor
which has multiple connections to earth. The cost of such a system is low because the
single phase lines only require protection equipment for the single phase conductor and
the use of the neutral conductor reduces the earthing costs. The main disadvantage is
that this system does not support SEF protection and must rely on earth fault (E/F) and
overcurrent (O/C) protection. Loads are supplied via single phase distribution
transformers e g 6.35/.24kV.
§Ul&Ie Wire Earth Return (SWElb system
V single phase conductor is used with the earth providing a return path. SWER lines can
n°t make up an entire distribution system and have to be used in conjunction with any of
28

the other systems (Wyatt & Dingley, 1995). The SWER lines are supplied from an
isolating transformer to restrict the extent of earth return currents and to allow freedom
in the choice of SWER line voltage. The transformer must be well earthed and must be
capable of carrying the full load current while ensuring step potentials remain within safe
limits. O/C protection is the only applicable scheme and the relay setting must therefore
be sufficiently low to detect all faults.
In a study carried out in Kenya to determine the best electrical system configuration for
application in the rural areas (McCall, 1989), it was found that the single phase, phase-
to-phase provides a viable and economic alternative. The use of single phase motors up
to 20HP was recommended in the study but was found to be unsuitable by KPLC. The
latter gave 7.5HP as the maximum single phase rating that is acceptable and which it uses
citing the following reasons.
a) Beyond this limit there is too much voltage dip at motor starting thus reducing the
distribution radius to contain the voltage dip.
b) Single phase motors require bigger transformers
c) Single phase motors require heavier conductors due to the high current drawn
d) In Kenya single phase motors are more expensive than the equivalent 3-phase units.
However, single phase motors available in the market are of capacity upto 3 HP thus
rendering this system unsuitable where motors above this rating are required.
The cheapest system as regards cost of the line only is the SWER system However, this
requires expensive distribution transformer earthing and isolating transformers thus
ma ang the fixed costs high but with low cost per km of line construction (Wyatt &
ngley, 1995). The viability of this system in a given situation is therefore dependent on
29

the number o f distribution transformers to be supplied and the total line length. The total
cost (fixed cost + cost of line) per km decreases as the line length increases. In the
Kenyan study (McCall, 1989) in which conclusions were drawn in favour of the single
phase phase-to-phase system, this may hold only because the area studied already had the
MV network in place. For a new project, factors like the length of the line and number of
distribution transformers ought to be addressed. Some of the requirements used in the
study to rate the various system configurations, like safety of the system, if well
addressed can be solved. Pabla (1981) recommends the application of SWER as a means
of meeting basic energy needs and promoting productivity in sparsely populated and
isolated villages where the load is scattered, small and unlikely to increase substantially in
5-10 years time.
2.5.3 System cost reduction
In a study carried out by the Asian Development Bank (ADB) in Asian and Pacific
countries (Chullakesa, 1992), it was observed that the cost of RE can be reduced by
altering engineering design standards and design criteria. These observations were on RE
by grid extension and the percentage savings were as shown in table 2.5.1.
30

Table 2.5.1 Percentage savings in RE by altering the engineering design
Item Potential saving as a % of total RE cost
Distribution substation 10
Distribution line
- Correct selection of system voltage 30
- Economic design of line supports 10-20
Distribution transformer 15
Service qualitv and reliabilitv
- Lowering voltage regulation 8-25
- Lowering reliability level 10-15
Meter installation 10
Source: (Chullakesa, 1992.)
Distribution substation cost can be brought down by use of a simple bus arrangement
such as the single bus, avoiding duplication of transformers and correct choice of
substation equipment and design.
A correct choice of system voltage is important as this determines the size of conductor
to be used. This also affects the mechanical design of the line e g pole height & size and
size of insulators to be used.
Voltage regulation can be optimised by a trade off between the incremental investment to
improve regulation and the loss of life of electric appliances in the consumer premises.
Over-voltage often shortens the life of most appliances, e g tungsten bulbs, coils and
transformers, while under-voltage shortens the life of standard motors. The stipulated
voltage regulation at the consumer premises is ±6%. Chullakesa (1992) argues that since
there are very few motors in most rural supply systems, it would be cheaper to specify
31

and procure motors that can cope with -10% voltage regulation at an extra cost of 10%.
He further notes that in the ADB survey it was observed that RE systems designed for -8
to -12% regulation can save on investment by 15-25%. He gives power factor correction
as the most economical means of improving voltage regulation.
For MHP plants working in isolation from the grid supply, Harvey (1993) recommends a
voltage tolerance of ±7% for an all purpose electrical supply system. These limits may be
exceeded when loads are switched on and off for as long as the fluctuations are not
excessive and do not last more than two or three seconds. The Kenyan utility company,
KPLC, allows a voltage dip of 10% during motor starting in the rural areas.
The costs of RE may also be cut by reducing the distribution line losses which are both
technical and non-technical (theft by illegal connection;. It can be very expensive to
reduce these losses and therefore the lowest possible losses may not necessarily be the
most economical. Optimal levels depend on the load density and for a given loading the
technical losses will depend on the power factor, conductor size, system voltage, length
of the line and load factor. Of all these factors, loss reduction by power factor correction
has been found to be the most cost effective (Chullakesa. 1992). Pabla (1981) notes that
the power factor of rural loads without compensation is about 0.7 and an improvement
to 0.85 may reduce the losses by as much as 22.5%. Induction motors commonly used
for agricultural pumping and industrial loads are normally designed for a power factor of
0-8-0.85 at full load This falls appreciably when the motors are run on part load e g for
hghtly loaded motors power factor can be as low as 0 .4 . In practice most motors are run
0n part load due to over sizing of motors because most people fear it may bum out if
32

they purchase the exact rating required for a given purpose. To attain the full benefit
from the investment, power factor correction should be done at the consumer end.
2.5.4 Metering and billing techniques
One of the problems faced by utility companies in connection with RE is the high cost of
revenue collection. This includes meter reading, billing and administration costs. On the
other hand the consumer faces the constraint of high charge for initial connection which
includes the cost of the meter. It is therefore important to try and come up with a scheme
which harmonises the two sides.
Pre-paxment meters
The pre-payment meter provides almost an ideal solution to the utility company’s
problem. The consumer purchases the units of electricity from the supply authority in
advance in as much the same way as filling up a car with petrol. This dispenses the need
for meter reading, billing and default on payments. However, the main drawback with
these meters is the high cost which makes them non-starters for rural areas where most
of the population are low income earners. They have been used extensively in South
Africa principally in townships (Smith, 1995).
Load limitprK
The use of load limiters is a more promising solution for both the consumer and the
utl «ty company. It limits the amount of current drawn by a consumer to a prescribed
value and if it is exceeded, the load limiter trips. Some load limiters require manual reset
e others will automatically reset once the overload is removed. The consumer pays a
k 33

fixed monthly fee depending on his size of load limiter, no matter the amount o f energy
consumed (peak demand based tariff system).
There are three types o f load limiters
i) Miniature circuit breaker - MCB
ii) Positive Temperature Coefficient Thermistor - PTC
iii) Electronic Current Cut-out - ECC
The MCB is the most widely used because it is produced in mass, robust and is cheap. It
uses thermal or magnetic sensing mechanism with some incorporating both. The thermal
and thermal-magnetic are more common. It has to be reset manually after the overload is
cleared. The standard current rating is from 1A to 100A.
The PTC uses semiconductor technology. They are mass produced for overload
protection in telecommunications. It has not been widely used for domestic electricity
connection due to its low current rating - typically 20mA to 500mA.
The ECC is a very recent development which is still at the field trial stage (Smith, 1995).
It uses thyristor switching to cut off the supply in case o f overload. The range currently
being developed is between 500mA and 3A.
The load limiter has the disadvantage that it is prone to illegal connection by by-passing
it or connecting a higher rated one than what is actually paid for. This is because unlike
the metered supply it gives no indication o f the energy consumed in a given period. This
- o r M , . o o p Of OOO— ,0 , _ «
limiter, in addition to the individual ones, installed at the top of a pole to avoid
34

tampering. It then becomes a communal responsibility to ensure that the common load
limiter does not trip Load limiters have been successfully used in Nepal, Zimbabwe and
Sri Lanka. Consumers may be given the option of getting a metered supply.
2.6 MINl/MICRO HYDRO POWER IN KENYA
2.6.1 MHP in KenyaIn the Kenya National Paper published by the Ministry of Energy for the United Nations
Conference (UN, 1981), the author outlines some of the government’s objectives for the
development of new and renewable energy sources as>
* Increase the supply of energy to meet the requirements of the economy.
* Lessening dependence on imported fuels through vigorous conservation
measures aimed at increasing productivity of such fuels and utilization of new
and renewable sources of energy to the extent possible.
* Developing indigenous resources
The author further points out that the sources currently being used are hydro and fuel
wood and the development of mini/micro hydro power potential is under investigation.
However, as o f today very little if anything has been done in this direction. The first
objective which is the most urgent has also not been realized and the energy deficit is
becoming worse by the day. Perhaps unlike in China where these projects have been very
successful, the government has not given them much backing by way of subsidies or
preferential loans and even dissemination of the technology (Jiandong, 1993). It has been
found that (Santos, 1992) micro Hydro power programmes only have a future if the
governments of developing countries show a real and enduring interest in rural and
f f35

village development and it is important that their development is integrated with the
country’s general development plan.
In a study carried out by Mbuthia (1981) he found out that the number of small scale
hydro schemes in Kenya had not increased since 1956 (as of 1981) and that some
existing ones had infact been closed down in favour of the formerly cheap grid supply
and oil-based stations. He further points out that for those that were abandoned, it was
not due to poor performance or uneconomic operation, but they were simply regarded as
an unnecessary bother and were replaced with energy tapped from the national grid. He
writes that, for the survival of small hydro power (SHP), the attitude towards them must
change especially where a large organisation is involved in their management.
Kenya has mainly concentrated on exploiting the large hydro sites while leaving the many
small rivers and streams found in many parts of the country untouched. Muchiri (1980)
reports that small hydro electricity has not received much attention in Kenya and only
exists in isolated places such as ranches and estates, in spite of the fact that they might
even be cheaper as has been demonstrated by Brooke Bond (K) Limited in Kericho. The
company runs four hydro power stations, some diesel generators and is connected to the
Kenya Power and Lighting Company (KPLC) grid supply. The total hydro generation is
2030 kW (Henya, 1995) which contribution to the peak demand is about 65%. In a wet
month, the hydro stations supply 81% of the total power requirement while during the\
dry spell they account for about 30% of the Supply. The economic comparison of the
three sources is as shown below for the unit cost.
V
36

Source Unit cost (Ksh./kWh)
Hydro 1.22
Diesel 10.10
KPLC 8.10
Source: Henya (1995)
From this, it can be seen that MHP supply is the cheapest, followed by KPLC and the
most expensive being diesel generation. The electricity generated is mainly for productive
use in the tea factories with domestic supply accounting for only 14 5% of the peak
demand.
Another successful installation is the Tenwek mission hospital in Bomet District. This has
a 320 kW hydro generator supplying a 300 beds hospital, church, school and staff
houses Generation has been limited to 280 kW to discourage expansion of the plant for
unproductive purposes. To ensure that the domestic load remains low, staff houses have
been fitted with solar panels for water heating and the hospital encourages its staff to use
gas cookers by providing them with free gas cylinders. The hospital also has a standby
diesel generator of 292 kW capacity rating.
Fielder & Berne (1982) in their study on the energy resources of Kenya concluded that
the fuel cost savings achieved by use of electricity instead of kerosene for lighting, and
the secondary benefits resulting from rural electrification may justify' the large capital
c°sts of MHP developments. It has also been found that although small hydro plants mays>
L V 'considered marginal as regards their contribution to the total power supply, they are
lmP°rtant for political and sociological reasons. These projects harness both small hydro
37

power and “small people's power” in the sense that, the people who participate are small
income earners, with low education level and a small amount of technical skill.
2.6.2 MHP sites in KenyaA desk study had previously been carried out (Ewbank, 1979; Finnconsult, 1981) that
used topographical maps -1:50000 scale- with rivers' main course and aerial
photographs, to identity potential MHP sites. Hydrological and geological data was also
used for the investigation of the site power potential and assessment of site suitability for
putting up a power plant. The sites that are within the scope of this study are those that
i) Have hydrological data available
ii) Where there is no grid supply
iii) The site power potential i.e. power input to the turbine, is not more than 650 kW.
iv) Site is accessible.
v) Load centre is not more than 10km away from the MHP site.
The site power potential is estimated using the following equation
P = 9.81 x // x O x 0.9
where the multiplying factor 0.9 is the estimated combined efficiency of the civil works,
power conduit and the penstock.
P - Estimated power potential o f site (kW)
h ■ Gross head (m)
Q - Average river flow rate (nr/s).
e ‘dentified MHP sites in Kenya and the estimated power potential for each are as
^lven in table 2.6.1 below.
38

Table 2.6.1 Existing and Potential MHP Sites in Kenya.
River/Tributary Locationmap)
(1:50,000 Annual Mean Discharge(nr/s)
Max. available head / river section (m/km)
Maximum me< capacity (kW)
Sheet No. Reference1. Arror 90/1 8608 2.12 28 /0 .05 5252. Arror 76/3 8321 1.53 6 0 /0 .4 8103. Arror 75/4 7829 045 6 0 /0 .4 2384. Muruny 75/4 5535 040 100/ 1.0 3545. Muruny 75/4 5733 040 4 0 /0 .5 1416. Perkerra 104/3 0511 2.20 3 0 /0 .7 5827. Nzoia/Kuywa 88/1 8091 0 30 110/0 .5 2928. Nzoia/Moyben 89/2 7590 0.92 2 0 /0 .2 1629. Nzoia/Moyben 90/1 7800 0 65 2 0 /0 .5 11410. Nzoia/Moyben 75/4 7414 0.25 6 0 /0 6 13211. Nyando 118/1 8378 1.50 3 0 / 1.0 39712. Nyando 118/1 8680 1.40 3 0 / - 37013. Kuja 130/3 9112 11 80 6 / - 62614. Kuja/Mogunga 130/3 9311 4.20 16/0 .2 59415. Mara/Anala 131/4 7607 4.60 2 0 / 1.2 81316. Mara/Amala 132/3 8312 4.10 2 0 / 1.0 72517 Mara/Amala 132/3 8412 4.00 2 0 / 1.0 70718. Migori 144/2 0874 4.50 2 0 /1 .0 79519 Muruny 75/4 5436 0 40 250/1.0 88320. Thingithu 122/1 5293 2 80 2 0 / - 49421. Thingithu 122/1 4195 1.60 2 0 / - 28322. Maranene 122/1 4876 1.20 6 0 / - 63623. Thuchi 122/4 ^6360 4.50 1 5 / - 59524. Ena 136/1 4343 2.40 2 0 / - 42425. Ruamuthambi 121/3 0048 040 2 0 / - 7126 Kabingashi 135/2 2943 0.90 3 0 / - 23927. Thaina 120/4 5259 0.85 7 0 / - 52528. Kathita 122/2 8780 14.00 5 . 0 / - 61829 Mutonga 122/1 4580 3.80 1 4 / - 50430 Kaanja 134/4 6214 0.55 2 4 / - 12231. Gathika 134/4 6409 0.61 2 5 / - 13532, Thika . 134/4 6308 1.67 1 5 / - 22133. Gathika 134/4 6309 0.41 2 0 / - 7234 Ruarai 135/1 8535 0.90 2 3 / - 19835. Rutune 135/1 * 9429 3 40 2 0 / - 60036 Sara saba 135/3 9611 3.40 2 0 / - 600
_37__ Kaanja 134/4 6513 0.60 1 5 / - 8038 Ruarai 135/1 8536 0.80 2 0 / - 14139. Gathika 134/4 6309 0.41 1 8 / - 6640 _ Kazita 122/2 8587 14.00 6 . 5 / - 618
E l _Maragwa Mesco* 1.91 4 0 / - 675 (380)
39
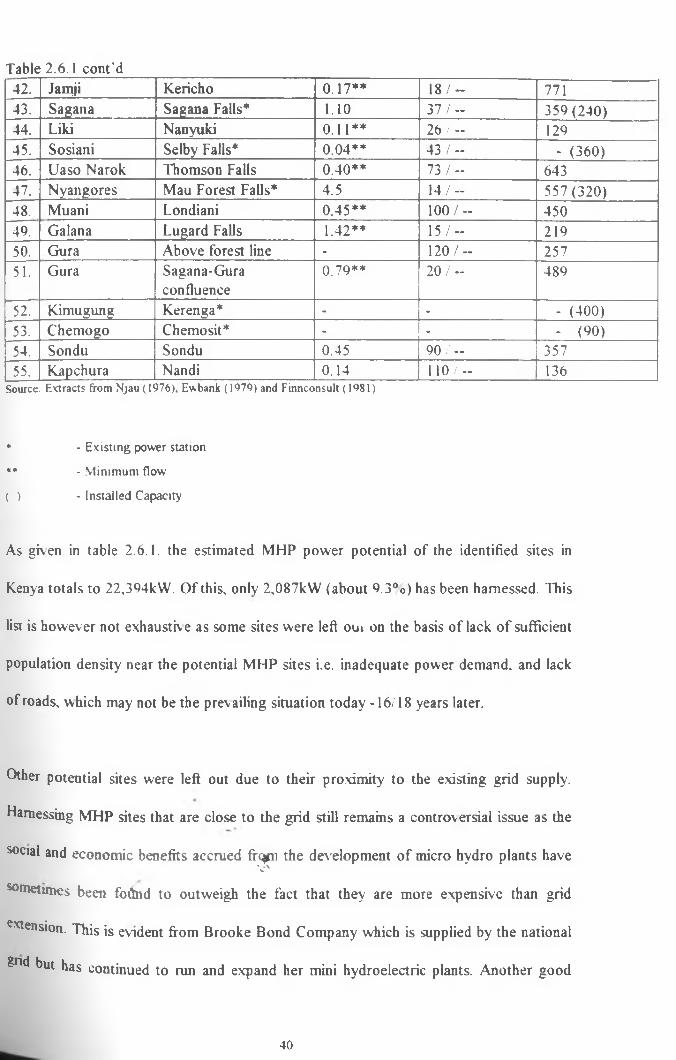
Table 2.6.1 cont'd42. Jamji Kericho 0.17** 1 8 / - 77143. Sagana Sagana Falls* 1.10 3 7 / - 359(240)44. Liki Nanyuki 0.11** 2 6 / - 12945. Sosiani Selby Falls* 0.04** 4 3 / - - (360)46. Uaso Narok Thomson Falls 0.40** 7 3 / - 64347. Nyangores Mau Forest Falls* 4.5 1 4 / - 557(320)48. Muani Londiani 0.45** 1 0 0 / - 45049. Galana Lugard Falls 1.42** 1 5 / - 21950. Gura Above forest line - 1 2 0 / - 25751. Gura Sagana-Gura
confluence0.79** 2 0 / - 489
52. Kimugung Kerenga* - - - (400)53. Chemogo Chemosit* - - - (% )54. Sondu Sondu 0.45 9 0 / - 35755. Kapchura Nandi 0.14 1 1 0 / - 136
Source: Extracts from Njau (1976), Ewbank (1979) and Finnconsult (1981)
* - Existing power station
** - Minimum flow
( ) - Installed Capacity
As given in table 2.6.1. the estimated MHP power potential of the identified sites in
Kenya totals to 22,394kW. Of this, only 2,087kW (about 9.3°<>) has been harnessed. This
list is however not exhaustiv e as some sites were left oui on the basis of lack o f sufficient
population density near the potential MHP sites i.e. inadequate power demand, and lack
of roads, which may not be the prev ailing situation today -16/18 years later.
Other potential sites were left out due to their proximity to the existing grid supply.
Harnessing MHP sites that are close to the grid still remains a controversial issue as the
social and economic benefits accrued frqjn the development of micro hydro plants have*-%\%
sometimes been fodnd to outweigh the fact that they are more expensive than grid
extension. This is evident from Brooke Bond Company which is supplied by the national
fcnd but has continued to run and expand her mini hydroelectric plants. Another good
40

example is the Mau Forest Falls scheme (Tenwek Mission Hospital) which was
developed against the finding that it would have been more economical to extend the grid
supply (Finnconsult & Imatran, 1982).
Other MHP sites have not been accorded any meaningful attention because their power
potential is below 50kW In other countries where MHP has been popularised plants of
capacity as low as lOkW have been installed.
. v
41

CHAPTER 3
DESIGN MODEL COMPONENTS
TECHNICAL DESIGN & FINANCLAL ANALYSIS
3.1 INTRODUCTION
This chapter discusses the main components of a MHP mainly in the areas of civil engineering,
penstock design and electrical equipment. The design steps suggested and use of alternative
materials whenever possible are all directed towards reducing the project cost. A guide to the
choice of equipment to be used is given. A financial analysis of the designed plant is then
carried out A comparative analysis with an alternative source, in this case diesel, is done.
A load demand survey should be carried out in the feasibility study to assess the power
demand in the area. It was not possible to come up with a mathematical model for predicting
this given the available time and resources. Site visits should therefore be made to assess the
potential demand in the area to be served by the MHP plant.
Some of the main factors considered in the assessment o f household power demand include:-
Family income *■?
u) Preference that the consumer gives to electricity with respect to other needs e g. food,
clothing, transport
42

iii) Literacy level
iv) Awareness of the uses of electricity
v) Quality of housing.
Non-household use:-
i) Extent of local commerce
ii) Type and growth of local agriculture
iii) Development o f local agro-industries
iv) Quality and extent of local infrastructure e g. roads, railway, schools, water, health
facilities
v) Any government plans for the area.
A study of the consumption of the fuel used in place of electricity e g. kerosene, would give a
good guideline for the prediction of the domestic power requirement. The growth in
consumption must also be considered and it depends on the population growth and income
level.
A good load estimation is necessary for the planning of the generation plant capacity and
distribution system. These should be planned to serve an optimum period of time which
depends on maintenance costs of the distribution system, annual load growth and the capital
cost of the system. A period of ten years has been found (Mevon & Rao, 1986) to be
acceptable on all counts.\
V
43

3.2 MODEL DESCRIPTION
3.2.1 Site Hydrology and GeologySeparate hydrological and geological studies of the proposed site should be carried out as it is
not covered in this study. Hydrological daily data taken for a period o f 15 years or more
should be used so as to come up with a good model. Kenya has quite a good number of
gauging stations across the country and the data is available at the Ministry of Water
Development. This data is used to assess the power and energy potential of a site and its
seasonal variation throughout the year. It is also used in the design of civil works. The most
cost-effective site is one with the highest head concentrated over a short distance.
The geological survey helps in assessing the best location for proposed civil works and in
estimating their construction and future maintenance costs. Such a survey should aim at
assessing the future surface movements, -marked by loose slopes, storm gullies, flood plai..^-
fiiture sub-surface movements, -marked by land slides, layer faulting- and soil & rock types at
the site.
T2.2 Matching Power Demand and SupplyOpportunities to develop small hydro power plants are often found in remote rural areas where
there is no grid supply This model is therefore designed for isolated operation.
The power potential at a hydro site is determined from the relationship
P = g * H x Q x 0.4 6kW.-............................................................................... 3.1
* %v
44

where
P - power (kW)
g - gravitational acceleration (m/s2)
Q - average discharge How rate (m3/s)
H - gross head (m)
The constant 0.46 is the approximated efficiency of the whole scheme which includes 51% for
the electromechanical equipment (Martinez, 1987) and 90% for the civil works i.e only about
46% of the power available at a hydro site gets to the consumer It is therefore important to
match the power requirement to the power supply. The power demand may vary seasonally
during the year especially where it is put into some agriculture based productive use. For
example a tea factory’s demand is higher during the wet season when tea harvest is high.
During the dry season, the harvest is low and hence the demand is also low. On th' other
hand, where there is irrigation pumping, the power demand is higher during the dry season
than during wet season. The design should cater for the peak demand.
3-2-3 Civil WorksIn this study, only a skeleton design of the civil works has been presented. To reduce on costs,
the civil design should be as simple as is practically possible. The important data that has to be
available include the flow duration curve for the potential site, gross head of water and the
^esign discharge flow rate. There is a great variation in the design of intake, weir and power
anal to suit a wide range o f natural conditions. This study only gives a guideline to the design.
45

3.2.3.1 Intake location
For the small schemes considered in this study, it is recommended that a storage reservoir is
not included unless it is extremely necessary. This is because a reservoir highly inflates the cost
of the plant. Therefore only a simple diversion weir should be built across the river. In locating
the intake care must be taken to find a position which is least likely to be a position of
sediment deposition. The intake mouth should be placed some distance behind the weir to
allow sediment and debris to build up downstream of the mouth. Other factors that should be
considered include
* The nature o f the stream bed
* Bends along the stream
* Natural features along the stream
* Competing uses for water
* Ease o f accessibility.
Having identified the intake location, the data required for its design include the largest river
flow rate (m Vs) for each year recorded, length and height of weir crest (m).
3.2.3.2 Intake dimensions
The intake is dimensioned using the orifice discharge equation.
Q design = Ai Vi ................................................................................... 3.2
Vi = Ca V[2g(hr - h„) ] ...............................................................................3.3
Where
Qdesign - Design discharge flow $ te✓
A - Area o f the orifice which from fig. 3J2.1 (a) = d x w
46

Vj - Velocity of water passing through the intake orifice
Cj - Coefficient of discharge of the intake orifice
= 0 6 for sharp edged, roughly finished orifice
= 0.8 for a carefully finished aperture,
hh - depth of water in the headrace channel
h, - head of water in the river upstream of the weir under normal conditions.
In this study a rectangular shaped orifice has been adopted but other shapes may also be used
and the same dimensioning procedure followed but making changes to suit the particular shape
chosen. The velocity of water in the headrace channel must not be excessively fast as this
erodes the channel while on the other hand it must not be too slow as this would result in silt
deposition The lower limit for silty water and water carrying fine sand is 0.3m/s and 0.3 - 0.5
m/s respectively while for clear water is 0.1 m/s. The upper limit of velocity depends on th''
type of canal used and table 3 2.1 gives the values for different types of canals.
Table 3 2.1.: Allowable maximum flow velocity to avoid erosion (m/s)
Material Less than 0.3m deep Less than lm deep
Sandy loam 0.4 0.7
Loam 0.5 0.8
Clay loam 0.6 1.5
Clay 0.8 2.0
Masonry 1.5 2.0
Concrete 2.0 2.2
Source : Fraenkel P. et al (1991)
^ °°d and quality concrete have been found to withstand velocities of up to 4 m/s while for
thinmetal flumes the maximum is 2-3 m/s.
47

J. 2.3.3 Worst Flood discharge flow
The useful life of large hydro civil works is between 50 and 60 years. Due to the very simple
design and materials used in mini/micro hydro schemes, their life is reduced to about 35 years.
Therefore to take care of flood discharges, civil structures should be designed to cope with the
highest flood discharge predicted in the next 40 years. Very small schemes may be designed
for a life of between 20-30 years. Gumbel distribution method of flood prediction is
recommended because it is simple and easy to use. The description of this method is given in
Appendix B. The flood discharge Qnvennood), is used to design suitable heights of intake barrier
walls and wings.
The conditions at the intake during both normal and flood conditions are as shown in figure
3.2.1.(a), (b), (c).
48

Fig. 3.2.1. (b ): Side view section through the intake during normal flow
49

j. 2.3.4 Headrace channel slope and width
In most MHP schemes, the power canals are often unlined because of the cost savings that
result. An appropriate velocity flow rate is chosen and the headrace must slope downwards
sufficiently to maintain this velocity and the depth of water in the headrace hh at the chosen
value The channel should very closely follow a contour line.
Optimizing channel dimensions
The material in which the canal is excavated or of which it is constructed dictates the cross-
sectional profile. A semi-circular cross-section is the most efficient but it is impractical to
excavate. It is therefore used with materials which lend themselves to this shape e g. pre
fabricated concrete, sheet metal and wood stave sections.
A trapezoidal section is more practical and is the most commonly used. T1 nature of the soil
in which the canal is excavated determines the maximum side slope. Table 3.2.2. gives the
recommended side slope angles for different channel materials.
Table 3.2.2.: Recommended side slope angles for trapezoidal channels
Material Angle of inclination measured from the horizontal, ‘a ‘ (°)
Sand 18
Sandy loam 27
Loam 34
Hay loam 45Clay 60 s>
ConcreteSource • c__, . ~
as■
>

Rectangular cross-section is used where excavation is undertaken in firm rock. This study only
looks at the trapezoidal cross section because it is hoped that earth canals will be used for the
MHP schemes to reduce costs. The canal dimensions are as shown in figure 3 2.2.
Fig 3 2.2 : Canal dimensions
In optimizing the channel design, a compromise between channel head loss and channel size
has to be struck: The hydraulic radius gives a measure of channel efficiency and the higher the
radius, the more efficient the channel is. The hydraulic radius is given by
. . I A sin a , ,r - 0.5 J ............... .......................................................................................... 3.4
V 2 -cosor
where
ct - side slope angle measured from the horizontal
A - wetted cross-sectional area given by
A = Q / V ..................................................................................................................3.5
Penstockpenstock, being gfore expensive than an open channel, should be kept as short as possible.
IriUst be strong enough to withstand surge pressure which results from sudden shut down.
ThePenstock pipe must also not collapse inwards at times of negative pressure. A design for
51

the worst positive surge is sufficient for both positive and negative surges. A safety factor of
between 2 - 3 is adopted.
3.2.4.1 Penstock Material
The factors that determine the material to be used for a particular project include
* Surface roughness
* Design pressure
* Weight and ease in handling and accessibility of the site
* Nature of terrain to be traversed
* Expected life and maintenance requirements
* Local availability of pipe
* Relative cost
* Likelihood of structural damage
* Method o f jointing
* Effect of water quality, climate, soil and possible tampering on the pipe
*f the materials used for penstock, this study recommends the use of either poly vinyl chloride
or mild steel because both are locally available and are relatively cheap It is also
commended that except where the terrain to be traversed is rough and rocky or where the
* is exposed to destruction by either human beings or wildlife, PVC pipes be used where
' Pressure rating allows. High density PVC has been used for heads upto 150m. However,
■ up ■v Pipes must be^protected from ultraviolet (UV) radiation primarily from sunlight which
L .s lt deteriorate fast. This may be done by either burying the pipe, covering with foliage or
tting.
52

j . 2.4.2 Penstock sizing
J. 2.4. 2.1 Choosing penstock diameter.
Selecting penstock diameter is a trade-off between higher costs for larger diameter and higher
frictional loss for smaller diameters. The acceptable diameter is one that results in losses
between 2 - 10% and 5 % loss is a good balance.
2.2.4.2.2 Choosing Penstock Thickness
If mild steel is used for penstock material, a safety factor of 2 can be used. For PVC penstocks
it is recommended that a safety factor of 3 be adhered to due to the fact that it is weaker and is
bound to deteriorate due to UV radiation even when protected from direct exposure.
The young’s modulus of elasticity E, and the ultimate tensile strength Gt for the material mu.‘
be known. A manufacturer’s list giving the available thicknesses and corresponding internal
diameters is also necessary.
2-2.5 Choice of Turbine.For MHP schemes, the developer only need to give the necessary specifications and the
turbine manufacturer/dealer is relied on to select the most appropriate components and ensure
their compatibility as a part of a jcomplete turbine-generator package The selection of the best
turbine for a particular hydro site depends on site characteristics the dominant ones being head
and the available flow Other necessary information include maximum output power needed,
quality, type of governing device required, required speed, altitude o f powerhouse site
Penstock diameter.
53

Turbines may be classified in two broad categories as either
/. Impulse turbines
In this type of turbine, the pressure energy in water is first converted to kinetic energy in the
form of a high speed jet of water emerging from a nozzle. The water jet strikes the runner
imparting its momentum to the surface it strikes and then drops into the tail water at
atmospheric pressure.
These are generally more suitable for MHP applications because of the following advantages
over reaction turbines.
i) They are easier to fabricate and maintain
ii) They are not subject to cavitation
iii) They have better access to working parts
iv) They have no pressure seals around the shaft
v) They have greater tolerance of sand and other particles in the water
vi) They have better part-load efficiency.
However, they are mostly unsuitable for low head sites because of their low specific speeds.
The turbines that fall in this class are pelton, turgo and crossflow.
Reaction turbines
Water pressure exerts a force directly on the surface of the runner which imparts energy on it
fusing a corresponding energy or pressure drop in the water as it goes through the runner.
Water leaves the distributor with energy>in the form of both kinetic and pressure Turbines in
class are francis, propeller and kaplan.
54

The actual type of turbine used is determined by the specific speed N„ and the part load
efficiency of the turbine if the demand is variable. The specific speed is given by
N. J(\A*P„)‘ G H ........................................
Na - generator speed (rpm)
G - gearing ratio. Where there is direct coupling G = 1
P0 - Maximum Turbine output power (kW)
H - Head (m)
3.6
Whenever possible, direct coupling is recommended to avoid complexity and losses.
Table 3.2.3. : Specific speed for different types of turbines.
Type o f turbine Specific speed (metric)
Impulse
1 - Jet pelton 10-35
2 - Jet pelton 10-45
3 - Jet pelton 10-55
4 - Jet pelton 10-70
6 - Jet pelton 10-80
Turgo 20-80
Crossflow 20-90
ReactionFrancis 70-500Kaplan 350-1100Propeller 600-900
55

Despite the complexity, higher cost and poor part load efficiency of the francis turbine, it is
often a popular choice due to the fact that it is the only turbine suitable within a certain range
of specific speeds.
For turbines smaller than 100 kW, fixed pitch propeller turbines for low head, cross-flow or
turgo wheel turbines for medium head and multi-jet pelton wheels for high head are
recommended (Holland, 1983) all either direct or belt drive coupled to the generator.
3.2.6 Choice of GovernorThe frequency of the voltage generated by a synchronous generator depends on the rotor
speed and the number of poles, the latter being fixed at machine construction. The speed is
therefore the only variable parameter that affects the frequency and is directly proportional to
it Changes in frequency may cause damage to electrical appliances connected o the supply.
For example, when frequency is too low, motor and transformer losses increase.
This study recommends the use of an ELC for plants of capacity less than 200kW except for
cases where a storage reservoir is found to be extremely necessary, in which case a speed
governor may be used. This allows the use of simpler turbine design and avoids the use of
complex mechanical governors. Since an earlier suggestion of run-of-river schemes has been
made, the fact that water is wasted to generate power supplied to the ballast becomes
Relevant as there is no provision for storage.
A deviation of ± 1% of the rated frequency is allowed by the Kenya Power & Lightning
^pany and has been adopted in this study.
56

3.2.7.1 Supply system - AC or DC
In Kenya the grid supply system is AC. This study has been carried out with the background
intentions of connecting the MHP plants to the grid once it has been sufficiently extended to
the rural areas. Coupled with this, most o f the electrical appliances in the Kenyan market
require an AC supply. With these two dominating factors an AC system has been chosen for
the MHP plants. DC generation may be used only where the plant is for battery charging -
very common in Sri Lanka- which has not been discussed in this study.
3.2.7 Electrical Design
3.2.7.2 Single phase or three-phase
Harvey (1993) gives an approximate rule of, systems up to 10 kW may be single phase while
those over 5kW may be three phase. Three-phase generation has been recommended in this
study for plants rated more than lOkW and 1-phase for smaller plants for the following
reasons.
* Attaining a balance in all the three phases would be difficult at low power rating hence
the use of 1-phase below lOkW.
* 3-phase generators and motors are more common, cheaper and smaller than their 1-
phase equivalents.
* A 3-phase system delivers power more efficiently and the transmission line is cheaper
per unit of power delivered.T|*
s distinct grouping between 3-phase and 1-phase generation has been used by ITDG
Holland■» 1996) inseveral countries all over the world.
57

Since Kenya does not manufacture her own generators, it is recommended that standard ones
are used instead of custom built to suit a particular hydro site This has the advantages of
ready availability, costs less than a special made unit and spare parts can be easily found. The
generator used can either be induction or synchronous type. Whatever choice of generator is
made, the 3-phase and 1-phase generation voltage should be 415V and 240 V respectively at a
frequency of 50Hz, these being the national standard values. In this study, induction
generators have been recommended for use where they cost less than synchronous generators,
both single phase and three phase, which is generally upto 25kW (Smith, 1994).
3.2.7.3.1 Synchronous generator
A synchronous generator with a revolving field and stationary armature is preferable due to
the fact that it is more advantageous to have the more complex part being stationary. It is also
easier with this arrangement to protect and insulate the stationary armature leads which carry
current at high potential.
The self-excited generator makes a better choice and is recommended. The static excitation
system has the advantage that it has no rotating parts and therefore requires less maintenance.
They also have fast current response which contributes to improved transient stability. These
have been used in MHP plants throughout Sri Lanka, Indonesia, Peru and Nepal (Holland,
1996). The DC power requirement of the field is generally much less than the machine rating
^ « typically les* than i%.
J.2.7.3 Generator
58
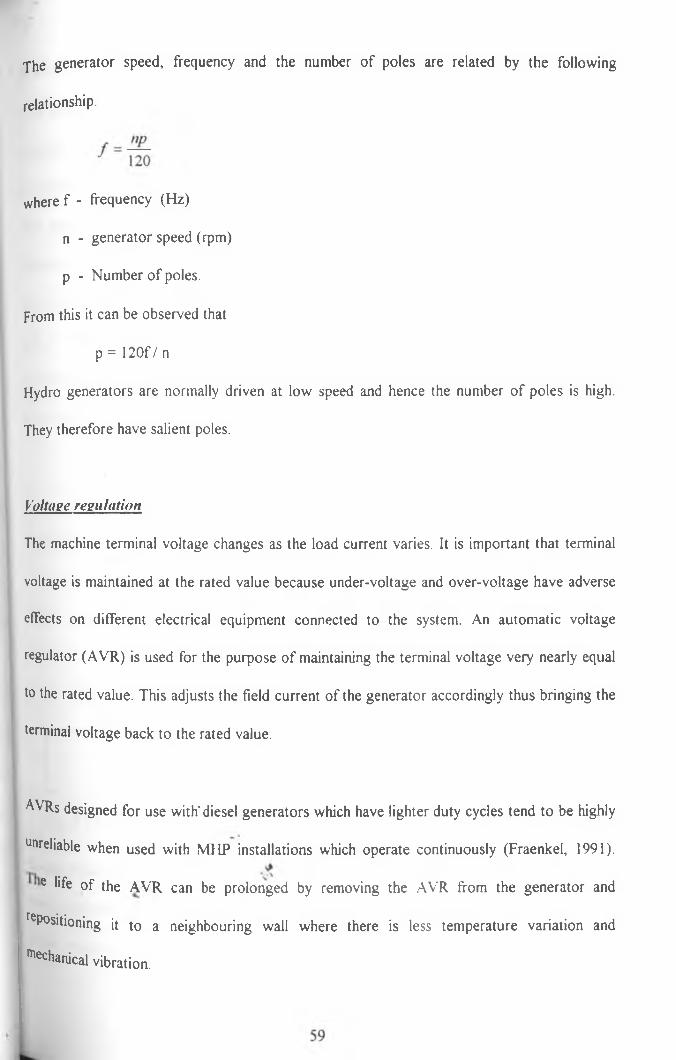
The generator speed, frequency and the number of poles are related by the following
relationship.
where f - frequency (Hz)
n - generator speed (rpm)
p - Number of poles.
From this it can be observed that
p = 120f / n
Hydro generators are normally driven at low speed and hence the number of poles is high.
They therefore have salient poles.
Voltage regulation
The machine terminal voltage changes as the load current varies. It is important that terminal
voltage is maintained at the rated value because under-voltage and over-voltage have adverse
effects on different electrical equipment connected to the system. An automatic voltage
regulator (AVR) is used for the purpose of maintaining the terminal voltage very nearly equal
to the rated value. This adjusts the field current of the generator accordingly thus bringing the
terminal voltage back to the rated value.
AVRs designed for use with'diesel generators which have lighter duty cycles tend to be highly
unreliable when used with MHP installations which operate continuously (Fraenkel, 1991).
e ^fe of the AVR can be prolonged by removing the AVR from the generator and
^Positioning it to a neighbouring wall where there is less temperature variation and
^chanical vibration.

The induction generator is only used where it gives a cost benefit over the synchronous
generator which generally tends to be up to about 25 kW. This must however be confirmed
from the market.
The squirrel cage type is the most common and the simplest form and should always be
selected because it is less expensive and more robust than the wound rotor type (Smith, 1994).
For the plants under study that have been designed for isolated operation, excitation capacitors
are a requirement. Harvey (1993) recommends a star connected generator with delta
connected excitation capacitors (figure 3.2.3.) for a three phase supply because this
arrangement requires less capacitance values.
j 2.7.3.2 Induction Generator (IG)
% 3.2.3. A star connected IG with delta connected excitation capacitors
To 3 phaseIGC and load
S|ngle phase induction generators a r^n o t manufactured in sizes above 2 kW and they are
m°re expensive than three phase motors. Single phase output may be obtained from a three-
Phase machine by using the ‘C-2C’ connection shown in figure 3.2.4. The unbalanced
60

arrangement of capacitance helps to compensate for the unbalanced load on the generator. The
v^ue of ‘C’ calculated is that required for normal 3-phase 240V delta operation.
Fig. 3 2 4.: Single phase supply system using the 'C -2C ' arrangement
3.2.7.4 Transformer
It has been found that (Walkade, 1986) to transmit power up to 10 kW, the distribution
system required can use secondary voltage circuits so as to keep the unit cost low. The load
centre must be within 1km of the generation station to limit the voltage drop. Sites with a
potential of this size will most likely not be feasible if the load centre is more than 1km away
Therefore, for all the single phase units no transformer is required.
The 415V system voltage may be used for supplying loads not exceeding 40 kW in total within
, of the generating station (Taylor, 1969). For loads exceeding this capacity and distance
the voltage may be stepped up to 1 lkV or 33kV which are the standard voltage levels used in
KenVa For the purposes of this study,'the 1 lkV system is considered to be adequate. Taylor
^9(>9) recommends this voltage level for loads less than 5MW over distances of up to 8km.
61

In a study carried out in Malaysia (Shanker & Krause, 1992), the allowable distance between a
micro hydro station and the load, and the associated voltage drops for various values of power
transmitted on an 1 lkV system were found to be as given in table 3.2.4. These values have to
be confirmed on a case by case basis.
Table 3.2.4. : Maximum allowable distance of transmission for various amounts of power at
11 kV.
Peak Load (kW) Voltage drop (V) / km Maximum distance (km)
500 40 22
350 28 16
200 16 11
100 8 7
50 4 4
Source: Shanker & Krause (1992)
A delta-star (LV/HV) connected transformer is the most suitable because it allows for the
circulation of currents in the delta circuit in case of load imbalance.
In specifying the transformer rating, the power capacity is given in KVA. This must be capable
of handling the rated generator output and its allowable overload. As much as possible, a
standard rating should be chosen. The voltage rating required is 0 415/1 lkV.
3-2.8 Protection Scheme^ comprehensive protection scheme l^s been designed for both the generator and
V '
tr3nsformer because if any of the two units is damaged, this would cost a great
b°th in financial terms and the inconvenience caused to the consumers.
62

J. 2.8.1 Generator protection
/. Rotor earth fault (FF) protection
The DC injection method is recommended for this fault protection with
connections as shown in figure 3.2.5.
F i g 3 . 2 . 5 : Rotor E/F Protection
The field is biased by a d.c. voltage which causes current to flow through the relay for an earth
fault anywhere on the field circuit.
(Mehta , 1982) and it cannot cause immediate damage to the
can be relied on to disconnect the machine manually in case of
s>
^ hieIJ Failure
This is a very rare occurrence
machine. 1 he station attendant
failure.
63

j Unbalanced stator currents
^ negative sequence relay is connected in the stator circuit to detect imbalances which may be
due to
j) Open-circuiting of one phase o f a line or failure o f one contact o f a circuit breaker,
jj) Unbalanced fault near the station which is not cleared promptly,
jjj) A fault in the stator winding.
These faults are protected by other relays and so the inclusion of the negative sequence relay is
optional. The flow of unbalanced currents causes heating o f the stator. The heating time
constant of the machine is expressed by a rating equation.
K = l i t
K - Constant which depends on the method of stator cooling
I2 - Negative sequence current in per unit based on the continuous maximum rating
t - Current duration in seconds.
The protective relay should have a time current characteristic (U2t = K) that closely matches
that of the machine to avoid unnecessary disconnection.
When an induction generator is used, a derating factor is applied to allow for load imbalance.
However, to protect against severe overload on a phase, miniature circuit breakers (MCBs)
rated for 1.5 times the rated full load generator output can be used (Smith, 1994).
s>
64

^ Overload protection
$ets below 30 MW are usually provided with a thermal relay that detects overheating of the
stator windings (Ravindranath & Chander 1977; Wadhwa, 1983). Thus no extra protection is
required.
The excitation of the induction generator collapses when the machine is overloaded thus
limiting the winding currents to safe values.
5. Prime mover protection
In case of prime mover failure, the generator starts motoring and draws power from the
system. For the purposes of this study where the plants have been designed tor isolated
operation, the question of reverse power flow does not arise However, protection may be
achieved by providing mechanical devices to disconnect the generator when the water flow
drops to an insufficient rate
6. Overvoltage Over speed protection
An overvoltage may result due to
(a) A faulty voltage regulation system
(b) Sudden loss of generator load with consequent overspeed.
1 An overvoltage relay is used for the protection against these fault conditions. It has two units;
1 an instantaneous unit (inserts resistance in the exciter field circuit) set to operate at 140% ot
■ l^e rated voltage value and an inverse time unit (if the overvoltage persists, it shuts down the
generator) with a pick-up setting of J^0% (Warrington, 1968, Wadhwa, 1983). The relay
^ compensated for frequency and energised from an unregulated voltage supply.
65

On loss of load, an induction generator draws current from the capacitors hence increasing the
winding current above the rated value. To protect the capacitors and the windings againsti
damage, a three-pole MCB should be fitted in series with the capacitors. Its current rating
should be between 1.2 and 1.5 times the capacitor current under normal conditions (Smith,
1994). Magnetic MCBs are preferable to thermal ones because they are more accurate and are
unaffected by temperature variations.
J.2.8.2 Generator - Transformer Protection
Whenever a transformer is used, it is recommended that the generator and transformer units
are directly connected so that the two are protected as one unit by a biased differential
protection scheme. This has been chosen because it is cheaper to protect the two as one unit
and biased differential protection is more reliable than simple differential relay during through
faults This scheme detects phase-to-earth faults and the arrangement is as shown in figure
3.26.
A - Y transformer
3.2.6. : Biased differential protection for the generator-transformer unit
66

CTs on the delta side of the transformer are connected in star while those on the star side are
connected in delta. This is to counter the 30° phase shift o f currents in a A-Y transformer. This
connection also eliminates zero sequence component o f current on the wye side which might
otherwise upset stability due to lack of corresponding component on the delta side and thus
prevent tripping on an external fault on the wye side (Warrington, 1968). Alternatively,
interposing CTs may be used to correct the phase shift.
No appreciable magnetizing in-rush current is produced when the transformer is magnetised
near a voltage zero and therefore harmonic restraint is not necessary
Typical values of bias are 10 to 40% and pick-up setting of 50-100%. A pick-up setting of
20% and 20% bias has been found to be satisfactory (Rushton 1986, Ravindranath & Chander,
1977).
3.2.8.3 Transformer protection
In addition to the biased differential protection, the transformer has other protection schemes.
The Buchholz relay is recommended for the detection of incipient faults.
These include:-
(a) Insulation failure o f windings
(b) Fall o f oil level due to leakage
(c) Coolant failure which causes temperature rise.
The transformer must have a conservator for this relay to be fitted
67

j 2.9 Switchgear
Circuit breaker rating[t is recommended that a CB be located after the transformer just before the bus-bar and
immediately after the bus-bar on each feeder as shown in figure 3 2.7.
Transformer
Generator CB
X -CB
XCB
Fig 3.2.7.:Circuit breaker locations
The following CB ratings must be given in specifying the required breaker.
(i) Breaking capacity
This is the rms current that the breaker is capable of interrupting at a given recovery voltage
The symmetrical breaking current is used to calculate the KVA rating.
KVAscr v A ^ ,
where IK = symmetrical short circuit current
KVL4. = Line-line voltage
KVAw = Base KVA f »\
z* = per unit impedance

(ii) Making Capacity
This is the peak value of current during the first cycle of current wave after the closure of CB
contacts.
Rated making capacity = 1 8 x V2 x If
= 2.55 x If.
The factor 1.8 accounts for the asymmetry present in the short circuit current.
If = rated breaking current (rms)
(Hi) Short-time rating
This defines the time for which the CB is able to carry fault current without damage while
remaining closed. The rating is based on thermal limitations and the breaker's ability to
withstand the electromagnetic force effects.
(iv) Normal current rating.
RMS value of current that the CB can carry continuously at rated frequency under specified
conditions.
Since the maximum system voltage will be l l kV either air or oil break type of CB may be
used.
V - '
69

3.3 T E C H N I C A L D E S IG N
3 3.1 Matching Demand and Supply
Whenever conditions allow, the choice of turbine and generator made should be one which can
provide the peak power demand predicted in the load survey. The discharge flow rate required
to generate this power is calculated from equation 3.1 as
Q c a lc ~
Pg x H x 0.46
m7s. 3.7
P is the maximum demand predicted in the load survey.
If this flow is less than the minimum river flow rate, then the plant can supply the required
power throughout the year. The design discharge (Qd«lgn) will be equal to the value calculated
(Qcaic) in 3.7 above. On the other hand, if Qcjic is more than the minimum river flow, then the
demand cannot be met all the year round and some load management measures have to be
taken to suit the power supply pattern. In such circumstances, a de^!0.i discharge
corresponding to 70% exceedance (Q7o), which has been used in India (Kedia, 1986), has been
adopted in this model. However, if QM|C. is less than Q70 i.e. the percentage exceedance of
Qcaic- is more than 70%, then the value of becomes the design discharge. A turbine with
adjustable blades is recommended for such cases so as to give a reasonable part load
efficiency.
1-3-2 Civil Works
' 1 Intake dimensionss>Vx
^ procedure followed for dimensioning the intake orifice is iterative adjusting various
fetors so as to achieve a suitable flow velocity.
70

Xhe data required includes depth of water upstream of the weir hr and design discharge flow
rate, Qdc*ign-
fnr determining ori fice dimensions
1 Choose a value for the depth of water in the headrace channel, h nonnai), e g. hh = d
2 . Under normal conditions hOVertoP 541 0
hrlnormal) — hweir llovcrtop
— hwcir — hr(norina|)
3 Calculate the velocity of water through the orifice using equation 3.3
Vi = Cd V[2g(hr-hh)]
If the value of velocity is outside the set limits, adjust the most appropriate factor and
repeat steps 1 to 3.
4. Calculate the value of the width of the intake orifice from equation 3.2
Q = d x w x V,
c/xF(
The velocity may be altered by
(a) Adjusting the weir crest height, hweir. Increasing this value while holding all other
parameters constant increases the velocity while reducing it has the opposite effect,
(fi) Adjusting the depth of water in the headrace, hh. Increasing this height reduces the
velocity while reducing it resets in a faster flow.
71

(c) Adjusting the intake position from the river-bed so as to adjust the head of water in
the river upstream of the weir, h,. Reducing hr by raising the intake position results
in a lower flow velocity while lowering it has the opposite effect.
The choice of the factor to be altered depends on the economics involved and the seasonal
variation of the river flow.
13.2.2 Height of flood harrier and wing walls
The value of predicted flood flow rate is used to calculate the flood level, Ivertop, during worst
flood. The standard weir equation is used i.e.
3.8
where
Qnvcr (fioodr river flow during worst flood (m3/s)
Cw - Coefficient o f discharge which depends on the weir crest profile. Values for
different profiles are given in table 3.3.1.
Lwcir - weir crest length (m)
overtop - flood level to be calculated.
from equation 3.8
r Ofa __ f c n v t r i flood)“Tvtrtop ~ " 3.9
CWL
Ig s*P be observed from this relationship hover-top is inversely proportional to the length of thek jrI Cfest. It is therefore advisable to choose a high value of weir crest length.
72

The height of the barrier wall should be 0.5m higher than the predicted flood level.
hbamcr ( h weir h<jvcrtop 0 . 5 ) IT1 ..................................................................................... 3 . 1 0
Table 3.3.1. : Coefficient of discharge Cw for different weir profiles.
P r o f i l e of c r e s t of w e i r c w P r o f i l e of c r e s t o f w e i r
b r o a d ; s h a r p e d g e s1.5
b r o a d ; r o u n d e d g e s 1 . 6
r o u n d o v e r f a l l 2 .1
Source: Han ey (1993)
I s h a r p - e d g e d1.9
r o u n d e d 2 . 2
r o o f - s h a p e d2.3
J-3.2.3 Headrace channel slope and dimensions
m>±for calculating channel dimensions
* Decide upon the length of the channel L and have a record of rated channel flow Q.
* Choose a suitable velocity that is within the limits for the particular type o f channel.
Deduce the value o f wetted area from equation 3.5.
Prom table 3.2.2. choose the most efficient side slope angle ‘a ’ and calculate the
Hydraulic radius using equation 3.4.sJ f the angle is not practically achievable, choose aV '
Citable value.
Estimate the value of manning’s roughness coefficient ‘n’ from table 3.3.2. then calculate
l e slope using Manning’s equation.

3.11S = [ n V /r273]2
If this slope is not practically achievable, give the maximum slope attainable, SFIX, and
calculate the hydraulic radius using the equation
6 Determine the channel headloss ; HL = L x S.
If the headloss is more than 5%, repeat steps 2 to 5 using a lower value of velocity. If on
the other hand this loss is too small, increase the velocity - which results in a smaller
channel size - and repeat steps 2 to 5.
7 Calculate the channel dimensions as shown in figure 3.2.2 from the following:-
wetted height H = 2 r.
wetted top width T = 4 r/sina
Bottom width B = T - 2H/tana
8 Find the channel width and depth by multiplying T and H by the freeboard allowance F
(usually 1.2) which ensures that the channel does not overspill when carrying a flow in
excess of the design discharge flow.
Table 3.3.2. : Manning’s Roughness Coefficient ‘n’.
EgLlh ccmals
Clay
S°lid material, smooth
^nd with some clay or broken rock
^°hom of sand & gravel, with paved slopes
lne gravel, 10 - 30mm
^ u m gravel, 20^- 60mmp°«rse gravel, 50- 150mm
Clo<% loam
0.0130
00222
0.0167
0.0200
0.0213
0.0250
0.0286
74
0.0333

Lined with coarse stones 0.0370
Sand, loam or gravel, strongly overgrown 0.0455
^Qckccmgk
Medium coarse rock muck 0.0370
Rock muck from careful blasting 0.0455
Very coarse rock muck, great irregularities 0.0588
M'nsonrv canals
Brickwork, bricks, also clinker, well pointed 0.0125
Ashlars 0.0133
Thorough rubble masonry 0.0143
Normal masonry 0.0167
Normal (good) rubble masonry, hewn stones 0.0167
Coarse rubble masonry, stones roughly hewn 0.0200
Rubble walls, paved slopes, sand and gravel bed 0.0213
Wooden channels
Planed, well-joined boards 0.0111
Unplaned boards 0.0125
Older wooden channels 0.0149
Natural water courses
Natural river bed, solid and no irregularities 0.0244
Natural river bed, weedy 0.03 13
Natural river bed with rubble and irregularities 0 0333
horrent with coarse rubble (head-sized stones),
tad load at rest 0.0385
Torrent with coarse rubble, bed load in motion 0 0500
ExUacted from Fraenkel etal. (1991)
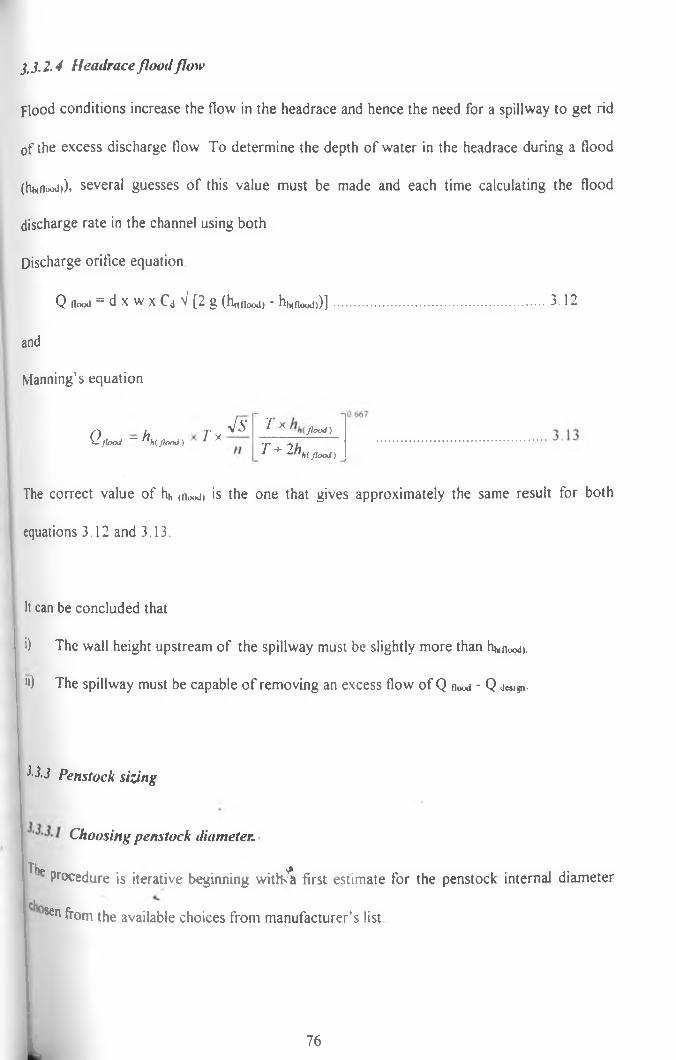
j. J. 2.4 Headrace flood flow
Flood conditions increase the flow in the headrace and hence the need for a spillway to get rid
of the excess discharge flow To determine the depth of water in the headrace during a flood
(hhdiood)), several guesses of this value must be made and each time calculating the flood
discharge rate in the channel using both
Discharge orifice equation
Q flood = d x w x Cd V [2 g (hrtHood) - hh(flood,)]......................................................... 3.12
and
Manning’s equation
^ X flood)
T + 2hh(JlooJ)Q jiooj - h.h( J lo o J) T x J s
The correct value of hh (flood) is the one that gives approximately the same result for both
equations 3.12 and 3.13.
It can be concluded that
i) The wall height upstream of the spillway must be slightly more than h Aood).
u) The spillway must be capable of removing an excess flow of Q flood - Q j«ign-
3 J J Penstock sizing
Choosing penstock diameter.
Thp ^Procedure is iterative beginning with'-a first estimate for the penstock internal diameter
^n from the available choices from manufacturer’s list
L76

The data required include penstock length (L), design discharge flow rate (Qd«.gn), gross head
(Hgn«) anc* the number of bends along the penstock profile, n.
<n>ps for determining penstock diameter
1 Estimate penstock diameter, D, in metres
2 Calculate the velocity of flow in the penstock using
V =4 0z-Jestgn
kD 2
3 Determine the frictional headloss
a. ) If a pipe manufacturer’s friction loss chart is available, read hf.
b. ) If the chart is not available
(i) calculate Reynold’s number Re = V x D x 106
(ii) Find the ratio e = k/D where k is the equivalent grain size and values tor
different materials are given in table 3.3.3.
(iv) Deduce the friction factor f from moody’s chart fig. 3.3.1.
(v) Calculate the frictional headloss
f gD
4 Deduce the headloss coefficients for each o f the bends from table 3.3.4.
Turbulence headloss
% y « .
V .
where n - total number of bends
77

K, - head loss coefficient for the i* bend
Determine the percentage headloss
%HL =hf +htHgross
X 100
(i) If this value is more than 10%, increase the diameter size and repeat steps 2 to 5.
(ii) If the value is less than 2%, reduce the diameter and repeat steps 2 to 5.
Table 3.3.3. : Roughness values, k mm for different materials.
Material k mm
Smooth pipePVC 0.01
Concrete 0.15Mild steel
Uncoated 0.10Galvanised 0.15
Cast ironNew 0.30Old - Slight corrosion 1.50
Moderate corrosion 3.00Severe corrosion 10 0
Source : Harvey (1993)

. F
rict
ion
fact
or
F i g c m 2.3.1:.* locd u di agram
Re
lati
ve
ro
ug
hn
es
s

Table 3.3.4. : Turbulence Headloss Coefficients
H e a d l o s s c o e f f i c i e n t s f o r i n t a k e s )
W0.5
v Z ' w r^ e n t r a n c e 1 0 0 - 8
H e a d l o s s c o e f f i c i e n t s f o r b e n d s ( ^ c n j )
B e n d p r o f i l e :
D
R / D
^ b e n d
H e a d l o s s c o e f f i c i e n t s f o r s u d d e n c o n t r a c t i o n ( K c o n t r a c t i o n 1
577------^C o n t r a c t l o n p r o f i l e : ____ 1________________________________
T
1.00
1.50 D
2.00.35
2.50.40
1 U argc
0.2
0.9
0.4
0.7
0.6
0.4
0.8
0.1
0.2
1 2 3 5
II rvj
00
0.36 0.25 0.20 0.15
= 45° 0.45 0.38 0.30 0.23
= 90° 0.60 0.50 0.40 0.30
K *-c o n t r a c t i o n
Head loss coefficients for sudden enlargements (K*niarge)
5.00.50
1.0
0
Head loss coefficients for valves (Kva|VC)
Type of valve spherical gate
Kvah-e 0 0.1
butterfly
0.3
Source : Fraenkel et al. (1991)
■Uj.2 Choosing Penstock thickness
Jorjietermining penstock thickne * *\ S.*.
Estimate penstock thickness t (m)
Calculate the pressure wave velocity

1c =
where
C - wave velocity (m/s)
p - Density of water (1000 kg/m3)
K - Bulk modulus of water (2.1 x 10S * * * 9 N/M2)
D - Internal pipe diameter (m)
E - Material young’s modulus of elasticity (N/M2)
t - pipe wall thickness (m)
Calculate surge pressure in terms of surge head
Where V - flow veloc:t'
g - gravitational acceleration
Calculate maximum expected pressure head
Calculate the minimum allowable pipe thickness
min
\ s J
S - Safety factor
Check if the estimated thickness is less than tmuI. If yes, increase t and repeat steps 2
through 5.
^ the estimate is more than tmtn , check from the manufacturer’s sizes whether this value
Can be closer to tmin. If yes, repeat steps 2 to 5.
81

j j 4 Choice o f Governor\Vhen the plant size is less than 200kW, an ELC is preferable. For bigger plants, the
conventional speed governor may be used.
j j.5 Electrical Design
3.3.5 I Generator(i) Synchronous Generator
Flpctrical specification
The power generated must be sufficient to supply the load demand and transformer &
distribution line losses. It is also important to ensure that the voltage reduction due to motor
starting is minimised. To cater for all these factors the generator is normally over-rated by
25% and by 60% if a phase controlled ELC is used. This is due to the fact that when
conduction is retarded, the generator sees the ballast load as a load with a lagging power
factor (Harvey, 1993). In this study, ELCs are recommended for plants of capacity up to
200kW. The appropriate generator rating is given by>
x 1.6 for P,demand< 200kW
X 1.25 for Pdemand > 200kW
where
Pdemand - estimated demand in kW
Pf - rated power factor
Other important specifications that mustsbe made when ordering a generator are voltage rating
which in this case is 415V and 240 V for 3-phase and 1-phase respectively at a frequency of
50Hz.
82

The ambient temperature and humidity o f the powerhouse should be given as these can affect
of the generator.
Some generators have built-in protection schemes against underspeed, overload and short
circuit.
(ii) Induction Generator (IG)
Selection o f suitable induction motor for use as a generator
Harvey (1993) gives a derating factor o f 0.8 to be applied on the generator rating required e.g.
if the power demand is 20 kW, choose a motor o f 20/0.8 = 25 kW rating. If the rating
calculated is not standard, get the closest rating that is higher than this value. This simple
derating rule has been found to be sufficient in almost all cases. It compensates for possible
load imbalance in the phases and also caters for the generator losses which must be supplied
from the mechanical input power.
Capacitor sizing
Having identified the size of motor required, the machine’s data can be obtained from the
manufacturer giving its characteristics. If such information is available, the rated full load
current and corresponding power factor are necessary for the determination of the
aPproximate capacitance required for self-excitation. The magnetising current component o f
full load current (In) may be estimated by
the insulation of the generator windings. It is also important to know the overspeed capability
83

where
Imag - magnetising current
In - rated full load current
pf - power factor at full load
The magnetising reactance -which is the capacitive reactance required for excitation- is given
by
X c
V.rated ( L - L )
mag
X
where V ratCd(L-L) - rated line-line voltage
Therefore the capacitance required per phase is
C =1
2 *fXe
However, if the manufacturer’s data is not available, then a no-load test has to be performed
on the motor. The line current is measured when the motor is supplied at rated voltage and
frequency. The measured current is the magnetising current drawn by the motor and the
capacitance required is calculated as in the previous case. Under normal circumstances a value
within 10% of the calculated value is adequate (Harvey, 1993; Smith, 1994).
d .i.5 .2 . Transformer
A transformer is not necessary for all_single phase plants (P<10kW).
F°r the plants whose generation is threfc phase, if the load is less than 40kW and the
transmission distance is less than 0 8km, no transformer is required. All other cases will have a
4l5V/llkV step-up tra/oformer.
84

j j f i Protection Schem eSettings of the relays discussed earlier in section 3.2 should be determined by the designer.
For the biased differential unit protection of the generator-transformer set, the CTs chosen
must be capable o f carrying the full load current. Hence the primary rating of the CT, n, at the
generator neutral is given by
q - generator overload capability
j - generator full load current rating after allowing for overload tolerance.
KVA„t.ng - generator KVA rating
VrJted - generator rated voltage
The rating o f the CT, m, on the transformer HV side is given by
/ gen' HV ~ rrV3 x a
Where
a - Transformer turns ratio as marked on Fig. 3.2.6.
The values o f n and m (fig. 3.2.6) are chosen from available standard CTs closest to the
cakulated values. In some cases, the standard values chosen may not exactly match due to the
lransformation ratio. The ratio of the ratings of the CTs should be Igen/Irrv = 1/^3. Auxiliary
^Ts may be used to achieve this ratio but adjustment of tap-settings on the relay coil .j a
etter alternative. This provides an adequate margin to correct for most practical ratio
misn«tches.

fable 3.3.5 Summarised Design
ffrEM
'fj^pA^rks
. Dam
. Reserv oir
DESCRIPTION
- Use a simple diversion weir
- Not necessary for plants below 200kW using
ELC. May be considered for higher capacities
. Intake
- Flood discharge rate
- Power canal
- Penstock
Turbine
Governor
ferrictencal Design
Generator
using a speed governor
- designed to satisfy allowable water flow velocity
both minimum and maximum.
- Cater for worst flood predicted in 40 years
- use earth canal
- Maximum headloss of 5%
- Headloss between 2 - 10%
- safety factor - 2 for steel
- 3 for PVC
- Determine the specific speed
- ELC for plants < 200kW
- Speed governor for plants > 200kW
- All AC generation
- 1 - <J> for plants of capacity < lOkW at 240V
*3 - <J> for plants of capacity > lOkW at 415V
N> . . . . .- For plants less than 25kW capacity the induction
generator when chosen may provide a better
option to reduce the generation equipment cost.

fahjej 3 5 cont'd
. Transformer
For higher capacities self-excited synchronous
generator is recommended.
- Not necessary for all 1 - <J> plants and 3 - 4> loads
less than 40kW transmitted within a distance of
0.8km. All other cases require a 415V/1 lkV step-
up transformer.
Protection
. Generator Protection
- Rotor earth fault - DC injection method
-Field failure - not necessary
- Unbalanced stator currents - not necessary
- Overload - thermal relay fitted by manufacturer
- Prime mover protection - not necessary when plant is run in isolation from
- Overvoltage/Overcpeed
the gnd.
- use overvoltage relay
Generator-transformer protection - Biased differential protection
iA FINANCIAL f e a s ib il it y o f m h p p l a n t s
Introduction
nancial feasibility d^ermines whether the tangible value of project output is sufficient to
rtlse the project loan, pay operation and maintenance costs and meet other financial
Rations. Economic feasibility on the other hand involves the analysis of both tangible and

intangible benefits and costs of an investment from the point of view of society as a whole. A
project that is economically feasible may not necessarily be financially feasible and vice versa.
This study only gives the financial analysis of MHP plants as it is hard to quantify the
intangible costs and benefits required for economic analysis. Moreover, it is more important to
have the schemes being first and foremost financially sound for self-sustenance.
MHP schemes are characterised by high initial capital cost and low operating costs thus
making them very sensitive to interest rate. They are to some extent inflation proof because
the energy costs are very low The capacity factor is also a critical consideration as it directly
affects the price of electricity.
The Net Present Worth (NPW) method of financial feasibility analysis is chosen. Other
methods include benefit/cost ratio (B/C), payback period, Life Cycle Costing (LCC) and
Internal Rate of Return (IRR). The NPW offers the following joint advantages over other
methods.
0 It gives a monetary indication of the project feasibility.
u) It recognises time value of money.
Ul) It takes care of the opportunity cost of capital.

1 4.2 Financial A nalysis
The necessary parameters for project analysis are
a) Plant installed capacity, P
b) Annual energy production, E
c) Plant capacity factor, CF
d) Capital cost including cost of distribution, C
e) Annual operation and maintenance cost, OM
f) Discount rate, r
g) Interest rate, i
h) Construction period, t
i) Financing period, k
j) Plant’s useful life, n
Operation and maintenance of MHP plants has been found to account for 3% of the plants
initial capital cost per annum (Harvey, 1993).
The interest rate charged on borrowed capital is used to calculate the annuity. The analysis
covers the life span of the project, n.
Steps for determining the NPW o f a project.
Calculate the value o f annuity
A.+ C x i ( l + i YA. ^ft • < 0 + 0 ' ->
Calculate the annual operation and maintenance costs
OM = 0.03 x C

3. Calculate the annual revenue from sale of energy
4.
B = UCE x CF x P x 8760
where UCE is the unit price of energy
Calculate the present worth of costs and benefits
0 M,=i (1 + /*)' ,=/+i(l + r ) ‘
p w b = y - i *—, y , ( i + ry
5. Calculate net present worth
NPW = PWB - PWC
The project is only feasible if NPW is positive.
3.4.3 Comparative analysis between mini/micro hydr and diesel generation.
To ascertain the economic feasibility of MHP for a given situation, it is necessary to compare
the cost of generating each unit of power with an alternative source. In remote rural areas of
developing countries, the most commonly used alternative is the diesel generator.
Cost of electricity generation (cost of generating a kWh of energy) depends on both the fixed
and variable costs. Fixed costs comprise of loan repayment including interest charged on
capital, insurance and in some cases government taxes. The variable costs include cost of fuel,
Maintenance costs and wages. The cost of generation also depends on technical factors like
Plant capacity factor arid the power fadfcor.

\ diesel plant’s capital cost is less than the equivalent hydro plant but it has a shorter useful
life than the hydro plant (Fritz, 1984). For the purposes of this study, loan repayment has been
spread over the plant’s useful life.
The described evaluation model is developed in the next chapter following the technical design
outlined in this chapter.
t
Q 1

CHAPTER 4
MODEL DEVELOPMENT AND TESTING
4.1 INTRODUCTION
The design model developed in this chapter gives the dimensions and rating of the main
components o f a MHP plant. It is based on the technical design discussed in chapter
three. The designer should have some knowledge of the potential site.
The model has two main parts, one for the civil components and the other one for the
electrical components design. A financial analysis of the proposed plant and generation
cost comparison with a diesel plant are also carried out.
4.2 COMPUTER PROGRAM
The model is implemented in FORTRAN language and is user friendly. It prompts the
user for design data and offers available alternatives where there are options. It has been
structured into four subroutines all called in the main program as shown on flow chart in
fi8 4.2.1(a).
4s described in section 3 1, the potential power demand is taken to have been estimated
atching this with the available site power potential, the design discharge rate is
^k ^ in ed which leads to the subroutine CWORKS for the civil design. This performs
92

the tasks of determining the weir and intake dimensions, sizing of the power canal and
computes its efficiency.
Subroutine PENDIM leads to the choice of penstock material, pipe diameter and its
thickness using manufacturer’s standard tables and charts. Calculating the frictional
headloss the subroutine further computes the penstock efficiency
Subroutine ELECT performs the electrical design of the plant It determines the type of
generation that is appropriate for a given site power rating i e 1-<J> or 3-<j>. Choice of
synchronous generator as against induction generator with suitable capacitor for self
excitation is decided. The type of turbine is based on the specific speed which depends
upon the speed of the generator. Choice between ELC and the standard hydraulic
governor depends upon the overall plant size. The need for the transformer is based on
overall plant capacity and the transmission distance to the load centre. It however, does
not carry out the design of the protection scheme and choice of switchgear.
Subroutine ECON performs the financial analysis of the MHP plant. It determines the net
present worth (NPW) of the project, which gives the viability of the plant. This is done
for various values of interest rate, discount rate, plant useful life and plant capacity
factor The estimated cost of the project must be known to perform this analysis. The
user can also carry out a comparison between the designed MHP and an equivalent diesel
plant. This compares the cost o f generating a unit of electricity using MHP and using a>»
diesel plant of the same power rating.
93

All the design output results are written to an output file.
A print out of the program is given in Appendix A and its operation is as given by the
flow charts on fig. 4.2.1 (a), (b), (c), (d) and (e) below.
MAIN
Fig 4 2 1 (a) MAIN
AV'
94

Subroutine CWORKS for civil design
95Fig 4 2 1 (b ): Subroutine CWORXS

Subroutine PENDIM for penstock design
c o n t ’ d n e x t page
*
v .
96
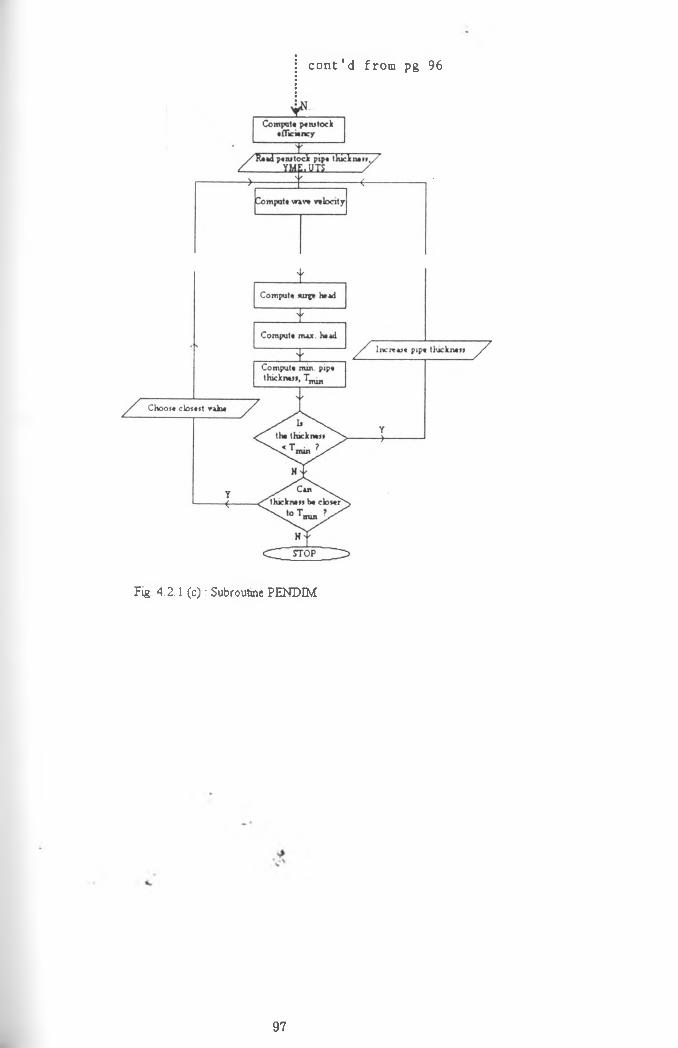
c o n t ’ d from pg 96
Fig 4.2.1 (c ): Subroutine PENDIM
97

Subroutine ELECT for electrical design
Fig 4 2 1 (d) Subroutine ELECT
98

Subroutine ECON for financial analysis
Fig 4.2.1 (e) Subroutine ECON
4.3 M ODEL TESTING
4.3.1 Test Data
The model is tested using two plants because data for other existing stations was not
available. This was due to lack of other plants known to the author which work in
isolation from the grid and are within the model’s range The two plants have capacity
greater than that considered in the study i.e. 500kW
The first plant is the Mau Forest Falls MHP plant (Tenwek Mission Hospital) on,N>
Nyangores river which is a privately bwned generation station and it works in isolation
from the national grid. It was commissioned in 1987 and has an installed capacity ot
320kW. There is provision for the installation of a second turbine-generator set
99

Therefore when the second phase is implemented the plant will have a total capacity of
640kW. At the time of construction, the grid supply was more than 40km away (Kericho
town) and the hospital's main supply was a diesel generator.
The generation cost averaged US$0.19/kWh (Mckay et al., 1990). This figure has been
adopted in the financial analysis of this study as this was the cost of the alternative source
at the time of project implementation.
The second plant is the proposed Terem Falls scheme which was designed by Finnconsult
(1982). It is on Kuywa river which is a tributary of river Nzoia. There are three possible
heads of 100m, 200m and 270m. The 200m head was found to be the most economic
choice. Two designs were made, one with one machine (850kW) installed initially with
provision for a second one at a later date and the other with two machines right fro- the
beginning. The design for the latter plan connected to the grid was also made.
For the purposes of this study, the single unit, isolated operation design has been
preferred because it is closer to the designed model size limit (500kW).
Part of the data used for the Mau Forest Falls plant is for the design that was done in the
feasibility study (Finnconsult & Imatran, 1982) whose plant capacity was 740kW. The
weir in both cases has been assumed to be wedge-shaped with a flat top and a discharge
coefficient of 1.8. The intake orifice is also^sum ed to be sharp edged with coefficient of
discharge equal to 0.6
100

The plant’s construction time, useful life and loan repayment period used are one, thirty
five and six years respectively but these may be varied. The opportunity cost of capital
(discount rate) used is the interest rate paid on five years treasury bills. These are not
fixed values but they are varied within a given range so as to observe their effect on the
project viability. Other data used is given in table 4.3.1.
The comparison of \1HP with an alternative source (i.e. a diesel plant) has been done tor
the Mau Forest Falls plant only because diesel plant data for the Terem Falls plant was
not available. The diesel and MHP plants are assumed to have equal power rating.
However, diesel plants have a shorter useful life than MHP.
The values of the parameters used in this study are as given below:
(I) Useful life - fifteen and thirty five years for diesel and MHP respectr ly (Fritz,
1984).
(ii) The cost of the diesel plant - US$800 per kW of installed capacity (Jabbal).
(iii) A diesel plant uses 0.33 litre (Fritz, 1984) to generate one kWh and the cost of
diesel per litre at the time of project implementation was US$0 39 (McKay et
al., 1990). Hence cost of generation per kWh is US$0.13.
(iv) Annual operation & maintenance costs - 3.5% (Fritz, 1984) and 3% (Harvey,
1993) of the capital cost for the diesel and MHP plant respectively.
101

Table 4.3 1. Design data
Description Mau Forest Falls Terem Falls
Gross head (m) 14 200
Average minimum discharge (nr'/s) 0.27 0.13
70% exceedance discharge (mVs) 2.85 0.55
Design flood discharge (m?/s) 120* 120
Estimated power demand (kW) 450* 1000*
Length of weir (m) 30 35
Power canal length (m) - 185
Minimum allowed water velocity (m/s) 0.3* 0.3*
Canal roughness coefficient - 0.013*
Penstock length (m) 48 380
No. of bends on penstock (40°) 2 0*
Turbulence loss coefficient 0.30*, 0.30* -
Turbine speed (rpm) 222 1500
Capital cost (US $ - 1987) 828,000* (676,000**) 1,163,000**
Rated flow turbine efficiency (%) 85*
Generator overload tolerance (%) 15*
Equivalent grain size for steel (mm) 0.1*
Young’s modulus of elasticity (N/M2) 200 x 10!>•
Ultimate tensile strength (N/M2) 400 x 106‘
* - Estimated data
* - Actual amount spent on single unit with provision for a second machine.
** - Finnconsult estimate for single unit
4-3.2. Test ResultsThe model was tested with the input data given in section 4.3.1 above The output
results are as shown in tables 4.3.2 (a f and (b) along with the field data tor the Mau
Forest Falls and Terem Falls plants respectively has also been given. However
^available field data has been put as dash.
102

Table 4.3 2 ( a ) : MHP plant design results - Mau Forest Falls plant.
Item Model Results Field Data
Intake and Weir
I Weir height (m) 2.0 2.0* (maximum)
Barrier wall height (m) 4.20 5.0*
Intake height (m) 0.750 0.75
Intake width (m) 1.28 -
iPenstock
Penstock material steel steel
Diameter (m) 1.2 1.4
Thickness (mm) 7.0 6.2
Minimum thickness (mm) 7.0 -
Flow velocity (m/s) 2.52 2.5* (max)
Design discharge (m /s) 2.85 2.5
Efficiency (%)i
94 97.9*(max)
Runner specific speed 171.6 141.5
Generator
Type 3-phase synchronous 3-phase synchronous
KVA rating 400 (330) 400
Frequency (Hz) 50 50
Rated voltage (V) 440 440
Transformer
KVA rating 400 400
High voltage side max current (A) 14 -
Generator side max. current (A) s>V '
604 -
( ) - calculated vjHuc
* - Finnconsult design values for plant with single unit.
103

Table 4.3.2 ( b ) : MHP plant design results - Proposed Terem Falls project.
Item Model Results Field Data
Intake and Weir
Weir height (m) 2.0 2.0
Barrier wall height (m) 4.04 5.0
Intake height (m) 0.85 -
Intake width (m) 0.227 -
Power canal
Concrete canal shape T rapezoidal Rectangular
Depth (m) 0.55 -
Top width (m) 1.28 -
Bottom width (m) 0.64 -
Flow velocity (m/s) 1.5 1.0
Canal efficiency (%) 99.75 90
Canal slope 0.0027 0.001
Spillway capacity (m7s) 0.35 -
Penstock
Penstock material Steel Steel
Diameter (m) 0.5 0.5
Thickness (mm) 6.5 6.0,10.0 (upper, lower section)
Minimum thickness (mm) 6.2 5.4
Flow velocity (m/s) 2.8 2.6 (max)
Design discharge (mVs) 0.55 0.5
Efficiency (%) 91 -
Runner specific speed
S »
68.2 -
%
Generator
Type 3-phase synchronous 3-phase synchronous
KVA rating 1000 1000
104

Table 4 3 2 (b) cont’dFrequency (Hz) 50 50
Rated voltage (V) 400 230/400
Transformer
KVA rating 1000 1000
High voltage side max. current (A) 35 -
Generator side max. current (A) 1660 -
Table 4.3.3 below is a sample of the present worth table It shows the present value of
both costs and benefits. The annuity is calculated up to the end of the loan repayment
period which has been taken to be six years after which it becomes zero. During the
construction period, assumed to be one year, operation & maintenance costs and benefits
are zero.
The net present worth which is the difference between c im of present worth of benefits
and that of costs -sum of column five less sum of column four- is given at the end of the
table.
s».\
105

Table 4 3.3 Present Worth Table.
DISCOUNT RATE = 10 00%
INTEREST RATE = 2.00%
CAPACITY FACTOR = 0.50
CONSTRUCTION PERIOD = 1 YEAR
PLANT’S USEFUL LIFE = 35 YEARS
ANNUITY FOR 6 YEARS REPAYMENT PERIOD = US $147819 37
ANNUAL O & M COST AT 3% OF CAPITAL COST = US $24840.00
ANNUAL BENEFITS FROM
SALE OF POWER AT US $0 19/KWH = US$266304.00
YEAR PW ANNUITY PW O&M PW COSTS PW BEN.
1 134381 0 134381.25 0
2 122164 20528 142693.70 220085.94
3 111058 18662 129721.55 200078.12
4 100962 16966 117928.68 181889.20
5 91784 15423 107207.89 165353 81
6 83440 14021 97461.71 150321.64
7 0 12746 12746.85 136656.03
8 0 11588 11588.04 124232.76
9 0 10534 10534.58 112938.87
10 0 9576 9576.90 102671.70
11 0 8706 8706.27 93337.91
12 0 7914 7914.79 84852.64
13 0 7195 7195.26 77138 76
14 0 6541 6541.15 70126.15
15 0 5946 5946.50 63751.04
16 0 5405 5405.91 57955 49
17 0 4914 4914.46 52686.81
18 o , 4467 4467.69 47897.10
19 0 4061 4061.54 43542.81
20 0 3692 3692.31 39584.37
21 0 3356 3356.64 35985 80
106

Table 4.3.3 Present Worth Table.
DISCOUNT RATE 10.00%
INTEREST RATE 2.00%
CAPACITY FACTOR 0.50
CONSTRUCTION PERIOD 1 YEAR
PLANT’S USEFUL LIFE 35 YEARS
ANNUITY FOR 6 YEARS REPAYMENT PERIOD = US $147819.37
ANNUAL 0 & M COST AT 3% OF CAPITAL COST = US $24840.00
ANNUAL BENEFITS FROM
SALE OF POWER AT US $0 19/KWH = US$266304.00
YEAR PW' ANNUITY PW O&M PW COSTS PW BEN.
1 134381 0 134381.25 0
2 122164 20528 142693.70 220085.94
3 111058 18662 129721.55 200078.12
4 100962 16966 117928.68 181889.20
5 91784 15423 107207.89 165353 81
6 83440 14021 97461.71 150321.64
7 0 12746 12746.85 136656.03
8 0 11588 11588.04 124232.76
9 0 10534 10534.58 1 12938.87
10 0 9576 9576.90 102671.70
11 0 8706 8706.27 93337.91
12 0 7914 7914.79 84852.64
13 0 7195 7195.26 77138.76
14 0 6541 6541.15 70126.15
15 0 5946 5946.50 63751.04
16 0 5405 5405.91 57955.49
17 0 4914 4914.46 52686.81
18 < v 4467' 4467.69 47897.10
19 0 4061 4061.54 43542.81
20 0 3692 3692.31 39584.37
21 03356 3356.64 35985 80
106

Table 4.3.3 cont’d22 0 3051 3051.49 32714.36
23 0 2774 2774.09 29740.33
24 0 2521 2521.90 27036.66
25 0 2292 2292.63 24578 78
26 0 2084 2084.21 22344.35
27 0 1894 1894.74 20313.04
28 0 1722 1722.49 18466.40
29 0 1565 1565.90 16787.64
30 0 1423 1423.54 15261.49
31 0 1294 1294.13 13874.08
32 0 1176 1176.48 12612.80
33 0 1069 1069.53 11466 18
34 0 972 972.30 10423.80
35 0 883 883.91 9476.18
THE NET PRESENT WORTH IS = US $1465412.12
Table 4.3.4 shows the variation of net present worth (NPW) with average annual
capacity factor at various discount rates and interest rates. The annuity remains constant
for as long as the interest rate and loan repayment period remain constant. The NPW is
calculated as explained above for each value of capacity factor.
s>
107

T abic 1.1.4 : Variation ol net present worth w ith average annual capacity factor.
Net present w o r th (US $)
Discount Rate = 10% Discount Rate = 15% Discount Rate = 20%
Int. rate r 2% 4% 8% 2% 4% 8% 2% 4% 8%
cap. fact/"'"^^
0 -860771 -904896 -997046 -702176 -740519 -820592 -594865 -628557 -698919
0.1 -395534 -439660 -531809 -396084 -434427 -514500 -373395 -407088 -477450
0.2 697014 25577.1 -66573 -89992 -128335 -208408 -151926 -185619 -255981
0.3 '£34939 490814 398664 216100 .77758 97684.6 69542.8 35850.4 -34512
0.4 1000176 956050 863901 522192 483850 403777 291012 257320 186958
0.5 1465412 1421287 1329137 828284 789942 709869 512481 478789 408427
0.6 1930649 1886524 1794374 1134377 1096034 1015961 733950 700258 629896
0.7 2395885 2351760 2259610 1440469 1402126 1322053 955419 921727 851365
0.8 2861122 2816997 2724847 1746561 1708218 1628145 1176888 1143196 1072834
0.9 3326358 3282233 3190083 2052653 2014310 1934237 1398357 1364665 1294303
1 3791595 3747470 3655320 2358745 2320402 2240329 1619827 1586134 1515772
108

Table 4.3.5 gives the average cost of generating a unit of energy using MHP at different
average annual capacity factors while varying the plant’s useful life. It also gives the
average cost of unit generation using a diesel plant with a useful life of fifteen years. An
interest rate of eight percent has been used.
Table 4.3.5 : Average cost of unit generation for MHP and diesel.
Averaue Unit cost (US $/kWh)
Useful life (years)
MHP Diesel
Cap. Factor 25 35 45 P 150.1 0.365 0.342 0.333 0 2 6 9
0.2 0.183 0.171 0.166 0.199
0.3 0.122 0.114 0.111 j 0.176
0.4 0.091 0.086 0.083 0.165i
0 5 0.073 0.068 0.067 0.158
0.6 0 .06 '1 0.057 0 055 0.153
0.7 0.052 0.049 0.048 0.15
0.8 0.046 0.043 0.042 0.147
0.9 0.041 0.038 0.037 0.145
1.0 0.037 0.034 0.033 0.144
The above results are represented graphically by figures 4.3.1, 4.3.2, 4.3.3 and 4 3.4.
109

NP
W (
US
$)
IN T E R E S T R A TE = 2%
4000000
Fig. 4.3.1 : NPW Vs average annual capacity factor for various values o f discount rate
I 10

N P
W (
US
'S)
DISCOUNT RATE = 10%
4000000
-m—2%—• —4%-■ —8%
Fig. 4.3.2 : NPW Vs average annual capacity factor for various values of interest rate

Uni
t cos
t of e
nerg
y (U
S$/K
WH
)
Fig. 4.3.3: Unit cost of energy Vs average annual capacity factor for varying MHP plant useful life
112

Uni
t cos
t of
ene
rgy
(USS
/KW
H)
0 .4
0 1 0 . 2 0 . 3 0 .4 0 5 0 6 0 7 0 8 0 9 1
A v e r a g e a n n u a l c a p a c i t y f a c t o r
3 5 Y R S .
D i e s e l
Fig. 4.3.4 : Unit cost of energy Vs average annual capacity factor for diesel and Mill* plants
113

CHAPTER 5
DISCUSSIONS, CONCLUSIONS AND
RECOMMENDATIONS
5.1 DISCUSSIONS
5. /. 1 Model results
From the test results given in table 4.2.2(a) and (b), it can be seen that the penstock
dimensions, generator and transformer ratings for the two plants tested are in very close
agreement with the field data. The slight variations are attributable to the fact that the
two test cases had been designed for plant capacities above 500kW which is the limit for
this model. Lack of some crucial design data which had to be assumed also contributes to
the deviations.
It is observed from figure 4.3.1 that for the same average annual plant capacity factor,
the higher the discount rate the less attractive the project becomes i.e. the project returns
are lower at higher discount rates. The higher the discount rate, the higher the minimum
average annual capacity factor required to make project worthwhile i.e. to have a
positive value o f NPW. There- is a linear relationship between NPW and the average
S>
annual capacity' factor. However, it observed that the graphs for the various values of« <.
discount rates transpose at low values of capacity factor. This is due to the fact that the
114

gradient of each of the graphs is inversely proportional to the discount rate and hence the
graphs are not parallel to each other. Thus leading to the transposition.
International lending interest rates used in the study are stable and thus as seen on figure
4.3.2, the interest rate variation does not affect the projects worth significantly.
However, it must be noted that if the Kenyan commercial lending rates are used which
are currently quite high (over 20%), then this would adversely affect the project's
financial viability.
Both the discount and interest rate are factors that depend on the country's economic
health and the organisation or person undertaking the project is a victim of it with no
control over it. Hence a project's financial feasibility can only be improved by varying
te^.uical factors like the plant's capacity factor.
If the Mau Forest plant had been implemented as per the design for the single unit plant,
the total capital cost had been estimated at US$676,000 giving an installation cost of
US$2.200/kW. This figure rose to US$2.600/kW due to the fact that a second machine
was provided for in the design but was not installed. The cost o f the two machine design
had been estimated at US$1,028,000 which reduces the unit capital cost to
approximately US$l,400/kW. The unit cost of generation decreases with the unit capital
cost.
*V '
• <The unit cost of generation using MHP decreases as the plant capacity factor increases.
On ngure 4.3.3 it can be seen that the drop in unit cost is very drastic as the capacity
115

factor increases up to 0.4 and then reduces gradually as it tends to unity. If the capacity
factor is improved from 0.2 to 0.5 when the plant’s useful life is thirty five years, the unit
cost reduces by about 60%. If further to this the plant's useful life is changed to forty
five years the combined changes result in an overall unit cost reduction of about 61%. It
must be noted that changing the economic life of the plant calls for sophisticated design
and materials which may increase the project cost and this has not been taken into
account in this test. Maximising on the plant's useful life may therefore not necessarily
bring down the unit cost. It is therefore more advisable to improve on the plants capacity
factor to achieve a significant cost reduction.
As observed on figure 4.3.4, MHP is cheaper than diesel generation only for capacity
factors greater than 0.175. MHP becomes competitive when the capacity factor is higher
than this value.
5.1.2 M H P Implementation
Mini;Micro Hydro Power is mainly meant for use in the rural areas most of which are
characterised by low income earning population. These being schemes that require the
participation o f the local community in terms of both financial and labour input, a careful
implementation process is worth considering. Introducing small scale hydro power
involves more than just equipment installation. There are two methods o f project
implementation which mav be used. One of these involves governmental or non-* »\
governmental organisations owning and managing the plant with the local people
purchasing power from them. The local people usually have a passive attitude towards
the project and it neither motivates them nor does it help to build their self confidence.

Klaus & Thomas (1992) regard it a fundamental mistake to induce a government to
install and operate MHP plants of capacity under lOOkW and plants under 1MW should
be run by a public utility but never by the state. The other method is one where the local
community implements the project through harambee/co-operative efforts. In this, they
gain a sense of achievement and they want to identify with the project. With this
approach, the project may be implemented in three stages where need be.
1. Start by creating irrigation canals
This makes the area more productive and by sale of the agricultural produce, the
rural community will gain a higher purchasing power meaning that they can make
bigger financial commitments towards the project.
2. Once there is increased productivity and higher income, energy may be harnessed
by introducing mechanical drive units. These can be used for agro processes like
grain milling, rice hulling and oil pressing.
3. Having enhanced the financial capability of the local community, a turbine-
generator set can be installed for electricity generation. By the time this stage is
implemented, the local people can afford to pay for the installation, wire their
houses and buy electrical appliances.
Initially, only one generator per scheme is recommended so as to avoid the need for
synchronising equipment, load sharing, sophisticated protection schemes and to minimise
on the operation and maintenance costs.
WTiere electronic load controller^ are employed, the ballast can be put into some
productive use. This increases the load factor, thus reducing the cost of energy
117

significantly. It may be more advantageous to locate the controller away from the
powerhouse so as to utilise the power diverted to the ballast more effectively. In such a
case frequency sensing becomes more appropriate. This is due to the fact that system
voltage fluctuation could be due to line impedance, power factor or action of the voltage
regulator rather than only change in the system loading, resulting in erroneous ELC
response.
5.2 CONCLUSIONS
The evaluation model developed reduces the engineering design time and also cuts
overall project cost due to the simplified design. The potential power demand is taken to
have been estimated as a pre-condition for the use of the design model as sizing of the
plant capacity depends on it To attain good results using the model, all the necessary
data must be available Manufacturer’s data on the various components like penstock,
generator and their characteristics must be obtained before hand.
The model was tested for the Mau Forest Falls plant (Tenwek Mission Hospital) and the
proposed Terem Falls project. There was some missing data required in the design which
had to be estimated and both plants were of higher capacity than the maximum limit of
500kW recommended for the model. Not withstanding these shortcomings, the test
results were in good agreement with the field data.
Using the developed evaluation model quifck comparison of different possible MHP plant• <.
locations on the same river/stream, so also the comparison of alternative designs for a
specific site is possible This if done manually would be time consuming. The model thus
118

increases location choice and specific site design flexibility A model user can also test
the financial feasibility of the designed plant after costing has been done Priority listing
of sites based on the financial return can be concluded by re-running the program for the
selected sites.
To make the project more attractive and to reduce the unit cost of generation the plant
should be operated at high values of capacity factor. This may be attained by
encouraging the consumers to make productive use of electricity like cottage industries
and modernised farming methods.
The comparison between MHP and diesel generation done in this study shows that MHP
only offers a better alternative when operated at capacity factor higher than 17.5%. This
will vary depending on the capital cost of the plant with cheaper plants being more
competitive. The plant’s capital cost per kW of installed capacity must therefore remain
as low as is practically possible.
In cases where MHP will be installed to replace an existing diesel generator and the
power demand cannot be met all the year round, then diesel generation may be used to
bridge the deficit.
The model is only a design tool and the user must have some engineering knowledge
although not specialised. -
119

5.3 RECOMMENDATIONS
1. The competitiveness of grid extension as against MHP supply as a means of rural
electrification should be analysed from all angles and not just from the economic
point of view.
2. Given that conditions, circumstances and attitude towards MHP have changed over
the years, there is need to update the list o f potential sites by visiting the sites in
addition to the desk study.
3. Carry out a study for the development of a mathematical model for assessing the
potential power demand in an area to be served by MHP site. This should take into
consideration all the parameters that affect rural electricity demand.
4. Investigate the use of heat storage cookers as the ballast and assess their acceptability
and affordability by the local community. If this can be incorporated, the plant
capacity factor would improve.
*V'
120•A S T AFH1CANA C O U E c i l y *

REFERENCES
Blankenberg F. P. and Hulscher W. S. (1990): ' Small Hydro Power in Developing Countries
- A review o f some case studies ” ; Working paper no. 49, July 1990.
CBS (1996) (Central Bureau o f Statistics): “Economic Survey
Chullakesa C. (1992) : “Cost-cutting Approaches to Rural Electrification Development
Rural Electrification Handbook for Asia and the Pacific, Bangkok 1992.
Clark P. T. (1982) : “Cost Implication o f Small Hydropower Systems ’’ ; Workshop on Small
Scale Hydro Power in Africa - March 1982.
Elder et al. (1984) : '‘Self-Excited Induction Machine as a Small Low Cost Generator LEE
Proceedings Vol. 131 Pt C No 2 March 1984 pp33-41.
Eschbom (1985): "‘GTZ-SEP Special Energy Programme Kenya".
Ewbank and Partners Ltd., Brighton and WLPU (1979) : "Pre-Feasibility Study fo r Small
Hydroelectric Projects in the Tana River Basin Kenya - Final Report June 1979.
Fielder P. W and Bertie T. W. (1982): “The Energy Resources o f Kenya”; Water Power ands*
V 'Dam Construction vok34 April 1982 pp 39-41.
Finnconsult Consulting Engineers (1981): nSmall Scale Hydroelectric Schemes in South-West
Kenya - 1 Preliminary Survey Report"; April 1981.
121

Finnconsult and Imatran V. (1982) : ",Small Scale Hydroelectric Schemes in South-West
Kenya, II Feasibility Study fo r Terem Falls and Mau Forest Falls for Ministry of
Energy, January 1982.
Fraenkel P. et al. (1991) : “Micro-Hydro Power - A guide fo r development w o r k e r s IT
Publications.
Fritz J. J (1984) : “Small and Mini Hydro Power Systems: Resource Assessment and
Project Feasibility ’, Published by McGraw-Hill Book Company.
Harvey A. (1993) : “Micro-Hydro Design M anual: A guide to small scale water power
schemes”, Published by Intermediate Technology Publications.
Henderson D S. (1993): “Recent Developments o f Electronic Load Governor fo r Micro
Hydroelectric G e n e r a t i o n Renewable Energy, 17-19 Nov. 1993, Conference
publication no. 385.
Henva H (1995) : Senior Electrical Engineer Brooke Bond (K) Ltd Kericho.; “Personal
Communication
Holland R. (1983) : “Micro Hydro Power fo r Rural Development - Lessons drawn from
the experience o f the Intermediate^Technology Development G r o u p 'Third Workshop
on Small Hydro Power RCTT/UNIDO/REDP/Govemment of Malaysia, 7th - 15th March
1983, Kuala Lumpur, Malaysia.
122

Holland R. (1996) : Managing Director, Intermediate Technology Consultants (ITC)
UK; “Personal Communication ”.
Hydronet (1995) “Mini Hydro : Policy and P r a c t ic e Newsletter Published by FAKT
and SKAT.
Inversin A. R. (1986) : “Micro Hydropower Sourcebook - A practical guide to design
and implementation in developing c o u n t r i e s NRECA International Foundation,
Washington DC.
Jabbal H. S. : “Power Generation Development in Kenya over the next 20 Years”.
Jiandong T. (1993) : “Small Hydro and its Organisation in China ” ; International Water
Power & Dam Construction, February 1993.
Kadete H. and Reichel R : “Experiences with Small Hydro Electric Stations in
T a n z a n ia Research report No 78.08.
Kahn A. et al. (1992) : “Field Trial o f Micro Hydro Design Software” ; 5 th International
Conference on Small Hydro, Nov. 1992.
Kedia D (1986) : “Government Incentives fo r Small Hydro Power Generation in India”,
Water Power & Dam Construction April 1986.
123

Klaus R. and Thomas S. (1992) : “GTZ GATE Micro Hydro Power Dissemination
Program : Concepts & P r o b le m s 5th International Conference on Small Hydro, Nov.
1992.
Kristoferson L. A. and Bokalders V. (1986) : "Renewable Energy Technologies : Their
Applications in Developing C o u n tr ie s Pergamon Press.
Malik N. H. and Ai-Bahrani A H (1990) : “Influence o f the Terminal Capacitor on the
Performance Characteristics o f a Self-Excited Induction Generator IEE Proceeding
Vol. 137 Pt C No 2 March 1990 ppl68-173
Manwell J F. (1988) : “Recent Developments in Micro-Hydro Electric Power”, 1st
International Conference on Renewable Energy and Local Production, Sep. 1988 pp257-
270.
Marquand C. J. and Githinji P M. (1980) : “Energy Resources and their Environmental
I m p a c t s International Workshop on Energy and Environment in East Africa, 1980
pp 159-177.
Martinez M. (1988) : "On the Electrification o f Rural M exico” ; Solar & Wind
Technology Vol. 5 , No 2, pp 177r 180, 1988
V '
Mbuthia J. M. (1981) : “Small Scale Hydro Generators and Generating Stations fo r
Rural Electrification ”
124

McCall (1989) : “Configuration o f Electrical Distribution Systems fo r Application in
Rural Areas o f Kenya ; Kenya-Canada Energy Advisory Project 1986-88.
McKay H. G. et al. (1990) : “Development and Appraisal o f Mini Hydro in Remote
Areas ', Water Power & Dam Construction, October 1990.
Mehta V. K. (1982) : “Principles o f Power S y s t e m S. Chand & Company Publishers
Ltd.
Metzler R. (1982) : “Equipment Design and Local Manufacturing Opportunities'; Small
Scale Hydro Power in Africa - Workshop Proceedings 1st - 5th March 1982, Abidjan,
Ivory Coast.
Mevon S G and Rao B B. (1986) : “Planning o f Distribution Systems in Developing
C ountries '; LEE Proceedings Vol. 133 Pt. C No. 7 1986, pp384-388.
Monition L. et al. (1984) : “Micro Hydroelectric Power Stations" Published by John
Willey & Sons.
Mosin J.( 1995) Electrical Engineer, Tenwek Mission Hospital, “Personal
Communication ”
N>X
Muchiri G. (1986) : “Rural Energy Needs and Alternative Sources", International
Workshop on Energy and Environment in East Africa, 1980, pp232-249.
125

Njau E. C. (1976) : "Hydro Power atui Rural Electrification in East Africa"', Energy
Resources in East Africa - Proceedings of the Symposium of the East African Academy,
August 1976.
Pabla A. S. (1981): “Electric Power Distribution Systems”, Published by Tata McGraw-
Hill.
Ravindranath B. and Chander M. (1977) : “Power System Protection and Switchgear”;
Published by Wiley Eastern Limited.
Rushton J. (1986) : “Power System Protection 3 - Application ” Chapter 12.
Santos Z. A. (1992) : “Small Hydropower Development in the Asia and Pacific Region”,
Rural Electrification Handbook for Asia and the Pacific ; Bangkok 1992.
Saunier G. (1992) : Editor “Rural Electrification Handbook fo r Asia and the Pacific”,
Bangkok 1992.
Saunier G. and Mohantv B. (1992) : “Overview and Guidelines fo r Rural
E le c tr ific a tio n Rural Electrification Handbook for Asia and the Pacific ; Bangkok
1992.
s*V '
Sen L. K. (1981) : “Rural Electrification in Developing Countries : General
considerations”, Development discussion paper No. 122, Oct. 1981.
126

Sen L K (1982) : “Rural Electrification in Indonesia : Current and Future
P e rsp e c tiv e Development discussion paper No. 131, Feb. 1982.
Shanker A. and Krause G G. (1992) : “Decentralised Small Scale Power Systems” ;
Rural Electrification Handbook for Asia and the Pacific ; Bangkok 1992.
SHP News . No 1 1993.
“Small Hydro 1990” ; Water Power & Dam Construction , Feb. 1991 pp37-46.
Smith N. (1994): “Motors as Generators fo r Micro Hydro Power” ; IT Publications Ltd.
Smith N. (1995) : “Low-cost Electricity Installation' Intermediate Technology
Consultants.
Soedjarwo A. (1982) : “Process o f Introducing Hydropower to Rural People
Workshop on Small-scale hydropower in Africa , March 1982.
Taylor E. O (1969): "Power System Ecomonics” ; Edward Arnold Publishers Ltd
Tripathv S. C. et al. (1993) : “ Wind Turbine Driven Self-excited Induction Generator
Energy Conversion & Management, vol. 34 No. 8 pp64l-648.
V '
127

United Nations - UN (1981) : “E xtrac ts fr o m the K en ya N a tio n a l P aper p re p a re d f o r
the United Nations Conference on New and Renewable Sources o f E n e r g y 10th - 21s*
August, 1981, Published by the Ministry of Energy.
United Nations - UN Department of Technical Co-operation for Development (1982) :
“Evaluation o f Small Hydro Power Sites in Kenya"; 18th March - 9th April.
Wadhwa C. L. (1983) : “Electrical Power Systems" , Wiley Eastern Limited.
Walkade N. S. (1986) : “AUni Hydro Power fo r Rural Development - An Overview" ;
ANSTI EE - 86 , International Conference , Lusaka Zambia, 18th - 20th August, 1986.
Warrington A. R. (1968) : “Protective Relays : Their Theoryr and Practice" ; Vol. 1
Published by Chapman & Hall Ltd.
Woodward J. L. (1982) : “An Electronic Load Governor and Related Developments" ;
Small Scale Hydro Power in Africa - Workshop proceedings 1st - 5th March 1982,
Abidjan, Ivory Coast.
Wyatt G. and Dinglev C. (1995) : “A Financial Comparison o f Three-Phase versus
Single-Phase Rural Electricity Distribution" ; Southern African Universities Power
Engineering Conference. ,s>
128

BIBLIOGRAPHY
Brown D. R. and Hamilton E. P. (1984) : “Electromechanical Energy Conversion” ;
Macmillan Publishing Company.
Coghlan A. (1991) : “Converted Motors Shed Light on Rural Homes" ; New Scientist
29,h June 1991.
Elgerd O. I. (1983) : “Electric Energy' Systems Theory' - An Introduction" ; Tata
McGraw-Hill, 2nd Edition.
ESCAP Secretariat (1983) : “Small Hydro Power Development" ; Third Workshop on
Small Hydro Power RCTT/UNIDO/REDP/Government of Malaysia, 7th - 15th March
1983, Kuala Lumpur, Malaysia.
Goldsmith K. (1983) : “Economic Appraisal o f Small Scale Hydro Power Projects" ;
Third Workshop on Small Hydro Power RCTT/LTNIDO/REDP/Govemment of
Malaysia, 7lh - 15th March 1983, Kuala Lumpur, Malaysia.
Huang J. W. (1988) : “Capital Investment Analysis Using Discounting Techniques" ;
Power System Planning & Project Management Seminar, Nairobi, 7th - 25th March 1988.
V '
ITDG (1993) : “Setting up and Sustaining Village Hydro Projects : Some Community
Experiences m Matara District” ; Study carried out in Sep. 1993.
129
Say M. G. (1976) : “Alternating Current Machines" ; ELBS and Pitman Publishing L td ,
4th Edition.
Sunde’n D et al. : “Design and Construction Experience o f Electrical Systems fo r Small
Scale Hydro Power Plants
Vinjar A. (1983) : “Factors Affecting the Feasibility o f Small Scale Water Power
Plants" ; Third Workshop on Small Hydro Power RCTT/UNIDO/REDP/Govemment of
Malaysia, 7th - 15th March 1983, Kuala Lumpur, Malaysia.»i
Xiaozhang Z. (1995) : “Small Hydropower Development fo r Rural Electrification" ;
Asia Energy 1995, UN-ESCAP, Sydney, Australia. 26th July - 3rd August, 1995.
130

APPENDIX A
PROGRAM MHP
REAL HGROSS,QCALC,QMIN,Q70,N,QDES,G,PSITE,PDEMES,THICK,SPECSP,TX
REAL h g t w ,h g t w a ,in h g t ,in w ,w e t h ,w e t t ,b o t ,v e l ,d ia ,v e l p e n ,p i,pg en v a ,d
REAL EFC,SLOPE,EFP,QRF,VOLTRACTLV,CTHV,QSPILL, VC,THICkM
INTEGER F,L,Q
CHARACTERS ANSE,ANSCAN
CHARACTER* 10 PENSMA
CHARACTERS GENTYP
COMMON G,D,PI,EFP,EFC
COMMON GENRAT
COMMON / HYDRO / HGROSS,QDES, QSPILL,QRF,ANSCAN,VC
COMMON / EP ARAM / F,PSITE,PGENVA
OPEN(30,FILE-A DES RES')
REWIND(30)
5 FORMATC ',T20,'MHP PLANT DESIGN* / ' ',T20,16(,=') / )
15 FORMATC ','THE DESIGNED PLANT FROM THE DATA GIVEN IS AS FOLLOWS'
$//' ',T10,'ITEM\T30,'SPECIFICATION* / ' ‘,T 10,4C-'),T30,13('-*)
$ r 7 INTAKE AND WEIR'/* M5C*4) )
25 FORMATC’, A,T35,F 10 4 / ” ,A,T35,F10 4 )
35 FORMATC 7 T10,A)
45 FORMATC, A,T30,A / )
55 FORMATC A,T30,F10.2 / ’ ',A,T30,I6 f)
65 FORMATC, A/)
75 FORMAT!Al) ,,Vx
85 FORMATC ',A,T35,F10 3 )
05 FORMATC ',T20,A,/' ',T20,33C*'))
105 FORMATC ',T10,51('- ') /)
131

PRINT 95,'WELCOME TO THE MHP DESIGN PROGRAM’
PRINT 35,'Please t>pc all the CHARACTER entries in UPPER CASE’
PRINT 105
G=9.81
D= 1000.0
F=50
PI=3.14
WRITE(30,35)'MHP DESIGN DATA'
PRINT 65,'ENTER THE VALUES OF GROSS HEAD, MIN AND 70% EXCEEDANCE R
$IVER DISCHARGE’
READ*, HGROSS.QMIN,Q70
WRITE(30,85)'GROSS HEAD'.HGROSS
WRITE(30,85)'MINIMUM DISCHARGE RATE',QMIN
WRITE(30,85)'70% EXCEEDANCE DISCHARGE’,Q70
PRINT 65,'WHAT IS THE MAXIMUM EXPECTED FLOOD DISCHARGE DURING THE
SWORST FLOOD AT THE MHP SITE IN THE NEXT 40 YEARS'
READ*,QRF
WRITE(30,85)'DESIGN FLOOD DISCHARGE',QRF
N = 0.46
PRINT 65,WHAT IS THE ESTIMATED POWER REQUIREMENT OF THE AREA.KW9'
READ*,PDEMES
C THE POTENTIAL POWER OF THE SITE SO AS TO MEET THIS DEMAND SHOULD
C BE
PSITE = PDEMES/N
QCALC = PSITE/(G*HGROSS)
IF((QCALC LE Q'MIN) OR.((QCALC LE.Q70).AND (QCALC GT QMIN)))THEN
QDES = QCALC -
ELSE *vxQDES = Q70
PSITE = G*HGROSS*QDES
END IF
132

CALL CIVIL(HGTW.HGTWA,INHGT,INW,WETH.WETT,BOT,VEL,SLOPE)
CALL PEN(PENSMA.D(ATHICK,V£L?EN,THICKM)
CALL TURGEN(SPECSP.GENTYP,VOLTRA,TX,CTLV,CTHV)
WR1TE(30,5)
WRITE(30,15)
WRJTE(30,25)'WEIR HEIGHT(M)',HGTW ,’BARRIER WALL HEIGHT(M)',HGTWA
WRITE(30,25)'INTAKE HEIGHT(M)',INHGT,'INTAKE WIDTH (M)',INW
IF(ANSCAN.EQ 'Y')THEN
WRITE(30,35)'POWER CANAL'
WRITE(30,25)'DEPTH (M)'.WETH,’TOP WIDTH (M)'.WETT
WRJTE(30,25)'BOTTOM WlDTH(M)'.BOT,'FLOW VELOCITY (M/S)',VC
WRITE(30,25)'CANAL EFFICIENCY',EFC,'CANAL SLOPE'.SLOPE
WRJTE(30,25)'SPILLWAY CAPACITY (CUBIC M/S)\QSPILL
END IF
WRJTE(30,35)'PENSTOCK'
WRITE(30,45)’PENSTOCK MATERIAL',PENSMA
WRJTE(30,25)'DIAMETER (M)',DIA,'FLOW VELOCITY (M/S)'.Vr .PEN
WRITE(30,25)'THICKNESS (M)',THICK,'MINIMUM THICKNESS'THICKM
WRITE(30,25)'DESIGN DISCHARGE (CUBIC M/S)',QDES,'EFFICIENCY',EFP
WRITE(30,25)'RUNNER SPECIFIC SPEED',SPECSP
WRJTE(30,35)'GENERATOR'
WRITE(30,45)TYPE'.GENTYP
WRITE(30,55)'KVA RATING',PGENVA,'FREQUENCY (HZ)',F
WRITE(30,25)'RATED VOLTAGE (V)',VOLTRA
WRITE(30,35)TRANSFORMER'
WRITE(30,25)'KVA RATING',TX
WRITE(30,25)'GENERATOR MAXIMUM CURRENT (A)',CTLV,’HIGH VOLTAGE MAX
SIMUM CURRENT (A)'.CTHV
PRINT 65,'DO YOU WANT TO CARRY OUT AN ECONOMIC ANALYSIS OF THE PRO
SJECT? (Y/N)' *V '
READ 75,ANSE
IF(ANSE EQ T)THEN
CALL ECON
END IF
133

CLOSE(30)
STOP
END
*******************************************************************************
SUBROUTINE PEN(PENMAT,B,T,VP,TMIN)
*******************************************************************************
* THIS SUBROUTINE SELECTS THE MOST SUITABLE PENSTOCK PIPE MATERIAL *
* FOR A PARTICULAR SITE.CALCULATES THE DIAMETER AND GIVES THE APP- *
* ROPRIATE THICKNESS FROM WHAT IS AVAILABLE IN THE MARKET ********************************************************************************
INTEGER ACCESS,TERAIN.PH,TEMP,N
REAL L.B,E,F.K(20),SUMK.HLF,HLT,T,YME,UTS,HS,HMAX,TMIN
REAL HLP,X,Y.EFP.SAFE,VP
INTEGER I
CHARACTERS PENMAT
CHARACTER* 1 ANST.ALT.ANSFRI,ANSVP
COMMON G,D,PI,EFP.EFC
COMMON / HYDRO / HGROSS,QDES,QSPILL,QRF,ANSCAN,VC
5 FORMAT!' ',A I)
15 FORMAT! A l)
25 FORMAT!” ,A, A6/)
35 FORMATC \A ,El2 5/)
45 FORMATfA6)
PRINT 5,'HOW IS THE SITE ACCESSIBILITY*'
PRINT 5,'l=GOOD, 2=AVERAGE, 3=BAD'
134

READ*,ACCESS
PRINT 5,'HOW IS THE TERRAIN TO BE TRAVERSED?'
PRINT 5,'l=ROUGH. 2=GENTLE'
READ*,TERAIN
PRINT 5,WHAT IS THE QUALITY OF WATER/SOIL IN THE AREA ’(ACIDIC, AL
SKALINE)'
PRINT 5,'l=CORROSIVE, 2=NEUTRAL'
READ*,PH
PRINT 5,'HOW IS THE CLIMATE IN THE AREA (TEMPERATURE)?'
PRINT 5,'l=TEMPERATE,2=HOT
READ*,TEMP
IF((TERAIN EQ I) OR (TEMP EQ 2) OR.(ACCESS EQ.3))THEN
PENMAT-STEEL'
SAFE = 2.0
ELSE
PENMAT-PVC'
SAFE = 3.0
END IF
PRINT 25,THE APPROPRIATE PENSTOCK PIPE MATERIAL IS PENMAT
PRINT 5,'DO YOU WANT TO USE ANOTHER MATERIAL? (Y/N)'
READ 15, ALT
I F( ALT EQ. Y')TH EN
PRINT 5,'ENTER THE MATERIAL YOU WANT TO USE(MAX. 6 CHARACT
$ERS)'
READ 45,PENMAT
SAFE = 3.0
END IF
PRINT 5,'ENTER THE PENSTOCK LENGTH L, IN METRES'
READ*,L
PRINT 5,'ESTIMATE THE DIAMETER B,IN METRES’
READ*.B ^Vx
10 , VP=i*QDES/(PI*(B**2))
PRINT 5,'ARE YOU USING A PIPE MANUFACTURER'S FRICTION LOSS CHART9
$(Y/N)'
READ 15,ANSFRI
135

IF(ANSFRJ EQ/N')THEN
RE=VP*B*10**6
PRINT 35,THE REYNOLD"S NUMBER RE = \RE
PRINT 5,'ENTER THE VALUE OF EQUIVALENT GRAIN SIZE,k.METRE'
READ*,Y
E= Y/B
PRINT 35,THE RELATIVE COEFFICIENT E = ',E
PRINT 5, DEDUCE AND ENTER THE VALUE OF FRICTION FACTOR, F,
$ FROM MOODYS CHART
READ*.F
HLF=2*(VP**2)*L*F/(G*B)
ELSE
PRINT 5, READ OFF THE FRICTIONAL HEAD LOSS FROM THE CHART
READ*,HLF
END IF
PRINT 5,'HOW MANY BENDS DOES THE PENSTOCK PIPE HAVE?(NUMBER)'
READ*,N
IF(N.NE.O)THEN
PRINT 5,'ENTER THE VALUES OF THE LOSS COEFFICIENTS AT EACH
$ BEND FROM THE TURBULENCE LOSS TABLES'
SUMK=0
DO 20 1=1,N
READ*,K(I)
SUMK=SUMK+K(I)
20 CONTINUE
END IF
HLT=(VP**2)*SUMK/(2*G)
HLP = (HLF+HLT)/HGROSS
IF(HLP.GT 0.10)THEN -•
PRINT 5,'INCREASE PiP^ DIAMETER’vx
RE\D*.B
GOTO 10
ELSE IF(HLP LT 0 02)THEN
PRINT 5,'REDUCE DIAMETER BY ONE SIZE’
136

READ*,B
GOTO 10
END IF
PRINT*,’THE WATER FLOW VELOCITY = ',VP,'M/S'
PRINT 5,'IS THIS WITHIN THE LIMITS? (Y/N)'
READ 15,ANSVP
IF(ANSVP EQ/N')THEN
PRINT 5,'INCREASE PIPE DIAMETER'
READ*,B
GOTO 10
END IF
EFP = 1 0-HLP
PRINT 5,'ESTIMATE THE PENSTOCK PIPE THICKNESS,T(M)'
READ*,T
PRINT 5,'ENTER THE YOUNGS MODULUS OF ELASTICITY,YME, & ULTIMATE TE
SNSILE STRENGTH FOR THE PIPE MATERIAL,UTS'
READ*,YME,UTS
X = 2.1E+9
30 A = 1/SQRT(D*(( 1/X)+(B/(YME*T))))
HS=A*VP/G
HMAX=HGROSS+HS
TMIN=D*G*HMAX*B*SAFE/(2*UTS)
IF(T LT TMIN)THEN
PRINT 5,'INCREASE THE PIPE THICKNESS,T
READ*,T
GOTO 30
ELSE
PRINT*,'MINIMUM PIPE THICKNESS IS ’, TMIN
PRINT 5,'CAN T BE CLOSER TO TMIN?(Y/N)'
READ 15,ANST ^
iP(ANST EQ ’Y’)THEN
PRINT 5,'REDUCE T TO THE AVAILABLE THICKNESS CLOSEST
$TO TMIN'
READ*,T
137

GOTO 30
END IF
END IF
RETURN
END
********************************************************************************
SUBROUTINE CIVIL(HWEIR.HWALL,IH,IW,H,T,B.V,S)
*******************************************************************************
* THIS SUBROUTINE DESIGNS THE WEIR, INTAKE AND THE POWER CANAL AND *
* GIVES THE WEIR AND WALL HEIGHT, INTAKE DIMENSIONS, SLOPE OF THE
* CANAL AND ITS DIMENSIONS ** * * * * * * * * * * * * * * * * * * * * * * * * * * * * * * * * * * * * * * * * * * * * * * * * * * * * * * * * * * * * * * * * * * * * * * * * * * * * * *
REAL QRF,CW,LWEIR.HWALL,HWEIR,HTOPF,IH,VI,CD,HR,HH,QDES,QSPILL.HLC
REAL R,N,S,AWET.HHF.QFM,QFD,HRF,X,VMIN,SFIX,IW,SLOPE,H,T,B.D.L,EFC
INTEGER ANSO.CP.CHOICE
CHARACTERS ANSV.ANSS,ANSSLO.ANSrAN
COMMON G,D,PI,EFP,EFC
COMMON / HYDRO / HGROSS,QDES.QSPILL,QRF,ANSCAN,VC
5 FORMAT('A,E12.4)
15 FORMAT!", A/)
25 FORMAT!",A,F8.47)
35 FORMAT(",A,F6 4,A/) -
45 FORMAT! A I) +
PRINT k5,WHAT IS THE DESIRED LENGTH OF WEIR*>,M’
READ*,LWEIR
PRINT 15,'DEDUCE THE VALUE OF COEFFICIENT OF DISCHARGE, CW, FOR TH
$E CHOSEN WEIR PROFILE'
138

READ*,CW
HTOPF=(QRF/(CW*LWEIR))**0.667
PRINT 15,'IS THE INTAKE ORIFICE, 1=SHARP EDGED AND ROUGH OR, 2=CAR
SEFULLY FINISHED^’
READ*,ANSO
C CHOOSE THE COEFFICIENT OF DISCHARGE OF THE INTAKE ORIFICE
IF(ANSO EQ 2)THEN
CD = 0.8
ELSE
CD = 0.6
END IF
PRINT 15,WHAT IS THE MINIMUM ALLOWED WATER VELOCITY? (M/S)'
READ*,VMIN
10 PRINT 15,'ESTIMATE THE WEIR HEIGHT, HWEIR (M).FIRST ESTIMATE BEING
$ SLIGHTLY LOWER THAN THE ANNUAL AVERAGE DEPTH OF WATER AT THE POIN
$T WHERE WEIR IS TO BE CONS^ ,UCTED.'
READ*,HWEIR
HR = HWEIR
50 PRINT 15,'ESTIMATE THE INTAKE ORIFICE HEIGHT,D METRES'
READMH
HH = IH
VI = CD*SQRT(2*G*(HR-HH))
IF(VI.LE.VMIN)THEN
PRINT 5,THIS VELOCITY IS LESS THAN THE MINIMUM ALLOWED VE
SLOCITY :-',VI
PRINT 15,'1=INCREASE THE WEIR HEIGHT OR 2=REDUCE THE DEPTH
$ OF WATER IN THE HEADRACE HH OR 3=INCREASE HR BY LOWERING THE INTA
$KE POSITION'
READ*.CHOfCE
lF((CHOICE EQ 1) OR.(CHOICE EQ 3))THEN
GOTO 10
ELSE
GOTO 50
139

END IF
ELSE
PRINT 35,THE VELOCITY OF WATER IS ',VI,'M/S'
PRINT 15,’IS THIS VELOCITY WITHIN THE LIMITS9 (Y/N)’
READ 45,ANSV
IF(ANSV EQ 'N')THEN
PRINT 15,'1=REDUCE THE WEIR HEIGHT OR 2=INCREASE THE
SDEPTH OF WATER IN THE HEADRACE HH OR 3= REDUCE HR BY RAISING THE I
SNTAKE POSITION’
READ*,CHOICE
IF(CHOICE EQ I OR CHOICE EQ.3)THEN
GOTO 10
ELSE
GOTO 50
END IF
END IF
END IF
HWALL = HWEIR+HTOPr +0.5
C THE INTAKE WIDTH IS GIVEN BY
IW = QDES/(IH*VI)
PRINT 15,'IS A POWER CANAL NECESSARY9 (Y/N)'
READ 45,ANSCAN
IF(ANSCAN.EQ T)THEN
PRINT 15,'WHAT IS THE LENGTH OF THE POWER CANAL9 (M)'
READ*,L
PRINT 15,'ENTER THE VALUE OF ROUGHNESS COEFFICIENT FOR THE CANA
$L'
READ*,N
PRINT 15,'CHOOSE A SUITABLE VALUE OF VELOCITY OF FLOW IN THE CA
$NAL' V'
READ*,VC
PRINT 15,'A TRAPEZOIDAL CANAL PROFILE IS RECOMMENDED '
PRINT 15,'ENTER THE APPROPRIATE SIDE SLOPE ANGLE (DEG)'
140

READ*,X
X = X*PI/180
40 AWET = QDES/VC
R = 0.5*SQRT(AWET*SIN(X)/(2-COS(X)))
S = (N*VC/(R**0.667))**2
PRINT 5,THE CALCULATED CANAL SLOPE IS ',S
PRINT 15,'CAN THIS SLOPE BE ACHIEVED PRACTICALLY?(Y/N)'
READ 45,ANSS
IF(ANSS.EQ.'N')THEN
PRINT 15,'WHAT IS THE MAXIMUM SLOPE THAT CAN BE ATTAI
$NED?'
READ*,SFIX
R = 0.46*QDES**0.38/SFIX**0.19
S = SFIX
HLC = L*S/HGROSS
ELSE
HLC = L*S/HGROSS
IF((HLC GT 0.1^' AND (VC LT VI))THEN
PRINT 15. REDUCE THE CANAL WATER FLOW VELOCITY’
READ*.VC
GOTO 40
END IF
END IF
C CALCULATE THE EFFICIENCY OF THE CANAL
EFC = (l-HLC)
H = 1.2*2*R
T = 1.2*4*R/SIN(X)
B = T-2*H7TAN(X) -
C DETERMINE THE FLOW IN HE HEADRACE DURING FLOODSV '
60 PRINT 15,'ESTIMATE THE DEPTH OF WATER IN THE HEADRACE DURINGfL
$OODS'
READ*,HHF
141

HRF = HTOPF+HWEIR
QFM = HHF*T*(SQRT(S)/N)*(T*HHF/(T + 2*HHF))**0.667
QFD = IH*IW*CD*SQRT(2*G*(HRF - HHF))
ACC = ABS(QFM - QFD)
PRINT*,'QFM - .QFM.'AND QFD =',QFD
IF(ACC GT. 1 E-2)THEN
GOTO 60
END IF
C THE DISCHARGE THAT THE SPILLWAY MUST GET RID OFF IS
QSPILL = QFM - QDES
ELSE
EFC = 1
END IF
RETURN
END
***************************************************************************
SUBROUTINE TURGEN(NS,TYPE,VRATED,TXRATE,IGEN,ITXHV)
*******************************************************************************
* THIS SUBROUTINE GIVES THE TYPE OF TURBINE THAT IS MOST APPROPRIATE *
* FOR A GIVEN SITE AND ALSO GIVES THE BEST GENERATOR TYPE AND RATING* *******************************************************************************
REAL NS,NT,PTURO,EFT.PGENVA,CMIN,INL,IFL,IM,PGENKW,TXRATE,ITXHV
REAL PFFL,XC,VPEAK.VRATED.PMOTORHGROSS,QDES,PSITE,TOL,IGEN,TRATIO
CHARACTER* 1 IMDATA%
CHARACTER*3(i.TVPE
COMMON G,D,PI.EFP.EFC
t-'
142

COMMON / HYDRO / HGROSS,QDES,QSPILL,QRF,ANSCAN,VC
COMMON / EPARAM / F.PSITE,PGENVA
25 FORMAT^ \A f)
35 FORMAT(” ,A,F6 2,A/)
45 FORMATC ’,A,F6.2)
PRINT 25,'CHOOSE THE TURBINE SPEED (RPM)'
READ*,NT
PRINT 25,'ENTER THE APPROXIMATE TURBINE EFFICIENCY AT RATED FLOW (
$%)'
READ*,EFT
EFT=EFT/100
PTURO = PSITE*EFC*EFP*EFT
NS=NT*SQRT( 1 4*PTURO)/(HGROSS** 1.25)
PRINT 45,THE SPECIFIC SPEED OF THE TURBINE REQUIRED IS ',NS
PRINT 25,'CHOOSE A MATCHING RUNNER(S) FOR THIS VALUE OF SPECIFIC S
SPEED'
PRINT 25,'IF THERE IS MORE THAN ONE CHOICE, USE THE EFF1CIECY CURV
$ES FOR THE ELLIGIBLE TYPES TO CHOOSE THE ONE WITH THE BEST PART LO
SAD EFFICIENCY'
C DETERMINE THE SIZE AND TYPE OF GENERATOR REQUIRED
PGENKW = PTURO*0 85
IF(PGENKW LT 10.0)THEN
PRINT 25,'CHOOSE A SINGLE PHASE 240V, 50HZ SYNCHRONOUS GENERATO
SR'
PRINT 25,WHAT IS THE MACHINES RATED VOLTAGE9 (V)'
READ*. VRATED
. TYPE VI-PHASE SYNCHRONOUS'
PGENVA = PTURO* 1.6/0 8
ELSE IF((PGENKW LT 25 0).AND (PGENKW GT 10.0))THEN
PRINT 25,'USE A 3-PHASE 415V,50HZ INDUCTION GENERATOR’

TYPE = '3-PHASE INDUCTION MOTOR'
PMOTOR = PTURO/O 8
PRINT 35, RATING OF MOTOR TO BE USED AS GENERATOR IS'.PMOT
$OR,'KW'
PRINT 25,'FROM THE MANUFACTURER'^ LIST WHICH IS THE STAND
SARD SIZE CLOSEST TO THIS RATING?'
READ*,PMOTOR
C DETERMINE THE MINIMUM VALUE OF CAPACITANCE REQUIRED FOR EXCITATIQ^
PRINT 25,'IS AN INDUCTION MACHINE MANUFACTURER'S DATA AVA
$ILABLE9(Y/N)'
READMMDATA
PRINT 25,'WHAT IS THE MACHINES RATED VOLTAGE9 (V)'
READ*,VRATED
PGENVA = PMOTOR/0.8
IF(IMDATA.EQ Y’)THEN
PRINT 25,'READ FULL LOAD CURRENT AND THE CORRESPONDIN
$G POWER FACTOR'
READ*,IFL,PFFL
IM=IFL*SIN(ACOS(PFFL))
ELSE
PRINT 25,'CARRY OUT A NO-LOAD TEST ON THE MOTOR AND D
SEDUCE THE NO-LOAD CURRENT AT RATED VOLTAGE AND ENTER THIS VALUE (A
$)'
R£AD*,INL
IM=INL
END IF
XC=VRATED* 1 732/IM
CMIN=1/(2*PI*F*XC)
VPEAK=VRATED* 1414^Vx
PRrNT^5,THE MINIMUM CAPACITANCE REQUIRED IS',CMIN,WITH
SPEAK VOLTAGE OF ’.VPEAK
PRINT 25,'ALLOW MARGIN FOR PEAK VOLTAGE AND CHOOSE A STAND
SARD CAPACITOR THAT IS WITHIN 10% OF THE CALCULATED VALUE'
144

ELSE
PRINT 25,'USE A 3-PHASE 415V, 50HZ SYNCHRONOUS GENERATOR'
PRINT 25, WHAT IS THE MACHINE'S RATED VOLTAGE? (V)'
READ*,VRATED
TYPE = '3-PHASE SYNCHRONOUS’
IF(PGENKW.LT.200)THEN
PGENVA = PTURO*l.6/0.8
ELSE
PGENVA = PTURO*0.85/0.8
END IF
END IF
PRINT 35,THE GENERATOR SIZE REQUIRED IS ',PGENVA ,'KVA’
PRINT 25,'WHICH IS THE STANDARD SIZE CLOSEST TO THIS?'
READ*,PGENVA
C DETERMINE THE SIZE OF TRANSFORMER REQUIRED
IF(PGENVA GT 50)THEN
PRINT 25,'CHOOSE A STANDARD RATING OF TRANSFORMER OF VOLTAGE RA
$TIO 0.415/11KV.'
READ*,TXRATE
PRINT 25,'WHAT IS THE TRANSFORMER’S TURNS RATIO, HV/LV'
READ*,TRATIO
C CALCULATE CT RATING REQUIRED FOR DIFFERENTIAL PROTECTION
PRINT 25,AYRAT IS THE MACHINE'S PERCENTAGE TOLERANCE? (0 -100)’
READ*,TOL
TOL = (TOL+100)/100
IGEN = PGENVAJTOL* IOOO/( 1.7321 *VRATED)
ITXHV = IGEN/(1.7321*TRATIO)
C CALCULATE THE MVA FAULT RATING OF THE CB JUST BEFORE THE BUSBAR
145

END IF
RETURN
END
******************************************************************************
SUBROUTINE ECON
*******************************************************************************
* THIS SUBROUTINE EVALUATES THE ECONOMIC ANALYSIS OF THE PROJECT
* USING THE NET PRESENT WORTH METHOD AND COMPARES THE COST OF G-
* ENERATING POWER USING MHP ON ONE HAND AND USING A DIESEL PLAN-
* T ON THE OTHER THIS IS EVALUATED FOR DIFFERENT INTEREST AND
* DISCOUNT RATES AND FOR VARIOUS CAPACITY FACTORS *******************************************************************************
REAL A(100),C,K,T,N.OM.UCE,CF(100),P,B(100),PWC(500),NPW(500),CD
REAL SUMC(500).PWA(500),PWOM(500),PWB(500),SUMB(500),INTE( 100)
REAL AH(10),CCD.ULD( 10),ICOM,AD(10),OMD,UCED(200),TFC(200)
REAL UCEH(200),ULH( 10).CCH,OMH,DIS( 100)
INTEGER J,L,I,G,R,Q,D.M,Z,E
CHARACTERS ANS
COMMON / EPARAM / F.PSITEPGENVA
5 FORMAT*' \A /)
15 FORMATC 7 A.T6.A.T 19.A.T32,A,T48,A )
25 FORMATC ',T2,I2,T6.F15.2,T19,F15.2,T32,F15.2,T48,F15.2)
35 FORMAT*'A,F15.2/) -
45 FORMATC 7A,F10.2 ) *Vv
55 FORMAT^ AI )
65 FORMAT*’ 7 A,F6.4 /)
75 FORMATC',T5,F4.2.T20.F 10.2 )
85 FORMATC ',A,T30.A / )
146

95 FORMATC \T30,A,T40.A /)
105 FORMATC ’,T5,F4 2.T30.F5 3.T40,F5 3 )
OPEN(20,FILE='A:CAPFAC DAT',STATUS-OLD')
REWIND(20)
OPEN(IO,FILE='ECONOM RES')
REWIND(IO)
PRINT 5,'HOW MANY VALUES OF INTEREST RATE DO YOU W A NT TO TEST*'
READ*,L
PRINT 5,'HOW MANY VALUES OF DISCOUNT RATE DO YOU W A N T TO TEST1?'
READ*,Q
PRINT 5,'WHAT IS THE CAPITAL COST OF THE PROJECT INCLUDING THE DIS
STRIBUTION SYSTEM? ($)'
READ*,C
PRINT 5,'WHAT IS THE UNIT COST OF ENERGY FROM THE ALTERNATIVE SOUR
$CE?(US$/KWH)'
READ*,UCE
PRINT 5,'ENTER THE CONSTRUCTION & FINANCING PERIODS AND THE USEFUL
$ LIFE OF THE PR O JEC T
READ*,T,K,N
P = PGENVA*0 8
DO 40 R=1,Q
PRINT 5,'ENTER THE DISCOUNT RATE (%)'
READ*,DIS(R)
WRITE( 10,45)'DISCOUNT RATE = ',DIS(R),'%'
DIS(R)=DIS(R)/100
DO 50 1=1,L
PRINT 5,'ENTER THE INTEREST RATE (%)'
READM NTE(I)
WRITE( 10,45)'INTEREST RATE = ,,INTE(I),,% ’
INTE(I)=INTE(I)/100
A(I) = (C*INTE(I)*(I+IN TE(I))^K)/((l+INTE(I))**K -l)
OM = 0.03*C
DO 60 M = I ,I0
147

READ(20.*)CF(M)
3(M) = UCE*CF|M)*P*8760
WRJTE(10.45)'ANNt)ITY FOR 6 YEARS REPAYMENT = \A(I)
WRITE(10,45)'ANNUAL 0 & M = \O M
WR1TE( 10,45)'ANNUAL BENEFITS = \B(M )
WRJTE( 10.15)'YEAR','PW ANNUITY','PW O& M '/PW COSTS’,’PW
SUMB(M) = 0
SUMC(M) = 0
DO 10 J=1.N
1F(J LE K)THEN
PWA(J) = A(l)/( l+DIS(R))**J
END IF
IF(J GE.T+DTHEN
PWOM(J) = OM/( 1+DIS(R))**J
PWB(J) = B(M)/( 1 + DIS(R))**J
END IF
PWC(J) = PWA(J) + PWOM(J)
SUMC(M) = SUMC(M) + PWC(J)
SUMB(M) = SUMB(M) + PWB(J)
NPW(M) = SUMB(M) - SUMC(M)
WRITE( IO,25)J,PWA(J),PWOM(J),PWC(J),PWB(J)
WR1TE( I0.35)'THE NET PRESENT W O RTH IS ='.NPW(M)
$ BEN.
10 CONTINUE
60 CONTINUE
WR1TE(!0.95)’CAP. FACT.’, NET PW'
DO 20 E= 1. 10
WRITE ( I0.75)CF(E),NPW(E)
20
R£WIND(20)
CONTINUE
50 CONTINUE
40 CONTINUE
148

C COMPARATIVE STUDY OF MHP AND DIESEL ENGINE
PRINT 5,'DO YOU WANT TO CARRY OUT A COMPARATIVE STUDY OF THE MHP A
$ND THE EQUIVALENT DIESEL PLANT? (Y/N)'
READ 55,ANS
CCH = C
IF(ANS.EQ/Y')THEN
PRINT 5,'ENTER THE TOTAL CAPITAL COST OF THE DIESEL PLANT
READ*,CCD
PRINT 5,'HOW MANY VALUES OF USEFUL LIFE DO YOU WANT TO USE?'
READ*,M
PRINT 5,'ENTER THE COST OF FUEL PER KWH - ASSUME 0.30 LIT/KWH'
READ*,FC
PRINT 5,'WHAT INTEREST RATE DO YOU WANT TO USE (%)'
READMCOM
ICOM = ICOM/100
WRITE(10,5)'CAPACITY FACTOR AND AVERAGE GENERATION COST
WRITE(10,5)'FOR HYDRO AND DIESEL POWER STATIONS'
WRITE(10,85)'AV ANNUAL CF’.'AV COST (S/KWH)'
WRITE( 10,95)'HYDRO'.'DIESEL'
DO 80 J=1.M
PRINT 5.'ENTER THE USEFUL LIFES OF THE HYDRO AND DIESEL PLANT R
SESPECTIVELY’
READ*,ULH(J),ULD(J)
DO 70 1=1,10
READ(20,*)CF(I)
C CALCULATE THE FIXED AND VARIABLE COST OF EACH UNIT
AD(J) = (CCD*ICOM*(l+ICOM)**ULD(J))/((l+ICOM)**ULD(J)-l)
OMD = 0 035*CCD
TFC(I) = (AD(J)+OMD)/(CF(IVT*8760)
UCED(I) = FC+TFC(I)
AH(J) = (CCH*ICOM*(l+ICOM)**ULH(J))/((l+ICOM)**ULH(J)-l)
OMH = 0.02*CCH
149

UCEH(I) = (OMH + AH(j))/(CF(I)*P*8760)
WR1TE( 10.105)CF(I),UCEH(I),UCED(I)
70 CONTINUE
REWIN D(20)
80 CONTINUE
END IF
CLOSE(20)
CLOSE(IO)
RETURN
END
V
150

APPENDIX B
Ciumbel Distribution (Extreme-Value Type l Distribution)
This method has two approaches. In both cases, streamflow data taken over a number of
years must be available. For the determination of flood flow rate for a given recurrence
frequency, the peak river flow rate for each recorded year must be known.
flie first approach calculates the recurrence period Tr as
//+1T =
m
w here n = number of years o f record
m = rank of event in order of magnitude, the highest annual peak discharge
being m=l down to the lowest being m = n.
fhe probability, P, that a flood recurs is the reciprocal o f the return period
P =1
7;
The graph of annual peak discharge against return period on a special extreme-value
probability graph paper yields a straight line. Other values are extrapolated from the
graph.
The second method involves the calculation of the mean and standard deviation of the
annual peak discharge rate values. The flood discharge rate, X, with a specified
recurrence period is given by
X = X+ K o ,AT = 0.1191 y - 0.45
where
X - is the mean of the annual peak discharge rates
a x - is the standard deviation
y - is the reduced variate given by
v = -ln|-li^fl - /?)j
Values of K are given in the table below.
151t--

Table B-l : Values of K for the extreme-value (type I) distribution.
Return period, years Probability Reduced variate, y K
1.58 0.63 0.000 -0.450
2.00 0.50 0.367 -0.164
2.33 0.43 0.579 0.001
5 0.2 1.500 0.719
10 0.1 2.250 1.30
20 0.05 2.970 1.87
50 0.02 3.902 2.59
100 0.01 4.600 3.14
200 0.005 5.296 3.68
400 0.0025 6.000 4.23
For example, the flood discharge rate with a return period of 50 years (probability of
0.02) will be equal to
*(50) = *+ 2 .5 9 a x
A
152