Embed Size (px)
Citation preview
Development of Enzyme Replacement and
Pharmacological Chaperone Approaches for Therapy of
Metachromatic Leukodystrophy
Dissertation
zur
Erlangung des Doktorgrades (Dr. rer. nat.)
der
Mathematisch-Naturwissenschaftlichen Fakultät
der
Rheinischen Friedrich-Wilhelms-Universität Bonn
vorgelegt von
Tilman Schuster
aus
Wittmund
Bonn, 2014

Angefertigt mit Genehmigung der Mathematisch-Naturwissenschaftlichen
Fakultät der Rheinischen Friedrich-Wilhelms-Universität Bonn
1. Gutachter: Prof. Dr. V. Gieselmann
2. Gutachter: Prof. Dr. S. Burgdorf
Tag der Promotion: 28.11.2014
Erscheinungsjahr: 2014

Table of contents I
Table of contents
Table of contents .............................................................................................................. I
List of Figures ................................................................................................................ IV
List of tables ................................................................................................................... V
List of abbreviations ..................................................................................................... VI
1 Summary .............................................................................................................. 1
2 Introduction ......................................................................................................... 3
2.1 Lysosomes ............................................................................................................. 3
2.2 Lysosomal storage diseases ................................................................................... 6
2.3 Therapeutic approaches for lysosomal storage disorders ...................................... 8
2.4 Metachromatic Leukodystrophy .......................................................................... 10
2.5 Arylsulfatase A .................................................................................................... 12
2.6 Therapeutic Approaches for Metachromatic Leukodystrophy ............................ 13
2.7 The blood brain barrier ........................................................................................ 15
2.8 Transport of drugs across the blood brain barrier ............................................... 17
2.8.1 Polymeric nanoparticle mediated brain delivery of therapeutics ........................ 17
2.8.2 Elongation of the blood circulation times to increase brain delivery of therapeutics .......................................................................................................... 20
2.9 Aim of this study ................................................................................................. 21
3 Materials ............................................................................................................. 22
3.1 Chemicals ............................................................................................................ 22
3.2 Enzymes .............................................................................................................. 23
3.3 Nanoparticle preparations .................................................................................... 23
3.4 Cells ..................................................................................................................... 24
3.5 Mice ..................................................................................................................... 24
3.6 Primers ................................................................................................................. 24
3.7 Instruments .......................................................................................................... 25
3.8 Software ............................................................................................................... 26
3.9 Ready to use reaction kits .................................................................................... 26
4 Methods .............................................................................................................. 27
4.1 Standard molecular biology techniques ............................................................... 27
4.1.1 Polymerase Chain Reaction ................................................................................. 27
II Table of contents
4.1.2 Digestion of DNA using restriction endonucleases ............................................. 28
4.1.3 Agarose gel electrophoresis ................................................................................. 28
4.1.4 DNA Extraction and purification from agarose gels ........................................... 28
4.1.5 Ligation and transformation of E. coli ................................................................. 29
4.1.6 Phenol/chloroform purification and DNA precipitation ...................................... 29
4.2 Standard protein-biochemistry techniques ........................................................... 29
4.2.1 Determination of protein concentrations ............................................................. 29
4.2.2 Sodium dodecyl sulfate polyacrylamide gel electrophoresis (SDS-PAGE) ........ 30
4.2.3 Coomassie staining of polyacrylamide gels ......................................................... 31
4.2.4 Semi-dry Western Blot ........................................................................................ 31
4.2.5 Enzymatic deglycosylation of proteins using Endo Hf ........................................ 32
4.2.6 Protein purification by affinity chromatography ................................................. 32
4.3 Cell culture techniques ......................................................................................... 33
4.3.1 Culture conditions ................................................................................................ 33
4.3.2 Cryopreservation .................................................................................................. 33
4.3.3 Endocytosis experiments ..................................................................................... 34
4.4 Cloning and expression of MPR300 domain 9 constructs ................................... 35
4.4.1 Cloning and in vitro mutagenesis ........................................................................ 35
4.4.2 Transformation of Pichia pastoris ....................................................................... 36
4.4.3 Expression of pPICZα-B constructs in P. pastoris .............................................. 36
4.5 Techniques involving nanoparticles .................................................................... 36
4.5.1 Determination of ASA activity after incubation in solvents ................................ 36
4.5.2 Unspecific, adsorptive binding of ASA to nanoparticles ..................................... 37
4.5.3 Covalent binding of ASA to nanoparticles .......................................................... 37
4.5.4 High affinity binding of ASA to PLA- and PLGA-nanoparticles ....................... 38
4.5.5 Release of ASA from nanoparticles in vitro ........................................................ 41
4.6 In vivo experiments .............................................................................................. 41
4.6.1 Intravenous injections of various nanoparticle preparations ............................... 41
4.6.2 Dissection of tissues ............................................................................................. 42
4.6.3 Homogenization of tissues ................................................................................... 43
4.7 Biochemical assays .............................................................................................. 43
4.7.1 ASA-ELISA ......................................................................................................... 43
4.7.2 Standard ASA activity measurements ................................................................. 45
4.7.3 Adapted ASA activity assay for high-throughput screenings .............................. 46
4.7.4 KD determination .................................................................................................. 47
4.7.5 Dissociation experiments of ASA and receptor fragment ................................... 47
4.8 Mass spectrometric analyses of compounds ........................................................ 48
5 Results ................................................................................................................. 49
5.1 Use of nanoparticles to increase brain delivery of Arylsulfatase A ..................... 49
5.1.1 Biotolerance of PBCA-, PLA- und HSA-nanoparticles ...................................... 50
Table of contents III
5.1.2 Incorporation of ASA into nanoparticles ............................................................ 51
5.1.3 Adsorption of ASA to the surface of nanoparticles ............................................. 52
5.1.4 Stable binding of ASA to nanoparticles .............................................................. 55
5.2 Increasing blood circulation times by shielding the M6P residues of ASA ........ 65
5.2.1 Cloning, protein expression and characterization of ‘MPR300 dom9’ ............... 66
5.2.2 Functional characterization of MPR300 dom9 polypeptides .............................. 68
5.2.3 Endocytosis experiments of MPR300 dom9 (N28Q & N94Q) complexed ASA ..................................................................................................................... 70
5.2.4 Dissociation of ASA and receptor fragment in different solutions ..................... 72
5.2.5 Covalent binding of the receptor fragment to nanoparticles ............................... 73
5.3 Identification of inhibitors for Arylsulfatase A ................................................... 74
5.3.1 Establishment of an assay suitable for high throughput screening ...................... 75
5.3.2 High throughput screening of libraries ................................................................ 76
5.3.3 Biochemical evaluation of inhibitors found in screenings .................................. 80
5.3.4 Identification of ASA inhibitors by Virtual Screening ........................................ 89
6 Discussion ........................................................................................................... 93
6.1 Enzyme replacement therapy and use of nanoparticles ....................................... 93
6.1.1 Choice of nanoparticles ....................................................................................... 95
6.1.2 Strategies to combine ASA and nanoparticles .................................................... 96
6.1.3 In vivo experiments with nanoparticles ............................................................. 100
6.2 Physical shielding of the M6P residues of ASA ............................................... 103
6.3 Identification of ASA inhibitors ........................................................................ 108
6.3.1 Potential of compound A to establish a cell culture model of MLD ................. 109
6.3.2 Potential of compound A as a pharmacological chaperone for ASA ................ 110
Bibliography ................................................................................................................ 112
Appendix ...................................................................................................................... 124
Acknowledgements ..................................................................................................... 125
Curriculum Vitae ........................................................................................................ 126
Declaration .................................................................................................................. 127

IV List of Figures
List of Figures
Figure 2.1: Sorting of lysosomal enzymes. ....................................................................... 5
Figure 2.2: Metachromatic leukodystrophy (MLD). ....................................................... 11
Figure 2.3: The blood brain barrier (BBB) - structure and endogenous transport mechanisms. ........................................................................................................ 16
Figure 2.4: Proposed transport mechanism of surfactant coated, polymeric nanoparticles across the BBB and proof for apolipoprotein E involvement. ...... 19
Figure 5.1: Residual ASA activity after incubation of ASA in solvents and solutions used for nanoparticle production. ........................................................................ 51
Figure 5.2: Adsorption of ASA on different nanoparticle batches. ................................ 53
Figure 5.3: Release of ASA from nanoparticles in serum or water over time after passive adsorption. .............................................................................................. 55
Figure 5.4: Covalent crosslinking strategies of ASA binding to nanoparticles. ............. 57
Figure 5.5: In vitro and in vivo studies of ASA covalently bound to HSA nanoparticles. ....................................................................................................... 58
Figure 5.6: High-affinity binding of biotinylated ASA to different PLA- and PLGA-nanoparticle batches after their modification with neutravidin. .......................... 60
Figure 5.7: Binding of biotinylated or non-biotinylated to thiolated or non-thiolated neutravidin nanoparticles and their release of ASA in serum and water. ........... 61
Figure 5.8: In vitro and in vivo studies of biotinylated ASA high-affinity-bound to neutravidin-modified PLGA-nanoparticles (batch 1311). ................................... 64
Figure 5.9: Coomassie stained SDS-PAGE of four M6P binding domain fragment constructs of the MPR300 (‘MPR300 dom 9’), deglycosylated by incubation with Endo Hf or not deglycosylated. ................................................................... 67
Figure 5.10: KD determination of ASA binding to the MPR300 Dom9 constructs mentioned before. ................................................................................................ 68
Figure 5.11: pH dependent dissociation of ASA from the receptor fragment. ............... 69
Figure 5.12: Endocytosis of ASA after pre-coincubation with varying concentrations of receptor fragment in MEFs after 24 hours. ............................. 71
Figure 5.13: Dissociation of ASA from the MPR-fragment in presence different solutions. .............................................................................................................. 72
Figure 5.14: Crosslinking strategy for covalent attachment of the MPR fragment to amine modified PLGA-nanoparticles. ................................................................. 73
Figure 5.15: Results of high throughput screening with approximately 30,000 compounds performed to identify ASA inhibitors. ............................................. 78
Figure 5.16: Results of manual high throughput screening of 440 commercially available drugs. .................................................................................................... 79
Figure 5.17: IC50 determination of compounds previously identified in high throughput screenings. ......................................................................................... 81
Figure 5.18: Inhibition kinetics of previously found candidate ASA inhibitors in different concentrations and varying substrate concentrations to determine the type of ASA inhibition. ................................................................................. 83
Figure 5.19: Specificity of ASA inhibitors. .................................................................... 84
List of tables V
Figure 5.20: Residual ASA activity after incubation for varying time periods (1-90 min) in the presence or absence of compound A (crosses), primaquine (filled squares), sulfathiourea (filled triangles) or metamizole (filled circles). .. 85
Figure 5.21: Mass spectra of metamizole (A, B) and sulfathiourea (C) after incubation under assay conditions (37°C, pH 5.0 for 0-90 minutes). ................. 87
Figure 5.22: ASA inhibition in presence of increasing concentrations of sodium phosphate in presence (+) or absence (-) of primaquine. .................................... 89
Figure 5.23: Compounds identified by virtual screening approach (A) and evaluation of their effect on ASA activity (B). ................................................... 91
Figure 6.1: Publications describing brain delivery of drugs by different nanoparticle preparations. ........................................................................................................ 94
Figure 6.2: Comparison of the pH dependent dissociation of the non-glycosylated MPR dom9 fragment and ASA observed in this work (A) and of the whole MPR300 on the cell surface of fibroblasts and β-glucuronidase as described by Gonzalez-Noriega et al. (1980) (B). ............................................................. 105
List of tables
Table 2.1: Example lysosomal storage disorders – corresponding defective proteins and accumulating storage materials (adapted from Ballabio and Gieselmann 2009). .................................................................................................................... 7
Table 5.1: Enzyme kinetic parameters determined by Michaelis-Menten kinetics and subsequent non-linear regression analysis using the software Graphpad Prism. .................................................................................................................. 82
VI List of abbreviations
List of abbreviations
(v/v) Volume per volume
(w/v) Weight per volume
ABTS 2,2'-azino-bis(3-ethylbenzothiazoline-6-sulphonic acid)
AP1 Adaptor protein 1
ApoE Apolipoprotein E
ASA Arylsulfatase A
ASB Arylsulfatase B
ATP Adenosine triphosphate
BBB Blood-brain barrier
BSA Bovine serum albumin
CHO-S Chinese hamster ovary – suspension (cells)
CNS Central nervous system
Da Dalton (g/mol)
DGJ 1-deoxygalactonojirimycin
DMEM Dulbecco’s modified Eagle’s medium
DMSO Dimethyl sulfoxide
DNA Deoxyribonucleic acid
E. coli Escherichia coli
ECL Enhanced chemiluminescence
EDC 1-ethyl-3-(3-dimethylaminopropyl)carbodiimide
EDTA Ethylenediaminetetraacetic acid
ELISA Enzyme-linked immunosorbent assay
ERAD Endoplasmic reticulum-associated degradation
ERT Enzyme replacement therapy
FDA United States Food and Drug Administration
FGE Formylglycine-generating enzyme
h, min, s Hours, minutes, seconds
HEPES 4-(2-hydroxyethyl)-1-piperazineethanesulfonic acid
HSA Human serum albumin
HSCT Hematopoietic stem cell therapy
IC50 Half maximal inhibitory concentration
k, m, µ, n, p, f Kilo (103), milli (10-3), micro (10-6), nano (10-9), pico (10-12), femto (10-15)
KD Dissociation constant
Km Michaelis-Menten constant
List of abbreviations VII
L Liter
LD50 Median lethal dose
LIMP-2 Lysosomal integral membrane protein-2
LSD Lysosomal storage disease
M Molar (mol/L)
MEF Mouse embryonic fibroblast
MLD Metachromatic leukodystrophy
MPR Mannose 6-phosphate receptor
MPR300 Cation-independent mannose 6-phosphate receptor
MPR300 dom9
Domain 9 of the cation-independent mannose 6-phosphate receptor
MPR46 Cation-dependent mannose 6-phosphate receptor
MPS Mononuclear phagocytic system
MR Mannose receptor
n.s. Not significant
NaAc Sodium acetate
NGF Nerve growth factor
NHS N-hydroxysuccinimide
Ni-NTA Nickel-nitrilotriacetic acid
o.n. Overnight
P. pastoris Pichia pastoris
P188 Poloxamer 188
PAGE Polyacrylamide gel electrophoresis
PBCA Poly(butyl cyanoacrylate)
PBS Phosphate buffered saline
PCR Polymerase chain reaction
PEG Polyethylene glycol
pI Isoelectric point
PLA Poly(lactic acid)
PLGA Poly(lactic-co-glycolic acid)
PNS Peripheral nervous system
PS 80 Polysorbate 80
PVA Polyvinyl alcohol
RB Reaction buffer
SDS Sodium dodecyl sulfate
SRT Substrate reduction therapy
SUMF1 Sulfatase-modifying factor 1
TBS Tris-buffered saline

VIII List of abbreviations
TBS-T Tris-buffered saline, supplemented with Tween 20
TCEP Tris(2-carboxyethyl)phosphine
UV Ultraviolet
Vmax Maximal reaction velocity
w/o Without
wt Wildtype
1 Summary 1
1 Summary
Metachromatic leukodystrophy (MLD) is a monogenic, autosomally recessively inherit-
ed lysosomal storage disease. Certain mutations of the arylsulfatase A (ASA) gene
cause misfolding or absence of ASA. Physiologically ASA is responsible for the lyso-
somal degradation of 3-O-sulfogalactosylceramide (sulfatide), a main lipid component
of myelin. Lack of ASA activity results in accumulation of sulfatide and consequently
in demyelination processes, causing severe central nervous system pathology leading to
premature death.
Two therapeutic approaches for MLD were pursued in this thesis: enzyme replacement
therapy (ERT) and chaperone therapy. For ERT recombinantly produced enzyme is in-
jected intravenously. However, the blood brain barrier (BBB) prevents efficient
transport into the brain, the main target of the disease. Therefore options to increase
brain delivery were investigated. To this end ASA was bound to four different nanopar-
ticle preparations that have been described to increase brain delivery of therapeutics.
Inclusion during polymerization was unfeasible due to loss of ASA activity. Adsorption
of ASA to the nanoparticle surface was efficient, however rapid and complete desorp-
tion was observed in presence of serum in vitro. In contrast, stable binding by direct
crosslinking or high-affinity methods significantly reduced desorption in presence of
serum. Two nanoparticle systems were thereon investigated with respect to their poten-
tial to increase brain delivery of ASA in vivo. However, contrary to the working hy-
pothesis, brain delivery was not enhanced upon binding to nanoparticles in comparison
to free ASA, although the overall biodistribution of ASA was altered. This was ex-
plained by rapid uptake via mannose 6-phosphate (M6P) receptor endocytosis. To re-
duce uptake by peripheral cells, a M6P binding domain was coupled to nanoparticles in
order to physically shield ASA’s M6P residues that are recognized by M6P receptors on
these cells. Indeed, in first in vitro experiments, shielding of ASA resulted in a reduc-
tion of uptake by M6P receptor expressing cells. In vivo, this effect would be expected
to lead to prolonged blood circulation times and an increase in brain delivery.
Chaperone therapy aims at restoring activity of misfolded enzyme molecules by stabi-
lizing correct folding intermediates. Typically, pharmacological chaperones are small-
molecule enzyme inhibitors and ideally cross the BBB. By means of high throughput

2 1 Summary
screenings one ASA inhibitor was identified and subsequently characterized biochemi-
cally. This compound is to be further tested with respect to its use as a pharmacological
chaperone.
2 Introduction 3
2 Introduction
2.1 Lysosomes
To understand lysosomal storage diseases and corresponding therapeutic approaches, it
is necessary to consider physiological functioning of lysosomes. Lysosomes are cellular
organelles and consist of a limiting, external membrane harboring hydrolytic enzymes.
Depending on the cell type, one cell can contain up to 100 lysosomes. The lysosomal
lumen is acidic (pH 4.6 - 5.0) due to continuous active import of protons by adenosine
triphosphate (ATP) dependent membrane proton pumps of the V-type (Ohkuma et al.
1982). The primary function of lysosomes is the degradation of macromolecules to
components of low molecular weight. These are then transported to the cytosol and used
for the de novo synthesis of cellular macromolecules. For these degradation processes,
the lysosome contains approximately 40 different hydrolases - proteases, glycosidases,
lipases, nucleases, phosphatases and sulfatases (Luzio et al. 2007), which share a com-
mon pH optimum at lysosomal pH (Coffey and Duve 1968). This ensures that in case of
lysosomal rupture, the hydrolases do not destroy cellular components, thereby granting
survival of the cell. On the luminal membrane of lysosomes, glycosylated membrane
proteins form a glycocalyx preventing uncontrolled membrane-protein and -lipid diges-
tion by lysosomal enzymes (Kundra and Kornfeld 1999).
Extracellular macromolecules are transported to the lysosome via endocytosis or phago-
cytosis. During this process the lipid bilayer of the cell membrane invaginates and ulti-
mately leads to the formation of an endosome. Intracellular macromolecules such as
damaged cell organelles or dysfunctional proteins can be engulfed by a lipid bilayer,
forming autophagosomes. Both autophagosomes and endosomes ultimately transport
their cargo to lysosomes to allow for their degradation. The precise molecular mecha-
nism of this transport has not yet been fully elucidated. Four theories are discussed:
(1) Endosomes mature into lysosomes by acidification of their lumen; (2) Vesicles
transport the cargo from endosomes to lysosomes; (3) Endosomes repeatedly fuse with
and detach from lysosomes transiently (‘kiss and run’); (4) Endosomes and lysosomes
fuse resulting in a hybrid cellular compartment. Increasing evidence favors the latter
two theories (Luzio et al. 2007).
4 2 Introduction
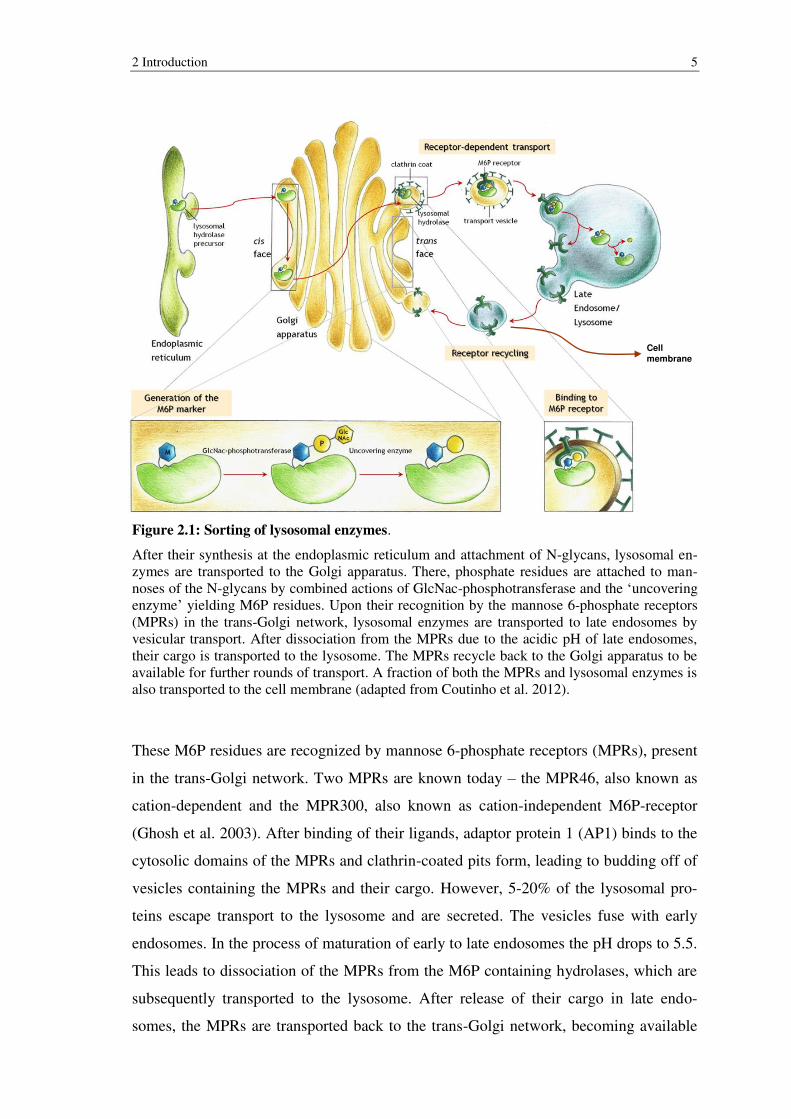
The synthesis and transport of lysosomal hydrolases involve the endoplasmic reticulum,
the Golgi apparatus including the trans-Golgi network, and endosomes (Figure 2.1).
Soluble lysosomal enzymes are translated at the rough endoplasmic reticulum and are
translocated into their lumen by recognition of a 20-25 amino acids long signal se-
quence at their N-terminus. During this process the signal sequence is removed by sig-
nal peptidases. At certain asparagine residues (amino acid recognition sequence: Asn-
X-Ser/Thr) oligosaccharides are added (N-glycosylation). After vesicular transport to
the Golgi apparatus, N-glycans of soluble lysosomal enzymes are specifically modified:
First, N-acetylglucosaminyl-1-phosphotransferase (EC 2.7.8.17, short GlcNac-
phosphotransferase) adds N-acetylglucosamine-1-phosphate to terminal mannose resi-
dues of N-glycans. Then N-acetylglucosamin-1-phosphodiester-α-N-acetylglucosamini-
dase (‘uncovering enzyme’, EC 3.1.4.45) removes the N-acetylglucosaminyl residues,
thereby uncovering mannose 6-phosphate (M6P) residues (Braulke and Bonifacino
2009; Coutinho et al. 2012a).
2 Introduction 5
Figure 2.1: Sorting of lysosomal enzymes.
After their synthesis at the endoplasmic reticulum and attachment of N-glycans, lysosomal en-zymes are transported to the Golgi apparatus. There, phosphate residues are attached to man-noses of the N-glycans by combined actions of GlcNac-phosphotransferase and the ‘uncovering enzyme’ yielding M6P residues. Upon their recognition by the mannose 6-phosphate receptors (MPRs) in the trans-Golgi network, lysosomal enzymes are transported to late endosomes by vesicular transport. After dissociation from the MPRs due to the acidic pH of late endosomes, their cargo is transported to the lysosome. The MPRs recycle back to the Golgi apparatus to be available for further rounds of transport. A fraction of both the MPRs and lysosomal enzymes is also transported to the cell membrane (adapted from Coutinho et al. 2012).
These M6P residues are recognized by mannose 6-phosphate receptors (MPRs), present
in the trans-Golgi network. Two MPRs are known today – the MPR46, also known as
cation-dependent and the MPR300, also known as cation-independent M6P-receptor
(Ghosh et al. 2003). After binding of their ligands, adaptor protein 1 (AP1) binds to the
cytosolic domains of the MPRs and clathrin-coated pits form, leading to budding off of
vesicles containing the MPRs and their cargo. However, 5-20% of the lysosomal pro-
teins escape transport to the lysosome and are secreted. The vesicles fuse with early
endosomes. In the process of maturation of early to late endosomes the pH drops to 5.5.
This leads to dissociation of the MPRs from the M6P containing hydrolases, which are
subsequently transported to the lysosome. After release of their cargo in late endo-
somes, the MPRs are transported back to the trans-Golgi network, becoming available
Cell
membrane
6 2 Introduction
for further rounds of transport (Braulke and Bonifacino 2009). Both MPRs are also
found on the cell surface, but only the MPR300 has been shown to be involved in the
internalization process of M6P containing ligands (Nadimpalli and Amancha 2010).
Secreted lysosomal hydrolases can thus be recognized by MPRs on the cell surfaces of
the same or neighboring cells. Consequently these lysosomal enzymes are endocytosed
and transported into the lysosome. The phenomenon that cells deficient for a lysosomal
enzyme can take up functional enzyme secreted by another cell has first been observed
by Fratantoni et al. (1968) and is the basis for most therapies of lysosomal storage dis-
orders (‘cross correction’).
Besides the most common MPR-mediated transport route described here, sortilin and
lysosomal integral membrane protein 2 (LIMP-2) have also been shown to contribute to
lysosomal transport of some newly synthesized lysosomal proteins (e.g. β-
glucocerebrosidase) (Reczek et al. 2007; Coutinho et al. 2012b).
2.2 Lysosomal storage diseases
Approximately 50 lysosomal storage disorders (LSDs) have been identified. Tradition-
ally, LSDs are subcategorized according to the storage material found in the lysosomes,
causing the disease. In mucopolysaccharidoses and sphingolipidoses, glycosaminogly-
cans and sphingolipids accumulate, respectively (Futerman and van Meer 2004; Heese
2008). However, several defects exist in which more than one macromolecule accumu-
lates showing the limitations of this classification.
The reason for this intralysosomal accumulation is usually lack of activity or absence of
one or more lysosomal enzymes. An overview of typical LSDs, the affected enzymes
and the accumulating storage material is given in table 2.1. For instance, in Gaucher
disease, a sphingolipidosis, lack of glucosylceramide-β-glucosidase results in accumula-
tion of glucosylceramide, especially in macrophages. Consequently, patients suffering
from Gaucher disease, type I, show hepatosplenomegaly, but also anemia, thrombocy-
topenia and bone damage. Some LSDs cannot only be caused by lack of activity of a
lysosomal hydrolase, but also by dysfunction of activator proteins, such as saposins.
One example is saposin C, serving activation of glucosylceramide-β-glucosidase.
Saposin C deficiency also leads to (juvenile) Gaucher disease (Kolter and Sandhoff
2006).
2 Introduction 7
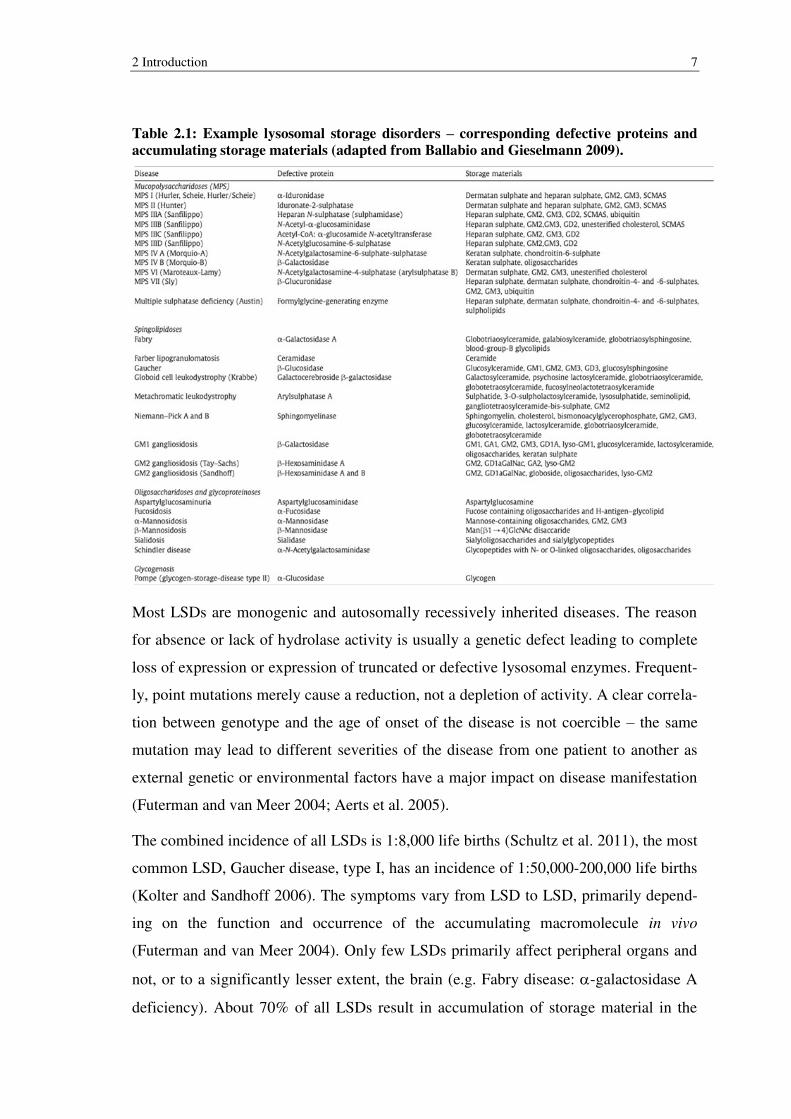
Table 2.1: Example lysosomal storage disorders – corresponding defective proteins and
accumulating storage materials (adapted from Ballabio and Gieselmann 2009).
Most LSDs are monogenic and autosomally recessively inherited diseases. The reason
for absence or lack of hydrolase activity is usually a genetic defect leading to complete
loss of expression or expression of truncated or defective lysosomal enzymes. Frequent-
ly, point mutations merely cause a reduction, not a depletion of activity. A clear correla-
tion between genotype and the age of onset of the disease is not coercible – the same
mutation may lead to different severities of the disease from one patient to another as
external genetic or environmental factors have a major impact on disease manifestation
(Futerman and van Meer 2004; Aerts et al. 2005).
The combined incidence of all LSDs is 1:8,000 life births (Schultz et al. 2011), the most
common LSD, Gaucher disease, type I, has an incidence of 1:50,000-200,000 life births
(Kolter and Sandhoff 2006). The symptoms vary from LSD to LSD, primarily depend-
ing on the function and occurrence of the accumulating macromolecule in vivo
(Futerman and van Meer 2004). Only few LSDs primarily affect peripheral organs and
not, or to a significantly lesser extent, the brain (e.g. Fabry disease: -galactosidase A
deficiency). About 70% of all LSDs result in accumulation of storage material in the
8 2 Introduction
brain, in many cases leading to central nervous system (CNS) pathology (Begley et al.
2008).
2.3 Therapeutic approaches for lysosomal storage disorders
Five major strategies are currently pursued by researchers and physicians for treatment
of LSDs: cell-, gene-, substrate reduction-, chaperone- and enzyme replacement thera-
py. None of these strategies is effective for all LSDs – the strategy rather needs to be
adjusted to each LSD and its specific symptoms. The underlying principles of the men-
tioned treatment options will be explained here.
One example of a cell based therapeutic approach is hematopoietic stem cell therapy
(HSCT), which has been in use for 30 years. Hematopoietic stem cells of a healthy do-
nor are engrafted in the bone marrow of LSD patients. These cells and their progeny
produce and secrete active enzyme, whose lack causes the LSD in the patient. The en-
zyme is then taken up by MPR300-dependent endocytosis allowing for metabolic cross
correction. HSCT is most efficient when performed before the age of two years. Clinical
benefits are evident for treated mucopolysaccharidosis, type I, (Hurler’s disease) pa-
tients with substantial reduction of glycosaminoglycan storage and amelioration of the
pathology (Beck 2010; Noh and Lee 2014). Theoretically, LSDs with CNS pathology
can also be treated, as a subset of the transplanted cells may infiltrate the CNS
(Brazelton et al. 2000; Asheuer et al. 2004). However, clinical trials using HSCT for
several other LSDs, such as mucolipidosis type II (I-cell disease), mucopolysaccha-
ridoses types II (Hunter syndrome) and III (Sanfilippo syndrome), showed limited to no
effect in terms of neuropathology (Lund et al. 2014; Noh and Lee 2014).
Gene therapy aims at transducing patient-own cells by the use of e.g. lentiviral vectors.
After transduction, cells express normal or supranormal levels of functional target lyso-
somal enzyme. Due to cross correction, neighboring cells can also take up the functional
enzyme. Viral vectors are either directly injected into tissues, transducing the cells in
the periphery of the injection site, or cells, e.g. hematopoietic stem cells, are isolated
from patients, transduced and then re-implanted (‘ex vivo gene therapy’). Although pre-
clinical experiments in mouse models were promising, clinical trials using gene therapy
were therapeutically inefficient for Gaucher (type I), mucopolysaccharidosis (type II)
and Batten diseases (Byrne et al. 2012). One example of a more successful phase I clin-
2 Introduction 9
ical trial of ex vivo gene therapy for metachromatic leukodystrophy will be discussed in
chapter 2.6.
Substrate reduction therapy (SRT) is a relatively newly evolving therapeutic option. In
contrast to all other approaches aiming at reducing storage material by increasing its
degradation, the aim of SRT is to decrease the de novo synthesis of the accumulating
component. To that end, small compounds are used to inhibit target enzymes responsi-
ble for synthesis of the accumulating storage material. In 1998, first trials were per-
formed using N-butyl-deoxynojirimycin (Miglustat) for SRT of Gaucher disease.
Miglustat is an imino sugar, functioning as a reversible inhibitor of glucosylceramide
synthase, thereby reducing production of the storage material of Gaucher disease, glu-
cosylceramide. Today, Miglustat is not only clinically approved for treatment of Gau-
cher, type I disease, but also for Niemann Pick, type C in the European Union (Venier
and Igdoura 2012).
A similar approach is chaperone therapy, also employing small compounds as inhibi-
tors. The molecular targets are misfolded lysosomal enzymes, responsible for failure in
degradation of storage material. In the endoplasmic reticulum, these inhibitors bind re-
versibly to the active site of the enzyme. By acting as a chaperone, a portion of the en-
zymes is correctly-folded and escapes the endoplasmic-reticulum-associated protein
degradation pathway (ERAD), physiologically responsible for degradation of misfolded
proteins. Ideally, once reaching the lysosome, the inhibitor dissociates from the enzyme
in a pH-dependent manner, releasing at least partially active enzyme. Consequently
storage material is degraded, preventing progression of the disease. The compound 1-
deoxygalactonojirimycin (DGJ) is a competitive inhibitor of -galactosidase A and has
now reached phase III clinical trials for chaperone therapy of Fabry disease (Suzuki,
2013). Further compounds have been identified and used in preclinical and clinical trials
for chaperone therapies of GM1- and GM2-gangliosidosis and Gaucher disease (Maegawa
et al. 2007; Bendikov-Bar et al. 2013; Suzuki 2013). Both substrate reduction and chap-
erone therapy use small molecules for treatment. These are likely to traverse the blood
brain barrier (BBB) and can frequently even be administered per os.
Enzyme replacement therapy (ERT) is the most widely used approach for LSDs. Re-
combinantly produced, purified enzyme is usually administered intravenously. After its
distribution by the blood circuit, cells throughout the body are able to take up recombi-
nant enzyme primarily via MPR-mediated endocytosis and subsequent transport to the
10 2 Introduction
lysosome. One exception is the enzyme β-glucocerebrosidase that is also the first en-
zyme that has been successfully used for ERT of Gaucher disease, type I. First clinical
trials were performed in the 1980’s by Brady et al. using β-glucocerebrosidase of hu-
man placental origin. As mentioned before, mainly macrophages are affected in Gau-
cher disease. It has been shown that ERT is more efficient when the N-linked oligosac-
charides of β-glucocerebrosidase are enzymatically modified to display mannose resi-
dues, which are recognized by mannose receptors (MR) present on macrophages. Later,
recombinantly produced enzyme, subsequently enzymatically modified, was shown to
be equally efficient for ERT of Gaucher disease (Desnick and Schuchman 2012). Until
today, the United States Food and Drug Administration (FDA) and the European Medi-
cines Agency (EMA) have authorized drugs for ERT of five other LSDs (Fabry and
Pompe diseases, as well as mucopolysaccharidoses, types I, II, VI) (Boudes 2013).
However, success of ERT is limited to LSDs with pathology of peripheral tissues and
organs. Typically, LSDs with CNS pathology cannot be treated with traditional ERT as
the BBB prohibits transport of intravenously injected enzymes into the brain (Aerts et
al. 2005).
2.4 Metachromatic Leukodystrophy
Metachromatic leukodystrophy (MLD) is a LSD with an incidence of approximately
1:100,000 life births (Gieselmann and Krägeloh-Mann 2010). The disease is character-
ized by severe CNS pathology. Historically, three forms of the disease are roughly dis-
tinguished by their age of onset. Late infantile MLD is the most severe form and starts
at age 1-2, the juvenile form at 4-12 years. The adult form of the disease is character-
ized by a relatively late age of onset starting at 16 years of age or beyond. In very mild
forms of the disease, patients may reach 60 years of age until the first symptoms occur.
The course of all three forms of the disease is fatal. Patients with infantile MLD usually
have the shortest life span (few years), whereas on average patients with the adult form
of MLD pass away within 15 years after diagnosis. Although the first symptoms vary
depending on the type of the disease, the end stage symptoms are similar for all forms:
ataxia, blind- and deafness, dementia, muscular dystrophy, spastical paralysis and tetra-
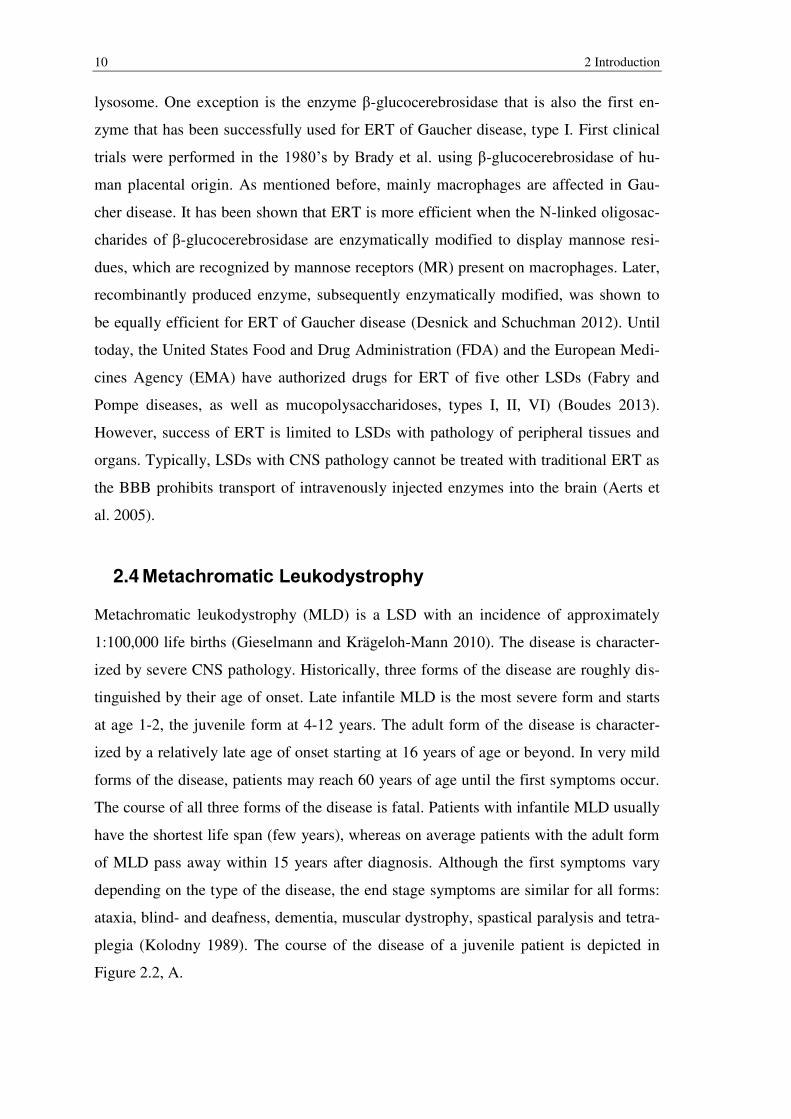
plegia (Kolodny 1989). The course of the disease of a juvenile patient is depicted in
Figure 2.2, A.
2 Introduction 11
Figure 2.2: Metachromatic leukodystrophy (MLD).
A) Clinical course in a patient with juvenile MLD. As CNS pathology increases over time, patients develop ataxia, blindness, deafness, dementia, muscular dystrophy, spastical paral-ysis and tetraplegia and ultimately die prematurely (modified after Kolodny 1989).
B) Alcian blue stainings in brains of 19 months old MLD mice (ASA-/-) in comparison to wildtype (ASA+/+) mice. Alcian blue stains sulfatide storage material, accumulating primari-ly in the brain of ASA deficient mice, which is also observed in MLD patients (adapted from Wittke et al. 2004).
C) Demyelination in the brain of an animal model of MLD. Electron micrographs of the corpus callosum of mice heterozygous for ASA (no phenotype) and ASA deficient mice, addition-ally carrying a transgene for overexpression of cerebroside-sulfotransferase (CST), respon-sible for sulfatide production, in myelin producing cells. In contrast to ASA+/- mice, CST-tg/ASA-/- mice show reduction of thicknesses of myelin sheaths indicative of demyelination. Scale bar represents 1 µm (modified after Ramakrishnan et al. 2007).
The cause of the symptoms of MLD is the accumulation of 3-O-sulfogalactosyl-
cerebroside, or short sulfatide, and lysosulfatide (Blomqvist et al. 2011) (Figure 2.2, B).
Sulfatide is one of the main lipid components of myelin (4-6%) (Eckhardt 2008). Mye-
lin is produced by oligodendrocytes in the CNS and by Schwann cells in the peripheral
nervous system (PNS). Presence of myelin and so called myelin sheaths enable saltatory
conduction of action potentials in neuronal axons and are indispensable for the signal
transduction in the nervous system. Accumulation of sulfatide in oligodendrocytes and
Schwann cells leads to demyelination in the CNS (Figure 2.2, C) and PNS and is re-
sponsible for the CNS symptoms of the disease. The molecular link between accumula-
tion of sulfatide and demyelination is still poorly understood. Besides in myelin-
producing cells, sulfatide storage also occurs in neurons, astroglia and macrophages
(Eckhardt 2008). In a mouse model where sulfatide specifically accumulates in neurons,
lethal seizures were observed after acoustical stimulation, indicating that sulfatide ac-
cumulation in neurons may contribute to the pathogenesis of MLD (Gieselmann and
Krägeloh-Mann 2010; van Zyl et al. 2010).
5 7 9
Age (years)
ASA+/- CST-tg/ASA-/-
ASA+/+B
C
A ASA-/-
12 2 Introduction
Under physiological conditions, sulfatide is degraded by the lysosomal enzyme aryl-
sulfatase A (ASA). In case of MLD, ASA is deficient or inactive. Consequently sul-
fatide cannot be degraded, leading to its accumulation. Sulfatide hydrolysis further de-
pends on presence of the activator protein saposin B, extracting sulfatide from mem-
branes, rendering it accessible for ASA. Rare cases of activator-deficient MLD due to
saposin B deficiency have been reported (Kuchar et al. 2009; Gieselmann and
Krägeloh-Mann 2010).
Like most LSDs, MLD is monogenic and autosomally recessively inherited. In contrast
to other LSDs, the genotype roughly correlates with the severity of the disease. As a
rule of thumb: the higher the residual ASA activity, the milder the progression of the
disease. Many mutations of the ASA gene causing amino acid substitutions of the ASA
polypeptide, for example G86D, Y201C and D255H, have been identified to lead to
ASA instability in the endoplasmic reticulum, resulting in its degradation (Hermann et
al. 2000; Poeppel et al. 2005). Patients homozygous for these mutations or mutations
causing production of truncated, inactive ASA (‘null allele’) are commonly affected by
the most severe (late infantile) form of MLD due to early accumulation of sulfatide.
Homozygosity for mutations that lead to partially active ASA that passes the ERAD
quality control system and reaches the lysosome, may cause juvenile MLD, depending
on the residual ASA activity levels. Other juvenile MLD patients may be heterozygous
for one ‘null allele’ and one, which results in a low level of active ASA or a defect of
oligomerization in the lysosome (Gieselmann and Krägeloh-Mann 2010). A frequent
mutation (P426L) is known to lead to failure in octamerization accompanied with accel-
erated degradation by cathepsin L in comparison to wildtype ASA. Patients homozy-
gous for these mutations have the least severe, adult form of MLD (von Bülow et al.
2002). Humans with more than 10% of the physiological ASA-activity levels show no
signs of the disease (Gieselmann et al. 1989; Gieselmann et al. 1991).
2.5 Arylsulfatase A
ASA, or cerebroside sulfatase (EC 3.1.6.8), consists of 507 amino acids including the
endoplasmic reticulum-signal peptide (18 amino acids). In order to be able to bind and
cleave off the sulfate of sulfatide, the cystein residue at position 69 needs to be oxidized
to form formylglycine (3-oxoalanin). This modification is performed in the endoplasmic
reticulum by action of the formylglycine-generating enzyme (FGE), otherwise known as
2 Introduction 13
sulfatase-modifying factor 1 (SUMF1). If FGE is not functional, ASA and other sulfa-
tases lack activity, leading to so called multiple sulfatase deficiency, a LSD with symp-
tomatic features of MLD and mucoploysaccharidosis types II-IV and VI (Dierks et al.
2009).
ASA has three N-glycosylation sites (N158, N184, N350), all of them carry oligosac-
charides of the high mannose type. Statistically each molecule of ASA contains 3.4 ±
0.08 phosphates. As no phosphorylation sites are known for the ASA polypeptide, these
phosphates are attributed to M6P-residues (Schröder et al. 2010). Interestingly, only two
(N158 and N350) of the three N-glycosylation sites are phosphorylated (Sommerlade et
al. 1994). Therefore one of these sites carries two M6P residues. As described in chapter
2.1, these M6P residues are necessary for recognition by the MPRs for directional
transport to the lysosomes.
ASA forms oligomers in a pH-dependent manner. At the neutral pH of the endoplasmic
reticulum and Golgi, ASA dimerizes. Under acidic conditions in lysosomes, four ASA-
dimers are reported to form octamers. Clustering of eight molecules of ASA leads to
shielding off of cathepsin L-binding sites, preventing rapid degradation by this lysoso-
mal papain-like protease (von Bülow et al. 2002).
2.6 Therapeutic Approaches for Metachromatic Leukodystrophy
For MLD, a LSD with severe CNS pathology, no curative therapy has been approved
for clinical use. However, much data has been generated in preclinical and clinical stud-
ies for MLD treatment in the last decades. Cell-, gene- and enzyme replacement thera-
pies have been evaluated for MLD, but not substrate reduction or chaperone therapies.
Traditional HSCT with healthy donor hematopoietic stem cells showed varying success
in treatment of MLD. After treatment, a patient with juvenile MLD showed decelerated
disease progression in comparison to an untreated sibling (Krägeloh-Mann et al. 2013).
In four patients with adult MLD, HSCT even halted disease progression (Solders et al.
2014). However, for late infantile MLD, HSCT only delayed neurological deterioration
and death without providing curative treatment (Batzios and Zafeiriou 2011).
A similar approach employing patients own hematopoietic stem cells was recently
shown to lead to more success for patients with late infantile MLD. Hematopoietic stem
14 2 Introduction
cells were harvested and transduced with a lentiviral vector encoding for functional
ASA (ex vivo gene therapy). After infusion into the patient, these cells and their proge-
ny produced high amounts of ASA, leading to supranormal levels of ASA in the cere-
brospinal fluid. In contrast to untreated siblings of same genotype, the treated children
showed no deterioration of their mental and physical condition (Biffi et al. 2013).
The cell based therapies described here have three profound drawbacks: (1) Patients
need to be treated before onset of the symptoms. As there is no screening of newborns
for MLD, this treatment is only feasible for a minority of patients with known familial
MLD occurrence. (2) Harvesting and infusion of hematopoietic stem cells is complicat-
ed, invasive and may have life-threatening consequences (e.g. graft-versus-host-
disease). (3) Lentiviral random integration into the genome, as performed by Biffi et al.
2013, imposes the risk of tumor formation, in this case leukemia.
In contrast, ERT is better controllable. In most cases of LSDs inactive enzymes are pro-
duced, therefore usually no immunogenic effects are observed when recombinantly pro-
duced enzyme is injected. Instead, the major obstacle for ERT is the BBB, prohibiting
efficient brain delivery of systemically administered ASA.
In mouse models of MLD, only high dose treatment carried out over a period of several
weeks led to minor uptake of recombinant, human ASA by the brain (Matzner et al.
2005; Matzner et al. 2009b). Consequently sulfatide storage was decreased as was visu-
alized by Alcian blue staining and measured quantitatively by lipid analyses. Treated
mice performed significantly better in behavioral tests (e.g. rotarod performance). Based
on these positive results, two clinical ERT studies have been conducted with late infan-
tile MLD patients, but only the results of one study have been reported so far. Although
a reduction of sulfatide levels in the cerebrospinal fluid was observed in the reported
study, treatment with up to 2.5 mg of ASA per kg body weight did not result in im-
provements of motor or cognitive function. Instead, 64% of treated patients showed
adverse events (í Dali and Lund 2009). The results of the second study with higher dos-
es administered in shorter intervals (weekly instead of biweekly) will show whether
high dose treatment benefits late infantile MLD patients. Importantly, this treatment
may never become available for all patients, as it is very cost intensive. To reduce costs
and adverse effects attributed to the high doses, ways to increase therapeutic efficiency
of ASA need to be found by increasing transport across or by circumvention of the
2 Introduction 15
BBB, as this barrier prevents uptake of intravenously injected ASA by the brain, the
main target in MLD.
To transport ASA into the brain, Stroobants et al. 2011 implanted so called ‘osmotic
miniature pumps’, continuously supplying recombinant ASA into the right lateral ven-
tricle of ASA-/- mice over a period of four weeks. ASA was unevenly distributed
throughout the brain as ASA activity and consequently reduction of sulfatide levels
were only found in the forebrain and brain stem. Nevertheless, treated mice performed
better in behavioral tests in comparison to their mock-treated littermates. Currently, a
clinical trial (NCT01510028) with intrathecal injections of ASA is performed, but no
results have been reported yet. Although neurosurgeons perform similar operations rou-
tinely, the risks accompanied with introduction of a needle into the ventricle or spinal
cord of patients remain high. Moreover, not all areas of the brain can be reached by
these methods.
Recently, fusion proteins consisting of ASA and BBB-penetrating peptides have been
generated (Böckenhoff et al. 2014). Of the five intravenously injected fusion proteins,
only one, consisting of ASA and the Low-Density Lipoprotein (LDL) receptor binding
domain of apolipoprotein E (apoE), was shown to lead to significantly elevated ASA
levels in the brains of treated ASA-/- mice in comparison to controls treated with un-
modified ASA. Nevertheless, the effect size was relatively low; a 1.7-fold increase in
brain levels and a 1.6-fold increase in therapeutic efficacy were reported.
Although these two studies show promising results, further efforts have to be made in
order to increase brain delivery of ASA without putting the patients at a risk beyond the
pale. To that end strategies to overcome the BBB need to be pursued.
2.7 The blood brain barrier
The BBB serves to protect the brain from potentially harmful endogenous and exoge-
nous molecules of the blood, thereby sustaining the brain’s homeostasis. It is highly
evolutionary conserved among vertebrates proving the importance of its function. The
BBB primarily consists of endothelial cells lining the blood vessels in the brain, which
are tightly connected to each other by means of so-called tight junctions. Pericytes and
perivascular astrocyte endfeet further contribute to the BBB, forming a ‘second line of
defence’ by building up a metabolic barrier (Abbott et al. 2006; Abbott et al. 2010).
16 2 Introduction
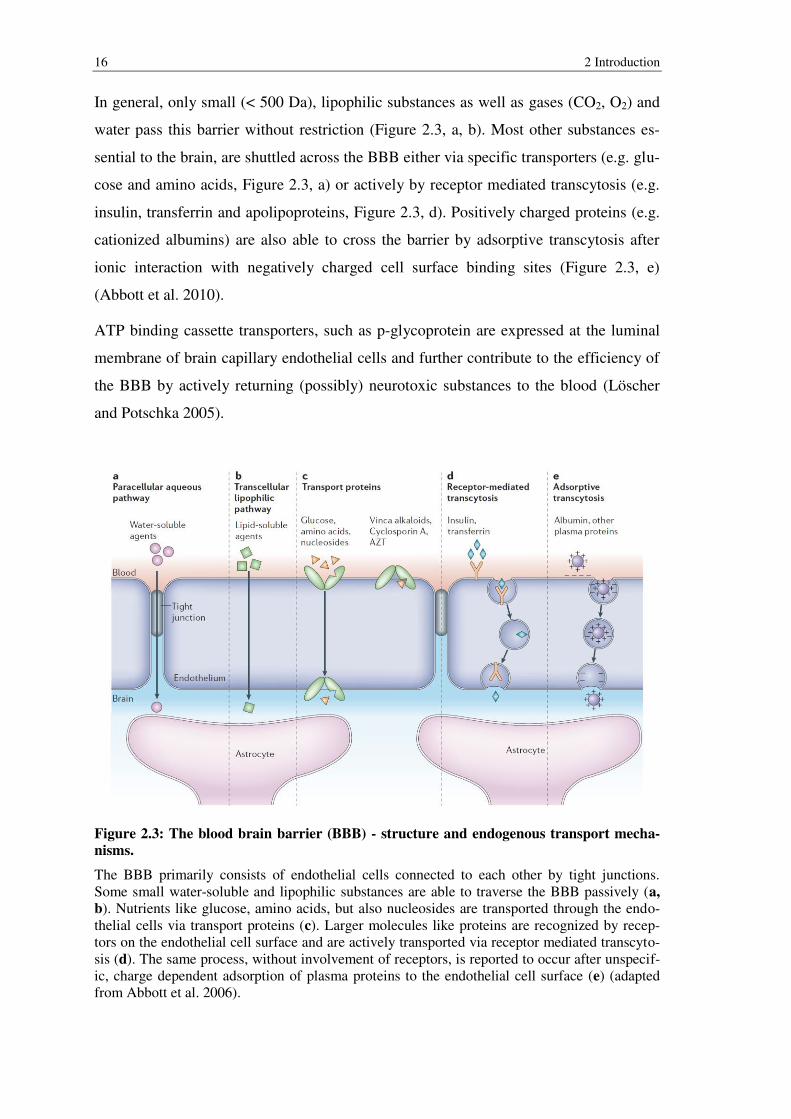
In general, only small (< 500 Da), lipophilic substances as well as gases (CO2, O2) and
water pass this barrier without restriction (Figure 2.3, a, b). Most other substances es-
sential to the brain, are shuttled across the BBB either via specific transporters (e.g. glu-
cose and amino acids, Figure 2.3, a) or actively by receptor mediated transcytosis (e.g.
insulin, transferrin and apolipoproteins, Figure 2.3, d). Positively charged proteins (e.g.
cationized albumins) are also able to cross the barrier by adsorptive transcytosis after
ionic interaction with negatively charged cell surface binding sites (Figure 2.3, e)
(Abbott et al. 2010).
ATP binding cassette transporters, such as p-glycoprotein are expressed at the luminal
membrane of brain capillary endothelial cells and further contribute to the efficiency of
the BBB by actively returning (possibly) neurotoxic substances to the blood (Löscher
and Potschka 2005).
Figure 2.3: The blood brain barrier (BBB) - structure and endogenous transport mecha-
nisms.
The BBB primarily consists of endothelial cells connected to each other by tight junctions. Some small water-soluble and lipophilic substances are able to traverse the BBB passively (a,
b). Nutrients like glucose, amino acids, but also nucleosides are transported through the endo-thelial cells via transport proteins (c). Larger molecules like proteins are recognized by recep-tors on the endothelial cell surface and are actively transported via receptor mediated transcyto-sis (d). The same process, without involvement of receptors, is reported to occur after unspecif-ic, charge dependent adsorption of plasma proteins to the endothelial cell surface (e) (adapted from Abbott et al. 2006).
2 Introduction 17
2.8 Transport of drugs across the blood brain barrier
There are numerous diseases with CNS pathology necessitating transport of drugs
across the BBB. One may distinguish between three basic approaches: (1) circumven-
tion of the BBB by direct infusion into the brain/cerebrospinal fluid, (2) systemic ad-
ministration of drugs in combination with a transient disruption of the BBB (induced by
e.g. ultrasound or vasoactive compounds) and (3) systemic administration of drugs that
are modified with, or attached to a brain targeting moiety, exploiting endogenous trans-
porting routes across the BBB (Chen and Liu 2012). The first two options are highly
invasive, consequently imposing serious risks for treated patients and are disregarded
here. Instead two strategies of the third option will be introduced in more detail.
2.8.1 Polymeric nanoparticle mediated brain delivery of therapeutics
Nanoparticles are spherical objects with a diameter of 1-1000 nm. Although nanoparti-
cles have been described as early as 1955, it was not until 1995 that the potential of pol-
ymeric nanoparticles to cross the BBB had been discovered and exploited for drug de-
livery (Kreuter et al. 1995). From thereon different kinds of materials and surface modi-
fications of nanoparticles have been identified to increase brain delivery of therapeutics
in numerous studies.
Several desirable criteria for brain delivery of nanoparticles have been ordained (Olivier
2005). First of all, nanoparticles should be biodegradable and non-toxic. Polymeric na-
noparticles consisting of poly(butyl cyanoacrylate) (PBCA), poly(lactic acid) (PLA) or
poly(lactic-co-glycolic acid) (PLGA) core materials are biodegradable and have been
successfully used to this end. PLA and PLGA have been approved by the FDA for clin-
ical use (Duncanson et al. 2007). Furthermore polymers of natural origin, e.g. chitosan
and human serum albumin (HSA) fulfill these criteria (Kumari et al. 2010).
Another criterion for in vivo studies is the stability of the nanoparticles in the blood and
their clearance. It is known that uncoated nanoparticles are rapidly cleared from the
blood stream by monocytes and macrophages of the mononuclear phagocyte system
(MPS) after their opsonization (Owens and Peppas 2006). These cells are primarily
found in the lymph nodes, spleen, liver and lung. The surface properties of nanoparti-
cles play a pivotal role in recognition by the MPS and consequently their overall biodis-
tribution. Surface charged nanoparticles have been reported to be more prone to uptake
by the MPS than non-charged or weakly negatively charged nanoparticles in vitro
18 2 Introduction
(Roser et al. 1998; Zahr et al. 2006). Further reduction of MPS recognition was first
achieved by masking the nanoparticle’s surface with polyethylene-glycol (PEG) and
then with surfactants. These so called ‘stealth nanoparticles’, were reported to have
longer blood circulation times and reduced tissue accumulation at the sites of the MPS.
These effects have been explained by sterical hindrance, thereby decreasing adsorption
of opsonic proteins (Andrieux and Couvreur 2009).
Besides preventing rapid clearance by the MPS, surfactant coating has been shown to
increase targeting to specific organs, especially the brain in experiments using an anal-
gesic peptide, dalargin, which is physiologically unable to pass the BBB. After dalargin-
loaded PBCA-nanoparticles were surfactant coated with polysorbates, dalargin delivery
to the brain was suggested by measuring increased pain tolerance (Kreuter et al. 1997).
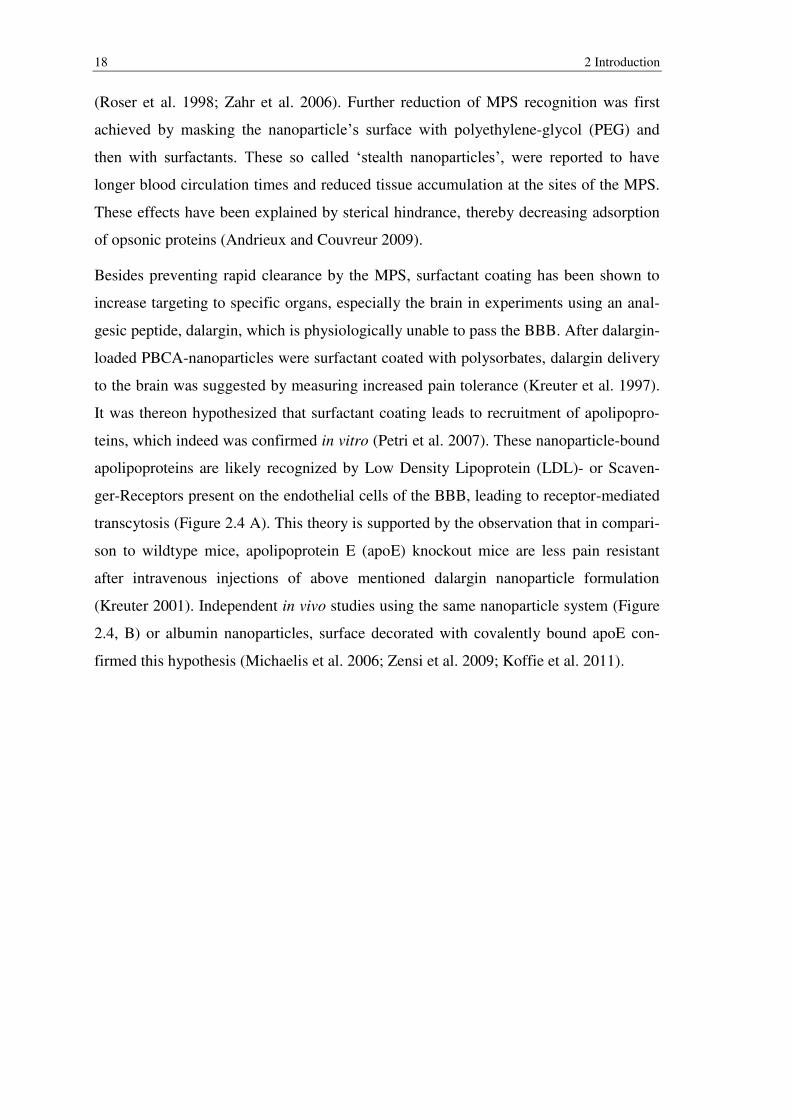
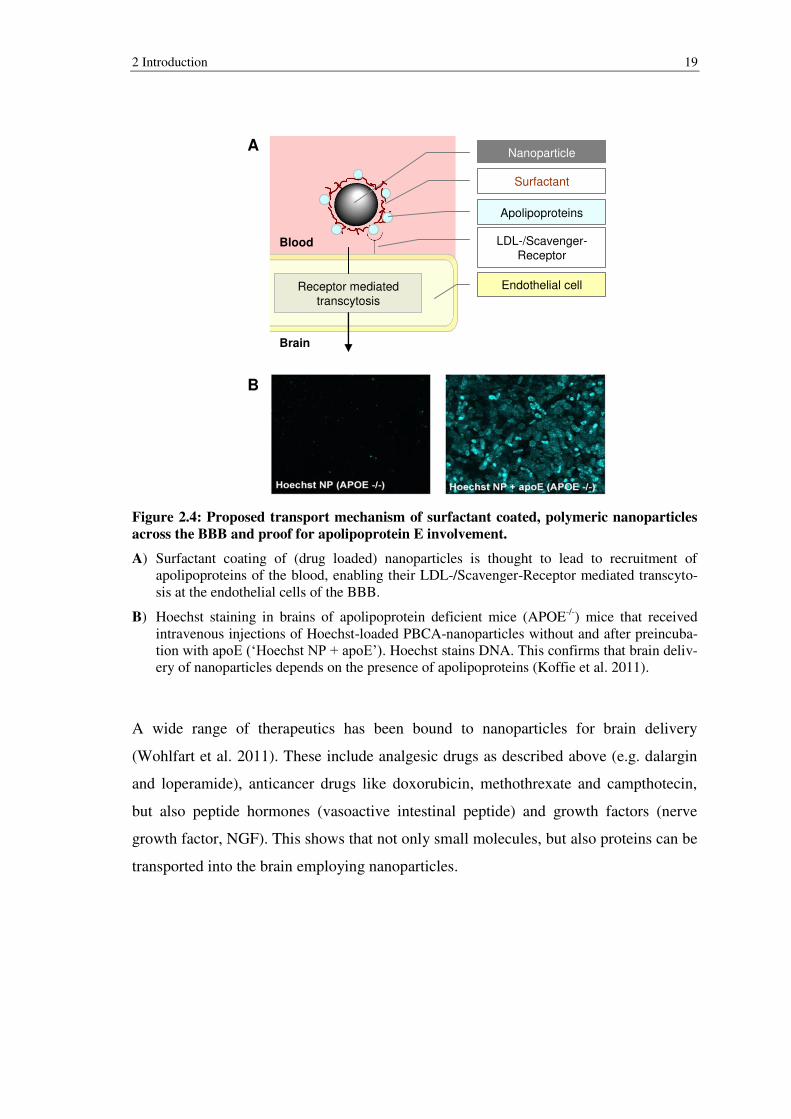
It was thereon hypothesized that surfactant coating leads to recruitment of apolipopro-
teins, which indeed was confirmed in vitro (Petri et al. 2007). These nanoparticle-bound
apolipoproteins are likely recognized by Low Density Lipoprotein (LDL)- or Scaven-
ger-Receptors present on the endothelial cells of the BBB, leading to receptor-mediated
transcytosis (Figure 2.4 A). This theory is supported by the observation that in compari-
son to wildtype mice, apolipoprotein E (apoE) knockout mice are less pain resistant
after intravenous injections of above mentioned dalargin nanoparticle formulation
(Kreuter 2001). Independent in vivo studies using the same nanoparticle system (Figure
2.4, B) or albumin nanoparticles, surface decorated with covalently bound apoE con-
firmed this hypothesis (Michaelis et al. 2006; Zensi et al. 2009; Koffie et al. 2011).
2 Introduction 19
Figure 2.4: Proposed transport mechanism of surfactant coated, polymeric nanoparticles
across the BBB and proof for apolipoprotein E involvement.
A) Surfactant coating of (drug loaded) nanoparticles is thought to lead to recruitment of apolipoproteins of the blood, enabling their LDL-/Scavenger-Receptor mediated transcyto-sis at the endothelial cells of the BBB.
B) Hoechst staining in brains of apolipoprotein deficient mice (APOE-/-) mice that received intravenous injections of Hoechst-loaded PBCA-nanoparticles without and after preincuba-tion with apoE (‘Hoechst NP + apoE’). Hoechst stains DNA. This confirms that brain deliv-ery of nanoparticles depends on the presence of apolipoproteins (Koffie et al. 2011).
A wide range of therapeutics has been bound to nanoparticles for brain delivery
(Wohlfart et al. 2011). These include analgesic drugs as described above (e.g. dalargin
and loperamide), anticancer drugs like doxorubicin, methothrexate and campthotecin,
but also peptide hormones (vasoactive intestinal peptide) and growth factors (nerve
growth factor, NGF). This shows that not only small molecules, but also proteins can be
transported into the brain employing nanoparticles.
Nanoparticle
Surfactant
Apolipoproteins
LDL-/Scavenger-Receptor
Endothelial cellReceptor mediatedtranscytosis
Blood
Brain
A
B
20 2 Introduction
2.8.2 Elongation of the blood circulation times to increase brain delivery
of therapeutics
In 2008, Grubb et al. showed increased brain delivery of β-glucuronidase, the lysosomal
enzyme deficient in mucopolysaccharidosis VII (Sly syndrome), by increasing its blood
circulation time (Grubb et al. 2008). This was achieved by chemical modification of
M6P-residues of β-glucuronidase, thereby abolishing recognition by MPRs of peripher-
al cells. This procedure resulted in an increase of its plasma half life time from 11.7
minutes to 18 hours. Notably, uptake by the brain increased 5.7-fold in comparison to
mice treated with non-modified enzyme. The authors offer three possible explanations
for enhanced brain delivery of modified enzyme: (1) Brain endothelial cellular uptake
of modified enzyme by fluid phase pinocytosis. Although the rate of this unspecific
uptake is slow in comparison to receptor mediated endocytosis, it may be favored by the
relatively high concentrations and long circulation times of the modified enzyme. (2)
Modified, but not unmodified enzyme may be taken up by a novel receptor at the BBB.
(3) Delivery into the brain via the ‘extracellular route’, which has been previously pro-
posed for delivery of small amounts of albumin, erythropoietin and antibodies (Banks
2004).
These findings were confirmed for another lysosomal enzyme, sulfamidase, the enzyme
deficient in mucopolysaccharidosis IIIA (Rozaklis et al. 2011). Chemical modification
also led to an increase in plasma half life time and consequently to increased brain de-
livery in comparison to unmodified enzyme. Surprisingly and in contrast to the findings
of Grubb et al. (2008), no reduction in substrate accumulation in brain cells of treated
mucopolysaccharidosis IIA mice was observed after weekly treatment over four weeks
with modified enzyme. This observation may be explained by a failure of modified en-
zyme uptake by brain cells, as MPR-mediated endocytosis is not possible and needs to
take place by unspecific pinocytosis. Indeed, the authors did not find sulfamidase stain-
ing in neuronal and glial cells, but only in endothelial cells, the meninges and the cho-
roid plexus.
2 Introduction 21
2.9 Aim of this study
The aim of this thesis is to develop new therapeutic options for metachromatic leu-
kodystrophy.
To use nanoparticles for ERT of ASA, five different strategies to combine ASA and
nanoparticles are pursued. More precisely, incorporation, adsorption, covalent attach-
ment and two high-affinity binding methods of ASA to nanoparticles are investigated
with respect to their efficiency of binding, their stability in serum and their potential to
increase brain delivery in vivo. In the course of these experiments, four different core
materials are used: PBCA, PLA, PLGA and HSA. One of the high-affinity methods
involves the use of a MPR300 receptor fragment, which is covalently bound to nanopar-
ticles to then bind ASA with high affinity. This receptor fragment, consisting of the
domain 9 of the MPR300, is expressed, purified and characterized with respect to its
potential to bind ASA and to decrease MPR-dependent uptake by peripheral cells in
vitro.
In the second part of this thesis, the goal is to find ASA inhibitors for future use as
pharmacological chaperones for misfolded ASA (chaperone therapy) and/or for estab-
lishment of a cell culture model of MLD. To that end, a suitable ASA activity assay is
established in order to perform high-throughput screenings. Potential inhibitors are
characterized concerning their inhibitory potential (IC50), their type of inhibition, their
specificity towards ASA and their stability over time.
22 3 Materials
3 Materials
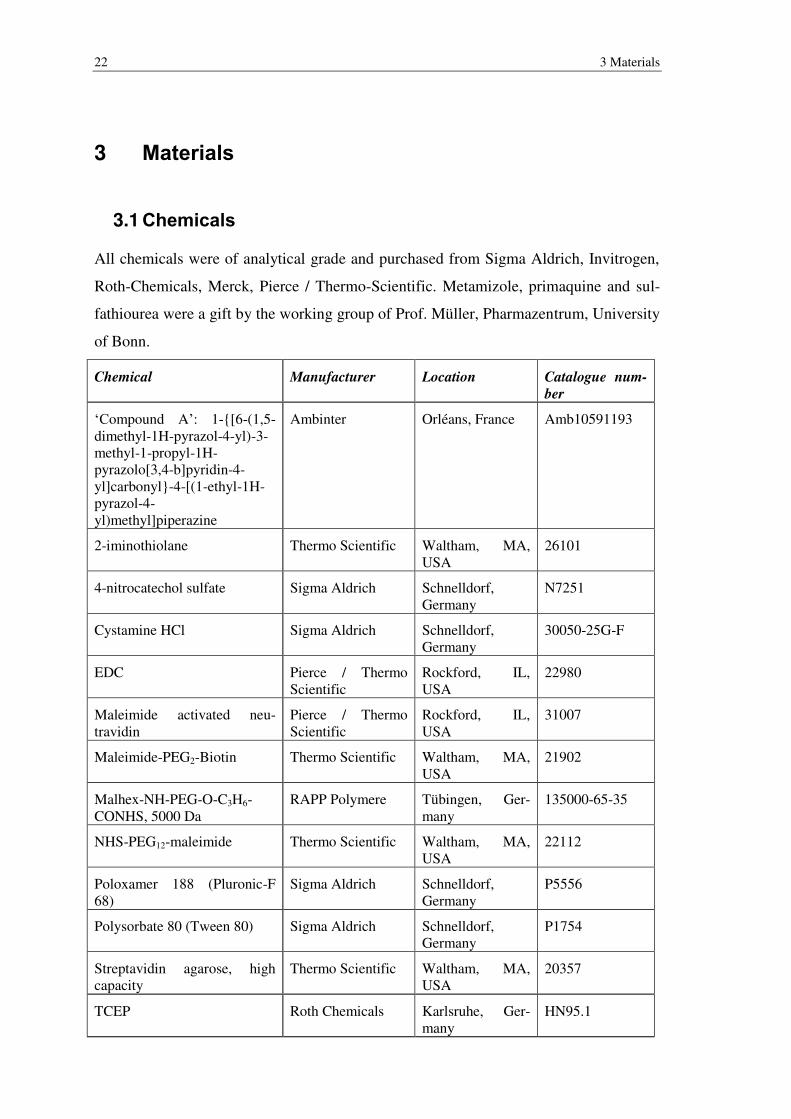
3.1 Chemicals
All chemicals were of analytical grade and purchased from Sigma Aldrich, Invitrogen,
Roth-Chemicals, Merck, Pierce / Thermo-Scientific. Metamizole, primaquine and sul-
fathiourea were a gift by the working group of Prof. Müller, Pharmazentrum, University
of Bonn.
Chemical Manufacturer Location Catalogue num-
ber
‘Compound A’: 1-{[6-(1,5-dimethyl-1H-pyrazol-4-yl)-3-methyl-1-propyl-1H-pyrazolo[3,4-b]pyridin-4-yl]carbonyl}-4-[(1-ethyl-1H-pyrazol-4-yl)methyl]piperazine
Ambinter Orléans, France Amb10591193
2-iminothiolane Thermo Scientific Waltham, MA, USA
26101
4-nitrocatechol sulfate Sigma Aldrich Schnelldorf, Germany
N7251
Cystamine HCl Sigma Aldrich Schnelldorf, Germany
30050-25G-F
EDC Pierce / Thermo Scientific
Rockford, IL, USA
22980
Maleimide activated neu-travidin
Pierce / Thermo Scientific
Rockford, IL, USA
31007
Maleimide-PEG2-Biotin Thermo Scientific Waltham, MA, USA
21902
Malhex-NH-PEG-O-C3H6-CONHS, 5000 Da
RAPP Polymere Tübingen, Ger-many
135000-65-35
NHS-PEG12-maleimide Thermo Scientific Waltham, MA, USA
22112
Poloxamer 188 (Pluronic-F 68)
Sigma Aldrich Schnelldorf, Germany
P5556
Polysorbate 80 (Tween 80) Sigma Aldrich Schnelldorf, Germany
P1754
Streptavidin agarose, high capacity
Thermo Scientific Waltham, MA, USA
20357
TCEP Roth Chemicals Karlsruhe, Ger-many
HN95.1
3 Materials 23
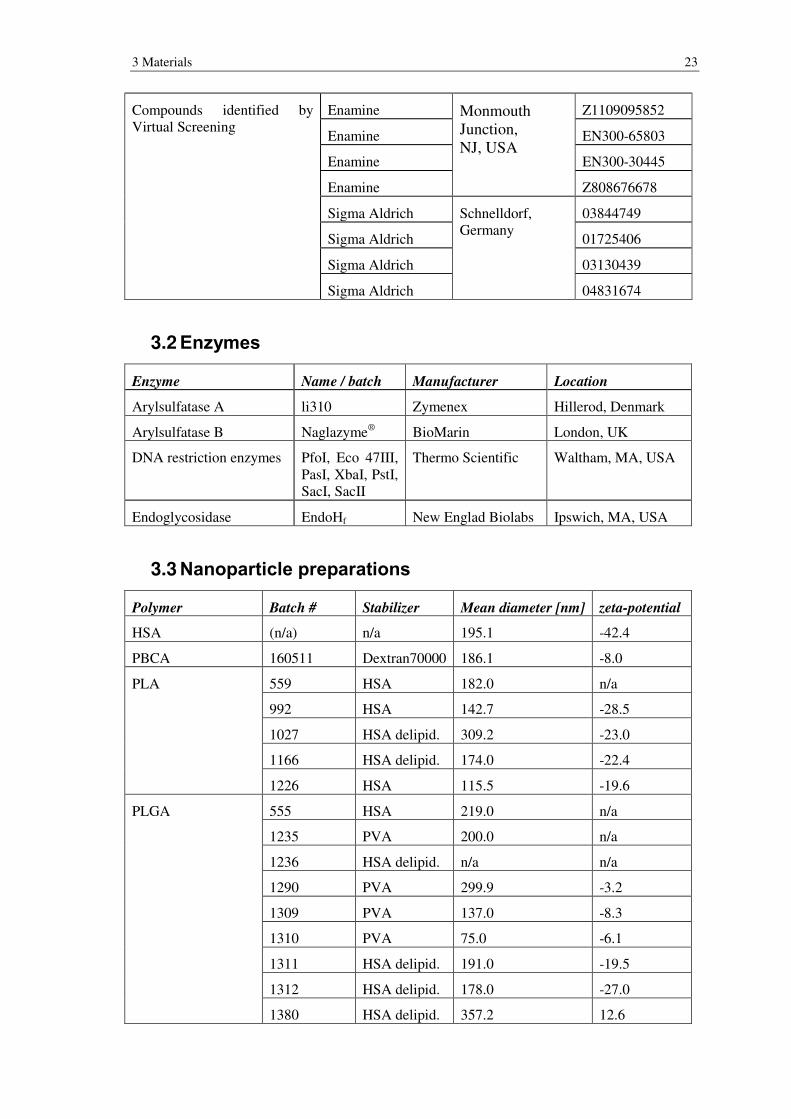
Compounds identified by Virtual Screening
Enamine Monmouth Junction, NJ, USA
Z1109095852
Enamine EN300-65803
Enamine EN300-30445
Enamine Z808676678
Sigma Aldrich Schnelldorf, Germany
03844749
Sigma Aldrich 01725406
Sigma Aldrich 03130439
Sigma Aldrich 04831674
3.2 Enzymes
Enzyme Name / batch Manufacturer Location
Arylsulfatase A li310 Zymenex Hillerod, Denmark
Arylsulfatase B Naglazyme® BioMarin London, UK
DNA restriction enzymes PfoI, Eco 47III, PasI, XbaI, PstI, SacI, SacII
Thermo Scientific Waltham, MA, USA
Endoglycosidase EndoHf New Englad Biolabs Ipswich, MA, USA
3.3 Nanoparticle preparations
Polymer Batch # Stabilizer Mean diameter [nm] zeta-potential
HSA (n/a) n/a 195.1 -42.4
PBCA 160511 Dextran70000 186.1 -8.0
PLA 559 HSA 182.0 n/a
992 HSA 142.7 -28.5
1027 HSA delipid. 309.2 -23.0
1166 HSA delipid. 174.0 -22.4
1226 HSA 115.5 -19.6
PLGA 555 HSA 219.0 n/a
1235 PVA 200.0 n/a
1236 HSA delipid. n/a n/a
1290 PVA 299.9 -3.2
1309 PVA 137.0 -8.3
1310 PVA 75.0 -6.1
1311 HSA delipid. 191.0 -19.5
1312 HSA delipid. 178.0 -27.0
1380 HSA delipid. 357.2 12.6
24 3 Materials
1437 PVA 148.4 -10.4
1452 PVA 196.3 -15.1
1507 PVA 173.4 -19.7
1561 HSA 100.7 -34.0
LGFG200 n/a 227.4 n/a
Amine mod. PLGA LGFG200N n/a 227.4 n/a
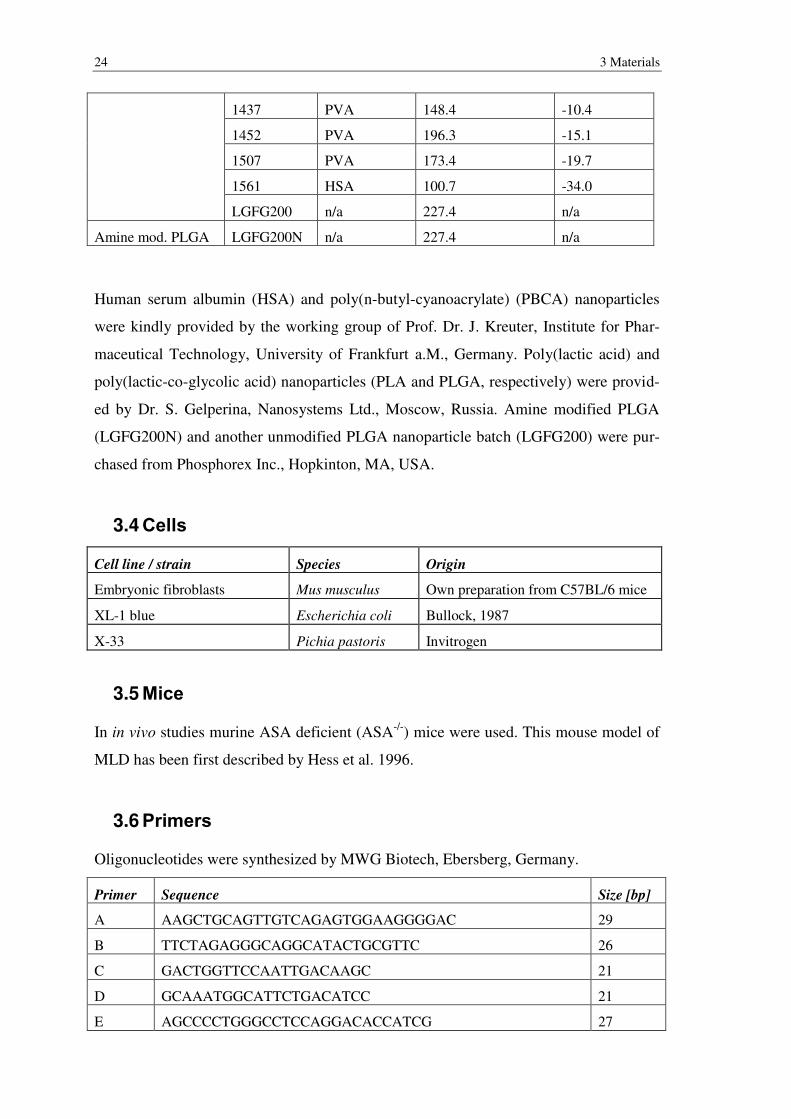
Human serum albumin (HSA) and poly(n-butyl-cyanoacrylate) (PBCA) nanoparticles
were kindly provided by the working group of Prof. Dr. J. Kreuter, Institute for Phar-
maceutical Technology, University of Frankfurt a.M., Germany. Poly(lactic acid) and
poly(lactic-co-glycolic acid) nanoparticles (PLA and PLGA, respectively) were provid-
ed by Dr. S. Gelperina, Nanosystems Ltd., Moscow, Russia. Amine modified PLGA
(LGFG200N) and another unmodified PLGA nanoparticle batch (LGFG200) were pur-
chased from Phosphorex Inc., Hopkinton, MA, USA.
3.4 Cells
Cell line / strain Species Origin
Embryonic fibroblasts Mus musculus Own preparation from C57BL/6 mice
XL-1 blue Escherichia coli Bullock, 1987
X-33 Pichia pastoris Invitrogen
3.5 Mice
In in vivo studies murine ASA deficient (ASA-/-) mice were used. This mouse model of
MLD has been first described by Hess et al. 1996.
3.6 Primers
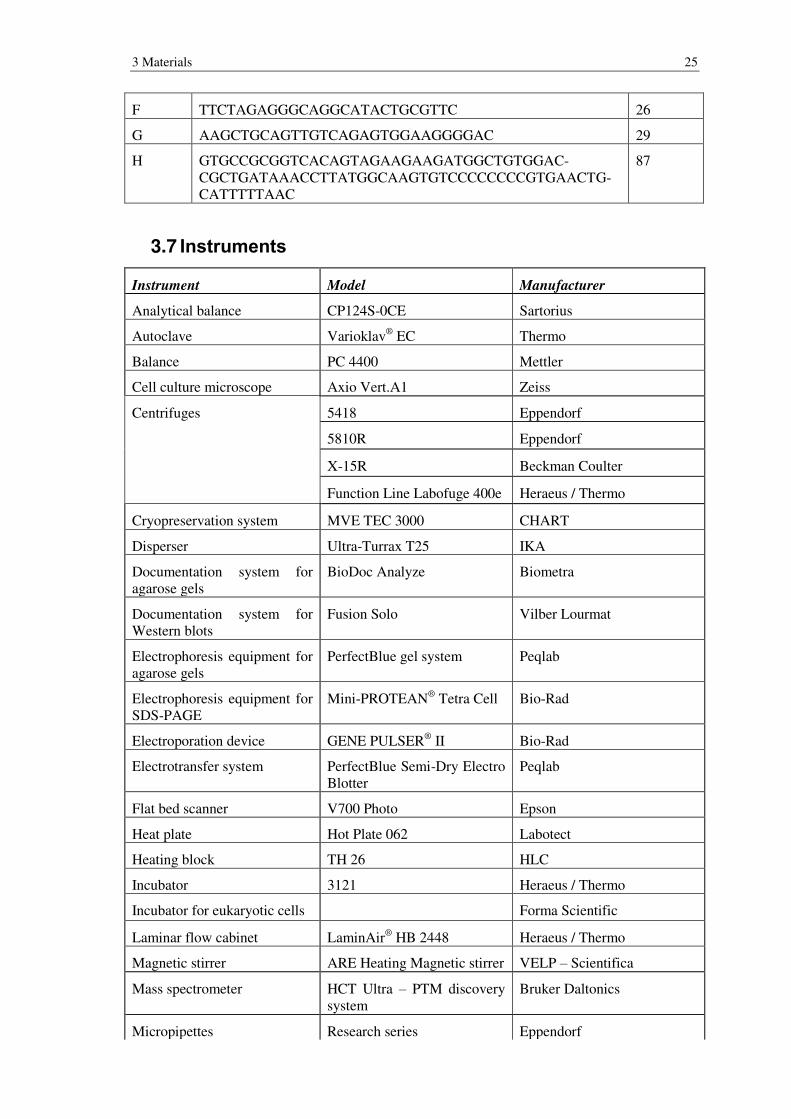
Oligonucleotides were synthesized by MWG Biotech, Ebersberg, Germany.
Primer Sequence Size [bp]
A AAGCTGCAGTTGTCAGAGTGGAAGGGGAC 29
B TTCTAGAGGGCAGGCATACTGCGTTC 26
C GACTGGTTCCAATTGACAAGC 21
D GCAAATGGCATTCTGACATCC 21
E AGCCCCTGGGCCTCCAGGACACCATCG 27
3 Materials 25
F TTCTAGAGGGCAGGCATACTGCGTTC 26
G AAGCTGCAGTTGTCAGAGTGGAAGGGGAC 29
H GTGCCGCGGTCACAGTAGAAGAAGATGGCTGTGGAC-CGCTGATAAACCTTATGGCAAGTGTCCCCCCCCGTGAACTG-CATTTTTAAC
87
3.7 Instruments
Instrument Model Manufacturer
Analytical balance CP124S-0CE Sartorius
Autoclave Varioklav® EC Thermo
Balance PC 4400 Mettler
Cell culture microscope Axio Vert.A1 Zeiss
Centrifuges 5418 Eppendorf
5810R Eppendorf
X-15R Beckman Coulter
Function Line Labofuge 400e Heraeus / Thermo
Cryopreservation system MVE TEC 3000 CHART
Disperser Ultra-Turrax T25 IKA
Documentation system for agarose gels
BioDoc Analyze Biometra
Documentation system for Western blots
Fusion Solo Vilber Lourmat
Electrophoresis equipment for agarose gels
PerfectBlue gel system Peqlab
Electrophoresis equipment for SDS-PAGE
Mini-PROTEAN® Tetra Cell Bio-Rad
Electroporation device GENE PULSER® II Bio-Rad
Electrotransfer system PerfectBlue Semi-Dry Electro Blotter
Peqlab
Flat bed scanner V700 Photo Epson
Heat plate Hot Plate 062 Labotect
Heating block TH 26 HLC
Incubator 3121 Heraeus / Thermo
Incubator for eukaryotic cells Forma Scientific
Laminar flow cabinet LaminAir® HB 2448 Heraeus / Thermo
Magnetic stirrer ARE Heating Magnetic stirrer VELP – Scientifica
Mass spectrometer HCT Ultra – PTM discovery system
Bruker Daltonics
Micropipettes Research series Eppendorf
26 3 Materials
Microplate reader GENios Tecan
Microplate washer Hydro Flex Tecan
Multi-channel micropipette Transferpette S-12 Brand
Peristaltic pump Peristaltic Pump P-1 Pharmacia Fine Chemicals
pH electrode pH Electrode BlueLine 18 pH Schott
pH meter pH-Meter 761 calimatic Knick
Photometer DU 640 Beckman
Power Supply PowerPac 300 Bio-Rad
Shaking device for cultivation of bacteria
Controlled Environment In-cubator Shaker
New Brunswick Scientific
Spectrophotometer NanoDrop 2000 Thermo
Thermal cycler T3 Thermalcycler Biometra
Thermal shaker ThermoMixer comfort Eppendorf
Ultrasonic bath 1210 Branson
Ultrasonic disperser UP 50 H Hielscher
Vacuum pump n/a HLC
Vortex mixer VORTEX Genius 3 IKA
Water bath 1083 GFL
Water purification system NANOpure Barstead
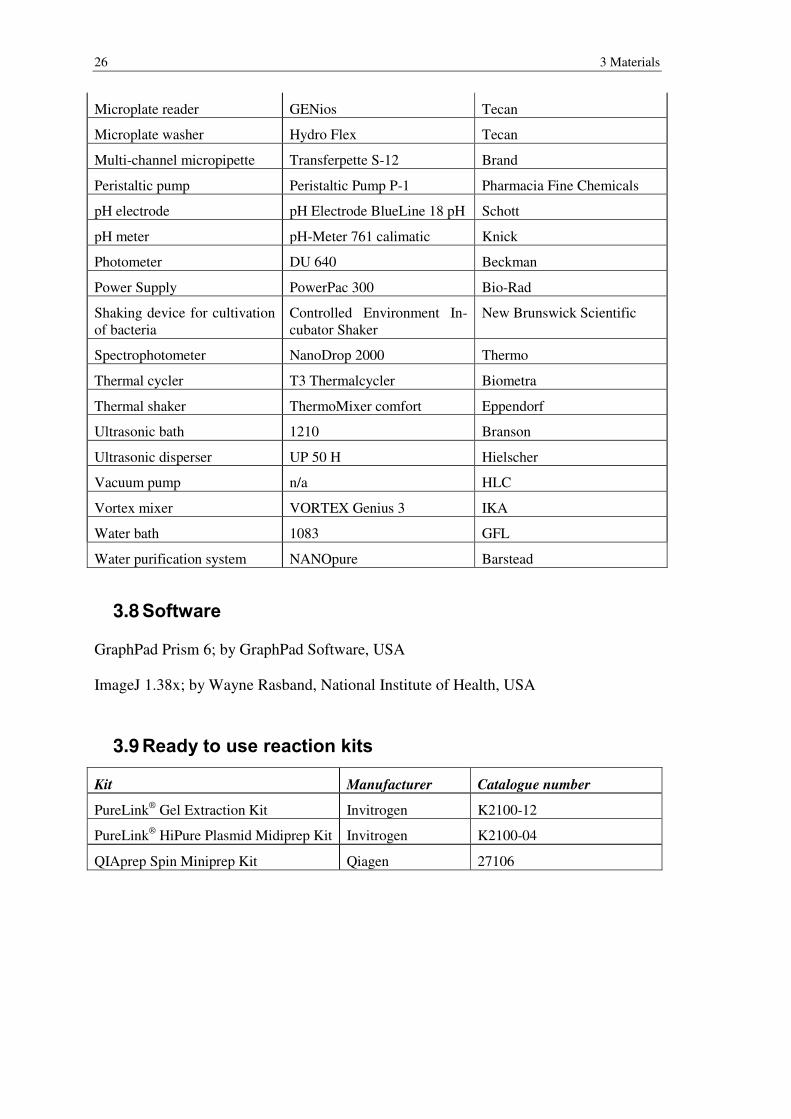
3.8 Software
GraphPad Prism 6; by GraphPad Software, USA
ImageJ 1.38x; by Wayne Rasband, National Institute of Health, USA
3.9 Ready to use reaction kits
Kit Manufacturer Catalogue number
PureLink® Gel Extraction Kit Invitrogen K2100-12
PureLink® HiPure Plasmid Midiprep Kit Invitrogen K2100-04
QIAprep Spin Miniprep Kit Qiagen 27106
4 Methods 27
4 Methods
4.1 Standard molecular biology techniques
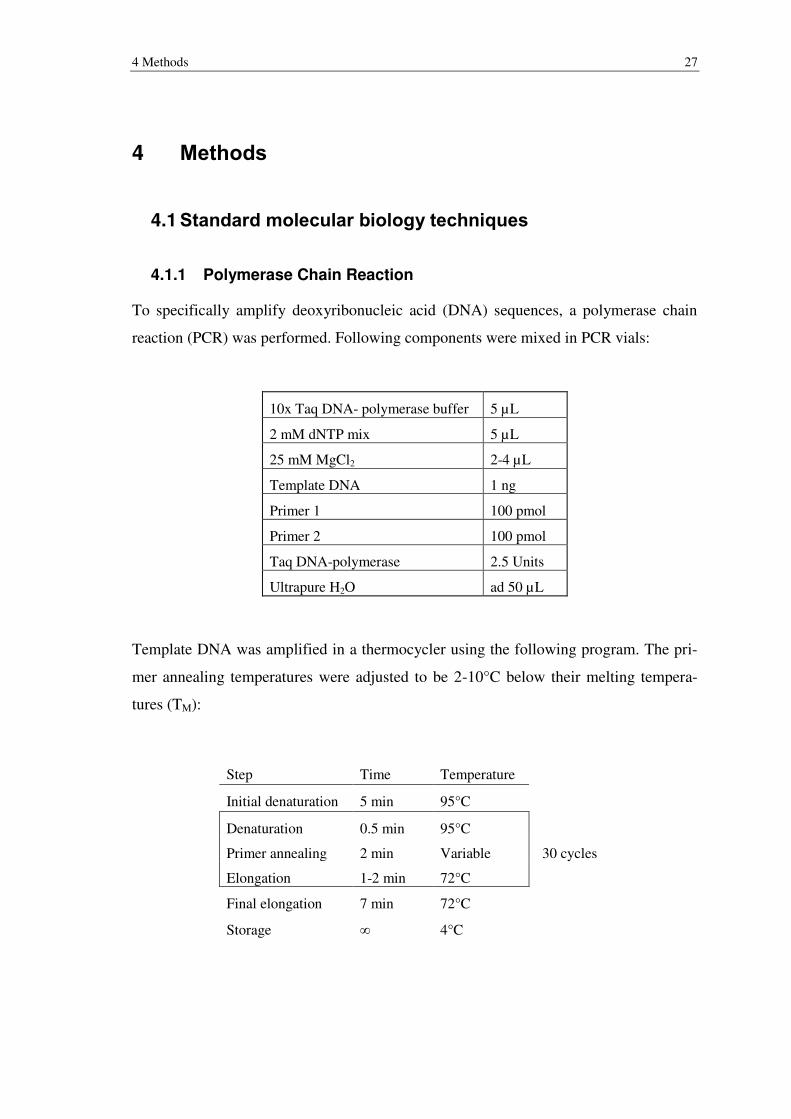
4.1.1 Polymerase Chain Reaction
To specifically amplify deoxyribonucleic acid (DNA) sequences, a polymerase chain
reaction (PCR) was performed. Following components were mixed in PCR vials:
10x Taq DNA- polymerase buffer 5 µL
2 mM dNTP mix 5 µL
25 mM MgCl2 2-4 µL
Template DNA 1 ng
Primer 1 100 pmol
Primer 2 100 pmol
Taq DNA-polymerase 2.5 Units
Ultrapure H2O ad 50 µL
Template DNA was amplified in a thermocycler using the following program. The pri-
mer annealing temperatures were adjusted to be 2-10°C below their melting tempera-
tures (TM):
Step Time Temperature
Initial denaturation 5 min 95°C
Denaturation 0.5 min 95°C
30 cycles Primer annealing 2 min Variable
Elongation 1-2 min 72°C
Final elongation 7 min 72°C
Storage ∞ 4°C
28 4 Methods
4.1.2 Digestion of DNA using restriction endonucleases
DNA was specifically cleaved by use of restriction endonucleases. To that end 1 µg of
DNA was incubated with 10 units of restriction endonuclease(s) for 1 h at 37°C in cor-
respondent buffer. In case of double digests the reaction buffer was chosen according to
the manufacturer’s recommendations. Digested DNA was separated according to its size
by agarose gel electrophoresis to monitor success or to purify the DNA fragment of in-
terest.
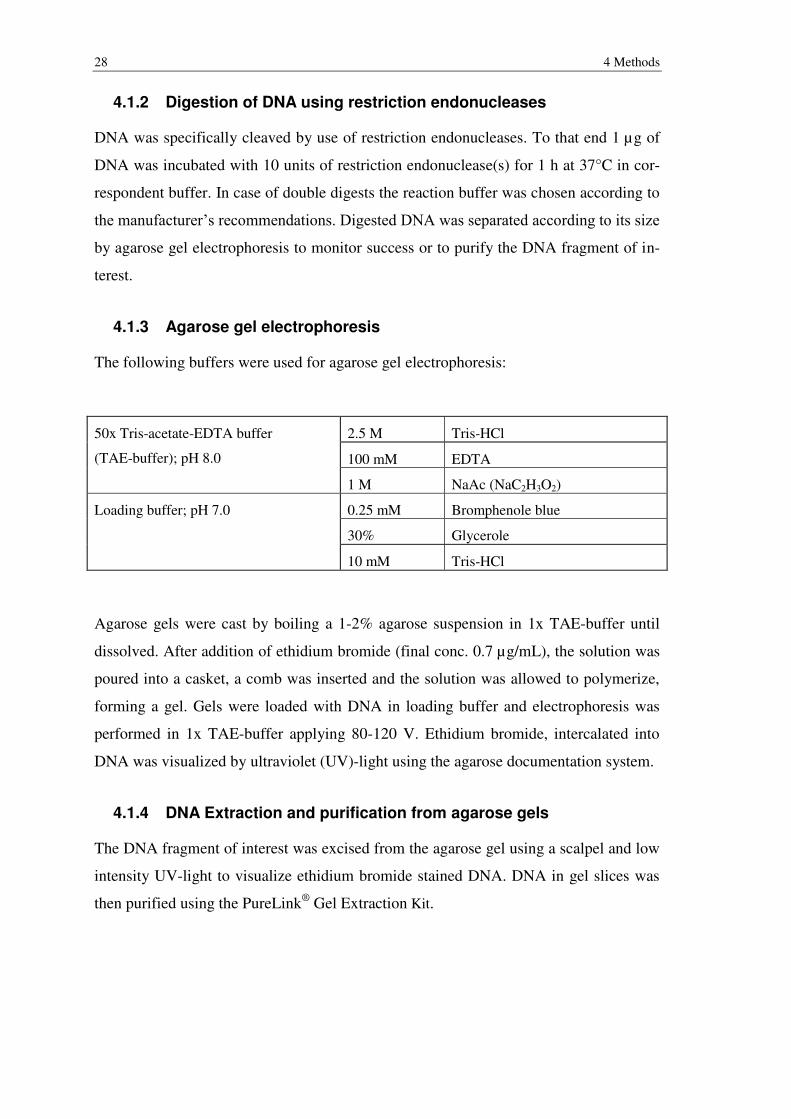
4.1.3 Agarose gel electrophoresis
The following buffers were used for agarose gel electrophoresis:
50x Tris-acetate-EDTA buffer
(TAE-buffer); pH 8.0
2.5 M Tris-HCl
100 mM EDTA
1 M NaAc (NaC2H3O2)
Loading buffer; pH 7.0 0.25 mM Bromphenole blue
30% Glycerole
10 mM Tris-HCl
Agarose gels were cast by boiling a 1-2% agarose suspension in 1x TAE-buffer until
dissolved. After addition of ethidium bromide (final conc. 0.7 µg/mL), the solution was
poured into a casket, a comb was inserted and the solution was allowed to polymerize,
forming a gel. Gels were loaded with DNA in loading buffer and electrophoresis was
performed in 1x TAE-buffer applying 80-120 V. Ethidium bromide, intercalated into
DNA was visualized by ultraviolet (UV)-light using the agarose documentation system.
4.1.4 DNA Extraction and purification from agarose gels
The DNA fragment of interest was excised from the agarose gel using a scalpel and low
intensity UV-light to visualize ethidium bromide stained DNA. DNA in gel slices was
then purified using the PureLink® Gel Extraction Kit.
4 Methods 29
4.1.5 Ligation and transformation of E. coli
DNA fragments, e.g. generated by PCR, and target vectors were digested with the same
restriction endonucleases. 20 ng of vector DNA were incubated for 1 h at RT with a 3-
4-fold excess of insert in presence of one unit of T4 DNA-ligase (Thermo Scientfic).
Success of the procedure was confirmed by agarose gel electrophoresis followed by
transformation of ligated vectors into E. coli cells. E. coli (strain XL-1 blue) were made
chemical competent according as described previously (Sambrook et al. 1989). 10 ng of
DNA were incubated at 0°C for 30 min per E. coli aliquot (still partially frozen). After a
heat shock (42°C for 45 sec) and further incubation at 0°C for 5 min, 1 mL of LB-
medium was added. After an incubation period (1 h, 37°C, 200 rpm), 10-100 µL of the
mixture was plated on LB-plates containing antibiotics for selection of positive clones.
After culture at 37°C o.n., colonies were picked and liquid culture was performed.
4.1.6 Phenol/chloroform purification and DNA precipitation
To purify DNA and remove proteins, phenol/chloroform precipitation was performed.
400 µL of DNA in water were mixed with 400 µL of phenol/chloroform/isoamylalcohol
(25:24:1) for 30 sec. After centrifugation (15,000 g, 5 min) the upper aqueous phase
was removed and mixed with an equal volume of chloroform. This step was repeated
and the upper phase was mixed with an equal volume of isopropanol and centrifuged for
5 min at 15,000 g to precipitate DNA. The pellet was washed with 300 µL of 70% etha-
nol, centrifuged and the supernatant discarded. After air-drying the pellet, DNA was
resuspended in 10-20 µL of ultrapure H2O.
4.2 Standard protein-biochemistry techniques
4.2.1 Determination of protein concentrations
The here employed Biorad DC assay is based on the Lowry reaction and was performed
according to the manufacturers protocol in 96-well plates. In brief working reagent A’
was prepared by addition of 20 µL of reagent S per mL of reagent A. 5 µL of sample or
bovine serum albumin (BSA) standard were pipetted into each well. Sequentially, 25 µL
of working reagent A’ and 200 µL of reagent B were added and the plate was gently
shaken by using a Vortex shaker. After incubation for 15 minutes the absorbance at
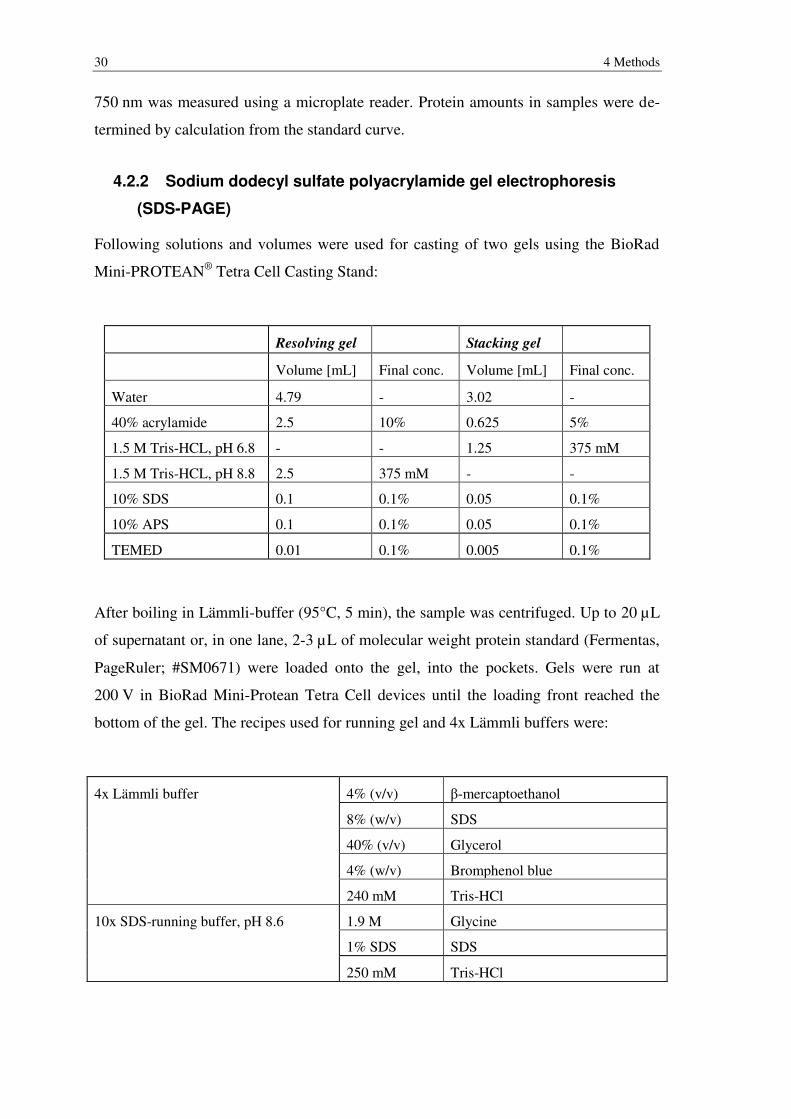
30 4 Methods
750 nm was measured using a microplate reader. Protein amounts in samples were de-
termined by calculation from the standard curve.
4.2.2 Sodium dodecyl sulfate polyacrylamide gel electrophoresis
(SDS-PAGE)
Following solutions and volumes were used for casting of two gels using the BioRad
Mini-PROTEAN® Tetra Cell Casting Stand:
Resolving gel Stacking gel
Volume [mL] Final conc. Volume [mL] Final conc.
Water 4.79 - 3.02 -
40% acrylamide 2.5 10% 0.625 5%
1.5 M Tris-HCL, pH 6.8 - - 1.25 375 mM
1.5 M Tris-HCL, pH 8.8 2.5 375 mM - -
10% SDS 0.1 0.1% 0.05 0.1%
10% APS 0.1 0.1% 0.05 0.1%
TEMED 0.01 0.1% 0.005 0.1%
After boiling in Lämmli-buffer (95°C, 5 min), the sample was centrifuged. Up to 20 µL
of supernatant or, in one lane, 2-3 µL of molecular weight protein standard (Fermentas,
PageRuler; #SM0671) were loaded onto the gel, into the pockets. Gels were run at
200 V in BioRad Mini-Protean Tetra Cell devices until the loading front reached the
bottom of the gel. The recipes used for running gel and 4x Lämmli buffers were:
4x Lämmli buffer 4% (v/v) β-mercaptoethanol
8% (w/v) SDS
40% (v/v) Glycerol
4% (w/v) Bromphenol blue
240 mM Tris-HCl
10x SDS-running buffer, pH 8.6 1.9 M Glycine
1% SDS SDS
250 mM Tris-HCl
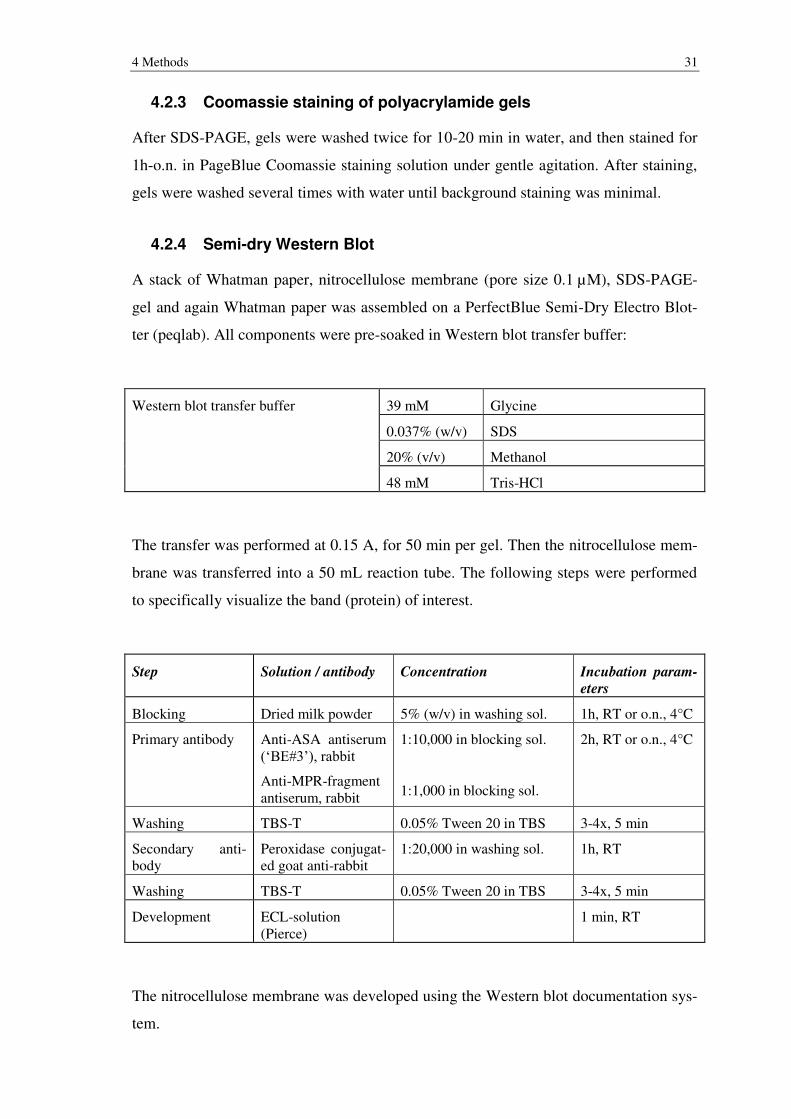
4 Methods 31
4.2.3 Coomassie staining of polyacrylamide gels
After SDS-PAGE, gels were washed twice for 10-20 min in water, and then stained for
1h-o.n. in PageBlue Coomassie staining solution under gentle agitation. After staining,
gels were washed several times with water until background staining was minimal.
4.2.4 Semi-dry Western Blot
A stack of Whatman paper, nitrocellulose membrane (pore size 0.1 µM), SDS-PAGE-
gel and again Whatman paper was assembled on a PerfectBlue Semi-Dry Electro Blot-
ter (peqlab). All components were pre-soaked in Western blot transfer buffer:
Western blot transfer buffer 39 mM Glycine
0.037% (w/v) SDS
20% (v/v) Methanol
48 mM Tris-HCl
The transfer was performed at 0.15 A, for 50 min per gel. Then the nitrocellulose mem-
brane was transferred into a 50 mL reaction tube. The following steps were performed
to specifically visualize the band (protein) of interest.
Step Solution / antibody Concentration Incubation param-
eters
Blocking Dried milk powder 5% (w/v) in washing sol. 1h, RT or o.n., 4°C
Primary antibody Anti-ASA antiserum (‘BE#3’), rabbit
Anti-MPR-fragment antiserum, rabbit
1:10,000 in blocking sol.
1:1,000 in blocking sol.
2h, RT or o.n., 4°C
Washing TBS-T 0.05% Tween 20 in TBS 3-4x, 5 min
Secondary anti-body
Peroxidase conjugat-ed goat anti-rabbit
1:20,000 in washing sol. 1h, RT
Washing TBS-T 0.05% Tween 20 in TBS 3-4x, 5 min
Development ECL-solution (Pierce)
1 min, RT
The nitrocellulose membrane was developed using the Western blot documentation sys-
tem.
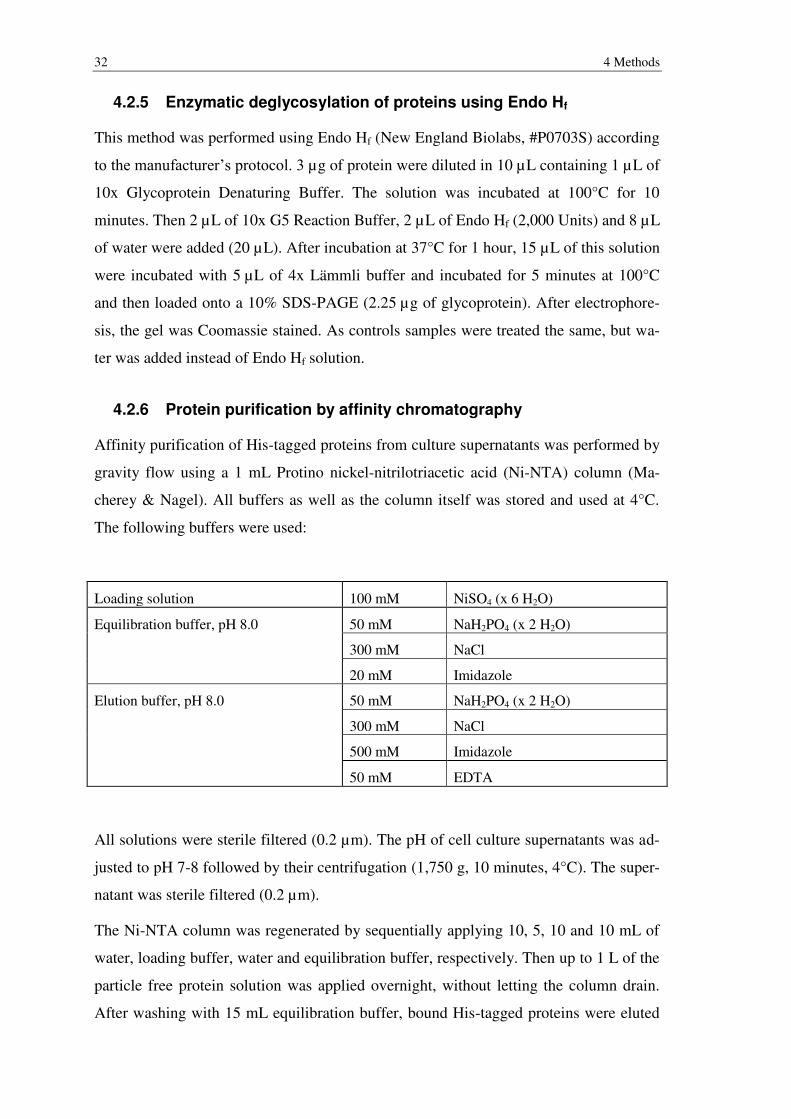
32 4 Methods
4.2.5 Enzymatic deglycosylation of proteins using Endo Hf
This method was performed using Endo Hf (New England Biolabs, #P0703S) according
to the manufacturer’s protocol. 3 µg of protein were diluted in 10 µL containing 1 µL of
10x Glycoprotein Denaturing Buffer. The solution was incubated at 100°C for 10
minutes. Then 2 µL of 10x G5 Reaction Buffer, 2 µL of Endo Hf (2,000 Units) and 8 µL
of water were added (20 µL). After incubation at 37°C for 1 hour, 15 µL of this solution
were incubated with 5 µL of 4x Lämmli buffer and incubated for 5 minutes at 100°C
and then loaded onto a 10% SDS-PAGE (2.25 µg of glycoprotein). After electrophore-
sis, the gel was Coomassie stained. As controls samples were treated the same, but wa-
ter was added instead of Endo Hf solution.
4.2.6 Protein purification by affinity chromatography
Affinity purification of His-tagged proteins from culture supernatants was performed by
gravity flow using a 1 mL Protino nickel-nitrilotriacetic acid (Ni-NTA) column (Ma-
cherey & Nagel). All buffers as well as the column itself was stored and used at 4°C.
The following buffers were used:
Loading solution 100 mM NiSO4 (x 6 H2O)
Equilibration buffer, pH 8.0 50 mM NaH2PO4 (x 2 H2O)
300 mM NaCl
20 mM Imidazole
Elution buffer, pH 8.0 50 mM NaH2PO4 (x 2 H2O)
300 mM NaCl
500 mM Imidazole
50 mM EDTA
All solutions were sterile filtered (0.2 µm). The pH of cell culture supernatants was ad-
justed to pH 7-8 followed by their centrifugation (1,750 g, 10 minutes, 4°C). The super-
natant was sterile filtered (0.2 µm).
The Ni-NTA column was regenerated by sequentially applying 10, 5, 10 and 10 mL of
water, loading buffer, water and equilibration buffer, respectively. Then up to 1 L of the
particle free protein solution was applied overnight, without letting the column drain.
After washing with 15 mL equilibration buffer, bound His-tagged proteins were eluted
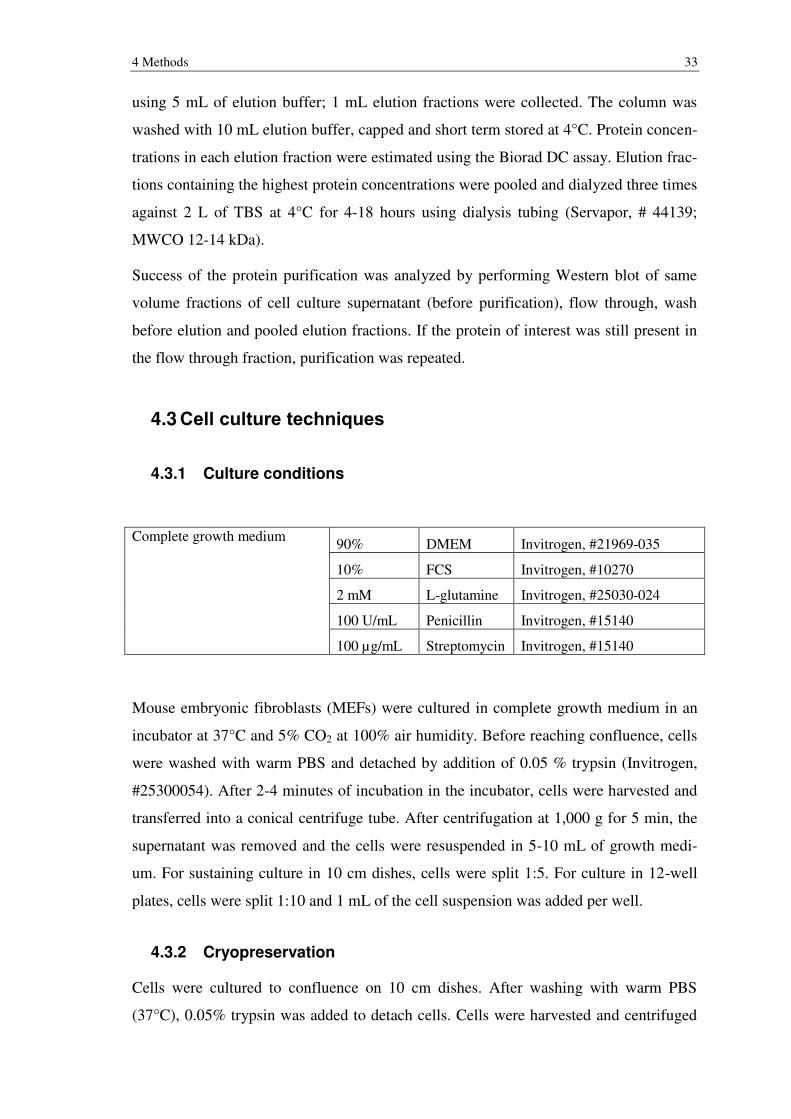
4 Methods 33
using 5 mL of elution buffer; 1 mL elution fractions were collected. The column was
washed with 10 mL elution buffer, capped and short term stored at 4°C. Protein concen-
trations in each elution fraction were estimated using the Biorad DC assay. Elution frac-
tions containing the highest protein concentrations were pooled and dialyzed three times
against 2 L of TBS at 4°C for 4-18 hours using dialysis tubing (Servapor, # 44139;
MWCO 12-14 kDa).
Success of the protein purification was analyzed by performing Western blot of same
volume fractions of cell culture supernatant (before purification), flow through, wash
before elution and pooled elution fractions. If the protein of interest was still present in
the flow through fraction, purification was repeated.
4.3 Cell culture techniques
4.3.1 Culture conditions
Complete growth medium 90% DMEM Invitrogen, #21969-035
10% FCS Invitrogen, #10270
2 mM L-glutamine Invitrogen, #25030-024
100 U/mL Penicillin Invitrogen, #15140
100 µg/mL Streptomycin Invitrogen, #15140
Mouse embryonic fibroblasts (MEFs) were cultured in complete growth medium in an
incubator at 37°C and 5% CO2 at 100% air humidity. Before reaching confluence, cells
were washed with warm PBS and detached by addition of 0.05 % trypsin (Invitrogen,
#25300054). After 2-4 minutes of incubation in the incubator, cells were harvested and
transferred into a conical centrifuge tube. After centrifugation at 1,000 g for 5 min, the
supernatant was removed and the cells were resuspended in 5-10 mL of growth medi-
um. For sustaining culture in 10 cm dishes, cells were split 1:5. For culture in 12-well
plates, cells were split 1:10 and 1 mL of the cell suspension was added per well.
4.3.2 Cryopreservation
Cells were cultured to confluence on 10 cm dishes. After washing with warm PBS
(37°C), 0.05% trypsin was added to detach cells. Cells were harvested and centrifuged
34 4 Methods
for 5 min at 1,000 g. The supernatant was removed and cells were resuspended in 5 mL
of cryopreservation medium (normal growth medium supplemented with 10% FCS and
10% dimethyl sulfoxide - DMSO). Cell suspensions were transferred into multiple cry-
opreservation vials and gradually frozen to -80°C in a styrofoam box. After one day,
cryovials were transferred into gaseous phase nitrogen tanks.
To revitalize cells, cryovials were quickly thawed at 37°C and transferred to the bottom
of a conical centrifuge tube filled with 10 mL ice-cold growth medium. After inverting
the tube the cell suspension was centrifuged at 1,000 g for 5 min and the supernatant
was removed. Cells were resuspended in 10 mL of warm growth medium and seeded
onto a 10 cm dish.
4.3.3 Endocytosis experiments
Acidic washing solution (pH 3.0) 50 mM Glycine
150 mM NaCl
Lysis buffer (pH 8.0) 1% Trition X-100
20 mM Tris-HCl
50 mM NaCl
5 mM EDTA
After 30 minutes of coincubation in complete growth medium supplemented with 10
mM HEPES at pH 7.0 at 37°C, ASA and the MPR300 dom 9 were added to confluent
MEF cells in 12-well plates (0.5 mL per well). 2.5 µg/mL of ASA were coincubated
with equimolar amounts (0.88 µg/mL) or a tenfold excess (8.8 µg/mL) of the MPR300
dom9. After 24 hours of incubation, the supernatant was removed; cells were washed
with prewarmed PBS (37°C) and then with 0.5 mL of acidic washing solution for 3 min
at 37°C to remove unspecifically bound ASA from cell surfaces and plastic material.
200 µL of lysis buffer were added per well and cells were detached from the plastic
surface using a cell scraper and by rigorous pipetting. The suspension was transferred
into a new reaction vial, vortex-mixed, treated by ultrasound in an ultrasonic bath (5
min) and vortex-mixed again to lyse the cells. Cell fragments were removed by centrif-
ugation (15,000 g, 5 min), the supernatant transferred into a new reaction vial and stored
at -20°C for further analyses.
4 Methods 35
4.4 Cloning and expression of MPR300 domain 9 constructs
The Pichia pastoris expression vector pPICZα-B by Invitrogen was used. Cloning and
expression in P. pastoris were performed according to the manufacturer’s manual. All
buffer- and solution-recipes are provided in the manual.
4.4.1 Cloning and in vitro mutagenesis
The nucleotide sequence of the domain 9 of the MPR300 was amplified by PCR using
the primers A and B (material, table 2) and the human MPR300 gene (provided by Prof.
Pohlmann, Münster University) as template. Both the PCR product as well as the
pPICZα-B were digested using the restriction enzymes PstI and XbaI. After ligation of
the insert into the vector, competent E. coli (strain XL-1) were transformed by heat
shock and Zeocin resistant clones were selected and propagated. After purification of
plasmid DNA using the QIAprep Spin Miniprep Kit, the clones carrying the correct
insert were identified by analytical restriction enzyme digest. Correct clones were prop-
agated and plasmid DNA was isolated by using the PureLink HiPure Plasmid Midiprep
Kit. The nucleotide sequence was confirmed by sequencing (GATC Biotech AG, Kon-
stanz, Germany) using the sequencing primers C and D.
The vector containing the insert (named pPICZαB_MPR300 dom9) was used as a tem-
plate for mutagenesis PCR using either the primer pair E & F, G & H or E & H to insert
(an) amino acid substitution(s) at position 28 (N28Q), 94 (N94Q) or 28 & 94 (N28Q &
N94Q), respectively. Each amplification product was cloned into the pJET vector, prop-
agated in E. coli in presence of ampicillin and purified using the QIAprep Spin Mini-
prep Kit. Success of the insertion into pJET and the mutations were monitored by ana-
lytical restriction enzyme digest using PfoI, AfeI or both, respectively. Both the pJET
and the pPICZαB_MPR300 dom9 were linearized with two identical restriction en-
zymes each:
N28Q: PasI and XbaI
N94Q: PstI and SacII
N28Q & N94Q: PasI and SacII
After purification of the insert using the PureLink Gel Extraction Kit, ligation into the
target vector was performed. Competent E. coli were transformed and propagated in
presence of Zeocin (Invitrogen). After purification of the plasmid DNA using the QI-
36 4 Methods
Aprep Spin Miniprep Kit, positive clones were identified by analytical restriction en-
zyme digest using PfoI, AfeI or both, respectively. Positive clones were propagated fur-
ther and their plasmid DNA was extracted and purified using the PureLink HiPure
Plasmid Midiprep Kit. The nucleotide sequence was confirmed by sequencing (GATC
Biotech AG, Konstanz, Germany) using the sequencing primers C and D.
4.4.2 Transformation of Pichia pastoris
Wildtype (wt) P. pastoris cells (strain X33) were grown overnight, then made electro-
competent (manufacturer’s protocol) and used on the same day. 80 µL of electrocompe-
tent P. pastoris cells were mixed with 5-10 µg of SacI-linearized and by phe-
nol/chloroform purified pPICZαB-vector DNA in electroporation cuvette at 0°C. Elec-
troporation was performed by applying 1 kV at 1 Ω and 25 µF using the Gene Pulser II
(Biorad). The time constants were 11-17 msec. Further steps were performed according
to the manufacturer’s protocol.
4.4.3 Expression of pPICZα-B constructs in P. pastoris
After selection, 10 Zeocin resistant clones were picked and cultured in YPD-medium
containing Zeocin overnight at 30°C. These liquid cultures were used for cryopreserva-
tion (glycerol stock, -80°C) and the inoculation of a 10 mL BMMY culture. After three
days (50 µL of methanol added daily), supernatants were harvested and screened for
expression of the myc-tagged proteins by Western blot.
Large scale expression was performed using best producing clones from cryocon-
servates following the manufacturer’s protocol.
4.5 Techniques involving nanoparticles
4.5.1 Determination of ASA activity after incubation in solvents
5 µg/mL ASA were incubated in different solutions and organic solvents used for
polymerization of nanoparticles, namely ehthylacetate, chloroform, dichlorethan, and an
aqueous solution of 1% (w/v) dextran and 10 mM HCl. As control ASA was incubated
in the same solution without dextran and in 1% (w/v) BSA in TBS. 1 µL of ASA solu-
tion (0.5 mg/mL) and 99 µL of said solvents or solution were mixed and incubated for
2.5 hours at room temperature. Then, 2 µL of each sample was used in the standard

4 Methods 37
ASA-activity determination assay in 96-well plates using its artificial substrate 4-
nitrocatechol sulfate. The measured absorption values were normalized on the BSA in
TBS control.
4.5.2 Unspecific, adsorptive binding of ASA to nanoparticles
Nanoparticles provided by our collaboration partners were freeze dried. For the follow-
ing experiments the content of one entire vial (10-20 mg of nanoparticles) was weighed.
The obtained weight was used to calculate the weight corresponding to 1 mg of nano-
particle. For adsorptive binding studies, 1 mg of one nanoparticle batch was used per
pH to be tested. 70 µL of an ASA solution in water (1 mg/mL) whose pH was adjusted
with small amounts of acid or base (0.01 M HCl / NaOH) or buffer were used to resus-
pend the nanoparticles. After two hours of incubation under constant shaking (800 rpm)
at room temperature, surfactants were added to a final concentration of 1% (w/v), fol-
lowed by incubation for another 30 minutes under same conditions. Thereon the suspen-
sions were centrifuged for 10 min at 16,800 rpm and room temperature. The supernatant
was removed and the pellet was washed three times with 90 µL of water (pH adjusted
with small amounts of acid/base, accordingly). Finally the pellet was resuspended in
60 µL of same pH-adjusted water. A standard ASA-activity assay in 96-well plates un-
der shaking was performed to determine the amounts of active ASA bound to the nano-
particles.
4.5.3 Covalent binding of ASA to nanoparticles
To this end, commercially available, amine modified PLA-nanoparticles were used
(LGFG200N, Phosphorex Inc.). In brief, 1 mg of these nanoparticles was resuspended
and washed twice with PBS. After resuspension in 10 µL of PBS using an ultrasound
probe (Hielscher) at 80% amplitude in 5 second pulses, 0.42 µL of a 1 mM solution
(10% DMSO) of the heterobifunctional crosslinker NHS-PEG12-maleimide crosslinker
was added. After 30 minutes of incubation at room temperature under constant shaking
(Eppendorf Thermomixer, 800 rpm) thiolated ASA was added. For thiolation of ASA,
an ASA-variant (T365C) was used. This protein was stably expressed in Chinese ham-
ster ovary suspension (CHO-S) cells and purified by affinity chromatography as shown
before (Höcker 1999). The sulfhydryl-residue on its surface was used to covalently react
with the maleimid-group of the crosslinker. To that end 60 µg (1.0 nmol) of ASA-
T365C in PBS were reduced under mild conditions using 69 µg (225 nmol) TCEP for 2
38 4 Methods
hours at room temperature to ensure availability of crosslinkable sulfhydryl groups.
Subsequently, the modified nanoparticles and the thiolated ASA T365C variant were
coincubated over night at 4°C and 800 rpm. A standard ASA-activity assay in 96-well
plates under shaking was performed to determine the amounts of active ASA bound to
the nanoparticles.
Secondly, HSA nanoparticles were used to covalently bind ASA with a similar cross-
linking strategy. The crosslinking procedure was performed by collaboration partners of
the working group of Prof. Dr. J. Kreuter of the Goethe University of Frankfurt. In
brief, 400 µg of ASA were thiolated using 48 µg of Traut’s reagent (2-iminothiolane)
and 20 hours of incubation at room temperature. 1 mg of HSA nanoparticles were react-
ed with 0.74 µg of the crosslinker Malhex-NH-PEG-O-C3H6-CONHS (RAPP Polymere,
Germany). 1 mg of these activated HSA-nanoparticles were then reacted with 400 µg of
thiolated ASA for 18 h at room temperature and constant shaking, and then washed
three times.
The subsequent binding and release analyses were performed in this work. To that end,
a standard ASA-activity assay in 96-well plates under shaking was performed to deter-
mine the amounts of active ASA bound to the nanoparticles.
4.5.4 High affinity binding of ASA to PLA- and PLGA-nanoparticles
Two strategies were pursued to bind ASA with high affinity to nanoparticles. (1)
Biotinylated ASA was to be bound to neutravidin-modified nanoparticles. (2) Unmodi-
fied ASA was to be bound with high-affinity to nanoparticles that had been covalently
modified with the M6P binding domain 9 of the MPR300.
4.5.4.1 Biotinylation of ASA
For biotinylation 300 µg (5.3 nmol) of purified ASA-T365C was buffer exchanged into
PBS. To ensure that the cystein residue is available for crosslinking, a mild reduction
reaction was performed using 400 µg (1300 nmol) of TCEP (in water, pH adjusted to
7.4.). Then 300 nmol of maleimid-PEG2-biotin were added and incubated for 2 hours at
room temperature. Excess reaction reagents were removed by dialysis using Slide-A-
Lyzer mini-dialysis devices (Thermo).
To determine biotinylation yields, a pull-down assay with streptavidin-agarose was per-
formed. Streptavidin-agarose was washed three times with 1% (w/v) BSA in TBS, then
4 Methods 39
10 µL of the slurry was incubated with 1 µg of biotinylated ASA in a final volume of
40 µL containing 1% (w/v) of BSA in TBS. Samples were incubated over night at 4°C
under constant shaking (1300 rpm), then centrifuged at 10,000 g for 3 minutes at room
temperature. 20 µL of the supernatant was carefully removed and the pellet was washed
three times with 1 mL of 1% (w/v) BSA in TBS. Finally the pellet was resuspended in
40 µL of same buffer. ASA activity was assessed in supernatant, washes and pellet in
the 96-well ASA activity assay. The absolute activity of ASA found in the pellet, corre-
sponding to biotinylated ASA, was normalized on the total absolute activity of the ini-
tially employed ASA (sum of all fractions).
4.5.4.2 Covalent binding of neutravidin to PLA- and PLGA-nanoparticles
PLA- and PLGA-nanoparticles were neutravidin-modified using the protocol described
by Nobs et al., (2004) in a slightly modified version. In this protocol carboxylic end
groups of PLA- or PLGA-polymers are thiolated, followed by reaction with maleimide-
activated neutravidin. The following buffers were used:
Reaction buffer 1 (RB1): pH 4.7
100 mM MES
0.9% (w/v) NaCl
Reaction buffer 2 (RB2): pH 6.5 100 mM MES
0.9% (w/v) NaCl
Nanoparticles were precipitated by centrifugation at 16,000 rpm for 15 minutes at room
temperature in between reaction steps and in washing procedures. Resuspension was
achieved by ultrasound treatment using a probe (Hielscher) at 80% amplitude in 5 sec-
ond pulses until the suspension appeared homogenous and no pellet was visible. All
incubation steps were performed in a Eppendorf Thermomixer at 1,100 rpm at room
temperature.
Before starting, 1 mg of nanoparticle was resuspended in and washed three times with
300 µL reaction buffer 1 (RB1). After resuspension in 100 µL of RB1, 100 µL EDC-
solution (24 mg/mL) and 50 µL of cystamine dihydrochloride solution (71 mg/mL)
were added. After 24 hours of incubation, excess reaction reagents were removed by
washing twice with 300 µL of RB2. 10 µL of TCEP solution (6 mg/mL, pH 7.0) were
then added to 200 µL of resuspended nanoparticles. The reaction mixture was incubated
for three hours. Excess TCEP and 2-aminoethanthiol, resulting from the reduction reac-
40 4 Methods
tion, were removed by washing three times with RB2. To remove agglomerates from
the maleimide-activated neutravidin solution, a freshly prepared 5 mg/mL stock in wa-
ter was centrifuged for 5 minutes at 15,000 g. The pellet was discarded and the superna-
tant was used. Thiolated nanoparticles were incubated with 50 µL of agglomerate free
maleimide-neutravidin solution for 6 hours at 4°C. Excess neutravidin was removed by
washing three times with 300 µL of TBS.
4.5.4.3 High affinity binding of biotinylated ASA to neutravidin-modified
nanoparticles
2.0-6.0 µg of biotinylated ASA were added per mg neutravidin-modified nanoparticle.
After incubation over night at 4°C, nanoparticles were precipitated and the pellets were
washed twice with 300 µL and finally resuspended in 40 µL of TBS. A standard ASA-
activity assay in 96-well plates under shaking was performed to determine the amounts
of active ASA in the pellet.
4.5.4.4 Covalent binding of the MPR300 domain 9 fragment to PLA- and
PLGA-nanoparticles
Two nanoparticle systems were used to covalently bind the receptor fragment. First of
all, PLGA-nanoparticles (batch 1311) were reacted with EDC and cystamine to create
amine reactive nanoparticles. This was performed according to the protocol described in
chapter 4.5.4.2. Secondly, commercially available N-PLGA nanoparticles (LGFG200N,
Phosphorex Inc.) were used. The same crosslinker (NHS-(PEG)12-maleimide), reactive
towards thiol- and amine-groups, as mentioned before (chapter 4.5.3) was added to a
final concentration of 2.5 mM.
The non-glycosylated MPR fragment was thiolated using Traut’s reagent: 210 µg of the
non-thiolated receptor fragment were incubated with 30 µg of Traut’s reagent (2-
iminothiolane) and incubated for 1.5 h at RT. Excess reaction reagent was removed by
dialysis (three times, against 2 L of PBS at 4°C for >4 h) using Slide-A-Lyzer mini-
dialysis units. 5-20 µg of thiolated receptor fragment were incubated with 1 mg of
amine-modified nanoparticles for 1.5 h at RT under constant agitation (1300 rpm). After
washing twice with 215 µL of TBS, the pellet was resuspended in 40 µL of TBS.
4 Methods 41
4.5.4.5 Binding of ASA to MPR300 domain 9 fragment-nanoparticles
1 mg of the receptor-fragment modified nanoparticle formulations were coincubated
with 3-5 µg of unmodified ASA in a total volume of 50 µL. After 2 h of incubation at
4°C under constant agitation (1300 rpm), samples were centrifuged and the supernatant
was removed (25 µL). The remaining 25 µL containing the nanoparticles were washed
twice with 215 µL of TBS. The pellet was resuspended in 50 µL of TBS. A standard
ASA-activity assay in 96-well plates under shaking was performed to determine the
amounts of active ASA bound to the nanoparticles.
4.5.5 Release of ASA from nanoparticles in vitro
0.2 mg of ASA-nanoparticles were centrifuged (17,000 g, 15 min at 4°C) and resus-
pended in 12 µL of serum of ASA-/- mice or water and incubated for two hours at 37°C
under shaking at 1,100 rpm. After another centrifugation step 10 µL of supernatant were
withdrawn and the pellet was resuspended in 18 µL of 1% (w/v) BSA in TBS. ASA
activity of supernatants and washes were determined by ASA activity assay in 96 well
plates. Absolute ASA activities in supernatant and pellets were calculated, arithmetical-
ly subtracting the ASA activity of 2 µL of supernatant not withdrawn for pellet samples.
ASA activities measured in the pellets were normalized on initially employed ASA
(sum of ASA activities in supernatant and pellet).
4.6 In vivo experiments
Animals were kept with food and water ad libitum. All experiments were performed in
accordance with the German ‘Tierschutzgesetz’. To avoid a cross reaction with murine
ASA when analyzing tissue concentrations of injected human ASA, ASA-/- mice were
used (Hess et al. 1996).
4.6.1 Intravenous injections of various nanoparticle preparations
For tail-vein injections ASA-/- mice were subjected to red-light radiation for warming,
leading to swelling of their tail veins, facilitating the intervention. 300 –350 µL of each
formulation were injected per non-anesthetized mouse, using a syringe with a small
cannula. After receiving the injection, mice were put back into their cage with their lit-
termates. 5 min after injection, a blood sample (~50 µL) was taken by injuring the tail
with a scalpel.
42 4 Methods
Tail vein injections and parameters of injected formulations used in this work are listed
in the following table:
Experiment Mice
(n) Nanoparticles Surfactant ASA
[U/kg] Injection
vol. [µL] Polymer Conc.
[mg/kg] Name Conc.
[mg/kg]
Tolerance 2 PBCA 200 PS80 100 - 300
3 PBCA 100 PS80 50 - 300
4 PLA 300 P188 100 - 300
2 HSA 100 PS80 100 - 350
Distribution 3 HSA 100 PS80 100 34 350
3 - - PS80 100 34 350
3 PLGA 240 P188 100 21.6 250
3 - - P188 100 21.6 250
PS80 = polysorbate 80; P188 = poloxamer 188
Mice used in tolerance studies were observed closely for one hour for abnormal behav-
ior. In case severe adverse effects were noted, mice were euthanized by cervical disloca-
tion within 20 minutes. When this was not the case, mice were observed in regular in-
tervals the following two weeks and sacrificed subsequently.
4.6.2 Dissection of tissues
For distribution studies tail-vein injected mice were anaesthetized after 2 hours,
transcardially perfused and their tissues dissected. Anesthesia was performed by
intraperitoneal injection of 0.6-1.0 mL of 1% (w/v) tribromoethanol (Avertin). After
approximately 5 minutes mice were tested for their reaction to pain by pinching their
fore- and hind-paws. Only in case of negative response, mice were fixed to a styrofoam
board with all paws. The visceral cavity was opened and the heart was exposed by scis-
soring left and right from the sternum. The right atrium of the still beating heart was
punctured; the emerging blood was collected from the chest cavity and transferred into a
reaction tube. For transcardial perfusion a butterfly cannula was inserted from the tip of
the heart towards the left ventricle. PBS containing 1% (w/v) procain was pumped
through the circulatory system at a flow rate of approximately 10 mL/min for 10
minutes.
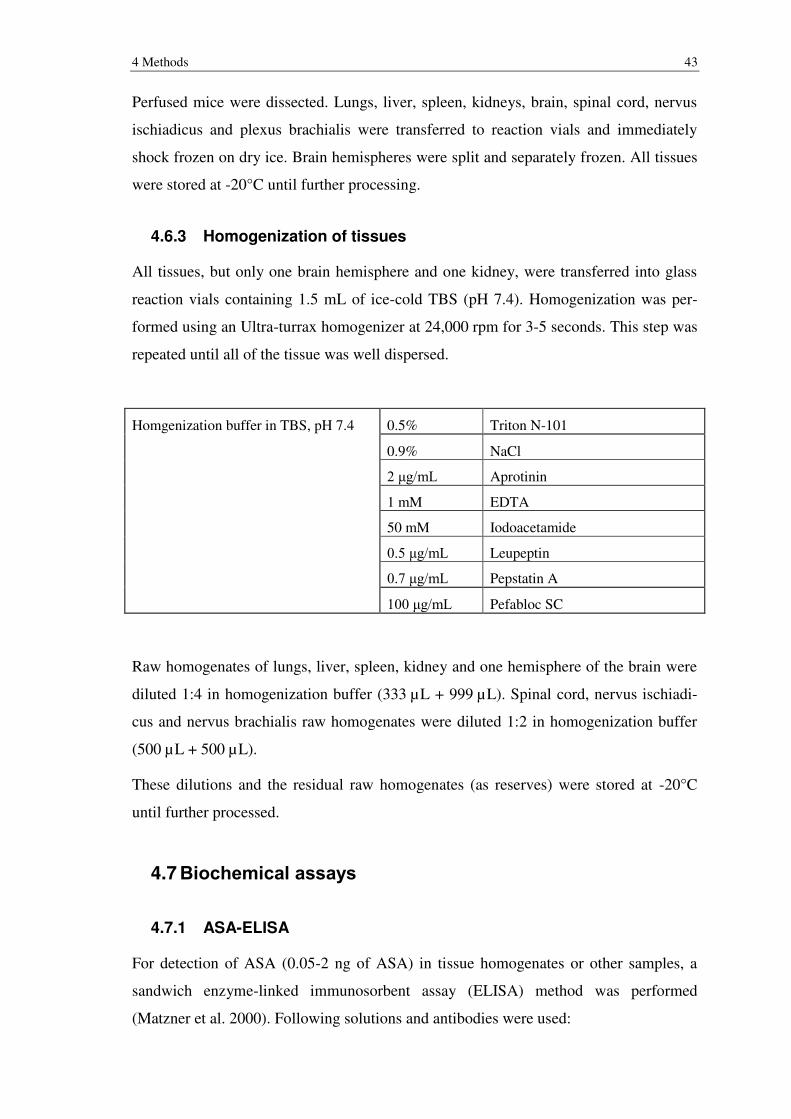
4 Methods 43
Perfused mice were dissected. Lungs, liver, spleen, kidneys, brain, spinal cord, nervus
ischiadicus and plexus brachialis were transferred to reaction vials and immediately
shock frozen on dry ice. Brain hemispheres were split and separately frozen. All tissues
were stored at -20°C until further processing.
4.6.3 Homogenization of tissues
All tissues, but only one brain hemisphere and one kidney, were transferred into glass
reaction vials containing 1.5 mL of ice-cold TBS (pH 7.4). Homogenization was per-
formed using an Ultra-turrax homogenizer at 24,000 rpm for 3-5 seconds. This step was
repeated until all of the tissue was well dispersed.
Homgenization buffer in TBS, pH 7.4
0.5% Triton N-101
0.9% NaCl
2 μg/mL Aprotinin
1 mM EDTA
50 mM Iodoacetamide
0.5 μg/mL Leupeptin
0.7 μg/mL Pepstatin A
100 μg/mL Pefabloc SC
Raw homogenates of lungs, liver, spleen, kidney and one hemisphere of the brain were
diluted 1:4 in homogenization buffer (333 µL + 999 µL). Spinal cord, nervus ischiadi-
cus and nervus brachialis raw homogenates were diluted 1:2 in homogenization buffer
(500 µL + 500 µL).
These dilutions and the residual raw homogenates (as reserves) were stored at -20°C
until further processed.
4.7 Biochemical assays
4.7.1 ASA-ELISA
For detection of ASA (0.05-2 ng of ASA) in tissue homogenates or other samples, a
sandwich enzyme-linked immunosorbent assay (ELISA) method was performed
(Matzner et al. 2000). Following solutions and antibodies were used:
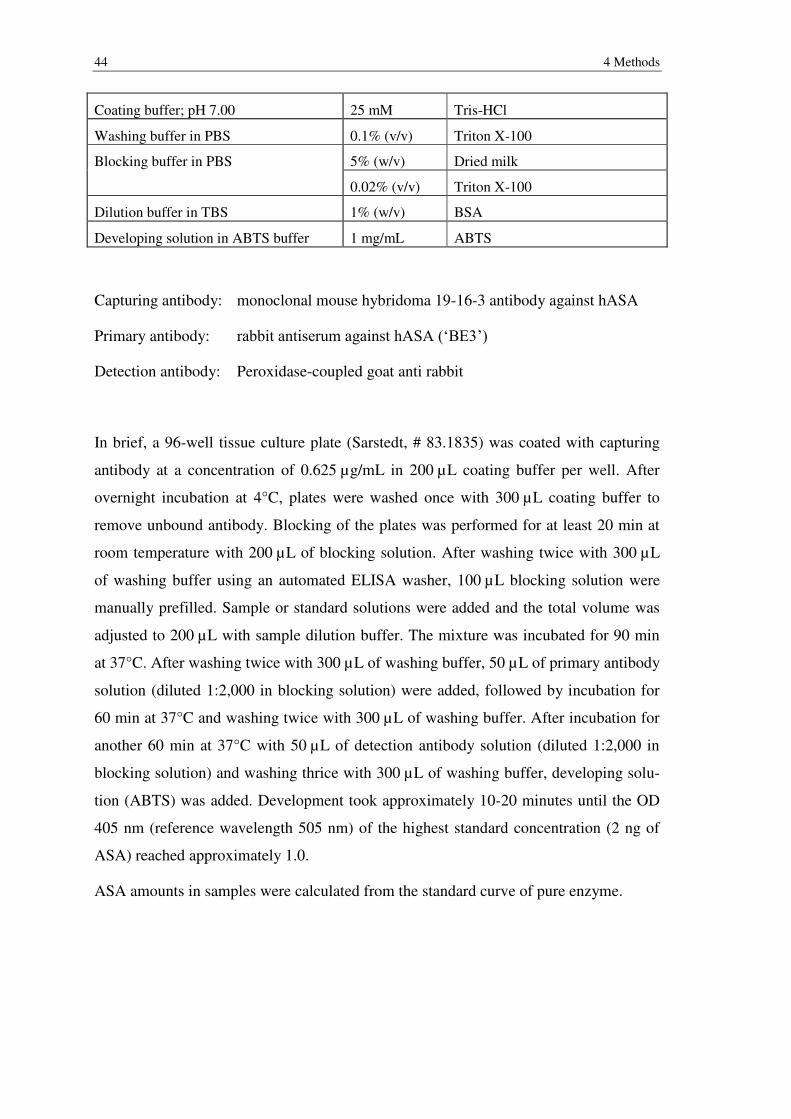
44 4 Methods
Coating buffer; pH 7.00 25 mM Tris-HCl
Washing buffer in PBS 0.1% (v/v) Triton X-100
Blocking buffer in PBS 5% (w/v) Dried milk
0.02% (v/v) Triton X-100
Dilution buffer in TBS 1% (w/v) BSA
Developing solution in ABTS buffer 1 mg/mL ABTS
Capturing antibody: monoclonal mouse hybridoma 19-16-3 antibody against hASA
Primary antibody: rabbit antiserum against hASA (‘BE3’)
Detection antibody: Peroxidase-coupled goat anti rabbit
In brief, a 96-well tissue culture plate (Sarstedt, # 83.1835) was coated with capturing
antibody at a concentration of 0.625 µg/mL in 200 µL coating buffer per well. After
overnight incubation at 4°C, plates were washed once with 300 µL coating buffer to
remove unbound antibody. Blocking of the plates was performed for at least 20 min at
room temperature with 200 µL of blocking solution. After washing twice with 300 µL
of washing buffer using an automated ELISA washer, 100 µL blocking solution were
manually prefilled. Sample or standard solutions were added and the total volume was
adjusted to 200 µL with sample dilution buffer. The mixture was incubated for 90 min
at 37°C. After washing twice with 300 µL of washing buffer, 50 µL of primary antibody
solution (diluted 1:2,000 in blocking solution) were added, followed by incubation for
60 min at 37°C and washing twice with 300 µL of washing buffer. After incubation for
another 60 min at 37°C with 50 µL of detection antibody solution (diluted 1:2,000 in
blocking solution) and washing thrice with 300 µL of washing buffer, developing solu-
tion (ABTS) was added. Development took approximately 10-20 minutes until the OD
405 nm (reference wavelength 505 nm) of the highest standard concentration (2 ng of
ASA) reached approximately 1.0.
ASA amounts in samples were calculated from the standard curve of pure enzyme.
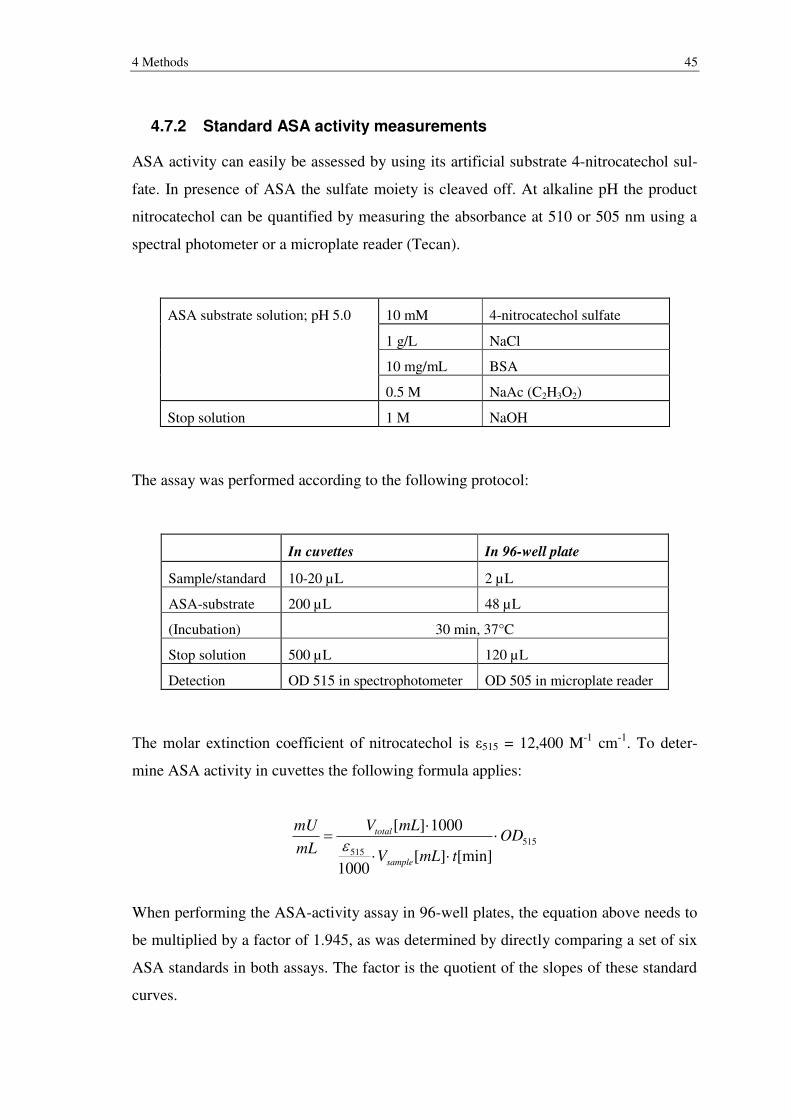
4 Methods 45
4.7.2 Standard ASA activity measurements
ASA activity can easily be assessed by using its artificial substrate 4-nitrocatechol sul-
fate. In presence of ASA the sulfate moiety is cleaved off. At alkaline pH the product
nitrocatechol can be quantified by measuring the absorbance at 510 or 505 nm using a
spectral photometer or a microplate reader (Tecan).
ASA substrate solution; pH 5.0 10 mM 4-nitrocatechol sulfate
1 g/L NaCl
10 mg/mL BSA
0.5 M NaAc (C2H3O2)
Stop solution 1 M NaOH
The assay was performed according to the following protocol:
In cuvettes In 96-well plate
Sample/standard 10-20 µL 2 µL
ASA-substrate 200 µL 48 µL
(Incubation) 30 min, 37°C
Stop solution 500 µL 120 µL
Detection OD 515 in spectrophotometer OD 505 in microplate reader
The molar extinction coefficient of nitrocatechol is ε515 = 12,400 M-1 cm-1. To deter-
mine ASA activity in cuvettes the following formula applies:
When performing the ASA-activity assay in 96-well plates, the equation above needs to
be multiplied by a factor of 1.945, as was determined by directly comparing a set of six
ASA standards in both assays. The factor is the quotient of the slopes of these standard
curves.
515515 [min]][
1000
1000][OD
tmLV
mLV
mL
mU
sample
total
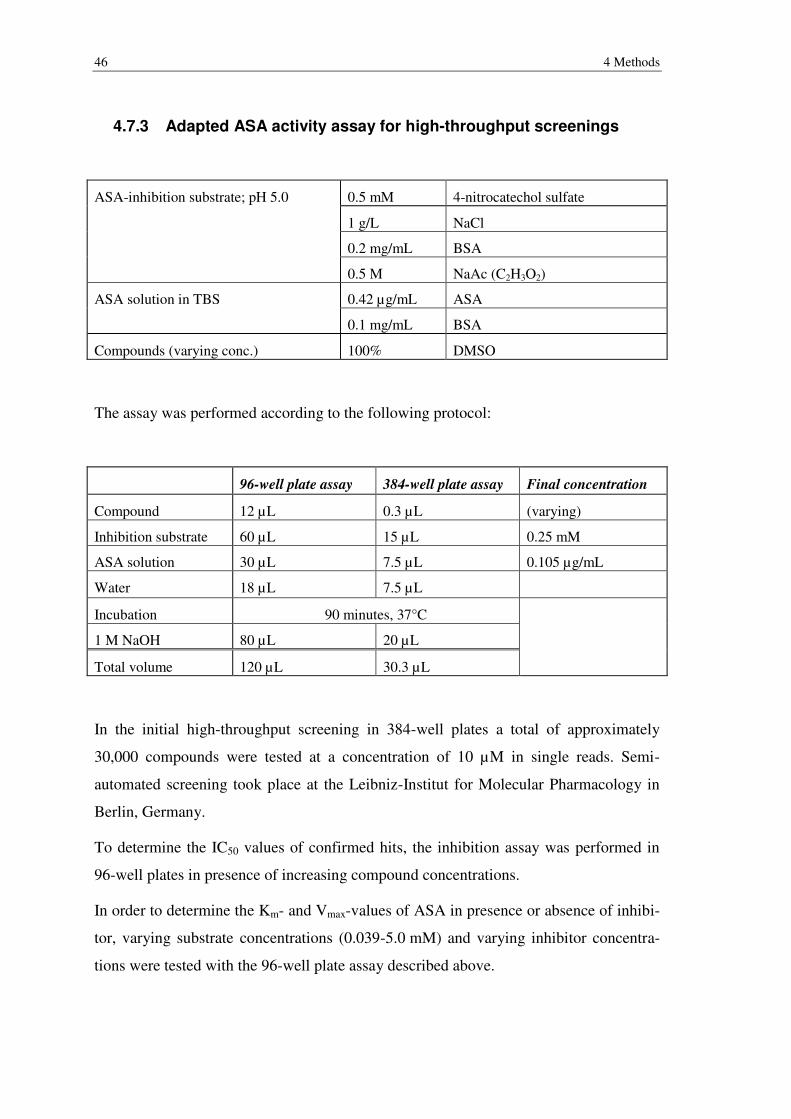
46 4 Methods
4.7.3 Adapted ASA activity assay for high-throughput screenings
ASA-inhibition substrate; pH 5.0 0.5 mM 4-nitrocatechol sulfate
1 g/L NaCl
0.2 mg/mL BSA
0.5 M NaAc (C2H3O2)
ASA solution in TBS 0.42 µg/mL ASA
0.1 mg/mL BSA
Compounds (varying conc.) 100% DMSO
The assay was performed according to the following protocol:
96-well plate assay 384-well plate assay Final concentration
Compound 12 µL 0.3 µL (varying)
Inhibition substrate 60 µL 15 µL 0.25 mM
ASA solution 30 µL 7.5 µL 0.105 µg/mL
Water 18 µL 7.5 µL
Incubation 90 minutes, 37°C
1 M NaOH 80 µL 20 µL
Total volume 120 µL 30.3 µL
In the initial high-throughput screening in 384-well plates a total of approximately
30,000 compounds were tested at a concentration of 10 µM in single reads. Semi-
automated screening took place at the Leibniz-Institut for Molecular Pharmacology in
Berlin, Germany.
To determine the IC50 values of confirmed hits, the inhibition assay was performed in
96-well plates in presence of increasing compound concentrations.
In order to determine the Km- and Vmax-values of ASA in presence or absence of inhibi-
tor, varying substrate concentrations (0.039-5.0 mM) and varying inhibitor concentra-
tions were tested with the 96-well plate assay described above.
4 Methods 47
To determine the Z’-factor for each plate the following equation was used (Zhang et al.
1999):
(σ = standard deviation; µ = mean value; c+ = positive control; c- = negative control)
4.7.4 KD determination
For washing and loading, 150 µL of Ni-NTA-agarose (Qiagen, #30210) was sequential-
ly washed with water (1.35 mL), loaded with 750 µL NiSO4 solution (compare chapter
4.2.6), washed again in water and then in 1% BSA in TBS. Finally, Ni-NTA agarose
was resuspended in 187.5 µL BSA/TBS. For precipitation in between washes, the sus-
pension was centrifuged at 17,000 g for 5 min.
For KD determination, 25 µL of MPR300-fragment solution (82.7 µg/mL in BSA/TBS)
were serially diluted 1:2 in 1% BSA in TBS in a conical 96-well plate (Sarstedt,
#82.1583). Then, 25 µL of ASA-solution (6.05 µg/mL in 1% BSA in TBS) were added
per well and the mixture was incubated for 1 h at 1000 rpm and 37°C. 10 µL of washed
and loaded Ni-NTA agarose were added per well. Samples were incubated for 2 h at
1200 rpm and 37°C. Then the 96-well plate was centrifuged at 3150 g in a swing-out
rotor (Eppendorf, A-4-62) for 20 min at room temperature. 45 µL of the supernatant
were removed. 2 µL of supernatant were used to determine the ASA activity in the 96-
well plate assay (chapter 4.7.2). KD calculation was performed using GraphPad Prism 6.
4.7.5 Dissociation experiments of ASA and receptor fragment
For evaluation of the dissociation in presence of different solutions/buffers of varying
pH, 8.9 µg of MPR300 fragment were first co-incubated with 6.48 µg of ASA in
250 µL of 1% BSA in TBS for 1 h at 37°C at 1000 rpm and then precipitated by incuba-
tion with 50 µL of washed Ni-NTA agarose (compare chapter 4.7.4) for 2 h at 1200 rpm
and 37°C and subsequent centrifugation (5 min, 17,000 g). After resuspension in
300 µL 1% BSA in TBS, the suspension was split into 6 reaction vials (55 µL each).
After centrifugation and removal of 50 µL of the supernatant each, the pellet was resus-
pended in 95 µL of the solution to be tested and incubated for 30 min at 37°C and
1200 rpm. Subsequently, samples were precipitated by centrifugation, 90 µL of the su-
pernatant were removed and stored, the pellet was washed with 90 µL of 1% BSA in
||
)33(1'
CC
CC
µµZ
48 4 Methods
TBS and finally resuspended in a final volume of 50 µL of 1% BSA in TBS. ASA activ-
ity was measured in washes, supernatant and resuspended pellet using the 96-well plate
ASA activity assay (chapter 4.7.2).
4.8 Mass spectrometric analyses of compounds
Mass spectromic analyses were performed by direct injections of samples into an elec-
tro-spray-ionization ion trap mass spectrometer (Bruker, HCT Ultra – PTM discovery sys-
tem) using a Hamilton syringe (Gastight #1775) at a flow rate of 5 µL/min. The sample
composition was: 100 µM of analyte in 81% acetonitrile, 9% ultrapure water, 9% meth-
anol and 1% DMSO.
5 Results 49
5 Results
Enzyme replacement therapy, based on repeated intravenous injections of recombinant-
ly produced lysosomal enzyme, is a treatment option for several LSDs (Desnick and
Schuchman 2012). However, previous experiments in mice have shown that only a
small fraction of the injected ASA reaches its target, the brain.
Three approaches to increase brain delivery of intravenously injected ASA are de-
scribed here. The first involves the use of nanoparticles, which have previously been
shown to increase brain delivery of drugs otherwise known to be unable to pass the
blood-brain barrier. Secondly, the blood circulation time of ASA was to be increased,
which has been suggested to enhance brain delivery of another lysosomal enzyme, β-
glucuronidase (Grubb et al. 2008). To this end, a M6P residue binding domain of the
MPR300 is used in a novel approach. Thirdly, a combinational approach is pursued,
coupling this M6P residue binding domain to nanoparticles, which are in turn used to
bind ASA. This approach should ensure increased blood circulation times, mediated by
the MPR300 binding domain, and specific transcytosis across the endothelial cells of
the BBB, mediated by nanoparticles.
5.1 Use of nanoparticles to increase brain delivery of Arylsulfatase A
When doses of 20 mg of free ASA per kg body weight were tail-vein injected into
ASA-/- mice, approximately 0.005% of the injected dose was found in the brain (calcu-
lated from unpublished data by Dr. A. Böckenhoff). In contrast, 0.1 and 0.93% of the
injected doses were found in the brains of mice treated with PLGA- and PBCA-
nanoparticles, respectively (Ambruosi et al. 2006; Halder et al. 2008). Comparing these
two delivery rates, 20- to 186-fold more ASA may be delivered to the brain using these
nanoparticles. Therefore, injections of 0.1-1.0 mg nanoparticle bound ASA and 20 mg
of free ASA per kg body weight should result in same absolute amounts of ASA reach-
ing the brain. Commonly, up to 300 mg/kg body weight of nanoparticles are injected
intravenously. Thus, theoretically 0.1-1.0 mg ASA must be bound per 300 mg nanopar-
ticle = 0.33-3.33 µg of ASA per mg nanoparticle. Taking the specific activity of ASA
into account (40 mU/µg), 13.3-133 mU of ASA must be bound per mg nanoparticle.
50 5 Results
The threshold value of 13.3 mU/mg nanoparticle was defined as minimal binding of
ASA necessary to allow for in vivo experiments.
The nanoparticles used here, were made of biodegradable polymers. Their size, varying
among batches, ranged between 75 and 350 nm in diameter. Different materials were
used for these particles exposing different chemical functional groups on their surfaces.
These groups determine the surface charge, defined as ‘zeta potential’, and may also be
used for chemical crosslinking. The nanoparticles used in this work and their physico-
chemical properties are listed in chapter 3.3. To avoid uptake by the MPS and to
achieve targeting to the brain, nanoparticles were surfactant coated prior to in vivo stud-
ies.
Basically, there are three strategies to use nanoparticles as drug carriers: (1) incorpora-
tion of the drug during nanoparticle production, (2) adsorption or (3) covalent or high
affinity binding of the drug on their surface. All of these methods were evaluated in the
course of this thesis with regard to their efficacy and capacity of binding active ASA,
the release of previously bound ASA (stability) and their capability to increase brain
delivery of ASA in vivo.
Before conducting experiments to bind ASA to nanoparticles, biotolerance studies of
these particles were performed. To that end surfactant coated empty nanoparticles were
injected into mice.
5.1.1 Biotolerance of PBCA-, PLA- und HSA-nanoparticles
In first experiments two mice received doses of 200 mg polysorbate 80 coated PBCA
nanoparticles per kg body weight. Treated mice showed severe side effects and abnor-
mal behavior and were euthanized after 5-10 min due to reasons of humanity. In a fol-
lowing experiment the injected doses were halved (100 mg/kg body weight). Three
mice received injections; all showed transient side effects such as reduced cage activity,
horrent fur, red eyes and efforts to clean their faces.
In contrast, mice that received poloxamer 188 coated PLA- (n=4) or polysorbate 80
coated HSA-nanoparticle (n=2) formulations at a dose of 300 and 100 mg/kg body
weight, respectively, showed no signs of adverse effects. This showed that in principle
doses of at least 100 mg/kg of all three tested nanoparticle materials are suited for in in
vivo studies.
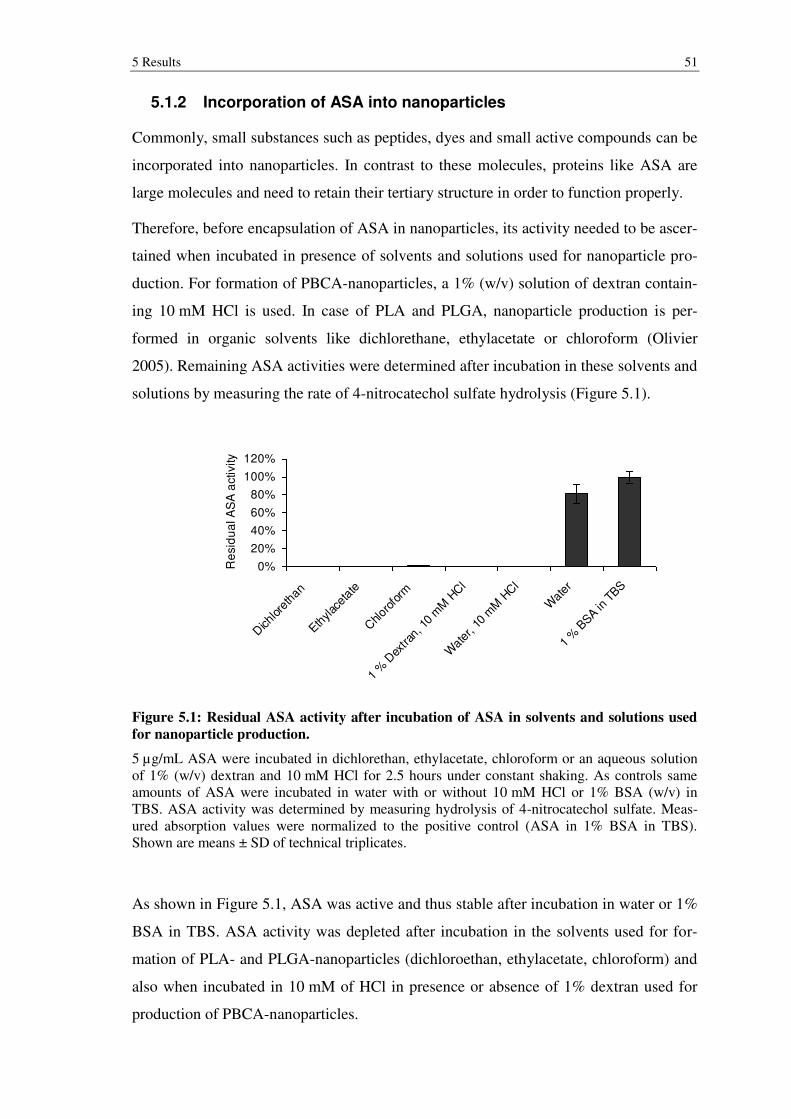
5 Results 51
5.1.2 Incorporation of ASA into nanoparticles
Commonly, small substances such as peptides, dyes and small active compounds can be
incorporated into nanoparticles. In contrast to these molecules, proteins like ASA are
large molecules and need to retain their tertiary structure in order to function properly.
Therefore, before encapsulation of ASA in nanoparticles, its activity needed to be ascer-
tained when incubated in presence of solvents and solutions used for nanoparticle pro-
duction. For formation of PBCA-nanoparticles, a 1% (w/v) solution of dextran contain-
ing 10 mM HCl is used. In case of PLA and PLGA, nanoparticle production is per-
formed in organic solvents like dichlorethane, ethylacetate or chloroform (Olivier
2005). Remaining ASA activities were determined after incubation in these solvents and
solutions by measuring the rate of 4-nitrocatechol sulfate hydrolysis (Figure 5.1).
Figure 5.1: Residual ASA activity after incubation of ASA in solvents and solutions used
for nanoparticle production.
5 µg/mL ASA were incubated in dichlorethan, ethylacetate, chloroform or an aqueous solution of 1% (w/v) dextran and 10 mM HCl for 2.5 hours under constant shaking. As controls same amounts of ASA were incubated in water with or without 10 mM HCl or 1% BSA (w/v) in TBS. ASA activity was determined by measuring hydrolysis of 4-nitrocatechol sulfate. Meas-ured absorption values were normalized to the positive control (ASA in 1% BSA in TBS). Shown are means ± SD of technical triplicates.
As shown in Figure 5.1, ASA was active and thus stable after incubation in water or 1%
BSA in TBS. ASA activity was depleted after incubation in the solvents used for for-
mation of PLA- and PLGA-nanoparticles (dichloroethan, ethylacetate, chloroform) and
also when incubated in 10 mM of HCl in presence or absence of 1% dextran used for
production of PBCA-nanoparticles.
0%
20%
40%
60%
80%
100%
120%
Dich
lore
than
Ethylac
etat
e
Chlor
ofor
m
1 %
Dex
tran,
10
mM
HCl
Wat
er, 1
0 m
M H
Cl
Wat
er
1 %
BSA in
TBS
Re
sid
ua
l A
SA
activity
52 5 Results
This result indicates that incorporation of ASA is not feasible under these conditions as
ASA activity is depleted in presence of the solvents and solutions present during nano-
particle production.
5.1.3 Adsorption of ASA to the surface of nanoparticles
As incorporation led to insufficient results considering loss of ASA activity, other
methods of binding had to be investigated. Unspecific adsorption of ASA to the surface
of the nanoparticles potentially avoids functional loss of ASA.
In first experiments ASA adsorption to PLA- and PBCA-nanoparticles was tested after
their coincubation for two hours in different buffers or water followed by surfactant
coating for another 30 minutes. Subsequently, nanoparticle suspensions were centri-
fuged and the pellet containing the nanoparticles was washed thrice. Then, the amount
of bound ASA was analyzed by ASA activity determinations as described before and by
immunoblot analysis.
In buffer (TBS or NaAc) no adsorption of ASA was observed to any of the nanoparti-
cles tested, independently from the pH (data not shown). In water, however, after ad-
justing the pH, ASA was found to adsorb to PLA-, but not to PBCA nanoparticles (Fig-
ure 5.2).
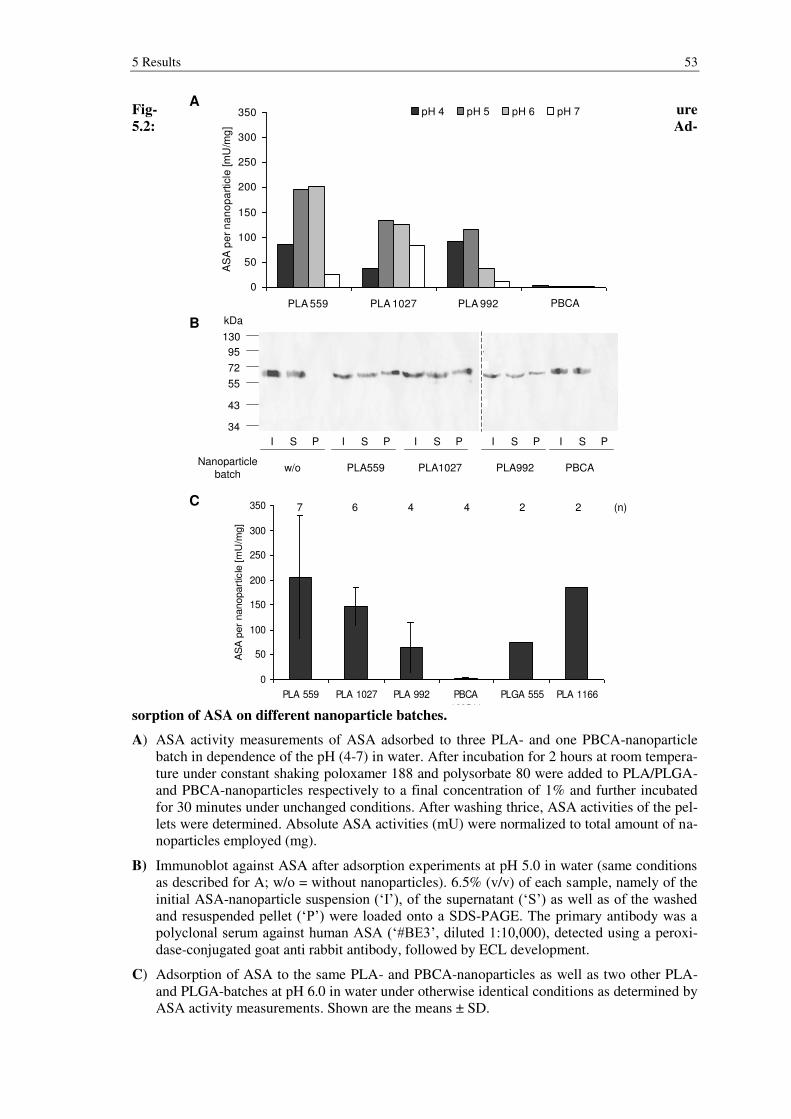
5 Results 53
Fig- ure
5.2: Ad-
sorption of ASA on different nanoparticle batches.
A) ASA activity measurements of ASA adsorbed to three PLA- and one PBCA-nanoparticle batch in dependence of the pH (4-7) in water. After incubation for 2 hours at room tempera-ture under constant shaking poloxamer 188 and polysorbate 80 were added to PLA/PLGA- and PBCA-nanoparticles respectively to a final concentration of 1% and further incubated for 30 minutes under unchanged conditions. After washing thrice, ASA activities of the pel-lets were determined. Absolute ASA activities (mU) were normalized to total amount of na-noparticles employed (mg).
B) Immunoblot against ASA after adsorption experiments at pH 5.0 in water (same conditions as described for A; w/o = without nanoparticles). 6.5% (v/v) of each sample, namely of the initial ASA-nanoparticle suspension (‘I’), of the supernatant (‘S’) as well as of the washed and resuspended pellet (‘P’) were loaded onto a SDS-PAGE. The primary antibody was a polyclonal serum against human ASA (‘#BE3’, diluted 1:10,000), detected using a peroxi-dase-conjugated goat anti rabbit antibody, followed by ECL development.
C) Adsorption of ASA to the same PLA- and PBCA-nanoparticles as well as two other PLA-and PLGA-batches at pH 6.0 in water under otherwise identical conditions as determined by ASA activity measurements. Shown are the means ± SD.
0
50
100
150
200
250
300
350
PLA 559 PLA 1027 PLA 992 PBCA
160511
PLGA 555 PLA 1166
AS
A p
er
nanopart
icle
[m
U/m
g]
44 26 27 (n)
0
50
100
150
200
250
300
350
PLA 559 PLA 1027 PLA 992 PBCA 160511
AS
A p
er
na
no
pa
rtic
le [m
U/m
g]
pH 4 pH 5 pH 6 pH 7A
72
55
43
34
130
95
kDa
w/oNanoparticle
batchPLA559 PLA1027 PLA992 PBCA
I S P I S P I S P I S P I S P
PBCA
B
C
54 5 Results
As Figure 5.2, A suggests, adsorption of ASA to PLA- and PLGA- nanoparticles is in-
fluenced by the pH. A maximum of 202 mU of active ASA per mg nanoparticle was
determined for PLA559 at pH 6.0. For PLA1027 maximal binding occurred at pH 5.0
and 6.0 (134 and 126 mU/mg nanoparticle, respectively). Lower adsorption yields were
found for PLA992 at pH 5.0 (116 mU/mg nanoparticle). Maximally 2.7 mU of active
ASA were adsorbed to one mg of PBCA nanoparticles at pH 4.0. These results were
further supported by immunoblot analysis against ASA in samples of adsorption exper-
iments conducted at pH 5.0 (Figure 5.2, B). Whereas bands attributed to ASA (molecu-
lar weight: 57 kDa) were detected in the resuspended pellets of PLA559, PLA1027 and
PLA992, no signal was observed in the correspondent sample of PBCA-nanoparticles,
nor the negative control (ASA without nanoparticles). This proves absence of ASA on
PBCA-nanoparticles, and negates presence of inactive ASA.
The results suggest that adsorption of ASA to nanoparticles is highest when incubated
in water at pH 5.0-6.0. In further adsorption experiments performed at pH 6.0 the high-
est adsorption yields were confirmed for PLA 559 with 205 mU/mg nanoparticle (n=7;
Figure 5.2, C). No significant difference between adsorption to PLA- or PLGA-
nanoparticles was observed, as one mg of PLA 992 or PLGA 555 both bound approxi-
mately 75 mU of ASA. Again, only 2.3 mU of ASA were adsorbed to PBCA nanoparti-
cles (n=4). Because of these low yields and their high toxicity observed in chapter 5.1.1,
PBCA nanoparticles were not used for subsequent studies.
An important factor for delivery of therapeutics adsorbed to nanoparticles in vivo is
their release in serum. Therefore, before in vivo studies were performed, ASA release
from nanoparticles was to be investigated in serum in vitro. Hence, ASA was adsorbed
to two different PLA-nanoparticle batches (#559, 1027) in water at pH 6.0 followed by
surfactant coating with poloxamer 188. Then nanoparticles were pelletized and resus-
pended in serum of ASA-/- mice and incubated for 0-60 min at 37°C. Bound ASA in the
pellet and released ASA in the supernatant were analyzed by ASA activity determina-
tions (Figure 5.3).
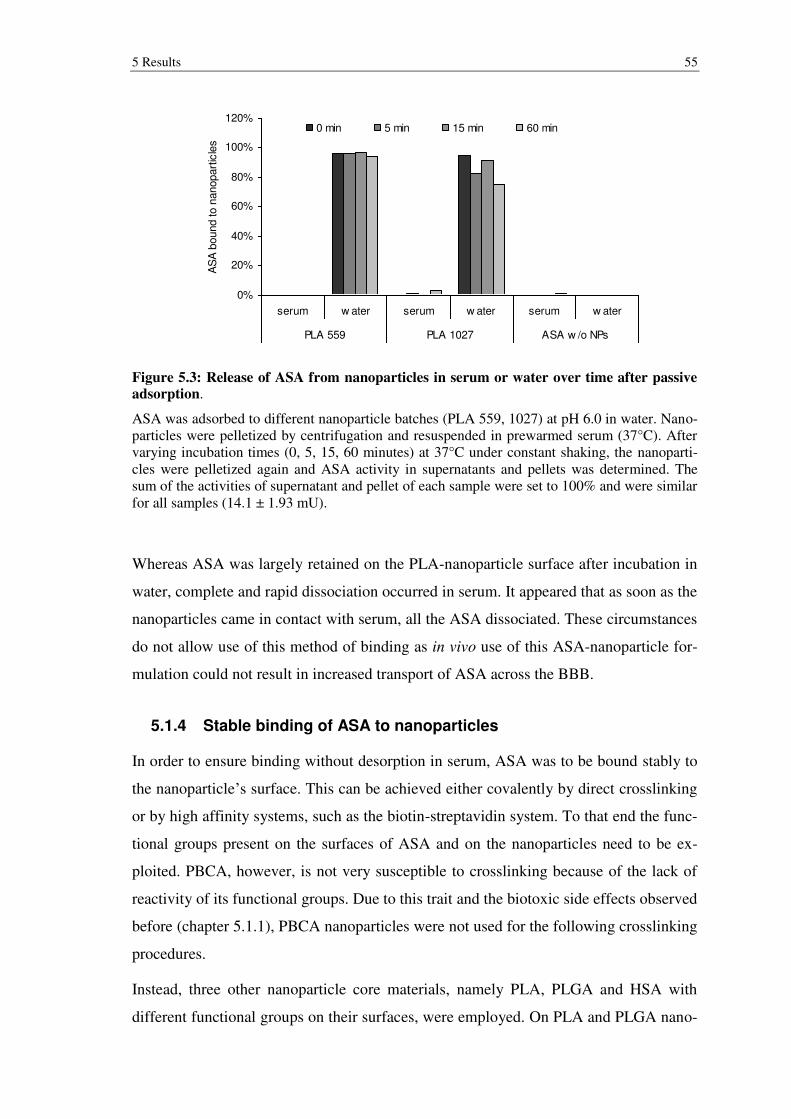
5 Results 55
Figure 5.3: Release of ASA from nanoparticles in serum or water over time after passive adsorption.
ASA was adsorbed to different nanoparticle batches (PLA 559, 1027) at pH 6.0 in water. Nano-particles were pelletized by centrifugation and resuspended in prewarmed serum (37°C). After varying incubation times (0, 5, 15, 60 minutes) at 37°C under constant shaking, the nanoparti-cles were pelletized again and ASA activity in supernatants and pellets was determined. The sum of the activities of supernatant and pellet of each sample were set to 100% and were similar for all samples (14.1 ± 1.93 mU).
Whereas ASA was largely retained on the PLA-nanoparticle surface after incubation in
water, complete and rapid dissociation occurred in serum. It appeared that as soon as the
nanoparticles came in contact with serum, all the ASA dissociated. These circumstances
do not allow use of this method of binding as in vivo use of this ASA-nanoparticle for-
mulation could not result in increased transport of ASA across the BBB.
5.1.4 Stable binding of ASA to nanoparticles
In order to ensure binding without desorption in serum, ASA was to be bound stably to
the nanoparticle’s surface. This can be achieved either covalently by direct crosslinking
or by high affinity systems, such as the biotin-streptavidin system. To that end the func-
tional groups present on the surfaces of ASA and on the nanoparticles need to be ex-
ploited. PBCA, however, is not very susceptible to crosslinking because of the lack of
reactivity of its functional groups. Due to this trait and the biotoxic side effects observed
before (chapter 5.1.1), PBCA nanoparticles were not used for the following crosslinking
procedures.
Instead, three other nanoparticle core materials, namely PLA, PLGA and HSA with
different functional groups on their surfaces, were employed. On PLA and PLGA nano-
0%
20%
40%
60%
80%
100%
120%
serum w ater serum w ater serum w ater
PLA 559 PLA 1027 ASA w /o NPs
AS
A b
ound to n
anopart
icle
s
0 min 5 min 15 min 60 min
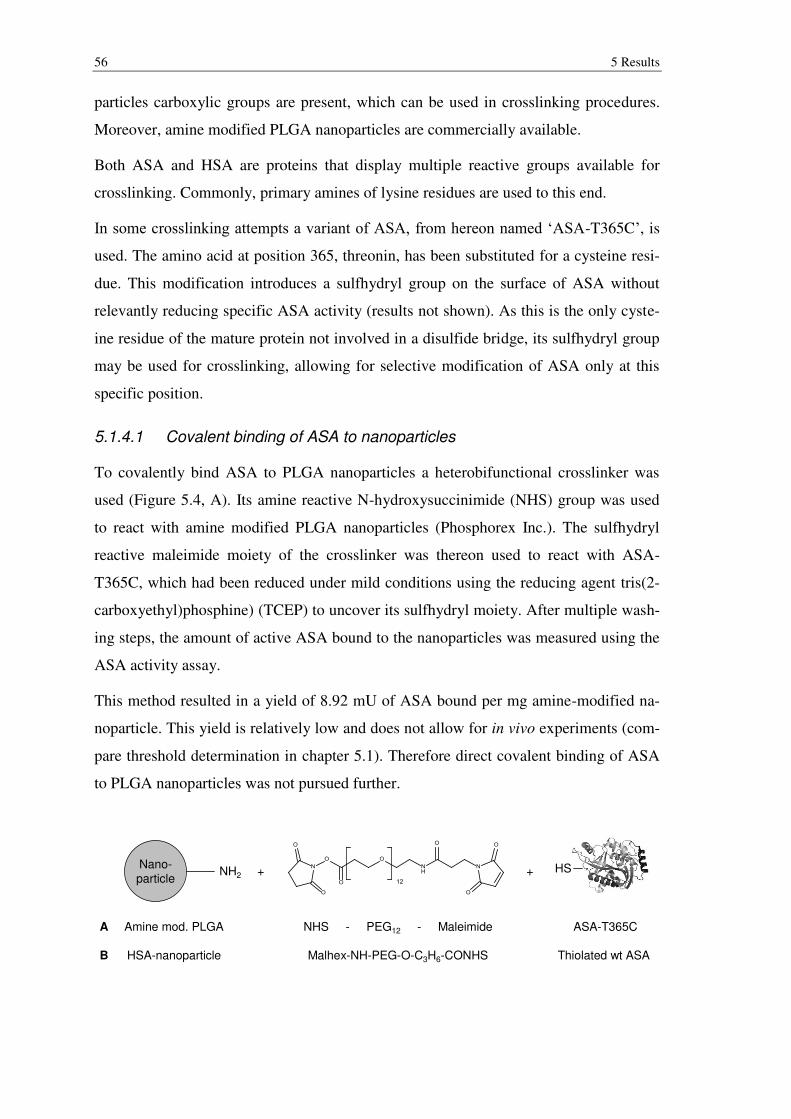
56 5 Results
particles carboxylic groups are present, which can be used in crosslinking procedures.
Moreover, amine modified PLGA nanoparticles are commercially available.
Both ASA and HSA are proteins that display multiple reactive groups available for
crosslinking. Commonly, primary amines of lysine residues are used to this end.
In some crosslinking attempts a variant of ASA, from hereon named ‘ASA-T365C’, is
used. The amino acid at position 365, threonin, has been substituted for a cysteine resi-
due. This modification introduces a sulfhydryl group on the surface of ASA without
relevantly reducing specific ASA activity (results not shown). As this is the only cyste-
ine residue of the mature protein not involved in a disulfide bridge, its sulfhydryl group
may be used for crosslinking, allowing for selective modification of ASA only at this
specific position.
5.1.4.1 Covalent binding of ASA to nanoparticles
To covalently bind ASA to PLGA nanoparticles a heterobifunctional crosslinker was
used (Figure 5.4, A). Its amine reactive N-hydroxysuccinimide (NHS) group was used
to react with amine modified PLGA nanoparticles (Phosphorex Inc.). The sulfhydryl
reactive maleimide moiety of the crosslinker was thereon used to react with ASA-
T365C, which had been reduced under mild conditions using the reducing agent tris(2-
carboxyethyl)phosphine) (TCEP) to uncover its sulfhydryl moiety. After multiple wash-
ing steps, the amount of active ASA bound to the nanoparticles was measured using the
ASA activity assay.
This method resulted in a yield of 8.92 mU of ASA bound per mg amine-modified na-
noparticle. This yield is relatively low and does not allow for in vivo experiments (com-
pare threshold determination in chapter 5.1). Therefore direct covalent binding of ASA
to PLGA nanoparticles was not pursued further.
Nano-particle
NH2 +
NHS - PEG12 - Maleimide
Malhex-NH-PEG-O-C3H6-CONHS
HS+
ASA-T365C
Thiolated wt ASA
Amine mod. PLGA
HSA-nanoparticle
A
B
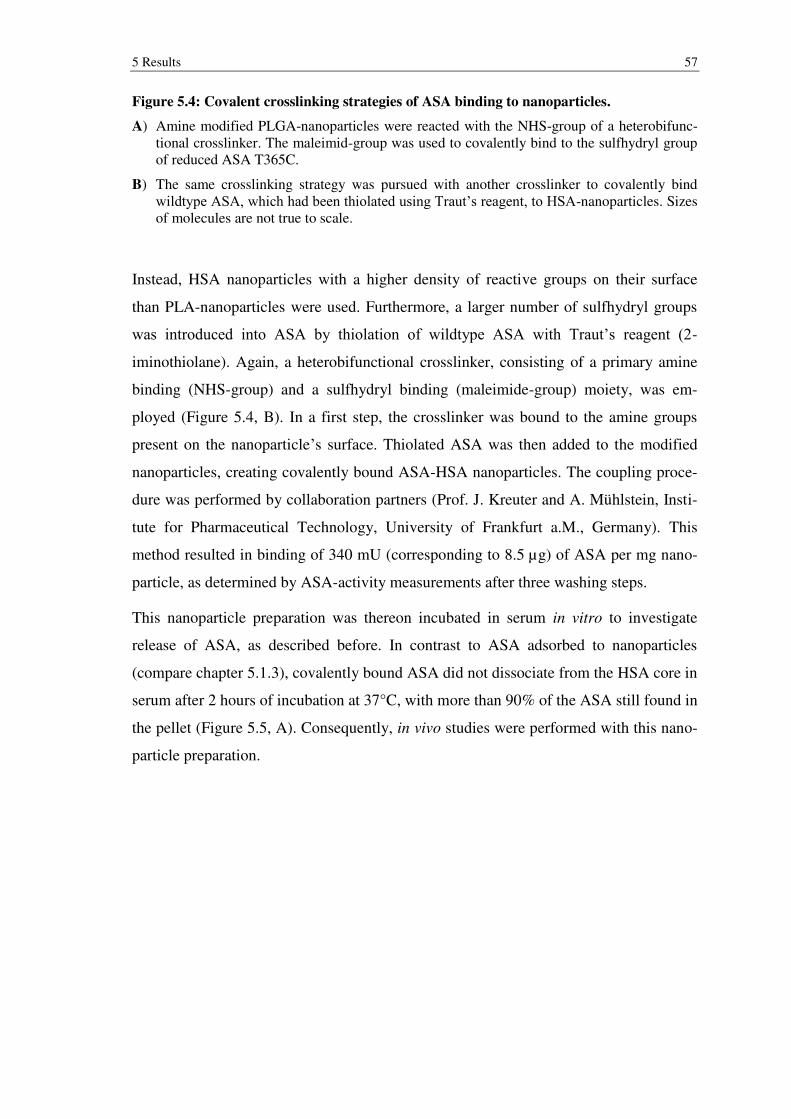
5 Results 57
Figure 5.4: Covalent crosslinking strategies of ASA binding to nanoparticles.
A) Amine modified PLGA-nanoparticles were reacted with the NHS-group of a heterobifunc-tional crosslinker. The maleimid-group was used to covalently bind to the sulfhydryl group of reduced ASA T365C.
B) The same crosslinking strategy was pursued with another crosslinker to covalently bind wildtype ASA, which had been thiolated using Traut’s reagent, to HSA-nanoparticles. Sizes of molecules are not true to scale.
Instead, HSA nanoparticles with a higher density of reactive groups on their surface
than PLA-nanoparticles were used. Furthermore, a larger number of sulfhydryl groups
was introduced into ASA by thiolation of wildtype ASA with Traut’s reagent (2-
iminothiolane). Again, a heterobifunctional crosslinker, consisting of a primary amine
binding (NHS-group) and a sulfhydryl binding (maleimide-group) moiety, was em-
ployed (Figure 5.4, B). In a first step, the crosslinker was bound to the amine groups
present on the nanoparticle’s surface. Thiolated ASA was then added to the modified
nanoparticles, creating covalently bound ASA-HSA nanoparticles. The coupling proce-
dure was performed by collaboration partners (Prof. J. Kreuter and A. Mühlstein, Insti-
tute for Pharmaceutical Technology, University of Frankfurt a.M., Germany). This
method resulted in binding of 340 mU (corresponding to 8.5 µg) of ASA per mg nano-
particle, as determined by ASA-activity measurements after three washing steps.
This nanoparticle preparation was thereon incubated in serum in vitro to investigate
release of ASA, as described before. In contrast to ASA adsorbed to nanoparticles
(compare chapter 5.1.3), covalently bound ASA did not dissociate from the HSA core in
serum after 2 hours of incubation at 37°C, with more than 90% of the ASA still found in
the pellet (Figure 5.5, A). Consequently, in vivo studies were performed with this nano-
particle preparation.
58 5 Results
To analyze whether nanoparticle-bound ASA is delivered more efficiently to the brain,
three mice each received tail vein injections of the ASA-HSA-nanoparticle preparation
or same amounts of non-nanoparticle bound (free) ASA as control. After two hours,
mice were sacrificed and dissected. ASA concentrations in tissue homogenates were
determined using a highly sensitive ASA-ELISA protocol (Matzner et al. 2000).
Figure 5.5: In vitro and in vivo studies of ASA covalently bound to HSA nanoparticles.
The NHS group of a heterobifunctional crosslinker was used to react with amine groups present on the HSA-nanoparticle surface. The maleimide moiety of the same crosslinker was thereon used to covalently bind thiolated ASA. 340 mU of ASA were bound per mg HSA-nanoparticle.
A) ASA release from nanoparticles after incubation for two hours in serum or water. As control, non-nanoparticle-bound ASA was used. The experiment was conducted as described for Figure 5.3.
B) Biodistribution of ASA two hours after injection of free ASA or nanoparticle bound ASA in ASA-/- mice as determined by ASA-ELISA in tissue homogenates. HSA-ASA nanoparticles were surfactant coated with polysorbate 80 prior to tail vein injections of 100 mg of the nanoparticle formulation (corresponding to 34 U of ASA) per kg body weight in ASA knockout mice. As control, unmodified, non-nanoparticle bound ASA of same dose was injected. After two hours, mice were sacrificed and dissected. ASA concentrations in tissue homogenates were determined by ASA-ELISA. ASA tissue concentrations were normalized to soluble protein of tissue homogenates as measured by Biorad DC-assay. Bars represent means ± SD of three mice per group. Statistical significances of differences (p < 0.05) were determined by students t-test and are indicated by an asterisk (‘*’). Sp. cord = spinal cord; N. isch. = ischiadic nerve; Pl. brach. = brachial plexus.
A difference in the overall biodistribution of nanoparticle bound ASA to free ASA is
apparent (Figure 5.5, B). A significant reduction of ASA levels in spleen, kidney and
liver and an increase in brachial plexus were observed in comparison to the control (p-
values of 0.0024, 0.0007, 0.0020, 0.0003 respectively). No significant difference of
ASA levels in the brain was measured. Thus it has to be concluded that this HSA nano-
particle preparation failed to increase brain delivery.
0%
20%
40%
60%
80%
100%
120%
se
rum
wa
ter
se
rum
wa
ter
HSA-NPs ASA w/o
NPs
AS
A b
ou
nd
to
na
no
pa
rtic
les
0
20
40
60
80
100
120
140
160
180
200
Liver Spleen Kidney Lungs Brain Sp.
cord
N. isch Pl.
brach.
AS
A p
er
tota
l p
rote
in [n
g/m
g]
ASA-HSA-nanoparticles ASA w/o nanoparticlesA B
0.00
0.01
0.02
0.03
0.04
Brain
*
*
* *
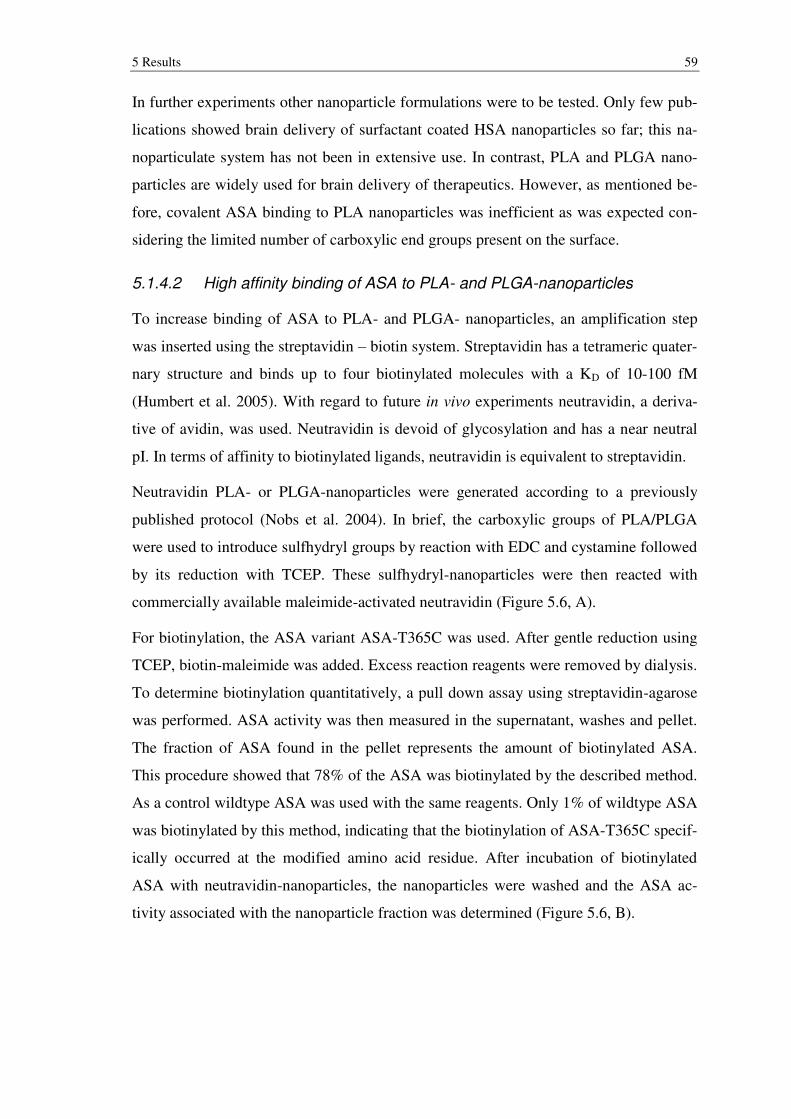
5 Results 59
In further experiments other nanoparticle formulations were to be tested. Only few pub-
lications showed brain delivery of surfactant coated HSA nanoparticles so far; this na-
noparticulate system has not been in extensive use. In contrast, PLA and PLGA nano-
particles are widely used for brain delivery of therapeutics. However, as mentioned be-
fore, covalent ASA binding to PLA nanoparticles was inefficient as was expected con-
sidering the limited number of carboxylic end groups present on the surface.
5.1.4.2 High affinity binding of ASA to PLA- and PLGA-nanoparticles
To increase binding of ASA to PLA- and PLGA- nanoparticles, an amplification step
was inserted using the streptavidin – biotin system. Streptavidin has a tetrameric quater-
nary structure and binds up to four biotinylated molecules with a KD of 10-100 fM
(Humbert et al. 2005). With regard to future in vivo experiments neutravidin, a deriva-
tive of avidin, was used. Neutravidin is devoid of glycosylation and has a near neutral
pI. In terms of affinity to biotinylated ligands, neutravidin is equivalent to streptavidin.
Neutravidin PLA- or PLGA-nanoparticles were generated according to a previously
published protocol (Nobs et al. 2004). In brief, the carboxylic groups of PLA/PLGA
were used to introduce sulfhydryl groups by reaction with EDC and cystamine followed
by its reduction with TCEP. These sulfhydryl-nanoparticles were then reacted with
commercially available maleimide-activated neutravidin (Figure 5.6, A).
For biotinylation, the ASA variant ASA-T365C was used. After gentle reduction using
TCEP, biotin-maleimide was added. Excess reaction reagents were removed by dialysis.
To determine biotinylation quantitatively, a pull down assay using streptavidin-agarose
was performed. ASA activity was then measured in the supernatant, washes and pellet.
The fraction of ASA found in the pellet represents the amount of biotinylated ASA.
This procedure showed that 78% of the ASA was biotinylated by the described method.
As a control wildtype ASA was used with the same reagents. Only 1% of wildtype ASA
was biotinylated by this method, indicating that the biotinylation of ASA-T365C specif-
ically occurred at the modified amino acid residue. After incubation of biotinylated
ASA with neutravidin-nanoparticles, the nanoparticles were washed and the ASA ac-
tivity associated with the nanoparticle fraction was determined (Figure 5.6, B).
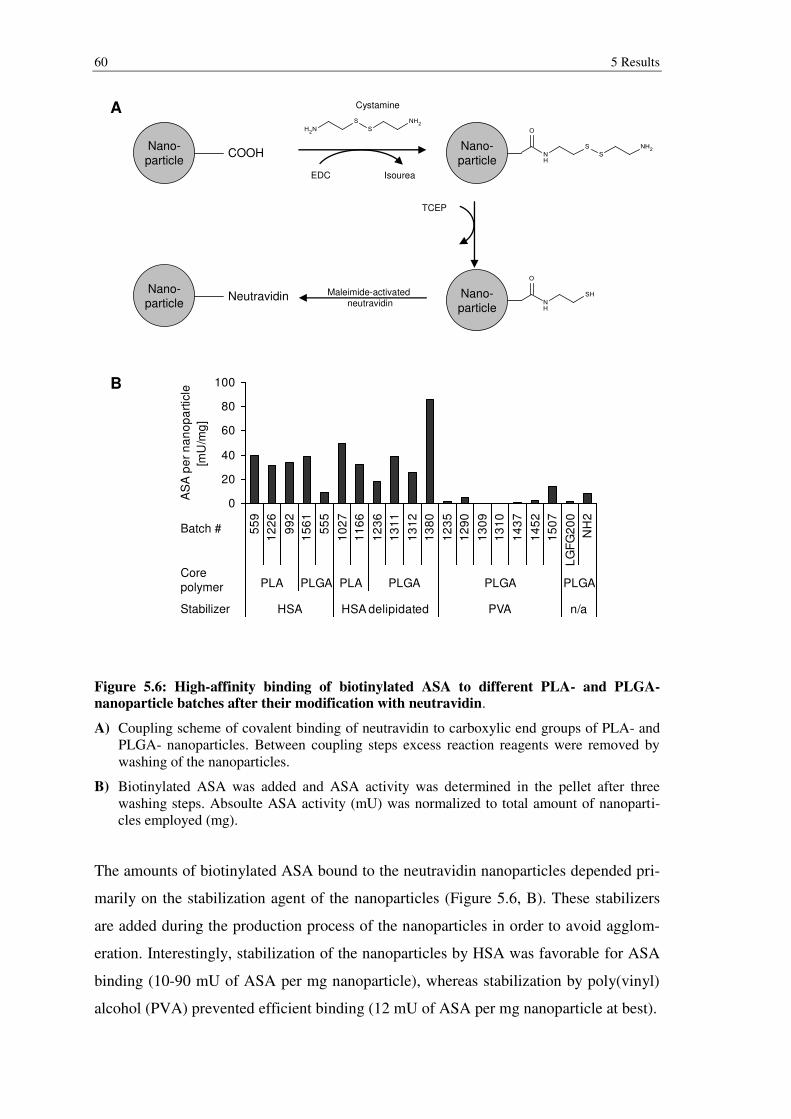
60 5 Results
Figure 5.6: High-affinity binding of biotinylated ASA to different PLA- and PLGA-nanoparticle batches after their modification with neutravidin.
A) Coupling scheme of covalent binding of neutravidin to carboxylic end groups of PLA- and PLGA- nanoparticles. Between coupling steps excess reaction reagents were removed by washing of the nanoparticles.
B) Biotinylated ASA was added and ASA activity was determined in the pellet after three washing steps. Absoulte ASA activity (mU) was normalized to total amount of nanoparti-cles employed (mg).
The amounts of biotinylated ASA bound to the neutravidin nanoparticles depended pri-
marily on the stabilization agent of the nanoparticles (Figure 5.6, B). These stabilizers
are added during the production process of the nanoparticles in order to avoid agglom-
eration. Interestingly, stabilization of the nanoparticles by HSA was favorable for ASA
binding (10-90 mU of ASA per mg nanoparticle), whereas stabilization by poly(vinyl)
alcohol (PVA) prevented efficient binding (12 mU of ASA per mg nanoparticle at best).
0
20
40
60
80
100
55
9
12
26
99
2
15
61
55
5
10
27
11
66
12
36
13
11
13
12
13
80
12
35
12
90
13
09
13
10
14
37
14
52
15
07
LG
FG
20
0
NH
2PLA PLGA PLA PLGA PLGA PLGA
HSA HSA delipidated PVA n/a
AS
A p
er
na
no
pa
rtic
le
[mU
/mg
]
Stabilizer
Corepolymer
Batch #
Nano-
particleCOOH
EDC
Cystamine
Isourea
Nano-
particle
TCEP
Nano-particle
Maleimide-activatedneutravidin
Nano-particle
Neutravidin
A
B
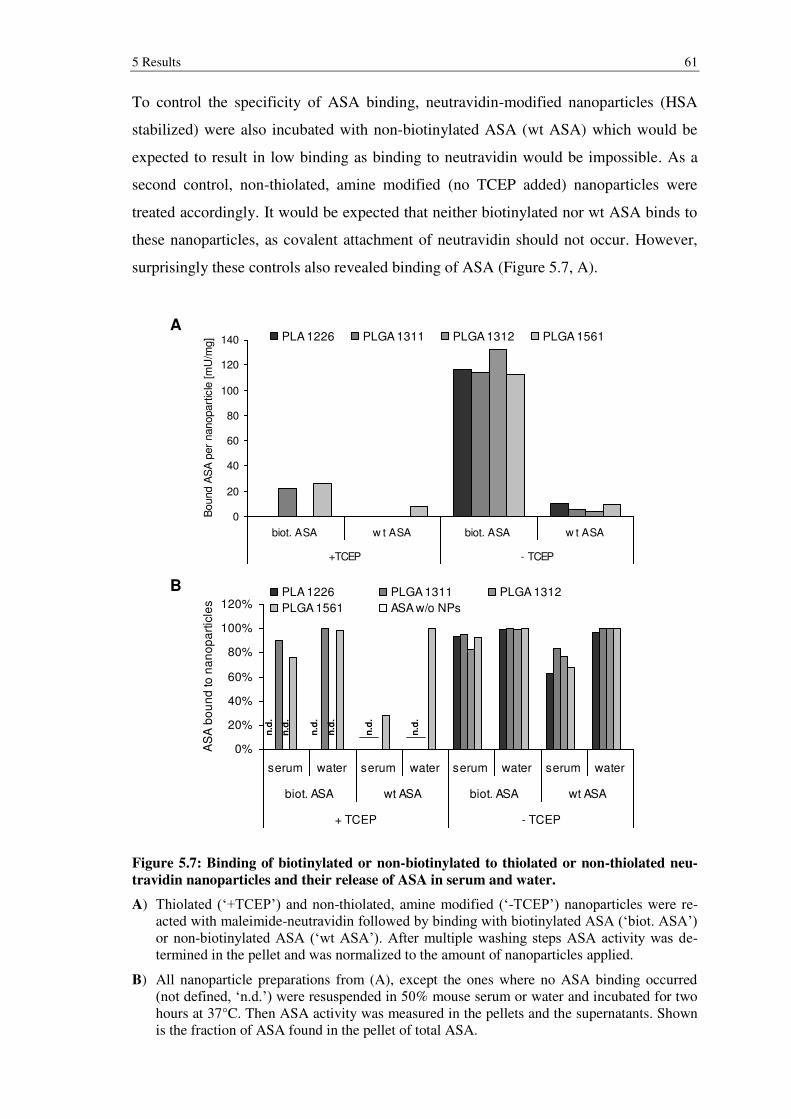
5 Results 61
To control the specificity of ASA binding, neutravidin-modified nanoparticles (HSA
stabilized) were also incubated with non-biotinylated ASA (wt ASA) which would be
expected to result in low binding as binding to neutravidin would be impossible. As a
second control, non-thiolated, amine modified (no TCEP added) nanoparticles were
treated accordingly. It would be expected that neither biotinylated nor wt ASA binds to
these nanoparticles, as covalent attachment of neutravidin should not occur. However,
surprisingly these controls also revealed binding of ASA (Figure 5.7, A).
Figure 5.7: Binding of biotinylated or non-biotinylated to thiolated or non-thiolated neu-
travidin nanoparticles and their release of ASA in serum and water.
A) Thiolated (‘+TCEP’) and non-thiolated, amine modified (‘-TCEP’) nanoparticles were re-acted with maleimide-neutravidin followed by binding with biotinylated ASA (‘biot. ASA’) or non-biotinylated ASA (‘wt ASA’). After multiple washing steps ASA activity was de-termined in the pellet and was normalized to the amount of nanoparticles applied.
B) All nanoparticle preparations from (A), except the ones where no ASA binding occurred (not defined, ‘n.d.’) were resuspended in 50% mouse serum or water and incubated for two hours at 37°C. Then ASA activity was measured in the pellets and the supernatants. Shown is the fraction of ASA found in the pellet of total ASA.
0%
20%
40%
60%
80%
100%
120%
serum water serum water serum water serum water
biot. ASA wt ASA biot. ASA wt ASA
+ TCEP - TCEP
AS
A b
ou
nd
to
na
no
pa
rtic
les
PLA 1226 PLGA 1311 PLGA 1312
PLGA 1561 ASA w/o NPs
0
20
40
60
80
100
120
140
biot. ASA w t ASA biot. ASA w t ASA
+TCEP - TCEP
Bound A
SA
per
nanopart
icle
[m
U/m
g] PLA 1226 PLGA 1311 PLGA 1312 PLGA 1561
A
B
n.d
.
n.d
.
n.d
.
n.d
.
n.d
.
n.d
.
62 5 Results
In general, binding of both biotinylated and wt ASA to non-thiolated, amine modified
nanoparticles (-TCEP) was significantly greater in comparison to binding of
biotinylated and wt ASA to thiolated nanoparticles (+TCEP). In both cases significantly
more biotinylated ASA than wt ASA was bound. Overall, best binding occurred when
using non-thiolated, amine modified nanoparticles and biotinylated ASA (average of
110 mU/mg for all tested nanoparticle batches).
One explanation for increased binding of biotinylated ASA to non-thiolated nanoparti-
cles may be unspecific binding. Reaction with cystamine and thiolation influence the
physicochemical properties of the nanoparticle’s surface, therefore possibly enhancing
unspecific adsorption. To test this, desorption experiments were conducted in vitro, as
described before. The nanoparticles were centrifuged and resuspended in 50% serum or
water. After two hours the activity of ASA in pellets and supernatants was determined
by ASA-activity measurements (Figure 5.7, B).
As would be expected for high-affinity binding, desorption of biotinylated ASA from
neutravidin-modified, thiolated nanoparticles was low (10-25%). In contrast 70% of wt
ASA bound to the same nanoparticle preparation were released, indicating that binding
was non-specific. Surprisingly, only 5-18% of biotinylated ASA bound to non-thiolated,
amine modified neutravidin-nanoparticles was released into the supernatant, indicating
stable, high-affinity binding. Binding of wt ASA to the same nanoparticle preparations
was also relatively stable in serum, as only up to 40% of the initially bound ASA was
found in the supernatant.
In summary, two effects contradicting the crosslinking procedure hypothesis were not-
ed. First of all, binding of biotinylated ASA was significantly higher when HSA-
stabilized nanoparticles were used instead of PVA stabilized nanoparticles (Figure 5.6).
This effect may be explained by covalent binding to HSA instead of binding to the car-
boxylic end groups of the PLA- or PLGA-polymers. HSA may either be adsorbed to the
nanoparticles or (partly) incorporated in their matrix. As virtually no release of biotinyl-
ated ASA was observed in serum (Figure 5.7, A), binding of HSA to the nanoparticles
must be irreversible under these conditions. Secondly, binding of biotinylated ASA was
profoundly increased when the reduction step using TCEP to create thiolated nanoparti-
cles was omitted (Figure 5.7, A). This means that binding was increased when the num-
ber of amine groups available on the nanoparticles surface was increased. This effect
may be explained by covalent binding via amine groups. Indeed, maleimide is also able
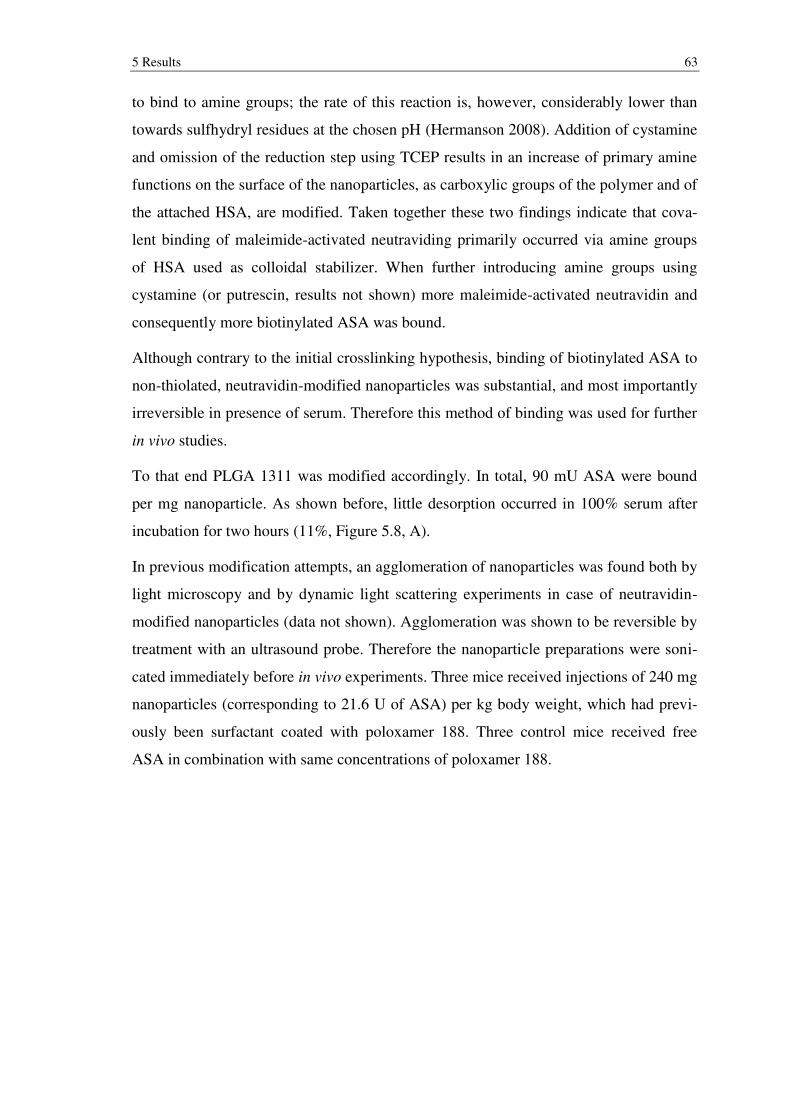
5 Results 63
to bind to amine groups; the rate of this reaction is, however, considerably lower than
towards sulfhydryl residues at the chosen pH (Hermanson 2008). Addition of cystamine
and omission of the reduction step using TCEP results in an increase of primary amine
functions on the surface of the nanoparticles, as carboxylic groups of the polymer and of
the attached HSA, are modified. Taken together these two findings indicate that cova-
lent binding of maleimide-activated neutraviding primarily occurred via amine groups
of HSA used as colloidal stabilizer. When further introducing amine groups using
cystamine (or putrescin, results not shown) more maleimide-activated neutravidin and
consequently more biotinylated ASA was bound.
Although contrary to the initial crosslinking hypothesis, binding of biotinylated ASA to
non-thiolated, neutravidin-modified nanoparticles was substantial, and most importantly
irreversible in presence of serum. Therefore this method of binding was used for further
in vivo studies.
To that end PLGA 1311 was modified accordingly. In total, 90 mU ASA were bound
per mg nanoparticle. As shown before, little desorption occurred in 100% serum after
incubation for two hours (11%, Figure 5.8, A).
In previous modification attempts, an agglomeration of nanoparticles was found both by
light microscopy and by dynamic light scattering experiments in case of neutravidin-
modified nanoparticles (data not shown). Agglomeration was shown to be reversible by
treatment with an ultrasound probe. Therefore the nanoparticle preparations were soni-
cated immediately before in vivo experiments. Three mice received injections of 240 mg
nanoparticles (corresponding to 21.6 U of ASA) per kg body weight, which had previ-
ously been surfactant coated with poloxamer 188. Three control mice received free
ASA in combination with same concentrations of poloxamer 188.
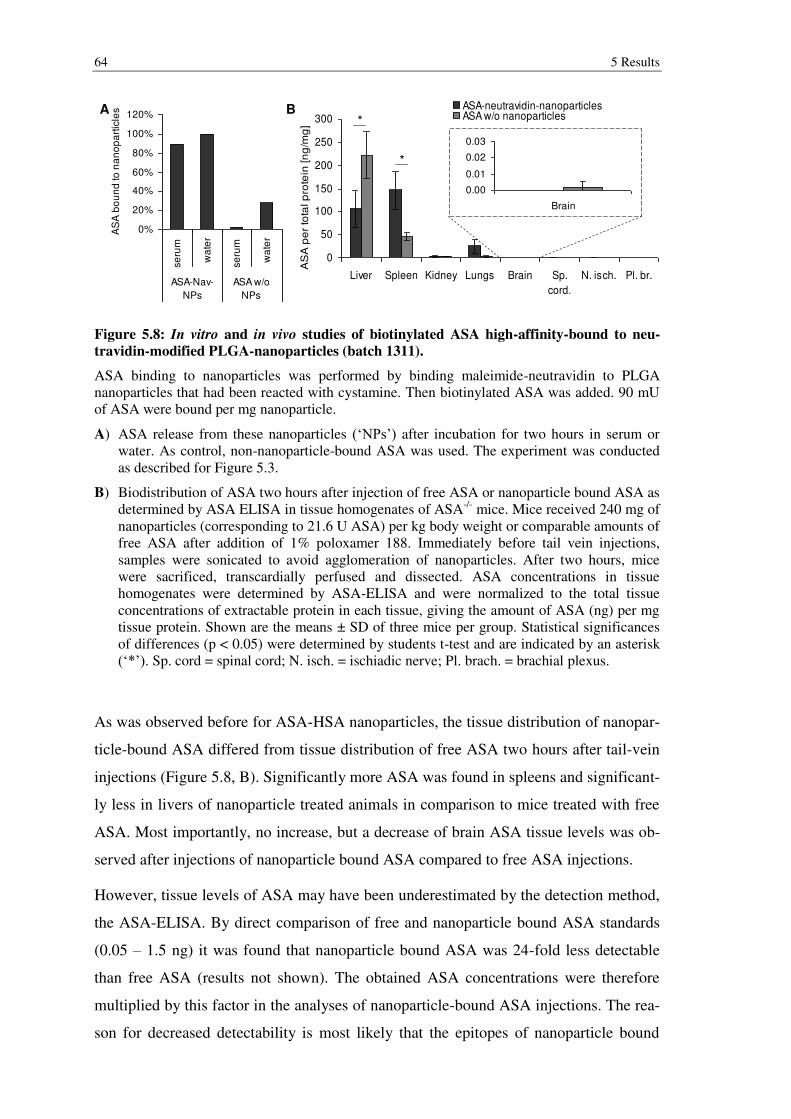
64 5 Results
Figure 5.8: In vitro and in vivo studies of biotinylated ASA high-affinity-bound to neu-
travidin-modified PLGA-nanoparticles (batch 1311).
ASA binding to nanoparticles was performed by binding maleimide-neutravidin to PLGA nanoparticles that had been reacted with cystamine. Then biotinylated ASA was added. 90 mU of ASA were bound per mg nanoparticle.
A) ASA release from these nanoparticles (‘NPs’) after incubation for two hours in serum or water. As control, non-nanoparticle-bound ASA was used. The experiment was conducted as described for Figure 5.3.
B) Biodistribution of ASA two hours after injection of free ASA or nanoparticle bound ASA as determined by ASA ELISA in tissue homogenates of ASA-/- mice. Mice received 240 mg of nanoparticles (corresponding to 21.6 U ASA) per kg body weight or comparable amounts of free ASA after addition of 1% poloxamer 188. Immediately before tail vein injections, samples were sonicated to avoid agglomeration of nanoparticles. After two hours, mice were sacrificed, transcardially perfused and dissected. ASA concentrations in tissue homogenates were determined by ASA-ELISA and were normalized to the total tissue concentrations of extractable protein in each tissue, giving the amount of ASA (ng) per mg tissue protein. Shown are the means ± SD of three mice per group. Statistical significances of differences (p < 0.05) were determined by students t-test and are indicated by an asterisk (‘*’). Sp. cord = spinal cord; N. isch. = ischiadic nerve; Pl. brach. = brachial plexus.
As was observed before for ASA-HSA nanoparticles, the tissue distribution of nanopar-
ticle-bound ASA differed from tissue distribution of free ASA two hours after tail-vein
injections (Figure 5.8, B). Significantly more ASA was found in spleens and significant-
ly less in livers of nanoparticle treated animals in comparison to mice treated with free
ASA. Most importantly, no increase, but a decrease of brain ASA tissue levels was ob-
served after injections of nanoparticle bound ASA compared to free ASA injections.
However, tissue levels of ASA may have been underestimated by the detection method,
the ASA-ELISA. By direct comparison of free and nanoparticle bound ASA standards
(0.05 – 1.5 ng) it was found that nanoparticle bound ASA was 24-fold less detectable
than free ASA (results not shown). The obtained ASA concentrations were therefore
multiplied by this factor in the analyses of nanoparticle-bound ASA injections. The rea-
son for decreased detectability is most likely that the epitopes of nanoparticle bound
0
50
100
150
200
250
300
Liver Spleen Kidney Lungs Brain Sp.
cord.
N. isch. Pl. br.
AS
A p
er
tota
l p
rote
in [n
g/m
g]
ASA-neutravidin-nanoparticlesASA w/o nanoparticles
0.00
0.01
0.02
0.03
Brain
0%
20%
40%
60%
80%
100%
120%
se
rum
wa
ter
se
rum
wa
ter
ASA-Nav-
NPs
ASA w/o
NPs
AS
A b
ou
nd
to
na
no
pa
rtic
lesA B
*
*
5 Results 65
ASA are shielded by its binding to nanoparticles, resulting in less antibody binding and
lower signal. However, the ASA tissue levels measured in the brain after injections of
free ASA were already at the detection limit, the ones measured after injections of na-
noparticle bound ASA even below the detection limit. This means that in comparison to
free ASA nanoparticle-bound ASA would have had to increase brain tissue levels 24-
fold in order to obtain measurable ASA concentrations. In other words, the conclusion
of this experiment must be that ASA brain delivery was either not increased or increase
was less than 24-fold and therefore not detectable.
In summary, none of the investigated nanoparticle preparations led to a detectable in-
crease of brain delivery of ASA. As can be seen in both in vivo studies, ASA was well
distributed in the peripheral tissues, without reaching the CNS in substantial amounts.
One explanation for this observation may be that nanoparticle mediated brain targeting
fails due to rapid clearance of the nanoparticles by peripheral cells. Therefore an effort
was made to reduce uptake of ASA and thus nanoparticle-bound ASA by peripheral
cells, possibly allowing for nanoparticle mediated brain targeting.
5.2 Increasing blood circulation times by shielding the M6P residues of ASA
The M6P residues of ASA are recognized by MPRs present on the cell surfaces of pe-
ripheral cells. Despite binding to nanoparticles and surfactant coating, M6P residues of
nanoparticle bound ASA are likely to be bound by MPRs as well. Therefore ways to
inhibit uptake by peripheral cells were investigated.
To that aim, a physical shielding of the M6P residues of ASA was attempted. The work-
ing hypothesis was that a polypeptide consisting of the M6P binding domain 9 of the
MPR300 binds the M6P residues of ASA, thereby preventing recognition of the latter
by endogenous MPRs on the cell surfaces of peripheral cells. During the process of
transcytosis at the endothelial cells of the BBB (e.g. mediated by the nanoparticle –
apolipoprotein system), the pH drops to pH 5.5 in late endosomes. Under these condi-
tions the receptor fragment should release ASA. Unmodified, free ASA may thus be
delivered to the brain, where M6P mediated endocytosis by brain cells could occur.
To test this hypothesis, the M6P binding domain 9 (‘MPR300 dom9’) of the human
MPR300 was cloned, expressed in a Pichia pastoris expression system and purified by
affinity purification. To prove its ability to bind M6P bearing ASA, KD determinations
66 5 Results
were performed. Furthermore, the release of ASA from the receptor fragment in de-
pendence of the pH was analyzed. In first in vitro experiments the endocytosis of recep-
tor fragment bound ASA was analyzed in mouse embryonic fibroblasts (MEFs).
5.2.1 Cloning, protein expression and characterization of
‘MPR300 dom9’
In brief, the coding sequence of the domain 9 (dom 9) of the human MPR300 receptor
was cloned into a Pichia pastoris expression vector, pPICZαB. In total, four different
vector constructs were cloned encoding for four different protein constructs, followed
by their expression and secretion in P. pastoris. Proteins were purified by affinity chro-
matography exploiting their His6-tags. The first, named ‘wildtype’ (wt), has the same
amino acid sequence as the domain 9 of the human MPR300, including its two (poten-
tial) N-glycosylation sites. The remaining three protein constructs, generated by in vitro
mutagenesis, carry an amino-acid substitution (asparagine to glutamine) at either one of
these glycosylation sites (‘N28Q’ and ‘N94Q’) or at both (‘N28Q & N94Q’). Primarily,
the aim was to generate a non-glycosylated protein construct to avoid immunogenic
complications possibly triggered by the yeast specific N-glycans in case of in vivo stud-
ies. However, as these oligosaccharide side chains may affect the functionality of the
protein, each N-glycosylation site had been mutated independently and possible effects
on stability and ASA binding were evaluated.
To investigate glycosylation, all of the described proteins were analyzed by Endo Hf
digest. This endoglycosidase cleaves off N-bound oligosaccharides of the high mannose
type. Deglycosylation results in a size shift, which was monitored by SDS-PAGE and
subsequent Coomassie-staining (Figure 5.9).
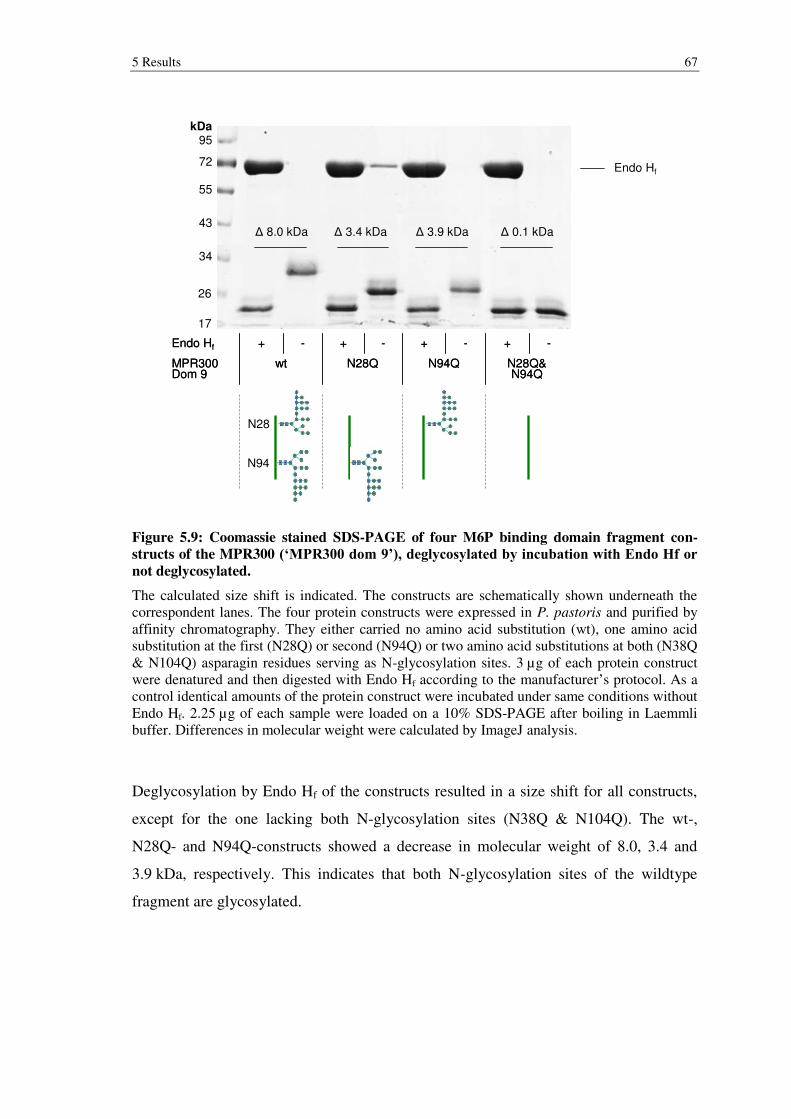
5 Results 67
Figure 5.9: Coomassie stained SDS-PAGE of four M6P binding domain fragment con-
structs of the MPR300 (‘MPR300 dom 9’), deglycosylated by incubation with Endo Hf or not deglycosylated.
The calculated size shift is indicated. The constructs are schematically shown underneath the correspondent lanes. The four protein constructs were expressed in P. pastoris and purified by affinity chromatography. They either carried no amino acid substitution (wt), one amino acid substitution at the first (N28Q) or second (N94Q) or two amino acid substitutions at both (N38Q & N104Q) asparagin residues serving as N-glycosylation sites. 3 µg of each protein construct were denatured and then digested with Endo Hf according to the manufacturer’s protocol. As a control identical amounts of the protein construct were incubated under same conditions without Endo Hf. 2.25 µg of each sample were loaded on a 10% SDS-PAGE after boiling in Laemmli buffer. Differences in molecular weight were calculated by ImageJ analysis.
Deglycosylation by Endo Hf of the constructs resulted in a size shift for all constructs,
except for the one lacking both N-glycosylation sites (N38Q & N104Q). The wt-,
N28Q- and N94Q-constructs showed a decrease in molecular weight of 8.0, 3.4 and
3.9 kDa, respectively. This indicates that both N-glycosylation sites of the wildtype
fragment are glycosylated.
17
26
34
43
55
72
95
N28Q&N94Q
+-
N94Q
+-
N28QwtMPR300Dom 9
-+-+Endo Hf
N28Q&N94Q
+-
N94Q
+-
N28QwtMPR300Dom 9
-+-+Endo Hf
kDa
Endo Hf
Δ 8.0 kDa Δ 3.4 kDa Δ 3.9 kDa Δ 0.1 kDa
N28
N94
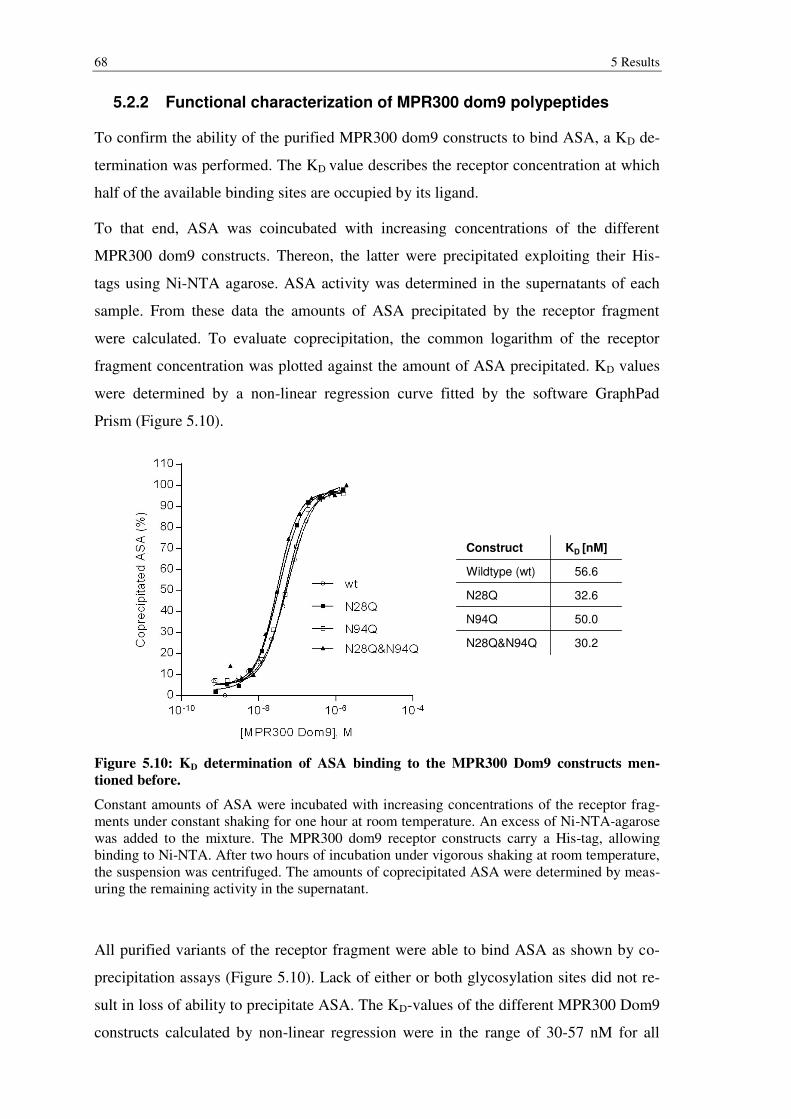
68 5 Results
5.2.2 Functional characterization of MPR300 dom9 polypeptides
To confirm the ability of the purified MPR300 dom9 constructs to bind ASA, a KD de-
termination was performed. The KD value describes the receptor concentration at which
half of the available binding sites are occupied by its ligand.
To that end, ASA was coincubated with increasing concentrations of the different
MPR300 dom9 constructs. Thereon, the latter were precipitated exploiting their His-
tags using Ni-NTA agarose. ASA activity was determined in the supernatants of each
sample. From these data the amounts of ASA precipitated by the receptor fragment
were calculated. To evaluate coprecipitation, the common logarithm of the receptor
fragment concentration was plotted against the amount of ASA precipitated. KD values
were determined by a non-linear regression curve fitted by the software GraphPad
Prism (Figure 5.10).
Figure 5.10: KD determination of ASA binding to the MPR300 Dom9 constructs men-
tioned before.
Constant amounts of ASA were incubated with increasing concentrations of the receptor frag-ments under constant shaking for one hour at room temperature. An excess of Ni-NTA-agarose was added to the mixture. The MPR300 dom9 receptor constructs carry a His-tag, allowing binding to Ni-NTA. After two hours of incubation under vigorous shaking at room temperature, the suspension was centrifuged. The amounts of coprecipitated ASA were determined by meas-uring the remaining activity in the supernatant.
All purified variants of the receptor fragment were able to bind ASA as shown by co-
precipitation assays (Figure 5.10). Lack of either or both glycosylation sites did not re-
sult in loss of ability to precipitate ASA. The KD-values of the different MPR300 Dom9
constructs calculated by non-linear regression were in the range of 30-57 nM for all
30.2N28Q&N94Q
50.0N94Q
32.6N28Q
56.6Wildtype (wt)
KD [nM]Construct
30.2N28Q&N94Q
50.0N94Q
32.6N28Q
56.6Wildtype (wt)
KD [nM]Construct
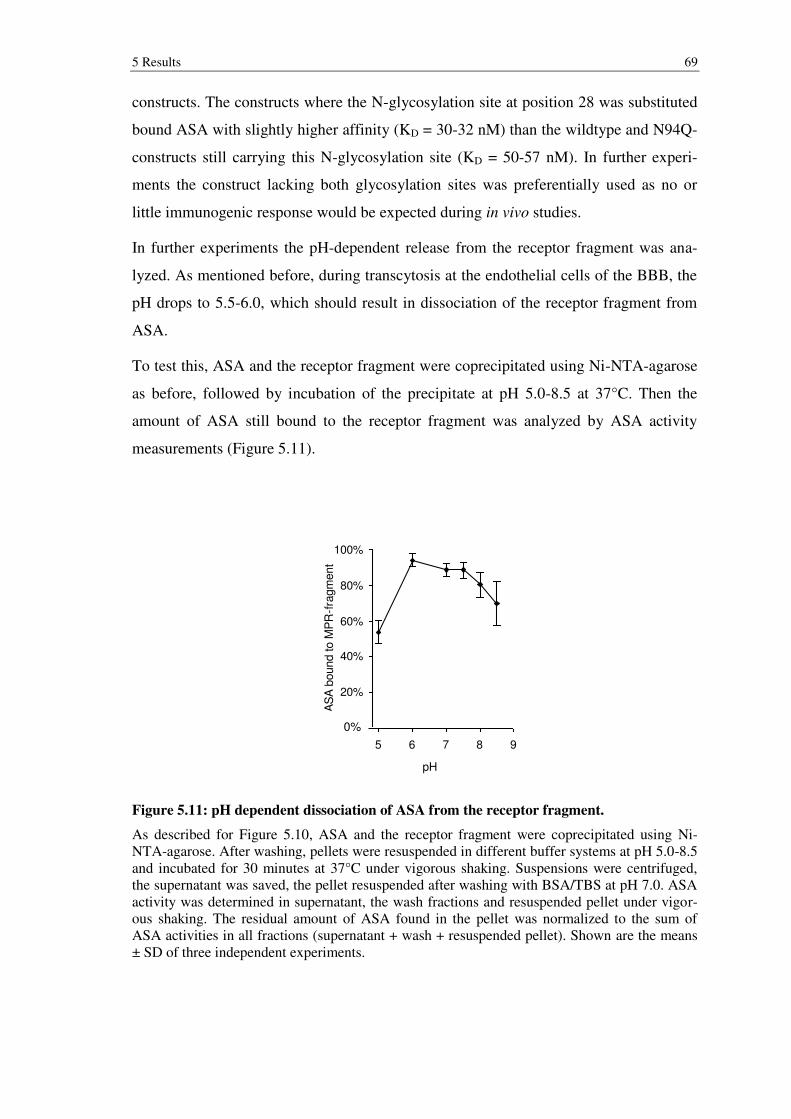
5 Results 69
constructs. The constructs where the N-glycosylation site at position 28 was substituted
bound ASA with slightly higher affinity (KD = 30-32 nM) than the wildtype and N94Q-
constructs still carrying this N-glycosylation site (KD = 50-57 nM). In further experi-
ments the construct lacking both glycosylation sites was preferentially used as no or
little immunogenic response would be expected during in vivo studies.
In further experiments the pH-dependent release from the receptor fragment was ana-
lyzed. As mentioned before, during transcytosis at the endothelial cells of the BBB, the
pH drops to 5.5-6.0, which should result in dissociation of the receptor fragment from
ASA.
To test this, ASA and the receptor fragment were coprecipitated using Ni-NTA-agarose
as before, followed by incubation of the precipitate at pH 5.0-8.5 at 37°C. Then the
amount of ASA still bound to the receptor fragment was analyzed by ASA activity
measurements (Figure 5.11).
Figure 5.11: pH dependent dissociation of ASA from the receptor fragment.
As described for Figure 5.10, ASA and the receptor fragment were coprecipitated using Ni-NTA-agarose. After washing, pellets were resuspended in different buffer systems at pH 5.0-8.5 and incubated for 30 minutes at 37°C under vigorous shaking. Suspensions were centrifuged, the supernatant was saved, the pellet resuspended after washing with BSA/TBS at pH 7.0. ASA activity was determined in supernatant, the wash fractions and resuspended pellet under vigor-ous shaking. The residual amount of ASA found in the pellet was normalized to the sum of ASA activities in all fractions (supernatant + wash + resuspended pellet). Shown are the means ± SD of three independent experiments.
0%
20%
40%
60%
80%
100%
4 5 6 7 8 9
pH
AS
A b
ound to M
PR
-fra
gm
ent
0%
70 5 Results
As shown in Figure 5.11, ASA did not dissociate from the receptor fragment at pH 6.0-
7.4. At more acidic pH (5.0) approximately 50% of previously bound ASA dissociated.
When incubated at alkaline pH (pH 8.0-8.5) the receptor fragment released 20-30% of
the initially applied ASA. It is therefore assumed that under the acidic environment of
the endosome, ASA would be partially released from the receptor fragment, allowing
for brain delivery of unmodified ASA after transcytosis through the endothelial cells of
the BBB.
5.2.3 Endocytosis experiments of MPR300 dom9 (N28Q & N94Q)
complexed ASA
The previous KD determination studies clearly showed binding of the receptor fragment
to ASA. Ultimately, the receptor fragment is supposed to bind ASA and shield its M6P
residues, thereby reducing its uptake by peripheral cells.
To test for reduced uptake of ASA after binding to the receptor fragment, in vitro endo-
cytosis experiments with MEFs were conducted (Figure 5.12).
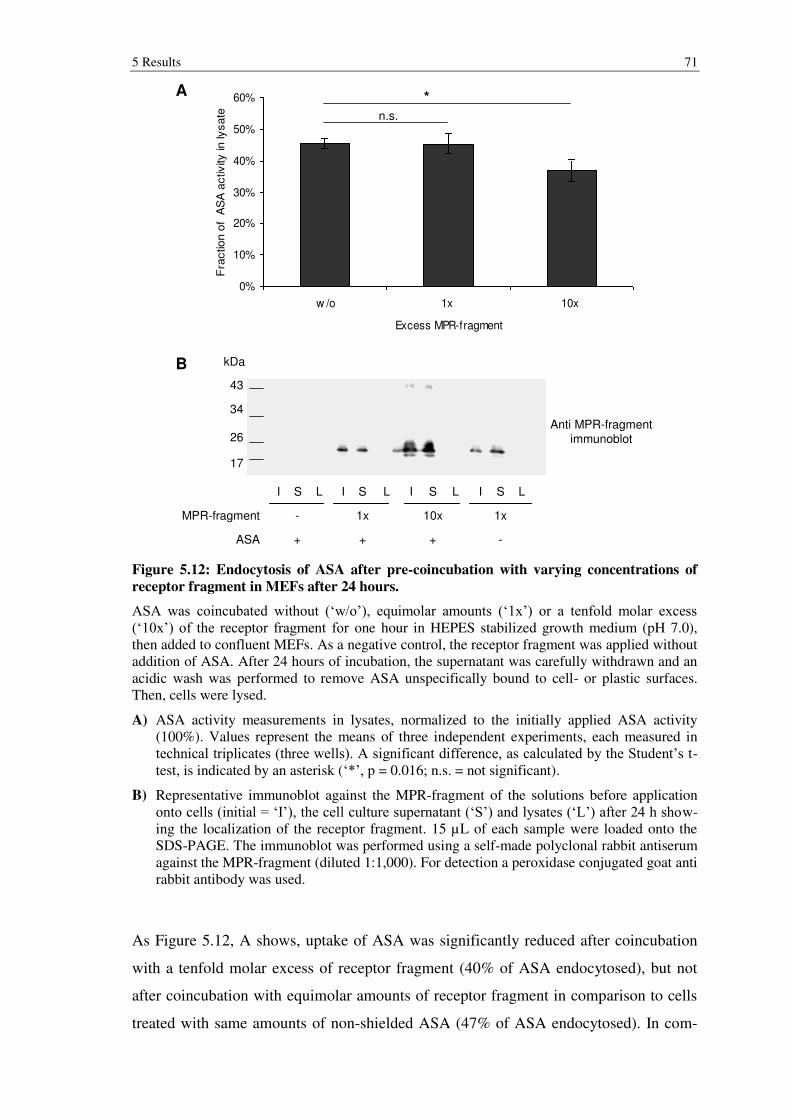
5 Results 71
Figure 5.12: Endocytosis of ASA after pre-coincubation with varying concentrations of
receptor fragment in MEFs after 24 hours.
ASA was coincubated without (‘w/o’), equimolar amounts (‘1x’) or a tenfold molar excess (‘10x’) of the receptor fragment for one hour in HEPES stabilized growth medium (pH 7.0), then added to confluent MEFs. As a negative control, the receptor fragment was applied without addition of ASA. After 24 hours of incubation, the supernatant was carefully withdrawn and an acidic wash was performed to remove ASA unspecifically bound to cell- or plastic surfaces. Then, cells were lysed.
A) ASA activity measurements in lysates, normalized to the initially applied ASA activity (100%). Values represent the means of three independent experiments, each measured in technical triplicates (three wells). A significant difference, as calculated by the Student’s t-test, is indicated by an asterisk (‘*’, p = 0.016; n.s. = not significant).
B) Representative immunoblot against the MPR-fragment of the solutions before application onto cells (initial = ‘I’), the cell culture supernatant (‘S’) and lysates (‘L’) after 24 h show-ing the localization of the receptor fragment. 15 µL of each sample were loaded onto the SDS-PAGE. The immunoblot was performed using a self-made polyclonal rabbit antiserum against the MPR-fragment (diluted 1:1,000). For detection a peroxidase conjugated goat anti rabbit antibody was used.
As Figure 5.12, A shows, uptake of ASA was significantly reduced after coincubation
with a tenfold molar excess of receptor fragment (40% of ASA endocytosed), but not
after coincubation with equimolar amounts of receptor fragment in comparison to cells
treated with same amounts of non-shielded ASA (47% of ASA endocytosed). In com-
0%
10%
20%
30%
40%
50%
60%
w /o 1x 10x
Excess MPR-fragment
Fra
ction o
f A
SA
activity in lysate n.s.
*
34
26
17
43
I S L I S L I S L I S L
1x 10x 1xMPR-fragment -
ASA + + -+
kDa
Anti MPR-fragment
immunoblot
A
B

72 5 Results
parison to non-shielded ASA, 15% less ASA was taken up after coincubation with a
tenfold excess of receptor fragment.
The immunoblot against the MPR-fragment (Figure 5.12, B) showed no signal in the
lysates, whereas clear bands were detected for the initial solutions and the cell culture
supernatants. This indicates that in contrast to the applied ASA the receptor fragment
was not endocytosed but remained extracellularly located.
5.2.4 Dissociation of ASA and receptor fragment in different solutions
The reduction of ASA uptake of shielded compared to non-shielded ASA was less than
expected. It was hypothesized that a component of the cell culture medium may possi-
bly have caused partial dissociation of ASA and the receptor fragment thereby allowing
endocytosis of unshielded ASA. To investigate this, the release of ASA from the recep-
tor fragment was determined in presence of cell culture medium according to the same
method applied for the pH-dependent desorption experiments (chapter 5.2.2). With re-
gard to future in vivo studies, dissociation experiments were conducted in serum. In case
of rapid dissociation in serum, uptake by peripheral cells and consequently the serum
half life times would be expected to be unchanged. As positive control for dissociation,
a M6P solution was used in this assay. M6P should compete with ASA for receptor
binding, thereby inducing release of ASA (Figure 5.13).
Figure 5.13: Dissociation of ASA from the MPR-fragment in presence different solutions.
The experiment was conducted as described for Figure 5.11. Bars represent the means ± SD of four independent experiments. Dissociation of ASA was analyzed in presence of 1% (w/v) BSA in TBS (pH 7.0), cell culture medium (DMEM+FCS+HEPES, pH 7.0), ASA-/- mouse serum and 10 mM M6P (M6P; in 1% BSA in TBS, pH 7.0)
0%
20%
40%
60%
80%
100%
120%
BSA/TBS DMEM+
FCS+HEPES
Serum M6P
AS
A b
ound to M
PR
-fra
gm
ent
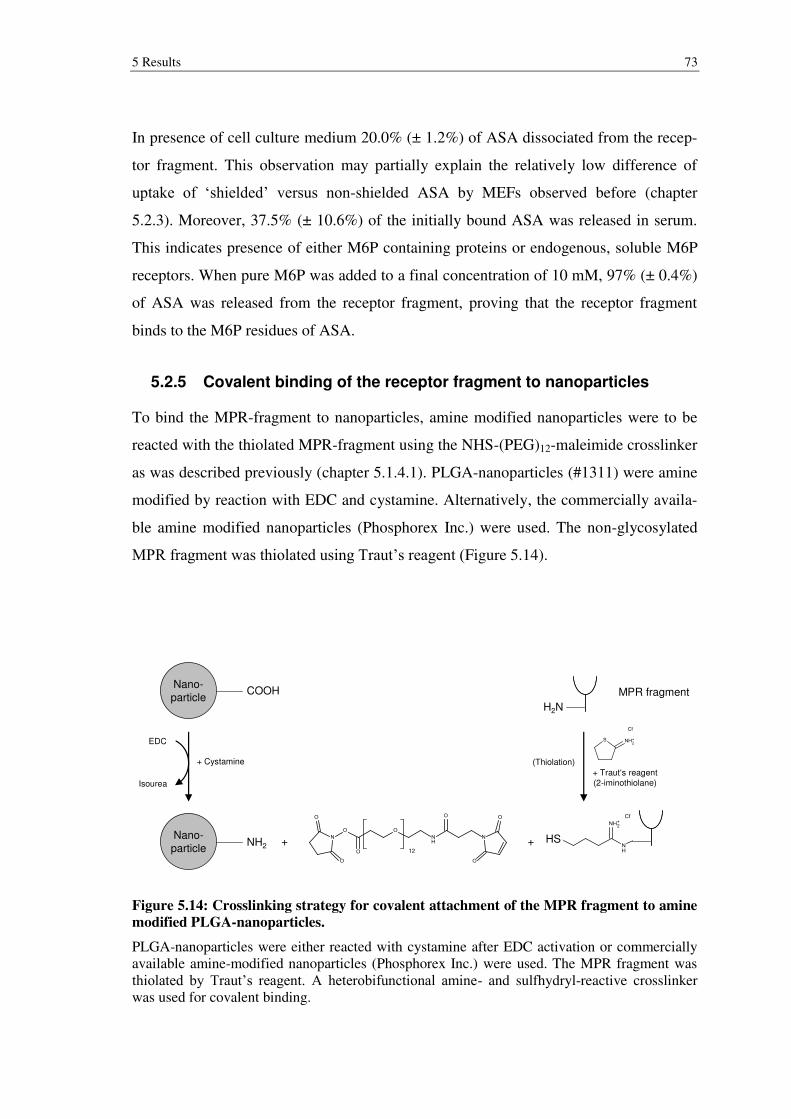
5 Results 73
In presence of cell culture medium 20.0% (± 1.2%) of ASA dissociated from the recep-
tor fragment. This observation may partially explain the relatively low difference of
uptake of ‘shielded’ versus non-shielded ASA by MEFs observed before (chapter
5.2.3). Moreover, 37.5% (± 10.6%) of the initially bound ASA was released in serum.
This indicates presence of either M6P containing proteins or endogenous, soluble M6P
receptors. When pure M6P was added to a final concentration of 10 mM, 97% (± 0.4%)
of ASA was released from the receptor fragment, proving that the receptor fragment
binds to the M6P residues of ASA.
5.2.5 Covalent binding of the receptor fragment to nanoparticles
To bind the MPR-fragment to nanoparticles, amine modified nanoparticles were to be
reacted with the thiolated MPR-fragment using the NHS-(PEG)12-maleimide crosslinker
as was described previously (chapter 5.1.4.1). PLGA-nanoparticles (#1311) were amine
modified by reaction with EDC and cystamine. Alternatively, the commercially availa-
ble amine modified nanoparticles (Phosphorex Inc.) were used. The non-glycosylated
MPR fragment was thiolated using Traut’s reagent (Figure 5.14).
Figure 5.14: Crosslinking strategy for covalent attachment of the MPR fragment to amine
modified PLGA-nanoparticles.
PLGA-nanoparticles were either reacted with cystamine after EDC activation or commercially available amine-modified nanoparticles (Phosphorex Inc.) were used. The MPR fragment was thiolated by Traut’s reagent. A heterobifunctional amine- and sulfhydryl-reactive crosslinker was used for covalent binding.
Nano-particle
NH2 + +
Nano-
particleCOOH
EDC
+ Cystamine
Isourea
H2N
+ Traut‘s reagent
(2-iminothiolane)
MPR fragment
(Thiolation)
HS
74 5 Results
After the covalent crosslinking procedure, unmodified ASA was added to determine
how much ASA can be bound by this nanoparticle system. As described before,
amounts of bound ASA were evaluated by ASA activity determinations. 9.2 and 16.2
mU of ASA were bound to PLGA 1311 and N-PLGA (Phosphorex Inc.) nanoparticles,
respectively. These yields are comparable to the ones of direct crosslinking of ASA to
N-PLGA observed in chapter 5.1.4.1 (8.92 mU/mg nanoparticle). However, this rela-
tively low binding of ASA to MPR-fragment nanoparticles does not allow for in vivo
studies. Therefore crosslinking strategies to improve binding of the MPR fragment and
consequently ASA need to be optimized. For instance, neutravidin-modified nanoparti-
cles may again be used to bind biotinylated MPR-fragment, followed by binding of
(unmodified) ASA.
In summary, four constructs of the domain 9 of the MPR300 were successfully cloned,
expressed and purified. All constructs were able to bind ASA with high affinities (30-
57 nM). The non-glycosylated construct was thereon analyzed further. It was shown
that ASA was released from this construct in a pH dependent manner. However, the
affinity of the receptor fragment towards ASA must be increased in the future, as 38%
of initially bound ASA dissociated in presence of serum, limiting its applicability in
vivo. Covalent binding of the receptor fragment to nanoparticles was achieved, but must
be increased in future experiments. Most importantly, however, it was shown that a ten-
fold molar excess of the receptor fragment over ASA led to significantly lowered uptake
by MEFs, confirming the working hypothesis.
5.3 Identification of inhibitors for Arylsulfatase A
ASA inhibitors are needed for two reasons:
Primarily, ASA inhibitors may be used in a novel therapeutic approach for MLD, chap-
erone therapy. The rationale of chaperone therapy is that the inhibitor binds to the mis-
folded protein in the endoplasmic reticulum. Thereby the enzyme is stabilized and is
not, as would physiologically happen, degraded by the ERAD. Consequently, these en-
zymes are then transported to the lysosome, where ideally the inhibitor dissociates from
the enzyme due to the acidic pH. The at least partially active enzyme can then degrade
the lysosomally accumulated storage material thus reducing the severity of the disease.
However, this therapeutic approach will only be applicable for patients carrying gene
5 Results 75
mutants responsible for expression of misfolded enzymes (with little or no residual ac-
tivity), but not complete lack of enzyme. More than 7 mutations are known leading to
ASA misfolding and degradation by the ERAD system (Poeppel et al. 2005).
Secondly, ASA inhibitors might prove useful to generate a cell culture model of MLD.
All sorts of cells could be treated with such an ASA inhibitor, abolishing ASA-activity
in the lysosome, possibly leading to intralysosomal storage of sulfatide, the substrate of
ASA. Such a cell culture model would be useful to study the cellular and molecular
pathomechanisms of MLD and might help find new therapeutic targets against this dis-
ease.
5.3.1 Establishment of an assay suitable for high throughput
screening
In order to be able to identify potential inhibitors in high throughput screenings, it is
necessary to adjust the assay parameters. First, substrate levels have to be minimized to
avoid competition of excess substrate molecules with inhibitors for enzyme binding
sites. As a gold standard the substrate concentration in inhibition assays should be in the
range of or below the Km of the investigated enzyme. Secondly, the enzymatic hydroly-
sis of the substrate has to be constant over the time of the assay. Furthermore, the assay
should tolerate DMSO, the solvent for most screening compounds. Under these condi-
tions the assay must be robust, which can be evaluated by determination of the Z’-
factor. In general, the higher the Z’ score (ranging between 0 and 1), the lower is the
variability and the better suited is the assay for high throughput screenings. As a rule of
thumb, a Z’ score ≥0.5 indicates that the assay is robust (Zhang et al. 1999). The Z’
score was evaluated for each measured plate separately.
The high-throughput screenings were performed at a substrate (end-)concentration of
0.25 mM, near the Km of 0.21 mM as previously described (Bognar et al. 2006). The
rate of 4-nitrocatechol sulfate hydrolysis remained constant over 90 minutes at 37°C
employing 105 ng/µL ASA in the assay (results not shown). The assay tolerated up to
5% DMSO without significant loss of signal in comparison to 0% DMSO (results not
shown). The performance of the assay was robust both in 96- and in 384-well plates as
the Z’-factor was 0.89 on average for all plates. No plate had a Z’-factor below 0.5 (not
shown).
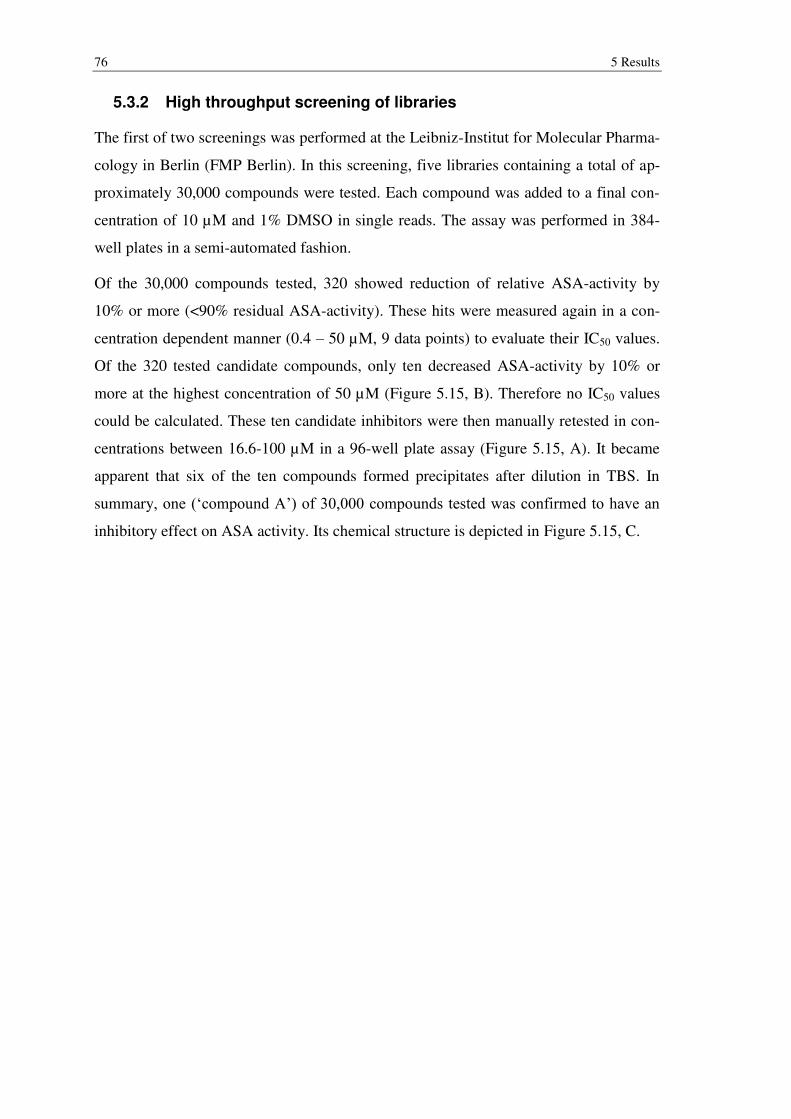
76 5 Results
5.3.2 High throughput screening of libraries
The first of two screenings was performed at the Leibniz-Institut for Molecular Pharma-
cology in Berlin (FMP Berlin). In this screening, five libraries containing a total of ap-
proximately 30,000 compounds were tested. Each compound was added to a final con-
centration of 10 µM and 1% DMSO in single reads. The assay was performed in 384-
well plates in a semi-automated fashion.
Of the 30,000 compounds tested, 320 showed reduction of relative ASA-activity by
10% or more (<90% residual ASA-activity). These hits were measured again in a con-
centration dependent manner (0.4 – 50 µM, 9 data points) to evaluate their IC50 values.
Of the 320 tested candidate compounds, only ten decreased ASA-activity by 10% or
more at the highest concentration of 50 µM (Figure 5.15, B). Therefore no IC50 values
could be calculated. These ten candidate inhibitors were then manually retested in con-
centrations between 16.6-100 µM in a 96-well plate assay (Figure 5.15, A). It became
apparent that six of the ten compounds formed precipitates after dilution in TBS. In
summary, one (‘compound A’) of 30,000 compounds tested was confirmed to have an
inhibitory effect on ASA activity. Its chemical structure is depicted in Figure 5.15, C.
5 Results 77
B
0%
20%
40%
60%
80%
100%
120%
0 10 20 30 40 50 60 70 80 90 100
Compound [µM]
Re
sid
ua
l A
SA
activity
A
C
Re
sid
ua
l A
SA
activity
‘Compound A‘
‘Compound A‘
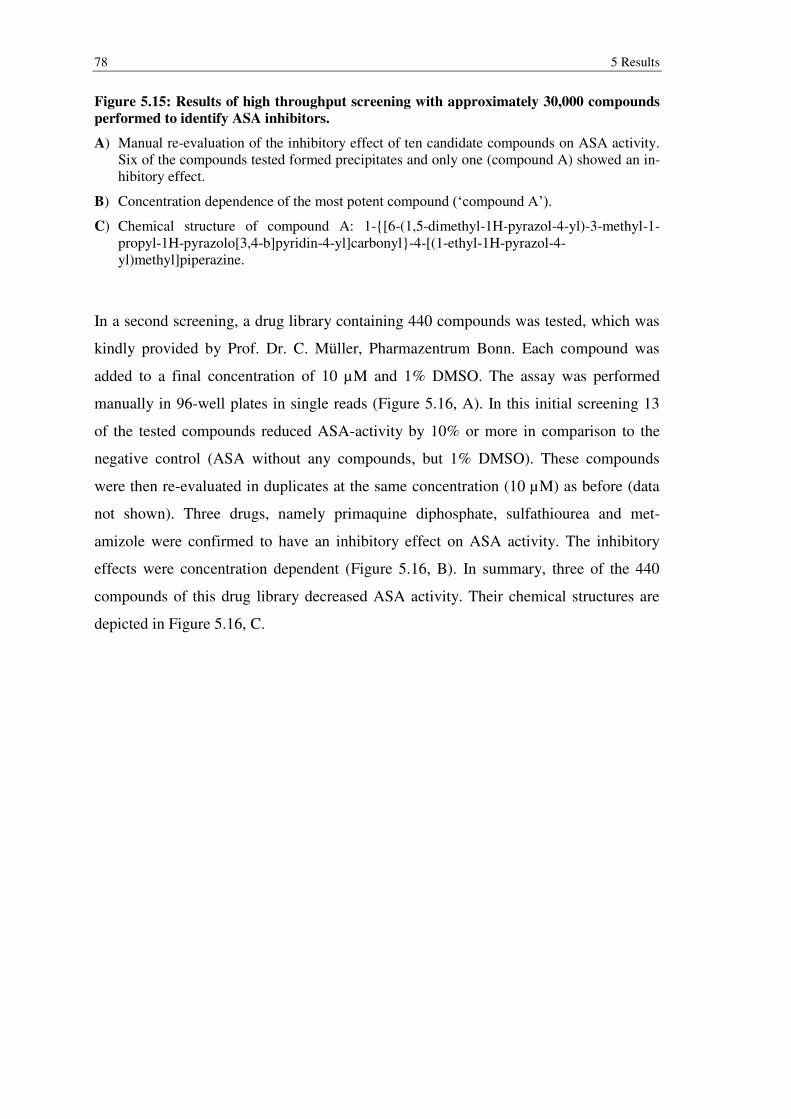
78 5 Results
Figure 5.15: Results of high throughput screening with approximately 30,000 compounds
performed to identify ASA inhibitors.
A) Manual re-evaluation of the inhibitory effect of ten candidate compounds on ASA activity. Six of the compounds tested formed precipitates and only one (compound A) showed an in-hibitory effect.
B) Concentration dependence of the most potent compound (‘compound A’).
C) Chemical structure of compound A: 1-{[6-(1,5-dimethyl-1H-pyrazol-4-yl)-3-methyl-1-propyl-1H-pyrazolo[3,4-b]pyridin-4-yl]carbonyl}-4-[(1-ethyl-1H-pyrazol-4-yl)methyl]piperazine.
In a second screening, a drug library containing 440 compounds was tested, which was
kindly provided by Prof. Dr. C. Müller, Pharmazentrum Bonn. Each compound was
added to a final concentration of 10 µM and 1% DMSO. The assay was performed
manually in 96-well plates in single reads (Figure 5.16, A). In this initial screening 13
of the tested compounds reduced ASA-activity by 10% or more in comparison to the
negative control (ASA without any compounds, but 1% DMSO). These compounds
were then re-evaluated in duplicates at the same concentration (10 µM) as before (data
not shown). Three drugs, namely primaquine diphosphate, sulfathiourea and met-
amizole were confirmed to have an inhibitory effect on ASA activity. The inhibitory
effects were concentration dependent (Figure 5.16, B). In summary, three of the 440
compounds of this drug library decreased ASA activity. Their chemical structures are
depicted in Figure 5.16, C.
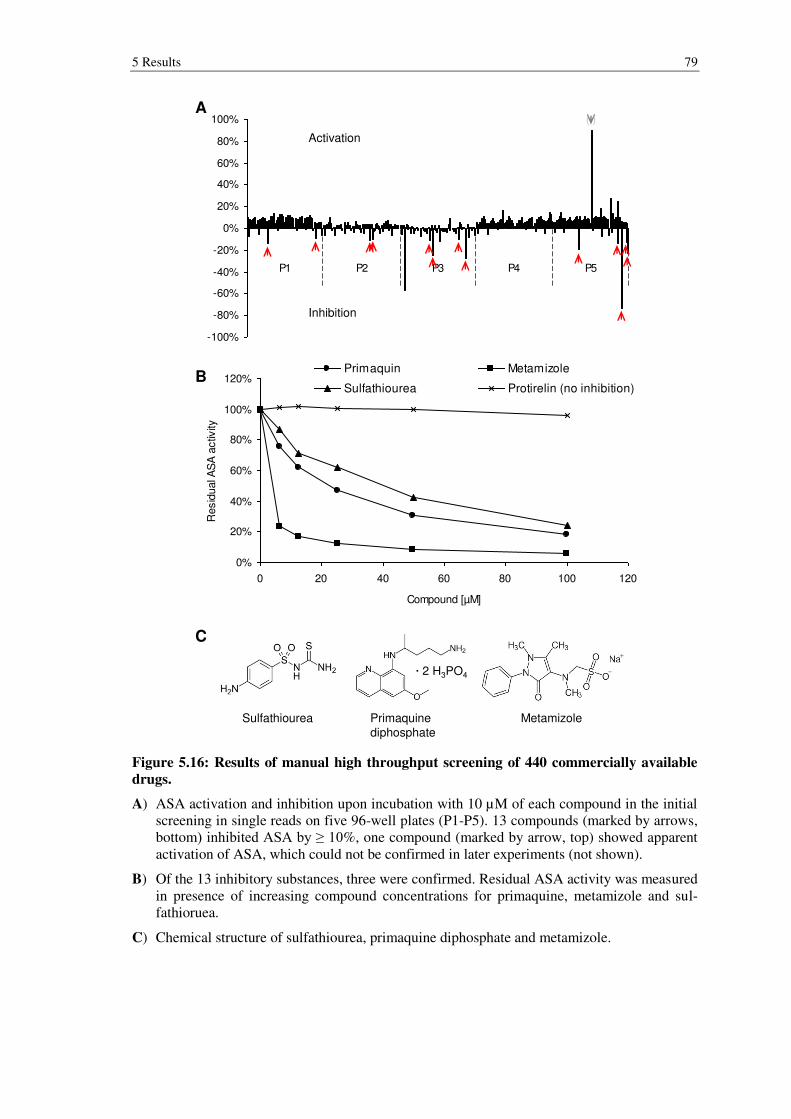
5 Results 79
Figure 5.16: Results of manual high throughput screening of 440 commercially available
drugs.
A) ASA activation and inhibition upon incubation with 10 µM of each compound in the initial screening in single reads on five 96-well plates (P1-P5). 13 compounds (marked by arrows, bottom) inhibited ASA by ≥ 10%, one compound (marked by arrow, top) showed apparent activation of ASA, which could not be confirmed in later experiments (not shown).
B) Of the 13 inhibitory substances, three were confirmed. Residual ASA activity was measured in presence of increasing compound concentrations for primaquine, metamizole and sul-fathioruea.
C) Chemical structure of sulfathiourea, primaquine diphosphate and metamizole.
0%
20%
40%
60%
80%
100%
120%
0 20 40 60 80 100 120
Compound [µM]
Resid
ual A
SA
activ
ity
Primaquin Metamizole
Sulfathiourea Protirelin (no inhibition)
-100%
-80%
-60%
-40%
-20%
0%
20%
40%
60%
80%
100%
P1 P2 P3 P4 P5
Activation
Inhibition
A( )
B
C
Sulfathiourea Primaquine
diphosphate
Metamizole
∙ 2 H3PO4
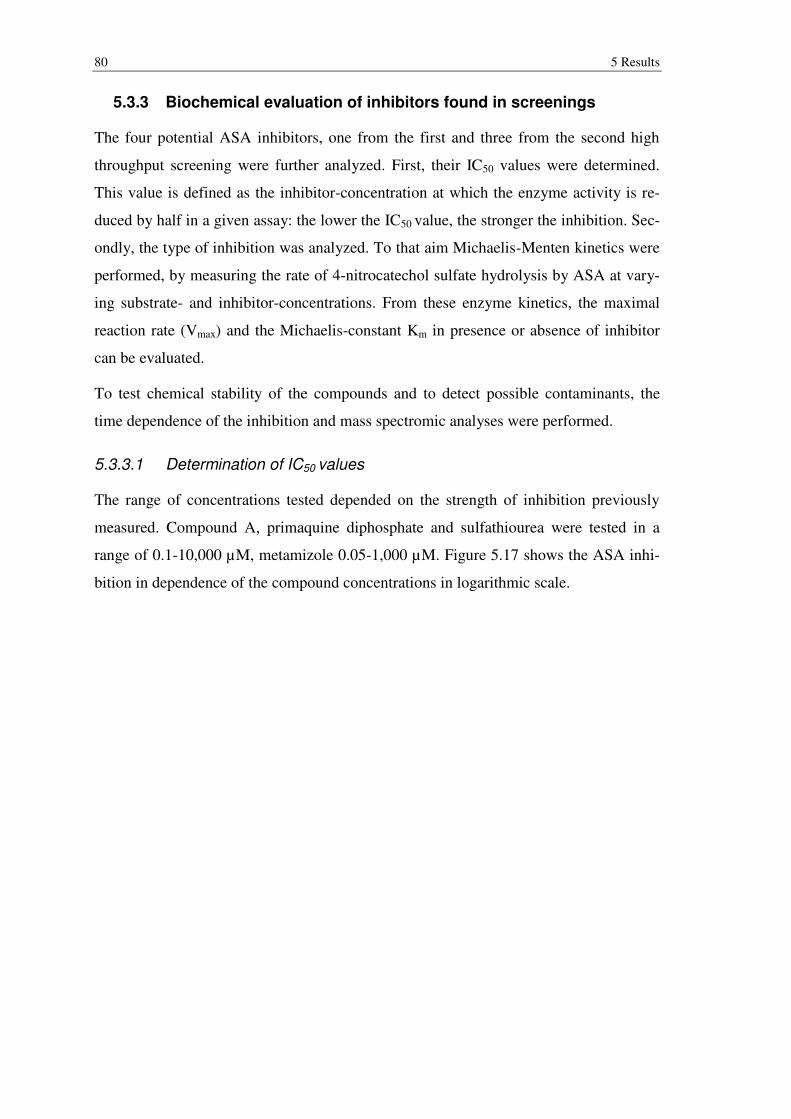
80 5 Results
5.3.3 Biochemical evaluation of inhibitors found in screenings
The four potential ASA inhibitors, one from the first and three from the second high
throughput screening were further analyzed. First, their IC50 values were determined.
This value is defined as the inhibitor-concentration at which the enzyme activity is re-
duced by half in a given assay: the lower the IC50 value, the stronger the inhibition. Sec-
ondly, the type of inhibition was analyzed. To that aim Michaelis-Menten kinetics were
performed, by measuring the rate of 4-nitrocatechol sulfate hydrolysis by ASA at vary-
ing substrate- and inhibitor-concentrations. From these enzyme kinetics, the maximal
reaction rate (Vmax) and the Michaelis-constant Km in presence or absence of inhibitor
can be evaluated.
To test chemical stability of the compounds and to detect possible contaminants, the
time dependence of the inhibition and mass spectromic analyses were performed.
5.3.3.1 Determination of IC50 values
The range of concentrations tested depended on the strength of inhibition previously
measured. Compound A, primaquine diphosphate and sulfathiourea were tested in a
range of 0.1-10,000 µM, metamizole 0.05-1,000 µM. Figure 5.17 shows the ASA inhi-
bition in dependence of the compound concentrations in logarithmic scale.
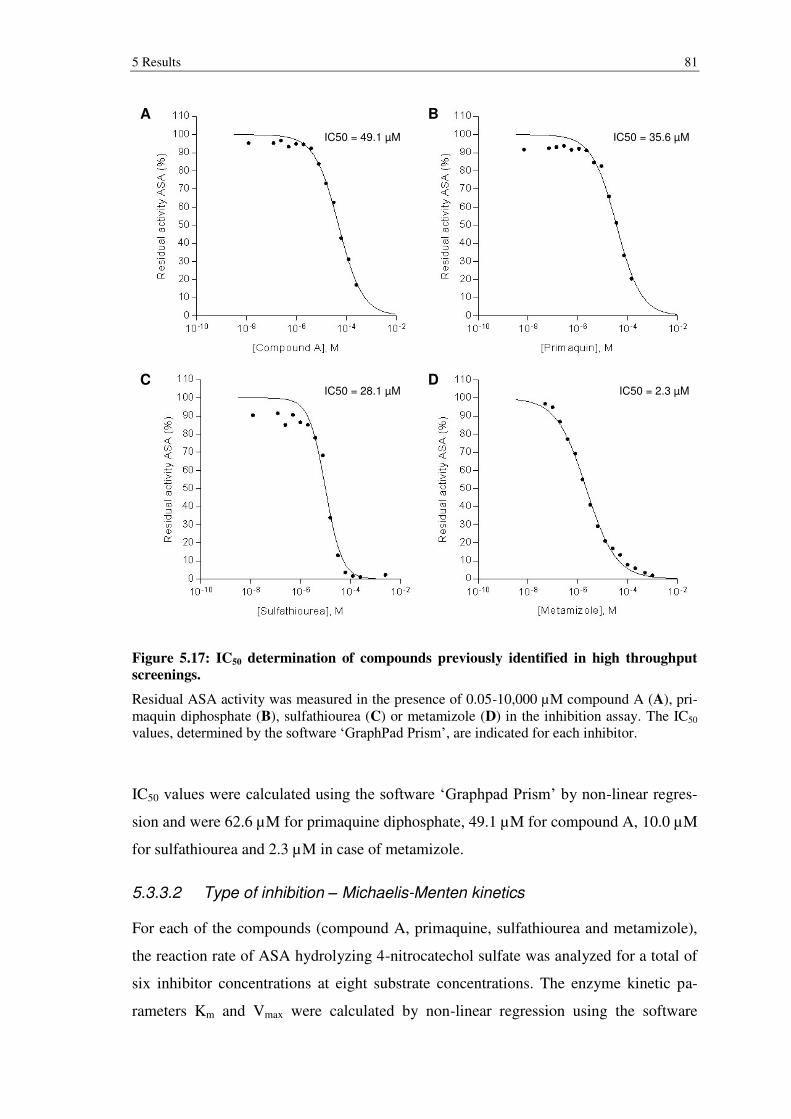
5 Results 81
Figure 5.17: IC50 determination of compounds previously identified in high throughput
screenings.
Residual ASA activity was measured in the presence of 0.05-10,000 µM compound A (A), pri-maquin diphosphate (B), sulfathiourea (C) or metamizole (D) in the inhibition assay. The IC50 values, determined by the software ‘GraphPad Prism’, are indicated for each inhibitor.
IC50 values were calculated using the software ‘Graphpad Prism’ by non-linear regres-
sion and were 62.6 µM for primaquine diphosphate, 49.1 µM for compound A, 10.0 µM
for sulfathiourea and 2.3 µM in case of metamizole.
5.3.3.2 Type of inhibition – Michaelis-Menten kinetics
For each of the compounds (compound A, primaquine, sulfathiourea and metamizole),
the reaction rate of ASA hydrolyzing 4-nitrocatechol sulfate was analyzed for a total of
six inhibitor concentrations at eight substrate concentrations. The enzyme kinetic pa-
rameters Km and Vmax were calculated by non-linear regression using the software
IC50 = 49.1 µM IC50 = 35.6 µM
IC50 = 28.1 µM IC50 = 2.3 µM
A
C
B
D
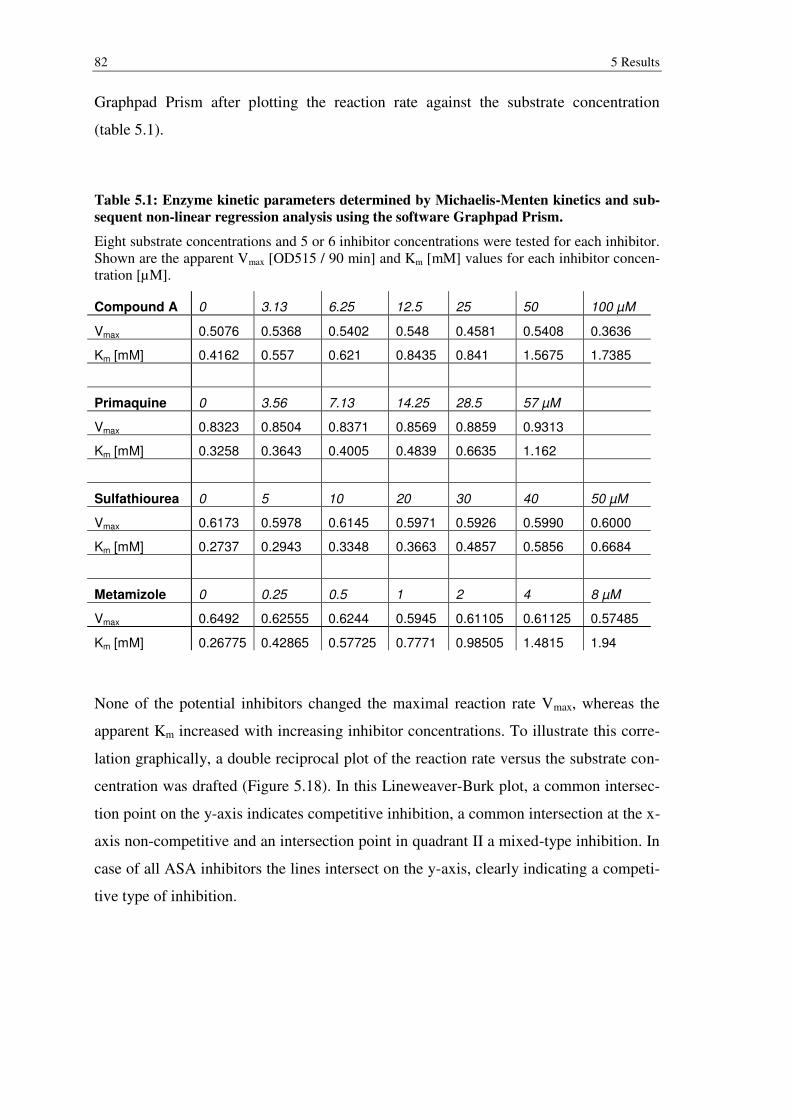
82 5 Results
Graphpad Prism after plotting the reaction rate against the substrate concentration
(table 5.1).
Table 5.1: Enzyme kinetic parameters determined by Michaelis-Menten kinetics and sub-
sequent non-linear regression analysis using the software Graphpad Prism.
Eight substrate concentrations and 5 or 6 inhibitor concentrations were tested for each inhibitor. Shown are the apparent Vmax [OD515 / 90 min] and Km [mM] values for each inhibitor concen-tration [µM].
Compound A 0 3.13 6.25 12.5 25 50 100 µM
Vmax 0.5076 0.5368 0.5402 0.548 0.4581 0.5408 0.3636
Km [mM] 0.4162 0.557 0.621 0.8435 0.841 1.5675 1.7385
Primaquine 0 3.56 7.13 14.25 28.5 57 µM
Vmax 0.8323 0.8504 0.8371 0.8569 0.8859 0.9313
Km [mM] 0.3258 0.3643 0.4005 0.4839 0.6635 1.162
Sulfathiourea 0 5 10 20 30 40 50 µM
Vmax 0.6173 0.5978 0.6145 0.5971 0.5926 0.5990 0.6000
Km [mM] 0.2737 0.2943 0.3348 0.3663 0.4857 0.5856 0.6684
Metamizole 0 0.25 0.5 1 2 4 8 µM
Vmax 0.6492 0.62555 0.6244 0.5945 0.61105 0.61125 0.57485
Km [mM] 0.26775 0.42865 0.57725 0.7771 0.98505 1.4815 1.94
None of the potential inhibitors changed the maximal reaction rate Vmax, whereas the
apparent Km increased with increasing inhibitor concentrations. To illustrate this corre-
lation graphically, a double reciprocal plot of the reaction rate versus the substrate con-
centration was drafted (Figure 5.18). In this Lineweaver-Burk plot, a common intersec-
tion point on the y-axis indicates competitive inhibition, a common intersection at the x-
axis non-competitive and an intersection point in quadrant II a mixed-type inhibition. In
case of all ASA inhibitors the lines intersect on the y-axis, clearly indicating a competi-
tive type of inhibition.
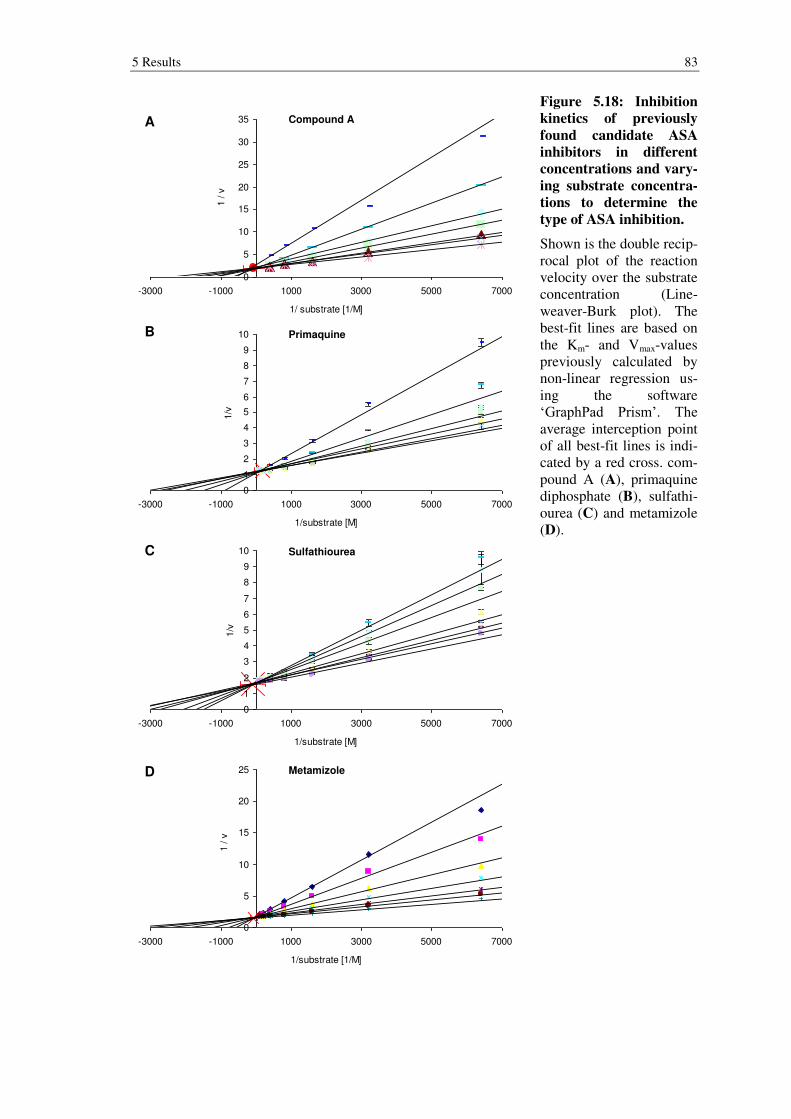
5 Results 83
Figure 5.18: Inhibition
kinetics of previously
found candidate ASA
inhibitors in different
concentrations and vary-
ing substrate concentra-
tions to determine the
type of ASA inhibition.
Shown is the double recip-rocal plot of the reaction velocity over the substrate concentration (Line-weaver-Burk plot). The best-fit lines are based on the Km- and Vmax-values previously calculated by non-linear regression us-ing the software ‘GraphPad Prism’. The average interception point of all best-fit lines is indi-cated by a red cross. com-pound A (A), primaquine diphosphate (B), sulfathi-ourea (C) and metamizole (D).
0
5
10
15
20
25
30
35
-3000 -1000 1000 3000 5000 7000
1/ substrate [1/M]
1 / v
0
1
2
3
4
5
6
7
8
9
10
-3000 -1000 1000 3000 5000 7000
1/substrate [M]
1/v
0
1
2
3
4
5
6
7
8
9
10
-3000 -1000 1000 3000 5000 7000
1/substrate [M]
1/v
0
5
10
15
20
25
-3000 -1000 1000 3000 5000 7000
1/substrate [1/M]
1 / v
A
B
C
D
Compound A
Primaquine
Sulfathiourea
Metamizole
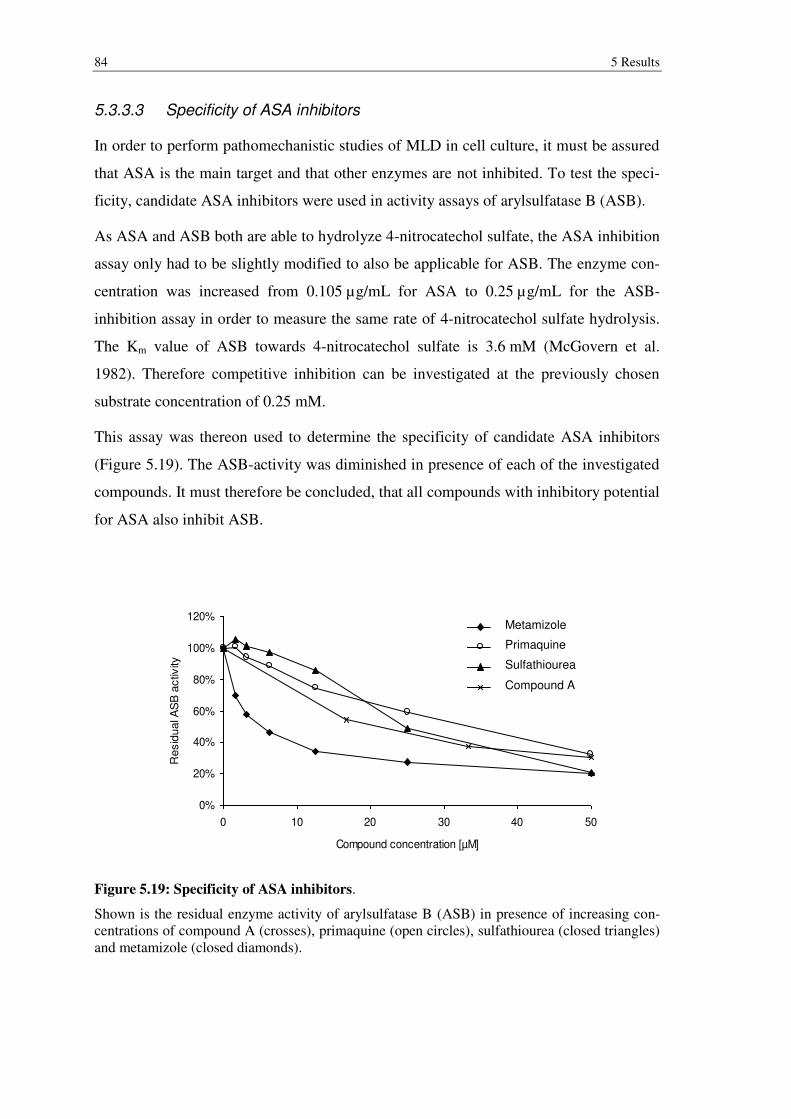
84 5 Results
5.3.3.3 Specificity of ASA inhibitors
In order to perform pathomechanistic studies of MLD in cell culture, it must be assured
that ASA is the main target and that other enzymes are not inhibited. To test the speci-
ficity, candidate ASA inhibitors were used in activity assays of arylsulfatase B (ASB).
As ASA and ASB both are able to hydrolyze 4-nitrocatechol sulfate, the ASA inhibition
assay only had to be slightly modified to also be applicable for ASB. The enzyme con-
centration was increased from 0.105 µg/mL for ASA to 0.25 µg/mL for the ASB-
inhibition assay in order to measure the same rate of 4-nitrocatechol sulfate hydrolysis.
The Km value of ASB towards 4-nitrocatechol sulfate is 3.6 mM (McGovern et al.
1982). Therefore competitive inhibition can be investigated at the previously chosen
substrate concentration of 0.25 mM.
This assay was thereon used to determine the specificity of candidate ASA inhibitors
(Figure 5.19). The ASB-activity was diminished in presence of each of the investigated
compounds. It must therefore be concluded, that all compounds with inhibitory potential
for ASA also inhibit ASB.
Figure 5.19: Specificity of ASA inhibitors.
Shown is the residual enzyme activity of arylsulfatase B (ASB) in presence of increasing con-centrations of compound A (crosses), primaquine (open circles), sulfathiourea (closed triangles) and metamizole (closed diamonds).
0%
20%
40%
60%
80%
100%
120%
0 10 20 30 40 50
Compound concentration [µM]
Resid
ual A
SB
activ
ity
ASA Metamizole
ASA Primaquine
ASA Sulfathiourea
Compound A
Primaquine
Sulfathiourea
Compound A
Metamizole
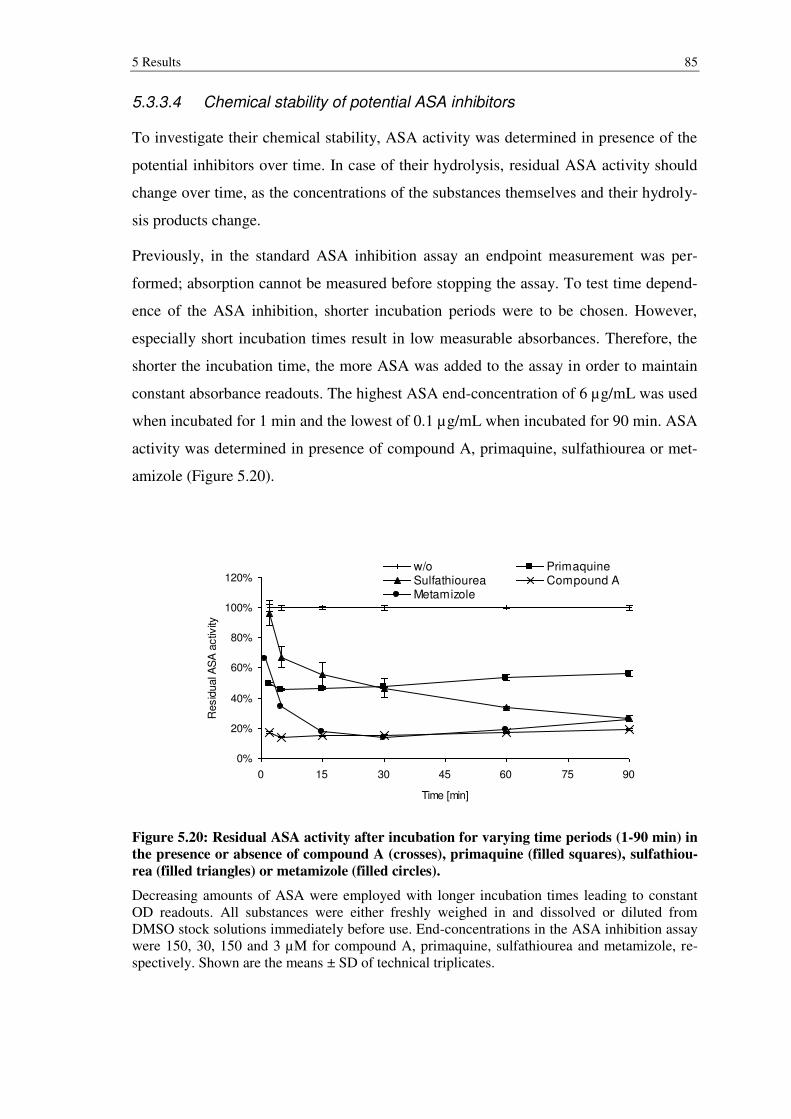
5 Results 85
5.3.3.4 Chemical stability of potential ASA inhibitors
To investigate their chemical stability, ASA activity was determined in presence of the
potential inhibitors over time. In case of their hydrolysis, residual ASA activity should
change over time, as the concentrations of the substances themselves and their hydroly-
sis products change.
Previously, in the standard ASA inhibition assay an endpoint measurement was per-
formed; absorption cannot be measured before stopping the assay. To test time depend-
ence of the ASA inhibition, shorter incubation periods were to be chosen. However,
especially short incubation times result in low measurable absorbances. Therefore, the
shorter the incubation time, the more ASA was added to the assay in order to maintain
constant absorbance readouts. The highest ASA end-concentration of 6 µg/mL was used
when incubated for 1 min and the lowest of 0.1 µg/mL when incubated for 90 min. ASA
activity was determined in presence of compound A, primaquine, sulfathiourea or met-
amizole (Figure 5.20).
Figure 5.20: Residual ASA activity after incubation for varying time periods (1-90 min) in
the presence or absence of compound A (crosses), primaquine (filled squares), sulfathiou-
rea (filled triangles) or metamizole (filled circles).
Decreasing amounts of ASA were employed with longer incubation times leading to constant OD readouts. All substances were either freshly weighed in and dissolved or diluted from DMSO stock solutions immediately before use. End-concentrations in the ASA inhibition assay were 150, 30, 150 and 3 µM for compound A, primaquine, sulfathiourea and metamizole, re-spectively. Shown are the means ± SD of technical triplicates.
0%
20%
40%
60%
80%
100%
120%
0 15 30 45 60 75 90
Time [min]
Resid
ual A
SA
activ
ity
w/o PrimaquineSulfathiourea Compound AMetamizole
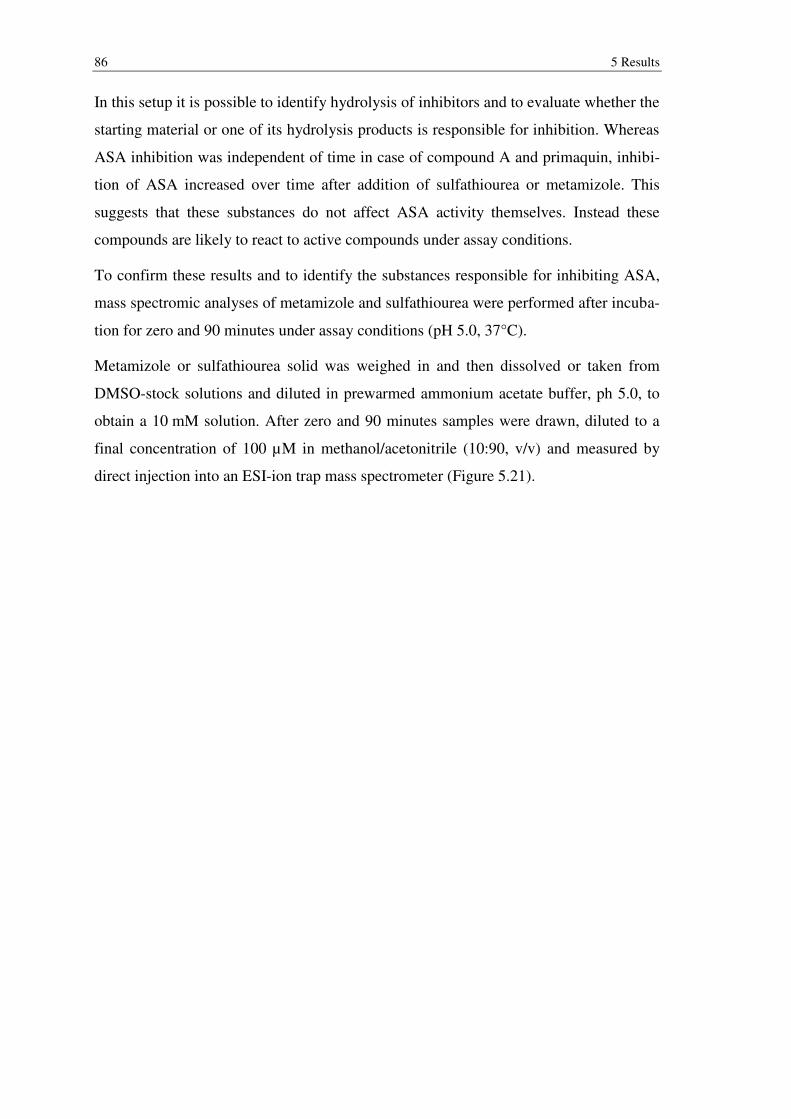
86 5 Results
In this setup it is possible to identify hydrolysis of inhibitors and to evaluate whether the
starting material or one of its hydrolysis products is responsible for inhibition. Whereas
ASA inhibition was independent of time in case of compound A and primaquin, inhibi-
tion of ASA increased over time after addition of sulfathiourea or metamizole. This
suggests that these substances do not affect ASA activity themselves. Instead these
compounds are likely to react to active compounds under assay conditions.
To confirm these results and to identify the substances responsible for inhibiting ASA,
mass spectromic analyses of metamizole and sulfathiourea were performed after incuba-
tion for zero and 90 minutes under assay conditions (pH 5.0, 37°C).
Metamizole or sulfathiourea solid was weighed in and then dissolved or taken from
DMSO-stock solutions and diluted in prewarmed ammonium acetate buffer, ph 5.0, to
obtain a 10 mM solution. After zero and 90 minutes samples were drawn, diluted to a
final concentration of 100 µM in methanol/acetonitrile (10:90, v/v) and measured by
direct injection into an ESI-ion trap mass spectrometer (Figure 5.21).
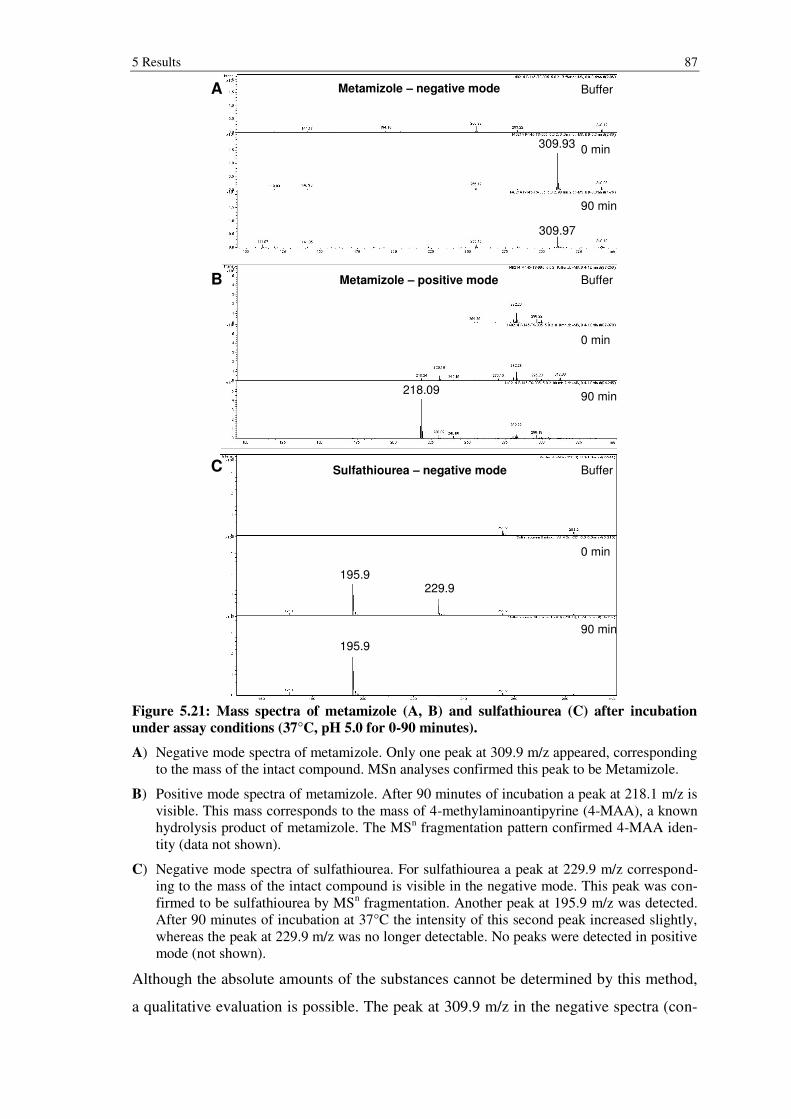
5 Results 87
Figure 5.21: Mass spectra of metamizole (A, B) and sulfathiourea (C) after incubation
under assay conditions (37°C, pH 5.0 for 0-90 minutes).
A) Negative mode spectra of metamizole. Only one peak at 309.9 m/z appeared, corresponding to the mass of the intact compound. MSn analyses confirmed this peak to be Metamizole.
B) Positive mode spectra of metamizole. After 90 minutes of incubation a peak at 218.1 m/z is visible. This mass corresponds to the mass of 4-methylaminoantipyrine (4-MAA), a known hydrolysis product of metamizole. The MSn fragmentation pattern confirmed 4-MAA iden-tity (data not shown).
C) Negative mode spectra of sulfathiourea. For sulfathiourea a peak at 229.9 m/z correspond-ing to the mass of the intact compound is visible in the negative mode. This peak was con-firmed to be sulfathiourea by MSn fragmentation. Another peak at 195.9 m/z was detected. After 90 minutes of incubation at 37°C the intensity of this second peak increased slightly, whereas the peak at 229.9 m/z was no longer detectable. No peaks were detected in positive mode (not shown).
Although the absolute amounts of the substances cannot be determined by this method,
a qualitative evaluation is possible. The peak at 309.9 m/z in the negative spectra (con-
Buffer
0 min
90 min
Buffer
0 min
90 min
Buffer
0 min
90 min
A
B
C
195.9
195.9229.9
218.09
309.97
309.93
Metamizole – negative mode
Metamizole – positive mode
Sulfathiourea – negative mode
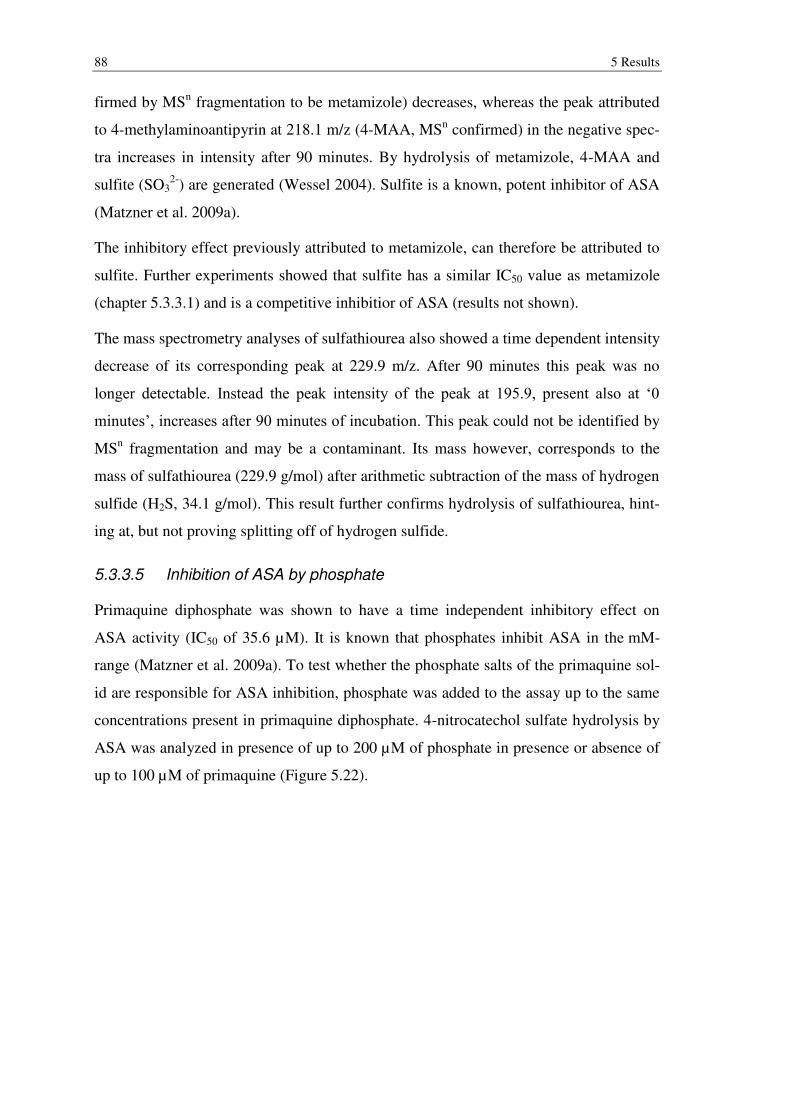
88 5 Results
firmed by MSn fragmentation to be metamizole) decreases, whereas the peak attributed
to 4-methylaminoantipyrin at 218.1 m/z (4-MAA, MSn confirmed) in the negative spec-
tra increases in intensity after 90 minutes. By hydrolysis of metamizole, 4-MAA and
sulfite (SO32-) are generated (Wessel 2004). Sulfite is a known, potent inhibitor of ASA
(Matzner et al. 2009a).
The inhibitory effect previously attributed to metamizole, can therefore be attributed to
sulfite. Further experiments showed that sulfite has a similar IC50 value as metamizole
(chapter 5.3.3.1) and is a competitive inhibitior of ASA (results not shown).
The mass spectrometry analyses of sulfathiourea also showed a time dependent intensity
decrease of its corresponding peak at 229.9 m/z. After 90 minutes this peak was no
longer detectable. Instead the peak intensity of the peak at 195.9, present also at ‘0
minutes’, increases after 90 minutes of incubation. This peak could not be identified by
MSn fragmentation and may be a contaminant. Its mass however, corresponds to the
mass of sulfathiourea (229.9 g/mol) after arithmetic subtraction of the mass of hydrogen
sulfide (H2S, 34.1 g/mol). This result further confirms hydrolysis of sulfathiourea, hint-
ing at, but not proving splitting off of hydrogen sulfide.
5.3.3.5 Inhibition of ASA by phosphate
Primaquine diphosphate was shown to have a time independent inhibitory effect on
ASA activity (IC50 of 35.6 µM). It is known that phosphates inhibit ASA in the mM-
range (Matzner et al. 2009a). To test whether the phosphate salts of the primaquine sol-
id are responsible for ASA inhibition, phosphate was added to the assay up to the same
concentrations present in primaquine diphosphate. 4-nitrocatechol sulfate hydrolysis by
ASA was analyzed in presence of up to 200 µM of phosphate in presence or absence of
up to 100 µM of primaquine (Figure 5.22).
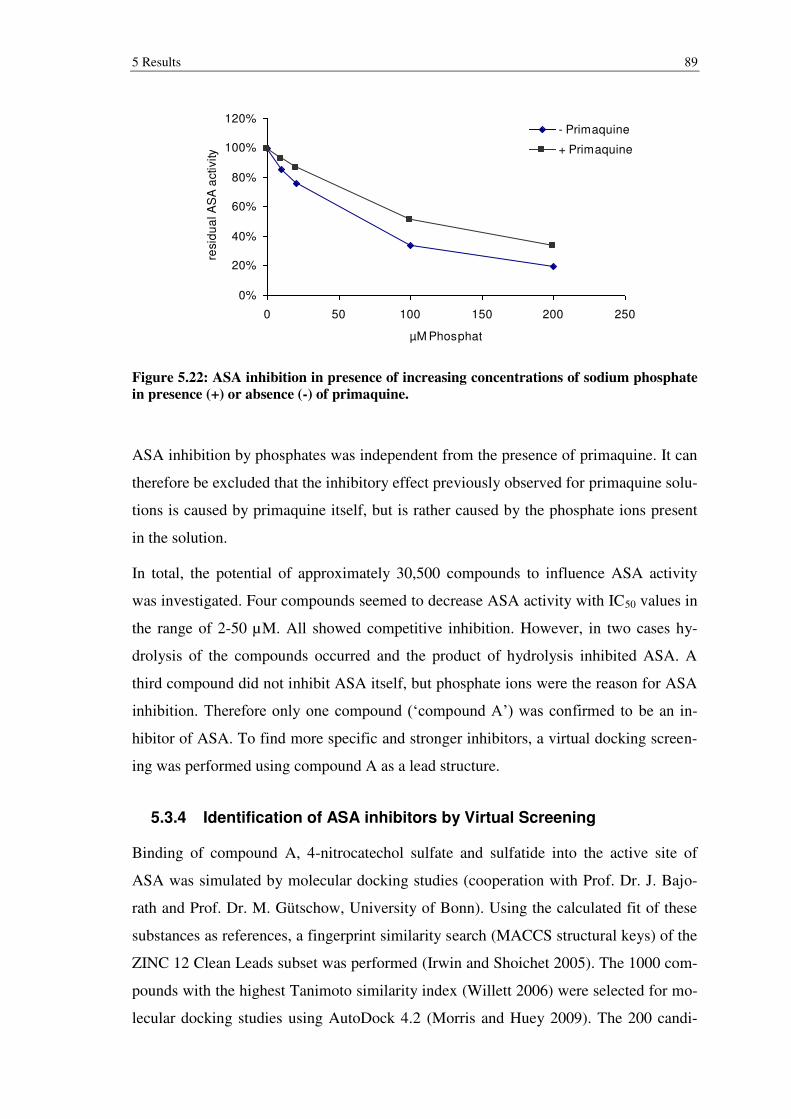
5 Results 89
Figure 5.22: ASA inhibition in presence of increasing concentrations of sodium phosphate
in presence (+) or absence (-) of primaquine.
ASA inhibition by phosphates was independent from the presence of primaquine. It can
therefore be excluded that the inhibitory effect previously observed for primaquine solu-
tions is caused by primaquine itself, but is rather caused by the phosphate ions present
in the solution.
In total, the potential of approximately 30,500 compounds to influence ASA activity
was investigated. Four compounds seemed to decrease ASA activity with IC50 values in
the range of 2-50 µM. All showed competitive inhibition. However, in two cases hy-
drolysis of the compounds occurred and the product of hydrolysis inhibited ASA. A
third compound did not inhibit ASA itself, but phosphate ions were the reason for ASA
inhibition. Therefore only one compound (‘compound A’) was confirmed to be an in-
hibitor of ASA. To find more specific and stronger inhibitors, a virtual docking screen-
ing was performed using compound A as a lead structure.
5.3.4 Identification of ASA inhibitors by Virtual Screening
Binding of compound A, 4-nitrocatechol sulfate and sulfatide into the active site of
ASA was simulated by molecular docking studies (cooperation with Prof. Dr. J. Bajo-
rath and Prof. Dr. M. Gütschow, University of Bonn). Using the calculated fit of these
substances as references, a fingerprint similarity search (MACCS structural keys) of the
ZINC 12 Clean Leads subset was performed (Irwin and Shoichet 2005). The 1000 com-
pounds with the highest Tanimoto similarity index (Willett 2006) were selected for mo-
lecular docking studies using AutoDock 4.2 (Morris and Huey 2009). The 200 candi-
0%
20%
40%
60%
80%
100%
120%
0 50 100 150 200 250
µM Phosphat
resid
ua
l A
SA
activity
- Primaquine
+ Primaquine
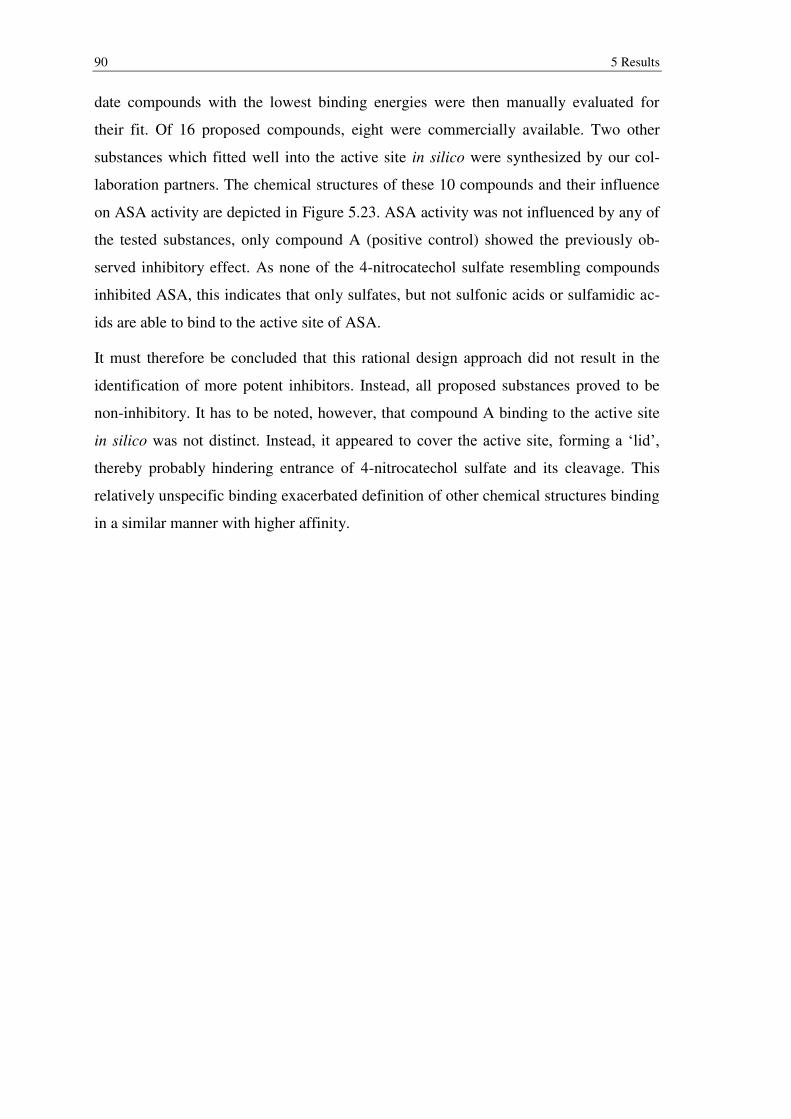
90 5 Results
date compounds with the lowest binding energies were then manually evaluated for
their fit. Of 16 proposed compounds, eight were commercially available. Two other
substances which fitted well into the active site in silico were synthesized by our col-
laboration partners. The chemical structures of these 10 compounds and their influence
on ASA activity are depicted in Figure 5.23. ASA activity was not influenced by any of
the tested substances, only compound A (positive control) showed the previously ob-
served inhibitory effect. As none of the 4-nitrocatechol sulfate resembling compounds
inhibited ASA, this indicates that only sulfates, but not sulfonic acids or sulfamidic ac-
ids are able to bind to the active site of ASA.
It must therefore be concluded that this rational design approach did not result in the
identification of more potent inhibitors. Instead, all proposed substances proved to be
non-inhibitory. It has to be noted, however, that compound A binding to the active site
in silico was not distinct. Instead, it appeared to cover the active site, forming a ‘lid’,
thereby probably hindering entrance of 4-nitrocatechol sulfate and its cleavage. This
relatively unspecific binding exacerbated definition of other chemical structures binding
in a similar manner with higher affinity.
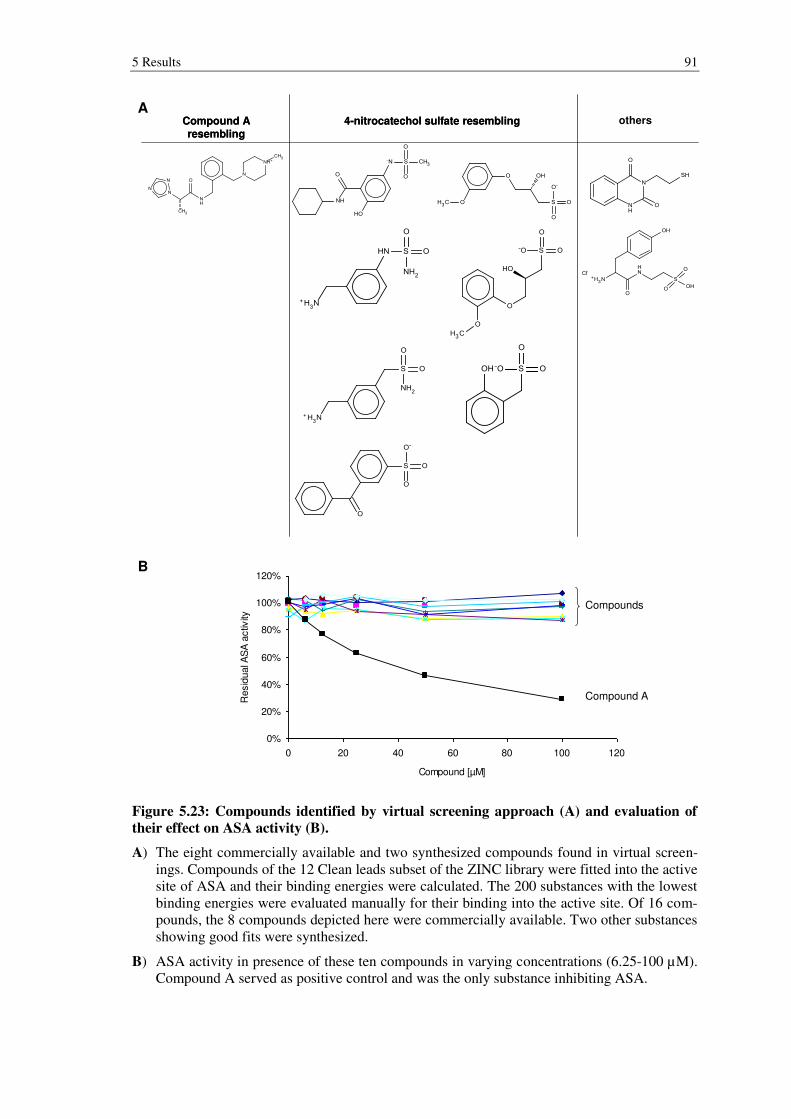
5 Results 91
Figure 5.23: Compounds identified by virtual screening approach (A) and evaluation of
their effect on ASA activity (B).
A) The eight commercially available and two synthesized compounds found in virtual screen-ings. Compounds of the 12 Clean leads subset of the ZINC library were fitted into the active site of ASA and their binding energies were calculated. The 200 substances with the lowest binding energies were evaluated manually for their binding into the active site. Of 16 com-pounds, the 8 compounds depicted here were commercially available. Two other substances showing good fits were synthesized.
B) ASA activity in presence of these ten compounds in varying concentrations (6.25-100 µM). Compound A served as positive control and was the only substance inhibiting ASA.
4-nitrocatechol sulfate resemblingCompound A
resembling
4-nitrocatechol sulfate resemblingCompound A
resembling
others
0%
20%
40%
60%
80%
100%
120%
0 20 40 60 80 100 120
Compound [µM]
Resid
ual A
SA
activ
ity
A
B
Compounds
Compound A
92 5 Results
Compound A remains the only confirmed inhibitor of ASA. This compound had an IC50
value of 49.1 µM and was proven to be a competitive inhibitor. Inhibition was not spe-
cific for ASA, as also ASB was inhibited at similar inhibitor concentrations.
To find more active and/or more specific inhibitors of ASA, further libraries may be
screened using the here established ASA inhibition assay. Moreover, the here identified
inhibitor may be used as a lead structure for further virtual screenings. The chemical
structure of compound A may be modified at different parts of the molecule followed
by empirically testing for inhibitory potential. This would allow identification of more
active substances step by step.
Moreover, compound A is to be used in cell culture experiments in the future to evalu-
ate its efficacy of inhibiting ASA in vitro. Further cell culture experiments using cells
expressing mutant, inactive ASA that is degraded by the ERAD, are then to be treated
with the inhibitor. It will have to be investigated whether compound A can function as a
chaperone to ASA, thereby increasing the transport of functional ASA to the lysosomal
compartment. Before conducting in vivo experiments, the ability of compound A to
traverse the BBB will be analyzed in a well established porcine BBB model (Prof. H.-J.
Galla, Münster).
6 Discussion 93
6 Discussion
6.1 Enzyme replacement therapy and use of nanoparticles
Although ERT is a common approach to treat lysosomal storage disorders, its use for
diseases with CNS pathology is limited by the impermeability of the BBB. Therefore,
only high dose treatment with intravenously injected ASA has led to improvements in a
mouse model of MLD in terms of sulfatide storage and performance in behavioral tests
(Matzner et al. 2005; Matzner et al. 2009b). However, therapeutic benefits are out-
weighed by the costs of high dose treatment posing yearly costs of several million € per
year and patient – global treatment of MLD would not be possible. It is consequently
necessary to reduce the amounts of ASA needed for treatment. This can only be
achieved by surmounting the BBB, one of the ‘holy grails’ of modern medicine.
Many strategies to increase brain delivery have been proposed in the past decades. Two
of them were investigated in this work in detail to be used for ERT of MLD. The first
strategy is the use of polymeric nanoparticles to transport drugs into the brain. Second-
ly, shielding of M6P residues of recombinant ASA was performed to decrease uptake
by peripheral cells and increase brain delivery by prolonging the blood circulation
times.
Numerous nanoparticle preparations have been described to reach the brain. Recently,
1481 publications (1970-2012) attributed to the field of brain delivery and targeting of
drugs or drug delivery systems were screened (Kozlovskaya and Stepensky 2013). Only
a fraction of all publications (< 123) described the portion of drugs found in the brain
quantitatively after parenteral administration using different nanoparticle systems (Fig-
ure 6.1). Curiously, the percentage of the drug dose found in the brain using nanoparti-
cles ranges from less than 0.01% to more than 10% in these publications. This hetero-
geneity is attributed to several factors. For instance, the authors state that in the majority
of the publications drugs and nanoparticles left in the circulation system are not re-
moved by (transcardial) perfusion before dissecting the brain and analyzing its drug
content and may therefore overestimate the percentage of the drug dose in the brain.
Also, due to limitations of the applied analytical methods, a significant number of stud-
ies may have over- or underestimated the percentage of the drug dose in the brain.
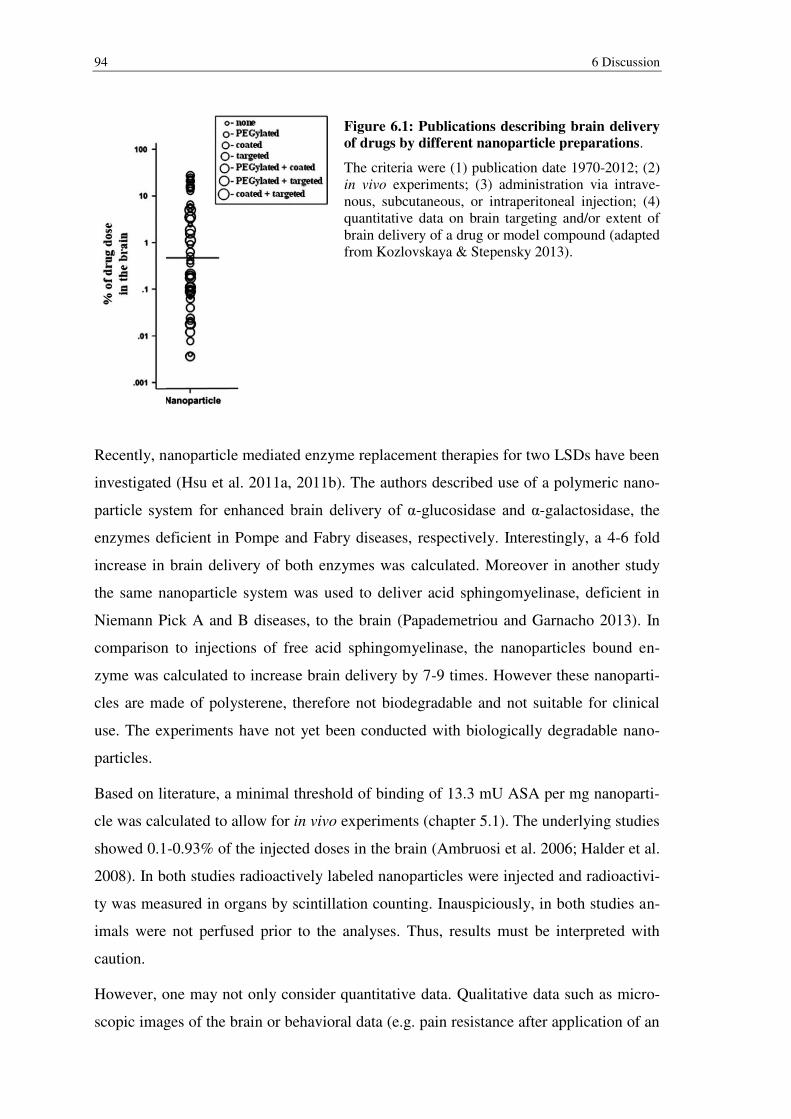
94 6 Discussion
Figure 6.1: Publications describing brain delivery
of drugs by different nanoparticle preparations.
The criteria were (1) publication date 1970-2012; (2) in vivo experiments; (3) administration via intrave-nous, subcutaneous, or intraperitoneal injection; (4) quantitative data on brain targeting and/or extent of brain delivery of a drug or model compound (adapted from Kozlovskaya & Stepensky 2013).
Recently, nanoparticle mediated enzyme replacement therapies for two LSDs have been
investigated (Hsu et al. 2011a, 2011b). The authors described use of a polymeric nano-
particle system for enhanced brain delivery of α-glucosidase and α-galactosidase, the
enzymes deficient in Pompe and Fabry diseases, respectively. Interestingly, a 4-6 fold
increase in brain delivery of both enzymes was calculated. Moreover in another study
the same nanoparticle system was used to deliver acid sphingomyelinase, deficient in
Niemann Pick A and B diseases, to the brain (Papademetriou and Garnacho 2013). In
comparison to injections of free acid sphingomyelinase, the nanoparticles bound en-
zyme was calculated to increase brain delivery by 7-9 times. However these nanoparti-
cles are made of polysterene, therefore not biodegradable and not suitable for clinical
use. The experiments have not yet been conducted with biologically degradable nano-
particles.
Based on literature, a minimal threshold of binding of 13.3 mU ASA per mg nanoparti-
cle was calculated to allow for in vivo experiments (chapter 5.1). The underlying studies
showed 0.1-0.93% of the injected doses in the brain (Ambruosi et al. 2006; Halder et al.
2008). In both studies radioactively labeled nanoparticles were injected and radioactivi-
ty was measured in organs by scintillation counting. Inauspiciously, in both studies an-
imals were not perfused prior to the analyses. Thus, results must be interpreted with
caution.
However, one may not only consider quantitative data. Qualitative data such as micro-
scopic images of the brain or behavioral data (e.g. pain resistance after application of an
6 Discussion 95
analgesic drug) are also valuable, especially as behavioral assays prove functionality of
the administered drug (van Rooy et al. 2011). Several qualitative studies were able to
prove brain delivery of PBCA- (Reimold et al. 2008; Andrieux and Couvreur 2009;
Reukov et al. 2010), PLA- and PLGA (Gelperina et al. 2010; Li et al. 2011; Chaturvedi
et al. 2014), as well as HSA-nanoparticles (Hoffmann et al. 2006; Ulbrich et al. 2009;
Zensi et al. 2009).
6.1.1 Choice of nanoparticles
Different sizes, core materials and surface modifications have been studied in last dec-
ades to increase brain delivery of therapeutics. For ERT repeated injections of recombi-
nant enzyme over long periods of time are necessary. Therefore, nanoparticles used for
ERT need to be biodegradable; otherwise their accumulation over time may lead to ad-
verse effects. All nanoparticles used in this work fulfill this criterion. Poly(acryl cy-
anoacrylate)-, HSA- and PLA-containing nanoparticles are physiologically degraded by
esterases, cathepsin B and hydrolysis, respectively (Kreuter et al. 2007; Andrieux and
Couvreur 2009; Samarajeewa et al. 2012).
In most studies of polymeric nanoparticles for brain delivery, their average diameter is
in the range of 50-400 nm (Wohlfart et al. 2011). Accordingly, only nanoparticles in the
range of 75-357 nm were used here.
The most important factor for tissue targeting of nanoparticles appears to be their sur-
face characteristics – these play important roles in respect to biodistribution (Aggarwal
et al. 2009). Brain targeting has been reported in multiple studies by using polysorbate
80- or poloxamer 188-surfactant coating. Interestingly, the efficiency of surfactant me-
diated brain delivery depends on the employed core material. Best brain delivery of
PBCA-nanoparticles was observed after polysorbate 80-coating, other classes of surfac-
tants led to poor brain delivery (Kreuter et al. 1997). HSA nanoparticles have also been
surfactant coated to increase brain delivery using polysorbate 80 (Michaelis et al. 2006;
Avachat et al. 2014). In case for PLA- and PLGA-nanoparticles poloxamer 188-
surfactant coating resulted in superior brain delivery versus polysorbate 80-coating
(Gelperina et al. 2010), although another study also proved significant brain delivery by
means of polysorbate 80-coated PLGA-nanoparticles (Chaturvedi et al. 2014). Accord-
ingly, in this work HSA- and PBCA-nanoparticles were surfactant-coated with poly-
sorbate 80, whereas for PLA- and PLGA-nanoparticles poloxamer 188 was used.
96 6 Discussion
6.1.2 Strategies to combine ASA and nanoparticles
To bind ASA to these nanoparticles, all three possible approaches were investigated –
inclusion during the production of the nanoparticles, passive adsorption and covalent /
high affinity-binding to the nanoparticles surface.
6.1.2.1 Incorporation into PBCA-, PLA- and PLGA-nanoparticles
Inclusion of drugs and their brain delivery is frequently described in literature. Howev-
er, the drugs incorporated are usually small, e.g. the anthracycline doxorubicin (Gulyaev
et al. 1999; Dreis et al. 2007) or paclitaxel (Sahoo and Labhasetwar 2005; Ren et al.
2011). Proteins, like ASA, need to retain their tertiary structure to fulfill their function.
Protein stability depends mainly on the solvents used in the production process of nano-
particles as the interface between water and a solvent is a well-known destabilizing fac-
tor. Ethyl acetate has been described to cause less protein denaturation than other sol-
vents for encapsulation in microspheres (Bilati et al. 2005).
Here, ASA was shown to be unstable in presence of solvents (e.g. ethyl acetate) and
solutions used for nanoparticle formation (Figure 5.1, results). Consequently, ASA can-
not be incorporated into PBCA-, PLA- and PLGA-nanoparticles. Incorporation into
HSA nanoparticles is not possible as glutaraldehyde is used to covalently connect pri-
mary amine groups of HSA (Langer et al. 2003). As ASA also displays primary amine
groups, these would be covalently bound. Besides possibly abolishing ASA activity,
release of bound ASA could not occur.
6.1.2.2 Adsorption to PBCA-, PLA- and PLGA-nanoparticles
Adsorption of various drugs to nanoparticles for brain delivery has been shown in sev-
eral studies. 277 molecules of the lysosomal enzyme α-glucosidase were adsorbed per
non-biodegradable polystyrene, Intercellular Adhesion Molecule 1 (ICAM-1) modified
nanoparticle and evidence for their brain delivery was found (Hsu et al. 2011a). Koffie
and colleagues adsorbed BBB-impermeable fluorophores, MRI contrast agents, but
most importantly also therapeutic antibodies to PBCA nanoparticles and found evidence
for their brain delivery after polysorbate 80 surfactant coating (Koffie et al. 2011).
Moreover, nerve growth factor (NGF) was transported into the brain using the same
delivery system (Kurakhmaeva et al. 2009). However, these studies did not analyze the
release of these proteins in presence of serum.
6 Discussion 97
Naturally, success of protein adsorption and release in serum depends on the surface
characteristics of the nanoparticle system as well as the protein itself. In case of PBCA-
nanoparticles, only little ASA activity was found to be in the pellet. To prove that no
ASA was bound instead of bound ASA becoming inactive, immunoblot analyses
against ASA were performed (Figure 5.2, B). No signal was detectable in the pellets,
proving that in fact no ASA was bound. This is in contrast to findings of Kurakhmaeva
et al., 2009 who showed binding of 2.4 µg of NGF per mg nanoparticle. However, NGF
is smaller than ASA (27 kDa versus 57 kDa, respectively) and has an alkaline isoelec-
tric point (pI) in contrast to the acidic pI of ASA (pI 9.94 versus 5.65, respectively; the-
oretical calculations based on the primary amino acid sequences performed using the
ExPASy pI/MW calculator); both factors influence adsorption yields.
In contrast, up to 200 mU, corresponding to 5 µg of ASA were adsorbed per mg of
PLA- and PLGA-nanoparticles. However, when these nanoparticles were subjected to
incubation in serum, release of adsorbed ASA occurred rapidly, as even after the short-
est incubation time (‘0 min’, immediately centrifuged after resuspension in serum) all of
the adsorbed ASA was found in the supernatant. This was true for all PLA- and PLGA-
nanoparticle preparations tested, rendering them useless for in vivo studies.
It is long known that plasma proteins interact with nanoparticles. Which proteins adsorb
depends on the surface characteristics influenced by addition of surfactants and the size
of the nanoparticles (Lück et al. 1998; Cedervall et al. 2007; Walkey and Chan 2012;
Sempf et al. 2013). It is highly likely that the ASA desorption observed in presence of
serum is induced by competition for binding sites with plasma proteins. These proteins
exhibit a higher binding affinity to the nanoparticle surface, thereby promoting rapid
release of ASA into the supernatant.
6.1.2.3 Covalent binding to PLA-nanoparticles
Therefore, more stable binding methods, using direct crosslinking or the high-affinity
neutravidin-biotin system, were investigated with regard to their efficiency of binding
and the release of bound ASA in serum. Both involve the chemical modification of
functional groups on the nanoparticle’s surface. As PBCA nanoparticles can only be
modified under harsh conditions (e.g. Pinner reaction, Oh et al. 2011) and showed high
biotoxicity in the study at hand (chapter 5.1.1) they were disregarded for these experi-
ments. PLA- and PLGA-nanoparticles, however, bear crosslinkable carboxylic groups
on their surfaces (Nobs et al. 2003). Moreover, amine modified nanoparticles are com-
98 6 Discussion
mercially available. Their amine groups were used in a direct covalent crosslinking at-
tempt employing a NHS-maleimide heterobifunctional crosslinker and the thiolated
ASA-variant T365C. This approach led to poor covalent binding (8.9 mU of ASA per
mg nanoparticle) due to the limited amount of crosslinkable functional groups.
6.1.2.4 Covalent binding to HSA-nanoparticles
Therefore, HSA nanoparticles were used for further direct crosslinking attempts, as
these nanoparticles display a high density of amine groups on their surface available for
crosslinking (Michaelis et al. 2006; Zensi et al. 2009). Using a similar crosslinking ap-
proach, employing a NHS-maleimide heterobifunctional crosslinker and thiolated ASA,
340 mU (8.5 µg) of active ASA were bound per mg HSA-nanoparticles. Considering
the molecular weight of ASA (57 kDa), 0.15 nmol of ASA were bound per mg nanopar-
ticle. Similar binding yields (0.37 nmol per mg) were found using neutravidin by Mich-
aelis et al. (2006). In contrast to ASA bound by adsorption, this ASA-HSA nanoparticle
formulation did not release ASA in presence of serum, confirming covalent binding and
most importantly, allowing for in vivo studies.
6.1.2.5 High affinity binding to PLA- and PLGA-nanoparticles
As direct covalent binding of ASA to amine-modified PLGA-nanoparticles was poor,
an amplification step had to be inserted. To this end the neutravidin-biotin system was
used as one molecule of neutravidin (tetramer) can bind up to four biotinylated mole-
cules. Covalent binding of neutravidin to PLA-nanoparticles followed by high affinity
binding of biotinylated molecules has previously been performed (Nobs et al. 2004). In
this work, PLA- and PLGA-nanoparticles were modified using the same protocol. Bio-
tinylated ASA was bound to these nanoparticles. The success of this method was ana-
lyzed by determination of nanoparticle bound ASA activity. On average 37 ± 19.7 mU
of ASA were bound per mg to HSA stabilized PLA-/PLGA-nanoparticles. Taking the
specific activity of ASA (40 mU/µg) and its molecular weight (57 kDa), as well as the
average diameter of nanoparticles (200 nm) and their reported polymer densities (1.25
and 1.2 g/cm3 for PLA and PLGA-, respectively, Vauthier et al. 1999) into account, 23
molecules of biotinylated ASA were bound per (HSA-stabilized) nanoparticle. Howev-
er, binding did not occur via the carboxylic groups of the PLA-/PLGA-nanoparticles,
but via amine groups of the HSA used for the stabilization of the nanoparticles in their
production process as figure 5.6 suggests.

6 Discussion 99
In contrast, Nobs et al. (2004) report covalent attachment of up to 975 molecules of neu-
travidin per PLA-nanoparticle. However, the authors state that each neutravidin tetram-
er merely bound 1.8 (instead of 4) biotinylated molecules. Taking these numbers into
account up to 440 biotinylated molecules may have been bound per nanoparticle.
The yields found in the study on hand correspond to only 5% of the previously reported.
These deviant findings may be due to three factors. First of all, ASA is considerably
larger than biotin-4-fluorescein or D-biotin used to assess biotin binding properties in
the previously cited study. This difference in size may cause steric hindrance resulting
in less biotinylated ASA bound per nanoparticle-bound neutravidin. Secondly, binding
of ASA may be underestimated in this work, as inactive, bound ASA is not considered.
Thirdly, binding of biotinylated molecules to the neutravidin-modified nanoparticles
may have been drastically overestimated by Nobs et al. (2004): Both in their study, as
well as in this work, physical instability of neutravidin was observed – agglomeration of
neutravidin was evident. In contrast to the experiments performed in this work, these
agglomerates were not removed before incubation with nanoparticles in the cited study.
Subsequently, neutravidin agglomerates and nanoparticles were probably coprecipitated
in the following centrifugation steps. Excess neutravidin was therefore likely still pre-
sent when conducting experiments to determine yields of bound neutravidin and biotin.
This may explain the significantly higher amounts of binding found by Nobs et al.
(2004) in comparison to the findings shown in this work.
Although considerably lower amounts of ASA were bound per neutravidin-modified
PLA- and PLGA-nanoparticle than would have been expected based on the literature,
binding of biotinylated ASA was stable in presence of serum. Consequently the nano-
particle formulations were suitable for in vivo studies.
In summary only stable binding to the nanoparticles surface allowed for in vivo studies.
Strategies to encapsulate ASA during the nanoparticle production process and non-
specific adsorption to their surface was shown to either result in depletion of ASA activ-
ity or in rapid and complete desorption in presence of serum.
100 6 Discussion
6.1.3 In vivo experiments with nanoparticles
6.1.3.1 Biotolerance of non-loaded PBCA-, HSA-, PLA- and PLGA-
nanoparticles
In initial in vivo experiments empty polysorbate 80-surfactant coated PBCA- and HSA-,
as well as poloxamer 188-surfactant coated PLGA-nanoparticles were tested for their
biotoxicity in ASA-/- mice. In concordance to published results no adverse effects were
observed at doses of 100 and 300 mg per kg body weight for HSA- and PLGA-
nanoparticles, respectively (Michaelis et al. 2006, Material Safety Data Sheet for
RESOMER®, Sigma).
In contrast, a dose of 200 mg per kg body weight of polysorbate 80 coated PBCA-
nanoparticles was lethal. Reducing the dose by half still led to serious adverse effects,
but not to death of the treated mice. The LD50 of orally administered polysorbate 80 is
reported to be 25 g/kg in mice (Material Safety Data Sheet, Sigma Aldrich), therefore
the concentration of 0.1 g/kg intravenously administered in this experiment is unlikely
to be the cause for the observed adverse effects. Also, no side effects were noted after
intravenous injections of polysorbate 80 coated HSA-nanoparticles. Instead the PBCA-
nanoparticles are responsible for the biotoxicity observed. At relatively low doses of 33
mg/kg of PBCA nanoparticles injected intravenously, no adverse effects were reported
(Ambruosi et al. 2005). However, another study found the LD50 of PBCA-nanoparticles
to be 230 mg per kg body weight (Couvreur et al. 1982), which is a similar concentra-
tion to the one used here. Biotoxicity and its possible influence on the BBB integrity at
lower concentration have been discussed in the literature (Olivier et al. 1999). In one
study it was shown that polysorbate 80 coated PBCA nanoparticles (13.3 µg/mL) in-
duced a reversible disruption in an in vitro model of the BBB (Rempe et al. 2011).
Besides lack of ASA activity after incubation in 1% dextran, 10 mM HCl, the solvent
for PBCA-nanoparticle formation, and low yields of ASA adsorption, their low biotol-
erance render PBCA-nanoparticles unfeasible for use in ERT with ASA. HSA- and
PLA-/PLGA- nanoparticles, however, show high biotolerance and may be well suited
for this purpose.
6.1.3.2 Biodistribution of ASA covalently bound to HSA-nanoparticles
The biodistribution studies in ASA-/- mice performed using ASA covalently bound to
HSA-nanoparticles, surfactant coated with polysorbate 80, showed a difference in tissue
6 Discussion 101
distribution of nanoparticle bound ASA in comparison to free ASA. In comparison to
free ASA injections, uptake by cells of the MPS was even less for nanoparticle bound
ASA as levels in liver, spleen and kidney were reduced. However, contrary to the work-
ing hypothesis, brain delivery of nanoparticle bound ASA was not higher than that of
free ASA.
This result contradicts the previous findings (Michaelis et al. 2006). In their study the
opiate loperamide was adsorbed to HSA nanoparticles. After surfactant coating with
polysorbate 80 and tail-vein injection into mice, a strong analgesic effect, as measured
by the tail-flick test, was observed after 15-45 minutes, indicating brain delivery of
loperamide. It has to be noted, however, that loperamide is able to cross the endothelial
layer of the BBB. The reason for lack of transport into the CNS of free loperamide is
that it is a substrate of efflux transporters, such as P-glycoprotein, and is actively trans-
ported back into the blood stream (Upton 2007). Interestingly, it has been shown in in
vitro experiments using the adenocarcinoma cell line Caco-2 that polysorbate 80 may be
a P-glycoprotein inhibitor (Hugger et al. 2002). Therefore brain delivery of loperamide
may not be mediated by the HSA-nanoparticles, but by polysorbate 80 in the study of
Michaelis et al. (2006). Unfortunately no control injections of loperamide and polysorb-
ate 80 without nanoparticles were performed.
Notably, this nanoparticle system using polysorbate 80-coated HSA-nanoparticles has
not been used in further studies. Instead direct, covalent attachment of apolipoproteins
has been used to deliver substances into the brain, as has also initially been shown by
Michaelis et al. (2006). Brain delivery of this nanoparticle formulation was further
strengthened by electronmicroscopic analyses (Zensi et al. 2009). The use of this system
has not been evaluated here, as amounts of covalently attached ASA would be expected
to be decreased as also amine groups are used for crosslinking.
6.1.3.3 Biodistribution of ASA bound to PLA-nanoparticles by high affinity
As observed for HSA-nanoparticles before, PLA-nanoparticle bound ASA resulted in a
different biodistribution in comparison to free ASA. Tissue levels of ASA two hours
after injections of this nanoparticle formulation were increased in spleen and lungs in
comparison to injections of free ASA. Although tissue levels of nanoparticle bound
ASA were significantly decreased in the liver, these findings hint at clearance by cells
of the MPS. Most importantly, however, no increased brain delivery of ASA was ob-
served when using this nanoparticle preparation.
102 6 Discussion
Both ASA nanoparticle preparations used for biodistribution studies were less detecta-
ble in the ASA-ELISA than free ASA. As described in the results section the ASA con-
centrations in the brain after the neutravidin-nanoparticle preparation were below the
detection limit. To evaluate ASA brain delivery of nanoparticle bound ASA, the inject-
ed dose would need to be increased in order to reach the detection limit. Increasing the
dose of nanoparticles may, however, lead to adverse effects and is limited by the injec-
tion volume. Instead, the aim must be to increase the yields of ASA binding to nanopar-
ticles or to find other, more sensitive ways to detect nanoparticle bound ASA or the na-
noparticles themselves (e.g. by radioactive labeling).
However, the results allow the calculation that the increase in nanoparticle mediated
brain delivery of ASA was below 27-fold. Considering the findings of other studies
mentioned before nanoparticle mediated brain delivery of ASA was expected to be up to
200-fold higher than that of free ASA (chapter 5.1). However, as stated above, literature
may partly overestimate the brain delivery of drugs, e.g. by disregarding perfusion or by
using imprecise or inadequate detection methods. Here, in contrast, transcardially perfu-
sion was performed. Moreover the detection assay (ASA-ELISA) used here is sensitive,
reproducible and robust and has been used frequently in our working group to detect
ASA in tissue homogenates (Matzner et al. 2000; Matzner et al. 2005; Matthes et al.
2011; Böckenhoff et al. 2014).
In case of the neutravidin-nanoparticle formulation the possible clearance by cells of the
MPS and decreased brain uptake may indicate that surfactant coating using poloxamer
188 was impeded. Possibly, modification of the surface of the nanoparticles using neu-
travidin and biotinylated ASA changes or prevents the binding of poloxamer 188. Con-
sequently, opsonins may bind to the nanoparticles surface thereby triggering uptake by
macrophages of the MPS. More importantly, adsorption of serum-apolipoproteins to
these nanoparticles would be expexted to be reduced. Reduced or abolished adsorption
of apolipoproteins would be detrimental for brain delivery as this process supposedly
enables LDL-receptor-mediated transcytosis across the BBB.
Another reason both for decreased brain delivery and increased uptake by cells of the
MPS could be the size of nanoparticles. After modification with neutravidin, Nobs et al.
(2004) report a moderate increase in diameter from 276 to 322 nm. However, as stated
before, the amount of neutravidin bound may have been less than the authors state.
Michaelis et al. (2006), who covalently bound neutravidin to HSA-nanoparticles, do not
6 Discussion 103
mention an increase in size. In the study on hand, an agglomeration of neutravidin mod-
ified nanoparticles was observed. Therefore directly before injections, nanoparticles
were treated with ultrasound, which reversed agglomeration (not shown). Nonetheless,
an increase in size or partial agglomeration may have occurred. However, Voigt et al.
(2014) state that the surface characteristics of nanoparticle formulations have a stronger
influence on brain delivery than their size.
Besides the described reasons of impeded surfactant coating and increased size, one
further explanation for failure in brain delivery may be that by binding ASA to their
surface, nanoparticles obtain a new targeting moiety, influencing their biodistribution
stronger than the surfactant. ASA displays M6P residues. These residues are recognized
by MPRs, ubiquitously expressed on the cell surfaces throughout the body. Therefore
uptake of ASA-nanoparticles by MPR-mediated endocytosis by peripheral cells may
impede their brain delivery by removing them from the blood stream.
6.2 Physical shielding of the M6P residues of ASA
Based on this hypothesis, a novel approach was pursued. The M6P-residues of ASA
were to be physically shielded in order to increase blood circulation times, decrease
uptake by peripheral cells and allow for surfactant/nanoparticle mediated brain target-
ing.
It has already been shown that by chemically modifying the M6P residues of β-
glucuronidase its serum half-life time was increased 100-fold (from 0.2 to 18.5 hours).
As Grubb et al. (2008) state, this effect resulted in 5.7-fold more β-glucuronidase in the
brain in comparison to non-modified β-glucuronidase. Exploiting this effect in combina-
tion with nanoparticle mediated brain targeting may potentiate this increase several-
fold.
However, chemical modification of lysosomal enzymes is irreversible and also influ-
ences their lysosomal stability after pinocytosis. Moreover, in case of ASA, chemical
modification using sodium periodate leads to loss of its activity (Matthes 2010). There-
fore a different strategy was pursued here. Instead of chemical modification, physical
shielding of M6P residues was performed. To this end the M6P binding domain 9 of the
human MPR300 was used. The domain 9 of the bovine MPR300 has previously been
reported to bind with high affinity towards two other lysosomal proteins, acid alpha-
glucosidase and beta-glucuronidase (Bohnsack et al. 2009). Not only should shielding
104 6 Discussion
of ASA result in similar effects concerning blood circulation times and brain delivery as
observed after chemical modification of β-glucuronidase, but once ASA is taken up by
cells, the binding domain used for shielding should dissociate due to a pH drop in the
endosome consequently releasing unmodified ASA. Thus, after transcytosis at the BBB,
released, unmodified ASA would be delivered to the brain. Uptake of the unmodified
ASA by cells of the brain could then occur via MPR-mediated endocytosis. In contrast
to chemically modified enzyme, no decreased lysosomal stability would be expected.
To avoid immunogenic complications in future in vivo studies, a non-glycosylated form
of the receptor fragment was produced. To that end three constructs besides the wt con-
struct were generated. Two of these lacked either one, and the third lacked both N-
glycosylation sites as was confirmed by EndoHf digest. The KD values of all four con-
structs were in the range of 30.2-56.6 nM. These findings are similar to the KD observed
by Bohnsack et al. (2009) for the recombinantly produced domain 9 of the bovine
MPR300 towards acid α-glucosidase and β-glucuronidase (71 ± 20 nM). The slightly
higher affinity of binding towards ASA observed here may have its cause in the use of a
different KD determination method, species-dependent differences in the primary se-
quences of the domain 9 or use of a different lysosomal enzyme (ASA instead of acid α-
glucosidase or β-glucuronidase).
The non-glycosylated receptor fragment construct was then analyzed with respect to
dissociation from ASA in dependence of the pH. Although a pH-dependence was clear,
dissociation both under acidic (pH 5.0) and alkaline conditions (pH 8-9) was moderate
with approximately 50% and 20-30% respectively. Only little dissociation occurred at
pH 6-7.4. This result is directly comparable with the observations of Gonzalez-Noriega
et al., 1980, where the effect of the pH on the dissociation of β-glucuronidase from
MPR300 on the cell surface was investigated (Figure 6.2, B) (Gonzalez-Noriega et al.
1980). In their study binding was stable at pH 7.0 (10% dissociation), but approximately
80% and 60% dissociation were observed at pH 5.0 and 9.0, respectively. As less disso-
ciation was found in this work using the isolated domain 9 of the MPR300, the pH de-
pendent release must be partially mediated by another domain.
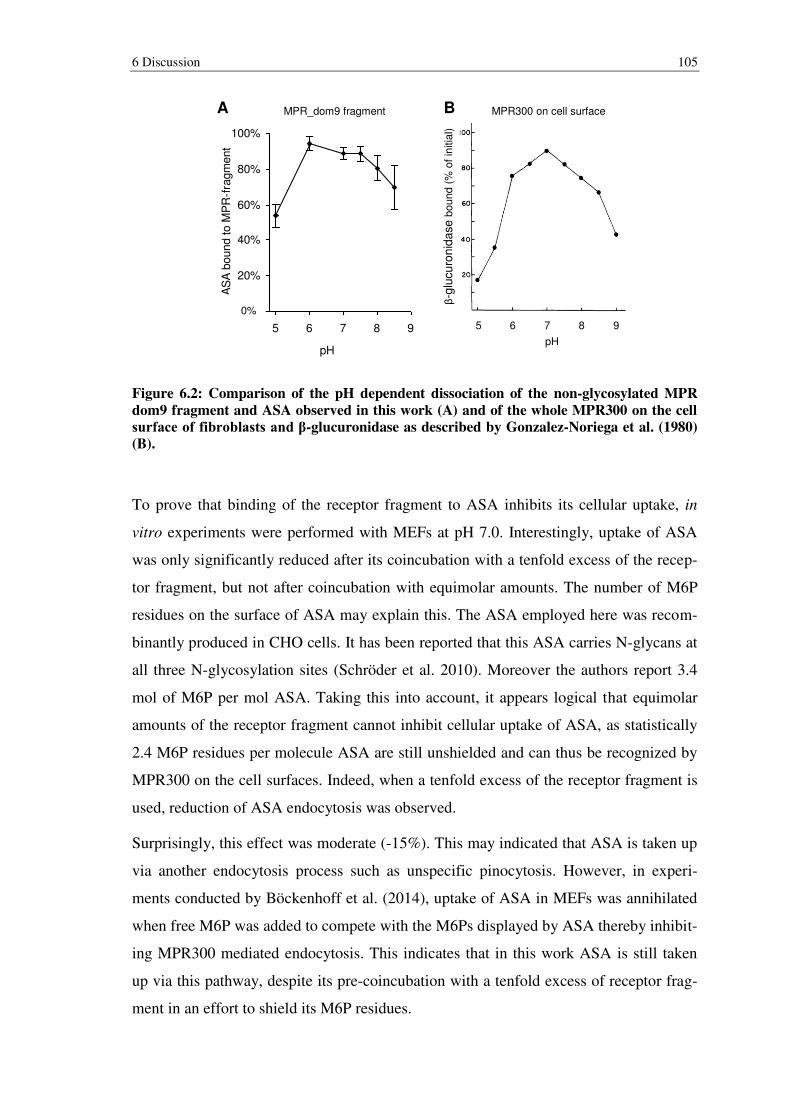
6 Discussion 105
Figure 6.2: Comparison of the pH dependent dissociation of the non-glycosylated MPR
dom9 fragment and ASA observed in this work (A) and of the whole MPR300 on the cell
surface of fibroblasts and β-glucuronidase as described by Gonzalez-Noriega et al. (1980)
(B).
To prove that binding of the receptor fragment to ASA inhibits its cellular uptake, in
vitro experiments were performed with MEFs at pH 7.0. Interestingly, uptake of ASA
was only significantly reduced after its coincubation with a tenfold excess of the recep-
tor fragment, but not after coincubation with equimolar amounts. The number of M6P
residues on the surface of ASA may explain this. The ASA employed here was recom-
binantly produced in CHO cells. It has been reported that this ASA carries N-glycans at
all three N-glycosylation sites (Schröder et al. 2010). Moreover the authors report 3.4
mol of M6P per mol ASA. Taking this into account, it appears logical that equimolar
amounts of the receptor fragment cannot inhibit cellular uptake of ASA, as statistically
2.4 M6P residues per molecule ASA are still unshielded and can thus be recognized by
MPR300 on the cell surfaces. Indeed, when a tenfold excess of the receptor fragment is
used, reduction of ASA endocytosis was observed.
Surprisingly, this effect was moderate (-15%). This may indicated that ASA is taken up
via another endocytosis process such as unspecific pinocytosis. However, in experi-
ments conducted by Böckenhoff et al. (2014), uptake of ASA in MEFs was annihilated
when free M6P was added to compete with the M6Ps displayed by ASA thereby inhibit-
ing MPR300 mediated endocytosis. This indicates that in this work ASA is still taken
up via this pathway, despite its pre-coincubation with a tenfold excess of receptor frag-
ment in an effort to shield its M6P residues.
0%
20%
40%
60%
80%
100%
4 5 6 7 8 9
pH
AS
A b
ound to M
PR
-fra
gm
ent
0%
pH
5 6 7 8 9
β-g
lucu
ron
ida
se
bound
(% o
f in
itia
l)
MPR_dom9 fragment MPR300 on cell surfaceA B
106 6 Discussion
First of all, endocytosis of the receptor fragment itself could explain this finding. It has
been suggested that the MPR300 forms homodimers (Byrd et al. 2000), therefore the
receptor fragment may form heterodimers with endogenous MPR300 on the cell surface
followed by its endocytosis. However, this possibility was ruled out by performing an
immunoblot against the receptor fragment in supernatants and lysates of treated cells
(Figure 5.12, B). No signal was detected in the lysates, but only in the supernatants,
indicating that the receptor fragment is not endocytosed.
Secondly, the endogenous MPR300 on the cell surfaces may compete for binding to
ASA with the receptor fragment used for physical shielding, thereby triggering endocy-
tosis. As for each receptor-ligand interaction binding of the receptor fragment to ASA is
reversible and thus time dependent. Once a single M6P residue of ASA is released, en-
dogenous MPR300 binding would be more likely than receptor fragment binding due to
its higher affinity. Subsequent endocytosis would remove ASA from the equilibrium.
This notion is supported by findings of Bohnsack et al. (2009), who show that the total
(bovine, soluble) MPR300 has a higher affinity towards M6P bearing acid alpha-
glucosidase than the binding domain 9 alone. Two reasons could explain this higher
affinity: (1) Another receptor domain binds to M6P with higher affinity. This is true as
the domains 1-3 have been reported to bind M6P residues (Bohnsack et al. 2009). (2)
The higher affinity of the endogenous receptor versus the receptor fragment is due to
bivalent binding of two M6P residues per ligand. This also has been confirmed. It is
controversially discussed whether this effect is caused by cooperative binding of two
domains of one receptor molecule or by receptor dimerization (Byrd et al. 2000;
Hartman et al. 2009). Thus, one strategy to reduce endocytosis of physically shielded
ASA may be to decrease the affinity of the endogenous MPR300 towards ASA. This
may be achieved by reducing the number of M6P residues of ASA to one per molecule,
thereby prohibiting bivalent binding of the endogenous MPR300. To that end, an ASA
mutant enzyme with amino acid substitutions at two of the three N-glycosylation sites
could be expressed and purified. Secondly, the same may be achieved by controlled
digest of wt ASA using acid phosphatase 5 (Sun et al. 2008). Alternatively, the affinity
of the receptor fragment towards the M6P residues of ASA may be increased by protein
engineering thereby reducing dissociation and consequently recognition by endogenous
MPRs. Moreover, the whole, soluble MPR300 could be used as its affinity towards
M6P containing proteins is higher than its domain 9 alone. However, the size of this
protein may be disadvantageous.
6 Discussion 107
Finally, dissociation of the receptor fragment from ASA in presence of cell culture me-
dium may explain its MPR300-mediated uptake. The dissociation constant of a ligand
from its receptor is dependent on various properties of the buffer system and other com-
ponents. Moreover, dissociation of the receptor fragment from ASA would be expected
in presence of other, competing ligands.
Indeed, 20.0 ± 1.2% of dissociation of the receptor fragment occurred upon incubation
in cell culture medium. Therefore one or more components of cell culture medium af-
fect binding of the receptor fragment to ASA. Possibly, supplemented FCS (10%, v/v)
caused this effect, as even more dissociation was found upon incubation in 100% mouse
serum: on average, 37.5 ± 10.6% of the initially bound ASA were found to dissociate
from the receptor fragment. First of all, the soluble form of the MPR300 present both in
FCS, and also in (human) serum (Causin et al. 1988; Li et al. 1991), may cause the ob-
served dissociation of the receptor fragment. However, this cannot explain the results of
the endocytosis experiments, as uptake would be expected to be even decreased after
binding of the soluble MPR300 in comparison to the receptor fragment due to its higher
affinity. Secondly, dissociation may be explained by competition of other lysosomal
enzymes present in serum (Koster et al. 1993).
Importantly, the dissociation of the receptor fragment from ASA in presence of mouse
serum limits the applicability of this system for physical shielding of the M6P residues
of ASA in vivo. No relevant decrease of uptake by peripheral cells and thus no in-
creased blood circulation times would be expected, if competition of other lysosomal
enzymes was the cause of the dissociation.
In further studies it was shown that the receptor fragment can be covalently bound to
nanoparticles. The yields of subsequently bound ASA were comparable to the low lev-
els of direct covalent binding of ASA to amine-modified PLGA nanoparticles. Further
crosslinking strategies will be pursued to increase binding. Alternatively, HSA-
nanoparticles could be used to the same end as these carry many primary amine groups
available for crosslinking (compare chapter 5.1.4.1).
The working hypothesis that uptake of physically shielded ASA by MPR-expressing
cells decreases, was verified. However, for use in in vivo studies, the affinities of ASA
towards the receptor fragment need to be increased and/or decreased towards endoge-
nous MPR. First attempts to bind the receptor fragment to nanoparticles have led to
108 6 Discussion
promising results, however binding still needs to be increased to allow for in vivo stud-
ies. When both issues, the dissociation of the receptor fragment in presence of serum
and the low binding of the receptor fragment to nanoparticles, are resolved, this drug
delivery system could not only be used for brain delivery of ASA, but for any lysosomal
protein containing M6P residues.
However, none of the ASA-nanoparticle formulations tested was found to be able to
increase brain delivery in comparison to free ASA. Although several explanations were
found, ultimately the reason for these findings is unclear. As the tested nanoparticulate
drug delivery system did not meet the expectations, others are to be used in the future.
Manifold different nanoparticle surface modifications have been investigated to increase
brain delivery. Possibly, adsorbed or covalently bound targeting moieties such as trans-
ferrin anitibodies or apolipoproteins (Kreuter et al. 2007; Gan and Feng 2010) may be
better suited for brain delivery of nanoparticle bound ASA than surfactant coating. Drug
delivery systems such as nanospheres, liposomes and dendrimers have also been exten-
sively investigated (Kozlovskaya and Stepensky 2013) and may also serve to increase
brain delivery of ASA.
6.3 Identification of ASA inhibitors
In the second part of this thesis, inhibitors of ASA were to be identified. ASA inhibitors
may either serve to establish a cell culture model of MLD or be used as pharmacologi-
cal chaperones for misfolded ASA, reducing its degradation by the ERAD-system. Both
prospects will be elucidated for the identified ASA inhibitor, compound A, shortly.
In first experiments substrate- and enzyme-concentrations, as well as reaction times of
the standard ASA activity assay were optimized to fulfill the criteria of (1) substrate
concentrations close to the Km as to be able to identify competitive inhibitors, (2) ro-
bustness of the assay, and (3) cost control for high throughput screenings.
The substrate concentration was 0.25 mM, close to the Km (0.21 mM) of ASA towards
4-nitrocatechol sulfate previously reported (Bognar et al. 2006). It is therefore possible
to find competitive inhibitors. Indeed, a competitive inhibitor of ASA was identified
(compound A). The assay was robust as all plates had Z’ scores exceeding 0.5 (on aver-
age 0.89). Therefore, this assay is very well suited for high throughput screenings
6 Discussion 109
(Zhang et al. 1999). The costs were considerably low with approximately 0.004 € per
tested compound.
Using this assay, a total of four inhibitory substances of 30,500 tested compounds were
identified. Two of them later proved to be chemically instable (metamizole, sulfathiou-
rea) with the hydrolysis products inhibiting ASA. In case of metamizole it was shown
and has already been described in the literature (Wessel 2004) that sulfite is released
after its rapid hydrolysis under assay conditions. Sulfite is a known, potent inhibitor of
ASA (Matzner et al. 2009a) and forms sulfur dioxide gas in presence of weak acids (as-
say conditions: pH 5.0). The hydrolysis product of sulfathiourea responsible for ASA
inhibition has not yet been identified in this work, but may be hydrogen sulfide gas or
its soluble form in water hydrosulfuric acid. As both hydrolysis products of metamizole
and sulfathiourea may outgas, they are unsuitable for cell culture experiments. A third
compound, primaquine, has been shown to be non-inhibitory. Instead the phosphates
present in primaquine solid caused the observed inhibitory effect. Phosphates have al-
ready been described to inhibit ASA, also by Matzner et al., 2009a. Ultimately, only
compound A was confirmed to be an inhibitor of ASA which was chemically stable.
Compound A is not specific for ASA, as ASB was inhibited at similar inhibitor concen-
trations.
6.3.1 Potential of compound A to establish a cell culture model of MLD
This ASA inhibitor may be used to establish an in vitro model of MLD. The major ad-
vantage of inhibitors for cell culture experiments is that they are easily applicable and
can be used for a wide variety of cells – most importantly primary cells or cell lines of
human origin. In contrast to knockdown or knockout experiments, activity of the inhib-
ited enzyme can be quickly restored by withdrawing the inhibitor. Cell culture models
of LSDs have been previously induced by addition of small compounds. For instance,
progesterone and U18666A have been used to impede cholesterol transport routes lead-
ing to its accumulation and induction of a Niemann-Pick, type C-like phenotype (Lange
and Steck 1994; Huang et al. 2006). Moreover, a specific inhibitor of glucocerebro-
sidase-1, conduritol-β-epoxide, has been used to create in vitro models of Gaucher dis-
ease (Berger et al. 2010; Cleeter et al. 2013; Dermentzaki et al. 2013). Experiments in
such cell culture models of LSDs increase our understanding of the molecular and cellu-
lar pathomechanisms involved in these diseases. The establishment of a cell culture
110 6 Discussion
model of MLD using compound A and sulfatide-loading may help to cast a light on the
link between sulfatide accumulation and demyelination.
However, the use of compound A to this end may be limited. As compound A also in-
hibits ASB, cells treated with this inhibitor may not only show a MLD-like, but also a
mucopolysaccharidosis, type VI-like phenotype. Therefore, the interpretation of ob-
served effects would be difficult or even impossible.
6.3.2 Potential of compound A as a pharmacological chaperone for ASA
Moreover, inhibitors of ASA may be used for chaperone therapy. Several studies
proved that inhibitors identified by high throughput screenings have the ability to rescue
enzyme activity by acting as pharmacological chaperones. Zheng et al. (2007) identified
three chemically distinct classes of glucocerebrosidase inhibitors. Although none of
these compounds were competitive inhibitors, two were shown to function as chemical
chaperones.
Tropak et al. (2007) screened a library of 50,000 small molecules for inhibitors of β-
hexosaminidase A. Similar to the assay performed here, screening was performed at
acidic pH and an endpoint assay was used. An end concentration of 20 µM of each
compound was used in comparison to 10 µM used here. Of 64 hits reducing β-
hexosaminidase A activity by 50% or more, only 24 (0.048% of initially 50,000 com-
pounds) were confirmed to be ‘bona fide inhibitors’ in subsequent assays. This shows
that high throughput screenings are susceptible to identify ‘false positives’. Vice versa,
some factual inhibitors may not be recognized (‘false negatives’) (Inglese et al. 2006;
Malo et al. 2006). Therefore, in this work all compounds that led to as little as 10% of
inhibition were reevaluated, on the one hand increasing the likelihood for identification
of false positives, but also minimizing the risks of false negatives.
Interestingly, the three most potent β-hexosaminidase A inhibitors identified by Tropak
et al. (2007) were also inhibitors of β-hexosaminidase B at similar concentrations.
These inhibitors were used in cell culture experiments using fibroblasts of patients with
a certain mutation causing infantile Sandhoff diseases. All three tested inhibitors were
shown to act as pharmacological chaperones increasing the enzyme activities 2-3-fold
depending on the inhibitor concentration applied.
This example shows that, although not specific for ASA (as also ASB is inhibited), the
identified, competitive ASA inhibitor may serve as a pharmacological chaperone. In
6 Discussion 111
comparison to the three β-hexosaminidase B inhibitors described above (IC50: 0.2-
5.8 µM) the potency of compound A is rather low (IC50: 49.1 µM). First attempts to find
similar compounds with higher potency by a virtual screening approach have not been
successful (Figure 5.23). However, further attempts to find similar compounds using
rational design will be made. Importantly, the potency of compound A may already be
sufficient for chaperone therapy considering that N-butyl-deoxynojirimycin (Miglustat),
which is in clinical use for treatment of Gaucher (type I) and Niemann-Pick (type C)
diseases, has an IC50-value of 20-37 µM for its target glucosylceramide synthase (data
sheet for Zavesca®).
Before conducting cell culture experiments on fibroblasts of MLD patients, the pH de-
pendence of the inhibition is to be analyzed. Only if compound A is able to bind to ASA
at neutral pH of the endoplasmic reticulum, it may be used as a pharmacological chap-
erone. Ideally, inhibition decreases at the more acidic pH of the lysosome as to allow
enzymatic degradation of storage material. These criteria were shown to be fulfilled for
the pharmacological chaperone pyrimethamine, another inhibitor of β-hexosaminidase
A. Almost 100% inhibition was observed at pH 6.5, whereas inhibition was only ap-
proximately 70% at pH 4.0 (Maegawa et al. 2007).
In summary, one ASA inhibitor (‘compound A’) was identified. This compound is a
good lead structure, possibly allowing for identification of more potent inhibitors by
rational design. Compound A may have limited use to establish an in vitro model of
MLD since it also inhibits ASB, thereby potentially causing a mucopolysaccharidosis,
type VI, like phenotype. In contrast, its prospects for use as pharmacological chaperone
for MLD are promising. Further biochemical, in vitro and in vivo experiments will show
whether this compound is ultimately suitable for first clinical trials for treatment of
MLD.
112 Bibliography
Bibliography
Abbott, N. J., A. a K. Patabendige, D. E. M. Dolman, S. R. Yusof, and D. J. Begley. 2010. Structure and function of the blood-brain barrier. Neurobiology of disease 37:13–25.
Abbott, N. J., L. Rönnbäck, and E. Hansson. 2006. Astrocyte-endothelial interactions at the blood-brain barrier. Nature reviews. Neuroscience 7:41–53.
Aerts, J., M. Vanbreemen, A. Bussink, J. Brinkman, C. Hollak, M. Langeveld, G. Linthorst, et al. 2005. The blood brain barrier and treatment of lysosomal storage diseases. International Congress Series 1277:19–31.
Aggarwal, P., J. B. Hall, C. B. McLeland, M. A. Dobrovolskaia, and S. E. McNeil. 2009. Nanoparticle interaction with plasma proteins as it relates to particle biodistribution, biocompatibility and therapeutic efficacy. Advanced drug delivery reviews 61:428–37.
Ambruosi, A., A. S. Khalansky, H. Yamamoto, S. E. Gelperina, D. J. Begley, and J. Kreuter. 2006. Biodistribution of polysorbate 80-coated doxorubicin-loaded [14C]-poly(butyl cyanoacrylate) nanoparticles after intravenous administration to glioblastoma-bearing rats. Journal of drug targeting 14:97–105.
Ambruosi, A., H. Yamamoto, and J. Kreuter. 2005. Body distribution of polysorbate-80 and doxorubicin-loaded [14C]poly(butyl cyanoacrylate) nanoparticles after i.v. administration in rats. Journal of drug targeting 13:535–42.
Andrieux, K., and P. Couvreur. 2009. Polyacrylcyanoacrylate nanoparticles for delivery of drugs across the blood – brain barrier. Wiley Interdisciplinary Reviews: Nanomedicine and Nanobiotechnology 1:463–474.
Asheuer, M., F. Pflumio, S. Benhamida, A. Dubart-Kupperschmitt, F. Fouquet, Y. Imai, P. Aubourg, et al. 2004. Human CD34+ cells differentiate into microglia and express recombinant therapeutic protein. Proceedings of the National Academy of Sciences of the United States of America 101:3557–62.
Avachat AM, Oswal YM, Gujar KN, S. R. 2014. Preparation and Characterization of Rivastigmine Loaded Human Serum Albumin (HSA) Nanoparticles. Current drug delivery 11:359–70.
Banks, W. A. 2004. Are the Extracelluar Pathways a Conduit for the Delivery of Therapeutics to the Brain? Current pharmaceutical design 10:1365–1370.
Batzios, S. P., and D. I. Zafeiriou. 2011. Developing treatment options for metachromatic leukodystrophy. Molecular genetics and metabolism 105:56–63.
Beck, M. 2010. Therapy for lysosomal storage disorders. IUBMB life 62:33–40.
Bibliography 113
Begley, D. J., C. C. Pontikis, and M. Scarpa. 2008. Lysosomal storage diseases and the blood-brain barrier. Current pharmaceutical design 14:1566–80.
Bendikov-Bar, I., G. Maor, M. Filocamo, and M. Horowitz. 2013. Ambroxol as a pharmacological chaperone for mutant glucocerebrosidase. Blood cells, molecules & diseases 50:141–5.
Berger, J., S. Lecourt, V. Vanneaux, C. Rapatel, S. Boisgard, C. Caillaud, N. Boiret-Dupré, et al. 2010. Glucocerebrosidase deficiency dramatically impairs human bone marrow haematopoiesis in an in vitro model of Gaucher disease. British journal of haematology 150:93–101.
Biffi, A., E. Montini, L. Lorioli, M. Cesani, F. Fumagalli, T. Plati, C. Baldoli, et al. 2013. Lentiviral hematopoietic stem cell gene therapy benefits metachromatic leukodystrophy. Science 341:1233158.
Bilati, U., E. Allémann, and E. Doelker. 2005. Strategic approaches for overcoming peptide and protein instability within biodegradable nano- and microparticles. European journal of pharmaceutics and biopharmaceutics 59:375–88.
Blomqvist, M., V. Gieselmann, and J.-E. Månsson. 2011. Accumulation of lysosulfatide in the brain of arylsulfatase A-deficient mice. Lipids in health and disease 10:28.
Böckenhoff, A., S. Cramer, P. Wölte, S. Knieling, C. Wohlenberg, V. Gieselmann, H.-J. Galla, et al. 2014. Comparison of five Peptide vectors for improved brain delivery of the lysosomal enzyme arylsulfatase a. The Journal of neuroscience 34:3122–9.
Bognar, S., B. Foretic, I. Furac, Z. Vukelic, and Z. Grubesic. 2006. Kinetics and activity of arylsulfatase A in leukocytes derived from patients with cerebral palsy. Acta pharmaceutica 56:95–104.
Bohnsack, R. N., X. Song, L. J. Olson, M. Kudo, R. R. Gotschall, W. M. Canfield, R. D. Cummings, et al. 2009. Cation-independent mannose 6-phosphate receptor: a composite of distinct phosphomannosyl binding sites. The Journal of biological chemistry 284:35215–26.
Boudes, P. F. 2013. Clinical studies in lysosomal storage diseases: past, present and future. Pediatric endocrinology reviews: PER 11 Suppl 1:68–76.
Braulke, T., and J. S. Bonifacino. 2009. Sorting of lysosomal proteins. Biochimica et biophysica acta 1793:605–14.
Brazelton, T. R., F. M. V. Rossi, G. I. Keshet, and H. M. Blau. 2000. From Marrow to Brain: Expression of Neuronal Phenotypes in Adult Mice. Science 290:1775–1779.
Byrd, J. C., J. H. Park, B. S. Schaffer, F. Garmroudi, and R. G. MacDonald. 2000. Dimerization of the insulin-like growth factor II/mannose 6-phosphate receptor. The Journal of biological chemistry 275:18647–56.
Byrne, B. J., D. J. Falk, N. Clément, and C. S. Mah. 2012. Gene therapy approaches for lysosomal storage disease: next-generation treatment. Human gene therapy 23:808–15.
114 Bibliography
Causin, C., A. Waheed, T. Braulke, and U. Junghans. 1988. Mannose 6-phosphate/insulin-like growth factor II-binding proteins in human serum and urine. Their relation to the mannose 6-phosphate/insulin-like growth factor II. Biochemical Journal 252:795–799.
Cedervall, T., I. Lynch, S. Lindman, T. Berggård, E. Thulin, H. Nilsson, K. A. Dawson, et al. 2007. Understanding the nanoparticle-protein corona using methods to quantify exchange rates and affinities of proteins for nanoparticles. Proceedings of the National Academy of Sciences of the United States of America 104:2050–5.
Chaturvedi, M., Y. Molino, B. Sreedhar, M. Khrestchatisky, and L. Kaczmarek. 2014. Tissue inhibitor of matrix metalloproteinases-1 loaded poly(lactic-co-glycolic acid) nanoparticles for delivery across the blood-brain barrier. International journal of nanomedicine 9:575–88.
Chen, Y., and L. Liu. 2012. Modern methods for delivery of drugs across the blood-brain barrier. Advanced drug delivery reviews 64:640–65.
Cleeter, M. W. J., K.-Y. Chau, C. Gluck, A. Mehta, D. A. Hughes, M. Duchen, N. W. Wood, et al. 2013. Glucocerebrosidase inhibition causes mitochondrial dysfunction and free radical damage. Neurochemistry international 62:1–7.
Coffey, J., and C. De Duve. 1968. Digestive activity of lysosomes I. The digestion of proteins by extracts of rat liver lysosomes. Journal of Biological Chemistry.
Coutinho, M. F., M. J. Prata, and S. Alves. 2012a. Mannose-6-phosphate pathway: a review on its role in lysosomal function and dysfunction. Molecular genetics and metabolism 105:542–50.
Coutinho, M. F., M. J. Prata, and S. Alves. 2012b. A shortcut to the lysosome: the mannose-6-phosphate-independent pathway. Molecular genetics and metabolism 107:257–66.
Couvreur, P., B. Kante, L. Grislain, M. Roland, and P. Speiser. 1982. Toxicity of polyalkylcyanoacrylate nanoparticles II: Doxorubicin-loaded nanoparticles. Journal of pharmaceutical sciences 71:790–792.
Dermentzaki, G., E. Dimitriou, M. Xilouri, H. Michelakakis, and L. Stefanis. 2013. Loss of β-glucocerebrosidase activity does not affect alpha-synuclein levels or lysosomal function in neuronal cells. PloS one 8:e60674.
Desnick, R. J., and E. H. Schuchman. 2012. Enzyme replacement therapy for lysosomal diseases: lessons from 20 years of experience and remaining challenges. Annual review of genomics and human genetics (Vol. 13, pp. 307–35).
Dierks, T., L. Schlotawa, M.-A. Frese, K. Radhakrishnan, K. von Figura, and B. Schmidt. 2009. Molecular basis of multiple sulfatase deficiency, mucolipidosis II/III and Niemann-Pick C1 disease - Lysosomal storage disorders caused by defects of non-lysosomal proteins. Biochimica et biophysica acta 1793:710–25.
Bibliography 115
Dreis, S., F. Rothweiler, M. Michaelis, J. Cinatl, J. Kreuter, and K. Langer. 2007. Preparation, characterisation and maintenance of drug efficacy of doxorubicin-loaded human serum albumin (HSA) nanoparticles. International journal of pharmaceutics 341:207–14.
Duncanson, W. J., M. A. Figa, K. Hallock, S. Zalipsky, J. A. Hamilton, and J. Y. Wong. 2007. Targeted binding of PLA microparticles with lipid-PEG-tethered ligands. Biomaterials 28:4991–9.
Eckhardt, M. 2008. The role and metabolism of sulfatide in the nervous system. Molecular neurobiology 37:93–103.
Fratantoni, J., C. Hall, and E. Neufeld. 1968. Hurler and Hunter syndromes: mutual correction of the defect in cultured fibroblasts. Science 162:3–5.
Futerman, A. H., and G. van Meer. 2004. The cell biology of lysosomal storage disorders. Nature reviews. Molecular cell biology 5:554–65.
Gan, C. W., and S.-S. Feng. 2010. Transferrin-conjugated nanoparticles of poly(lactide)-D-alpha-tocopheryl polyethylene glycol succinate diblock copolymer for targeted drug delivery across the blood-brain barrier. Biomaterials 31:7748–57.
Gelperina, S., O. Maksimenko, A. Khalansky, L. Vanchugova, E. Shipulo, K. Abbasova, R. Berdiev, et al. 2010. Drug delivery to the brain using surfactant-coated poly(lactide-co-glycolide) nanoparticles: influence of the formulation parameters. European journal of pharmaceutics and biopharmaceutics 74:157–63.
Ghosh, P., N. M. Dahms, and S. Kornfeld. 2003. Mannose 6-phosphate receptors: new twists in the tale. Nature reviews. Molecular cell biology 4:202–12.
Gieselmann, V., A. L. Fluharty, T. Tønnesen, and K. Von Figura. 1991. Mutations in the arylsulfatase A pseudodeficiency allele causing metachromatic leukodystrophy. American journal of human genetics 49:407–13.
Gieselmann, V., and I. Krägeloh-Mann. 2010. Metachromatic leukodystrophy--an update. Neuropediatrics 41:1–6.
Gieselmann, V., A. Polten, J. Kreysing, and K. von Figura. 1989. Arylsulfatase A pseudodeficiency: loss of a polyadenylylation signal and N-glycosylation site. Proceedings of the National Academy of Sciences of the United States of America 86:9436–40.
Gonzalez-Noriega, A., J. H. Grubb, V. Talkad, and W. S. Sly. 1980. Chloroquine inhibits lysosomal enzyme pinocytosis and enhances lysosomal enzyme secretion by impairing receptor recycling. The Journal of cell biology 85:839–52.
Grubb, J. H., C. Vogler, B. Levy, N. Galvin, Y. Tan, and W. S. Sly. 2008. Chemically modified beta-glucuronidase crosses blood-brain barrier and clears neuronal storage in murine mucopolysaccharidosis VII. Proceedings of the National Academy of Sciences of the United States of America 105:2616–21.
116 Bibliography
Gulyaev, A., S. Gelperina, and I. Skidan. 1999. Significant transport of doxorubicin into the brain with polysorbate 80-coated nanoparticles. Pharmaceutical research.
Halder, K. K., B. Mandal, M. C. Debnath, H. Bera, L. K. Ghosh, and B. K. Gupta. 2008. Chloramphenicol-incorporated poly lactide-co-glycolide (PLGA) nanoparticles: formulation, characterization, technetium-99m labeling and biodistribution studies. Journal of drug targeting 16:311–20.
Hartman, M. A., J. L. Kreiling, J. C. Byrd, and R. G. MacDonald. 2009. High-affinity ligand binding by wild-type/mutant heteromeric complexes of the mannose 6-phosphate/insulin-like growth factor II receptor. The FEBS journal 276:1915–29.
Heese, B. A. 2008. Current strategies in the management of lysosomal storage diseases. Seminars in pediatric neurology 15:119–26.
Hermann, S., F. Schestag, A. Polten, S. Kafert, J. Penzien, J. Zlotogora, N. Baumann, et al. 2000. Characterization of four arylsulfatase A missense mutations G86D, Y201C, D255H, and E312D causing metachromatic leukodystrophy. American journal of medical genetics 91:68–73.
Hermanson, G. T. 2008. Bioconjugation techniques. Academic Press 10:0123705010.
Hess, B., P. Saftig, D. Hartmann, R. Coenen, R. Lüllmann-Rauch, H. H. Goebel, M. Evers, et al. 1996. Phenotype of arylsulfatase A-deficient mice: relationship to human metachromatic leukodystrophy. Proceedings of the National Academy of Sciences of the United States of America 93:14821–6.
Höcker, J. 1999. Untersuchung Zur Konstruktion Von Antikörper-Enzymderivaten Zur Überwindung Der Blut-Hirn-Schranke.
Hoffmann, M., S. Dreis, and E. Herbert. 2006. Covalent linkage of apolipoprotein E to albumin nanoparticles strongly enhances drug transport into the brain. The Journal of pharmacology and experimental therapeutics 317:1246–1253.
Hsu, J., L. Northrup, T. Bhowmick, and S. Muro. 2011a. Enhanced delivery of α-glucosidase for Pompe disease by ICAM-1-targeted nanocarriers: comparative performance of a strategy for three distinct lysosomal storage disorders. Nanomedicine: nanotechnology, biology, and medicine 1–9.
Hsu, J., D. Serrano, T. Bhowmick, K. Kumar, Y. Shen, Y. C. Kuo, C. Garnacho, et al. 2011b. Enhanced endothelial delivery and biochemical effects of α-galactosidase by ICAM-1-targeted nanocarriers for Fabry disease. Journal of controlled release 149:323–31.
Huang, Z., Q. Hou, N. S. Cheung, and Q.-T. Li. 2006. Neuronal cell death caused by inhibition of intracellular cholesterol trafficking is caspase dependent and associated with activation of the mitochondrial apoptosis pathway. Journal of neurochemistry 97:280–91.
Hugger, E. D., B. L. Novak, P. S. Burton, K. L. Audus, and R. T. Borchardt. 2002. A comparison of commonly used polyethoxylated pharmaceutical excipients on their
Bibliography 117
ability to inhibit P-glycoprotein activity in vitro. Journal of pharmaceutical sciences 91:1991–2002.
Humbert, N., A. Zocchi, and T. R. Ward. 2005. Electrophoretic behavior of streptavidin complexed to a biotinylated probe: a functional screening assay for biotin-binding proteins. Electrophoresis 26:47–52.
í Dali, C., and A. M. Lund. 2009. Intravenous Enzyme Replacement Therapy for Metachromatic Leukodystrophy (MLD). Annual Clinical Genetics Meeting.
Inglese, J., D. S. Auld, A. Jadhav, R. L. Johnson, A. Simeonov, A. Yasgar, W. Zheng, et al. 2006. Quantitative high-throughput screening: a titration-based approach that efficiently identifies biological activities in large chemical libraries. Proceedings of the National Academy of Sciences of the United States of America 103:11473–8.
Irwin, J. J., and B. K. Shoichet. 2005. ZINC - a free database of commercially available compounds for virtual screening. Journal of chemical information and modeling 45:177–82.
Koffie, R. M., C. T. Farrar, L.-J. Saidi, C. M. William, B. T. Hyman, and T. L. Spires-Jones. 2011. Nanoparticles enhance brain delivery of blood-brain barrier-impermeable probes for in vivo optical and magnetic resonance imaging. Proceedings of the National Academy of Sciences of the United States of America 1–6.
Kolodny, E. H. 1989. Metachromatic Leukodystrophy and Multiple Sulfatase Deficiency: Sulfatide Lipidosis (pp. 1721–1750).
Kolter, T., and K. Sandhoff. 2006. Sphingolipid metabolism diseases. Biochimica et biophysica acta 1758:2057–79.
Koster, A., P. Saftig, U. Matzner, K. Von Figura, and C. Peters. 1993. Targeted disruption of the M (r) 46,000 mannose 6-phosphate receptor gene in mice results in misrouting of lysosomal proteins. The EMBO Journal 1:5219–5223.
Kozlovskaya, L., and D. Stepensky. 2013. Quantitative analysis of the brain-targeted delivery of drugs and model compounds using nano-delivery systems. Journal of controlled release 171:17–23.
Krägeloh-Mann, I., S. Groeschel, C. Kehrer, K. Opherk, T. Nägele, R. Handgretinger, and I. Müller. 2013. Juvenile metachromatic leukodystrophy 10 years post transplant compared with a non-transplanted cohort. Bone marrow transplantation 48:369–75.
Kreuter, J. 2001. Nanoparticulate systems for brain delivery of drugs. Advanced drug delivery reviews 47:65–81.
Kreuter, J., R. N. Alyautdin, D. A. Kharkevich, and A. A. Ivanov. 1995. Passage of peptides through the blood-brain barrier with colloidal polymer particles (nanoparticles). Brain research 674:171–4.
Kreuter, J., T. Hekmatara, S. Dreis, T. Vogel, S. Gelperina, and K. Langer. 2007. Covalent attachment of apolipoprotein A-I and apolipoprotein B-100 to albumin
118 Bibliography
nanoparticles enables drug transport into the brain. Journal of controlled release 118:54–8.
Kreuter, J., V. Petrov, D. Kharkevich, and R. Alyautdin. 1997. Influence of the type of surfactant on the analgesic effects induced by the peptide dalargin after its delivery across the blood–brain barrier using surfactant-coated nanoparticles. Journal of Controlled Release 49:81–87.
Kuchar, L., J. Ledvinová, M. Hrebícek, H. Mysková, L. Dvoráková, L. Berná, P. Chrastina, et al. 2009. Prosaposin deficiency and saposin B deficiency (activator-deficient metachromatic leukodystrophy): report on two patients detected by analysis of urinary sphingolipids and carrying novel PSAP gene mutations. American journal of medical genetics. Part A 149A:613–21.
Kumari, A., S. K. Yadav, and S. C. Yadav. 2010. Biodegradable polymeric nanoparticles based drug delivery systems. Colloids and surfaces. B, Biointerfaces 75:1–18.
Kundra, R., and S. Kornfeld. 1999. Asparagine-linked Oligosaccharides Protect Lamp-1 and Lamp-2 from Intracellular Proteolysis. Journal of Biological Chemistry 274:31039–31046.
Kurakhmaeva, K. B., I. A. Djindjikhashvili, V. E. Petrov, V. U. Balabanyan, T. A. Voronina, S. S. Trofimov, J. Kreuter, et al. 2009. Brain targeting of nerve growth factor using poly(butyl cyanoacrylate) nanoparticles. Journal of drug targeting 17:564–74.
Lange, Y., and T. Steck. 1994. Cholesterol homeostasis. Modulation by amphiphiles. Journal of Biological Chemistry 29371–29374.
Langer, K., S. Balthasar, V. Vogel, N. Dinauer, H. von Briesen, and D. Schubert. 2003. Optimization of the preparation process for human serum albumin (HSA) nanoparticles. International Journal of pharmaceutics 257:169–180.
Li, J., L. Feng, L. Fan, Y. Zha, L. Guo, Q. Zhang, J. Chen, et al. 2011. Targeting the brain with PEG-PLGA nanoparticles modified with phage-displayed peptides. Biomaterials 32:4943–50.
Li, M., J. J. Distler, and G. W. Jourdian. 1991. Isolation and characterization of mannose 6-phosphate/insulin-like growth factor II receptor from bovine serum. Glycobiology 1:511–7.
Löscher, W., and H. Potschka. 2005. Blood-brain barrier active efflux transporters: ATP-binding cassette gene family. NeuroRx: the journal of the American Society for Experimental NeuroTherapeutics 2:86–98.
Lück, M., K. F. Pistel, Y. X. Li, T. Blunk, R. H. Müller, and T. Kissel. 1998. Plasma protein adsorption on biodegradable microspheres consisting of poly(D,L-lactide-co-glycolide), poly(L-lactide) or ABA triblock copolymers containing poly(oxyethylene). Influence of production method and polymer composition. Journal of controlled release 55:107–20.
Bibliography 119
Lund, T. C., S. S. Cathey, W. P. Miller, M. Eapen, M. Andreansky, C. C. Dvorak, J. H. Davis, et al. 2014. Outcomes after Hematopoietic Stem Cell Transplantation for Children with I-Cell Disease. Biology of blood and marrow transplantation: journal of the American Society for Blood and Marrow Transplantation.
Luzio, J. P., P. R. Pryor, and N. a Bright. 2007. Lysosomes: fusion and function. Nature reviews. Molecular cell biology 8:622–32.
Maegawa, G. H. B., M. Tropak, J. Buttner, T. Stockley, F. Kok, J. T. R. Clarke, and D. J. Mahuran. 2007. Pyrimethamine as a potential pharmacological chaperone for late-onset forms of GM2 gangliosidosis. The Journal of biological chemistry 282:9150–61.
Malo, N., J. A. Hanley, S. Cerquozzi, J. Pelletier, and R. Nadon. 2006. Statistical practice in high-throughput screening data analysis. Nature biotechnology 24:167–75.
Matthes, F. 2010. Enzymersatztherapie der metachromatischen Leukodystrophie: Untersuchungen zur therapeutischen Wirksamkeit rekombinanter humaner Arylsulfatase A und zum transendothelialen Übertritt über die Blut-Hirn-Schranke.
Matthes, F., P. Wölte, A. Böckenhoff, S. Hüwel, M. Schulz, P. Hyden, J. Fogh, et al. 2011. Transport of arylsulfatase A across the blood-brain barrier in vitro. The Journal of biological chemistry 286:17487–94.
Matzner, U., B. Breiden, G. Schwarzmann, A. Yaghootfam, A. L. Fluharty, A. Hasilik, K. Sandhoff, et al. 2009a. Saposin B-dependent reconstitution of arylsulfatase A activity in vitro and in cell culture models of metachromatic leukodystrophy. The Journal of biological chemistry 284:9372–81.
Matzner, U., M. Habetha, and V. Gieselmann. 2000. Retrovirally expressed human arylsulfatase A corrects the metabolic defect of arylsulfatase A-deficient mouse cells. Gene therapy 7:805–12.
Matzner, U., E. Herbst, K. K. Hedayati, R. Lüllmann-Rauch, C. Wessig, S. Schröder, C. Eistrup, et al. 2005. Enzyme replacement improves nervous system pathology and function in a mouse model for metachromatic leukodystrophy. Human molecular genetics 14:1139–52.
Matzner, U., R. Lüllmann-Rauch, S. Stroobants, C. Andersson, C. Weigelt, C. Eistrup, J. Fogh, et al. 2009b. Enzyme replacement improves ataxic gait and central nervous system histopathology in a mouse model of metachromatic leukodystrophy. Molecular therapy 17:600–6.
McGovern, M. M., D. T. Vine, M. E. Haskins, and R. J. Desnick. 1982. Purification and Properties of Feline and Human Arylsulfatase B isozymes. Journal of Biological Chemistry 257.
Michaelis, K., M. Hoffmann, and S. Dreis. 2006. Covalent linkage of apolipoprotein e to albumin nanoparticles strongly enhances drug transport into the brain. The Journal of pharmacology and experimental therapeutics 317:1246–1253.

120 Bibliography
Morris, G., and R. Huey. 2009. AutoDock4 and AutoDockTools4: Automated docking with selective receptor flexibility. Journal of Computational Chemistry 30:2785–2791.
Nadimpalli, S. K., and P. K. Amancha. 2010. Evolution of mannose 6-phosphate receptors (MPR300 and 46): lysosomal enzyme sorting proteins. Current protein & peptide science 11:68–90.
Nobs, L., F. Buchegger, R. Gurny, and E. Allémann. 2003. Surface modification of poly(lactic acid) nanoparticles by covalent attachment of thiol groups by means of three methods. International journal of pharmaceutics 250:327–37.
Nobs, L., F. Buchegger, R. Gurny, and E. Allémann. 2004. Poly(lactic acid) nanoparticles labeled with biologically active Neutravidin for active targeting. European journal of pharmaceutics and biopharmaceutics 58:483–90.
Noh, H., and J. I. Lee. 2014. Current and potential therapeutic strategies for mucopolysaccharidoses. Journal of clinical pharmacy and therapeutics 39:215–24.
Oh, W.-K., Y. S. Jeong, J. Song, and J. Jang. 2011. Fluorescent europium-modified polymer nanoparticles for rapid and sensitive anthrax sensors. Biosensors & bioelectronics 6–11.
Ohkuma, S., Y. Moriyama, and T. Takano. 1982. Identification and characterization of a proton pump on lysosomes by fluorescein-isothiocyanate-dextran fluorescence. Proceedings of the National Academy of Sciences of the United States of America 79:2758–62.
Olivier, J., L. Fenart, and R. Chauvet. 1999. Indirect evidence that drug brain targeting using polysorbate 80-coated polybutylcyanoacrylate nanoparticles is related to toxicity. Pharmaceutical research.
Olivier, J.-C. 2005. Drug transport to brain with targeted nanoparticles. NeuroRx: the journal of the American Society for Experimental NeuroTherapeutics 2:108–19.
Owens, D. E., and N. A. Peppas. 2006. Opsonization, biodistribution, and pharmacokinetics of polymeric nanoparticles. International journal of pharmaceutics 307:93–102.
Papademetriou, J., and C. Garnacho. 2013. Comparative binding, endocytosis, and biodistribution of antibodies and antibody-coated carriers for targeted delivery of lysosomal enzymes to ICAM-1 versus transferrin receptor. Journal of inherited metabolic disease 36:467–477.
Petri, B., A. Bootz, A. Khalansky, T. Hekmatara, R. Müller, R. Uhl, J. Kreuter, et al. 2007. Chemotherapy of brain tumour using doxorubicin bound to surfactant-coated poly(butyl cyanoacrylate) nanoparticles: revisiting the role of surfactants. Journal of controlled release 117:51–8.
Poeppel, P., M. Habetha, A. Marcão, H. Büssow, L. Berna, and V. Gieselmann. 2005. Missense mutations as a cause of metachromatic leukodystrophy. Degradation of arylsulfatase A in the endoplasmic reticulum. The FEBS journal 272:1179–88.
Bibliography 121
Ramakrishnan, H., K. K. Hedayati, R. Lüllmann-Rauch, C. Wessig, S. N. Fewou, H. Maier, H.-H. Goebel, et al. 2007. Increasing sulfatide synthesis in myelin-forming cells of arylsulfatase A-deficient mice causes demyelination and neurological symptoms reminiscent of human metachromatic leukodystrophy. The Journal of neuroscience 27:9482–90.
Reczek, D., M. Schwake, J. Schröder, H. Hughes, J. Blanz, X. Jin, W. Brondyk, et al. 2007. LIMP-2 is a receptor for lysosomal mannose-6-phosphate-independent targeting of beta-glucocerebrosidase. Cell 131:770–83.
Reimold, I., D. Domke, J. Bender, C. A. Seyfried, H.-E. Radunz, and G. Fricker. 2008. Delivery of nanoparticles to the brain detected by fluorescence microscopy. European journal of pharmaceutics and biopharmaceutics 70:627–32.
Rempe, R., S. Cramer, S. Hüwel, and H.-J. Galla. 2011. Transport of Poly(n-butylcyano-acrylate) nanoparticles across the blood-brain barrier in vitro and their influence on barrier integrity. Biochemical and biophysical research communications 406:64–9.
Ren, F., R. Chen, Y. Wang, Y. Sun, Y. Jiang, and G. Li. 2011. Paclitaxel-loaded poly(n-butylcyanoacrylate) nanoparticle delivery system to overcome multidrug resistance in ovarian cancer. Pharmaceutical Research 28:897–906.
Reukov, V., V. Maximov, and A. Vertegel. 2010. Proteins conjugated to poly (butyl cyanoacrylate) nanoparticles as potential neuroprotective agents. Biotechnology and Bioengineering 108:243–252.
Roser, M., D. Fischer, and T. Kissel. 1998. Surface-modified biodegradable albumin nano- and microspheres. II: effect of surface charges on in vitro phagocytosis and biodistribution in rats. European journal of pharmaceutics and biopharmaceutics 46:255–63.
Rozaklis, T., H. Beard, S. Hassiotis, A. R. Garcia, M. Tonini, A. Luck, J. Pan, et al. 2011. Impact of high-dose, chemically modified sulfamidase on pathology in a murine model of MPS IIIA. Experimental neurology 230:123–30.
Sahoo, S., and V. Labhasetwar. 2005. Enhanced antiproliferative activity of transferrin-conjugated paclitaxel-loaded nanoparticles is mediated via sustained intracellular drug retention. Molecular pharmaceutics 2:373–383.
Samarajeewa, S., R. Shrestha, Y. Li, and K. L. Wooley. 2012. Degradability of Poly(Lactic Acid)-Containing Nanoparticles: Enzymatic Access through a Cross-Linked Shell Barrier. Journal of the American Chemical Society.
Sambrook, J., E. F. Fritsch, and T. Maniatis. 1989. Molecular Cloning: A Laboratory Manual. Cold Spring Harbor laboratory press. New York (pp. 931–957).
Schröder, S., F. Matthes, P. Hyden, C. Andersson, J. Fogh, S. Müller-Loennies, T. Braulke, et al. 2010. Site-specific analysis of N-linked oligosaccharides of recombinant lysosomal arylsulfatase A produced in different cell lines. Glycobiology 20:248–59.
122 Bibliography
Schultz, M. L., L. Tecedor, M. Chang, and B. L. Davidson. 2011. Clarifying lysosomal storage diseases. Trends in neurosciences 34:401–10.
Sempf, K., T. Arrey, S. Gelperina, T. Schorge, B. Meyer, M. Karas, and J. Kreuter. 2013. Adsorption of plasma proteins on uncoated PLGA nanoparticles. European journal of pharmaceutics and biopharmaceutics 1.
Solders, M., D. A. Martin, C. Andersson, M. Remberger, T. Andersson, O. Ringdén, and G. Solders. 2014. Hematopoietic SCT: a useful treatment for late metachromatic leukodystrophy. Bone marrow transplantation 1–6.
Sommerlade, H. J., T. Selmer, A. Ingendoh, V. Gieselmann, K. von Figura, K. Neifer, and B. Schmidt. 1994. Glycosylation and phosphorylation of arylsulfatase A. The Journal of biological chemistry 269:20977–81.
Stroobants, S., D. Gerlach, F. Matthes, D. Hartmann, J. Fogh, V. Gieselmann, R. D’Hooge, et al. 2011. Intracerebroventricular enzyme infusion corrects central nervous system pathology and dysfunction in a mouse model of metachromatic leukodystrophy. Human molecular genetics 20:2760–9.
Sun, P., D. E. Sleat, M. Lecocq, A. R. Hayman, M. Jadot, and P. Lobel. 2008. Acid phosphatase 5 is responsible for removing the mannose 6-phosphate recognition marker from lysosomal proteins. Proceedings of the National Academy of Sciences of the United States of America 105:16590–5.
Suzuki, Y. 2013. Chaperone therapy update: Fabry disease, GM1-gangliosidosis and Gaucher disease. Brain & development 35:515–23.
Tropak, M. B., J. E. Blanchard, S. G. Withers, E. D. Brown, and D. Mahuran. 2007. High-throughput screening for human lysosomal beta-N-Acetyl hexosaminidase inhibitors acting as pharmacological chaperones. Chemistry & biology 14:153–64.
Ulbrich, K., T. Hekmatara, E. Herbert, and J. Kreuter. 2009. Transferrin- and transferrin-receptor-antibody-modified nanoparticles enable drug delivery across the blood-brain barrier (BBB). European journal of pharmaceutics and biopharmaceutics 71:251–6.
Upton, R. N. 2007. Cerebral uptake of drugs in humans. Clinical and experimental pharmacology & physiology 34:695–701.
Van Rooy, I., S. Cakir-Tascioglu, W. E. Hennink, G. Storm, R. M. Schiffelers, and E. Mastrobattista. 2011. In vivo methods to study uptake of nanoparticles into the brain. Pharmaceutical research 28:456–71.
Van Zyl, R., V. Gieselmann, and M. Eckhardt. 2010. Elevated sulfatide levels in neurons cause lethal audiogenic seizures in mice. Journal of neurochemistry 112:282–95.
Vauthier, C., C. Schmidt, and P. Couvreur. 1999. Measurement of the density of polymeric nanoparticulate drug carriers by isopycnic centrifugation. Journal of Nanoparticle Research 1:411–418.
Bibliography 123
Venier, R. E., and S. a Igdoura. 2012. Miglustat as a therapeutic agent: prospects and caveats. Journal of medical genetics 49:591–7.
Von Bülow, R., B. Schmidt, T. Dierks, N. Schwabauer, K. Schilling, E. Weber, I. Usón, et al. 2002. Defective oligomerization of arylsulfatase a as a cause of its instability in lysosomes and metachromatic leukodystrophy. The Journal of biological chemistry 277:9455–61.
Walkey, C. D., and W. C. W. Chan. 2012. Understanding and controlling the interaction of nanomaterials with proteins in a physiological environment. Chemical Society reviews 41:2780–99.
Wessel, J. C. 2004. Erstmaliger Nachweis von Oxalsäurederivaten bei der Biotransformation von Metamizol im bebrüteten Hühnerei und beim Menschen.
Willett, P. 2006. Similarity-based virtual screening using 2D fingerprints. Drug discovery today 11:1046–53.
Wittke, D., D. Hartmann, V. Gieselmann, and R. Lüllmann-Rauch. 2004. Lysosomal sulfatide storage in the brain of arylsulfatase A-deficient mice: cellular alterations and topographic distribution. Acta neuropathologica 108:261–71.
Wohlfart, S., S. Gelperina, and J. Kreuter. 2011. Transport of drugs across the blood-brain barrier by nanoparticles. Journal of controlled release.
Zahr, A. S., C. A. Davis, and M. V Pishko. 2006. Macrophage uptake of core-shell nanoparticles surface modified with poly(ethylene glycol). Langmuir: the ACS journal of surfaces and colloids 22:8178–85.
Zensi, A., D. Begley, C. Pontikis, C. Legros, L. Mihoreanu, S. Wagner, C. Büchel, et al. 2009. Albumin nanoparticles targeted with Apo E enter the CNS by transcytosis and are delivered to neurones. Journal of controlled release 137:78–86.
Zhang, J.-H., T. D. Y. Chung, and K. R. Oldenburg. 1999. A Simple Statistical Parameter for Use in Evaluation and Validation of High Throughput Screening Assays. Journal of Biomolecular Screening 4:67–73.
Zheng, W., J. Padia, D. J. Urban, A. Jadhav, O. Goker-Alpan, A. Simeonov, E. Goldin, et al. 2007. Three classes of glucocerebrosidase inhibitors identified by quantitative high-throughput screening are chaperone leads for Gaucher disease. Proceedings of the National Academy of Sciences of the United States of America 104:13192–7.
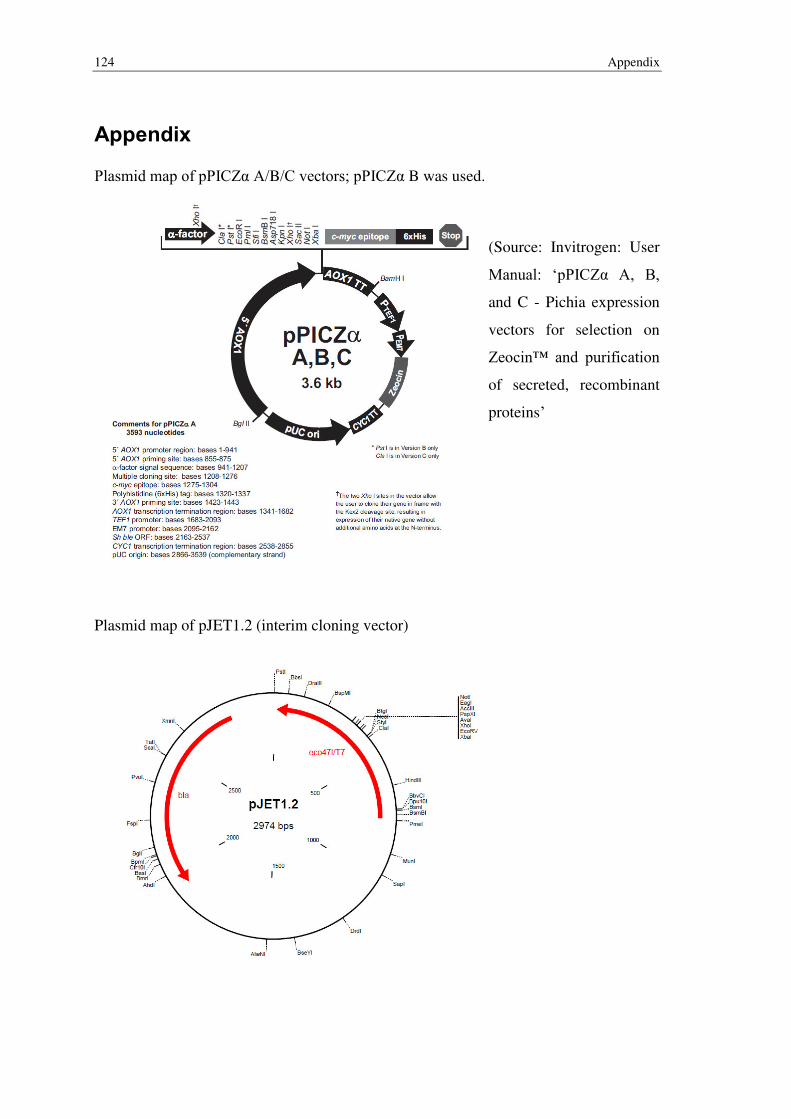
124 Appendix
Appendix
Plasmid map of pPICZα A/B/C vectors; pPICZα B was used.
(Source: Invitrogen: User
Manual: ‘pPICZα A, B,
and C - Pichia expression
vectors for selection on
Zeocin™ and purification
of secreted, recombinant
proteins’
Plasmid map of pJET1.2 (interim cloning vector)
Acknowledgements 125
Acknowledgements
I would like to formally thank Prof. Gieselmann for giving me the opportunity to work
in his group and for accepting first reference of this work. Moreover, I would like to
thank Prof. Burgdorf for accepting second reference. Prof. Müller and Prof. Beck readi-
ly agreed to be ‘fachnahe’ and ‘fachfremde’ members on short notice.
Dr. Matzner supervised and supported me throughout my work. The lively discussions
and his interest in my work often helped me to see difficulties in a new light. I am glad
that I was able to work in an atmosphere allowing for personal and scientific develop-
ment. Also, I have to thank the members of the AG Matzner, namely Debora Kaminski,
Axel Stein, Annika Böckenhoff, Frank Matthes and our wonderful technicians, Claudia
Wohlenberg and Heidi Simonis. It was good to always be able to talk about problems
and success and to receive feedback from colleagues who quickly became friends.
Many thanks to my cooperation partners: Prof. Kreuters group (Astrid Mühlstein) and
Dr. Gelperina generously sent many different nanoparticle preparations. Prof. Müller
provided the drug library for screening. Prof. Bajorath and Prof. Gütschow helped to
pursue the bioinformatic approach to find new inhibitors for ASA with great effort. I
value Norbert Furtmann’s work spending days programming algorithms and fitting
compounds into the active site of ASA.
I enjoyed my last couple of years in the ‘IBMB’ thanks to the cordial atmosphere in the
laboratory and in the office. I will miss the lunch times we spent together in the botani-
cal garden. Many thanks to Isabell Zech, my companion in my HTS project.
My full gratitude shall be expressed to Caroline Kubaczka, who did not only tolerate me
on gloomy days, but gave me strength and support throughout the years. I have been
fortunate to have met her and am grateful for the time she shares with me.
Finally, I would like to thank my family. I gratefully appreciate the interest in my work
and life and of course the moral and financial support during my studies. Last but not
least, I thank my American family. I value our friendship and am still thankful for one
of the best years in my life. Without them, this work would have never been written in
English.

126 Curriculum Vitae
Curriculum Vitae
Declaration 127
Declaration
Hiermit versichere ich, dass ich die hier vorliegende Arbeit selbständig angefertigt und
keine anderen, als die angegebenen Hilfsmittel und Quellen benutzt habe. Ferner erkläre
ich, die vorliegende Arbeit an keiner anderen Hochschule als Dissertation eingereicht zu
haben.
Bonn, August 2014,
Tilman Schuster


![Pharmacological management for agitation and … Professionals/Pharmacological... · [Intervention Review] Pharmacological management for agitation and aggression in people with acquired](https://img.pdfslide.us/doc/110x75/5a9dcaaa7f8b9a0d5a8c29c1/pharmacological-management-for-agitation-and-professionalspharmacologicalintervention.jpg)