Embed Size (px)
Citation preview

Journal of Environmental Protection, 2010, 1, 346-361 doi:10.4236/jep.2010.14041 Published Online December 2010 (http://www.SciRP.org/journal/jep)
Copyright © 2010 SciRes. JEP
Development of Emission Factors for Quantification of Blasting Dust at Surface Coal Mines
Surendra Roy1, Govind Raj Adhikari1, Trilok Nath Singh2
1National Institute of Rock Mechanics, Champion Reefs, Kolar Gold Fields, India; 2Department of Earth Sciences, Indian Institute of Technology, Bombay, India. Email: [email protected] Received August 11th, 2010; revised August 25th, 2010; accepted September 10th, 2010.
ABSTRACT
Environmental impact assessment (EIA) and environmental management plan (EMP) is a statutory requirement for execution of new mining projects or for expansion of the operating projects. For this purpose, quantification of blasting dust emission is required. This can be done by developing emission factors for blasting. The concept is similar to that of specific charge in blasting. For mining operations other than blasting, quantification of dust can be done using emis- sion factors. Emission estimation techniques are very limited for blasting. In this study, the emission factors were de- veloped by carrying out a detailed field study at one of the largest opencast coal mines of India in all four seasons. Da- ta on atmospheric and meteorological conditions were generated by installing sodar and automatic weather station at the mine site. Respirable dust samplers were installed for monitoring of the dust emitted during coal or overburden bench blasting. Emission factors for dust concentrations were developed in gram per cubic meter of rock excavated. The developed emission factors were used to estimate dust emissions for adjacent mines due to similarity in mining and meteorological conditions. Seasonal variations in moisture contents in benches, where dust was monitored, indicated the lowest emission factors in monsoon due to high moisture in the bench materials. Similar field studies were also conducted at another coalfield of India for two seasons. It was found that the emission factors are site-specific. Keywords: Emission Factor, Blasting Dust, Particulate Matter, Surface Coal Mines
1. Introduction
Emission factor is a representative value to estimate the quantity of a pollutant released to the atmosphere with an activity associated with the release of that pollutant. It is important for developing emission control strategies by Central and State Government, consultants, and industry [1]. Among different fugitive dust sources of mining ac- tivities like topsoil stripping, drilling, overburden and coal removal, material hauling, stock piles, etc. [2,3]; blasting produces very large quantities of dust. The dust produced due to blasting in the form of total suspended particulate matter (TSP) and particulate matter less than 10 μm (PM10) affects the surrounding environment, hu-man beings, animals, and plants depending on the mete-orological conditions at the mine site.
The concept of emission factor is analogous to specific charge in rock blasting. Specific charge is a measure of the mass of an explosive required to break a unit volume
or a unit mass of the rock. Considering the explosive mass in units of kilograms and the rock quantity in cubic meters or tons, the specific charge can be expressed in kg/m3 or kg/t [4]. Specific charge indicates how much explosive is needed for fragmentation of one cubic meter of rock whereas emission factor indicates the amount of dust emitted into the atmosphere during blasting of one cubic meter of rock. A lower emission factor is desirable as a higher value can cause air pollution in the mine and surrounding areas.
Emission factor can be used to quantify the dust gen- erated by blasting at the planning or operating stage of a mine. Hence this is a useful tool for preparation of envi- ronmental management plan. Previous work on air pollu- tion due to surface coal mining mostly deals with moni- toring and analysis of dust generated by different mining operations. According to the United States of Environ- mental Protection Agency [5], blasting presents formida- ble logistic difficulties in sampling or sampler deploy-

Development of Emission Factors for Quantification of Blasting Dust at Surface Coal Mines
Copyright © 2010 SciRes. JEP
347
ment. Hence USEPA did not recommend for further field study.
Data from source-specific emission tests are usually preferred. Realistic emission factors can only be devel- oped with actual emissions data. The first issue which must be faced while developing an emission factor is to define a source category. In some cases, this may be fairly simple and straightforward. But in case of fugitive particulate matter emission, the definition of a source category generally involves some compromises [2]. Dif- ferent mining activities have been categorized into dif- ferent source categories such as drilling as point source, coal loading as point or area source, dragline as point or area source, dozer as line or point source, blasting as area source, etc [6]. For blasting, most of the researchers have developed single-valued or predictive equations for cal- culating emission factor in kilogram per blast and some have estimated in kilogram per tonne of explosive con- sumed. Often in the mine, the size of blast varies from blast to blast. Therefore, the emission factors can be de- veloped in gram per cubic meter of rock excavated. An attempt was made to develop emission factor for PM10 and TSP by carrying out a detailed study at large open- cast coal mines in India. Application of the emission factor in other mines is also presented.
2. Overview on Blasting Emission Factors
The emission factors are usually expressed as the weight of pollutant divided by a unit weight, volume, distance, or duration of the activity emitting the pollutant depend- ing on the operations carried out at surface mines [1]. For example, it is expressed in kilogram per vehicle kilome- ters traveled (kg/VKT) for scrapers, kg/hr for bulldozer, kg/t for truck dumping coal or overburden, etc. Similarly emission factors for blasting have been expressed in dif- ferent units by the different countries.
Different researchers have developed different emis- sion factors for blasting under different mining and me- teorological conditions. Most of the works related to fu- gitive emissions have been undertaken in the United States. Some work has also been undertaken in Australia, although the Australian work is not as comprehensive as that of the US [7]. It is worth pointing out that the USE- PA emission factors are published and are widely re- ferred. The most comprehensive compilation of emission factors is the USEPA document referred as AP-42 [8]. The emission factors developed and used by various countries are summarized below.
2.1. Emission Factors for USA Mines
Cole and Kerch [3] reported TSP emission factor as 14.3 to 85.3 lb/blast for overburden and 25.1 to 78.1 lb/blast
for coal [9]. Emission factor for PM10 is not given. Axe- tell and Cowherd [10] developed emission factor equa- tion for coal or overburden for 30 μm size particles as 0.00022(A)1.5 in kg/blast, where A is the horizontal area with blasting depth 21 m as it is reported in USEPA [1].
Axetell and Cowherd [11] developed the emission factor equation for TSP as 961 A0.8 D-1.8 M-1.9 lb/blast for coal or overburden, where A is the area blasted (sq ft); D is the blasthole depth (ft); and M is the moisture content (%). For the estimation of particulate < 15 μm, the equa- tion is given as 2550 (A)0.6/(D)1.5(M)2.3 and for calcula- tion of particulate < 2.5, the values obtained by TSP equ-ation should be multiplied by 0.030. Single valued emis-sion factors have also been mentioned for different mines. For mine type A, the single-valued TSP emission factor for overburden blasting is mentioned as 1690 lb/blast, but for coal this value is not given. For mine type C, TSP emission factor for coal and overburden is 25.1 lb/blast and 14.2 lb/blast respectively. For mine type D, TSP emission factor for coal is 78.1 lb/blast. For overburden, the value is not given. For mine type E, the TSP emission factor for coal and overburden is 72.4 lb/blast and 85.3 lb/blast respectively. This has been reported under sec-tion 5.5 and 8.5 of “Fugitive Dust Emission factor Up-date for AP-42” [6].
The current version of AP-42 section 11.9 was first drafted in 1983 using the field data collected during the late 1970s and early 1980s at Western surface coal mines. Minor changes related to emissions from blasting and estimating PM10 emissions were made in this version [6]. According to current version, the general equation for TSP and PM-15 is reported as e = k (A)a/(D)b (M)d, where e is the emission factor expressed in mass of emis- sions per blast; A is the area blasted (area); D is the hole depth; M is the material moisture content (%); and k, a, b, and c are the regression values. The USEPA has reported emission factor for particulate ≤ 30 μm for coal or over- burden as 0.0005A1.5, where A is the horizontal area with blasting depth ≤ 70 feet. For PM10, the values obtained from this equation will be multiplied by 0.5.
2.2. Emission Factors for Australian Mines
National Pollutant Inventory [12] reported emission fac- tors for Australian mines based on the particles emitted per tonne of explosive used. The emission factor is re- ported for the different particle size ranges emitted per tonne of the explosive used. The emission factor for particle size 0-2.5 μm, 2.5-15 μm and 15-30 μm is 5.1 kg/tonne, 46.0 kg/tonne and 49.9 kg/tonne respectively. The emission factor for overburden blasting is 0.00022 A1.5 kg per blast, where A is the area to be blasted in m2.
Environment Australia [13] formulated the guidance for application of emission factors in Australian condi-

Development of Emission Factors for Quantification of Blasting Dust at Surface Coal Mines
Copyright © 2010 SciRes. JEP
348
tions. In this report, equation for TSP estimation is men- tioned as 0.008A1.5 kg/blast; where A is the area blasted in m2. For PM10 estimation, the value obtained by TSP equation should be multiplied by a factor 0.52. Later on, Environment Australia [7,14] derived the TSP emission factor equation as 344A0.8M-1.9D-1.8 kg/blast; where A the area blasted in m2, D is the depth of blasthole (m) and M is the moisture content (%). For estimation of PM10, it will be multiplied by a factor of 0.52.
2.3. Emission Factors for European Mines
EEA (European Environmental Agency) emission in- ventory guidebook [15] has stated that emission factors estimation for open dust sources for coal mines as given in the USEPA document AP-42 [6] can be used.
2.4. Emission Factors for Indian Mines
Chakraborty et al. [16] developed emission rates for var- ious surface coal mining activities except blasting. Ghose [17] calculated emission factors for different operations of the surface coal mine but he has not reported dust emission for blasting.
2.4.1. Remarks from the Overview It is found that different countries have adopted different emission factors for blasting. Some empirical equations for emission factor include only area of blasts while other use area of blast, blasthole depth and moisture content. In most of the cases, emission factors have been expressed in pound per blasts or kilogram per blasts or in kilogram per tonne of the explosive used. No emission factors for blasting have been developed for Indian mines.
Coal or overburden benches in the mine cover differ- ent area of blasts as well as different blasthole depths depending on the requirements. After blasting, a volume of rock is broken and fragmented, which is the source of dust emission into the atmosphere. It would be better to develop emission factors in gram per cubic meter of rock excavated.
3. Blasting Dust Sampling Problems
The plume from a blast is particularly difficult to sample due to the vertical and horizontal dimensions of the plume and the inability to place sampling equipment near the blast [6]. To sample blasts, the exposure profiler concept was modified. Balloon-suspended samplers along with ground-based samplers were used for blasting dust monitoring, which was found to be impractical un- der field conditions. The location of the plume centerline depended very much on the exact wind direction at the time of the blast. Because the balloon sampling array required at least one hour to set up, it was impossible to anticipate the exact wind direction one hour in advance.
Therefore, the ground-based samplers were placed at some distance apart when the wind was variable so that some of the samplers were in the plume. The balloon sometimes could not be moved to the plume centerline quickly enough after the blast. In order to avoid equip- ment damage from the blast debris and to obtain a repre-sentative sample of the plume, the balloon-suspended samplers were located 100 m downwind of the blast area. This distance varied depending on the size of the blast and physical constraints. These descriptions are given in Section 3 of USEPA report [6]. Potential errors like maintaining an isokinetic flow rate also occurred during sampling. Balloon sampling being a substantial modify- cation of the exposure profiling method reveals some- what experimental technique. Hence it was difficult to apply to blasting because technical limitations of the technique combined with the infrequency of blasting resulted in very few opportunities to perform the sam- pling. This sampling method could not be used when ground level winds were greater than about 6 m/s be- cause the balloon could not be controlled on its tether. Sometimes balloon was found to be damaged due to blast debris. Because of logistical difficulties in sampler de- ployment, further field studies were not recommended.
It is observed that even after modification of sampling methodology, many problems occurred. No suitable me- thod has been finalized for blasting dust monitoring. Sampling of blasting dust has been considered as a diffi- cult source of field testing.
4. Description of Mine Sites
Field investigations were carried out at two large open- cast coal mines. The first mine is Dudhichua project, Northern Coalfields Limited (NCL), Singrauli, Madhya Pradesh, India. It is one of the largest opencast coal mines of India and is surrounded by large opencast coal mines namely Jhingurdha, Bina, Jayant, Amlohri, Nigahi, Khadia, Block B and Krishnashila. These mines coming under Singrauli coalfield are divided into two basins viz. Moher sub-basin and Singrauli main basin. The present coal mining activities of NCL are concentrated in Moher sub-basin of 100 km2. All the coal seams are common for all the mines of NCL except Jhingurdha seam which ex- ists only in the Jhingurdha mine. In NCL, total coal pro- duction was 63.65 Mt and overburden removal was 203 million m3 during 2008-09. Among them Dudhichua project produced 13.27 Mt coal and removed 34.36 mil- lion m3 overburden using 18990 t explosive. This project is having an area of 8.68 km2 and located in the central part of Moher basin of Singrauli Coalfields. The mine is situated between latitudes 24°7’30” and 24°10’ north and longitudes 82°40’ and 82°42’30” east. The area is undu- lating with an average elevation of 325 m above MSL. It

Development of Emission Factors for Quantification of Blasting Dust at Surface Coal Mines
Copyright © 2010 SciRes. JEP
349
is at a distance of 63 km by road from Renukut in Uttar Pradesh and 18 km from Singrauli railway station in Madhya Pradesh. The general strike in Dudhichua block is NW-SE and the dips are 1 in 20 to 1 in 25 (2 to 3°) towards north-east. The lithology consists of mainly soil, sandstone and coal. This mine was developed in ten benches including three in coal and seven in overburden. Large blasts are regularly conducted both in coal and overburden benches using huge quantities of explosives, thus increasing the potential for dust hazards in and around the mine. The main mining and transport equip- ment are electric shovels, draglines, dumpers, dozers, etc.
The second surface mine where field investigations were conducted is Bharatpur opencast project. It is one of the largest opencast coal mines of Mahanadi Coalfields Limited (MCL) and is located in Angul district of Tal- cher coalfields, Orissa, India. The mine is surrounded by different opencast coal mines. It produced 11.02 Mt coal in the year 2008-09 and removed 6.21 Mm3 of overbur- den using 3824 t explosive. It is having an area of 6.81 km2 and located in the south central part of the Talcher Coalfields. The mine is situated between latitudes 20°56’35” and 20°58’40” north and longitudes 85°06’30” and 85°08’40” east. The area is gently undulating with elevation from 92 m to 124 m above MSL. It is at a dis-tance of 9 km, 12 km and 15 km by road from Talcher town, Talcher railway station and Angul town respect- tively. The general strike of the block is E-W and the beds dip 2° to 10° towards north. The lithology consists of mainly soil, sandstone and coal. The mine forms benches in coal and overburden for excavation. Large bench blasts being conducted both in coal and overbur- den increases likelihood of dust pollution surrounding the mine. The mining machinery deployed in this mine were similar to those of Dudhichua project.
5. Methodology
In surface mines, heavy bench blasting was conducted for excavation of overburden and production of coal. As the dust dissipates with distance, the dust generated due to blasting should be monitored surrounding the blast location. Usually the site conditions make blasting dust monitoring difficult because the benches to be blasted had high wall on one side and undulating or plane ground on the other side. Therefore, it was required to select a plane surface along one side of the blast location so that monitoring could be done by installing the dust samplers in the downwind direction. Samplers could not be in- stalled on the high wall side when the wind was blowing in that direction.
Sometimes coal bench had no suitable locations but overburden had suitable locations for dust monitoring. All these practical problems caused variation in the
number of data collected for coal and overburden benches. After the complete survey of the mine, suitable sites
surrounding the bench to be blasted were selected for blasting dust monitoring during post-monsoon (October- November), winter (January-February), summer (April- May) and monsoon (August-September) at Dudhichua project. Since the bench and blast parameters may vary from season to season, particulate matter can also vary. Therefore study was carried out in each season to obtain different seasonal value. Moisture content of the benches and the distances of sampling points from blast locations were determined in each season. These parameters cor- responded to blasting dust monitored benches.
At Bharatpur opencast project, dust monitoring was conducted during post-monsoon (October-November) and winter (January) seasons to assess whether emission factors developed for Dudhichua project can be used for Bharatpur opencast project. Since suitability of emission factor had to be examined, therefore, one high polluting season and another less polluting season were considered for data collection at this project. Winter season being the worst possible scenario of air pollution, Chakraborty et al. [16] studied emission rates for various mining ac- tivities only in this season. Chaulya [18] also observed maximum particulate matter concentrations in winter. In both the seasons, only coal benches were monitored. Overburden benches were not monitored because the site conditions were not suitable for dust sampling.
5.1. Moisture Content Determination
Moisture content is the ratio of the weight of water to the weight of dry materials. It is expressed in percentage. Samples of drill cuttings were collected and moisture contents were determined at Coal Analysis Laboratory of the mines. Moisture content is determined for coal and overburden prior to blasting [6]. Moisture content has restraining nature in dust generation and may vary from season to season. Therefore, assessment of moisture content was carried out in each season.
5.2. Collection of Blast Details
Blast details such as number of blastholes, blasthole depth, burden, and spacing for coal and overburden benches for each season was used for evaluation of the volume of material blasted. The period during which blasts were carried out was also noted because stability classes and wind speed were required for calculation of emission factor for each blast for the corresponding pe- riod. The details corresponded to dust monitored benches.
5.2.1. At Dudhichua Project In post-monsoon, 20 blasts were conducted, out of which 17 blasts were carried out during 13:00-14:00 and re-

Development of Emission Factors for Quantification of Blasting Dust at Surface Coal Mines
Copyright © 2010 SciRes. JEP
350
maining during 14:00-15:00. In this season, 11 blasts were monitored in coal and 9 blasts in overburden benches. Only one coal bench was blasted frequently and monitored in this season. For this coal bench, blasthole depth for most of the blasts was 7.0 m to 7.5 m. Burden was 7 m for all the blasts. Spacing was either 7 m or 8 m. In case of overburden, blasts were conducted in different benches. The blasthole depth varied from 12 m to 19 m. Burden was from 6 m to 8 m and spacing was 6 m or 9 m.
In winter, all the 20 blasts were conducted during 13:00-14:00. Out of 20, 16 blasts were carried out in coal and 4 blasts in overburden benches. The blasthole depth varied from 7.0 m to 14.0 m in coal whereas from 10.5 m to 18 m in overburden. Burden was either 6 m or 7 m in coal and 8 m or 9 m in overburden. Spacing varied from 7.0 m to 8 m for coal and from 9 m to 10 m in overbur- den.
In summer, out of 16 blasts, 2 blasts were conducted during 14:00-15:00 and all others during 13:00-14:00. In this season, 12 blasts were monitored in coal and 4 blasts in overburden. In the coal, blasthole depth varied from 6.0 m to 13.0 m. Burden ranged from 3 m to 9 m or spacing from 3 m to 9 m. In the overburden, blasthole depth increased from 15.5 m to 20.0 m depending on the height of the benches. Burden varied from 8 m to 10 m while spacing was 9 m or 10 m.
In monsoon, all the 12 blasts were conducted during 13:00-14:00. Out of 12, 5 blasts were carried out in coal and 7 blasts in overburden. In coal, blasthole depth var- ied from 11 m to 12 m. Burden and spacing was either 7 m or 8 m. In the overburden, blasthole depth varied from 15 m to 18 m. Burden ranged from 8 m to 10 m while spacing was 9 m to 10 m.
5.2.2. At Bharatpur Opencast Project In post-monsoon, out of 10 blasts, 6 blasts were carried out during 13:00-14:00 and remaining during 14:00- 15:00. All the blasts were monitored in coal seam-IV, which was blasted by constructing three benches of 7 m, 7 m and 3 m high. Only this bench was suitable for dust monitoring. Blasthole depths varied from 3 m to 7 m. Burden and spacing varied from 3 m to 5 m.
In winter, blasts were conducted during different peri- ods. Out of 10 blasts, 3 were conducted during 13:00- 14:00, 6 blasts during 14:00-15:00 and one during 15:00-16:00. Only coal seam-II was a suitable site for blasting dust monitoring. Five benches were constructed in this seam, among them only three benches were fre- quently blasted and monitored. Blasthole depth of the benches varied from 5 m to 8 m. Burden was either 4 m or 4.5 m. Spacing varied from 4 m to 5 m.
5.3. Description of Dust Samplers
Respirable dust samplers, Instrumex IPM 115BL, were used for measurement of particulate matter, both TSP and PM10. This dust sampler utilises a two-stage collec- tion system for fractionating the particulate matter sizes. The first stage consists of a cyclone through which the particles greater than 10 m sizes are separated from the air stream by centrifugal forces acting on the solid parti- cles. The separated particulate falls through the cyclone’s conical hopper and is collected in the plastic cup placed at its bottom [19]. PM10 is collected from the ambient air in the second stage by filtering the air stream through the glass microfibre filter. TSP consisted of both PM10 and the particles greater than 10 m size. Whatman GF/A filter papers of 203 mm × 254 mm size were used for collection of PM10 and plastic cups for the particulate matter greater than 10 µm size. The filter papers were conditioned and desiccated [20] before and after sam- pling. For determination of particulate matter mass, ini- tial and final weight of plastic cups and filter papers were taken using 235S Sartorius balance with sensitivity of 0.00001g. The flow rate of sampler was kept greater than 1.1 m3/min. The concentration of the particulate matter was obtained from the difference (in micrograms) of the final weight of filter papers exposed minus the initial weight before exposure, divided by the sampled air vol- ume (in cubic meter) [20,21].
5.3.1. Procedure for Dust Sampling For particulate monitoring in an industrial area, often respirable dust samplers are operated either in three shifts of eight hours duration or continuously for twenty four hours at fixed locations. In case of blasting dust moni- toring, it is not possible to keep the samplers at a fixed location because blast location changes time to time. Al- so monitoring cannot be done for hours because the dust emitted by blasting is dispersed quickly into the atmos- phere. For the monitoring of dust, the sampler needs 230 V power supply for maintaining the flow rates greater than 1.1 m3/min. In the mine, high voltage power of 6600 V was supplied by the main station through electric ca- bles for the operation of heavy duty machineries such as drill machines, shovels, and draglines. As high voltage power could not be used for respirable dust samplers, 230 V power was taken only through the sockets of 230 V available inside the cabins of heavy duty machineries. For the safety point of view, sometimes high voltage power cable was disconnected from the heavy duty ma- chineries. Hence samplers could not be operated. Alter- native source of power supply was not available near the blast bench. To overcome this problem, a petrol genera- tor was also used for the operation of samplers depending on the site condition. Since the amount of dust collected
Development of Emission Factors for Quantification of Blasting Dust at Surface Coal Mines
Copyright © 2010 SciRes. JEP
351
by the samplers depends on the wind direction, the sam- plers once installed in the downwind direction could not be reinstalled due to deviation in wind direction at the time of blasting. Mud, water logged area around the blasting site and rain interfered the dust monitoring in monsoon.
Dust samplers were installed at safe distances from the blast site in the downwind direction. The safe distance or distance depended on the size of blasts and on site condi- tion. Also, installation of the samplers at a large distance was not suitable because the blasting dust would get mixed with the ambient air and hence it would be diffi- cult to identify the contribution of dust by the blasting. Before installation, many blasts were observed for the accumulation period of dust in the downwind direction and accordingly 20 minutes monitoring periods were considered for sampling. After this period, the emitted dust was dispersed completely into the atmosphere. Dur- ing the blasting period, all other mining activities were stopped, which is the usual practice for blast site clear- ance. Therefore, blasting dust monitoring was not af- fected by the other activities. The number of samplers installed depended on the site conditions. They were in- stalled either approximately parallel to blast locations or at an increasing distance from the blast. All the partial or non collection of particulate matter data due to change of wind direction, getting the samplers tripped during mon- itoring period, etc were discarded.
To assess the background dust concentrations, sam- plers were operated for a duration of 20 minutes. The dust collected was negligible. Hence the influence of background dust concentrations was ignored for analysis.
5.4. Evaluation of Stability Classes Using Sodar
The details of sodar, installation and data generation for Dudhichua project are presented in report [22]. Sodar was operated continuously for 24-hours in post-monsoon, winter, summer, and monsoon seasons at Dudhichua project. In this analysis, stability classes, evaluated only for blasting dust monitoring period was used.
After completing the study at Dudhichua project, tri-axis monostatic (back-scattering) sodar was trans- ported to Bharatpur opencast project and installed on the roof of an office building. Sodar was operated continu- ously for 24-hours in post-monsoon and winter at this site and stability classes were determined using sodar data for the blasting dust monitoring period for these seasons.
5.5. Monitoring of Meteorological Parameters
The details of automatic weather station, installation and results for Dudhichua project are presented in report [22]. The weather station was operated continuously for 24-
hours in post-monsoon, winter, summer, and monsoon at Dudhichua project. But for the analysis, the data on wind speed recorded during blasting dust monitoring period at the mine site was used.
The same weather station was used at Bharatpur opencast project. It was installed on the roof of an office building adjacent to sodar. The weather station recorded data continuously for 24-hours in post-monsoon and winter. Wind speed data recorded during blasting dust monitoring period were used for analysis.
6. Results and Discussion
6.1. Particulate Matter Concentrations
For Dudhichua project, particulate matters for coal and overburden blasts at different locations in different sea- sons are given in Tables 1 to 4. These tables include a total of 20 blasts at 37 locations in post-monsoon (Table 1), 20 blasts at 52 locations in winter (Table 2), 16 blasts at 32 locations (Table 3) in summer and 12 blasts in monsoon at 30 locations (Table 4).
At Bharatpur opencast project, a total of 10 blasts at 19 locations in post-monsoon (Table 5) and 10 blasts at 20 locations (Table 6) in winter were monitored in coal. The values of particulate concentrations are also men- tioned in these tables.
6.2. Determination of Stability Classes Using Mixing Height and Sodar Echograms
The details on mixing height and sodar echograms used for determination of stability classes at Dudhichua pro- ject for each season are presented in report [22]. The sta- bility classes corresponding to the blasting dust monitor- ing period at Dudhichua project are given in Tables 1 to 4. Similarly, stability classes determined for the blasting dust monitoring period for two seasons at Bharatpur opencast project are shown in Tables 5 to 6.
To assess the similarity in stability classes for both the mine sites, percentage of atmospheric stability classes was calculated in respective seasons. In post-monsoon, only stability class A was observed to be 100% at the each mine site. In winter, class A was 95% and B was 5% at Dudhichua project whereas class A occurred 90% and B 10% at Bharatpur opencast project indicating that there were some differences in stability classes at the mine sites in this season.
6.3. Dispersion Coefficients
Two sets of dispersion coefficients are used in the Gaus-sian plume models. The lateral dispersion coefficient (σy) represents the horizontal spread of the plume perpen- dicular to the direction of travel. The vertical dispersion coefficient (σz) represents the spread of the plume in the

Development of Emission Factors for Quantification of Blasting Dust at Surface Coal Mines
Copyright © 2010 SciRes. JEP
352
Table 1. Emission factors for coal and overburden in post-monsoon at Dudhichua project, NCL.
Dispersion coefficient
(m)
Particulate matter(µg/m3)
Calculated emission factor
(g/m3) Blast no.
Date of blasting
Blasting sche-dule
No. of dust
samplers
Distance (m)
Stab. class
Wind speed (m/s)
σy σz PM10 TSP PM10 TSP
Volume of rock
excavated (m3)
Moisture content
(%)
Rock type
1 21.10.08 14:00-15:00 1 85 A 0.75 25 17 2730 11919 0.49 2.13 6720 13.97 Coal
2 23.10.08 13:00-14:00 1 90 A 0.90 25 17 508 3318 0.07 0.46 10500 13.97 Coal
3 25.10.08 13:00-14:00 1 135 A 1.08 34 22 262 1357 0.05 0.27 15120 4.68 OB
40 25 17 1191 9964
35 25 17 2914 216134 26.10.08 14:00-15:00 3
35
A 1.71
25 17 3742 37467
0.17 1.53 41328 3.53 OB
30 25 17 3684 222375 29.10.08 13:00-14:00 2
35 A 0.77
25 17 5380 352950.28 1.79 19836 4.68 OB
150 38 21 1606 100396 31.10.08 13:00-14:00 2
130 A 2.21
33 21 2515 151680.23 1.41 54720 4.29 OB
7 01.11.08 13:00-14:00 1 80 A 1.07 25 17 2251 14986 1.12 7.43 3456 3.78 OB
8 02.11.08 13:00 - 14:00 1 31 A 1.22 25 17 1118 7692 0.59 4.09 3675 13.97 Coal
35 25 17 567 5126 9 04.11.08 14:00-15:00 2
70 A 0.19
25 17 658 2932 0.02 0.16 7718 13.97 Coal
70 25 17 690 5634 10 06.11.08 13:00-14:00 2
30 A 0.62
25 17 721 6167 0.17 1.45 4043 13.97 Coal
75 25 17 781 3437
35 25 17 624 2047 11 10.11.08 13:00-14:00 3
35
A 1.15
25 17 1332 5192
0.38 1.49 4410 13.97 Coal
12 13.11.08 13:00-14:00 1 90 A 0.56 25 17 2240 15220 0.69 4.65 2940 13.97 Coal
130 33 21 502 3629
140 35 22 905 3057 13 14.11.08 13:00-14:00 3
155
A 1.35
39 24 566 1993
0.43 1.83 6248 13.97 Coal
35 25 17 1517 8073
35 25 17 1896 1138914 15.11.08 13:00-14:00 3
35
A 0.57
25 17 1473 7391
0.31 1.72 4752 3.53 OB
15 16.11.08 13:00-14:00 1 85 A 0.66 25 17 2248 10136 0.22 0.97 11025 13.97 Coal
95 25 17 515 2288
95 25 17 973 4832 16 17.11.08 13:00-14:00 3
95
A 0.18
25 17 1755 7686
0.03 0.13 10633 13.97 Coal
17 18.11.08 13:00-14:00 1 130 A 0.61 33 21 3286 6259 0.28 0.52 19008 3.53 OB
100 25 17 237 1458 18 19.11.08 13:00 - 14:00 2
100 A 0.62
25 17 422 1459 0.06 0.25 5880 13.97 Coal
80 25 17 1812 12176
80 25 17 2985 2518219 21.11.08 13:00 - 14:00 3
80
A 0.54
25 17 1291 7663
0.41 3.01 4320 6.24 OB
20 22.11.08 13:00 - 14:00 70 A 0.61 25 17 1134 14240 0.17 2.15 6480 4.68 OB
OB: Overburden

Development of Emission Factors for Quantification of Blasting Dust at Surface Coal Mines
Copyright © 2010 SciRes. JEP
353
Table 2. Emission factors for coal and overburden in winter at Dudhichua project, NCL.
Dispersion coefficient
(m)
Particulate matter(µg/m3)
Calculated emission factor
(g/m3) Blast no.
Date of blasting
Blasting schedule
No. of dust
samplers
Distance (m)
Stab. class
Wind speed (m/s)
σy σz PM10 TSP PM10 TSP
Volume of rock
excavated (m3)
Moisture content
(%)
Rock type
1 24.1.09 13:00-14:00 1 70 A 0.72 25 17 6321 38226 0.07 0.44 100440 7.55 OB
140 35 22 722 4640
140 35 22 912 50272 25.1.09 13:00-14:00 3
140
A 0.60
35 22 669 4364
0.08 0.47 17472 10.82 Coal
80 25 17 2183 173033 27.1.09 13:00-14:00 2
80 A 1.14
25 17 2822 235990.08 0.63 59472 3.63 OB
30 25 17 3787 31298
130 33 21 1677 97274 29.1.09 13:00-14:00 3
130
A 1.41
33 21 1391 11183
0.84 6.22 7923 15.5 Coal
100 25 17 556 3404100 25 17 537 45655 31.1.09 13:00-14:00 3 100
A 1.1325 17 474 2824
0.08 0.56 11648 10.82 Coal
150 38 24 172 1521150 38 24 176 11566 01.2.09 13:00-14:00 3 150
A 0.5538 24 472 2241
0.09 0.55 5600 10.82 Coal
60 25 17 12143 377577 05.2.09 13:00-14:00 2
40 A 0.53
25 17 12890 432130.10 0.33 104904 5.7 OB
40 25 17 2175 1007940 25 17 3182 246998 07.2.09 13:00-14:00 3 40
A 1.3225 17 1491 10010
0.91 5.97 5292 15.5 Coal
40 25 17 538 1955
30 25 17 1282 61309 08.2.09 13:00-14:00 3
30
A 0.69
25 17 461 4555
0.21 1.15 4040 15.5 Coal
20 25 17 1460 1102120 25 17 1358 667710 09.2.09 13:00-14:00 3 20
A 0.6725 17 1729 11727
0.30 1.92 5488 15.5 Coal
20 25 17 2014 1126030 25 17 1335 619211 10.2.09 13:00-14:00 3 30
A 0.9925 17 1175 7610
0.75 4.17 3175 15.5 Coal
30 25 17 807 239530 25 17 603 334912 12.2.09 13:00-14:00 3 30
A 1.0325 17 234 12123
0.11 1.21 8114 15.5 Coal
30 25 17 1793 830913 13.2.09 13:00-14:00 2
30 A 0.86
25 17 1303 70540.14 0.70 15120 6.16 OB
30 25 17 1210 564730 25 17 920 499514 14.2.09 13:00-14:00 3 30
A 0.6825 17 738 6849
0.19 1.16 5488 15.5 Coal
30 25 17 1161 612715 15.2.09 13:00-14:00 2
30 A 0.74
25 17 1365 102010.14 0.91 10584 15.5 Coal
100 25 17 283 2353100 25 17 247 162816 17.2.09 13:00-14:00 3 100
A 0.4625 17 284 2748
0.04 0.30 5513 15.5 Coal
20 25 17 1407 9505
20 25 17 3283 1401917 18.2.09 13:00-14:00 3
30
A 0.47
25 17 1286 9963
0.21 1.17 7203 15.5 Coal
66 25 17 3277 1397318 20.2.09 13:00-14:00 2
66 A 0.74
25 17 1239 80320.18 0.86 15092 10.82 Coal
16 18 12 2477 11990
16 18 12 2134 1983119 21.2.09 13:00-14:00 3
29
B 0.46
18 12 1504 7755
0.06 0.41 11907 10.82 Coal
35 25 17 3913 1237720 22.2.09 13:00-14:00 2
35 A 0.44
25 17 1420 112410.23 1.04 8008 10.82 Coal
OB: Overburden

Development of Emission Factors for Quantification of Blasting Dust at Surface Coal Mines
Copyright © 2010 SciRes. JEP
354
Table 3. Emission factors for coal and overburden in summer at Dudhichua project, NCL.
Dispersion coefficient
(m)
Particulate matter
(µg/m3)
Calculated emission factor
(g/m3) Blast no.
Date of blasting
Blasting schedule
No. of dust samplers
Distance (m)
Stab.class
Wind speed (m/s)
σy σz PM10 TSP PM10 TSP
Volume of rock
excavated (m3)
Moisture content
(%)
Rock type
150 26 17 545 52821 27.4.09 13:00-14:00 2
150 B 1.91
26 17 857 37280.07 0.46 31185 6.78 OB
2 04.5.09 13:00-14:00 1 150 A 1.38 38 24 1340 14215 0.16 1.68 40095 6.78 OB
100 25 17 1345 53783 07.5.09 13:00-14:00 2
40 A 1.95
25 17 2406 180150.65 4.06 8995 15.44 Coal
80 18 12 5578 32684
80 18 12 8421 346314 08.5.09 14:00-15:00 3
80
B 1.89
18 12 7007 41335
0.11 0.56 100000 4.87 OB
5 10.5.09 13:00-14:00 1 150 B 1.71 26 17 5730 15965 1.28 3.55 12800 14.19 Coal
160 40 25 998 8431
160 40 25 1302 89116 11.5.09 13:00-14:00 3
160
A 2.43
40 25 1005 4799
0.84 5.63 12000 14.19 Coal
100 25 17 1564 12514
100 25 17 1428 133007 12.5.09 13:00-14:00 3
100
A 0.90
25 17 1035 4423
0.30 2.27 6400 14.19 Coal
8 13.5.09 13:00-14:00 1 150 A 1.74 38 24 1949 10829 0.19 1.06 61380 6.12 OB
60 25 17 1501 11830
90 25 17 744 72869 15.5.09 13:00-14:00 3
150
A 1.46
38 24 916 5114
0.39 2.82 8320 14.19 Coal
10 16.5.09 14:00-15:00 1 60 A 1.20 25 17 2749 15868 0.41 2.38 12800 14.19 Coal
11 17.5.09 13:00-14:00 1 60 A 1.28 25 17 3333 13206 2.41 9.55 2835 13.91 Coal
55 25 17 3798 1393812 18.5.09 13:00-14:00 2
55 A 1.75
25 17 1990 101310.60 2.48 13608 13.91 Coal
70 25 17 4197 1563913 23.5.09 13:00-14:00 2
50 A 1.30
25 17 4065 306040.28 1.58 30576 14.19 Coal
14 24.5.09 13:00-14:00 1 150 A 0.42 38 24 999 8187 0.38 3.13 3780 15.44 Coal
60 25 17 2262 11750
60 25 17 2633 1370915 25.5.09 13:00-14:00 3
60
A 2.04
25 17 3150 23155
0.43 2.60 20384 14.19 Coal
80 25 17 969 3706
80 25 17 1532 1090716 27.5.09 13:00-14:00 3
80
A 1.49
25 17 1284 10521
0.60 4.01 4992 14.19 Coal
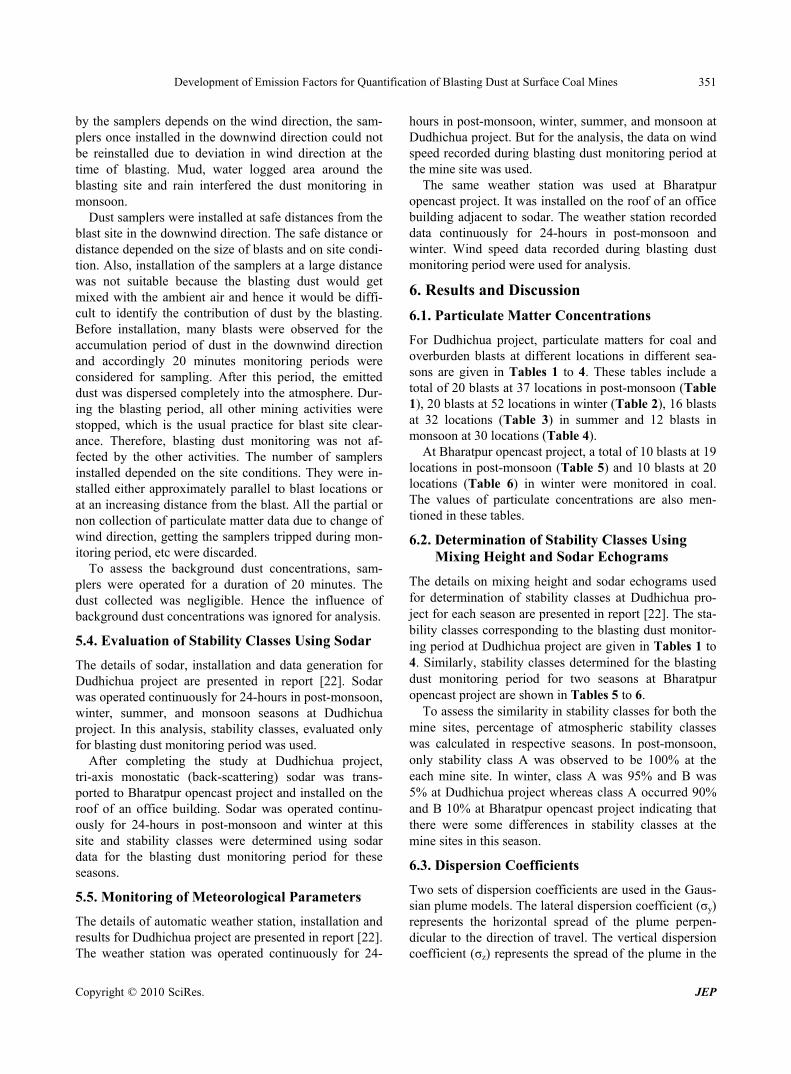
OB: Overburden

Development of Emission Factors for Quantification of Blasting Dust at Surface Coal Mines
Copyright © 2010 SciRes. JEP
355
Table 4. Emission factors for coal and overburden in monsoon at Dudhichua project, NCL.
Dispersion coefficient
(m)
Particulate matter
(µg/m3)
Calculated emission factor
(g/m3) Blast no.
Date of blasting
Blasting schedule
No. of dust samplers
Distance (m)
Stab. class
Wind speed (m/s)
σy σz PM10 TSP PM10 TSP
Volume of rock
excavated (m3)
Moisture content
(%)
Rock type
70 25 17 587 1876
70 25 17 482 22081 13.8.09 13:00-14:00 3
70
A 0.66
25 17 554 3376
0.09 0.42 6336 17.11 Coal
90 25 17 371 28652 15.8.09 13:00-14:00 2
120 A 0.49
30 20 416 12510.06 0.28 6468 17.11 Coal
3 22.8.09 13:00-14:00 1 80 A 0.57 25 17 734 1723 0.03 0.06 27000 6.28 OB
70 25 17 448 1030
70 25 17 57 8314 24.8.09 13:00-14:00 3
70
A 0.97
25 17 498 1509
0.11 0.36 4851 17.11 Coal
60 25 17 407 2219
60 25 17 424 8135 25.8.09 13:00-14:00 3
60
A 1.07
25 17 378 602
0.12 0.37 5632 17.11 Coal
60 25 17 441 125426 26.8.09 13:00-14:00 2
90 A 2.29
25 17 416 8830.04 0.63 38880 5.11 OB
100 25 17 526 10877 30.8.09 13:00-14:00 2
100 A 0.88
25 17 399 13380.11 0.30 5760 6.28 OB
35 25 17 1532 8611
42 25 17 2011 123428 01.9.09 13:00-14:00 3
51
A 0.38
25 17 1867 13383
0.11 0.73 9600 6.28 OB
15 25 17 691 2940
15 25 17 571 23749 02.9.09 13:00-14:00 3
15
A 0.61
25 17 741 4833
0.11 0.56 5888 17.11 Coal
50 25 17 1397 5328
50 25 17 738 291710 09.9.09 13:00-14:00 3
50
A 0.62
25 17 607 1708
0.09 0.34 9600 6.28 OB
50 18 12 864 290511 10.9.09 13:00-14:00 2
50 B 0.46
18 12 848 48680.05 0.21 6800 6.28 OB
70 25 17 598 210112 12.9.09 13:00-14:00 2
70 A 0.57
25 17 400 12900.02 0.08 20400 6.28 OB
OB: Overburden

Development of Emission Factors for Quantification of Blasting Dust at Surface Coal Mines
Copyright © 2010 SciRes. JEP
356
Table 5. Emission factors for coal and overburden in post-monsoon at Bharatpur opencast project, MCL.
Dispersion coefficient
(m)
Particulate matter(µg/m3)
Calculated emission factor
(g/m3) Blast no.
Date of blasting
Blasting schedule
No. of dust
samplers
Distance (m)
Stab. class
Wind speed (m/s)
σy σz PM10 TSP PM10 TSP
Volume of rock
excavated (m2)
Moisture content
(%)
Rock type
1 29.10.09 14:00-15:00 1 21 A 0.17 25 17 2068 13546 0.10 0.67 5528 5.93 Coal
30 25 17 1145 6466
30 25 17 1776 120402 02.11.09 13:00-14:00 3
30
A 0.24
25 17 1403 12084
0.08 0.53 7350 9.96 Coal
3 03.11.09 13:00-14:00 1 30 A 2.46 25 17 731 5768 1.37 10.82 2100 5.93 Coal
100 25 17 392 1543
100 25 17 490 3890 4 05.11.09 13:00-14:00 3
100
A 3.37
25 17 581 3846
1.51 9.54 1750 9.96 Coal
33 25 17 446 1530
33 25 17 322 2398 5 06.11.09 13:00-14:00 3
33
A 1.12
25 17 497 3218
0.25 1.44 2975 5.93 Coal
100 25 17 142 477 6 08.11.09 14:00-15:00 2
100 A 1.79
25 17 237 1305 0.16 0.73 3500 9.96 Coal
56 25 17 254 1004 7 09.11.09 13:00-14:00 2
56 A 0.27
25 17 118 459 0.15 0.59 540 21.26 Coal
8 09.11.09 14:00-15:00 1 100 A 0.79 25 17 1043 7689 0.25 1.82 5355 5.93 Coal
100 25 17 285 2289 9 10.11.09 13:00-14:00 2
100 A 1.95
25 17 348 3566 0.39 3.58 2552 9.96 Coal
10 10.11.09 14:00-15:00 1 70 A 1.22 25 17 780 6190 0.32 2.56 4725 5.93 Coal
vertical direction [23]. For known stability classes, σy and σz as horizontal and vertical dispersion coefficients as a function of downwind distances from the source using Pasquill-Gifford curves [24] were determined using Fig- ures 1 and 2. The dispersion coefficients for Dudhichua project are shown in Tables 1 to 4.
For known stability classes, for Bharatpur opencast project, the horizontal and vertical dispersion coefficients were also evaluated by Figures 1 and 2. The values of dispersion coefficients are shown in Tables 5 and 6.
6.4. Wind Speed
Wind speeds for the corresponding blasting period re-corded at Dudhichua project are given in Tables 1 to 4. It can be seen that there were no significant seasonal varia-tions in wind speed. Wind speeds monitored at Bharatpur
opencast project are given in Tables 5 and 6. To compare the wind speeds, average of wind speed at
the mine sites was calculated for respective seasons. The average wind speed in post-monsoon at Dudhichua pro- ject and Bharatpur opencast project was 0.87 m/s and 1.34 m/s respectively. In winter, the average wind speed at Dudhichua project was 0.78 m/s and at Bharatpur opencast project was 0.83 m/s. No significant differences in wind speeds were observed at the mine sites during the concerned seasons.
6.5. Calculation of Emission Factors
For known dust concentrations, dispersion coefficients and wind speeds, emission rates for blasting were calcu- lated using the following modified Pasquill and Gifford formula (1,25,26).

Development of Emission Factors for Quantification of Blasting Dust at Surface Coal Mines
Copyright © 2010 SciRes. JEP
357
Table 6. Emission factors for coal and overburden in winter at Bharatpur opencast project, MCL.
Dispersion coefficient (m)
Particulate matter
(µg/m3)
Calculated emission
factor (g/m3)
Blast no.
Date of blasting
Blasting schedule
No. of dust samplers
Distance (m)
Stab. class
Wind speed (m/s)
σy σz PM10 TSP PM10 TSP
Volume of rock
excavated (m3)
Moisture content
(%)
Rock type
40 25 17 1010 50931 08.01.10 14:00-15:00 2
40 A 0.96
25 17 2009 63140.91 3.44 2552 4.34 Coal
55 25 17 1053 63452 08.01.10 14:00-15:00 2
55 A 0.96
25 17 1132 57890.79 4.39 2126 3.25 Coal
44 25 17 1095 69353 09.01.10 13:00-14:00 2
44 A 0.89
25 17 986 62681.16 7.35 1280 10.25 Coal
25 25 17 1181 59964 10.01.10 14:00-15:00 2
25 A 0.61
25 17 1041 60120.78 4.23 1386 3.25 Coal
75 25 17 521 26615 11.01.10 13:00-14:00 2
75 A 0.63
25 17 521 26610.17 0.77 2977 10.25 Coal
100 25 17 238 9716 11.01.10 14:00-15:00 2
80 A 1.37
25 17 262 18940.19 1.11 2835 4.34 Coal
40 25 17 3536 123267 11.01.10 14:00-15:00 2
40 A 1.37
25 17 3638 113681.22 4.01 6480 3.25 Coal
55 25 17 1258 53258 12.01.10 13:00-14:00 2
70 A 0.56
25 17 751 48260.36 1.81 2520 3.25 Coal
60 25 17 722 20499 13.01.10 14:00-15:00 2
60 A 0.78
25 17 518 28600.65 2.58 1188 10.25 Coal
35 18 12 741 243010 14.01.10 15:00-16:00 2
35 B 0.18
18 12 658 21240.07 0.23 1448 10.25 Coal
,0xy z
QC
u (1)
where Cx,0 is the pollutant concentration (g/m3), Q is the pollutant emission rate (g/s), п = 3.14159, u is the mean wind speed (m/s), σy is the horizontal dispersion coeffi-cient, σz is the vertical dispersion coefficient.
TSP and PM10 values for different seasons indicated pollutant concentrations (Cx,0) in (1). Blasting was con- sidered as volume source and hence emission factors were calculated in gram per cubic meter of the rock ex- cavated. Emission factors for different blasts for different seasons for Dudhichua project are given in Tables 1 to 4.
The statistics of emission factors for coal and over-
burden for all the seasons is shown in Table 7. It is ob- served that the average emission factor for PM10 and TSP in coal blasts is higher than that for overburden blasts, indicating that per cubic meter of coal bench blasted emits more dust into the atmosphere than overburden. This may be explained by the higher in-situ percentage of dust in coal compared to overburden.
The emission factors for all the blasts of Bharatpur opencast project were also calculated for post-monsoon and winter using the procedures as followed for Dudhi- chua project. The emission factors for the Bharatpur opencast project are shown in Tables 5 and 6. Some variations were found in the emission factors when com- pared for the respective seasons of the mines indicating

Development of Emission Factors for Quantification of Blasting Dust at Surface Coal Mines
Copyright © 2010 SciRes. JEP
358
Figure 1. Horizontal dispersion coefficient σy vs downward distance from source.
Figure 2. Vertical dispersion coefficient σz vs downward distance from source. that emission factors are site-specific.
6.5.1. Influence of Moisture Content on Emission Factors
Since the moisture content in mine benches vary from season to season, the calculated PM10 and TSP emission
Table 7. Emission factors for coal and overburden for Dud-hichua project, NCL.
Emission factor (g/m3 )
Coal Overburden Statistics
TSP PM10 TSP PM10
Minimum 0.13 0.02 0.06 0.02
Maximum 9.55 2.41 7.43 1.12
Mean 2.08 0.38 1.17 0.18
Standard deviation
2.04 0.43 1.53 0.22
factors in different seasons for different blasts were plot- ted for all the data (Figures 3 (a), (b)). Emission factors for PM10 and TSP are higher in summer and the lowest in monsoon indicating higher dust emission in summer. The presence of higher moisture content in monsoon might be the reason for decrease in emission factor in this season. The particulate emissions depend on the moisture content of the material blasted [3,6]. The emissions are lower when the moisture content is higher and vice versa. Though there is no control method or emission reduction technique for blasting in coal and overburden [7], mois- ture content influenced the emissions of blasting dust.
6.5.2. Frequency Distribution of Emission Factors Histograms with normal distribution curve of PM10 and TSP emission factors were plotted by combined data sets of 68 blasts including coal and overburden (Figures 4(a), (b)) using SPPS software version 13.0. For PM10 emis- sion factor, frequency was the highest for the range of 0.02-0.25 g/m3 and for TSP, the highest frequency oc- curred for the range 0.06-1.00 g/m3 indicating that max- imum number of emission factors occurred in this range.
The emission factor values are normally distributed in positive direction. Most of the areas of histograms are under normal distribution curve. According to McClave and Sincich [27], histograms display the frequency of the measurements falling into specified intervals. The normal distribution plays a very important role in the science of statistical inference. Its physical appearance is that of a symmetrical bell-shaped curve, a histogram is said to be approximately normal when the areas of the rectangles are approximately equal to corresponding areas under a normal curve [28].
7. Application of Emission Factor for Quantification of Blasting Dust
Each mine of NCL regularly conducts more than two large blasts everyday for excavation of coal or overbur-

Development of Emission Factors for Quantification of Blasting Dust at Surface Coal Mines
Copyright © 2010 SciRes. JEP
359
(a) (b)
Figure 3. (a) Seasonal variations in emission factors of PM10 at Dudhichua project; (b) Seasonal variations in emission factors of TSP at Dudhichua project.
(a) (b)
Figure 4. (a) Histograms with normal distribution curve for PM10 emission factors at Dudhichua project; (b)Histograms with normal distribution curve for TSP emission factors at Dudhichua project.
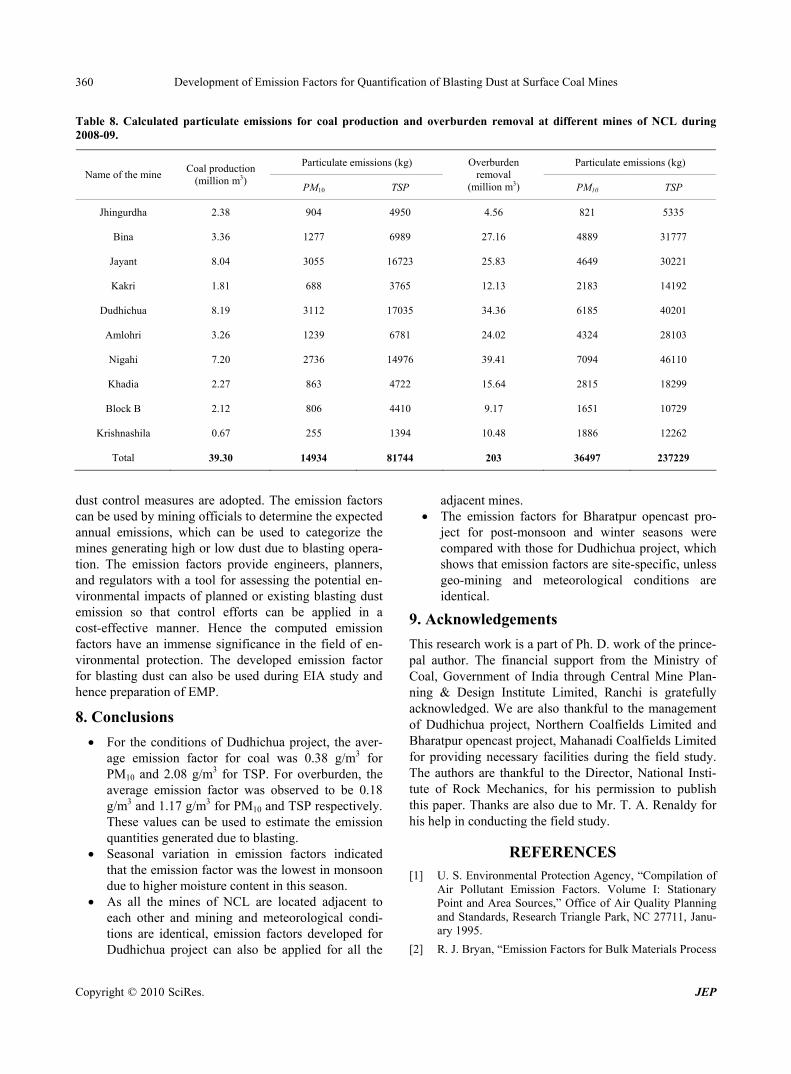
den removal. The excavated materials during 2008-09 revealed that thousands of blasts were conducted in the mines (Table 8). As a result, huge amount of dust would have emitted into the atmosphere and would have de- pleted the air quality in and around the mining area. It would certainly be interesting to quantify the dust gener- ated by blasting. Once the amount of dust generation is ascertained, the impact on air environment can be evalu- ated and proper mitigative measures would be thought of for control of dust pollution caused by blasting in the area. The quantification of blasting dust can be done by the emission factor. At Dudhichua project, the average emission factor for coal was 0.38 g/m3 and 2.08 g/m3 for PM10 and TSP respectively. For overburden benches, these were 0.18 g/m3 and 1.17 g/m3 for PM10 and TSP respectively. Since mining, geological conditions and meteorological parameters of this area are identical; these
emission factors can be used to quantify the dust gener- ated for known volume of overburden and coal. Accord- ing to USEPA [1] and Cole and Kerch [3], a mine-spe- cific emission factor can be used only if the characteris- tics of the mine for which emission estimate is needed are very similar to those of the mine for which the emis-sion factor was developed. Using the emission factors, the quantity of dust emitted during 2008-09 were calcu- lated for the volume of rock excavated during this period (Table 8). From this table, it is clear that huge amount of dust were emitted during production of coal and removal of overburden. This calculated dust emission can help the mining officials to know which of the mines generated high dust into the atmosphere and accordingly they could adopt control measures for high dust emitting mines. Considering that NCL is planning to increase production, the dust emission will certainly increase in future unless
Development of Emission Factors for Quantification of Blasting Dust at Surface Coal Mines
Copyright © 2010 SciRes. JEP
360
Table 8. Calculated particulate emissions for coal production and overburden removal at different mines of NCL during 2008-09.
Particulate emissions (kg) Particulate emissions (kg) Name of the mine
Coal production (million m3)
PM10 TSP
Overburden removal
(million m3) PM10 TSP
Jhingurdha 2.38 904 4950 4.56 821 5335
Bina 3.36 1277 6989 27.16 4889 31777
Jayant 8.04 3055 16723 25.83 4649 30221
Kakri 1.81 688 3765 12.13 2183 14192
Dudhichua 8.19 3112 17035 34.36 6185 40201
Amlohri 3.26 1239 6781 24.02 4324 28103
Nigahi 7.20 2736 14976 39.41 7094 46110
Khadia 2.27 863 4722 15.64 2815 18299
Block B 2.12 806 4410 9.17 1651 10729
Krishnashila 0.67 255 1394 10.48 1886 12262
Total 39.30 14934 81744 203 36497 237229
dust control measures are adopted. The emission factors can be used by mining officials to determine the expected annual emissions, which can be used to categorize the mines generating high or low dust due to blasting opera- tion. The emission factors provide engineers, planners, and regulators with a tool for assessing the potential en- vironmental impacts of planned or existing blasting dust emission so that control efforts can be applied in a cost-effective manner. Hence the computed emission factors have an immense significance in the field of en- vironmental protection. The developed emission factor for blasting dust can also be used during EIA study and hence preparation of EMP.
8. Conclusions
For the conditions of Dudhichua project, the aver-age emission factor for coal was 0.38 g/m3 for PM10 and 2.08 g/m3 for TSP. For overburden, the average emission factor was observed to be 0.18 g/m3 and 1.17 g/m3 for PM10 and TSP respectively. These values can be used to estimate the emission quantities generated due to blasting.
Seasonal variation in emission factors indicated that the emission factor was the lowest in monsoon due to higher moisture content in this season.
As all the mines of NCL are located adjacent to each other and mining and meteorological condi- tions are identical, emission factors developed for Dudhichua project can also be applied for all the
adjacent mines. The emission factors for Bharatpur opencast pro-
ject for post-monsoon and winter seasons were compared with those for Dudhichua project, which shows that emission factors are site-specific, unless geo-mining and meteorological conditions are identical.
9. Acknowledgements
This research work is a part of Ph. D. work of the prince- pal author. The financial support from the Ministry of Coal, Government of India through Central Mine Plan- ning & Design Institute Limited, Ranchi is gratefully acknowledged. We are also thankful to the management of Dudhichua project, Northern Coalfields Limited and Bharatpur opencast project, Mahanadi Coalfields Limited for providing necessary facilities during the field study. The authors are thankful to the Director, National Insti- tute of Rock Mechanics, for his permission to publish this paper. Thanks are also due to Mr. T. A. Renaldy for his help in conducting the field study.
REFERENCES [1] U. S. Environmental Protection Agency, “Compilation of
Air Pollutant Emission Factors. Volume I: Stationary Point and Area Sources,” Office of Air Quality Planning and Standards, Research Triangle Park, NC 27711, Janu-ary 1995.
[2] R. J. Bryan, “Emission Factors for Bulk Materials Process

Development of Emission Factors for Quantification of Blasting Dust at Surface Coal Mines
Copyright © 2010 SciRes. JEP
361
Fugitive Emissions,” PM-10: Implementation of Stan-dards: Transactions: APCA/EPA, International Specialty Conference, San Francisco, February 1988, pp. 336-352.
[3] C. F. Cole and R. L. Kerch, “Air Quality Management,” In: B. A. Kennedy Ed., Surface Mining, Society for Min-ing, Metallurgy, and Exploration Inc., Colorado, 1990, pp. 841-859.
[4] G. R. Adhikari, “Empirical Methods for the Calculation of the Specific Charge for Surface Blast Design,” FRAG-BLAST - The International Journal for Blasting and Fragmentation, Vol. 4, No. 1, 2000, pp. 19-33.
[5] U. S. Environmental Protection Agency, “Review of Sur-face Coal Mining Emission Factors,” Emission Factor and Inventory Group, Research Triangle Park, NC 27711, July 1991.
[6] U. S. Environmental Protection Agency, “Revision of Emission Factors for AP-42,” Section 11.9, Emission Factor and Inventory Group, Research Triangle Park, NC 27711, September 1998.
[7] Environment Australia, “Emission Estimation Technique Manual for Mining,” Version 2.3, December 2001, http://www.npi.gov.au.
[8] U. S. Environmental Protection Agency, “Compilation of Air Pollutant Emission Factors,” AP-42, Office of Air and Radiation Office of Quality Planning and Standards, Research Triangle Park, North Carolina 27711, 1985, http://www.epa.gov/
[9] Anon, “Compilation of Past Practices and Interpretations by EPA Region VIII on Air Quality – Mining,” USEPA, Region VIII, Denver, 1979.
[10] K. Axetell and C. Cowherd, “Improved Emission Factors for Fugitive Dust from Western Surface Coal Mining Sources,” Volume II: EPA Contract No. 68-03-2924, US Environmental Protection Agency, Cincinnati, OH, July, 1981(a).
[11] K. Axetell and C. Cowherd, “Improved Emission Factors for Fugitive Dust from Western Surface Coal Mining Sources,” Volume II: Pre-Publication Copy, US Envi-ronmental Protection Agency, Cincinnati, November 1981(b).
[12] National Pollutant Inventory, “Emission Estimation Technique Manual for Explosives Detonation and Firing Ranges,” March 1999. http://www2.unitar.org/
[13] Environment Australia, “Emission Estimation Technique Manual for Mining and Processing of Non-Metallic Min-erals,” November 1999. http://www2.unitar.org.
[14] Environment Australia, “Emission Estimation Technique Manual for Mining and Processing of Non-Metallic Min-erals,” Version 2.0, August 2000. http://www.npi.gov.au
[15] Guidebook, “EEA (European Environmental Agency) Emission Inventory Guidebook,” 2009. http://www.eea. europa.eu/
[16] M. K. Chakraborty, M. Ahmad, R. S. Singh, D. Pal, C. Bandopadhyay and S. K. Chaulya, “Determination of the Emission Rate from Various Opencast Mining Opera-tions,” Environmental Modelling & Software, Vol. 17, No. 5, 2002, pp. 467-480.
[17] M. K. Ghose, “Emission Factors for the Quantification of Dust in Indian Coal Mines,” Journal of Scientific & In-dustrial Research, Vol. 63, No. 9, 2004, pp. 763-768.
[18] S. K. Chaulya, “Assessment and Management of Air Quality for an Opencast Coal Mining Area,” Journal of Environmental Management, Vol. 70, No. 1, 2004, pp. 1- 14.
[19] Operation Manual, “Respirable Dust Sampler,” (Model IPM 115 BL), Instrumex, Mumbai, 2008.
[20] S. K. Maiti, “Handbook of Methods in Environmental Studies Vol. 2: Air, Noise, Soil and Overburden Analy-sis,” ABD Publishers, Jaipur, 2003.
[21] IS: 5182 (Part IV), “Methods for Measurement of Air Pollution (Suspended Matter),” BIS, New Delhi, 1973.
[22] NIRM, “Study on Blasting Dust Management System in an Opencast Coal Mine,” Project Code: EE/35, National Institute of Rock Mechanics, Kolar Gold Fields, 2010.
[23] N. E. Bowne, “Atmospheric Dispersion,” In: S. Calvert and H. M. Englund, Eds., Handbook of Air Pollution Technology, John Wiley & Sons, New York, 1984, pp. 859-891.
[24] F. A. Gifford, “Use of Routine Meteorological Observa-tions for Estimating Atmospheric Dispersion,” Nuclear Safety, Vol. 2, No. 4, 1961, pp. 47-51.
[25] H. S. Peavy, D. R. Rowe and G. Tehobanoglous, “Envi-ronmental Engineering,” McGraw-Hill, New York, 1985.
[26] A. Venkatram, “The Role of Meteorological Inputs in Estimating Dispersion from Surface Releases,” Atmos-pheric Environment, Vol. 38, No. 16, 2004, pp. 2439- 2446.
[27] J. T. McClave and T. Sincich, “A First Course in Statis-tics,” Prentice-Hall, New Jersey, 1997.
[28] W. J. Dixon and F. J. Massey, “Introduction to Statistical Analysis,” McGraw-Hill, Tokyo, 1983.