Embed Size (px)
Citation preview
i
Development of Elastomeric Auxetic
Structures for Impact Energy
Absorption
By
Muhammad Arshad Bashir
School of Chemical and Materials Engineering (SCME)
National University of Sciences & Technology (NUST)
2016
ii
Development of Elastomeric Auxetic
Structures for Impact Energy
Absorption
Muhammad Arshad Bashir 2009-NUST-trfPhD-MSE-79
This work is submitted as a PhD thesis in partial fulfillment of the
requirement for the degree of
(PhD in Materials and Surface Engineering)
Supervisor: Prof. Dr. Mohammad Shahid
School of Chemical and Materials Engineering (SCME)
National University of Sciences & Technology (NUST), H-12
Islamabad, Pakistan
APRIL, 2016
iii
Certificate
This is to certify that the research work in this thesis has been carried out by
Mr. Muhammad Arshad Bashir and completed under my supervision in
the Department of Materials Engineering, School of Chemical and
Materials Engineering, National University of Sciences and Technology,
Islamabad, Pakistan.
Supervisor: ______________
Prof. Dr. Muhammad Shahid
Materials Engineering
National University of Sciences & Technology (NUST), Islamabad
Submitted through
Prof. Dr. Mohammad Mujahid
Principal/Dean,
School of Chemical & Materials Engineering (SCME)
National University of Sciences & Technology (NUST), Islamabad

iv
In the Name of Allah, the Most Beneficent, the Most Merciful Dedication
I dedicate my PhD thesis work to my beloved father
(BashirAhmed), mother (Hameeda Begum), wife
(Riffat Arshad), Children (Hania Fatima MBBS-II,
Ahmed Bin Arshad (Civil Engg.-I and Hozaifa)

v
Acknowledgments I am grateful to the following persons and organizations for facilitating me with
affective guidelines, encouragement, equipments, accessories, funding, and moral
support to accomplish this research work.
Dr. Muhammad Shahid (HoD Materials Engineering , NUST, Islamabad)
Dr. Mohammad Mujahid (Principal/Dean, SCME, NUST, Islamabad)
Dr.Muhammad Bilal Khan (Principal/Dean, CES, NUST, Islamabad)
Dr. Abdul Quddos (CSO, IICS Rawalpindi)
Dr.Noaman-ul-Haq (Assistant Professor COMSATS, Lahore)
Dr. Nasir Mehmood (Associate Professor, SCME, NUST, Islamabad)
Dr. Aamir Habib (Assistant Professor, SCME, NUST, Islamabad)
Dr. Shamshad Ahmed (Professor, SCME, NUST, Islamabad)
Dr. Iftikhar Hussian Gul (Assistant Professor, SCME, NUST, Islamabad)
Dr. Muhammad Tanveer
Dr.Nadeem Iqbal (Assistant Professor Punjab University, Lahore)
Dr. Sadia Sagar (Assistant Professor Punjab University, Lahore)
Mr.Riaz Ahmed (DG, IICS Rawalpindi)
Dr.Syed Muzammil Hussain Shah (Director, IICS Rawalpindi)
Mr.Muhammad Khalid (Ex. Deputy Director IICS, Rawalpindi)
Mr.Muhammad Aslam (Tech.Officer IICS Rawalpindi)
Mr.Syed Saad Sajjad (Tech.Officer IICS Rawalpindi)
Mr.Irfan Ahmed (PT-1 IICS Rawalpindi)
Mr.Amir Baig (ST IICS Rawalpindi)
Special thanks to All my Friends, Brothers and Sisters
Institute of Industrial Control System(IICS), Rawalpindi
Higher Education Commission (HEC), Islamabad for providing sufficient
financial support to fulfill the research objectives.
vi
Abstract
Elastomeric sponge and auxetic materials have unique characteristics which
distinguish them from other solid materials like metals and ceramics. Such
engineering materials with unique performance are a continuous requisite so as to
assist the evolution for advance engineering applications. Auxetic materials
(materials with negative Poisson’s ratio) have a unique feature of getting fatter when
pulled and contract transversely when compressed, longitudinally. They are mainly
used for their improved indentation resistance, higher fracture toughness, better
thermal shock resistance, and good acoustic damping. Twenty diverse compositions
were developed with various reinforcements’ incorporation such as carbon black
nano particles etc., varying blending ratios of natural rubber (NR), styrene butadiene
rubber (SBR), and nitrile butadiene rubber (NBR) in ethylene propylene diene
monomer (EPDM). Sponge and auxetic structures were developed during
vulcanization a hot isostatic biaxial hydraulic press by volumetric compression and
cooling under pressure. The reinforcements were impregnated into the elastomeric
matrices using internal dispersion kneader and two-rolls mixing mill. Seven types of
mold geometries were designed and used as per ASTM standards to fabricate
nanocomposites using a hot press in order to evaluate the elastomeric composites for
rheological, mechanical, structural, vulcanization, compressive strain, dynamic
mechanical thermal analysis and impact energy absorption applications. Mechanical
characteristics were executed using Universal Testing Machine (UTM), Dynamic
Mechanical Thermal Analyzer (DMTA) and rubber hardness tester. Scanning
electron microscopy coupled with EDS were used to evaluate sponge and auxetic
structures. The synthesized auxetic materials verified by scanning electron images
and Poisson’s ratio determined by processing images using ‘Matlab’ software. With
the advances in the fabrication and synthesis of a wider range of these thrilling
materials, there is enormous potential for applications in industrial and commercial
sectors. Among the various rubber systems investigated EPDM based elastomeric
composites proved to be the best for development of auxetic structures. Hardness of
the EPDM sponge composite with 20% incorporation of carbon black nano fillers
enhanced up to 112%. EPDM with the addition of 20% carbon black attained tensile
strength 142%, compared to EPDM without reinforcement; this nanocomposite also
showed a 20% reduction in impact energy absorption. EPDM-30%NR reinforced
with 20% carbon black showed a minimum reduction of 33% in storage modulus
indicating good retention of elasticity. Maximum enhancement of 400% loss
modulus was obtained in case of EPDM-30%SBR reinforced with 20% carbon
black. Rheological bahaviour such as loss tangent during vulcanization enhanced up
to 130%, 300%, 85%, 11% by incorporation of 30% carbon black, 30% NBR, 30%
NR, and 30 % SBR.

vii
Contents
VIII
List of Figures
List of Tables
Abbreviations
List of Publications
XII
XVI
XVII
108
viii
Chapter#1
Introduction
1.1 Introduction
1.2 Impact Energy
1.3 Impact energy absorbing materials
1.4 Polymers
1.5 Elastomer or rubber
1.6 Thermoplastics
1.7 Thermosets
1.8 Sponge structures
1.9 Auxetic Materials
1.10 Auxetic Structures
1.11 Indentation behavior
1.12 Fracture toughness
1.13 Behavior of auxetic materials in blood vessel
1.14 Research motivation
Chapter#2
Literature Review
2.1 Brief history and background
2.2 Geometric models and structures for the development of auxetic materials
2.2.1 Re-entrant structures
2.2.2 Chiral Structures
2.2.3 Rotating units
2.2.4 Angle ply laminates
2.2.5 Hard molecules
2.3 Microscopic polymer models
2.3.1 Liquid crystalline polymer model
3
3
3
4
4
5
5
5
6
8
9
10
11
12
14
14
14
16
17
17
18
19
20

ix
2.4 Polymeric auxetic materials
2.4.1 Sponge structures in polymers
2.4.2 Micro porous polymer fibers
2.4.3 Fabrication Techniques
2.4.3.1 For conventional foams available with open and partly open
cells
2.4.3.2 For the conventional foams available in close cells
2.5 Polymeric composites
2.6 Elastomeric matrices
2.6.1 Ethylene Propylene Diene Monomer (EPDM)
2.6.2 Nitrile Butadiene Rubber (NBR)
2.6.3 Styrene Butadiene Rubber (SBR)
2.6.3.1 Emulsion polymerization
2.6.3.2 Preparation of SBR by solution process
2.6.3.3 Natural Rubber (NR)
2.7 Processing aids
2.7.1 Processing oils
2.7.2 Paraffin wax
2.7.3 Activators
2.7.4 Cross linkers
2.7.4.1 Sulphur
2.7.4.2 Organic per oxides
2.7.5 Accelerators
2.7.5.1 Thiocarbanillide
2.7.5.2 Guanidines
2.7.5.3 Thiazoles
2.7.5.4 Thiurams
2.8 Reinforcing filler
20
21
21
22
22
22
22
23
25
26
27
28
29
31
31
32
32
32
32
33
34
34
35
35
35
x
Chapter#3
Auxetic Structures, Characterization & Experimental Techniques
3.1 Development of sponge structures
3.1.1 Compounding of ingredients
3.1.2 Processing
3.1.3 Vulcanization
3.1.4 Rheological characteristics
3.2 Mold for auxetic structures
3.2.1 Mold for development of auxetic sheets.
3.2.2 Development of Auxetic Structures
3.2.3 Poisson’s ratio measurement
3.3 Mechanical Characterization
3.3.1 Tensile characteristics
3.3.2 Hardness testing
3.3.3 Compression testing
3.3.4 Measurement of Poisson’s ratio
3.4 Scanning electron microscopy (SEM)
3.5 Experimental
3.5.1 Materials
3.5.2 Compounding
3.5.3 Formulations for mixing
3.5.4 Mixing
3.5.5 Formation of samples
3.5.6 Testing / Characterization
37
37
38
39
41
42
43
45
46
47
47
49
49
49
50
52
53
53
53
56
56
56

xi
Chapter#4
Results and Discussions
4.1 Mechanical, Rheological and Vulcanization characterization of EPDM-Carbon
Nanocomposites
4.1.2 Curing characteristics
4.1.3 Mechanical behaviour
4.2 EPDM/NBR blended sponge nano- composites
4.2.1 Mechanical Characterization
4.3 EPDM-Natural Rubber nano composites
4.3.1 Characterization
4.4 EPDM - SBR Based Sponge Nanocomposites Mechanical, Curing, Viscoelastic and
Structural Investigation
4.4.1 Mechanical Testing
4.5 EPDM Based Auxetic Materials Mechanical and Structural Investigation
4.5.1 Characterization Techniques
4.5.2 Poisson’s ratio measurement
Chapter#5
Conclusions and Future Recommendations
5.1 Conclusions
5.2 Future Recommendations
58
58
59
67
67
74
75
85
85
95
95
96
107
108
xii
List of Figures
Chapter#1 Figure 1.1:- Types of polymers (a) Linear polymer (b) Branched polymer
(c) Cross linked polymer.
Figure 1.2:- The material exhibits positive Poisson’s ratio
Figure 1.3:- The material’s behavior with negative Poisson’s ratio
Figure 1.4:- Ideal structures for sponge cells. (a) Conventional cell
(b) Auxetic or re-entrant cell Figure 1.5:- a) non auxetic behavior b) auxetic behavior
Figure 1.6:- Crack propagation through spongy materials
Figure 1.7:- Deformation behavior of artificial blood vessels: (a) Conventional
material and (b) Auxetic material
Chapter#2
Figure 2.1:- 2D honeycomb re-entrant structure (a) un-deformed (b)
deformed showing auxetic behavior
Figure 2.2:- Re-entrant structures other than honey comb (a) double
arrowhead (b) star honey comb (c) re-entrant honey comb
(d) lozenge grids (e) grid structures (f) ligaments structures.
Figure 2.3:- Chiral honeycomb structures (a) developed by similar chiral
units (b) developed by symmetrical chiral structures
Figure 2.4:- Rotating units (a) triangle units (b) square units (c) rectangle
units (d) tetrahedron units.
Figure 2.5:- Composites with angle-ply laminate (a) composite’s structure
(b) model of the composite
Figure 2.6:- Hard molecule model, close pack structure of hard cyclic
hexa- mers
4
6
7
8
9
10
11
15
15
16
17
18
19
xiii
Figure 2.7:- Microstructure nodule-fibril representing micro porous
polymer (a) stable state polymer (b) in tensile load auxetic
polymer
Figure 2.8:- Liquid crystalline polymer (LCP) model (a) at the relaxed state
(b) Intension mode showing auxetic behavior
Figure 2.9:- Polymeric based sponge structures (a) conventional foam
(b) auxetic foam
Figure 2.10:- Micro structure of PTFE based auxetic material.
Figure 2.11:-Polymer based auxetic composites, PP fiber embedded in
epoxy resin
Figure 2.12:- Chemical structure of ethylene propylene diene monomer
(EPDM)
Figure 2.13:- Chemical structure of Nitrile Butadiene Rubber (NBR)
Figure 2.14:- Chemical structure of Styrene Butadiene Rubber
Figure 2.15:- Chemical structure of Natural Rubber (NR)
Figure 2.16:- Cross linking un-vulcanized elastomer with sulphur
Figure 2.17:- Chemical Structure of Dicumyl Per Oxide (DCP)
Chapter#3
Figure 3.1:- Formation of sponge structures in elastomeric composite
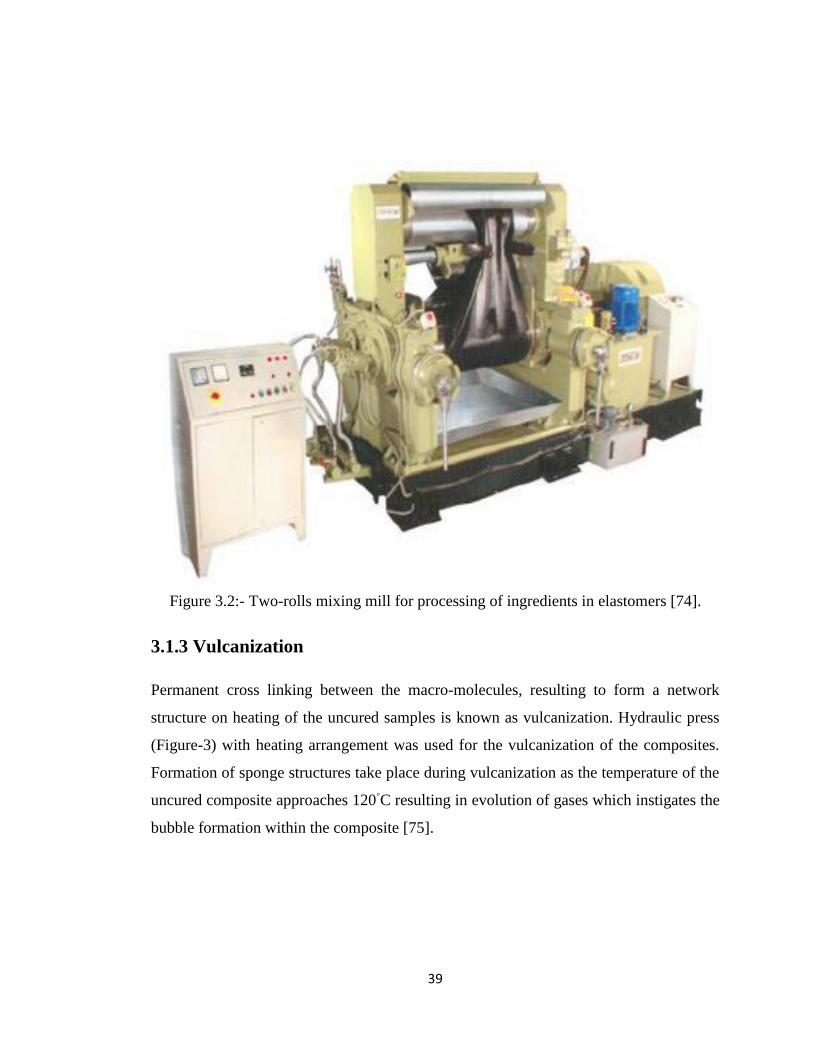
Figure 3.2:- Two-rolls mixing mill for processing of ingredients with
elastomers
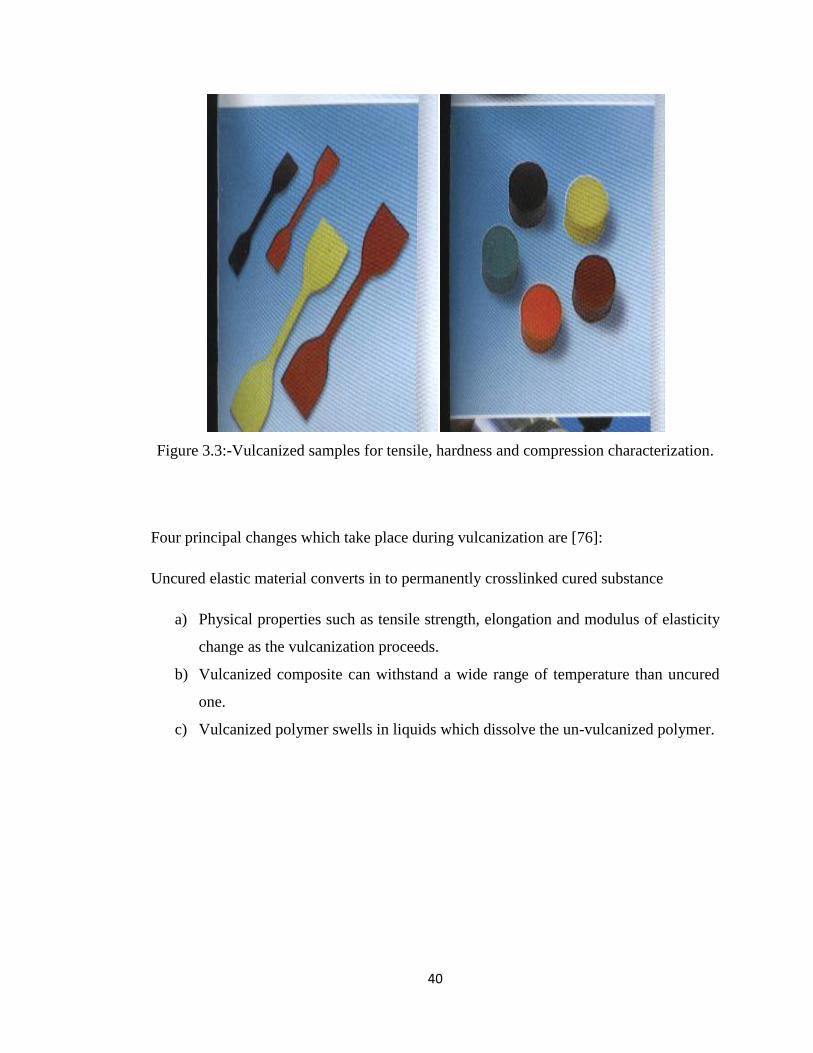
Figure 3.3:-Vulcanized samples for tensile, hardness and compression
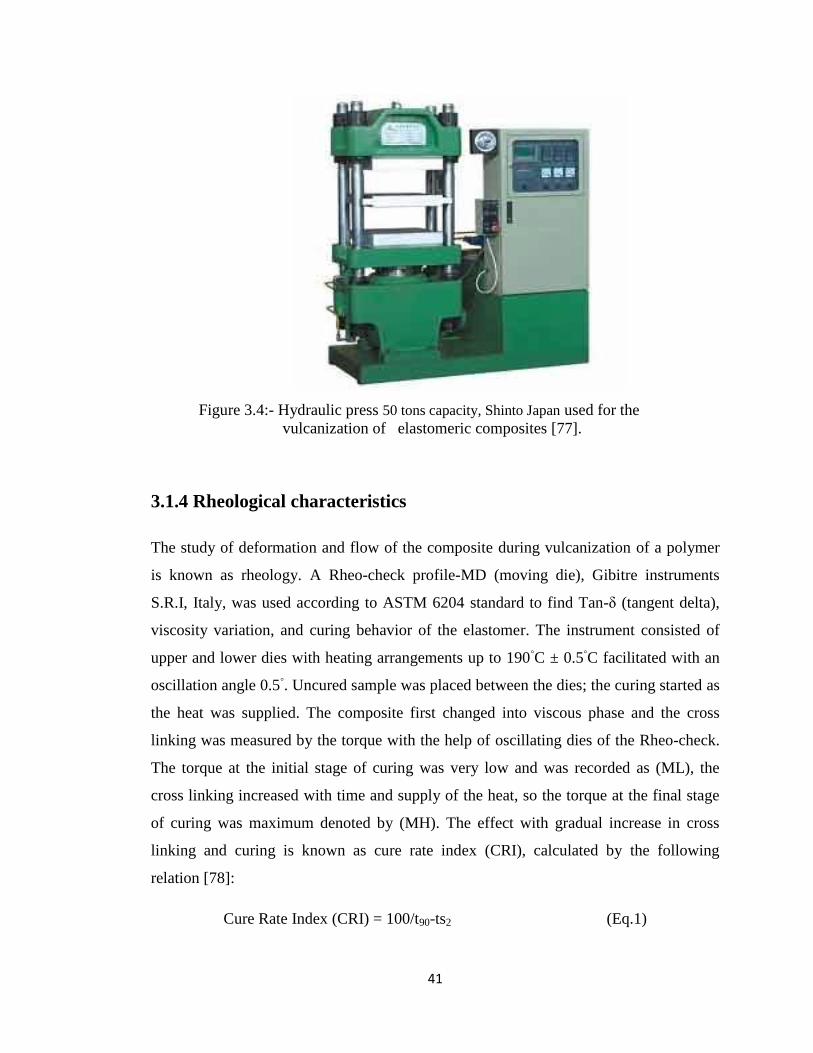
Figure 3.4:- Hydraulic press used for the vulcanization of elastomeric
composites
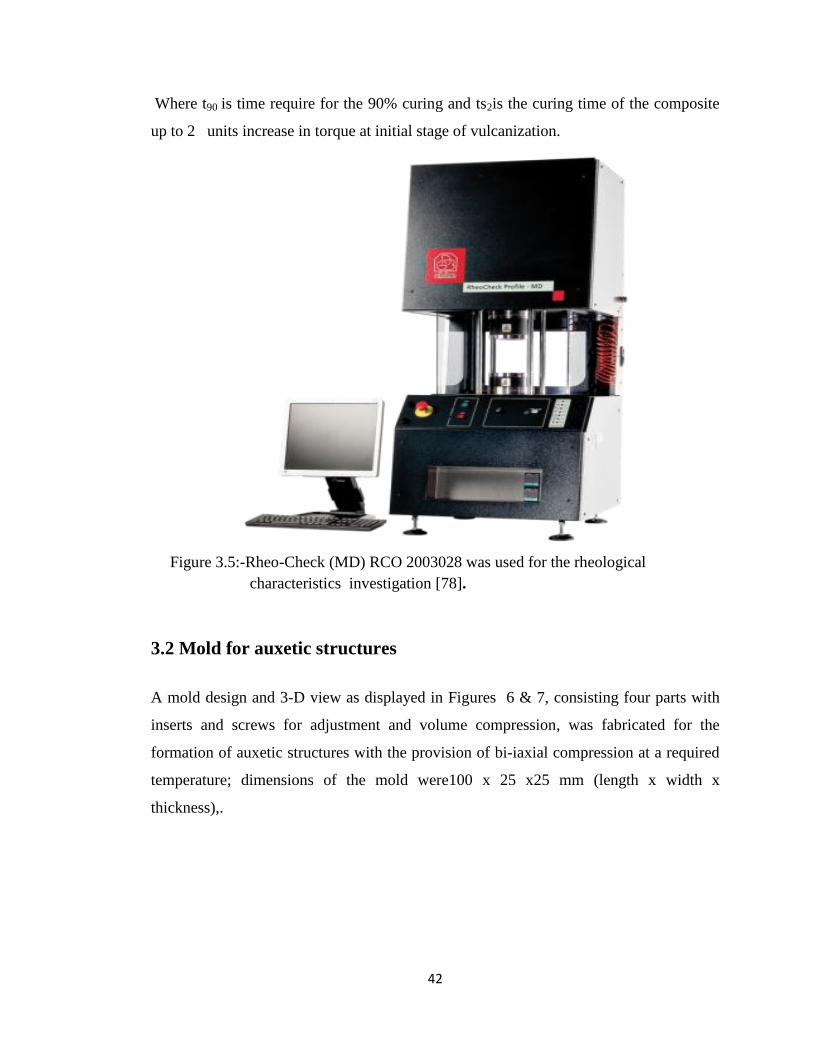
Figure 3.5: Rheo-Check (MD) RCO 2003028 for the rheological
characteristics
Figure 3.6:- Design of mold for the fabrication of EPDM based auxetic
structures
Figure 3.7:- 3-D view of the mold for the fabrication of EPDM based
auxetic
Figure 3.8:- Design of mold for the fabrication of EPDM based auxetic
sheets.
Figure 3.9:- 3-D view of the mold for the fabrication of EPDM based
auxetic
19
20
21
21
23
24
26
27
30
33
34
37
39
40
41
42
43
43
44
44
xiv
Figure 3.10:- Measuring of extension and expansion of the samples by UTM
Figure 3.11:- Extensometers Zwick-3549 for Poisson’s ratio measurement
Figure 3.12:- Tensor-check TCC2003098 used for testing tensile properties
Figure 3.13:- Hardness tester GS-709 N Tecklock Japan Durometer (Shore A)
Figure 3.14:- Universal testing machine SHIMADZU AG used in compression
mode for compressive strain
Figure 3.16:- JEOL JSM-6490 used for structural characterization of the
samples.
Chapter#4
Results and Discussion
Figure 4.1:- Effect of carbon black contents on Cure Rate Index of the
composite specimens
Figure 4.2:- Effect of carbon black contents on % curing with time at 190oC
sponge EPDM composites
Figure 4.3:- The effect of nanocarbon concentration on the stress-strain
behavior of the fabricated polymer composites
Figure 4.4:- Improvement in EPDM hardness by the addition of carbon black in
the Polymer matrix
Figure 4.5:- Increase in Tan δ of EPDM sponge composite by adding
carbon black
Figure 4.6:- Load-compression diagrams during compression testing
of EPDM sponge nano composites at various nano fillers’ loadings
Figure 4.7:- Effect of carbon black concentration energy absorption
Figure 4.8:- Effect of carbon nano filler on storage modulus of the
EPDM
Figure 4.9:- Effect of carbon nano filler on loss modulus of the EPDM
composites
Figure 4.10:- SEM micrographs showing variation in pore structure of EPDM
nano composites with addition of carbon black
Figure4.11:-The effect of blending ratio of NBR in EPDM on
hardness of blended composite .
Figure 4.12:- Curing behavior of blended composite with varying part of NBR
in EPDM
Figure 4.13:- Effect of blending of NBR on viscosity variation of EPDM
based nano-composite
Figure 4.14:- Variations in tan delta at minimum and maximum crosslinking
46
47
48
49
50
51
58
59
60
61
62
62
63
64
65
66
67
68
69
69
xv
Figure 4.15:- Variations in tensile strength of the composite
Figure 4.16: -Variations in % elongation of the composite
Figure 4.17:- Variations in storage modulus of the blended composite
Figure 4.18:- Variations in loss modulus of the EPDM/NBR
blended composite
Figure 4.19:- Load-compression curves of various EPDM/NBR blends
Figure 4.20:- Effect of EPDM/NBR blending ratio on energy absorbance
Figure 4.21:- Scanning Electron Micrographs EPDM/NBR
blended composites
Figure 4.22:- Effect of EPDM-NR blending ratio on mechanical torque
Figure 4.23:- Curing behavior of various formulations of EPDM-NR blends
Figure 4.24:- Variations in tan delta of EPDM/NR blended composite
Figure 4.25:- Effect of temperature on storage modulus of the
blended composites
Figure 4.26:- Effect of temperature on loss modulus of EPDM/NR blended
composites
Figure 4.27:- Effect of EPDM/NR blending ratio on compressive strain of
blended composites.
Figure 4.28:- Hardness variations in EPDM/NR blended composites
Figure 4.29:- Variations in tensile strength of EPDM/NR blended composite
Figure 4.30:-Effect of NR concentration on elongation of EPDM.
Figure 4.31:- Variations in energy absorption of EPDM/NR blended
composite
Figure 4.32:- Variations in sponge structure formation of EPDM/NR blended
composite
Figure4.33:- Variation in hardness of the EPDM based
composite with different blending ratio of SBR
Figure4.34:- Variation in tensile strength of the composite with
different blending ratio of SBR
Figure 4.35:- Variation in % elongation of EPDM/SBR blended composite
Figure 4.36:- Variation in compressive strain EPDM/SBR blended composite
Figure 4.37:- Variation in energy absorbance of EPDM/SBR blended
composite Figure 4.38:- Curing behavior of blended composite with varying part of SBR
in EPDM
Figure 4.39: Effect of blending of SBR on viscosity variation of EPDM based
blended composite.
70
70
71
72
73
74
75
76
77
78
79
80
81
82
83
84
84
85
86
87
88
89
89
90
91
xvi
Figure 4.40:- Variations in tan delta of the EPDM/SBR blended composite
Figure 4.41:- Variations in storage modulus of the EPDM/SBR blended
composite
Figure 4.42:- Variations in loss modulus of the EPDM/SBR blended composite
Figure 4.43:- Scanning Electron Micrographs EPDM/SBR blended composites
Figure 4.44:-Model of Auxetic structures developed by Lake in 1987.
Figure 4.45:- Measuring of extension and expansion of the samples by universal
testing machine
Figure 4.46:- Variations in hardness of the EPDM based auxetic composite
Figure 4.47:- Variations in of the compressive strain of the EPDM based auxetic
structures
Figure 4.48:- Variations in energy absorbance of EPDM based auxetic
composite.
Figure 4.49:- Structural view of the composite as reported in literature and
developed at NUST lab
Figure 4.50:- Variation in the structure of EPDM based auxetic composite with
the variation of carbon black concentration
Figure 4.51:- Variation in the storage modulus of EPDM based auxetic
composite with the variation of carbon black concentration
Figure 4.52:- Variation in the loss modulus of EPDM based auxetic composite
with the variation of carbon black concentration.
92
93
94
95
96
96
97
98
99
99
103
104
105
xvii
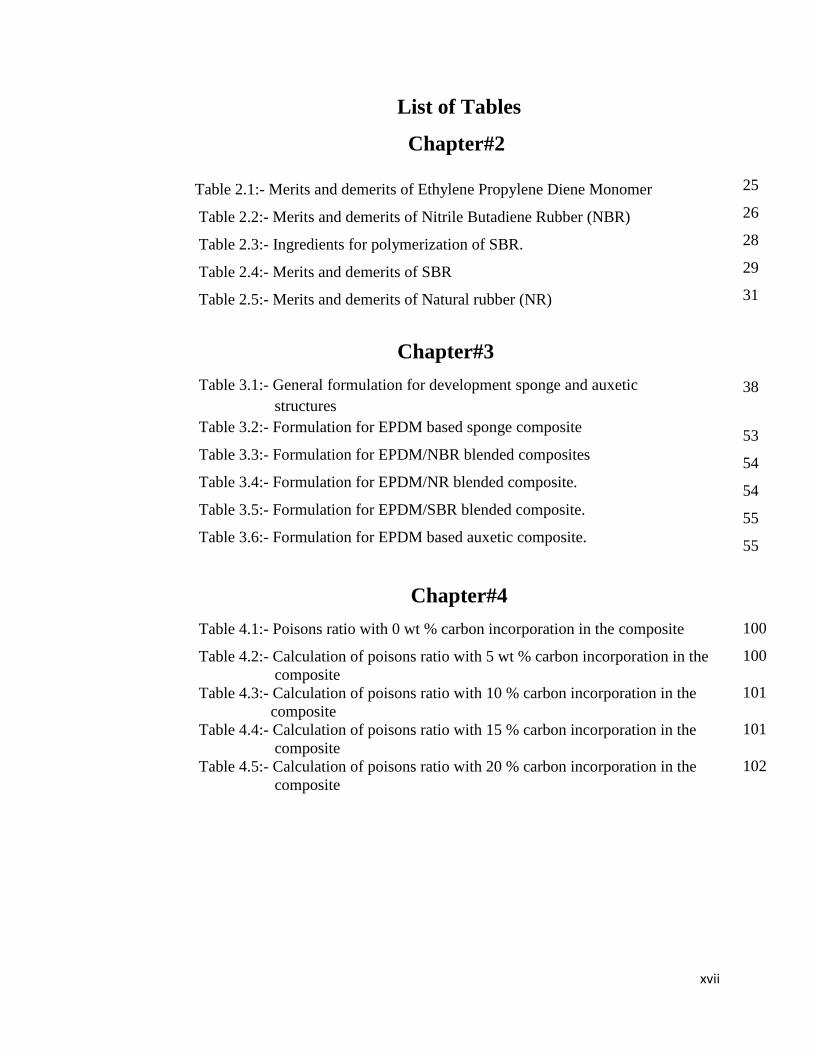
List of Tables
Chapter#2
Table 2.1:- Merits and demerits of Ethylene Propylene Diene Monomer
Table 2.2:- Merits and demerits of Nitrile Butadiene Rubber (NBR)
Table 2.3:- Ingredients for polymerization of SBR.
Table 2.4:- Merits and demerits of SBR
Table 2.5:- Merits and demerits of Natural rubber (NR)
Chapter#3
Table 3.1:- General formulation for development sponge and auxetic
structures
Table 3.2:- Formulation for EPDM based sponge composite
Table 3.3:- Formulation for EPDM/NBR blended composites
Table 3.4:- Formulation for EPDM/NR blended composite.
Table 3.5:- Formulation for EPDM/SBR blended composite.
Table 3.6:- Formulation for EPDM based auxetic composite.
Chapter#4
Table 4.1:- Poisons ratio with 0 wt % carbon incorporation in the composite
Table 4.2:- Calculation of poisons ratio with 5 wt % carbon incorporation in the
composite
Table 4.3:- Calculation of poisons ratio with 10 % carbon incorporation in the
composite Table 4.4:- Calculation of poisons ratio with 15 % carbon incorporation in the
composite Table 4.5:- Calculation of poisons ratio with 20 % carbon incorporation in the
composite
25
26
28
29
31
38
53
54
54
55
55
100
100
101
101
102
xviii
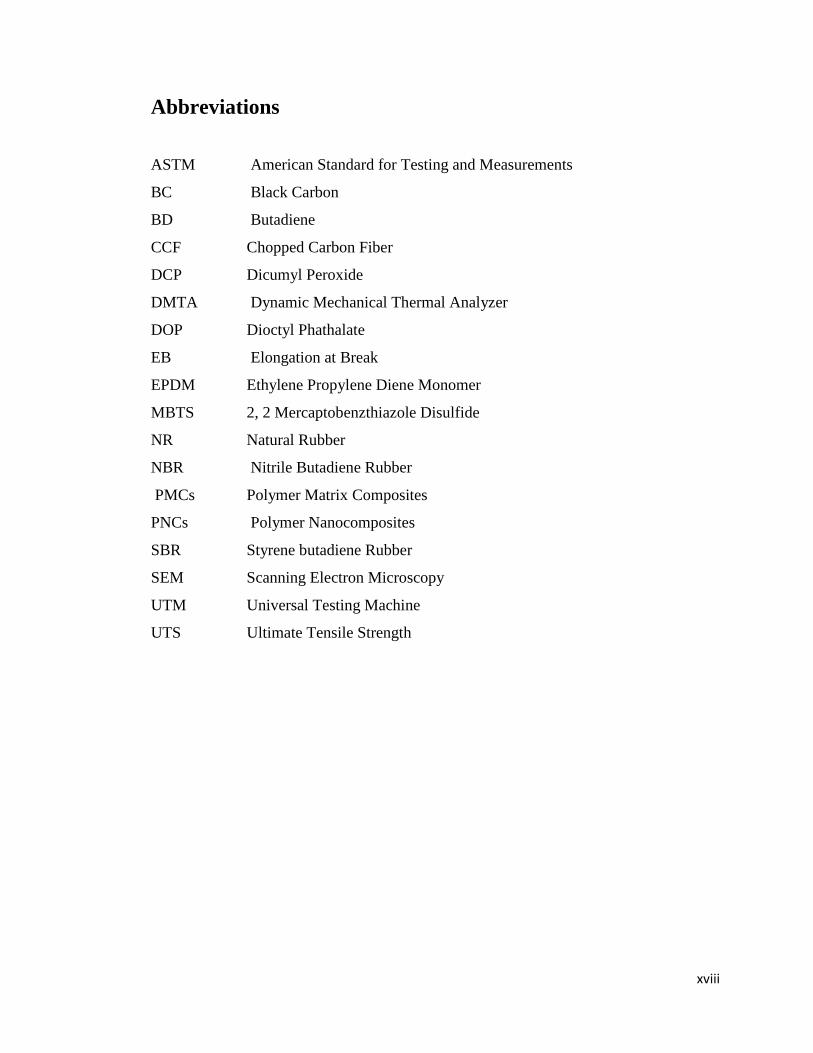
Abbreviations
ASTM American Standard for Testing and Measurements
BC Black Carbon
BD Butadiene
CCF Chopped Carbon Fiber
DCP Dicumyl Peroxide
DMTA Dynamic Mechanical Thermal Analyzer
DOP Dioctyl Phathalate
EB Elongation at Break
EPDM Ethylene Propylene Diene Monomer
MBTS 2, 2 Mercaptobenzthiazole Disulfide
NR Natural Rubber
NBR Nitrile Butadiene Rubber
PMCs Polymer Matrix Composites
PNCs Polymer Nanocomposites
SBR Styrene butadiene Rubber
SEM Scanning Electron Microscopy
UTM Universal Testing Machine
UTS Ultimate Tensile Strength
1
Development of Elastomeric Auxetic
Structures for Impact Energy Absorption
By
Muhammad Arshad Bashir

2
Chapter-1
Introduction
3
1.1 Introduction
Recently demands for the materials bearing capability for absorbing high impact
energy for personal and general protection have been increased manifolds.
Elastomers with auxetic structures are the best choice to overcome the issue as
compared to other materials like ceramics, metals etc. Ceramics are brittle in
nature and can only be used for one time use only to absorb energy hitted by bullet
or shatters from explosion. Metals and other such types of materials are hard so
they transfer major part of impact to the protected body. They are also difficult to
wear or use due to inflexibility nature of these materials. Auxtic structures in
elastomers provides cushioning effect or tiny air bags along with other
characteristics as mentioned below absorb major part of impact to protect inner
body. Moreover being flexible and viscoelastic in nature, they retain their shape
and can be used easily and many times as compared to ceramics. The current
research is based on elastomeric auxetic structures which are being addressed first
time as the elastomers have maximum capability of impact energy absorption
1.2 Impact Energy
Impact can be defined as a shock or high force applied for a short interval of time.
Usually, it has greater effect as compared to a force applied over long period of
time. The effect is mainly dependent on the relative velocities of the bodies [1]. At
normal speed and inelastic collision, the deformation will absorb most of the energy
produced by the projectile but at high speed collision (impact) does not provide
sufficient time to absorb abrupt change [2].
Impact energy absorption is very important to protect human beings or sensitive
devices from bullets or shatters from explosion.
1.3 Impact energy absorbing materials.
At high speed collision, normal materials behave as brittle and impulsive force
causes to fracture the material. Increase in modulus of elasticity, causes to decrease
in impact resistance [3]. Resilient materials e.g. elastomers and polymers are
4
considered better impact resistant. Sponge or cellular structures produced within the
polymers and elastomeric composite enhance the efficiency for impact energy
absorption [4, 5].
1.4 Polymers
Polymers have recently replaced many materials owing to their light weight, thermal
and electrical insulation, impact energy absorption, corrosion and ozone resistance
etc. The molecular mass of polymers may vary from100,000 to 250,000 which
represent a chain length of 6,000 to 15,000 carbon atoms respectively. Polymers
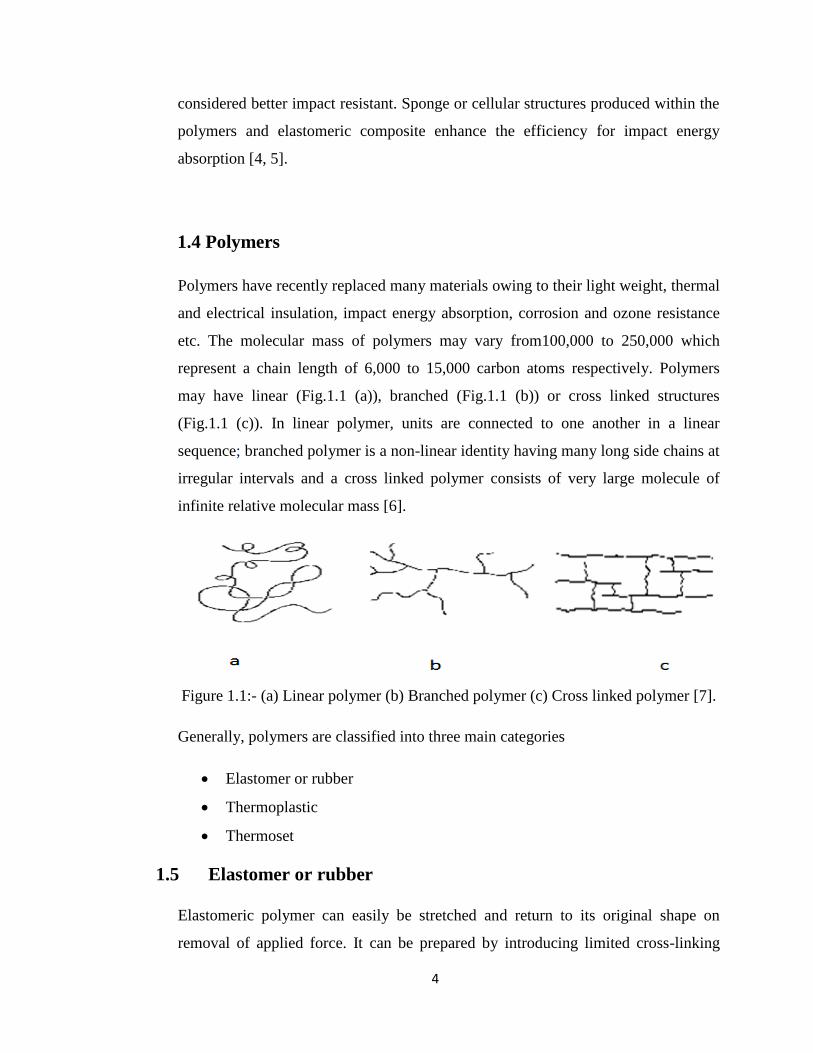
may have linear (Fig.1.1 (a)), branched (Fig.1.1 (b)) or cross linked structures
(Fig.1.1 (c)). In linear polymer, units are connected to one another in a linear
sequence; branched polymer is a non-linear identity having many long side chains at
irregular intervals and a cross linked polymer consists of very large molecule of
infinite relative molecular mass [6].
Figure 1.1:- (a) Linear polymer (b) Branched polymer (c) Cross linked polymer [7].
Generally, polymers are classified into three main categories
Elastomer or rubber
Thermoplastic
Thermoset
1.5 Elastomer or rubber
Elastomeric polymer can easily be stretched and return to its original shape on
removal of applied force. It can be prepared by introducing limited cross-linking

5
between the chains of monomer. Elasticity can be tailored by adding cross-linkers
which vary the pull-back force when stretched. As the number of cross-linker
increases, the viscous part diminishes causing a decrease in elastic component;
consequently, it may become brittle. The principle to classify a polymer as cross-
linked, depends on the limit to which main or side chains in the polymer backbone
inter-link covalently [8].
1.6 Thermoplastics
“Thermo” means heat and “plastic” means capable of being shaped or formed.
When these type of materials are heated they become soft and can be molded into a
variety of shapes on cooling [9]. Thermoplastics can be reheated and reshaped.
These materials exist in the form of linear, branched and lightly cross linked e.g.
polypropylene, polyethylene, polystyrene etc.[10].
1.7 Thermosets
These are heavily cross linked polymers, once a cross link is formed within the
polymer; it cannot be changed or re-shaped. On heating, thermosets begin to
decompose or degrade rather than moldable or pliable; phenolic resins and epoxies
are major examples of thermosets [11].
1.8 Sponge structures
The development of pores and cells within the materials or composites using
various techniques differentiate them from other classes of materials like steel,
ceramics etc., because of their unique characteristics to absorb high impacts and
pressures [12]. Sponge or cellular structures exist in nature as major constructing
part of different materials with different geometries and configurations. The
formation of these materials is basically dependent on the environmental
conditions. Scientists and engineers have taken keen interest in these materials due
to their unique characteristics like lightweight, high strength to weight ratio,
vibration and thermal resistance, high impact energy absorbents, acoustic
6
dampening etc. Some of the naturally occurring sponge structured materials are
playing very important roles in our daily life e.g. bone, coral, stalk of plant etc.
The requirement of modern technology is to develop materials with special
characteristics [13]. Due to the unusual mechanical characteristics, they can be used
as matrices to develop composite for advance industrial and engineering
applications [12].
1.9 Auxetic Materials
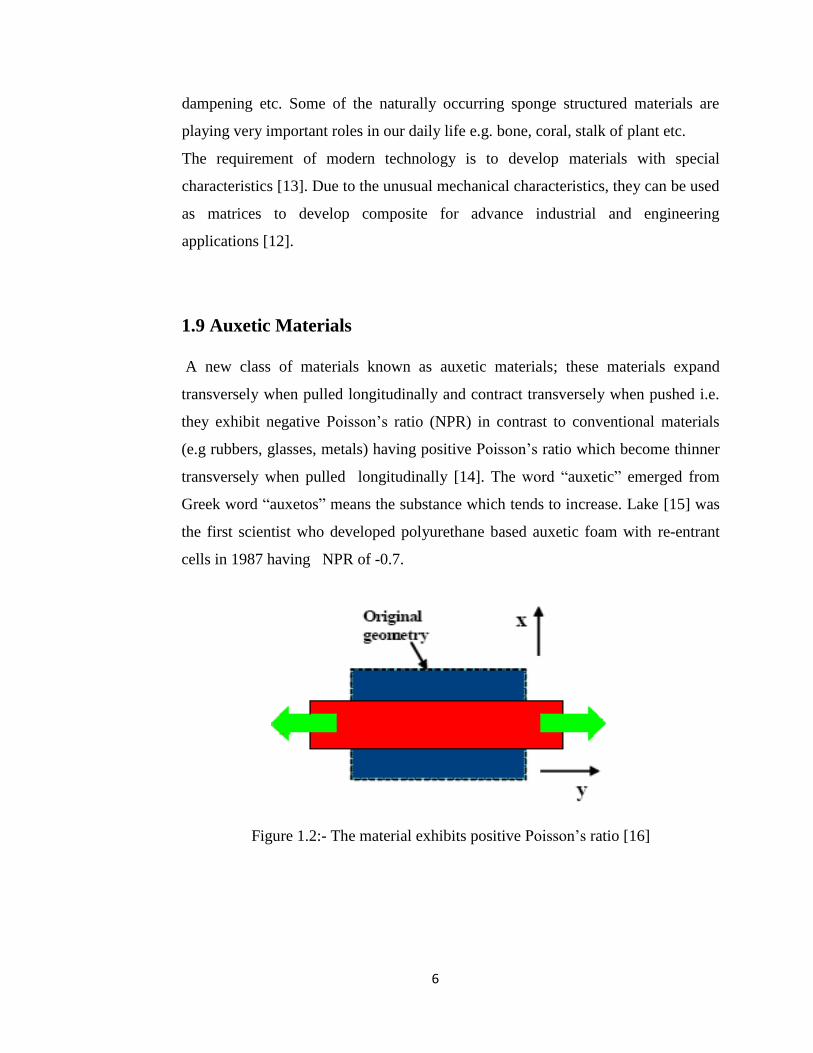
A new class of materials known as auxetic materials; these materials expand
transversely when pulled longitudinally and contract transversely when pushed i.e.
they exhibit negative Poisson‟s ratio (NPR) in contrast to conventional materials
(e.g rubbers, glasses, metals) having positive Poisson‟s ratio which become thinner
transversely when pulled longitudinally [14]. The word “auxetic” emerged from
Greek word “auxetos” means the substance which tends to increase. Lake [15] was
the first scientist who developed polyurethane based auxetic foam with re-entrant
cells in 1987 having NPR of -0.7.
Figure 1.2:- The material exhibits positive Poisson‟s ratio [16]
7
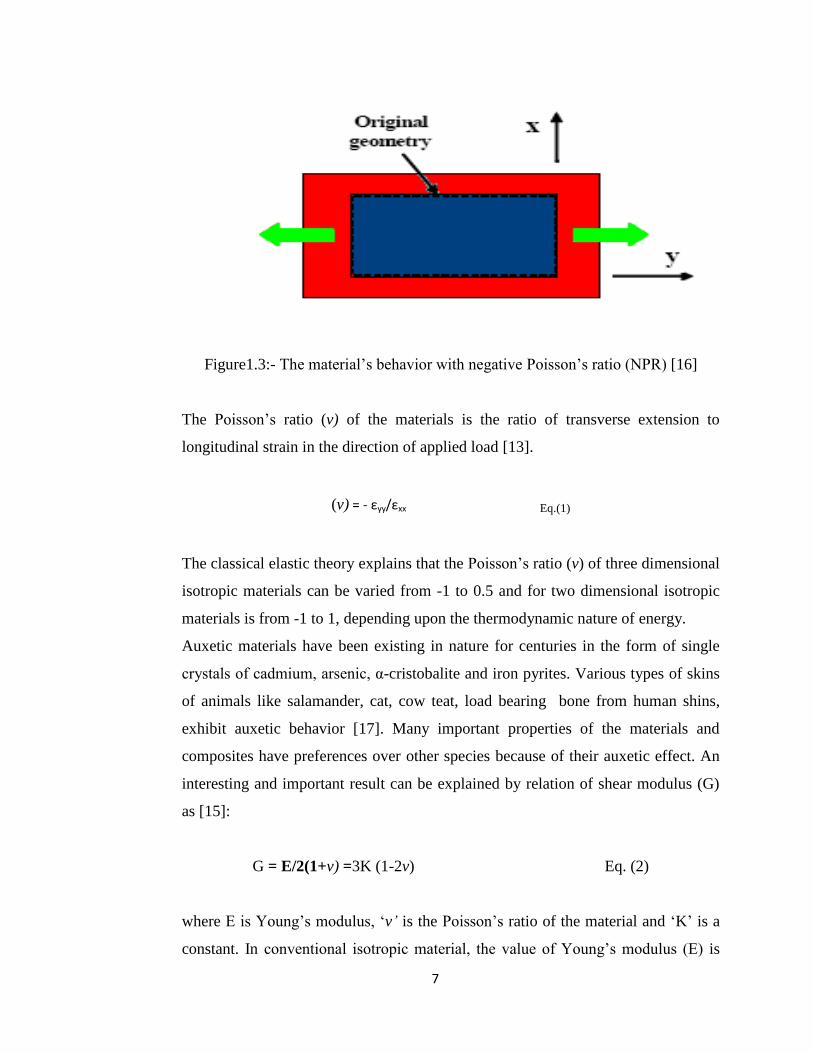
Figure1.3:- The material‟s behavior with negative Poisson‟s ratio (NPR) [16]
The Poisson‟s ratio (v) of the materials is the ratio of transverse extension to
longitudinal strain in the direction of applied load [13].
(v) = - εyy/εxx Eq.(1)
The classical elastic theory explains that the Poisson‟s ratio (v) of three dimensional
isotropic materials can be varied from -1 to 0.5 and for two dimensional isotropic
materials is from -1 to 1, depending upon the thermodynamic nature of energy.
Auxetic materials have been existing in nature for centuries in the form of single
crystals of cadmium, arsenic, α-cristobalite and iron pyrites. Various types of skins
of animals like salamander, cat, cow teat, load bearing bone from human shins,
exhibit auxetic behavior [17]. Many important properties of the materials and
composites have preferences over other species because of their auxetic effect. An
interesting and important result can be explained by relation of shear modulus (G)
as [15]:
G = E/2(1+v) =3K (1-2v) Eq. (2)
where E is Young‟s modulus, „v’ is the Poisson‟s ratio of the material and „K‟ is a
constant. In conventional isotropic material, the value of Young‟s modulus (E) is
8
almost twice that of shear modulus (G).When the Poisson‟s ratio becomes negative,
the values of two moduli approach each other at „v’ = -0.5,which means that
material has become highly compressible but difficult to shear. Beyond this limit,
the shear modulus exceeds the elastic modulus. It is obvious from Eq.2 that when
„v’ approaches to a limit of an isotropic material i.e. -1, the shear modulus
approaches to infinitely large. Other properties like indentation resistance, thermal
shock resistance, acoustic dampening properties and fracture toughness based on
auxetic behavior have shown amplification due to their special characteristics of
NPR effect [18]. The auxeticity of a material can be demonstrated in terms of
particular geometry and deformation upon mechanical loading. The development of
auxeticity is independent of the scale i.e. the auxetic behavior can be developed at
microscopic and macroscopic levels [19].
1.10 Auxetic Structures
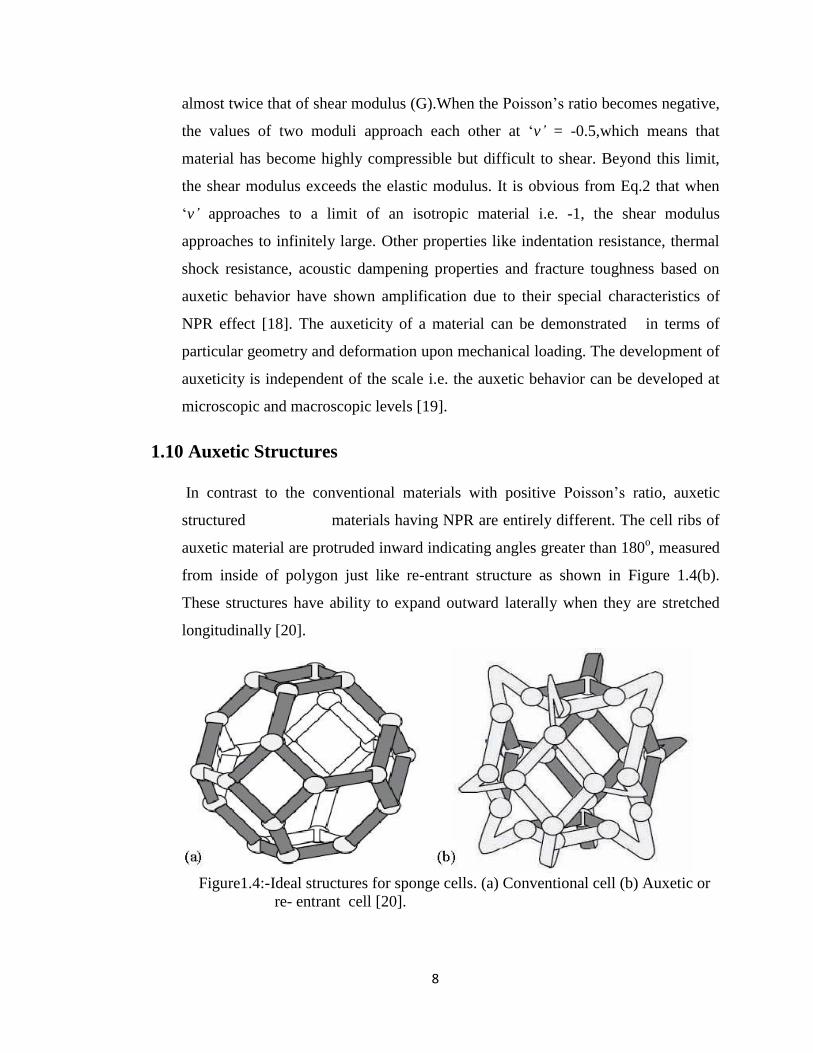
In contrast to the conventional materials with positive Poisson‟s ratio, auxetic
structured materials having NPR are entirely different. The cell ribs of
auxetic material are protruded inward indicating angles greater than 180o, measured
from inside of polygon just like re-entrant structure as shown in Figure 1.4(b).
These structures have ability to expand outward laterally when they are stretched
longitudinally [20].
Figure1.4:-Ideal structures for sponge cells. (a) Conventional cell (b) Auxetic or
re- entrant cell [20].
9
1.11 Indentation behavior
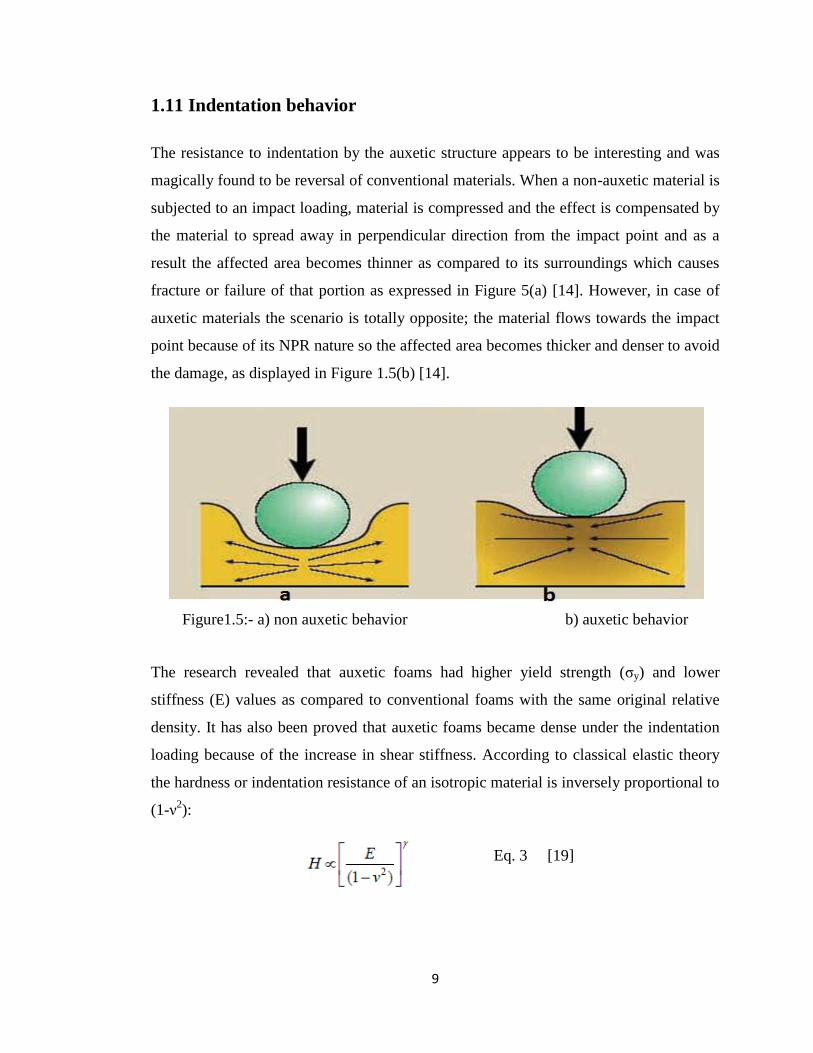
The resistance to indentation by the auxetic structure appears to be interesting and was
magically found to be reversal of conventional materials. When a non-auxetic material is
subjected to an impact loading, material is compressed and the effect is compensated by
the material to spread away in perpendicular direction from the impact point and as a
result the affected area becomes thinner as compared to its surroundings which causes
fracture or failure of that portion as expressed in Figure 5(a) [14]. However, in case of
auxetic materials the scenario is totally opposite; the material flows towards the impact
point because of its NPR nature so the affected area becomes thicker and denser to avoid
the damage, as displayed in Figure 1.5(b) [14].
Figure1.5:- a) non auxetic behavior b) auxetic behavior
The research revealed that auxetic foams had higher yield strength (σy) and lower
stiffness (E) values as compared to conventional foams with the same original relative
density. It has also been proved that auxetic foams became dense under the indentation
loading because of the increase in shear stiffness. According to classical elastic theory
the hardness or indentation resistance of an isotropic material is inversely proportional to
(1-ν2):
Eq. 3 [19]
10
where „ν‟ is Poisson‟s ratio, H is hardness, E is stiffness, when γ =1, H stands for
uniform pressure distribution and if γ =2/3, it is known as Hertzian indentation. H
increases with Poisson‟s ratio (ν) for a specified value of E. If value of ν approaches -1,
H approaches to infinity.
1.12 Fracture toughness
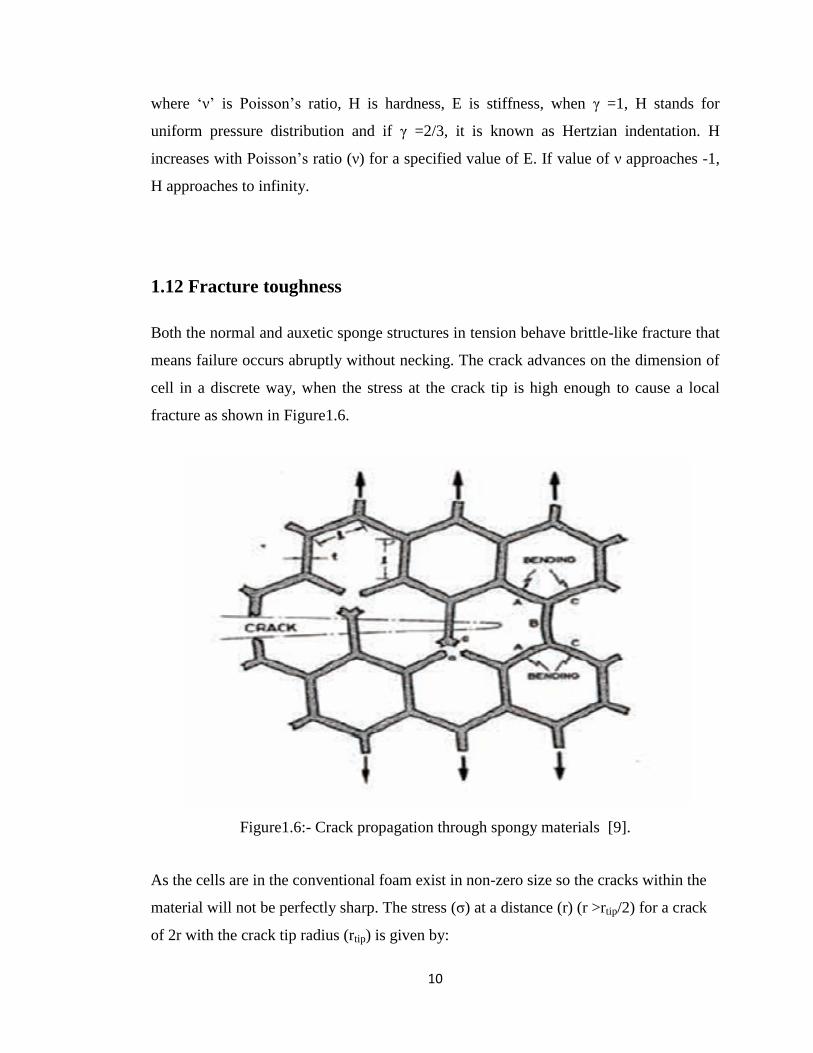
Both the normal and auxetic sponge structures in tension behave brittle-like fracture that
means failure occurs abruptly without necking. The crack advances on the dimension of
cell in a discrete way, when the stress at the crack tip is high enough to cause a local
fracture as shown in Figure1.6.
Figure1.6:- Crack propagation through spongy materials [9].
As the cells are in the conventional foam exist in non-zero size so the cracks within the
material will not be perfectly sharp. The stress (σ) at a distance (r) (r >rtip/2) for a crack
of 2r with the crack tip radius (rtip) is given by:
11
Eq.4[8]
Where „KI‟ is the stress intensity factor and „r‟ is the crack length.
1.13 Behavior of auxetic materials in blood vessel
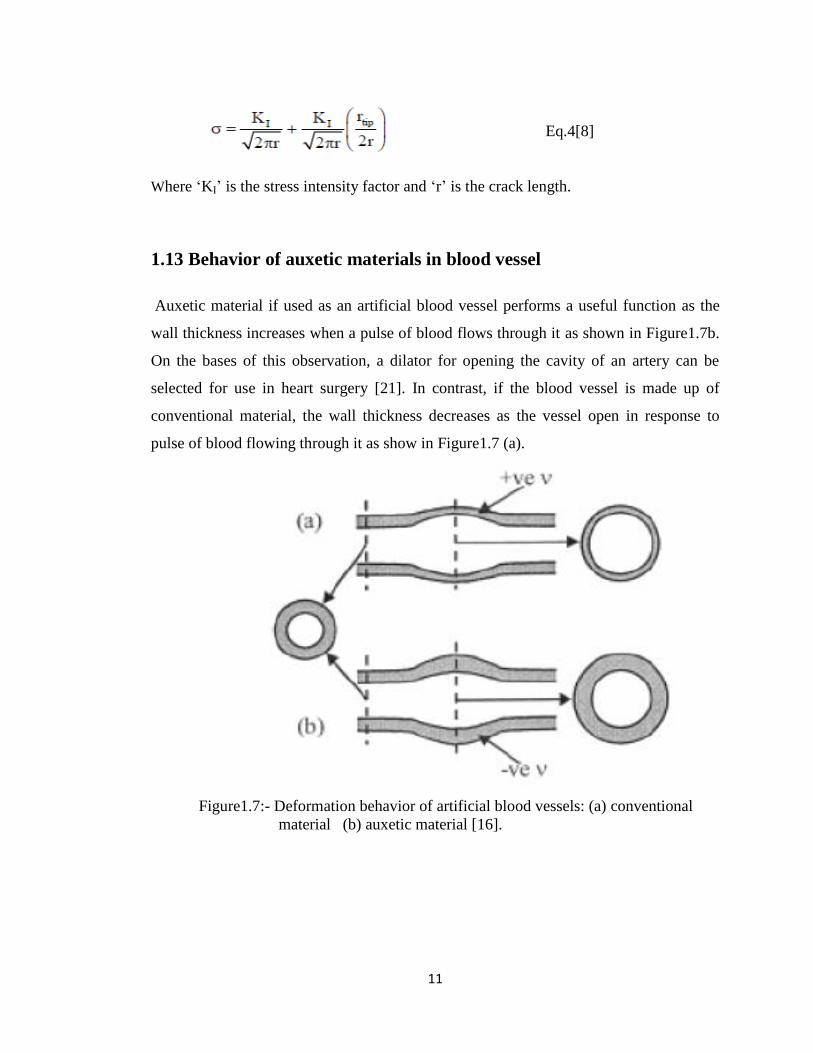
Auxetic material if used as an artificial blood vessel performs a useful function as the
wall thickness increases when a pulse of blood flows through it as shown in Figure1.7b.
On the bases of this observation, a dilator for opening the cavity of an artery can be
selected for use in heart surgery [21]. In contrast, if the blood vessel is made up of
conventional material, the wall thickness decreases as the vessel open in response to
pulse of blood flowing through it as show in Figure1.7 (a).
Figure1.7:- Deformation behavior of artificial blood vessels: (a) conventional
material (b) auxetic material [16].
12
1.14 Research motivation
Counter intuitive materials like cellular elastomeric based composites have enormous
potential that is yet to be explored for utilization in critical impact applications. Auxetic
materials are the most recently recognized by the scientists and engineers proved to be a
gift for mankind by nature. These materials are found to be fascinating, having unusual
behavior and a new addition for the advance engineering applications. For example
when an impact is applied on the auxetic material, it compresses in one direction, the
auxetic material flows towards the affected area due to its unique characteristics of the
material opposite to the normal material, thus hardening and densification of the affected
area by offering the resistance to the indentation. Similarly when bending forces are
applied on sponge auxetic composites, they experience double curvature into a dome-
like profile instead saddle formation as adopted by non-auxetic materials. Dynamic
effects have also revealed that the sponge auxetic composites are found to be superior to
their counterpart non-auxetic materials in absorbing sound and vibration.
Research and development regarding the auxetic material has attained the stage that a
number of materials and processing methods discovered and specific applications are
being addressed. The advances in fabrication and synthesis of wider range of these novel
materials for the application in industrial, commercial and defense applications are being
explored. Up till now major area of research has been carried out in the field of
thermoplastics and ceramics. There is major gap to address the elastomers, keeping in
view the importance of the research era and research gap; following areas will be
addressed in this work.
Development of sponge and auxetic structures in elastomers.
Sponge structures in the blended elastomers.
Variation of fillers and blending ratio of elastomers and their effect on the
characteristics of the developed material.
Development of sheets of auxetic material for impact energy absorption.

13
Chapter-2
Literature Review
14
2.1 Brief history and background
Auxetic materials are special type of materials that exhibiting negative Poisson‟s ratio
(NPR). This is a scale independent characteristic which can be developed at different
structural levels from molecular to macroscopic levels [22]. Recently, a variety of
auxetic structures have been developed for various applications. The research has been
mainly focused on modeling of geometric structures, inducing special properties and
applications of the auxetic materials. Although these materials had existed in nature f or
centuries, however, meaningful development of these materials for the use in
engineering applications, initiated from 1987 when Lake formulated a polymer based
auxetic sponge [23]. Many naturally existing materials exhibit auxetic effect e.g. iron
pyrite, pyrolytic graphite, rock with micro-cracks, cancellous bone, cow teat and cat skin
[24]. Numerous auxetic composites and structures have been developed, discovered, and
fabricated from macroscopic to molecular level. Polymeric auxetic materials have been
mainly focused to develop the auxetic structures [25]. Recently, a large number of
polymer based auxetic materials have been developed in the form of sponge with 0.5
NPR, fiber, and composites such as polyester urethane, polytetrafluoroethylene (PTFE),
ultra-high molecular weight polyethylene(UHMWPE), polypropylene (PP), nylon,
polyester, liquid crystalline and molecular auxetic polymer [26]. Auxetic structures in
metals, ceramics and other inorganic materials have also been investigated [27].
2.2 Geometric models and structures for the auxetic materials
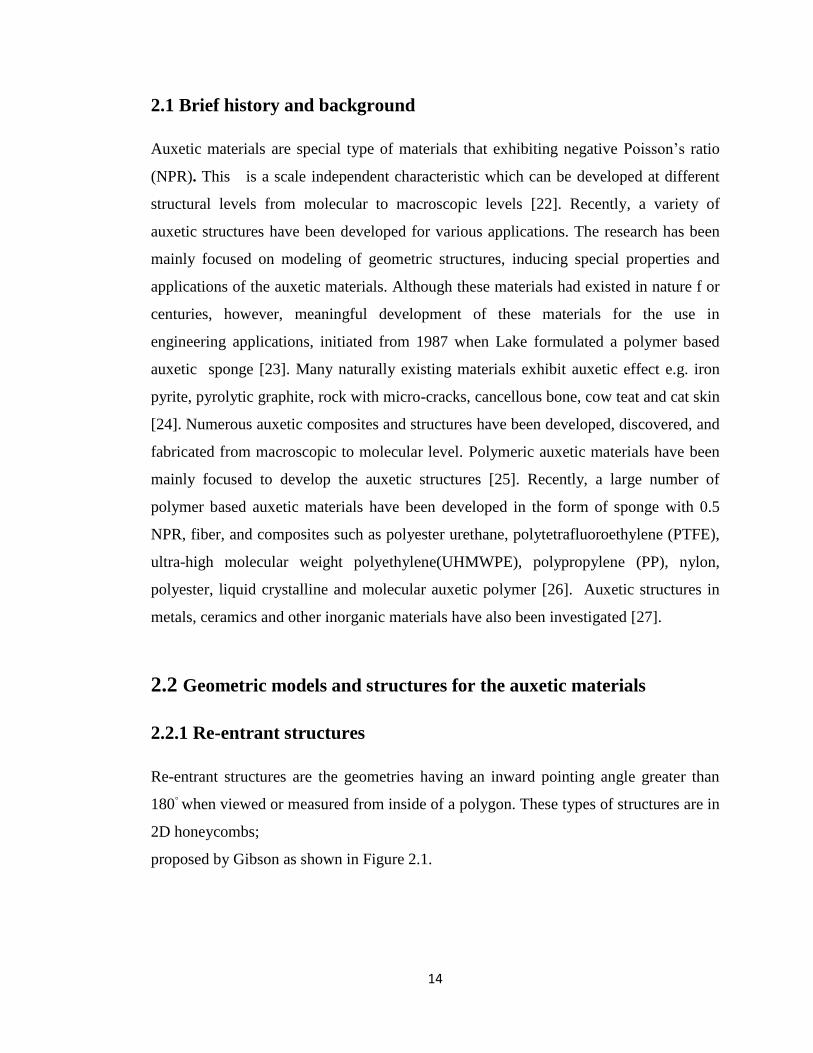
2.2.1 Re-entrant structures
Re-entrant structures are the geometries having an inward pointing angle greater than
180◦ when viewed or measured from inside of a polygon. These types of structures are in
2D honeycombs;
proposed by Gibson as shown in Figure 2.1.

15
Figure 2.1:- 2D honeycomb re-entrant structure (a) un-deformed (b)
deformed showing auxetic behavior [28].
These structures can be deformed by applying uniaxial load; the ribs move a direction
perpendicular to it, indicating an auxetic affect, as shown in Figure-2 (b). Most
honeycomb structures of this type deform predominantly by flexure of the diagonal ribs
with movement of hinges and axial stretching of the ribs.
Figure 2.2:- Re-entrant structures other than honey comb (a) double arrowhead (b) star
honey comb (c) hexagonal re-entrant honey comb (d) lozenge grids
(e) grid structures (f) ligaments structure.
16
Auxetic behavior can be obtained from other re-entrant structures by expanding and
stretching of the double arrow heads and stars (Figure2.2 (a)& (b)) [29]. A hexagonal re-
entrant honeycomb structure considered to be better for planar isotropic property than 2-
D structure (as displayed in Figure-2.1) by structural symmetry along radial direction.
The auxetic factor can be obtained by rotation and extension of each side in the unit cells
of grid structures (Figure 2.2d and Figure -2.2 e).The structure in Figure 2.2e performs
more auxetic effect compared with Figure2.2d subjected to a similar strain. Auxetic
behavior can be developed in sinusoidal ligaments (Figure2.2f) by opening up of re-
entrant cells into nearly rectangular structures. These structures are extremely useful and
helpful for the researchers to understand, develop, optimize and predict the auxetic
structure within different materials [30].
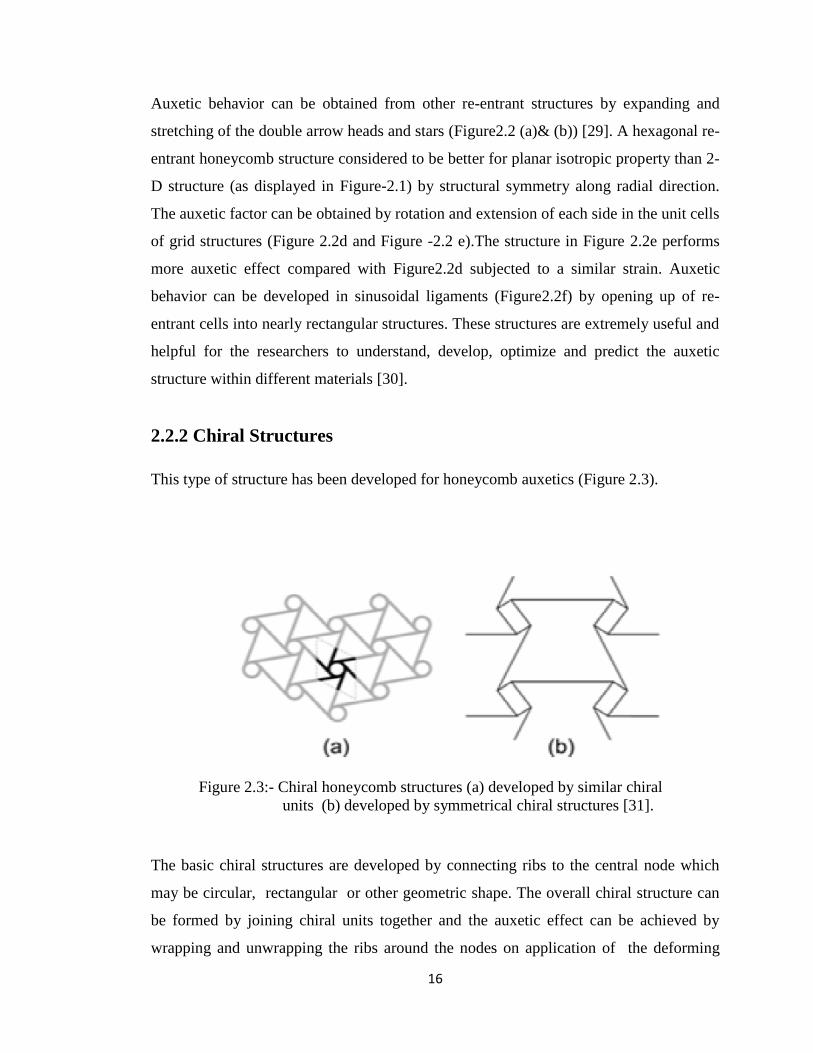
2.2.2 Chiral Structures
This type of structure has been developed for honeycomb auxetics (Figure 2.3).
Figure 2.3:- Chiral honeycomb structures (a) developed by similar chiral
units (b) developed by symmetrical chiral structures [31].
The basic chiral structures are developed by connecting ribs to the central node which
may be circular, rectangular or other geometric shape. The overall chiral structure can
be formed by joining chiral units together and the auxetic effect can be achieved by
wrapping and unwrapping the ribs around the nodes on application of the deforming
17
force [32]. The auxetic effect of the chiral structures shown in Figure-3a under in-plane
deformation has been observed theoratically and experimentally over a significant range
of strains [27]. A relatively new type of structure referred to as “meta-chiral” structure
(Figure 2.3b) has recently been demosntarted by Grima. This type of structure can be
formed by connecting symmetrical units to a rectangular node in each building block
and each node can be attached with infifnite ligaments. It is obvious that the auxetic
effect of this kind is dependent on length of the attached ligament and the shape of the
node [33].
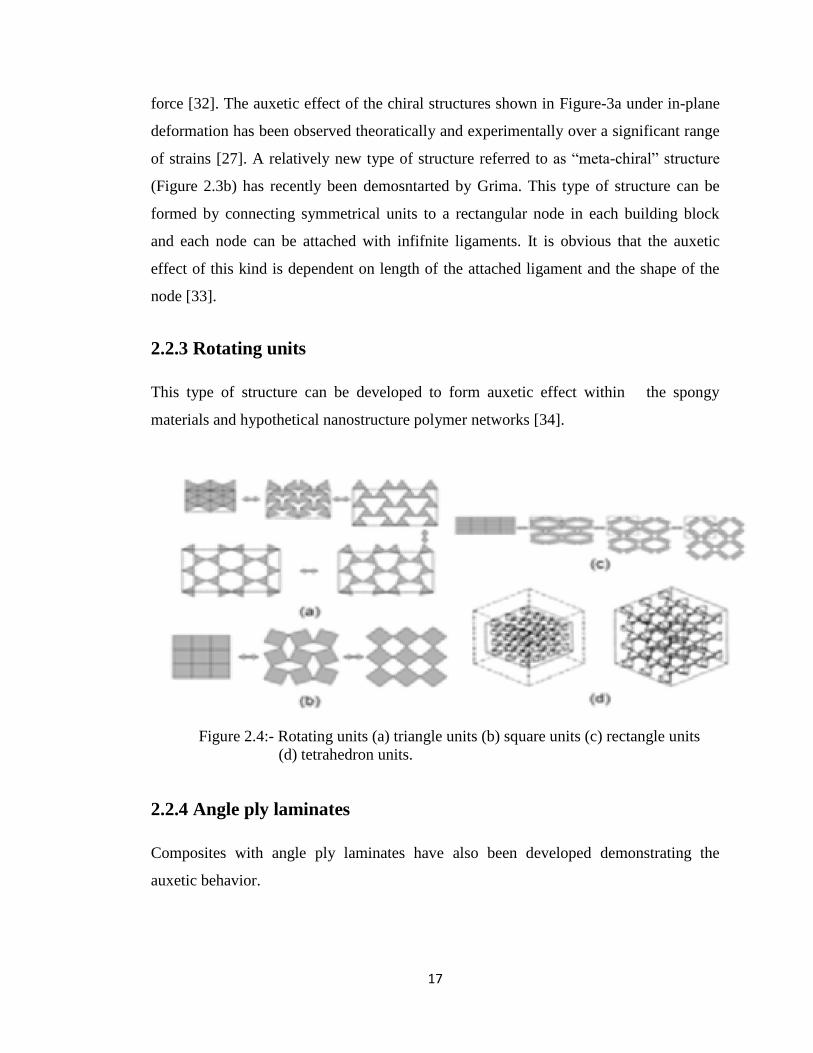
2.2.3 Rotating units
This type of structure can be developed to form auxetic effect within the spongy
materials and hypothetical nanostructure polymer networks [34].
Figure 2.4:- Rotating units (a) triangle units (b) square units (c) rectangle units
(d) tetrahedron units.
2.2.4 Angle ply laminates
Composites with angle ply laminates have also been developed demonstrating the
auxetic behavior.

18
Figure 2.5:- Composites with angle-ply laminate (a) composite‟s structure (b)
model of the composite [35].
A composite material consisting of a dual phasic structure, incorporating stiff inclusions
(hatched reagion in Figure 2.5a), represent a compliant phase simulated by tensile but
flexurally rigid rods.The dashed lines represent the periodicity that can beeasily attained
by placing a sliding element in the middle of each rod. To maintain the parallelism for
preventing surfaces sliding relative to each other, every rod is replaced by a parallel rod
fastened by two triangular links. Auxetic composite structures with angular parameters
Ɵ1 and Ɵ2 can be obtained by filling the the voids formed by displacing rods with an
elastic medium. The deformation behaviour of the composite as shown by the model in
Figure-5b, under an infinitely small deformation, expansion width AB is directly
proportional to the increased length CD. In this way a sandwitch like structure could
perform auxetic effect [36].
2.2.5 Hard molecules
Wojciechowski [37] proposed a model based on rigid “free” molecules with
intermolecular interaction to form thermodynamically stable, elastically isotropic and
auxetic phase in a system of interacting particles. The hexamers (six atoms at the
vertices of a hexagon) as displayed in Figure-6 were developed at 0◦C and the phase
performing the negative Poisson‟s ratio was proved thermodynamically stable in

19
positive temperature ranges. This auxetic effect was believed to be performed by the
hexamers using the intermolecular interaction.
Figure 2.6:- Geometry of hard molecule model, structure of hard cyclic hexamers [38].
2.3 Microscopic polymer models
The auxetic characteristics in the micro porous polymer have been expressed by a 2-D
model shown in Figure 2.7. This model consists of nodules and fibrils; the NPR
becomes obvious during tensile loading as evident by lateral extension of nodules [39].
Figure 2.7:-Schematic diagram of nodule-fibrils of a micro porous polymer
(a) stable state(b) during tensile loading showing auxetic effect [22].

20
2.3.1 Liquid crystalline polymer model
These models have been used as template for macroscopic re-entrant honeycomb
structures, in addition to auxetic effect, however, practically these structures have not
been employed due to their heavily cross linked nature [40]. Griffin‟s et al [41] recently
proposed a method to form a liquid crystalline polymer (LCP) owing to its orientation of
site-connectivity-driven rod, in the main chain (Figure 2.8(a)). The main chain consisted
of rigid-rod like molecules connected by flexible spacer along the chain lengths. At rest,
the rods are oriented along the chain direction (Figure 2.8(a)) and the auxetic effect is
generated on application of tensile load as compared to lateral rod‟s expansion
(Figure2.8(b)).
Figure 2.8:- Liquid crystalline polymer (LCP) model: (a) relaxed state; (b) in
tension mode showing auxetic behavior [42].
2.4 Polymeric auxetic materials
Polymeric auxetic materials designed and manufactured up till now, have either macro-
or micro-molecular framework. These types of auxetic materials have been presented in
the form of sponge or composite. Molecular auxetic polymer models have been
simulated but not practically developed as yet.
21
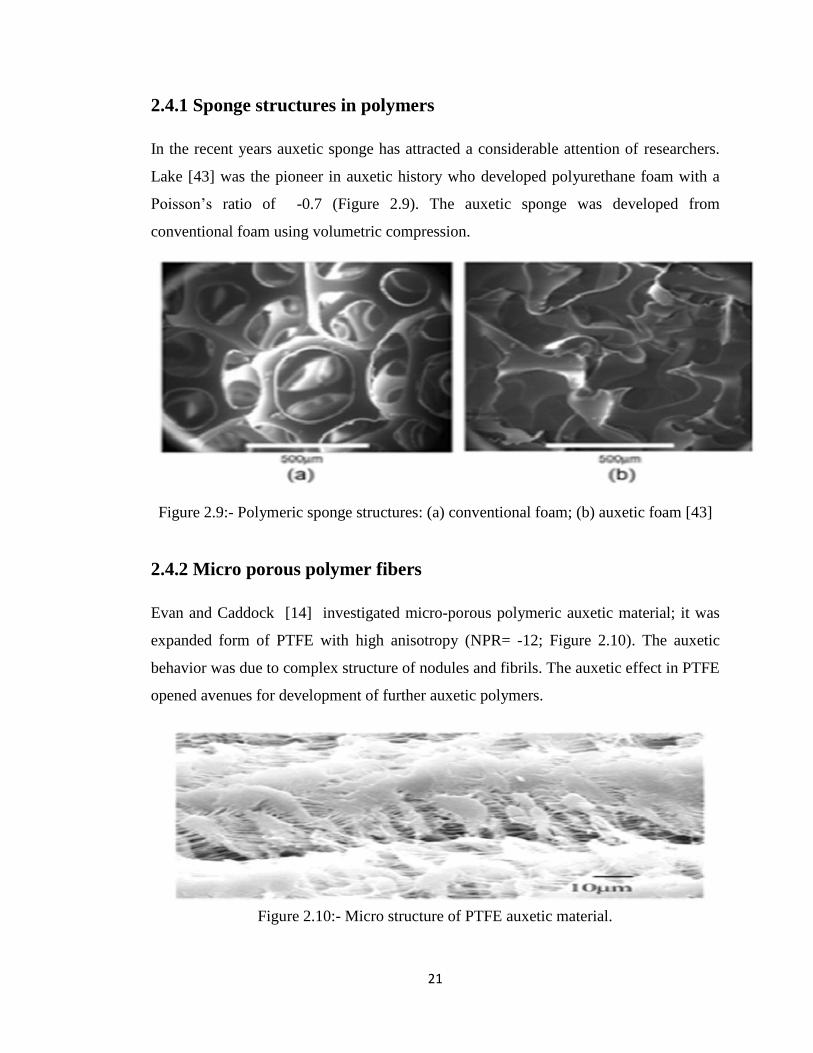
2.4.1 Sponge structures in polymers
In the recent years auxetic sponge has attracted a considerable attention of researchers.
Lake [43] was the pioneer in auxetic history who developed polyurethane foam with a
Poisson‟s ratio of -0.7 (Figure 2.9). The auxetic sponge was developed from
conventional foam using volumetric compression.
Figure 2.9:- Polymeric sponge structures: (a) conventional foam; (b) auxetic foam [43]
2.4.2 Micro porous polymer fibers
Evan and Caddock [14] investigated micro-porous polymeric auxetic material; it was
expanded form of PTFE with high anisotropy (NPR= -12; Figure 2.10). The auxetic
behavior was due to complex structure of nodules and fibrils. The auxetic effect in PTFE
opened avenues for development of further auxetic polymers.
Figure 2.10:- Micro structure of PTFE auxetic material.
22
2.4.3 Fabrication techniques
Following techniques have been used for development of auxetic sponge using
conventional foams [44]:
1) For conventional foams with open and partly open cells:
a) Tri-axial compression
b) Bi-axial compression
c) Multi-phase tri-axial thermal compression
d) Chemo-mechanical process
2) For the conventional foams available in close cells:
Vacuum methods and under high pressure
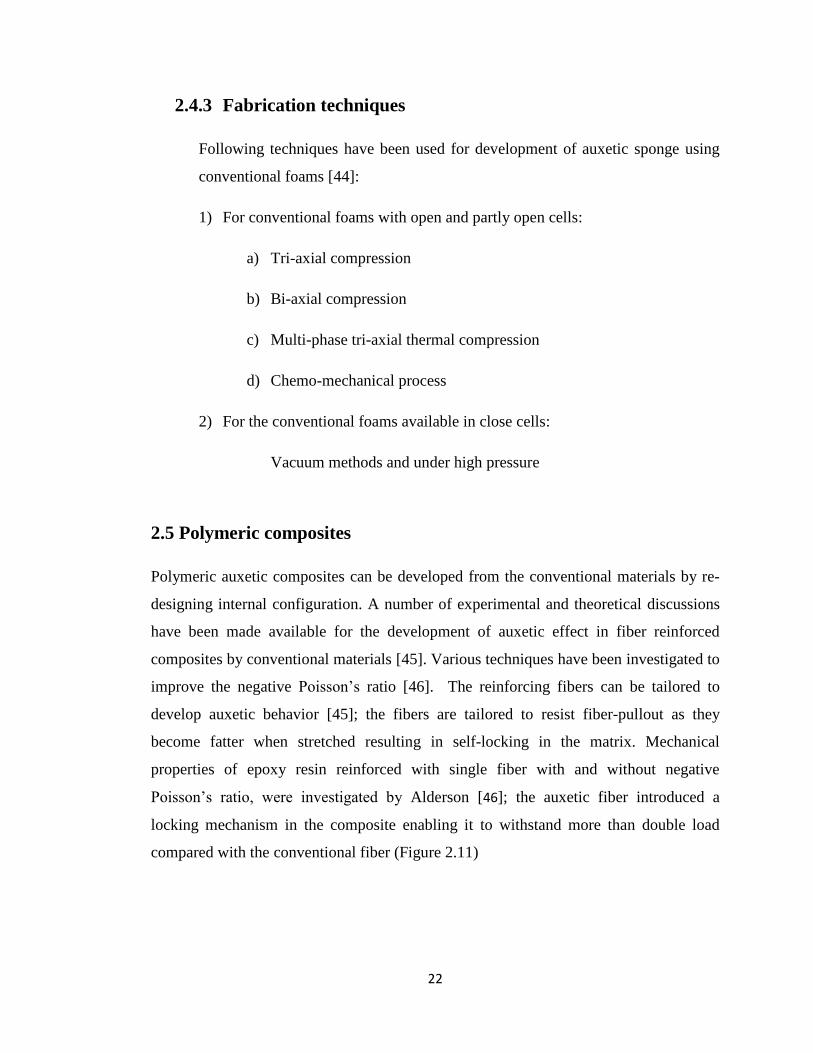
2.5 Polymeric composites
Polymeric auxetic composites can be developed from the conventional materials by re-
designing internal configuration. A number of experimental and theoretical discussions
have been made available for the development of auxetic effect in fiber reinforced
composites by conventional materials [45]. Various techniques have been investigated to
improve the negative Poisson‟s ratio [46]. The reinforcing fibers can be tailored to
develop auxetic behavior [45]; the fibers are tailored to resist fiber-pullout as they
become fatter when stretched resulting in self-locking in the matrix. Mechanical
properties of epoxy resin reinforced with single fiber with and without negative
Poisson‟s ratio, were investigated by Alderson [46]; the auxetic fiber introduced a
locking mechanism in the composite enabling it to withstand more than double load
compared with the conventional fiber (Figure 2.11)
23
Figure 2.11:-Effect of NPR in fiber pull out resistance in polymeric auxetic and
non auxetic composites [45].
2.6 Elastomeric matrices
Elastomeric matrices EPDM (ethylene propylene diene monomer), NBR (nitrile
butadiene rubber), SBR (styrene butadiene rubber) and NR (natural rubber) were
investigated for the development of conventional foam and auxetic sponge. The
individual rubbers and their blends with various reinforcements were studies for
mechanical, rheological, structural, curing, thermal oxidation and vulcanization behavior
will be discussed in the subsequent sections.
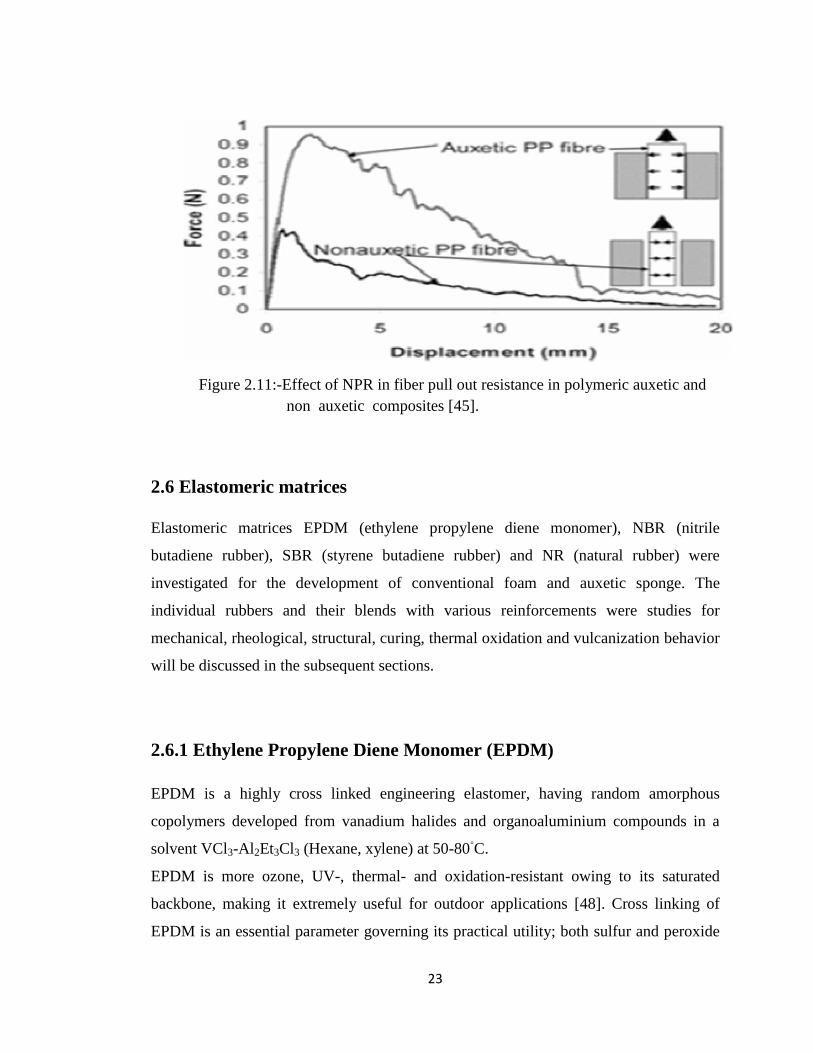
2.6.1 Ethylene Propylene Diene Monomer (EPDM)
EPDM is a highly cross linked engineering elastomer, having random amorphous
copolymers developed from vanadium halides and organoaluminium compounds in a
solvent VCl3-Al2Et3Cl3 (Hexane, xylene) at 50-80◦C.
EPDM is more ozone, UV-, thermal- and oxidation-resistant owing to its saturated
backbone, making it extremely useful for outdoor applications [48]. Cross linking of
EPDM is an essential parameter governing its practical utility; both sulfur and peroxide
24
systems are helpful for vulcanizations of EPDM. Curing using sulfur is exploited to
attain better mechanical and dynamic properties whereas peroxide curing is considered
the best for thermal stability.
Figure 2.12:- Chemical structure of EPDM [48]
Three major processes are used in the manufacturing of EPDM rubber
1. Solution 2. Suspension (slurry) 3. Gas phase
Various grades of EPDM with varying properties are produced using these techniques;
however, solution polymerization process being more versatile is mainly used in
producing majority of polymers.
The suspension or slurry process is a modification of bulk polymerization in which
monomers and catalysts are injected into a reactor along with propylene. Polymerization
immediately takes place by forming crumbs which are not soluble in polypropylene.
This process reduces the requirement for solvent and solvent handling equipment; lower
viscosity of the slurry also helps to control temperature and product management [49].
Gas phase technology has recently been developed to manufacture EPDM. Monomers
and nitrogen along with catalyst are fed into the vertical fluidized bed reactor and the
solid product is removed. Gas is circulated to maintain a suitable temperature for the
reaction. In the current research EPDM was used to develop the sponge and auxetic
structures along with various reinforcements like carbon nano particles, for applications
25
involving damping and impact energy absorption. The work was further extended to
develop sponge composite structures using blends of NR, NBR, SBR and EPDM. Merits
and demerits of EPDM are tabulated in Table 2.1.
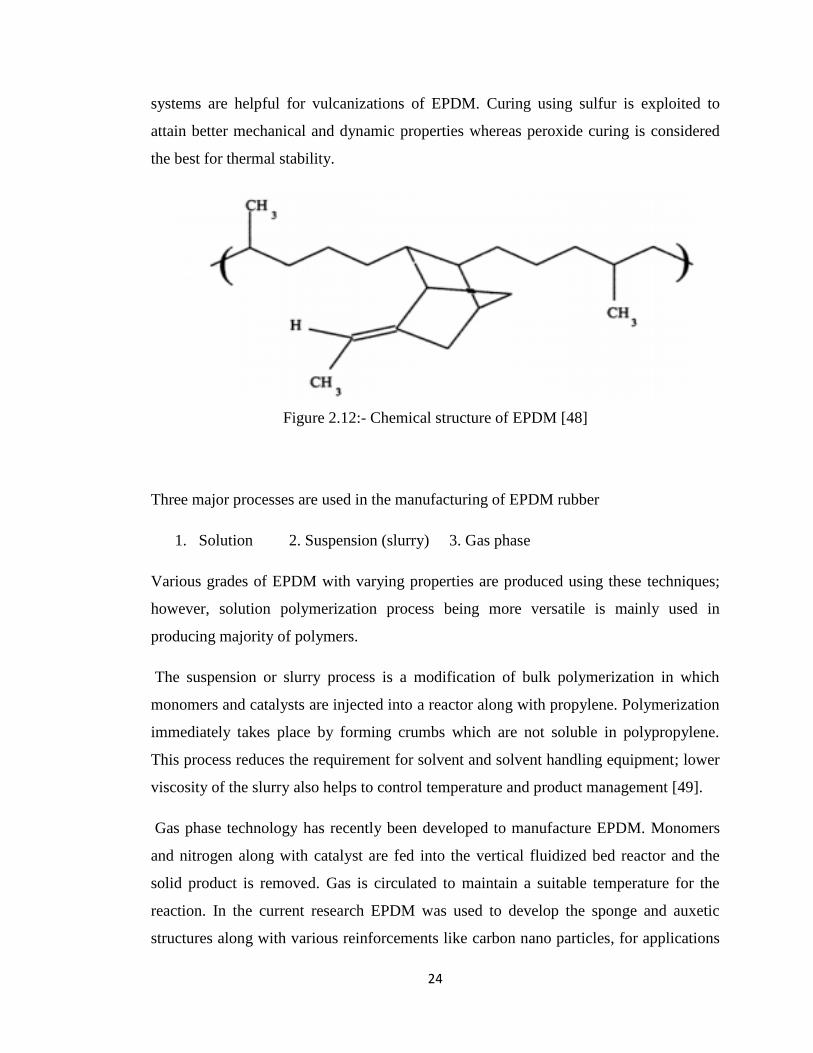
Table 2.1:- Merits and demerits of EPDM [49]
Merits Demerits
Stable at a wide range of temperature
-70 to 175 ◦C
Poor oil- and hydrocarbon-resistant
Good mechanical and dynamic properties Moderate adhesion to fabrics and metals
Useful in hot and humid environment e.g.
steam
Low tear resistance as compared to NBR
Excellent abrasion resistant Reinforced with carbon black or white
Injection molding possible Compression molding possible
2.6.2 Nitrile Butadiene Rubber (NBR)
Nitrile rubbers are copolymers of butadiene and acrylonitrile, synthesized by emulsion
copolymerization. Monomer ratio, temperature of polymerization, and nature of
additives play an important role in defining the characteristics of the elastomer.
Commercial grades of NBR contain 18-50% of acrylonitrile which imparts oil
resistance. NBR is commercially available in various forms e.g. slab, powder, crumb and
liquid. EPDM in crumb form is used to manufacture adhesives; powder of PVC/NBR
blends is also used for general purposes. The presence of acrylonitrile (ACN) plays
important role in improving relative density and solubility parameter along with oil
resistance characteristics. The presence of C≡N dipole moment within chains of NBR
repels non-polar oils being polar in nature. The flexibility of nitrile rubber at low
temperature increases with decreasing ACN content [50].
26
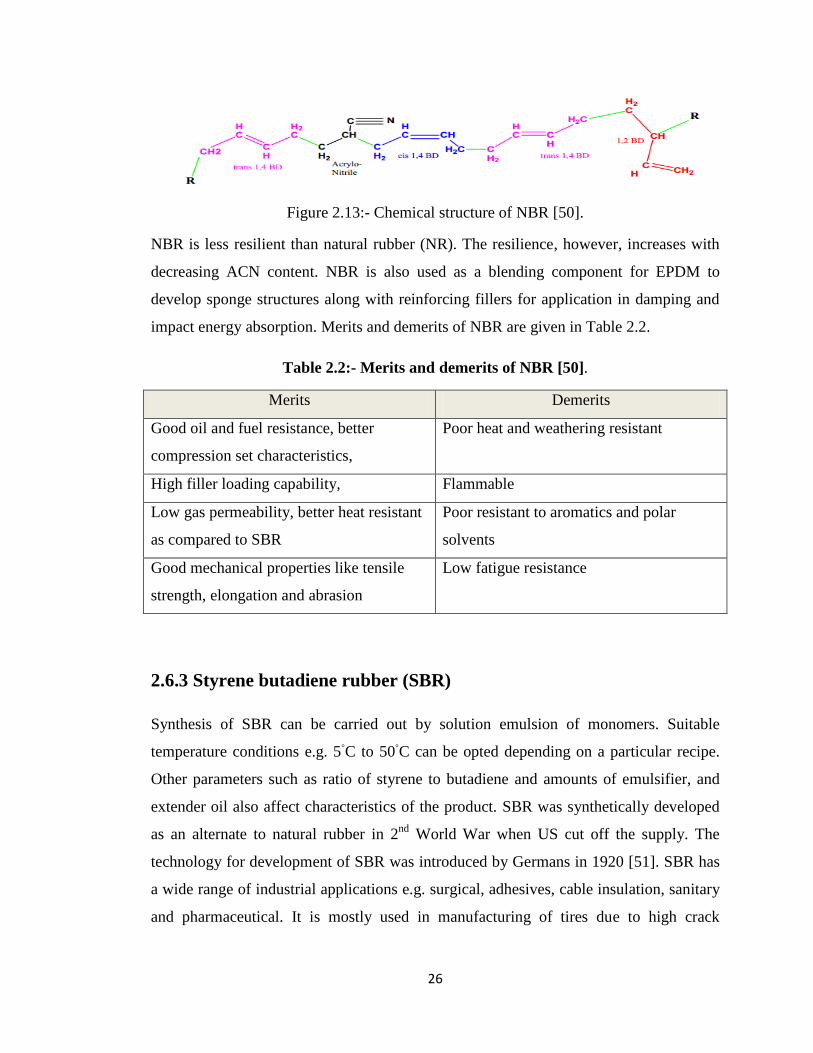
Figure 2.13:- Chemical structure of NBR [50].
NBR is less resilient than natural rubber (NR). The resilience, however, increases with
decreasing ACN content. NBR is also used as a blending component for EPDM to
develop sponge structures along with reinforcing fillers for application in damping and
impact energy absorption. Merits and demerits of NBR are given in Table 2.2.
Table 2.2:- Merits and demerits of NBR [50].
Merits Demerits
Good oil and fuel resistance, better
compression set characteristics,
Poor heat and weathering resistant
High filler loading capability, Flammable
Low gas permeability, better heat resistant
as compared to SBR
Poor resistant to aromatics and polar
solvents
Good mechanical properties like tensile
strength, elongation and abrasion
Low fatigue resistance
2.6.3 Styrene butadiene rubber (SBR)
Synthesis of SBR can be carried out by solution emulsion of monomers. Suitable
temperature conditions e.g. 5◦C to 50
◦C can be opted depending on a particular recipe.
Other parameters such as ratio of styrene to butadiene and amounts of emulsifier, and
extender oil also affect characteristics of the product. SBR was synthetically developed
as an alternate to natural rubber in 2nd
World War when US cut off the supply. The
technology for development of SBR was introduced by Germans in 1920 [51]. SBR has
a wide range of industrial applications e.g. surgical, adhesives, cable insulation, sanitary
and pharmaceutical. It is mostly used in manufacturing of tires due to high crack
27
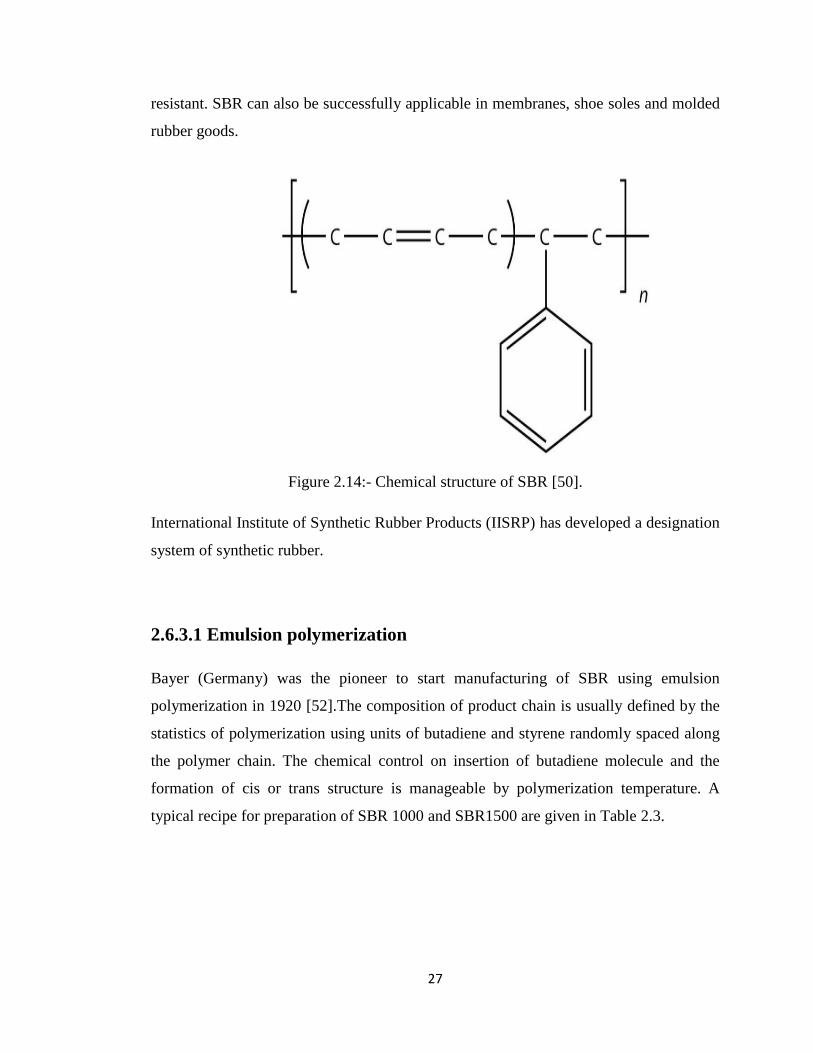
resistant. SBR can also be successfully applicable in membranes, shoe soles and molded
rubber goods.
Figure 2.14:- Chemical structure of SBR [50].
International Institute of Synthetic Rubber Products (IISRP) has developed a designation
system of synthetic rubber.
2.6.3.1 Emulsion polymerization
Bayer (Germany) was the pioneer to start manufacturing of SBR using emulsion
polymerization in 1920 [52].The composition of product chain is usually defined by the
statistics of polymerization using units of butadiene and styrene randomly spaced along
the polymer chain. The chemical control on insertion of butadiene molecule and the
formation of cis or trans structure is manageable by polymerization temperature. A
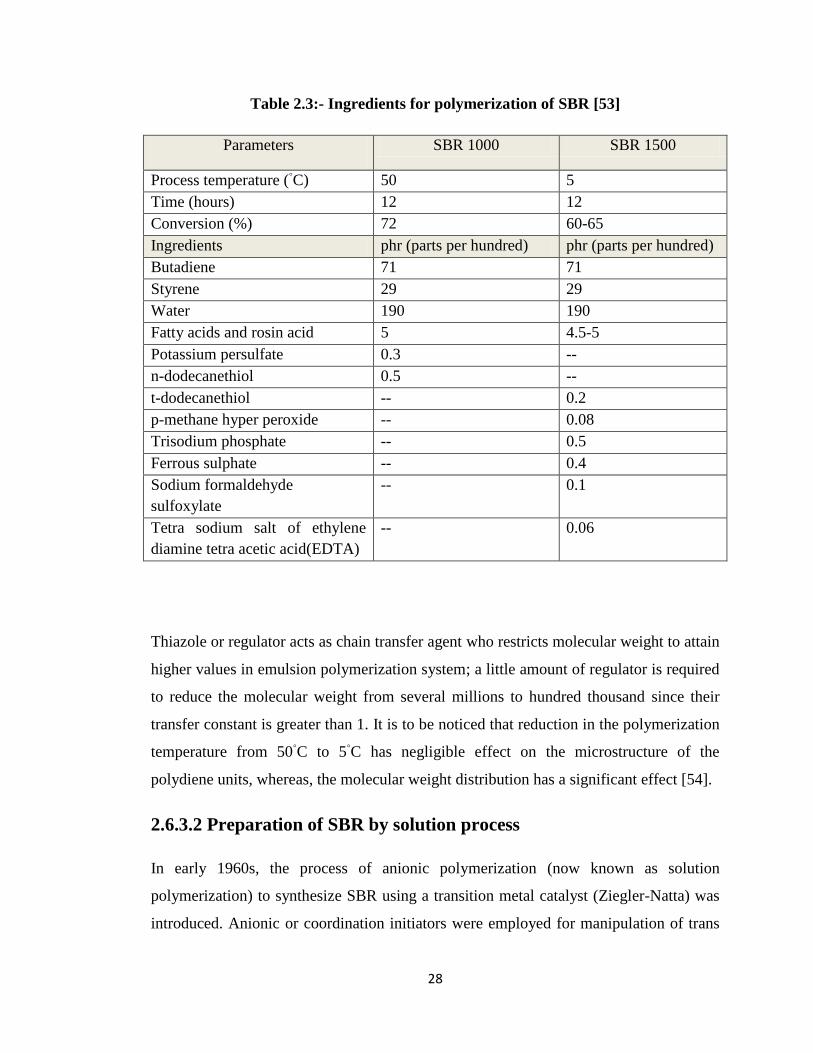
typical recipe for preparation of SBR 1000 and SBR1500 are given in Table 2.3.
28
Table 2.3:- Ingredients for polymerization of SBR [53]
Parameters SBR 1000 SBR 1500
Process temperature (◦C) 50 5
Time (hours) 12 12
Conversion (%) 72 60-65
Ingredients phr (parts per hundred) phr (parts per hundred)
Butadiene 71 71
Styrene 29 29
Water 190 190
Fatty acids and rosin acid 5 4.5-5
Potassium persulfate 0.3 --
n-dodecanethiol 0.5 --
t-dodecanethiol -- 0.2
p-methane hyper peroxide -- 0.08
Trisodium phosphate -- 0.5
Ferrous sulphate -- 0.4
Sodium formaldehyde
sulfoxylate
-- 0.1
Tetra sodium salt of ethylene
diamine tetra acetic acid(EDTA)
-- 0.06
Thiazole or regulator acts as chain transfer agent who restricts molecular weight to attain
higher values in emulsion polymerization system; a little amount of regulator is required
to reduce the molecular weight from several millions to hundred thousand since their
transfer constant is greater than 1. It is to be noticed that reduction in the polymerization
temperature from 50◦C to 5
◦C has negligible effect on the microstructure of the
polydiene units, whereas, the molecular weight distribution has a significant effect [54].
2.6.3.2 Preparation of SBR by solution process
In early 1960s, the process of anionic polymerization (now known as solution
polymerization) to synthesize SBR using a transition metal catalyst (Ziegler-Natta) was
introduced. Anionic or coordination initiators were employed for manipulation of trans
29
or cis structure of the polymer. Mechanical properties like tensile strength, elongation
and modulus of elasticity are kept constant in both emulsion and solution
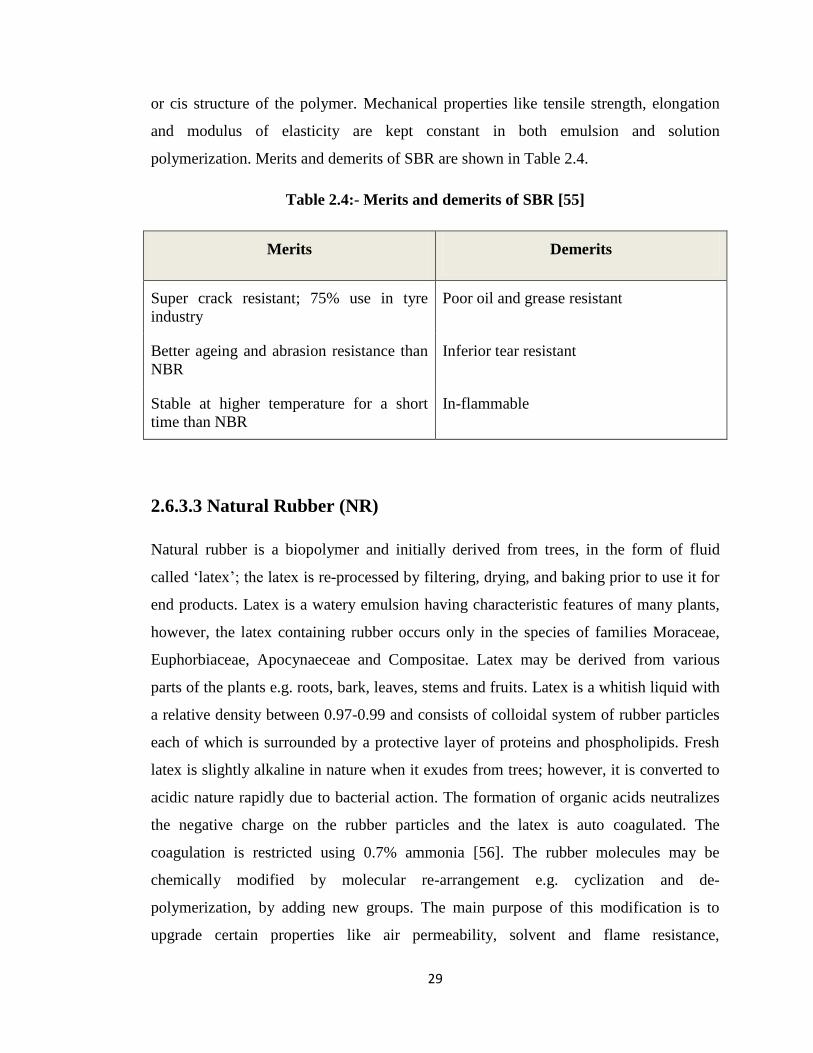
polymerization. Merits and demerits of SBR are shown in Table 2.4.
Table 2.4:- Merits and demerits of SBR [55]
Merits Demerits
Super crack resistant; 75% use in tyre
industry
Poor oil and grease resistant
Better ageing and abrasion resistance than
NBR
Inferior tear resistant
Stable at higher temperature for a short
time than NBR
In-flammable
2.6.3.3 Natural Rubber (NR)
Natural rubber is a biopolymer and initially derived from trees, in the form of fluid
called „latex‟; the latex is re-processed by filtering, drying, and baking prior to use it for
end products. Latex is a watery emulsion having characteristic features of many plants,
however, the latex containing rubber occurs only in the species of families Moraceae,
Euphorbiaceae, Apocynaeceae and Compositae. Latex may be derived from various
parts of the plants e.g. roots, bark, leaves, stems and fruits. Latex is a whitish liquid with
a relative density between 0.97-0.99 and consists of colloidal system of rubber particles
each of which is surrounded by a protective layer of proteins and phospholipids. Fresh
latex is slightly alkaline in nature when it exudes from trees; however, it is converted to
acidic nature rapidly due to bacterial action. The formation of organic acids neutralizes
the negative charge on the rubber particles and the latex is auto coagulated. The
coagulation is restricted using 0.7% ammonia [56]. The rubber molecules may be
chemically modified by molecular re-arrangement e.g. cyclization and de-
polymerization, by adding new groups. The main purpose of this modification is to
upgrade certain properties like air permeability, solvent and flame resistance,
30
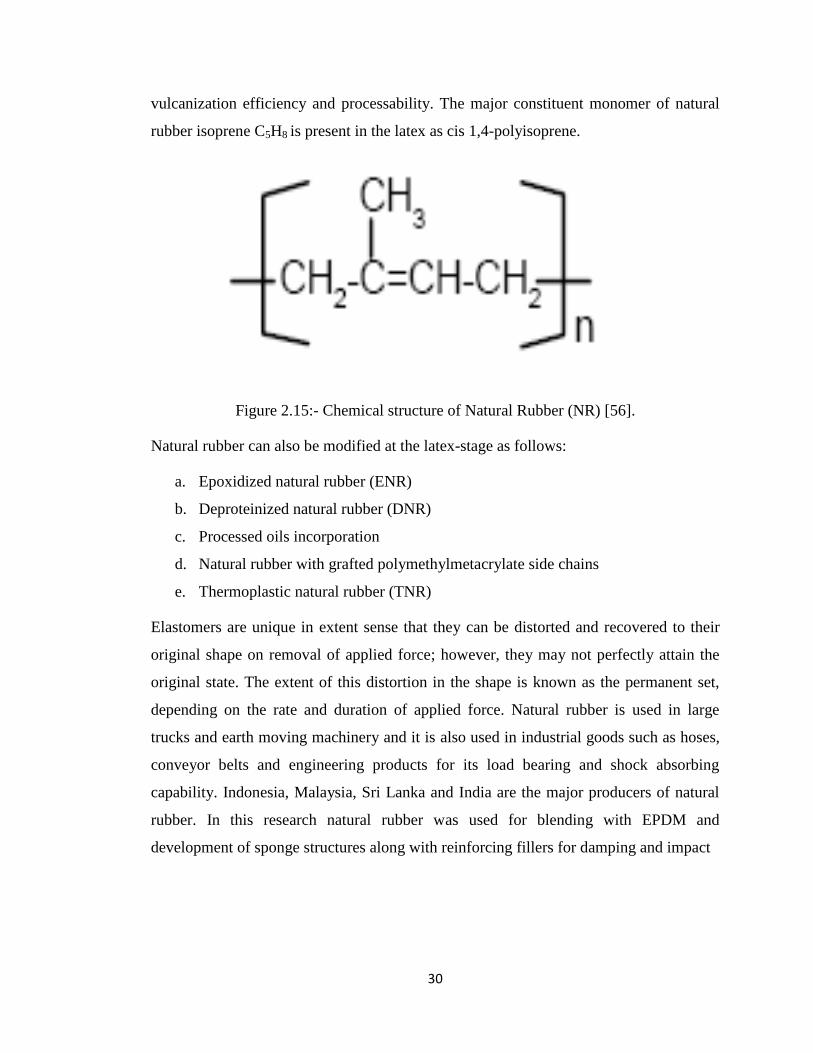
vulcanization efficiency and processability. The major constituent monomer of natural
rubber isoprene C5H8 is present in the latex as cis 1,4-polyisoprene.
Figure 2.15:- Chemical structure of Natural Rubber (NR) [56].
Natural rubber can also be modified at the latex-stage as follows:
a. Epoxidized natural rubber (ENR)
b. Deproteinized natural rubber (DNR)
c. Processed oils incorporation
d. Natural rubber with grafted polymethylmetacrylate side chains
e. Thermoplastic natural rubber (TNR)
Elastomers are unique in extent sense that they can be distorted and recovered to their
original shape on removal of applied force; however, they may not perfectly attain the
original state. The extent of this distortion in the shape is known as the permanent set,
depending on the rate and duration of applied force. Natural rubber is used in large
trucks and earth moving machinery and it is also used in industrial goods such as hoses,
conveyor belts and engineering products for its load bearing and shock absorbing
capability. Indonesia, Malaysia, Sri Lanka and India are the major producers of natural
rubber. In this research natural rubber was used for blending with EPDM and
development of sponge structures along with reinforcing fillers for damping and impact
31
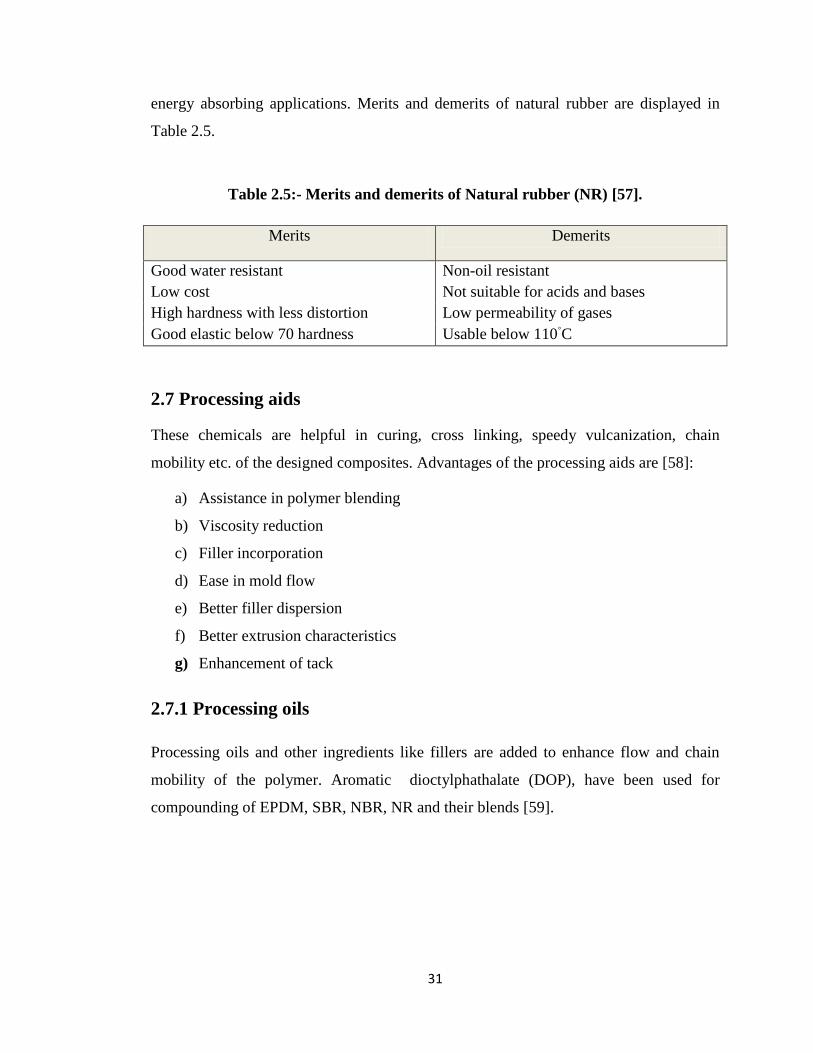
energy absorbing applications. Merits and demerits of natural rubber are displayed in
Table 2.5.
Table 2.5:- Merits and demerits of Natural rubber (NR) [57].
Merits Demerits
Good water resistant Non-oil resistant
Low cost Not suitable for acids and bases
High hardness with less distortion Low permeability of gases
Good elastic below 70 hardness Usable below 110◦C
2.7 Processing aids
These chemicals are helpful in curing, cross linking, speedy vulcanization, chain
mobility etc. of the designed composites. Advantages of the processing aids are [58]:
a) Assistance in polymer blending
b) Viscosity reduction
c) Filler incorporation
d) Ease in mold flow
e) Better filler dispersion
f) Better extrusion characteristics
g) Enhancement of tack
2.7.1 Processing oils
Processing oils and other ingredients like fillers are added to enhance flow and chain
mobility of the polymer. Aromatic dioctylphathalate (DOP), have been used for
compounding of EPDM, SBR, NBR, NR and their blends [59].
32
2.7.2 Paraffin wax
Paraffin waxes are derived from petroleum with long chain hydrocarbons and low
melting point. These are generally used in rubber processing industry for plasticizing,
filler incorporation and viscosity reduction [60].
2.7.3 Activators
Activators activate sites on the polymer chains to enhance the probability of cross
linking for better fabrication of composite during vulcanization. Majority of activators
are metallic oxides and organic acids. Zinc oxide and stearic acid supplied by BDH
Merck, Germany were employed in this research. Stearic acid plays dual role; it helps in
processing and reacts with zinc to form zinc stearate which reduces surplus amount of
sulfur present in the composite [61].
2.7.4 Cross linkers
Elastomers consist of a long coiled polymer chains with rotatable points and segments.
These chains can un-coiled, partially straighten under an applied stress and can revert to
the coiled condition on the removal of stress. These chains are required to be
permanently cross linked for useful application [62]. Sulphur and dicumyl peroxide
curing systems were applied for cross linking in this research.
2.7.4.1 Sulphur
Permanent cross linking or chemical bonding between the polymer chains requires
entanglement of polymer molecules into a suitable network, which is bound at both ends
by cross linked junction. The reaction between chains of the polymer for permanent
cross linking of elastomeric composite is known as vulcanization. A cross link may be a
single sulphur atom, a group of sulphur atoms, a carbon-carbon bond, an ionic cluster or
33
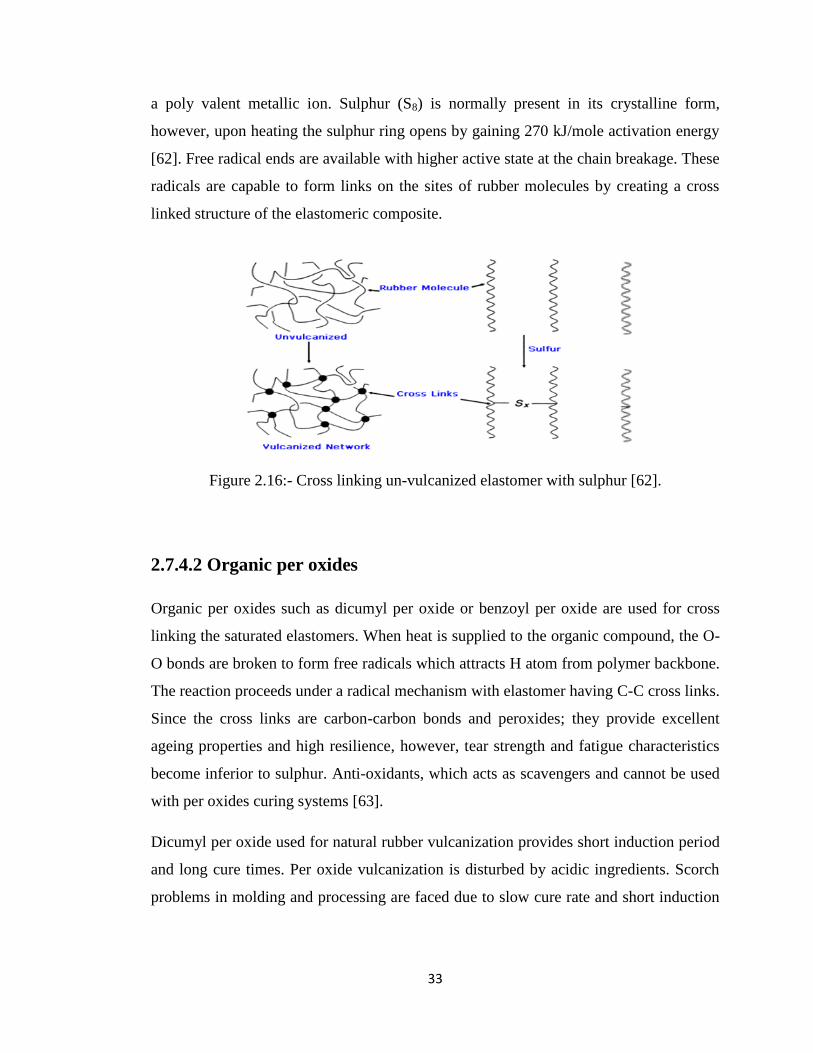
a poly valent metallic ion. Sulphur (S8) is normally present in its crystalline form,
however, upon heating the sulphur ring opens by gaining 270 kJ/mole activation energy
[62]. Free radical ends are available with higher active state at the chain breakage. These
radicals are capable to form links on the sites of rubber molecules by creating a cross
linked structure of the elastomeric composite.
Figure 2.16:- Cross linking un-vulcanized elastomer with sulphur [62].
2.7.4.2 Organic per oxides
Organic per oxides such as dicumyl per oxide or benzoyl per oxide are used for cross
linking the saturated elastomers. When heat is supplied to the organic compound, the O-
O bonds are broken to form free radicals which attracts H atom from polymer backbone.
The reaction proceeds under a radical mechanism with elastomer having C-C cross links.
Since the cross links are carbon-carbon bonds and peroxides; they provide excellent
ageing properties and high resilience, however, tear strength and fatigue characteristics
become inferior to sulphur. Anti-oxidants, which acts as scavengers and cannot be used
with per oxides curing systems [63].
Dicumyl per oxide used for natural rubber vulcanization provides short induction period
and long cure times. Per oxide vulcanization is disturbed by acidic ingredients. Scorch
problems in molding and processing are faced due to slow cure rate and short induction
34
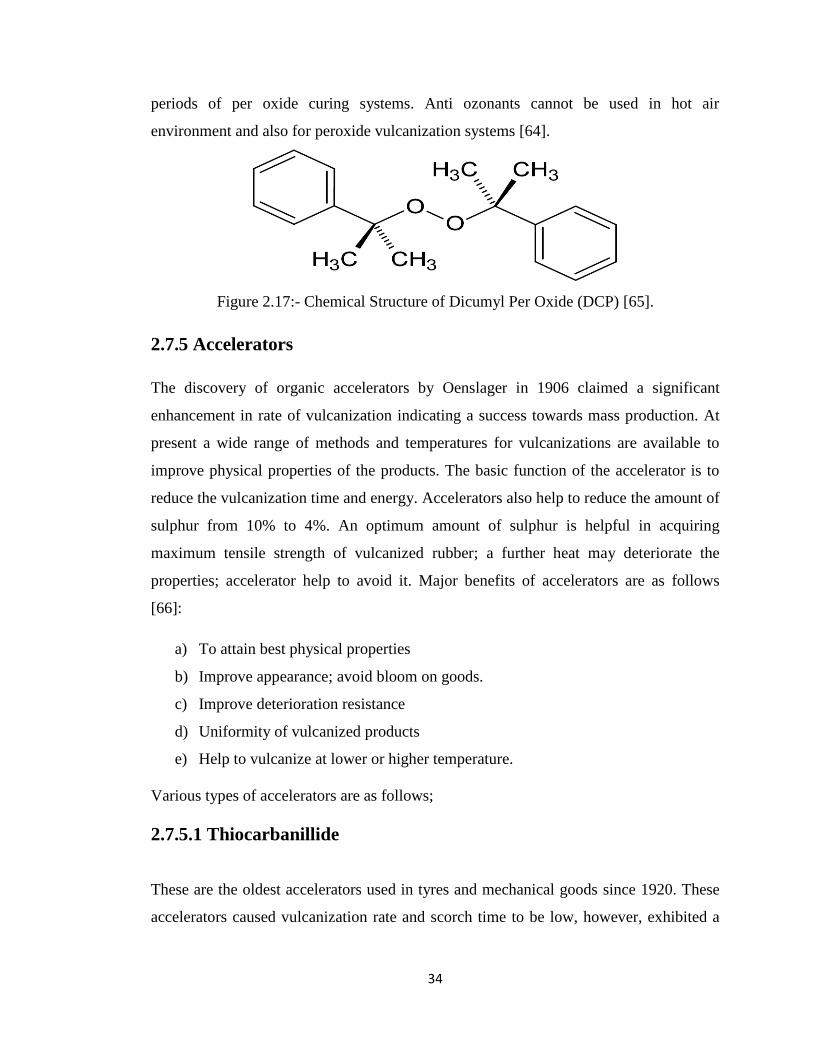
periods of per oxide curing systems. Anti ozonants cannot be used in hot air
environment and also for peroxide vulcanization systems [64].
Figure 2.17:- Chemical Structure of Dicumyl Per Oxide (DCP) [65].
2.7.5 Accelerators
The discovery of organic accelerators by Oenslager in 1906 claimed a significant
enhancement in rate of vulcanization indicating a success towards mass production. At
present a wide range of methods and temperatures for vulcanizations are available to
improve physical properties of the products. The basic function of the accelerator is to
reduce the vulcanization time and energy. Accelerators also help to reduce the amount of
sulphur from 10% to 4%. An optimum amount of sulphur is helpful in acquiring
maximum tensile strength of vulcanized rubber; a further heat may deteriorate the
properties; accelerator help to avoid it. Major benefits of accelerators are as follows
[66]:
a) To attain best physical properties
b) Improve appearance; avoid bloom on goods.
c) Improve deterioration resistance
d) Uniformity of vulcanized products
e) Help to vulcanize at lower or higher temperature.
Various types of accelerators are as follows;
2.7.5.1 Thiocarbanillide
These are the oldest accelerators used in tyres and mechanical goods since 1920. These
accelerators caused vulcanization rate and scorch time to be low, however, exhibited a
35
relatively high modulus with lower tensile strength and ageing properties, compared
with modern thiazole accelerators [67].
2.7.5.2 Guanidines
These are considered as primary accelerators; diphenyl guanidine (DPG) and di-o-tolyl
guanidine (DOTG) are the basic accelerators with a relatively slow onset of
vulcanization; for this reason they are used in the vulcanization of thick walled goods
[68].
2.7.5.3 Thiazoles
These are quite popular in rubber industry and have a wide range of variety e.g. 2-
mercaptobenzothiazole (MBT) and dibenzothiazyldisulphide (MBTS). The compounds
can be vulcanized at relatively high temperature along with safe processing. They are
also used for slow onset of vulcanization; if fast onset of vulcanization is required these
are used in combination with dithiocarbamates for outstanding tensile strength, high
modulus, high hardness and elasticity [69].
2.7.5.4 Thiurams
This type of accelerators is employed for fast curing at low temperatures and as boosters
for thiazoles or sulphenamides. The compounds vulcanized with this category, have
good heat resistance, especially the products for the use in steam joints, steam hose, hot
water bottles etc.Tetramethylthiuram (TMTD) and Tetraethylthiuram (TETD) are the
major accelerators of this category [70].
2.8 Reinforcing filler
Carbon Black (N330) nano particles have been used to develop sponge and auxetic
composites. These fillers are capable of filling the micro voids inherently existing in the
elastomeric materials to increase the strength of the composite. Carbon nano particles
also improve the hardness along with other physical properties of the fabricated
composites [71]. Details of effect of carbon black on mechanical, curing and rheological
characteristics will be discussed in Chapter 4.

36
Chapter 3
Auxetic Structures, Characterization &
Experimental Techniques
37
3.1 Development of sponge structures
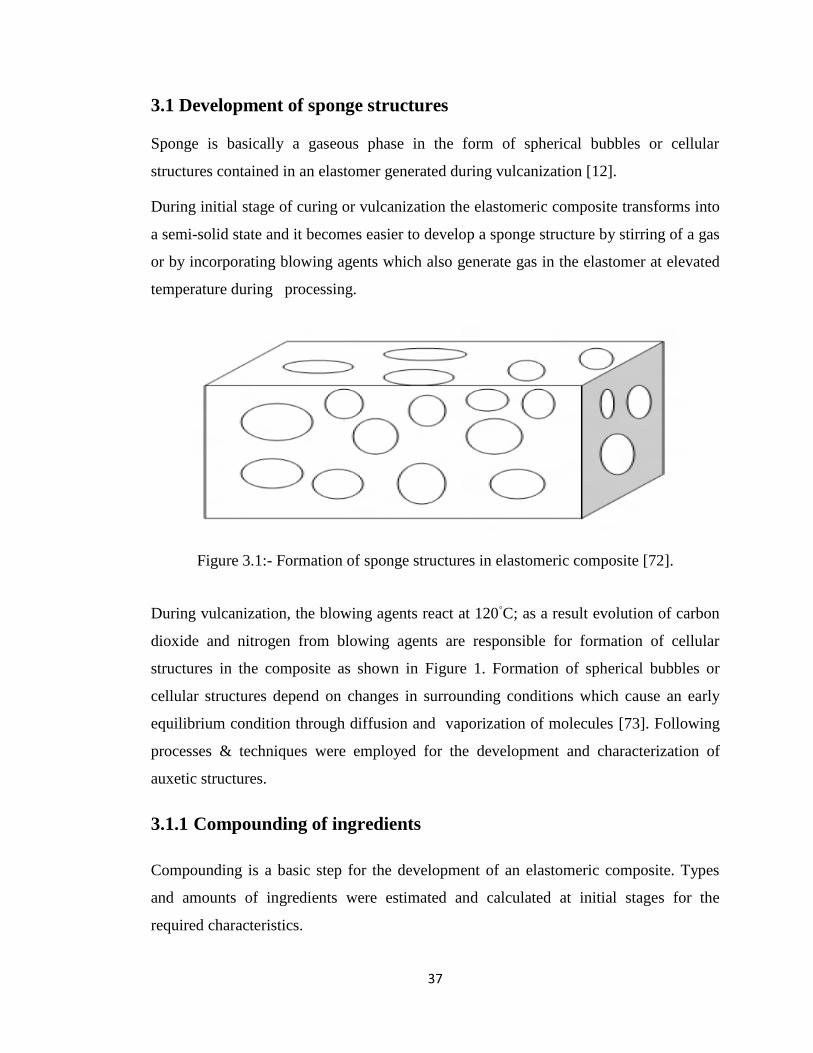
Sponge is basically a gaseous phase in the form of spherical bubbles or cellular
structures contained in an elastomer generated during vulcanization [12].
During initial stage of curing or vulcanization the elastomeric composite transforms into
a semi-solid state and it becomes easier to develop a sponge structure by stirring of a gas
or by incorporating blowing agents which also generate gas in the elastomer at elevated
temperature during processing.
Figure 3.1:- Formation of sponge structures in elastomeric composite [72].
During vulcanization, the blowing agents react at 120◦C; as a result evolution of carbon
dioxide and nitrogen from blowing agents are responsible for formation of cellular
structures in the composite as shown in Figure 1. Formation of spherical bubbles or
cellular structures depend on changes in surrounding conditions which cause an early
equilibrium condition through diffusion and vaporization of molecules [73]. Following
processes & techniques were employed for the development and characterization of
auxetic structures.
3.1.1 Compounding of ingredients
Compounding is a basic step for the development of an elastomeric composite. Types
and amounts of ingredients were estimated and calculated at initial stages for the
required characteristics.
38
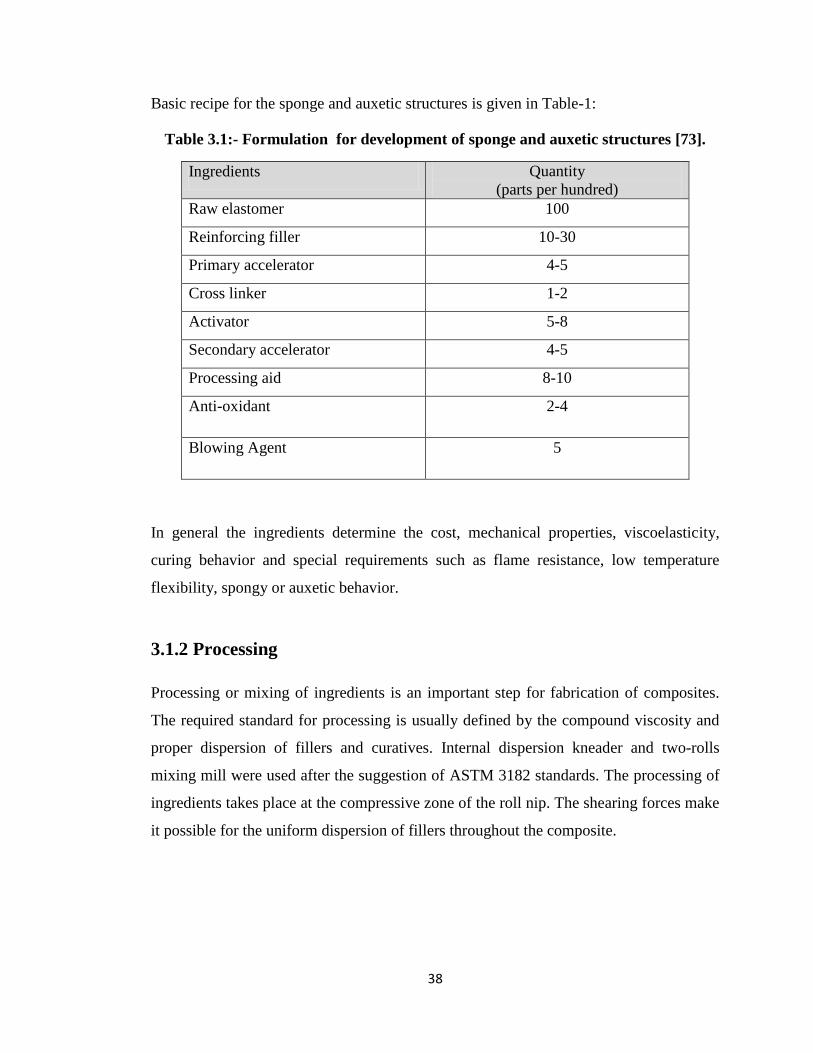
Basic recipe for the sponge and auxetic structures is given in Table-1:
Table 3.1:- Formulation for development of sponge and auxetic structures [73].
Ingredients Quantity
(parts per hundred)
Raw elastomer 100
Reinforcing filler 10-30
Primary accelerator 4-5
Cross linker 1-2
Activator 5-8
Secondary accelerator 4-5
Processing aid 8-10
Anti-oxidant 2-4
Blowing Agent 5
In general the ingredients determine the cost, mechanical properties, viscoelasticity,
curing behavior and special requirements such as flame resistance, low temperature
flexibility, spongy or auxetic behavior.
3.1.2 Processing
Processing or mixing of ingredients is an important step for fabrication of composites.
The required standard for processing is usually defined by the compound viscosity and
proper dispersion of fillers and curatives. Internal dispersion kneader and two-rolls
mixing mill were used after the suggestion of ASTM 3182 standards. The processing of
ingredients takes place at the compressive zone of the roll nip. The shearing forces make
it possible for the uniform dispersion of fillers throughout the composite.
39
Figure 3.2:- Two-rolls mixing mill for processing of ingredients in elastomers [74].
3.1.3 Vulcanization
Permanent cross linking between the macro-molecules, resulting to form a network
structure on heating of the uncured samples is known as vulcanization. Hydraulic press
(Figure-3) with heating arrangement was used for the vulcanization of the composites.
Formation of sponge structures take place during vulcanization as the temperature of the
uncured composite approaches 120◦C resulting in evolution of gases which instigates the
bubble formation within the composite [75].
40
Figure 3.3:-Vulcanized samples for tensile, hardness and compression characterization.
Four principal changes which take place during vulcanization are [76]:
Uncured elastic material converts in to permanently crosslinked cured substance
a) Physical properties such as tensile strength, elongation and modulus of elasticity
change as the vulcanization proceeds.
b) Vulcanized composite can withstand a wide range of temperature than uncured
one.
c) Vulcanized polymer swells in liquids which dissolve the un-vulcanized polymer.
41
Figure 3.4:- Hydraulic press 50 tons capacity, Shinto Japan used for the
vulcanization of elastomeric composites [77].
3.1.4 Rheological characteristics
The study of deformation and flow of the composite during vulcanization of a polymer
is known as rheology. A Rheo-check profile-MD (moving die), Gibitre instruments
S.R.I, Italy, was used according to ASTM 6204 standard to find Tan-δ (tangent delta),
viscosity variation, and curing behavior of the elastomer. The instrument consisted of
upper and lower dies with heating arrangements up to 190◦C ± 0.5
◦C facilitated with an
oscillation angle 0.5◦. Uncured sample was placed between the dies; the curing started as
the heat was supplied. The composite first changed into viscous phase and the cross
linking was measured by the torque with the help of oscillating dies of the Rheo-check.
The torque at the initial stage of curing was very low and was recorded as (ML), the
cross linking increased with time and supply of the heat, so the torque at the final stage
of curing was maximum denoted by (MH). The effect with gradual increase in cross
linking and curing is known as cure rate index (CRI), calculated by the following
relation [78]:
Cure Rate Index (CRI) = 100/t90-ts2 (Eq.1)
42
Where t90 is time require for the 90% curing and ts2is the curing time of the composite
up to 2 units increase in torque at initial stage of vulcanization.
Figure 3.5:-Rheo-Check (MD) RCO 2003028 was used for the rheological
characteristics investigation [78].
3.2 Mold for auxetic structures
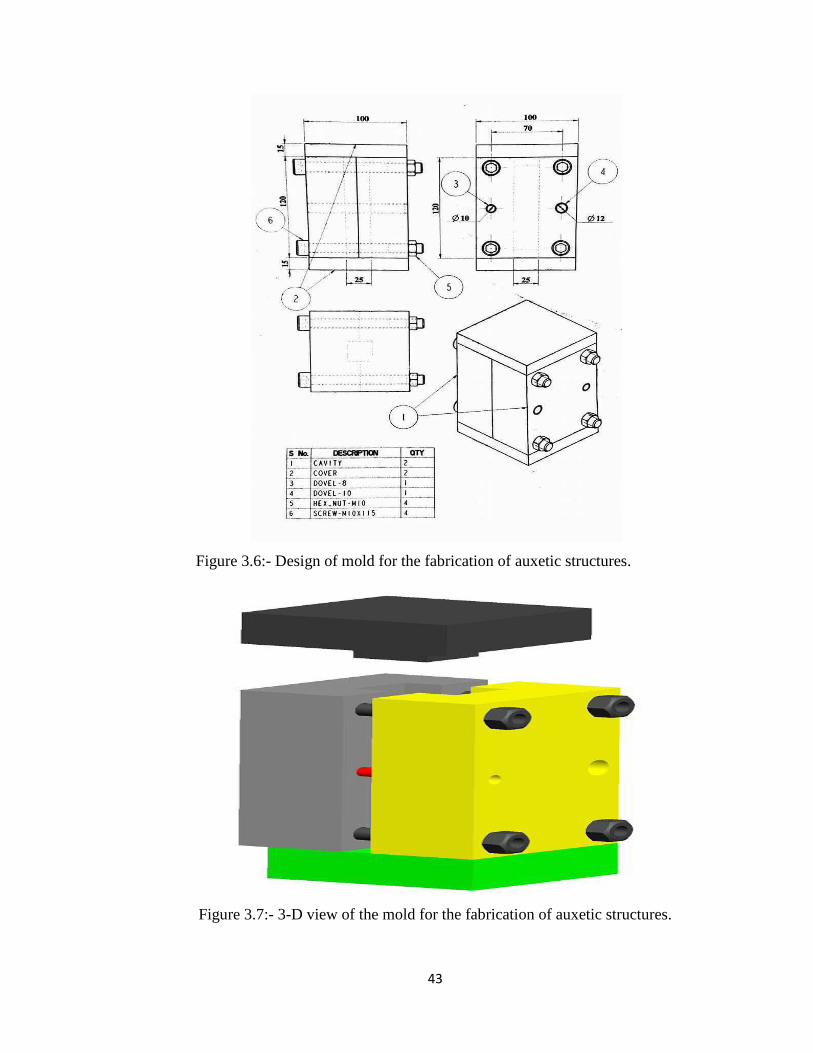
A mold design and 3-D view as displayed in Figures 6 & 7, consisting four parts with
inserts and screws for adjustment and volume compression, was fabricated for the
formation of auxetic structures with the provision of bi-iaxial compression at a required
temperature; dimensions of the mold were100 x 25 x25 mm (length x width x
thickness),.
43
Figure 3.6:- Design of mold for the fabrication of auxetic structures.
Figure 3.7:- 3-D view of the mold for the fabrication of auxetic structures.
44
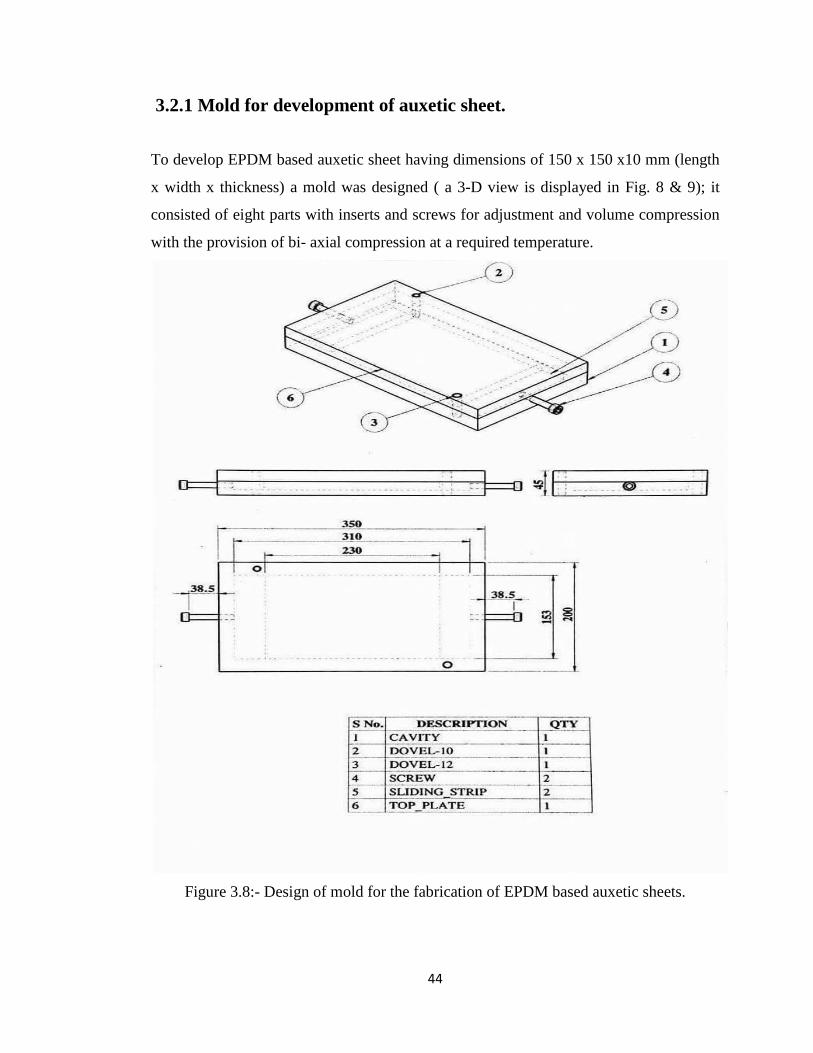
3.2.1 Mold for development of auxetic sheet.
To develop EPDM based auxetic sheet having dimensions of 150 x 150 x10 mm (length
x width x thickness) a mold was designed ( a 3-D view is displayed in Fig. 8 & 9); it
consisted of eight parts with inserts and screws for adjustment and volume compression
with the provision of bi- axial compression at a required temperature.
Figure 3.8:- Design of mold for the fabrication of EPDM based auxetic sheets.
45
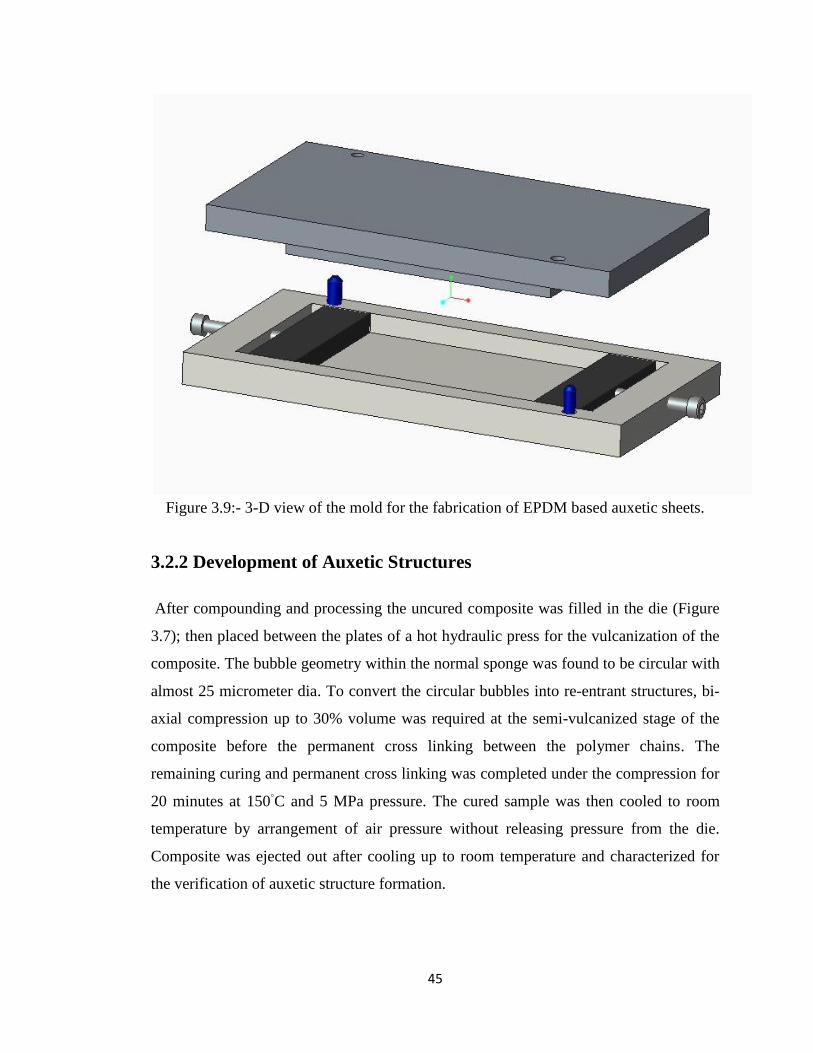
Figure 3.9:- 3-D view of the mold for the fabrication of EPDM based auxetic sheets.
3.2.2 Development of Auxetic Structures
After compounding and processing the uncured composite was filled in the die (Figure
3.7); then placed between the plates of a hot hydraulic press for the vulcanization of the
composite. The bubble geometry within the normal sponge was found to be circular with
almost 25 micrometer dia. To convert the circular bubbles into re-entrant structures, bi-
axial compression up to 30% volume was required at the semi-vulcanized stage of the
composite before the permanent cross linking between the polymer chains. The
remaining curing and permanent cross linking was completed under the compression for
20 minutes at 150◦C and 5 MPa pressure. The cured sample was then cooled to room
temperature by arrangement of air pressure without releasing pressure from the die.
Composite was ejected out after cooling up to room temperature and characterized for
the verification of auxetic structure formation.
46
3.2.3 Poisson’s ratio measurement
Two methods can be employed for the measurement of Poisson‟s ratio of the elastomeric
based auxetic composites.
a) Image data analysis
b) Transverse extensometer
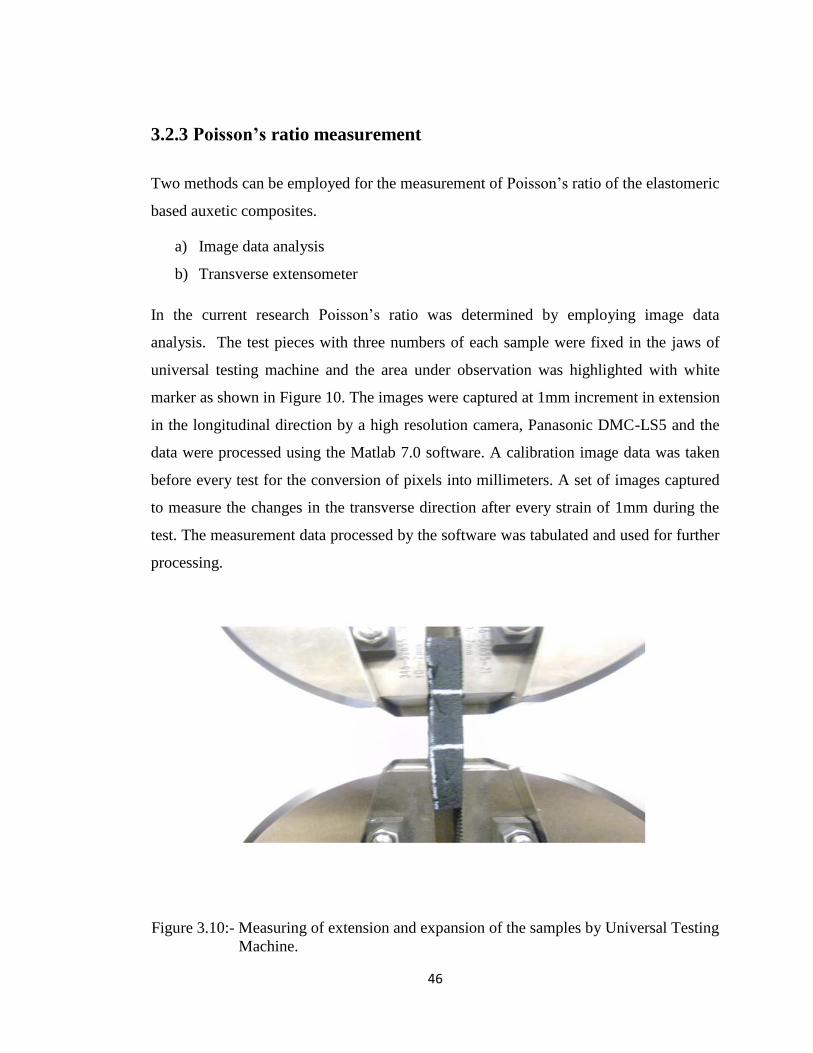
In the current research Poisson‟s ratio was determined by employing image data
analysis. The test pieces with three numbers of each sample were fixed in the jaws of
universal testing machine and the area under observation was highlighted with white
marker as shown in Figure 10. The images were captured at 1mm increment in extension
in the longitudinal direction by a high resolution camera, Panasonic DMC-LS5 and the
data were processed using the Matlab 7.0 software. A calibration image data was taken
before every test for the conversion of pixels into millimeters. A set of images captured
to measure the changes in the transverse direction after every strain of 1mm during the
test. The measurement data processed by the software was tabulated and used for further
processing.
Figure 3.10:- Measuring of extension and expansion of the samples by Universal Testing
Machine.
47
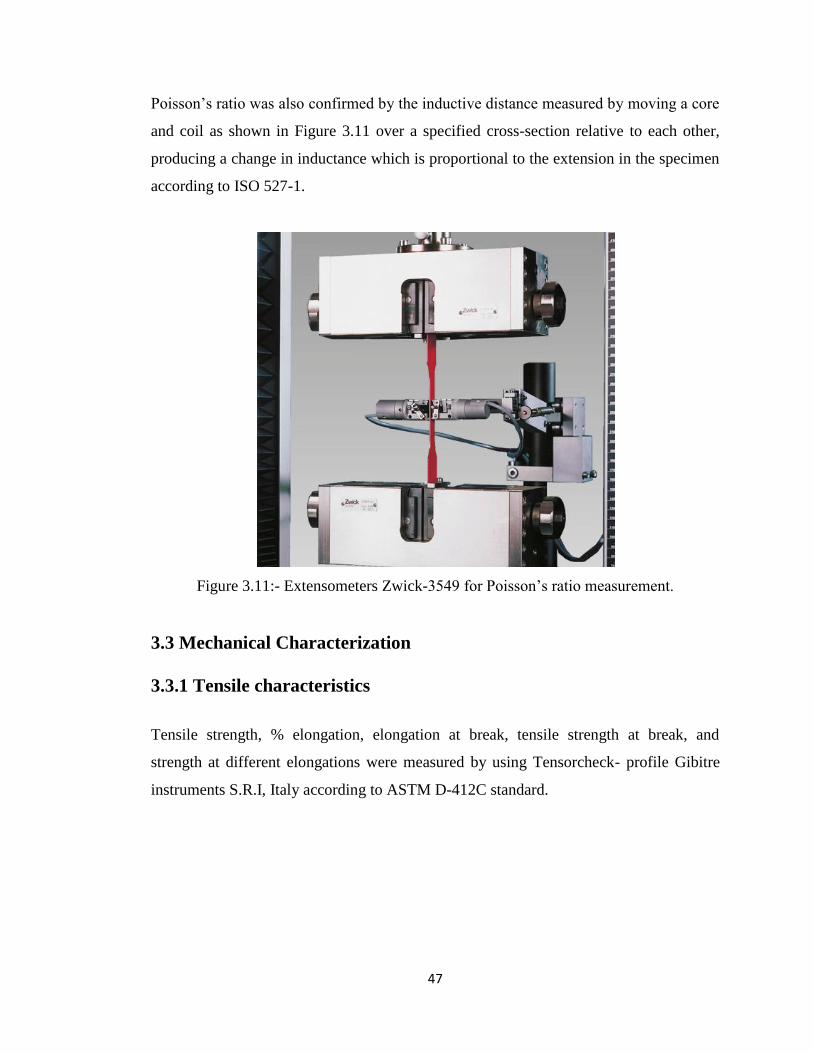
Poisson‟s ratio was also confirmed by the inductive distance measured by moving a core
and coil as shown in Figure 3.11 over a specified cross-section relative to each other,
producing a change in inductance which is proportional to the extension in the specimen
according to ISO 527-1.
Figure 3.11:- Extensometers Zwick-3549 for Poisson‟s ratio measurement.
3.3 Mechanical Characterization
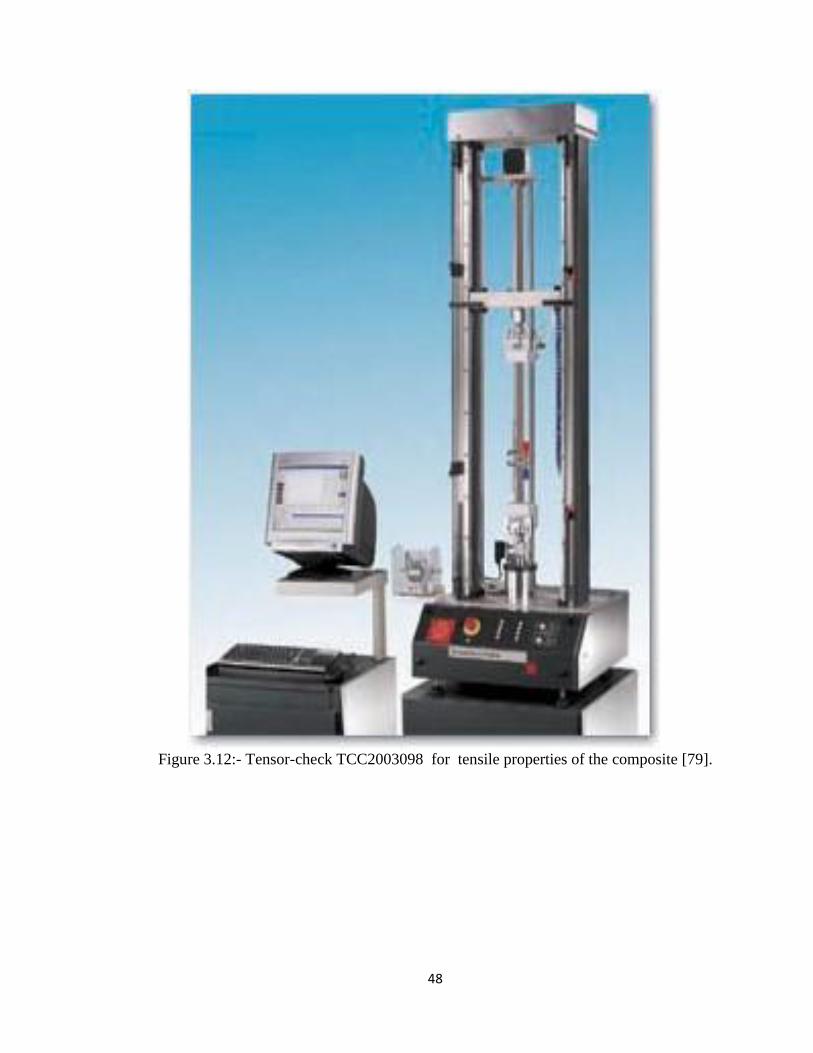
3.3.1 Tensile characteristics
Tensile strength, % elongation, elongation at break, tensile strength at break, and
strength at different elongations were measured by using Tensorcheck- profile Gibitre
instruments S.R.I, Italy according to ASTM D-412C standard.
48
Figure 3.12:- Tensor-check TCC2003098 for tensile properties of the composite [79].
49
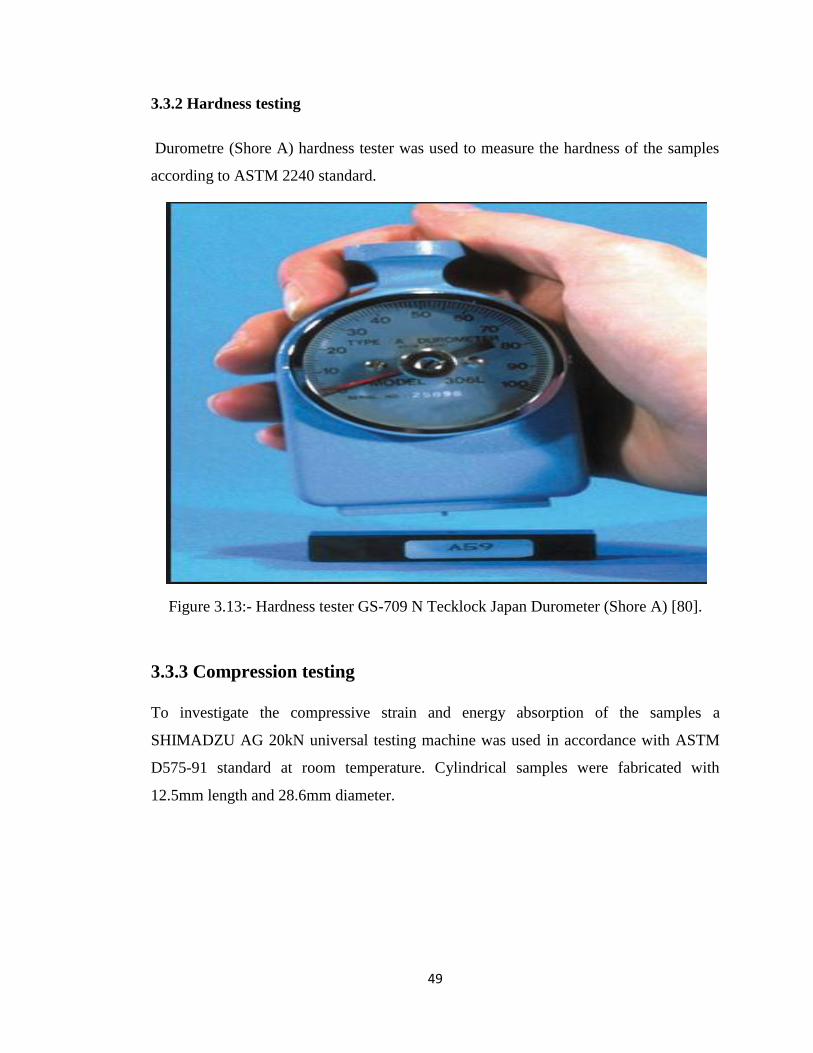
3.3.2 Hardness testing
Durometre (Shore A) hardness tester was used to measure the hardness of the samples
according to ASTM 2240 standard.
Figure 3.13:- Hardness tester GS-709 N Tecklock Japan Durometer (Shore A) [80].
3.3.3 Compression testing
To investigate the compressive strain and energy absorption of the samples a
SHIMADZU AG 20kN universal testing machine was used in accordance with ASTM
D575-91 standard at room temperature. Cylindrical samples were fabricated with
12.5mm length and 28.6mm diameter.
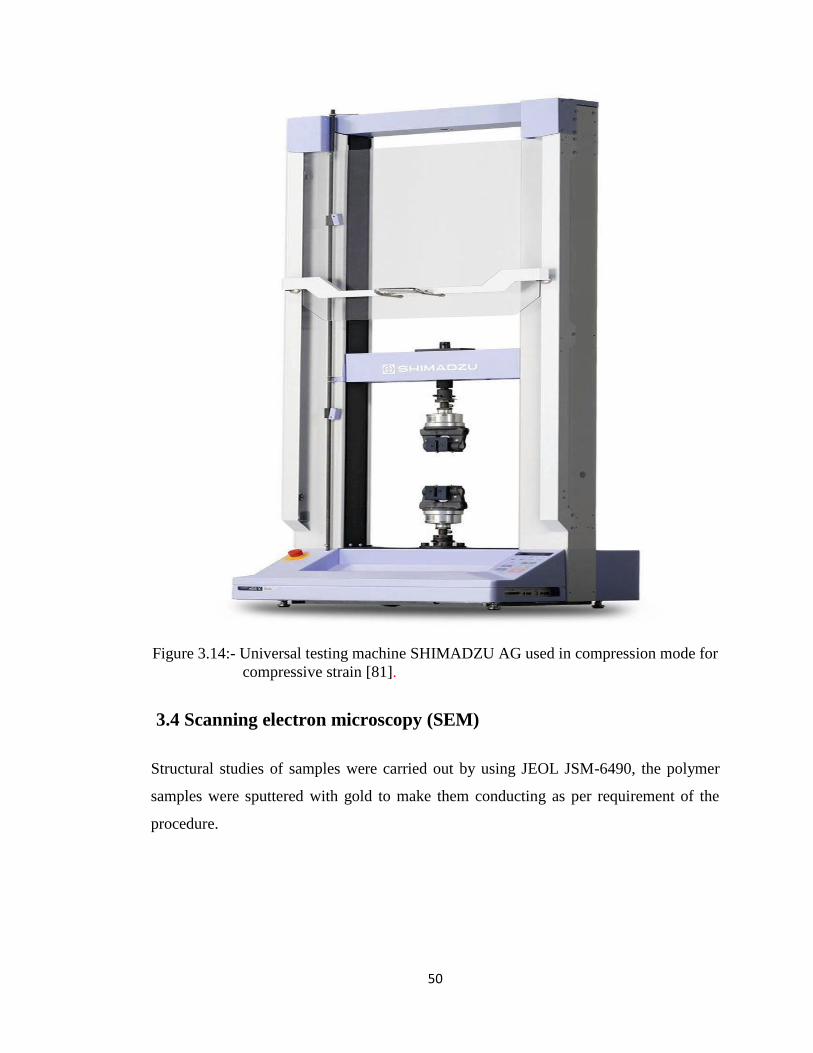
50
Figure 3.14:- Universal testing machine SHIMADZU AG used in compression mode for
compressive strain [81].
3.4 Scanning electron microscopy (SEM)
Structural studies of samples were carried out by using JEOL JSM-6490, the polymer
samples were sputtered with gold to make them conducting as per requirement of the
procedure.
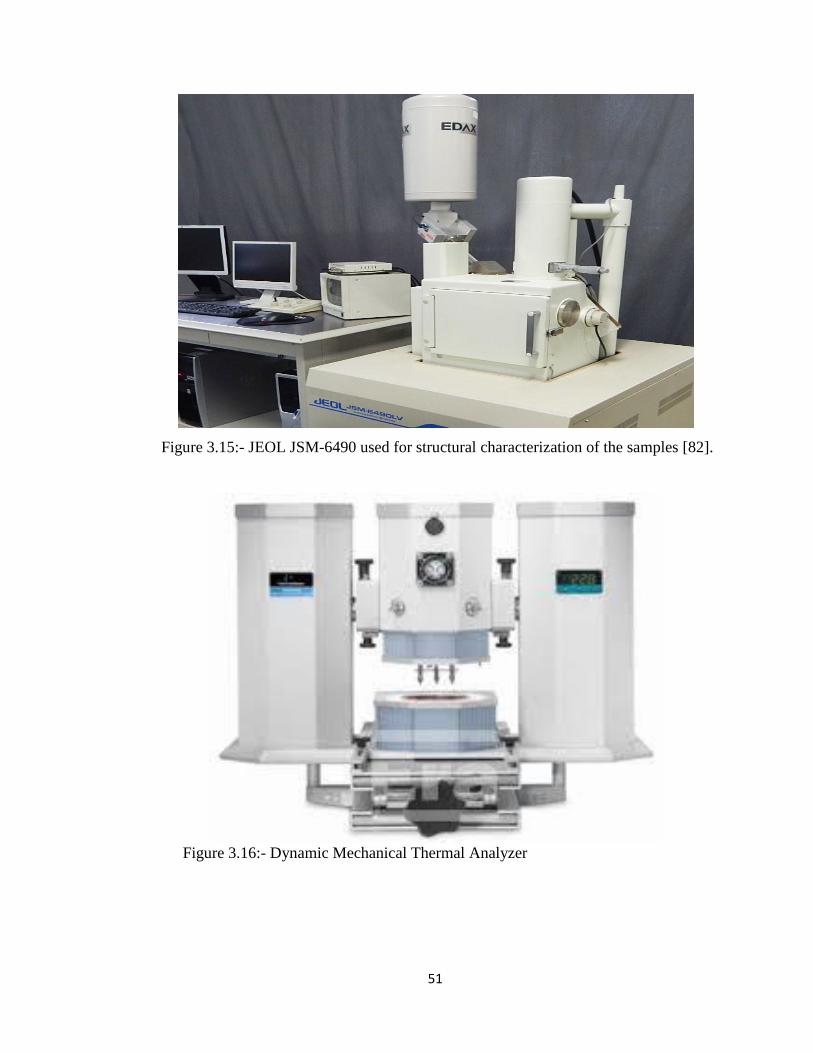
51
Figure 3.15:- JEOL JSM-6490 used for structural characterization of the samples [82].
Figure 3.16:- Dynamic Mechanical Thermal Analyzer
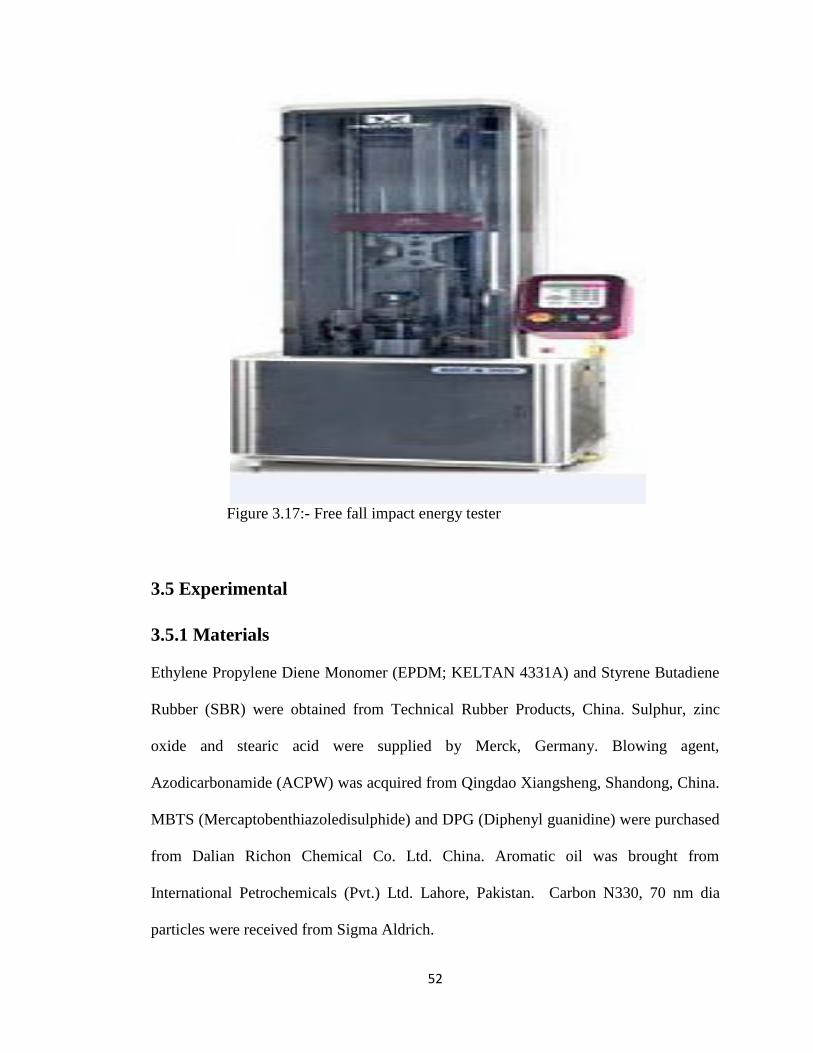
52
Figure 3.17:- Free fall impact energy tester
3.5 Experimental
3.5.1 Materials
Ethylene Propylene Diene Monomer (EPDM; KELTAN 4331A) and Styrene Butadiene
Rubber (SBR) were obtained from Technical Rubber Products, China. Sulphur, zinc
oxide and stearic acid were supplied by Merck, Germany. Blowing agent,
Azodicarbonamide (ACPW) was acquired from Qingdao Xiangsheng, Shandong, China.
MBTS (Mercaptobenthiazoledisulphide) and DPG (Diphenyl guanidine) were purchased
from Dalian Richon Chemical Co. Ltd. China. Aromatic oil was brought from
International Petrochemicals (Pvt.) Ltd. Lahore, Pakistan. Carbon N330, 70 nm dia
particles were received from Sigma Aldrich.
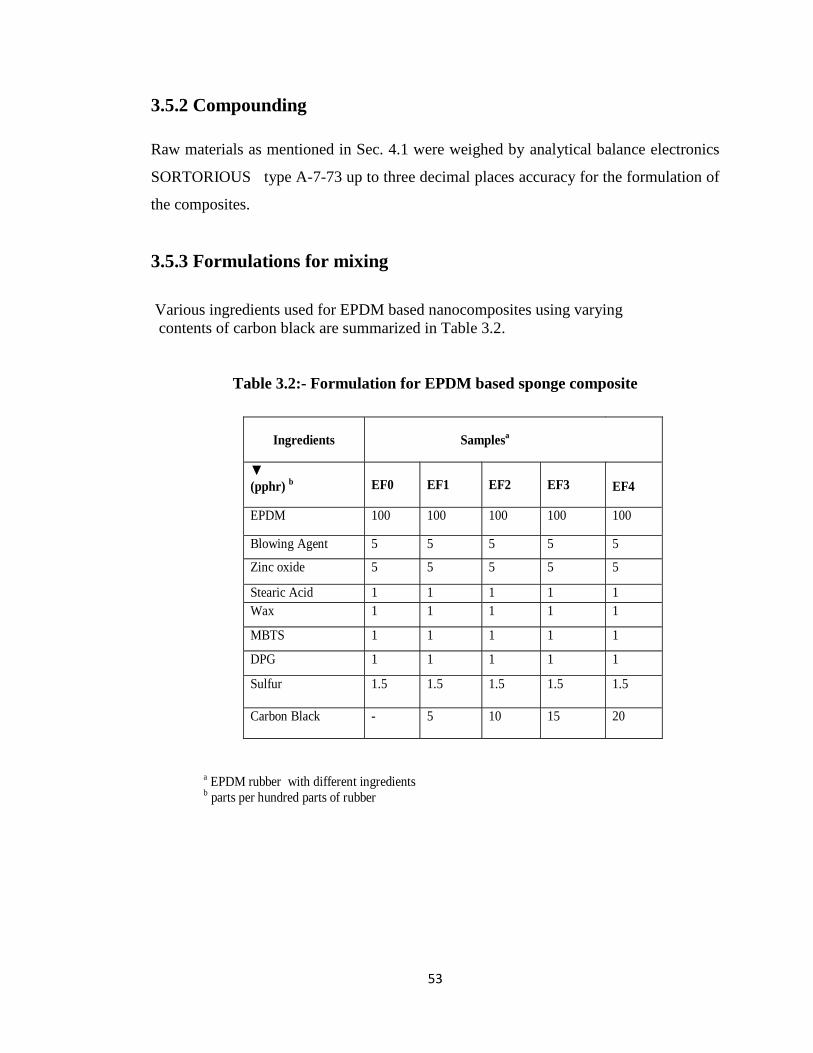
53
3.5.2 Compounding
Raw materials as mentioned in Sec. 4.1 were weighed by analytical balance electronics
SORTORIOUS type A-7-73 up to three decimal places accuracy for the formulation of
the composites.
3.5.3 Formulations for mixing
Various ingredients used for EPDM based nanocomposites using varying
contents of carbon black are summarized in Table 3.2.
Table 3.2:- Formulation for EPDM based sponge composite
Ingredients Samplesa
▼
(pphr) b EF0 EF1 EF2 EF3
EF4
EPDM 100 100 100 100 100
Blowing Agent 5 5 5 5 5
Zinc oxide 5 5 5 5 5
Stearic Acid 1 1 1 1 1
Wax 1 1 1 1 1
MBTS 1 1 1 1 1
DPG 1 1 1 1 1
Sulfur 1.5 1.5 1.5 1.5
1.5
Carbon Black - 5 10 15 20
a EPDM rubber with different ingredients b parts per hundred parts of rubber
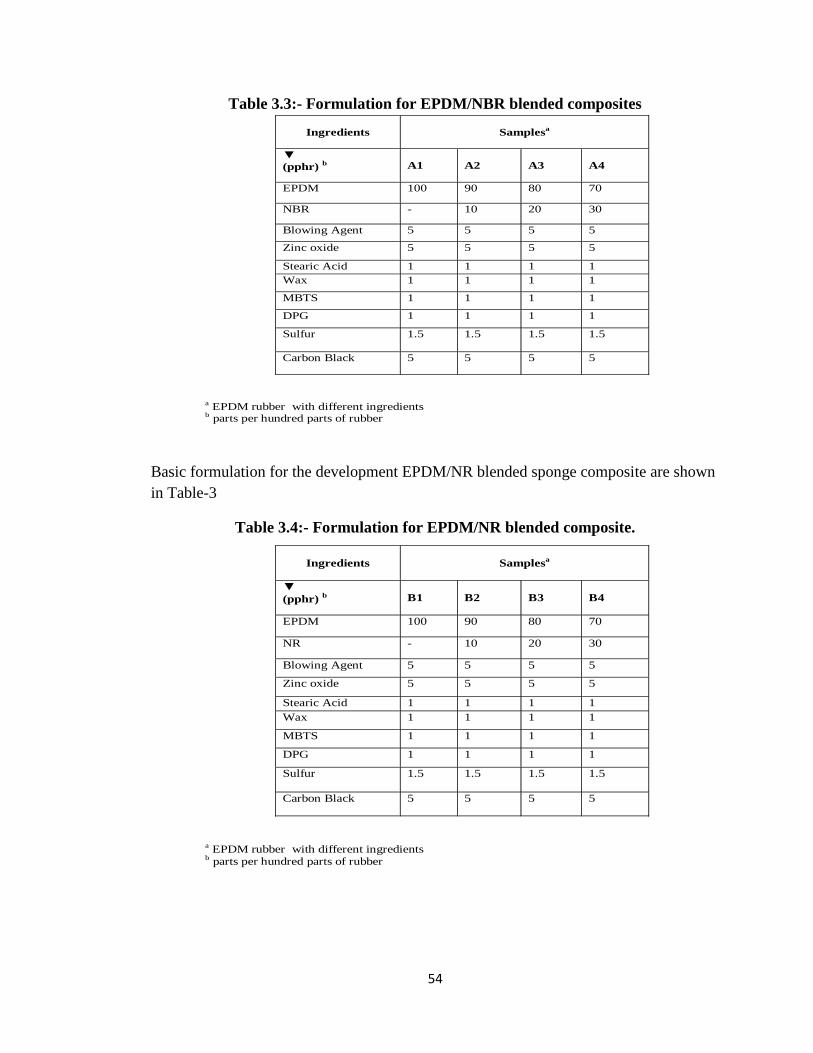
54
Table 3.3:- Formulation for EPDM/NBR blended composites
Ingredients Samplesa
▼
(pphr) b A1 A2 A3 A4
EPDM 100 90 80 70
NBR - 10 20 30
Blowing Agent 5 5 5 5
Zinc oxide 5 5 5 5
Stearic Acid 1 1 1 1
Wax 1 1 1 1
MBTS 1 1 1 1
DPG 1 1 1 1
Sulfur 1.5 1.5 1.5 1.5
Carbon Black 5 5 5 5
a EPDM rubber with different ingredients b parts per hundred parts of rubber
Basic formulation for the development EPDM/NR blended sponge composite are shown
in Table-3
Table 3.4:- Formulation for EPDM/NR blended composite.
Ingredients Samplesa
▼
(pphr) b B1 B2 B3 B4
EPDM 100 90 80 70
NR - 10 20 30
Blowing Agent 5 5 5 5
Zinc oxide 5 5 5 5
Stearic Acid 1 1 1 1
Wax 1 1 1 1
MBTS 1 1 1 1
DPG 1 1 1 1
Sulfur 1.5 1.5 1.5 1.5
Carbon Black 5 5 5 5
a EPDM rubber with different ingredients b parts per hundred parts of rubber
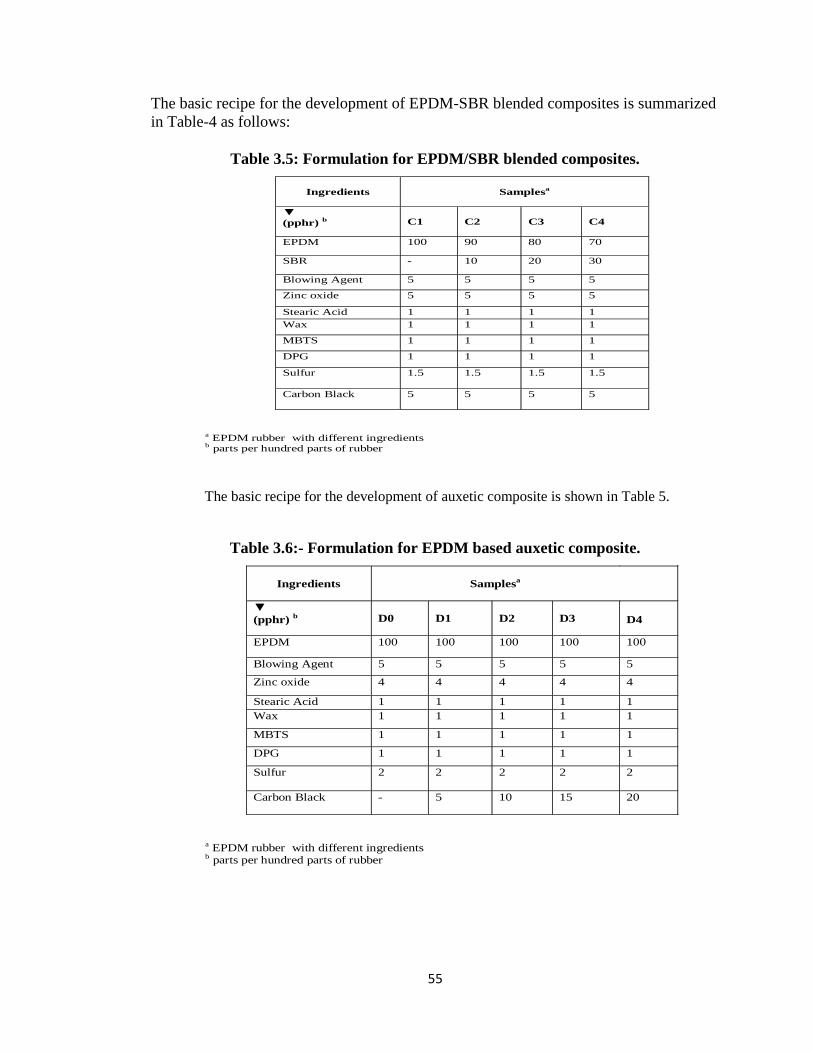
55
The basic recipe for the development of EPDM-SBR blended composites is summarized
in Table-4 as follows:
Table 3.5: Formulation for EPDM/SBR blended composites.
Ingredients Samplesa
▼
(pphr) b C1 C2 C3 C4
EPDM 100 90 80 70
SBR - 10 20 30
Blowing Agent 5 5 5 5
Zinc oxide 5 5 5 5
Stearic Acid 1 1 1 1
Wax 1 1 1 1
MBTS 1 1 1 1
DPG 1 1 1 1
Sulfur 1.5 1.5 1.5 1.5
Carbon Black 5 5 5 5
a EPDM rubber with different ingredients b parts per hundred parts of rubber
The basic recipe for the development of auxetic composite is shown in Table 5.
Table 3.6:- Formulation for EPDM based auxetic composite.
Ingredients Samplesa
▼
(pphr) b D0 D1 D2 D3
D4
EPDM 100 100 100 100 100
Blowing Agent 5 5 5 5 5
Zinc oxide 4 4 4 4 4
Stearic Acid 1 1 1 1 1
Wax 1 1 1 1 1
MBTS 1 1 1 1 1
DPG 1 1 1 1 1
Sulfur 2 2 2 2
2
Carbon Black - 5 10 15 20
a EPDM rubber with different ingredients b parts per hundred parts of rubber
56
3.5.4 Mixing
The compounded formulations were mixed by the two-roll mixing mill as shown in
Fig.2 according to ASTM 3182. Mixing was carried out in two steps, in first step only
raw elastomer , fillers and processing aids were mixed for10 minutes at 100 ◦
C then
accelerators, activators and curing agents added and mixed the batch for 7 minutes
below 100 ◦C. Mixed batch kept at room temperature for 24 hours before formation of
samples.
3.5.5 Formation of samples
Hydraulic press 50 tons capacity, Shinto Japan was used for the manufacturing of
samples for free fall impact energy, compressive strain, dynamic mechanical thermal
analyzer, rheology, and mechanical characteristics according to ASTM D1709, D575-
91, D4065, D6204, D2240, and D412 C under 16 MPa pressure, at 150 ◦C for 20
minutes.
3.5.6 Testing / Characterization
Manufactured samples were characterized by employing instruments as shown in Figs.
5, 12, 13, 14, 15, 16, and 17 for rheology, mechanical characterization, free fall impact
energy, compressive strain, dynamic mechanical thermal analyzer and scanning electron
micrograph.

57
Chapter-4
Results and Discussions
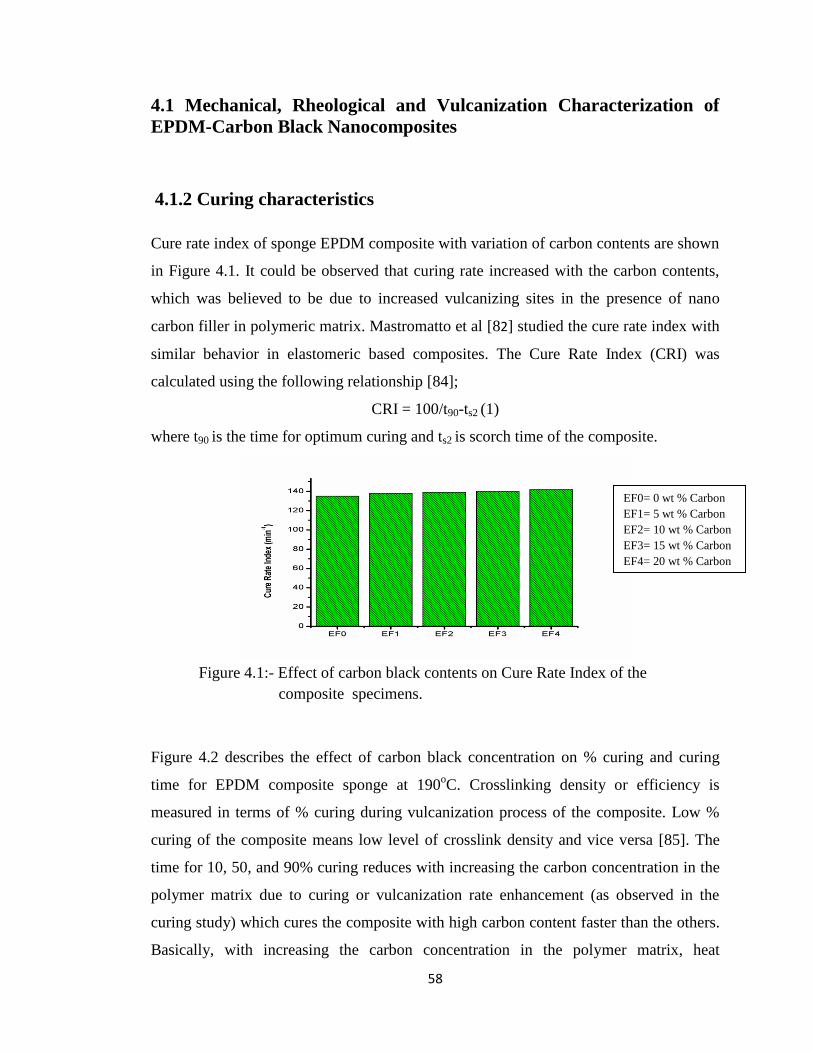
58
4.1 Mechanical, Rheological and Vulcanization Characterization of
EPDM-Carbon Black Nanocomposites
4.1.2 Curing characteristics
Cure rate index of sponge EPDM composite with variation of carbon contents are shown
in Figure 4.1. It could be observed that curing rate increased with the carbon contents,
which was believed to be due to increased vulcanizing sites in the presence of nano
carbon filler in polymeric matrix. Mastromatto et al [82] studied the cure rate index with
similar behavior in elastomeric based composites. The Cure Rate Index (CRI) was
calculated using the following relationship [84];
CRI = 100/t90-ts2 (1)
where t90 is the time for optimum curing and ts2 is scorch time of the composite.
Figure 4.1:- Effect of carbon black contents on Cure Rate Index of the
composite specimens.
Figure 4.2 describes the effect of carbon black concentration on % curing and curing
time for EPDM composite sponge at 190oC. Crosslinking density or efficiency is
measured in terms of % curing during vulcanization process of the composite. Low %
curing of the composite means low level of crosslink density and vice versa [85]. The
time for 10, 50, and 90% curing reduces with increasing the carbon concentration in the
polymer matrix due to curing or vulcanization rate enhancement (as observed in the
curing study) which cures the composite with high carbon content faster than the others.
Basically, with increasing the carbon concentration in the polymer matrix, heat
EF0= 0 wt % Carbon
EF1= 5 wt % Carbon
EF2= 10 wt % Carbon
EF3= 15 wt % Carbon
EF4= 20 wt % Carbon

59
transports from source to the polymeric molecular chains increases which endorses and
speeds up the vulcanization process. Gardinar et al [85] also observed similar curing
trend behavior in elastomers.
Figure 4.2:- Effect of carbon black contents on % curing with
time at 190oC sponge EPDM composites.
4.1.3 Mechanical behavior
The effect of various concentrations of carbon black on the mechanical properties of
EPDM sponge rubber composite is displayed in Figure 4.3. Tensile strength was
improved by increasing amount of carbon black in the rubber matrix, however,
elongation at break reduced owing to increase in resistance to flow under uniaxial force
offered by the incorporated nanofiller. Bretter et al [86] revealed the enhancement of
tensile strength and depreciation in elongation with the incorporation of nano carbon.
A remarkable augmentation was observed with 20 wt% nano carbon addition in the
polymer matrix. The enhancement in mechanical aspects appears to be due to the fact
that carbon black acts as reinforcing filler in the composite and it increases the cross-link
density and reduces viscosity by occupying active sites of the branched chains of the
base polymer by filling up the micro voids exist in it and consequently higher
strengthening is achieved. The enhancement of cross-link density during vulcanization
EF0= 0 wt % Carbon
EF1= 5 wt % Carbon
EF2= 10 wt % Carbon
EF3= 15 wt % Carbon
EF4= 20 wt % Carbon
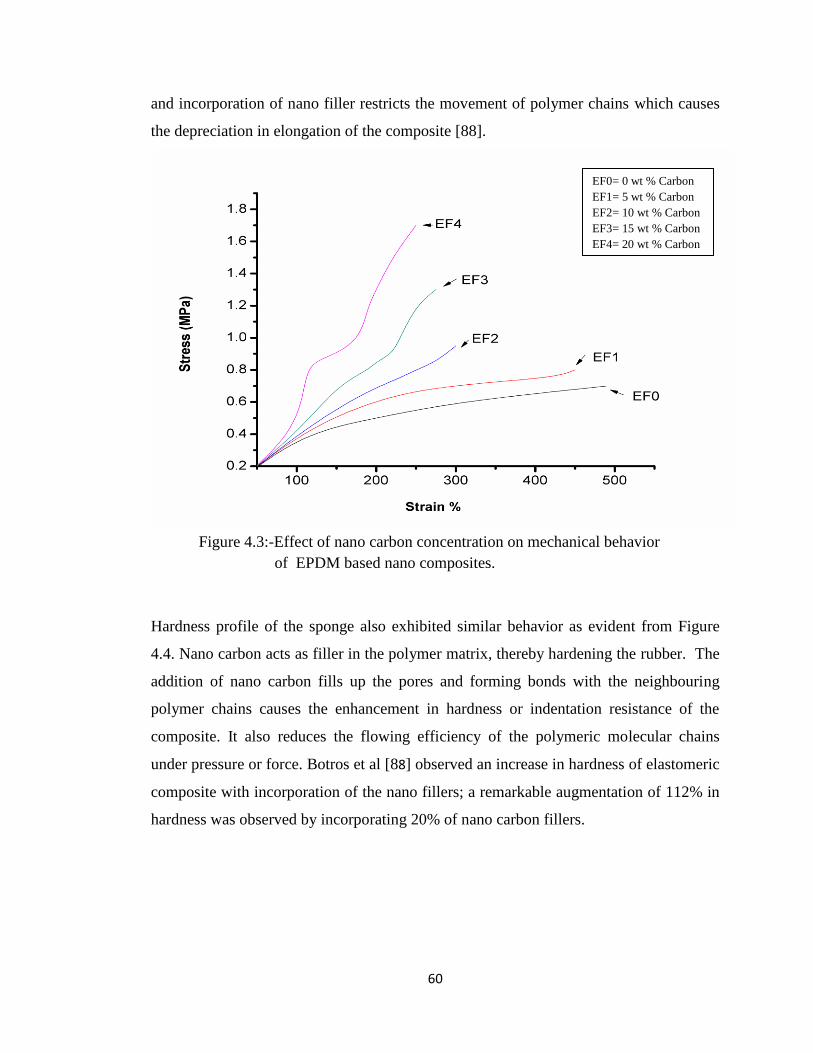
60
and incorporation of nano filler restricts the movement of polymer chains which causes
the depreciation in elongation of the composite [88].
Figure 4.3:-Effect of nano carbon concentration on mechanical behavior
of EPDM based nano composites.
Hardness profile of the sponge also exhibited similar behavior as evident from Figure
4.4. Nano carbon acts as filler in the polymer matrix, thereby hardening the rubber. The
addition of nano carbon fills up the pores and forming bonds with the neighbouring
polymer chains causes the enhancement in hardness or indentation resistance of the
composite. It also reduces the flowing efficiency of the polymeric molecular chains
under pressure or force. Botros et al [88] observed an increase in hardness of elastomeric
composite with incorporation of the nano fillers; a remarkable augmentation of 112% in
hardness was observed by incorporating 20% of nano carbon fillers.
EF0= 0 wt % Carbon
EF1= 5 wt % Carbon
EF2= 10 wt % Carbon
EF3= 15 wt % Carbon
EF4= 20 wt % Carbon
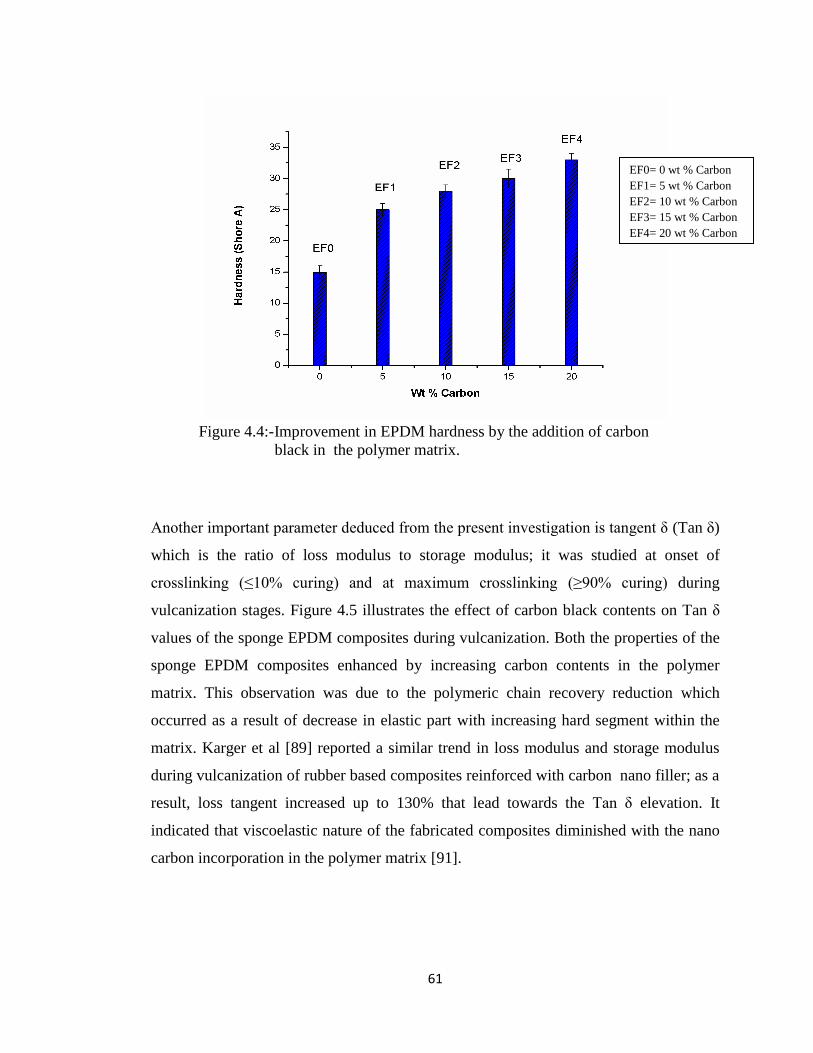
61
Figure 4.4:-Improvement in EPDM hardness by the addition of carbon
black in the polymer matrix.
Another important parameter deduced from the present investigation is tangent δ (Tan δ)
which is the ratio of loss modulus to storage modulus; it was studied at onset of
crosslinking (≤10% curing) and at maximum crosslinking (≥90% curing) during
vulcanization stages. Figure 4.5 illustrates the effect of carbon black contents on Tan δ
values of the sponge EPDM composites during vulcanization. Both the properties of the
sponge EPDM composites enhanced by increasing carbon contents in the polymer
matrix. This observation was due to the polymeric chain recovery reduction which
occurred as a result of decrease in elastic part with increasing hard segment within the
matrix. Karger et al [89] reported a similar trend in loss modulus and storage modulus
during vulcanization of rubber based composites reinforced with carbon nano filler; as a
result, loss tangent increased up to 130% that lead towards the Tan δ elevation. It
indicated that viscoelastic nature of the fabricated composites diminished with the nano
carbon incorporation in the polymer matrix [91].
EF0= 0 wt % Carbon
EF1= 5 wt % Carbon
EF2= 10 wt % Carbon
EF3= 15 wt % Carbon
EF4= 20 wt % Carbon

62
Figure 4.5:- Increase in Tan δ of EPDM sponge composite by adding
carbon black.
As revealed from Figure 4.6, the compressive strain decreased up to 70% by the addition
of 20% carbon nano fillers. Sponge structures formed within the composite behaved like
cushions which were responsible for the compression on the application of external load.
Faris et al [91] observed similar trend in their research. Incorporation of rigid fillers
caused a reduction in sponge formation in the composite which decreased the capability
of the composite to be deformed under compression.
Figure 4.6:- Load-compression diagrams during compression testing
of EPDM rubber sponge nano composites at various nano
fillers‟ loadings.
EF0= 0 wt % Carbon
EF1= 5 wt % Carbon
EF2= 10 wt % Carbon
EF3= 15 wt % Carbon
EF4= 20 wt % Carbon
EF0= 0 wt % Carbon
EF1= 5 wt % Carbon
EF2= 10 wt % Carbon
EF3= 15 wt % Carbon
EF4= 20 wt % Carbon
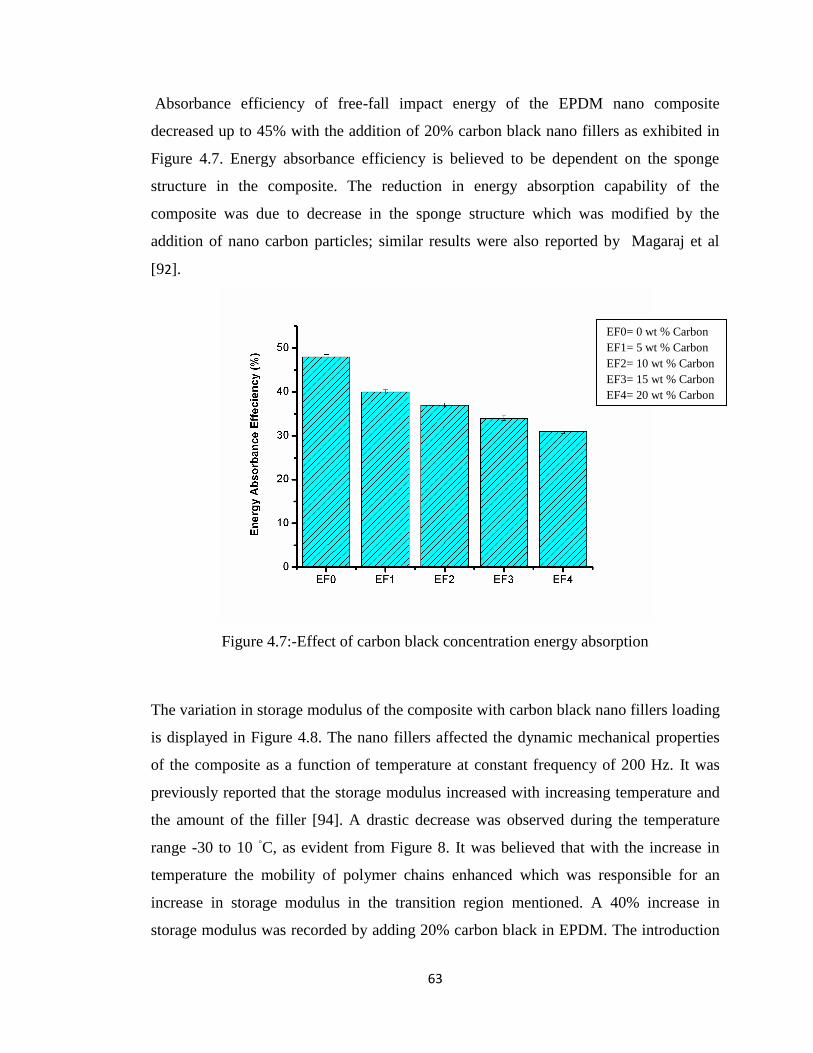
63
Absorbance efficiency of free-fall impact energy of the EPDM nano composite
decreased up to 45% with the addition of 20% carbon black nano fillers as exhibited in
Figure 4.7. Energy absorbance efficiency is believed to be dependent on the sponge
structure in the composite. The reduction in energy absorption capability of the
composite was due to decrease in the sponge structure which was modified by the
addition of nano carbon particles; similar results were also reported by Magaraj et al
[92].
Figure 4.7:-Effect of carbon black concentration energy absorption
The variation in storage modulus of the composite with carbon black nano fillers loading
is displayed in Figure 4.8. The nano fillers affected the dynamic mechanical properties
of the composite as a function of temperature at constant frequency of 200 Hz. It was
previously reported that the storage modulus increased with increasing temperature and
the amount of the filler [94]. A drastic decrease was observed during the temperature
range -30 to 10 ◦C, as evident from Figure 8. It was believed that with the increase in
temperature the mobility of polymer chains enhanced which was responsible for an
increase in storage modulus in the transition region mentioned. A 40% increase in
storage modulus was recorded by adding 20% carbon black in EPDM. The introduction
EF0= 0 wt % Carbon
EF1= 5 wt % Carbon
EF2= 10 wt % Carbon
EF3= 15 wt % Carbon
EF4= 20 wt % Carbon
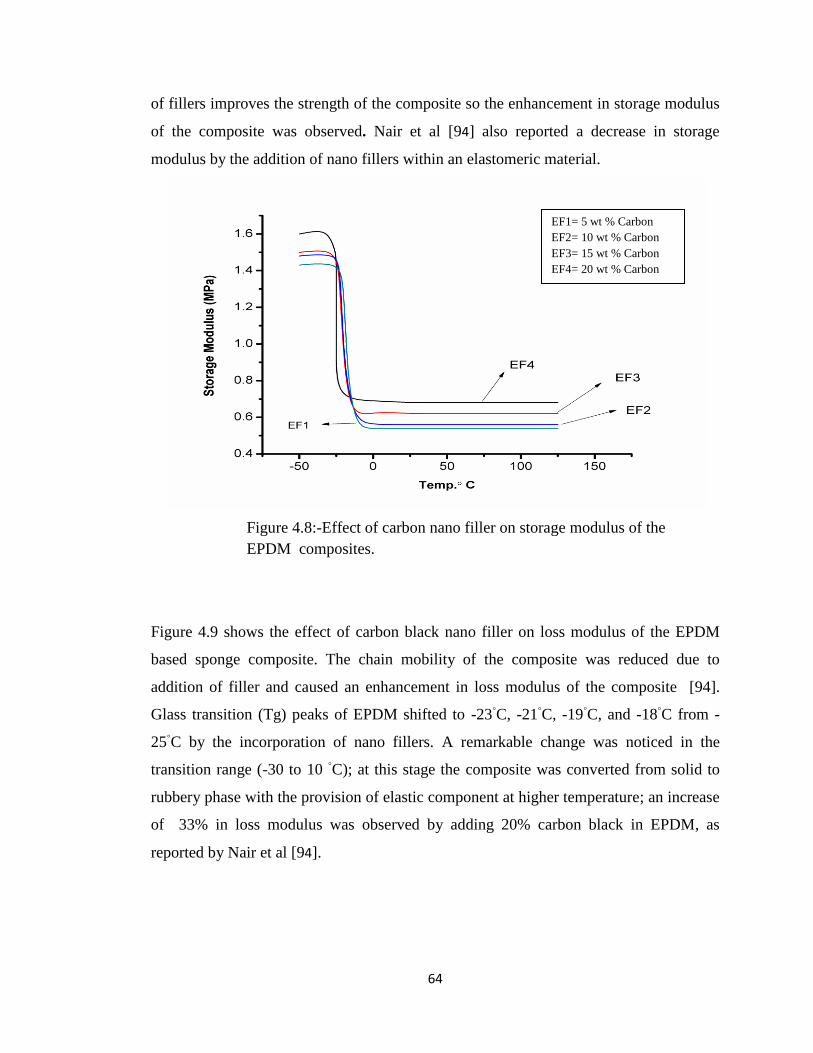
64
of fillers improves the strength of the composite so the enhancement in storage modulus
of the composite was observed. Nair et al [94] also reported a decrease in storage
modulus by the addition of nano fillers within an elastomeric material.
Figure 4.8:-Effect of carbon nano filler on storage modulus of the
EPDM composites.
Figure 4.9 shows the effect of carbon black nano filler on loss modulus of the EPDM
based sponge composite. The chain mobility of the composite was reduced due to
addition of filler and caused an enhancement in loss modulus of the composite [94].
Glass transition (Tg) peaks of EPDM shifted to -23◦C, -21
◦C, -19
◦C, and -18
◦C from -
25◦C by the incorporation of nano fillers. A remarkable change was noticed in the
transition range (-30 to 10 ◦C); at this stage the composite was converted from solid to
rubbery phase with the provision of elastic component at higher temperature; an increase
of 33% in loss modulus was observed by adding 20% carbon black in EPDM, as
reported by Nair et al [94].
EF1= 5 wt % Carbon
EF2= 10 wt % Carbon
EF3= 15 wt % Carbon
EF4= 20 wt % Carbon
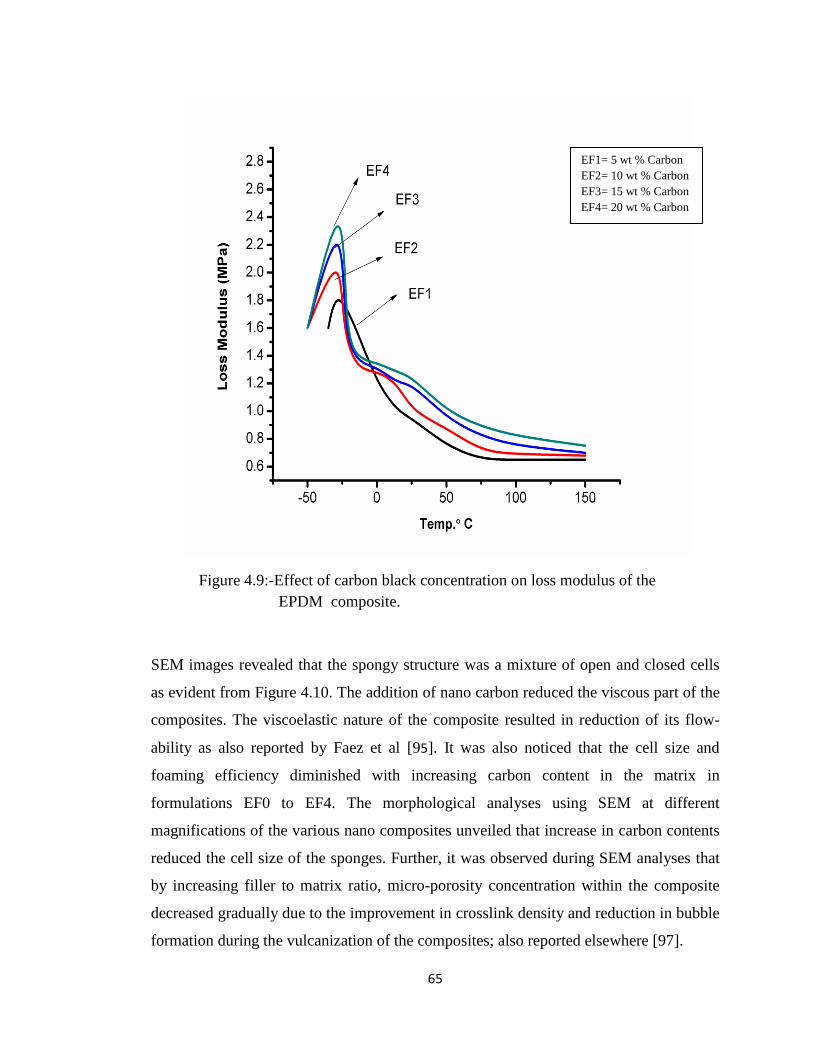
65
Figure 4.9:-Effect of carbon black concentration on loss modulus of the
EPDM composite.
SEM images revealed that the spongy structure was a mixture of open and closed cells
as evident from Figure 4.10. The addition of nano carbon reduced the viscous part of the
composites. The viscoelastic nature of the composite resulted in reduction of its flow-
ability as also reported by Faez et al [95]. It was also noticed that the cell size and
foaming efficiency diminished with increasing carbon content in the matrix in
formulations EF0 to EF4. The morphological analyses using SEM at different
magnifications of the various nano composites unveiled that increase in carbon contents
reduced the cell size of the sponges. Further, it was observed during SEM analyses that
by increasing filler to matrix ratio, micro-porosity concentration within the composite
decreased gradually due to the improvement in crosslink density and reduction in bubble
formation during the vulcanization of the composites; also reported elsewhere [97].
EF1= 5 wt % Carbon
EF2= 10 wt % Carbon
EF3= 15 wt % Carbon
EF4= 20 wt % Carbon
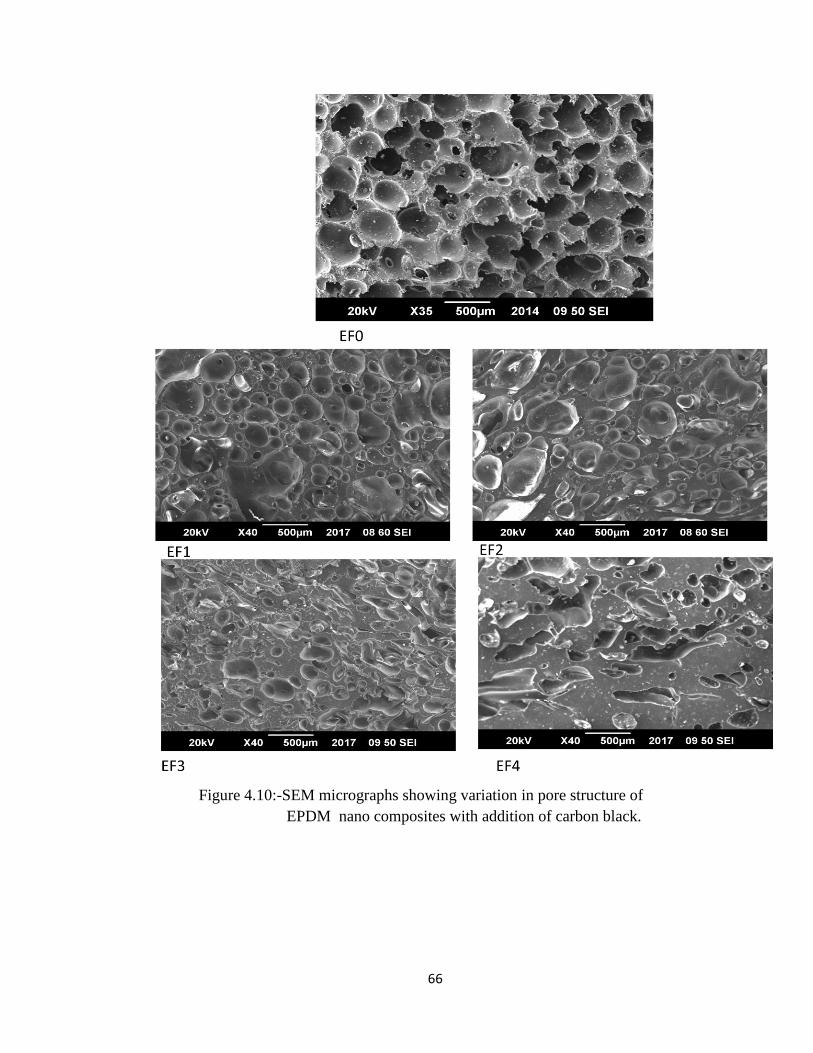
66
Figure 4.10:-SEM micrographs showing variation in pore structure of
EPDM nano composites with addition of carbon black.
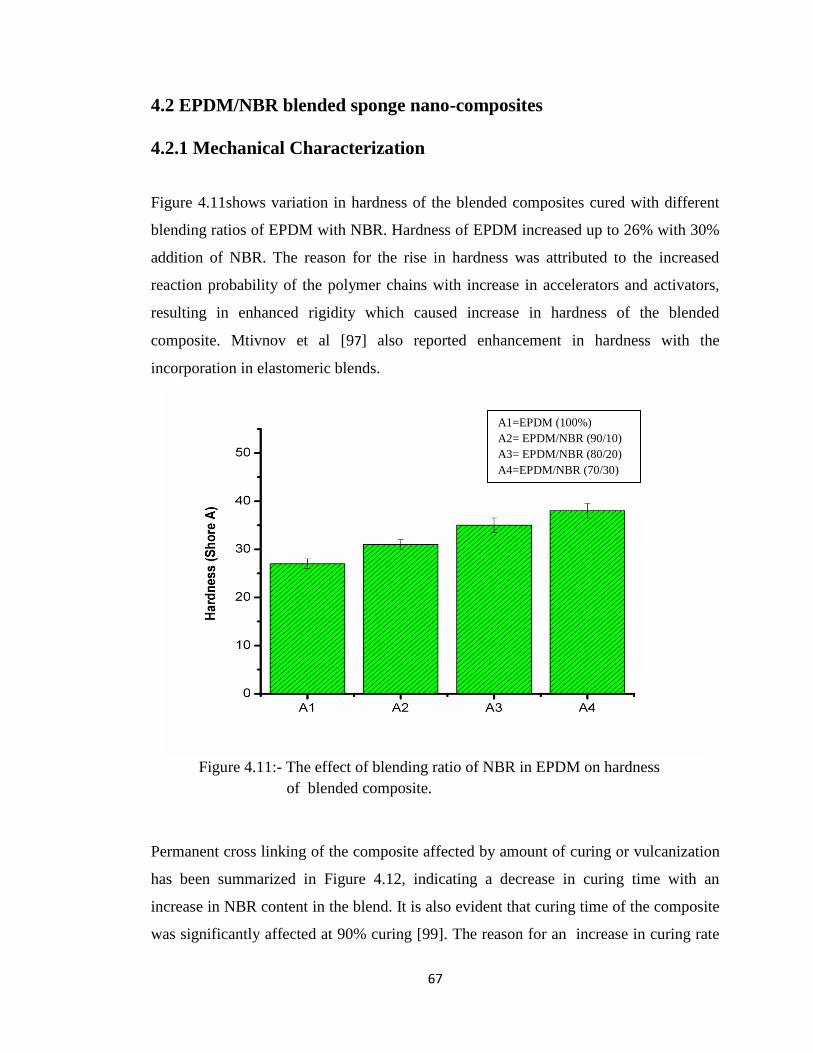
67
4.2 EPDM/NBR blended sponge nano-composites
4.2.1 Mechanical Characterization
Figure 4.11shows variation in hardness of the blended composites cured with different
blending ratios of EPDM with NBR. Hardness of EPDM increased up to 26% with 30%
addition of NBR. The reason for the rise in hardness was attributed to the increased
reaction probability of the polymer chains with increase in accelerators and activators,
resulting in enhanced rigidity which caused increase in hardness of the blended
composite. Mtivnov et al [97] also reported enhancement in hardness with the
incorporation in elastomeric blends.
Figure 4.11:- The effect of blending ratio of NBR in EPDM on hardness
of blended composite.
Permanent cross linking of the composite affected by amount of curing or vulcanization
has been summarized in Figure 4.12, indicating a decrease in curing time with an
increase in NBR content in the blend. It is also evident that curing time of the composite
was significantly affected at 90% curing [99]. The reason for an increase in curing rate
A1=EPDM (100%)
A2= EPDM/NBR (90/10)
A3= EPDM/NBR (80/20)
A4=EPDM/NBR (70/30)
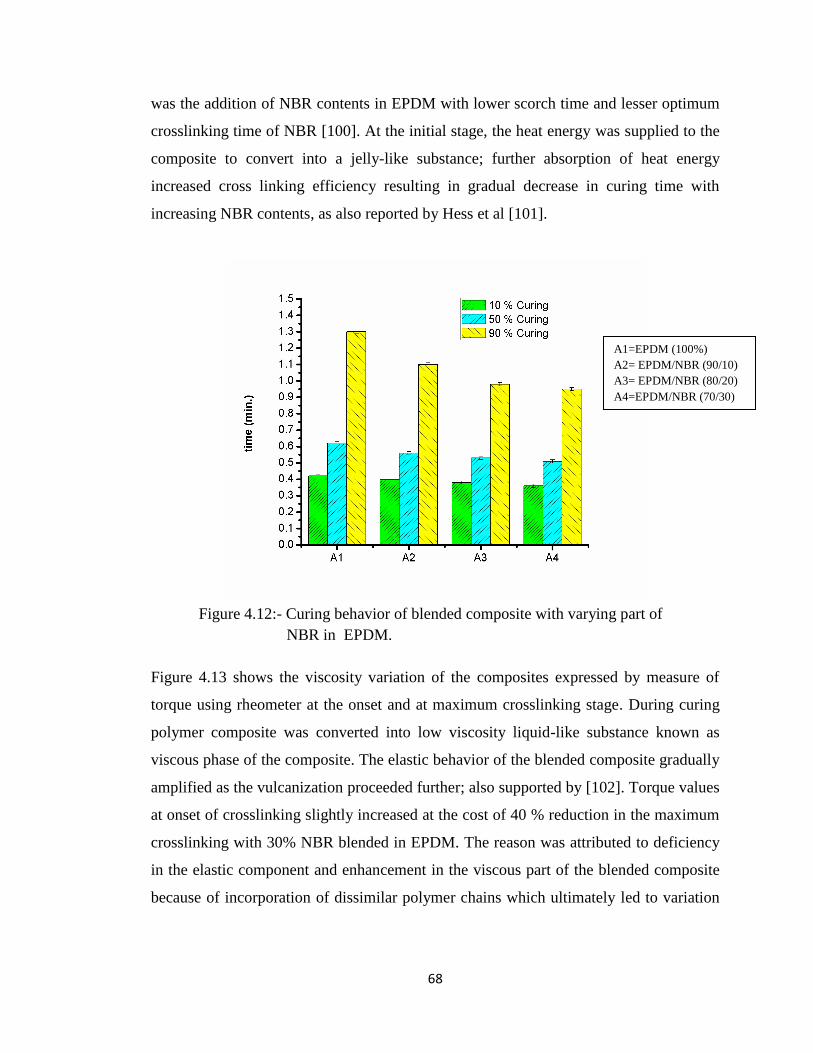
68
was the addition of NBR contents in EPDM with lower scorch time and lesser optimum
crosslinking time of NBR [100]. At the initial stage, the heat energy was supplied to the
composite to convert into a jelly-like substance; further absorption of heat energy
increased cross linking efficiency resulting in gradual decrease in curing time with
increasing NBR contents, as also reported by Hess et al [101].
Figure 4.12:- Curing behavior of blended composite with varying part of
NBR in EPDM.
Figure 4.13 shows the viscosity variation of the composites expressed by measure of
torque using rheometer at the onset and at maximum crosslinking stage. During curing
polymer composite was converted into low viscosity liquid-like substance known as
viscous phase of the composite. The elastic behavior of the blended composite gradually
amplified as the vulcanization proceeded further; also supported by [102]. Torque values
at onset of crosslinking slightly increased at the cost of 40 % reduction in the maximum
crosslinking with 30% NBR blended in EPDM. The reason was attributed to deficiency
in the elastic component and enhancement in the viscous part of the blended composite
because of incorporation of dissimilar polymer chains which ultimately led to variation
A1=EPDM (100%)
A2= EPDM/NBR (90/10)
A3= EPDM/NBR (80/20)
A4=EPDM/NBR (70/30)
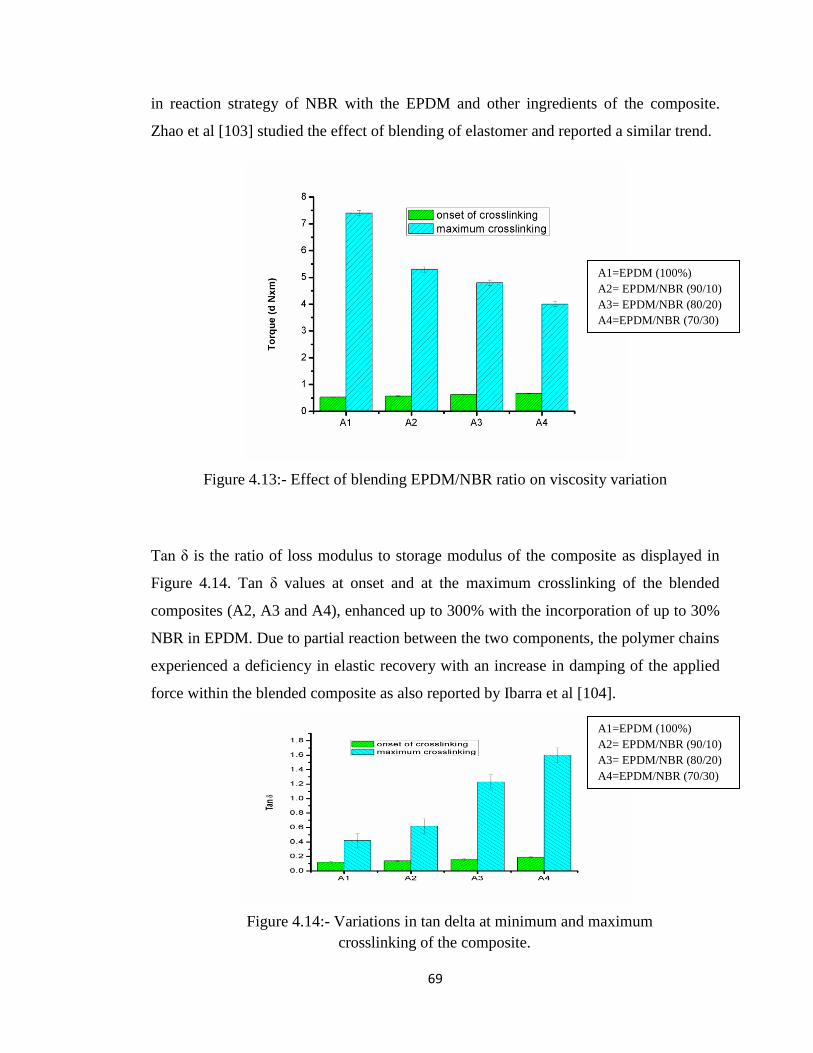
69
in reaction strategy of NBR with the EPDM and other ingredients of the composite.
Zhao et al [103] studied the effect of blending of elastomer and reported a similar trend.
Figure 4.13:- Effect of blending EPDM/NBR ratio on viscosity variation
Tan δ is the ratio of loss modulus to storage modulus of the composite as displayed in
Figure 4.14. Tan δ values at onset and at the maximum crosslinking of the blended
composites (A2, A3 and A4), enhanced up to 300% with the incorporation of up to 30%
NBR in EPDM. Due to partial reaction between the two components, the polymer chains
experienced a deficiency in elastic recovery with an increase in damping of the applied
force within the blended composite as also reported by Ibarra et al [104].
Figure 4.14:- Variations in tan delta at minimum and maximum
crosslinking of the composite.
A1=EPDM (100%)
A2= EPDM/NBR (90/10)
A3= EPDM/NBR (80/20)
A4=EPDM/NBR (70/30)
A1=EPDM (100%)
A2= EPDM/NBR (90/10)
A3= EPDM/NBR (80/20)
A4=EPDM/NBR (70/30)
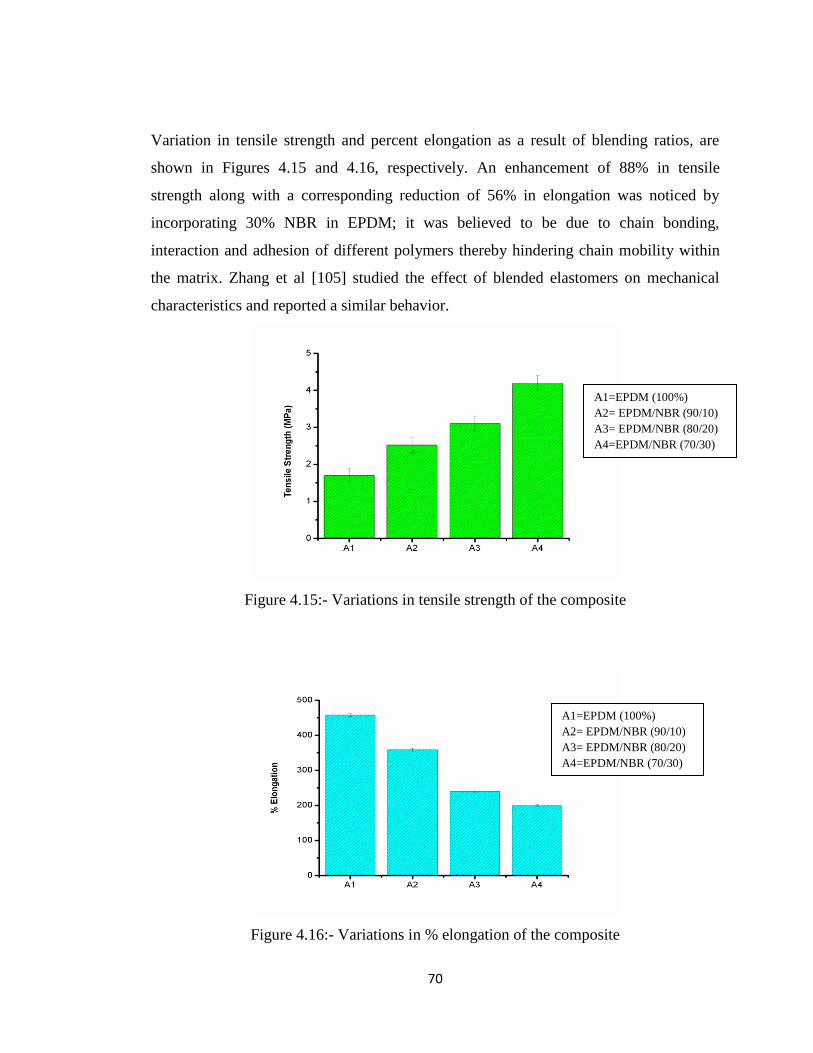
70
Variation in tensile strength and percent elongation as a result of blending ratios, are
shown in Figures 4.15 and 4.16, respectively. An enhancement of 88% in tensile
strength along with a corresponding reduction of 56% in elongation was noticed by
incorporating 30% NBR in EPDM; it was believed to be due to chain bonding,
interaction and adhesion of different polymers thereby hindering chain mobility within
the matrix. Zhang et al [105] studied the effect of blended elastomers on mechanical
characteristics and reported a similar behavior.
Figure 4.15:- Variations in tensile strength of the composite
Figure 4.16:- Variations in % elongation of the composite
A1=EPDM (100%)
A2= EPDM/NBR (90/10)
A3= EPDM/NBR (80/20)
A4=EPDM/NBR (70/30)
A1=EPDM (100%)
A2= EPDM/NBR (90/10)
A3= EPDM/NBR (80/20)
A4=EPDM/NBR (70/30)
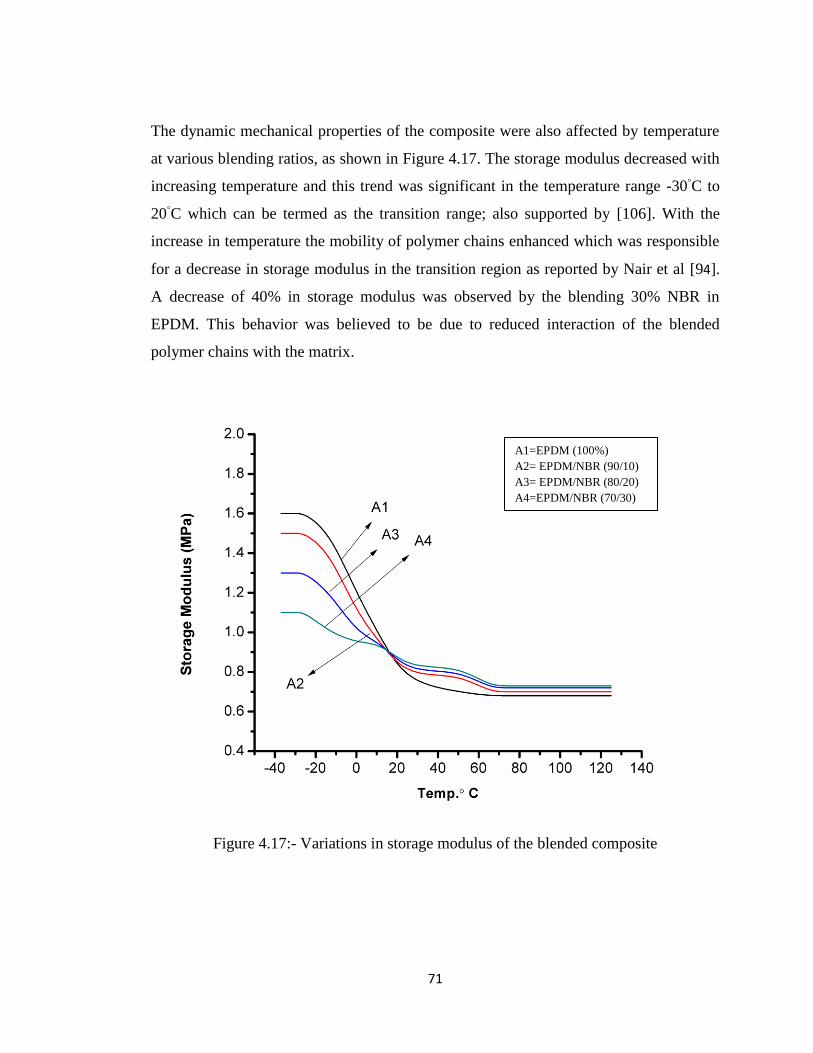
71
The dynamic mechanical properties of the composite were also affected by temperature
at various blending ratios, as shown in Figure 4.17. The storage modulus decreased with
increasing temperature and this trend was significant in the temperature range -30◦C to
20◦C which can be termed as the transition range; also supported by [106]. With the
increase in temperature the mobility of polymer chains enhanced which was responsible
for a decrease in storage modulus in the transition region as reported by Nair et al [94].
A decrease of 40% in storage modulus was observed by the blending 30% NBR in
EPDM. This behavior was believed to be due to reduced interaction of the blended
polymer chains with the matrix.
Figure 4.17:- Variations in storage modulus of the blended composite
A1=EPDM (100%)
A2= EPDM/NBR (90/10)
A3= EPDM/NBR (80/20)
A4=EPDM/NBR (70/30)
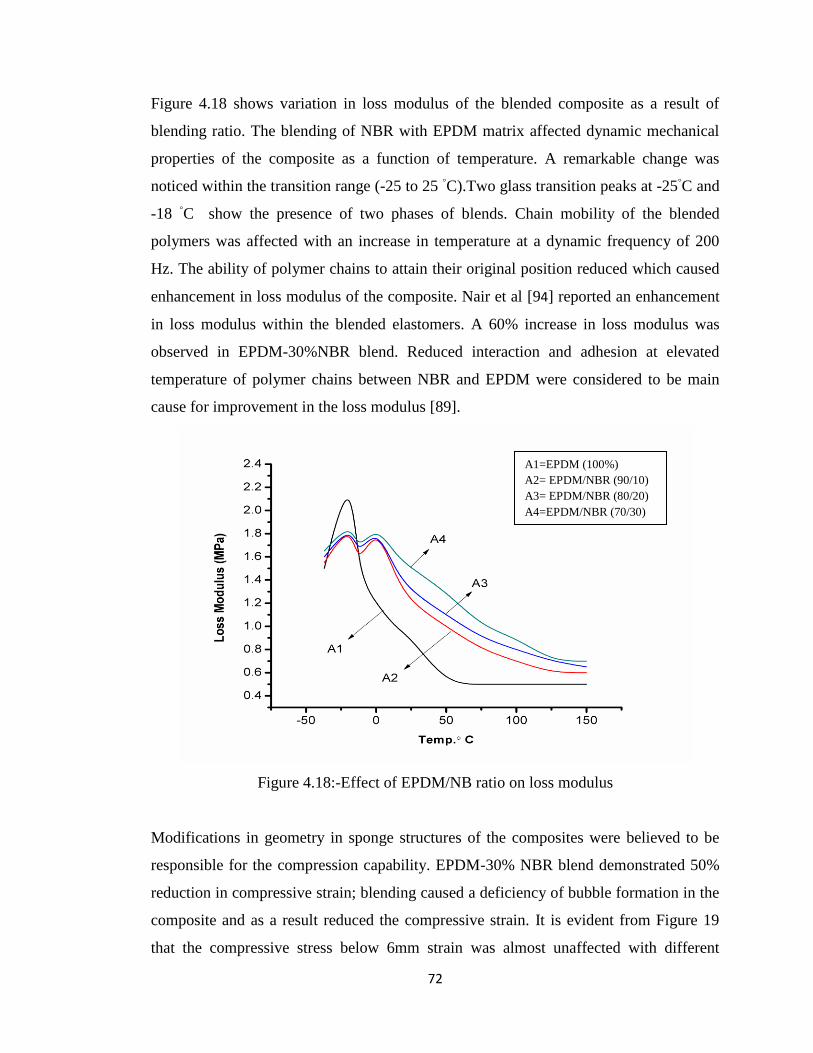
72
Figure 4.18 shows variation in loss modulus of the blended composite as a result of
blending ratio. The blending of NBR with EPDM matrix affected dynamic mechanical
properties of the composite as a function of temperature. A remarkable change was
noticed within the transition range (-25 to 25 ◦C).Two glass transition peaks at -25
◦C and
-18 ◦C show the presence of two phases of blends. Chain mobility of the blended
polymers was affected with an increase in temperature at a dynamic frequency of 200
Hz. The ability of polymer chains to attain their original position reduced which caused
enhancement in loss modulus of the composite. Nair et al [94] reported an enhancement
in loss modulus within the blended elastomers. A 60% increase in loss modulus was
observed in EPDM-30%NBR blend. Reduced interaction and adhesion at elevated
temperature of polymer chains between NBR and EPDM were considered to be main
cause for improvement in the loss modulus [89].
Figure 4.18:-Effect of EPDM/NB ratio on loss modulus
Modifications in geometry in sponge structures of the composites were believed to be
responsible for the compression capability. EPDM-30% NBR blend demonstrated 50%
reduction in compressive strain; blending caused a deficiency of bubble formation in the
composite and as a result reduced the compressive strain. It is evident from Figure 19
that the compressive stress below 6mm strain was almost unaffected with different
A1=EPDM (100%)
A2= EPDM/NBR (90/10)
A3= EPDM/NBR (80/20)
A4=EPDM/NBR (70/30)

73
blending ratios; the analogy was also supported by another researcher [107]. However,
an elastic response was also noticed in this regime along with an increase in stress;
buckling of cells was initiated and behavior of the composites was altered depending
upon the blending ratio, cell size, crosslink density, and sponge density. Puskas [108]
reported a similar trend during compression of elastomeric blends. The accelerating
stress caused buckled cell walls to contact each other till complete densification of the
sponge structures occurred.
Figure 4.19:-Load-compression curves of various EPDM/NBR blends
The energy absorption of the composite is dependent on the sponge structures within the
composite as shown in Figure 4.20. The blending caused up to12 % loss in capability of
energy absorption for a blend of 30% NBR in EPDM, which was also evident from a
decline in bubble formation by blending. Dumolin et al [109] studied the variation in
impact energy absorbance within the blended elastomeric composites and reported
similar behavior.
A1=EPDM (100%)
A2= EPDM/NBR (90/10)
A3= EPDM/NBR (80/20)
A4=EPDM/NBR (70/30)
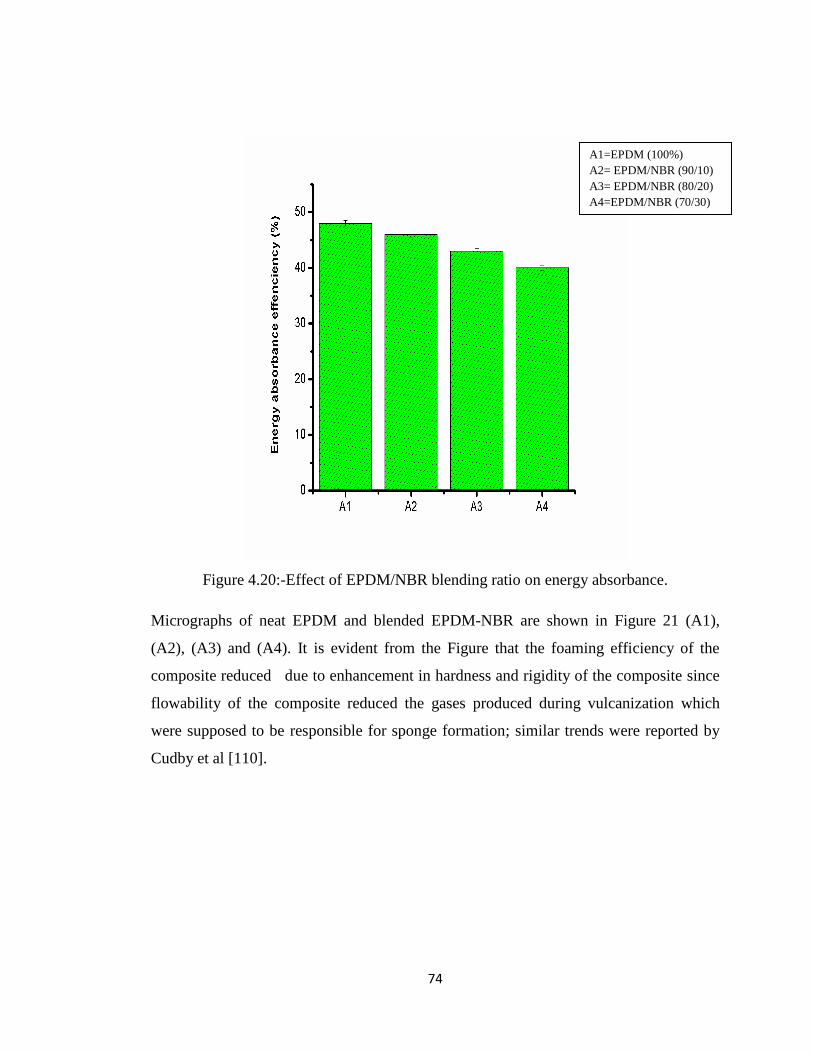
74
Figure 4.20:-Effect of EPDM/NBR blending ratio on energy absorbance.
Micrographs of neat EPDM and blended EPDM-NBR are shown in Figure 21 (A1),
(A2), (A3) and (A4). It is evident from the Figure that the foaming efficiency of the
composite reduced due to enhancement in hardness and rigidity of the composite since
flowability of the composite reduced the gases produced during vulcanization which
were supposed to be responsible for sponge formation; similar trends were reported by
Cudby et al [110].
A1=EPDM (100%)
A2= EPDM/NBR (90/10)
A3= EPDM/NBR (80/20)
A4=EPDM/NBR (70/30)
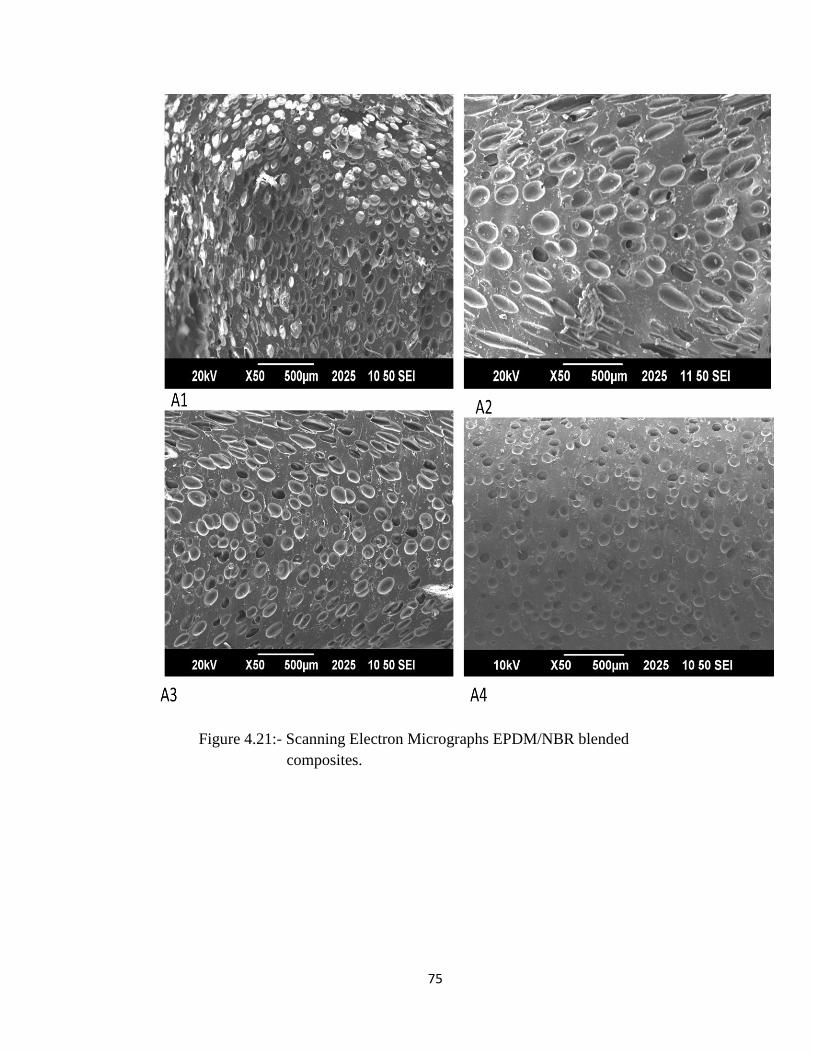
75
Figure 4.21:- Scanning Electron Micrographs EPDM/NBR blended
composites.
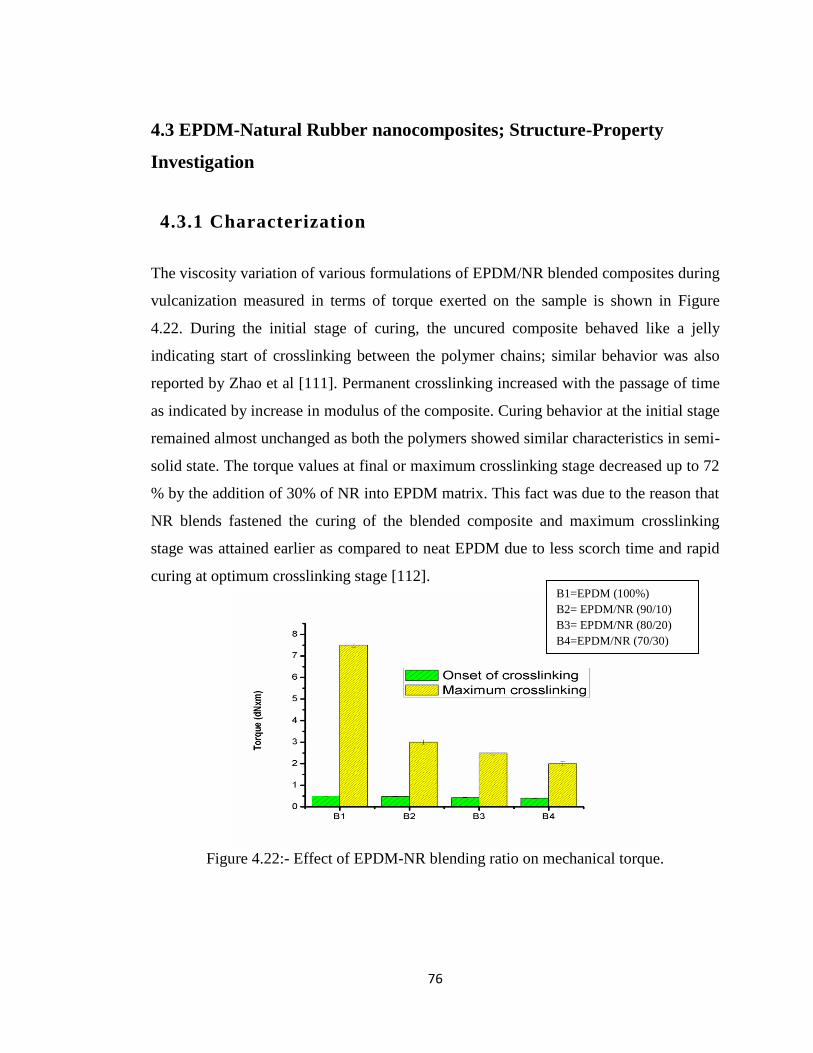
76
4.3 EPDM-Natural Rubber nanocomposites; Structure-Property
Investigation
4.3.1 Characterization
The viscosity variation of various formulations of EPDM/NR blended composites during
vulcanization measured in terms of torque exerted on the sample is shown in Figure
4.22. During the initial stage of curing, the uncured composite behaved like a jelly
indicating start of crosslinking between the polymer chains; similar behavior was also
reported by Zhao et al [111]. Permanent crosslinking increased with the passage of time
as indicated by increase in modulus of the composite. Curing behavior at the initial stage
remained almost unchanged as both the polymers showed similar characteristics in semi-
solid state. The torque values at final or maximum crosslinking stage decreased up to 72
% by the addition of 30% of NR into EPDM matrix. This fact was due to the reason that
NR blends fastened the curing of the blended composite and maximum crosslinking
stage was attained earlier as compared to neat EPDM due to less scorch time and rapid
curing at optimum crosslinking stage [112].
Figure 4.22:- Effect of EPDM-NR blending ratio on mechanical torque.
B1=EPDM (100%)
B2= EPDM/NR (90/10)
B3= EPDM/NR (80/20)
B4=EPDM/NR (70/30)
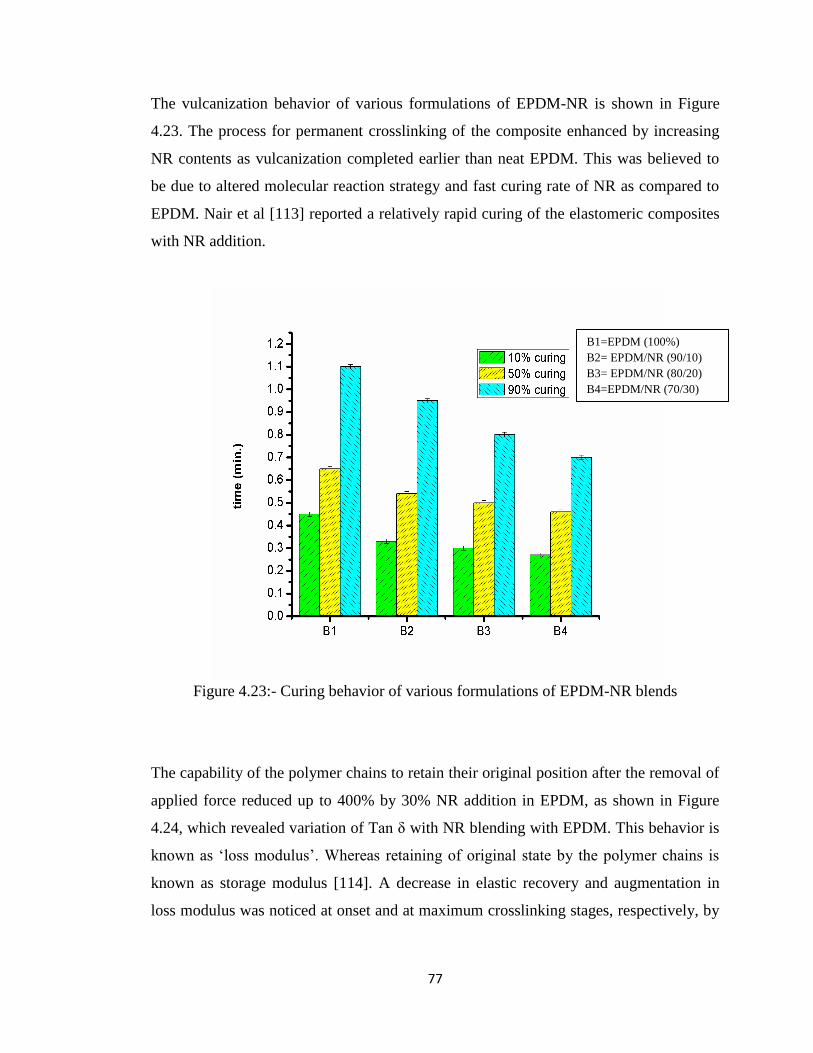
77
The vulcanization behavior of various formulations of EPDM-NR is shown in Figure
4.23. The process for permanent crosslinking of the composite enhanced by increasing
NR contents as vulcanization completed earlier than neat EPDM. This was believed to
be due to altered molecular reaction strategy and fast curing rate of NR as compared to
EPDM. Nair et al [113] reported a relatively rapid curing of the elastomeric composites
with NR addition.
Figure 4.23:- Curing behavior of various formulations of EPDM-NR blends
The capability of the polymer chains to retain their original position after the removal of
applied force reduced up to 400% by 30% NR addition in EPDM, as shown in Figure
4.24, which revealed variation of Tan δ with NR blending with EPDM. This behavior is
known as „loss modulus‟. Whereas retaining of original state by the polymer chains is
known as storage modulus [114]. A decrease in elastic recovery and augmentation in
loss modulus was noticed at onset and at maximum crosslinking stages, respectively, by
B1=EPDM (100%)
B2= EPDM/NR (90/10)
B3= EPDM/NR (80/20)
B4=EPDM/NR (70/30)
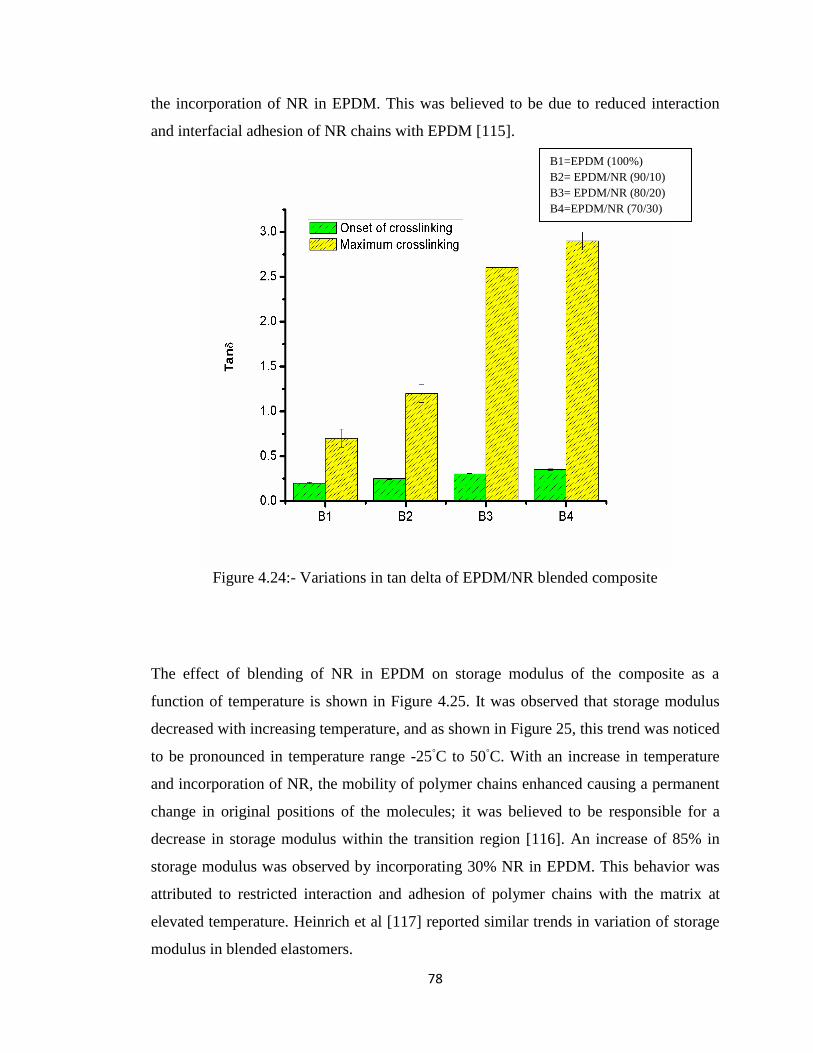
78
the incorporation of NR in EPDM. This was believed to be due to reduced interaction
and interfacial adhesion of NR chains with EPDM [115].
Figure 4.24:- Variations in tan delta of EPDM/NR blended composite
The effect of blending of NR in EPDM on storage modulus of the composite as a
function of temperature is shown in Figure 4.25. It was observed that storage modulus
decreased with increasing temperature, and as shown in Figure 25, this trend was noticed
to be pronounced in temperature range -25◦C to 50
◦C. With an increase in temperature
and incorporation of NR, the mobility of polymer chains enhanced causing a permanent
change in original positions of the molecules; it was believed to be responsible for a
decrease in storage modulus within the transition region [116]. An increase of 85% in
storage modulus was observed by incorporating 30% NR in EPDM. This behavior was
attributed to restricted interaction and adhesion of polymer chains with the matrix at
elevated temperature. Heinrich et al [117] reported similar trends in variation of storage
modulus in blended elastomers.
B1=EPDM (100%)
B2= EPDM/NR (90/10)
B3= EPDM/NR (80/20)
B4=EPDM/NR (70/30)
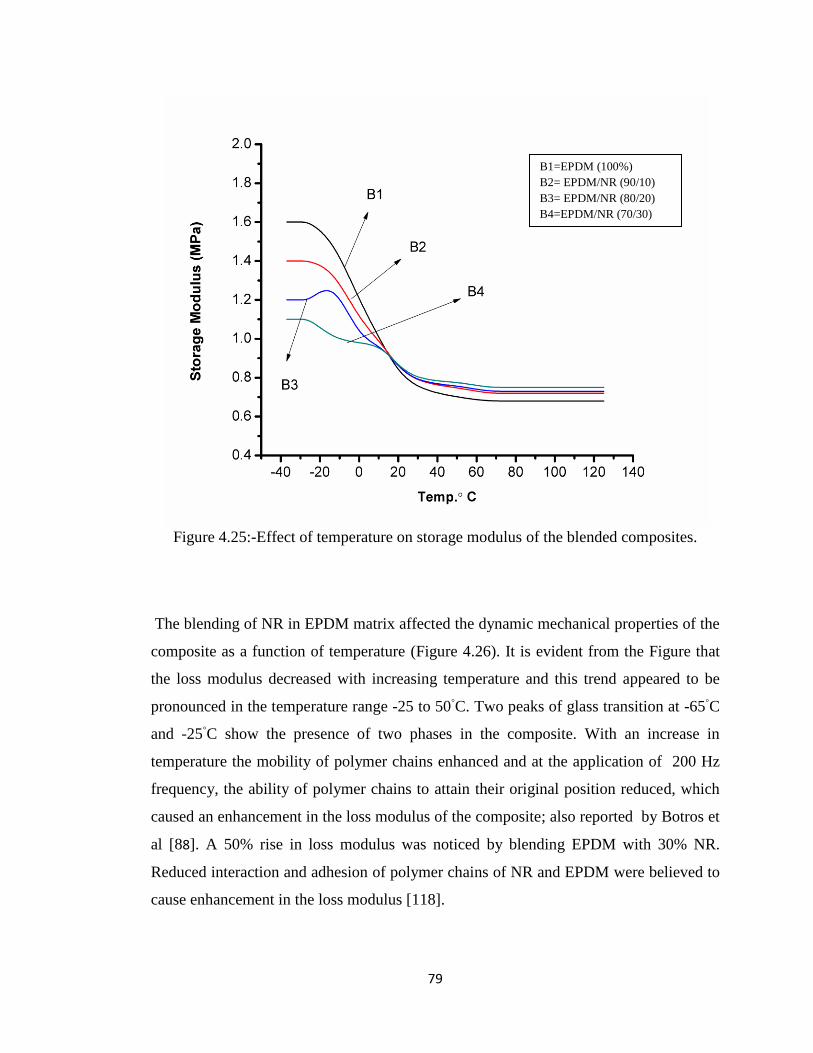
79
Figure 4.25:-Effect of temperature on storage modulus of the blended composites.
The blending of NR in EPDM matrix affected the dynamic mechanical properties of the
composite as a function of temperature (Figure 4.26). It is evident from the Figure that
the loss modulus decreased with increasing temperature and this trend appeared to be
pronounced in the temperature range -25 to 50◦C. Two peaks of glass transition at -65
◦C
and -25◦C show the presence of two phases in the composite. With an increase in
temperature the mobility of polymer chains enhanced and at the application of 200 Hz
frequency, the ability of polymer chains to attain their original position reduced, which
caused an enhancement in the loss modulus of the composite; also reported by Botros et
al [88]. A 50% rise in loss modulus was noticed by blending EPDM with 30% NR.
Reduced interaction and adhesion of polymer chains of NR and EPDM were believed to
cause enhancement in the loss modulus [118].
B1=EPDM (100%)
B2= EPDM/NR (90/10)
B3= EPDM/NR (80/20)
B4=EPDM/NR (70/30)
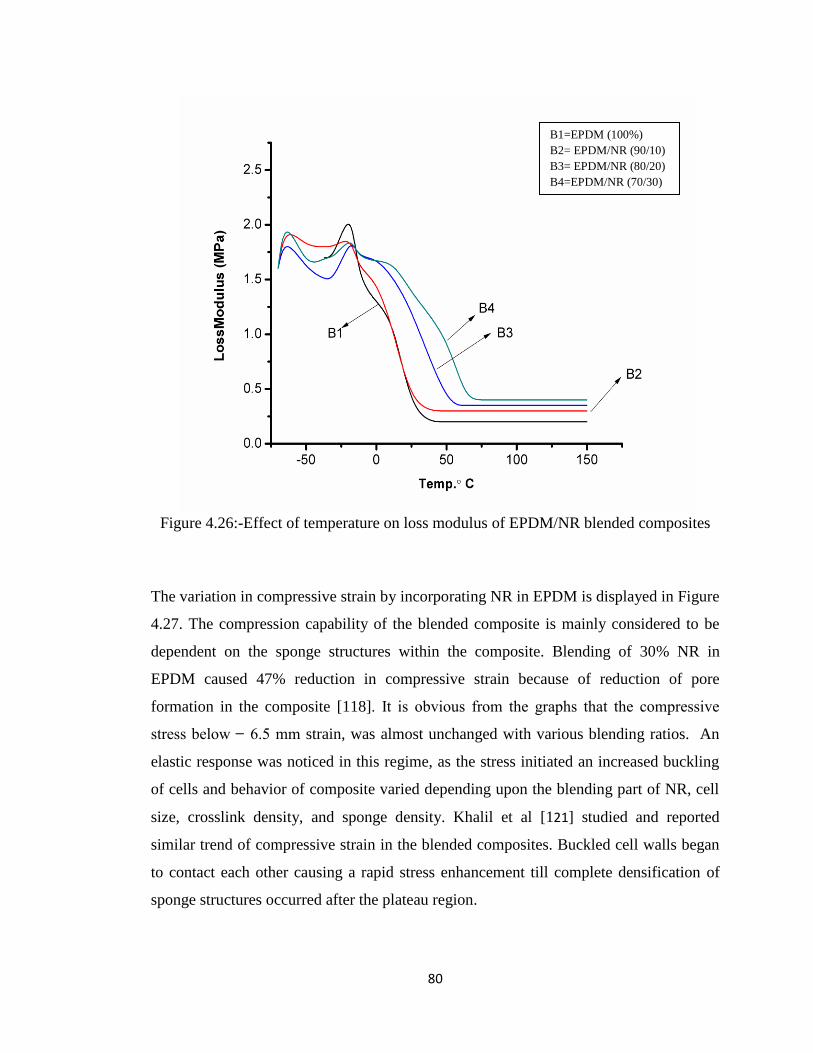
80
Figure 4.26:-Effect of temperature on loss modulus of EPDM/NR blended composites
The variation in compressive strain by incorporating NR in EPDM is displayed in Figure
4.27. The compression capability of the blended composite is mainly considered to be
dependent on the sponge structures within the composite. Blending of 30% NR in
EPDM caused 47% reduction in compressive strain because of reduction of pore
formation in the composite [118]. It is obvious from the graphs that the compressive
stress below 6.5 mm strain, was almost unchanged with various blending ratios. An
elastic response was noticed in this regime, as the stress initiated an increased buckling
of cells and behavior of composite varied depending upon the blending part of NR, cell
size, crosslink density, and sponge density. Khalil et al [121] studied and reported
similar trend of compressive strain in the blended composites. Buckled cell walls began
to contact each other causing a rapid stress enhancement till complete densification of
sponge structures occurred after the plateau region.
B1=EPDM (100%)
B2= EPDM/NR (90/10)
B3= EPDM/NR (80/20)
B4=EPDM/NR (70/30)

81
Figure 4.27:-Effect of EPDM/NR blending ratio on compressive strain of
blended composites.
Figure 4.28 elucidates variation in hardness of the composite with various
blending ratios of NR and EPDM. It is evident from the Figure 4.28 that
hardness of the samples increased up to 15% with 30% addition of NR.
This augmentation in hardness was believed to be due to the fa ct that
polymer chains of multiple base components have more reaction
probability with the accelerators and activators to enhance the rigidity
[120] which causes the enhancement of indentation resistance of the
blended composite, as also reported by Mager et al [122] with similar
trend.
B1=EPDM (100%)
B2= EPDM/NR (90/10)
B3= EPDM/NR (80/20)
B4=EPDM/NR (70/30)
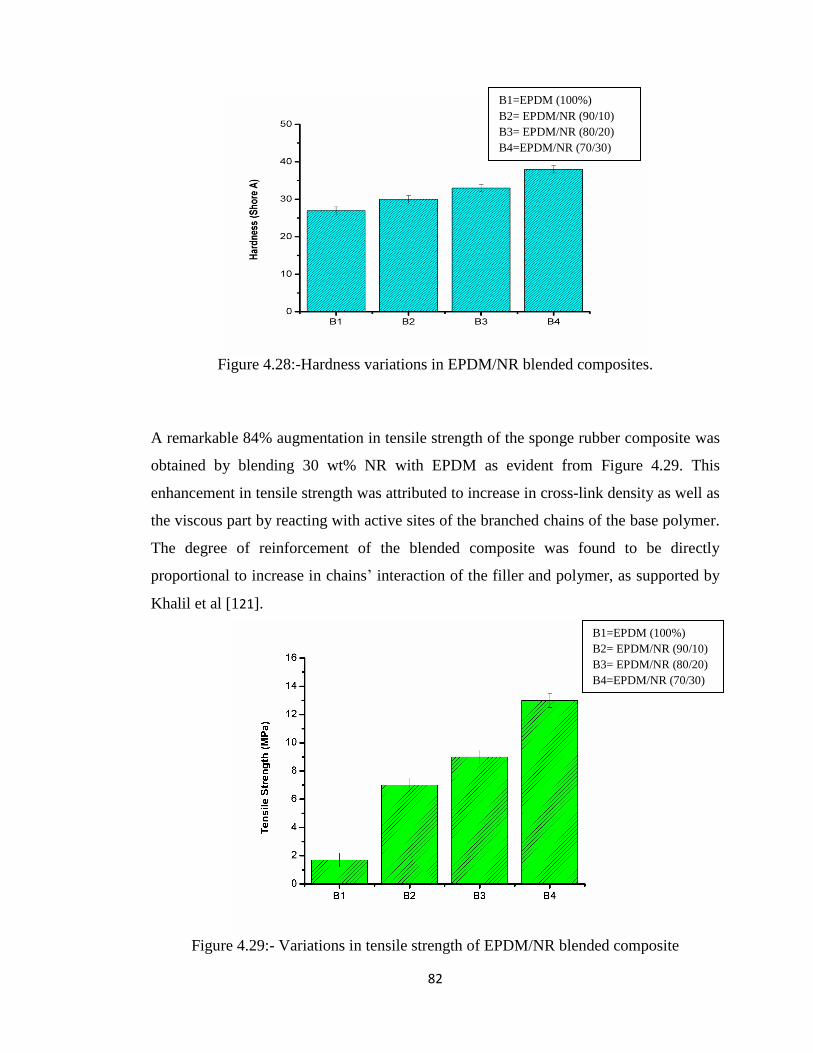
82
Figure 4.28:-Hardness variations in EPDM/NR blended composites.
A remarkable 84% augmentation in tensile strength of the sponge rubber composite was
obtained by blending 30 wt% NR with EPDM as evident from Figure 4.29. This
enhancement in tensile strength was attributed to increase in cross-link density as well as
the viscous part by reacting with active sites of the branched chains of the base polymer.
The degree of reinforcement of the blended composite was found to be directly
proportional to increase in chains‟ interaction of the filler and polymer, as supported by
Khalil et al [121].
Figure 4.29:- Variations in tensile strength of EPDM/NR blended composite
B1=EPDM (100%)
B2= EPDM/NR (90/10)
B3= EPDM/NR (80/20)
B4=EPDM/NR (70/30)
B1=EPDM (100%)
B2= EPDM/NR (90/10)
B3= EPDM/NR (80/20)
B4=EPDM/NR (70/30)
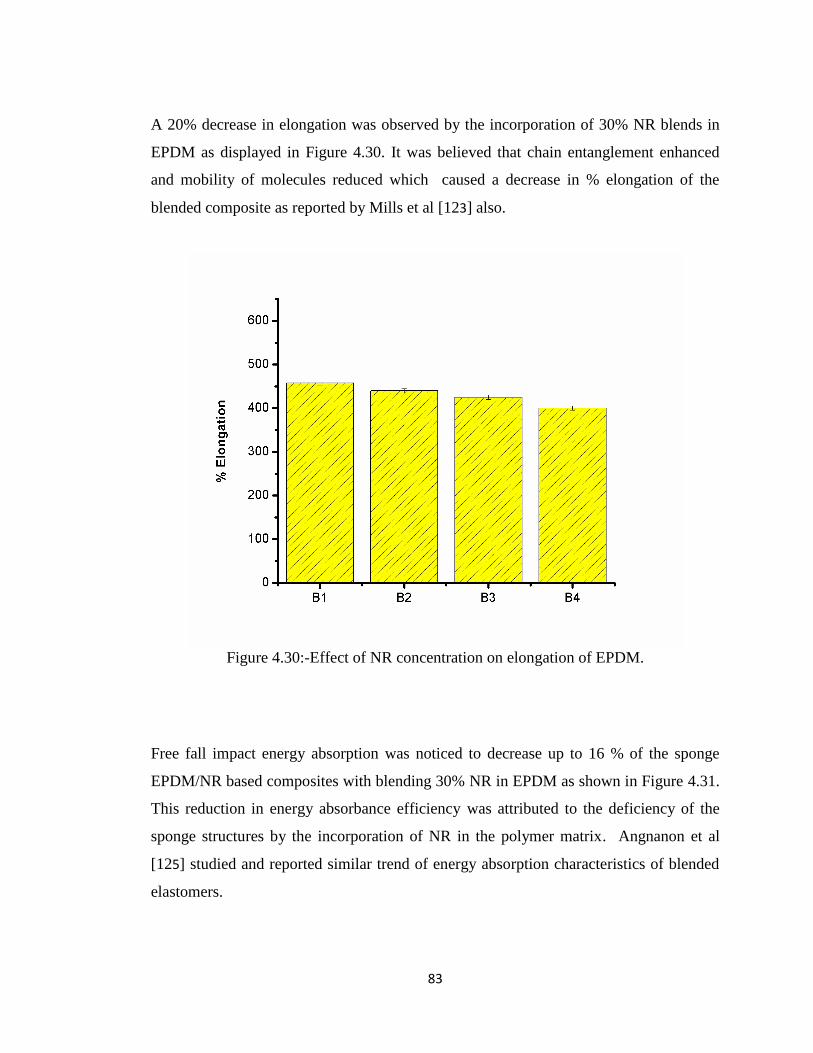
83
A 20% decrease in elongation was observed by the incorporation of 30% NR blends in
EPDM as displayed in Figure 4.30. It was believed that chain entanglement enhanced
and mobility of molecules reduced which caused a decrease in % elongation of the
blended composite as reported by Mills et al [123] also.
Figure 4.30:-Effect of NR concentration on elongation of EPDM.
Free fall impact energy absorption was noticed to decrease up to 16 % of the sponge
EPDM/NR based composites with blending 30% NR in EPDM as shown in Figure 4.31.
This reduction in energy absorbance efficiency was attributed to the deficiency of the
sponge structures by the incorporation of NR in the polymer matrix. Angnanon et al
[125] studied and reported similar trend of energy absorption characteristics of blended
elastomers.
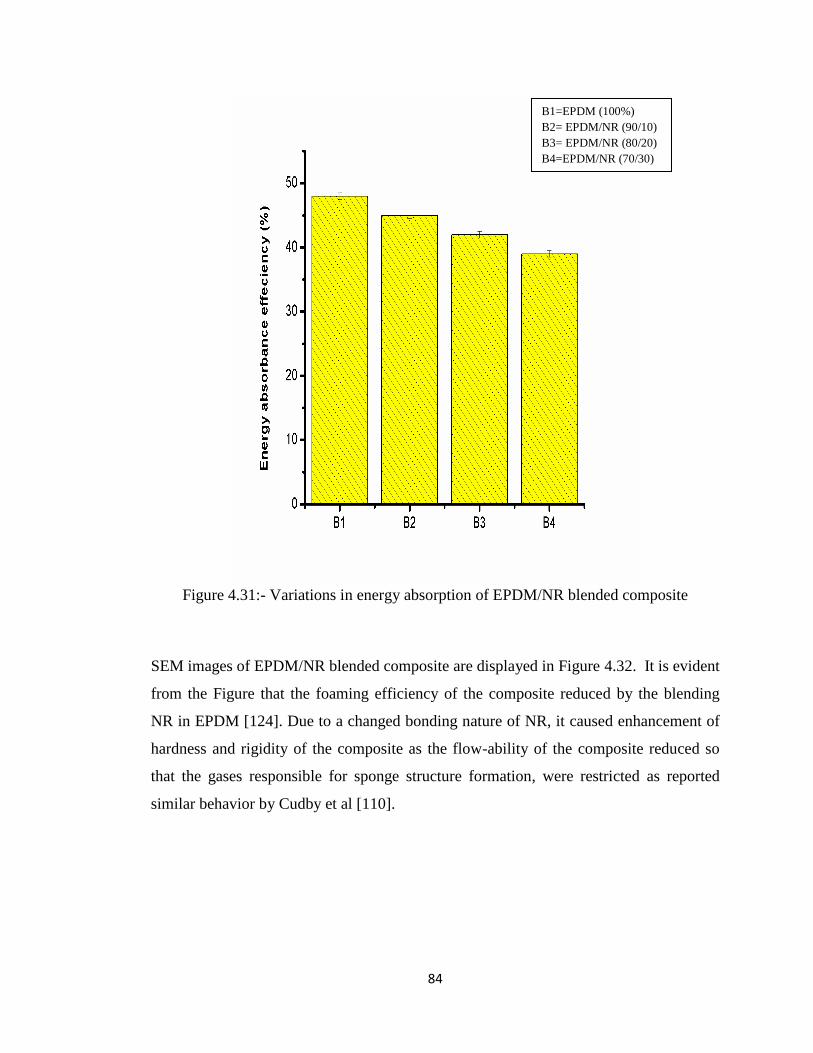
84
Figure 4.31:- Variations in energy absorption of EPDM/NR blended composite
SEM images of EPDM/NR blended composite are displayed in Figure 4.32. It is evident
from the Figure that the foaming efficiency of the composite reduced by the blending
NR in EPDM [124]. Due to a changed bonding nature of NR, it caused enhancement of
hardness and rigidity of the composite as the flow-ability of the composite reduced so
that the gases responsible for sponge structure formation, were restricted as reported
similar behavior by Cudby et al [110].
B1=EPDM (100%)
B2= EPDM/NR (90/10)
B3= EPDM/NR (80/20)
B4=EPDM/NR (70/30)
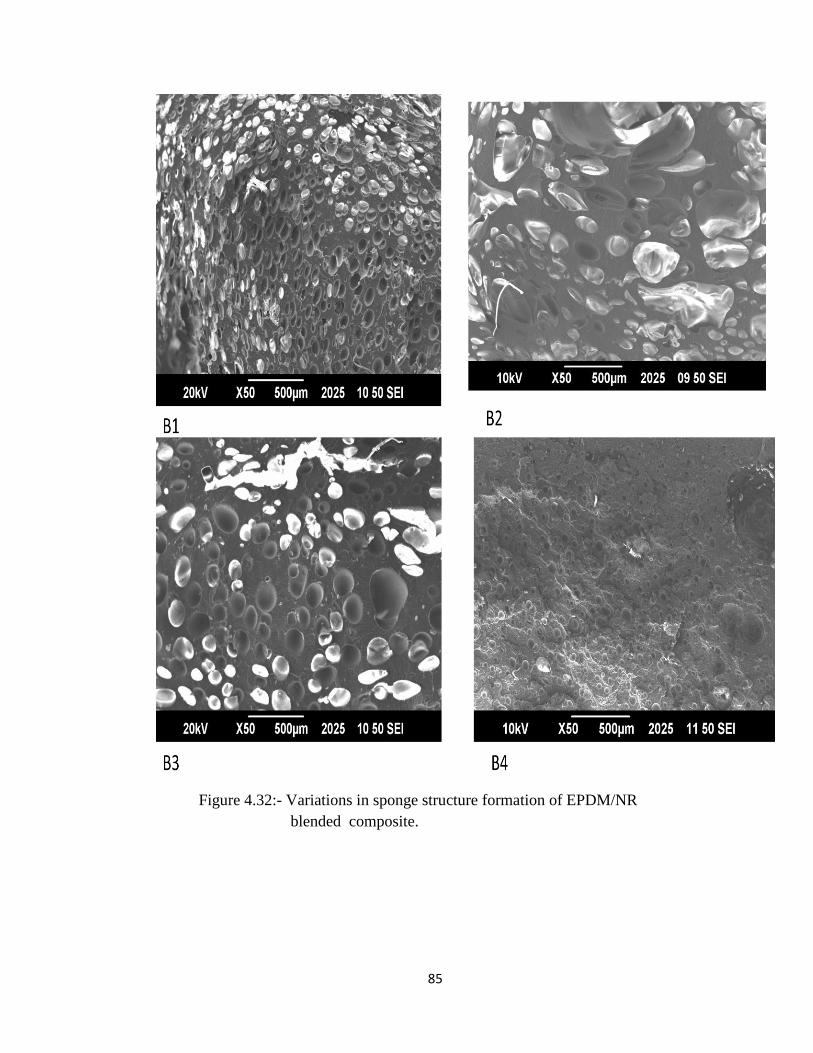
85
Figure 4.32:- Variations in sponge structure formation of EPDM/NR
blended composite.
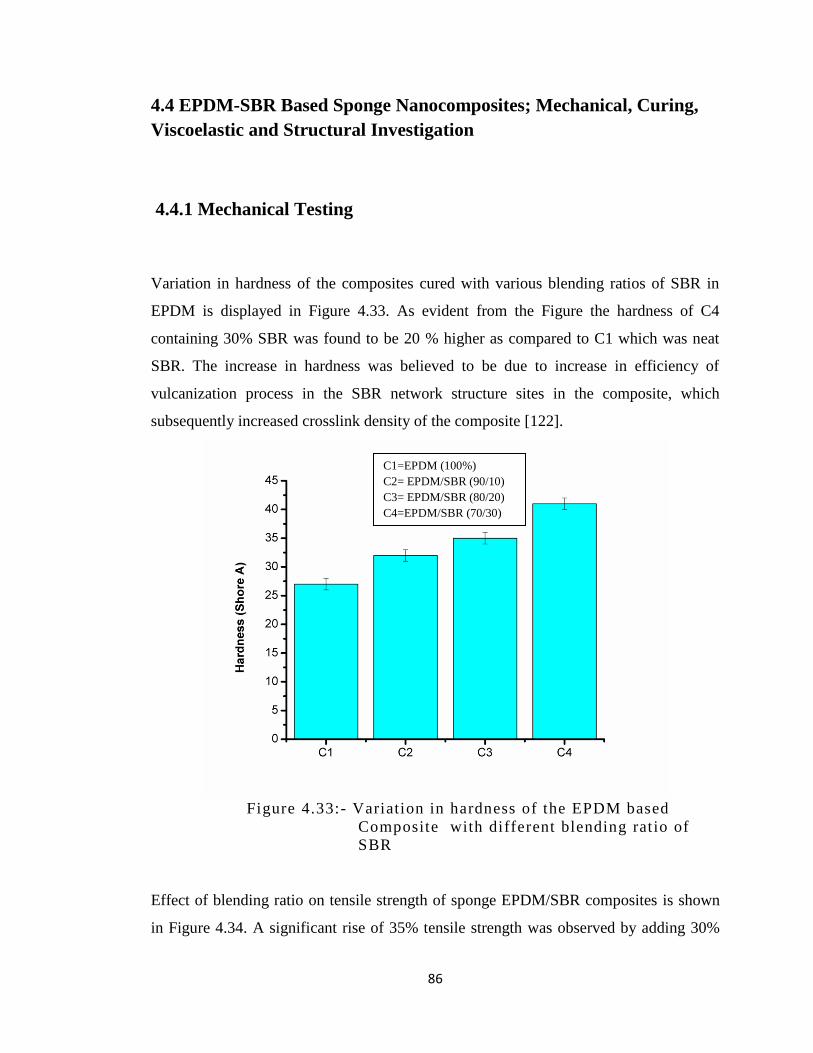
86
4.4 EPDM-SBR Based Sponge Nanocomposites; Mechanical, Curing,
Viscoelastic and Structural Investigation
4.4.1 Mechanical Testing
Variation in hardness of the composites cured with various blending ratios of SBR in
EPDM is displayed in Figure 4.33. As evident from the Figure the hardness of C4
containing 30% SBR was found to be 20 % higher as compared to C1 which was neat
SBR. The increase in hardness was believed to be due to increase in efficiency of
vulcanization process in the SBR network structure sites in the composite, which
subsequently increased crosslink density of the composite [122].
Figure 4.33:- Variation in hardness of the EPDM based
Composite with different blending ratio of
SBR
Effect of blending ratio on tensile strength of sponge EPDM/SBR composites is shown
in Figure 4.34. A significant rise of 35% tensile strength was observed by adding 30%
C1=EPDM (100%)
C2= EPDM/SBR (90/10)
C3= EPDM/SBR (80/20)
C4=EPDM/SBR (70/30)
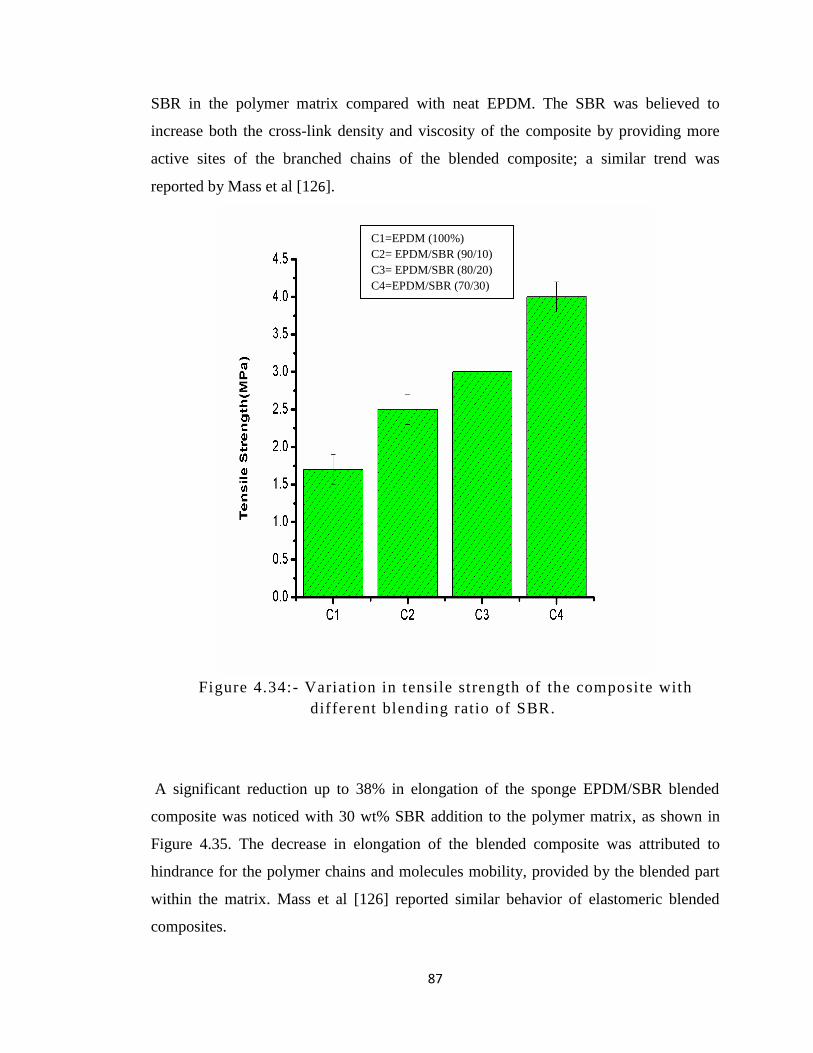
87
SBR in the polymer matrix compared with neat EPDM. The SBR was believed to
increase both the cross-link density and viscosity of the composite by providing more
active sites of the branched chains of the blended composite; a similar trend was
reported by Mass et al [126].
Figure 4.34:- Variation in tensile strength of the composite with
different blending ratio of SBR.
A significant reduction up to 38% in elongation of the sponge EPDM/SBR blended
composite was noticed with 30 wt% SBR addition to the polymer matrix, as shown in
Figure 4.35. The decrease in elongation of the blended composite was attributed to
hindrance for the polymer chains and molecules mobility, provided by the blended part
within the matrix. Mass et al [126] reported similar behavior of elastomeric blended
composites.
C1=EPDM (100%)
C2= EPDM/SBR (90/10)
C3= EPDM/SBR (80/20)
C4=EPDM/SBR (70/30)
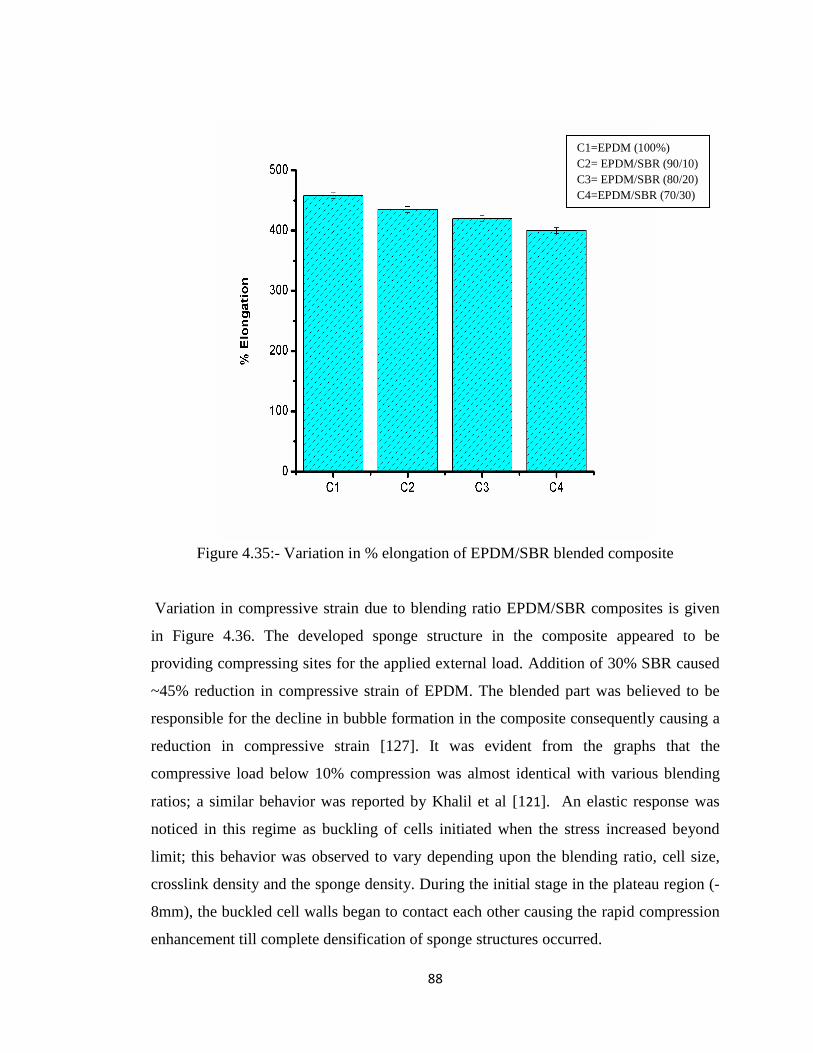
88
Figure 4.35:- Variation in % elongation of EPDM/SBR blended composite
Variation in compressive strain due to blending ratio EPDM/SBR composites is given
in Figure 4.36. The developed sponge structure in the composite appeared to be
providing compressing sites for the applied external load. Addition of 30% SBR caused
~45% reduction in compressive strain of EPDM. The blended part was believed to be
responsible for the decline in bubble formation in the composite consequently causing a
reduction in compressive strain [127]. It was evident from the graphs that the
compressive load below 10% compression was almost identical with various blending
ratios; a similar behavior was reported by Khalil et al [121]. An elastic response was
noticed in this regime as buckling of cells initiated when the stress increased beyond
limit; this behavior was observed to vary depending upon the blending ratio, cell size,
crosslink density and the sponge density. During the initial stage in the plateau region (-
8mm), the buckled cell walls began to contact each other causing the rapid compression
enhancement till complete densification of sponge structures occurred.
C1=EPDM (100%)
C2= EPDM/SBR (90/10)
C3= EPDM/SBR (80/20)
C4=EPDM/SBR (70/30)
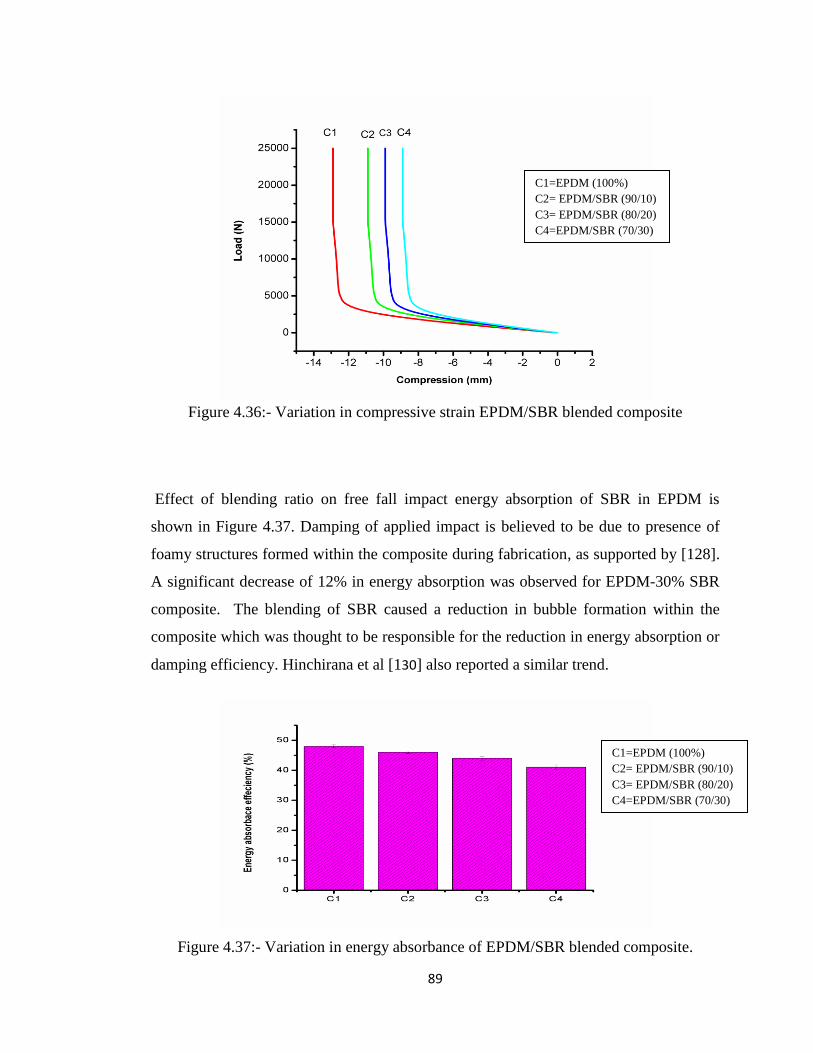
89
Figure 4.36:- Variation in compressive strain EPDM/SBR blended composite
Effect of blending ratio on free fall impact energy absorption of SBR in EPDM is
shown in Figure 4.37. Damping of applied impact is believed to be due to presence of
foamy structures formed within the composite during fabrication, as supported by [128].
A significant decrease of 12% in energy absorption was observed for EPDM-30% SBR
composite. The blending of SBR caused a reduction in bubble formation within the
composite which was thought to be responsible for the reduction in energy absorption or
damping efficiency. Hinchirana et al [130] also reported a similar trend.
Figure 4.37:- Variation in energy absorbance of EPDM/SBR blended composite.
C1=EPDM (100%)
C2= EPDM/SBR (90/10)
C3= EPDM/SBR (80/20)
C4=EPDM/SBR (70/30)
C1=EPDM (100%)
C2= EPDM/SBR (90/10)
C3= EPDM/SBR (80/20)
C4=EPDM/SBR (70/30)
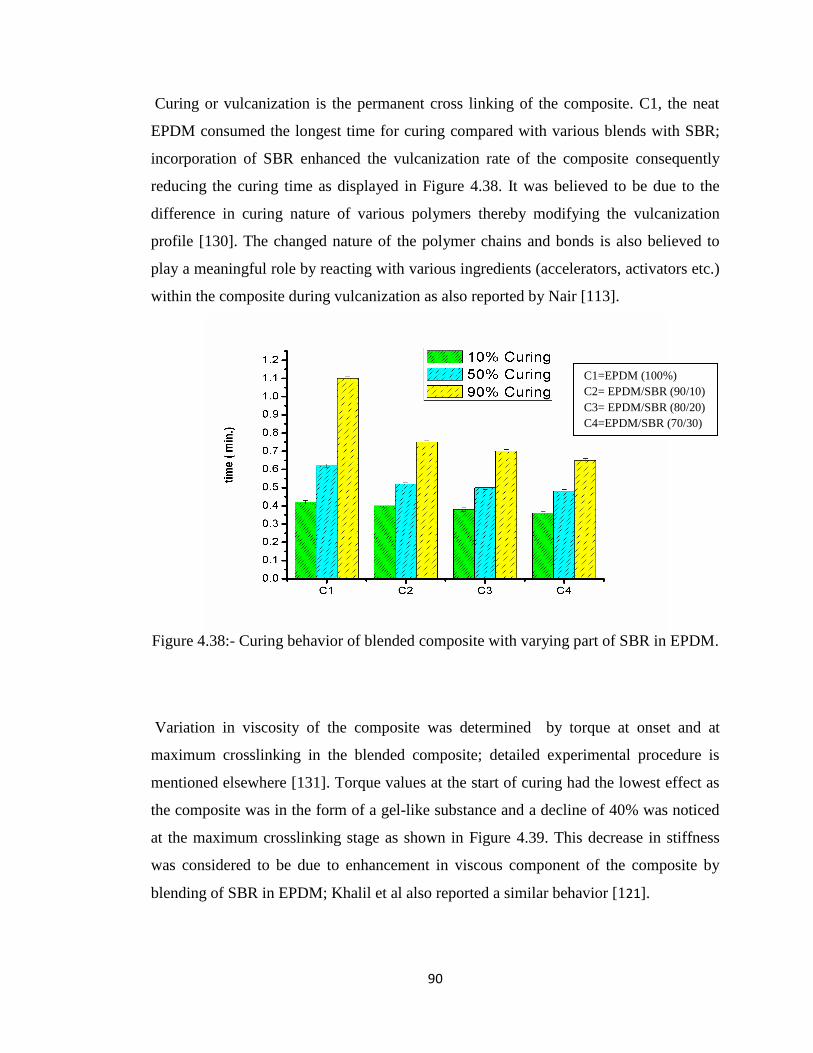
90
Curing or vulcanization is the permanent cross linking of the composite. C1, the neat
EPDM consumed the longest time for curing compared with various blends with SBR;
incorporation of SBR enhanced the vulcanization rate of the composite consequently
reducing the curing time as displayed in Figure 4.38. It was believed to be due to the
difference in curing nature of various polymers thereby modifying the vulcanization
profile [130]. The changed nature of the polymer chains and bonds is also believed to
play a meaningful role by reacting with various ingredients (accelerators, activators etc.)
within the composite during vulcanization as also reported by Nair [113].
Figure 4.38:- Curing behavior of blended composite with varying part of SBR in EPDM.
Variation in viscosity of the composite was determined by torque at onset and at
maximum crosslinking in the blended composite; detailed experimental procedure is
mentioned elsewhere [131]. Torque values at the start of curing had the lowest effect as
the composite was in the form of a gel-like substance and a decline of 40% was noticed
at the maximum crosslinking stage as shown in Figure 4.39. This decrease in stiffness
was considered to be due to enhancement in viscous component of the composite by
blending of SBR in EPDM; Khalil et al also reported a similar behavior [121].
C1=EPDM (100%)
C2= EPDM/SBR (90/10)
C3= EPDM/SBR (80/20)
C4=EPDM/SBR (70/30)
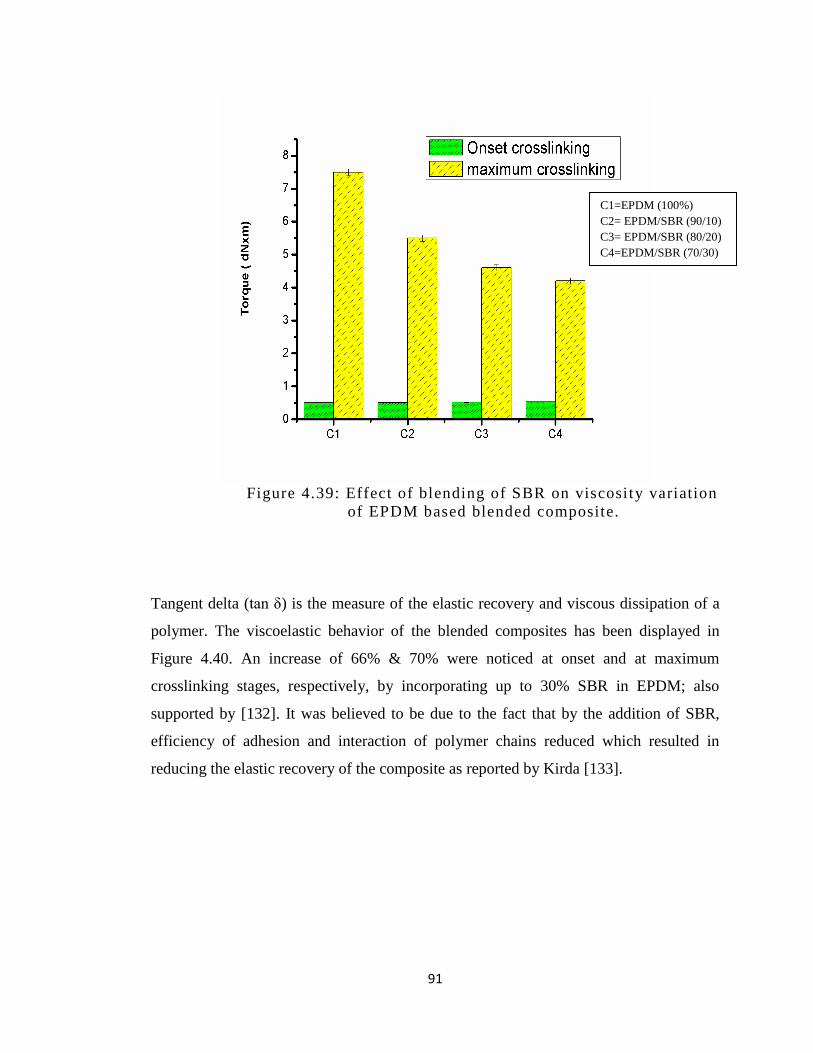
91
Figure 4.39: Effect of blending of SBR on viscosity variation
of EPDM based blended composite.
Tangent delta (tan δ) is the measure of the elastic recovery and viscous dissipation of a
polymer. The viscoelastic behavior of the blended composites has been displayed in
Figure 4.40. An increase of 66% & 70% were noticed at onset and at maximum
crosslinking stages, respectively, by incorporating up to 30% SBR in EPDM; also
supported by [132]. It was believed to be due to the fact that by the addition of SBR,
efficiency of adhesion and interaction of polymer chains reduced which resulted in
reducing the elastic recovery of the composite as reported by Kirda [133].
C1=EPDM (100%)
C2= EPDM/SBR (90/10)
C3= EPDM/SBR (80/20)
C4=EPDM/SBR (70/30)
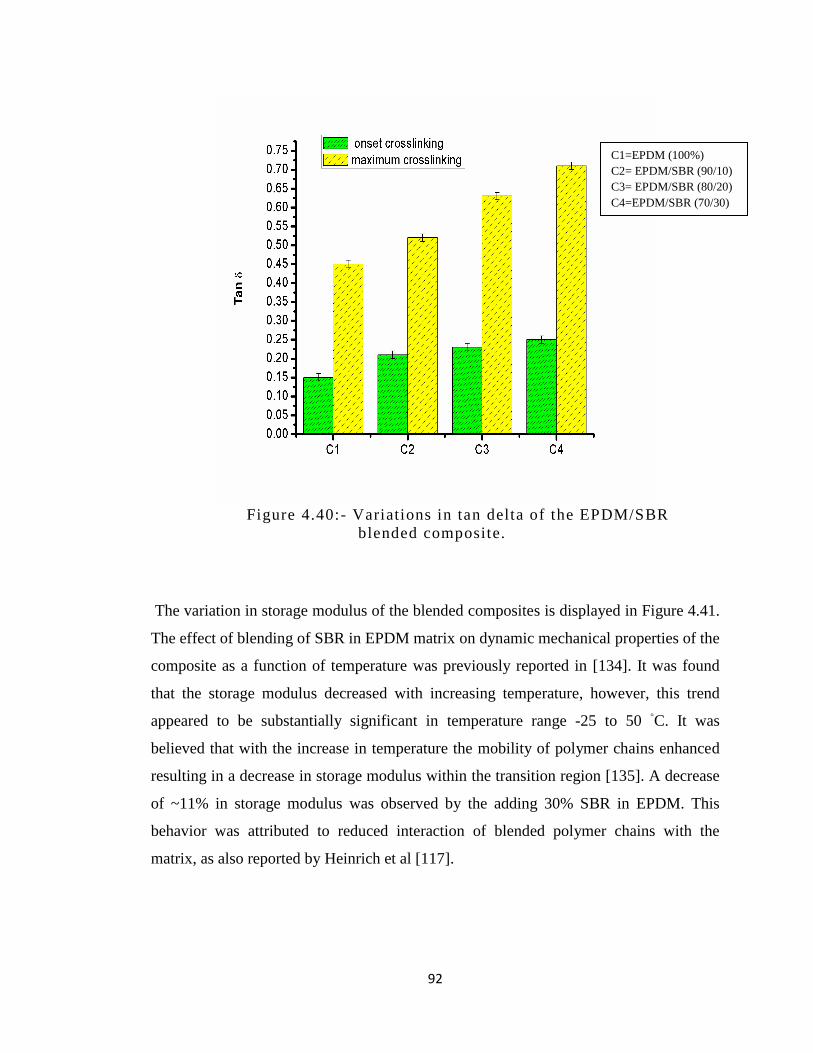
92
Figure 4.40:- Variations in tan delta of the EPDM/SBR
blended composite.
The variation in storage modulus of the blended composites is displayed in Figure 4.41.
The effect of blending of SBR in EPDM matrix on dynamic mechanical properties of the
composite as a function of temperature was previously reported in [134]. It was found
that the storage modulus decreased with increasing temperature, however, this trend
appeared to be substantially significant in temperature range -25 to 50 ◦C. It was
believed that with the increase in temperature the mobility of polymer chains enhanced
resulting in a decrease in storage modulus within the transition region [135]. A decrease
of ~11% in storage modulus was observed by the adding 30% SBR in EPDM. This
behavior was attributed to reduced interaction of blended polymer chains with the
matrix, as also reported by Heinrich et al [117].
C1=EPDM (100%)
C2= EPDM/SBR (90/10)
C3= EPDM/SBR (80/20)
C4=EPDM/SBR (70/30)
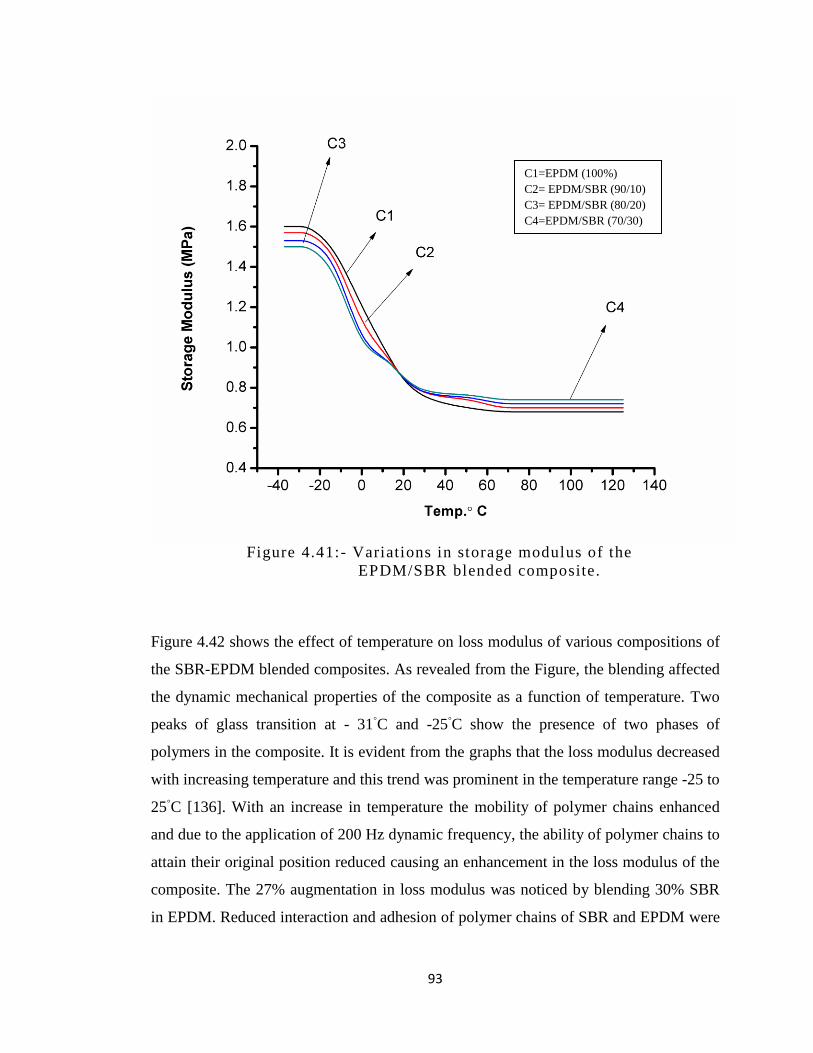
93
Figure 4.41:- Variations in storage modulus of the
EPDM/SBR blended composite.
Figure 4.42 shows the effect of temperature on loss modulus of various compositions of
the SBR-EPDM blended composites. As revealed from the Figure, the blending affected
the dynamic mechanical properties of the composite as a function of temperature. Two
peaks of glass transition at - 31◦C and -25
◦C show the presence of two phases of
polymers in the composite. It is evident from the graphs that the loss modulus decreased
with increasing temperature and this trend was prominent in the temperature range -25 to
25◦C [136]. With an increase in temperature the mobility of polymer chains enhanced
and due to the application of 200 Hz dynamic frequency, the ability of polymer chains to
attain their original position reduced causing an enhancement in the loss modulus of the
composite. The 27% augmentation in loss modulus was noticed by blending 30% SBR
in EPDM. Reduced interaction and adhesion of polymer chains of SBR and EPDM were
C1=EPDM (100%)
C2= EPDM/SBR (90/10)
C3= EPDM/SBR (80/20)
C4=EPDM/SBR (70/30)
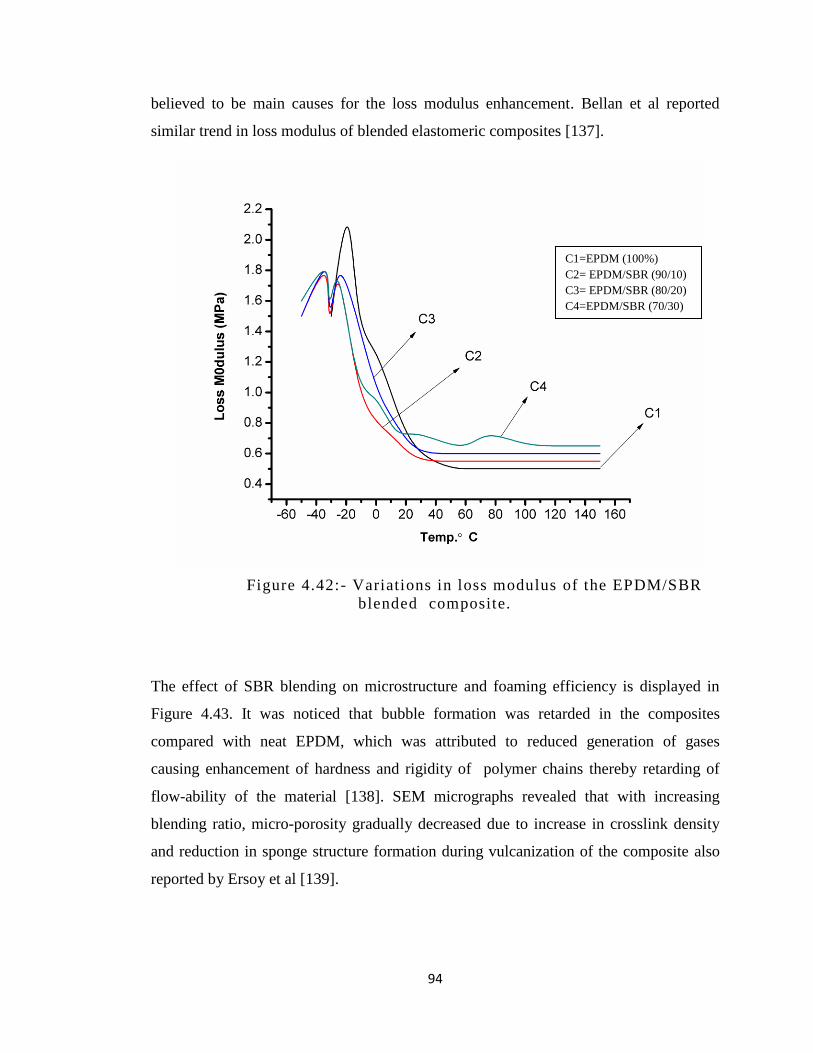
94
believed to be main causes for the loss modulus enhancement. Bellan et al reported
similar trend in loss modulus of blended elastomeric composites [137].
Figure 4.42:- Variations in loss modulus of the EPDM/SBR
blended composite.
The effect of SBR blending on microstructure and foaming efficiency is displayed in
Figure 4.43. It was noticed that bubble formation was retarded in the composites
compared with neat EPDM, which was attributed to reduced generation of gases
causing enhancement of hardness and rigidity of polymer chains thereby retarding of
flow-ability of the material [138]. SEM micrographs revealed that with increasing
blending ratio, micro-porosity gradually decreased due to increase in crosslink density
and reduction in sponge structure formation during vulcanization of the composite also
reported by Ersoy et al [139].
C1=EPDM (100%)
C2= EPDM/SBR (90/10)
C3= EPDM/SBR (80/20)
C4=EPDM/SBR (70/30)
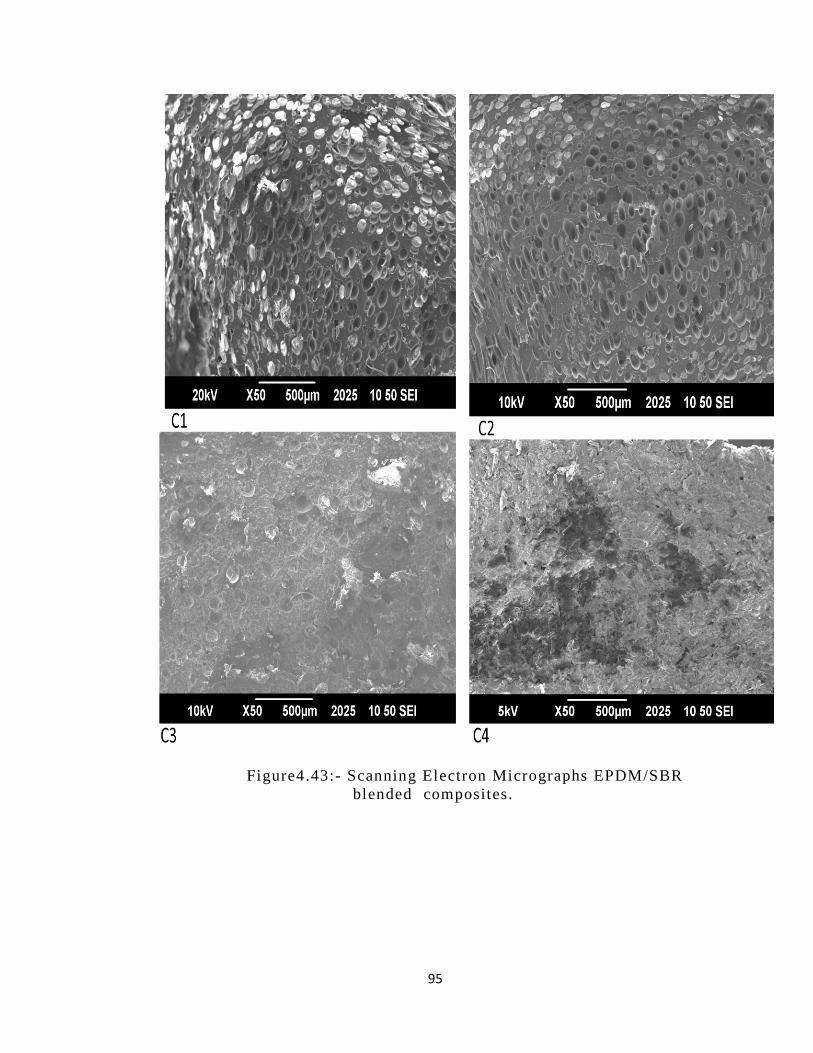
95
Figure4.43:- Scanning Electron Micrographs EPDM/SBR
blended composites.
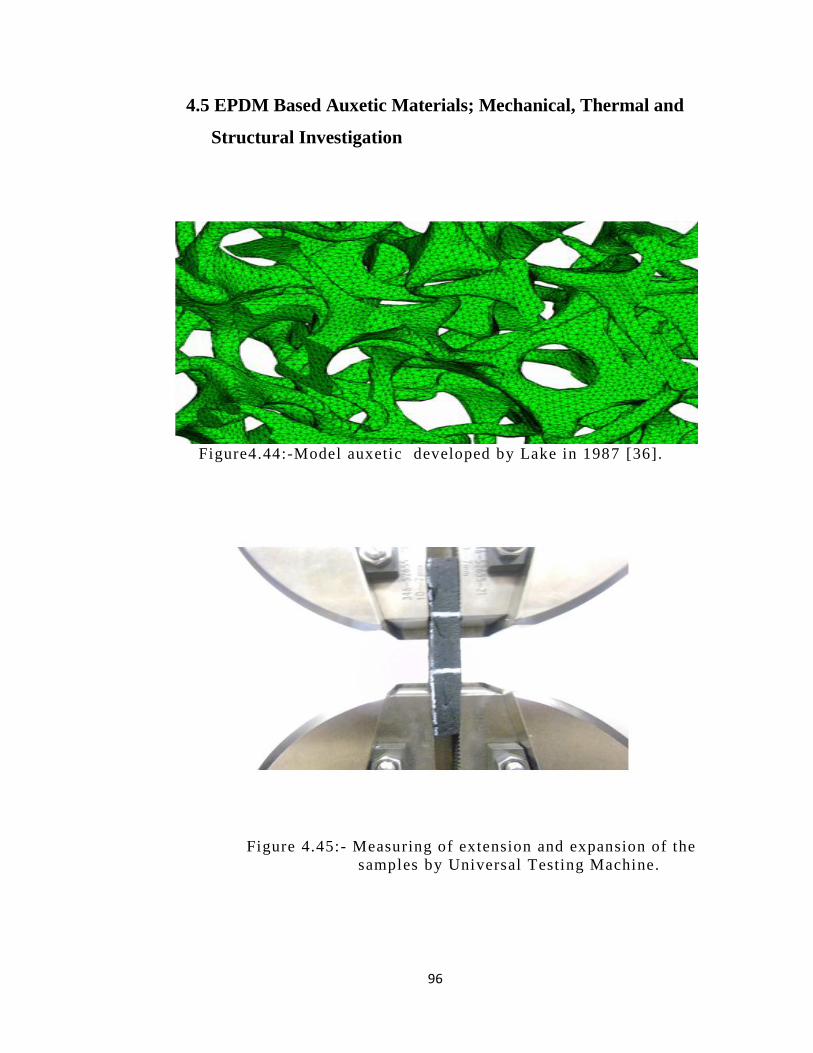
96
4.5 EPDM Based Auxetic Materials; Mechanical, Thermal and
Structural Investigation
Figure4.44:-Model auxetic developed by Lake in 1987 [36].
Figure 4.45:- Measuring of extension and expansion of the
samples by Universal Testing Machine.
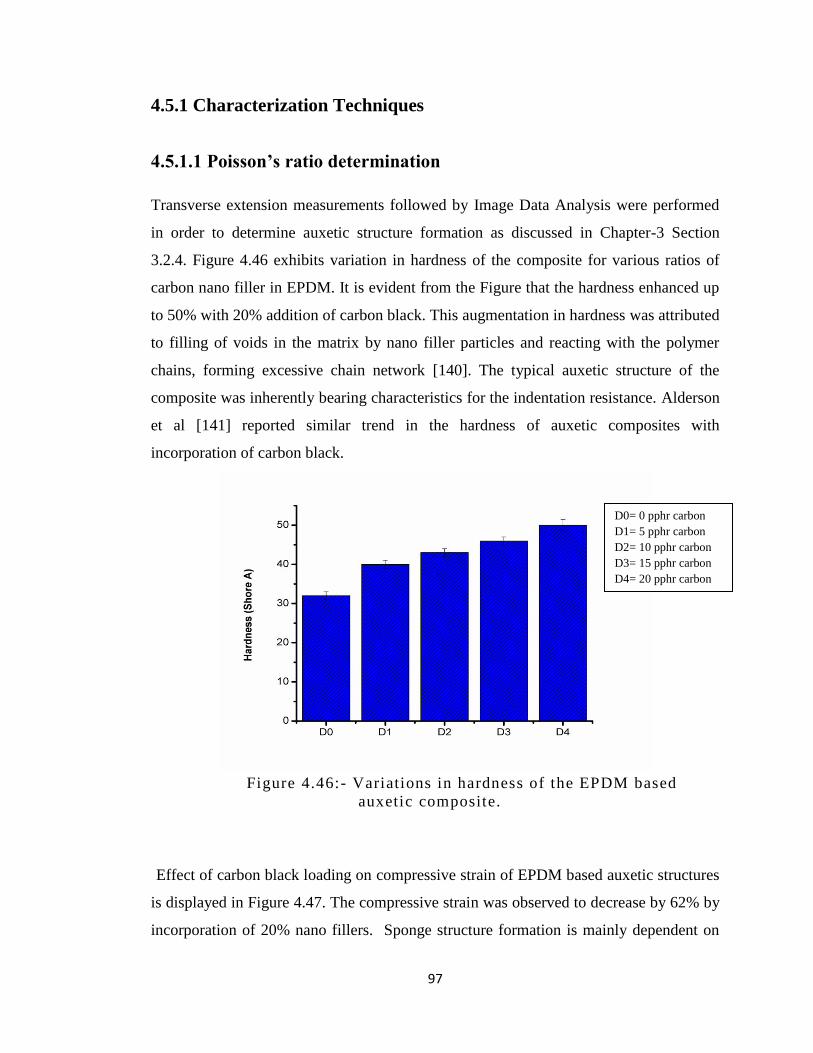
97
4.5.1 Characterization Techniques
4.5.1.1 Poisson’s ratio determination
Transverse extension measurements followed by Image Data Analysis were performed
in order to determine auxetic structure formation as discussed in Chapter-3 Section
3.2.4. Figure 4.46 exhibits variation in hardness of the composite for various ratios of
carbon nano filler in EPDM. It is evident from the Figure that the hardness enhanced up
to 50% with 20% addition of carbon black. This augmentation in hardness was attributed
to filling of voids in the matrix by nano filler particles and reacting with the polymer
chains, forming excessive chain network [140]. The typical auxetic structure of the
composite was inherently bearing characteristics for the indentation resistance. Alderson
et al [141] reported similar trend in the hardness of auxetic composites with
incorporation of carbon black.
Figure 4.46:- Variations in hardness of the EPDM based
auxetic composite.
Effect of carbon black loading on compressive strain of EPDM based auxetic structures
is displayed in Figure 4.47. The compressive strain was observed to decrease by 62% by
incorporation of 20% nano fillers. Sponge structure formation is mainly dependent on
D0= 0 pphr carbon
D1= 5 pphr carbon
D2= 10 pphr carbon
D3= 15 pphr carbon
D4= 20 pphr carbon

98
the availability of viscous part in the composite during vulcanization. Carbon black,
being rigid particles is considered to be a major cause for minimizing viscous behavior
of the composite
[142]. It is evident from Figure 4.47 that the compressive load below 8.3 mm
compression was almost identical with different wt. % of carbon black. An elastic
response was observed in this regime; buckling of cells started as the load increased
beyond this limit and behavior of samples was noticed to be varying depending upon wt.
% of carbon black, cell size, crosslinking and sponge density. At the onset of the plateau
region (- 8mm), buckled cell walls began to contact each other causing a rapid load
enhancement till complete densification of sponge structures occurred. Zhang et al [143]
also reported similar behavior in the auxetic elastomeric composites.
Figure 4.47:- Variations in of the compressive strain of the
EPDM based auxetic structures.
Effect of carbon black filler on free fall impact energy absorption of the composite is
shown in Figure 4.48. A significant decrease of 18% was observed by incorporation of
20% filler. It was believed that sponge or bubble structures within the composite
D0= 0 pphr carbon
D1= 5 pphr carbon
D2= 10 pphr carbon
D3= 15 pphr carbon
D4= 20 pphr carbon
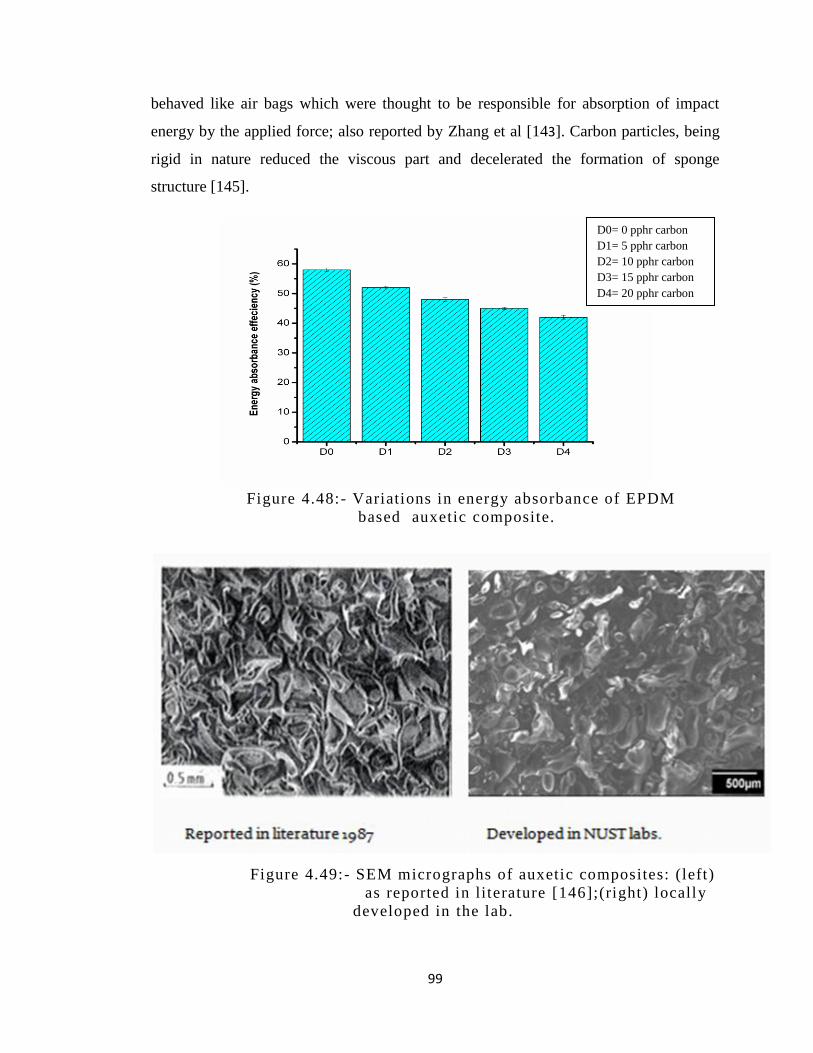
99
behaved like air bags which were thought to be responsible for absorption of impact
energy by the applied force; also reported by Zhang et al [143]. Carbon particles, being
rigid in nature reduced the viscous part and decelerated the formation of sponge
structure [145].
Figure 4.48:- Variations in energy absorbance of EPDM
based auxetic composite.
Figure 4.49:- SEM micrographs of auxetic composites: (left)
as reported in literature [146];(right) locally
developed in the lab.
D0= 0 pphr carbon
D1= 5 pphr carbon
D2= 10 pphr carbon
D3= 15 pphr carbon
D4= 20 pphr carbon
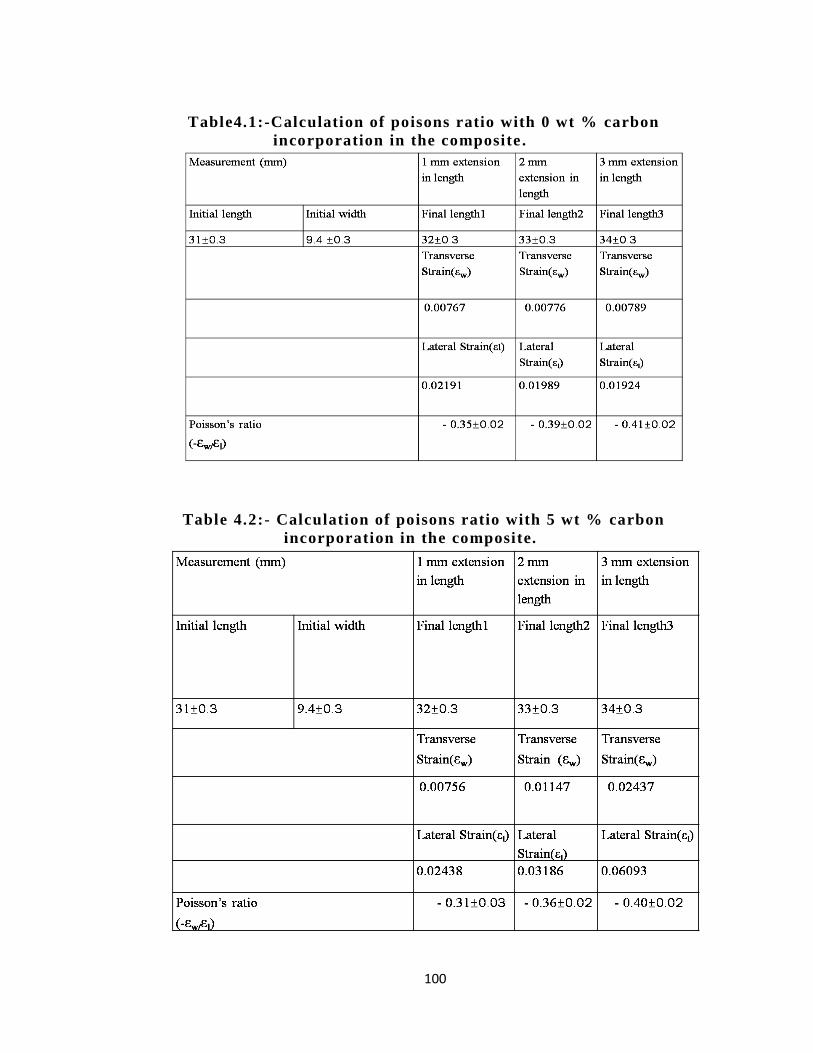
100
Table4.1:-Calculation of poisons ratio with 0 wt % carbon
incorporation in the composite .
Table 4.2:- Calculation of poisons ratio with 5 wt % carbon
incorporation in the composite.
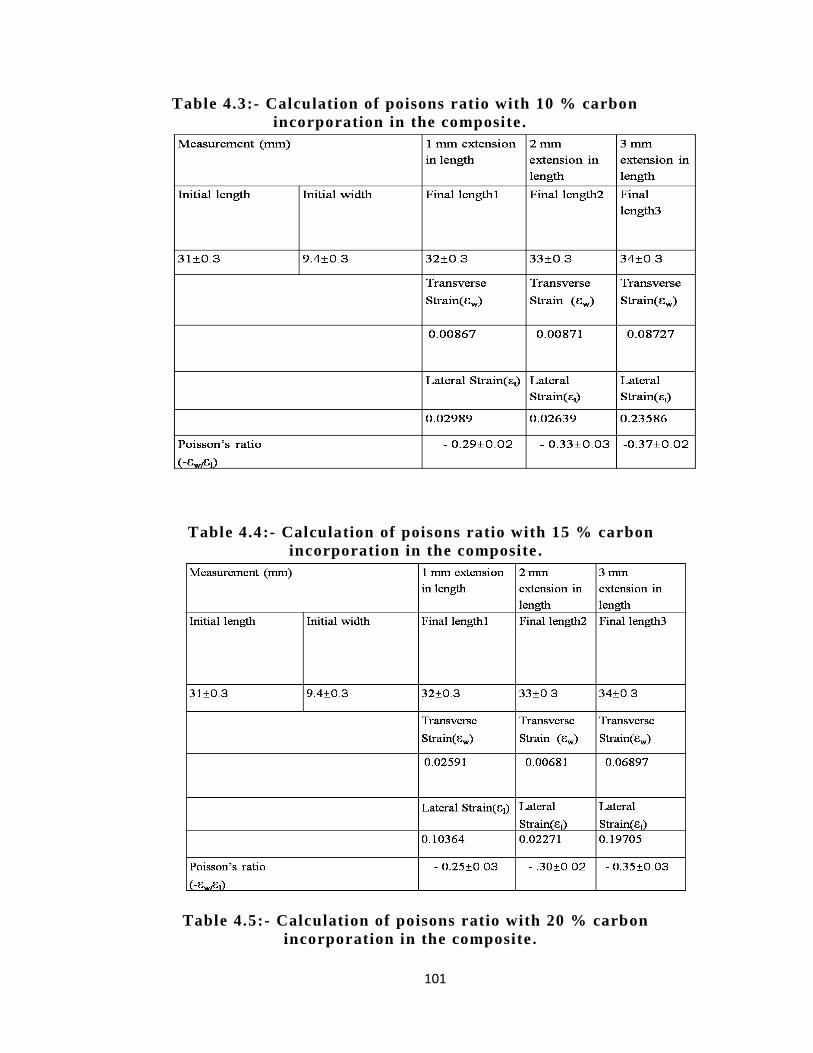
101
Table 4.3:- Calculation of poisons ratio with 10 % carbon
incorporation in the composite .
Table 4.4:- Calculation of poisons ratio with 15 % carbon
incorporation in the composite .
Table 4.5:- Calculation of poisons ratio with 20 % carbon
incorporation in the composite .
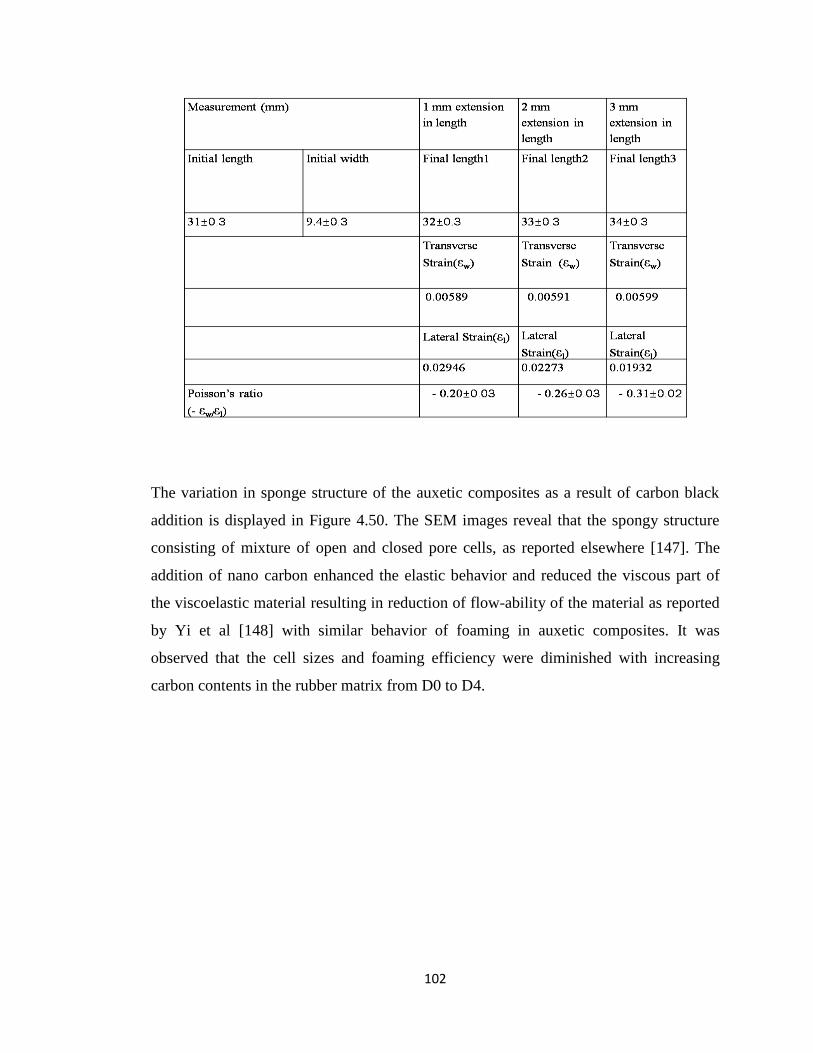
102
The variation in sponge structure of the auxetic composites as a result of carbon black
addition is displayed in Figure 4.50. The SEM images reveal that the spongy structure
consisting of mixture of open and closed pore cells, as reported elsewhere [147]. The
addition of nano carbon enhanced the elastic behavior and reduced the viscous part of
the viscoelastic material resulting in reduction of flow-ability of the material as reported
by Yi et al [148] with similar behavior of foaming in auxetic composites. It was
observed that the cell sizes and foaming efficiency were diminished with increasing
carbon contents in the rubber matrix from D0 to D4.
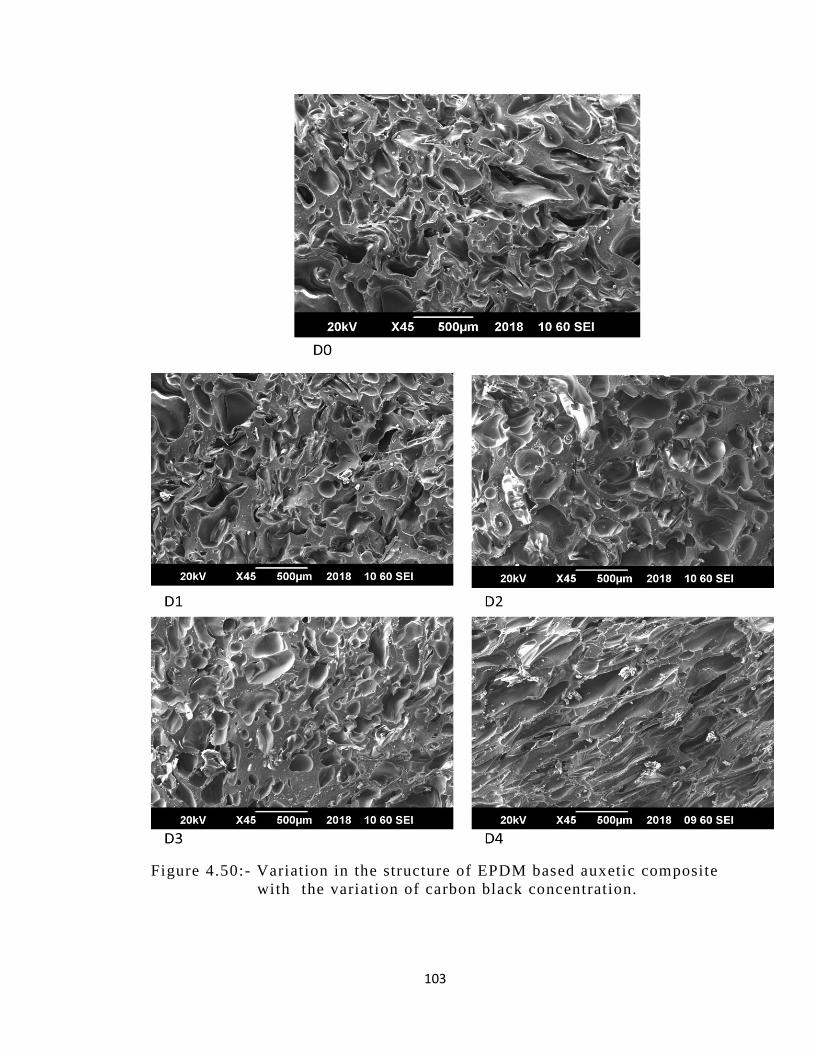
103
Figure 4.50:- Variation in the structure of EPDM based auxetic composite
with the variation of carbon black concentration.
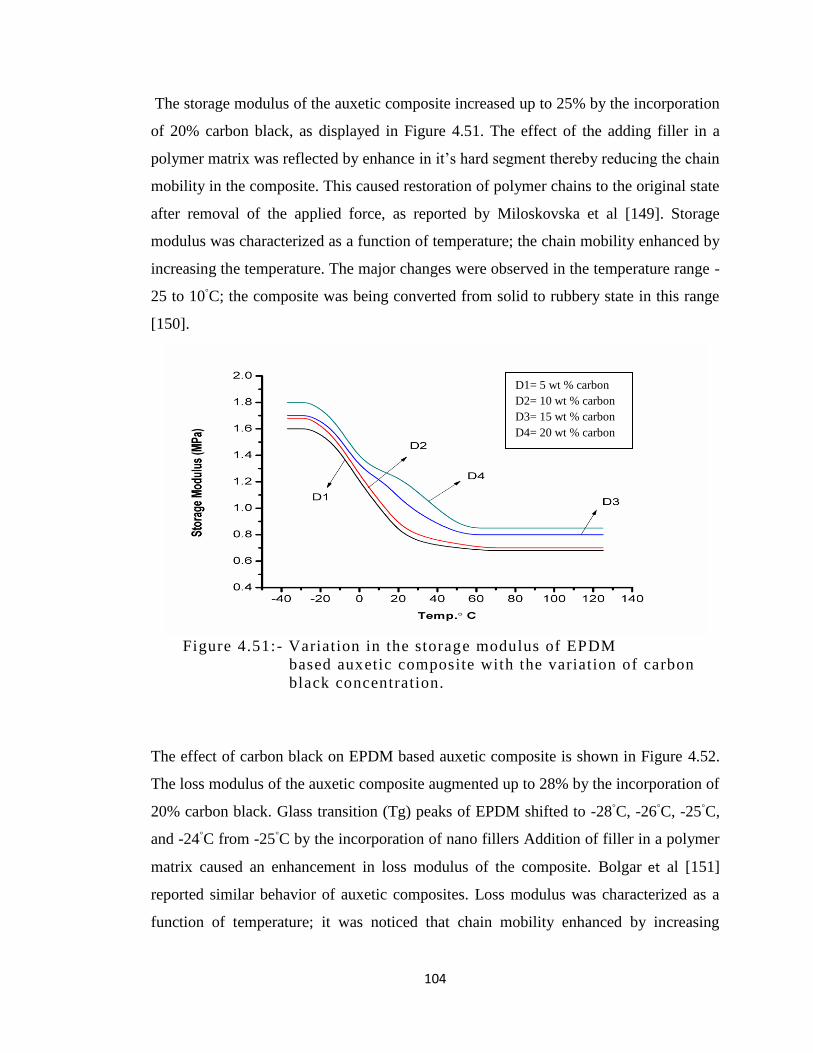
104
The storage modulus of the auxetic composite increased up to 25% by the incorporation
of 20% carbon black, as displayed in Figure 4.51. The effect of the adding filler in a
polymer matrix was reflected by enhance in it‟s hard segment thereby reducing the chain
mobility in the composite. This caused restoration of polymer chains to the original state
after removal of the applied force, as reported by Miloskovska et al [149]. Storage
modulus was characterized as a function of temperature; the chain mobility enhanced by
increasing the temperature. The major changes were observed in the temperature range -
25 to 10◦C; the composite was being converted from solid to rubbery state in this range
[150].
Figure 4.51:- Variation in the storage modulus of EPDM
based auxetic composite with the variation of carbon
black concentration.
The effect of carbon black on EPDM based auxetic composite is shown in Figure 4.52.
The loss modulus of the auxetic composite augmented up to 28% by the incorporation of
20% carbon black. Glass transition (Tg) peaks of EPDM shifted to -28◦C, -26
◦C, -25
◦C,
and -24◦C from -25
◦C by the incorporation of nano fillers Addition of filler in a polymer
matrix caused an enhancement in loss modulus of the composite. Bolgar et al [151]
reported similar behavior of auxetic composites. Loss modulus was characterized as a
function of temperature; it was noticed that chain mobility enhanced by increasing
D1= 5 wt % carbon
D2= 10 wt % carbon
D3= 15 wt % carbon
D4= 20 wt % carbon
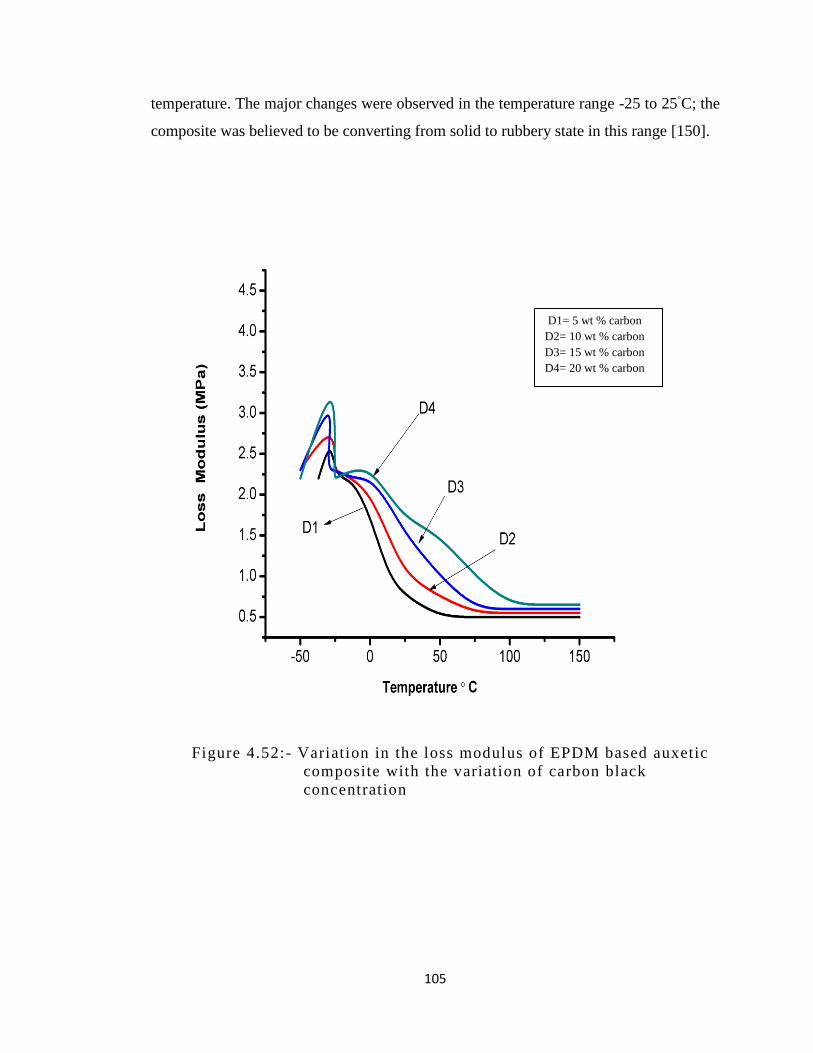
105
temperature. The major changes were observed in the temperature range -25 to 25◦C; the
composite was believed to be converting from solid to rubbery state in this range [150].
Figure 4.52:- Variation in the loss modulus of EPDM based auxetic
composite with the variation of carbon black
concentration
D1= 5 wt % carbon
D2= 10 wt % carbon
D3= 15 wt % carbon
D4= 20 wt % carbon

106
Chapter-5
Conclusions and Future
Recommendations
107
5.1 Conclusions
It is possible to develop sponge structures in EPDM, EPDM/NBR, EPDM/NR
and EPDM/SBR blended composites.
Among various elastomeric systems investigated EPDM proved to be the best to
develop an auxetic structure.
The best indentation resistance (48 shore A), reduction in free fall impact energy
absorption (22%), compression (14mm at 25000 N load) were observed in the
EPDM based auxetic materials.
Hardness of the sponge composites with the 20% incorporation of carbon black
nano fillers in EPDM enhances up to 112% while this increment was 35%, 26%,
62% and 55% by blending NBR, NR, SBR in EPDM and EPDM based auxetic
structures, respectively.
Tensile strength increased by 142% with the addition of 20% carbon black in
EPDM but an increment of 164%, 88%, 150%, was observed with 30% blends of
NBR, NR, and SBR in EPDM.
% Elongation of the 20% nano carbon filled EPDM based sponge composite
decreased by 50% and with the 30% blends of NBR, NR, and SBR in EPDM
caused the depreciation of 56%, 20%, and 13%.
Reduction in impact energy absorbed by the EPDM based sponge composite
with 20% variation of carbon black and blending ratio of NBR, NR, SBR in
EPDM and auxetic structures were found to be 31%, 12%, 16%, 12%, 22%,
respectively.
Storage modulus reduced 40%, 25%, 11% by blending 30% blends of NBR, NR,
SBR and EPDM based auxetic material and augmented 33%, 25% by
incorporation of 20% nano carbon in EPDM based sponge and auxetic structures
.
Loss modulus augmented by 33%, 60%, 50%, 27%, and 28% with the addition
of 20% carbon black in EPDM with 30% blends of NBR, NR, SBR and EPDM
based auxetic material.
„Tan δ‟ during vulcanization enhanced by 130%, 300%, 400%, and 27%, with
the addition of 20% carbon black, and 30% blends of NBR, NR, SBR in EPDM.
108
5.2 Future Recommendations.
In future the project may be proceeded on the basis of following steps to improve the
mechanical, compressive strain, energy absorption and vulcanization of the composite.
Development of auxetic fibers in thermoplastics like PE, PS, PP etc.
Effect of variant fillers loading on the auxetic structures, mechanical and
vulcanization behavior.
Elastomeric blended composites may also be tried for the development of auxetic
structures.
Interfacial behavior of polymer matrix-reinforcement bonding to improve
matrix-filler interaction for best mechanical, impact energy absorption and
compressive characteristics.
Effect of different parameters like temperature, pressure during vulcanization
will be studied
Papers Published in International Journals
1. Structural, Viscoelastic, and Vulcanization Study of Sponge Ethylene–
Propylene–Diene Monomer Composites with Various Carbon Black Loadings
M. Arshad Bashir, Nadeem Iqbal, Mohammad Shahid, Quratulain, Riaz Ahmed,
J. APPL. Polym. Sci. 2013, DOI: 10.1002/APP.39423 7
2. Study of rheological, viscoelastic and vulcanization behavior of sponge
EPDM/NR blended nano- composites, M Arshad Bashir, M Shahid, Riaz
Ahmed, A G Yahya, IOP Conf. Series: Materials Science and Engineering, 60
(2014) 012070 doi:10.1088/1757-899X/60/1/012070
3. Auxetic Nanocomposite Based on Styrene Butadiene Rubber (SBR) Foam with
Varying Nano-carbon Loading, M. Tanweer Khan, Muhammad Shahid, M.
Arshad Bashir, Qurat Ulain, Manufacturing Science and Technology 3(5): 204-
209, 2015 http://www.hrpub.org DOI: 10.13189/mst.2015.030502
4. Thermogravimetric, Differential Scanning Calorimetric and Experimental
Thermal Transport Study of Functionalized Nanokaolinite Doped Elastomeric
nanocomposites” Journal of Thermal Analysis and Calorimetry DOI:
10.1007/s10973-016-5486-7
Sadia Sagar Iqbal, Fawad Inam, Tahir Jamil, M.Arshad Bashir, Mohammad
Shahid
109
References
[1] Q.-X. Zhang, Z.-Z. Yu, X.-L. Xie, Y.-W. Mai, Polymer 45 (2004) 5985-5994. [2] S. Reid, International Journal of Mechanical Sciences 35 (1993) 1035-1052. [3] J. Liang, R. Li, Journal of Applied Polymer Science 77 (2000) 409-417. [4] A. Alghamdi, Thin-walled structures 39 (2001) 189-213. [5] P. Qiao, M. Yang, F. Bobaru, Journal of Aerospace Engineering 21 (2008) 235-248. [6] K. Haeusler, J. Stanford, R. Stepto, Journal of analytical and applied pyrolysis 13 (1988)
287-303. [7] M.W. Weimer, J.M. Fréchet, I. Gitsov, Journal of Polymer Science Part A: Polymer
Chemistry 36 (1998) 955-970. [8] R. Pelrine, R. Kornbluh, G. Kofod, Advanced Materials 12 (2000) 1223-1225. [9] E. Kresge, Rubber chemistry and technology 64 (1991) 469-480. [10] R. Gächter, H. Müller, H. Andreas, Plastics additives handbook: stabilizers, processing
aids, plasticizers, fillers, reinforcements, colorants for thermoplastics, Hanser. Distributed in the USA by Macmillan, 1985.
[11] P.M. Lipic, F.S. Bates, M.A. Hillmyer, Journal of the American Chemical Society 120 (1998) 8963-
8970. [12] L.J. Gibson, M.F. Ashby, Cellular solids: structure and properties, Cambridge university
press, 1999. [13] A. Vidal, Elastomeric sponge, Google Patents, 1981. [14] R. Lakes, K. Elms, Journal of composite materials 27 (1993) 1193-1202. [15] R. Lakes, R. Witt, International Journal of Mechanical Engineering Education 30 (2002)
50-58. [16] G. Greaves, A. Greer, R. Lakes, T. Rouxel, Nature materials 10 (2011) 823-837. [17] J.N. Grima, D. Attard, R. Gatt, R.N. Cassar, Advanced Engineering Materials 11 (2009)
533-535. [18] K.W. Wojciechowski, V.V. Novikov, Task Quarterly 5 (2001) 5-11. [19] K. Wojciechowski, Simple models of unusual elastic properties, AIP Conference
Proceedings, 2004, p. 735. [20] J.N. Grima, P.S. Farrugia, C. Caruana, R. Gatt, D. Attard, Journal of materials science 43
(2008) 5962-5971. [21] B. Caddock, K. Evans, Journal of Physics D: Applied Physics 22 (1989) 1877. [22] Q. Liu, Literature Review: Materials with Negative Poisson's Ratios and Potential
Applications to Aerospace and Defence, DTIC Document, 2006. [23] J.N. Grima, R. Gatt, V. Zammit, J.J. Williams, K.E. Evans, A. Alderson, R.I. Walton, Journal
of applied physics 101 (2007) 086102. [24] D. Prall, R. Lakes, International Journal of Mechanical Sciences 39 (1997) 305-314. [25] L. Yanping, H. Hong, Scientific Research and Essays 5 (2010) 1052-1063. [26] K. Alderson, A. Alderson, P. Davies, G. Smart, N. Ravirala, G. Simkins, Journal of
materials science 42 (2007) 7991-8000. [27] K. Evans, M. Nkansah, I. Hutchinson, S. Rogers, Nature 353 (1991) 124-124. [28] K. Evans, M. Nkansah, I. Hutchinson, Acta metallurgica et materialia 42 (1994) 1289-
1294. [29] K.E. Evans, Endeavour 15 (1991) 170-174. [30] J.N. Grima, R. Gatt, N. Ravirala, A. Alderson, K. Evans, Materials Science and
Engineering: A 423 (2006) 214-218.
110
[31] B. Caddock, K. Evans, Biomaterials 16 (1995) 1109-1115. [32] J.N. Grima, K.E. Evans, Chemical Communications (2000) 1531-1532. [33] J. Grima, K. Evans, Journal of materials science letters 19 (2000) 1563-1565. [34] F. Scarpa, S. Adhikari, C. Wang, International Journal of Smart and Nano Materials 1
(2010) 83-94. [35] Y. Liu, H. Hu, Sci. Res. Essays 5 (2010) 1052-1063. [36] M.F. Wojciechowski, Advances in legume systematics, part 10 (2003) 5-35. [37] M.F. Wojciechowski, M. Lavin, M.J. Sanderson, American Journal of Botany 91 (2004)
1846-1862. [38] J.N. Grima, E. Manicaro, D. Attard, Proceedings of the Royal Society A: Mathematical,
Physical and Engineering Science 467 (2011) 439-458. [39] C. He, P. Liu, P.J. McMullan, A.C. Griffin, physica status solidi (b) 242 (2005) 576-584. [40] H. Wan, H. Ohtaki, S. Kotosaka, G. Hu, European Journal of Mechanics-A/Solids 23
(2004) 95-106. [41] K. Adcox, S. Adler, S. Afanasiev, C. Aidala, N. Ajitanand, Y. Akiba, A. Al-Jamel, J.
Alexander, R. Amirikas, K. Aoki, Nuclear Physics A 757 (2005) 184-283. [42] H.J. Salas, P. Martino, Water research 25 (1991) 341-350. [43] W. Yang, Z.-M. Li, W. Shi, B.-H. Xie, M.-B. Yang, Journal of materials science 39
(2004)3269-3279. [44] A. Alderson, K. Alderson, Proceedings of the Institution of Mechanical Engineers, Part
G: Journal of Aerospace Engineering 221 (2007) 565-575. [45] G. Berke, Cell 81 (1995) 9-12. [46] K. Alderson, A. Alderson, R. Webber, K. Evans, Journal of materials science letters 17
(1998) 1415-1419. [47] Y.P. Wu, Y. Ma, Y.Q. Wang, L.Q. Zhang, Macromolecular Materials and Engineering 289
(2004) 890-894. [48] Y. Ma, Y.P. Wu, Y.Q. Wang, L.Q. Zhang, Journal of Applied Polymer Science 99 (2006)
914-919. [49] Y.P. Wu, Q.X. Jia, D.S. Yu, L.Q. Zhang, Journal of Applied Polymer Science 89 (2003)
3855-3858. [50] D. Todd, Journal of European Economic History 10 (1981) 153. [51] S.A. Bon, M. Bosveld, B. Klumperman, A.L. German, Macromolecules 30 (1997) 324-
326. [52] N. Nagata, T. Sato, T. Fujii, Y. Saito, Structure and mechanical properties of
hydrogenated NBR/zinc di-methacrylate vulcanizates, Wiley, John & Sons, Inc., J. Appl. Polym. Sci.(Symp.)(USA), 1993, pp. 103-120.
[53] A. Donatelli, L. Sperling, D. Thomas, Macromolecules 9 (1976) 671-675. [54] N. Yoshimura, K. Fujimoto, Rubber chemistry and technology 42 (1969) 1009-1013. [55] P. Anthony, R. Arnold, H. Band, H. Borel, P. Bosted, V. Breton, G. Cates, T. Chupp, F.
Dietrich, J. Dunne, Physical Review Letters 71 (1993) 959. [56] J.A. Theobald, N.S. Oxtoby, M.A. Phillips, N.R. Champness, P.H. Beton, Nature 424
(2003) 1029-1031. [57] M. Morton, Rubber technology, Van Nostrand Reinhold Company, 1987. [58] W. Hofmann, Rubber technology handbook, Hanser Publishers. Distributed in the USA
by Oxford University Press, 1989. [59] S.C. Jana, S. Jain, Polymer 42 (2001) 6897-6905.
111
[60] D.D. Onan, G.W. Davis, R.S. Cromwell, W.D. Riley, Well completion and remedial methods utilizing cement-ladened rubber, Google Patents, 1994.
[61] D. Wachsstock, W. Schwarz, T. Pollard, Biophysical journal 66 (1994) 801-809. [62] Y. Egashira, S. Tomita, Multi-piece solid golf ball, Google Patents, 1995. [63] K.H. Rahiman, G. Unnikrishnan, A. Sujith, C. Radhakrishnan, Materials Letters 59 (2005)
633-639. [64] B. Kuriakose, S. De, Polymer Engineering & Science 25 (1985) 630-634. [65] B. Dogadkin, Journal of Polymer Science 30 (1958) 351-361. [66] L. Fishbein, Anthropogenic Compounds, Springer, 1990, pp. 45-95. [67] C. Parks, D. Parker, D. Chapman, W. Cox, Rubber chemistry and technology 43 (1970)
572-587. [68] W. Fischer, Dynamically partially cured thermoplastic blend of monoolefin copolymer
rubber and polyolefin plastic, Google Patents, 1974. [69] R.W. Cruse, R.J. Pickwell, Filled rubbers comprising blocked mercaptosilanes and
thiuram deblocking agents, Google Patents, 2000. [70] R.B. Maccallum, Reinforcing fillers for rubber, Google Patents, 1968. [71] A.R. Hobson, R.L. Sassa, S.H. Speck, T.-K. Lau, Fluoropolymer coated elastomeric rollers
and structures, Google Patents, 1998. [72] J.Y. Chen, Thermoplastic elastomer gelatinous articles, Google Patents, 1994. [73] J.-M. Charrier, Polymeric materials and processing: plastics, elastomers, and
composites, Hanser publishers, 1991. [74] T.F. Wawron, Process for vulcanization of elastomers, Google Patents, 1967. [75] L. Loan, Rubber Chemistry and Technology 40 (1967) 149-176. [76] M.A. Fath, Rubber World 209 (1993) 17-20. [77] J.L. White, Rubber chemistry and technology 42 (1969) 257-338. [78] J. Ma, S. Zhang, Z. Qi, Journal of Applied Polymer Science 82 (2001) 1444-1448. [79] S.B. Haska, E. Bayramli, F. Pekel, S. Oezkar, Journal of Applied Polymer Science 64
(1997) 2347-2354. [80] M. Peleg, Journal of Food Science 41 (1976) 721-722. [81] H. Todokoro, M. Ezumi, Scanning electron microscope, Google Patents, 1999. [82] R. Mastromatteo, J. Mitchell, T. Brett Jr, Rubber Chemistry and Technology 44 (1971)
1065-1079. [83] H. Essawy, D. El-Nashar, Polymer Testing 23 (2004) 803-807. [84] A.L. Saad, S. El‐Sabbagh, Journal of applied polymer science 79 (2001) 60-71. [85] J.B. Gardiner, Rubber Chemistry and Technology 43 (1970) 370-399. [86] T.J. Brett Jr, R. Mastromatteo, Co-cure of blend of rubber of low unsaturation and
highly unsaturated rubber using long chain hydrocarbon dithiocarbamate accelerators, Google Patents, 1972.
[87] L. Flandin, A. Chang, S. Nazarenko, A. Hiltner, E. Baer, Journal of Applied Polymer Science 76 (2000) 894-905.
[88] S. Botros*, M. Tawfic, Polymer-Plastic Technology and Engineering 44 (2005) 209-227. [89] J. Karger-Kocsis, V. Kuleznev, Polymer 23 (1982) 699-705. [90] S. Siriwardena, H. Ismail, U. Ishiaku, M. Perera, Journal of applied polymer science 85
(2002) 438-453. [91] R.J. Farris, J.E. Morin, Thermoset recycling methods and solid article produced, Google
Patents, 2003. [92] D. Mangaraj, Rubber Recycling (2004).
112
[93] G. Heinrich, M. Klüppel, T.A. Vilgis, Current opinion in solid state and materials science 6 (2002) 195-203.
[94] T.M. Nair, M. Kumaran, G. Unnikrishnan, V. Pillai, Journal of applied polymer science 112 (2009) 72-81.
[95] R. Faez, I.M. Martin, M.A. De Paoli, M.C. Rezende, Journal of applied polymer science 83 (2002) 1568-1575.
[96] K. Premphet, P. Horanont, Journal of applied polymer science 76 (2000) 1929-1939. [97] V.M. Litvinov, P. De, Spectroscopy of rubber and rubbery materials, iSmithers Rapra
Publishing, 2002. [98] A. Coran, R. Patel, Reactive Modifiers for Polymers, Springer, 1997, pp. 349-394. [99] L. Flandin, A. Chang, S. Nazarenko, A. Hiltner, E. Baer, Journal of Applied Polymer
Science 76 [100] K. George, R. Joseph, D.J. Francis, Journal of applied polymer science 32 (1986) 2867-
2873. [101] W. Hess, C. Herd, P. Vegvari, Rubber chemistry and technology 66 (1993) 329-375. [102] C. Nakason, W. Pechurai, K. Sahakaro, A. Kaesaman, Polymers for advanced
technologies 16 (2005) 592-599. [103] J. Zhao, G. Ghebremeskel, J. Peasely, P. Neches, KAUTSCHUK UND GUMMI
KUNSTSTOFFE 54 (2001) 223-229. [104] . barra- me , A. r ue , L. . amos-de alle, .S. odr gue - ern nde , ubber
chemistry and technology 76 (2003) 969-978. [105] M. Zhang, T.-j. CHEN, Y.-c. Zhang, Journal of Nanjing University of Technology (Natural
Science Edition) 3 (2009) 015. [106] M. Alexandre, P. Dubois, Materials Science and Engineering: R: Reports 28 (2000) 1-63. [107] M.C. Boyce, K. Kear, S. Socrate, K. Shaw, Journal of the Mechanics and Physics of Solids
49 (2001) 1073-1098. [108] J.E. Puskas, KGK. Kautschuk, Gummi, Kunststoffe 58 (2005) 288-296. [109] M.M. Dumoulin, Polymer blends forming, Springer, 2003. [110] P. Cudby, Blends of Natural Rubber, Springer, 1998, pp. 21-39. [111] J. Zhao, G. Ghebremeskel, J. Peasely, P. Neches, KGK. Kautschuk, Gummi, Kunststoffe
54 (2001) 84-91. [112] A.L.N. Da Silva, M.C. Rocha, F. Coutinho, R. Bretas, C. Scuracchio, Journal of applied
polymer science 75 (2000) 692-704. [113] T.M. Nair, M. Kumaran, G. Unnikrishnan, S. Kunchandy, Journal of applied polymer
science 107 (2008) 2923-2929. [114] A. Katbab, H. Nazockdast, S. Bazgir, Journal of applied polymer science 75 (2000) 1127-
1137. [115] . Kamal, . Lai‐ ook, N. Demar uette, Polymer Engineering & Science 34 (1994) 1834-
1839. [116] S. Burattini, B.W. Greenland, D.H. Merino, W. Weng, J. Seppala, H.M. Colquhoun, W.
Hayes, M.E. Mackay, I.W. Hamley, S.J. Rowan, Journal of the American Chemical Society 132 (2010) 12051-12058.
[117] G. Heinrich, M. Klüppel, Filled Elastomers Drug Delivery Systems, Springer, 2002, pp. 1-44.
[118] J.J. Barry, S.N. Nazhat, F.R. Rose, A.H. Hainsworth, C.A. Scotchford, S.M. Howdle, Journal of Materials Chemistry 15 (2005) 4881-4888.
[119] D. Mangaraj, Rubber chemistry and technology 75 (2002) 365-427.
113
[120] M.J. Vander Wielen, J.D. Taylor, Composite elastomeric material and process for making the same, Google Patents, 1988.
[121] A. Khalil, S.N. Shaikh, Z.R. Nudrat, S. Khaula, Advances in Materials Physics and Chemistry 2012 (2012).
[122] D. Meyer, J. Sommer, Rubber Chemistry and Technology 44 (1971) 258-270. [123] N. Mills, Polymer foams handbook: engineering and biomechanics applications and
design guide, Butterworth-Heinemann, 2007. [124] H. Ismail, Polymer Testing 21 (2002) 389-395. [125] S. Angnanon, P. Prasassarakich, N. Hinchiranan, Polymer-Plastics Technology and
Engineering 50 (2011) 1170-1178. [126] T. Mass, M. Woods, Vulcanizates of epdm and diene rubber blends, Google Patents, 1974. [127] D.J. Lipomi, Z. Bao, Energy & Environmental Science 4 (2011) 3314-3328. [128] W. Courtney, S. Oyadiji, Journal of Materials Processing Technology 119 (2001) 379-
386. [129] A.R. Allafi, Effect of Different Percent Loadings of Nanoparticles and Food Processing
Conditions on the Properties of Nylon 6 Films, The Ohio State University, 2008. [130] N. Hinchiranan, W. Lertweerasirikun, W. Poonsawad, G. Rempel, P. Prasassarakich,
Journal of Applied Polymer Science 111 (2009) 2813-2821. [131] S. Abdou-Sabet, M.A. Fath, Thermoplastic elastomeric blends of olefin rubber and
polyolefin resin, Google Patents, 1982. [132] S. Chattopadhyay, T. Chaki, A.K. Bhowmick, Journal of applied polymer science 79
(2001) 1877-1889. [133] E. Prut, N. Erina, J. Karger‐Kocsis, T. edintseva, Journal of applied polymer science 109
(2008) 1212-1220. [134] J.A. Manson, Polymer blends and composites, Springer Science & Business Media,
2012. [135] R. Geilenkirchen, Rubber material and method for production thereof, Google Patents,
2010. [136] T. Xavier, (2012). [137] C. Bellan, G. Bossis, International Journal of Modern Physics B 16 (2002) 2447-2453. [138] K. Lee, B. Lee, C. Kim, H. Kim, K. Kim, C. Nah, Macromolecular Research 13 (2005) 441-
445. [139] A. Erosy, A. Kuntman, IU-Journal of Electrical & Electronics Engineering 7 (2007) 387-
391. [140] M. Bashir, M. Shahid, R. Alvi, A. Yahya, Effect of carbon black on curing behavior,
mechanical properties and viscoelastic behavior of natural sponge rubber-based nano-composites, Key Engineering Materials, Trans Tech Publ, 2012, pp. 532-539.
[141] K. Alderson, A. Pickles, P. Neale, K. Evans, Acta Metallurgica et Materialia 42 (1994) 2261-2266.
[142] W. Chen, F. Lu, D. Frew, M. Forrestal, Journal of Applied Mechanics 69 (2002) 214-223. [143] H. Zhang, EPDM-rubber in blends with NR/BR-elastomers for ozone-resistant tyre
sidewall applications, University of Twente, 2009. [144] P.J. Carr, D.L. Collett, Arrester bed system and method for airports and airfields, Google
Patents, 2011. [145] C.H. Jones, W.B. Johnson, J.M. Blaha, Impact energy absorbing composite materials,
Google Patents, 1999.
114
[146] F. Scarpa, F. Smith, Journal of intelligent material systems and structures 15 (2004) 973-979.
[147] B. Wang, H. Lu, G.-h. Kim, Mechanics of Materials 34 (2002) 475-483. [148] H.L. Yi, T. Wei, L. Heng, B.C. Zheng, Applied Mechanics and Materials 217 (2012) 517-
521. [149] E. Miloskovska, Structure-property relationships of rubber/silica nanocomposites via
sol-gel reaction, Dissertation, Eindhoven University of Technology, ISBN 978-90-386-3278-0, 2012.
[150] J.P. Rolland, R.M. Van Dam, D.A. Schorzman, S.R. Quake, J.M. DeSimone, Journal of the american chemical society 126 (2004) 2322-2323.
[151] M. Bolgar, J. Hubball, J. Groeger, S. Meronek, Handbook for the chemical analysis of plastic and polymer additives, CRC Press, 2007.