Embed Size (px)
Citation preview

University of Nebraska - LincolnDigitalCommons@University of Nebraska - LincolnTextiles, Merchandising and Fashion Design:Dissertations, Theses, & Student Research
Textiles, Merchandising and Fashion Design,Department of
12-2016
Development of Composites from Waste PET -Cotton TextilesMadhuri PalakurthiUniversity of Nebraska-Lincoln, [email protected]
Follow this and additional works at: http://digitalcommons.unl.edu/textilesdiss
This Thesis is brought to you for free and open access by the Textiles, Merchandising and Fashion Design, Department of atDigitalCommons@University of Nebraska - Lincoln. It has been accepted for inclusion in Textiles, Merchandising and Fashion Design: Dissertations,Theses, & Student Research by an authorized administrator of DigitalCommons@University of Nebraska - Lincoln.
Palakurthi, Madhuri, "Development of Composites from Waste PET - Cotton Textiles" (2016). Textiles, Merchandising and FashionDesign: Dissertations, Theses, & Student Research. 9.http://digitalcommons.unl.edu/textilesdiss/9

DEVELOPMENT OF COMPOSITES FROM WASTE PET - COTTON
TEXTILES
by
MADHURI PALAKURTHI
A THESIS
Presented to the Faculty of
The Graduate College at the University of Nebraska
In Partial Fulfillment of Requirements
For the Degree of Master of Science
Major: Textiles, Merchandising and Fashion Design
Under the Supervision of Professor Yiqi Yang
Lincoln, Nebraska
December, 2016

DEVELOPMENT OF COMPOSITE FROM WASTE PET – COTTON
TEXTILES
Madhuri Palakurthi, M.S
University of Nebraska, 2016
Advisor: Yiqi Yang
In this research, waste textile materials like polyethylene terephthalate (PET) and
cotton were compression molded into composites. The main idea was to use waste
textiles to develop composites like PET and cotton. PET acts as matrix and cotton as
reinforcement because PET is thermoplastic whereas cotton is non thermoplastic.
Approximately about 21 million tons of textile solid waste is being disposed into
landfills annually, leading to vast environmental properties and waste of valuable raw
materials. By using waste PET and cotton textiles there are technical as well as
environmental viabilities. However, implementing them into fabricating composites is not
widely conducted.
Compression molding is a feasible approach to use waste PET and cotton textiles
into fabricating composites that have good potential for industrial applications. In this
research, investigating the effects of plasticizers and alkalis on decreasing the processing
temperatures of composites was studied so that the cotton is protected during
compression molding. In the following paper, it is shown how plasticizers can be
effectively used to decrease the melting temperature of PET. The influences of chemicals
on the melting temperature of PET and the mechanical properties of the composites are
investigated. In my future research, the feasibility of compression molding PET and
cotton fabrics into composites with other chemicals will be studied. More molecular

characterizations of individual PET and cotton components plus static and dynamic
mechanical characterizations of composites will be conducted.

Dedicated to
My parents - Mr. Surender & Mrs. Sravani
Uncle and Aunt – Mr. Giri & Mrs. Shanthi

ACKNOWLEDGEMENT
First and foremost, I would like to thank my advisor, Professor Yiqi Yang, for
accepting me in his team. Without his constant moral support, this research would not
have been completed. I would like to express my deepest thanks and sincere appreciation
to Professor Helan Xu for her generous advice, kind endless help, and support during the
study. I would like to express my gratitude to Professor Rita Kean for her encouragement
through my graduate study experience in this department. I’m grateful for my textile
science team especially Zhuanzhuan Ma, Yi Zhao and Gangwei Pan for helping me
through my research.
I would like to acknowledge National Institute of Food and Agriculture (Multi-
State Project S1054 (NEB 37-037)), USDA Hatch Act and Agricultural Research
Division at University of Nebraska – Lincoln for giving me this opportunity to work on
this research. My graduate study experience at Department of Textiles, Merchandising
and Fashion Design benefitted greatly from the courses I took and various opportunities
explored.
Finally, I would like to acknowledge my family Mom (Sravani), Dad (Surender),
Uncle (Giri), Aunt (Shantha) and friends Lalitha, Suman, Shiva, Aditya, Vikas, Niruktha,
Gayathri, Pooja for providing me with unfailing love, support and unlimited
encouragement throughout my research.
Author
Madhuri Palakurthi

i
Table of Contents
CHAPTER 1: INTRODUCTION……………………………..…………………….….1
1.1 PET waste…………………………………………………………………………….………2
1.2 Cotton waste…………………………………………………………………………….……4
1.3 Phases of composites……………………………………………………………………….6
1.4 Polymer Matrix composites………………..…………………........................….…….7
1.5 Cellulose composites……………………..…….……………………………….……........7
CHAPTER 2: OBJECTIVES…………………………..………….………...…....…….9
CHAPTER 3: LITERATURE REVIEW …………………………………...…..…….10
3.1 Theoretical Model…………………………………………………………………………….14
CHAPTER 4: MATERIALS AND METHODS…………..…………………...……...15
4.1 Materials………………………………………………………………………………...........15
4.2 Composite fabrication…………………………..………………………………………..….17
4.2.1 Plasticization…………………………………………….………………..……..17
4.2.2 Hydrolysis………………………………………………………………………...………….…18
4.3 Materials characteristics……………………..……………….…….…………………......20
4.3.1 Mechanical properties………………..………………….….........................20
4.3.2 Thermal Analysis……………………………………......………….….……….21
4.3.3 Molecular Characterizations……………...…………………………..………22
4.3.4 Statistical Analysis…………..……………...…………………………..………22
CHAPTER 5: RESULTS AND DISCUSSION…………………….….………………23
5.1 Cotton effect……………………………………………………….……………………..……24
5.2 Plasticizer effect…….………………………….……..……………………………..……….29
5.3 Hydrolysis effect…………………………………………………….…………………......…46

ii
CHAPTER 6: CONCLUSIONS………………………………….…………………....50
CHAPTER 7: FUTURE PLAN ………………………….……..….………………….51
CHAPTER 8: BIBLIOGRAPHY ……………………….…….………......................52

iii
List of Tables
TABLE 1.1: COST OF COTTON WASTE…………………..…………………………...4
TABLE 1.2: PROPERTIES OF PET AND COTTON………………………………….…4
TABLE 4.1: LIST OF PLASTICIZERS AND ALKALIS………………………….……15
TABLE 4.2: PROPERTIES OF THE CHEMICALS…………………..………..……….16
TABLE 5.1: VALUES OF MECHANICAL PROPERTIES OF COTTON FABRICS….24
TABLE 5.2: DEGREE OF POLYMERIZATION VALUES OF COTTON………….….27
TABLE 5.3: VALUES OF MECHANICAL PROPERTIES OF PLASTICIZERS……...31
TABLE 5.4: STATISTICAL ANALYSIS OF TENSILE STRESS……………………....33
TABLE 5.5: STATISTICAL ANALYSIS OF TENSILE STRESS…………………..…..37
TABLE 5.6: STATISTICAL ANALYSIS OF TENSILE STRESS………………………40

iv
List of Flow Charts
FLOW CHART 4.1: THEORETICAL MODEL………………………………….……..14
FLOW CHART 4.2: PLASTIZATION TREATMENT………………………………….18
FLOW CHART 4.3: HYDROLYSIS TREATMENT…………….………...……………18
FLOW CHART 4.4: COMPOSITE FABRICATION……………………………………19

v
List of Figures
Figure 1.1: WASTE ANALYSIS………………………………………………..….……...1
Figure 5.1: MECHANICAL PROPERTIES OF COTTON FABRIC…………..………..24
Figure 5.2: INTRINSIC VISCOSITY OF COTTON…………………………..….…….27
Figure 5.3: THERMAL ANALYSIS OF PET WITH PLASTICIZERS…………………29
Figure 5.4: TEMPERATURE STUDY FOR TENSILE STRESS…………………….....33
Figure 5.5: TENSILES STRESS - LS Mean 95% confidence limit…………………….34
Figure 5.6: TEMPERATURE STUDY FOR TENSILE STRAIN……………..………..37
Figure 5.7: TENSILES STRAIN - LS Mean 95% confidence limit……………….…….38
Figure 5.8: TEMPERATURE STUDY FOR WORK OF RUPTURE………………...…40
Figure 5.9: WORK OF RUPTURE - LS Mean 95% confidence limit……………….…41
Figure 5.10: TEMPERATURE STUDY FOR FLEXURAL ANALYSIS…….…………44
Figure 5.11: SEM TO STUDY THE INTERFACIAL MORPHOLOGY……………….45
Figure 5.12: DSC OF PET/COTTON COMPOSITES WITH TMAH……………...…..46
Figure 5.13: TMAH EFFECT ON THE COMPOSITE FABRICATION……..……...…47
Figure 5.14: DSC OF PET/COTTON COMPOSITES WITH DMSO…………………..48
Figure 5.15: DMSO EFFECT ON THE COMPOSITE FABRICATION…………..…....49

vi
List of Abbreviations
Abbreviations Description
PET Polyethylene Terephthalate
PP Polypropylene
2PP 2 phenyl phenol
BBP Benzyl butyl phthalate
DAP Diallyl phthalate
BA Benzoic acid
MPa Mega pascal
DP Degree of Polymerization
TMAH Tetra methyl ammonium hydroxide
DMSO Dimethyl sulfoxide

1
Chapter 1: INTRODUCTION
Nowadays, the scope of development of composites from waste textiles paved a
way for increased research activities. The main purposes of using waste textiles are:
1) Textile waste is cheaper and profitable.
2) Most modern textile products are from synthetic materials, recycling this waste to
developing new composites can be environment-friendly.
Waste textiles are having a greater impact on the environment as they are being
disposed of in the landfill which takes a very long time to decompose. Materials
manufactured from non-renewable petroleum extracts tend to release gases while
decomposing which is hazardous to nature causing atmospheric pollution. According to
the United States environmental protection, and council of textile recycling, it is
estimated that 8.7% of the total solid waste in 2012 is from textiles, which is calculated as
approximately 21 million tons. The Secondary Materials and Recycled Textiles
Association estimated that 10.5 million tons of textiles are sent to landfills every year.
Solid textile waste mainly comprises of natural and synthetics. It is estimated that fabric
form blended with other types of materials comprises of about 73% of the synthetics. In
this case, it is difficult to reuse or separate from other materials like blends, dyes etc.
Figure 1.1: WASTE ANALYSIS

2
1.1 PET WASTE:
Polyethylene terephthalate (PET) is usually the major contributor to the textile
industry which is derived from non-renewable petroleum resources. It is estimated that
about 13-14 million tons of PET were being produced as waste annually in 2012. The
biggest disadvantage of PET is that it takes a large amount of time for decomposition and
degradation when it is disposed. PET waste can be reused, which helps in reducing
environmental pollution and saving valuable resources used in producing new PET. There
are the different ways of effectively using PET:
COMBUSTION/ INCINERATION:
It is a procedure used to generate energy from waste materials. By this process,
there is a scope of using about 80 – 90 percent of volume and 70 – 75 percent in weight
of waste being utilized.
The main disadvantage with this procedure is that the combustion process releases
dangerous gases into the environment, thereby causing environmental pollution.
DISCARD VIA LANDFILLS:
It is a major process used for getting rid of textile wastes which are calculated to
be about 90% of the total solid waste. In this method, the textile wastes are disposed into
landfills and allowed to degrade. Textiles comprising of synthetics or polymers take a
relatively large amount of time to degrade or decompose. This process involves many
disadvantages which are release of toxic chemicals, takes long time to decompose and
waste of valuable polymers

3
RECYCLING:
It is estimated that only 7.5 – 10% of waste PET is successfully being recycled.
The main idea of this method is to depolymerize PET using the techniques of hydrolysis,
methanolysis, and ammonolysis.
Hydrolysis: This procedure involves the chemical breakdown of a compound due
to reaction with water
Ammonolysis: This procedure is similar to hydrolysis in which ammonia reacts
with other compounds usually to form an amine.
Methanolysis: This procedure is used to produce biodiesel by the displacement of
alcohol from an ester by another alcohol like methanol, so the process also called as
called transesterification or alcoholysis.
Disadvantages involved in this method are high cost, high energy consumption and
complicated procedure.
REUSING:
It is a common process in practice. In this process, PET is melted and then
processed into new fibers and nonwovens. It is considered as a good method overall but
has some disadvantages i.e., it is hard to remove the color from the PET.

4
1.2 COTTON WASTE:
Cotton waste is estimated to be 4 – 5 million tons annually. Cotton waste is a
multiuse product which can be reused even after being disposed. Cotton waste is bio-
degradable and can be used in constructions, medical fields, and industrial purposes.
Cotton waste is also sold widely in large quantities. Here is a table which gives us the
cost of various types of waste cotton being sold worldwide. Usually, the bulk amount
varies between 50,000 kilograms to 100,000 kilograms.
TABLE 1.1: COST OF COTTON WASTE
CATEGORIES OF COTTON COST
White cotton waste $ 0.5 - $ 0.7
Colored cotton waste $ 0.17 - $ 0.25
Mixed cotton waste $0.10 - $0.15
Cotton threads and fiber waste $0.10 - $0.13
TABLE 1.2: PROPERTIES OF PET AND COTTON
PET COTTON
THERMAL BEHAVIOUR (°C) 260 149; 246
STRENGTH (g/denier) 2.5 to 9.5 Dry - 3.0 to 4.9
Wet - 3.3 to 6.0
ELONGATION AT BREAK (%) 15 – 20 8 - 10
LENGTH (mm) 32 – 102 (38) 22 – 31
SPECIFIC GRAVITY( g/cm3) 1.38 1.54
MOISTURE REGAIN (%) 0 – 0.4 7.0 – 8.5
5
Studies suggest that about one-third of PET earmarked for the textile industry is
being used to produce staple fibers, which are mostly blended with cotton fibers to make
PET/ cotton blend fabrics. PET/cotton blended fabrics are widely used in the
manufacturing of garments, home furnishings and other very commonly used household
textile products. Disposal of these PET/cotton blended fabrics is a grave environmental
concern due to polymer going into debris.
Unfortunately, the physical and chemical techniques of recycling pure PET are
not conclusive for recovering PET from PET/cotton blended fabrics. PET in blended
fabrics is intricately mixed with cotton fibers and cannot be separated mechanically.
Moreover, dissolving PET from the blends is not economically feasible since PET has
limited solvents that are very expensive and to make things worse, PET/cotton fabrics
contain plastic and metallic accessories like buttons and zippers, which cannot be easily
separated. Finally, the process of removing dyes (color) from PET is very complicated
and tedious.
There is a sustained and increasing pressure from environmental activists to
safeguard and preserve invaluable natural resources. Several nations paved a way for new
inventions and development for developing composites. Characteristics of PET and
cotton are having potential in developing the composites. PET is thermoplastic, lighter in
weight and has high strength. Cotton is non-thermoplastic and easily biodegradable.
Composites are materials made up of two or more dissimilar materials, which
when combined are stronger than their respective individual materials, as they usually
take up the desired characteristics of the individual materials. Composites can be easily
found in our daily lives. Wood is a classic example of a composite.

6
Composites are gradually replacing the conventional materials in various fields
ranging from appliances to space crafts, sporting goods to building industries due to their
low cost, eco-friendliness, and easy processing.
Stiffness, thermal expansion, strength and flexural properties of composites can
vary over a broad range depending on the fiber, resin and fabrication mechanisms during
manufacture. Nowadays, the popular textiles materials in composites are glass fiber,
aramid, and carbon fiber because these reinforcement fibers give composites high
strength and stiffness.
1.3 PHASES OF COMPOSITES
Composites generally have two phases. They are:
MATRIX PHASE:
It is a structural constituent, which determines the internal structure of
composites. The Matrix phase may contain a metal, a ceramic or a polymer.
REINFORCEMENT PHASE:
This phase is connected to the matrix phase by bonding. It adds rigidity to the
composites. Common fibers used for reinforcement include glass fibers, carbon fibers,
cellulose (wood/paper fiber & straw) and high strength polymers.
Polymers are cheap and can be easily fabricated into composites. Cellulose is
easily available and has good mechanical properties.
Textile industries mainly use polymers which are usually 60 – 70% and the
remaining is from cellulose which is apparently being wasted. Cellulosic fibers usually

7
take a large amount of time, more labor and resources for production. Hence, reusing the
waste textiles will help in a significant saving of time, resources and will lead to an
increase in revenues.
1.4 POLYMER MATRIX COMPOSITES:
Composites made with polymers are comprised of a variety of short or continuous
fibers bound together by an organic polymer matrix.
Advantages of Polymer Matrix Composites are High tensile strength, High
stiffness, High Fracture Toughness, Good abrasion resistance, Good puncture resistance,
Good corrosion resistance and Low cost.
Disadvantages of Polymer Matrix Composites are low thermal resistance and high
coefficient of thermal expansion.
1.5 CELLULOSE REINFORCED COMPOSITES:
Cellulose fibers have been used as reinforcing materials in combination with
polymeric materials for over 3000 years. The price of natural fibers is $200-1000 per
metric ton. Cellulose fibers are broadly classified into three types, depending on the part
of the plant from which they are extracted. Like bast or stem fibers (jute, flax, hemp,
ramie), leaf fibers (sisal, banana, manila, hemp, pineapple) and seed fibers (cotton, coir,
oil palm)
Natural fiber-reinforced polymer composites represent one of today’s fastest
growing industries. Natural fibers are gradually gaining significant importance in
technical applications and are used as an alternative to manmade fibers such as carbon,
glass or aramid.
Natural fibers have some of the special characteristics which cannot be found in

8
synthetic fibers, so by reinforcing polymers with natural fibers there is a scope for
improvement in mechanical properties such as stiffness and strength. These mechanical
properties differ from material to material depending on the source. Availability, price,
and performance are main factors to be considered while using cellulosic fibers. Despite
the variability in mechanical properties, natural fibers have more advantages than
thermoplastics such as low specific weight and low production cost. But cellulosic fibers
have a low thermal stability that results in the exclusion of some manufacturing processes
and also limits the use of the composites to low temperature applications.
Composites from polymers have been gaining in popularity due to their inherent
processing advantages. Among thermoplastics, polypropylene (PP) and polyethylene
terephthalate (PET) have outstanding properties like low density, good flex life, good
surface hardness, very good abrasion resistance and excellent electrical properties.
The composites prepared using cellulosic and thermoplastic materials are
undergoing some problems like the incompatibility between polar - hygroscopic fiber and
nonpolar - hydrophobic matrices.

9
Chapter 2: OBJECTIVES
Main objective is to develop composites from PET – cotton with good mechanical
properties. The goal is to use plasticization and hydrolysis treatment to reduce the melting
temperature of PET which further helps in ensuring better tensile stress, elongation and
work of rupture. This study aims to form at composites at lower temperatures to ensure
less damage to cotton fabrics.

10
Chapter 3: LITERATURE REVIEW An intensive literature review aided me understand that there isn’t enough
research being pursued in direction of reducing the melting point of PET in cotton
composites. On the other hand, significant amount of work has been done in the
development of composites from PET or cotton with polypropylene, HDPE, banana,
kapok, etc.
In this research, our primary focus was on using waste textiles such as cotton and
PET to prepare composites at a lower temperature with the intention of protecting the
cotton properties by reducing melting temperature of PET, so that resulting composites
have better mechanical properties.
Yi Zou et al (Yi Zou et al., 2011- “Reusing polyester/cotton blend fabrics for
composites”) were successful in producing composites from polyester and cotton blend
fabrics without using additional matrix or reinforcement materials. PET/cotton blend
composites were formed by treating with plasticizers like 2- Phenyl phenol and glycerol.
This process was successful in producing composites at 260 °C, 270 °C, 280 °C and 290
°C. The aim was to compare composites developed from untreated PET-cotton blend
fabrics to plasticizer-treated composites to reduce the time taken to fabricate composites.
Studies were able to produce regenerated cellulosic fibers from waste PET and
cotton blend textiles. N-methyl-morpholine N-oxide was used as a solvent to dissolve
cellulose materials and thereby separating from synthetic materials contained in the
original composition to obtain a cellulose solution according to Kazuyuki Yabuki et al
(Kazuyuki Yabuki et al., 2003 – “Process for producing regenerated cellulosic fibers”).
This cellulosic solution was used to produce high quality regenerated cellulosic fiber

11
through the high-speed spinning process. However, this process resulted in wastage of
valuable synthetic which could instead be reused thereby reducing the contribution
towards environmental pollution.
Until now, the ways of reusing cotton and PET waste textiles together was
described but they can also be reused separately. Cotton waste was usually reused in
shredded form. Shredded cotton was usually used as filling materials or to produce
regenerated cellulosic fibers or to produce composites using molten polymers. This
makes reuse of cotton easier compared to PET. This may be an effective way for using
cotton but, the lack of continuity of the fibers will have a negative impact on the
mechanical properties of the future materials. On the other hand, waste polymeric
materials like PET or PP (Leonard Y.Mwaikambo et al., 2000 – “Kapok/cotton fabric-
polypropylene composites”), (Maries Idicula et al., 2006 – “Thermophysical properties of
natural fiber reinforced polyester composites”) are melted and then used to develop
composites using natural fibers like banana, sisal. This process is not preferred due to its
lower mechanical properties resulting from poor interfacial adhesion between matrix and
reinforcement.
The study titled “Polyester cotton composites with graphite modified cotton as
reinforcement” by Hashmi et al (S.A.R.Hashmi et al., 2007) has shown that cotton
undergoes graphite modification which was used as reinforcement to polyester which can
be used to fabricate composites.
Review done by Layth Mohammed et al (Layth Mohammed et al., 2015 – “A
review on natural fiber reinforced polymer composites and its applications”) comparing
properties of composites prepared from cellulosic/cellulosic and cellulosic/synthetic

12
fibers. Composites prepared with two cellulosic fibers i.e., cellulosic/cellulosic are less
common when compared to cellulosic/synthetic fibers. Composites fabricated with
cellulosic/synthetic fibers are economical and retains better processing, mechanical,
physical, electrical, thermal and dynamic mechanical properties.
The study “Recycling of polyethylene terephthalate” by M.Evstatiev et al
(M.Evstatiev et al., 2002) helps in understanding the process of recycling the polyester,
methods, and characterization techniques to know the recycled polyester properties.
Hybrid Ramie Cotton Fabric Composites by C.Z Paiva Júniora (C.Z Paiva Júnior
a et al.,
2004), Natural fiber reinforced PET composites, Natural fiber reinforcement on other
polymers to form composites were few other studies which helped us in understanding
the fabrication of composites made from natural fibers with PET.
Most of the composites reported in the literature survey were formed at 260 °C.
At such a high temperature, there may be an adverse effect on the mechanical properties
of the constituent materials or the composites may become weak, mainly when using
natural fibers like cotton to develop composites. Also, the composites formed with high
amounts of chemicals such as alkalis, plasticizers etc. during the depolymerization
process, with an idea of lowering the melting point, may increase the treatment cost and
more importantly, affect the environment.
Continuous and dedicated research to reclaim valuable PET has used in many
physical and chemical techniques to recycle PET. The approach to reusing PET includes
melting the waste PET bottles to reproduce new products. Among all types of PET,
polyester fibers have good mechanical properties and therefore are easy to be reused
when compared to bottles or flakes. The chemical methods of recycling PET involve

13
depolymerizing the PET to obtain monomers and oligomers by hydrolysis, methanolysis
and ammonolysis. Among these methods, hydrolysis is the easy process and causes less
environmental problems.
Considering the achievements and the drawbacks of the various techniques
studied in the literature review, this research has harnessed a method for the development
of composites using 100% PET and 100% cotton waste textiles. Hydrolysis and
Plasticization are the types of treatment selected in our technique for decreasing the
melting point so that the composites can be prepared at a lower temperature thereby
reducing the damage to cotton from high temperatures.

14
1.1 THEORETICAL MODEL
FLOW CHART 3.1: THEORETICAL MODEL
Procedure considered for designing the theoretical model
100% PET and 100% cotton are the materials selected to develop composites.
PET has a melting point is 260°C and whereas cotton starts damages after 146°C. So the
main idea is to reduce the melting point of PET to protect cotton. PET undergoes
plasticization and hydrolysis to reduce its melting temperature. PET is tested with DSC
(Differential scanning calorimetry) which is a thermal analysis to check whether the
melting point is decreased or not. Treated PET and cotton are compressed into a
composites using compression molding. Composites is tested for mechanical properties
like strength, elongation, work of rupture, Flexural rigidity etc.

15
Chapter 4: MATERIALS AND METHODS
4.1 MATERIALS
Plain woven fabrics of 100% cotton and 100% PET are considered in fabricating
the composites. The fabrics are supplied by Limian Textile Company, Wuxi, China.
Cotton is used as reinforcement whereas polyester is used as a matrix in fabricating the
composites. Alkali and plasticizers are used to treat PET, which are reagent grade
chemicals from VWR international, Bristol, CT. The Table 4.1 presented below lists the
chemicals used in plasticization and hydrolysis processes and Table 4.2 presents the
properties of chemicals listed in Table 4.1.
TABLE 4.1: LIST OF PLASTICIZERS AND ALKALI
For plasticization For hydrolysis
2 Phenyl phenol (2PP)
Benzyl Butyl Phthalate (BBP)
Diallyl Phthalate (DAP)
Benzoic Acid
Dimethyl Sulfoxide (DMSO)
Tetra methyl ammonium hydroxide (TMAH)

16
TABLE 4.2: PROPERTIES OF THE CHEMICALS
Chemicals Chemical formula Density(g
/cm³)
Boiling
point(°C)
2 Phenyl phenol (2PP) C12H10O 1.293 280 to 284
Butyl benzyl phthalate (BBP) CH3(CH2)3OOC6C
H4COOCH2C6H5
1.12 295
Diallyl phthalate (DAP) C6H4(COOCH2CH
=CH22) 2
1.05 340
Benzoic Acid (BA) C7H6O2 1.27 249.2
Dimethyl sulfoxide (DMSO) C2H6OS
1.1004
189
Tetramethylammonium
hydroxide (TMAH)
C4H13NO
~1.015 Decomposes
The Chemicals used are:
Plasticizers for plasticization:
Phenyl Phenol (2PP) is an organic compound containing 2 benzene rings linked together
with a hydroxyl group
Benzyl butyl phthalate (BBP) is an ester of phthalic acid, benzyl alcohol, and n-butanol.
Diallyl phthalate (DAP) is a Diallyl ester of o-phthalate acid which can be used as a
plasticizer and for polymerization.
Benzoic Acid is a colorless crystalline solid with a simple aromatic carboxylic acid.
Alkali for hydrolysis:
Tetra methyl ammonium hydroxide is a quaternary ammonium salt and is a stable solid
form only as a pentahydrate.

17
Dimethyl sulfoxide is an organosulfur compound. It is a colorless liquid which can
dissolve both polar and nonpolar compounds and can be dissolved in a wide range of
organic solvents as well as water.
Hydrolysis treatment was not effective in reducing the melting point of PET
whereas plasticizers were able to reduce the melting point of PET. The main advantage of
this is that the composites formed at lower temperature retain better mechanical
properties when compared to composites prepared with no treatment. Therefore it is
better to fabricate composites at lower temperatures as lower temperatures leave lesser
damage on cellulosic materials.
4.2 COMPOSITES FABRICATION:
100% cotton and 100% polyester were cut into the required sizes and were treated
with plasticizer and alkali. To achieve good penetration level, polyester fabric is treated
using the techniques described below:
4.2.1 PLASTICIZATION:
In this procedure, PET was treated with plasticizers which have high density, so
the penetration of the chemicals into the PET fabrics is difficult when treated. The
amount of plasticizer required for the treatment is selected based on the weight of the
fabrics. For our experimentation, 10% of Plasticizer was selected. Fabric to liquor ratio
was about 1:3. Ethanol was selected as solvent to dissolve the plasticizer. Once the
plasticizer is dissolved completely, it is sprayed on the fabrics followed by removal of
solvent.

18
FLOW CHART 4.1: PLASTICIZATION TREATMENT
4.2.2 HYDROLYSIS:
In this procedure, PET was treated with alkali selected on the weight of the
fabrics. For this study, 10% of the alkali was selected. Water was used as solvent selected
to dissolve the alkali. Once the alkali was completely dissolved in water, the alkali
solution and fabrics are sealed in a canister. The canister was then placed in an oven for
30 min at a temperature of 130°C. The fabric was then removed from the canisters and
rinsed completely.
FLOW CHART 4.2: HYDROLYSIS TREATMENT
After the fabric was completely dried, 7 samples of treated polyester and 5
samples of cotton were stacked together alternatively and placed between two aluminum
sheets coated with Teflon. This is to ensure that the melted polyester will not stick to the
compressing plates.
PET
Plasticizer +
Ethanol
Solvent Removal
PET
Alkali +
Water
Oven: Temp – 130°C
Time – 30 min Rinsed and Dried

19
Mechanical hot press or laboratory scale compression molding press (Carver, Inc.,
Wabash, IN, USA) was selected from developing composites post-treatment. Hot press
was preheated to the desired temperature to make the composites. For this study, the
selected temperatures were 240°C, 250°C, 260°C and 270°C. Treated fabrics are hot
pressed at 240°C, 250°C, 260°C and 270°C whereas untreated fabrics are formed into
composites at 260°C and 270°C. The amount of time in the hot press also affects the
mechanical properties and flexural properties of the sample. Samples are developed at
3.5mins (210 seconds) (here time refers to the amount of time a sample is held inside the
hot press.)
FLOW CHART 4.3: COMPOSITE FABRICATION
The layers of the fabrics were evenly arranged and placed between 2 plates and pressure
of 10,000 pounds or 200 psi was applied to them for the 3.5 mins (210 seconds). Finally,
PET
Plasticizer Treatment
Treated PET
+
Cotton
Compression Molding
Temp - 240°C, 250°C,260°C and 270°C
Time – 3.5min
Hydrolysis Treatment

20
the compressing molding press was turned off and cold tap water was turned on until the
machine cools down. The composites were carefully removed and cut into samples as per
dimensions for further tests.
4.3 MATERIAL CHARACTERISTICS
4.3.1 MECHANICAL PROPERTIES
4.3.1.1 STATIC TENSILE ANALYSIS
Tensile stress is defined as the expansion caused due to the equal and opposite
force applied on a body in a tensile direction thereby causing expansion in the samples.
The principle used is the constant rate of traverse. The graphs were formed using this data
to compare the difference between samples which helps us to do time and temperature
study.
Tensile strain was used to test the elastic nature of the composites. The
comparison study of elongation for treated PET-cotton composites against untreated
PET-cotton composites was done. Higher tensile strain makes the composites more
durable, thereby making the composites effective for various purposes.
Work of rupture is defined as the energy required in breaking a material. It helps
us to know the amount of stress and strain a sample can take before it gets ruptured.
Composites were conditioned in a standard testing atmosphere of 21 °C and 65%
relative humidity for at least 24 hours before performing the test. Each data point was
average of 5 or higher tested samples which are taken from different composites prepared
under similar conditions.
Tensile test of PET-cotton composites was carried out on an MTS tester
(QTest/10) according to the procedure of ASTM D638-03 using a 2000 pounds load cell.

21
The samples are cut in dog bone shape with a length of 165 mm, with a width of the
widest section as 19 mm, width at the narrow section as 13 mm, and gauge length for
testing as 115 mm.
Samples were carefully placed between the clamps of the tensile testing machine
which runs under the principle of the constant rate of traverse as previously mentioned.
Once the sample was tested the software helps us in generating the data automatically.
The output data required can be selected ahead like stress, strain, modulus, energy etc.
The output data received from the software was imported into an Excel file and all the
means are calculated and graphs were developed which helps us to evaluate the
mechanical properties of the composites.
4.3.1.2 STATIC FLEXURAL ANALYSIS
Flexible rigidity was the study of flexible nature of composites. The composites
were cut into sample sizes and then tested for flexibility.
After the composites were cut into required sizes, an MTS Qtest/10 tester was
used to determine the flexural properties of PET – cotton composites. According to the
procedure ASTM D790-03, the size of samples was 20.3 cm x 7.6 cm with support length
of 15.2 cm, and load of the cell was 2000 pounds with a crosshead speed of 10mm/min
for the three-point-bend tests. The data was then imported into Excel and required graphs
were developed to analyze the efficiency of the composites.
4.3.2 THERMAL ANALYSIS
DIFFERENTIAL SCANNING CALORIMETRY
A mettle Toledo DSC is used in this study, which enables us to study the effect of
alkali and plasticizers on PET under a wide range of temperatures. The samples are

22
sealed in the aluminum cans, with both the treated and untreated samples. The weight of
sample is less than 5 mg. The experiment is conducted from 25 °C to 280 °C with a
heating rate of 25 °C/min and 280 °C to 25 °C with a cooling rate of 15°C/min. This
experiment is carried out under a nitrogen atmosphere.
4.3.3 MOLECULAR CHARACTERIZATION
INTRINSIC VISCOSITY
Intrinsic viscosity was used to measure the solute’s (cotton) concentration in the
viscosity of the solution. Cotton was hot pressed at four different temperatures 240 °C,
250 °C, 260 °C and 270 °C. Solvent selected to dissolve cotton was copper ethylene
diamine. The solution was continuous stirred for 36-48 hours to ensure uniformity. A
large water bath was prepared and temperature of water was maintained at 25 °C.
Dissolved solution was taken into Viscometer. The time required for the solution to flow
between two points was recorded. This recorded time helps us to calculate viscosity using
the viscosity table which helps us to measure the Degree of polymerization (DP). Using
the DP values the extent of damage in the cotton fabrics due to hot press can be
estimated.
Example: The longer the time, higher is the degree of polymerization of the solution.
This means the length of cellulose molecules is longer. On the other hand, if it takes less
time than DP is less and therefore, length of cellulose molecules is shorter.
4.3.4 STATISTICAL ANALYSIS
Fisher’s least significant difference (LSD) provided by the SAS (SAS Institute
Inc., NC) software was used in order to analyze the results of composites prepared from
polyester & cotton under various temperatures and times.
23
Chapter 5: RESULTS AND DISCUSSION
PET-COTTON COMPOSITES:
Results from the test performed on fabricated composites fall under three different
categories as follows:
5.1 COTTON EFFECT – THERMAL DEGRADATION OF COTTON
Cotton effect is studied to understand the effect of temperature on cotton fabrics.
Mechanical properties and molecular characterization selected to analyze cotton behavior.
5.2 PLASTICIZER EFFECT
Plasticizer effect was studied using thermal analysis using DSC, mechanical
properties are categorized into static tensile analysis and flexural rigidity, interfacial
morphology and statistical analysis.
5.3 HYDROLYSIS EFFECT
Hydrolysis effect is studied using thermal analysis using DSC and mechanical
properties by static tensile analysis.

24
5.1 COTTON EFFECT – THERMAL DEGRADATION OF COTTON
5.1.1 Mechanical Properties
TABLE 5.1: VALUES OF MECHANICAL PROPERTIES OF COTTON FABRICS
Tensile stress Tensile strain Work of Rupture
MEAN SD MEAN SD MEAN SD
ORIGINAL 77.51229 3.793531 11.625 0.894917 58.52957 4.817601
240 65.62 5.6 10.98 0.69 44.36 6.125
250 62.96271 4.361044 9.524286 0.332739 36.08471 3.893688
260 53.833 2.465985 8.947714 0.312184 28.71114 1.631946
270 47.40671 2.884851 7.705714 0.472878 21.18171 2.507454
0
10
20
30
40
50
60
70
80
90
Ten
sile
Str
ess
(M
Pa)
Temperature (°C)
0
2
4
6
8
10
12
14
Ten
sile
Str
ain
(%
)
Temperature (°C)

25
Figure 5.1: MECHANICAL PROPERTIES OF COTTON FABRIC
For testing mechanical properties five different conditions are considered. Out of
those four of them are hot pressed at a temperature of 240 °C, 250 °C, 260 °C and 270 °C
for a time of 1 minute and the other is the control which has no heat treatment. The
samples are prepared according ASTM standard which is 75mm length and 15mm width.
These samples are carefully placed between the clamps of MTS QTest/10 which runs on
the principle of the constant rate of traverse. For testing the samples 30 samples in each
condition are considered to reduce the standard error. These results help us understand
the effect of cotton fabrics on the final composites. Poor mechanical properties of cotton
fabrics influence the mechanical behaviour of composites. From Table 5.1 the values of
tensile stress, tensile strain and work of rupture reduces as temperature increases were
shown. So this implies poor mechanical properties when compared to control. Figure 5.1
0
10
20
30
40
50
60
70
Wo
rk o
f R
up
ture
(kg
*mm
)
Temperature (°C)

26
helps us understand the trend of decrease in the properties.
Tensile stress indicates the strength of the fabrics, from the graph the strength of
control is more when compared to samples which are hot pressed. Strength decreases due
to the damage to the cotton fabrics while hot press. So as the temperature increases the
contribution of strength by cotton fabrics towards composites tend to decrease. The same
trend was observed in the tensile strain and work of rupture. In case of tensile strain,
elongation decreases as the treatment temperature increases resulting in poor elongation
when compared to control. As observed in the tensile stress graph, strength of the fabric
is reducing with temperature which means less amount of energy to break it. This
cements the results observed in Work of Rupture graph, an inverse relationship between
amount of energy and temperature was observed.
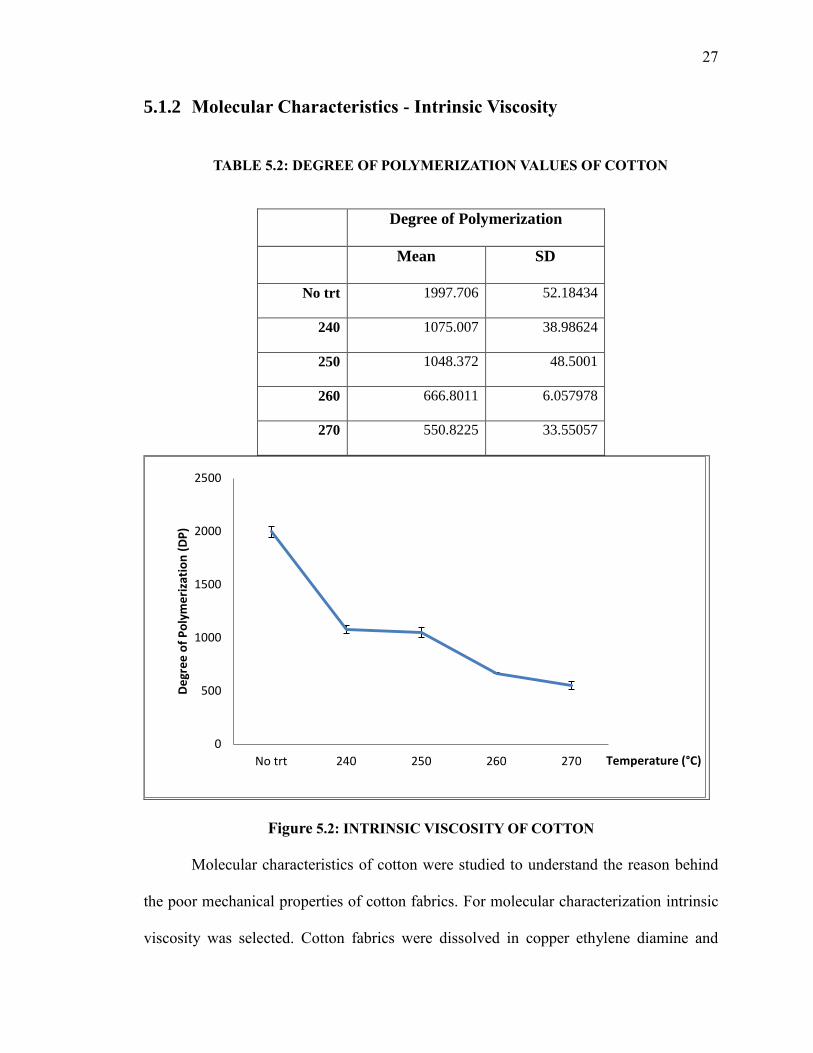
27
5.1.2 Molecular Characteristics - Intrinsic Viscosity
TABLE 5.2: DEGREE OF POLYMERIZATION VALUES OF COTTON
Degree of Polymerization
Mean SD
No trt 1997.706 52.18434
240 1075.007 38.98624
250 1048.372 48.5001
260 666.8011 6.057978
270 550.8225 33.55057
Figure 5.2: INTRINSIC VISCOSITY OF COTTON
Molecular characteristics of cotton were studied to understand the reason behind
the poor mechanical properties of cotton fabrics. For molecular characterization intrinsic
viscosity was selected. Cotton fabrics were dissolved in copper ethylene diamine and
0
500
1000
1500
2000
2500
No trt 240 250 260 270
De
gre
e o
f P
oly
me
riza
tio
n (
DP
)
Temperature (°C)

28
tested for the viscosity. For the testing, five different fabrics were tested in each category
and each fabric is tested thrice to reduce the standard error. From the Table 5.2 decrease
in DP was observed as temperature increases.
Figure 5.2 helps us understand the damage to cotton caused by temperature effect
due to hot press at higher temperatures i.e., 240 °C, 250 °C, 260 °C and 270 °C when
compared to control (No trt). The gradual decrease in the Degree of Polymerization (DP)
which helps us understand that the number of monomers or the polymer length is
decreasing as the treatment temperature increases resulting in weak cotton fabrics. DP
helps us understand the length of polymer chain, lesser the DP shorter the fibers and
higher DP indicates longer fibers hence resulting in good mechanical properties. From
Figure 5.2 the DP of control (No trt) is 1997.706 which is very high. When compared this
value to samples treated at 270 °C DP is 550.8225 implying an almost 1/4th
reduce in the
length of the polymer. At 240 °C the value is about 1075.007 and at 250 °C it is 1048.372
which are relatively higher DP than fabrics treated at 270 °C. Therefore composites
fabricated at 240 °C and 250 °C have less damage to cotton fabrics. Hence, lesser DP
results in shorter fiber length or less polymer length resulting in the poor mechanical
properties of composites.

29
5.2 PLASTICIZER EFFECT:
PET fabrics are treated using plasticizers i.e., 2PP (2 phenyl phenol), BBP
(Benzyl butyl phthalate), DAP (Diallyl phthalate) and BA (Benzoic acid). Test methods
used for these composites are thermal analysis using DSC (Differential scanning
calorimetry), Mechanical properties like static tensile analysis and Flexural analysis using
MTS QTest/10, Interfacial Morphology using SEM (scanning electron microscope) and
statistical analysis is done for the above results using least significant difference.
The above results will help us understand which plasticizer exhibits better properties.
5.2.1 THERMAL ANALYSIS - DIFFERENTIAL SCANNING CALORIMETRY:
Figure 5.3: THERMAL ANALYSIS OF PET WITH PLASTICIZERS
No treatment
2PP
BBP
Benzoic Acid
DAP

30
Figure 5.3 helps us to understand the change in the melting point by plasticizer
treated PET. The graph shows melting peaks of PET samples that underwent different
treatments. The first graph is a PET sample with no treatment where the melting peak is
at 260 °C, which can be considered the control. The second graph shows PET treated
with 2PP for which melting peak is at 230 °C which is significantly lower than the
control. The remaining graphs show PET treated with BBP, DAP and BA respectively
where the melting peaks are all 240 °C, which are also less than the control. Therefore the
plasticizer treatment of PET significantly reduces its melting point. Further study of
mechanical properties will help us understand the effect of Plasticizers on composites
fabricated at lower temperatures.
From the study done by Yi Zou the melting point of PET was influenced by
plasticization treatment using 2PP and glycerol. Using 2PP for the treatment and
increased our search in finding plasticizer whose melting point and chemical structure are
similar to PET. The chemicals with higher melting point are selected which are
mentioned in Table 4.2.

31
5.2.2 STATIC TENSILE ANALYSIS
TABLE 5.3: VALUES OF MECHANICAL PROPERTIES OF PLASTICIZERS
Tensile Stress Tensile Strain Work of Rupture
Mean SD Mean SD Mean SD
240
2PP 43.589 1.991 2 0.152 143.166 17.96
BBP 45.088 5.837 3 0.453 144.841 46.921
DAP 35.981 4.901 2.21 0.491 140.193 19.037
BA 39.867 5.764 2.445 0.583 132.823 14.238
250
2PP 36.24 6.519 1.755 0.279 75.611 25.394
BBP 40.166 4 2.481 0.322 140.148 35.146
DAP 30.489 6.234 1.843 0.141 120.374 23.347
BA 30.8742 4.19 2.1087 0.34 100.731 12.463
260
2PP 36.608 3.913 2.542 0.2 51.786 15.415
BBP 12.882 0.619 2.288 0.248 81.397 3.339
DAP 24.848 9.342 1.28 0.123 80.563 5.24
BA 19.182 2.634 137.76 0.176 79.341 8.834
no trt 9.051 0.866 3.535 0.31 50.7 5.401
270
2PP 28.091 1.659 2.488 0.439 18.595 9.253
BBP 17.76 2.231 1.542 0.189 10.817 1.929
DAP 12.344 8.732 1.012 0.124 8.092 4.293
BA 10.53 4.276 0.978 0.177 15.834 2.42
no trt 8.34 1.055 1.79 0.3 18.72 6.73

32
For mechanical properties, composites are fabricated at four different
temperatures 240 °C, 250 °C, 260 °C and 270 °C for 3.5 mins with a pressure of 10,000
pounds or 2,000 psi. Composites are developed under five categories which includes
plasticizer treatments with 2PP, BBP, DAP, BA and no treatment. The samples are tested
for static tensile test like tensile stress, tensile strain and work of rupture. Samples are
prepared by following ASTM standards which are dog bone in shape. The dimensions of
the samples are length of 165 mm, width of the widest section is 19 mm and width at the
narrow section is 13 mm. From the table above it can be observed that composites
prepared at 240 °C and 250 °C tend to have better properties when compared to
composites fabricated at no treatment. Composites prepared at lower temperature and
good mechanical properties are considered to be better composites.

33
5.2.2.1 TENSILE STRESS
Figure 5.4: TEMPERATURE STUDY FOR TENSILE STRESS
TABLE 5.4: STATISTICAL ANALYSIS OF TENSILE STRESS
0
5
10
15
20
25
30
35
40
45
50
2PP BA BBP DAP no trt
240 250 260 270
B C
E
I
D
F H
L
A
D
F
K
E
G
J
M M N
T Grouping for temp(trt)
Least Squares Means (Alpha = 0.05)
LS-means with the same
letter are not significantly
different.
trt temp Estimate
BBP 240 45.0880 A
2PP 240 43.5841 B
2PP 250 41.2435 C
BBP 250 40.1670 D
BA 240 39.8676 D
2PP 260 36.6080 E

34
In Figure 5.4 comparing all the plasticizer treated composites with the control (no
trt) which indeed helps us understand the effect of the chemical treatment on the
composites.
DAP 240 35.9809 E
BBP 260 33.1038 F
BA 250 32.8743 F
DAP 250 31.4897 G
BA 260 29.1825 H
2PP 270 28.0913 I
DAP 260 24.8487 J
BBP 270 17.7607 K
BA 270 15.5350 L
DAP 270 12.3446 M
none 260 12.0512 M
none 270 8.3411 N
Figure 5.5: TENSILES STRESS - LS Mean 95% confidence limit

35
Tensile stress values using Table 5.4 and Figure5.5 show that 240-BPP gives the
best result with the highest value at 45.0880 (standard error = 0.3642) and is not
significantly different (estimate = 3.4172, standard error = 0.5151, p-value = <.0001)
from 240-2PP at 43.5841 (standard error = 0.03642). These two values perform
significantly better than the other values as shown in the Least Squares Means table
above and also shown by the average of the two highest values being significantly
different from the next highest value, 240-2PP and BPP vs 250-BPP (estimate = 8.3382,
standard error = 0.8922, p-value < 0.0001). The highest value is significantly different
from the lowest value, 240-BPP vs none-270 (estimate = 35.2431, standard error =
0.5151, p-value < 0.0001). Compare the estimates like 2PP vs BBP (estimate = 13.4075,
standard error = 1.0401, p-value ≤ 0.0001) which has the least difference when compared
to the others like 2PP vs BA (estimate = 32.0675, standard error = 1.0302, p-value ≤
0.0001) , 2PP vs DAP (estimate = 44.8631, standard error = 1.0302, p-value ≤ 0.0001)
and 2PP vs none (estimate = 75.1404, standard error = 1.2618, p-value ≤ 0.0001) which
are estimated to have a huge difference between the treatments.
From these analyses, the composites prepared with plasticizer treatments of 2PP
and BBP have better strength and the significant difference is very less whereas when
compared to other composites they have poor strength and difference between the
estimates is high. Higher strength is due to higher interfacial bonding between PET and
cotton and less damage to the cotton fabric resulting in a better mechanical property.
There is a decrease in the strength of the composites as the treatment temperature
increases. At 260°C and 270°C, plasticizer treated composites has better strength than the
other composites and composites fabricated with no treatment tend to have lowest

36
strength. Overall composites prepared with BBP and 2PP have higher strength when
fabricated at lower temperature but overall composites prepared with plasticizer treatment
tend to exhibit higher strength than composites fabricated with no treatment.

37
5.2.2.2 TENSILE STRAIN:
Figure 5.6: TEMPERATURE STUDY FOR TENSILE STRAIN
TABLE 5.5: STATISTICAL ANALYSIS OF TENSILE STRAIN
0
0.5
1
1.5
2
2.5
3
3.5
2PP BA BBP DAP no trt
240 250 260 270
A
E E
F
B
D
E
H
A
B C
F
C
E
G
H
F
I
T Grouping for temp(trt)
Least Squares Means (Alpha=0.05)
LS-means with the same
letter are not significantly
different.
trt temp Estimate
BBP 240 3.0100 A
2PP 240 3.0027 A
BBP 250 2.4813 B
BA 240 2.4453 B
BBP 260 2.2884 C
DAP 240 2.2100 C
BA 250 2.1087 D

38
Figure 5.7 helps us understand the amount of elongation a sample can undergo
before it breaks. Composites prepared at 240°C have the highest elongation when
compared to the composites fabricated at other temperatures.
From Table 5.5 and Figure 5.7, tensile strain of 240-BPP performs the best with
the highest value at 3.01 (standard error = 0.0331) and is not significantly different
DAP 250 1.8433 E
2PP 260 1.8423 E
BA 260 1.7653 E
2PP 250 1.7553 E
BBP 270 1.5427 F
none 260 1.5353 F
2PP 270 1.4887 F
DAP 260 1.2850 G
DAP 270 1.0120 H
BA 270 0.9789 H
none 270 0.7961 I
Figure 5.7: TENSILES STRAIN - LS Mean 95% confidence limit

39
(estimate = .007, standard error = 0.04, p-value = 0.8756) from 240-2PP at 3.0027
(standard error = 0.0331). These two values perform significantly better than the other
values as shown in the least squares means Table 5.5 and also shown by the average of
the two highest values being significantly different from the next highest value, 240-2PP
and BPP vs 250-BPP (estimate = 1.05, standard error = 0.08, p-value < 0.0001). The
highest value is significantly different from the lowest value, 240-BPP vs none-270
(estimate = 2.21, standard error = 0.046, p-value < 0.0001). Comparing the estimates like
2PP vs BBP (estimate = 0.5213, standard error = 0.04681, p-value < 0.0001) have least
significant difference when compared to 2PP vs BA (estimate = 0.7908, standard error =
0.09362, p-value < 0.0001), 2PP vs DAP (estimate = 1.7387, standard error = 0.09362, p-
value < 0.0001) and 2PP vs none (estimate = 3.4950, standard error = 0.1147, p-value <
0.0001) which are estimated to have a huge difference between treatments.
From this analysis, 2PP and BBP treated composites exhibit better elongation and
the significant difference between both is less which makes them fall under same range.
Composites prepared from other plasticizers like BA and DAP also have good elongation
than control but less when compared to 2PP and BBP. Composites prepared at 270 °C
with DAP and no treatment have poor elongation.

40
5.2.2.3 WORK OF RUPTURE:
Figure 5.8: TEMPERATURE STUDY FOR WORK OF RUPTURE
TABLE 5.6: STATISTICAL ANALYSIS OF WORK OF RUPTURE
T Grouping for temp(trt)
Least Squares Means (Alpha=0.05)
trt temp Estimate
BBP 240 144.84 A
2PP 240 143.80 A
DAP 240 140.19 B
BA 240 132.82 C
BBP 250 120.15 D
DAP 250 100.37 E
BA 250 89.7310 F
BBP 260 81.3928 G
BA 260 79.3637 H
DAP 260 75.5634 I
2PP 250 75.4923 I
0
20
40
60
80
100
120
140
160
2PP BA BBP DAP no trt
240 250 260 270A
I
J
K
C
F H
L
A
D
G
M
B
E
I
N
J
O

41
T Grouping for temp(trt)
Least Squares Means (Alpha=0.05)
trt temp Estimate
2PP 260 51.7863 J
none 260 50.6753 J
2PP 270 30.6306 K
BA 270 25.7059 L
BBP 270 23.6595 M
DAP 270 18.0408 N
none 270 15.7853 O
Amount of energy required to break the composite is measured from Figure 5.8.
Composites prepared with at 240 °C BBP need more energy to rupture the composites
whereas DAP and BA require less energy. At 250 °C BBP, BA and DAP require more
energy to break and 2PP requires less. At 260 °C and 270 °C composites with treatment
require more energy when compared to control. Composites fabricated with treatment
Figure 5.9: WORK OF RUPTURE - LS Mean 95% confidence limit

42
tend to show better work of rupture indicating that treatment is effective in protecting the
cotton and developing better composites.
Work of rupture according to Table 5.6 and Figure 5.9 show that 240-BPP is
performing the best with the highest value at 144.84 (standard error = 0.6038) and is not
significantly different (estimate = -0.007, standard error = 0.04, p-value = 0.8756) from
240-2PP at 143.80 (standard error = 0.6038). Estimates help us understand the results
better. Comparing 2PP at 240 and BBP at 250 (estimate = 23.6478, standard error =
0.8540, p-value = <.0001),2PP vs BA (estimate = -25.9189, standard error =1.7079, p-
value = <.0001), 2PP vs BPP (estimate = -68.3369, standard error =1.7079, p-value =
<.0001), 2PP vs DAP (estimate = -32.4663, standard error =1.7079, p-value = <.0001),
2PP vs none (estimate = 114.50, standard error =2.9018, p-value = <.0001), 240 vs 250
(estimate = 175.91, standard error = 1.7079, p-value = <.0001) and 240 vs 260 (estimate
= 290.63, standard error = 1.6203, p-value = <.0001) above results helps us to understand
that the composites fabricated at 240 °C had better properties than composites at other
temperatures.
From this analysis, composites developed at 240 °C with BBP and 2PP require
more energy to break the composites compared to composites formed at other
temperatures. Overall composites fabricated at lower temperature tend to require more
energy to break than the composites developed at higher temperature because at that high
temperature there is large impact on cotton causing it to damage resulting in reduction of
mechanical properties of the composites.
Static tensile analysis calculated from above figures helps us understand that
composites fabricated at lower temperature with plasticization treatments are better when

43
compared to composites by Yi Zou “Reusing polyester/cotton blend fabrics for
composites” - composites were fabricated at higher temperatures and exhibits poor
mechanical properties. The poor mechanical properties is due to the damage caused to the
cotton which was proved by mechanical and molecular characteristics of cotton fabrics
calculated in cotton effect.
Composites using plasticizer 2PP were developed in Yi Zou’s research but they
were fabricated at higher temperature, composites are developed at lower temperature
which was not focusing in there research. Composites fabricated at lower temperature
exhibit higher strength in case on BBP at 260 °C tensile stress 33 MPa and the control at
260 °C is 12 MPa. There was a 175% increase in the strength due to the plasticizer
treatment. In the same way the elongation and work or rupture are influenced by treating
them with plasticizers. Indicating that composited developed at lower temperature with
plasticization treatment exhibit better mechanical properties when compared to
composites fabricated with no treatment.

44
5.2.3 STATIC FLEXURAL ANALYSIS:
Figure 5.10: TEMPERATURE STUDY FOR FLEXURAL ANALYSIS
Flexural rigidity is studied measuring peak stress using testing machine MTS
Qtest/10. Samples are prepared according to standard ASTM and conditioned for 24
hours before testing.
From the above Figure 5.10, composites fabricated at 250 °C show more
flexibility and as the temperature increases the flexibility tends to decrease. Composites
prepared with plasticizer treatment have higher flexibility when compared to control (no
trt). Among all the plasticizers BA tend to show lower flexibility. At 260 °C the highest
flexibility is for BBP whereas least is for BA and no treatment which explains us that
composites have low flexibility as the temperature increases causing poor mechanical
properties.
0
0.02
0.04
0.06
0.08
0.1
0.12
0.14
0.16
0.18
0.2
2PP BA BBP DAP NO TRT
240 250 260 270

45
5.2.4 INTERFACIAL MORPHOLOGY
Figure 5.11 – SEM TO STUDY THE INTERFACIAL MORPHOLOGY
SEM helps us to understand the interfacial bonding and structure of individual
compounds during different temperatures of hot press. On the left side, long cotton yarns
which are intact with melted polyester or PET at a temperature of 240 °C for 3.5 mins.
Whereas the picture on the right is taken at 260 °C for 3.5 min, it clearly shows in figure
5.11that cotton fibers are broken into smaller pieces which help us to understand the
effect of temperature on the cotton. Cotton fibers are damaged or broken as temperatures
increase which gives us an explanation behind the poor mechanical properties of the
composites. Composites prepared at 240 °C have longer cotton fibers which contribute to
better mechanical properties when compared to the composites fabricated at 260 °C. The
presence of continuous cotton fibers provides better mechanical properties to composites
prepared at 240 °C compared to the ones prepared at 260 °C.

46
5.3 HYDROLYSIS EFFECT
5.3.1 TETRA METHYL AMMONIUM HYDROXIDE - TMAH
5.3.1.1 Thermal Analysis: Differential Scanning Calorimetry
Figure 5.12 - DSC OF PET/COTTON COMPOSITES WITH TMAH
From Figure 5.12 DSC graph gives as melting peak which helps us to study the
thermal behavior of the composites. In the above graph appears to be at 260 °C which
means that there is not shift in the melting point of PET but hydrolysis treatment.
Hydrolysis treatment using TMAH was not successful in reducing the melting point of
PET and composites cannot be fabricated at a temperature lower than 260 °C.

47
5.3.1.2 Mechanical Analysis – Static Tensile Analysis
Figure 5.13: TMAH EFFECT ON THE COMPOSITE FABRICATION
Mechanical properties of composites which were fabricated at 260 °C for 1.5 min
are studied. Composites were prepared with 0% TMAH and 10% TMAH. Mechanical
properties like strength, elongation, and work of rupture are tested.
From Figure 5.13 the composites prepared without treatment exhibit good
mechanical properties when compared to the composites with treatment.
In the case of tensile stress, there was a decrease in strength due to hydrolysis treatment
which indicated that composites are being damaged and same trend is observed in case of
elongation and work of rupture. So hydrolysis treatment using TMAH was causing
damage to the composites resulting in poor mechanical properties.
0
10
20
30
40
50
60
0% TMAH 10% TMAH
Ten
sile
Str
ess
(M
Pa)
0
0.5
1
1.5
2
0% TMAH 10% TMAH
Ten
sile
Str
ain
(%
)
0
50
100
150
200
0% TMAH 10% TMAH
Wo
rk o
f R
up
ture
( k
g*m
m)

48
5.3.2 DI METHYL SULPHOXIDE - DMSO
5.3.2.1 Thermal Analysis: Differential Scanning Calorimetry
Figure 5.14 - DSC OF PET/COTTON COMPOSITES WITH DMSO
PET fabrics are treated with DMSO using hydrolysis treatment procedure. The
samples undergo thermal analysis to check the shift in the melting point using
Differential scanning calorimetry (DSC).
According to Figure 5.14, the melting peak is at 260 °C which means that
composites cannot be prepared at a lower temperature below than 260 °C. By observing
the shape of the curve it can help us understand the crystalline and amorphous nature in
PET after treatment. The peak is narrow which means that the amount of amorphous
nature in PET is less. The amorphous nature helps in melting of PET so as the amount of
amorphous nature in PET decreases temperature required for melting PET is more which
is 260 °C.

49
5.3.2.2 Mechanical Analysis: Static Tensile Analysis
Figure 5.15: DMSO EFFECT ON THE COMPOSITE FABRICATION
From Figure 5.15, the effect of DMSO on strength, elongation and energy was
interpreted. Tensile stress which represents strength decreases as the percentage of
DMSO increase. Strength of composites prepared with 0% DMSO has better properties.
Tensile stress is directly proportional to strain so same trend is experienced in elongation
so as the percentage of DMSO increases elongation decreases. Strength influences the
work the rupture because work of rupture represents the amount of energy required to
break the composite so as the composites strength decreases less amount of energy is
required to break the composites. Overall, DMSO treatments results in decreasing the
mechanical properties decreases.
0
5
10
15
20
25
30
35
40
45
DMSO 0% DMSO 2.5% DMSO 5%
TEN
SILE
STR
ESS(
MP
a)
0
0.2
0.4
0.6
0.8
1
1.2
DMSO 0% DMSO 2.5% DMSO 5%
TEN
SILE
STR
AIN
(%
)
0
5
10
15
20
25
DMSO 0% DMSO 2.5% DMSO 5%
WO
RK
OF
RU
PTU
RE
(kg*
mm
)

50
Chapter 6: CONCLUSIONS
Waste PET and cotton textiles were successfully fabricated into composites.
Plasticization and hydrolysis treatment were selected to reduce the melting point of PET.
Plasticizer treatment was effective in reducing the melting point so they are developed at
lower temperatures i.e., 240 °C and 250 °C. Among plasticizers 2PP and BBP exhibits
better mechanical properties. Overall composites developed with plasticizer treatment
have better mechanical properties when compared to control.
Successfully in fabricating the composites at lower temperature tend to have
better mechanical properties due to less damage caused to cotton fabric. In order to
corroborate our findings, molecular characterization and interfacial morphology to study
the damage done to cotton fabrics when treated at higher temperatures.
Hydrolysis treatment was found not successful in decreasing the melting point of
PET. This was proved by the generated DSC graphs from thermal analysis. Additionally,
the hydrolysis effect caused damage to PET resulting in poor mechanical properties than
composites fabricated without treatment.

51
Chapter 7: FUTURE WORK
From this research, successful fabrication of composites at lower temperature
with better properties but there are several suggestions for further study which might help
to understand this process better.
PET/Cotton blend fabrics can be considered instead of 100% PET 100% cotton
for fabricating the composites by selecting chemicals which can help reduce the melting
point of polyester and protect the cotton properties. Cotton can also be treated with
coupling agents to protect its properties when fabricated at higher temperatures.
This study used TMAH and DMSO during hydrolysis treatment for reducing the
melting. Alternative alkali can be selected for the hydrolysis study. Plasticizer treatment
was successful in reducing the melting point of PET but h
ave not studied the structural modification of PET. Structural modification of PET can be
studied for understanding the changes occurred in PET. Another property that should be
studied is the intermolecular bonding or the interfacial attraction for all the chemical
treatments.
Alternative methods of thermal analysis like TGA (thermal gravimetric analysis)
can be studied for understanding the results. Also, mechanical properties of the
composites like abrasion resistance, impact resistance can also be studied, which were not
included in this study.

52
Chapter 8: BIBLIOGRAPHY
Avérous, L., & Halley, P. J. (2009). Biocomposites based on plasticized starch. Biofuels,
Bioproducts and Biorefining, 3(3), 329-343.
Carta, D., Cao, G., & D’Angeli, C. (2003). Chemical recycling of poly (ethylene
terephthalate)(PET) by hydrolysis and glycolysis. Environmental Science and Pollution
Research, 10(6), 390-394.
Dufresne, A. (2000). Dynamic mechanical analysis of the interphase in bacterial
polyester/cellulose whiskers natural composites. Composite Interfaces, 7(1), 53-67.
Evstatiev, M., Fakirov, S., Krasteva, B., Friedrich, K., Covas, J. A., & Cunha, A. M.
(2002). Recycling of poly (ethylene terephthalate) as polymer‐polymer composites.
Polymer Engineering & Science, 42(4), 826-835.
Hashmi, S. A. R., Dwivedi, U. K., & Chand, N. (2007). Graphite modified cotton fibre
reinforced polyester composites under sliding wear conditions. Wear, 262(11), 1426-
1432.
Idicula, M., Boudenne, A., Umadevi, L., Ibos, L., Candau, Y., & Thomas, S. (2006).
Thermophysical properties of natural fibre reinforced polyester composites. Composites
Science and Technology, 66(15), 2719-2725.
Idicula, M., Malhotra, S. K., Joseph, K., & Thomas, S. (2005). Dynamic mechanical
analysis of randomly oriented intimately mixed short banana/sisal hybrid fibre reinforced
polyester composites. Composites Science and Technology, 65(7), 1077-1087.
Jawaid, M. H. P. S., & Khalil, H. A. (2011). Cellulosic/synthetic fibre reinforced polymer
hybrid composites: A review. Carbohydrate Polymers, 86(1), 1-18.

53
Júnior, C. P., De Carvalho, L. H., Fonseca, V. M., Monteiro, S. N., & d’Almeida, J. R. M.
(2004). Analysis of the tensile strength of polyester/hybrid ramie–cotton fabric
composites. Polymer Testing, 23(2), 131-135.
Kim, S. J., Moon, J. B., Kim, G. H., & Ha, C. S. (2008). Mechanical properties of
polypropylene/natural fiber composites: comparison of wood fiber and cotton fiber.
Polymer Testing, 27(7), 801-806.
Lou, C. W., Lin, J. H., & Su, K. H. (2005). Recycling polyester and polypropylene
nonwoven selvages to produce functional sound absorption composites. Textile Research
Journal, 75(5), 390-394.
López-Manchado, M. A., & Arroyo, M. (2000). Thermal and dynamic mechanical
properties of polypropylene and short organic fiber composites. Polymer, 41(21), 7761-
7767.
Liu, F., Cui, X., Yu, S., Li, Z., & Ge, X. (2009). Hydrolysis reaction of poly (ethylene
terephthalate) using ionic liquids as solvent and catalyst. Journal of Applied Polymer
Science, 114(6), 3561-3565.
Mohammed, L., Ansari, M. N., Pua, G., Jawaid, M., & Islam, M. S. (2015). A review on
natural fiber reinforced polymer composite and its applications. International Journal of
Polymer Science, 2015.
Mohanty, S., Verma, S. K., & Nayak, S. K. (2006). Dynamic mechanical and thermal
properties of MAPE treated jute/HDPE composites. Composites Science and Technology,
66(3), 538-547.
Mwaikambo, L. Y., Martuscelli, E., & Avella, M. (2000). Kapok/cotton fabric–
polypropylene composites. Polymer Testing, 19(8), 905-918.

54
Mwaikambo, L. Y., & Bisanda, E. T. (1999). The performance of cotton–kapok fabric–
polyester composites. Polymer Testing, 18(3), 181-198.
Nikles, D. E., & Farahat, M. S. (2005). New motivation for the depolymerization
products derived from poly (ethylene terephthalate)(PET) waste: a review.
Macromolecular Materials and Engineering, 290(1), 13-30.
Pothan, L. A., Thomas, S., & Groeninckx, G. (2006). The role of fibre/matrix interactions
on the dynamic mechanical properties of chemically modified banana fibre/polyester
composites. Composites Part A: Applied Science and Manufacturing, 37(9), 1260-1269.
Pothan, L. A., & Thomas, S. (2003). Polarity parameters and dynamic mechanical
behaviour of chemically modified banana fiber reinforced polyester composites.
Composites Science and Technology, 63(9), 1231-1240.
Pothan, L. A., Oommen, Z., & Thomas, S. (2003). Dynamic mechanical analysis of
banana fiber reinforced polyester composites. Composites Science and Technology,
63(2), 283-293.
Oromiehie, A., & Mamizadeh, A. (2004). Recycling PET beverage bottles and improving
properties. Polymer international, 53(6), 728-732.
Ochi, T., Okubo, S., & Fukui, K. (2007). Development of recycled PET fiber and its
application as concrete-reinforcing fiber. Cement and Concrete Composites, 29(6), 448-
455.
Rout, J., Misra, M., Tripathy, S. S., Nayak, S. K., & Mohanty, A. K. (2001). The
influence of fibre treatment on the performance of coir-polyester composites. Composites
Science and Technology, 61(9), 1303-1310.

55
Romanzini, D., Lavoratti, A., Ornaghi, H. L., Amico, S. C., & Zattera, A. J. (2013).
Influence of fiber content on the mechanical and dynamic mechanical properties of
glass/ramie polymer composites. Materials & Design, 47, 9-15.
Saheb, D. N., & Jog, J. P. (1999). Natural fiber polymer composites: a review. Advances
in Polymer Technology, 18(4), 351-363.
Shukla, S. R., Harad, A. M., & Jawale, L. S. (2008). Recycling of waste PET into useful
textile auxiliaries. Waste Management, 28(1), 51-56.
Shukla, S. R., & Harad, A. M. (2006). Aminolysis of polyethylene terephthalate waste.
Polymer Degradation and Stability, 91(8), 1850-1854.
Sharifah, H. A., Martin, P. A., Simon, T. C., & Simon, R. P. (2005). Modified polyester
resins for natural fiber composites. Composites Science and Technology, 65(3-4), 525-
535.
Tajvidi, M., Falk, R. H., & Hermanson, J. C. (2006). Effect of natural fibers on thermal
and mechanical properties of natural fiber polypropylene composites studied by dynamic
mechanical analysis. Journal of Applied Polymer Science, 101(6), 4341-4349.
Tawfik, M. E., & Eskander, S. B. (2010). Chemical recycling of poly (ethylene
terephthalate) waste using ethanolamine. Sorting of the end products. Polymer
Degradation and Stability, 95(2), 187-194.
Yabuki, K., Tanaka, Y., & Kobayashi, H. (2003). U.S. Patent No. 6,527,987.
Washington, DC: U.S. Patent and Trademark Office.
Yao, W., Wang, B., Ye, T., & Yang, Y. (2013). Durable press finishing of cotton fabrics
with citric acid: enhancement of whiteness and wrinkle recovery by polyol extenders.
Industrial & Engineering Chemistry Research, 52(46), 16118-16127.

56
Zou, Y., Reddy, N., & Yang, Y. (2011). Reusing polyester/cotton blend fabrics for
composites. Composites Part B: Engineering, 42(4), 763-770.
Zou, Y., Huda, S., & Yang, Y. (2010). Lightweight composites from long wheat straw
and polypropylene web. Bioresource Technology, 101(6), 2026-2033.
Zou, Y., Reddy, N., & Yang, Y. (2010). Using hop bines as reinforcements for
lightweight polypropylene composites. Journal of Applied Polymer Science, 116(4),
2366-2373.
Zou, Y., Xu, H., & Yang, Y. (2010). Lightweight polypropylene composites reinforced
by long switchgrass stems. Journal of Polymers and the Environment, 18(4), 464-473.