Embed Size (px)
Citation preview

DEVELOPMENT OF CaZrO3-BASED HYDROGEN SENSORS WITH OXIDE
REFERENCE ELECTRODES FOR MOLTEN ALUMINUM
Except where reference is made to the work of others, the work described in this dissertation is my own or was done in collaboration with my advisory
committee. This dissertation does not include proprietary or classified information.
________________________________________ Vivek Krishnan
Certificate of Approval: ______________________ ________________________ Ruel A. (Tony) Overfelt Jeffrey W. Fergus, Chair Professor Associate Professor Materials Engineering Materials Engineering ______________________ ________________________ ZhongYang (Z.-Y.) Cheng Thomas E. Albrecht-Schmitt Assistant Professor Associate Professor Materials Engineering Chemistry
______________________ Joe F. Pittman Interim Dean Graduate School

DEVELOPMENT OF CaZrO3-BASED HYDROGEN SENSORS WITH OXIDE
REFERENCE ELECTRODES FOR MOLTEN ALUMINUM
Vivek Krishnan
A Dissertation
Submitted to
the Graduate Faculty of
Auburn University
in Partial Fulfillment of the
Requirements for the
Degree of
Doctor of Philosophy
Auburn, Alabama December 15, 2006

iii
DEVELOPMENT OF CaZrO3-BASED HYDROGEN SENSORS WITH OXIDE
REFERENCE ELECTRODES FOR MOLTEN ALUMINUM
Vivek Krishnan
Permission is granted to Auburn University to make copies of this dissertation at its discretion, upon the request of individuals or institutions and at their expense.
The author reserves all publication rights.
___________________________ Signature of Author
___________________________ Date of Graduation
iv
VITA
Vivek Krishnan, son of Mr. R.S. Krishnan and Mrs. Rajivi Krishnan, was born on
September 20, 1978 in the city of Jamshedpur, India. He joined Annamalai University,
India in August 1996 and graduated with a Bachelor of Engineering in Chemical
Technology in May 2000. He joined the graduate program in Materials Engineering at
Auburn University in January, 2001. Vivek is a student member of ACerS and MRS. He
is also a member of the Materials Engineering honors society Alpha Sigma Mu (Alabama
Beta chapter).

v
DISSERTATION ABSTRACT
DEVELOPMENT OF CaZrO3-BASED HYDROGEN SENSORS WITH OXIDE
REFERENCE ELECTRODES FOR MOLTEN ALUMINUM
Vivek Krishnan
Doctor of Philosophy, December 15, 2006 (B.E., Annamalai University, India, 2000)
166 Typed Pages
Directed by Jeffrey W. Fergus
Hydrogen is a major cause of gas porosity in aluminum and is frequently removed
from the melt prior to casting. The degassing process can be better controlled if the
hydrogen content in the melt is known. Thus, gas sensors which can make continuous in
situ measurements in molten aluminum are needed. Current online hydrogen sensing
systems are complex designs which are prohibitively expensive. Solid electrolyte based
potentiometric sensors have been developed as an attractive alternate. These sensors have
traditionally used a gas phase as the reference electrode. The present design has a
condensed-phase reference electrode to avoid the need for transport of the reference gas
into and out of the melt. The use of an oxide rather than a hydride phase reference is
expected to considerably lower device cost and improve shelf life and reliability.
The sensor element consists of a solid electrolyte tube based on 10 mol% In-
doped CaZrO3, which was synthesized using both solid oxide and oxalate co-precipitation
vi
techniques. Precursor oxalate powders prepared using polymeric surfactants (PEG) were
characterized using SEM, XRD, FTIR and particle size analysis. PEG was found to
reduce particle size and also influence the process of perovskite formation. The oxalate
co-precipitation technique enabled powder synthesis at reduced processing time and
temperature.
Closed-one-end tubes were slip cast and densified for use as solid electrolytes.
Impedance spectroscopy and D.C. resistance measurements were made at temperatures
between 650 and 900°C. Undoped CaZrO3 was found to be a p-type conductor in air. In-
doped CaZrO3 acted as a proton conductor in air and argon+H2O, whereas the material
was found to be a p-type conductor in pure argon. While bulk conduction was found to be
homogenous with activation energies matching those from D.C. measurements,
conduction across the grain boundary was found to be heterogeneous.
Potentiometric sensors using In-doped CaZrO3 as the electrolyte, and metal/metal
oxides, metal/metal hydrides as the reference electrodes were fabricated. Sensors with
Mg-MgO reference electrodes, on exposure to argon and aluminum environments,
generated a potential matching the Nernstian voltage. Sensors with Ca-CaH2 reference
electrodes measured the Nernstian potential when exposed to 5%H2. Laboratory tests
conducted using gas mixtures also showed sensors with Mg-MgO reference electrodes to
measure changes in hydrogen concentration. Pilot plant testing of sensor prototypes was
carried out in commercial aluminum alloy melts and the sensors were found to respond to
hydrogen degassing. The response of these sensors to changes in the gas content of the
melt correlated reasonably well with that of a commercially available system for
measuring hydrogen content in molten aluminum (AlScan).

vii
ACKNOWLEDGEMENTS
I would like to thank my advisor, Dr. Jeff Fergus, for his guidance and
encouragement during the course of my research studies. His constant support and
motivation has been instrumental in helping me accomplish my objectives.
This research project would not have been possible without continuous support
from Dr. Tony Overfelt and the NASA Solidification Design Consortium. Special thanks
go out to Dr. S. Bakhthiyarov, Amit Suryavanshi and Jonathon Capps for their help with
aluminum casting. I also appreciate Dr. Festus Fasoyinu and all the engineers from
CANMET who helped us arrange the testing of our devices at CANMET, Ottawa.
During my work here, I had the opportunity of learning skills from several people.
I would like to acknowledge George Teodorescu, Zhimin Li and Rui Shao for their time
and assistance. I would also like to thank my colleagues, Devendra Tambe, Mihai Irimia-
Vladu, Naren Pari, Lisa Orona, Victoria Salazar, Chris Long and Todd Dorough for their
help. Working with you guys has been a pleasure.
My friends have been an important source of encouragement. Although I am not
able to name them all here, I would like to mention Kashyap, Raghu, Anand, Karthik,
Shankar, Kavita, Ranjani and Gayatri for their support.
Finally, I would like to dedicate this work to my parents, Mr. R. S. Krishnan and
Mrs. Rajivi Krishnan, and my great sister Divya.

viii
Style Manual or journal used: Journal of the American Ceramics Society
Computer software used: Microsoft Office, ZView, Data Thief

ix
TABLE OF CONTENTS
LIST OF TABLES ...........................................................................................................xii
LIST OF FIGURES.........................................................................................................xiii
1. INTRODUCTION .......................................................................................................... 1
1.1. Motivation for research ............................................................................................ 1
1.2. Solid electrolyte properties ...................................................................................... 2
1.3. Hydrogen sensor development ................................................................................. 2
2. LITERATURE REVIEW ............................................................................................... 4
2.1 Porosity in aluminum castings .................................................................................. 4
2.1.1 Introduction ................................................................................................... 4
2.1.2 Hydrogen porosity in aluminum castings ..................................................... 5
2.1.3 Effect of porosity on properties ..................................................................... 8
2.1.4 Hydrogen removal from liquid aluminum .................................................... 8
2.1.5 Hydrogen determination in aluminum melts ............................................... 11
2.2 Electrochemical sensors based on solid oxide conductors ...................................... 18
2.2.1 Introduction ................................................................................................. 18
2.2.2 Use of solid electrolytes in sensors ............................................................. 20
2.2.3 Sensor classification .................................................................................... 21
2.2.4 Application of electrochemical sensors in molten metal processing .......... 23

x
2.2.5 Oxygen sensors for steel ............................................................................. 24
2.3. Properties of calcium zirconate .............................................................................. 26
2.3.1 Structure, properties and applications ......................................................... 26
2.3.2 CaZrO3 based solid electrolyte materials .................................................... 30
2.3.3 Proton conduction in In-doped CaZrO3 ...................................................... 31
2.4 Ceramic Synthesis and Processing .......................................................................... 35
2.4.1. Solid oxide synthesis .................................................................................. 35
2.4.2. Wet chemical synthesis .............................................................................. 36
3. OBJECTIVES .............................................................................................................. 38
4. EXPERIMENTAL METHODS ................................................................................... 39
4.1. Ceramic preparation ............................................................................................... 39
4.2. Powder characterization and processing ................................................................ 42
4.3. Electrical measurements ......................................................................................... 44
4.4. Sensor fabrication and testing ................................................................................ 46
5. RESULTS AND DISCUSSION .................................................................................. 52
5.1 Synthesis, processing and characterization of doped and undoped calcium
zirconate ............................................................................................................... 52
5.1.1 Solid oxide synthesis ................................................................................... 52
5.1.2 Oxalate coprecipitation synthesis ................................................................ 55
5.1.2.1 Precursor synthesis and characterization ...................................... 55
5.1.2.2 Oxalate decomposition ................................................................. 59
5.2 Electrical characterization of the solid electrolyte material .................................... 75
5.2.1 Solid electrolyte characterization using impedance spectroscopy .............. 75
xi
5.2.2 Conductivity of undoped CaZrO3 in air ...................................................... 81
5.2.3 Conductivity of In-doped CaZrO3 in air ..................................................... 85
5.2.4 Conductivity of In-doped CaZrO3 in dry argon ........................................... 91
5.2.5 Conductivity of In-doped CaZrO3 in Ar+H2O ............................................ 95
5.2.6 Electrical properties of Mg-doped CaZrO3 ................................................. 95
5.2.7 Alternate equivalent circuit model .............................................................. 98
5.2.8 Electrical characterization of In-doped CaZrO3 at very low oxygen
partial pressures ................................................................................... 100
5.3 Sensor fabrication and testing ............................................................................... 104
5.3.1. Sensor design and measurements in argon ............................................... 104
5.3.2 Reference electrode performance in aluminum ........................................ 108
5.3.3. Hydrogen sensing using hydride based reference electrodes ................... 111
5.3.4 Hydrogen sensing using oxide based reference electrodes ....................... 113
5.3.5 Sensor tests in pilot plant conditions ......................................................... 115
6. CONCLUSIONS ........................................................................................................ 120
6.1. Ca(Zr,In)O3 powder synthesis .............................................................................. 120
6.2. Electrical characterization of Ca(Zr,In)O3 materials ............................................ 120
6.3. Hydrogen sensor testing ....................................................................................... 121
7. FUTURE WORK ....................................................................................................... 122
REFERENCES ............................................................................................................... 128

xii
LIST OF TABLES
Table 1 Proton-dopant binding energies computed for In, Ga and Sc in CaZrO3............. 33
Table 2 Solutions A, B and C used in the co-precipitation synthesis of Ca(Zr,In)O3 ...... 40
Table 3 Two layer brick layer model along with values of circuit parameters extracted
from relaxations observed at 870°C...................................................................... 79
Table 4 List of activation energies reported for stoichiometric and non-stoichiometric
CaZrO3 according to mode of measurement and temperature range .................... 85
Table 5 List of gas specifications obtained for AR 300 from Airgas ............................. 105
Table 6 Sensor and AlScan outputs observed in 4 different Al alloy melts at
CANMET............................................................................................................ 117
xiii
LIST OF FIGURES
Figure 1 Variation of hydrogen solubility with melt temperature.16................................... 6
Figure 2 Stages involved in the formation of hydrogen porosity in aluminum castings. ... 7
Figure 3 Fine dispersed gas bubbles produced by rotary unit for degassing molten
aluminum.24 ........................................................................................................ 10
Figure 4 Steps involved in the reduced pressure test to estimate hydrogen content......... 12
Figure 5 Standard photographic reference chart used to compare RPT samples
showing estimates of porosity and sample density. ........................................... 12
Figure 6 Schematic diagram of the Alscan probe.26.......................................................... 13
Figure 7 Schematic of a hydrogen sensor for molten aluminum.37................................... 17
Figure 8 Schematic of typical designs for oxygen sensors for molten steel.55,51,56 ........... 26
Figure 9 Phase Diagram of the CaO-ZrO2 binary system. ............................................... 27
Figure 10 Phase diagram describing the decomposition of phases φ1 and φ2................... 28
Figure 11 Schematic showing the ABO3 type cubic perovskite structure of BaZrO3....... 29
Figure 12 Structural comparison showing distorted ZrO6 octahedra in orthorhombic
perovskites.63 ...................................................................................................... 30
Figure 13 Schematic detailing steps involved in the transport of hydrogen through the
CaZrO3 lattice.99 ................................................................................................. 32
Figure 14 Proton-dopant interaction in CaZrO3 based materials.100 ................................. 33

xiv
Figure 15 Flowcharts of the solid oxide (left) and co-precipitation synthesis (right)
processes used to synthesize the solid electrolyte material Ca(Zr,In)O3 ........... 41
Figure 16 Process steps involved in the forming of fresh electrolyte tubes using slip
casting................................................................................................................. 44
Figure 17 Schematic of cell design used to measure impedance at very low oxygen
pressures. Very low oxygen partial pressures are fixed on opposite sides of
the electrolyte by using molten aluminum. ........................................................ 46
Figure 18 Schematic of the Ca(Zr,In)O3 based potentiometric sensor designed to
detect hydrogen in molten aluminum. Metal-metal oxide and metal-metal
hydride mixtures used as condensed phase reference electrodes. ...................... 48
Figure 19 Picture of a sensor prototype constructed for pilot plant testing ...................... 49
Figure 20 AU sensor and AlScan making simultaneous measurements in a
commercial alloy melt at CANMET, Ottawa CA. ............................................. 50
Figure 21 Commercial rotary degasser used to reduce hydrogen content in the melt
between sensor measurements. ......................................................................... 51
Figure 22 XRD pattern from a pure sample of CaCO3 used in the solid oxide
synthesis ............................................................................................................. 53
Figure 23 XRD pattern from a pure sample of In2O3 used in the solid oxide synthesis ... 53
Figure 24 XRD pattern from pure ZrO2 used in the solid oxide synthesis ....................... 54
Figure 25 XRD pattern from CaZr0.9In0.1O2.95 synthesized using the solid state route..... 54
Figure 26 XRD pattern typical of precursor powders obtained from co-precipitation
process with and without using washing as process step. .................................. 56

xv
Figure 27 FTIR spectra obtained from precursor powders prepared with and without
using the washing step........................................................................................ 59
Figure 28 Phases formed during perovskite formation from precursor decomposition.... 61
Figure 29 Disappearance of In-rich secondary phase CaIn2O4 at high temperatures ....... 61
Figure 30 Disappearance of the In-rich peak in CaZr0.9In0.1O2.95 shown by a decrease
in peak ratios ...................................................................................................... 62
Figure 31 Formation of In-rich CaIn2O4 phase due to increased indium content in the
perovskite powder. ............................................................................................. 63
Figure 32 Increase in peak ratios of integrated intensities in CaZrO3 powders with
varying In contents. ............................................................................................ 64
Figure 33 Variation of cell volume (V) with increasing indium concentration in
CaZrO3. .............................................................................................................. 65
Figure 34 Mg-doped CaZrO3 powders obtained from oxalate precursor decomposition . 66
Figure 35 Schematic of surfactant PEG preventing particle agglomeration by limiting
particle-particle interactions............................................................................... 68
Figure 36 SEM image of precursor particles synthesized using PEG as a surfactant....... 69
Figure 37 SEM image of precursor particles synthesized without use of PEG. ............... 69
Figure 38 Effect of PEG addition on particle size distribution of precursor powders. ..... 70
Figure 39 Effect of precipitate washing on particle size distribution of precursor
powders. ............................................................................................................. 70
Figure 40 Influence of PEG on particle settling. Powders prepared using PEG settled
down slower than those prepeared without PEG indicating smaller sizes. ........ 72
Figure 41 Effect of PEG addition on perovskite formation from precursor powders....... 72

xvi
Figure 42 Effect of ball-milling on perovskite formation from precursor powders.
prepared without PEG. ....................................................................................... 73
Figure 43 Effect of ball-milling on perovskite formation from precursor powders
prepared using PEG............................................................................................ 74
Figure 44 Pellet surface with porous Pt electrodes at 1000x. ........................................... 76
Figure 45 Highly networked Pt electrode on CaZrO3 pellet at 3500x. ............................ 77
Figure 46 Nyquist plot of impedance measured from CaZr0.9In0.1O3-α pellet at 870°C. .. 78
Figure 47 Bode plot showing dependence of impedance magnitude on frequency.......... 78
Figure 48 Bode representation showing variation of phase lag (θ) with frequency. ........ 79
Figure 49 Schematic showing a polycrystalline pellet across which A.C and D.C
resistance is measured. ....................................................................................... 80
Figure 50 Electrical conductivity of undoped CaZrO3 measured in air. ........................... 82
Figure 51 Arrhenius plot of conductivity for samples of CaZrO3 measured in air. .......... 84
Figure 52 Bulk conductivities observed for Ca(Zr,In)O3 and CaZrO3 samples in air ..... 87
Figure 53 Variation of resistance with temperature in CaZr0.95In0.05O2.975 measured in
air........................................................................................................................ 89
Figure 54 Variation of time constants with temperature for CaZr0.95In0.05O3-α
measured in air. .................................................................................................. 89
Figure 55 Variation of capacitances in In-doped CaZrO3 measured in air. ...................... 90
Figure 56 Variation of exponent n with temperature in In-doped CaZrO3. ...................... 91
Figure 57 Bulk and grain boundary conductivity of In-doped CaZrO3 in argon. ............. 93
Figure 58 Variation of bulk capacitance in In-doped CaZrO3 with temperature in
argon................................................................................................................... 93

xvii
Figure 59 Arrhenius plot of hole mobilities in In-doped CaZrO3. .................................... 94
Figure 60 Activation energy for the creation of holes in In-doped CaZrO3. .................... 94
Figure 61 DC conductivity measured for CaZr0.9In0.1O3-x/2 exposed to Ar+H2O.............. 96
Figure 62 DC conductivity measured for CaZr0.9In0.1O3-x/2 exposed to Ar+H2O.............. 96
Figure 63 Total conductivities measured for CaZr1-xMgxO3-x pellets. Results
compared with undoped and In-doped CaZrO3.................................................. 97
Figure 64 Admittance representation of impedance data measured from
CaZr0.9In0.1O3-α pellet at 870°C. ......................................................................... 99
Figure 65 Circuit parameters extracted from impedance data at 870°C using the
reduced CPE model.......................................................................................... 100
Figure 66 Conduction domain diagram developed by Kurita et al.162 to describe the
defect properties of CaZr0.9In0.1O3-x/2 materials. .............................................. 101
Figure 67 Domain diagram highlighting the oxygen and hydrogen partial pressures in
molten aluminum at 750°C. ............................................................................. 101
Figure 68 Typical impedance spectrum measured in liquid aluminum at 1000K. ......... 102
Figure 69 Typical impedance spectrum measured from a Ca(Zr,In)O3 tube inserted in
solid aluminum................................................................................................. 103
Figure 70 Voltage between argon and Mg-MgO measured using CaZr0.9In0.1O2.75 as
the solid electrolyte. ......................................................................................... 104
Figure 71 Comparison of voltage response at 720°C from tubular and pellet shaped
electrolyte samples tested in Ar with Mg/MgO reference electrode. Cell
construction used a porous support tube. ......................................................... 107

xviii
Figure 72 Schematic of cell configurations used to test sensors with Mg-MgO
reference electrodes in argon............................................................................ 109
Figure 73 Theoretical voltage difference between Mg/MgO and Al/Al2O3 reference
electrodes calculated from thermochemical tables........................................... 109
Figure 74 Difference in voltage output measured between sensors containing
Mg/MgO and Al/Al2O3 reference electrodes dipped in liquid aluminum........ 110
Figure 75 Voltage output from tubular sensor (Mg/MgO reference electrode)
suspended in aluminum.................................................................................... 111
Figure 76 Voltage measured from a sensor using Ca-CaH2 reference electrode tested
in Ar+5%H2 environment. ............................................................................... 112
Figure 77 EMF measured from a Ca(Zr,In)O3 based sensor with Mg-Mgo reference
electrode exposed to Ar and Ar+5%H2. Sensor shows a change in response
with hydrogen content that is both stable and reproducible............................. 114
Figure 78 Simultaneous measurements made by sensor and AlScan in Aluminum
356 melt at CANMET. ..................................................................................... 116
Figure 79 Cross-section of reduced pressure test samples taken before and after
degassing showing change in porosity. ............................................................ 116
Figure 80 Comparison of voltage change caused due to degassing calculated from
AlScan measurements and sensor outputs from 4 the different alloy melts. ... 118
Figure 81 A simple block diagram for a feedback control system that can be designed
to optimize hydrogen content in molten aluminum. ........................................ 123

xix
Figure 82 Equilibrium oxygen partial pressures established by using metal-metal
oxide mixtures and H2O-H2, CO-CO2 gas mixtures as a function of
temperature....................................................................................................... 124

1
1. INTRODUCTION
1.1. Motivation for research
Today’s industrialized world places more and more emphasis on automatic
control and real-time monitoring of all industrial processes. Aluminum degassing is one
such industrial process which involves removal of dissolved hydrogen from the melt prior
to casting. Since hydrogen removal is an important step in aluminum processing, there is
a need to optimize the degassing process with a simple online detection system that can
continuously monitor hydrogen levels in the melt. In-situ hydrogen detection in molten
metal could lead to the development of feedback-controlled degassing systems which
would substantially improve process efficiency and produce superior aluminum parts.
Most commercial hydrogen detection techniques transport a reference gas into
and out of the liquid melt. This requires expensive equipment and complex practices that
may appear unattractive to the common foundry-man. Concentration cell type
potentiometric sensors using solid electrolytes offer a potentially inexpensive, simple
solution to this problem. Such sensors typically use a gas phase reference to fix the
hydrogen partial pressure. The voltage measured across the electrolyte is related to the
hydrogen concentration in the melt according to the Nernst equation.
Although the electrochemical technique offers a simpler solution it still does not
necessarily avoid the requirement of transporting a gas mixture through molten metal.
The use of a metal-metal hydride mixture helps overcome this problem by fixing a
2
reference hydrogen partial pressure which can be calculated from thermodynamics. These
materials however, are not very stable and have been known to degrade over time,
limiting their use in commercial devices. Oxide materials should have better high
temperature stability, so, condensed phase reference electrodes based on metal-metal
oxide mixtures could offer devices with a longer shelf life.
1.2. Solid electrolyte properties
Electrolytes for high temperature electrochemical applications are usually solid
oxides. The solid electrolyte electrically separates the reference electrode from the melt
by allowing the passage of ions from one side to the other side, while blocking electronic
transport. As molten aluminum presents a very harsh and corrosive high temperature
environment, the solid electrolyte material used should have good chemical and thermal
stability. Adequate electrical properties are also desired as sensor operation depends on
the conduction of ionic defects through the electrolyte. In addition, the solid electrolyte
material should be easily processed.
1.3. Hydrogen sensor development
Ca(Zr,In)O3 based materials possess several attractive properties and have
become popular for electrochemical applications in molten metal. These materials are
relatively inert in the melt, have excellent thermal shock resistance and can be
synthesized using a wide variety of techniques. The ability to conduct protons in the
presence of hydrogen/moisture makes them specifically attractive for hydrogen sensing
applications.

3
The current project investigates development of CaZrO3-based hydrogen sensors for
molten aluminum applications. Issues related to solid electrolyte synthesis and processing
were studied through structural characterization and the material’s electrical properties
were analyzed through conductivity measurements. Sensor prototypes using oxide based
reference electrodes were fabricated, and tested in both laboratory and pilot plant
conditions.

4
2. LITERATURE REVIEW
2.1 Porosity in aluminum castings
2.1.1 Introduction
Aluminum is the most abundant metal found in the earth’s crust and is one of the
most successfully used structural materials. The silvery white element was first seen and
named by Sir Humphry Davy in 1808.1 Today it is the second largest metal produced in
the world after iron, with total production in 2005 reaching 23,500 metric tones.2
Aluminum possesses several interesting properties like low density, high strength and
good corrosion resistance making it suitable for a wide range of applications.3,4 Common
usages of the material include automotive applications,5 beverage packaging,6
construction,7,8 power transmission,9 consumer appliances etc.
A large volume of aluminum parts are produced by casting processes. Liquid
aluminum is poured into a mold cavity and then cooled to form the desired part. Although
aluminum can be produced by all common casting processes, there are various issues that
require the constant attention of foundrymen. One of the major foundry concerns is melt
quality.10 Inclusions, dissolved gas, oxide particles easily contaminate the melt.11 These
cause defective castings with degraded properties and normally get rejected by the
consumer.

5
Since more and more scrap is being reused everyday,12 companies that recycle
aluminum find it imperative to monitor quality of the melt in order to remain competitive.
While impurities and oxides can generally be prevented from entering the melt by taking
proper precautions, porosity-type defects could be more difficult to avoid. Monroe13
describes porosity as the most common complaint of metal casters, as many
improvements in the quality, performance and reliability can be achieved by its
elimination.
Porosity in aluminum castings is generally attributed to the entrapment of gas
bubbles in the melt or metal shrinkage during solidification.14 Aluminum experiences
volumetric changes when forming the solid phase from molten state. If the shrinkage due
to metal solidification is not compensated by delivering fresh liquid metal, a void can be
created.15 Large voids of this kind are typically formed when liquid metal gets isolated
within the solid during solidification.
2.1.2 Hydrogen porosity in aluminum castings
Pores are also formed in castings due to the entrapment of hydrogen bubbles.
Hydrogen is the only gas with sufficient solubility in liquid aluminum.16 It is typically
introduced into the melt during the interaction between aluminum and moisture. Molten
aluminum reacts with moisture from the surroundings to form aluminum oxide (dross)
and hydrogen according to the reaction,
2Al + 3H2O ↔ Al2O3 + 6H (in Al) (1)
6
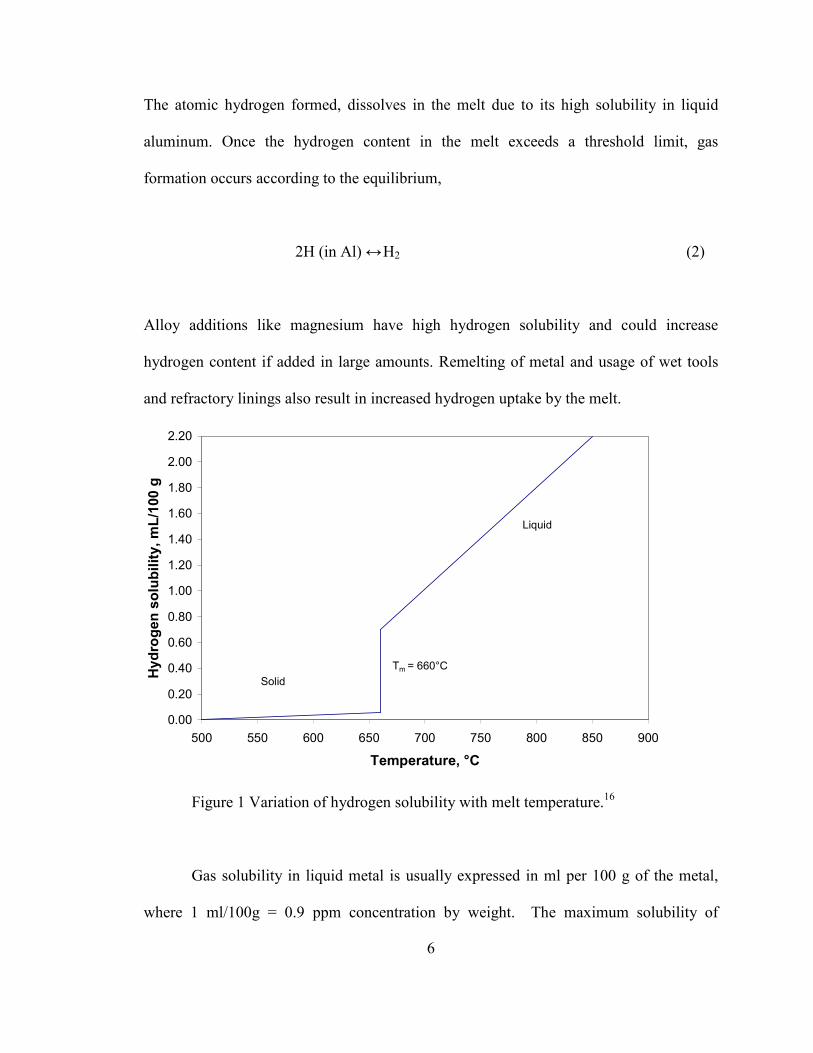
The atomic hydrogen formed, dissolves in the melt due to its high solubility in liquid
aluminum. Once the hydrogen content in the melt exceeds a threshold limit, gas
formation occurs according to the equilibrium,
2H (in Al) ↔ H2 (2)
Alloy additions like magnesium have high hydrogen solubility and could increase
hydrogen content if added in large amounts. Remelting of metal and usage of wet tools
and refractory linings also result in increased hydrogen uptake by the melt.
0.00
0.20
0.40
0.60
0.80
1.00
1.20
1.40
1.60
1.80
2.00
2.20
500 550 600 650 700 750 800 850 900
Temperature, °C
Hydrogen solubility, mL/100 g
Solid
Liquid
Tm = 660°C
Figure 1 Variation of hydrogen solubility with melt temperature.16
Gas solubility in liquid metal is usually expressed in ml per 100 g of the metal,
where 1 ml/100g = 0.9 ppm concentration by weight. The maximum solubility of

7
hydrogen in liquid aluminum is 0.67-0.77 ml/100 g of aluminum (660°C, 1 atm) while
only 0.03 ml/100 g is soluble in solid aluminum. This corresponds to a 20-fold decrease
in hydrogen solubility during solidification. The hydrogen solubility limit varies with
temperature of the melt as shown in Figure 1.
Once molten metal is poured into the mold, it first solidifies along the mold walls.
Reduced solubility leads to hydrogen being rejected at the solid-liquid interface thus
increasing the gas content in the inter-dendritic liquid. Once the hydrogen content
exceeds the solubility limit, pores are nucleated at dendrite roots and other heterogenous
sites such as inclusions. The surface melt layer is exposed to cooler atmosphere and
solidifies faster than the rest of the liquid. In the meantime hydrogen nuclei coalesce
together and form bubbles. The solidifying metal traps the hydrogen bubbles present in
the liquid pool, which leads to hydrogen porosity in the final casting. The basic steps of
the above mentioned porosity forming mechanism are shown in Figure 2.
Figure 2 Stages involved in the formation of hydrogen porosity in aluminum castings.

8
2.1.3 Effect of porosity on properties
Most pores in aluminum castings are caused by a combination of shrinkage and
hydrogen porosity. The defects cause several changes in the materials’ properties. Pores
can start fatigue cracks by acting as stress concentration sites and could lower fatigue
resistance as well as strength.17 Porous castings also experience a lack of pressure-
tightness, reduced machinability and might require polishing of the surface defects prior
to use.18 Yield properties generally depend on the matrix material, and are thus less
affected by porosity.
2.1.4 Hydrogen removal from liquid aluminum
As dissolved hydrogen is primarily responsible for porosity, it is desired to reduce
the gas content in the melt. This is commonly achieved by the avoidance of hydrogen
absorption and removing absorbed hydrogen prior to casting. Hydrogen removal
basically involves diffusion of hydrogen from the melt to a carrier gas or vacuum. The
efficiency of this process depends on alloy composition and temperature among other
factors.
Common removal techniques used in many commercial foundries are natural
outgassing, vacuum degassing and bubble degassing.
Natural outgassing: A decrease in temperature will reduce hydrogen solubility limit in
the melt. Reducing the melt temperature can remove hydrogen if the hydrogen content
exceeds the solubility limit at the lower temperature. So, hydrogen will then diffuse out
of the melt to the environment with lower hydrogen content. This simple method has
limited efficiency and is not always feasible.

9
Vacuum degassing: This technique involves the application of vacuum over the melt.19
Since the hydrogen partial pressure in vacuum should be very low, hydrogen can be
forced out of the melt. This method is more popular than the previous technique as high
efficiencies have been reported. However, the expensive vacuum equipment makes it
attractive only for high end applications where high melt purity is necessary.
Bubble degassing: In this process, a carrier gas is bubbled through the melt.20 Hydrogen
contained in the liquid metal diffuses into the gas bubbles due to a hydrogen partial
pressure difference and gets transported out of the melt. Since gas bubbles are distributed
throughout the melt, the process offers increased contact area and lowers the hydrogen
diffusion distance.21 These two factors result in higher process efficiency.
The important components of a bubble degassing equipment are the degassing
agent and the setup used to flow gas into the melt. The system used to introduce the
carrier gas into the melt must be able to produce small gas bubbles and distribute them
uniformly. The degassing setup must not cause much disturbance to the melt surface,
since loss of the protective layer might result in increased hydrogen absorption and
inclusion formation.
The carrier agent should ideally have little or no hydrogen content. Interaction of
the gas with melt additives is undesired, since this would alter melt composition thus
affecting final properties of the cast product. Chlorine has been widely used as a
degassing agent for aluminum melts. It is however, known to react with magnesium
additives, and has been specifically used for “demagging” applications in aluminum.22
On the hand, the ability to form volatile compounds with hydrogen could prove useful.

10
Chlorine reacts with hydrogen to form hydrogen chloride which exits the melt faster than
other inert gases like argon. 23
Rotary degassing: While tubes can be used to facilitate passage of the carrier gas
through the melt, rotor units have been very successful in degassing systems.24 Rotor
units are allowed to rotate in the melt while releasing gas through its head. The gas
immediately forms small, finely dispersed bubbles because of shear forces created in the
melt due to rotor motion. Graphite is the material typically used for rotor construction.
The process is highly efficient although maintenance costs are typically high.
Figure 3 Fine dispersed gas bubbles produced by rotary unit for degassing molten
aluminum.24

11
2.1.5 Hydrogen determination in aluminum melts
All the degassing techniques described reduce hydrogen levels to some extent.
Gas content in the melt however does not remain constant as more hydrogen is
continuously absorbed after degassing is completed. Proper control of the degassing
process is only possible when the hydrogen content in the melt can be quantified.25
Several methods have been developed and used by the aluminum casting industry to
detect hydrogen.
A complete review of this topic has been presented by Makhlouf et al.26 Three
techniques for hydrogen detection, the reduced pressure test, AlScan/Telegas systems and
electrochemical detection are described in this section.
Reduced Pressure Test (RPT): This simple test, also called the Straube-Pfeiffer test,27 is
a common technique used by foundry professionals to test the quality of their melt.
Liquid metal is carefully poured into a small crucible and placed inside a vacuum bell jar.
The metal then is allowed to cool down under the application of vacuum. The
solidification process forms pores within the metal which are later examined by
sectioning the sample. The nature and extent of porosity can be compared with reference
photographic charts to estimate the hydrogen content in the melt. Additional information
can also be obtained from pressure measurements and movement in the melt surface
during solidification. Liquid metal samples with large amounts of dissolved hydrogen
typically show a lot of surface movement on the application of vacuum.
A simple schematic of the RPT process is shown in Figure 4, while the
photographic reference chart is shown in Figure 5. Although the RPT is a standard

12
industry procedure, it does not have high precision. The technique also requires
considerable time for the sample to cool down before the hydrogen content in the melt
can be estimated. For this reason, online sensors which can make in-situ hydrogen
measurements are desired.
Figure 4 Steps involved in the reduced pressure test to estimate hydrogen content.
Figure 5 Standard photographic reference chart used to compare RPT samples showing
estimates of porosity and sample density.
13
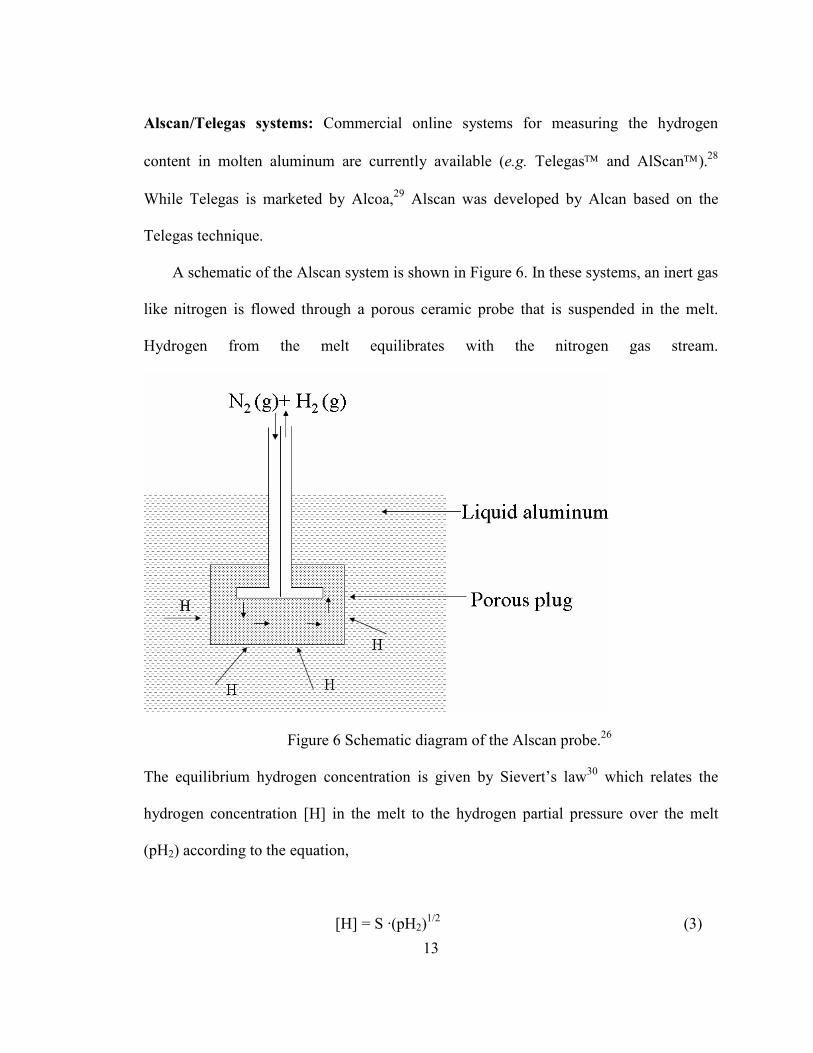
Alscan/Telegas systems: Commercial online systems for measuring the hydrogen
content in molten aluminum are currently available (e.g. Telegas and AlScan).28
While Telegas is marketed by Alcoa,29 Alscan was developed by Alcan based on the
Telegas technique.
A schematic of the Alscan system is shown in Figure 6. In these systems, an inert gas
like nitrogen is flowed through a porous ceramic probe that is suspended in the melt.
Hydrogen from the melt equilibrates with the nitrogen gas stream.
Figure 6 Schematic diagram of the Alscan probe.26
The equilibrium hydrogen concentration is given by Sievert’s law30 which relates the
hydrogen concentration [H] in the melt to the hydrogen partial pressure over the melt
(pH2) according to the equation,
[H] = S ·(pH2)1/2 (3)

14
where S is hydrogen solubility in the alloy melt (ml/100g, for 1 atm hydrogen). Hydrogen
partial pressure in the melt is determined by measuring thermal conductivity of the
nitrogen stream using a katharometer.
Alloying additions and melt temperature affect the solubility S, and are included in
the following expression, 26
[H] = S0 · (pH2)1/2 ·CF(T) · CF(A) (4)
where S0 is the standard solubility in pure aluminum at 700°C, CF(T) is the temperature
correction factor and CF(A) is the alloy correction factor. CF(A) depends on the
concentration of the alloying elements and an equation to calculate CF(A) values for
various aluminum alloys is given as, 26
log CF(A) = 0.017(%Mg) – 0.0269(%Cu) – 0.0119(%Si) (5)
The Alscan and Telegas systems have proved to be reliable and are the most widely
units used in the industry. A 10-minute operation is generally used to produce consistent
results. However, they are not without several drawbacks. The technique requires the
transport of gas into and out of melt and thus devices are bulky and difficult to operate.
The probe in these systems is quite fragile and tends to plug easily.26 Also, these systems
are cost prohibitive for several applications and have longer response times, so new
designs, which can provide reliable data at an affordable cost are being developed.

15
Electrochemical hydrogen sensors: Potentiometric sensors based on solid
electrolytes have found widespread application in the molten metals industry due to their
ruggedness and stability at high temperatures.31 These sensors offer the possibility of in
situ measurement and faster response times.32 Some disadvantages of such sensors
include lack of sensitivity. However in many applications, the disadvantages are not
prohibitive and many devices have been commercialized successfully.
Hydrogen sensors have also been developed for molten aluminum using the
electrochemical technique. These devices typically measure the electromotive force
(EMF) between the aluminum melt containing hydrogen (working) and an electrode
whose hydrogen partial pressure is constant (reference). The measured voltage is directly
related to the difference between the two hydrogen partial pressures and is given by the
Nernst equation,
)(
)(ln
2 2
2
IIpH
IpH
F
RTE = (6)
where R is the gas constant, T is the temperature, 2 for the number of electrons involved
in the reversible reaction and F is Faraday’s constant. Using such a device the hydrogen
partial pressure could be calculated based on the measured EMF.
In 1978, Gee and Fray33 developed a hydrogen sensor using CaH2 as the solid
electrolyte and Ca+CaH2 as the reference electrode mixture. The solid state reference
mixture fixed a stable hydrogen partial pressure and the sensor results were said to
correlate with other measurement techniques. Thermal stability of the hydride-based
16
sensor materials was however a major concern as the device showed unstable responses
and a short life.
Solid electrolyte based sensors based on proton conducting oxides have been
investigated for use in molten metal applications. The use of an oxide material as the
solid electrolyte imparts thermal stability to the device,34 and various designs have been
proposed and commercially tested. Zhuiykov35 reviewed several proton conducting
perovskite oxides and recommended the further research of barium and strontium cerates
for use in various hydrogen sensors.
Among all the alkaline earth cerates and zirconates, indium-doped calcium
zirconate became popular for use as solid electrolyte because of its excellent stability in
molten aluminum. This compound has also been used to fabricate hydrogen sensors for
copper and silver. Yajima et al.36 developed a hydrogen sensor for molten aluminum
based on indium-doped calcium zirconate electrolyte with a gas phase reference. The
device used a gas phase mixture to fix the hydrogen partial pressure in the reference
section. Figure 7 shows a schematic of the device developed for molten aluminum.
The electromotive force measured across this galvanic cell is given by the Nernst
equation as shown in equation 6. The authors reported measurements that agreed with the
theoretical voltage, so hydrogen concentration measurement with this method is possible.
However, the method still involves a gas phase reference, which complicates sensor
design.

17
Figure 7 Schematic of a hydrogen sensor for molten aluminum.37
Zheng et al.37 also constructed hydrogen sensors using doped CaZrO3 based
materials. These devices made use of a condensed phase reference electrode containing a
mixture of Ca and CaH2. The use of the condensed phase electrode eliminates the need
for transporting the gas into and out of the melt and thus can reduce device costs.
However, the hydrides of Ca are extremely reactive and unstable even under controlled
test conditions. To enhance the sensor stability, we proposed metal/metal oxide reference
electrode systems using an In-doped calcium zirconate electrolyte for hydrogen sensing
in molten aluminum.38 The oxide electrodes might possess better stability and thus could
be more suited for industrial use.

18
2.2 Electrochemical sensors based on solid oxide conductors
2.2.1 Introduction
A large number of chemical sensors are based on electrochemical principles.
Electrochemical sensors are devices where analyte concentrations are determined by the
charge exchange process at the electrodes. Electrochemical devices were first built with
liquid electrolytes.39 These were sometimes found to be bulky and clumsy. Drying or
leakage of the electrolyte in these devices caused corrosion, shortened lifetime and
limited functionality. Therefore, there has been a lot of progress in the direction of solid
state electrochemical sensors.
An important element of a solid state electrochemical sensor is the electrolyte
across which a potential difference is established. In the case of high temperature
applications, oxide-based ionic conductors are typically used because of their stability.
The principles and application of various oxygen ion conducting solid electrolytes have
been elaborately reviewed by Etsell and Flangas.40
Any material at T > 0 K contains a specific number of imperfections, which are
usually in the form of vacancies and interstitials. The presence of these is necessitated in
a solid in thermodynamic equilibrium because of the entropy contribution to the Gibb’s
energy. Such defects fixed due to thermodynamic equilibrium, are called intrinsic defects.
Since charge neutrality has to be maintained at all times, a positively charged defect is
created for every negatively charged defect and thus the formation of ionic defect pairs is
usually observed. Vacancy pairs and vacancy-interstitial pairs are common defects found
in solid electrolytes.

19
Unlike certain halide conductors (fluorides), oxide materials rarely exhibit high
ionic conductivity based on just intrinsic defects. Conductivity strongly depends on the
number of charge carriers through the relation,
σ = n•µ•e (7)
where σ is the conductivity of the material, n is the number of defects, µ is the defect
mobility and e is the charge of an electron. Thus if the concentration of ionic defects were
to be increased, the material’s conductivity should improve. Extrinsic defects are
typically produced by introducing aliovalent dopant ions into the lattice. A common
dopant used in doping zirconia is yttrium oxide. Here, Y3+ cations occupy Zr4+ sites
through the reaction,
Y2O3 (-2ZrO2) = 2'ZrY + ••
oV +3 xoO (8)
The resulting relative negative charge leads to the creation of oxygen vacancies in order
to maintain charge neutrality.
In an ion-conducting solid, the ions move between normal lattice positions. These
ions are free to move through the lattice upon application of an electrical field or a
concentration gradient. Ion movement usually occurs when the ion finds a vacant site or
is able to move via an interstitialcy mechanism.41 Ionic conductivity thus occurs due to
imperfections (defects) in the lattice, which depend on the temperature and lattice
elements.
Solid electrolyte systems could sometimes have more than one mobile defect
species (oxygen vacancies, holes, protons, interstitials etc.). In such cases it is important

20
to know the individual species contribution to the overall conductivity. This is given by
the transference number which is the fraction of the total conductivity contributed by
each carrier. Transference number tj is:
tj = σj/σtotal (9)
where σj is the conductivity of the mobile species j and σtotal is the total conductivity of
the material.
The ionic transference number is the sum of all ionic contribution such that its
sum with the electronic transference number should be unity. In the case of electrode
applications in batteries, comparable contributions of electrons and holes could prove
useful. However, for potentiometric concentration-type sensors, any electronic
contribution to total conductivity is undesirable and a transference number close to 1 is
preferred.
2.2.2 Use of solid electrolytes in sensors
Solid electrolyte based potentiometric devices are often used for detection of low
concentrations and represent the most common class of sensors researched for high
temperature applications.42,43,44 In these devices, two electrodes are separated by a solid
electrolyte material whose two sides are exposed to different concentrations of the
species to be measured. The variation in species concentration establishes a chemical
potential difference across the solid electrolyte.

21
In the case of charged particles like ions, the energy of the species also depends
on the electrical potential of the region. This is given by the electrochemical potential
which is the sum of the chemical potential and the contribution due to the electrical
potential. A change in the electrochemical potential sets up a potential difference across
the electrodes. Thus, the output of these devices is a D.C. voltage, which can be easily
measured using a voltmeter.
A famous example of potentiometric devices for high temperature applications is
the zirconia based oxygen sensor used in automotive applications.45 Such sensors are
solid oxide based potentiometric devices which measure a potential difference that occurs
across the faces of an oxygen-ion conducting electrolyte. This potential difference is due
to the difference in oxygen concentrations at the two faces of the electrolyte and is given
by the Nernstian equation,
)(
ln4 2
2
refpO
pO
F
RTE = (10)
where pO2 is the oxygen partial pressure in the exhaust gas that needs to be measured,
pO2 (reference) is the oxygen partial pressure fixed by the reference material and 4 is the
number of electrons. Such sensors typically use air to establish a fixed reference oxygen
partial pressure.
2.2.3 Sensor classification
Although potentiometric sensors are commonly used to measure species that are
mobile in the electrolyte, this need not always be a requirement. In 1992, Weppner
classified these types of devices according to the equilibrium that relates the activity of
the species to be measured to the species that is mobile in the solid electrolyte.46 In the

22
case of oxygen sensors using oxygen-ion conductors, no additional equilibria need to be
established and these are called Type I sensors. The most common oxygen sensor used
zirconia as a solid electrolyte which is usually doped in such a way that the dominant
ionic defect is the oxygen vacancy.
Solid electrolytes can also be used to measure species that are present, but
immobile in the electrolyte. These are called Type II sensors. An example of such devices
are those developed by Alberti et al.47 who report the use of phosphate based proton
conducting electrolytes for developing oxygen sensors. In the case of Type III sensors,
the electrolyte does not contain the species to be measured. However, the electrolyte
contains a separate phase which equilibrates with the species to be measured and
establishes a chemical potential which generates a response. The separate phase is termed
as an auxiliary electrode and may be formed in situ or added separately at the start.
Sodium-ion conductors like β”-alumina48 and NASICON 49,50 (Na3Zr2Si2PO12) are
excellent examples of solid electrolytes used in Type III sensors. NOx sensors have been
proposed based on devices using NASICON using NaNO2 as an auxiliary electrode. The
typical cell structure for these sensors is,
O2, Au| NASICON|NaNO2|Au, NO2+O2
where the gas-sensing reaction is,
Na+ + NO2 + e- ↔ NaNO2 (11)

23
Thus, by using NaNO2 as an auxiliary electrode, a Na+ ion conductor could be used to
measure NO2. β″-alumina based materials have been successfully used to develop
magnesium sensors for molten aluminum. The β″-alumina based sensor establishes
equilibrium between the dissolved magnesium in molten aluminum, and magnesium
oxide and sodium oxide phases that are dissolved in β″-alumina to generate a voltage,
corresponding to the magnesium concentration.
Potentiometric sensing devices are usually operated in open circuit conditions
where no electrical current flows through the external circuit. A common source of error
in some sensors is the presence of electronic conduction, which reduces the ionic
transference number to below 1. Examples are high temperature applications like oxygen
sensing in molten steel using zirconia-based electrolytes where temperatures around
1600ºC increase pO2 at which electronic conductivity significant. With the onset of
electronic conduction, there would be electrical current flowing through the electrolyte
even under open circuit conditions. This would lead to lower voltage measurements than
expected.
2.2.4 Application of electrochemical sensors in molten metal processing
The choice of suitable materials is often the limiting factor in the development or
improvement of high temperature technology. The harsh conditions prevalent in molten
metals require materials to possess high mechanical and thermal stability. Since reaction
rates are usually high at the high operating temperatures, materials should also possess
high chemical stability. Zirconia-based solid electrolytes possess these qualities and have
been used extensively in various sensor applications.

24
Reference electrodes: An important design consideration in the development of
sensors for molten metals is the reference electrode. Gas phase reference electrodes are
usually used in laboratory tests to fix a reliable reference concentration of the analyte to
be detected. However there are inherent disadvantages associated with this type of
electrode. Transport of gas into and out of the melt makes the sensor design complicated
and bulky. Another drawback is the possibility of molecular gaseous species diffusing
through the fine pores and microcracks of the electrolyte from the reference electrode to
the liquid metal electrolyte interface. The gaseous enrichment will cause the reference
potential to drift resulting in erroneous EMF readings. Hence, many investigations have
been directed towards the development of chemically compatible solid reference
electrodes.
2.2.5 Oxygen sensors for steel
One of the most common applications of solid electrolyte based potentiometric
sensors is for oxygen sensing in molten steel.51 During processing of molten steel,
oxygen from reaction with surrounding atmosphere is removed by adding aluminum or
silicon alloys. These react with the oxygen to form oxides, which are removed as slag.
Determination of optimal amounts of alloys to be added requires knowledge of the
oxygen content in the metal. An oxygen sensor can provide this information and such
devices are used commercially in steel foundries.
The reference electrode used is a metal/metal oxide mixture that fixes a reference
oxygen partial pressure on equilibrium. The most common reference electrode used is a
Cr/Cr2O3 mixture though the use of Mo/MoO2 has also been studied. CaO stabilized

25
zirconia is used as the solid electrolyte up to 1600ºC where oxygen partial pressures of
about 3 x 10-13 atm (corresponds to 10 ppm oxygen in unalloyed iron) can be established.
Below 10 ppm concentrations, ZrO2 (CaO) exhibits electronic conductivity and other
electrolyte systems like ZrO2 (Y2O3)52 and ThO2 (Y2O3)
53 have been developed to
successfully measure oxygen activities corresponding to less than 1 ppm in steel.
The first important work in developing a galvanic cell based oxygen sensor for
steel was done by Turkdogan et al. 54 who constructed a simple galvanic cell consisting of
a ZrO2 (CaO) disc sealed into a silica tube. The tube was packed with a powder mixture
of Cr and Cr2O3. The cell can be represented as
Cr-Cr2O3 (s) | ZrO2 (CaO) | O (in steel)
Pt or Mo wire was used to make contact with the electrode and suitable electrical contact
was made with the melt. The cell was found to achieve a steady Nernstian response
within 10 seconds of immersion into the melt.
Other designs proposed for oxygen sensing in steel are shown in Figure 8. Current
oxygen sensors are of the disposable kind and devices have very short life times (Figure
8a). 55 Improving the seal between the reference electrode and molten steel can extend the
lifetime of a sensor. Figure 8b shows a design where the zirconia electrolyte is
isostatically pressed around the reference electrode. This provides a better seal for the
reference electrode compared to the disposable sensor.51 Another approach has been in
the design of a non-isothermal sensor, in which the reference electrode is outside the
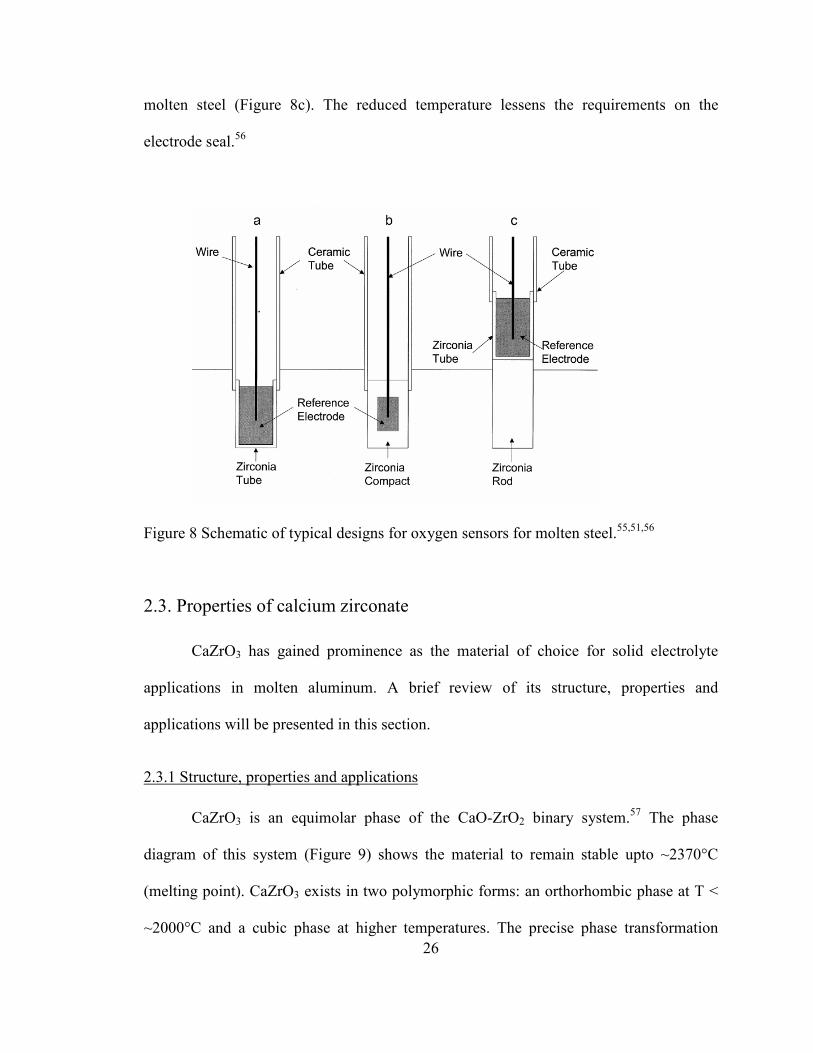
26
molten steel (Figure 8c). The reduced temperature lessens the requirements on the
electrode seal.56
Figure 8 Schematic of typical designs for oxygen sensors for molten steel.55,51,56
2.3. Properties of calcium zirconate
CaZrO3 has gained prominence as the material of choice for solid electrolyte
applications in molten aluminum. A brief review of its structure, properties and
applications will be presented in this section.
2.3.1 Structure, properties and applications
CaZrO3 is an equimolar phase of the CaO-ZrO2 binary system.57 The phase
diagram of this system (Figure 9) shows the material to remain stable upto ~2370°C
(melting point). CaZrO3 exists in two polymorphic forms: an orthorhombic phase at T <
~2000°C and a cubic phase at higher temperatures. The precise phase transformation

27
temperature is not certain as values close to 1750°C and 1900°C have been reported. Two
other Zr-rich ordered phases, CaZr4O9 (φ1) and Ca6Zr19O44 (φ2) have been seen in limited
temperature ranges.58,59 A phase diagram detailing the formation and decomposition of
these phases is shown in Figure 10.
Figure 9 Phase Diagram of the CaO-ZrO2 binary system.60

28
Figure 10 Phase diagram describing the decomposition of phases φ1 and φ2.61
CaZrO3 has been described to belong to the Pcmn symmetry group,
isostructural with CaTiO3.62 The material has a perovskite structure comprised of corner
sharing ZrO6 octahedra with the Ca2+ cation found in a 12-coordinate site. Unlike other
common cubic perovskites such as BaTiO3 and BaZrO3, the smaller Ca2+ cation makes
the material orthorhombic with lattice parameters (a=5.5912 Å, b = 8.0171 Å, c= 5.7616
Å, V = 258.26 Å3).63 Figure 11 shows 2 schematic representations of the cubic perovskite
structure drawn for BaZrO3. The orthorhombic perovskite structure requires a tilt in the

29
ZrO6 octahedra and Zr-O-Zr angles of 146° have been measured. All the atomic positions
and bond distances for this material have been calculated by Shi et al64 using Density
Functional Theory calculations. Figure 12 is taken from Islam’s 65 representation of tilted
octahedra observed in orthorhombic perovskites.
CaZrO3 is an attractive material for a wide variety of applications. In 1998, Orera
et al.66 reported the characteristic infrared and Raman active modes of vibration, which
were later confirmed by Zheng et al.67 Orera and his coworkers proposed the use of
CaZrO3 doped with Er3+ as an optical material due to its luminescence properties.68
Waveguides designed using the material showed absorption and emission spectra of
narrow bands along with high emission efficiencies. 69 CaZrO3 has excellent catalytic and
mechanical properties as porous composites have been offered for use in high
temperature NOx filters70 and lightweight structural components respectively.71 The
dielectric properties of CaZrO3 have also been extensively studied.72 The material has a
dielectric constant ~30 and a quality factor (Q=1/tanδ) of 3000 at 13 GHz.73 The high
Figure 11 Schematic showing the ABO3 type cubic perovskite structure of BaZrO3.74

30
Figure 12 Structural comparison showing distorted ZrO6 octahedra in orthorhombic
perovskites.63
dielectric constant combined with excellent thermal stability makes it attractive as a gate
material for MOSFET applications.75 Yu et al.76 measured a leakage current density of
9.5 x 10⁻⁸ A/cm2 at electrical field of 2.6 MV/cm. CaZrO3 additions have also been seen
to greatly increase the dielectric constant77 and temperature coefficient of capacitance
(TCC) behavior78 in BaTiO3 based capacitors.
2.3.2 CaZrO3 based solid electrolyte materials
Since oxide basicity increases with increase in ionic size, mixed oxides containing
Ca are thought to be more chemically stable than other typical oxides.79 The stability of
CaZrO3 based material combined with its ability to conduct ions, led to solid electrolyte
applications in fuel cells and high temperature gas sensors.80 Perhaps the widest studies
of the material have been related to its electrical properties. The dominant defects in In-
doped CaZrO3 were found to be holes, oxygen ions or protons depending on dopant type,
31
operation temperature and environment.81,82 Wang et al.83 doped CaZrO3 with small
additions of Al2O3, MgO, Y2O3 or a small excess of (ZrO2, CaO), and found the material
to be a hole-oxygen ion mixed conductor in air. Undoped CaZrO3 was found to be a p-
type conductor at low temperatures and an oxygen ionic conductor at high temperatures.
Following their initial study with alkaline earth cerates,84 Iwahara and his coworkers
reported protonic conduction in doped CaZrO3 in the presence of hydrogen.85 Several
studies detailing the electrical properties of the individual zirconates and cerates have
since been conducted and review articles detailing various proton conducting ceramics
and their applications have been published.86,87,88,89,90,91
Indium-doped calcium zirconate was first investigated for use as a proton
conducting solid electrolyte in molten metal applications by Yajima et al.92 Although the
group published results showing conductivities in doped CaZrO3 were lowest among
alkaline earth cerates and zirconates,93 excellent chemical and mechanical stabilities
made the material an attractive candidate for sensor applications in molten metal. In
addition to being established as the material of choice in hydrogen sensors for molten
aluminum applications, In-doped CaZrO3 has also being used in hydrocarbon sensors94
and hydrogen isotope sensors95.
2.3.3 Proton conduction in In-doped CaZrO3
Conduction mechanisms responsible for proton transport in doped cerates and
zirconates have been reviewed previously.96,97 The most popular theory involves presence
of the protonic defect at the oxygen site in the form of a hydroxyl ion. Islam and his co-
workers published a series of papers investigating protonic conduction in doped CaZrO3

32
by studying the influence of protons and dopants using ab-initio molecular dynamic
simulation methods. The authors98 reported that rotational and stretching motion of the
O-H bond allowed protons to hop between oxygen atoms of adjacent octahedra rather
than move as the hydroxyl ion. The equilibrium proton configuration was calculated to
have an O-H bond distance of 1.01 A. Energetics of the proton transfer was calculated
from which activation energy of 0.74 eV was derived. A schematic of the steps involved
in the proton conduction process is shown in Figure 13.
Formation energies of different Schottky and Frenkel defects in CaZrO3 were
computed by Davies and Islam.99 The creation of Frenkel defects were seen to require
high amounts of energy (> 4eV), indicating that the formation of ion interstitials is
unlikely in the close packed perovskite structure. Proton-dopant interactions in the
perovskite lattice have also been modeled by calculating binding energies associated with
dopant-defect pairs.100 A schematic of the defect-dopant interaction in CaZrO3 is shown
in Figure 14.
Figure 13 Schematic detailing steps involved in the transport of hydrogen through the
CaZrO3 lattice.99
33
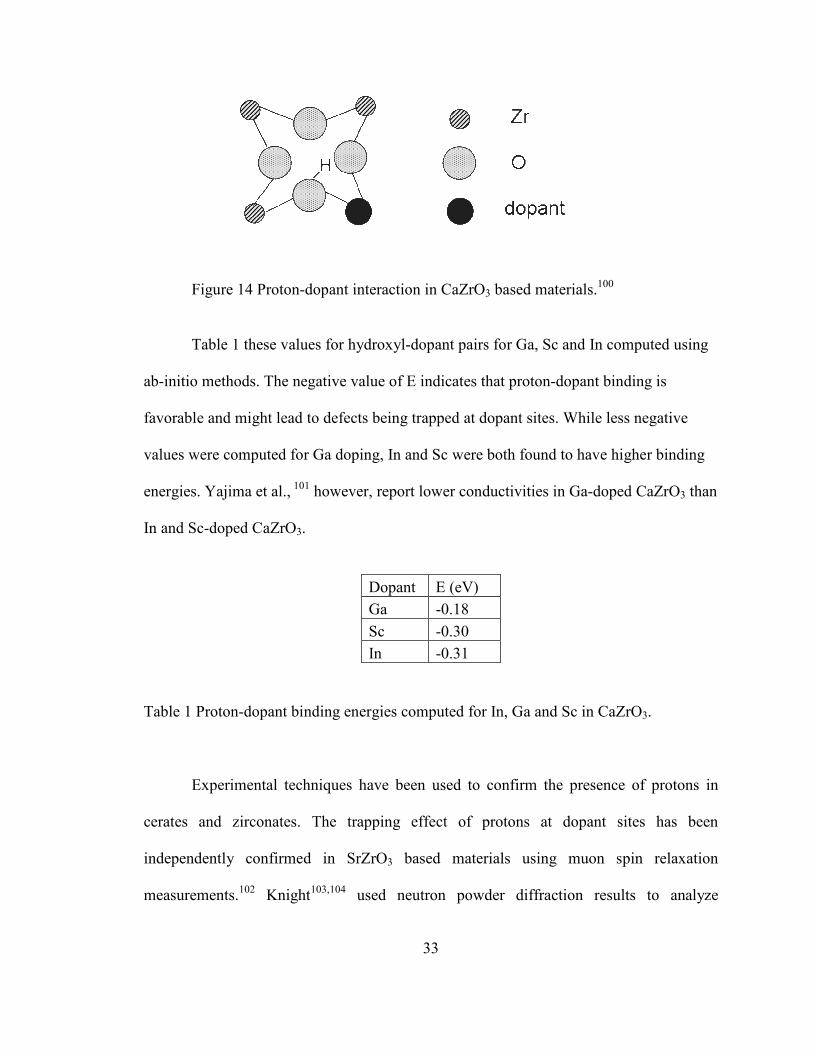
Figure 14 Proton-dopant interaction in CaZrO3 based materials.100
Table 1 these values for hydroxyl-dopant pairs for Ga, Sc and In computed using
ab-initio methods. The negative value of E indicates that proton-dopant binding is
favorable and might lead to defects being trapped at dopant sites. While less negative
values were computed for Ga doping, In and Sc were both found to have higher binding
energies. Yajima et al., 101 however, report lower conductivities in Ga-doped CaZrO3 than
In and Sc-doped CaZrO3.
Table 1 Proton-dopant binding energies computed for In, Ga and Sc in CaZrO3.
Experimental techniques have been used to confirm the presence of protons in
cerates and zirconates. The trapping effect of protons at dopant sites has been
independently confirmed in SrZrO3 based materials using muon spin relaxation
measurements.102 Knight103,104 used neutron powder diffraction results to analyze
Dopant E (eV)
Ga -0.18
Sc -0.30
In -0.31

34
protonation in doped and undoped BaCeO3, and proposed a suitable site for the proton in
the perovskite lattice. Infra-red spectra were used by Omata et al.105 to identify three
proton dissolution sites in In-doped CaZrO3. Higuchi et al.106 used soft x-ray emission
spectroscopy (SXES) and photoemission spectroscopy (PES) to investigate the presence
of protons in In-doped CaZrO3. Energy differences between two proton-induced states
suggest an activation energy of ~0.65 eV for protonic conduction. Hibino et al.107 used
temperature programmed desorption experiments and reported that proton concentrations
and mobilities in In-doped CaZrO3 were lower than other cerates and zirconates. This
finding was also used to explain the lower conductivities in these materials as reported by
Iwahara et al.93
Although many fundamental properties of a ceramic depend on structure,
materials’ synthesis also plays an important role in determining their final properties. It is
therefore useful to choose an appropriate method for ceramic preparation. Some
important techniques used to synthesize electrical ceramics, and in particular CaZrO3
based materials, will be reviewed in the next section.

35
2.4 Ceramic Synthesis and Processing
2.4.1. Solid oxide synthesis
Mixed oxide materials have been traditionally synthesized using the solid oxide
technique. This involves reacting individual oxides at high temperatures to form the
desired product through a solid state reaction. Since this reaction requires intimate mixing
and uniform distribution of the reacting materials, the starting oxides are first crushed and
mixed together before the calcination. Powder milling reduces particle size which reduces
diffusion distances for complete reaction of the cations. The method is simple and
requires very little equipment. High calcinations temperatures and reaction times are,
however, required. Contamination of the samples is also a possibility since the powders
are in continuous contact with abrasive materials during the milling process.
The solid oxide route has been commonly used in the synthesis of alkaline earth
cerates and zirconates. One of the early investigations involving CaZrO3 synthesis using
the was reported by Nadler et al.,108 who prepared single phase CaZrO3 by reacting ZrO2
with CaO, Ca(OH)2 or CaCO3 at high temperatures. Of the different materials used,
CaCO3 was found to show more complete reaction. This was attributed to better
dispersion of the carbonate phase which produced a more active Ca species on
dissociation. Pure CaZrO3 was also synthesized through the solid oxide route by Angers
et al109,110 who annealed CaO- ZrO2 diffusion couples to grow CaZrO3 at the diffusion
zone. The authors reported the formation of CaZrO3 to be strictly diffusion controlled by
the transport of Ca in CaZrO3. Yajima et al.101 synthesized indium-doped calcium
zirconate samples from powders of CaCO3, ZrO2 and In2O3. The oxide powders were
36
taken in the required proportions and mixed in a slurry using ethanol. Powders were then
calcined, ball-milled, pressed and finally sintered to form the final sample pellet. Final
powders were found to mainly contain CaZrO3 and the In-rich CaIn2O4 phase.
2.4.2. Wet chemical synthesis
Various wet chemical techniques have been developed to produce ceramic powders
with a high level of homogeneity and small particle sizes. These involve the precipitation
of oxides from a homogenous aqueous solution of the cations. Typical wet chemical
methods include the sol-gel process, hydrothermal synthesis and oxalate coprecipitation.
Sol-gel methods: Reports on the sol-gel synthesis of CaZrO3 have previously been
published.111,112 This technique makes use of inorganic polymerization reactions to form
an oxide network from molecular precursors. The use of molecular precursors reduces the
temperature needed for powder sintering. End products usually have high purity and good
homogeneity. The method also has its drawbacks as precursors are usually expensive.
These chemicals do not have a long shelf life and are highly sensitive to moisture.
Pechini method: 113 This technique is a modified sol-gel process where cations are
dissolved as nitrates or chlorides in aqueous solution. Chelation is then achieved by
introducing a alpha hydroxycarboxylic acid like citric acid. A polyhydroxy alcohol like
ethylene glycol is added to induce polyesterification at medium temperatures. This
process results in the formation a solid crosslinked polymer resin containing the cations
in a highly homogenous mixture. Oxide powders are then obtained by burning the resin
to remove all the organics.

37
Hydrothermal synthesis: Studies related to the hydrothermal synthesis of doped
SrZrO3114 and CaO-ZrO2 solid solutions
115 have been reported. This technique does not
require high calcination temperatures that are common to the other methods, as
pressurized hot water is used to precipitate well-crystallized oxide powders. The method
is simple and is easy to implement. It, however, needs high pressure equipment and
reaction times can extend out into several days.
Oxalate co-precipitation synthesis: The oxalate coprecipitation process has
become popular in the synthesis of precursor powders because of its simplicity and
ability to produce large quantities of powder.116 The method has been well researched and
used to synthesize mixed oxide powders for superconductor117, semiconductor118 and
solid electrolyte119 applications among many others. This precipitation method involves
the precipitation of oxalate precursors by the addition of ammonium oxalate to the
dissolved chloride or nitrate solution of the cations. Oxalate powders are usually more
reactive which helps in shorter reaction times as well as reduced particle size.120,121

38
3. OBJECTIVES
This project aimed to investigate several aspects related to the development and
fabrication of Ca(Zr,In)O3 based potentiometric sensors for hydrogen sensing
applications in molten aluminum.
Specifically, the major research objectives of this study are –
1. To optimize the processes involved in fabrication of CaZrO3 based solid
electrolyte tubes.
2. To investigate defect properties of CaZrO3 at a wide range of pO2.
3. To design, construct, test and evaluate the performance of potentiometric
hydrogen sensors for molten aluminum using oxide and hydride based
reference electrodes.

39
4. EXPERIMENTAL METHODS
4.1. Ceramic preparation
Solid oxide synthesis: The solid electrolyte material was synthesized by calcining
samples of CaCO3 (99.5%, Alfa Aesar), In2O3 (99.99%, Alfa Aesar) and ZrO2 (99.9%,
Alfa Aesar). Starting oxides were first weighed and crushed together using a mortar and
pestle. The powder mixture was mixed with ethanol (absolute grade, Pharmco) in a glass
jar, with a 3:1 ratio of ethanol to powder. Cylindrical zirconia beads were added to the
glass jar and then set on twin rollers of a rotary ball-mill (#CZ-921 6T, U.S. Stoneware)
for 5 days. Ethanol was evaporated away from the sample after milling by drying the
sample at room temperature. The milled powder was then placed in an alumina boat and
calcined at various temperatures using a hot furnace. A tube furnace (#2-221, Mellen)
was used for calcinations up to 1200°C, whereas heating up to 1400°C was achieved
using a high temperature muffle furnace (#46100, Thermolyne). Typical calcination times
used were 5-24 hours. All calcinations were done in laboratory air.
Oxalate Co-precipitation Synthesis: Liquid phase synthesis of the mixed oxide
was achieved by first precipitating oxalate precursor powders. The starting materials,
ZrOCl2.8H2O (99.9%, Alfa Aesar), CaCO3 and In2O3, were first dissolved in a 1:1
solution of concentrated HCl and distilled water by heating at 70°C amidst constant
stirring. Crystals of ZrOCl2.8H2O were dissolved in distilled water using stirring and

40
added to the acidic solution. This solution (Solution A) was then introduced drop-wise
into an alkaline solution of oxalic acid (Solution B), which was maintained at pH 9 by
adding NH4OH (Fischer Scientific). An excess amount of oxalic acid was used to ensure
complete precipitation of the cations. The resulting curdy white solution (Solution C) was
stirred continuously for 30 minutes at 50°C, and then allowed to age for 3 hours. The
precipitate was separated by filtration, and washed 3 times using distilled water to
remove chloride impurities from the powders. Chloride removal was checked by adding
few drops of silver nitrate to the supernatant solution, as a white silver chloride
precipitate was seen to form immediately in the presence of the chloride. The chloride
free precipitate was finally washed with ethanol and allowed to room dry for 12 hours.
The precursor powders were dried for 12 hours at 100°C to remove moisture and then
calcined for perovskite formation. A calcination procedure similar to that described for
the solid oxide synthesis was followed.
Table 2 Solutions A, B and C used in the co-precipitation synthesis of Ca(Zr,In)O3
To investigate the efficacy of using surfactants in oxalate coprecipitation,
precursor powders were also synthesized using polyethylene glycol (PEG). In this
process, 5 wt % PEG 200 (Sigma-Aldrich) was first mixed with distilled water and added
to Solution A. Flakes of PEG 1450 (Sigma) were then dissolved in ethanol and added to
Solution A ZrOCl2.8H2O+CaCO3+In2O3 dissolved in HCl+H2O and stirred at 70°C
Solution B Oxalic acid crystals dissolved in distilled water+NH4OH, pH 9
Solution C Solution A added slowly into B, stirred at 50°C
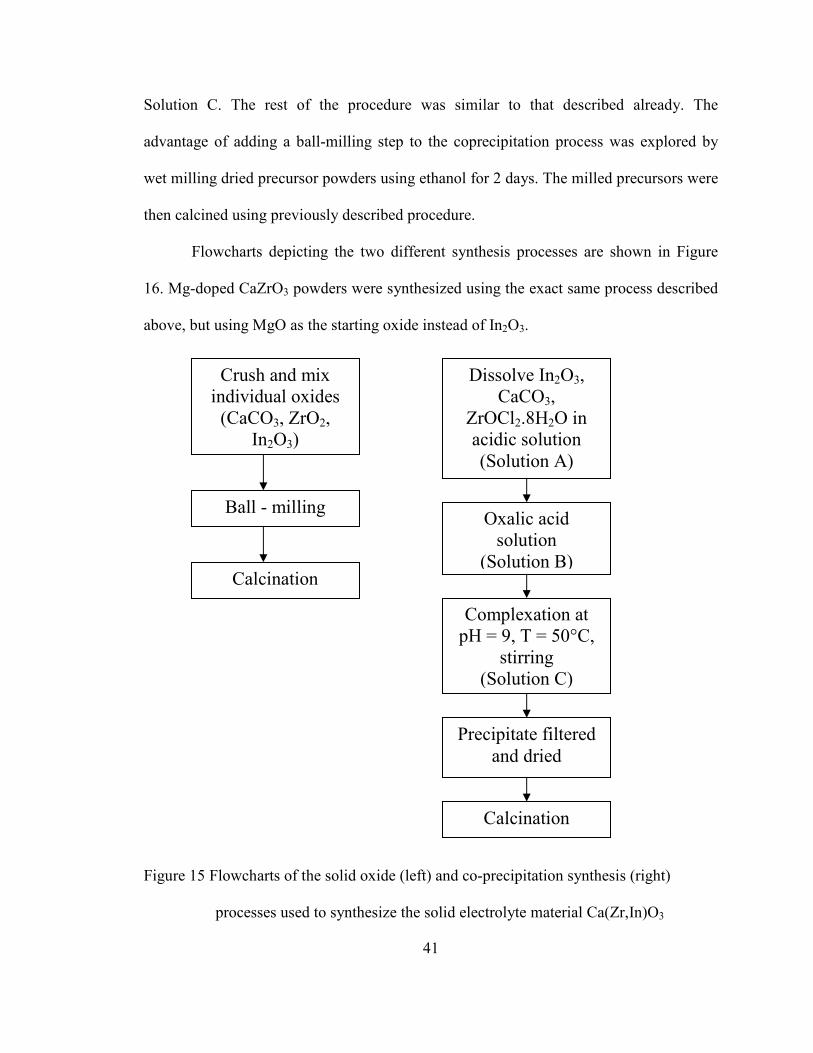
41
Solution C. The rest of the procedure was similar to that described already. The
advantage of adding a ball-milling step to the coprecipitation process was explored by
wet milling dried precursor powders using ethanol for 2 days. The milled precursors were
then calcined using previously described procedure.
Flowcharts depicting the two different synthesis processes are shown in Figure
16. Mg-doped CaZrO3 powders were synthesized using the exact same process described
above, but using MgO as the starting oxide instead of In2O3.
Figure 15 Flowcharts of the solid oxide (left) and co-precipitation synthesis (right)
processes used to synthesize the solid electrolyte material Ca(Zr,In)O3
Crush and mix individual oxides (CaCO3, ZrO2,
In2O3)
Ball - milling
Calcination
Dissolve In2O3, CaCO3,
ZrOCl2.8H2O in acidic solution (Solution A)
Oxalic acid solution
(Solution B)
Complexation at pH = 9, T = 50°C,
stirring (Solution C)
Precipitate filtered and dried
Calcination

42
4.2. Powder characterization and processing
Materials Characterization: Powders prepared by the solid oxide and co-precipitation
processes were characterized using different techniques.
1. X-ray Diffraction (XRD): Powders were placed on a glass slide and the surface was
flattened with a spatula. The slide was then inserted into a Rigaku DMAX-B vertical
diffractometer. Powder samples were exposed to X-rays (40 kV, 40 mA) from a Cu-
target and the intensity of the diffracted x-rays was measured between 20° and 90°
using a detector. A scan speed of 5 degrees/min and a sampling interval of 0.05
degrees were typically used.
2. Scanning Electron Microscopy (SEM): Powders obtained from the synthesis
processes were stuck on conductive carbon tape and then gold coated using a sputter
coater. JEOL JSM 840 and JEOL JSM 7000F FE-SEM were operated at 20 kV to
take secondary electron images at high magnifications. Compositional analysis of the
powders was accomplished using the Oxford Instruments Electron Dispersive X-ray
Spectroscopy (EDS) system.
3. Fourier Transform Infra Red Spectroscopy (FTIR): Powder samples were first mixed
with KBr (Wilmad Glass Co.) and then pressed uniaxially to form pellets.
Measurements were made in the transmissive mode within a spectral region of 400-
4000 cm-1 using the Perkin Elmer Spectrum GX FTIR.
4. Particle Size Analysis: Microtrac S3500 system employing laser scattering was used
to analyze sizes of the various particles in the solution.
Processing: The calcined powders were used to form solid electrolyte pellets and tubes.
Pellet samples were fabricated by first compacting the powders using a stainless steel

43
mold. Powders were placed in the mold and pressed under uniaxial load for 2 minutes
before removal. Mold Wiz® F-57 NC was used as a release agent to prevent the
compacted particles from sticking to the mold walls. Pressed pellets of the solid
electrolyte were placed in an alumina boat and sintered at temperatures between 1200°C
and 1400°C for 9 to 18 hours. Pellets of 8-10 mm diameter and 2-3 mm in thickness were
obtained.
Solid electrolyte tubes were fabricated using slip casting. A schematic detailing
the process steps is shown in Figure 16. Calcined powders were ball-milled for 7 days
with ethanol to form a slurry mixture. Alumina powder (99.9%, Johnson Matthey) was
then hand-compacted with a cavity into which the slurry was poured. The liquid was
allowed to wet the walls of the mold for approximately 5 minutes after which the excess
was drained off. The cast tube was allowed to dry in the mold for 12 hours at room
temperature. The mold was then broken open and the green tube removed. Alumina
impurities on the surface of the tube were carefully brushed away. The tube was finally
sintered by placing in the furnace and heated at temperatures between 1200°C and
1400°C for 9 to 18 hours. The resulting sintered closed-one-end tubes were ~20 mm in
length, 4-5 mm in diameter and had a wall thickness of 0.8-1 mm.
Experiments were also conducted to investigate the effect of particle size on
settling. Small amounts of powder were added to water taken in a 10 ml graduated
cylinder and then allowed to settle after shaking. The liquid column slowly separated into
a clear region and a turbid region containing the powder particles. The height of the
turbid region was measured as a function of settling time.

44
Figure 16 Process steps involved in the forming of fresh electrolyte tubes using slip
casting
4.3. Electrical measurements
A.C. impedance and 2-probe D.C. resistance measurements were performed to
characterize the electrical properties of the material. Pellet samples with platinum
electrodes were used for these experiments. Platinum paste (A 3786, Engelhard) was
applied uniformly over the faces of the pellet. The organic binder was burnt away by
heating the pellet at 800°C for 3 hours. The pellet was then spring-loaded into a sample
holder which was inserted into a tube furnace and heated to temperatures between 600°C

45
and 1000°C. Samples were tested in an inert atmosphere by passing argon gas through
the furnace. To test the samples in a moisture-rich environment, the gas was passed
through water before entering the furnace. The relative humidity in the laboratory was
measured. Conductivity measurements were also made in laboratory air. Molybdenum
wires (99.95%, Alfa Aesar) were used as contact leads in the case of reducing
environments (Ar, Ar+H2O) whereas platinum wires (unalloyed, Aldrich) were used for
experiments conducted in air. Pieces of platinum foil (99.9%, 0.1 mm thick, Aldrich)
were placed on both sides of the pellet to improve electrical contact.
2-probe D.C. measurements were carried out at temperatures between 600°C and
1000°C by measuring the resistance across the pellet using a Fluke 887B Graphic
Multimeter. Temperatures were set and controlled using Syscon REX-C100 temperature
controllers and a solid state relay. A.C. impedance measurements were made at the same
temperature range using the Solartron SI 1260 Impedance/Gain Phase Analyzer. A
perturbation signal of 5-10 mV was applied across the pellet and the resulting impedance
curves were analyzed and fitted using the Complex Non-linear Squares (CNLS) software
tool available in the ZView package.
Impedance spectroscopy was also used to study the material properties at low
oxygen partial pressures. The closed-one-end electrolyte tubes were filled with aluminum
powder. Molybdenum wire (1.27-mm diameter) was inserted in a ceramic sleeve and
suspended into the electrolyte tube to act as one of the lead wires. The electrolyte tube
was then inserted into a 3-cm long alumina support tube and sealed using the Aremco
517 sealant. The assembly was then suspended in a graphite crucible filled with
aluminum powder. A molybdenum wire inserted into a ceramic tube was also suspended

46
in the aluminum powder inside the crucible. The graphite crucible was suspended in a
quartz tube, which was heated in a tube furnace at different temperatures between 500°C
and 1000°C. Dry argon was flowed into the furnace to maintain a very low oxygen
pressure. A schematic of the cell is shown in Figure 17.
Figure 17 Schematic of cell design used to measure impedance at very low oxygen
pressures. Very low oxygen partial pressures are fixed on opposite sides of
the electrolyte by using molten aluminum.
4.4. Sensor fabrication and testing
Solid electrolyte tubes were used to construct hydrogen sensors. Tubes were first
manually filled with the reference electrode materials, which were a mixture of metal-
metal oxide or metal-metal hydride. Powder mixtures of magnesium (99+%, Aldrich)-
magnesium oxide were typically used as oxide based reference electrodes while calcium
(98.8%, Alfa Aesar)-calcium hydride (98%, Alfa Aesar) or zirconium (99.95%, Alfa
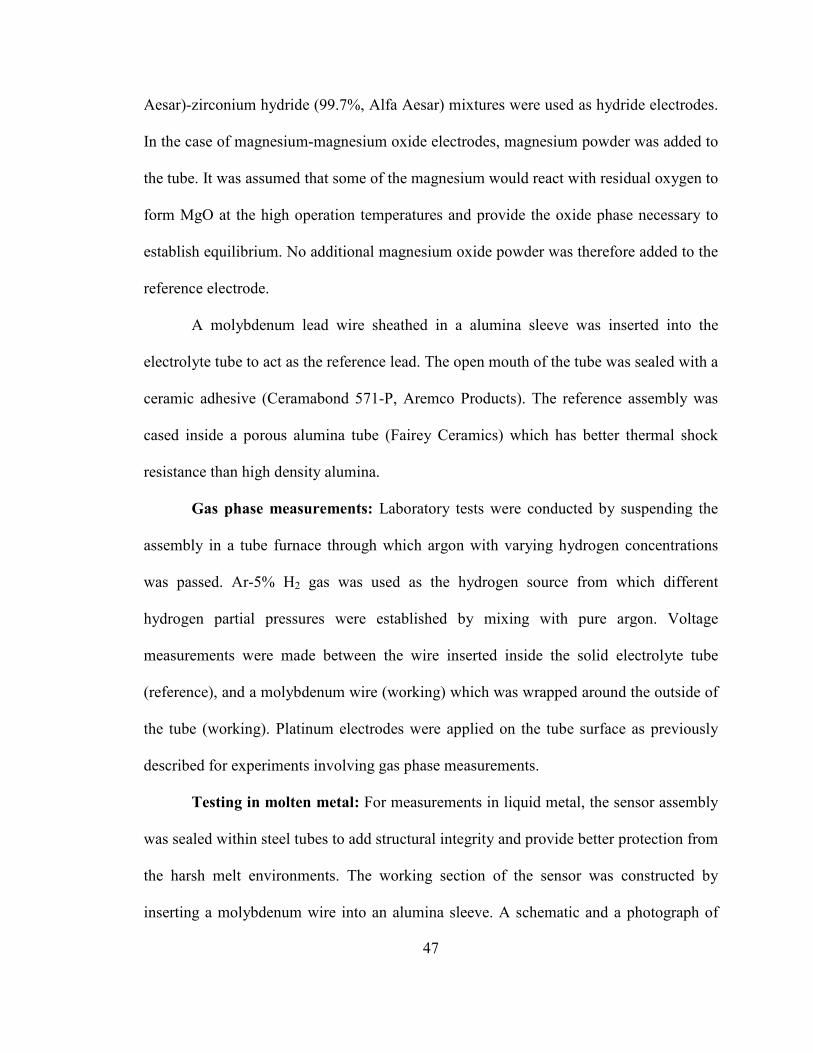
47
Aesar)-zirconium hydride (99.7%, Alfa Aesar) mixtures were used as hydride electrodes.
In the case of magnesium-magnesium oxide electrodes, magnesium powder was added to
the tube. It was assumed that some of the magnesium would react with residual oxygen to
form MgO at the high operation temperatures and provide the oxide phase necessary to
establish equilibrium. No additional magnesium oxide powder was therefore added to the
reference electrode.
A molybdenum lead wire sheathed in a alumina sleeve was inserted into the
electrolyte tube to act as the reference lead. The open mouth of the tube was sealed with a
ceramic adhesive (Ceramabond 571-P, Aremco Products). The reference assembly was
cased inside a porous alumina tube (Fairey Ceramics) which has better thermal shock
resistance than high density alumina.
Gas phase measurements: Laboratory tests were conducted by suspending the
assembly in a tube furnace through which argon with varying hydrogen concentrations
was passed. Ar-5% H2 gas was used as the hydrogen source from which different
hydrogen partial pressures were established by mixing with pure argon. Voltage
measurements were made between the wire inserted inside the solid electrolyte tube
(reference), and a molybdenum wire (working) which was wrapped around the outside of
the tube (working). Platinum electrodes were applied on the tube surface as previously
described for experiments involving gas phase measurements.
Testing in molten metal: For measurements in liquid metal, the sensor assembly
was sealed within steel tubes to add structural integrity and provide better protection from
the harsh melt environments. The working section of the sensor was constructed by
inserting a molybdenum wire into an alumina sleeve. A schematic and a photograph of
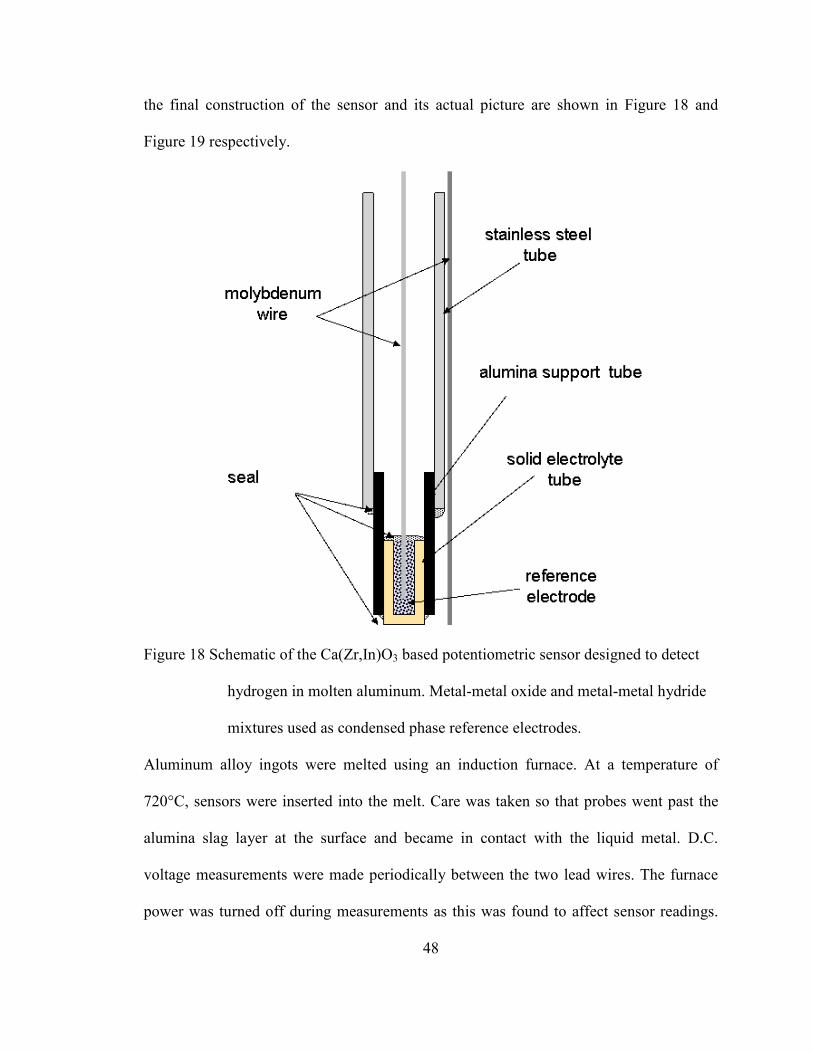
48
the final construction of the sensor and its actual picture are shown in Figure 18 and
Figure 19 respectively.
Figure 18 Schematic of the Ca(Zr,In)O3 based potentiometric sensor designed to detect
hydrogen in molten aluminum. Metal-metal oxide and metal-metal hydride
mixtures used as condensed phase reference electrodes.
Aluminum alloy ingots were melted using an induction furnace. At a temperature of
720°C, sensors were inserted into the melt. Care was taken so that probes went past the
alumina slag layer at the surface and became in contact with the liquid metal. D.C.
voltage measurements were made periodically between the two lead wires. The furnace
power was turned off during measurements as this was found to affect sensor readings.

49
Hydrogen content was reduced by flushing the melt with argon carrier gas. During runs
involving degassing, the sensor was pulled out from the melt and reinserted after
degassing. This was done to prevent any structural damage to the probe.
Figure 19 Picture of a sensor prototype constructed for pilot plant testing
Pilot plant experiments were conducted at the Canadian Metallurgical
Laboratories, Ottawa, CA. Sensors were tested along with a commercial AlScan
hydrogen analyzer in various commercial aluminum alloys. A picture describing this
experiment is shown as Figure 20. About 20 kg of the charge material was melted in a
box furnace and the temperature was controlled at 730°C. AU sensors were first dipped
into the melt, after which the AlScan probe was introduced. After the initial
measurements, rotary degassing was performed to change the hydrogen content in the
melt (Figure 21). The two probes were then reinserted after degassing to simultaneously

50
estimate the reduction in hydrogen levels. Liquid metal samples were taken before and
after degassing for reduced pressure test experiments. Liquid aluminum was poured into
a small crucible which was placed under a bell jar. The sample was allowed to solidify
under vacuum, after which it was sectioned for porosity examination.
Figure 20 AU sensor and AlScan making simultaneous measurements in a commercial
alloy melt at CANMET, Ottawa CA.
AU sensor
Alscan
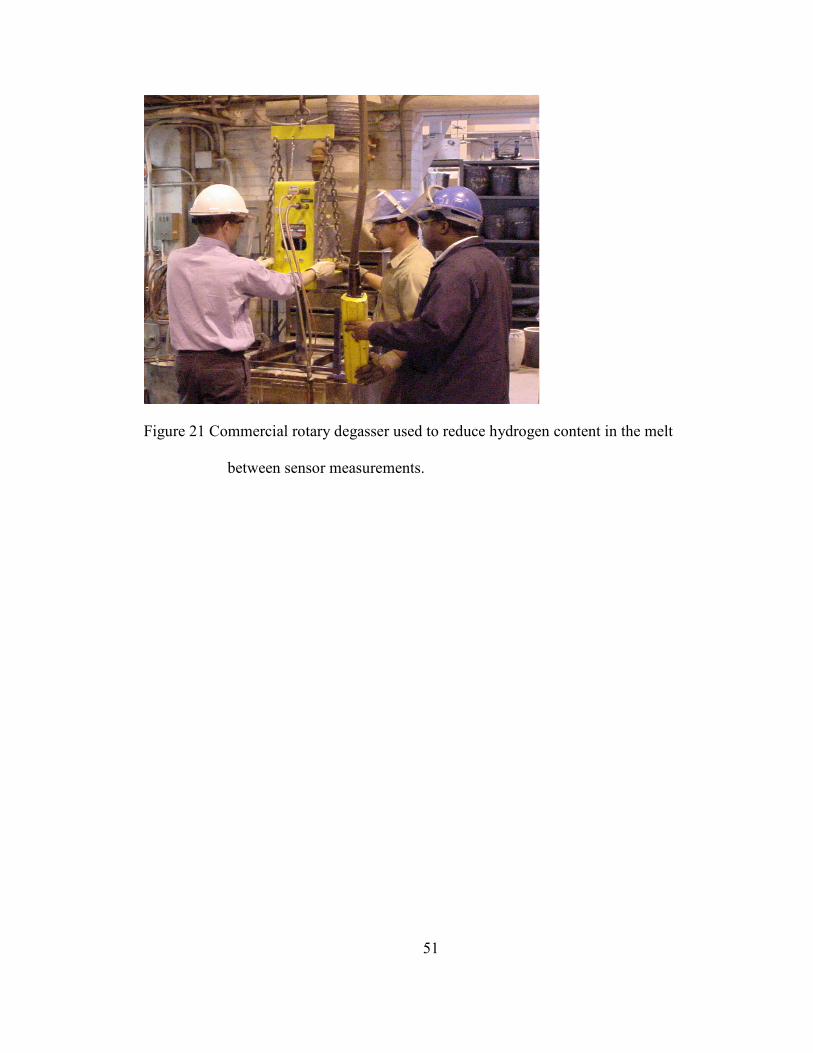
51
Figure 21 Commercial rotary degasser used to reduce hydrogen content in the melt
between sensor measurements.

52
5. RESULTS AND DISCUSSION
5.1 Synthesis, processing and characterization of doped and undoped
calcium zirconate
5.1.1 Solid oxide synthesis
The material CaZr1-xInxO3-x/2 (0 ≤ x ≤ 0.2) was first prepared using the solid oxide
technique. Phases involved in the formation of CaZrO3 were evaluated using X-ray
diffraction (XRD). XRD patterns from the individual oxides (CaCO3, ZrO2, and In2O3)
were obtained for comparison and are shown in Figure 22, Figure 23 and Figure 24. XRD
spectra obtained from 10 mol% In-doped CaZrO3 prepared from the solid oxide route are
shown in Figure 25.
Figure 25 shows x-ray diffraction peaks from oxide mixtures which were calcined
at 3 different temperatures (1000°C, 1200°C and 1400°C) for a period of 12 hours. Peaks
matched well with those attributed to the orthorhombic CaZrO3 phase and were indexed
with reference card (#35-0790) obtained from the Joint Committee on Powder Diffraction
Standards database (JCPDS). The peak positions show good agreement with the
diffraction profile obtained from commercially available CaZrO3 (Aldrich) shown in
Figure 25. Peaks appear to be well-formed indicating crystalline nature of the synthesized
product.

53
0
500
1000
1500
2000
2500
3000
20 30 40 50 60 70 80 90
angle
intensity
Figure 22 XRD pattern from a pure sample of CaCO3 used in the solid oxide synthesis
0
1000
2000
3000
4000
5000
6000
7000
8000
9000
20 30 40 50 60 70 80 90 100
angle (2θ)
Intensity
211
222
400
411
440
622
431611 444 662
0
1000
2000
3000
4000
5000
6000
7000
8000
9000
20 30 40 50 60 70 80 90 100
angle (2θ)
Intensity
211
222
400
411
440
622
431611 444 662
Figure 23 XRD pattern from a pure sample of In2O3 used in the solid oxide synthesis

54
0
500
1000
1500
2000
2500
3000
3500
20 30 40 50 60 70 80 90 100
angle (2θ)
Intensity
110
111
020
002112
211
221
310203
111
0
500
1000
1500
2000
2500
3000
3500
20 30 40 50 60 70 80 90 100
angle (2θ)
Intensity
110
111
020
002112
211
221
310203
111
110
111
020
002112
211
221
310203
111
Figure 24 XRD pattern from pure ZrO2 used in the solid oxide synthesis
0
1000
2000
3000
4000
5000
6000
7000
20 30 40 50 60 70 80angle (2θ)
Intensity
101
121
112
202
222212 321123 242
3231400°C, 12 hours1200°C, 12 hours
1000°C, 12 hours
CaIn2O4
CaZrO3 (commercial)
Figure 25 XRD pattern from CaZr0.9In0.1O2.95 synthesized using the solid state route

55
The XRD pattern in Figure 25 also shows a separate peak at 2θ= 33.4°, which
could not be indexed to the perovskite phase. The position however, matches well with
the (121) peak of the In-rich CaIn2O4 phase (JCPDS #17-0643).92 This suggests that all
the indium was not completely dissolved in the perovskite lattice, such that the doped
powders prepared from the solid oxide route are a mixture of two phases (CaZrO3 +
CaIn2O4).
5.1.2 Oxalate coprecipitation synthesis
5.1.2.1 Precursor synthesis and characterization
Oxalate decomposition to form CaZrO3 was investigated as an alternate to the
solid oxide route of synthesis. The precursor oxalate was first synthesized through a co-
precipitation reaction of the cations using oxalic acid as a chelating agent. Figure 26
shows typical XRD results from oxalate precursor powders obtained after drying.
Powders are clearly seen to have some amorphous character at regions around 30°.
Although crystalline features are also visible in the spectrum, the peak intensities are
quite low compared to the peaks obtained from the solid oxide samples, indicating lesser
crystallinity in the precursor powders.
The crystalline peaks in Figure 26 can be attributed to the monoclinic CaC2O4
phase and were indexed based on the JCPDS reference card (#21-0838). While the
presence of this phase is consistent with other published reports, there has been
disagreement over the other phases present in the system.
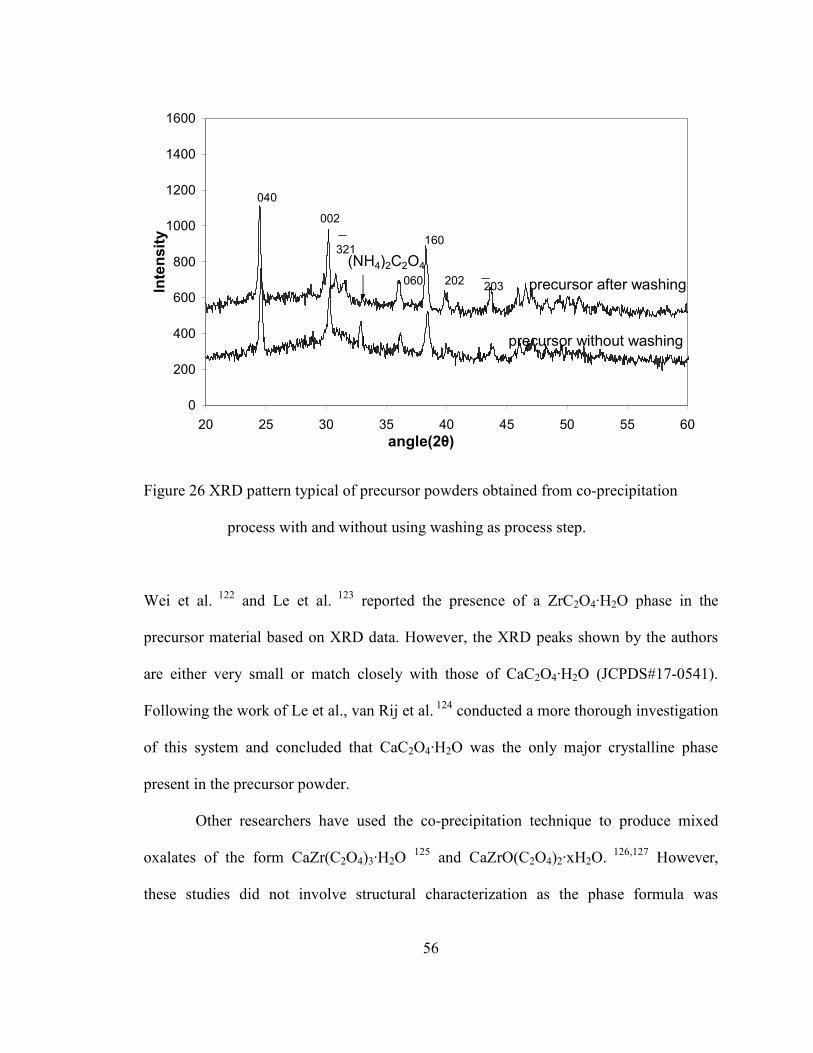
56
0
200
400
600
800
1000
1200
1400
1600
20 25 30 35 40 45 50 55 60
angle(2θ)
Intensity
(NH4)2C2O4
precursor after washing
precursor without washing
040
002
321
060
160
202203
Figure 26 XRD pattern typical of precursor powders obtained from co-precipitation
process with and without using washing as process step.
Wei et al. 122 and Le et al. 123 reported the presence of a ZrC2O4·H2O phase in the
precursor material based on XRD data. However, the XRD peaks shown by the authors
are either very small or match closely with those of CaC2O4·H2O (JCPDS#17-0541).
Following the work of Le et al., van Rij et al. 124 conducted a more thorough investigation
of this system and concluded that CaC2O4·H2O was the only major crystalline phase
present in the precursor powder.
Other researchers have used the co-precipitation technique to produce mixed
oxalates of the form CaZr(C2O4)3·H2O 125 and CaZrO(C2O4)2·xH2O.
126,127 However,
these studies did not involve structural characterization as the phase formula was

57
primarily derived from empirical calculations. Chapelet-Arab et al.128 and Audebrand et
al.129 carried out systematic single crystal studies and pointed out that the oxalate formed
must have a formula of Ca2Zr(C2O4)4·nH2O.
Although different mixed oxalate precursors have been synthesized involving
Ca2+ and Zr4+ cations, none have been shown to decompose directly to form the
perovskite phase. While Saavedra et al.125 report that single phase perovskite can be
formed from their process, secondary (CaO) phases can be seen in their XRD results. A
mixture of phases (CaCO3, CaZrO3 and CaO) is also seen after thermal decomposition of
the compound synthesized by Chapelet-Arab et al. 128
The precipitation of zirconium (Zr4+) has been discussed in detail by Baes and
Mesmer 130 as well as Curtis and Degueldre.131 Due to their high charge and small radius,
zirconium ions have a high tendency to get hydrolyzed. At the precipitation conditions,
the cation is supposed to be present in the polymer form,
which precipitates as ZrO(OH)2 (zirconium oxyhydroxide).132 This phase has a
characteristic broad amorphous hump at ~30° in the XRD spectra.133 The XRD spectrum
in Figure 26 contains a broad hump at ~30° suggesting that zirconium could be present in
the amorphous phase.
The solubility products in water for CaC2O4•H2O134, ZrO(OH)2
124 and In(OH)3135
are ~10-9, ~10-49 and ~10-34, respectively. Since these values do not lie close to each
OH OH
Zr Zr
OH OH
O O

58
other, the simultaneous precipitation of the cations in the form of mixed oxalates is
improbable.136 Zirconium speciation specially is a complex process which depends on
several irreversible reactions. A specific study investigating the problems associated with
controlled zirconium precipitation using the oxalate technique was carried out by Kirby et
al.137 Nature of oxalate addition, oxalate concentration, and temperature were among the
many parameters that were observed to affect Zr precipitation.
The oxalate and hydroxide species have very low solubilities at pH 9 and are
expected to precipitate out completely. Figure 26 contains an additional XRD peak in the
spectrum from powders prepared without using the elaborate washing procedure. The
peak position matches with that of ammonium oxalate, which could have been formed
during the precipitation reaction. Ammonium oxalate has been found to inhibit sintering
in other oxide systems, 138 so careful washing of the powder is an important step in the
precursor powder preparation.
Investigation of the powders using infra-red spectroscopy is useful to understand
the nature of the bonds present in the oxalate precursor. Figure 27 shows peaks obtained
from transmittance mode FTIR carried out on the precursor powder. The prominent
features seen in the FTIR spectra are at 509, 655, 779, 1311 and 1603 cm-1, and a few
small peaks are found at wave numbers greater than 3000 cm-1. The peaks found in the
spectra match well with those seen by other researchers. Girija et al.139 credit a peak at
1318 cm-1 to stretching of the metal-carboxylate bond while a peak at 510 cm-1 is said to
be due to in-plane O-C-O bending. Ouyang et al.140 and El-Shall et al.141 assign a peak at
1620 cm-1 to antisymmetric carbonyl stretching. Maurice-Estepa et al.142 credit a band at
780 cm-1 to out-of-plane bending of the water molecule, while antisymmetric and

59
symmetric stretches for coordinated water are said to cause small peaks above 3000 cm-1.
The difference in the two spectra is seen by way of a small peak at 2950 cm-1 in the
sample prepared without the washing step. This position corresponds to a peak found in
ammonium oxalate, consistent with the results discussed from the XRD shown in Figure
26.
0
50
100
150
200
250
350 850 1350 1850 2350 2850 3350 3850Wave number (cm-1)
Intensity
precursor with
washing
precursor without
washing
1311 cm-1779 cm-1
1613 cm-1
655 cm-1
509 cm-1
2950 cm-1
Wave number (cm -1)
0
50
100
150
200
250
350 850 1350 1850 2350 2850 3350 3850Wave number (cm-1)
Intensity
precursor with
washing
precursor without
washing
1311 cm-1779 cm-1
1613 cm-1
655 cm-1
509 cm-1
2950 cm-1
Wave number (cm -1)
Figure 27 FTIR spectra obtained from precursor powders prepared with and without
using the washing step
5.1.2.2 Oxalate decomposition
The oxalate precursor powders were heated at various temperatures to produce the
perovskite material. XRD was used to investigate the formation of various phases during
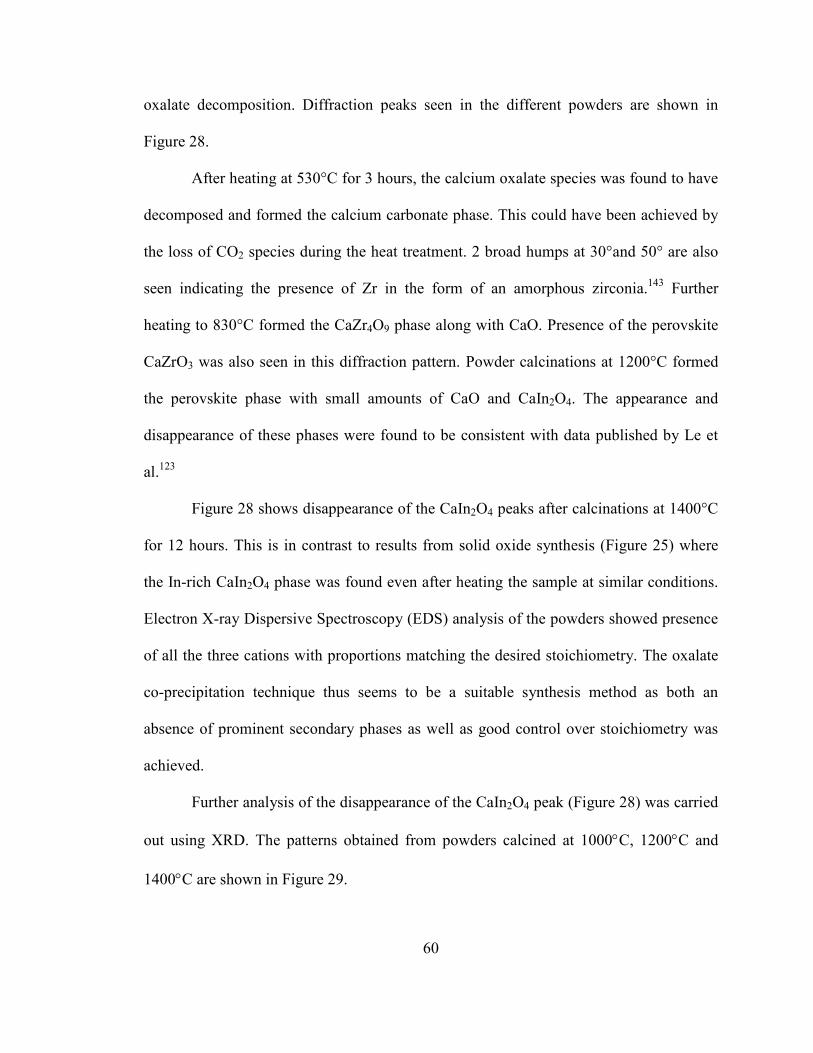
60
oxalate decomposition. Diffraction peaks seen in the different powders are shown in
Figure 28.
After heating at 530°C for 3 hours, the calcium oxalate species was found to have
decomposed and formed the calcium carbonate phase. This could have been achieved by
the loss of CO2 species during the heat treatment. 2 broad humps at 30°and 50° are also
seen indicating the presence of Zr in the form of an amorphous zirconia.143 Further
heating to 830°C formed the CaZr4O9 phase along with CaO. Presence of the perovskite
CaZrO3 was also seen in this diffraction pattern. Powder calcinations at 1200°C formed
the perovskite phase with small amounts of CaO and CaIn2O4. The appearance and
disappearance of these phases were found to be consistent with data published by Le et
al.123
Figure 28 shows disappearance of the CaIn2O4 peaks after calcinations at 1400°C
for 12 hours. This is in contrast to results from solid oxide synthesis (Figure 25) where
the In-rich CaIn2O4 phase was found even after heating the sample at similar conditions.
Electron X-ray Dispersive Spectroscopy (EDS) analysis of the powders showed presence
of all the three cations with proportions matching the desired stoichiometry. The oxalate
co-precipitation technique thus seems to be a suitable synthesis method as both an
absence of prominent secondary phases as well as good control over stoichiometry was
achieved.
Further analysis of the disappearance of the CaIn2O4 peak (Figure 28) was carried
out using XRD. The patterns obtained from powders calcined at 1000°C, 1200°C and
1400°C are shown in Figure 29.
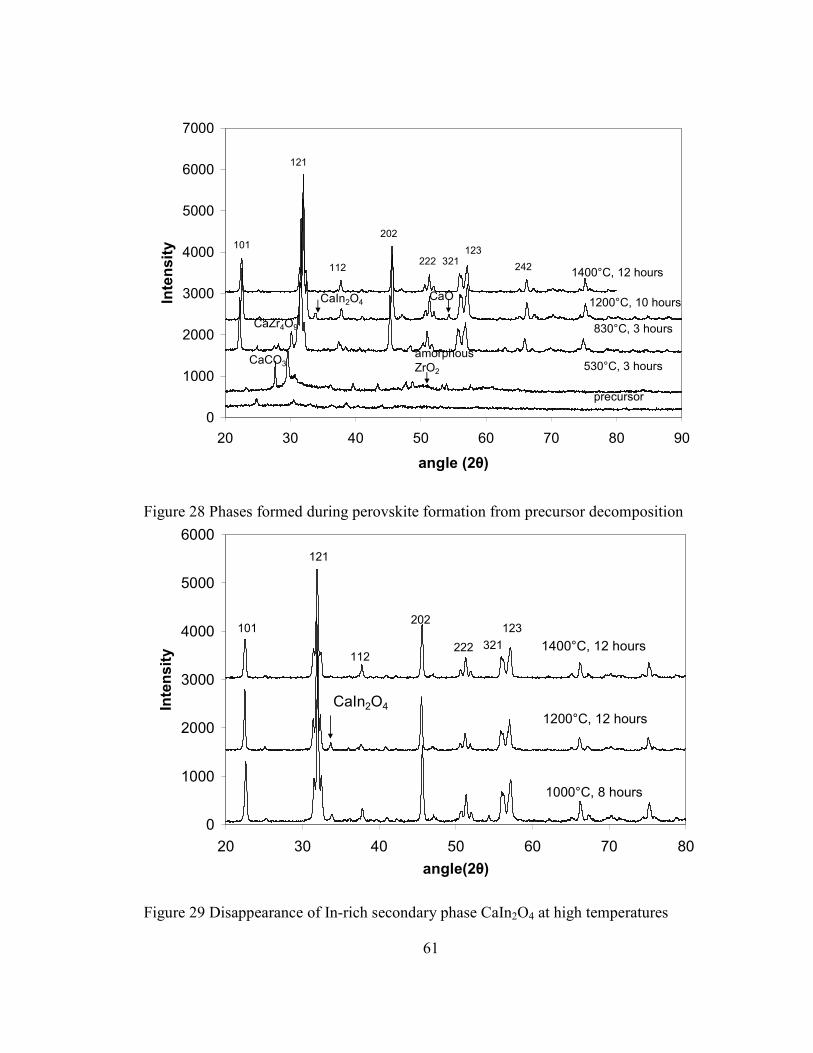
61
0
1000
2000
3000
4000
5000
6000
7000
20 30 40 50 60 70 80 90
angle (2θ)
Intensity
CaCO3
CaZr4O9
CaOCaIn2O4
amorphous
ZrO2
precursor
530°C, 3 hours
830°C, 3 hours
1200°C, 10 hours
1400°C, 12 hours
101
121
112
202
222123
321242
Figure 28 Phases formed during perovskite formation from precursor decomposition
0
1000
2000
3000
4000
5000
6000
20 30 40 50 60 70 80
angle(2θ)
Intensity
1000°C, 8 hours
1200°C, 12 hours
1400°C, 12 hours
CaIn2O4
101
121
112
202
222
123
321
Figure 29 Disappearance of In-rich secondary phase CaIn2O4 at high temperatures

62
The amount of CaIn2O4 decreased with thermal treatment as shown in Figure 30
using the ratio of integrated peak intensities of CaIn2O4 peak at 33.4° and (121) CaZrO3
peak at 22.35°. The CaIn2O4 peaks decrease more rapidly in samples calcined at 1400°C
as compared to samples calcined at 1200°C.
0.00
0.05
0.10
0.15
0.20
0.25
0 4 8 12 16 20
Calcination time (hours)
Peak ratios (CaIn2O4/CaZrO3)
1200°C
1400°C
1000°C
Figure 30 Disappearance of the In-rich peak in CaZr0.9In0.1O2.95 shown by a decrease in
peak ratios.
Indium (In3+) is present in the CaZrO3 lattice as a substitutional dopant on the B
site. Due to differences in cation sizes and charge, a certain concentration limit exists
below which the perovskite lattice is able to dissolve the dopant in its structure. Presence
of the dopant in amounts larger than this solubility limit causes precipitation of an In-rich
secondary phase (CaIn2O4) which could affect the electrical properties of the material.

63
Since the formation of the CaIn2O4 phase depends on the total indium concentration, it is
useful to monitor its presence by preparing samples with varying dopant content.
Figure 31 shows XRD patterns from CaZrO3 powders with various indium
concentrations using the coprecipitation technique. All the powders prepared were
calcined at 1400°C for 12 hours. XRD peaks from pure CaZrO3 powder obtained from
Aldrich are added for comparison. While all the major peaks present could be ascribed to
the perovskite phase, presence of the CaIn2O4 phase was clearly seen in samples with x >
0.15.
0
1000
2000
3000
4000
5000
6000
7000
8000
9000
20 30 40 50 60 70 80
angle(2θ)
Intensity
CaZrO3 (Aldrich)
5% In doping
10% In doping
15% In doping
20% In doping
CaIn2O4
undoped and In-doped CaZrO3
1400°C, 12 hours
Figure 31 Formation of In-rich CaIn2O4 phase due to increased indium content in the
perovskite powder.
The lack of a prominent peak in the XRD data does not necessarily mean absence
of the phase. Peak ratios and d-spacing calculations were used to better estimate the

64
concentration at which the secondary phase formed. A plot of the peak ratios for powders
with varying indium concentrations is shown in Figure 32. These were calculated by
dividing the integrated intensity of the secondary peak by the integrated intensity of the
CaZrO3 (121) peak. The ratios seem to increase in higher indium concentrations, and also
suggest the presence of the secondary phase at indium levels greater than 5%. This is
comparable with the 4 mol% solubility reported by Kobayashi et al.144 The authors base
their argument on findings by Iwahara,101 who reported incidence of the CaIn2O4 peak in
sintered samples of 5 mol% In-doped CaZrO3.
0
0.05
0.1
0.15
0.2
0.25
0.3
0.35
0.4
0.45
0% 5% 10% 15% 20%
In-concentration
peak ratios CaIn2O4/CaZrO3(121)
Figure 32 Increase in peak ratios of integrated intensities in CaZrO3 powders with
varying In contents.
XRD results from samples with varying indium concentrations were used to
calculate variations in the lattice parameters with doping. Cohen’s method was used to

65
arrive at lattice parameter values which were well comparable to those listed in the
JCPDS card. The variation in the cell volume (V) calculated from the individual lattice
parameters is shown in Figure 33. Although the data shows considerable scatter, the plot
clearly indicates an initial increase in cell volume on indium doping suggesting that
solubility of indium in these samples is between 0 and 5%.
Although further in-depth analysis is required to accurately determine the true
solubility limit, the XRD data helps in making a rough estimate. It is also important to
recognize the importance of samples attaining equilibrium, as it might take several days
of heating to dissolve the dopant completely.
257.8
257.9
258
258.1
258.2
258.3
258.4
258.5
258.6
258.7
258.8
0 5 10 15 20 25
indium %
volume V (A3)
Figure 33 Variation of cell volume (V) with increasing indium concentration in CaZrO3.

66
Mg-doped CaZrO3 were also produced using the oxalate coprecipitation
technique. XRD data from precursors decomposed at different calcinations conditions are
shown in Figure 34. While the ordered phase CaZr4O9 (φ1) was visible in powders
decomposed at 800°C, calcinations at higher temperatures (1000°C, 1200°C) fully
formed the perovskite material. All the peaks obtained from 10 mol% Mg-doped CaZrO3
powders were attributed to the perovskite phase and appropriately indexed. No extra
peaks were seen in the XRD profile which suggests the absence of any prominent
secondary phases.
0
1000
2000
3000
4000
5000
6000
7000
20 30 40 50 60 70 80 90
2θ (deg)
Intensity
101
111
200
121
002
031
202
131301222
103
321
123
331400
242
004 420341
323
CaZr4O9
commercial CaZrO3
1200°C, 10 hours
1000°C, 10 hours
800°C, 5 hours
212
10 mol % Mg doped CaZrO3 powders
Figure 34 Mg-doped CaZrO3 powders obtained from oxalate precursor decomposition 5.1.2.3 Effect of dispersant addition
An improvement to the co-precipitation process was attempted by adding
dispersants to the liquid phase synthesis. Addition of organic surfactants like

67
PolyEthylene Glycol (PEG), to the liquid mix process could lead to reduced particle size
either by inhibiting agglomeration or by causing deagglomeration of secondary particles
formed earlier in the process.
The first mechanism explains particle size reduction based on PEG’s ability to
prevent agglomeration.145 Since PEG is a non-ionic polymer, it consists of neutral
hydrophobic and hydrophilic parts. The O-H bonds are, however, polar and should form
linkages within the system by hydrogen bonding. According to Ece et al.146, the
interfacial energy at the particle/liquid interface is reduced because of these surface
linkages as the adsorbed polymer produces repulsive forces between the suspended
particles. Steric stabilization of the dispersion results in limited particle-particle
interactions and reduced agglomeration. A schematic of particles separated by PEG
molecules is shown in Figure 35.
Uhland et al. 147 propose a different mechanism in which PEG is said to promote
deagglomeration and redispersion of particles. According to this model, osmotic pressure
is created due to a change in the chemical potential of the solvent within and outside the
agglomerate. Since the osmotic pressure is inversely related to the molecular weight of
the polymer, a lower molecular weight PEG should be more effective in breaking down
larger agglomerates. SEM micrographs of Fe-Ni double oxalates shown by Uekawa et
al.148 confirm that particle size increases with increasing molecular weight of PEG.
SEM micrographs of the powders synthesized in this work are shown in Figure 36
and Figure 37. Figure 37 shows the considerable agglomeration in powders prepared
using without PEG, while better-dispersed, finer powders are present in the case of PEG

68
addition (Figure 36). This confirms the theory that addition of PEG helps in the formation
of powders with reduced particle size and agglomeration.
Figure 35 Schematic of surfactant PEG preventing particle agglomeration by limiting
particle-particle interactions.
The particle size distribution was characterized using the laser scattering
technique, results from which are shown in Figure 38 and Figure 39. The addition of PEG
had an effect on the distribution. Powders synthesized without PEG consist mainly of
larger particles with a relatively narrow distribution. Addition of the surfactant however,
results in a wider distribution with an increase in the amount of smaller agglomerates.

69
Figure 36 SEM image of precursor particles synthesized using PEG as a surfactant.
Figure 37 SEM image of precursor particles synthesized without use of PEG.
Precursor agglomerates
Fine precursor particles
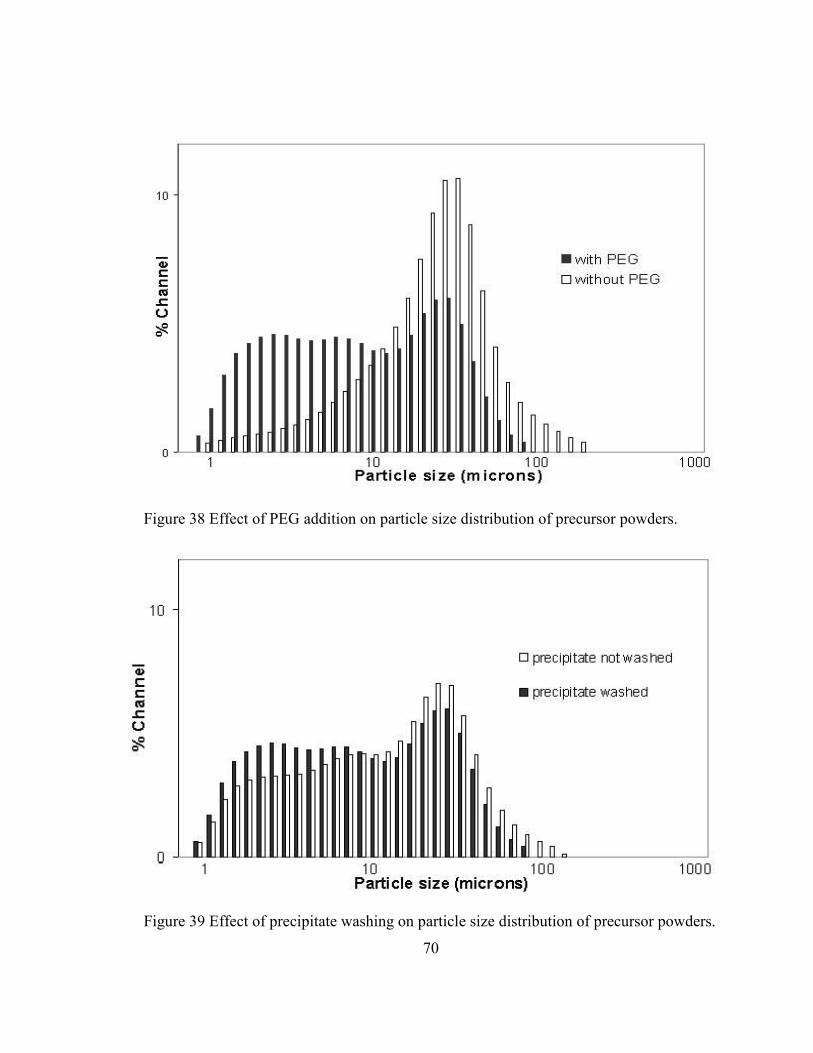
70
Figure 38 Effect of PEG addition on particle size distribution of precursor powders.
Figure 39 Effect of precipitate washing on particle size distribution of precursor powders.
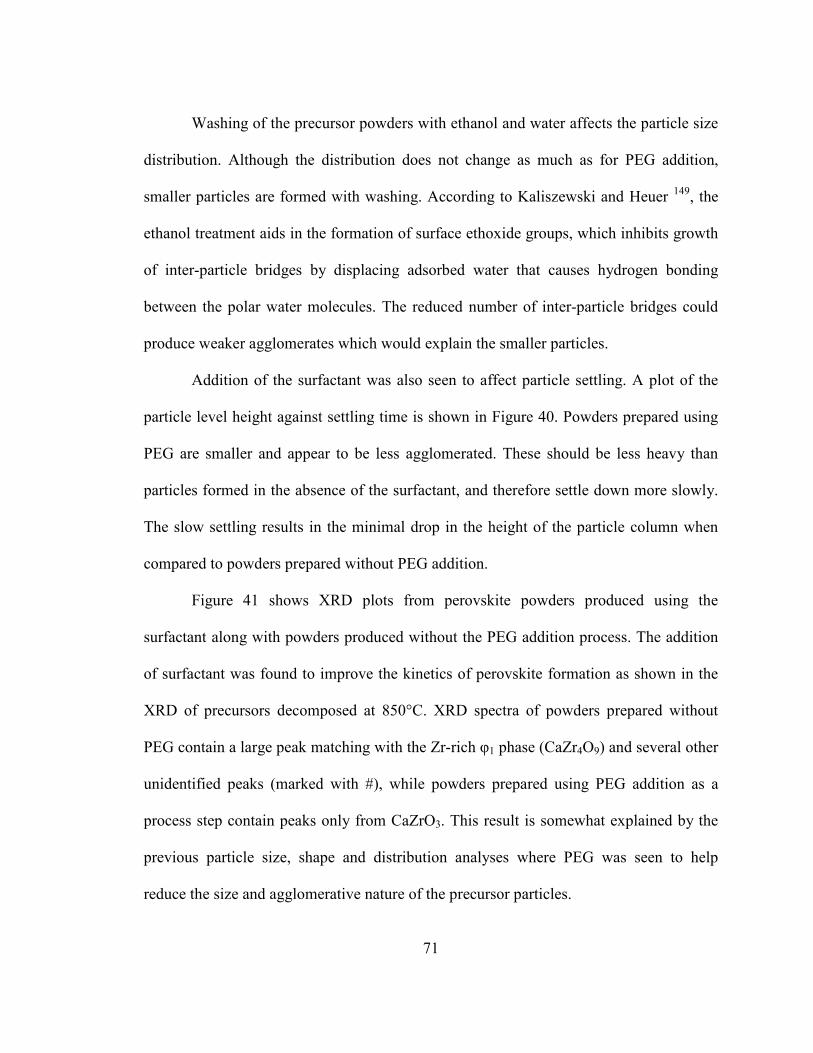
71
Washing of the precursor powders with ethanol and water affects the particle size
distribution. Although the distribution does not change as much as for PEG addition,
smaller particles are formed with washing. According to Kaliszewski and Heuer 149, the
ethanol treatment aids in the formation of surface ethoxide groups, which inhibits growth
of inter-particle bridges by displacing adsorbed water that causes hydrogen bonding
between the polar water molecules. The reduced number of inter-particle bridges could
produce weaker agglomerates which would explain the smaller particles.
Addition of the surfactant was also seen to affect particle settling. A plot of the
particle level height against settling time is shown in Figure 40. Powders prepared using
PEG are smaller and appear to be less agglomerated. These should be less heavy than
particles formed in the absence of the surfactant, and therefore settle down more slowly.
The slow settling results in the minimal drop in the height of the particle column when
compared to powders prepared without PEG addition.
Figure 41 shows XRD plots from perovskite powders produced using the
surfactant along with powders produced without the PEG addition process. The addition
of surfactant was found to improve the kinetics of perovskite formation as shown in the
XRD of precursors decomposed at 850°C. XRD spectra of powders prepared without
PEG contain a large peak matching with the Zr-rich φ1 phase (CaZr4O9) and several other
unidentified peaks (marked with #), while powders prepared using PEG addition as a
process step contain peaks only from CaZrO3. This result is somewhat explained by the
previous particle size, shape and distribution analyses where PEG was seen to help
reduce the size and agglomerative nature of the precursor particles.

72
0.0
0.5
1.0
1.5
2.0
2.5
3.0
3.5
4.0
0 20 40 60 80 100 120 140 160 180
settling time (mins)
particle bed height (cm)
with PEG
without PEG
Figure 40 Influence of PEG on particle settling. Powders prepared using PEG settled
down slower than those prepeared without PEG indicating smaller sizes.
0
500
1000
1500
2000
2500
3000
3500
20 30 40 50 60 70 80 90
angle (2θ)
Intensity
with PEG addition
without PEG addition#
#
##
# - other non CaZrO3 phasesCaZr4O9
Figure 41 Effect of PEG addition on perovskite formation from precursor powders.
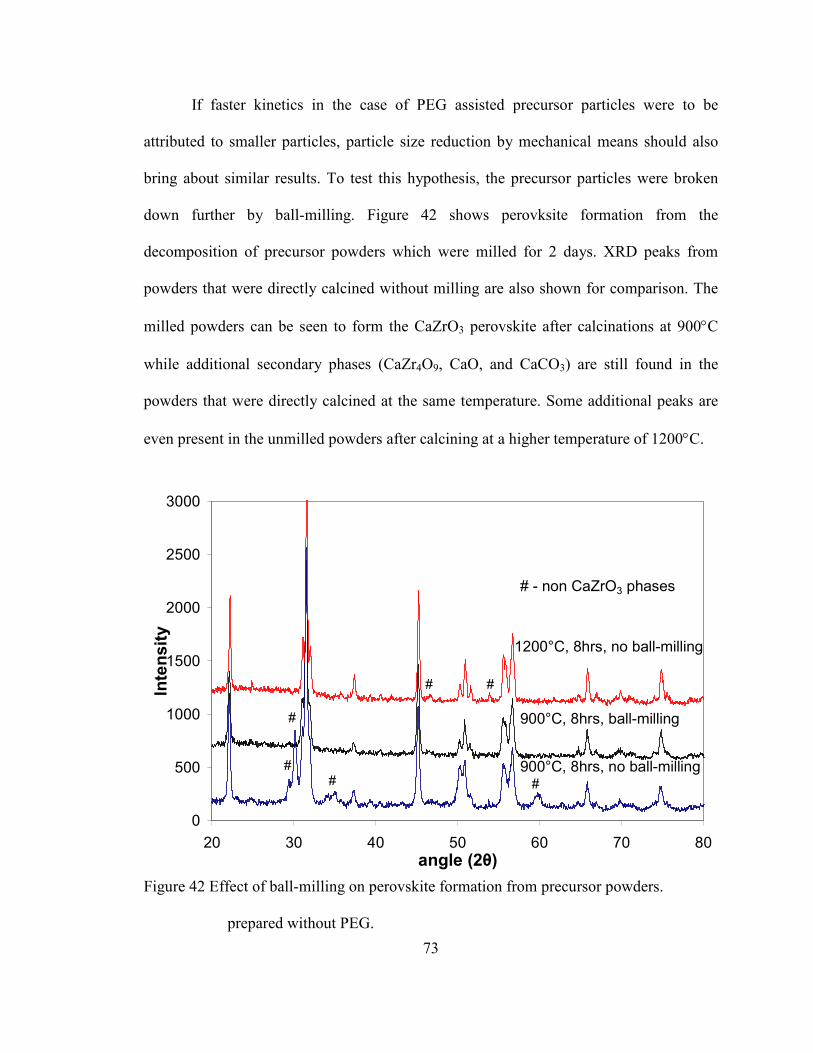
73
If faster kinetics in the case of PEG assisted precursor particles were to be
attributed to smaller particles, particle size reduction by mechanical means should also
bring about similar results. To test this hypothesis, the precursor particles were broken
down further by ball-milling. Figure 42 shows perovksite formation from the
decomposition of precursor powders which were milled for 2 days. XRD peaks from
powders that were directly calcined without milling are also shown for comparison. The
milled powders can be seen to form the CaZrO3 perovskite after calcinations at 900°C
while additional secondary phases (CaZr4O9, CaO, and CaCO3) are still found in the
powders that were directly calcined at the same temperature. Some additional peaks are
even present in the unmilled powders after calcining at a higher temperature of 1200°C.
0
500
1000
1500
2000
2500
3000
20 30 40 50 60 70 80
angle (2θ)
Intensity
900°C, 8hrs, no ball-milling
1200°C, 8hrs, no ball-milling
900°C, 8hrs, ball-milling
#
# - non CaZrO3 phases
#
#
# #
#
Figure 42 Effect of ball-milling on perovskite formation from precursor powders.
prepared without PEG.

74
The XRD plots Figure 41 and Figure 42 show that precursor powders that were
either ball-milled or prepared using PEG result in the formation of CaZrO3 without any
secondary phases. The consequence of ball-milling precursor powders prepared using
PEG is however not clear. To investigate this effect, precursor powders were ball-milled
for 2 days after being prepared using PEG. XRD peaks obtained from the decomposition
of the milled powders at 800°C and 950°C are shown in Figure 43.
0
500
1000
1500
2000
2500
20 30 40 50 60 70 80 90
angle (2θ)
intensity
800°C-8 hrs - no BM
800C°C-8hrs-BM
900°C - 24hrs - BM
101
121
112
202
222
123
321242
Figure 43 Effect of ball-milling on perovskite formation from precursor powders
prepared using PEG.
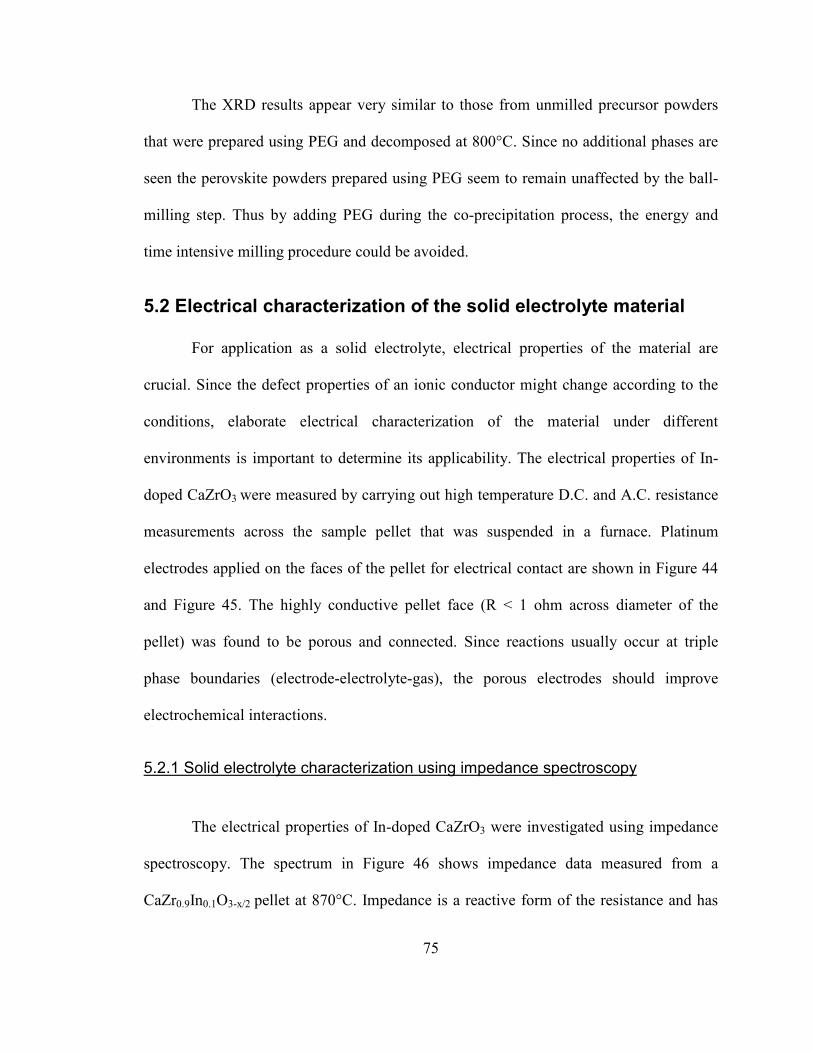
75
The XRD results appear very similar to those from unmilled precursor powders
that were prepared using PEG and decomposed at 800°C. Since no additional phases are
seen the perovskite powders prepared using PEG seem to remain unaffected by the ball-
milling step. Thus by adding PEG during the co-precipitation process, the energy and
time intensive milling procedure could be avoided.
5.2 Electrical characterization of the solid electrolyte material
For application as a solid electrolyte, electrical properties of the material are
crucial. Since the defect properties of an ionic conductor might change according to the
conditions, elaborate electrical characterization of the material under different
environments is important to determine its applicability. The electrical properties of In-
doped CaZrO3 were measured by carrying out high temperature D.C. and A.C. resistance
measurements across the sample pellet that was suspended in a furnace. Platinum
electrodes applied on the faces of the pellet for electrical contact are shown in Figure 44
and Figure 45. The highly conductive pellet face (R < 1 ohm across diameter of the
pellet) was found to be porous and connected. Since reactions usually occur at triple
phase boundaries (electrode-electrolyte-gas), the porous electrodes should improve
electrochemical interactions.
5.2.1 Solid electrolyte characterization using impedance spectroscopy
The electrical properties of In-doped CaZrO3 were investigated using impedance
spectroscopy. The spectrum in Figure 46 shows impedance data measured from a
CaZr0.9In0.1O3-x/2 pellet at 870°C. Impedance is a reactive form of the resistance and has

76
both resistive and capacitive elements. Real and imaginary parts of the impedance (Z’
and Z”) plotted against each other are shown in the Nyquist plot, while the frequency
dependent Bode representations are shown in Figure 47 and Figure 48.
The Nyquist plot shows two semicircular relaxations seen at different frequency
regions. These semicircles were attributed to bulk and grain boundary contributions and
modeled using a circuit comprising of 2 R-CPE (R-resistance, CPE-constant phase
element) units in series, with a series resistance (Rc) for contact. Such circuits, also called
as brick layer models (BLM), are common in the modeling of electrochemical impedance
data from polycrystalline materials.150 Fit results achieved using this 2 layer BLM model
are shown as trend lines in each of the impedance plots. Table 3 shows the equivalent
circuit model used along with the individual parameters that were extracted from the data
fit.
Figure 44 Pellet surface with porous Pt electrodes at 1000x.
77
Figure 45 Highly networked Pt electrode on CaZrO3 pellet at 3500x.
The capacitance values C1 and C2 obtained for the 2 semicircles are 3.2x10⁻¹⁰ F
and1.2x10-6 F, respectively. As expected, the low frequency capacitance (grain boundary)
is much higher than that of the high frequency semicircle (bulk). Grain boundaries
normally act as sinks for impurities, which increases their capacitance. This results in a
large value of the time constant (τ = RC), thus shifting the semicircle to lower
frequencies. Schematic of a polycrystalline ceramic microstructure shown in Figure 49
containing randomly oriented individual grains separated by grain boundaries.
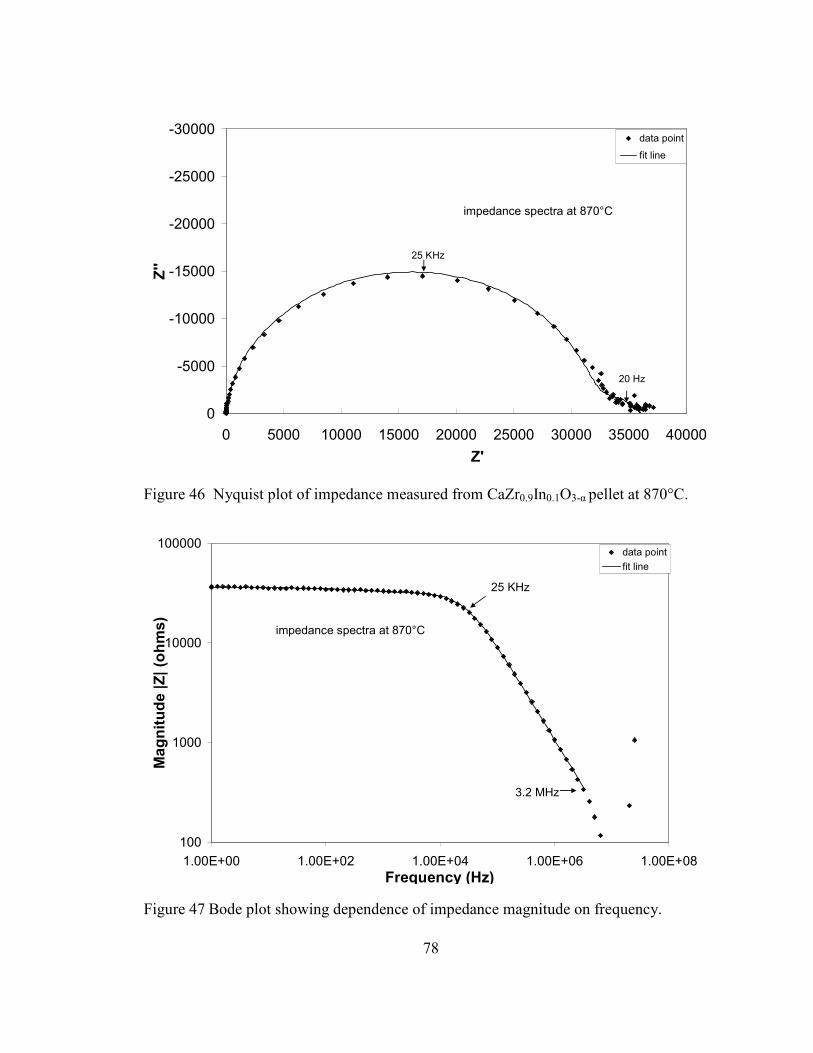
78
-30000
-25000
-20000
-15000
-10000
-5000
0
0 5000 10000 15000 20000 25000 30000 35000 40000
Z'
Z''
data point
fit line
impedance spectra at 870°C
25 KHz
20 Hz
Figure 46 Nyquist plot of impedance measured from CaZr0.9In0.1O3-α pellet at 870°C.
100
1000
10000
100000
1.00E+00 1.00E+02 1.00E+04 1.00E+06 1.00E+08
Frequency (Hz)
Magnitude |Z| (ohms)
data point
fit line
impedance spectra at 870°C
25 KHz
3.2 MHz
Figure 47 Bode plot showing dependence of impedance magnitude on frequency.

79
-100
-90
-80
-70
-60
-50
-40
-30
-20
-10
0
1.E+00 1.E+02 1.E+04 1.E+06 1.E+08
Frequency (Hz)
theta (deg)
data point
fit line
impedance spectra at 870°C
25 KHz
Figure 48 Bode representation showing variation of phase lag (θ) with frequency.
Element Value Error %
Rc (ohms) 4.2 N/A
R1 (ohms) 31783 1.19
CPE1-T (F) 3.12E-10 4.42
CPE1-P 0.95 0.37
R2 (ohms) 4236 11.02
CPE2-T (F) 1.19E-06 47.6
CPE2-P 0.69 11.7
Table 3 Two layer brick layer model along with values of circuit parameters extracted
from relaxations observed at 870°C.
Rc R1
CPE1
R2
CPE2

80
Figure 49 Schematic showing a polycrystalline pellet across which A.C and D.C
resistance is measured.
As described earlier, semicircular relaxations seen in the impedance spectrum
were modeled using the equivalent circuit shown. The model used a series resistance, Rs
to represent the contact resistance of the lead wires, while R1 and R2 were attributed to
the grain and grain boundary resistance contributions. Constant phase elements (CPE1
and CPE2) were used to model the individual capacitive contributions. This distributed
element is defined by 2 values CPE-T and CPE-P, where impedance Z is given by ZCPE =
A(jw)1-n.
The term CPE-T gives the capacitance of the element, whereas CPE-P (empirical
factor, n) accounts for depressed nature of the semicircles. A value of 1 for n indicates
pure capacitance, while any heterogeneity in the material lowers n. The values of CPE1-P
represent the level of homogeneity in the current paths. Conduction through the bulk
appears to be highly homogenous since values of CPE1-P are close to 1, which is

81
indicative of an ideal Debye-like relaxation. Grain boundaries, on the other hand, usually
act as sinks for impurities which make the conduction process heterogeneous. This is
evident from the values of CPE2-P which are much lower than the ideal value of 1.
The circuit model proposed represents the impedance data well. Fitting errors are
consistently less than 15% for almost all elements. The relatively higher errors in fitting
the capacitive element at lower frequencies is one of the limitations of the brick layer
model detailed by Fleig et al.151 The model is however highly suitable for analysis of bulk
properties. This circuit will hence fore be used in modeling the impedance measurements
carried out in this work.
5.2.2 Conductivity of undoped CaZrO3 in air
As electrical conduction in a solid electrolyte is a temperature-activated process,
the increase in conductivity with temperature for ceramic materials bears an Arrhenius
relationship. Figure 50 shows an Arrhenius plot of the D.C. conductivities measured from
an undoped CaZrO3 pellet at various temperatures in air. The plot also shows
conductivity values reported in other literature sources. Wang et al.152 measured D.C
conductivities at a higher temperature range with a pellet synthesized using the solid
oxide method. Rog et al.153 and Dudek et al.154 have also reported conductivities for pure
CaZrO3. Conductivities typically around (10-5 ohm-1cm-1 at 900°C) were measured.
These agree reasonably well with the literature. They are quite comparable to the values
published by Rog et al.,153 but slightly higher than those reported by Dudek 154 and Wang
et al.152 Discrepancies in the literature can be explained by differences in microstructure
since electrical conductivity is extremely sensitive to processing.
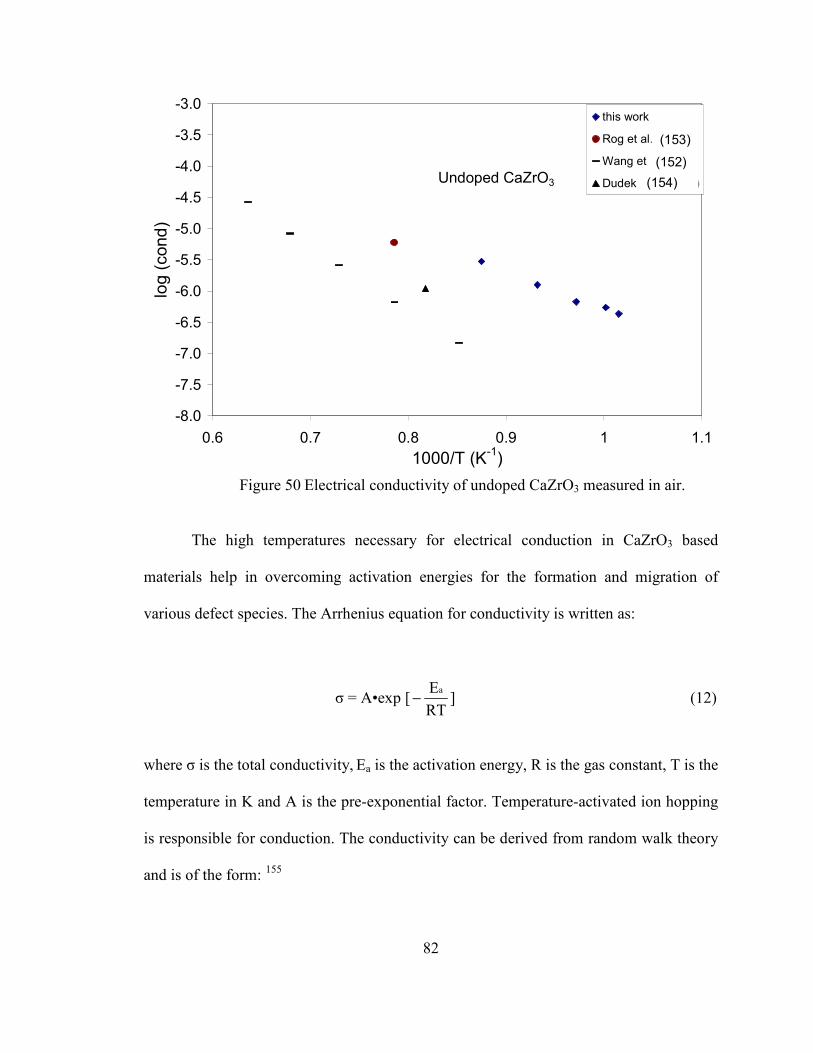
82
-8.0
-7.5
-7.0
-6.5
-6.0
-5.5
-5.0
-4.5
-4.0
-3.5
-3.0
0.6 0.7 0.8 0.9 1 1.1
1000/T (K-1)
log (cond)
this work
Rog et al.(2002)
Wang et al.(1997)
Dudek et al.(2003)Undoped CaZrO3
(153)
(152)
(154)
Figure 50 Electrical conductivity of undoped CaZrO3 measured in air.
The high temperatures necessary for electrical conduction in CaZrO3 based
materials help in overcoming activation energies for the formation and migration of
various defect species. The Arrhenius equation for conductivity is written as:
σ = A•exp [RT
Ea− ] (12)
where σ is the total conductivity, Ea is the activation energy, R is the gas constant, T is the
temperature in K and A is the pre-exponential factor. Temperature-activated ion hopping
is responsible for conduction. The conductivity can be derived from random walk theory
and is of the form: 155

83
log (σ•T) = log (A) RT
Ea− (13)
Using the above equation, the activation energy for the conduction process can be
computed from the slope of the line drawn in the plot of log (σ•T) vs 1/T.
Figure 51 shows an Arrhenius type conductivity plot for undoped CaZrO3
measured in air. The measurements are highly linear (R2 = 0.99), with an activation
energy of about 1.2 eV, which is in agreement with value of 1.14 eV reported by Hwang
et al.156 for a similar temperature range. The plot also shows linear trends calculated from
literature data. Activation energies of 2.16 eV and 2.42 eV were calculated from
Janke’s157 measurements with non-stoichiometric CaZrO3 at higher temperatures.
De Pretis et al.158 carried out conductivity measurements on pure CaZrO3 and
concluded the material to be a p-type conductor in air. This would mean holes are the
predominant defect species responsible for conduction across the electrolyte. The Kroger-
Vink notation for the formation of holes can be written as:
••
oV +
2
1O2 = 2 •h + Ox
o (14)
where ••
oV is an oxygen vacancy, •h is a hole andOxo denotes oxygen on an oxygen site.
At 1000°C, Dudek et al.154 carried out EMF measurements using a concentration
cell and measured an oxygen ion transference number of 0.92. This would suggest that
pure CaZrO3 is mainly an oxygen-ion conductor at higher temperatures. Data from Wang
et al.152 and Janke et al.15757 also agree with this as the activation energy calculated from

84
their work is close to the (~2eV) value reported for oxygen ion vacancy migration in
CaZrO3.159
Figure 51 also shows a set of conductivity measurements extracted from
A.C. impedance work carried out by Wang et al. 160 While the authors plotted the data set
as a single series, it seems better represented when replotted as two different lines split
based on the temperature range. The different slopes indicate that the activation energy
(or dominant defect species) changes with increase in temperature, which would explain
a possible transition of the predominant defect from holes to that of oxygen ion vacancies
at the higher temperatures.
Ea = 2.18 eV
Ea = 2.76 eV
Ea = 1.26 eV
Ea = 1.8 eV
Ea = 2.42 eV
Ea = 2.16 eV
-5
-4
-3
-2
-1
0
1
2
3
0.5 0.6 0.7 0.8 0.9 1 1.1
1000/T (K-1)
log (?.T) (ohmcm)-1.K
pure sample, Ref-30
pure sample, Ref-38
pure sample, this work
Ca-deficient sample, Ref-35
Zr-deficient sample, Ref-35
pure sample, Ref-38
(154)
Ref 162(162)
(162)
(159)
(159)
Ea = 2.18 eV
Ea = 2.76 eV
Ea = 1.26 eV
Ea = 1.8 eV
Ea = 2.42 eV
Ea = 2.16 eV
-5
-4
-3
-2
-1
0
1
2
3
0.5 0.6 0.7 0.8 0.9 1 1.1
1000/T (K-1)
log (σ.T) (ohmcm)-1.K
pure sample, Ref-30
pure sample, Ref-38
pure sample, this work
Ca-deficient sample, Ref-35
Zr-deficient sample, Ref-35
pure sample, Ref-38
(154)
Ref 162(162)
(162)
(159)
(159)
(152)
Ref 162(160)
(160)
(157)
(157)
Ea = 2.18 eV
Ea = 2.76 eV
Ea = 1.26 eV
Ea = 1.8 eV
Ea = 2.42 eV
Ea = 2.16 eV
-5
-4
-3
-2
-1
0
1
2
3
0.5 0.6 0.7 0.8 0.9 1 1.1
1000/T (K-1)
log (?.T) (ohmcm)-1.K
pure sample, Ref-30
pure sample, Ref-38
pure sample, this work
Ca-deficient sample, Ref-35
Zr-deficient sample, Ref-35
pure sample, Ref-38
Ea = 2.18 eV
Ea = 2.76 eV
Ea = 1.26 eV
Ea = 1.8 eV
Ea = 2.42 eV
Ea = 2.16 eV
-5
-4
-3
-2
-1
0
1
2
3
0.5 0.6 0.7 0.8 0.9 1 1.1
1000/T (K-1)
log (?.T) (ohmcm)-1.K
pure sample, Ref-30
pure sample, Ref-38
pure sample, this work
Ca-deficient sample, Ref-35
Zr-deficient sample, Ref-35
pure sample, Ref-38
(154)
Ref 162(162)
(162)
(159)
(159)
(154)
Ref 162(162)
(162)
(159)
(159)
Ea = 2.18 eV
Ea = 2.76 eV
Ea = 1.26 eV
Ea = 1.8 eV
Ea = 2.42 eV
Ea = 2.16 eV
-5
-4
-3
-2
-1
0
1
2
3
0.5 0.6 0.7 0.8 0.9 1 1.1
1000/T (K-1)
log (σ.T) (ohmcm)-1.K
pure sample, Ref-30
pure sample, Ref-38
pure sample, this work
Ca-deficient sample, Ref-35
Zr-deficient sample, Ref-35
pure sample, Ref-38
(154)
Ref 162(162)
(162)
(159)
(159)
(152)
Ref 162(160)
(160)
(157)
(157)
Figure 51 Arrhenius plot of conductivity for samples of CaZrO3 measured in air.

85
Sample description Reference Temperature range (K)
Activation energy
Undoped (D.C) This work 983-1173 K 1.26 eV Undoped (D.C.) Hwang et al.156 870-1370 K 1.25 eV
Undoped (A.C-hi freq) 2.76 eV
Undoped (A.C-total R)
Wang et al.160
1370-1670 K
2.75 eV
CaO+CaZrO3 (D.C) 2.16 eV
ZrO2+CaZrO3 (D.C)
Janke et al.157
1373-1873 K
2.42 eV
Undoped (D.C.) Wang et al.152 1173-1573 K 2.18 eV
Table 4 List of activation energies reported for stoichiometric and non-stoichiometric
CaZrO3 according to mode of measurement and temperature range.
5.2.3 Conductivity of In-doped CaZrO3 in air
Although stoichiometric CaZrO3 seems to behave like a p-type semiconductor in
air, changes in the electrical behavior are expected when the dopant is incorporated into
the lattice. The introduction of the aliovalent (different valence) In3+ cation results in a
substitution reaction. In3+ (0.8 Å, VI fold) is closer in size161 to the Zr4+ cation in the
octahedral arrangement (0.72 Å), than the Ca2+ cation (1.12 Å ) present in the VIII
coordinate site.63 The substitution therefore causes the replacement of some of the Zr4+
ions in the lattice and creates oxygen vacancies to maintain electrical neutrality. One
vacancy is created for every 2 dopant (In3+) substitutions through the following reaction,
In2O3 (-2ZrO2) = 'ZrIn2 +
••
oV +3Oxo (15)

86
where, 'ZrIn is the substituted indium ion on the zirconium site. While oxygen vacancies
form holes in the presence of oxygen, they react with moisture to form protons which
dissolve in the lattice. The Kroger-Vink notation for this reaction can be written as,
••
oV + H2O=2
•H + Oxo (16)
where •H represents the proton formed.
Bulk conductivity values of Ca(Zr,In)O3 pellets were measured using D.C. and
high frequency A.C. measurements. Increases in total conductivity of the material are
expected with doping since additional vacancies have been created. Conductivities
observed in undoped and indium-doped CaZrO3 samples are plotted in Figure 52.
Conductivities in 5 mol% In-doped CaZrO3 are 1-2 orders of magnitude larger than that
observed in undoped samples. Results obtained by Wei et al. 122 also compare well with
the observed data as a similar slope is observed. Data fitting using the circuit model
yields resistance and capacitance contributions of the bulk and grain boundary
components. The magnitude of the slope (and hence Ea), should remain unchanged
irrespective of whether resistances or conductivities are plotted against temperature,
although the sign reverses. The Arrhenius behavior of bulk and grain boundary
resistances calculated at various temperatures is plotted in Figure 53.

87
Ea = 0.713 eVEa = 0.74 eV
Ea = 1.1 eV
-7
-6.5
-6
-5.5
-5
-4.5
-4
-3.5
-3
0.7 0.8 0.9 1 1.1 1.2 1.3
1000/T (K-1)
logσT (ohm-1cm-1).K
9%In-Wei et al
5%In- current work
undoped pellet - current work
(123)
Ea = 0.713 eVEa = 0.74 eV
Ea = 1.1 eV
-7
-6.5
-6
-5.5
-5
-4.5
-4
-3.5
-3
0.7 0.8 0.9 1 1.1 1.2 1.3
1000/T (K-1)
logσT (ohm-1cm-1).K
9%In-Wei et al
5%In- current work
undoped pellet - current work
(123)
Figure 52 Bulk conductivities observed for Ca(Zr,In)O3 and CaZrO3 samples in air
In the plot, R1 represents the high frequency resistance (grain) and R2 represents
the low frequency resistance (grain boundary). The D.C resistance measured at the same
temperature range using a multimeter is also plotted. A linear trend is observed in all of
the data sets. Similar slopes are observed in the lines representing D.C resistance, total
resistance (R1+R2) and high frequency bulk resistance (R1). This trend has been
previously observed by Wang et al.160 The activation energies calculated from the various
slopes are shown in the figure. Ea for bulk conduction (from R1) from a CaZr0.95In0.05O3-
x/2 sample measured in air was ~ 0.7 eV, whereas that for grain boundary conduction
(from R2) was ~1 eV.
The measured bulk Ea value (0.7 eV) matches well with the 0.76 eV measured by
Kurita et al.162 for protonic conduction. Since holes are suspected to be responsible for

88
conduction in undoped CaZrO3 tested in air, the shift towards proton conduction must be
due to doping. The creation of protons has already been discussed as shown in (4). Using
molecular dynamic simulations, Islam163 predicted an interstitial position for the proton
which moves by way of inter-octahedra jumps between the oxygen atoms. The author
calculated activation energy of 0.74 eV for the protonic conduction, a value that agrees
well with this work as well as other experimental data.
The activation energy associated with low frequency grain boundary resistance
(R2) appears to be higher than that measured for bulk and total resistance. This matches
findings from Hwang et al.,156 who measured bulk activation energy of 0.85 eV and grain
boundary activation energy of 1.2 eV. The higher activation energy could be due to
inhomogeneities present in the grain boundaries that could impede the ion hopping
processes.
The time constants for the individual relaxation processes (τ1 = R1C1, τ2 = R2C2)
were calculated using the individual resistance and capacitance values obtained from the
data fit. The Arrhenius plot of these two time constants is shown in Figure 54. The slope
of the line attributed to the bulk time constant matches that observed for bulk resistance.
Similar slopes would mean similar activation energies, indicating that the bulk
capacitance remained invariant with temperature. This trend has been observed in pure
CaZrO3 samples by Wang et al.160 The grain boundary time constant had a different
activation energy (0.6 eV) from that of grain boundary resistance (1.07 eV). It should be
noted that the linear fit however, does not seem to be satisfactory with a R2 value of 0.62.

89
2.0
2.3
2.6
2.9
3.2
3.5
3.8
4.1
4.4
0.95 1.00 1.05 1.10 1.15 1.20
1000/T (K-1)
logR (ohms)
DC resistance, Ea = 0.72 eV
AC total resistance (R1+R2), Ea = 0.68 eV
High freq. component (R1), Ea = 0.63 eV
Low freq. component (R2), Ea = 1.07 eV
5 mol% In2O3-doped CaZrO3 in air
Figure 53 Variation of resistance with temperature in CaZr0.95In0.05O2.975 measured in air.
y = 3.299x - 8.8518
R2 = 0.9608
y = 2.9877x - 3.6419
R2 = 0.6239
-9.0
-8.0
-7.0
-6.0
-5.0
-4.0
-3.0
-2.0
-1.0
0.0
0.9 0.95 1 1.05 1.1 1.15 1.21000/T (K
-1)
log τ (s)
Bulk time constant, Ea = 0.65 eV, R2 = 0.96
grain boundary time constant, Ea = 0.6 eV, R2 = 0.624
τ1
τ2
y = 3.299x - 8.8518
R2 = 0.9608
y = 2.9877x - 3.6419
R2 = 0.6239
-9.0
-8.0
-7.0
-6.0
-5.0
-4.0
-3.0
-2.0
-1.0
0.0
0.9 0.95 1 1.05 1.1 1.15 1.21000/T (K
-1)
log τ (s)
Bulk time constant, Ea = 0.65 eV, R2 = 0.96
grain boundary time constant, Ea = 0.6 eV, R2 = 0.624
τ1
τ2
Figure 54 Variation of time constants with temperature for CaZr0.95In0.05O3-α measured in
air.

90
Capacitances obtained from the data fit are plotted in Figure 55. Data reported by
Wang et al 160 is also shown for comparison. Bulk capacitances are found to be of the
order of (~0.1nF), while grain boundary capacitances which remain high presumably due
to the presence of impurities, are close to (~1µF). Capacitances attributed to the bulk
appear to remain constant with temperature, while grain boundary capacitances seem to
vary with temperature, a trend different from that observed in pure CaZrO3 by Wang et
al.160 However, there seems to be again considerable scatter in the points similar to the
component’s resistance and time constant contributions plotted earlier.
-11.6
-10.6
-9.6
-8.6
-7.6
-6.6
-5.6
-4.6
-3.6
-2.6
0.0 0.2 0.4 0.6 0.8 1.0 1.2 1.4
1000/T (K-1)
log C (F)
bulk capacitance-this work
Grain boundary capacitance - this work
bulk capacitance-Wang et al. JMS (1997)
grain boundary capacitance-Wang et al. JMS(1997)
(162)
(162)
-11.6
-10.6
-9.6
-8.6
-7.6
-6.6
-5.6
-4.6
-3.6
-2.6
0.0 0.2 0.4 0.6 0.8 1.0 1.2 1.4
1000/T (K-1)
log C (F)
bulk capacitance-this work
Grain boundary capacitance - this work
bulk capacitance-Wang et al. JMS (1997)
grain boundary capacitance-Wang et al. JMS(1997)
(162)
(162)
(160)
(160)
-11.6
-10.6
-9.6
-8.6
-7.6
-6.6
-5.6
-4.6
-3.6
-2.6
0.0 0.2 0.4 0.6 0.8 1.0 1.2 1.4
1000/T (K-1)
log C (F)
bulk capacitance-this work
Grain boundary capacitance - this work
bulk capacitance-Wang et al. JMS (1997)
grain boundary capacitance-Wang et al. JMS(1997)
-11.6
-10.6
-9.6
-8.6
-7.6
-6.6
-5.6
-4.6
-3.6
-2.6
0.0 0.2 0.4 0.6 0.8 1.0 1.2 1.4
1000/T (K-1)
log C (F)
bulk capacitance-this work
Grain boundary capacitance - this work
bulk capacitance-Wang et al. JMS (1997)
grain boundary capacitance-Wang et al. JMS(1997)
(162)
(162)
(162)
(162)
-11.6
-10.6
-9.6
-8.6
-7.6
-6.6
-5.6
-4.6
-3.6
-2.6
0.0 0.2 0.4 0.6 0.8 1.0 1.2 1.4
1000/T (K-1)
log C (F)
bulk capacitance-this work
Grain boundary capacitance - this work
bulk capacitance-Wang et al. JMS (1997)
grain boundary capacitance-Wang et al. JMS(1997)
-11.6
-10.6
-9.6
-8.6
-7.6
-6.6
-5.6
-4.6
-3.6
-2.6
0.0 0.2 0.4 0.6 0.8 1.0 1.2 1.4
1000/T (K-1)
log C (F)
bulk capacitance-this work
Grain boundary capacitance - this work
bulk capacitance-Wang et al. JMS (1997)
grain boundary capacitance-Wang et al. JMS(1997)
(162)
(162)
(160)
(160)
Figure 55 Variation of capacitances in In-doped CaZrO3 measured in air.
This trend is also seen in Figure 56 where values of the exponent n are plotted against
temperature. The parameter is obtained from the data fit where the constant phase
element is used to model the impedance data.164 A value of 1 means the CPE acts as a

91
pure capacitor and indicates homogenous dispersion. As seen in Figure 56, bulk values of
n remain close to 1 and are unchanged with temperature. Grain boundary n values are
well below 1, which could be due to their high heterogeneity.
0.0
0.1
0.2
0.3
0.4
0.5
0.6
0.7
0.8
0.9
1.0
860 880 900 920 940 960 980 1000 1020 1040
Temperature (K)
exponent n
bulk
grain boundary
Figure 56 Variation of exponent n with temperature in In-doped CaZrO3.
5.2.4 Conductivity of In-doped CaZrO3 in dry argon
In order to understand the electrical properties of Ca(Zr,In)O3 materials at a lower
oxygen partial pressure (pO2) the sample pellet was tested in dry argon atmosphere.
Impedance spectra similar to those shown in Figure 46 were measured. These typically
consisted of two semicircles and the data was fit with a circuit model similar to that
shown earlier in Table 3. Figure 57 shows the Arrhenius plot of conductivities obtained
from the high and low frequency resistances measured in dry argon. The activation
energy for the high frequency resistance in argon (0.9 eV) is higher than that measured in
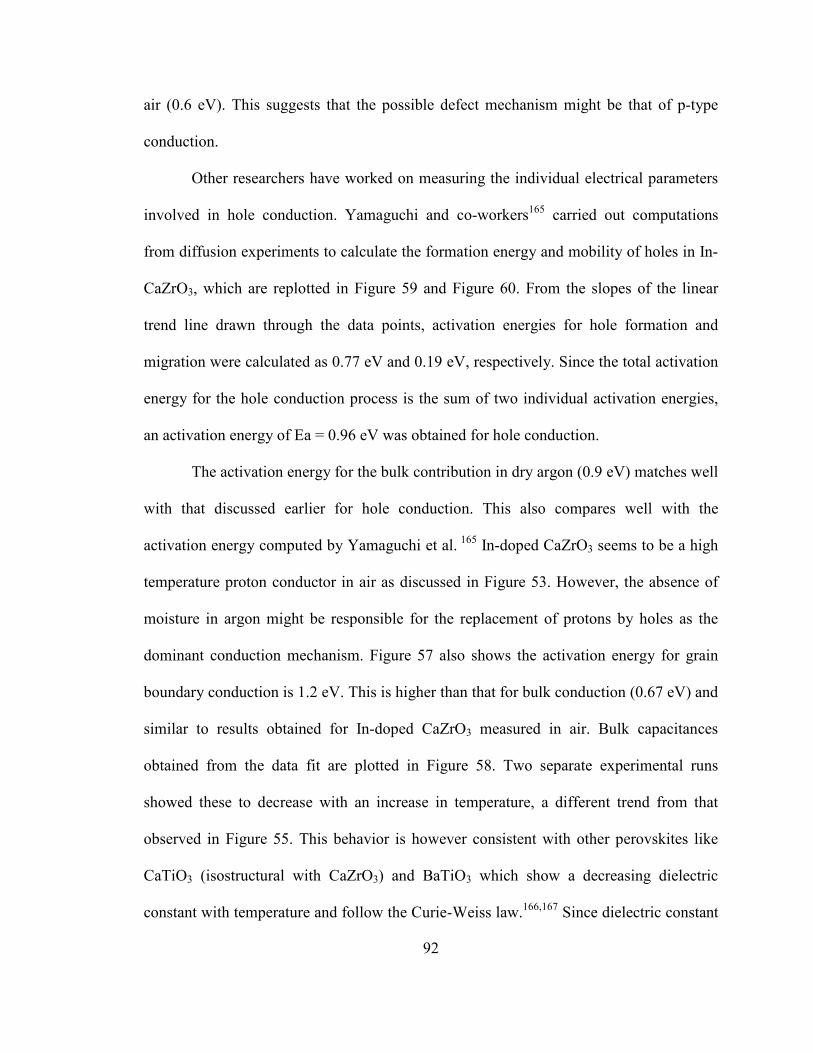
92
air (0.6 eV). This suggests that the possible defect mechanism might be that of p-type
conduction.
Other researchers have worked on measuring the individual electrical parameters
involved in hole conduction. Yamaguchi and co-workers165 carried out computations
from diffusion experiments to calculate the formation energy and mobility of holes in In-
CaZrO3, which are replotted in Figure 59 and Figure 60. From the slopes of the linear
trend line drawn through the data points, activation energies for hole formation and
migration were calculated as 0.77 eV and 0.19 eV, respectively. Since the total activation
energy for the hole conduction process is the sum of two individual activation energies,
an activation energy of Ea = 0.96 eV was obtained for hole conduction.
The activation energy for the bulk contribution in dry argon (0.9 eV) matches well
with that discussed earlier for hole conduction. This also compares well with the
activation energy computed by Yamaguchi et al. 165 In-doped CaZrO3 seems to be a high
temperature proton conductor in air as discussed in Figure 53. However, the absence of
moisture in argon might be responsible for the replacement of protons by holes as the
dominant conduction mechanism. Figure 57 also shows the activation energy for grain
boundary conduction is 1.2 eV. This is higher than that for bulk conduction (0.67 eV) and
similar to results obtained for In-doped CaZrO3 measured in air. Bulk capacitances
obtained from the data fit are plotted in Figure 58. Two separate experimental runs
showed these to decrease with an increase in temperature, a different trend from that
observed in Figure 55. This behavior is however consistent with other perovskites like
CaTiO3 (isostructural with CaZrO3) and BaTiO3 which show a decreasing dielectric
constant with temperature and follow the Curie-Weiss law.166,167 Since dielectric constant

93
is directly related to capacitance (C = kAεo/d), the capacitance in these materials must
also decrease with temperature.
-4.00
-3.50
-3.00
-2.50
-2.00
-1.50
-1.00
-0.50
0.00
0.80 0.90 1.00 1.10 1.20 1.30
1000/T(K-1)
log(cond*T) (ohm-1cm-1.K)
Bulk Ea = 0.9 eV
E
Grain boundary
Ea = 1.2 eV
Figure 57 Bulk and grain boundary conductivity of In-doped CaZrO3 in argon.
-9.60
-9.55
-9.50
-9.45
-9.40
-9.35
-9.30
-9.25
-9.20
0.80 0.90 1.00 1.10 1.20 1.30
1000/T (K-1)
log (C1) (F)
run 1
run 2
Figure 58 Variation of bulk capacitance in In-doped CaZrO3 with temperature in argon.

94
0.80
0.90
1.00
1.10
1.20
1.30
1.40
1.50
1.60
0.6 0.65 0.7 0.75 0.8
1000/T (K-1)
log(mobility*T)
Ea = 0.77 eV
Figure 59 Arrhenius plot of hole mobilities in In-doped CaZrO3.
-5.50
-5.00
-4.50
-4.00
-3.50
-3.00
-2.50
-2.00
0.6 0.65 0.7 0.75 0.8 0.85 0.9
1000/T (K-1)
log(p)
Ea = 0.19 eV
Figure 60 Activation energy for the creation of holes in In-doped CaZrO3.

95
5.2.5 Conductivity of In-doped CaZrO3 in Ar+H2O
It has been thus far been discussed that protonic conduction could be the
dominant conduction mechanism in In-doped CaZrO3 measured in air, whereas p-type
(hole) conduction is prevalent in argon environments (low H2O, low pO2). Addition of
water in dry argon helps test the doped material in a different condition (high pH2O,
lower pO2). The introduction of water might cause protons to form and replace holes as
the dominant species; a mechanistic change that can be identified by looking at the
activation energy obtained from the Arrhenius plots of conductivity.
To test this hypothesis, D.C and A.C measurements were made across a 10-mol%
In-doped CaZrO3 pellet in an environment of (Ar+H2O). In the case of impedance
measurements, a 2 layer BLM was used to model the data and extract resistance and
capacitance values. The resistances obtained were used to calculate A.C. conductivities
using sample dimensions.
D.C. and A.C. conductivities obtained from the pellet sample are shown in Figure
61 and Figure 62. The activation energies are 0.68 eV and 0.76 eV, respectively, which
match well with the previously discussed results for protonic conduction. Thus, protons
might replace holes as the major mechanism even at lower pO2’s as long as moisture is
present.
5.2.6 Electrical properties of Mg-doped CaZrO3
Pellets formed from CaZr1-xMgxO3-x (0 < x < 0.15) powders were characterized
using conductivity measurements. An Arrhenius-type plot for pellets with varying
amounts of the dopant is shown in Figure 63.
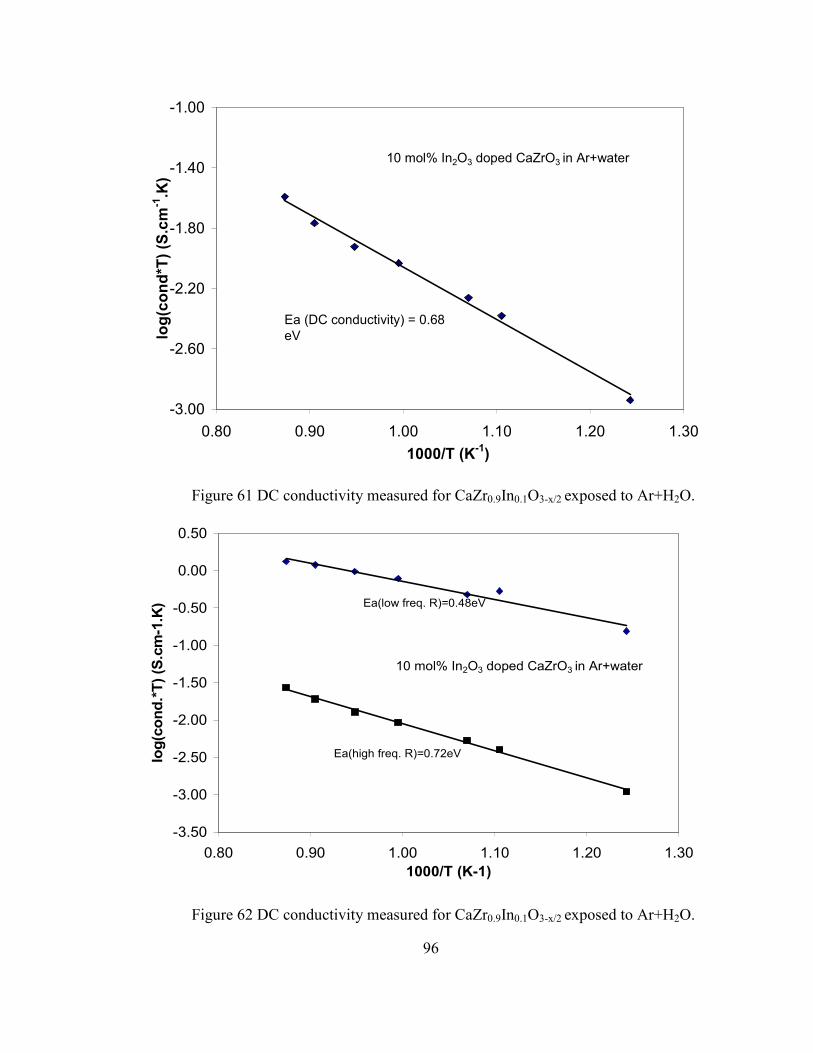
96
-3.00
-2.60
-2.20
-1.80
-1.40
-1.00
0.80 0.90 1.00 1.10 1.20 1.30
1000/T (K-1)
log(cond*T) (S.cm-1.K)
Ea (DC conductivity) = 0.68
eV
10 mol% In2O3 doped CaZrO3 in Ar+water
Figure 61 DC conductivity measured for CaZr0.9In0.1O3-x/2 exposed to Ar+H2O.
-3.50
-3.00
-2.50
-2.00
-1.50
-1.00
-0.50
0.00
0.50
0.80 0.90 1.00 1.10 1.20 1.30
1000/T (K-1)
log(cond.*T) (S.cm-1.K)
Ea(high freq. R)=0.72eV
Ea(low freq. R)=0.48eV
10 mol% In2O3 doped CaZrO3 in Ar+water
Figure 62 DC conductivity measured for CaZr0.9In0.1O3-x/2 exposed to Ar+H2O.

97
Mg-doping was found to increase the total conductivity of CaZrO3, although
conductivities were typically lower than those measured for In-doped CaZrO3. Samples
with 5% Mg doping showed the highest conductivity, as pellets with higher Mg
concentrations showed reduced values. A reduced grain boundary resistance for samples
with low Mg content might explain the improvement in total conductivity. Since Mg
solubility in CaZrO3 has been reported to be very low,168,169 the formation of a secondary
phase might occur at the grain boundaries for higher Mg concentrations (10% and 15%).
This could result in a decrease in the total conductivity.
Ea = 0.95 eV
Ea = 1.25 eV
Ea = 0.84 eV
Ea = 1.15 eV
-4
-3.5
-3
-2.5
-2
-1.5
-1
-0.5
0
0.8 0.85 0.9 0.95 1 1.05 1.1 1.15 1.2
1000/T (K-1)
log (σT) ohm-1cm-1.K
10% Mg doping
undoped
15% Mg doping
5% In doping
5 % Mg doping
Ea = 0.77 eV
Ea = 0.95 eV
Ea = 1.25 eV
Ea = 0.84 eV
Ea = 1.15 eV
-4
-3.5
-3
-2.5
-2
-1.5
-1
-0.5
0
0.8 0.85 0.9 0.95 1 1.05 1.1 1.15 1.2
1000/T (K-1)
log (σT) ohm-1cm-1.K
10% Mg doping
undoped
15% Mg doping
5% In doping
5 % Mg doping
Ea = 0.77 eV
Figure 63 Total conductivities measured for CaZr1-xMgxO3-x pellets. Results compared
with undoped and In-doped CaZrO3.

98
5.2.7 Alternate equivalent circuit model
The impedance spectra discussed thus far were modeled using the 2 layer BLM
circuit. Although this model represents the data well, the empirical nature of the constant
phase element poses limitations. Since the presence of this element could be explained by
various physical processes, it could be advantageous to reduce the number of CPE’s used
in the data fit.
Impedance data analyzed by the brick layer model indicates a heterogeneous
grain boundary contribution. The grain boundaries may be sites for possible charge-
trapping mechanisms. The trapping effect has been routinely modeled by various
researchers using a RC series combination.170 To model the entire spectrum using fewer
CPE elements, a slightly different equivalent circuit was used. A simple version of this
circuit has been used to fit data from the M* and Y* planes of the complex data (other
immittance representations) as shown by Wang et al.160 An admittance plot of the
complex data at 870°C (1MHz-1Hz) is shown in Figure 64. The curve contains a small
contribution at the low frequencies followed by a tail at the higher frequencies.
Frequency analysis suggests that the demarcation point between the 2 features matches
well with the onset of the second semicircle in the impedance plots, shown previously in
Figure 46.
Figure 65 shows the circuit parameters obtained for the same temperature using
the reduced CPE model. All the parameters seem to be estimated with reasonable errors.
The magnitude of the high frequency resistance R1 (35,764 ohms) matches well with the
sum of the 2 resistances (R1 and R2) extracted using the earlier model (Table 3). This
could be taken to represent the D.C. resistance of the pellet. The capacitance term of the
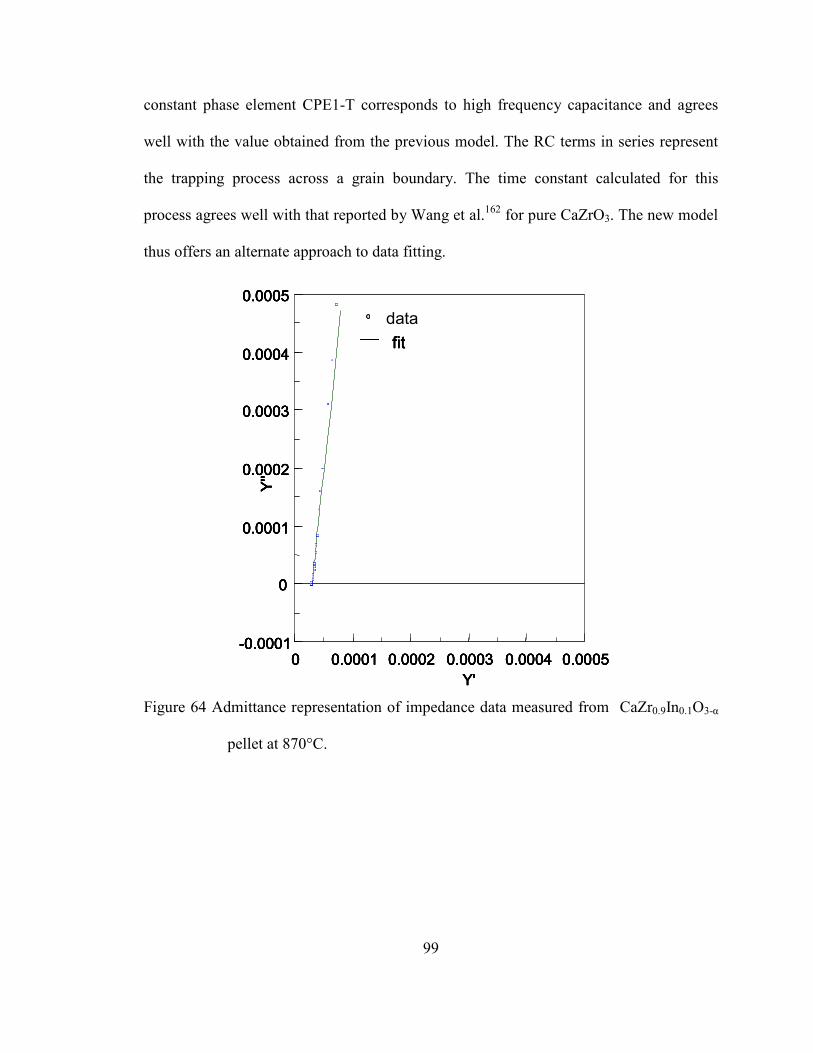
99
constant phase element CPE1-T corresponds to high frequency capacitance and agrees
well with the value obtained from the previous model. The RC terms in series represent
the trapping process across a grain boundary. The time constant calculated for this
process agrees well with that reported by Wang et al.162 for pure CaZrO3. The new model
thus offers an alternate approach to data fitting.
0 0.0001 0.0002 0.0003 0.0004 0.0005-0.0001
0
0.0001
0.0002
0.0003
0.0004
0.0005
Y'
Y''
870C.zFitResultdata
fit
0 0.0001 0.0002 0.0003 0.0004 0.0005-0.0001
0
0.0001
0.0002
0.0003
0.0004
0.0005
Y'
Y''
870C.zFitResultdata
fit
0 0.0001 0.0002 0.0003 0.0004 0.0005-0.0001
0
0.0001
0.0002
0.0003
0.0004
0.0005
Y'
Y''
870C.zFitResult
0 0.0001 0.0002 0.0003 0.0004 0.0005-0.0001
0
0.0001
0.0002
0.0003
0.0004
0.0005
Y'
Y''
870C.zFitResultdata
fit
0 0.0001 0.0002 0.0003 0.0004 0.0005-0.0001
0
0.0001
0.0002
0.0003
0.0004
0.0005
Y'
Y''
870C.zFitResultdata
fit
Figure 64 Admittance representation of impedance data measured from CaZr0.9In0.1O3-α
pellet at 870°C.

100
R1
C2 R3
CPE1
Figure 65 Circuit parameters extracted from impedance data at 870°C using the reduced
CPE model
5.2.8 Electrical characterization of In-doped CaZrO3 at very low oxygen partial
pressures
None of the electrical property investigations of CaZrO3 based electrolytes have
characterized the material at the very low oxygen pressures prevalent in the aluminum
melt. Such low oxygen partial pressures could very well affect and change the defect
mechanisms responsible for ionic conduction.171 Kurita et al. 162 developed a conduction
domain map for the material by making impedance spectroscopy measurements at a
variety of oxygen and hydrogen partial pressures fixed using gas (argon and H2/H2O)
mixtures. The prevalent hydrogen and oxygen partial pressures in molten aluminum are
highlighted in Figure 67, which shows the domain diagram at 750°C.
Element Value Error (%)
R1 (ohms) 35764 0.3
C1 (F) 2.00E-09 14
R2 (ohms) 4.20E+05 5.6
CPE1-P 0.94 0.24
CPE1-T (F) 4.00E-10 3.2

101
Figure 66 Conduction domain diagram developed by Kurita et al.162 to describe the defect
properties of CaZr0.9In0.1O3-x/2 materials.
Figure 67 Domain diagram highlighting the oxygen and hydrogen partial pressures in
molten aluminum at 750°C.

102
Impedance measurements at low oxygen partial pressures were made using the
setup detailed in Figure 17. Figure 68 shows a typical spectrum obtained in molten
aluminum at 840°C. A 2 layer brick layer model similar to the one shown in Table 3 was
found to fit the obtained data well. An additional low frequency component was seen in
the spectra obtained in solid aluminum, whose spectrum is shown in Figure 69. This
element could be attributed to the formation of a surface layer on the electrolyte tube or a
significant increase in interfacial resistance, and was modeled by adding another R-CPE
element in series. Values of resistance obtained from the data fit were used to compute
the conductivity by making estimates of tube thickness and area wetted by molten
aluminum.
0
20000
40000
60000
80000
100000
120000
0 20000 40000 60000 80000 100000 120000 140000
Z' Real component of impedance
-Z" imaginary component of impedance
R CPE1
R1
CPE 2
R2
Figure 68 Typical impedance spectrum measured in liquid aluminum at 1000K.

103
-40000
-35000
-30000
-25000
-20000
-15000
-10000
-5000
0
0 10000 20000 30000 40000 50000 60000
Z' (ohms)
Z" (ohms)
Figure 69 Typical impedance spectrum measured from a Ca(Zr,In)O3 tube inserted in
solid aluminum.
Conductivity computations using these measurements were more complex as the
contact area in the case of tubular samples is limited by the liquid aluminum inside the
tube. Any oxidation of the aluminum inside the tube would change the contact area, thus
increasing the total resistance. Prolonged exposure to molten aluminum affected the
sealant material used to separate the liquid aluminum on both sides of the electrolyte. A
very low resistance (or a short) was observed between the lead wires during several
experiments, as liquid aluminum from the graphite crucible entered inside the electrolyte
tube due to a failure in the seal.
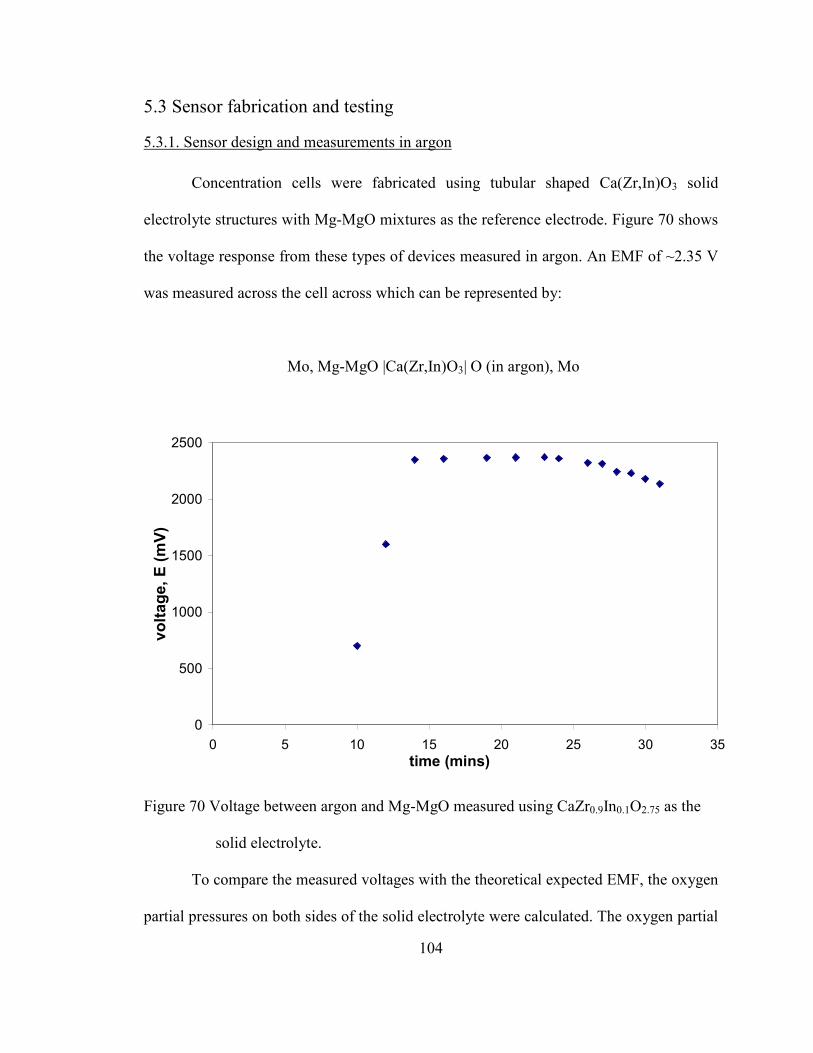
104
5.3 Sensor fabrication and testing
5.3.1. Sensor design and measurements in argon
Concentration cells were fabricated using tubular shaped Ca(Zr,In)O3 solid
electrolyte structures with Mg-MgO mixtures as the reference electrode. Figure 70 shows
the voltage response from these types of devices measured in argon. An EMF of ~2.35 V
was measured across the cell across which can be represented by:
Mo, Mg-MgO |Ca(Zr,In)O3| O (in argon), Mo
0
500
1000
1500
2000
2500
0 5 10 15 20 25 30 35
time (mins)
voltage, E (mV)
Figure 70 Voltage between argon and Mg-MgO measured using CaZr0.9In0.1O2.75 as the
solid electrolyte.
To compare the measured voltages with the theoretical expected EMF, the oxygen
partial pressures on both sides of the solid electrolyte were calculated. The oxygen partial

105
pressures in the reference side is fixed by the equilibrium between Mg and MgO
according to the equation,
Mg + ½ O2 = MgO (17)
The equilibrium oxygen pressure (pO2) established by this mixture at 730°C was
calculated using the Gibbs formation energy of MgO (∆Gf) according to the equation,
∆Gf (MgO) = RT ln K = RT ln [pO2]1/2 (18)
By substituting the value of ∆Gf (MgO) from JANAF thermochemical tables,172 an
oxygen partial pressure of ~10-51 atm was calculated.
The specifications on the argon gas cylinder (AR 300) obtained from Airgas lists
the oxygen content as < 5ppm and water content as < 10 ppm. A complete list of the
various impurities present in argon is given in Table 5.
Impurity type Levels
CO2 < 1 ppm
Nitrogen < 20 ppm
Oxygen < 5 ppm
Hydrocarbons < 1 ppm
Water < 10 ppm
Table 5 List of gas specifications obtained for AR 300 from Airgas.

106
Based on the values listed in the above table, an oxygen partial pressure of 10-4-
10-5 atm can be assumed to be the possible oxygen content present in argon. Figure 67
indicates that oxygen vacancies might be the predominant conduction defect at the low
oxygen partial pressures (~10-51 atm) established by the Mg-MgO mixture. Since the
Ca(Zr,In)O3 tube is exposed to Mg-MgO and argon on opposite sides, the theoretical
voltage expected across the solid electrolyte can be calculated from the Nernst equation.
By substituting required parameters in equation (10), the value of E was calculated as
~2.3 V. This matches well with the voltage measured in Figure 70, indicating that the
sensor could measure the theoretical voltage even when exposed to low oxygen partial
pressures.
EMF measurements were also made to compare the performance of pellet and
tubular shaped devices with Mg-MgO reference electrodes. Figure 71 shows responses
measured from these sensors tested in argon. The devices appeared to show similar
responses as a potential difference of ~750 mV was measured across both cells. There
was however a significant difference in the response times shown by the two designs.
The pellet based device showed a stable EMF after ~2.5 hours, while the tubular device
needed about 30 minutes to stabilize.

107
0
200
400
600
800
1000
1200
1400
0 50 100 150 200
time(mins)
E (mV)
pellet response in dry Ar
tube response dry Ar
Figure 71 Comparison of voltage response at 720°C from tubular and pellet shaped
electrolyte samples tested in Ar with Mg/MgO reference electrode. Cell
construction used a porous support tube.
The trends observed in the above plot can be explained by considering the
mechanisms involved in establishing the voltage. The measured EMF must depend on the
oxygen partial pressure difference set up across the faces of the electrolyte and should not
vary with cell geometry and dimensions. Response times, on the other hand, are strongly
influenced by the migration of defects through the electrolyte material. These depend on
the thickness of the electrolyte layer and should be longer in the pellet based device
(thickness, t = 3mm) compared to the tubular based cell design (t = 0.9 mm). Devices
based on solid electrolyte tubes were hence used for all further experiments.

108
The theoretical voltage (E = ~2.35 V) was found to be much higher than that
measured experimentally (E = ~750 mV). The smaller experimental value could be due to
a higher oxygen pressure in the reference section than that calculated from equilibrium.
Both designs had the solid electrolyte element sealed to an alumina based porous support
tube similar to that shown in Figure 18. This could have allowed oxygen to enter the
reference section thus increasing the oxygen content. The result can also be explained by
considering the exact location of the lead wire inside the reference section, as a higher
oxygen partial pressure would be measured if the wire were placed locally in an area of
high oxygen content. The cell tested in Figure 70 did not use the porous support tube, and
had a direct seal between the ceramic sleeve containing the lead wire and the mouth of
the electrolyte tube. The two different cell configurations are shown in Figure 72.
5.3.2 Reference electrode performance in aluminum
Since the sensor is suspended in molten aluminum during operation, it is useful to
measure the theoretical EMF between Mg-MgO and Al-Al2O3 mixtures. In order to
calculate this potential, the equilibrium oxygen partial pressures were first computed for
both Mg-MgO (pO2 (1)) and Al-Al2O3 (pO2 (2)) as described earlier. These were found to
be 10-51 atm and 10-47 atm respectively. The theoretical EMF (E) between the two
electrodes was calculated using equation (10). Variation of this voltage with temperature
is shown in Figure 73.

109
Solid electrolyte tube
Porous support
tube
Mg-MgO
reference
Solid electrolyte tube
Porous support
tube
Mg-MgO
reference
Figure 72 Schematic of cell configurations used to test sensors with Mg-MgO reference
electrodes in argon.
190
192
194
196
198
200
202
204
206
208
210
500 600 700 800 900 1000
EMF (mV)
solid metals
liquid metals
Temperature (oC)
Figure 73 Theoretical voltage difference between Mg/MgO and Al/Al2O3 reference
electrodes calculated from thermochemical tables.

110
Experiments were conducted to estimate sensor performance in aluminum. The
measured difference in EMF between a sensor containing Mg-MgO reference mixture,
and another sensor containing Al-Al2O3 reference mixture, both dipped in liquid
aluminum, is shown in Figure 74. Although the data seems to have some scatter, an EMF
measurement consistent with the theoretical calculation was observed. Since the working
section of the sensor simply uses a lead wire inserted into the melt, the previous
experiment was simplified by measuring the voltage between a sensor containing Mg-
MgO reference mixture and aluminum. The measured EMF is shown in Figure 75. The
data looks smoother and is observed to be ~300 mV. This matches well with the previous
measurement indicating that the working potential can be measured using a wire dipped
in aluminum without affecting sensor results.
0
100
200
300
400
500
0 4 8 12 16
time (mins)
voltage (mV)
difference in voltage outputs
Figure 74 Difference in voltage output measured between sensors containing Mg/MgO
and Al/Al2O3 reference electrodes dipped in liquid aluminum.

111
0
200
400
600
800
1000
1200
0 50 100 150 200 250
time (mins)
voltage measurements
T = 550 C
T = 620 C
Figure 75 Voltage output from tubular sensor (Mg/MgO reference electrode) suspended
in aluminum.
5.3.3. Hydrogen sensing using hydride based reference electrodes
Sensors with Ca-CaH2 based reference electrodes were tested in Ar+5%H2 environments.
The cell configuration for this system can be written as –
Mo, 5%H2 (in argon) |Ca(Zr,In)O3| Ca-CaH2, Mo
The conduction domain diagram shown in Figure 66 indicates that at high pH2
environments, Ca(Zr,In)O3 materials act as proton conductors. A potential E, should then
be setup because of the difference in hydrogen partial pressures on the opposite sides of
the electrolyte. The hydrogen partial pressure established by the equilibrium between β-

112
Ca and α-CaH2 at 730°C was calculated as 0.0051 atm using data reported by Curtis et
al.173 The theoretical EMF expected across this cell was calculated as -98 mV by using
using equation (6).
The measured EMF from a device with Ca-CaH2 reference electrodes tested in
Ar+5%H2 is shown in Figure 76. The voltage values appear to be stable around -100 mV,
which corresponds well with the theoretical voltage calculated. This indicates that the
sensor could measure the Nernstian potential for hydrogen species in hydrogen rich
environments.
-300
-250
-200
-150
-100
-50
0
0 40 80 120 160 200
time (mins)
voltage (mV)
T changed to
780 C
T changed
back to 720 C
T = 720 C
Figure 76 Voltage measured from a sensor using Ca-CaH2 reference electrode tested in
Ar+5%H2 environment.

113
5.3.4 Hydrogen sensing using oxide based reference electrodes
Past experiments have shown that the sensor is capable of acting as an oxygen
concentration cell and a hydrogen concentration cell depending on the choice of reference
electrode mixture and the species to be analyzed. If there is equilibrium between water,
hydrogen and oxygen according to the reaction,
2H2 +O2 = 2H2O (20)
then the hydrogen partial pressures will be fixed for fixed water and oxygen partial
pressures. A change in the hydrogen content could then be detected by measuring the
voltage due to hydrogen partial pressure difference.
The oxygen and water partial pressures were fixed on both sides of the electrolyte
by testing the sensor using Mg-MgO based reference electrodes in two different argon
gas mixtures. Figure 77 shows the EMF measured from the sensor exposed to pure Ar
and Ar+5%H2 gas mixtures at 730°C. The sensor response after exposure to Ar+5%H2
stabilizes at ~1.25 V. On switching the gas to pure argon, the EMF increases and
stabilizes at ~1.57 V. This jump of ~320 mV was again reproduced when the gas was
switched back to Ar+5%H2.
Since oxygen ion vacancies and/or protons may be responsible for conduction in
these conditions it is difficult to calculate the theoretical EMF for this system without
knowing the exact reactions at the electrode. The change in EMF, however, should be
due to the change in hydrogen partial pressures as there should be no major change in

114
oxygen levels while switching between Ar and Ar+5% H2. The theoretical change in
EMF was calculated as ~370 mV from equation (6) where pH2 in argon was taken as 10-5
atm from the specifications listed in Table 5. The calculated value for the change in EMF
corresponds well with that measured experimentally. This suggests that Mg-MgO based
reference electrodes could be used to measure hydrogen concentrations using
Ca(Zr,In)O3 type materials as solid electrolytes.
0
500
1000
1500
2000
2500
0 20 40 60 80 100 120 140 160time (mins)
EMF (E) Ar+5%H2
pure Ar
Ar+5%H2
Figure 77 EMF measured from a Ca(Zr,In)O3 based sensor with Mg-Mgo reference
electrode exposed to Ar and Ar+5%H2. Sensor shows a change in response
with hydrogen content that is both stable and reproducible.

115
5.3.5 Sensor tests in pilot plant conditions
To further investigate the use of hydrogen sensors based on oxide phase reference
electrodes (Al/Al2O3 and Mg/MgO), devices were tested in pilot plant conditions by
inserting them in various aluminum alloy melts at CANMET. In three out of the four
tests, similar voltage outputs were observed from both the Al/Al2O3 and the Mg/MgO
probes indicating that one of the probes may have failed. Post-test analysis of the failed
probes showed cracks in the alumina support tube through which liquid aluminum had
entered the probe and probably caused failure. This may have been due to the high
thermal shock during insertion. All four tests, however, showed an almost immediate
response to degassing.
The sensor output in Alloy 356 is shown in Figure 78 along with the results from
the periodic AlScan measurements. RPT samples taken from the melt before and after
degassing (shown in Figure 79) show a significant reduction in porosity after degassing.
As the precise auxiliary reactions relating the oxygen partial pressure fixed by the
reference mixture to the hydrogen partial pressures are not known, the reference
hydrogen pressures established by these electrodes could not be calculated. However, the
change in sensor output in response to degassing can be used to evaluate the sensor
response.
Table 6 summarizes the sensor outputs and AlScan measurements before and after
degassing for each of the four melts. The hydrogen partial pressure, pH2, measured by
the electrochemical sensor can be related to the hydrogen solubility, S, measured by the
AlScan analyzer using equation (4), where the standard solubility between 700ºC and
850ºC is given by,

116
07.3T
2980o
Slog +−
= (21)
Figure 78 Simultaneous measurements made by sensor and AlScan in Aluminum 356
melt at CANMET.
Figure 79 Cross-section of reduced pressure test samples taken before and after
degassing showing change in porosity.
-700
-600
-500
-400
-300
-200
-100
0 20 40 60 80 100 120 140
Time (minutes)
AU Sensor Output (mV)
0.000
0.050
0.100
0.150
0.200
0.250
0.300
AlScan Measurement (m
l/100g)
AU Sensor (mV)
AlScan (ml/100g)
Alloy 356
Degas for
10 minutes
Increase
temperature
Before DegassingAfter Degassing

117
The values of alloy correction factors (CF(A)) for the different melts are also
listed in Table 6. These numbers represent the activities of hydrogen in the respective
aluminum alloys. Equations 10, 11 and the results from Table 6 were used to calculate
the hydrogen partial pressures corresponding to the change in gas content determined by
AlScan measurements.
Alloy Sensor Output (mV) AlScan (ml/100mg)
Designation CF(A) Before After Before After
356 0.82 -327 -161 0.261 0.11
535 1.3 114 25 0.407 0.173
319 0.69 -166 -13 0.179 0.082
Pure aluminum 1 -229 -195 0.233 0.152
Table 6 Sensor and AlScan outputs observed in 4 different Al alloy melts at CANMET.
The voltage output corresponding to the change in hydrogen content measured by
AlScan was then calculated using the Nernst equation according to -
∆E degas = E before - E after (22)
= {before
pHF
RT2ln
2 –
refpH
F
RT2ln
2} – {
afterpH
F
RT2ln
2–
refpH
F
RT2ln
2} (23)
or,
∆E degas = afterpH
pH
F
RT before
2ln
2
2 (24)
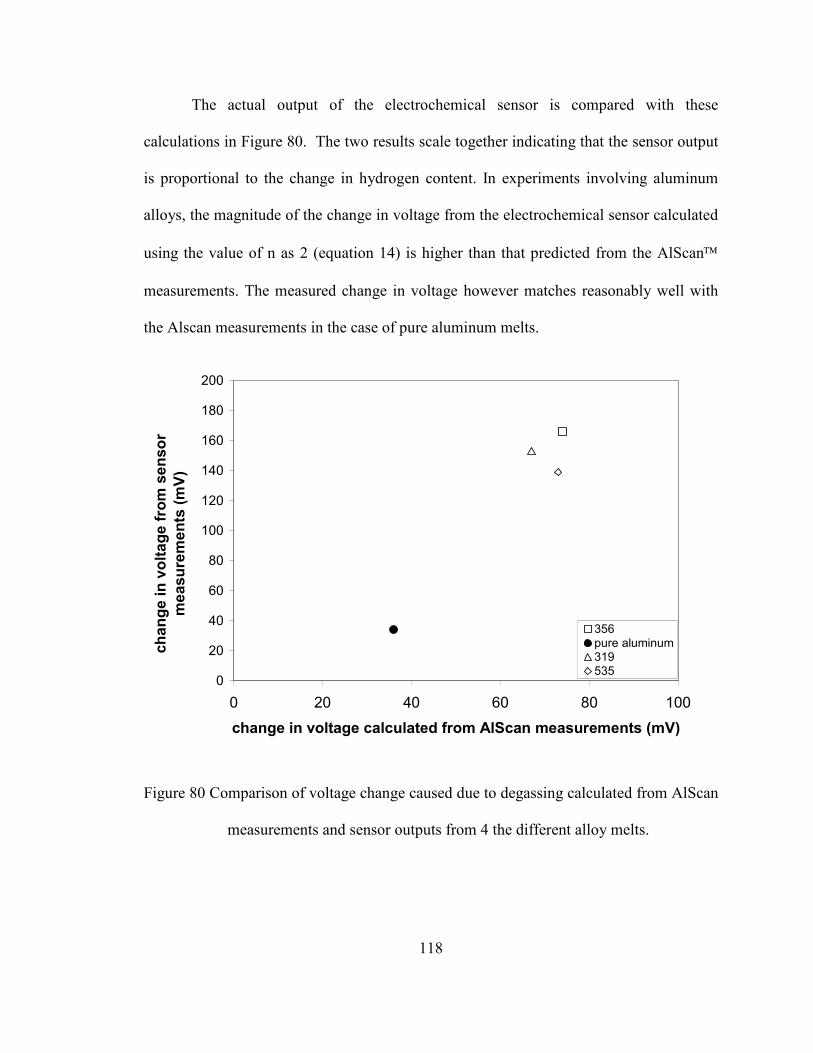
118
The actual output of the electrochemical sensor is compared with these
calculations in Figure 80. The two results scale together indicating that the sensor output
is proportional to the change in hydrogen content. In experiments involving aluminum
alloys, the magnitude of the change in voltage from the electrochemical sensor calculated
using the value of n as 2 (equation 14) is higher than that predicted from the AlScan
measurements. The measured change in voltage however matches reasonably well with
the Alscan measurements in the case of pure aluminum melts.
0
20
40
60
80
100
120
140
160
180
200
0 20 40 60 80 100
change in voltage calculated from AlScan measurements (mV)
change in voltage from sensor
measurements (mV)
356pure aluminum319535
Figure 80 Comparison of voltage change caused due to degassing calculated from AlScan
measurements and sensor outputs from 4 the different alloy melts.
119
Sensor responses from tests at CANMET showed that the sensor responded
considerably well to degassing with voltage outputs in the expected ranges. However,
several problems with mechanical and reference electrode stability were encountered.
Four out of a total of eight probes failed the initial insertion into the melt. Investigation of
the probe elements showed cracks in the alumina support tube presumably due to the high
thermal shock. To overcome this problem, samples of porous ceramic tubes were
obtained from Fairey Industrial Ceramics, UK. Laboratory tests conducted with sensors
using the porous tubes indicated improvement in device stability as the support tubes
were not found to crack during insertion. The alumina tubes that were used for insulating
the lead wires were replaced with insulative ceramic fibers to help in easier handling of
the device.
Problems with reference electrode stability were also observed with the sensor
response drifting with time. This could be due to inadequate sealing of the reference
mixture from the environment. The sensors tested in CANMET used a water based
ceramic seal (Ceramabond, Aremco Ceramics) that is not gas tight. This could have
allowed oxygen and water vapor to enter the reference continuously which would disturb
the equilibrium established. The observed drift in measured potential can be possibly
attributed to this occurrence.

120
6. CONCLUSIONS
6.1. Ca(Zr,In)O3 powder synthesis
Ca(Zr,In)O3 powders were synthesized using both solid oxide mixing and oxalate
co-precipitation techniques. Powders prepared using the solid oxide method were found
to contain CaIn2O4 as a secondary phase after calcination at 1400°C. Single-phase
CaZr0.9In0.1O2.975 powders were primarily obtained from the decomposition of oxalate
precursors at the same temperature. Indium solubility in these Ca(Zr,In)O3 samples was
found to be between 0-5 %. Smaller, better-dispersed precursor particles were produced
by using PEG during the co-precipitation process. PEG addition or precursor ball-milling,
both helped lower reaction times and temperatures needed for complete CaZrO3
formation.
6.2. Electrical characterization of Ca(Zr,In)O3 materials
Sample resistance and capacitance values were obtained from impedance
spectroscopy and conductivity measurements. Bulk conduction in Ca(Zr,In)O3 was found
to be homogenous with a Debye-type relaxation, while grain boundaries showed
heterogeneity. Bulk capacitances measured in air remained invariant with temperature.
Undoped CaZrO3 was found to be a p-type conductor (Ea = 1.2 eV) in air with
conductivity ~ 10 -5 Scm-1 at 900°C. Doping with indium increased sample conductivity

121
by 2-3 orders of magnitude. In-doped CaZrO3 was found to be a proton conductor (Ea =
0.74 eV) in air, argon+H2O and a p-type conductor (Ea = 0.91eV) in argon. Mg-doping
was found to increase conductivity in CaZrO3 by 1 order of magnitude.
6.3. Hydrogen sensor testing
Ca(Zr,In)O3 based potentiometric sensors with Mg-MgO and Ca-CaH2 reference
electrodes were fabricated successfully for application in molten aluminum. Laboratory
scale testing of devices with Mg-MgO reference electrodes showed reliable voltage
measurements in argon and aluminum environments. These sensors also measured a
reproducible voltage change when switched between Ar and Ar+5% H2. Ca-CaH2
reference electrodes, when exposed to 5% H2, generated a voltage matching the Nernst
equation. Sensors with tubular and pellet shaped solid electrolyte elements generated a
similar EMF in argon. Faster response times were measured in the case of tubular
designs.
Pilot plant tests showed the sensor to respond to hydrogen content changes in
various aluminum alloy melts. The voltage changes measured were of the same order as
that shown by the commercial AlScan hydrogen sensor. Poor thermal shock resistance of
the dense support tube used in these tests, affected sensor performance in some cases.
This was improved on by using porous support tubes. Seals were found to be a problem
as consistent reference electrode drift was measured during some experiments.
122
7. FUTURE WORK
Sensor development and commercialization
The hydrogen sensor proposed is suitable for further development and
commercialization. A series of further pilot plant tests involving simultaneous
measurements along with Alscan systems could confirm the sensor’s applicability in
industry type settings. Several foundries have a long feed line through which molten
aluminum is flowed prior to casting. Sensors could be placed at strategic locations to
estimate the hydrogen content along the feed line. This information could then be sent to
an online degassing system that would degas until the sensor measures hydrogen levels
below the permissible limit. By coupling hydrogen sensors with the degassing system, an
automatic feedback controlled degassing system can thus be developed. This would
enable continuous monitoring and control of the melt quality at all junctures during the
casting process. Such a system would have huge commercialization value. A simple
block diagram for such a feedback control system is shown in Figure 81.
Further advances in sensor sealant are necessary to ensure device success. Since
the reference electrode section of the sensor must be kept isolated from the outside, gas
tight sealing is important. Common gas tight high temperature sealants are usually based
on glass or glass ceramics. These materials usually contain silica which decomposes at
the low oxygen partial pressures prevalent in the melt. These also must be cured at high
temperatures before the actual use, which might affect the performance of the reference

123
material. Ceramic based adhesives are convenient in that they can be cured at low
temperatures (~200F). Ceramic based adhesives are sometimes porous and not gas-tight.
A hermetic seal can be achieved with these materials by first making the bond using an
alumina based adhesive (Aremco 569) and then applying a uniform coating of the binder
over the entire bond line to seal the pores.174
Figure 81 A simple block diagram for a feedback control system that can be designed to
optimize hydrogen content in molten aluminum. The control system couples
the proposed hydrogen sensor with a commercial degassing system.
Electrical characterization
Using metal-metal oxide mixtures to fix oxygen partial pressures can help
characterize electrical ceramics at hitherto unexplored conditions. Figure 82 shows a plot
of the oxygen partial pressures fixed by various metal-metal oxide combinations and gas
ratios. By appropriate selection, the same pO2 can be established using both methods. The
defect properties of a material should remain the same at a certain pO2 irrespective of

124
whether the partial pressure is fixed using a metal-metal oxide or a gas mixture.
Therefore, electrical characterization using the two treatments could help prove the
technique’s validity.
-80
-70
-60
-50
-40
-30
-20
-10
0
700 800 900 1000 1100 1200 1300 1400Temperature (K)
log pO2 (atm)
Co/CoO
Al/Al2O3
Bi/Bi2O3
Sn/SnO2
Mg/MgO
Fe/FeO
CO2/CO mixture 100:1 ratio
CO2/CO mixture 1:100 ratio
H2O/H2 mixture 1:10 ratio
Figure 82 Equilibrium oxygen partial pressures established by using metal-metal oxide
mixtures and H2O-H2, CO-CO2 gas mixtures as a function of temperature.
Since metals like aluminum and magnesium have a high affinity for oxygen, the
ability to fully retain the two-phase mixture for the entire experiment could be a
challenge. In the present investigation, metallic powders were melted to form the metal-
metal oxide mixture. Since there is always trapped oxygen between the powders, these
were found to react to form the oxide. This problem could be considerably reduced by
melting small metal ingots of the respective metal at the opposite sides of the electrolyte.
Upon verification, the technique could prove useful in characterizing the defect
properties of various systems. For example, the formation of Magnelli phases from rutile

125
(TiO2) can be characterized by exposing samples to molten aluminum. This could be
useful for estimating the defect transport mechanisms responsible for oxidation in
titanium aluminide alloys.
Structural characterization
Investigation of indium solubility in CaZrO3 – Although In-doped CaZrO3 has been the
material of choice for various high temperature electrochemical applications, a phase
diagram for this system is not yet available. The present work suggests dopant solubility
between 0 - 5% based on x-ray diffraction results from the prepared samples. Further
investigation of this system could be carried out by preparing samples with dopant levels
between 0 - 5 %. Precise lattice parameter measurements using x-ray diffraction could
then be used to arrive at a closer estimate of the dopant solubility.
Structural investigation of the proton site using neutron diffraction – There is not much
literature on the investigation of the structural properties of Ca(Zr,In)O3 materials using
neutron powder diffraction. This technique has excellent sensitivity towards light
elements and is ideal to detect features like protonation and oxygen vacancy ordering in
perovskite materials. According to Knight,175 high temperature measurements made in
samples with different indium concentrations could help separate atomic displacement
parameters from the static displacements induced on doping an aliovalent ion onto the
octahedral site. Knight also suggests that since indium is a significant neutron absorber,
high data collection times should be expected and the data should be corrected for
absorption effects.

126
Development of Mg-doped CaZrO3 materials as solid electrolytes
The presence of In-rich secondary phases like CaIn2O4 might affect the electrical
properties of In-doped CaZrO3 samples. Mg-doped CaZrO3 materials could be
investigated as an attractive alternate. This type of sensor design could simply utilize
commercially available undoped CaZrO3 as the solid electrolyte. Since the sensor device
uses Mg based reference electrodes, CaZrO3 could then interact with the Mg at high
temperatures to form the doped material. A small amount of the dopant should be
sufficient to improve the conductivity of CaZrO3 for use in various high temperature
applications. It should, however, be noted that at the operation temperature of the sensor
(~700°C), long times may be necessary for the dopant (Mg2+) to diffuse completely
throughout the solid electrolyte material (CaZrO3).
Ceramic synthesis and processing
Mixed hydroxide precursors for perovskite formations – Since the oxalate precipitation
process used does not yield mixed oxalates, other alternate routes of synthesis could be
investigated. A simple solution would be to study the precipitation of mixed (Ca, Zr, In)
hydroxides from the aqueous solution. Hydroxide based precursors would decompose to
form perovskite through fewer reaction steps when compared to oxalate precursors. This
might improve process yields. Hydrothermal synthesis might also be an attractive option
that could be studied in this regard.
Optimization of powder calcinations conditions – The formation of solid electrolyte tubes
and pellets involves oxalate decomposition by calcination followed by sintering of the
powder compacts. While high sintering temperatures are usually required to produce
dense samples, the reaction conditions for precursor calcination vary according to the

127
material. High calcinations temperatures may produce powders with large particles that
may not sinter to high density. Precursor powders heated at lower calcination
temperatures on the other hand may not decompose well enough so that reactions
continue to occur during the sintering stage. This again reduces the density of the sintered
product. It could therefore be useful to estimate the precise calcination conditions
(temperature, time) so as to produce the best results.
128
REFERENCES
1 K.J. Anderson. “Against the Elements: Sir Humphry Davy,” MRS Bull. 14 [1] 74 (Jan
1989)
2 http://www.world-aluminum.org/iai/stats/index.asp, as obtained on 08/30/06
3 J.E. Hatch, Aluminum: Properties and Physical Metallurgy, American Society for Metals,
Metals Park OH (1984)
4 L.F. Mondolfo, Aluminum Alloys: Structure and Properties, Butterworths, London and
Boston (1976)
5 P. Rohatgi, “Cast Aluminum-Matrix Composites for Automotive Applications”, JOM 43
[4] 10-15 (1991)
6 J. Han, K. Yamazaki and S. Nishiyama, “Optimization of Crushing Characteristics of
Triangulated Aluminum Beverage Cans”, Sruct. Multidisc. Optim. 28, 47-54 (2004)
7 F.M. Mazzolani, Aluminum Alloy Structures, Pub. E and FN Spon Publishers pp. 34
(1995)
8 J.R. Kissell and R. L. Ferry, Aluminum Structures, John Wiley and Sons pp. 5 (2002)
9 A.J. Pansini, Power Transmission and Distribution, 2nd ed. Fairmont Press Lilburn, GA
pp.198 (2005)
10 W. M. Rasmussen, “The Dilemma of Assessing your Aluminum Melt’s Cleanliness” Ed-
M.J. Lessiter, Mod. Cast. 45-48 (1996)

129
11 P.N. Crepeau, “Molten Aluminum Contamination: Gas, Inclusions and Dross”, Mod.
Cast. 87 [7] 39-41 (July 1997)
12 S. K. Das, W.J. Long III, H.W. Hayden, J.A.S. Green and W. Hunt Jr., “Energy
Implications of the Changing World of Aluminum Metal Supply”, JOM 56 [1] 14-17
(2004)
13 R. Monroe, “Porosity in Castings”, Mod. Cast., 1-28, (September 2005)
14 X.G. Chen and S. Engler, “Formation of Gas Porosity in Aluminum Alloys”, 98th Annual
Meeting of the American Foundrymen’s Society; Hamilton; CA, 673-682 (1994)
15 S.T. Mcclain, “A Study of Porosity Quantification Techniques and Pore Morphology in
Aluminum Castings”, M.S. Thesis, Mississippi State University (1997)
16 J.G. Kauffman and E.L. Rooy, Aluminum Alloy Castings: Properties, Processes and
Applications, ASM International, Metals Park OH (2004)
17 Q. G. Wang, D. Apelian and D.A. Lados, “Fatigue Behavior of A356-T6 Aluminum Cast
Alloys. Part I. Effect of Casting Defects”, J. Light Metals 1 [1] 73-84 (2001)
18 A.M. Samuel and F.H. Samuel, “Various Aspects Involved in the Production of Low-
Hydrogen Aluminum Castings”, J. Mat. Sci. 27 [24] 6533-63 (1992)
19 C. Meric, “Physical and Mechanical Properties of Cast Under Vacuum Aluminum Alloy
2024 Containing Lithium Additions”, MRS Bull. 35 [9] 1479-94 (2000)
20 D. P. Kanicki and W.M. Rasmussen, “Processing Molten Aluminum. II. Cleaning Up
Your Metal”, Mod. Cast. 80 [2] 55-58 (1990)
21 R. A. Rapp, “The Closed-Circuit Degassing of Liquid Aluminum by Argon”, JOM 49 [5]
16-19 (1997)

130
22 Qian Fu, Dong Xu, and James W. Evans, “Chlorine Fluxing for Removal of Magnesium
from Molten Aluminum: Part I. Laboratory-Scale Measurements of Reaction Rates and
Bubble Behavior,” Met. Trans. B 29B [5] 971-978 (1998)
23 J. Botor, “Kinetics of Hydrogen Degassing of Molten Aluminum by Purge Gases,”
Aluminum 56 [8] 519-522 (1980)
24 P. Waite and R. Thiffault, “The Alcan Compact Degasser: A Trough-Based Aluminum
Treatment Process. Part I: Metallurgical Principles and Performance,” Light Metals
1996 Conference Proceedings at the 125th TMS/AIME Annual Meeting, Anaheim, CA,
1001-1005 (1996)
25 J. W. Fergus, “Sensors for Monitoring the Quality of Molten Aluminum During
Casting,” J. Mater. Engg. Perf. 14 [2] 267-275 (2005)
26 M.M. Makhlouf, L. Wang, and D. Apelian, Measurement and Removal of Hydrogen in
Aluminum Alloys, Des Plaines, IL, AFS, 1998, 29-38.
27 P.D. Hess, “Measuring Hydrogen in Aluminum Alloys,” J. Met. 25 [10] 46-50 (1973)
28 X.G. Chen, F.J. Klinkenberg, S. Engler, L. Heusler, “Comparing Hydrogen Testing
Methods for Wrought Aluminum” JOM 46 [8] 34-38 (1994)
29 D.A. Anderson, D.A. Granger and R.R. Avery, “The Alcoa Telegas IITM Instrument”,
Light Metals (Warrendale, PA) 769-773 (1990)
30 H. Liu, M. Bouchard and L. Zhang, “An Experimental Study of Hydrogen Solubilkity in
Liquid Aluminum,” J. Mat. Sci., 30 [17] 4309-15 (1995)
31 J.W. Fergus, “Using Chemical Sensors to Control Molten Metal Processing,” JOM-e, 52
[10] (2000)

131
32 Solid Electrolytes: General Principles, Characterization, Materials, and Applications,
P. Hagenmuller and W. Van Gool (Ed), Academic, NY (1978)
33 R. Gee and D.J. Fray, "Instantaneous Determination of Hydrogen Content in Molten
Aluminium and Its Alloys," Met. Trans. 9B 427-430 (1978)
34 H. Iwahara, H. Uchida, K. Ogaki, H. Nagato, “Nernstian hydrogen sensor using BaCeO3-
based, proton-conducting ceramics operative at 200 degrees -900 degrees C,” J.
Electrochem. Soc. 138 [1] 295-299 (1991)
35 S. Zhuiykov, "Hydrogen Sensor Based on a New Type of Proton Conductive," Ceramic.
Int. J. Hydrogen Energy, 21 [9] 749-759. (1996),
36 T. Yajima, K. Koide, H. Takai, N. Fukatsu, H. Iwahara, “Application Of Hydrogen
Sensor Using Proton Conductive Ceramics as a Solid Electrolyte to Aluminum Casting
Industries,” Solid State Ionics 79 333-337 (1995)
37 M. Zheng and X. Zhen, "Hydrogen Probe Equipped with SrCeO3-Based Proton
Conductor and Ca/CaH2 Reference Electrode," Metall. Mater. Trans. B, 24B 789-794
(1993)
38 V. Krishnan, J.W. Fergus, F. Fasoyinu, “Solid electrolyte based hydrogen sensor for
molten aluminum,” in Advances in Aluminum Casting Technology II, Proceedings from
Materials Solutions Conference 2002, International Aluminum Casting Technology
Symposium, 2nd, Columbus, OH, United States, Oct. 7-9, 2002 (2002), 155-158.
39 The CRC Handbook of Solid State Electrochemistry, edited by P.J. Gellings, H.J.M.
Bouwmeester, CRC Press, Boca Raton FL (1997)

132
40 T.H. Etsell and S.N. Flengas, “The Electrical Properties of Solid Oxide Electrolytes,”
Chem. Rev. 70 [3] 339-76 (1970)
41 P.G. Bruce, Solid State Electrochemistry, Cambridge University Press, August 1997
42 D.J. Fray, “Potentiometric gas sensors for use at high temperatures,” Mater. Sci. Tech. 16 237-242 (2000)
43 S. Akbar, P. Dutta and C. Lee, “High-Temperature Ceramic Gas Sensors: A Review,”
Int. J. Appl. Ceram. Technol., 3 [4] 302-311 (2006)
44 R. Ramamoorthy, P.K. Dutta and S.A. Akbar, “Oxygen Sensors: Materials, Methods,
Designs and Applications,” J. Mat. Sci., 38, 4271-4282 (2003)
45 J-H. Lee, “Review on Zirconia Air-Fuel Ratio Sensors for Automotive Applications,” J.
Mat. Sci., 38, 4247-4257 (2003)
46 W. Weppner, “Advanced Principles of Sensors Based on Solid State Ionics,” Mater. Sci.
Engg B, 15, (1992) 48.
47 G. Alberti, A. Carbone, R. Palombari, “Oxygen potentiometric sensors based on
thermally stable solid state proton conductors: a preliminary investigation in the
temperature range 150-200 oC,” Sensors and Actuators B, 86, 150-54 (2002)
48 G. M. Kale, R. Kurchania, Ceramic Transactions (1999), 92 (Electrochemistry of Glass
and Ceramics), 195-220
49 E.D. Bartolomeo, E. Traversa, M. Baroncini, V. Kotzeva and R. V. Kumar, “Solid State
Ceramic Gas Sensors Based on Interfacing Ionic Conductors with Semiconducting
Oxides,” J. Eu. Ceram. Soc., 20 [16] 2691-99 (2000)

133
50 N. Miura, G. Lu and N. Yamazoe, “Progress in Mixed-Potential Type Devices Based on
Solid Electrolyte for Sensing Redox Gases,” Solid State Ionics 136-137, 533-542
(2000)
51 W.L. Worrell, Q. Liu, "Development of an Extended-Life Oxygen Sensor
for Iron and Steel Melts," Solid State Ionics 40-41, 761-763 (1990)
52 Q. Lin, “The development of high temperature electrochemical sensors for
metallurgical processes,” Solid State Ionics 86-88, 1037-1043 (1996)
53 A.R. Romero, J. Harkki, and D. Janke “Oxygen and carbon sensing in iron- oxygen -
carbon and Fe-O-C-Xn melts at elevated carbon contents,” Steel Research 57 [12] 636-
44 (1986)
54 E.T. Turkdogan, R.J. Fruehan “Review Of Oxygen Sensors For Use In Steelmaking And
Of Deoxidation Equilibriums,” Canadian Metallurgical Quarterly 11 [2] 371-84 (1972)
55 M. Iwase and Y. Waseda, "Recent Developments in Electrochemical Oxygen Sensors
Used for Iron and Steelmaking," High Temp. Mater. Proc. 7 [2-3] 123-131 (1986)
56 K.T. Jacob and S.K. Ramasesha, "Design of Temperature-Compensated Reference
Electrodes for Non-Isothermal Galvanic Sensors," Solid State Ionics 34, 161-166
(1989)
57 Y.Du, Z.P. Jin and P.Y. Huang, “Thermodynamic Calculation of the Zirconia–Calcia
System,” J.Am. Ceram. Soc., 75 [11] 3040-3048 (1992)
58 P. Duran, P. Recio and J.M. Rodriguez, “Comment on "The Calcia–Zirconia Phase
Diagram Revisited: Stability of the Ordered Phases ø1 and ø2," J. Am. Ceram. Soc. 75
[3] 731-732 (1992)

134
59 R. M. Dickerson and A. H. Heuer, “Reply to "Comment on 'The Calcia–Zirconia Phase
Diagram Revisited: Stability of the Ordered Phases φ1 and φ2," J. Am. Ceram.
Soc.75, 733 (1992)
60 Fig Zr-061 in “Phase Diagrams for zirconium and zirconia systems”, edited by H.M.
Ondik and H.F. McMurdie (American Ceramics Society, Westerville, OH, 1998).
61 Fig Zr-065 in “Phase Diagrams for zirconium and zirconia systems”, edited by H.M.
Ondik and H.F. McMurdie (American Ceramics Society, Westerville, OH, 1998).
62 V.P. Dravid, C.M. Sung, M.R. Notis and C.E. Lyman, “Crystal Symmetry and Coherent
Twin Structure of Calcium Zirconate,”, Acta Crystallogr. B45, 218 (1989)
63 H.J.A Koopmans,. G.M.H van de Velde, P.J. Gellings, “Powder Neutron Diffraction
Study of the Perovskites CaTiO3 and CaZrO3,” Acta Crystallogr. C39, 323 (1983)
64 C. Shi, M. Yoshino and M. Morinaga, “First-principles Study of Protonic Conduction in
In-doped AZrO3 (A=Ca, Ba, Sr),” Solid State Ionics 176, 1091-1096 (2005)
65 M.S. Islam, R.A. Davies and J.D. Gale, “Proton Migration and Defect Interactions in the
CaZrO3 Orthorhombic Perovskite : Quantum Mechanical Study,” Chem. Mater. 13
2049-55 (2000)
66 V.M. Orera, C. Peccharoman, J.I. Pena, R.I. Merino and C.J. Serna, “Vibrational
Spectroscopy of CaZrO3 Single Crystals,” J. Phys.: Condens. Matter 10 7501-7510
(1998)
67 H. Zheng, I.M. Reaney, G.D.C. Gyorgyfalva, R. Ubic, J. Yarwood, M.P. Seabra and
V.M. Ferreira, “Raman Spectroscopy of CaTiO3-based Solid Solutions,” J. Mater.
Res., 19 [2] 488-95 (2004)

135
68 V.M. Orera, J.I. Pena, R.I. Merino, J.A. Lazaro, J.A. Valles and M.A. Rebolledo,
“Prospects of New Planar Optical Waveguides Based on Eutectic Microcomposites of
Insulating Crystals: The ZrO2(c)-CaZrO3 Erbium Doped System,” Appl. Phy. Lett. 71
[19] 2746-48 (1997)
69 R.I. Merino, R.A. Pardo, J. I. Pena, G.F. De la Fuente, A. Larrea and V.M. Orera,
“Luminescence Properties of ZrO2-CaO Eutectic Crystals With Ordered Lamellar
Microstructure Activated with Er3+ Ions,” Phys. Rev. B 56 [17] 10907-915 (1997)
70 Y. Suzuki, H.J. Hwang, N. Kondo and T. Ohji, “In Situ Processing of a Porous Calcium
Zirconate/Magnesia Composite with Platinum Nanodispersion and Its Influence on
Nitric Oxide Decomposition,” J. Am. Ceram. Soc., 84 [11] 2713-15 (2001)
71 Y. Suzuki, N. Kondo and T. Ohji, “Reactive Synthesis of a Porous Calcium Zirconate/
Spinel Composite with Idiomorphic Spinel Grains,” J. Am. Ceram. Soc., 86 [7] 1128-31
(2003)
72 C.H. Perry, D. J. Mccarthy and G. Ruprecht, “Dielectric Dispersion of Some Perovskite
Zirconates,” Phy. Rev. 13B [5A] A1537-38 (1965)
73 M. Pollet, M. Daturi and S. Marinel, “Vibrational Spectroscopy Study of Doped-CaZrO3
Ceramics,” Mat. Sci. Eng B 104, 169-75 (2003)
74 K.M. Rabe, “Computational Materials Science: Think Locally Act Globally,” Nature
Materials 1, 147–148 (2002)
75 X.Y. Qiu, H.W. Liu, F. Fang, M.J. Ha, X.H. Zhou and J. M. Liu, “Thermal Stability and
Dielectric Properties of Ultrathin CaZrOx Films Prepared by Pulsed Laser Deposition,”
Appl. Phys. A 81 1431-34 (2005)

136
76 T. Yu, C.H. Chen, X.F. Chen, W. Zhu and R.G. Krishnan, “Fabrication and
Characterization of Perovskite CaZrO3 Oxide Thin Films,” Ceram. Int. 30 1279-82
(2004)
77 P.R. Krishnamoorthy, P. Ramaswamy and B.H. Narayana, “CaZrO3 additives to Enhance
Capacitance Properties in BaTiO3 Ceramic Capacitors,” J. Mater. Sci: Materials in
Electronics 3 176-80 (1992)
78 S. Zhang, S. Wang, X. Zhou, B. Li and Z. Chen, “Influence of 3d-Elements on Dielectric
Properties of BaTiO3 Ceramics,” J. Mater. Sci: Materials in Electronics 16 669-72
(2005)
79 R. Bagul, “Preparation of Dense Barium Cerate Film On a Planar Porous Support for
Hydrogen Separation Membranes,” M.S. Thesis, University of Florida (1997)
80 W. Engelen, A. Buekenhoudt, J. Luyten and F. De Shutter, “Humidity sensitivity of
Electrochemical Hydrogen Cells Using Calcium Zirconate Ceramics,” Solid State
Ionics 96 55-59 (1997)
81 M. P. Hills, C. Schwandt and R.V. Kumar, “Oxide Ion Conduction of Indium-Oxide-
Substituted Calcium Zirconate,” J. Electrochem. Soc., 153 [10] H189-H194 (2006)
82 N. Kurita, N. Fukatsu, K. Ito, T. Ohashi, “Protonic Conduction Domain of Indium-
Doped Calcium Zirconate,” J. Electrochem. Soc., 142, (1995) 1552.
83 C. Wang, X.Xu, H. Yu, Y. Wen and K. Zhao, “A Study of the Solid Electrolyte Y2O3-
Doped CaZrO3,” Solid State Ionics 28-30, 542-545 (1988)

137
84 H. Iwahara, T. Esaka, H. Uchida and N. Maeda, “Proton conduction in sintered oxides
and its application to steam electrolysis for hydrogen production,” Solid State Ionics 3-
4 359 (1981)
85 H. Iwahara, T. Yajima, H. Kazeoka, T. Hibino, K. Ozaki and H. Suzuki, “ Protonic
Conduction in Calcium, Strontium and Barium Zirconates,” Solid State Ionics 61 65
(1993)
86 K.D. Kreur, “On the Development of Proton Conducting Materials for Technological
Applications,” Solid State Ionics 97 1-15 (1997)
87 T. Schober, F. Krug and W.Shilling, “Criteria for the Application of High Temperature
Proton Conductors in SOFC Applications,” Solid State Ionics 97 369-373 (1997)
88 W. Munch, K.D. Kreur, G. Seifert and J. Maeir, “Proton Diffusion in Perovskites:
Comparison between BaCeO3, BaZrO3, SrTiO3 and CaTiO3 using Quantum Molecular
Dynamics,” Solid State Ionics 136-137 183-189 (200)
89 H.Iwahara, Y. Asakura, K. Katahira and M.Tanaka, “Prospect of Hydrogen Technology
Using Proton-Conducting Ceramics,” Solid State Ionics 168 299-310 (2004)
90 T. Norby, “Solid-State Protonic Conductors: Principles, Properties, Progress and
Prospects,” Solid State Ionics 125 1-11 (1999)
91 T. Schober, “Applications of Oxidic High-Temperature Proton Conductors,” Solid State
Ionics 162-163 277-81 (2003)
92 T. Yajima, K. Koide, N.Fukatsu, T. Ohashi and H. Iwahara, “ A New Hydrogen Sensor
for Molten Aluminum,” Sens. Actuators B 13-14 697 (1993)

138
93 H. Iwahara, “Proton Conducting Ceramics and Their Applications,” Solid State Ionics
86-88 9-15 (1995)
94 Y. Suzuki, M. Awano, N. Kondo and T. Ohji, “Effect of In-doping on the Microstructure
and CH4-Sensing Ability of CaZrO3/MgO Composites,” J. Eu. Ceram. Soc., 22 1177-
82 (2002)
95 H. Matsumoto, H. Hayashi, T. Shimura, H. Iwahara and T. Yogo, “Electrochemical
Hydrogen Isotope Sensing Via the Proton Conductor CaZr0.9In0.1O3-α,” Solid State
Ionics 161 93-103 (2003)
96 K.D. Kreur, “ On the Complexity of Proton Conduction Phenomena,” Solid State Ionics
136-137 149-60 (2000)
97 A.S. Nowick, A.V. Vaysleyb, “Isotope Effects and Proton Hopping in High-Temperature
Protonic Conductors,” Solid State Ionics 97 17-26 (1997)
98 M.S. Islam, R.A. Davies and J.D. Gale, “Hop, Skip or Jump? Proton Transport in the
CaZrO3 Oxide,” Chem. Commun., 661-62 (2001)
99 R.A. Davies, M.S. Islam and J.D. Gale, “Dopant and Proton Incorporation in Perovskite-
Type Zirconates,” Solid State Ionics 126 323-335 (1999)
100 M.S. Islam, P.S. Slater, J.R. Tolchard and T. Dinges, “Doping and Defect Association in
AZrO3 (A= Ca, Ba) and LaMO3 (M=Sc, Ga) Perovskite type Ionic Conductors,” Dalton
Trans. 3061-3066 (2004)
101 T. Yajima, H. Kazeoka, T. Yogo and H. Iwahara, “Proton Conduction in Sintered
Oxides Based on CaZrO3,” Solid State Ionics 47 271-75 (1991)

139
102 R. Hempelmann, M. Soetratmo, O. Hartmann and R. Wappling, “Muon Diffusion and
Trapping in Proton Conducting Oxides,” Solid State Ionics 107 269-280 (1998)
103 K.S. Knight, “Structural Phase Transitions, Oxygen Vacancy Ordering and Protonation
in Doped BaCeO3: Results from Time-of-Flight Neutron Powder Diffraction
Investigations,” Solid State Ionics 145 275-294 (2001)
104 K.S. Knight, “Powder Neutron Diffraction Studies of BaCe0.9Y0.1O2.95 and BaCeO3 at
4.2 K: A Possible Structural Site for the Proton,” Solid State Ionics 127 43-48 (2000)
105 T. Omata, M. Takagi, S. Matsuo, “O-H Stretching Vibrations of Proton Conducting
Alkaline-Earth Zirconates,” Solid State Ionics 168 99-109 (2004)
106 T. Higuchi, S. Yamaguchi, K. Kobayashi, S. Shin and T. Tsukamoto, “Electronic
structures in the bulk and surface states of protonic conductor CaZrO3 by soft-X-ray
spectroscopy,” Solid State Ionics 162– 163 121– 125 (2003)
107 T. Hibino, K. Mizutani, T. Yajima and H. Iwahara, “Evaluation of Proton Conductivity
in SrCeO3, BaCeO3, CaZrO3 and SrZrO3 by Temperature Programmed Desorption
Method,” Solid State Ionics 57 303-306 (1992)
108 M. R. Nadler, E.S. Fitzsimmons, “Preparation and Properties of Calcium Zirconate,”, J.
Amer.Ceram.Soc. 38 214-217 (1955)
109 R. Angers, R. Tremblay and A.C.D. Chaklader, “Formation of CaZrO3 by Solid- State
Reaction Between CaO and ZrO2,” J.Amer.Ceram.Soc., 55 425-426 (1972)
110 R. Angers, R. Tremblay and A.C.D. Chaklader, “Effect of Pressure on formation of
CaZrO3 by Solid- State Reaction Between CaO and ZrO2,” J.Amer.Ceram.Soc., 57 231-
232 (1974)
140
111 T. Yu, W.G. Zhu, C.H. Chen, X.F. Chen and R. Gopal Krishnan, “Preparation and
Characterization of Sol-Gel Derived CaZrO3 Dielectric Thin Films for High-k
Applications ,”Physica B 440-45 (2004)
112 J. Xu, A.P. Wilkinson and S. Pattanaik, “Solution Processing of Calcium Zirconium
Titanates Ca(ZrxTi1-x)O3: An X-ray Absorption Spectroscopy and Powder Diffraction
Study,” Chem. Mater. 12 3321-30 (2000)
113 M. Pechini, US Patent 3330697 July 11 1967
114 W. Zheng, W. Pang, G. Meng, “Hydrothermal Synthesis of SrZrO3-x (M=Al, Ga, In, x <
0.20) Series Oxides”, Solid State Ionics 108 37-41 (1998)
115 G. Dell’Agli and G. Mascolo, “Low Temperature Hydrothermal Synthesis of ZrO2-CaO
Solid Solutions”, J. Mat. Sci. 35 661-65 (2000)
116 A. Bhargava, T. Yamashita and I. D. R. Mackinnon, “Manufacture of specific BSCCO
powder compositions by co-precipitation,” Physica C, 247 385 (1995)
117 Chuanbin Mao, Lian Zhou, Fuzai Cuia and Hengde Lia, “Optimization of a new
modified wet-chemistry process for the synthesis of BPSCCO superconductor precursor
powders with specific stoichiometry” J. Mater. Chem., 7 [8] 1451–1456 (1997)
118 Naofumi Uekawa, Michio Endo, Kazuyuki Kakegawa and Yoshinori Sasaki,
“Homogenous precipitation of Cr3+-M2+ (M=Ni, Zn, Co, Cu) Oxalate by Oxidation of
the Polyethylene Glycol-Cation Complex,” Phys. Chem. Chem. Phys., 2 5485-5490
(2000)
119 V.B. Reddy and P.N. Mehrotra, “Preparation, Characterization and Thermal
Decomposition of Barium Zirconyl Oxalate,” Thermochim. Acta 31 31-37 (1979)

141
120 M. Toprak, Y. Zhang and M. Muhammed, “Chemical Alloying and Characterization of
Nanocrystalline Bismuth Telluride,” Materials Letters 57 3976-82 (2003)
121 C. Drouet, P. Alphonse and A. Rousset, “Synthesis And Characterization Of Non-
Stoichiometric Nickel-Copper Manganites” Solid State Ionics 123 25-37 (1999)
122 Y. Wei, L. Guangqiang and S. Zhitong, “Coprecipitating Synthesis and impedance study
of CaZrInOx.” J. Mat. Sci. Lett. 17 241-43 (1998)
123 J. Le, N. van Rij, R.C. van Landschoot and J.Schoonman, “A Wet-Chemical Method for
the Synthesis of In-doped CaZrO3 Ceramic Powders”, J. Eur. Ceram. Soc. 19 2589-
2591 (1999)
124 N. Van Rij, L. Winnubst, J. Le and J. Schoonman, “Analysis of the preparation of In-
doped CaZrO3 by the peroxo-oxalate complexation method” J. Mater. Chem. 10 2515-
21 (2000)
125 M.J. Saavedra, C. Parada, M.O. Figueiredo and A. Correa Dos Santos “Ca-Zr-O system:
synthesis and characterization of compounds using several routes of preparation”, Solid
State Ionics 63-65 213-217 (1993)
126 T. Gangadevi, K. Muraleedaran and M.P. Kannan, “A Comparitive Study of the
Thermal Decomposition Kinetics of Zirconyl Oxalates of Calcium and Strontium”,
Thermochim. Acta, 146 225-232 (1989)
127 V.B. Mehrotra and P.N. Reddy, “IR and Thermal Studies of Calcium Zirconyl Oxalate”,
J. Inorg. Nucl. Chem. 43 1078-1079 (1981)

142
128 B. Chapelet-Arab, G. Nowogrocki, F. Abraham and S. Grandjean, “New alkaline earth-
zirconium oxalates M2Zr(C2O4)4·nH2O (M = Ba, Sr, Ca) synthesis, crystal structure and
thermal behavior” J. Solid State Chem. 177 [11] 4269-4281 (2004),.
129 N. Audebrand, E. Jeanneau, T. Bataille, S. Raite and D. Louer, “A Family of
Microporous Mixed Oxalates with Isotypic-Framework Structures based on Eight-
Coordinate Metals,” Solid State Sciences 6 579-591 (2004)
130 C. F. Baes Jr. and R.E. Mesmer in “The Hydrolysis of Cations” (John Wiley and Sons,
1976) p.152.
131 E. Curtis and C. Degueldre, “Solubility and Hydrolysis of Zr Oxides: a Review and
Supplemental Data,” Radiochim. Acta 90 801-804 (2002)
132 S.V. Elinson and K.I. Petrov in “Analytical Chemistry of Zirconium and Hafnium,”
(Daniel Davey and Co, 1965) p. 7
133 T. Sato, “The Thermal Decomposition of Zirconium Oxyhydroxide,” J. Therm. Anal.
Calorimetry 69 256-265 (2002)
134 W.O.S. Doherty, “Effect of Calcium and Magnesium Ions on Calcium Oxalate
Formation in Sugar Solutions”, Ind. Eng. Chem. Res., 45 642-647 (2006)
135 T. Moeller, “Contributions to the Chemistry of Indium III. An Electrometric Study of
the Precipitation of Hydrous Indium Hydroxide,” J. Am. Chem. Soc. 63 2625-2628
(1941)
136 N. Uekawa, M. Endo, K. Kakegawa and Y. Sasaki, “Homogenous precipitation of Cr3+-
M2+ (M=Ni, Zn, Co, Cu) oxalate by oxidation of the polyethylene glycol-cation
complex,” Phys. Chem. Chem. Phys. 2 5485-5490 (2000)
143
137 N.M. Kirby, A. Van Riesen, C.E. Buckley and V.W. Wittorff, “Oxalate-precursor
processing for high quality BaZrO3,” J. Mater. Sci. 40 97-106 (2005)
138 A. Cavalheiro, M.A. Zaghete And J. Varela, “Influence Of Ammonium Oxalate In The
Formation Of The Columbite Precursor Obtained By Pechini’s Method,” Cerâmica 45
56 (1999)
139 E. K. Girija, S.C. Latha, S. N. Kalkura, C. Subramaniam And P. Ramasamy,
“Crystallization and Microhardness of Calcium Oxalate Monohydrate,” Materials
Chemistry and Physics 52 253-257 (1998)
140 J-M Ouyang and S-P Deng, “Controlled and Uncontrolled Crystallization of Calcium
Oxalate Monohydrate in the Presence of Citric Acid,” Dalton Transactions 2846-2851
(2003)
141 H. El-Shall, J-H Jeon, E.A. Abdel-Aal, S. Khan, L. Gower and Y. Rabinowich,”A Study
of Primary Nucleation of Calcium Oxalate Monohydrate I – Effect of Supersaturation,”
Crystal Research Technology 39 [3] 214-221 (2004)
142 L. Maurice-Estepa, P. Levillain, B. Lacour and M. Daudon, “Advantage of Zero-
Crossing-Point First-Derivative Spectrophotometry for the Quantification of Calcium
Oxalate Crystalline Phases by Infrared Spectrophotometry,”, Clinica Chemica Acta 298
1-11 (2000)
143 O. Vasylkiv, Y. Sakka, “Synthesis and Colloidal Processing of Zirconia Nanopowder,”,
J. Am. Ceram. Soc., 84 [11] 2489-94 (2001)
144 K. Kobayashi, Y. Yamaguchi, Y. Iguchi, “Electrical Transport Properties of Calcium
Zirconate at High Temperatures”, Solid State Ionics 108 355-62 (1998)

144
145Q. Liu, L. Gao, D.S. Yan, H. Mandal and Thompson D.P., “The Effect of Heat-
Treatment on the Performance of sub-micron SiCp-Reinforced Sialon Composites – I.
Preparation of Agglomerate-Free Starting Powders,” J. Eu. Ceram. Soc, 17 581-585
(1997)
146 O.I. Ece, A. Alemdar, N. Gungor And S. Hayashi, “Influences of Nonionic
Poly(ethylene glycol) Polymer PEG on Electrokinetic and Rheological Properties of
Bentonite Suspensions,” J. App. Polym. Sci. 86 (2002) 341.
147 S.A. Uhland, M.J. Cima and E.M. Sachs, “Additive-Enhanced Redispersion of Ceramic
Aggregates,” J. Am. Ceram. Soc. 86 (9) 1487-1492 (2003)
148 N. Uekawa, H. Ichikawa, A. Itsuki, S. Ishii, K. Kakegawa and Y. Sasaki, “Preparation
of Oxalate by Precipitation Method with Polyethylene Glycol and Formation Process of
the Precipitate,” J. Chem. Soc. Jap., 3 (2000) 187.
149 M.S. Kaliszewski and A.H. Heuer, “Alcohol Interaction with Zirconia Powders,” J. Am.
Ceram. Soc., 73 [6] 1504-1509 (1990)
150 J. Fleig, “The Grain Boundary Impedance of Random Microstructures: Numerical
Simulations and Implications for the Analysis of Experimental Data,” Solid State Ionics
150 181-193 (2002)
151 J. Fleig, J. Jamnik and J. Maier, “On the Validity and Limits of the Brick Layer Model
in Impedance Spectroscopy”, J. Electrochem. Soc., 145 2081 (1998)
152 C.C. Wang, S.A. Akbar, W. Chen and J.R. Schorr, “High-temperature Thermistors
Based on Yttria and Calcium Zirconate,” Sens. Actu. A 58 237-243 (1997)

145
153 G. Rog, M. Dudek, A. Koslowska-Rog and M. Bucko, “Calcium Zirconate:Preparation,
Properties and Application to the Solid Oxide Galvanic Cells,” Electrochimica Acta 47
4325-4329 (2002)
154 M. Dudek, M.M. Bucko, “Electrical Properties of Stoichiometric and Non-
stoichiometric Calcium Zirconate,” Solid State Ionics, 157 183-187 (2003)
155 A.R. West “Crystalline Solid Electrolytes I: General Considerations and Major
Materials”, in Solid State Electrochemistry, ed. P.G. Bruce page 18, Cambridge
University Press, 1995
156 S.C. Hwang, G.M. Choi, “The Effect of Cation Nonstoichiometry on the Electrical
Conductivity of CaZrO3,” J. Eur. Ceram. Soc., 25 2609-2612 (2005)
157 D. Janke, “Oxygen Probes Based on Calcia-Doped Hafnia or Calcium Zirconate for Use
in Metallic Melts,” Metall. Trans. B 13B 227-235 (1982)
158 A. Pretis, V. Longo, F. Ricciardiello and O. Sbraizero, “Considerations on the
Electrical Properties of Ceramics based on Perovskite-type Compounds,” Silicates
Industriels 139 7-8 (1984)
159 C.C. Wang, S.A. Akbar, W. Chen and V.D. Patton, “Review: Electrical Properties of
High-Temperature Oxides, Borides, Carbides and Nitrides,” J. Mat. Sci., 30 1627-1641
(1995)
160 C.C. Wang, W.H. Chen, S.A. Akbar and M.A. Alim, “High-temperature A.C. Electrical
Behavior of Polycrystalline Calcium Zirconate,” J. Mat. Sci., 32 2305-2312 (1997)
161 R.D. Shannon, "Revised Effective Ionic Radii and Systematic Studies of Interatomic
Distances in Halides and Chalcogenides,” Acta Cryst. A 32 751- 767 (1976)

146
162 N. Kurita, N. Fukatsu, H. Ito and T. Ohashi, “Protonic Conduction Domain of Indium-
Doped Calcium Zirconate,” J. Electrochem. Soc., 142 [5] 1552-1559 (1995)
163 M.S. Islam, R.A. Davies and J.D. Gale, “Proton Migration and Defect Interactions in the
CaZrO3 Orthorhombic Perovskite: A Quantum Mechanical Study,” Chem. Mater. 13
2049-2055 (2001)
164 Impedance Spectrosccopy: Emphasizing Solid Materials and Systems, Ed. Ross
Macdonald, Wiley-Interscience, London (1987)
165 S. Yamaguchi, K. Kobayashi, T. Higuchi, S. Shin and Y. Iguchi, “Electronic Transport
Properties and Electronic Structure of InO1.5-doped CaZrO3,”, Solid State Ionics 136-
137 305-311 (2000)
166 G. Rupprecht and R.O. Bell, “Dielecric Constant in Paraelectric Perovskites,” Phy. Rev.
135 [3A] A748-A752 (1964)
167 S. Zafar, R.E. Jones, P. Chu, B. White, B. Jiang, D. Taylor, P. Zurcher and S. Gillespie,
“Investigation of Bulk and Interfacial Properties of Ba0.5Sr0.5TiO3 Thin Film
Capacitors,” App. Phy. Lett. 72 [22] 2820-2822 (1998)
168 S. Serena, M.A.. Sainz and A. Caballero, “Experimental Determination and
Thermodynamic Calculation of the Zirconia-Calcia-Magnesia System at 1600°, 1700°,
and 1750°C,” J. Amer. Ceram. Soc. 87 [12] 2268-2274 (2004)
169 S. Serena, A. Caballero, M. Sainz, C. Antonia, P. Convert, J. Campo and X. Turrillas,
“Neutron Thermodiffractometry Study of Calcium Zirconate/Magnesium Oxide
Formation in the ZrO2-CaO-MgO system,” J. Amer. Ceram. Soc. 87 [9] 1706-1713
(2004)

147
170 J.R. Mcdonald, “Frequency response of unified dielectric and conductive systems
involving an exponential distribution of activation energies,” J. Appl. Phys. 58 1955
(1985)
171 V. Krishnan and J.W. Fergus, “Characterization of indium-doped calcium zirconate at
low oxygen partial pressures using impedance spectroscopy,” Proceedings -
Electrochemical Society, 2002-26(Solid-State Ionic Devices III) 471-477 (2003)
172 M.W. Chase, NIST-JANAF Thermochemical Tables, 4th Edition, Journal of Physical
and Chemical Reference Data, Monograph No. 9 (1998)
173 R. W. Curtis and P. Chiotti, “Thermodynamic Properties of Calcium Hydride,” J. Phy.
Chem. 67 1061-1065 (1963)
174 A.K.M.S. Chowdhury, S.A. Akbar, S. Kapileshwar and J.R. Schorr, “A Rugged Oxygen
Gas Sensor with Solid Reference for High Temperature Applications,” J. Electrochem.
Soc., 14B [2] G91-G94 (2001)
175 K.S. Knight, Personal Communication


![Modifying oxide nanomaterials properties by … · resonance upon those changes in their physical properties.[1–3] ... electronic and optical properties of oxide ... or hydrogen](https://img.pdfslide.us/doc/110x75/5b8129887f8b9ae47b8bb1ec/modifying-oxide-nanomaterials-properties-by-resonance-upon-those-changes-in.jpg)