Embed Size (px)
Citation preview
1 . Report No. 2. Government Accession No.
FHWA/TXDOT-96/1363-2F
4. Title and Subtitle
DEVELOPMENT OF BUNDLED REINFORCING STEEL
7. Author(s)
J. 0. Jirsa, W. Chen, D. B. Grant, and R. Elizondo
9. Performing Organization Nome and Address
Center for Transportation Research
Technical Report Documentation Page
3. Recipient's Cotolog No.
5. Report Dote
. December 1995 6. Performing Organization Code
8. Performing Organization Report No.
Research Report 1363-2F
10. Work Unit No. [TRAIS)
The University of Texas at Austin 11. Contract or Grant No.
3208 Red River, Suite 200 Research Study 0-1363 Austin, Texas 78705-2650 1----------------------------l 13. Type of Report and Period Covered
12. Sponsoring Agency Nome and Address
Texas Department of Transportation Research and Technology Transfer Office P. 0. Box 5080 Austin, Texas 78763-5080
15. Supplementary Notes
Final
14. Sponsoring Agency Code
Study conducted in cooperation with the U.S. Department of Transportation, Federal Highway Administration. Research study title: Anchorage and Development of Groups of Reinforcing Bars
16. Abstract
In the construction of reinforced concrete structures, it is sometimes advantageous or even necessary to place reinforcement in bundles. Bundling may be required because of restrictions on member dimensions. Bundling of bars may result in narrower, more graceful members, or allow for easier placement and vibration of concrete.
Current codes and design recommendations allow as many as four bars to be placed in a group or bundle. There ore provisions for increasing development length based on the size of the bundle, but in general there is little guidance to aid the designer using bar bundles. The objective of this study was to provide on understanding of the bond mechanics of bundles, and to provide test data for improving development and detailing requirements for bundled bars.
Tests were conducted on two, three, and four bar bundles in an effort to understand behavior and evaluate existing codes and specifications. Analysis of a spectrum of bundle sizes provided a brood foundation for the investigation of behavior. It also aided in identifying those parameters that have the greatest influence on bond strength. Tests included in the program on individual bars having on area equivalent to the two- and four-bar bundles were to test the concept of on "equivalent bar." The equivalent diameter has been introduced in codes for use in calculations for spacing cover based on bar diameter.
17. Key Words 1 8. Distribution Stotement
Bond, anchorage, development length, reinfocement, oundled bars
No restrictions. This document is available to the public through the National Technical Information Service, Springfield, Virginia 22161.
19. Security Classil. (of this report)
Unclassified
Form DOT F 1700.7 (8-721
20. Security Clossif. [of this poge)
Unclassified
Reproduction of completed page authorized
21. No. of Pages
116 22. Price

DEVELOPMENT OF BUNDLED REINFORCING STEEL
J. 0. Jirsa W.Chen
D. B. Grant R. Elizondo
Research Report 1363-2F
Research Project 0-1363
Anchorage and Development of Groups of Reinforcing Bars
conducted for the
TEXAS DEPARTMENT OF TRANSPORTATION
in cooperation with the
U.S. Department of Transportation Federal Highway Administration
by the
CENTER FOR TRANSPORTATION RESEARCH
Bureau of Engineering Research
THE UNIVERSITY OF TEXAS AT AUSTIN
December 1995

ii
IMPLEMENTATION STATEMENT
The results of a series of tests on two-, three-, and four-bar bundles in one or two layers were used to assess the adequacy of current AASHTO design provisions. Modifications to these provisions are outlined to reduce the uncertainty in application and the unconservative development lengths that may be computed for some bundled bar arrangements.
Prepared in cooperation with the Texas Department of Transportation and the U.S. Department of Transportation, Federal Highway Administration
DISCLAIMERS
The contents of this report reflect the views of the authors, who are responsible for the facts and accuracy of the data presented herein. The contents do not necessarily reflect the official views or policies of the Federal Highway Administration or the Texas Department of Transportation. This report does not constitute a standard, specification, or regulation.
There was no invention or discovery conceived or first actually reduced to practice in the course of or under this contract, including any art, method, process, machine, manufacture, design or composition of matter, or any new and useful improvement thereof, or any variety of plant, which is or may be patentable under the patent laws of the United States of America or any foreign country.
NOT lNTENDED FOR CONSTRUCTION, BIDDING, OR PERMIT PURPOSES
James 0. Jirsa, P.E. (Texas No. 31360) Research Supervisor
ill

iv
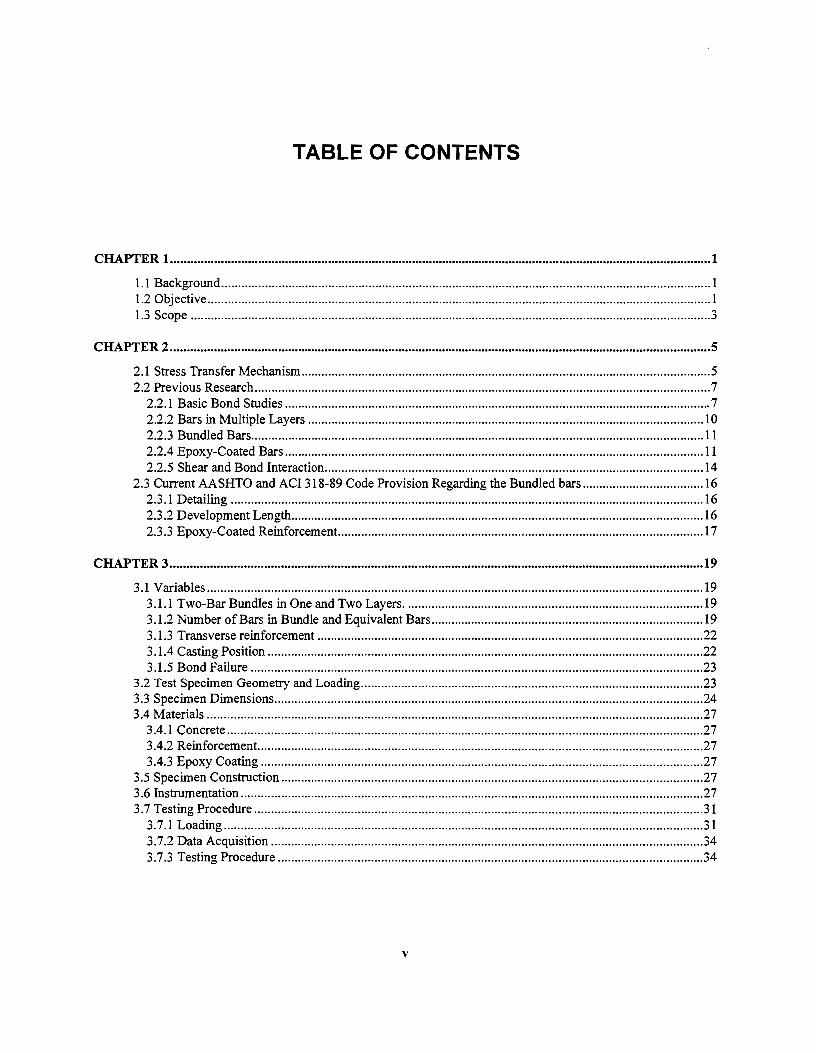
TABLE OF CONTENTS
CHAPTER 1 ................................................................................................................................................................. 1
1.1 Background .................................................................................................................................................. 1 1.2 Objective ...................................................................................................................................................... I 1.3 Scope ........................................................................................................................................................... 3
CHAPTER 2 ................................................................................................................................................................. 5
2.1 Stress Transfer Mechanism .......................................................................................................................... 5 2.2 Previous Research ........................................................................................................................................ ?
2.2.1 Basic Bond Studies ............................................................................................................................... 7 2.2.2 Bars in Multiple Layers ...................................................................................................................... 1 0 2.2.3 Bundled Bars ....................................................................................................................................... 11 2.2.4 Epoxy-Coated Bars ............................................................................................................................. 11 2.2.5 Shear and Bond Interaction ................................................................................................................. 14
2.3 Current AASHTO and ACI 318-89 Code Provision Regarding the Bundled bars .................................... l6 2.3.1 Detailing ............................................................................................................................................. 16 2.3 .2 Development Length ........................................................................................................................... 16 2.3 .3 Epoxy-Coated Reinforcement ............................................................................................................. 17
CHAPTER 3 ............................................................................................................................................................... 19
3.1 Variables .................................................................................................................................................... l9 3.1.1 Two-Bar Bundles in One and Two Layers ......................................................................................... 19 3.1.2 Number of Bars in Bundle and Equivalent Bars ................................................................................. 19 3 .1.3 Transverse reinforcement ................................................................................................................... 22 3.1.4 Casting Position .................................................................................................................................. 22 3.1.5 Bond Failure ....................................................................................................................................... 23
3.2 Test Specimen Geometry and Loading ...................................................................................................... 23 3.3 Specimen Dimensions ................................................................................................................................ 24 3.4 Materials .................................................................................................................................................... 27
3.4.1 Concrete .............................................................................................................................................. 27 3.4.2 Reinforcement. .................................................................................................................................... 27 3.4.3 Epoxy Coating .................................................................................................................................... 27
3.5 Specimen Construction .............................................................................................................................. 27 3.6 Instrumentation .......................................................................................................................................... 27 3.7 Testing Procedure ..................................................................................................................................... .31
3.7.1 Loading ............................................................................................................................................... 31 3.7.2 Data Acquisition ................................................................................................................................. 34 3.7.3 Testing Procedure ............................................................................................................................... 34
v
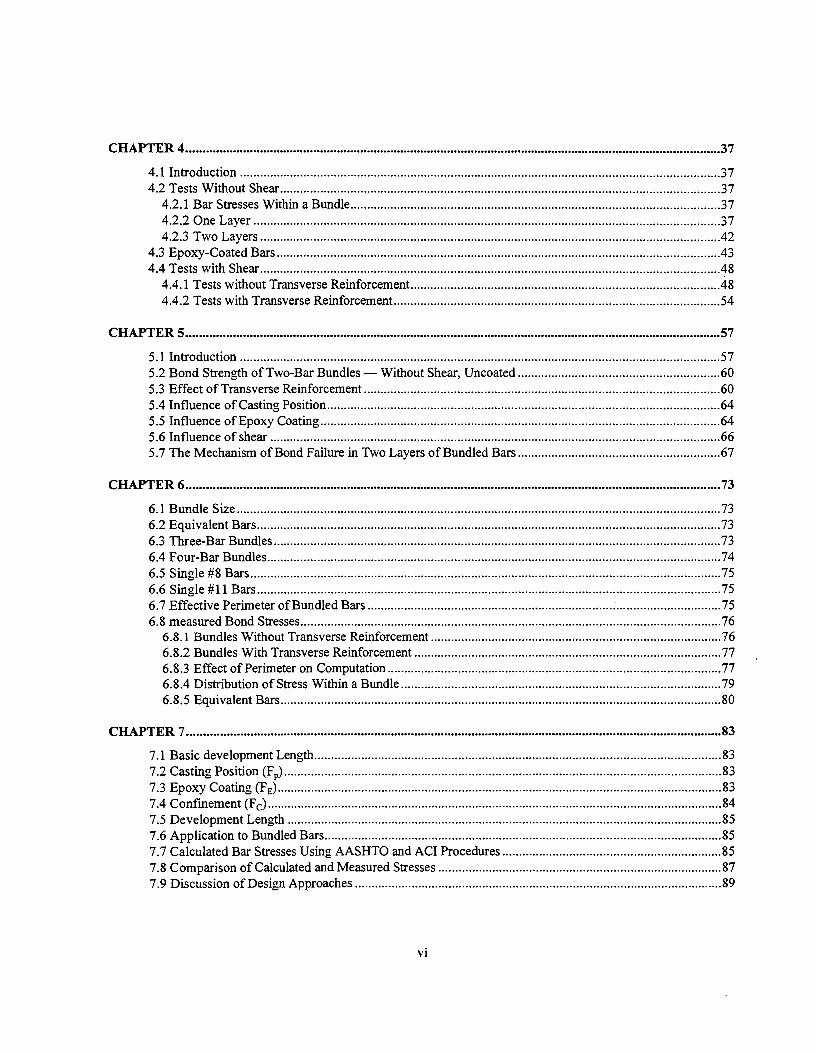
CHAPTER 4 ............................................................................................................................................................... 3 7
4.1 Introduction ............................................................................................................................................... 37 4.2 Tests Without Shear .................................................................................................................................. .37
4.2.1 Bar Stresses Within a Bundle .............................................................................................................. 37 4.2.2 One Layer ........................................................................................................................................... 37 4.2.3 Two Layers ......................................................................................................................................... 42
4.3 Epoxy-Coated Bars .................................................................................................................................... 43 4.4 Tests with Shear ......................................................................................................................................... 48
4.4.1 Tests without Transverse Reinforcement ............................................................................................ 48 4.4.2 Tests with Transverse Reinforcement ................................................................................................. 54
CHAPTER 5 ............................................................................................................................................................... 57
5.1 Introduction ............................................................................................................................................... 51 5.2 Bond Strength of Two-Bar Bundles- Without Shear, Uncoated ............................................................ 60 5.3 Effect of Transverse Reinforcement .......................................................................................................... 60 5.4 Influence of Casting Position ..................................................................................................................... 64 5.5 Influence ofEpoxy Coating ....................................................................................................................... 64 5.6 Influence of shear ...................................................................................................................................... 66 5.7 The Mechanism of Bond Failure in Two Layers of Bundled Bars ............................................................ 67
CHAPTER 6 ............................................................................................................................................................... 73
6.1 Bundle Size ................................................................................................................................................ 73 6.2 Equivalent Bars .......................................................................................................................................... 73 6.3 Three-BarBundles ..................................................................................................................................... 73 6.4 Four-Bar Bundles ....................................................................................................................................... 74 6.5 Single #8 Bars ............................................................................................................................................ 75 6.6 Single #11 Bars .......................................................................................................................................... 75 6. 7 Effective Perimeter ofBundled Bars ......................................................................................................... 75 6.8 measured Bond Stresses ............................................................................................................................. 76
6.8.1 Bundles Without Transverse Reinforcement ...................................................................................... 76 6.8.2 Bundles With Transverse Reinforcement ........................................................................................... 77 6.8.3 Effect of Perimeter on Computation ................................................................................................... 77 6.8.4 Distribution of Stress Within a Bundle ............................................................................................... 79 6.8.5 Equivalent Bars ................................................................................................................................... 80
CHAPTER 7 ............................................................................................................................................................... 83
7.1 Basic development Length ......................................................................................................................... 83 7.2 Casting Position (Fp) .................................................................................................................................. 83 7.3 Epoxy Coating (F£) .................................................................................................................................... 83 7.4 Confmement (Fc) ....................................................................................................................................... 84 7.5 Development Length ................................................................................................................................. 85 7.6 Application to Bundled Bars ...................................................................................................................... 85 7.7 Calculated Bar Stresses Using AASHTO and ACI Procedures ................................................................. 85 7.8 Comparison of Calculated and Measured Stresses .................................................................................... 87 7.9 Discussion of Design Approaches ............................................................................................................. 89
vi
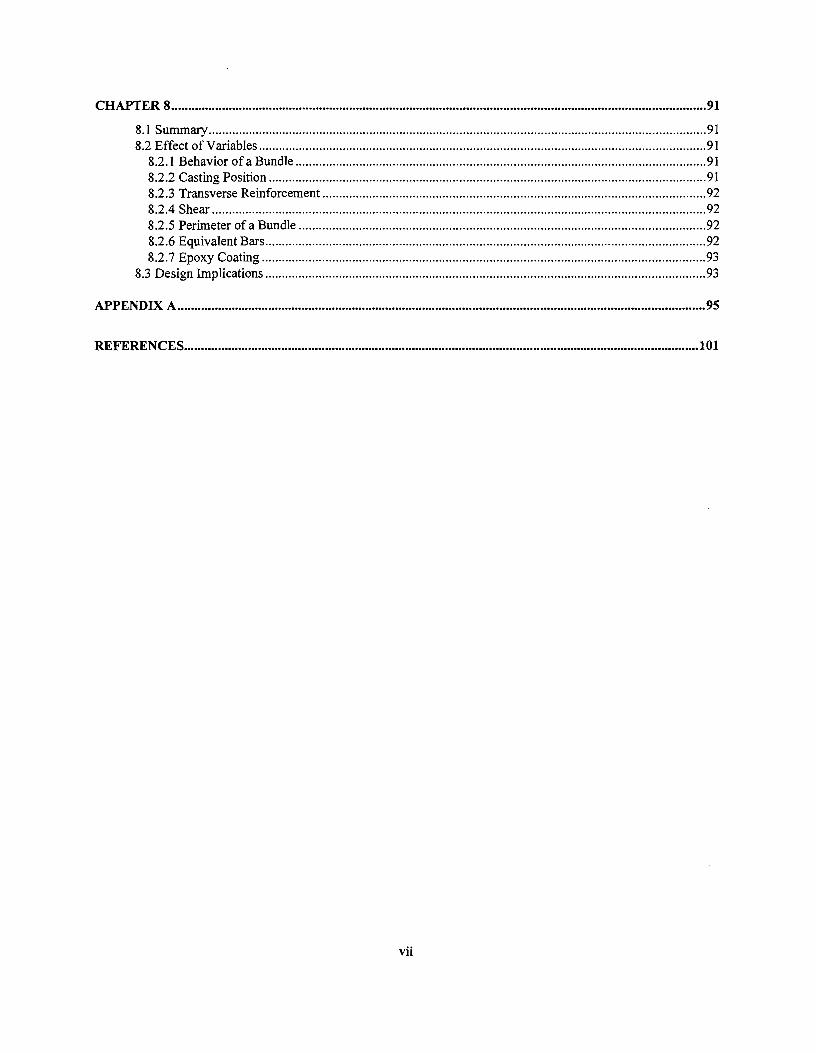
CHAPTER 8 ............................................................................................................................................................... 91
8.1 Summary .................................................................................................................................................... 91 8.2 Effect ofVariables ..................................................................................................................................... 91
8.2.1 Behavior of a Bundle .......................................................................................................................... 91 8.2.2 Casting Position .................................................................................................................................. 91 8.2.3 Transverse Reinforcement .................................................................................................................. 92 8.2.4 Shear ................................................................................................................................................... 92 8.2.5 Perimeter of a Bundle ......................................................................................................................... 92 8.2.6 Equivalent Bars ................................................................................................................................... 92 8.2.7 Epoxy Coating .................................................................................................................................... 93
8.3 Design Implications ................................................................................................................................... 93
APPENDIX A ............................................................................................................................................................. 95
REFERENCES ......................................................................................................................................................... lOl
vii

viii
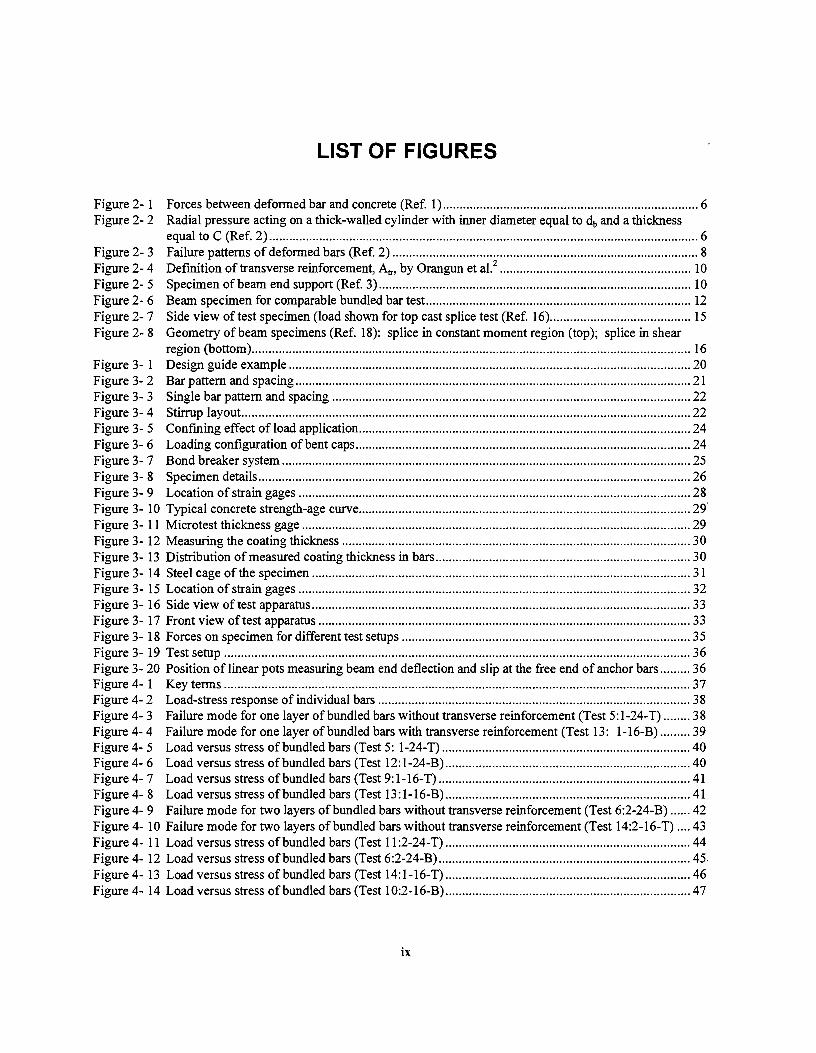
LIST OF FIGURES
Figure 2- 1 Forces between deformed bar and concrete (Ref. 1) ............................................................................ 6 Figure 2-2 Radial pressure acting on a thick-walled cylinder with inner diameter equal to db and a thickness
equal to C (Ref. 2) ................................................................................................................................ 6 Figure 2- 3 Failure patterns of deformed bars (Ref. 2) ........................................................................................... 8 Figure 2-4 Defmition of transverse reinforcement, Atr, by Orangun et al.2
......................................................... 10 Figure 2- 5 Specimen ofbeam end support (Ref. 3) ............................................................................................. 10 Figure 2- 6 Beam specimen for comparable bundled bar test.. ............................................................................. 12 Figure 2-7 Side view of test specimen (load shown for top cast splice test (Ref. 16) .......................................... 15 Figure 2- 8 Geometry ofbeam specimens (Ref. 18): splice in constant moment region (top); splice in shear
region (bottom) ................................................................................................................................... 16 Figure 3- 1 Design guide example ........................................................................................................................ 20 Figure 3- 2 Bar pattern and spacing ...................................................................................................................... 21 Figure 3- 3 Single bar pattern and spacing ........................................................................................................... 22 Figure 3- 4 Stirrup layout ...................................................................................................................................... 22 Figure 3- 5 Confming effect ofload application ................................................................................................... 24 Figure 3- 6 Loading configuration ofbent caps .................................................................................................... 24 Figure 3- 7 Bond breaker system .......................................................................................................................... 25 Figure 3- 8 Specimen details ................................................................................................................................. 26 Figure 3- 9 Location of strain gages ..................................................................................................................... 28 Figure 3- 10 Typical concrete strength-age curve ................................................................................................... 29' Figure 3- 11 Micro test thickness gage .................................................................................................................... 29 Figure 3- 12 Measuring the coating thickness ........................................................................................................ 30 Figure 3- 13 Distribution of measured coating thickness in bars ............................................................................ 30 Figure 3- 14 Steel cage of the specimen ................................................................................................................. 31 Figure 3- 15 Location of strain gages ..................................................................................................................... 32 Figure 3- 16 Side view of test apparatus ................................................................................................................. 33 Figure 3- 17 Front view of test apparatus ............................................................................................................... 33 Figure 3- 18 Forces on specimen for different test setups ...................................................................................... 35 Figure 3- 19 Test setup ........................................................................................................................................... 36 Figure 3- 20 Position oflinear pots measuring beam end deflection and slip at the free end of anchor bars ......... 36 Figure 4- 1 Key terms ........................................................................................................................................... 37 Figure 4- 2 Load-stress response of individual bars ............................................................................................. 38 Figure 4-3 Failure mode for one layer ofbundled bars without transverse reinforcement (Test 5:1-24-T) ........ 38 Figure 4- 4 Failure mode for one layer of bundled bars with transverse reinforcement (Test 13: 1-16-B) ......... 39 Figure 4- 5 Load versus stress of bundled bars (Test 5: 1-24-T) .......................................................................... 40 Figure 4- 6 Load versus stress of bundled bars (Test 12: 1-24-B) ......................................................................... 40 Figure 4- 7 Load versus stress of bundled bars (Test 9: 1-16-T) ........................................................................... 41 Figure 4- 8 Load versus stress of bundled bars (Test 13:1-16-B) ......................................................................... 41 Figure 4- 9 Failure mode for two layers of bundled bars without transverse reinforcement (Test 6:2-24-B) ...... 42 Figure 4- 10 Failure mode for two layers of bundled bars without transverse reinforcement (Test 14:2-16-T) .... 43 Figure 4- 11 Load versus stress of bundled bars (Test 11:2-24-T) ......................................................................... 44 Figure 4- 12 Load versus stress of bundled bars (Test 6:2-24-B) ........................................................................... 45. Figure 4- 13 Load versus stress of bundled bars (Test 14:1-16-T) ......................................................................... 46 Figure 4- 14 Load versus stress of bundled bars (Test 10:2-16-B) ......................................................................... 47
ix
Figure 4- 15 Concrete cover of epoxy-coated bars after test ................................................................................... 48 Figure 4- 16 Load versus stresses of bundled bars (Test 14E:E2-16-T) .................................................................. 49 Figure 4- 17 Load versus stress ofbundled bars (Test lOE:£2-16-B) ..................................................................... 50 Figure 4- 18 Load versus stress ofbundled bars (Test 14R:R2-16-T) ..................................................................... 51 Figure 4- 19 Load versus stress ofbundled bars (Test 10R:R2-16-B) .................................................................... 52 Figure 4- 20 Cracking and failure in Test 7S:S 1-24-T, one layer without transverse reinforcement ...................... 53 Figure 4-21 Failure mode for Test 15S:2S-24-B, two layers without transverse reinforcement.. .......................... 54 Figure 4- 22 Failure propogating from separator, Test 8S:S 1-16-T, one layer with transverse reinforcement.. ..... 55 Figure 4- 23 Failure mode for Test 16S:2S-16-B, two layers with transverse reinforcement. ................................ 55 Figure 4-24 Load versus stress ofbundled bars (Test 16:2-16-B) .......................................................................... 56 Figure 5- 1 Measured stress distribtuion across section (Tests without transverse reinforcement) ...................... 58 Figure 5-2 Measured stress distribtution across section (Tests with transverse reinforcement) .......................... 59 Figure 5-3 Defmition of An, area of transverse reinforcement ............................................................................ 62 Figure 5- 4 Comparison of stirrup stress for one and two layers of bundled bars ................................................ 63 Figure 5- 5 Inferior concrete below top casting bars ............................................................................................ 64 Figure 5- 6 Free-body diagram of end concrete block under the test without transverse reinforcement. ............. 66 Figure 5- 7 Free-body diagram of end concrete block under the test with transferse reinforcement .................... 67 Figure 5-8 The bond failure mechanism of two layers of bundled bars (with Teflon sheet) ............................... 68. Figure 5-9 Average stresses of outer and inner layer bars (two layers of bars without transverse
reinforcement, top cast) ...................................................................................................................... 69 Figure 5- 10 Average stresses of outer and inner layer bars (two layers of bars with transverse reinforcement,
top cast) .............................................................................................................................................. 69 Figure 5- 11 Average stresses of outer and inner layer of bars (two layers of bars without transverse
reinforcement, bottom cast) ................................................................................................................ 70 Figure 5- 12 Average stresses of outer and inner layer of bars (two layers of bars with transverse reinforcement,
bottom cast) ........................................................................................................................................ 70 Figure 6- 1 Bar patterns ........................................................................................................................................ 73 Figure 6- 2 Four-bar bundle after bond failure ..................................................................................................... 74 Figure 6- 3 Perimeters ........................................................................................................................................... 78 Figure 6-4 ............................................................................................................................................................ 78 Figure 6- 5 Stress distribution within a bundle ..................................................................................................... 79 Figure 6- 6 Splitting planes of different widths .................................................................................................... 80 Figure 8- 1 Redistribution of stress ....................................................................................................................... 92 Figure A- 1 Gap in cover after removal of plywood ............................................................................................. 96 Figure A- 2 Concrete cover splitting after bond failure ......................................................................................... 96 Figure A- 3 Bond failure mechanism of test region (Specimen #1). Plywood was used as separating material .. 97 Figure A- 4 Bar strain distribution across layer ..................................................................................................... 97 Figure A- 5 Second failure plane due to the release of energy at bond failure ...................................................... 98
X
Table 3- 1 Table 5-1 Table 6- 1 Table 6-2 Table 6-3 Table 6-4 Table 7- 1
LIST OF TABLES
As-built details of test specimens ........................................................................................................... 23 Comparison of measured load and the load calculated from strain gages .............................................. 57 Effect ofbundle size. Ultimate bond stress of tests without transverse reinforcement. ........................ 76 Effect of transverse reinforcement on ultimate bond strength of bundled bars ...................................... 77 Comparison of measured and predicted bond stress values ................................................................... 79 Normalized bond stress for bundled vs. equivalent bars ........................................................................ 81 Comparison of measured and predicted stressesin bundled bars ........................................................... 88
xi

xii
SUMMARY
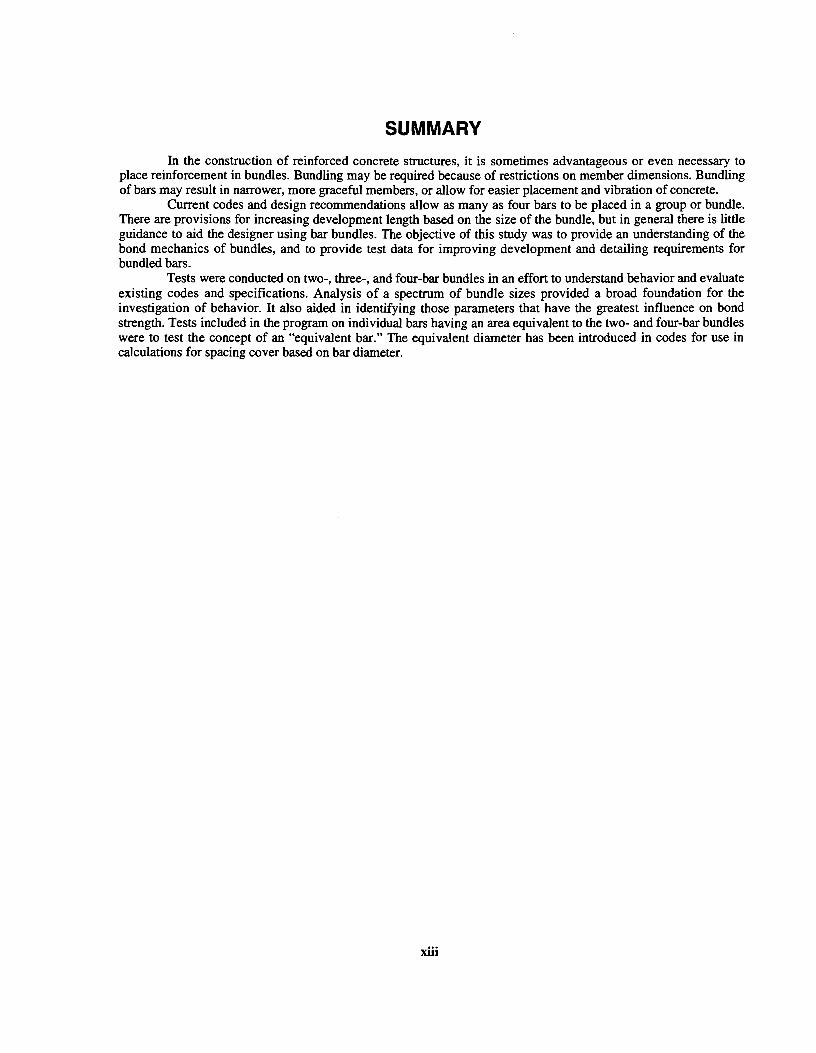
In the construction of reinforced concrete structures, it is sometimes advantageous or even necessary to place reinforcement in bundles. Bundling may be required because of restrictions on member dimensions. Bundling of bars may result in narrower, more graceful members, or allow for easier placement and vibration of concrete.
Current codes and design recommendations allow as many as four bars to be placed in a group or bundle. There are provisions for increasing development length based on the size of the bundle, but in general there is little guidance to aid the designer using bar bundles. The objective of this study was to provide an understanding of the bond mechanics of bundles, and to provide test data for improving development and detailing requirements for bundled bars.
Tests were conducted on two-, three-, and four-bar bundles in an effort to understand behavior and evaluate existing codes and specifications. Analysis of a spectrum of bundle sizes provided a broad foundation for the investigation of behavior. It also aided in identifying those parameters that have the greatest influence on bond strength. Tests included in the program on individual bars having an area equivalent to the two- and four-bar bundles were to test the concept of an "equivalent bar." The equivalent diameter has been introduced in codes for use in calculations for spacing cover based on bar diameter.
xiii

xiv
CHAPTER 1
INTRODUCTION
1.1 BACKGROUND
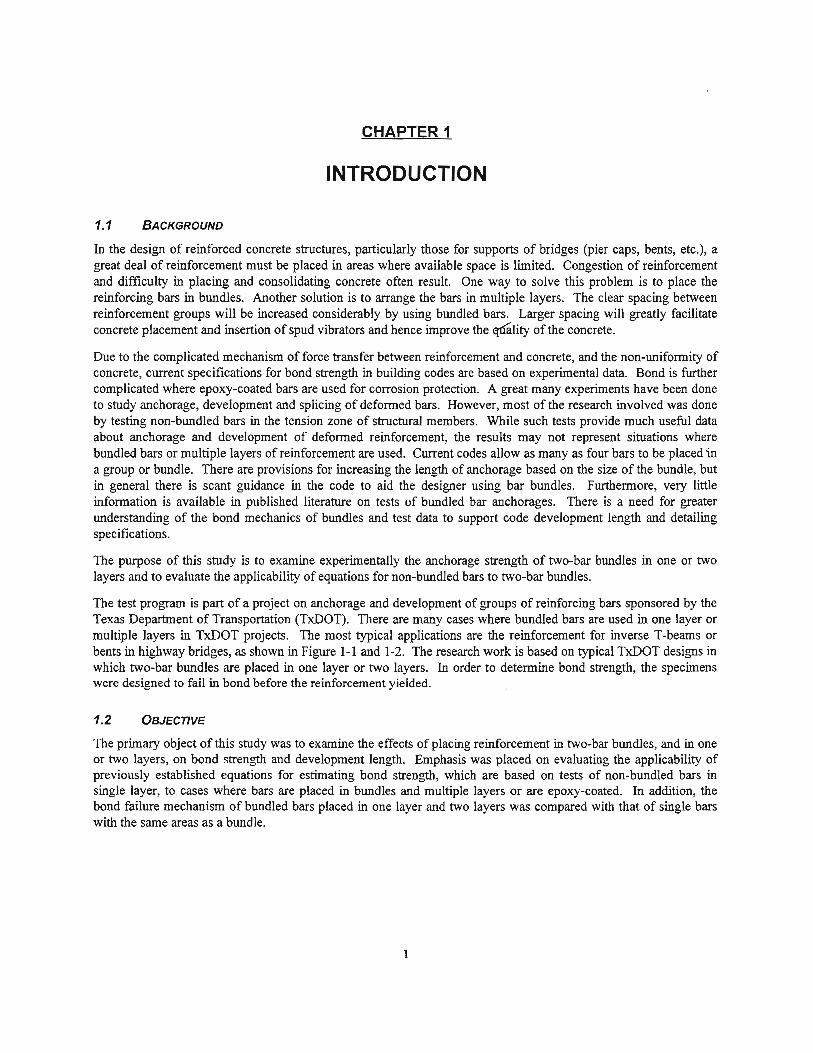
In the design of reinforced concrete structures, particularly those for supports of bridges (pier caps, bents, etc.), a great deal of reinforcement must be placed in areas where available space is limited. Congestion of reinforcement and difficulty in placing and consolidating concrete often result. One way to solve this problem is to place the reinforcing bars in bundles. Another solution is to arrange the bars in multiple layers. The clear spacing between reinforcement groups will be increased considerably by using bundled bars. Larger spacing will greatly facilitate concrete placement and insertion of spud vibrators and hence improve the qtfulity of the concrete.
Due to the complicated mechanism of force transfer between reinforcement and concrete, and the non-uniformity of concrete, current specifications for bond strength in building codes are based on experimental data. Bond is further complicated where epoxy-coated bars are used for corrosion protection. A great many experiments have been done to study anchorage, development and splicing of deformed bars. However, most of the research involved was done by testing non-bundled bars in the tension zone of structural members. While such tests provide much useful data about anchorage and development of deformed reinforcement, the results may not represent situations where bundled bars or multiple layers of reinforcement are used. Current codes allow as many as four bars to be placed in a group or bundle. There are provisions for increasing the length of anchorage based on the size of the bundle, but in general there is scant guidance in the code to aid the designer using bar bundles. Furthermore, very little information is available in published literature on tests of bundled bar anchorages. There is a need for greater understanding of the bond mechanics of bundles and test data to support code development length and detailing specifications.
The purpose of this study is to examine experimentally the anchorage strength of two-bar bundles in one or two layers and to evaluate the applicability of equations for non-bundled bars to two-bar bundles.
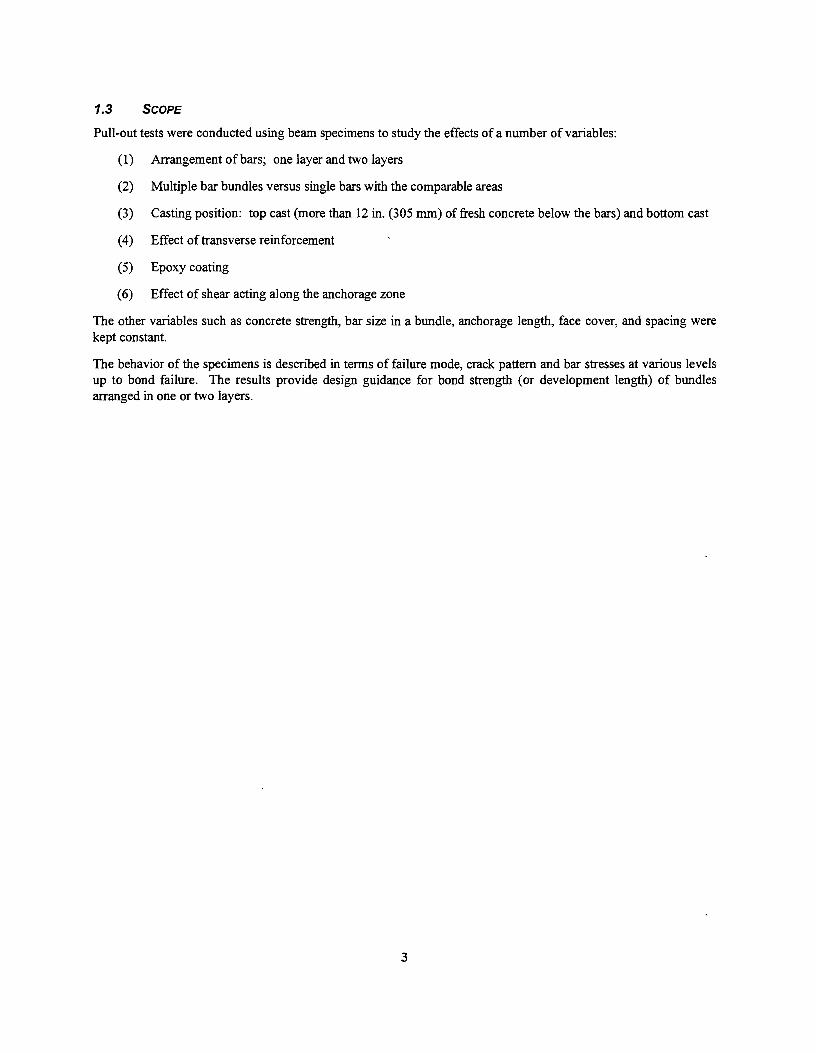
The test program is part of a project on anchorage and development of groups of reinforcing bars sponsored by the Texas Department of Transportation (TxDOT). There are many cases where bundled bars are used in one layer or multiple layers in TxDOT projects. The most typical applications are the reinforcement for inverse T-beams or bents in highway bridges, as shown in Figure 1-1 and 1-2. The research work is based on typical TxDOT designs in which two-bar bundles are placed in one layer or two layers. In order to determine bond strength, the specimens were designed to fail in bond before the reinforcement yielded.
1.2 OBJECTIVE
The primary object of this study was to examine the effects of placing reinforcement in two-bar bundles, and in one or two layers, on bond strength and development length. Emphasis was placed on evaluating the applicability of previously established equations for estimating bond strength, which are based on tests of non-bundled bars in single layer, to cases where bars are placed in bundles and multiple layers or are epoxy-coated. In addition, the bond failure mechanism of bundled bars placed in one layer and two layers was compared with that of single bars with the same areas as a bundle.
1
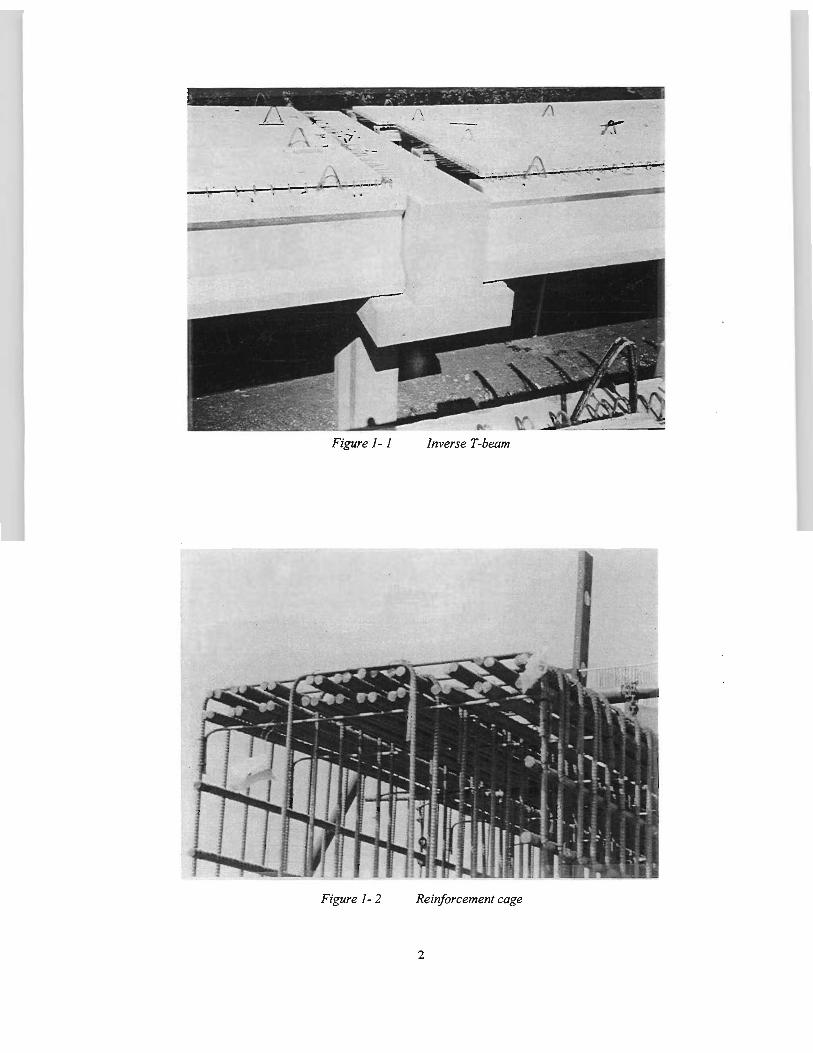
Figure 1-1 Inverse T-beam
Figure 1-2 Reinforcement cage
2
1.3 SCOPE
Pull-out tests were conducted using beam specimens to study the effects of a number of variables:
(1) Arrangement of bars; one layer and two layers
(2) Multiple bar bundles versus single bars with the comparable areas
(3) Casting position: top cast (more than 12 in. (305 mm) of fresh concrete below the bars) and bottom cast
(4) Effect of transverse reinforcement
(5) Epoxy coating
(6) Effect of shear acting along the anchorage zone
The other variables such as concrete strength, bar size in a bundle, anchorage length, face cover, and spacing were kept constant.
The behavior of the specimens is described in terms of failure mode, crack pattern and bar stresses at various levels up to bond failure. The results provide design guidance for bond strength (or development length) of bundles arranged in one or two layers.
3

CHAPTER2
BOND FAILURE HYPOTHESIS
2.1 STRESS TRANSFER MECHANISM
Bond stresses are assumed to represent the average shear stress between embedded reinforcement and the surrounding concrete. Early practice in reinforced concrete design involved plain bars for reinforcement. For plain bars, the bond strength is controlled mainly by a combination of chemical bond between the cement paste in concrete and the bar surface, and friction between the reinforcement and adjacent concrete. Together chemical bond and friction provide very little bond strength. For high strength reinforcement or large diameter bars, adhesion and friction usually cannot provide enough anchorage force to yield the bar within a reasonable anchorage length. For this reason, deformed reinforcement is used. In addition to adhesion bond and friction, there is mechanical interlock between concrete and the lugs on the deformed reinforcement. Most of the bond strength is provided by mechanical interlock. Although the deformed bar has higher bond strength, there is a greater tendency for failure to be produced by concrete spitting between the bars or in the cover.
Mechanical interlock is determined by many parameters, including the height, the inclined angle and the spacing pf the lugs on bars, the concrete strength, and the amount of concrete or transverse steel surrounding the bars. Since concrete is brittle and non-uniform material, stress transfer between reinforcement and concrete is not uniform. As a result, the average bond stress (rather than the bond stress at a particular point along the embedded bar) is used to assess the performance. By assuming bond stress is uniform along the anchorage length, the average bond stress can be calculated by equating the tensile force in the bar to the bond force acting on the cylindrical surface area of the anchored bar. The surface area is based on the nominal bar diameter, ignoring the extra surface area and bearing resistance provided by the lugs, as indicated in Equation 2.1:
(2.1)
where: T the tension force on bar
diameter of bar
stress on bar
u average bond stress along the anchorage length
Rearranging equation 2.1
(2.2)
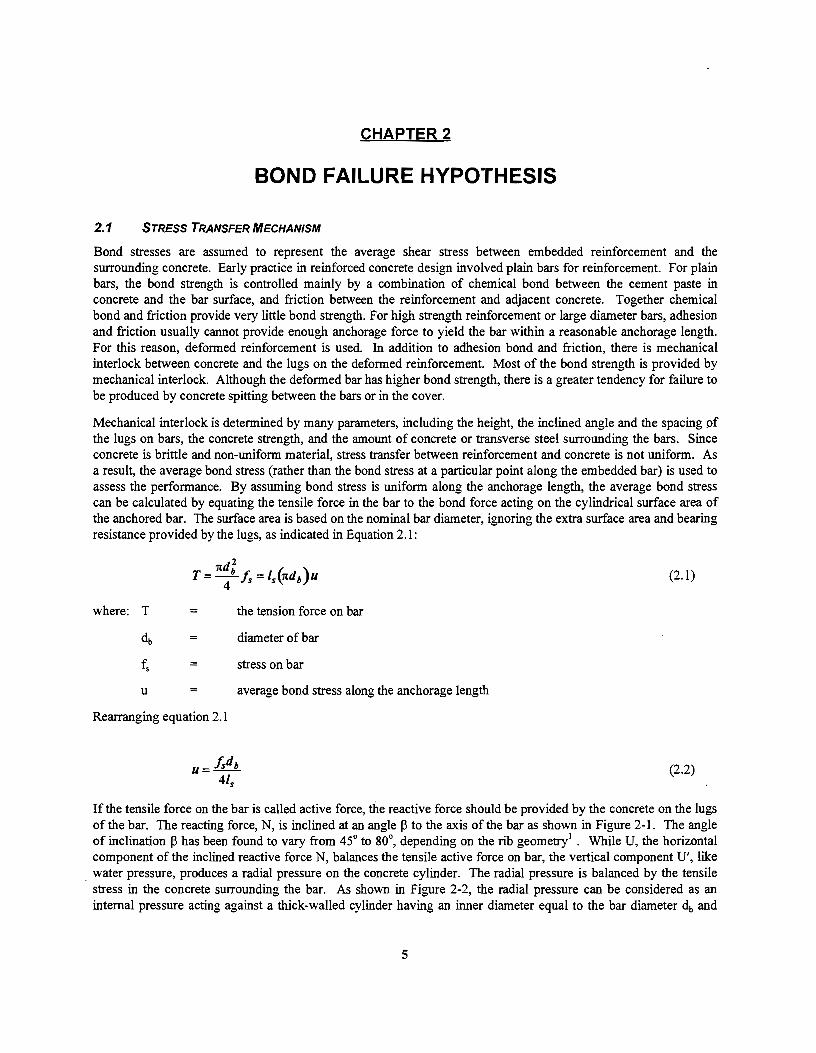
If the tensile force on the bar is called active force, the reactive force should be provided by the concrete on the lugs of the bar. The reacting force, N, is inclined at an angle ~ to the axis of the bar as shown in Figure 2-1. The angle of inclination ~ has been found to vary from 45° to 80°, depending on the rib geometry1
• While U, the horizontal component of the inclined reactive force N, balances the tensile active force on bar, the vertical component U', like water pressure, produces a radial pressure on the concrete cylinder. The radial pressure is balanced by the tensile stress in the concrete surrounding the bar. As shown in Figure 2-2, the radial pressure can be considered as an internal pressure acting against a thick-walled cylinder having an inner diameter equal to the bar diameter db and
5
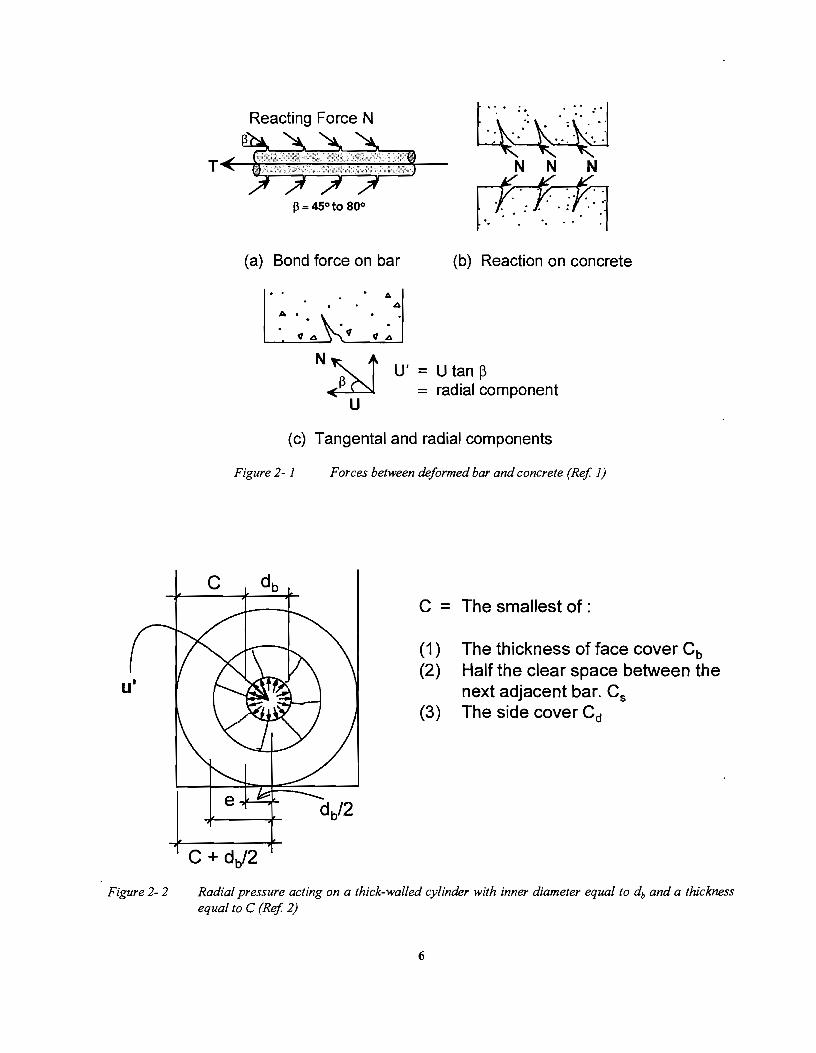
Figure 2-2
Reacting Force N
~ T<- N N N
~=45°to 80° ·. . .. . ..
(a) Bond force on bar (b) Reaction on concrete
NJ:cJ U': U tan~ radial component
u
(c) Tangental and radial components
Figure 2-1 Forces between deformed bar and concrete (Ref 1)
C = The smallest of :
(1) The thickness of face cover Cb (2) Half the clear space between the
next adjacent bar. Cs (3) The side cover Cd
Radial pressure acting on a thick-walled cylinder with inner diameter equal to db and a thickness equal to C (Ref 2)
6
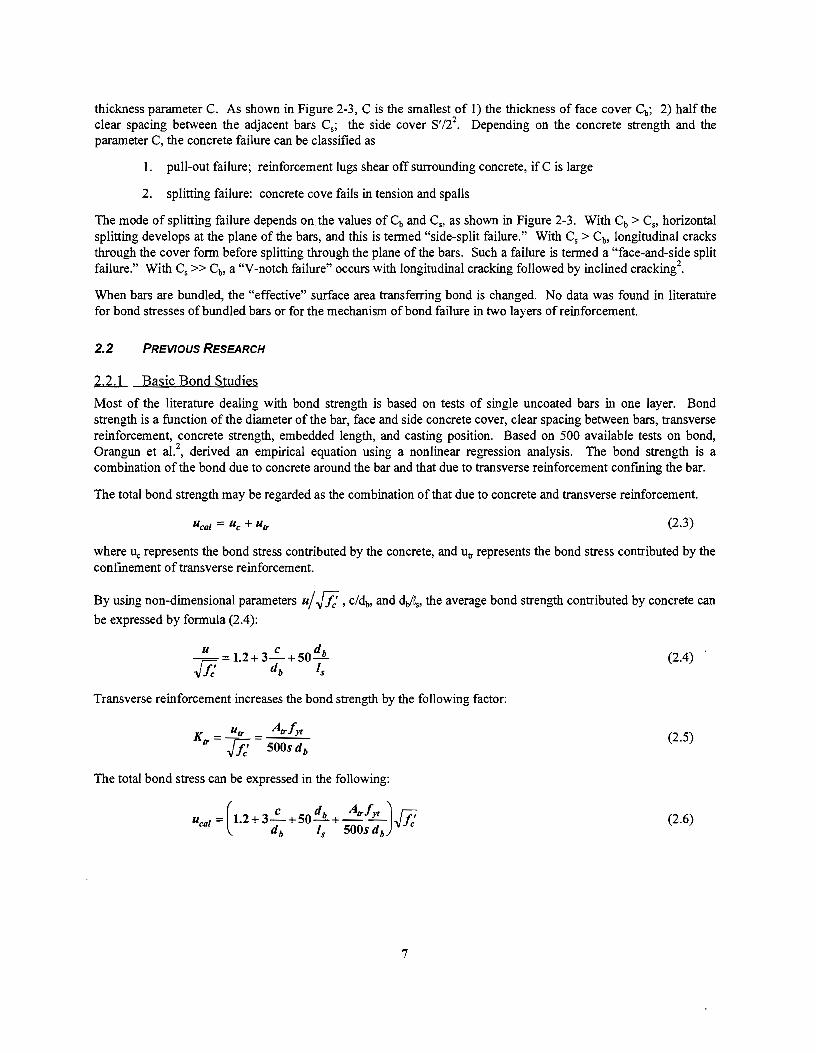
thickness parameter C. As shown in Figure 2-3, Cis the smallest of 1) the thickness offace cover Cb; 2) half the clear spacing between the adjacent bars C5; the side cover S'/22
• Depending on the concrete strength and the parameter C, the concrete failure can be classified as
1. pull-out failure; reinforcement lugs shear off surrounding concrete, if C is large
2. splitting failure: concrete cove fails in tension and spalls
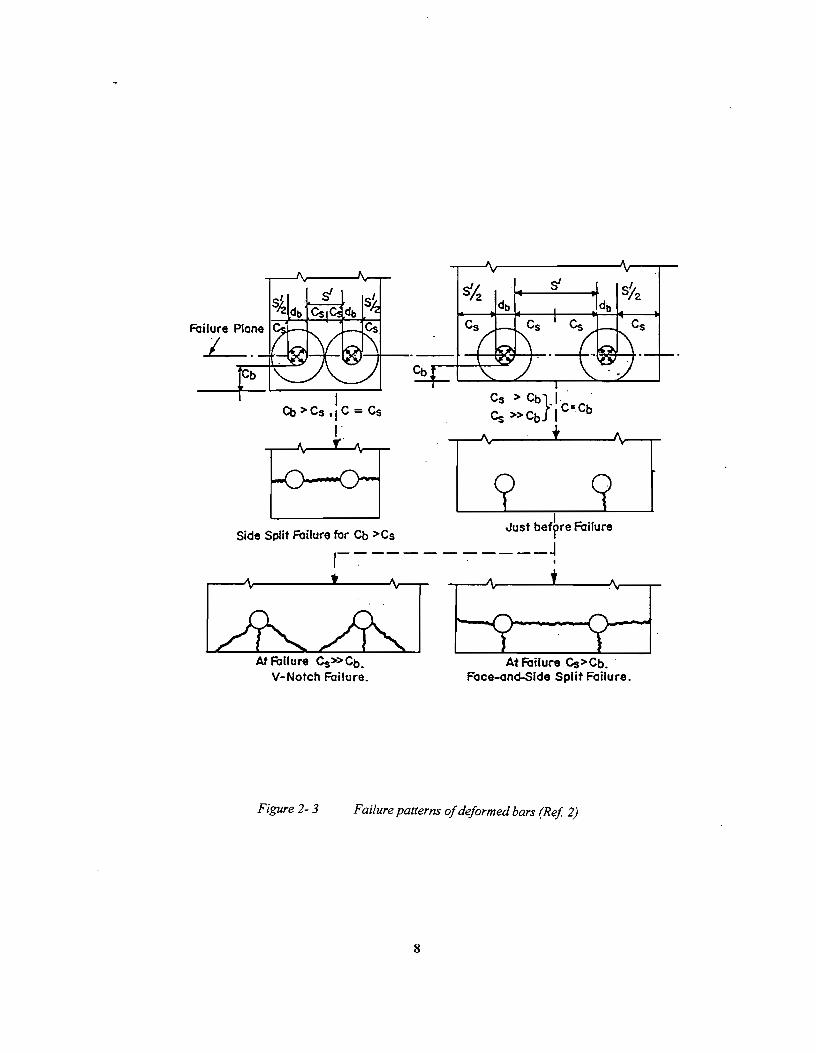
The mode of splitting failure depends on the values of Cb and C5, as shown in Figure 2-3. With Cb > C5, horizontal splitting develops at the plane of the bars, and this is termed "side-split failure." With C5 > Cb, longitudinal cracks through the cover form before splitting through the plane of the bars. Such a failure is termed a "face-and-side split failure." With C5 >> Cb, a "V -notch failure" occurs with longitudinal cracking followed by inclined cracking2
•
When bars are bundled, the "effective" surface area transferring bond is changed. No data was found in Iiterat:tire for bond stresses of bundled bars or for the mechanism ofbond failure in two layers of reinforcement.
2.2 PREVIOUS RE.SE.ARCH
.2..ll Basic Bond Studies
Most of the literature dealing with bond strength is based on tests of single uncoated bars in one layer. Bond strength is a function of the diameter of the bar, face and side concrete cover, clear spacing between bars, transverse reinforcement, concrete strength, embedded length, and casting position. Based on 500 available tests on bond, Orangun et al.2
, derived an empirical equation using a nonlinear regression analysis. The bond strength is a combination of the bond due to concrete around the bar and that due to transverse reinforcement confming the bar.
The total bond strength may be regarded as the combination of that due to concrete and transverse reinforcement.
(2.3)
where uc represents the bond stress contributed by the concrete, and utr represents the bond stress contributed by the confmement of transverse reinforcement.
By using non-dimensional parameters u/ fll , c/db, and dJiso the average bond strength contributed by concrete can
be expressed by formula (2.4):
u c db --= 1.2+ 3-+50-.fll db Is (2.4)
Transverse reinforcement increases the bond strength by the following factor:
(2.5)
The total bond stress can be expressed in the following:
(2.6)
7
I Cb>Cs,1C=Cs
r.
. s ... r· Fo"l f Cb >C Just befbre Foilure S1de ""'t 1 ure or s 1
1--------____ .J
. . .
c&:AJ At Fbllure Cs»Cb.
V-Notch Failure. AtFbilure Cs>Cb. ·
Foce-onc:f..Side Split Failure.
Figure 2-3 Failure patterns of deformed bars (Ref 2)
8
where: Ucal
Uc
U~r
Ko:
c
db
A~r
fyt
s
J:
= =
= = = = =
= = =
calculated ultimate bond stress, psi
portion of bond stress contributed by the concrete cover, psi
portion of bond stress contributed by the transverse reinforcement, psi
index of the strength provided along the anchored bars by the transverse reinforcement
minimum thickness of face cover and half spacing of adjacent bars, in.
bar diameter, in.
area of transverse reinforcement crossing the splitting plane through the anchored bars, in2
yield strength of transverse reinforcement, psi
spacing of transverse reinforcement, in.
concrete compressive strength, psi
As c/db increases the bond strength increases, and for large c/db ratios, direct pullout could occur. Test data indicated that for a c/db ratio of 2.5 or more, strength did not increase. Also, it was found that large amounts of transverse reinforcement become ineffective since a splitting failure mode is no longer produced. To reflect this observation, K~r was limited to 3. It was also observed that bond strength was affected by the casting position of the bar. In the relatively few tests with top bars, bond strength was about 82 to 88% of that for bottom bars. However, as there were very few tests with top bars, it was recommended that for top bars the development length be multiplied by 1.3. The last observation, based on the available data, was that the empirical equation fits best when the factor c.f(cb db) is less than 3. For values between 3 and 6 the equation is conservative and a reduction factor in the splice or development length of 0.9 was proposed as well as a factor of 0.7 for ratios higher than 6.
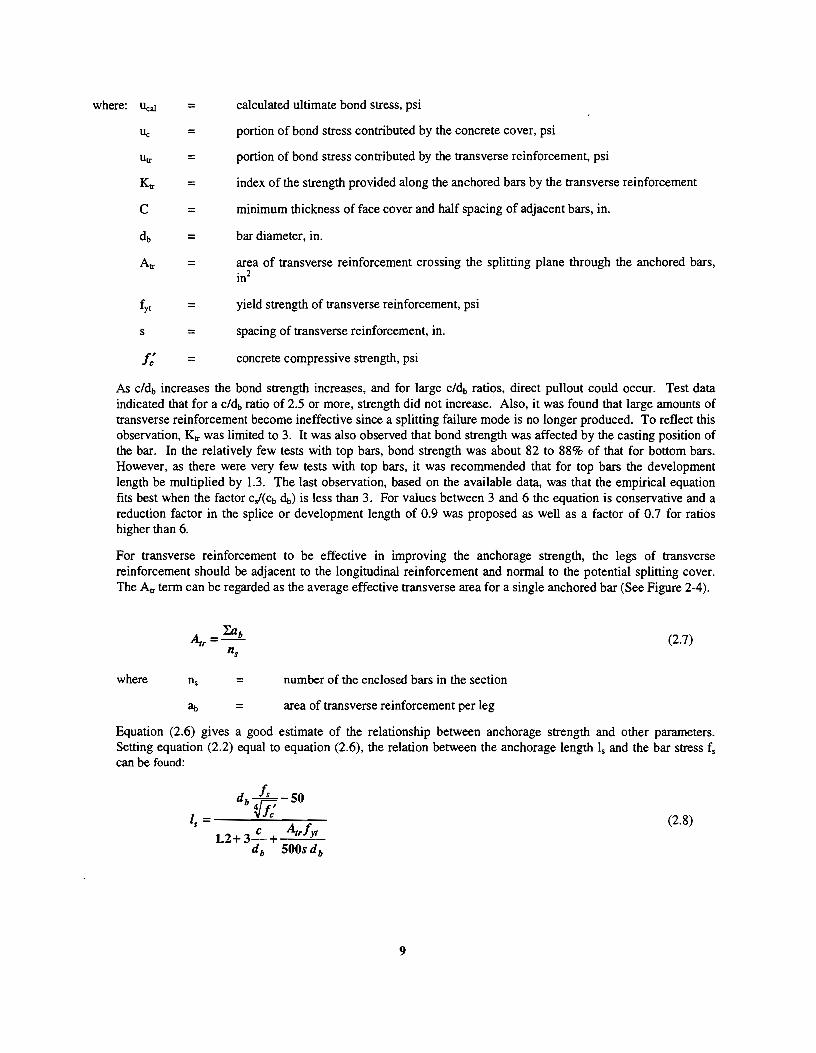
For transverse reinforcement to be effective in improving the anchorage strength, the legs of transverse reinforcement should be adjacent to the longitudinal reinforcement and normal to the potential splitting cover. The A~r term can be regarded as the average effective transverse area for a single anchored bar (See Figure 2-4).
(2.7)
where = number of the enclosed bars in the section
= area of transverse reinforcement per leg
Equation (2.6) gives a good estimate of the relationship between anchorage strength and other parameters. Setting equation (2.2) equal to equation (2.6), the relation between the anchorage length Is and the bar stress fs can be found:
(2.8)
9
t-S-+4' s/2
f ::::::: Is
If spacing is uneven s = Is I no. of transverse ties
Single Leg Double Leg
atr= ab atr= 2 ab
a,,= __ =-.:;.:.::._ __
no. of splices 2ab
3
Spiral
atr= 2ab
Rearranging Equation 2.8, f, can be expressed in terms of Is as follows:
4!J12+3~+50dh + A,rfyt J ft db l . db Is 500 S db c
(2.9)
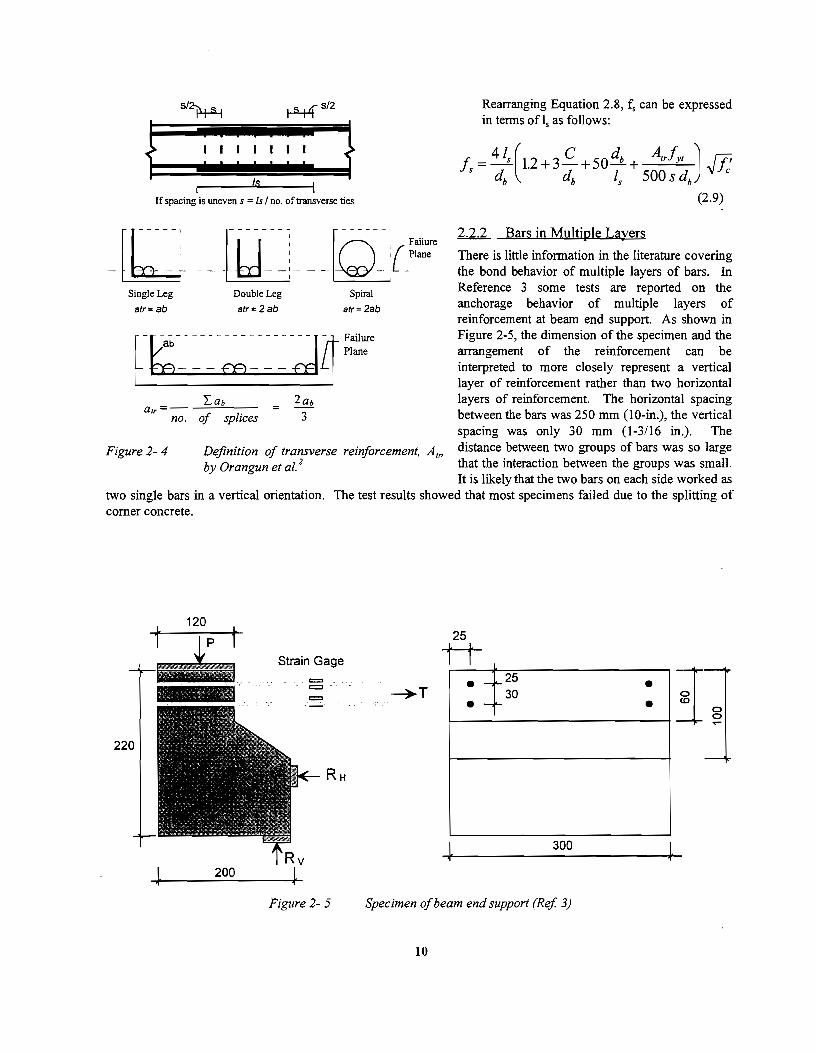
2.2.2 Bars in Multiple Layers
There is little infonnation in the literature covering the bond behavior of multiple layers of bars. In Reference 3 some tests are reported on the anchorage behavior of multiple layers of reinforcement at beam end support. As shown in Figure 2-5, the dimension of the specimen and the arrangement of the reinforcement can be interpreted to more closely represent a vertical layer of reinforcement rather than two horizontal layers of reinforcement. The horizontal spacing between the bars was 250 mm (I 0-in.), the vertical spacing was only 30 mm (1-3/16 in.). The
Figure2- 4 Definition of transverse reinforcement, A,,.. distance between two groups of bars was so large by Orangun et al. 2 that the interaction between the groups was small.
It is likely that the two bars on each side worked as two single bars in a vertical orientation. The test results showed that most specimens failed due to the splitting of comer concrete.
120
~ -220
200
Strain Gage
= ·= =
Figure 2-5
25
rr ~T
. - 1<- 25 • 30 . - 1<- •
300 J. 1
Specimen of beam end support (Ref 3)
10
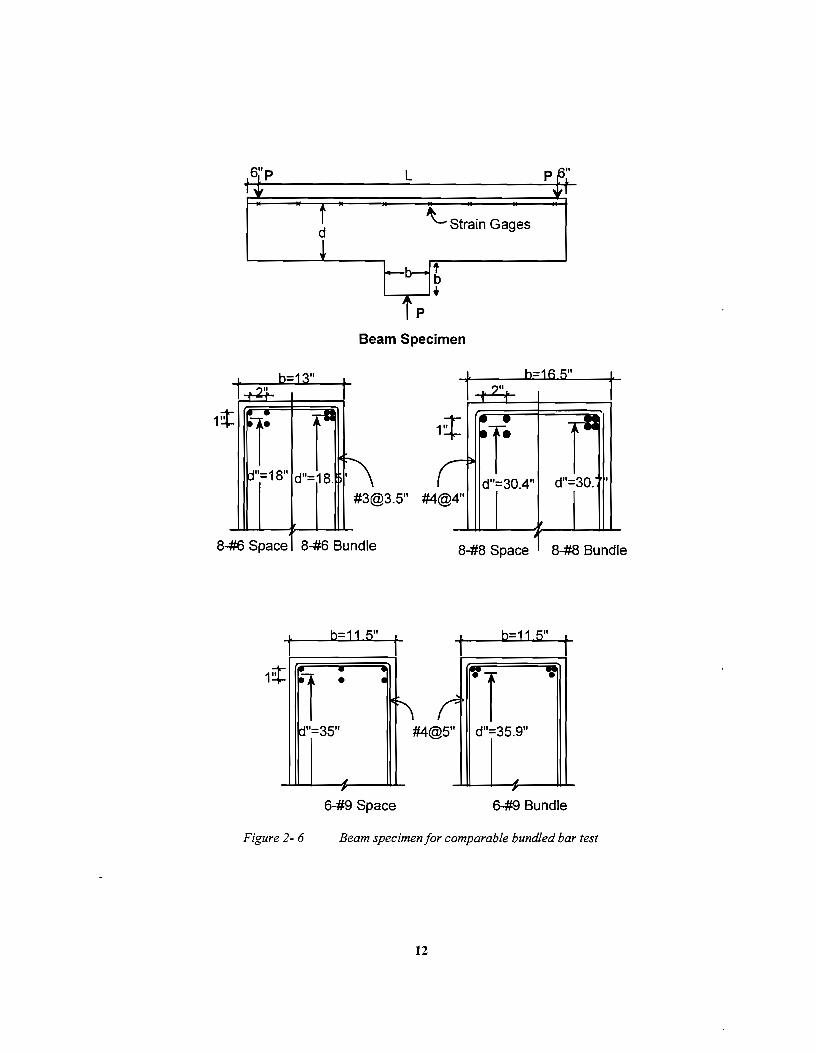
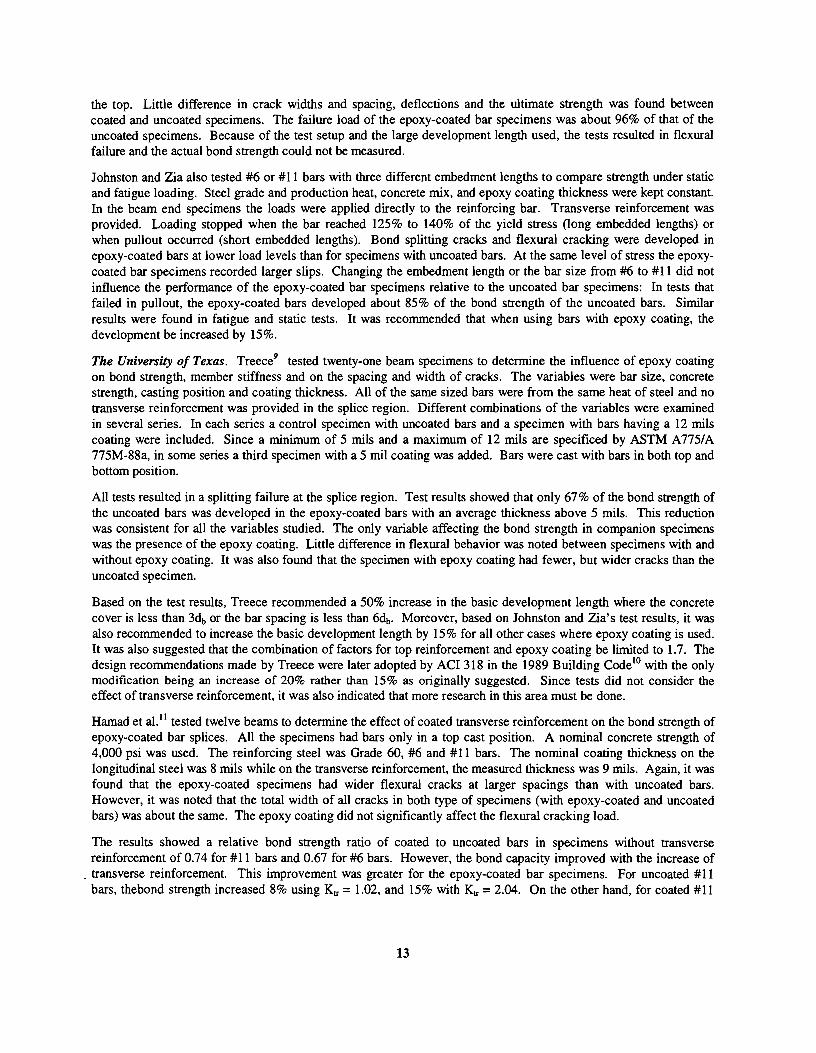
2.2.3 Bundled Bars In 1958, Hanson and Reiffenstuhl4 reported the results of an investigation of the feasibility of using bundled bar details in beams and columns (Figure 2-6). The first half of the program consisted of tests of pairs of beams. The first beam of the pair had conventionally spaced reinforcement; the second, bundled reinforcement. The same number of bars were used in each set of tests. Four bar bundles of #6 and #8 bars were tested, as well as three bar bundles of #9 bar. The bundles were top cast in short, deep beams. Two types of steel were used: "intermediate" grade steel, with a yield strength of approximately 47 ksi, and a high-strength steel, with a yield strength of approximately 82 ksi.
All the beams with intermediate grade steel failed in yielding of the reinforcement. Three of the four tests with high strength reinforcement failed in bond, the fourth failing in flexure after bond slip was recorded. The authors state that, " ... when only external bar perimeter was used to calculate bond stress, there was no systematic difference in ultimate bond stress developed by spaced and bundled bars." The authors' conclusion was that bundling reinforcement is a safe detailing practice, as long as each bar is "individually well anchored." They also recommend that bond stress for the bars be computed on the basis of the surface area of the bundle in direct contact with the concrete. No specific recommendations for the design of embedments for bar bundles were made.
The literature search located two other papers dealing with applying code provisions for crack control when detailing bundled bars. While perhaps not directly applicable to questions of development length, the discussions are still interesting in that they involve questions about bundled bar behavior.
In 1972, Nawy5 proposed a method for applying the crack control provisions of ACI 318-71 to bundled bars. The concern was that there was no specific instruction in the code for interpreting the equations for bundled geometries. Nawy proposed that designers modify the equation with parameters which account for the change in exposed bar area when the bars are grouped together.
Luti presented a similar modification in 1974. He felt that Nawy's modification was confusing. Instead, he presented a different method of modifying the code equations, based on slightly different assumptions about how grouping the bars changed their effective perimeter. The argument over which perimeter reflects behavior most accurately is particularly interesting in that it points to a good deal of confusion over the issue: Lutz states, "There is very little experimental information that could be used to aid in evaluating the expressions presented."
2.2.4 Epoxy-Coated Bars
National Bureau of Standards. Mathey and Clifton7 reported the fJrst study on bond of epoxy-coated bars. Bond strength of epoxy-coated bars was compared with uncoated bars in pullout tests. The reinforcing steel used was all #6, Grade 60 bars. Twenty-three bars with varying coating thicknesses, ranging from 1 to 11 mils, and two bars with a coating thickness of 25 mills were used. The results from the coated bars were compared with five uncoated bars. The variables studied were: coating thickness, deformation pattern, and the method for coating application. It was found that the average value of the applied load corresponding to the critical bond strength in bars having epoxy coating thicknesses between 1 and 11 mils was only 6% less than the average load applied to uncoated bars. Based on this critical bond strength it was concluded that bars with coating 1 to 11 mils thick develop acceptable bond strength. In these tests the critical bond strength was considered as the lesser of the bond stress corresponding to a loaded-end slip of 0.01 in. or that corresponding to a free-end slip of 0.002 in. However, the critical bond computed in this way does not give the actual bond strength of the bar. Most of the bars yielded in the tests. Only the two bars having 25 mil coating thickness failed in bond. All other coated bars with 1 to 11 mil coating thicknesses, as well as the uncoated bars, yielded in the tests. Based on this, it was recommended that bars with coating thickness greater than 10 mills not be used.
North Carolina State University. Johnston and Zia8 reported a study in which three slab specimens with uncoated #6 bars and three with coated #6 bars were used to compare strength, crack width and crack spacing width. In order
· to simplify the measurement of cracks, the slabs were tested as simply supported beams with the tensile surface at
11
L
d ~Strain Gages
Beam Specimen
t b-13" -~ t
b=16 5" •. ?"
T ['"13
~ ~"=18" d"=:18.
1~ !I' • -ra ·r I d"=30.4" d"=30. 1
#3 @3.5" #4 @4"
It ~
6 S ace 8-# p 8-#6 Bundl e 8-#8 Space 8-#8 Bundle
t b-11 5" t h=11 5"
• ~ r "I #4@5" d"=35.9"
, , 6-#9 Space 6-#9 Bundle
Figure 2-6 Beam specimen for comparable bundled bar test
12
the top. Little difference in crack widths and spacing, deflections and the ultimate strength was found between coated and uncoated specimens. The failure load of the epoxy-coated bar specimens was about 96% of that of the uncoated specimens. Because of the test setup and the large development length used, the tests resulted in flexural failure and the actual bond strength could not be measured.
Johnston and Zia also tested #6 or #11 bars with three different embedment lengths to compare strength under static and fatigue loading. Steel grade and production heat, concrete mix, and epoxy coating thickness were kept constant. In the beam end specimens the loads were applied directly to the reinforcing bar. Transverse reinforcement was provided. Loading stopped when the bar reached 125% to 140% of the yield stress (long embedded lengths) or when pullout occurred (short embedded lengths). Bond splitting cracks and flexural cracking were developed in epoxy-coated bars at lower load levels than for specimens with uncoated bars. At the same level of stress the epoxycoated bar specimens recorded larger slips. Changing the embedment length or the bar size from #6 to #11 did not influence the performance of the epoxy-coated bar specimens relative to the uncoated bar specimens: In tests that failed in pullout, the epoxy-coated bars developed about 85% of the bond strength of the uncoated bars. Similar results were found in fatigue and static tests. It was recommended that when using bars with epoxy coating, the development be increased by 15%.
The University of Texas. Treece9 tested twenty-one beam specimens to determine the influence of epoxy coating on bond strength, member stiffness and on the spacing and width of cracks. The variables were bar size, concrete strength, casting position and coating thickness. All of the same sized bars were from the same heat of steel and no transverse reinforcement was provided in the splice region. Different combinations of the variables were examined in several series. In each series a control specimen with uncoated bars and a specimen with bars having a 12 mils coating were included. Since a minimum of 5 mils and a maximum of 12 mils are specificed by ASTM A775/A 775M-88a, in some series a third specimen with a 5 mil coating was added. Bars were cast with bars in both top and bottom position.
All tests resulted in a splitting failure at the splice region. Test results showed that only 67% of the bond strength of the uncoated bars was developed in the epoxy-coated bars with an average thickness above 5 mils. This reduction was consistent for all the variables studied. The only variable affecting the bond strength in companion specimens was the presence of the epoxy coating. Little difference in flexural behavior was noted between specimens with and without epoxy coating. It was also found that the specimen with epoxy coating had fewer, but wider cracks than the uncoated specimen.
Based on the test results, Treece recommended a 50% increase in the basic development length where the concrete cover is less than 3db or the bar spacing is less than 6db. Moreover, based on Johnston and Zia's test results, it was also recommended to increase the basic development length by 15% for all other cases where epoxy coating is used. It was also suggested that the combination offactors for top reinforcement and epoxy coating be limited to 1.7. The design recommendations made by Treece were later adopted by ACI 318 in the 1989 Building Code10 with the only modification being an increase of 20% rather than 15% as originally suggested. Since tests did not consider the effect of transverse reinforcement, it was also indicated that more research in this area must be done.
Hamad et al. 11 tested twelve beams to determine the effect of coated transverse reinforcement on the bond strength of epoxy-coated bar splices. All the specimens had bars only in a top cast position. A nominal concrete strength of 4,000 psi was used. The reinforcing steel was Grade 60, #6 and #11 bars. The nominal coating thickness on the longitudinal steel was 8 mils while on the transverse reinforcement, the measured thickness was 9 mils. Again, it was found that the epoxy-coated specimens had wider flexural cracks at larger spacings than with uncoated bars. However, it was noted that the total width of all cracks in both type of specimens (with epoxy-coated and uncoated bars) was about the same. The epoxy coating did not significantly affect the flexural cracking load.
The results showed a relative bond strength ratio of coated to uncoated bars in specimens without transverse reinforcement of 0.74 for #11 bars and 0.67 for #6 bars. However, the bond capacity improved with the increase of
. transverse reinforcement. This improvement was greater for the epoxy-coated bar specimens. For uncoated #11 bars, thebond strength increased 8% using Krr = 1.02, and 15% with Krr = 2.04. On the other hand, for coated #11
13
bars, thebond strength increased 8% using Ku- = 1.02, and 15% with Ktt = 2.04. On the other hand, for coated #11 bars, the bond strength increased 19% with Ktt = 1.02 and 31% with Ktt = 2.04. In the case of #6 bars, the increase in specimens without transverse reinforcement was I 0% with Ku- 1.02, while for specimens with transverse reinforcement, it was 22%. The averge bond ratio for beams with ties in the splice region was 0.81.
Based on their results and on other available data, Hamad et al. suggested modifications to Code provisions.
Purdue University12 Cleary and Ramirez reported the results of an experimental program conducted to evaluate the bond strength of epoxy-coated splices in constant moment regions of slab specimens. The influence of epoxy coating on member stiffness and on the spacing and width of cracks was also studied. Four slab specimens reinforced with epoxy-coated bars and four companion slabs with uncoated bars were tested. All the steel bars were from the same heat and the average coating thickness was 9.0 mils. No transverse reinforcement was used. Different concrete strengths ( 4 and 8 ksi) and embedded lengths were used.
In two of the four uncoated slab specimens the steel bars yielded, and the other two resulted in bond splitting failure. Based on the two specimens that resulted in bond failure, the corresponding specimens with epoxy-coated bars developed 97% and 65% of the bond strength. The former ratio was obtained from a specimen with 12-in. splices and 4-ksi nominal concrete strength. The latter was obtained with 10-in. splices and 8-ksi nominal concrete strength. The large difference was attributed to the concrete strength and to the number of flexural cracks.
As in Treece's tests, it was also noted that there was no loss of slab stiffness due to the epoxy coating and that there were fewer cracks but they were wider in specimens with epoxy-coated bars. Cleary and Ramirez also concluded tl : t there appeared to be no significant difference in the behavior of beams and slabs with epoxy coating designed to fail in a splitting mode of failure. Based on only two slab specimens with high strength concrete (8200 psi), they concluded that there is a need in the design provisions to account for the effect of concrete strength on the reduction of bond strength when epoxy-coated bars are used.
The University of California at Berkeley13 DeVries and Moehle conducted an experimental program to examine the effects of concrete strength, casting position, epoxy coating, and the presence of an anti-bleeding agent on the bond strength of splices. Three nominal concrete strengths of 8, 10, and 15 ksi were tested. The reinforcing steel bars were Grade 60, #6 and #9 bars. All the bars of the same size came from the same heat. The nominal thickness of the epoxy coating was 8 mils. Some of the specimens had transverse reinforcement along the splice region.
The tests showed that bond strength was affected by the casting position and the presence of epoxy coating in the bars. However, it was observed that the effects were not cumulative. DeVries and Moehle concluded that the modification for top to bottom cast bars given in Section 12.2.4.3 of the 1989 ACI Code (ACI 318-89), was not needed. The test results also showed that the bond strength of a splice in either top or bottom cast bars is not significantly altered by the anti-bleeding agent.
bll Shear and Bond Interaction
The effect of a moment gradient along the embedment length of an anchored bar has been studied before, primarily with regard to splices. Tests conducted under Texas Highway Department Project 113, by Ferguson and Briceno14
and Ferguson and Krishnaswamy15, the splice was in a region of varying moment (Figure 2-6). Ferguson and
Krishnaswamy suggested a modification of bond stress for splices in which one end of the splice was at a lower stress using a factor of 2/(1-k), where k is the ratio of the smaller stress to the larger stress at the two ends of the splice. In the work reported in Reference 16 (THO Report 154) it was found it could be assumed to coincide with the failure by splitting of a "cylinder'' of concrete surrounding the bar or bars. A moment gradient should have little or no effect on the stress at failure. An anchored bar, either an individual bar or one bar in a splice, is subjected to the same stresses at the boundaries - maximum at the lead end and zero at the tail end. The validity of the "splitting cylinder" was examined considering the 28 splice tests conducted in Project 113. There was no tendency for the bond stresses to change ask changed. It was concluded that Eq. (2.6) slightly underestimates the strength of splices subjected to a moment gradient and did change the basic approach used in deriving Eq. (2.6) was not
14
changed. It should be noted that in tests with the splice in the region of variable moment, the splices were subjected to a fairly low constant shear force. The performance in actual design situations, high shears (or steep moment gradients) are unlikely along short splice or development lengths and it is difficult to create such conditions in test specimens without changing the boundary conditions and introducing loads that do not represent typical bridge design conditions.
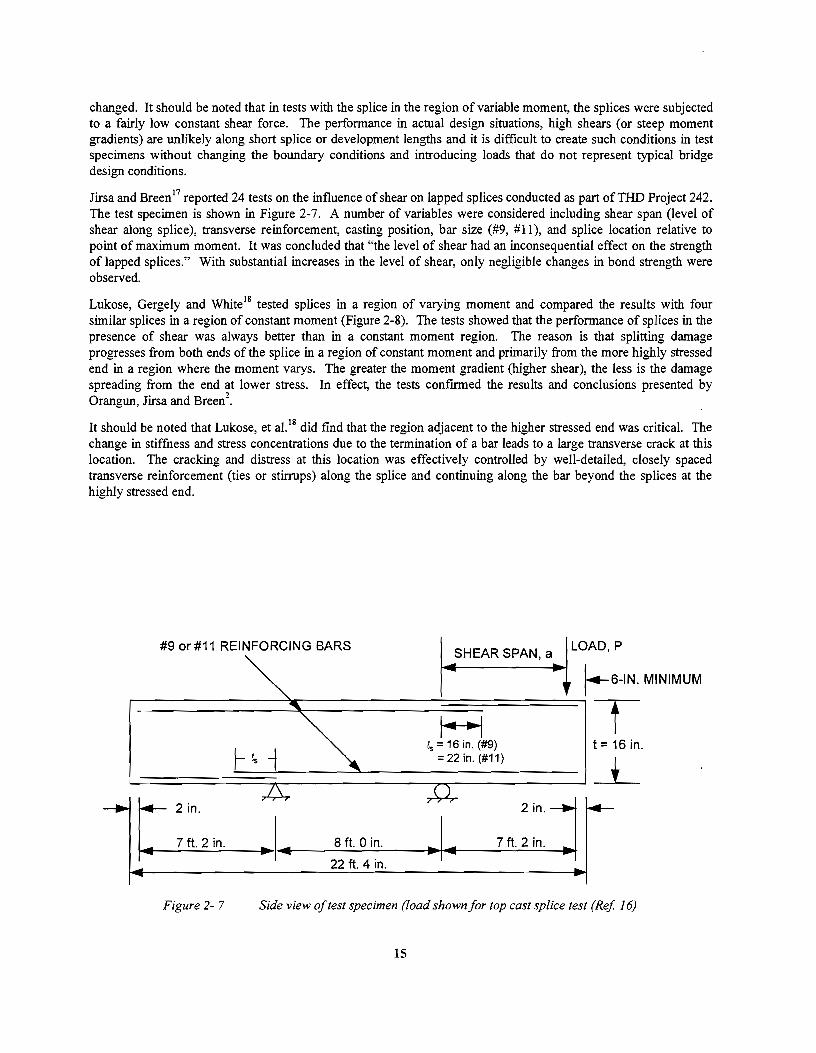
Jirsa and Breen17 reported 24 tests on the influence of shear on lapped splices conducted as part ofTHD Project 242. The test specimen is shown in Figure 2-7. A number of variables were considered including shear span (level of shear along splice), transverse reinforcement, casting position, bar size (#9, #11), and splice location relative to point of maximum moment. It was concluded that "the level of shear had an inconsequential effect on the strength of lapped splices." With substantial increases in the level of shear, only negligible changes in bond strength were observed.
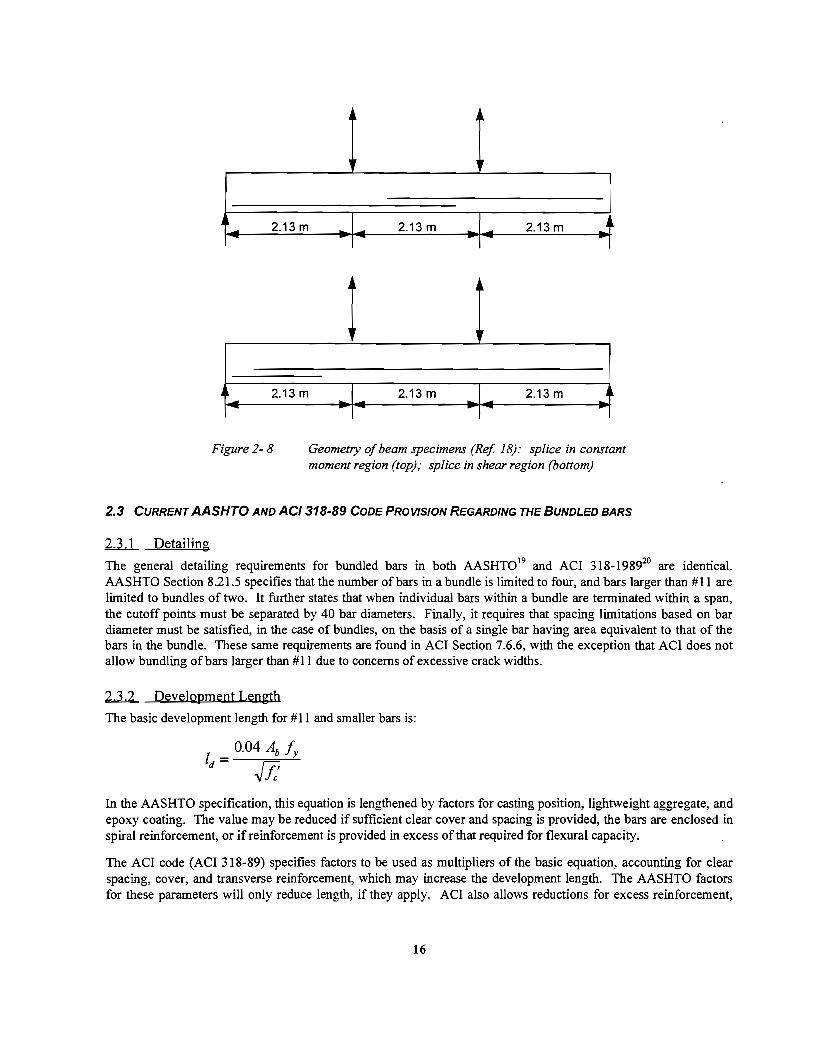
Lukose, Gergely and White18 tested splices in a region of varying moment and compared the results with four similar splices in a region of constant moment (Figure 2-8). The tests showed that the performance of splices in the presence of shear was always better than in a constant moment region. The reason is that splitting damage progresses from both ends of the splice in a region of constant moment and primarily from the more highly stressed end in a region where the moment varys. The greater the moment gradient (higher shear), the less is the damage spreading from the end at lower stress. In effect, the tests confirmed the results and conclusions presented by Orangun, Jirsa and Breen2
•
It should be noted that Lukose, et al. 18 did fmd that the region adjacent to the higher stressed end was critical. The change in stiffness and stress concentrations due to the termination of a bar leads to a large transverse crack at this location. The cracking and distress at this location was effectively controlled by well-detailed, closely spaced transverse reinforcement (ties or stirrups) along the splice and continuing along the bar beyond the splices at the highly stressed end.
#9 or #11 REINFORCING BARS SHEAR SPAN, a LOAD, P
r-6-IN. MINIMUM
~-=====~====~~~==~~ 15 = 16 in. (#9)
l===~~~~=~~l~====~====~=2=2=in.=(#=11=)=====J~ t = 16 in.
7ft. 2 in. 8ft. 0 in.
2 in j 7ft. 2 in.
2 in.
22ft. 4 in.
Figure 2- 7 Side view of test specimen (load shown for top cast splice test (Rej 16)
15
2.13 m
2.13 m
Figure 2-8
~
11r
2.13 m 2.13 m J
I I
! I 2.13 m 2.13 m
I I
Geometry of beam specimens (Ref 18): splice in constant moment region (top); splice in shear region (bottom)
2.3 CURRENT AASHTO AND AC/318-89 CODE PROVISION REGARDING THE BUNDLED BARS
b.1..L Detailing
The general detailing requirements for bundled bars in both AASHT019 and ACI 318-198920 are identical. AASHTO Section 8.21.5 specifies that the number of bars in a bundle is limited to four, and bars larger than #11 are limited to bundles of two. It further states that when individual bars within a bundle are terminated within a span, the cutoff points must be separated by 40 bar diameters. Finally, it requires that spacing limitations based on bar diameter must be satisfied, in the case of bundles, on the basis of a single bar having area equivalent to that of the bars in the bundle. These same requirements are found in ACI Section 7.6.6, with the exception that ACI does not allow bundling of bars larger than #11 due to concerns of excessive crack widths.
2..12.. Development Length
The basic development length for #11 and smaller bars is:
In the AASHTO specification, this equation is lengthened by factors for casting position, lightweight aggregate, and epoxy coating. The value may be reduced if sufficient clear cover and spacing is provided, the bars are enclosed irl spiral reirlforcement, or if reirlforcement is provided in excess of that required for flexural capacity.
The ACI code (ACI 318-89) specifies factors to be used as multipliers of the basic equation, accountirlg for clear spacing, cover, and transverse reinforcement, which may increase the development length. The AASHTO factors for these parameters will only reduce length, if they apply. ACI also allows reductions for excess reirlforcement,
16
wide bar spacing and cover, and both spiral reinforcement and closely spaced sitrrups. The factors in the ACI code are not all the same as those in AASHTO.
Presently, very little is said in addition to this in the codes regarding the development of bundled bars. AASHTO Section 8.28 states:
The development length of individual bars within a bundle, in tension or compression, shall be that for the individual bar, increased by 20 percent for a three-bar bundle, and 33 percent for a four-bar bundle.
The ACI code contains the same provisions in Section 12.4. These provisions are based on the amount of surface area on the inside of the bundle, which does not have direct contact with the surrounding concrete and therefore cannot transfer stress through bond.
2.J.]_ Epoxy-Coated Reinforcement
Section 12.2.4.3 of the 1989 ACI code10 specifies that for epoxy-coated bars with cover less than 3db with clear spacing between bars of 6db, the development length should be multiplied by 1.5, and for all other conditions should be multiplied by 1.2. It is also stated that the product of the factors for top casting and for epoxy coating needs not to be taken greater than 1. 7.
The 1992 AASHTO Specifications20 use the same criteria; however, the 1.2 factor for all other cases is taken as 1.15 as suggested by Treece.
17

CHAPTER3
EXPERIMENTAL PROGRAM
3.1 VARIABLES
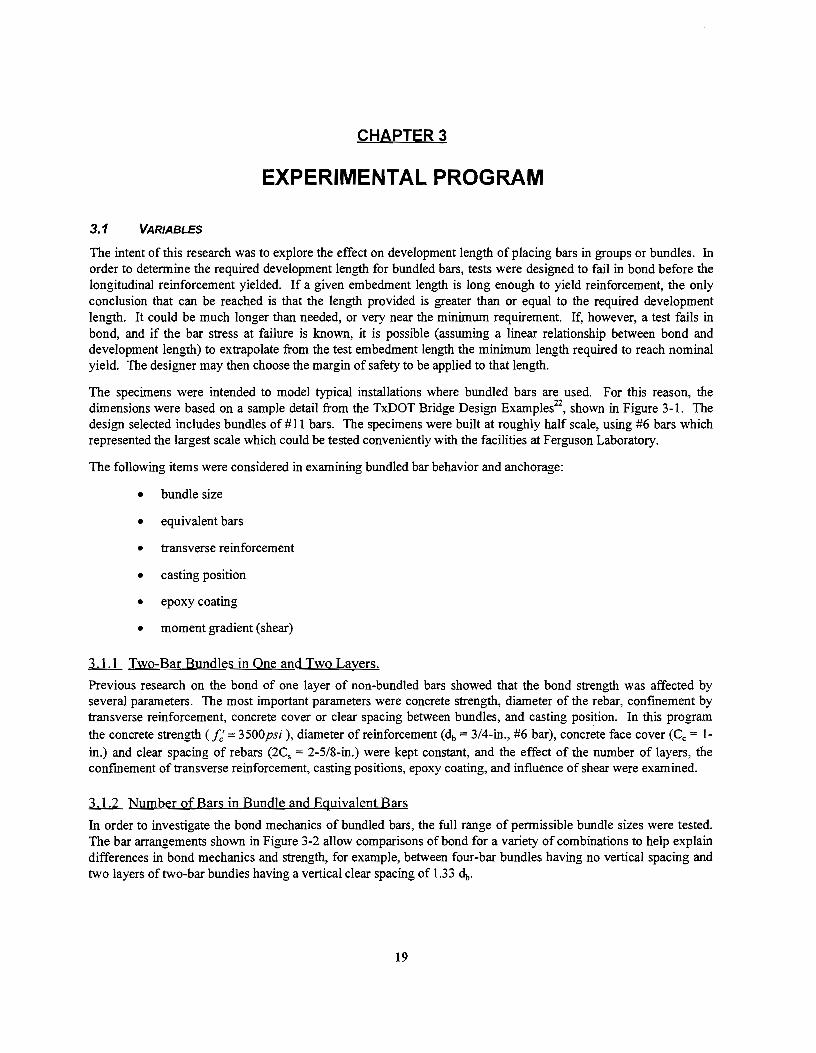
The intent of this research was to explore the effect on development length of placing bars in groups or bundles. In order to determine the required development length for bundled bars, tests were designed to fail in bond before the longitudinal reinforcement yielded. If a given embedment length is long enough to yield reinforcement, the only conclusion that can be reached is that the length provided is greater than or equal to the required development length. It could be much longer than needed, or very near the minimum requirement. If, however, a test fails in bond, and if the bar stress at failure is known, it is possible (assuming a linear relationship between bond and development length) to extrapolate from the test embedment length the minimum length required to reach nominal yield. The designer may then choose the margin of safety to be applied to that length.
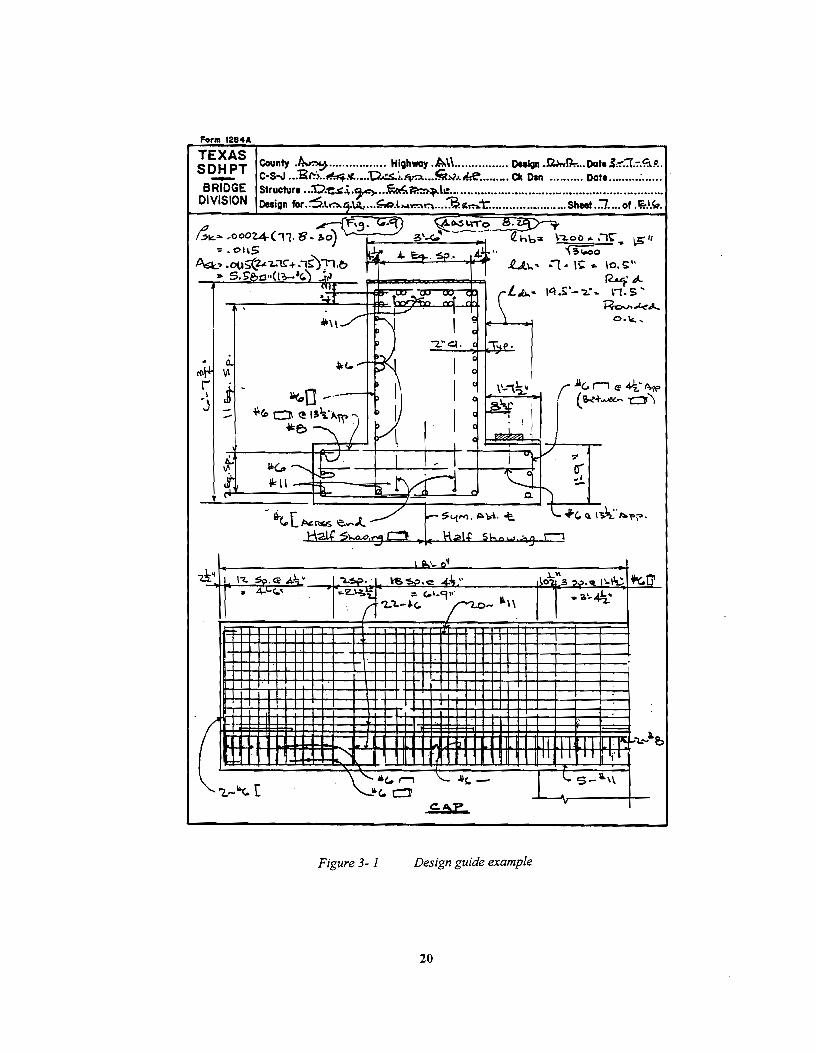
The specimens were intended to model typical installations where bundled bars are used. For this reason, the dimensions were based on a sample detail from the TxDOT Bridge Design Examples22
, shown in Figure 3-1. The design selected includes bundles of# 11 bars. The specimens were built at roughly half scale, using #6 bars which represented the largest scale which could be tested conveniently with the facilities at Ferguson Laboratory.
The following items were considered in examining bundled bar behavior and anchorage:
• bundle size
• equivalent bars
• transverse reinforcement
• casting position
• epoxy coating
• moment gradient (shear)
lJ....l_ Two-Bar Bundles in One and Two Layers.
Previous research on the bond of one layer of non-bundled bars showed that the bond strength was affected by several parameters. The most important parameters were concrete strength, diameter of the rebar, confmement by transverse reinforcement, concrete cover or clear spacing between bundles, and casting position. In this program the concrete strength ( 1: = 3500psi ), diameter of reinforcement (db= 3/4-in., #6 bar), concrete face cover (Cc = lin.) and clear spacing of rebars (2C5 = 2-5/8-in.) were kept constant, and the effect of the number of layers, the confmement of transverse reinforcement, casting positions, epoxy coating, and influence of shear were examined .
.3.J..2 Number of Bars in Bundle and Equivalent Bars
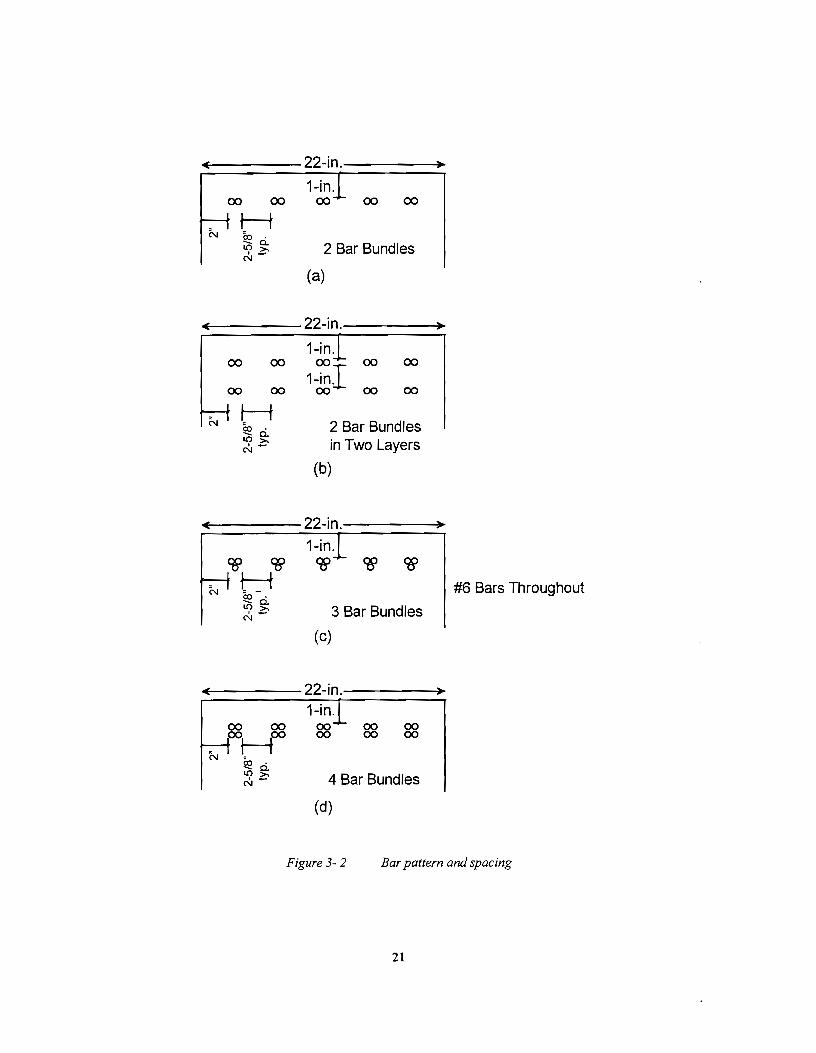
In order to investigate the bond mechanics of bundled bars, the full range of permissible bundle sizes were tested. The bar arrangements shown in Figure 3-2 allow comparisons of bond for a variety of combinations to help explain differences in bond mechanics and strength, for example, between four-bar bundles having no vertical spacing and two layers of two-bar bundles having a vertical clear spacing of 1.33 db.
19
Form 1284A
-tt~
(
~o ---~- ..... - ~G:o 0 <! ll~'A~
*'e>
\ &1.•. o• \"t. ~-<t A..\;.' ... ~.- \'SS:>.c .oi--l.,. " 4-\,.<..• .. oz..~~ .. "''·9"'
- ·. f "2..1.-~G.
~
~--~
'" ~
~ hb= \.4..00 ... ,1\;; ~·/ i'l>~oooe>o ..
.t..t"' ~ :'1 ~ I!; .... 1o. !;"
- .. \, I m
1'2..ufP.. 1'1.£'-".2."~ n.s ..
K,:,..., • .,Lc,l....
.)...\\ t}ci'j ~~~':..~ ""<..0'
I ...... ~
Jl .ll. .II .I I~ :'l.-'tr.
II I I I I 'fl
'"1..-"(. [ ~·c.,..-, .II"- "- s- .. \\
... (. c:l' ..... v
Figure 3-1 Design guide example
20
22-in.
1-in. 00 00 00 00 00
t--t N ~ci
1.0>. 2 Bar Bundles ~-
(a)
22-in.
1-in. 00 00 00 00 00
1-ini 00 00 00 00 00
N t--t 2 Bar Bundles ~ci
1.0>. in Two Layers c!J-
(b)
22-in.
1-in. ~ ~ ~ ~ ~
N t-t #6 Bars Throughout &:>- . ....... c. 1.0>. 3 Bar Bundles c!J-
(c)
22-in. 1-in.
00 00 00 00 00 oor-foo 00 00 00
N ~ci 1.0>. 4 Bar Bundles c!J-
(d)
Figure 3-2 Bar pattern and spacing
21
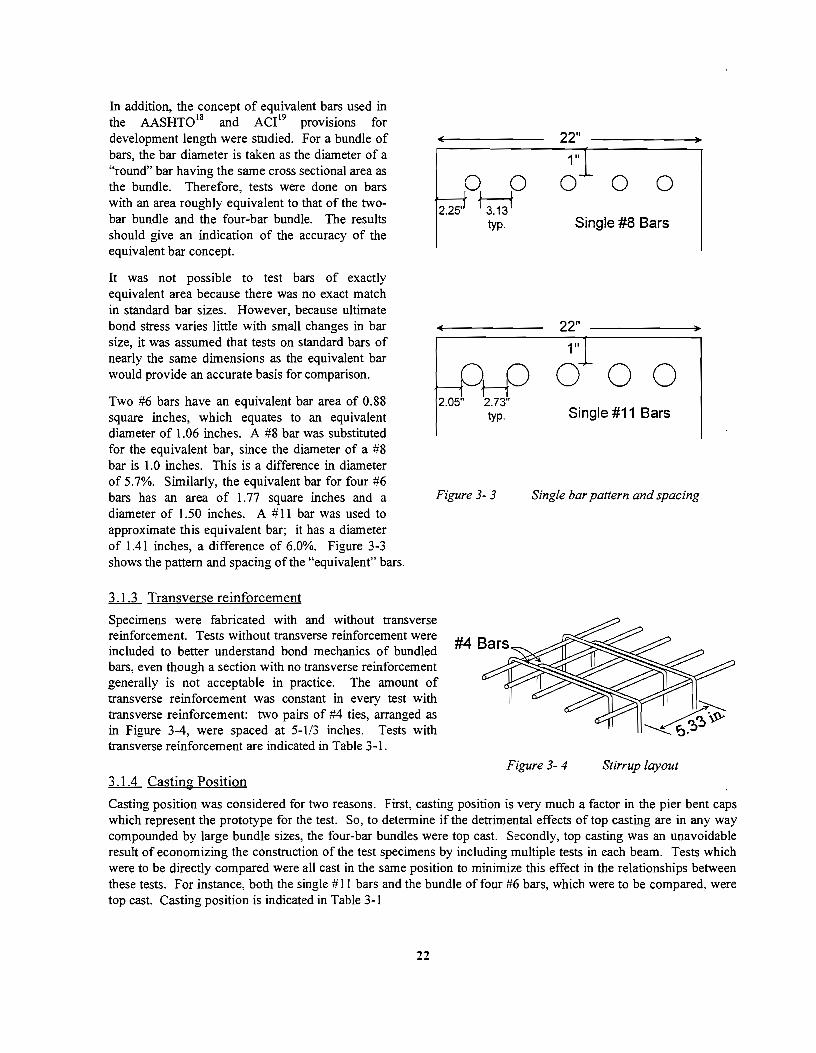
In addition, the concept of equivalent bars used in the AASHT018 and ACI19 provisions for development length were studied. For a bundle of bars, the bar diameter is taken as the diameter of a "round" bar having the same cross sectional area as the bundle. Therefore, tests were done on bars with an area roughly equivalent to that of the twobar bundle and the four-bar bundle. The results should give an indication of the accuracy of the equivalent bar concept.
It was not possible to test bars of exactly equivalent area because there was no exact match in standard bar sizes. However, because ultimate bond stress varies little with small changes in bar size, it was assumed that tests on standard bars of nearly the same dimensions as the equivalent bar would provide an accurate basis for comparison.
2.25'
0 0 g typ.
Two #6 bars have an equivalent bar area of 0.88 square inches, which equates to an equivalent diameter of I.06 inches. A #8 bar was substituted for the equivalent bar, since the diameter of a #8 bar is 1.0 inches. This is a difference in diameter
2.05" 2.73" typ.
of 5.7%. Similarly, the equivalent bar for four #6 bars has an area of I. 77 square inches and a diameter of 1.50 inches. A #II bar was used to approximate this equivalent bar; it has a diameter
Figure 3-3
of 1.41 inches, a difference of 6.0%. Figure 3-3 shows the pattern and spacing of the "equivalent" bars .
.1J.j_ Transverse reinforcement
Specimens were fabricated with and without transverse reinforcement. Tests without transverse reinforcement were included to better understand bond mechanics of bundled bars, even though a section with no transverse reinforcement generally is not acceptable in practice. The amount of transverse reinforcement was constant in every test with transverse reinforcement: two pairs of #4 ties, arranged as in Figure 3-4, were spaced at 5-l/3 inches. Tests with transverse reinforcement are indicated in Table 3-1.
22"
1"
0 0 0
Single #8 Bars
22" 1"
0 00 Single #11 Bars
Single bar pattern and spacing
Figure 3-4 Stirrup layout 3 .1.4 Castin2 Position
Casting position was considered for two reasons. First, casting position is very much a factor in the pier bent caps which represent the prototype for the test. So, to determine if the detrimental effects of top casting are in any way compounded by large bundle sizes, the four-bar bundles were top cast. Secondly, top casting was an unavoidable result of economizing the construction of the test specimens by including multiple tests in each beam. Tests which were to be directly compared were all cast in the same position to minimize this effect in the relationships between these tests. For instance, both the single #II bars and the bundle of four #6 bars, which were to be compared, were top cast. Casting position is indicated in Table 3-I
22
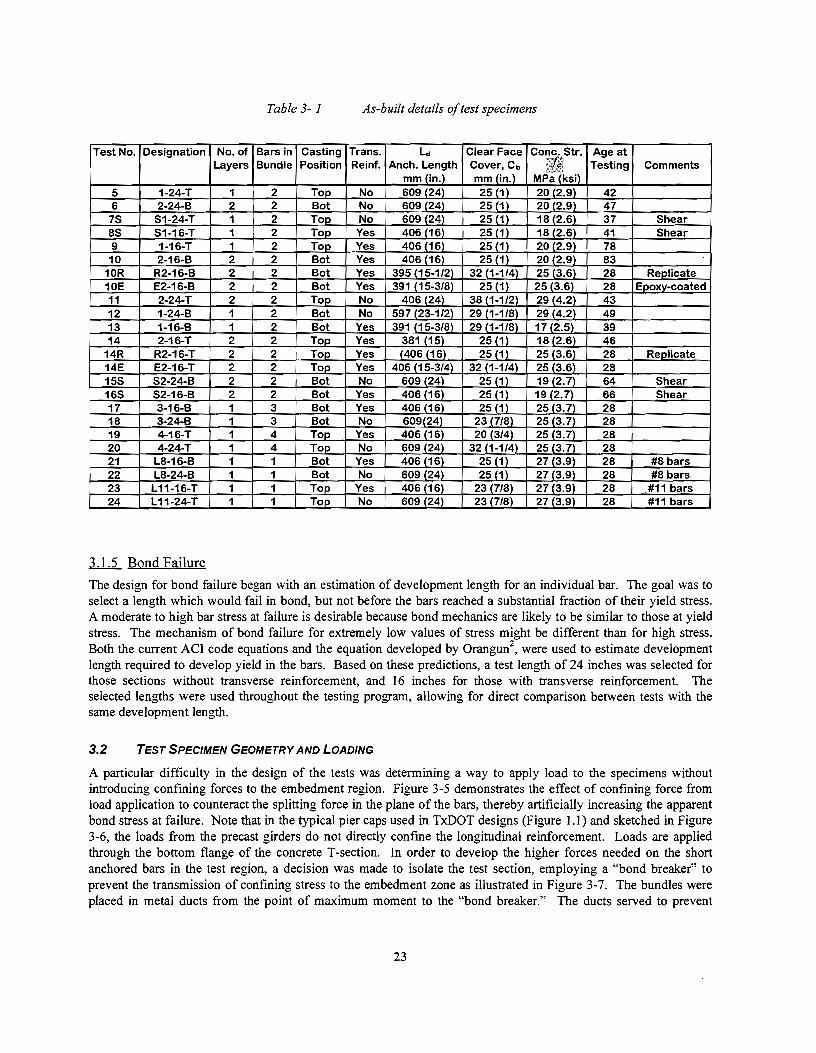
Table 3-1 As-built details of test specimens
Test No. Designation No. of Bars in Casting Trans. Ld Clear Face Cone. Str. Age at Layers Bundle Position Reinf. Anch. Length Cover, Cb ;rt~ Testing Comments
mm (in.) mm (in.) MP;(ksi) 5 1-24-T 1 2 Top No 609 (24) 25 (1) 20 (2.9) 42 6 2-24-B 2 2 Bot No 609 (24) 25 (1) 20 (2.9) 47
I 7S S1-24-T 1 2 Top No 609 (24) 25 (1) 18 (2.6) 37 Shear 8S S1-16-T 1 2 Top Yes 406 {16) 25 {1) 18 (2.6) 41 Shear 9 1-16-T 1 2 Top Yes 406 (16) 25 (1) 20 (2.9) 78
! 10 2-16-B 2 2 Bot Yes 406 (16) 25 (1) 20 (2.9) 83 10R R2-16·B 2 2 Bot Yes 395 (15-1/2) 32 (1-114) 25 (3.6) 28 Replicate
i 10E E2-16·B 2 2 Bot Yes 391 (15-3/8) 25 (1) 25 (3.6) 28 Epoxy-coated I 11 2·24-T 2 2 Top No 406 (24) 38 (1-1/2) 29 (4.2) 43
12 1·24-B 1 2 Bot No 597 (23-1/2) 29 (1-1/8) 29 (4.2) 49 13 1-16-B 1 2 Bot Yes 391 (15-3/8) 29 (1-1/8) 17 (2.5) 39 14 2-16-T 2 2 Top Yes 381 (15) 25 (11 18 (_2.6) 46
14R R2-16-T 2 2 Top Yes (406 (16) 25 (1) 25 (3.6) 28 Replicate 14E E2-16-T 2 2 Top Yes 406 (15-3/4) 32 (1-1/4) 25 (3.6) 28 155 S2-24-B 2 2 Bot No 609 (24) 25 (1) 19 (2.7) 64 Shear 16S 52-16-B 2 2 Bot Yes 406 (16) 25 (1) 19 (2. 7) 66 Shear 17 3-16-B 1 3 Bot Yes 406 (16) 25 (1) 25 (3.7) 28 18 3-24-B 1 3 Bot No 609(24) 23{7/81 25 (3.7) 28 19 4-16-T 1 4 Top Yes 406 (16) 20 (3/4) 25 (3.7) 28 20 4-24-T 1 4 Top No 609 (24) 32 (1-1/4) 25 (3.7) 28 21 L8-16-B 1 1 Bot Yes 406 (16) 25(11 27 (3.9) 28 #8 bars 22 L8-24-B 1 1 Bot No 609 (24) 25 (1) 27 (3.9) 28 #8 bars 23 L11-16-T 1 1 Top Yes 406 (16) 23 (7/8) 27 (3.9) 28 #11 bars 24 L11-24-T 1 1 Top No 609 {24) 23 {7/8) 27 (3.9) 28 #11 bars
lJ..i. Bond Failure
The design for bond failure began with an estimation of development length for an individual bar. The goal was to select a length which would fail in bond, but not before the bars reached a substantial fraction of their yield stress. A moderate to high bar stress at failure is desirable because bond mechanics are likely to be similar to those at yield stress. The mechanism of bond failure for extremely low values of stress might be different than for high stress. Both the current ACI code equations and the equation developed by Orangun2
, were used to estimate development length required to develop yield in the bars. Based on these predictions, a test length of 24 inches was selected for those sections without transverse reinforcement, and 16 inches for those with transverse reinforcement. The selected lengths were used throughout the testing program, allowing for direct comparison between tests with the same development length.
3.2 TEST SPECIMEN GEOMETRY AND LOADING
A particular difficulty in the design of the tests was determining a way to apply load to the specimens without introducing confining forces to the embedment region. Figure 3-5 demonstrates the effect of confining force from load application to counteract the splitting force in the plane of the bars, thereby artificially increasing the apparent bond stress at failure. Note that in the typical pier caps used in TxDOT designs (Figure 1.1) and sketched in Figure 3-6, the loads from the precast girders do not directly confme the longitudinal reinforcement. Loads are applied through the bottom flange of the concrete T-section. In order to develop the higher forces needed on the short anchored bars in the test region, a decision was made to isolate the test section, employing a "bond breaker" to prevent the transmission of confining stress to the embedment zone as illustrated in Figure 3-7. The bundles were placed in metal ducts from the point of maximum moment to the "bond breaker." The ducts served to prevent
23
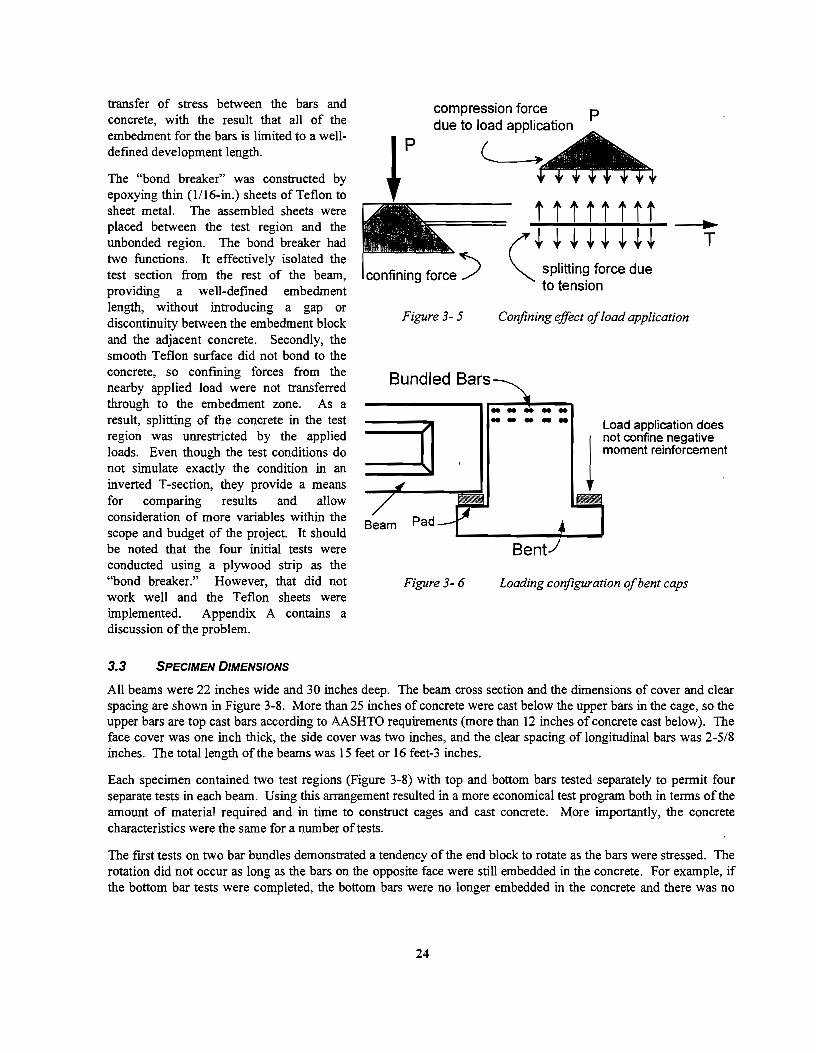
transfer of stress between the bars and concrete, with the result that all of the embedment for the bars is limited to a welldefmed development length.
The "bond breaker" was constructed by epoxying thin (1/16-in.) sheets of Teflon to sheet metal. The assembled sheets were placed between the test region and the unbonded region. The bond breaker had two functions. It effectively isolated the test section from the rest of the beam, providing a well-defmed embedment length, without introducing a gap or discontinuity between the embedment block and the adjacent concrete. Secondly, the smooth Teflon surface did not bond to the concrete, so confming forces from the nearby applied load were not transferred through to the embedment zone. As a result, splitting of the concrete in the test region was unrestricted by the applied loads. Even though the test conditions do not simulate exactly the condition in an inverted T -section, they provide a means for comparing results and allow consideration of more variables within the scope and budget of the project. It should be noted that the four initial tests were conducted using a plywood strip as the "bond breaker." However, that did not work well and the Teflon sheets were implemented. Appendix A contains a discussion of the problem.
3.3 SPECIMEN DIMENSIONS
p
compression force due to load application
(_ _ __.-j
confining force)
p
T
Figure 3-5 Confining effect of load application
Bundled Bars
Figure 3-6
.. -.. -- ....
Bent
Load application does
1 not confine negative moment reinforcement
Loading configuration of bent caps
All beams were 22 inches wide and 30 inches deep. The beam cross section and the dimensions of cover and clear spacing are shown in Figure 3-8. More than 25 inches of concrete were cast below the upper bars in the cage, so the upper bars are top cast bars according to AASHTO requirements (more than 12 inches of concrete cast below). The face cover was one inch thick, the side cover was two inches, and the clear spacing of longitudinal bars was 2-5/8 inches. The total length of the beams was 15 feet or 16 feet-3 inches.
Each specimen contained two test regions (Figure 3-8) with top and bottom bars tested separately to permit four separate tests in each beam. Using this arrangement resulted in a more economical test program both in terms of the amount of material required and in time to construct cages and cast concrete. More importantly, the concrete characteristics were the same for a number of tests.
The first tests on two bar bundles demonstrated a tendency of the end block to rotate as the bars were stressed. The rotation did not occur as long as the bars on the opposite face were still embedded in the concrete. For example, if the bottom bar tests were completed, the bottom bars were no longer embedded in the concrete and there was no
24
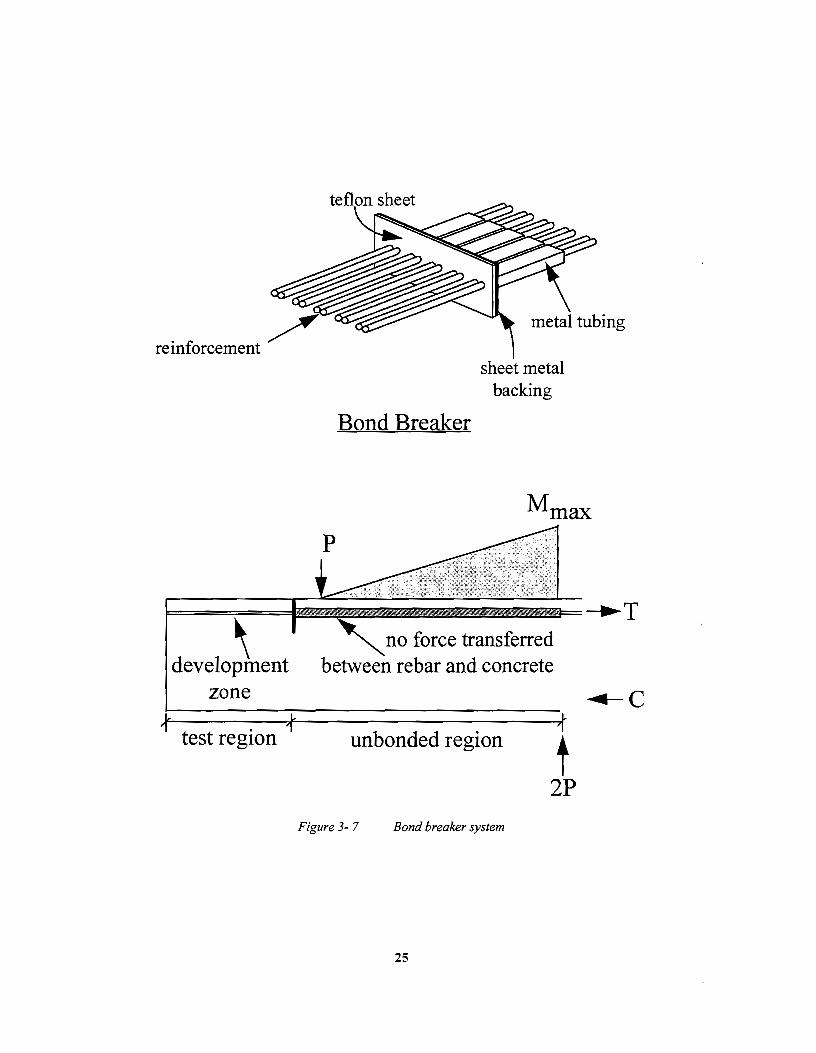
·~ / rem1orcement
p
Bond Breaker
sheet metal backing
F==F~~~--------~-.T \ 'no force transferred
development between rebar and concrete zone
test region unbonded region t 2P
Figure 3- 7 Bond breaker system
25
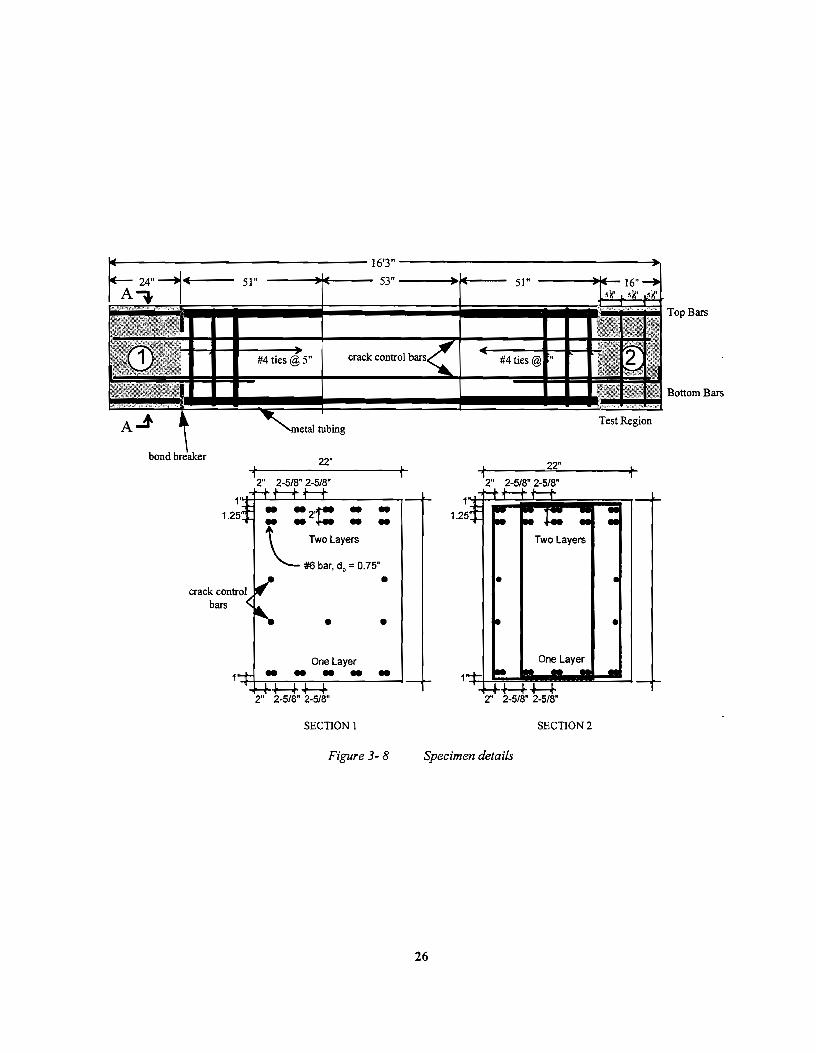
51"
1.25
crack control bars
2"
16'3"
53"
crack control
tubing
22"
2-5/8" 2-518"
--•
• •
One Layer
1'-t-lr-i'"o--o-.--...---------2"
SECTION 1
Figure 3-8
51"
Top Bars
Bottom Bars
Test Region
22"
2" 2-518" 2-5/8"
1.25
SECTION2
Specimen details
26
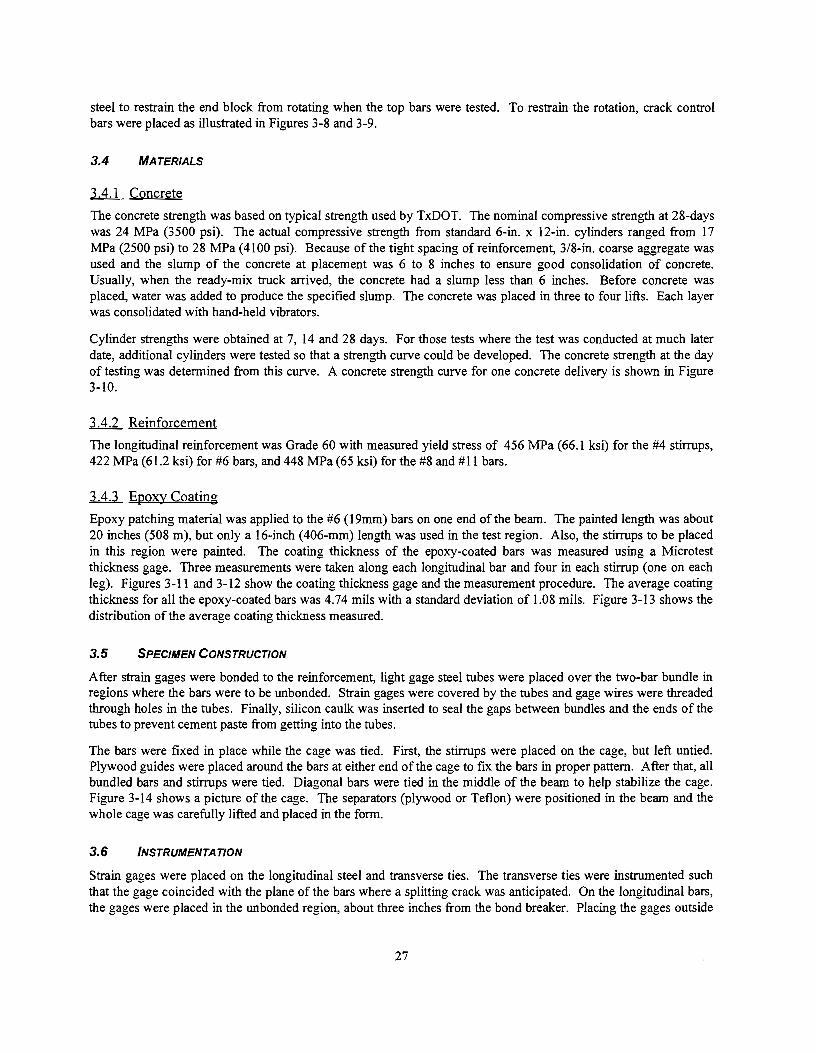
steel to restrain the end block from rotating when the top bars were tested. To restrain the rotation, crack control bars were placed as illustrated in Figures 3-8 and 3-9.
3.4 MATERIALS
lll. Concrete
The concrete strength was based on typical strength used by TxDOT. The nominal compressive strength at 28-days was 24 MPa (3500 psi). The actual compressive strength from standard 6-in. x 12-in. cylinders ranged from 17 MPa (2500 psi) to 28 MPa ( 4100 psi). Because of the tight spacing of reinforcement, 3/8-in. coarse aggregate was used and the slump of the concrete at placement was 6 to 8 inches to ensure good consolidation of concrete. Usually, when the ready-mix truck arrived, the concrete had a slump less than 6 inches. Before concrete was placed, water was added to produce the specified slump. The concrete was placed in three to four lifts. Each layer was consolidated with hand-held vibrators.
Cylinder strengths were obtained at 7, 14 and 28 days. For those tests where the test was conducted at much later date, additional cylinders were tested so that a strength curve could be developed. The concrete strength at the day of testing was determined from this curve. A concrete strength curve for one concrete delivery is shown in Figure 3-10 .
.3.A2._ Reinforcement
The longitudinal reinforcement was Grade 60 with measured yield stress of 456 MPa (66.1 ksi) for the #4 stirrups, 422 MPa (61.2 ksi) for #6 bars, and 448 MPa (65 ksi) for the #8 and #ll bars.
3...4.J_ Epoxy Coating
Epoxy patching material was applied to the #6 (19mm) bars on one end of the beam. The painted length was about 20 inches (508 m), but only a 16-inch (406-mm) length was used in the test region. Also, the stirrups to be placed in this region were painted. The coating thickness of the epoxy-coated bars was measured using a Microtest thickness gage. Three measurements were taken along each longitudinal bar and four in each stirrup (one on each leg). Figures 3-11 and 3-12 show the coating thickness gage and the measurement procedure. The average coating thickness for all the epoxy-coated bars was 4.74 mils with a standard deviation of 1.08 mils. Figure 3-13 shows the distribution of the average coating thickness measured.
3.5 SPECIMEN CONSTRUCTION
After strain gages were bonded to the reinforcement, light gage steel tubes were placed over the two-bar bundle in regions where the bars were to be unbonded. Strain gages were covered by the tubes and gage wires were threaded through holes in the tubes. Finally, silicon caulk was inserted to seal the gaps between bundles and the ends of the tubes to prevent cement paste from getting into the tubes.
The bars were fixed in place while the cage was tied. First, the stirrups were placed on the cage, but left untied. Plywood guides were placed around the bars at either end of the cage to fix the bars in proper pattern. After that, all bundled bars and stirrups were tied. Diagonal bars were tied in the middle of the beam to help stabilize the cage. Figure 3-14 shows a picture of the cage. The separators (plywood or Teflon) were positioned in the beam and the whole cage was carefully lifted and placed in the form.
3.6 INSTRUMENTATION
Strain gages were placed on the longitudinal steel and transverse ties. The transverse ties were instrumented such that the gage coincided with the plane of the bars where a splitting crack was anticipated. On the longitudinal bars, the gages were placed in the unbonded region, about three inches from the bond breaker. Placing the gages outside
27
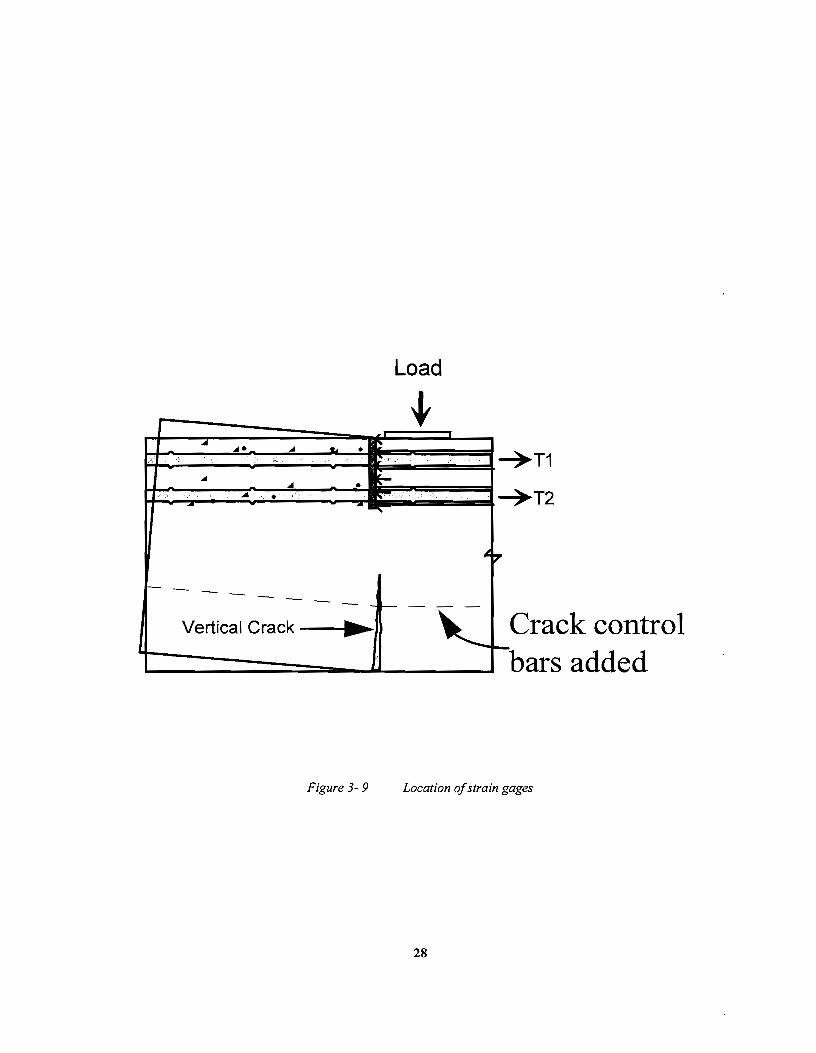
- .. .... ... r-:- c' '
... ... ~ ... • -
f-- - - - - -Vertical Crack
t. • , .c·
• .
- --..
Figure 3-9
Load
:c
t-~""'" ...
1--
··. --'-
.· . ...
I.
-~
~T1
~T2
P'
Crack control bars added
I'-
Location of strain gages
28
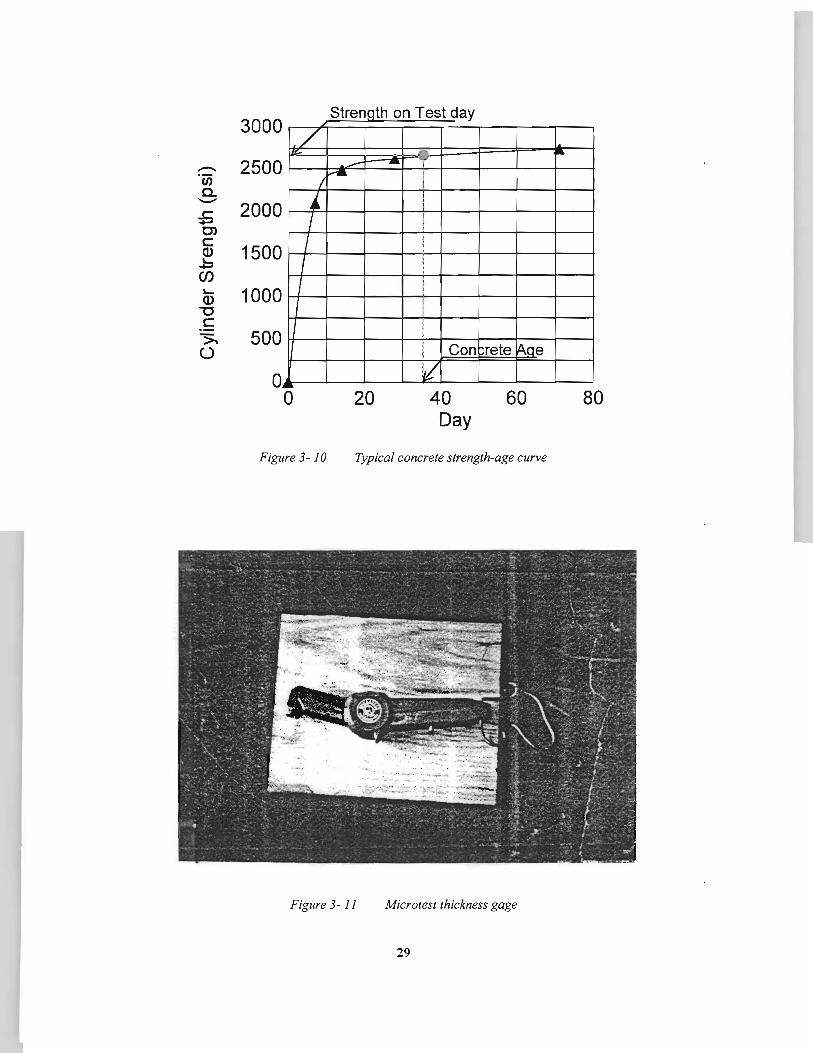
-·en a. --:5 C> c Q) !..... .... en
!..... Q)
"'0 c >. 0
3000
2500
2000
1500
1000
500
0 0
St th T t d renQl on es ay
/ ~ -- -
/,....
• I I I I L
20
I
I
I I
I
I I
Con
v 40 Day
rete ~ae
60
Figure 3- .J 0 Typical concrete strength-age curve
Figure 3- 11 Microtest thickness gage
29
~
80
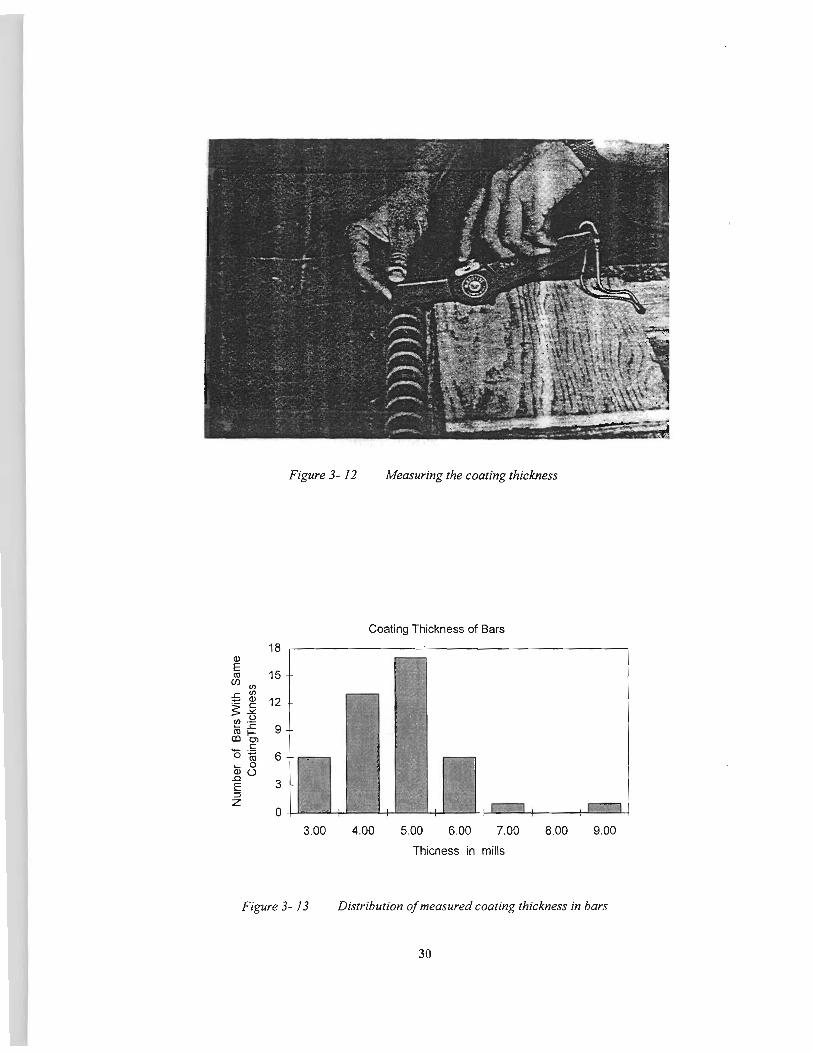
Figure 3- 12 Measuring the coating thickness
Coating Thickness of Bars
3.00 4.00 5.00 6.00 7.00 8.00 9.00
Thicness in mills
Figure 3- 13 Distribution of measured coating thickness in bars
30
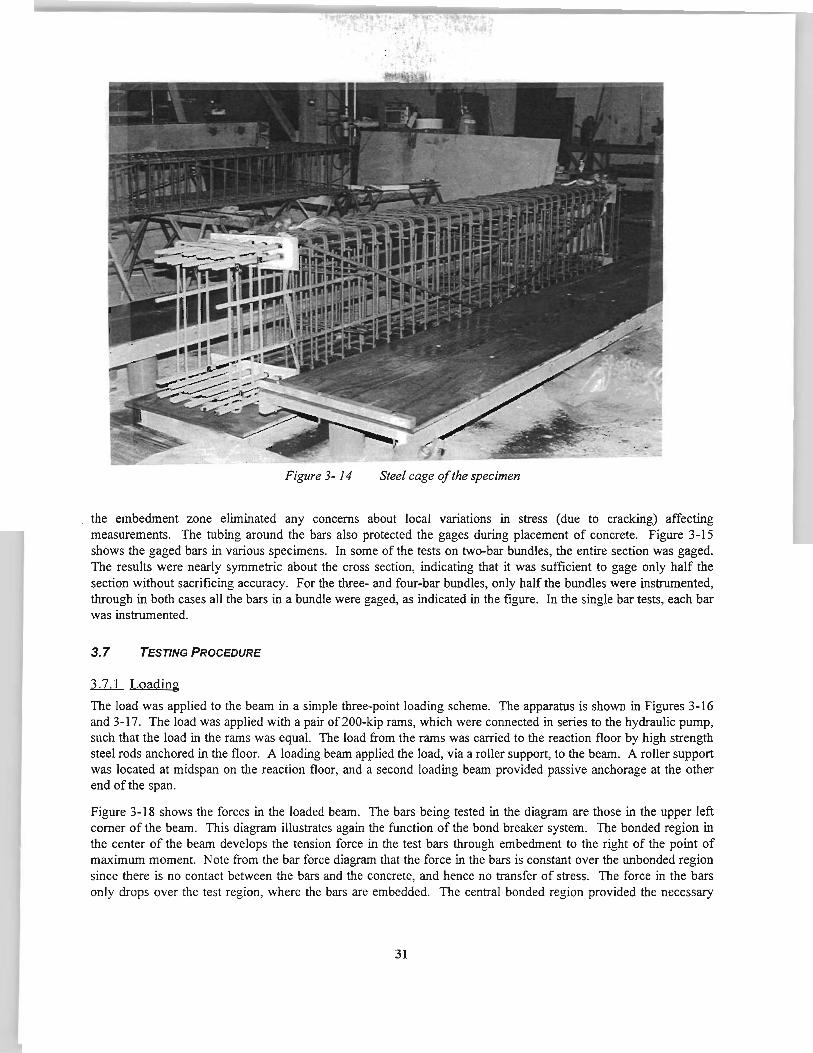
Figure 3-14 Steel cage of the specimen
the embedment zone eliminated any concerns about local variations in stress (due to cracking) affecting measurements. The tubing around the bars also protected the gages during placement of concrete. Figure 3-15 shows the gaged bars in various specimens. In some of the tests on two-bar bundles, the entire section was gaged. The results were nearly symmetric about the cross section, indicating that it was sufficient to gage only half the section without sacrificing accuracy. For the three- and four-bar bundles, only half the bundles were instrumented, through in both cases all the bars in a bundle were gaged, as indicated in the figure. In the single bar tests, each bar was instrumented.
3. 7 TESTING PROCEDURE
121__ Loading
The load was applied to the beam in a simple three-point loading scheme. The apparatus is shown in Figures 3-16 and 3-17. The load was applied with a pair of 200-kip rams, which were connected in series to the hydraulic pump, such that the load in the rams was equal. The load from the rams was carried to the reaction floor by high strength steel rods anchored in the floor. A loading beam applied the load, via a roller support, to the beam. A roller support was located at midspan on the reaction floor, and a second loading beam provided passive anchorage at the other end of the span.
Figure 3-18 shows the forces in the loaded beam. The bars being tested in the diagram are those in the upper left comer of the beam. This diagram illustrates again the function of the bond breaker system. The bonded region in the center of the beam develops the tension force in the test bars through embedment to the right of the point of maximum moment. Note from the bar force diagram that the force in the bars is constant over the unbonded region since there is no contact between the bars and the concrete, and hence no transfer of stress. The force in the bars only drops over the test region, where the bars are embedded. The central bonded region provided the necessary
31
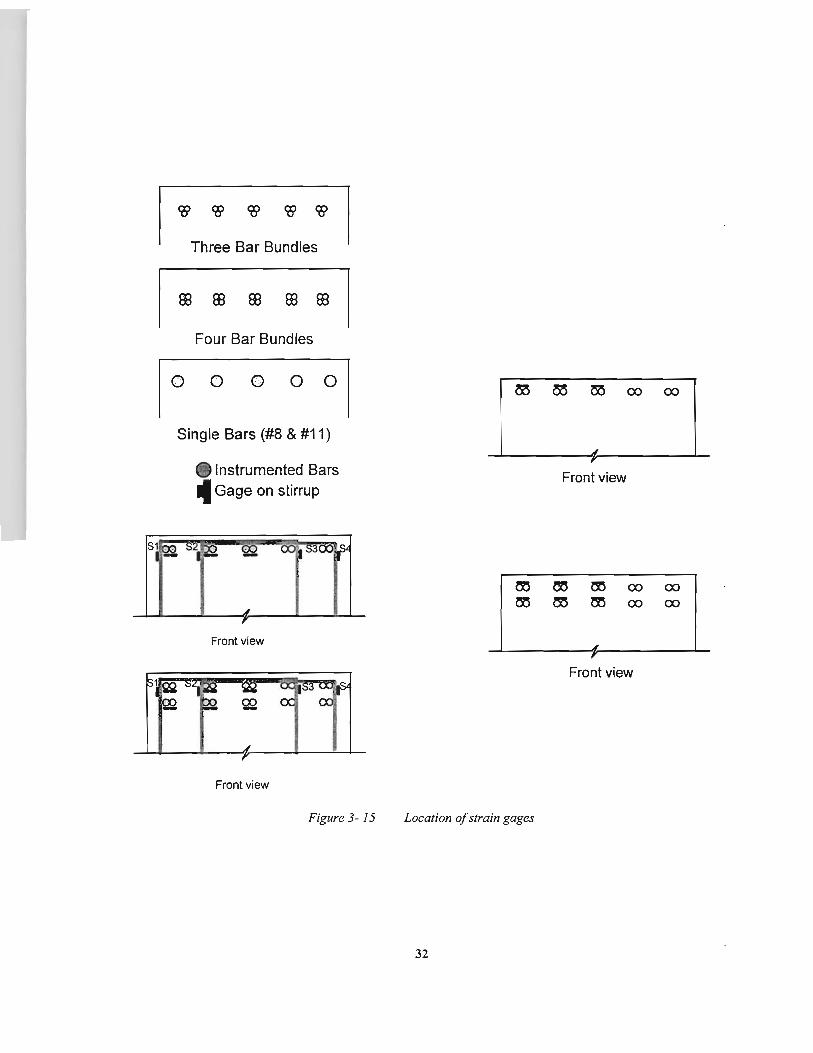
I ce ~ ~ <OJ <OJ
I Three Bar Bundles
I ffi ffi ffi ffi ffi
I Four Bar Bundles
0 0 0 0 0
Single Bars (#8 & #11)
Instrumented Bars 4 Gage on stirrup
, Front view
~ ~ ~ 00 00
~ ~ ~ 00 00
Front view ~ ,
Front view
Front view
Figure 3- 15 Location of strain gages
32
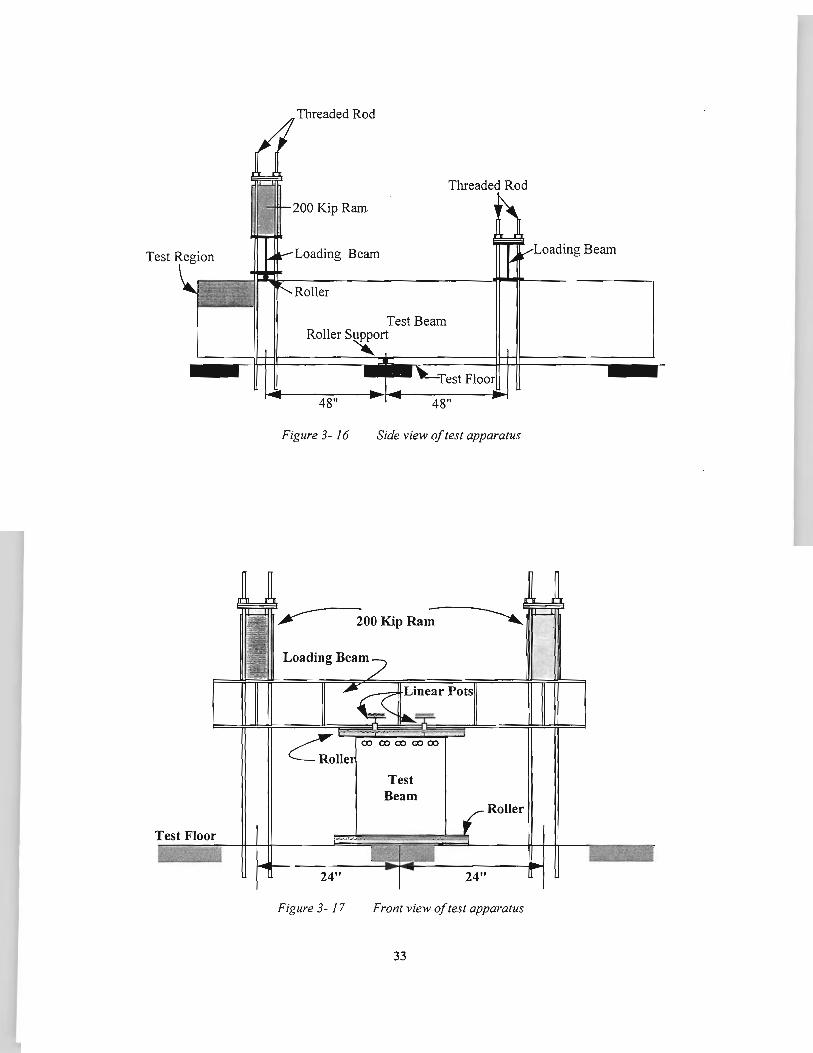
Test Floor
Threaded Rod
Threaded Rod
Kip Ram
Loading Beam
Test Beam Roller
48"
Figure 3-16 Side view of test apparatus
~OOKipRa~
24"
Figure 3- 17
Test Beam
24"
Roller
Front view of test apparatus
33
ingBeam
resistance to the test regions at either end of the beam. Figure 3-18 shows tests set up with and without a beam shear force along the anchored bars. Figure 3-19 shows a photo of the test setup.
3.7.2 Data Acquisition
The data was collected by a computer-based data acquisition unit. The strain gages, pressure transducer, and linear potentiometers (used to measure displacement during the test but not used for any computations) were connected to the data acquisition system. At each load increment data channels were scanned and the readings recorded on disk. A hard copy of each scan was printed providing instantaneous conversions of the readings to stresses and load. These read-outs were useful in monitoring the test's progress.
3. 7.3 Testing Procedure
The load was applied manually to the beam via a hydraulic pump. The load on the beam was a direct function of the pressure in the hydraulic lines: the pressure was monitored during the test by a dial gauge and a pressure transducer. The individual operating the pump gauged the load interval using the readout on a voltmeter attached to the pressure transducer.
Deformation transducers were placed at the end of the beam to measure the deflection and any twisting of the beam during the test. In tests l-4, the slip of the free end of anchored bars was measured as shown in Figure 3-20. However, the data showed that the slip of the free end before the bond failure was so small that it was beyond the accuracy of the testing method. Therefore, slip was not measured in later tests.
Readings were taken after each incremental application of load. The initial load steps were on the order of 1 0 kips. The data acquisition system printed a copy of the stresses at each scan, and this information was used to determine the appropriate load increment for the next step. The size of the step was reduced as the bars neared the expected failure load. Regular inspection of the beam and the marking of cracks also provided a measure of the performance. The load steps were reduced near the end of the test to a level which resulted in a change in bar stress of approximately 1 ksi per increment.
34
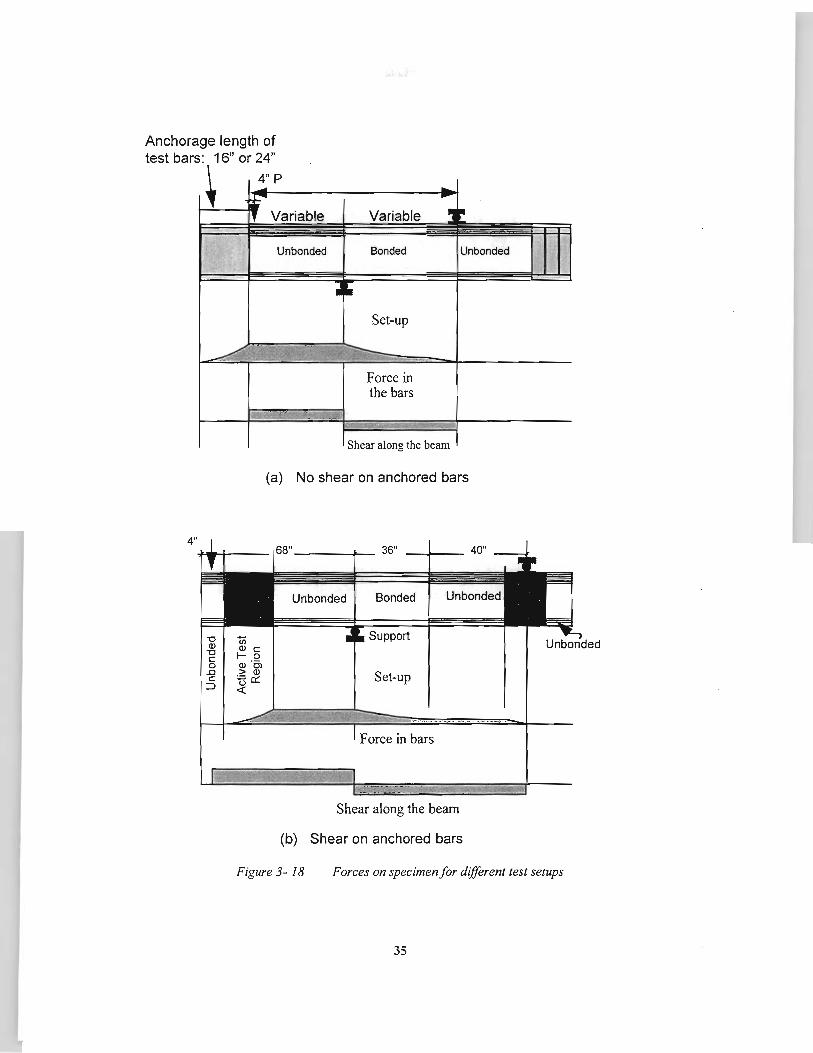
Anchorage length of test bars: 16" or 24"
4"
~ 1~4"~P------------------~ Variable ------------------=----=---==-
Unbonded
Variable
Bonded
Set-up
Force in the bars
Shear along the beam
(a) No shear on anchored bars
-HIIH---- 68" -----.1'- 36"
-o <ll -o c 0 .c c
::::>
u; <ll c f- 0 <ll "C:J > <ll uo:::
<t:
Bonded
Support
Set-up
Shear along the beam
(b) Shear on anchored bars
Unbonded
Figure 3- 18 Forces on specimen for different test setups
35
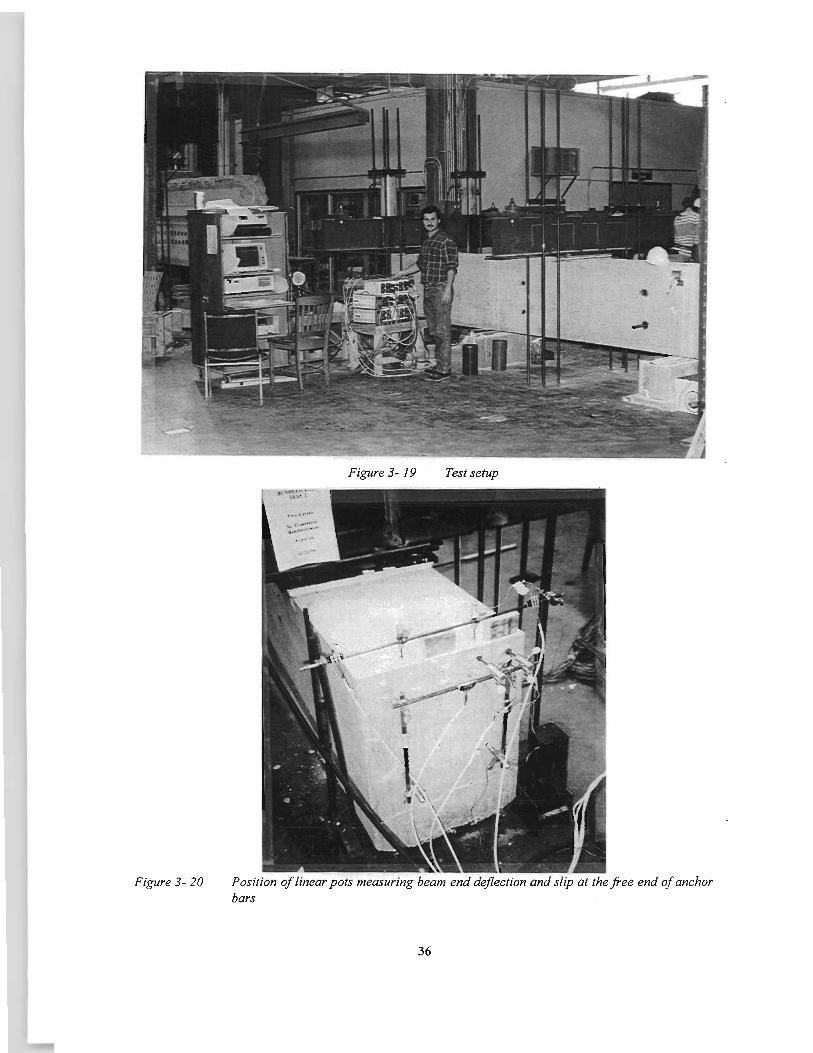
Figure 3-20
Figure 3- 19 Test setup
Position of linear pots measuring beam end deflection and slip at the free end of anchor bars
36
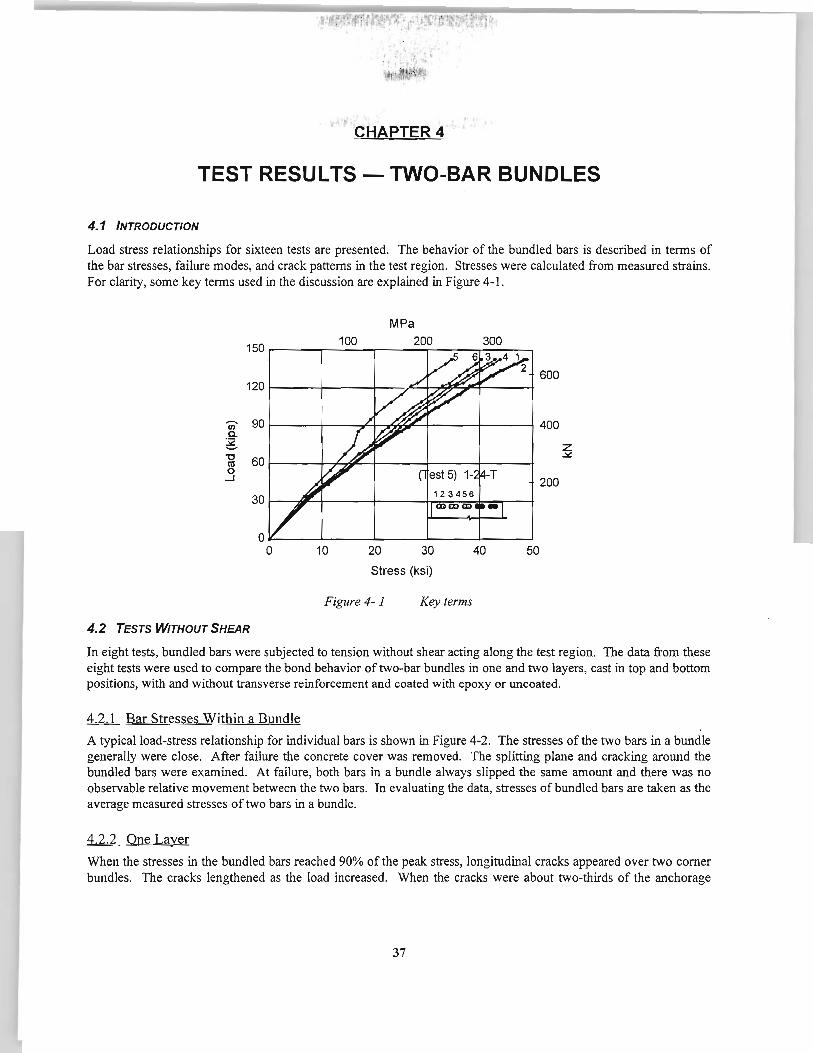
CHAPTER 4
TEST RESULTS -TWO-BAR BUNDLES
4.1 INTRODUCTION
Load stress relationships for sixteen tests are presented. The behavior of the bundled bars is described in terms of the bar stresses, failure modes, and crack patterns in the test region. Stresses were calculated from measured strains. For clarity, some key terms used in the discussion are explained in Figure 4-1.
150
120
li) 90 a. ~ "C 60 n:s 0
...J
30
4.2 TESTS WITHOUT SHEAR
100 MPa
200
Stress (ksi)
Figure 4-1 Key terms
300
z .:.::
In eight tests, bundled bars were subjected to tension without shear acting along the test region. The data from these eight tests were used to compare the bond behavior of two-bar bundles in one and two layers, cast in top and bottom positions, with and without transverse reinforcement and coated with epoxy or uncoated.
4.2.1 Bar Stresses Within a Bundle
A typical load-stress relationship for individual bars is shown in Figure 4-2. The stresses of the two bars in a bundle generally were close. After failure the concrete cover was removed. The splitting plane and cracking around the bundled bars were examined. At failure, both bars in a bundle always slipped the same amount and there was no observable relative movement between the two bars. In evaluating the data, stresses of bundled bars are taken as the average measured stresses of two bars in a bundle.
4.2.2 One Layer
When the stresses in the bundled bars reached 90% of the peak stress, longitudinal cracks appeared over two comer bundles. The cracks lengthened as the load increased. When the cracks were about two-thirds of the anchorage
37
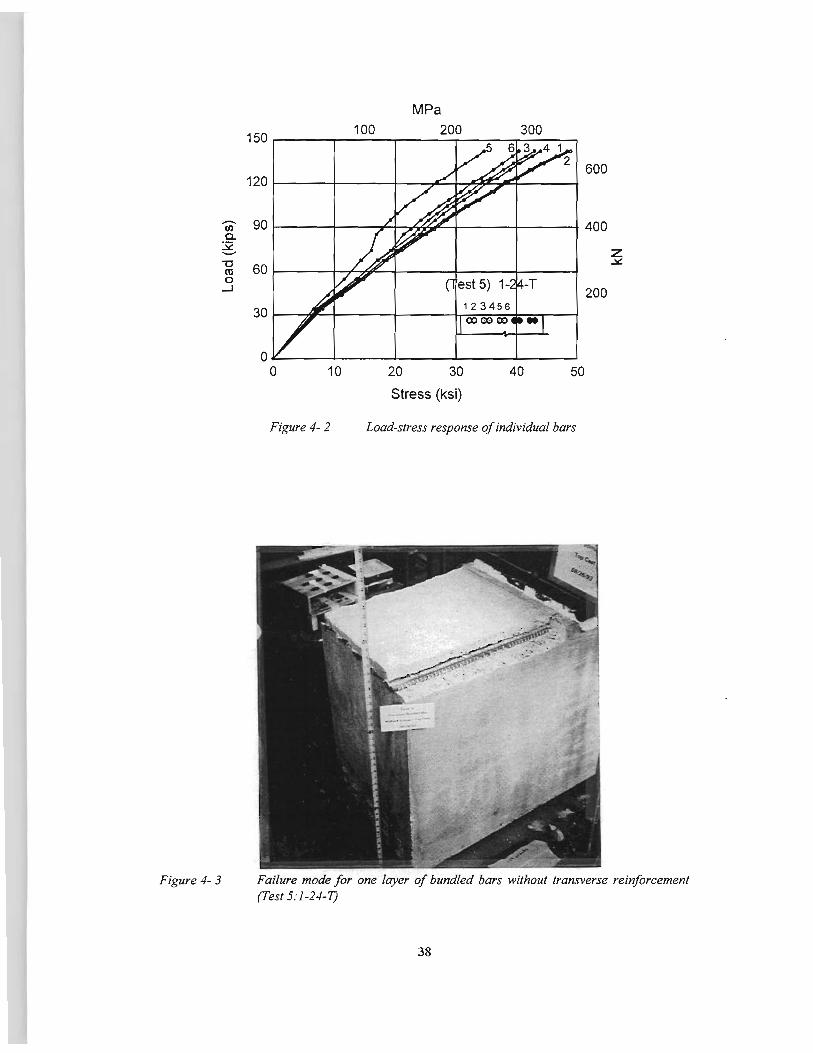
......... f/) c.. ~ -"0 m 0
..J
Figure 4-3
MPa
150 100 200 300
600 120
90 400
z 60
~
200 30
Stress (ksi)
Figure 4-2 Load-stress response of individual bars
Failure mode for one layer of bundled bars without transverse reinforcement (Test 5: 1-24-T)
38
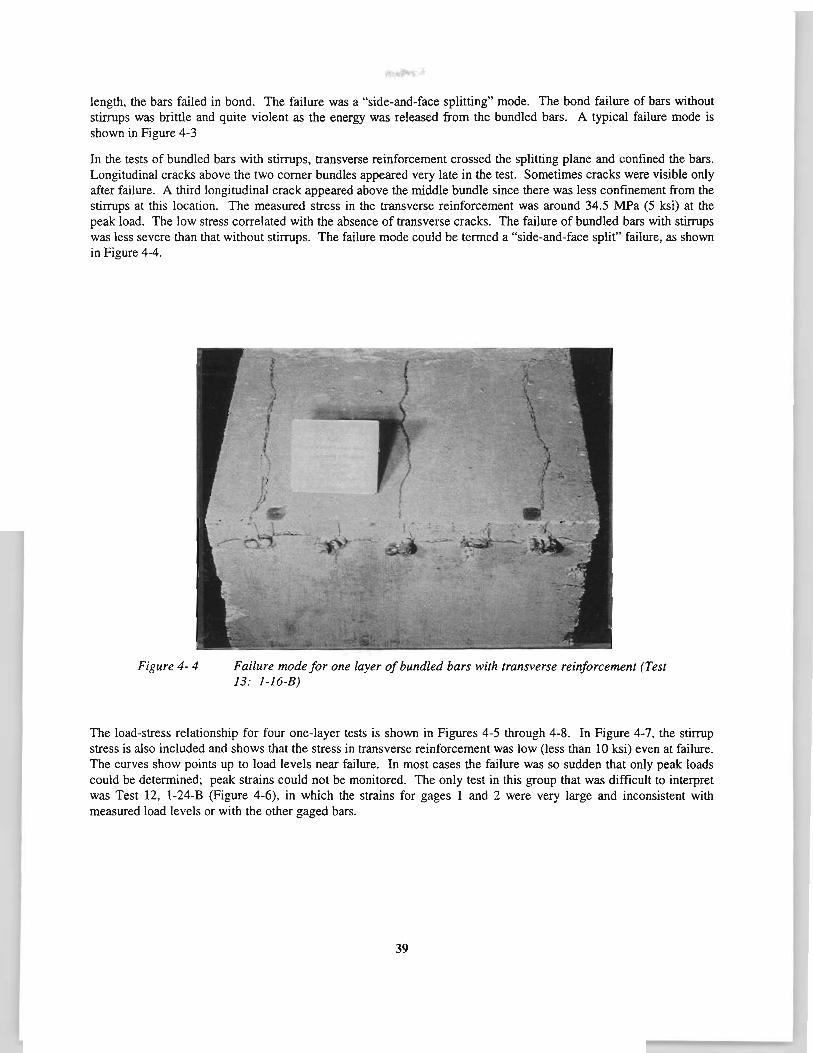
length, the bars failed in bond. The failure was a "side-and-face splitting" mode. The bond failure of bars without stirrups was brittle and quite violent as the energy was released from the bundled bars. A typical failure mode is shown in Figure 4-3
In the tests of bundled bars with stirrups, transverse reinforcement crossed the splitting plane and confined the bars. Longitudinal cracks above the two comer bundles appeared very late in the test. Sometimes cracks were visible only after failure. A third longitudinal crack appeared above the middle bundle since there was less confinement from the stirrups at this location. The measured stress in the transverse reinforcement was around 34.5 MPa (5 ksi) at the peak load. The low stress correlated with the absence of transverse cracks. The failure of bundled bars with stirrups was less severe than that without stirrups. The failure mode could be termed a "side-and-face split" failure, as shown in Figure 4-4.
Figure 4-4 Failure mode for one layer of bundled bars with transverse reinforcement (Test 13: 1-16-B)
The load-stress relationship for four one-layer tests is shown in Figures 4-5 through 4-8. In Figure 4-7, the stirrup stress is also included and shows that the stress in transverse reinforcement was low (less than 10 ksi) even at failure. The curves show points up to load levels near failure. In most cases the failure was so sudden that only peak loads could be determined; peak strains could not be monitored. The only test in this group that was difficult to interpret was Test 12, 1-24-B (Figure 4-6), in which the strains for gages 1 and 2 were very large and inconsistent with measured load levels or with the other gaged bars.
39
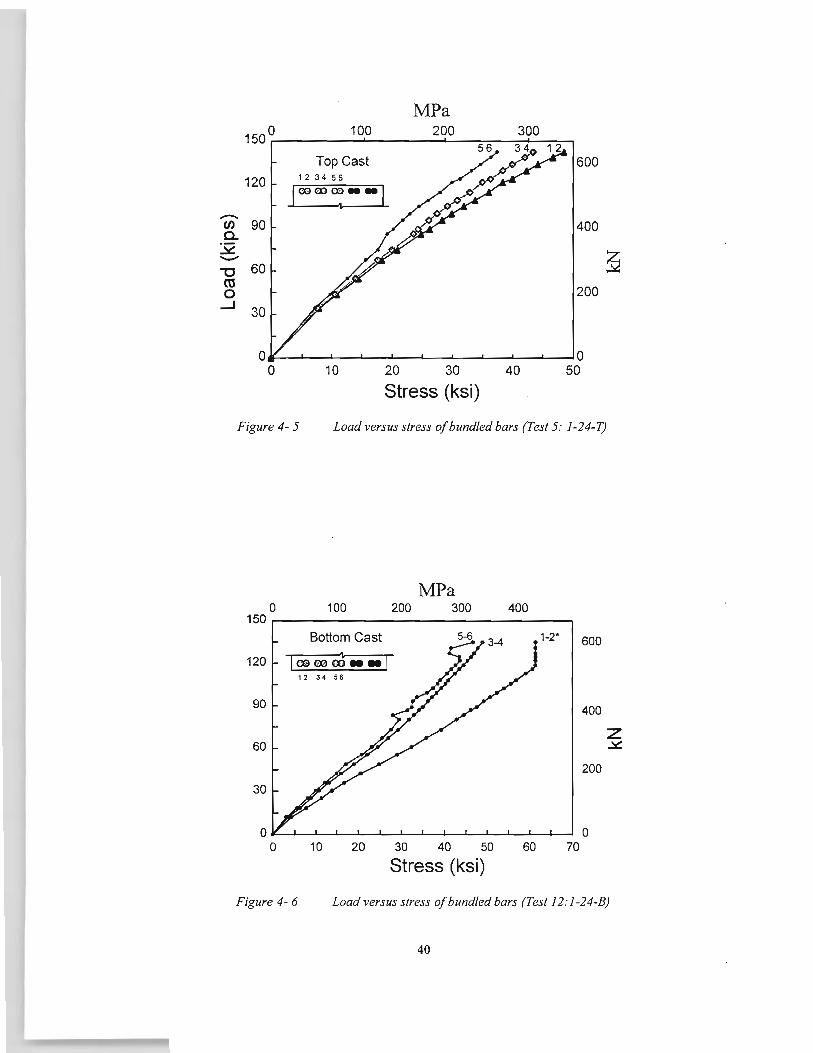
MPa
150° 100 200
Top Cast
120 123456
IC:XHXl~--1 . ......... en 90 400 c. ~
~ -'"C 60 ctl
200 0 .....J 30
0 0 0 10 20 30 40 50
Stress (ksi)
Figure 4-5 Load versus stress of bundled bars (Test 5: 1-24-T)
MPa 0 100 200 300 400
150 Bottom Cast 5-6 1-2* 600
120 I oo oo ci.i • • I 1 2 34 56
90 400
z 60 ~
200
30
0 0 0 10 20 30 40 50 60 70
Stress (ksi)
Figure 4-6 Load versus stress of bundled bars (Test I 2: I -24-B)
40
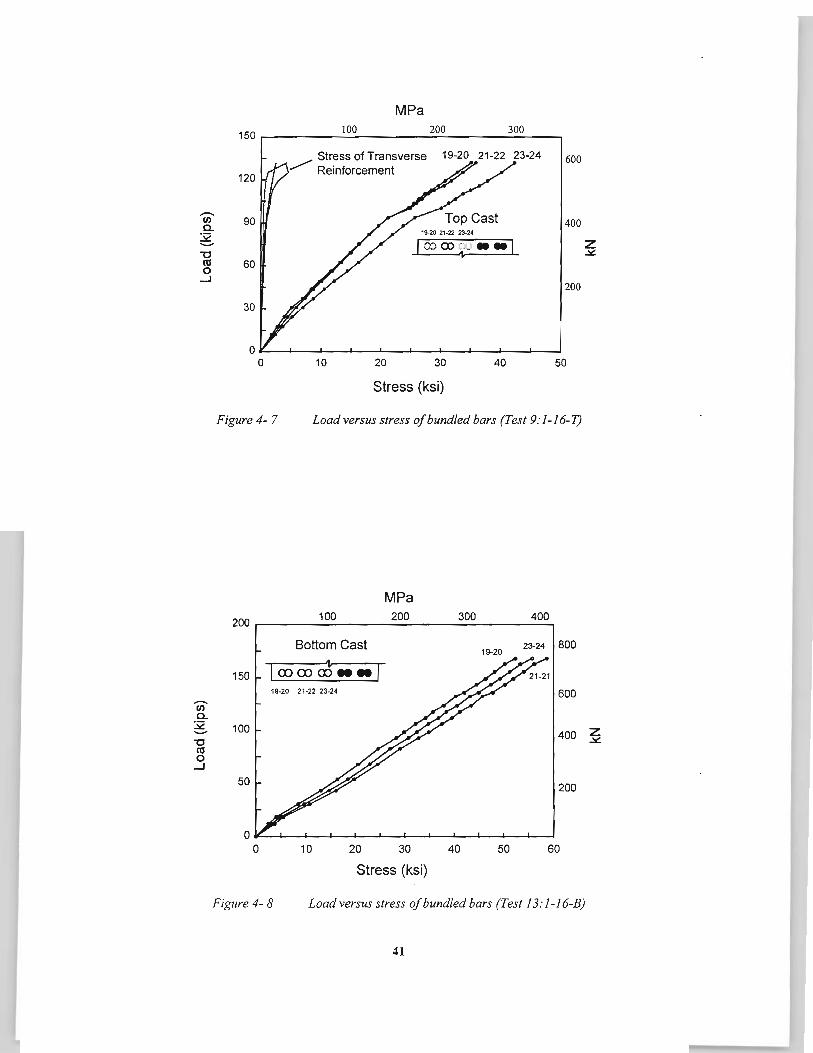
........, Ill a. ~ -"0 co 0 _J
......... Ill a. ~ .._.. "0 co 0 _J
MPa
150 ~ _________ I_oo ___________ 2o_o _________ 3_oo ____ ~
120
90
60
30
0 0
~ Stress of Transverse Reinforcement
19-20 21-22 23-24
I oo oo ~-:' • • I •
10 20 30 40
Stress (ksi)
600
400
200
50
Figure 4- 7 Load versus stress of bundled bars (Test 9:1-16-T)
MPa
200 100 200 300 400
Bottom Cast 19-20
23-24 800
150 !rococi> .... l 19-20 21·22 2l-24 600
100 400
50 200
0 0 10 20 30 40 50 60
Stress (ksi)
z ..)t!
z .:.:::
Figure 4-8 Load versus stress of bundled bars (Test 13: 1-16-B)
41
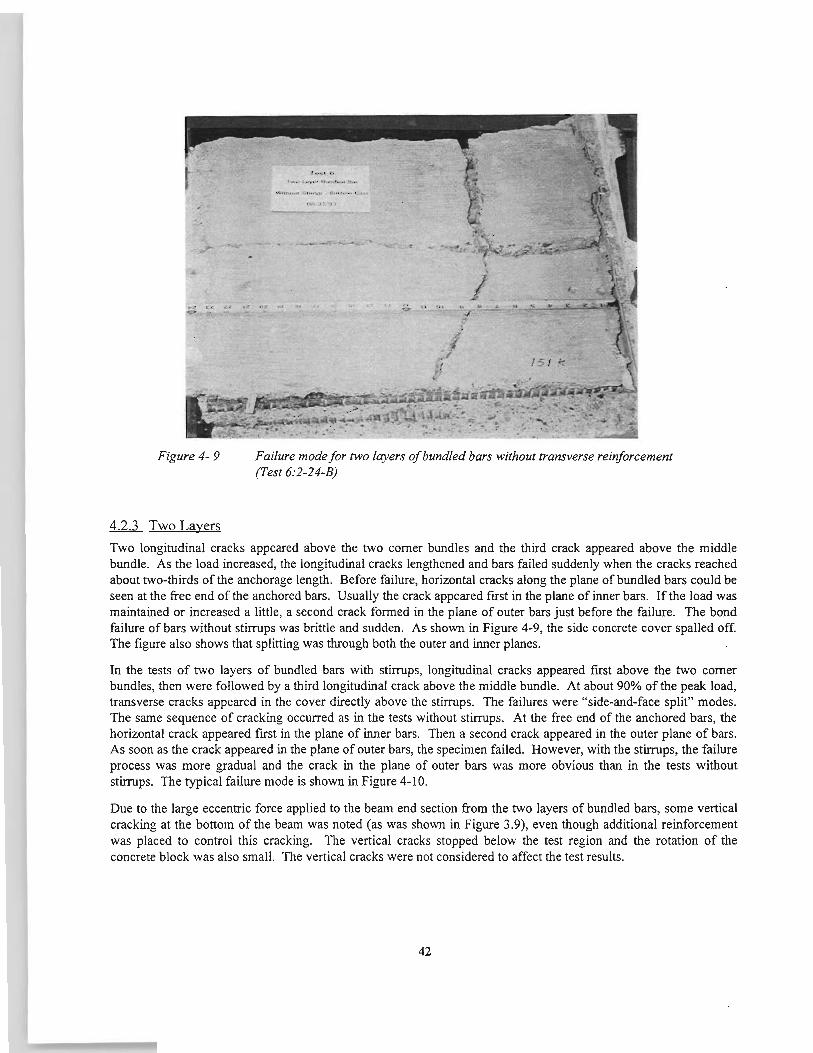
Figure 4-9
12.1_ Two Layers
Failure mode for two layers of bundled bars without transverse reinforcement (Test 6:2-24-B)
Two longitudinal cracks appeared above the two comer bundles and the third crack appeared above the middle bundle. As the load increased, the longitudinal cracks lengthened and bars failed suddenly when the cracks reached about two-thirds of the anchorage length. Before failure, horizontal cracks along the plane of bundled bars could be seen at the free end of the anchored bars. Usually the crack appeared first in the plane of inner bars. If the load was maintained or increased a little, a second crack formed in the plane of outer bars just before the failure. The bond failure of bars without stirrups was brittle and sudden. As shown in Figure 4-9, the side concrete cover spalled off. The figure also shows that splitting was through both the outer and inner planes.
In the tests of two layers of bundled bars with stirrups, longitudinal cracks appeared first above the two comer bundles, then were followed by a third longitudinal crack above the middle bundle. At about 90% of the peak load, transverse cracks appeared in the cover directly above the stirrups. The failures were "side-and-face split" modes. The same sequence of cracking occurred as in the tests without stirrups. At the free end of the anchored bars, the horizontal crack appeared first in the plane of inner bars. Then a second crack appeared in the outer plane of bars. As soon as the crack appeared in the plane of outer bars, the specimen failed. However, with the stirrups, the failure process was more gradual and the crack in the plane of outer bars was more obvious than in the tests without stirrups. The typical failure mode is shown in Figure 4-l 0.
Due to the large eccentric force applied to the beam end section from the two layers of bundled bars, some vertical cracking at the bottom of the beam was noted (as was shown in Figure 3.9), even though additional reinforcement was placed to control this cracking. The vertical cracks stopped below the test region and the rotation of the concrete block was also small. The vertical cracks were not considered to affect the test results.
42
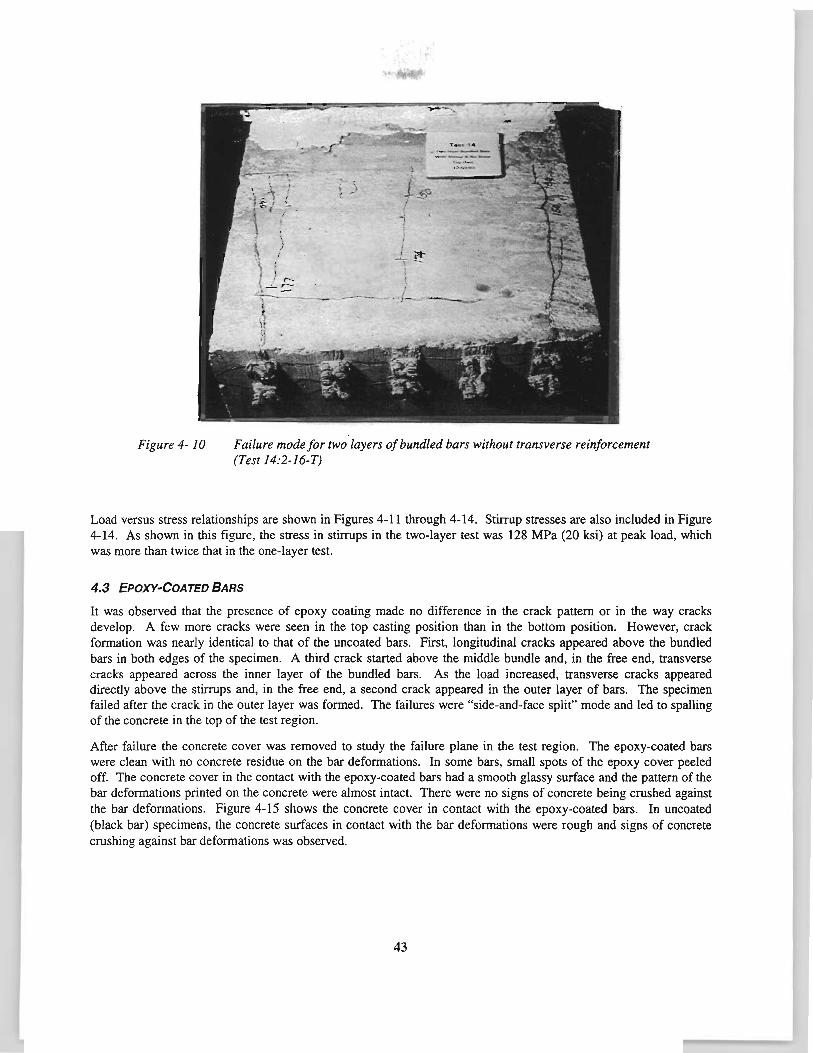
Figure 4- 10
)
I , t!'
- . . (
Failure mode for two layers of bundled bars without transverse reinforcement (Test 14:2-16-T)
Load versus stress relationships are shown in Figures 4-11 through 4-14. Stirrup stresses are also included in Figure 4-14. As shown in this figure, the stress in stirrups in the two-layer test was 128 MPa (20 ksi) at peak load, which was more than twice that in the one-layer test.
4.3 EPOXY-COATED BARS
It was observed that the presence of epoxy coating made no difference in the crack pattern or in the way cracks develop. A few more cracks were seen in the top casting position than in the bottom position. However, crack formation was nearly identical to that of the uncoated bars. First, longitudinal cracks appeared above the bundled bars in both edges of the specimen. A third crack started above the middle bundle and, in the free end, transverse cracks appeared across the inner layer of the bundled bars. As the load increased, transverse cracks appeared directly above the stirrups and, in the free end, a second crack appeared in the outer layer of bars. The specimen failed after the crack in the outer layer was formed. The failures were "side-and-face split" mode and led to spalling of the concrete in the top of the test region.
After failure the concrete cover was removed to study the failure plane in the test region. The epoxy-coated bars were clean with no concrete residue on the bar deformations. In some bars, small spots of the epoxy cover peeled off. The concrete cover in the contact with the epoxy-coated bars had a smooth glassy surface and the pattern of the bar deformations printed on the concrete were almost intact. There were no signs of concrete being crushed against the bar deformations. Figure 4-15 shows the concrete cover in contact with the epoxy-coated bars. In uncoated (black bar) specimens, the concrete surfaces in contact with the bar deformations were rough and signs of concrete crushing against bar deformations was observed.
43
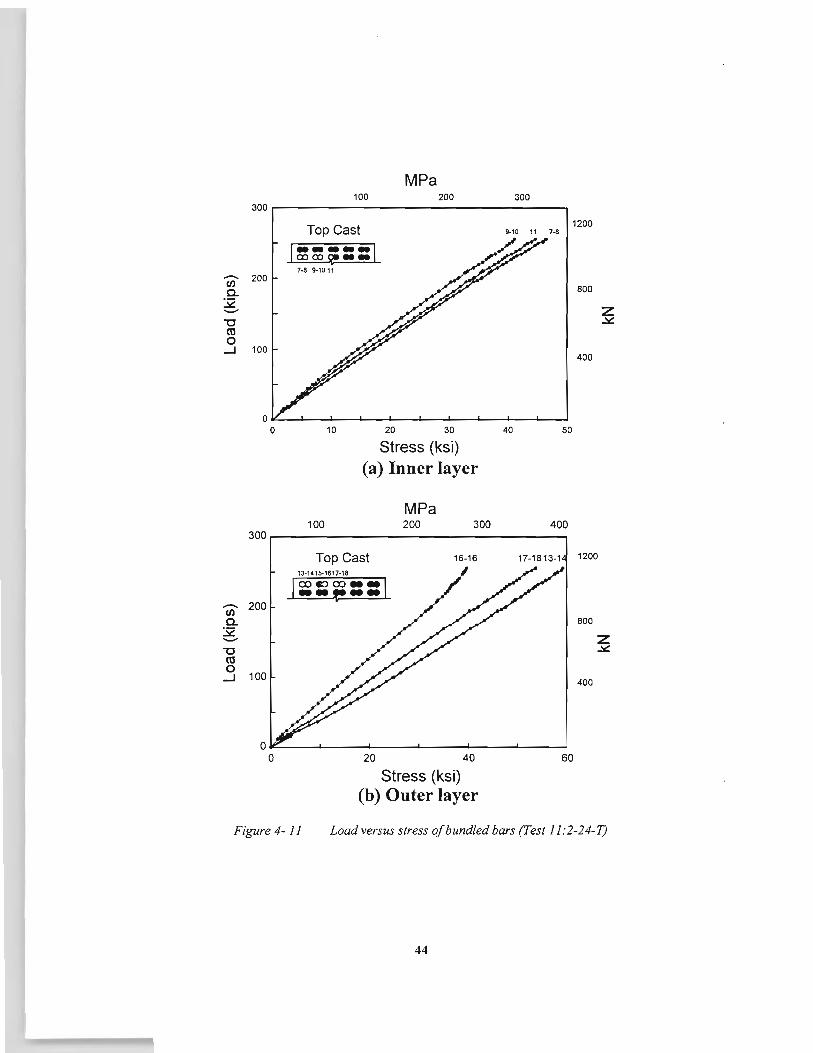
300
..-... 200 en c. ~ -"C ro 0
_J 100
0 0
300
..-... 200 en c. ~ -"C ro 0 _J 100
MPa 100 200
Top Cast
~-----1 CX)OJ~--7-8 9-10 11
10 20 30
Stress (ksi) (a) Inner layer
MPa 100 200 300
Top Cast 16-16
20 40
Stress (ksi) (b) Outer layer
300
1200 1-8
800
z .X:
400
40 50
400
17-1813-1 1200
800
z .X:
400
60
Figure 4- 11 Load versus stress of bundled bars (Test 11.·2-24-T)
44
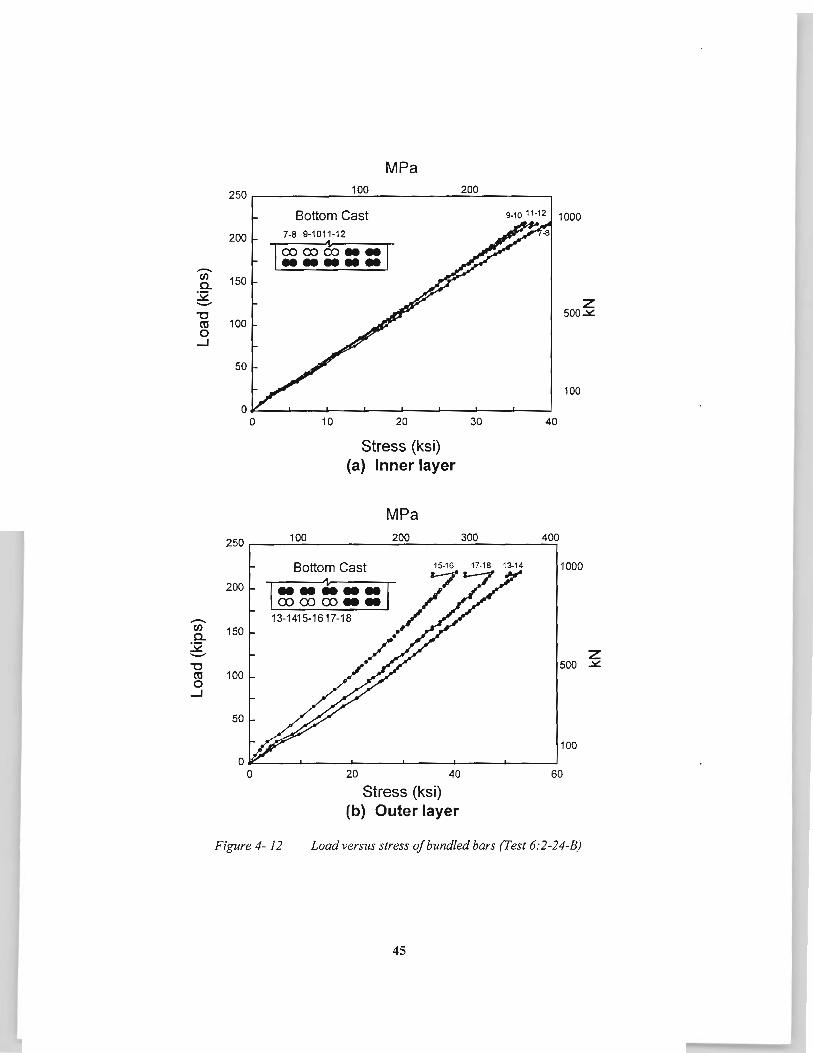
MPa
250 100 200
Bottom Cast 9-10 11-12 1000
200 7-8 9-1011-12
lcoco&••j ---------en 150 c.. :i: z -"C 500~ ctl 100 0
....J
50
100
0 0 10 20 30 40
Stress (ksi) (a) Inner layer
MPa
250 100 200 300 400
Bottom Cast 17-18 13-14 1000
200 1--~--1 corooo•• ---- 13-1415-1617-18 en 150 c.. :i: z -"C 500 ~ ctl 100 0
....J
50
100 0
0 20 40 60
Stress (ksi) (b) Outer layer
Figure 4- 12 Load versus stress of bundled bars (Test 6:2-24-B)
45
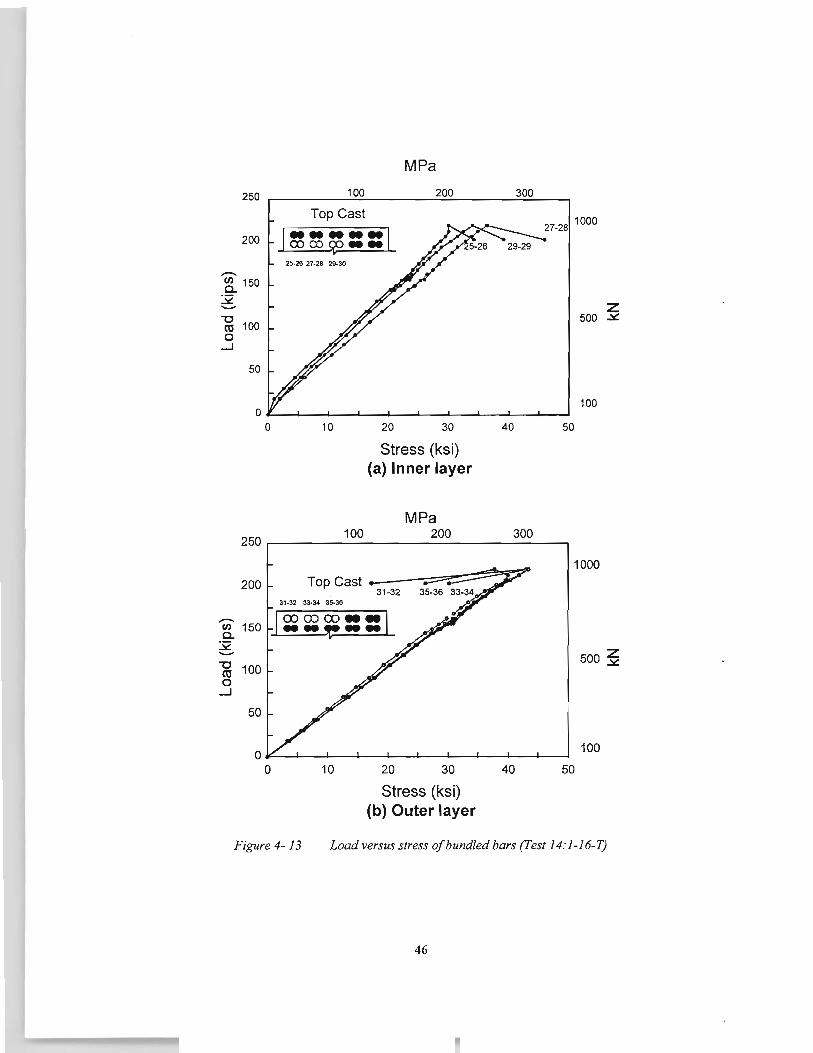
MPa
250 100 200 300
Top Cast 1000 , ...... , 27-28
200 0000~--2~26 27-28 29-30 -en 150 c...
~ z -"'C 500 .::J:. rn 100 0
_J
50
100 0
0 10 20 30 40 50
Stress (ksi) (a) Inner layer
MPa
250 100 200 300
1000
200
-en 150 c... ~
500 ~ -"'C 100 rn 0
_J
50
100
10 20 30 40 50
Stress (ksi) (b) Outer layer
Figure 4- 13 Load versus stress of bundled bars (Test 14: 1-16-T)
46

0~----~----~----~----~----~----~ 100
0 20 40 60
Stress (ksi) (a) Inner layer
MPa 300~---1~0~0 ___________ 20~0~----~3~0~0------~
1000
..-... 200 f/)
a. ~ -"C ro 500 0 100 _J
100
20 40 60 Stress (ksi)
(b) Outer layer
Figure 4-14 Load versus stress of bundled bars (Test 10:2-16-B)
47
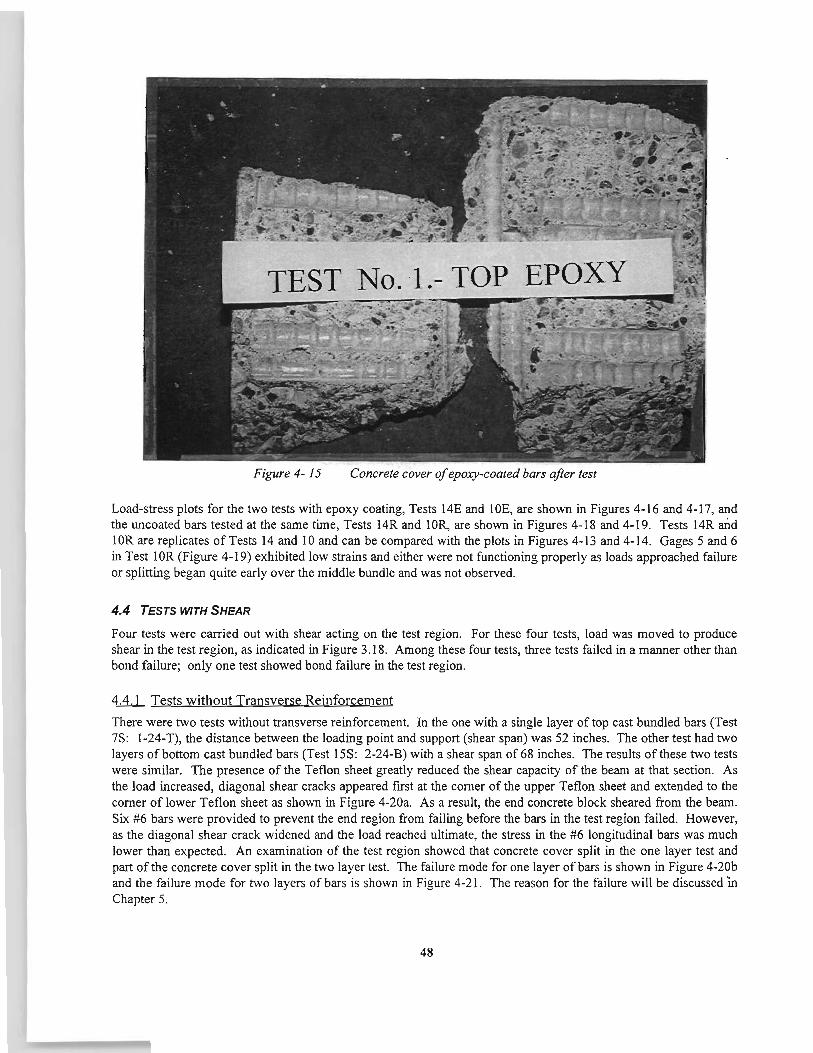
Figure 4-15 Concrete cover of epoxy-coated bars after test
Load-stress plots for the two tests with epoxy coating, Tests 14E and !OE, are shown in Figures 4-16 and 4-17, and the uncoated bars tested at the same time, Tests 14R and lOR, are shown in Figures 4-18 and 4-19. Tests 14R and 1 OR are replicates of Tests 14 and I 0 and can be compared with the plots in Figures 4-I3 and 4-I4. Gages 5 and 6 in Test I OR (Figure 4-I9) exhibited low strains and either were not functioning properly as loads approached failure or splitting began quite early over the middle bundle and was not observed.
4.4 TESTS WITH SHEAR
Four tests were carried out with shear acting on the test region. For these four tests, load was moved to produce shear in the test region, as indicated in Figure 3 .18. Among these four tests, three tests failed in a manner other than bond failure; only one test showed bond failure in the test region.
4.4.1 Tests without Transverse Reinforcement
There were two tests without transverse reinforcement. In the one with a single layer of top cast bundled bars (Test 7S: 1-24-T), the distance between the loading point and support (shear span) was 52 inches. The other test had two layers of bottom cast bundled bars (Test ISS: 2-24-B) with a shear span of68 inches. The results ofthese two tests were similar. The presence of the Teflon sheet greatly reduced the shear capacity of the beam at that section. As the load increased, diagonal shear cracks appeared first at the corner of the upper Teflon sheet and extended to the comer of lower Teflon sheet as shown in Figure 4-20a. As a result, the end concrete block sheared from the beam. Six #6 bars were provided to prevent the end region from failing before the bars in the test region failed. However, as the diagonal shear crack widened and the load reached ultimate, the stress in the #6 longitudinal bars was much lower than expected. An examination of the test region showed that concrete cover split in the one layer test and part of the concrete cover split in the two layer test. The failure mode for one layer of bars is shown in Figure 4-20b and the failure mode for two layers of bars is shown in Figure 4-2I . The reason for the failure will be discussed 'in Chapter 5.
48
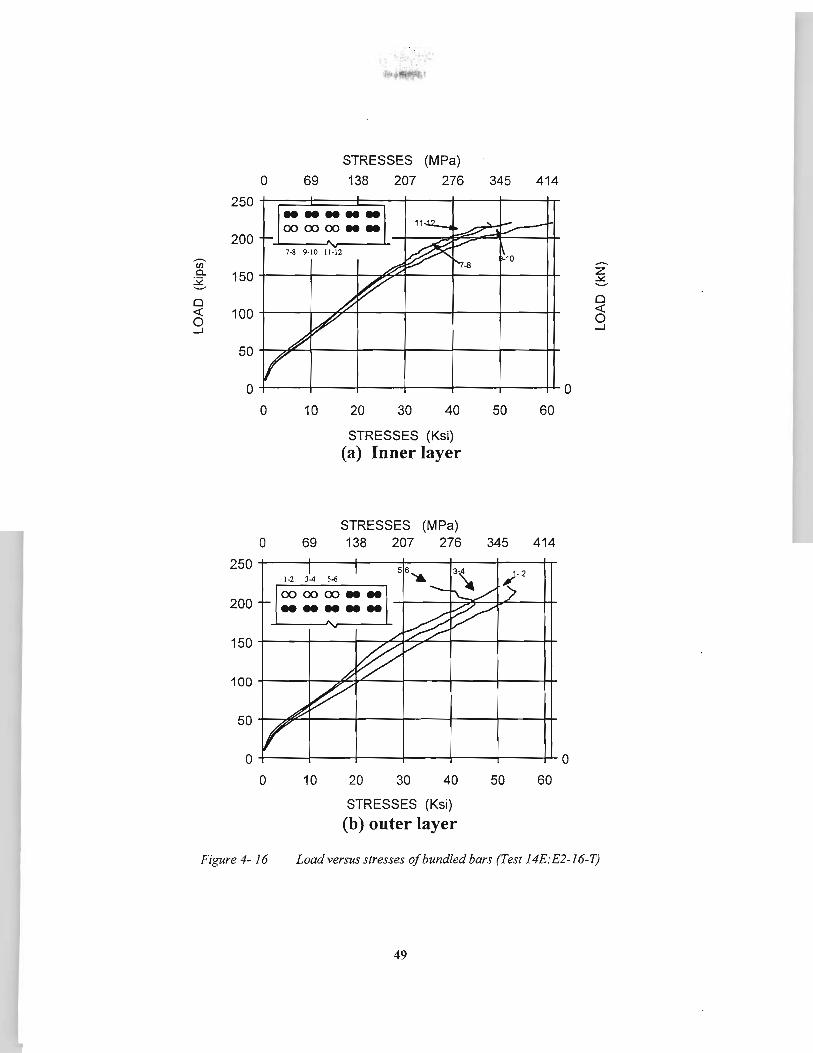
0 <( 0 ....1
STRESSES (MPa)
0 69 138 207 276 345 414
250tf==~==~==~t---~---t----tr
200 ----OOOOOOMM
o+---+--+---+---t---lr----+'-o
200
0 10 20 30 40
STRESSES (Ksi) (a) Inner layer
STRESSES (MPa)
50 60
0 69 138 207 276 345 414
~-2
[OOOOOOMMI - - - - - -+----1--':~~,.:-----t+
-'---~"v---.1...
0 +----+---+---+----1----t---~ 0
0 10 20 30 40
STRESSES (Ksi)
(b) outer layer
50 60
0 <( 0 ....1
Figure 4- 16 Load versus stresses of bundled bars (Test 14E:E2-16-T)
49
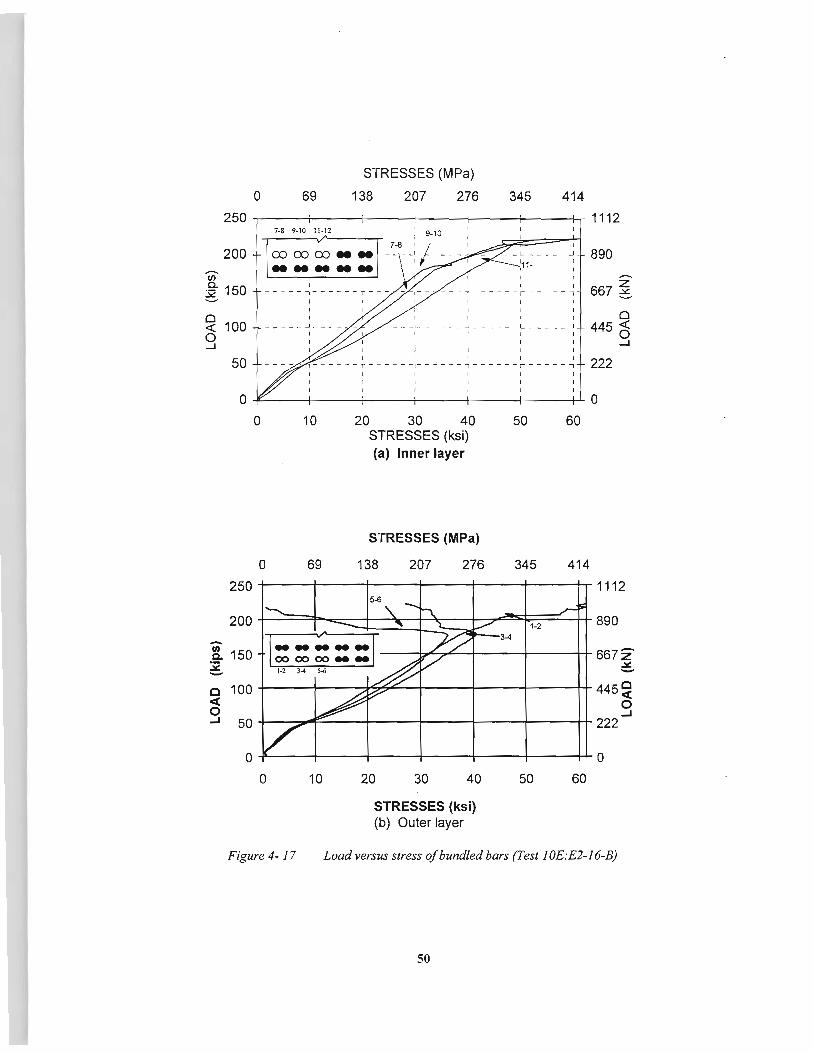
STRESSES (MPa)
0 69 138 207 276 345 414
250 +-----r-----~----~----~--~----~~1112
200 (j)
7·8 9·10 11·12 I 9·10
lro ro:;, .. • ( -7-..a\-!-/----~ -- L- ----~ .----- I I :11· . . t 1 r
890
0. g 150 I I I ---,------,-----. I I I
667 ~ 0
445 (§ 0 <( 0 ...J
-
100
50
0
0 10
0 69
I I I I I
__ _ _ I _ _ _ _ __ J _ _ _ ___ L _ __ _ _ .J
I I I
20 30 40 STRESSES (ksi) (a) Inner layer
STRESSES (MPa)
138 207 276
50 60
345 414
...J
222
250+-----~---;-----+----~----~----~1112
~ 150 ----~~~~--~-----++667z ;g ~~~~--~ ~
0 -jL---+---+---t---t-----1~-~1-'- 0
0 10
Figure 4- 17
20 30 40
STRESSES (ksi) (b) Outer layer
50 60
Load versus stress of bundled bars (Test JOE:£2-16-B)
50
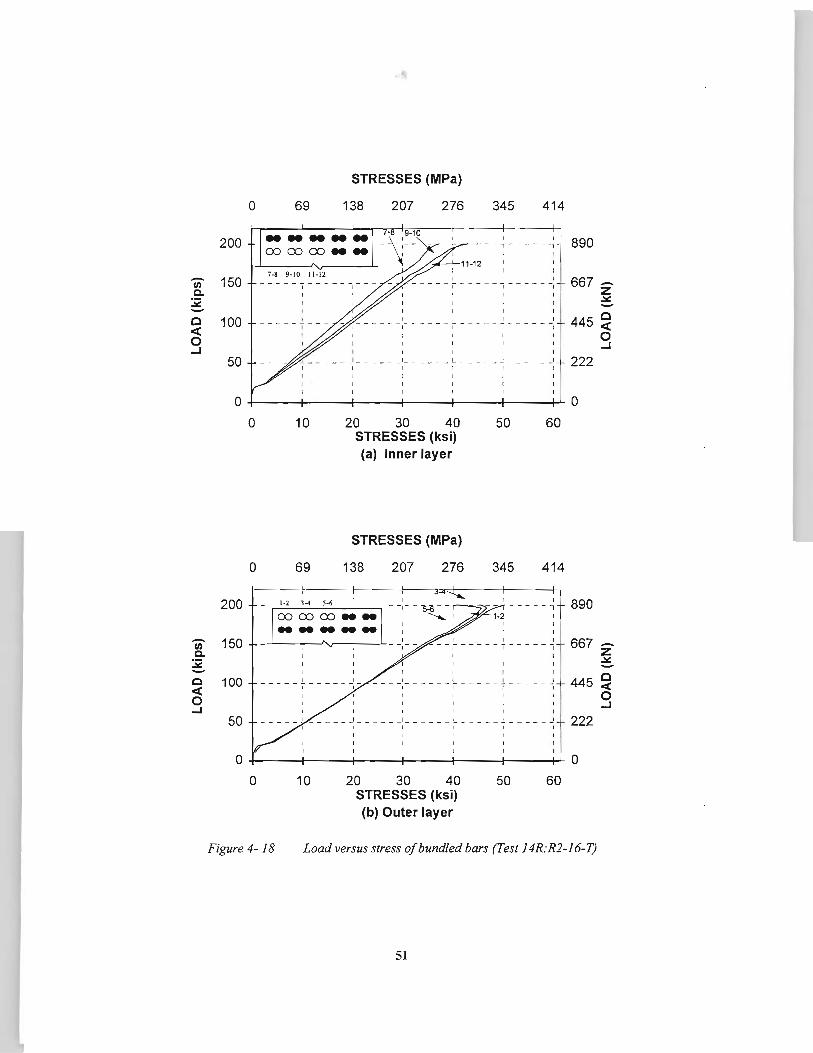
200
en 1so c. :i: -c 100 < 0 ...1
50
0
STRESSES (MPa)
69 138 207 276 345 414
I .......... (X) (X) (X) ....
- -- .- - - --
7-8 9-1 0 11-12
I
- -- - -- _,_ - - -- - !...- - -- - _!- - -- -I I I
I
- - - - - - _I - - - - - _I _ - - - - - !... - - - - - _! - - - - -I I I I I
890
667-z ~ -
445 ~ 0 ...1
222
0+---t------f---+----+---+---t-'-0
200
en 1so c. ;g_ c 100 < 0 ...1
50
0
0
10 20 30 40 50 60 STRESSES (ksi) (a) Inner layer
STRESSES (MPa)
69 138 207 276 345 414
1-2 l -4 l -6
IOO OOOOMM I ............ ~----. ~~~-.--~
- - - - ·- - - - - -I_ - - - - - !. - - - - - J I I
I _ _ _ _ _ J _ _ _ _ _ J _ __ _ __ _ __ _ __ L _ _ _ __ l _ _ _ _ _ J
I I I
890
667 z ~
445 ~ 0 ...1
222
04----t------4---+---+---+---~0
0 10 20 30 40 50 60 STRESSES (ksi) (b) Outer layer
Figure 4- 18 Load versus stress of bundled bars (Test 14R:R2-16-T)
51
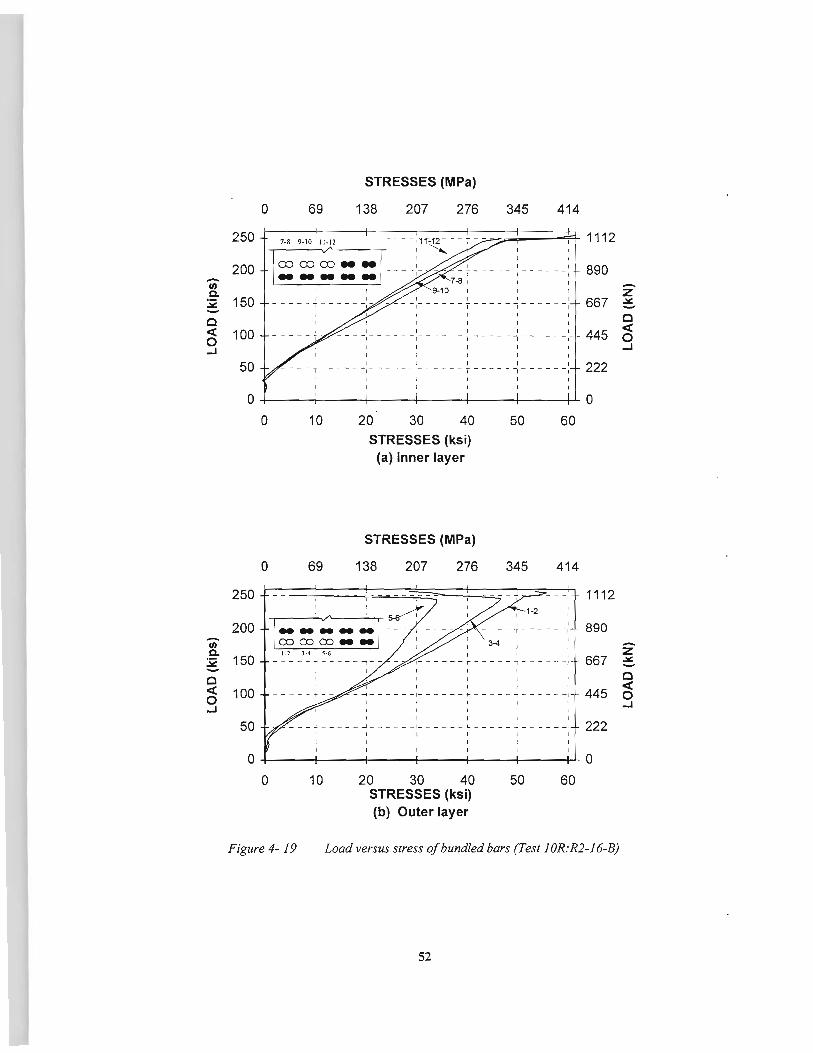
0
250
200 -II) c. :iC 150 -c <( 100 0 -1
50
0
0
0
250
200
STRESSES (MPa)
69 138 207 276 345 414
I I I I - - - - - - - - - - .- - - - - - T - - - - - r - - - - - -
I
I ; . - - - - , - ----~- - - - - - - - - - --r- - --- , -- --- -
10
69
1
20 30 40 STRESSES (ksi)
(a) Inner layer
STRESSES (MPa)
138 207 276
50 60
345 414
890
667
445
222
1112
890 (i) c.
:iC 150 667 -c <( 0 -1
100 445
50 - - -•--- - - ~ - - - - - -~ - - - -- · - - - -- 4 - - - -- ~ 222 I I I I
I
0+---t-----t----+----+---+----t-'-0
0 10 20 30 40 50 60 STRESSES (ksi) (b) Outer layer
Figure 4- 19 Load versus stress of bundled bars (Test JOR:R2-16-B)
52
z ..:.::: -c <( 0 -1
-z ..:.::: -c <( 0 -1
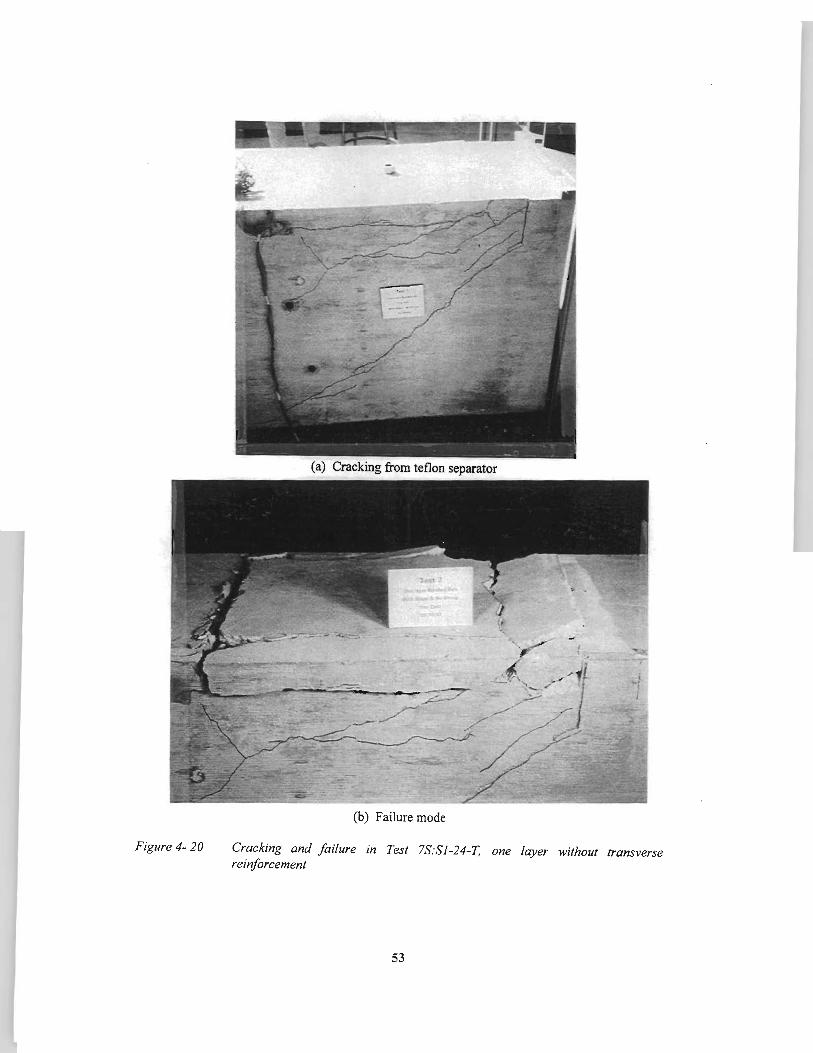
Figure 4-20
(a) Cracking from teflon separator
(b) Failure mode
Cracking and failure in Test 7S:Sl-24-T, one layer without transverse reinforcement
53
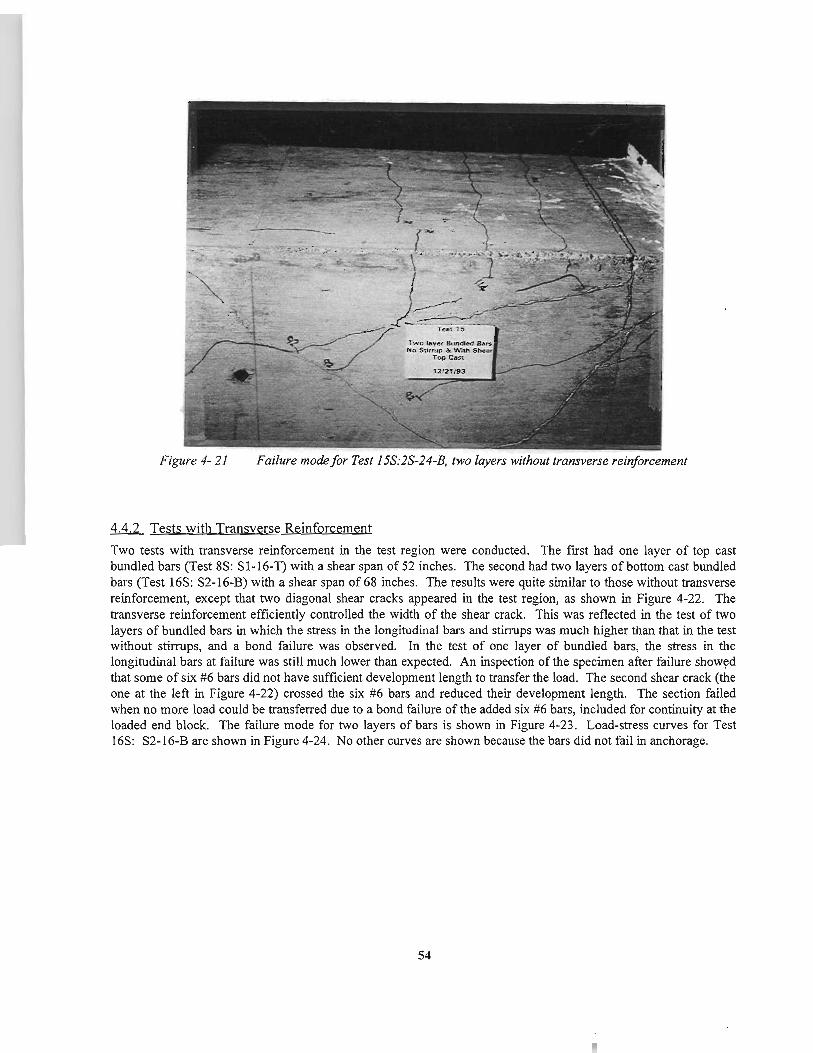
Figure 4-21 Failure mode for Test 15S:2S-24-B, two layers without transverse reinforcement
~ Tests with Transverse Reinforcement
Two tests with transverse reinforcement in the test region were conducted. The frrst had one layer of top cast bundled bars (Test 8S: Sl-16-T) with a shear span of 52 inches. The second had two layers of bottom cast bundled bars (Test l6S: S2-l6-B) with a shear span of 68 inches. The results were quite similar to those without transverse reinforcement, except that two diagonal shear cracks appeared in the test region, as shown in Figure 4-22. The transverse reinforcement efficiently controlled the width of the shear crack. This was reflected in the test of two layers of bundled bars in which the stress in the longitudinal bars and stirrups was much higher than that in the test without stirrups, and a bond failure was observed. In the test of one layer of bundled bars, the stress in the longitudinal bars at failure was still much lower than expected. An inspection of the specimen after failure show~d that some of six #6 bars did not have sufficient development length to transfer the load. The second shear crack (the one at the left in Figure 4-22) crossed the six #6 bars and reduced their development length. The section failed when no more load could be transferred due to a bond failure of the added six #6 bars, included for continuity at the loaded end block. The failure mode for two layers of bars is shown in Figure 4-23. Load-stress curves for Test 16S: S2-16-B are shown in Figure 4-24. No other curves are shown because the bars did not fail in anchorage.
54
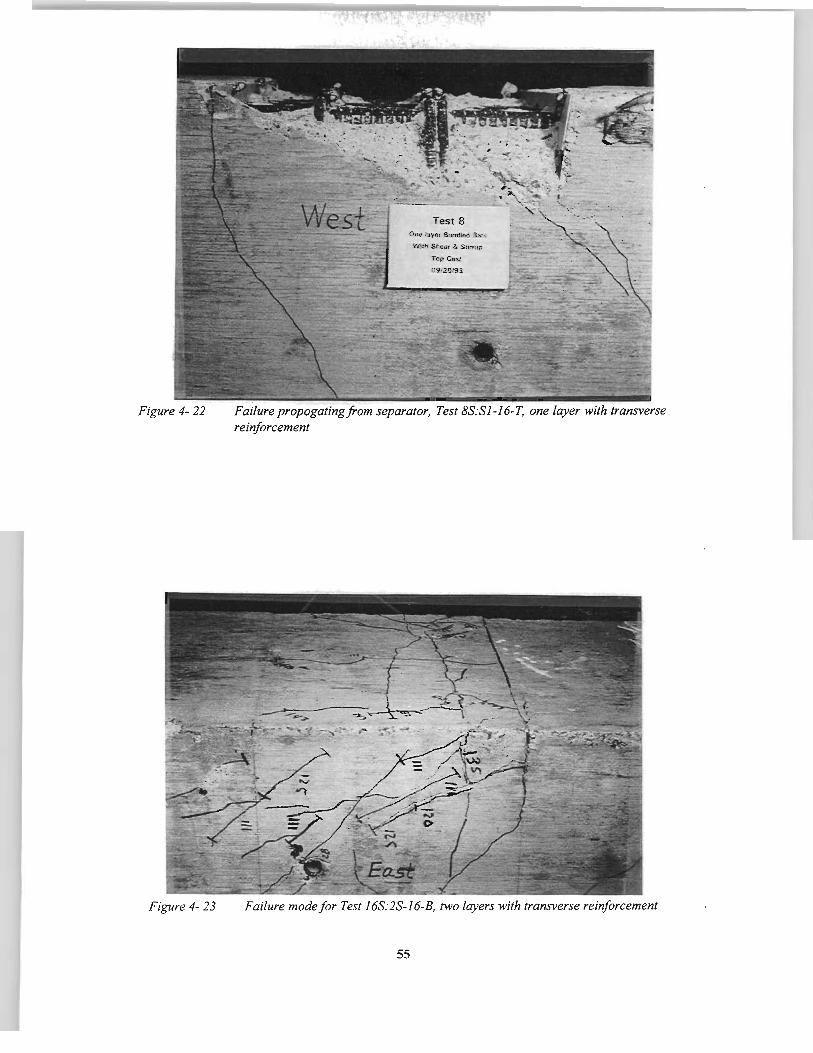
Figure 4-22
Figure 4-23
Failure propogatingfrom separator, Test SS:Sl-16-T, one layer with transverse reinforcement
Failure mode for Test 16S:2S-16-B, two layers with transverse reinforcement
55
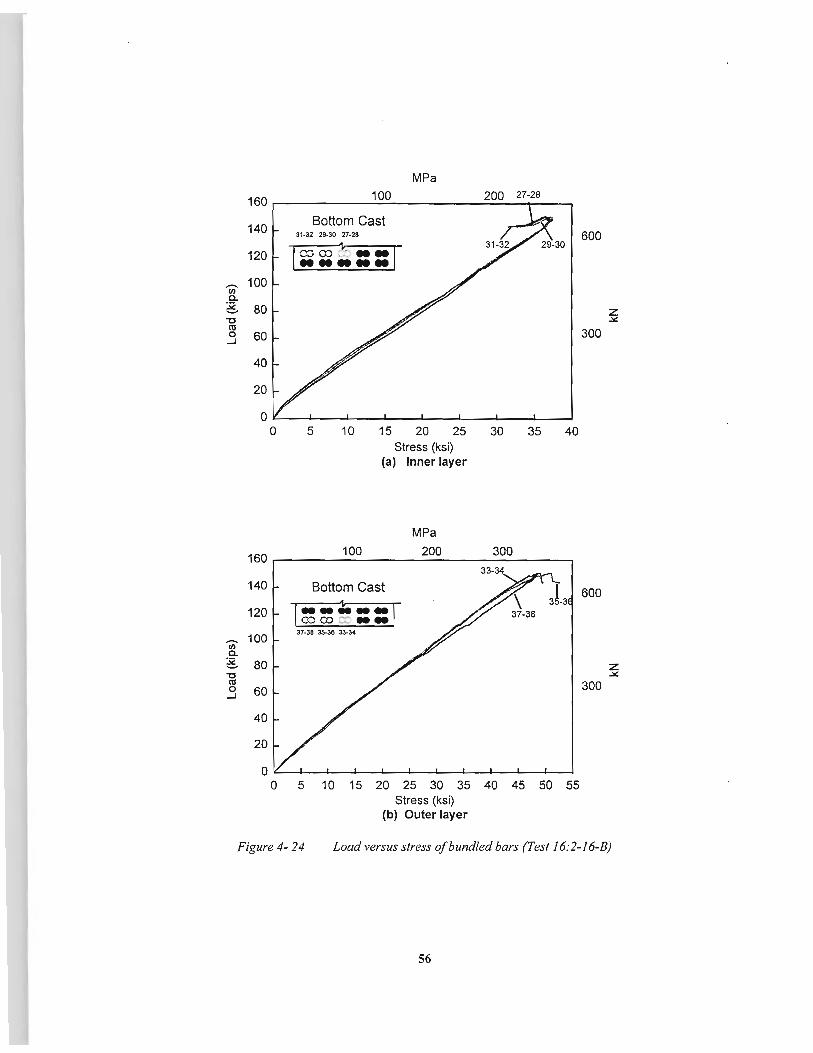
MPa
160 100 200 27-28
140 Bottom Cast 31-32 29-30 27-28 600
120 ~~~~==! ........ 100 (/)
c.. g 80 z -c ~ (U
300 0 60 ...J
40
20
0 0 5 10 15 20 25 30 35 40
Stress (ksi) (a) Inner layer
MPa
160 100 200 300
140 Bottom Cast
120 1--~--1 ccco c:: •• 100
37-38 35-36 33-3<4
(i) c.. ;g, 80 z -c ~ (U 300 0 60 ...J
40
20
0 0 5 10 15 20 25 30 35 40 45 50 55
Stress (ksi) (b) Outer layer
Figure 4-24 Load versus stress of bundled bars (Test 16:2-16-B)
56
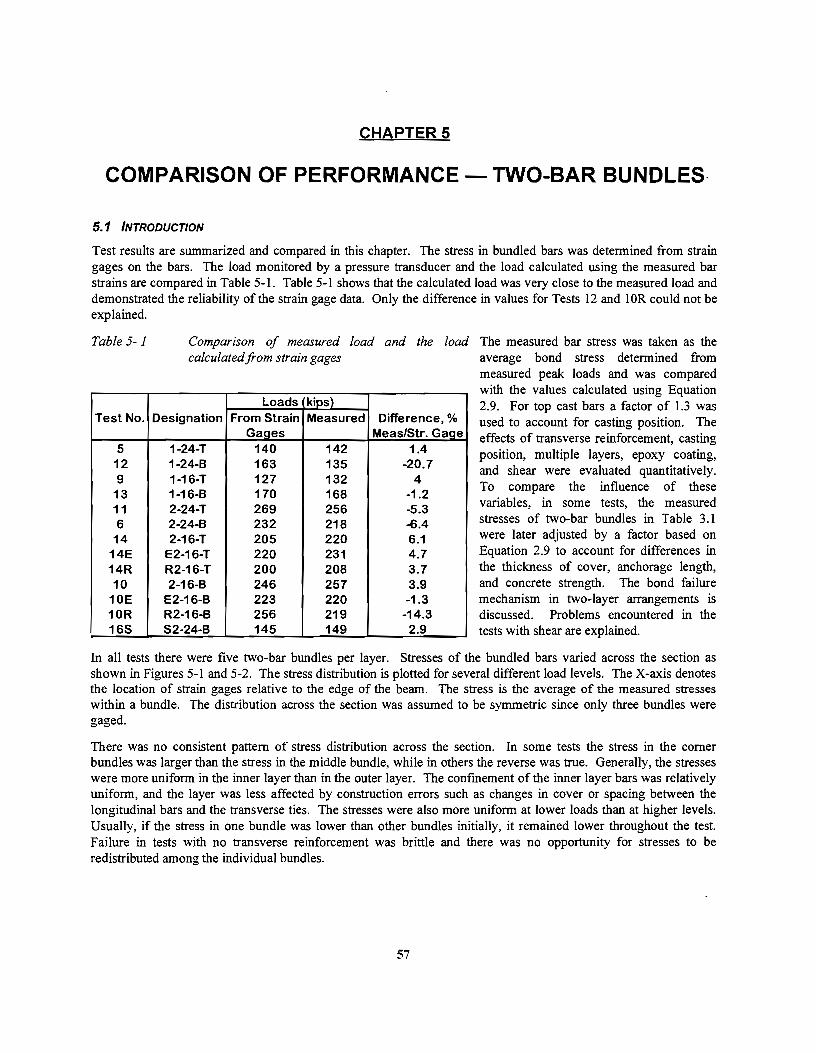
CHAPTERS
COMPARISON OF PERFORMANCE- TWO-BAR BUNDLES·
5.1 INTRODUCTION
Test results are summarized and compared in this chapter. The stress in bundled bars was determined from strain gages on the bars. The load monitored by a pressure transducer and the load calculated using the measured bar strains are compared in Table 5-l. Table 5-l shows that the calculated load was very close to the measured load and demonstrated the reliability of the strain gage data. Only the difference in values for Tests 12 and lOR could not be explained.
Table 5-1
Test No.
5 12 g 13 11 6 14
14E 14R 10
10E 10R 16S
Comparison of measured load and the load The measured bar stress was taken as the calculated from strain gages average bond stress determined from
Loads Designation From Strain
Gaqes 1-24-T 140 1-24-B 163 1-16-T 127 1-16-B 170 2-24-T 269 2-24-B 232 2-16-T 205
E2-16-T 220 R2-16-T 200 2-16-B 246
E2-16-B 223 R2-16-B 256 82-24-B 145
kips}_ Measured
142 135 132 168 256 218 220 231 208 257 220 219 149
Difference,% Meas/Str. Gage
1.4 -20.7
4 -1.2 -5.3 -6.4 6.1 4.7 3.7 3.9 -1.3
-14.3 2.9
measured peak loads and was compared with the values calculated using Equation 2.9. For top cast bars a factor of 1.3 was used to account for casting position. The effects of transverse reinforcement, casting position, multiple layers, epoxy coating, and shear were evaluated quantitatively. To compare the influence of these variables, in some tests, the measured stresses of two-bar bundles in Table 3.1 were later adjusted by a factor based on Equation 2.9 to account for differences in the thickness of cover, anchorage length, and concrete strength. The bond failure mechanism in two-layer arrangements is discussed. Problems encountered in the tests with shear are explained.
In all tests there were five two-bar bundles per layer. Stresses of the bundled bars varied across the section as shown in Figures 5-l and 5-2. The stress distribution is plotted for several different load levels. The X-axis denotes the location of strain gages relative to the edge of the beam. The stress is the average of the measured stresses within a bundle. The distribution across the section was assumed to be symmetric since only three bundles were gaged.
There was no consistent pattern of stress distribution across the section. In some tests the stress in the corner bundles was larger than the stress in the middle bundle, while in others the reverse was true. Generally, the stresses were more uniform in the inner layer than in the outer layer. The confmement of the inner layer bars was relatively uniform, and the layer was less affected by construction errors such as changes in cover or spacing between the longitudinal bars and the transverse ties. The stresses were also more uniform at lower loads than at higher levels. Usually, if the stress in one bundle was lower than other bundles initially, it remained lower throughout the test. Failure in tests with no transverse reinforcement was brittle and there was no opportunity for stresses to be redistributed among the individual bundles.
57
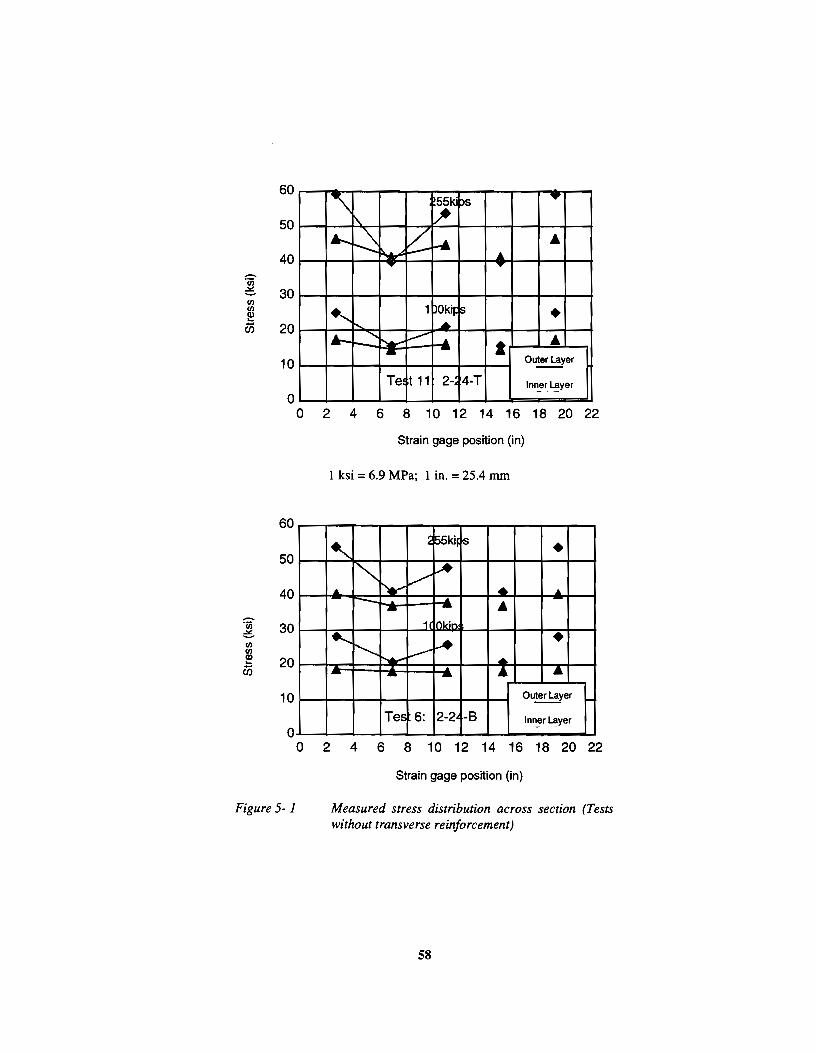
60
50
40 -"1i.i e. 30 UJ UJ (I) .... en 20
10
0
60
50
40
-"1i.i 30 e. UJ UJ (I)
20 .... en
10
0
Figure 5-1
"\ ~kl ps ... '\.
lA-... ~ ~ f--6 .. ..._... A. ,.. ,
i ' 1 poki~~ • _._ .._ ...... r-..-~ ...A. a .. - -
Outer Layer
Te t 11 2-: 4-T lnn~r~yer
0 2 4 6 8 10 12 14 16 18 20 22
Strain gage position (in)
1 ksi = 6.9 MPa; 1 in. = 25.4 mm
~ ~l55ki s •
"" v ~ --"- ~ -• _.... - ..... .. - -
1 IOkin
1 ..... f-.+ • "' ~ 1-- • - - - .. .. Outer layer
Tes 6: 2-2 B lnn_er ~yer
0 2 4 6 8 10 12 14 16 18 20 22
Strain gage position (in)
Measured stress distribution across section (Tests without transverse reinforcement)
58
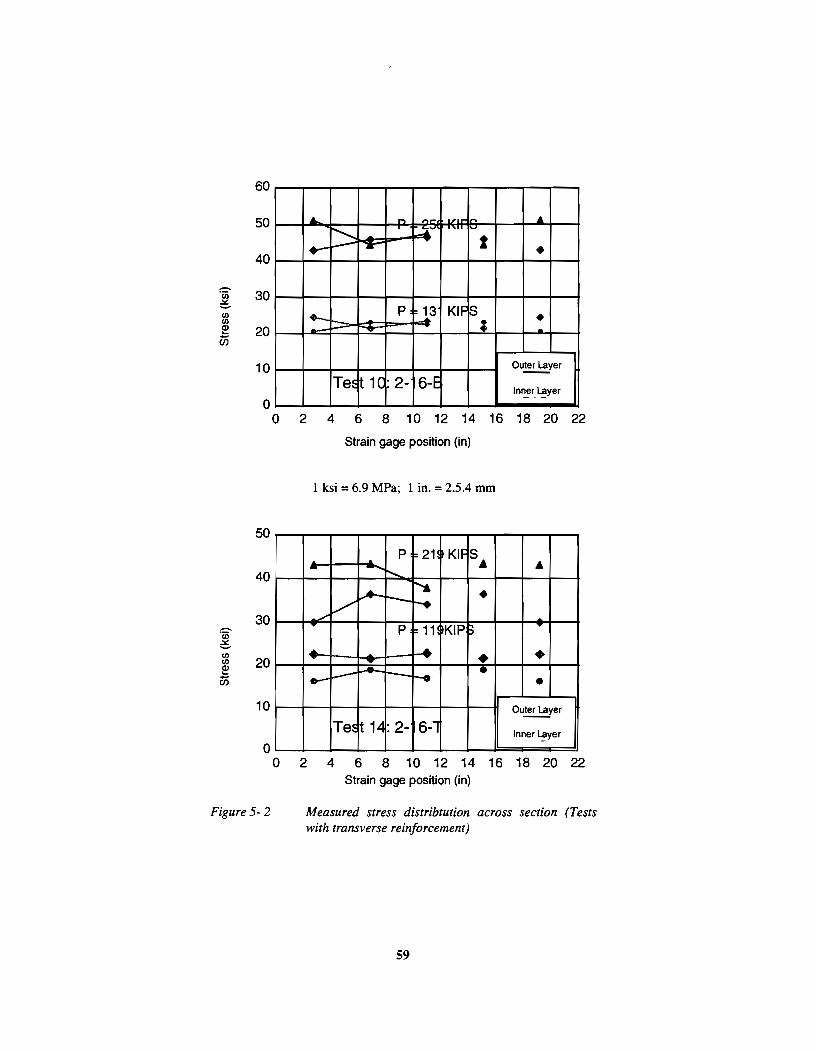
60
50
40
- 30 'Ci)
c. fl) fl)
~ 20 en
10
0
50
40
30 75 c. fl)
20 fl)
~ en
10
0
Figure 5-2
.. ...... ,.,,.., ,,, ... """'
.&
r--..... :...:1: r-'
...... ,__... ... t •
._ p _13 KIF ~ • -~'"'" ; .
Ou~er
Tes + 1C : 2- 6-E ln~r~yer
0 2 4 6 8 10 12 14 16 18 20 22
Strain gage position (in)
1 ksi = 6.9 MPa; 1 in. = 2.5.4 mm
-" p I= 21 KIF s,. - ...... , ..
A- 1"6 • / - r-. /
p I= 11 KIP:>
... A. • • ..,
....-r-- - r-o • • Outer layer
Tes t 14 :2- 6-1 Inner layer ---
0 2 4 6 8 10 12 14 16 18 20 22 Strain gage position (in)
Measured stress distribtution across section (Tests with transverse reinforcement)
59
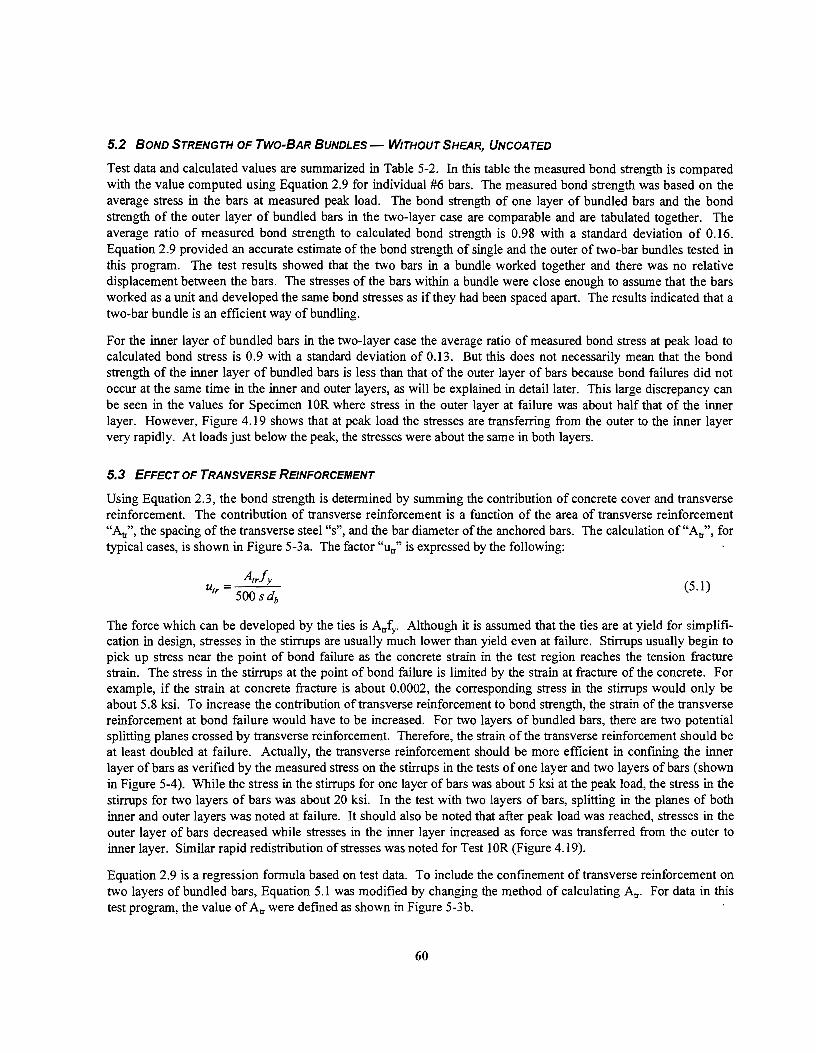
5.2 BOND STRENGTH OF TWO-BAR BUNDLES- WITHOUT SHEAR, UNCOATED
Test data and calculated values are summarized in Table 5-2. In this table the measured bond strength is compared with the value computed using Equation 2.9 for individual #6 bars. The measured bond strength was based on the average stress in the bars at measured peak load. The bond strength of one layer of bundled bars and the bond strength of the outer layer of bundled bars in the two-layer case are comparable and are tabulated together. The average ratio of measured bond strength to calculated bond strength is 0.98 with a standard deviation of 0.16. Equation 2.9 provided an accurate estimate of the bond strength of single and the outer of two-bar bundles tested in this program. The test results showed that the two bars in a bundle worked together and there was no relative displacement between the bars. The stresses of the bars within a bundle were close enough to assume that the bars worked as a unit and developed the same bond stresses as if they had been spaced apart. The results indicated that a two-bar bundle is an efficient way of bundling.
For the inner layer of bundled bars in the two-layer case the average ratio of measured bond stress at peak load to calculated bond stress is 0.9 with a standard deviation of 0.13. But this does not necessarily mean that the bond strength of the inner layer of bundled bars is less than that of the outer layer of bars because bond failures did not occur at the same time in the inner and outer layers, as will be explained in detail later. This large discrepancy can be seen in the values for Specimen lOR where stress in the outer layer at failure was about half that of the inner layer. However, Figure 4.19 shows that at peak load the stresses are transferring from the outer to the inner layer very rapidly. At loads just below the peak, the stresses were about the same in both layers.
5.3 EFFECT OF TRANSVERSE REINFORCEMENT
Using Equation 2.3, the bond strength is determined by summing the contribution of concrete cover and transverse reinforcement. The contribution of transverse reinforcement is a function of the area of transverse reinforcement "At:r", the spacing of the transverse steel "s", and the bar diameter of the anchored bars. The calculation of "At:r", for typical cases, is shown in Figure 5-3 a. The factor "ut:r" is expressed by the following:
(5.1)
The force which can be developed by the ties is At:rfy. Although it is assumed that the ties are at yield for simplification in design, stresses in the stirrups are usually much lower than yield even at failure. Stirrups usually begin to pick up stress near the point of bond failure as the concrete strain in the test region reaches the tension fracture strain. The stress in the stirrups at the point of bond failure is limited by the strain at fracture of the concrete. For example, if the strain at concrete fracture is about 0.0002, the corresponding stress in the stirrups would only be about 5.8 ksi. To increase the contribution of transverse reinforcement to bond strength, the strain of the transverse reinforcement at bond failure would have to be increased. For two layers of bundled bars, there are two potential splitting planes crossed by transverse reinforcement Therefore, the strain of the transverse reinforcement should be at least doubled at failure. Actually, the transverse reinforcement should be more efficient in confming the inner layer of bars as verified by the measured stress on the stirrups in the tests of one layer and two layers of bars (shown in Figure 5-4). While the stress in the stirrups for one layer of bars was about 5 ksi at the peak load, the stress in the stirrups for two layers of bars was about 20 ksi. In the test with two layers of bars, splitting in the planes of both inner and outer layers was noted at failure. It should also be noted that after peak load was reached, stresses in the outer layer of bars decreased while stresses in the inner layer increased as force was transferred from the outer to inner layer. Similar rapid redistribution of stresses was noted for Test 1 OR (Figure 4.19).
Equation 2.9 is a regression formula based on test data. To include the confmement of transverse reinforcement on two layers of bundled bars, Equation 5.1 was modified by changing the method of calculating At:r· For data in this test program, the value of At:r were defmed as shown in Figure 5-3 b.
60
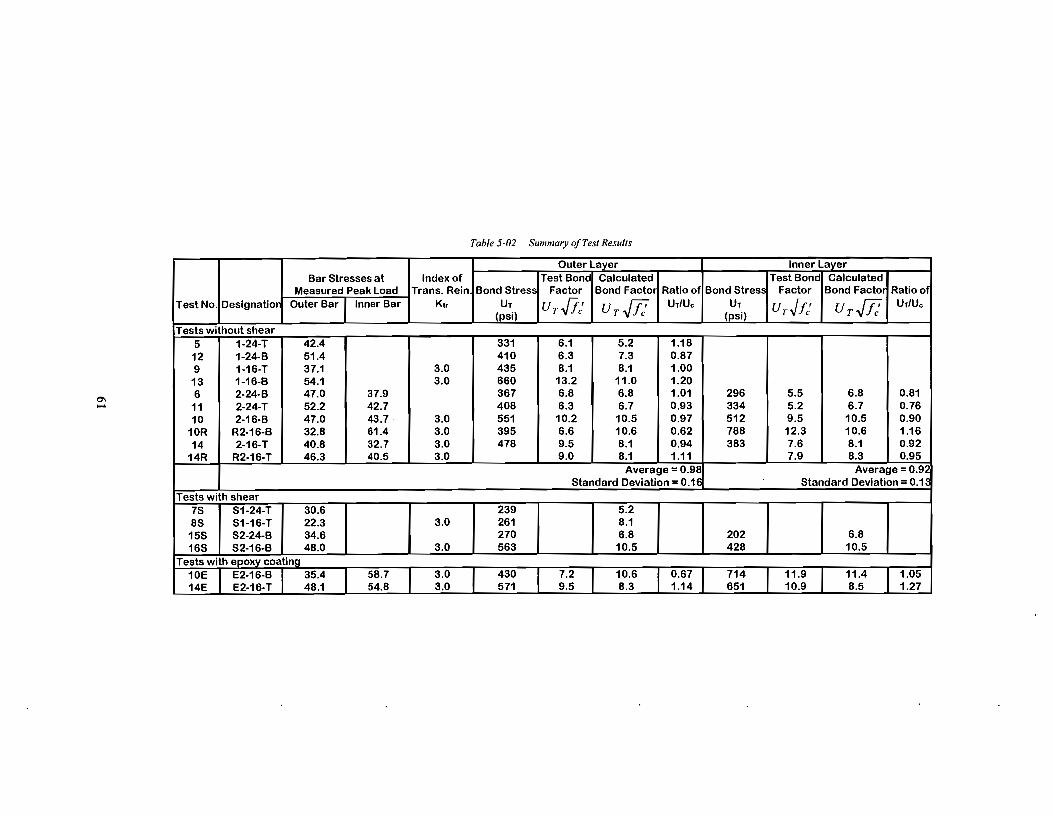
0'1 ....
Table 5-02 Summary of Test Results
Outer Layer Inner Layer Bar Stresses at Index of Test Bond Calculated Test Bond Calculated
Measured Peak Load Trans. Rein Bond Stress Factor Bond Factor Ratio of Bond Stress Factor Bond Factor Ratio of Test No. Oesignatior Outer Bar Inner Bar Ktr Ur U lJ: U IJ:• UriUc Ur U Iii U IJ:• UrfU.,
(psi) T'I/Jc T"'/Jc (psi} T'l/lc T"'/lc
Tests without shear 5 1-24-T 42.4 331 6.1 5.2 1.18
12 1-24-B 51.4 410 6.3 7.3 0.87 9 1-16-T 37.1 3.0 435 8.1 8.1 1.00
13 1-16-B 54.1 3.0 660 13.2 11.0 1.20 6 2-24-B 47.0 37.9 367 6.8 6.8 1.01 296 5.5 6.8 0.81
11 2-24-T 52.2 42.7 408 6.3 6.7 0.93 334 5.2 6.7 0.76 10 2-16-B 47.0 43.7 3.0 551 10.2 10.5 0.97 512 9.5 10.5 0.90
10R R2-16-B 32.8 61.4 3.0 395 6.6 10.6 0.62 788 12.3 10.6 1.16 14 2-16-T 40.8 32.7 3.0 478 9.5 8.1 0.94 383 7.6 8.1 0.92
14R R2·16·T 46.3 40.5 3.0 9.0 8.1 1.11 7.9 8.3 0.95 Average= 0.91l Average= 0.92
Standard Deviation= 0.1E Standard Deviation= 0.13 Tests with shear
7S S1-24-T 30.6 239 5.2 8S 81-16-T 22.3 3.0 261 8.1 15S 82-24-B 34.6 270 6.8 202 6.8 168 S2-16-B 48.0 3.0 563 10.5 428 10.5
Tests with epoxy coating
10E I E2-16-B I 35.4 I 58.7 I 3.0 I 430 1.7.2 I 10.6 I 0.67 I 714 I 11.9 I 11.4 I 1.05 14E E2-16-T 48.1 54.8 3.0 L 571 L 9.5 8.3 1.14 651 10.9 8.5 1.27
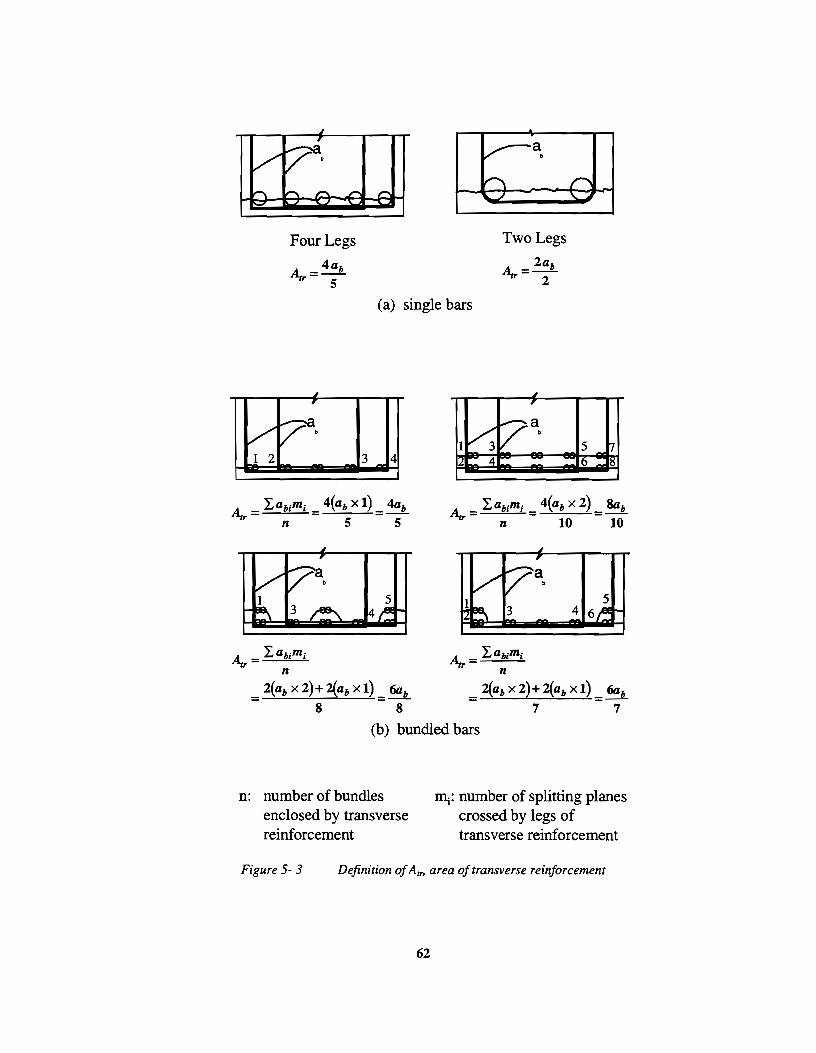
I 2
Four Legs
<t = 4ab ""tr 5
(a) single bars
lv; 3 4 4
Two Legs
Arr =lab 2
4 ,
t/a·
Arr = labimi Arr = labimi n n
5 [7 lb I!S
5 4 6
= 2(ab x 2)+ 2(ab x 1) = 6ab = 2(ab x 2)+ 2(ab X 1) _ 6ab 8 8 7 7
(b) bundled bars
n: number of bundles enclosed by transverse reinforcement
IDj: number of splitting planes crossed by legs of transverse reinforcement
Figure 5-3 Definition of A11., area of transverse reinforcement
62
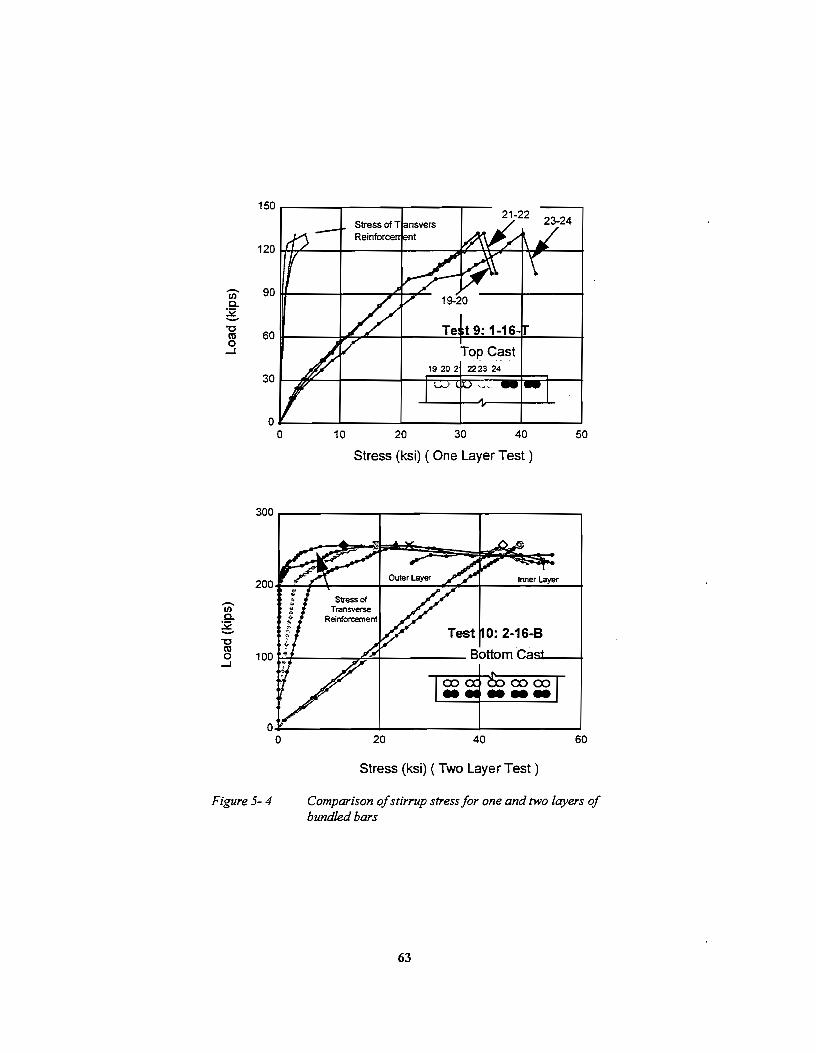
150
120
- 90 IJ) c.. g "0
60 ctl 0
...J
30
Stress (ksi) (One Layer Test)
300~----------~-----------r-----------,
200
-IJ) c. g
"0 ctl 0
...J 100
60
Stress (ksi) (Two Layer Test)
Figure 5-4 Comparison of stirrup stress for one and two layers of bundled bars
63
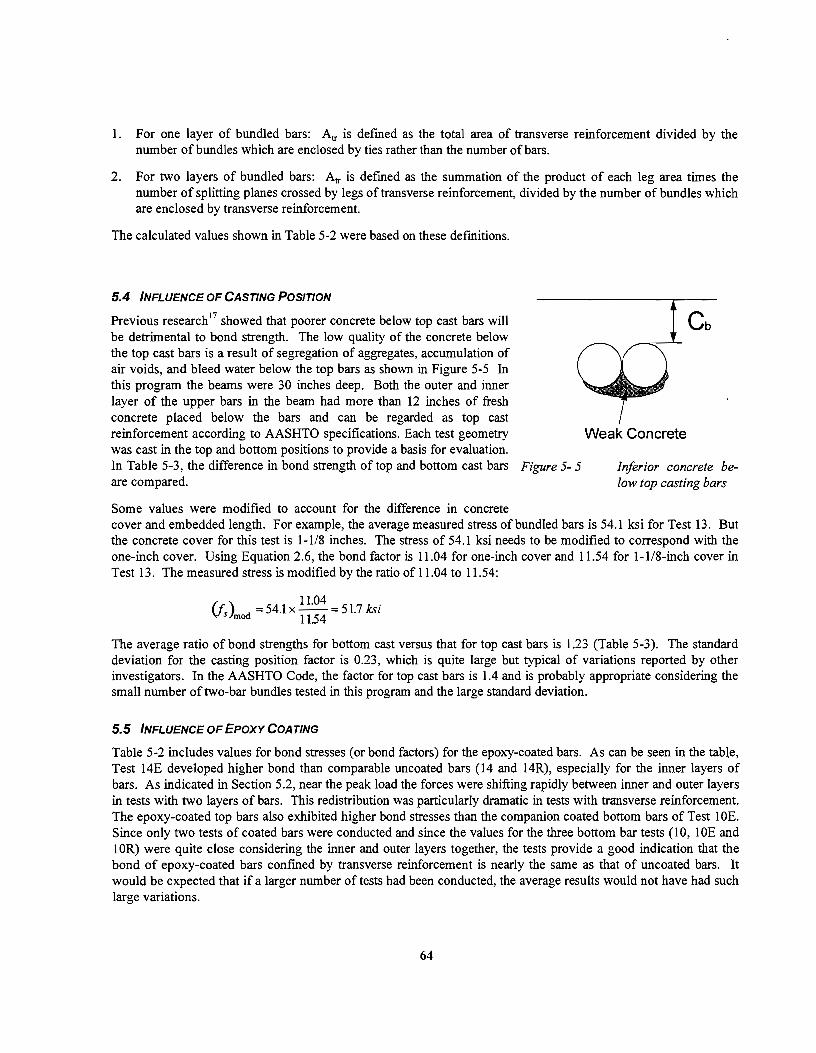
1. For one layer of bundled bars: Att is defmed as the total area of transverse reinforcement divided by the number of bundles which are enclosed by ties rather than the number of bars.
2. For two layers of bundled bars: Att is defmed as the summation of the product of each leg area times the number of splitting planes crossed by legs of transverse reinforcement, divided by the number of bundles which are enclosed by transverse reinforcement.
The calculated values shown in Table 5-2 were based on these defmitions.
5.4 INFLUENCE. OF CASTING POSITION
Previous research17 showed that poorer concrete below top cast bars will be detrimental to bond strength. The low quality of the concrete below the top cast bars is a result of segregation of aggregates, accumulation of air voids, and bleed water below the top bars as shown in Figure 5-5 In this program the beams were 30 inches deep. Both the outer and inner layer of the upper bars in the beam had more than 12 inches of fresh concrete placed below the bars and can be regarded as top cast reinforcement according to AASHTO specifications. Each test geometry was cast in the top and bottom positions to provide a basis for evaluation. In Table 5-3, the difference in bond strength of top and bottom cast bars are compared.
Some values were modified to account for the difference in concrete
Weak Concrete
Figure 5- 5 Inferior concrete below top casting bars
cover and embedded length. For example, the average measured stress of bundled bars is 54.1 ksi for Test 13. But the concrete cover for this test is 1-1/8 inches. The stress of 54.1 ksi needs to be modified to correspond with the one-inch cover. Using Equation 2.6, the bond factor is 11.04 for one-inch cover and 11.54 for 1-118-inch cover in Test 13. The measured stress is modified by the ratio of 11.04 to 11.54:
11.04 . VsJ od = 54.1 X-= 51.7 kst m 1154
The average ratio of bond strengths for bottom cast versus that for top cast bars is 1.23 (Table 5-3). The standard deviation for the casting position factor is 0.23, which is quite large but typical of variations reported by other investigators. In the AASHTO Code, the factor for top cast bars is 1.4 and is probably appropriate considering the small number of two-bar bundles tested in this program and the large standard deviation.
5.5 INFLUENCE. OF EPOXY COATING
Table 5-2 includes values for bond stresses (or bond factors) for the epoxy-coated bars. As can be seen in the table, Test 14E developed higher bond than comparable uncoated bars (14 and 14R), especially for the inner layers of bars. As indicated in Section 5.2, near the peak load the forces were shifting rapidly between inner and outer layers in tests with two layers of bars. This redistribution was particularly dramatic in tests with transverse reinforcement. The epoxy-coated top bars also exhibited higher bond stresses than the companion coated bottom bars of Test IOE. Since only two tests of coated bars were conducted and since the values for the three bottom bar tests (10, lOE and I OR) were quite close considering the inner and outer layers together, the tests provide a good indication that the bond of epoxy-coated bars confined by transverse reinforcement is nearly the same as that of uncoated bars. It would be expected that if a larger number of tests had been conducted, the average results would not have had such large variations.
64
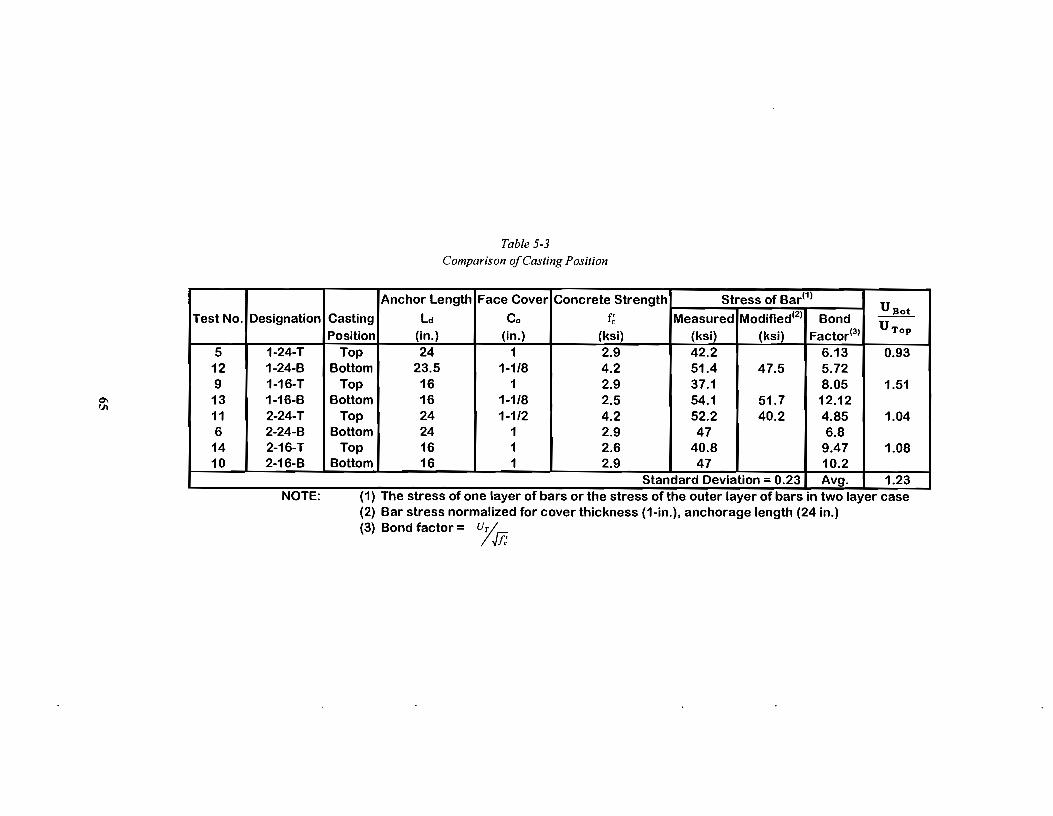
0\ t.ll
Test No.
5 12 9 13 11 6 14 10
Designation
1-24-T 1-24-B 1-16-T 1-16-B 2-24-T 2-24-B 2-16-T 2-16-B
NOTE:
Casting Position
Top Bottom
Top Bottom
Top Bottom
Top Bottom
Table 5-3 Comparison of Casting Position
Anchor Length Face Cover Concrete Strength Stress of Bar11 l
Ld Co f' c Measured Modified12l Bond (in.) (in.) (ksi) (ksi) (ksi) Factor13l
24 1 2.9 42.2 6.13 23.5 1-1/8 4.2 51.4 47.5 5.72 16 1 2.9 37.1 8.05 16 1-1/8 2.5 54.1 51.7 12.12 24 1-1/2 4.2 52.2 40.2 4.85 24 1 2.9 47 6.8 16 1 2.6 40.8 9.47 16 1 2.9 47 10.2
Standard Deviation - 0.23 Avg.
UBot
UTop
0.93
1.51
1.04
1.08
1.23 (1) The stress of one layer of bars or the stress of the outer layer of bars in two layer case (2) Bar stress normalized for cover thickness (1-in.), anchorage length (24 in.) (3) Bond factor= lJJJ
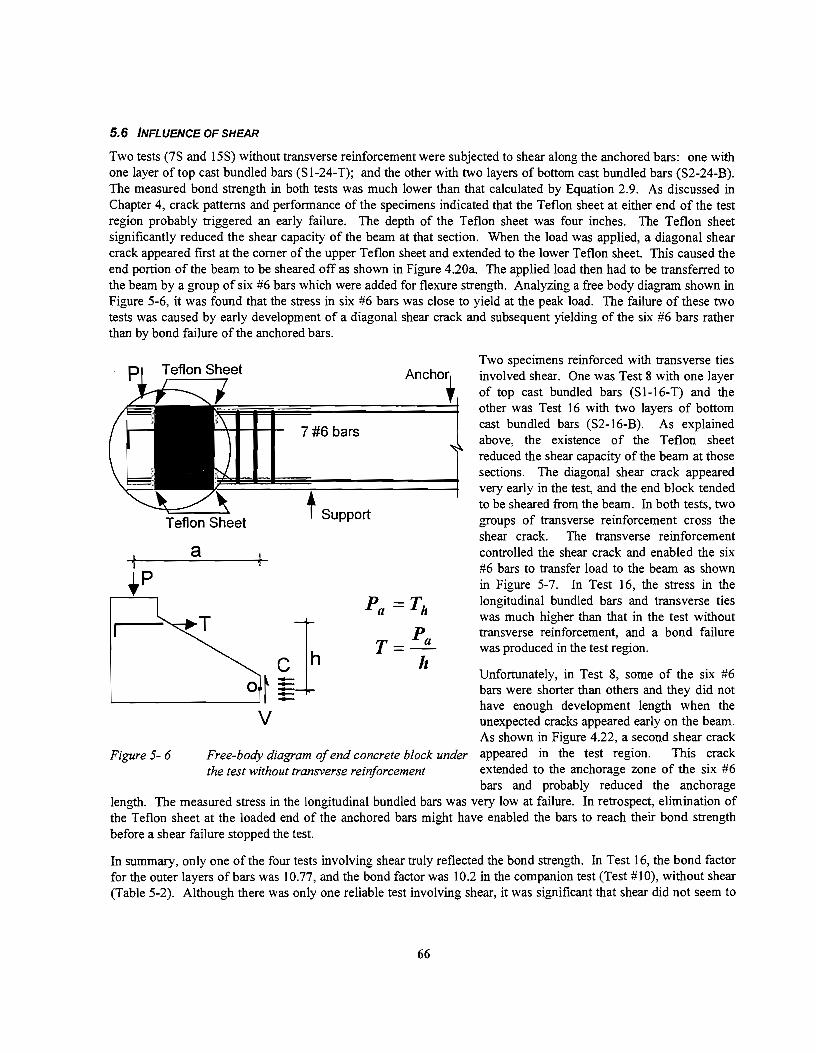
5.6 INFLUENCE OF SHEAR
Two tests (7S and 15S) without transverse reinforcement were subjected to shear along the anchored bars: one with one layer of top cast bundled bars (S 1-24-T); and the other with two layers of bottom cast bundled bars (S2-24-B). The measured bond strength in both tests was much lower than that calculated by Equation 2.9. As discussed in Chapter 4, crack patterns and performance of the specimens indicated that the Teflon sheet at either end of the test region probably triggered an early failure. The depth of the Teflon sheet was four inches. The Teflon sheet significantly reduced the shear capacity of the beam at that section. When the load was applied, a diagonal shear crack appeared first at the comer of the upper Teflon sheet and extended to the lower Teflon sheet. This caused the end portion of the beam to be sheared off as shown in Figure 4.20a. The applied load then had to be transferred to the beam by a group of six #6 bars which were added for flexure strength. Analyzing a free body diagram shown in Figure 5-6, it was found that the stress in six #6 bars was close to yield at the peak load. The failure of these two tests was caused by early development of a diagonal shear crack and subsequent yielding of the six #6 bars rather than by bond failure of the anchored bars.
Anchm~
7 #6 bars
Teflon Sheet Support
Two specimens reinforced with transverse ties involved shear. One was Test 8 with one layer of top cast bundled bars (S 1-16-T) and the other was Test 16 with two layers of bottom cast bundled bars (S2-16-B). As explained above, the existence of the Teflon sheet reduced the shear capacity of the beam at those sections. The diagonal shear crack appeared very early in the test, and the end block tended to be sheared from the beam. In both tests, two groups of transverse reinforcement cross the shear crack. The transverse reinforcement controlled the shear crack and enabled the six #6 bars to transfer load to the beam as shown in Figure 5-7. In Test 16, the stress in the longitudinal bundled bars and transverse ties was much higher than that in the test without transverse reinforcement, and a bond failure was produced in the test region.
a
Figure 5-6
Unfortunately, in Test 8, some of the six #6 bars were shorter than others and they did not have enough development length when the unexpected cracks appeared early on the beam. As shown in Figure 4.22, a second shear crack
Free-body diagram of end concrete block under appeared in the test region. This crack the test without transverse reinforcement extended to the anchorage zone of the six #6
bars and probably reduced the anchorage length. The measured stress in the longitudinal bundled bars was very low at failure. In retrospect, elimination of the Teflon sheet at the loaded end of the anchored bars might have enabled the bars to reach their bond strength before a shear failure stopped the test.
In summary, only one of the four tests involving shear truly reflected the bond strength. In Test 16, the bond factor for the outer layers of bars was 10.77, and the bond factor was 10.2 in the companion test (Test #10), without shear (Table 5-2). Although there was only one reliable test involving shear, it was significant that shear did not seem to
66
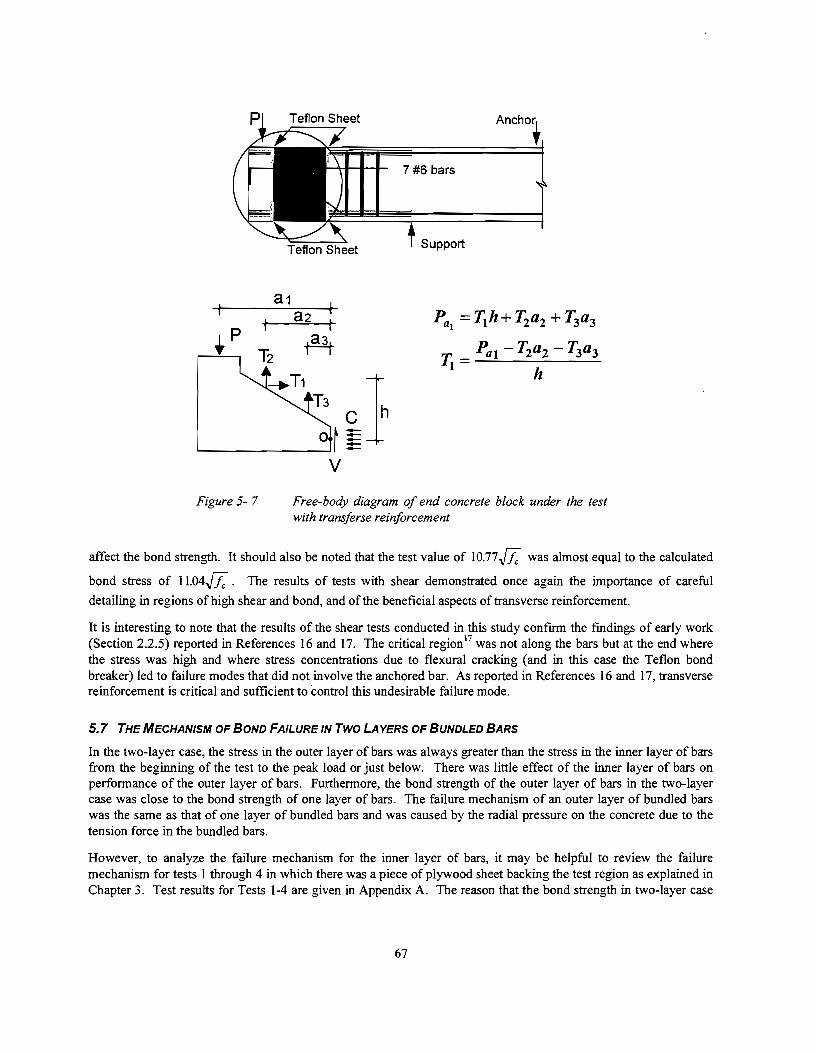
t
Ancho~
7 #6 bars
Support
Pal Tth+ T2a2 + T3a3
Pat- T2a2- T3a3 1}=-.;;;.._ ____ _ h
T3 C 1h ~...-______ o.....Jr § 1 Figure 5-7
v Free-body diagram of end concrete block under the test with transferse reinforcement
affect the bond strength. It should also be noted that the test value of 10.77 .[1; was almost equal to the calculated
bond stress of 11.04.[1; . The results of tests with shear demonstrated once again the importance of careful
detailing in regions of high shear and bond, and of the beneficial aspects of transverse reinforcement.
It is interesting to note that the results of the shear tests conducted in this study confirm the fmdings of early work (Section 2.2.5) reported in References 16 and 17. The critical region 17 was not along the bars but at the end where the stress was high and where stress concentrations due to flexural cracking (and in this case the Teflon bond breaker) led to failure modes that did not involve the anchored bar. As reported in References 16 and 17, transverse reinforcement is critical and sufficient to control this undesirable failure mode.
5.7 THE MECHANISM OF BOND FAILURE IN TWO LAYERS OF BUNDLED BARS
In the two-layer case, the stress in the outer layer of bars was always greater than the stress in the inner layer of bars from the beginning of the test to the peak load or just below. There was little effect of the inner layer of bars on performance of the outer layer of bars. Furthermore, the bond strength of the outer layer of bars in the two-layer case was close to the bond strength of one layer of bars. The failure mechanism of an outer layer of bundled bars was the same as that of one layer of bundled bars and was caused by the radial pressure on the concrete due to the tension force in the bundled bars.
However, to analyze the failure mechanism for the inner layer of bars, it may be helpful to review the failure mechanism for tests 1 through 4 in which there was a piece of plywood sheet backing the test region as explained in Chapter 3. Test results for Tests 1-4 are given in Appendix A. The reason that the bond strength in two-layer case
67
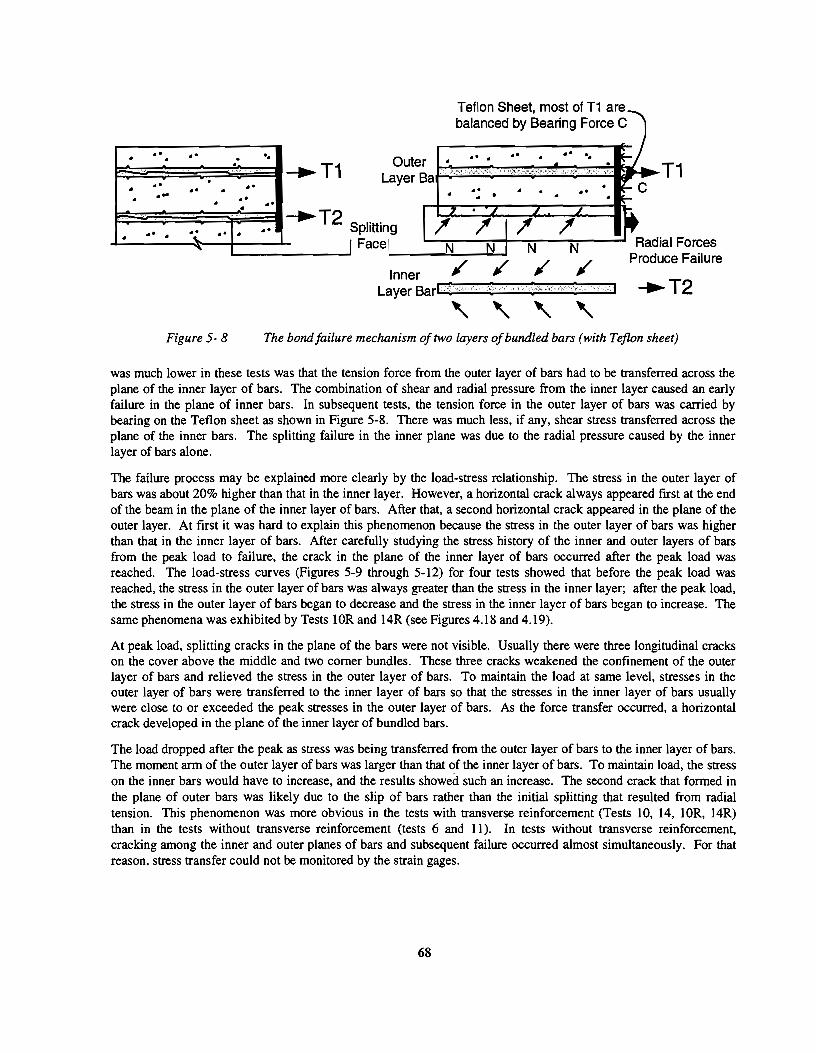
. .. .. . . . .. . .. .. . .. . . ... . . . .
.. .. . ·~ . . .. ...
Figure 5-8
. . __...... T1
... __....T2 ..
Teflon Sheet, most of T1 are balanced by Bearing Force C
Splitting [ Face N
L....---..!.:.--...U.....I N N N
/ / / / g, , :,,,, :
' ' '
Radial Forces Produce Failure
...,_T2
The bond failure mechanism of two layers of bundled bars (with Teflon sheet)
was much lower in these tests was that the tension force from the outer layer of bars had to be transferred across the plane of the inner layer of bars. The combination of shear and radial pressure from the inner layer caused an early failure in the plane of inner bars. In subsequent tests, the tension force in the outer layer of bars was carried by bearing on the Teflon sheet as shown in Figure 5-8. There was much less, if any, shear stress transferred across the plane of the inner bars. The splitting failure in the inner plane was due to the radial pressure caused by the inner layer of bars alone.
The failure process may be explained more clearly by the load-stress relationship. The stress in the outer layer of bars was about 20% higher than that in the inner layer. However, a horizontal crack always appeared first at the end of the beam in the plane of the inner layer of bars. After that, a second horizontal crack appeared in the plane of the outer layer. At first it was hard to explain this phenomenon because the stress in the outer layer of bars was higher than that in the inner layer of bars. After carefully studying the stress history of the inner and outer layers of bars from the peak load to failure, the crack in the plane of the inner layer of bars occurred after the peak load was reached. The load-stress curves (Figures 5-9 through 5-12) for four tests showed that before the peak load was reached, the stress in the outer layer of bars was always greater than the stress in the inner layer; after the peak load, the stress in the outer layer of bars began to decrease and the stress in the inner layer of bars began to increase. The same phenomena was exhibited by Tests lOR and 14R (see Figures 4.18 and 4.19).
At peak load, splitting cracks in the plane of the bars were not visible. Usually there were three longitudinal cracks on the cover above the middle and two comer bundles. These three cracks weakened the confinement of the outer layer of bars and relieved the stress in the outer layer of bars. To maintain the load at same level, stresses in the outer layer of bars were transferred to the inner layer of bars so that the stresses in the inner layer of bars usually were close to or exceeded the peak stresses in the outer layer of bars. As the force transfer occurred, a horizontal crack developed in the plane of the inner layer of bundled bars.
The load dropped after the peak as stress was being transferred from the outer layer of bars to the inner layer of bars. The moment arm of the outer layer of bars was larger than that of the inner layer of bars. To maintain load, the stress on the inner bars would have to increase, and the results showed such an increase. The second crack that formed in the plane of outer bars was likely due to the slip of bars rather than the initial splitting that resulted from radial tension. This phenomenon was more obvious in the tests with transverse reinforcement (Tests 10, 14, lOR, 14R) than in the tests without transverse reinforcement (tests 6 and 11). In tests without transverse reinforcement, cracking among the inner and outer planes of bars and subsequent failure occurred almost simultaneously. For that reason, stress transfer could not be monitored by the strain gages.
68
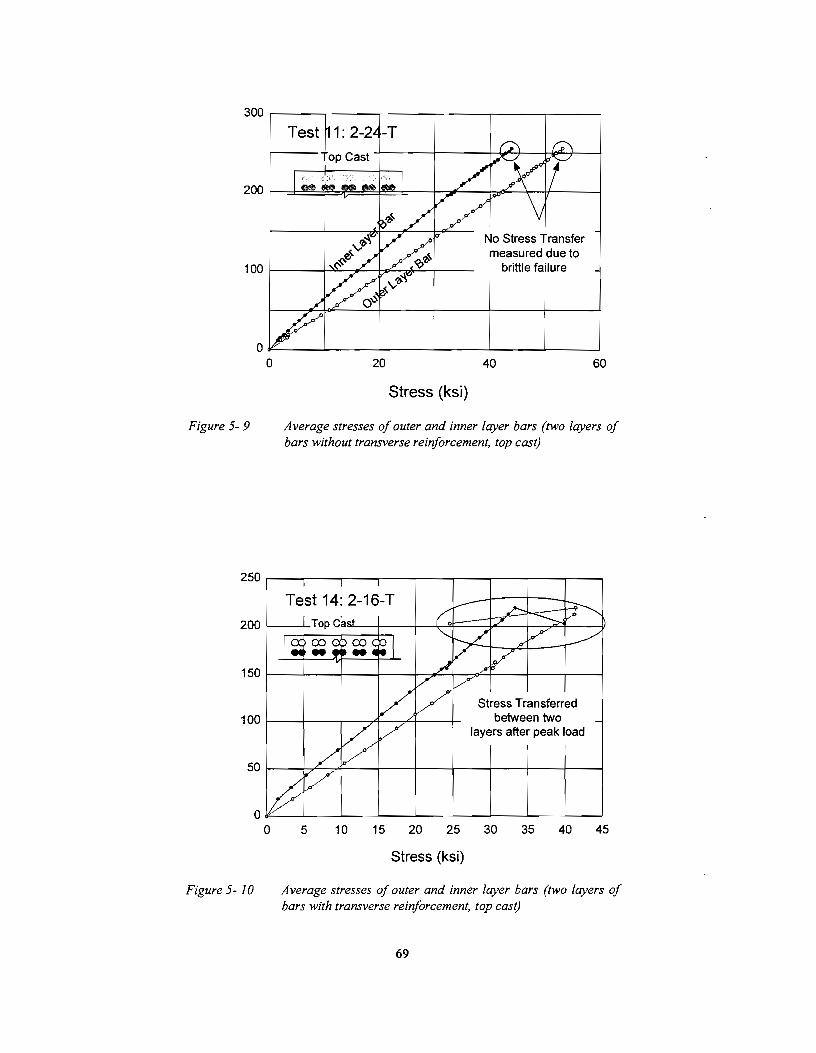
Figure 5-9
0
Figure 5-10
Stress (ksi)
Average stresses of outer and inner layer bars (two layers of bars without transverse reinforcement, top cast)
5 10 15 20 25
Stress (ksi)
Stress Transferred between 1wo
layers after peak load
30 35 40 45
Average stresses of outer and inner layer bars {two layers of bars with transverse reinforcement, top cast)
69
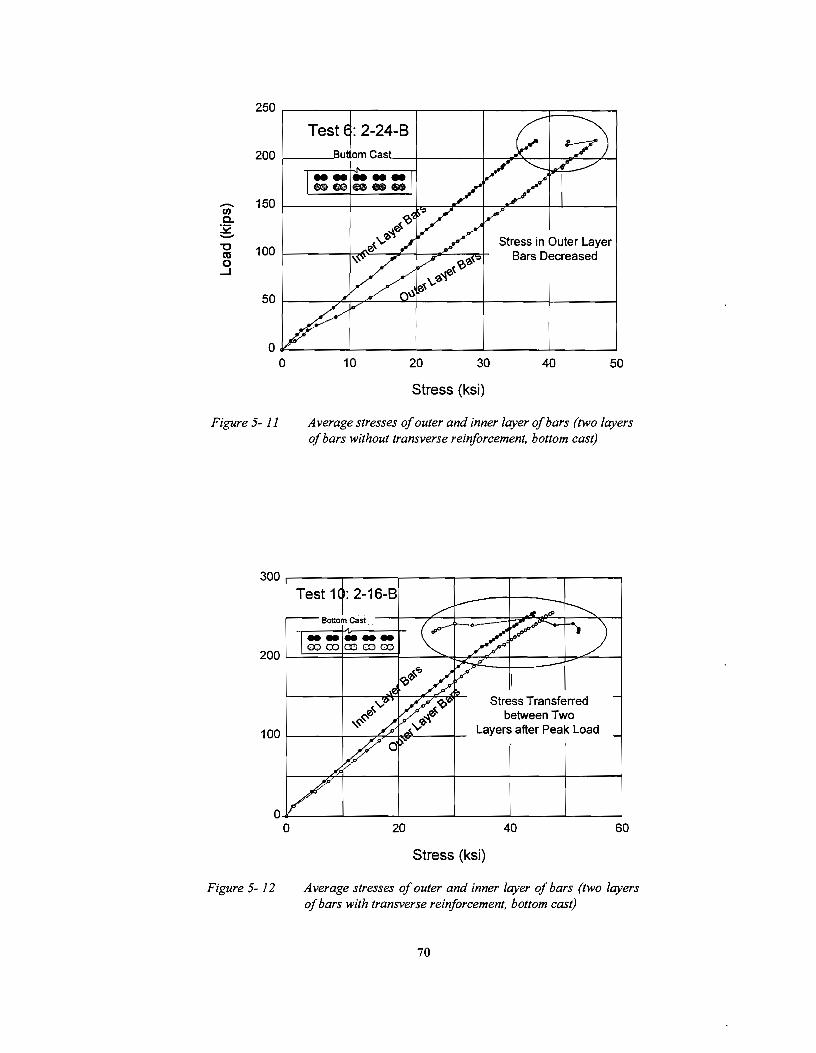
-U) a.
:52 -"0 ca 0
....J
Stress in Outer Layer Bars Decreased
0?-------~------~------~------~----~ 0
Figure 5-11
10 20 30 40 50
Stress (ksi)
Average stresses of outer and inner layer of bars (two layers of bars without transverse reinforcement, bottom cast)
Stress Transferred between Two
Layers after Peak Load
0~-----L------~----~----~----------~ 0
Figure 5-12
20 40 60
Stress (ksi)
Average stresses of outer and inner layer of bars (two layers of bars with transverse reinforcement, bottom cast)
70
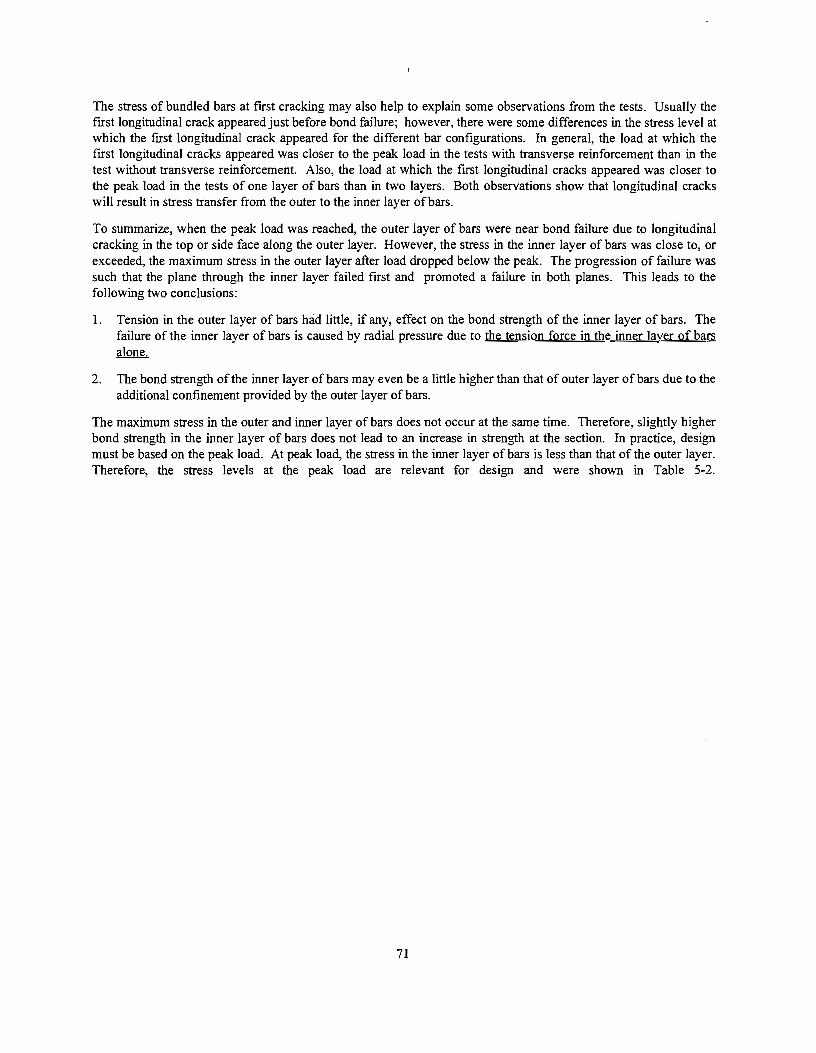
The stress of bundled bars at first cracking may also help to explain some observations from the tests. Usually the first longitudinal crack appeared just before bond failure; however, there were some differences in the stress level at which the frrst longitudinal crack appeared for the different bar configurations. In general, the load at which the first longitudinal cracks appeared was closer to the peak load in the tests with transverse reinforcement than in the test without transverse reinforcement. Also, the load at which the first longitudinal cracks appeared was closer to the peak load in the tests of one layer of bars than in two layers. Both observations show that longitudinal cracks will result in stress transfer from the outer to the inner layer of bars.
To summarize, when the peak load was reached, the outer layer of bars were near bond failure due to longitudinal cracking in the top or side face along the outer layer. However, the stress in the inner layer of bars was close to, or exceeded, the maximum stress in the outer layer after load dropped below the peak. The progression of failure was such that the plane through the inner layer failed first and promoted a failure in both planes. This leads to the following two conclusions:
1. Tension in the outer layer of bars had little, if any, effect on the bond strength of the inner layer of bars. The failure of the inner layer of bars is caused by radial pressure due to the tension force in the inner layer of bars alone.
2. The bond strength of the inner layer of bars may even be a little higher than that of outer layer of bars due to the additional confinement provided by the outer layer of bars.
The maximum stress in the outer and inner layer of bars does not occur at the same time. Therefore, slightly higher bond strength in the inner layer of bars does not lead to an increase in strength at the section. In practice, design must be based on the peak load. At peak load, the stress in the inner layer ofbars is less than that of the outer layer. Therefore, the stress levels at the peak load are relevant for design and were shown in Table 5-2.
71

72
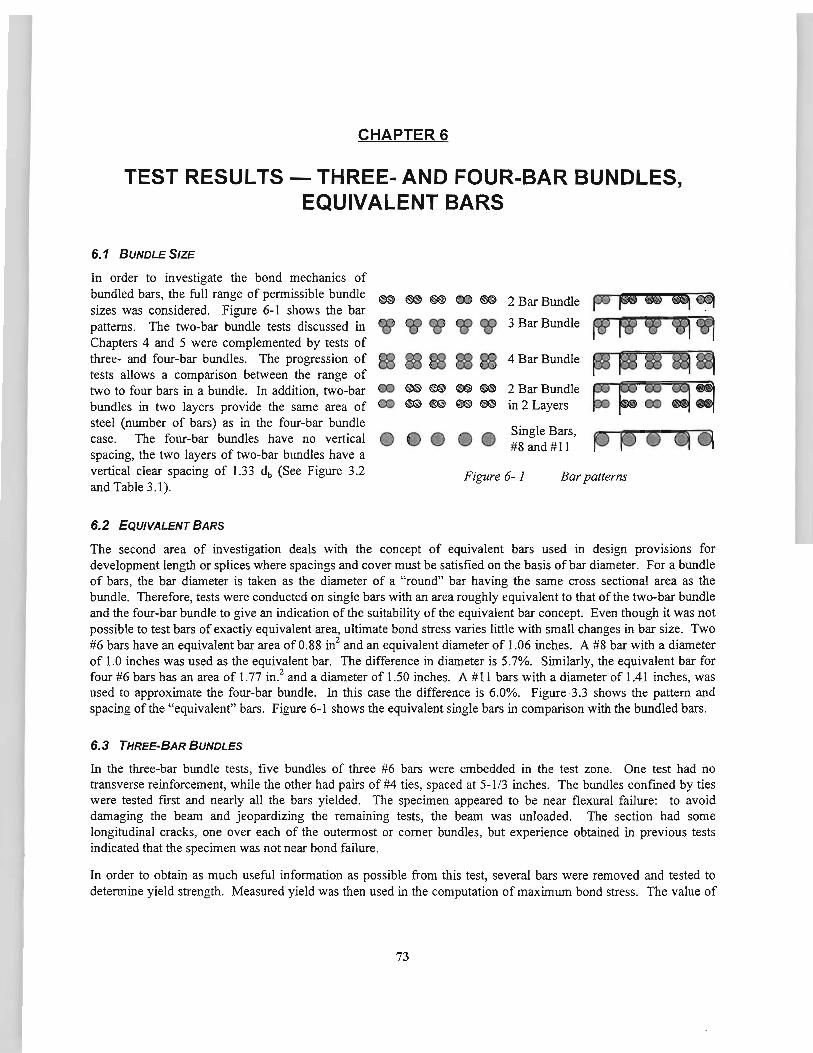
CHAPTER 6
TEST RESULTS- THREE .. AND FOUR .. BAR BUNDLES, EQUIVALENT BARS
6.1 BUNDLE SIZE
In order to investigate the bond mechanics of bundled bars, the full range of permissible bundle sizes was considered. Figure 6-1 shows the bar patterns. The two-bar bundle tests discussed in Chapters 4 and 5 were complemented by tests of three- and four-bar bundles. The progression of tests allows a comparison between the range of two to four bars in a bundle. In addition, two-bar bundles in two layers provide the same area of steel (number of bars) as in the four-bar bundle
N ~- ro ~
~CCf'fJW<o>
ffiffiffiffiOO 00 -- ~-ex:> -- --
2 Bar Bundle
3 Bar Bundle
4 Bar Bundle
2 Bar Bundle in 2 Layers
Single Bars, #8 and #II
~~ II ~~ ~~~~~
case. The four-bar bundles have no vertical Q spacing, the two layers of two-bar bundles have a vertical clear spacing of 1.33 db (See Figure 3.2 and Table 3.1).
Figure 6- 1 Bar patterns
6.2 EQUIVALENT BARS
The second area of investigation deals with the concept of equivalent bars used in design proviSions for development length or splices where spacings and cover must be satisfied on the basis of bar diameter. For a bundle of bars, the bar diameter is taken as the diameter of a "round" bar having the same cross sectional area as the bundle. Therefore, tests were conducted on single bars with an area roughly equivalent to that of the two-bar bundle and the four-bar bundle to give an indication of the suitability of the equivalent bar concept. Even though it was not possible to test bars of exactly equivalent area, ultimate bond stress varies little with small changes in bar size. Two #6 bars have an equivalent bar area of0.88 in2 and an equivalent diameter of 1.06 inches. A #8 bar with a diameter of 1.0 inches was used as the equivalent bar. The difference in diameter is 5.7%. Similarly, the equivalent bar for four #6 bars has an area of 1.77 in? and a diameter of 1.50 inches. A #11 bars with a diameter of 1.41 inches, was used to approximate the four-bar bundle. In this case the difference is 6.0%. Figure 3.3 shows the pattern and spacing of the "equivalent" bars. Figure 6-1 shows the equivalent single bars in comparison with the bundled bars.
6.3 THREE-BAR BUNDLES
In the three-bar bundle tests, five bundles of three #6 bars were embedded in the test zone. One test had no transverse reinforcement, while the other had pairs of #4 ties, spaced at 5-113 inches. The bundles confmed by ties were tested first and nearly all the bars yielded. The specimen appeared to be near flexural failure: to avoid damaging the beam and jeopardizing the remaining tests, the beam was unloaded. The section had some longitudinal cracks, one over each of the outermost or comer bundles, but experience obtained in previous tests indicated that the specimen was not near bond failure.
In order to obtain as much useful information as possible from this test, several bars were removed and tested to determine yield strength. Measured yield was then used in the computation of maximum bond stress. The value of
73
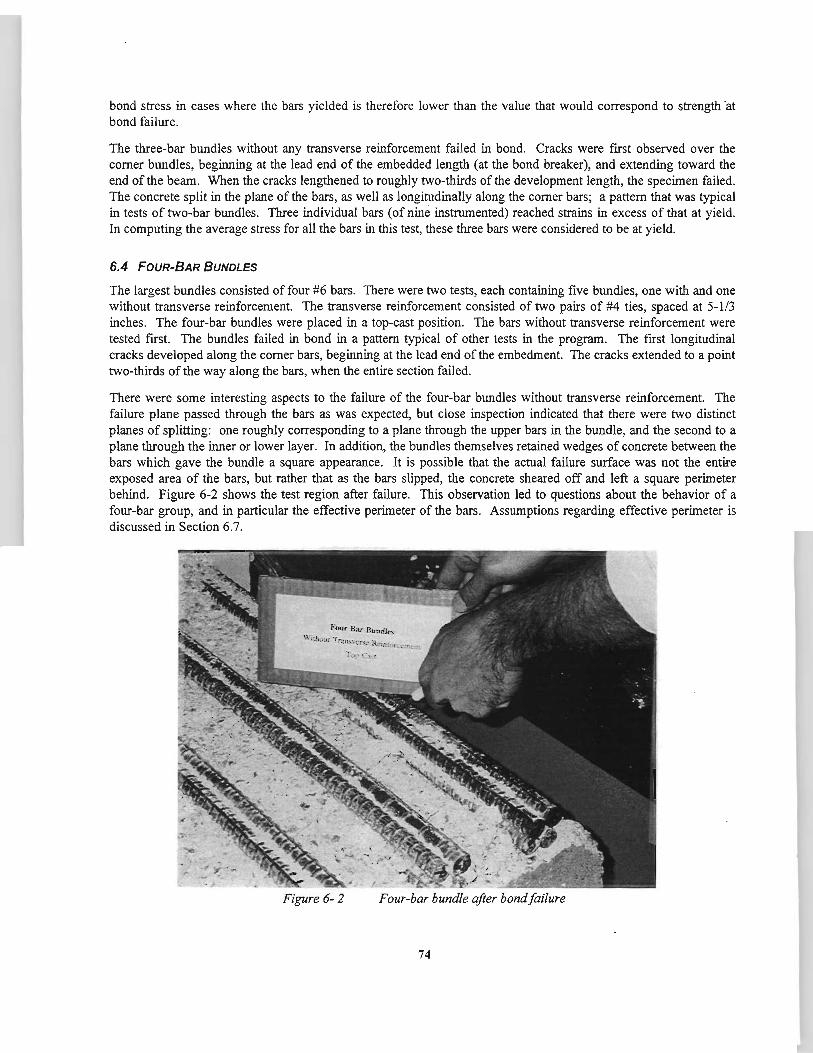
bond stress in cases where the bars yielded is therefore lower than the value that would correspond to strength ·at bond failure.
The three-bar bundles without any transverse reinforcement failed in bond. Cracks were first observed over the comer bundles, beginning at the lead end of the embedded length (at the bond breaker), and extending toward the end of the beam. When the cracks lengthened to roughly two-thirds of the development length, the specimen failed. The concrete split in the plane of the bars, as well as longitudinally along the comer bars; a pattern that was typical in tests of two-bar bundles. Three individual bars (of nine instrumented) reached strains in excess of that at yield. In computing the average stress for all the bars in this test, these three bars were considered to be at yield.
6.4 FOUR·BAR BUNDLES
The largest bundles consisted of four #6 bars. There were two tests, each containing five bundles, one with and one without transverse reinforcement. The transverse reinforcement consisted of two pairs of #4 ties, spaced at 5-113 inches. The four-bar bundles were placed in a top-cast position. The bars without transverse reinforcement were tested first. The bundles failed in bond in a pattern typical of other tests in the program. The first longitudinal cracks developed along the comer bars, beginning at the lead end of the embedment. The cracks extended to a point two-thirds of the way along the bars, when the entire section failed.
There were some interesting aspects to the failure of the four-bar bundles without transverse reinforcement. The failure plane passed through the bars as was expected, but close inspection indicated that there were two distinct planes of splitting: one roughly corresponding to a plane through the upper bars in the bundle, and the second to a plane through the inner or lower layer. In addition, the bundles themselves retained wedges of concrete between the bars which gave the bundle a square appearance. It is possible that the actual failure surface was not the entire exposed area of the bars, but rather that as the bars slipped, the concrete sheared off and left a square perimeter behind. Figure 6-2 shows the test region after failure. This observation led to questions about the behavior of a four-bar group, and in particular the effective perimeter of the bars. Assumptions regarding effective perimeter is discussed in Section 6.7.
Figure 6-2 Four-bar bundle after bond failure
74
The four-bar bundles with transverse ties also failed in bond. Cracks developed along the comer bars and, toward the end of the test, a shorter longitudinal crack fonned over the middle bundle. The bond failure in this test was not as dramatic as the unreinforced case, and the cover did not actually spall off as in the previous test. At failure the cover split over the ties as well as in the plane of the bars; and while the concrete was clearly de bonded, it did not come off cleanly or penn it a clear detennination of the failure surface. The confmement provided by the transverse reinforcement contributed to the difficulty in inspecting and defming the failure surface. None of the bars in either of the four-bar bundle tests reached yield.
6.5 SINGLE #8 BARS
The tests of single #8 bars were designed for comparison with bundles of equivalent area, two #6 bars in this case. The specimen contained five #8 bars; one test region with transverse ties and one without. The bars in both tests reached yield, and the tests had to be stopped to avoid excessive damage to the beam before the remaining tests could be perfonned. The unreinforced case showed some slight cracking over the comer bars, but the section with transverse ties showed no signs of distress when the test was tenninated. A bar was removed from the specimen and tested to detennine yield strength for use in ultimate strength computations. Because of this, the tests in which the bars yielded do not provide a measure of the strength at bond failure.
6.6 SINGLE#11 BARS
A single layer of five #11 bars was tested for comparison with bundles having four #6 bars. As with the other tests, one test region was reinforced with transverse steel consisting of two pairs of #4 ties spaced at 5-113 inches, while the other was unreinforced. The test region without any ties had a dramatic bond failure, with cracks once again initiating at the lead end of the embedment and progressing longitudinally along the outennost (comer) bars until the entire region suddenly split. The failure surfaces passed through the plane of the bars and included the longitudinal cracks that fonned around the comer bars.
The section reinforced with transverse steel also experienced a bond failure, although the ties kept the cover from spalling suddenly. Cracks fonned over the bars at the edge of the beam first, and over the middle bar and the ties at failure. None of the bars in either test approached the nominal yield stress of the steel.
6. 7 EFFECTIVE PERIMETER OF BUNDLED BARS
To make comparisons among the various test results, bar stresses detennined from strains were converted to unifonn or average bond stresses. Bond stress is the shear stress at the interface of the rebar and concrete. It allows force in the steel to be transferred to the surrounding concrete. To minimize the influence of concrete strength, the
bond strength was nonnalized by J7! . The equation for bond stress is:
where As total area of steel in bundle
f, steel stress at failure
anchorage length
Pe effective perimeter of bundle
In order to perfonn the computation for bundled bars, an effective perimeter had to be defmed.
Bond stress is defmed as the force in a bar or bundle, divided by the surface area of the bar being developed. Surface area for a single round bar is simply its length times its circumference, but the surface of a bundle is a less
75
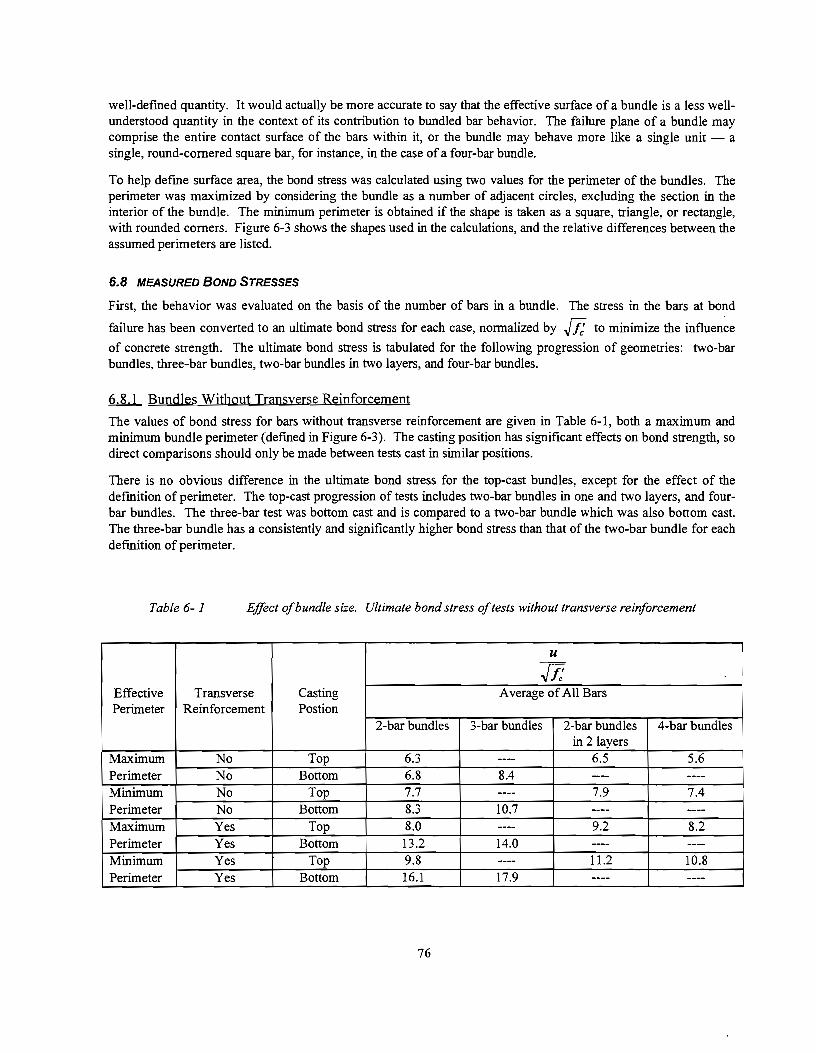
well-defmed quantity. It would actually be more accurate to say that the effective surface of a bundle is a less wellunderstood quantity in the context of its contribution to bundled bar behavior. The failure plane of a bundle may comprise the entire contact surface of the bars within it, or the bundle may behave more like a single unit - a single, round-cornered square bar, for instance, in the case of a four-bar bundle.
To help defme surface area, the bond stress was calculated using two values for the perimeter of the bundles. The perimeter was maximized by considering the bundle as a number of adjacent circles, excluding the section in the interior of the bundle. The minimum perimeter is obtained if the shape is taken as a square, triangle, or rectangle, with rounded comers. Figure 6-3 shows the shapes used in the calculations, and the relative differences between the assumed perimeters are listed.
6.8 MEASURED BOND STRESSES
First, the behavior was evaluated on the basis of the number of bars in a bundle. The stress in the bars at bond
failure has been converted to an ultimate bond stress for each case, normalized by fjf to minimize the influen~e of concrete strength. The ultimate bond stress is tabulated for the following progression of geometries: two-bar bundles, three-bar bundles, two-bar bundles in two layers, and four-bar bundles.
Q...U Bundles Without Transverse Reinforcement
The values of bond stress for bars without transverse reinforcement are given in Table 6-1, both a maximum and minimum bundle perimeter (defined in Figure 6-3). The casting position has significant effects on bond strength, so direct comparisons should only be made between tests cast in similar positions.
There is no obvious difference in the ultimate bond stress for the top-cast bundles, except for the effect of the defmition of perimeter. The top-cast progression of tests includes two-bar bundles in one and two layers, and fourbar bundles. The three-bar test was bottom cast and is compared to a two-bar bundle which was also bottom cast. The three-bar bundle has a consistently and significantly higher bond stress than that of the two-bar bundle for each defmition of perimeter.
Table 6-1 Effect of bundle size. Ultimate bond stress of tests without transverse reinforcement
u
fij Effective Transverse Casting Average of All Bars Perimeter Reinforcement Postion
2-bar bundles 3-bar bundles 2-bar bundles 4-bar bundles in 2layers
Maximum No Top 6.3 __ ... _
6.5 5.6 Perimeter No Bottom 6.8 8.4 ---- ----Minimum No Top 7.7 ---- 7.9 7.4 Perimeter No Bottom 8.3 10.7 ---- ----Maximum Yes Top 8.0 ---- 9.2 8.2 Perimeter Yes Bottom 13.2 14.0 ---- ----Minimum Yes Top 9.8 ---- 11.2 10.8 Perimeter Yes Bottom 16.1 17.9 ---- ----
76
I i
I
I
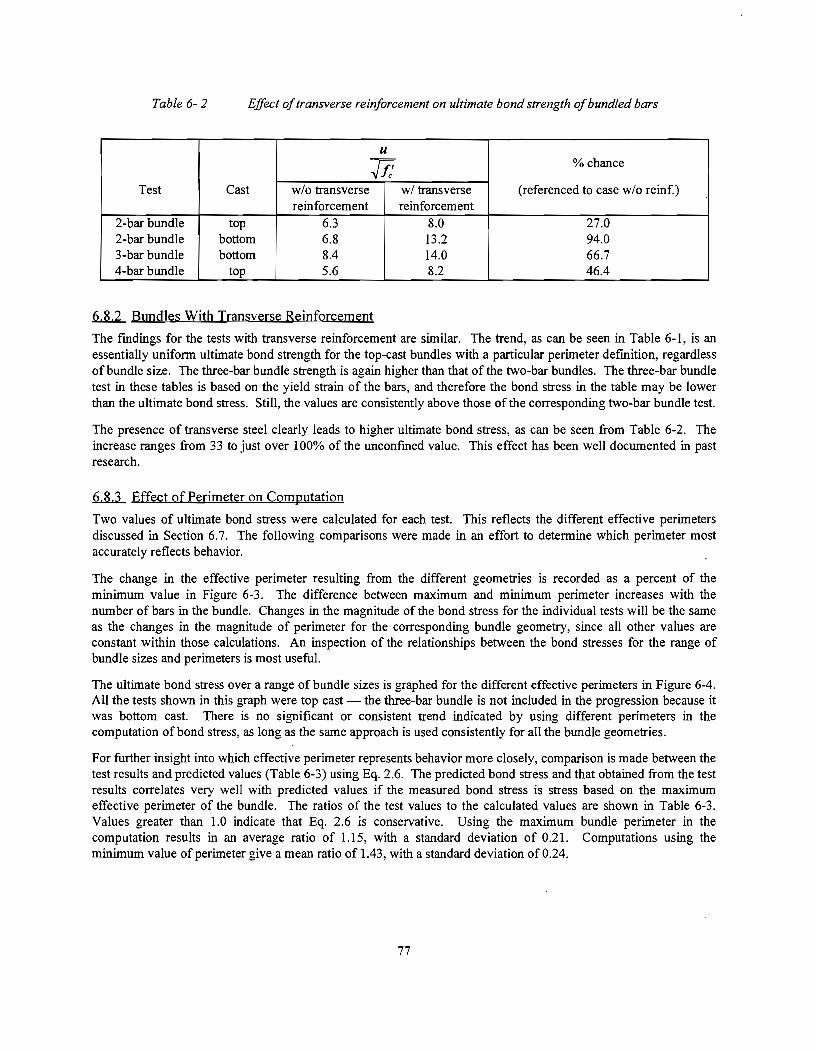
Table 6-2 Effect of transverse reinforcement on ultimate bond strength of bundled bars
' u
fjf %chance
Test Cast w/o transverse w/ transverse (referenced to case w/o reinf.) reinforcement reinforcement
2-bar bundle top 6.3 8.0 27.0 2-bar bundle bottom 6.8 13.2 94.0 3-bar bundle bottom 8.4 14.0 66.7 4-bar bundle top 5.6 8.2 46.4
ll2_ Bundles With Transverse Reinforcement
The fmdings for the tests with transverse reinforcement are similar. The trend, as can be seen in Table 6-l, is an essentially uniform ultimate bond strength for the top-cast bundles with a particular perimeter definition, regardless of bundle size. The three-bar bundle strength is again higher than that of the two-bar bundles. The three-bar bundle test in these tables is based on the yield strain of the bars, and therefore the bond stress in the table may be lower than the ultimate bond stress. Still, the values are consistently above those of the corresponding two-bar bundle test.
The presence of transverse steel clearly leads to higher ultimate bond stress, as can be seen from Table 6-2. The increase ranges from 33 to just over 100% of the unconfmed value. This effect has been well documented in past research .
.6...8....1. Effect of Perimeter on Computation
Two values of ultimate bond stress were calculated for each test. This reflects the different effective perimeters discussed in Section 6.7. The following comparisons were made in an effort to determine which perimeter most accurately reflects behavior.
The change in the effective perimeter resulting from the different geometries is recorded as a percent of the minimum value in Figure 6-3. The difference between maximum and minimum perimeter increases with the number of bars in the bundle. Changes in the magnitude of the bond stress for the individual tests will be the same as the changes in the magnitude of perimeter for the corresponding bundle geometry, since all other values are constant within those calculations. An inspection of the relationships between the bond stresses for the range of bundle sizes and perimeters is most useful.
The ultimate bond stress over a range of bundle sizes is graphed for the different effective perimeters in Figure 6-4. All the tests shown in this graph were top cast - the three-bar bundle is not included in the progression because it was bottom cast. There is no significant or consistent trend indicated by using different perimeters in the computation of bond stress, as long as the same approach is used consistently for all the bundle geometries.
For further insight into which effective perimeter represents behavior more closely, comparison is made between the test results and predicted values (Table 6-3) using Eq. 2.6. The predicted bond stress and that obtained from the test results correlates very well with predicted values if the measured bond stress is stress based on the maximum effective perimeter of the bundle. The ratios of the test values to the calculated values are shown in Table 6-3. Values greater than 1.0 indicate that Eq. 2.6 is conservative. Using the maximum bundle perimeter in the computation results in an average ratio of 1.15, with a standard deviation of 0.21. Computations using the minimum value of perimeter give a mean ratio of 1.43, with a standard deviation of 0.24.
77
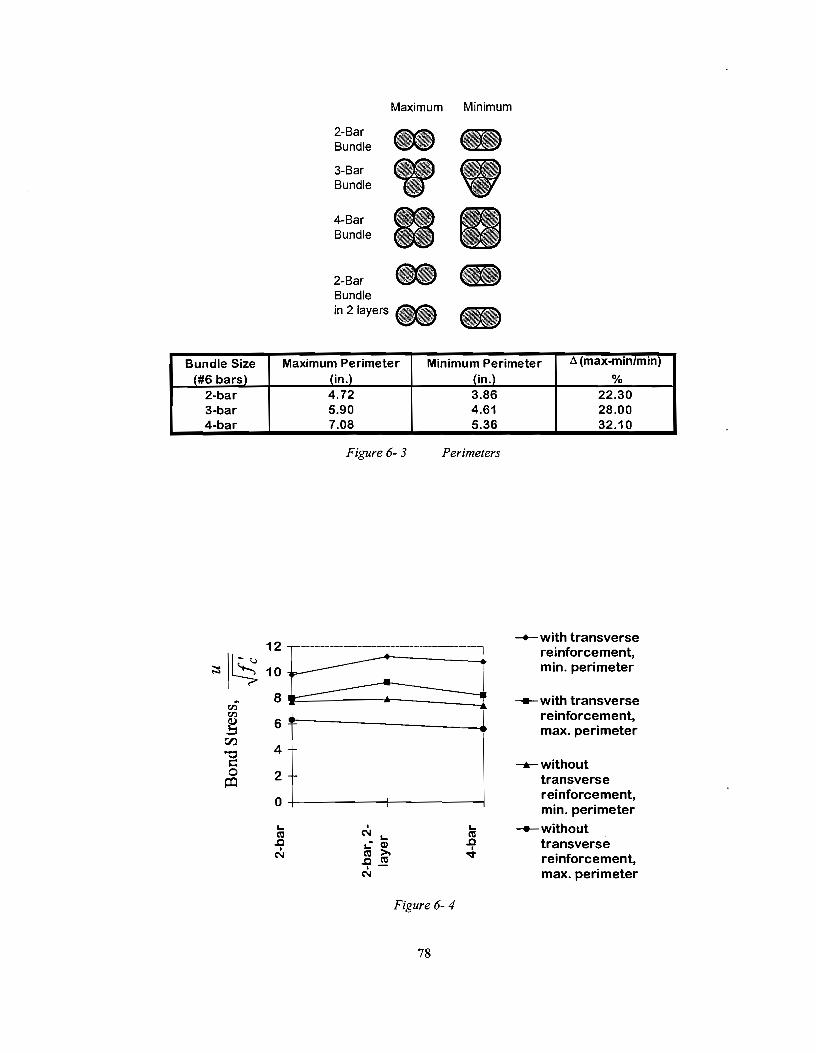
Bundle Size (#6 bars)
2·bar 3-bar 4-bar
~~~ rl:l~
rJ:l ,g tf.l
] 0
o:l
Maximum Minimum
2-Bar - -Bundle
3-Bar Bundle
4-Bar Bundle
2-Bar - -Bundle in21ayers- -
Maximum Perimeter Minimum Perimeter .l (max-min/min)
12
10
8
6
4
2
0
s... C\l
..0 • N
(in.) 4.72 5.90 7.08
Figure 6-3
• N s... S..:Q) C\l >.
..0 C\l . -N
(in.)
3.86 4.61 5.36
Perimeters
s... C\l ..0 • '¢
Figure 6-4
78
% 22.30 28.00 32.10
-+-with transverse reinforcement, min. perimeter
--11- with transverse reinforcement, max. perimeter
-.-without transverse reinforcement, min. perimeter
--without transverse reinforcement, max. perimeter
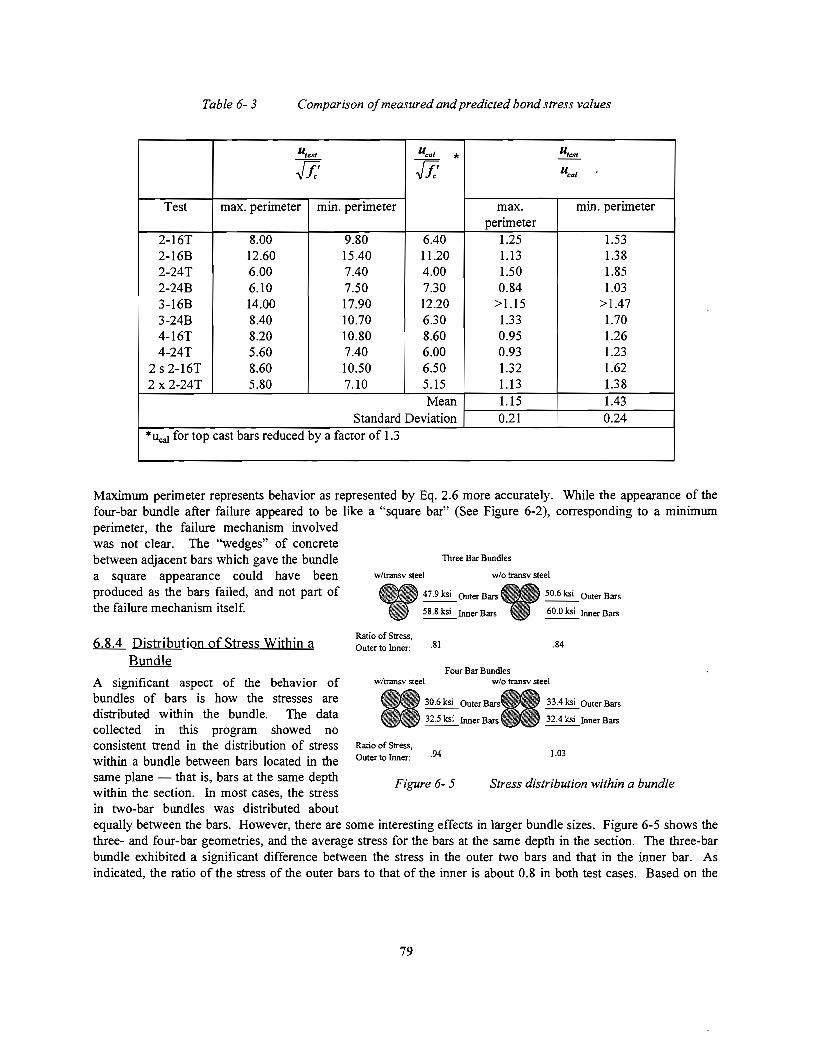
Table 6-3 Comparison of measured and predicted bond stress values
utcst ucal * ut,t
J1: J1: ucal
Test max. perimeter min. perimeter max. min. perimeter perimeter
2-16T 8.00 9.80 6.40 1.25 1.53 2-16B 12.60 15.40 11.20 1.13 1.38 2-24T 6.00 7.40 4.00 1.50 1.85 2-24B 6.10 7.50 7.30 0.84 1.03 3-16B 14.00 17.90 12.20 >1.15 >1.47 3-24B 8.40 10.70 6.30 1.33 1.70 4-16T 8.20 10.80 8.60 0.95 1.26 4·24T 5.60 7.40 6.00 0.93 1.23
2s2-16T 8.60 10.50 6.50 1.32 1.62 2 x2-24T 5.80 7.10 5.15 1.13 1.38
Mean 1.15 1.43 Standard Deviation 0.21 0.24
*ucaJ for top cast bars reduced by a factor of 1.3
Maximum perimeter represents behavior as represented by Eq. 2.6 more accurately. While the appearance of the four-bar bundle after failure appeared to be like a "square bar" (See Figure 6·2), corresponding to a minimum perimeter, the failure mechanism involved was not clear. The "wedges" of concrete between adjacent bars which gave the bundle a square appearance could have been produced as the bars failed, and not part of the failure mechanism itself.
6.8.4 Distribution of Stress Within a Bundle
A significant aspect of the behavior of bundles of bars is how the stresses are distributed within the bundle. The data collected in this program showed no consistent trend in the distribution of stress within a bundle between bars located in the same plane - that is, bars at the same depth within the section. In most cases, the stress in two-bar bundles was distributed about
Three Bar Bundles
w/transv steel w/o transv steel
Ratio of Stress, Outer to Inner:
47.9 ksi Outer Bars
58.8 ksi Inner Bars
.&I
Four Bar Bundles
50.6 ksi Outer Bars
60.0 ksi Inner Bars
.84
w/transv steel w/o transv steel
Ratio of Stress, Outer to Inner:
30.6 ksi Outer Bars
3 2.5 ksi Inner Bars
.94
33.4 ksi Outer Bars
32.4 ksi Inner Bars
1.03
Figure 6· 5 Stress distribution within a bundle
equally between the bars. However, there are some interesting effects in larger bundle sizes. Figure 6·5 shows the three- and four·bar geometries, and the average stress for the bars at the same depth in the section. The three-bar bundle exhibited a significant difference between the stress in the outer two bars and that in the inner bar. As indicated, the ratio of the stress of the outer bars to that of the inner is about 0.8 in both test cases. Based on the
79
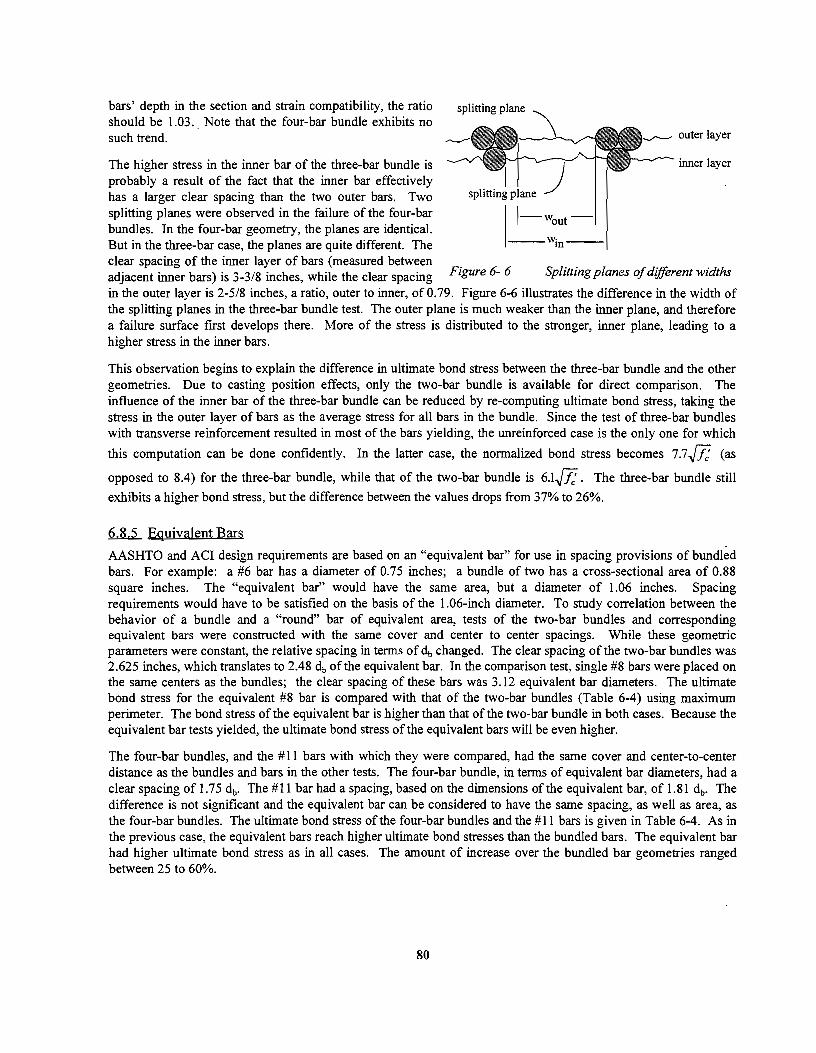
bars' depth in the section and strain compatibility, the ratio should be 1.03 .. Note that the four-bar bundle exhibits no such trend. outer layer
The higher stress in the inner bar of the three-bar bundle is inner layer probably a result of the fact that the inner bar effectively has a larger clear spacing than the two outer bars. Two splitting planes were observed in the failure of the four-bar I bundles. In the four-bar geometry, the planes are identical.
-wout--
But in the three-bar case, the planes are quite different. The ---win---clear spacing of the inner layer of bars (measured between adjacent inner bars) is 3-3/8 inches, while the clear spacing Figure 6- 6 Splitting planes of different widths in the outer layer is 2-5/8 inches, a ratio, outer to inner, of 0. 79. Figure 6-6 illustrates the difference in the width of the splitting planes in the three-bar bundle test. The outer plane is much weaker than the inner plane, and therefore a failure surface first develops there. More of the stress is distributed to the stronger, inner plane, leading to a higher stress in the inner bars.
This observation begins to explain the difference in ultimate bond stress between the three-bar bundle and the other geometries. Due to casting position effects, only the two-bar bundle is available for direct comparison. The influence of the inner bar of the three-bar bundle can be reduced by re-computing ultimate bond stress, taking the stress in the outer layer of bars as the average stress for all bars in the bundle. Since the test of three-bar bundles with transverse reinforcement resulted in most of the bars yielding, the unreinforced case is the only one for which
this computation can be done confidently. In the latter case, the normalized bond stress becomes 7.7ft (as
opposed to 8.4) for the three-bar bundle, while that of the two-bar bundle is 6.1J7l. The three-bar bundle still
exhibits a higher bond stress, but the difference between the values drops from 37% to 26%.
~ Equivalent Bars
AASHTO and ACI design requirements are based on an "equivalent bar" for use in spacing provisions of bundled bars. For example: a #6 bar has a diameter of 0.75 inches; a bundle of two has a cross-sectional area of 0.88 square inches. The "equivalent bar" would have the same area, but a diameter of 1.06 inches. Spacing requirements would have to be satisfied on the basis of the 1.06-inch diameter. To study correlation between the behavior of a bundle and a "round" bar of equivalent area, tests of the two-bar bundles and corresponding equivalent bars were constructed with the same cover and center to center spacings. While these geometric parameters were constant, the relative spacing in terms of db changed. The clear spacing of the two-bar bundles was 2.625 inches, which translates to 2.48 db of the equivalent bar. In the comparison test, single #8 bars were placed on the same centers as the bundles; the clear spacing of these bars was 3.12 equivalent bar diameters. The ultimate bond stress for the equivalent #8 bar is compared with that of the two-bar bundles (Table 6-4) using maximum perimeter. The bond stress of the equivalent bar is higher than that of the two-bar bundle in both cases. Because the equivalent bar tests yielded, the ultimate bond stress of the equivalent bars will be even higher.
The four-bar bundles, and the # 11 bars with which they were compared, had the same cover and center-to-center distance as the bundles and bars in the other tests. The four-bar bundle, in terms of equivalent bar diameters, had a clear spacing of 1.75 db. The #11 bar had a spacing, based on the dimensions of the equivalent bar, of 1.81 db. The difference is not significant and the equivalent bar can be considered to have the same spacing, as well as area, as the four-bar bundles. The ultimate bond stress of the four-bar bundles and the #11 bars is given in Table 6-4. As in the previous case, the equivalent bars reach higher ultimate bond stresses than the bundled bars. The equivalent bar had higher ultimate bond stress as in all cases. The amount of increase over the bundled bar geometries ranged between 25 to 60%.
80
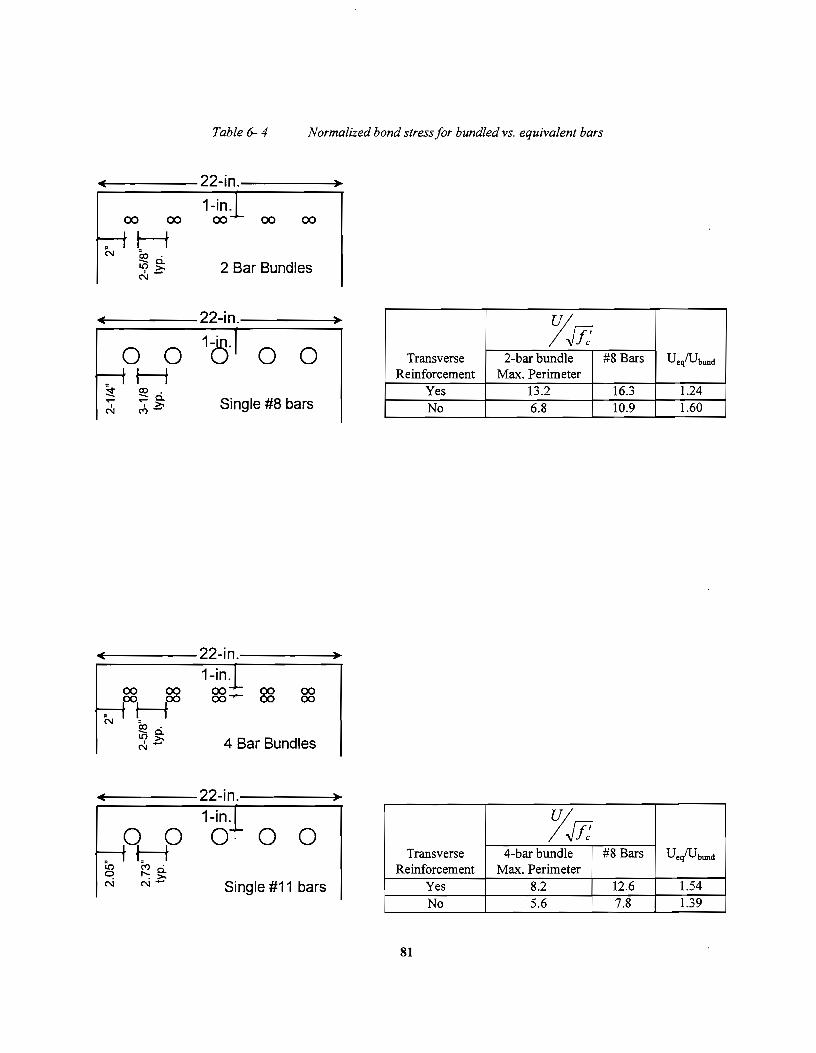
Table 6-4 Normalized bond stress for bundled vs. equivalent bars
+-----22-in.-----~
in 0 N
00 00
0 0 t--t
00
co . :;::~ cJ>-
00 oot--foo Co· ~:oc. Nb
oc--to ('f)· ,...c.
. >. N-
1-in. 00 00 00
2 Bar Bundles
22-in.
1(3· 0 0
Single #8 bars
22-in. 1-in.
&S- 00 00 00 00
4 Bar Bundles
22-in. 1-in.
0· 0 0
Single #11 bars
'YJJ: Transverse 2-bar bundle
Reinforcement Max. Perimeter Yes 13.2 No 6.8
'YJJ: Transverse 4-bar bundle
Reinforcement Max. Perimeter Yes 8.2 No 5.6
81
#8 Bars Ueq/UbUI!d
16.3 1.24 10.9 1.60
#8 Bars Ueq/Ubund
12.6 1.54 7.8 1.39

82
CHAPTER 7
DESIGN CONSIDERATIONS
7.1 BASIC DEVELOPMENT LENGTH
Current AASHTO provisions are based on calculations of the required length of embedment to develop yield in a bar. The basic development length, ldb> in AASHTO Section 8.2.5 for #11 bars and smaller is
(7.1)
but ldb is not less than 0.0004 dbfy
where Ab bar area, in 2
bar diameter, in.
steel yield strength, psi
concrete compressive strength, psi
The same equation has been included in ACI Codes; however, in the 1989 code a series of factors were included to account for cover, spacing between bars, and transverse reinforcement. Factors for casting position and epoxy coating are slightly different. In addition, the minimum length to avoid a pull-out failure rather than a splitting failure is slightly different in ACI 318-89.
7.2 CASTING PosmON (F,)
AASHTO 8.25.2.1 Top reinforcement so placed that more than 12 in. of concrete is cast below the reinforcement ........................................................................................................................... 1.4
ACI 12.2.4.1 Top Reinforcement. Horizontal reinforcement so placed that more than 12 in. of fresh concrete is cast in the member below the development length or splice .............................. 1.3
7.3 EPOXY COA nNG {FE:)
AASHTO 8.25.2.3- Bars coated with epoxy with cover less than 3db clear spacing between bars less than 6 db .................................................................................................................................. 1.5
All other cases ............................................................................................................................. 1.15
The product obtained when combining the factor for top reinforcement with the applicable factor for epoxy-coated reinforcement need not be taken greater than 1.7
ACI 12.2.4.3 Epoxy-Coated Reinforcement (same as AASHTO) except, all other cases .......... 1.2
83
7.4 CONFINEMENT(FcJ
Both ACI 318 (Sec. 12.2.3.5) and AASHTO (Sec. 8.25.3.3) allow a reduction in J..ib for the confmement provided by reinforcement enclosed within spirals (1/4-in. diameter and 4-in. pitch) of using a factor 0. 75. ACI 318 extends this to include closely-spaced (not more than 4 inches) #4 or larger ties. ·
However, AASHTO includes no other factors for small covers,· closely-spaced ties, or confmement by other arrangements of transverse reinforcement. ACI 318 includes a series of factors for these conditions.
ACI 12.2.3.1- For bars satisfying any one of the following conditions; (a), (b), (c), or (d) ..... 1.0
(a) Bars in beams or columns with
(1) minimum cover not less than required in 7. 7.1
[Note: for most cases this would be 1-112 in.]
(2) transverse reinforcement satisfying tie requirement of 7.10.5 {tied columns} or minimum stirrup requirements of 11.54 and 11.5.5.3 [shear] along the development length, and
(3) clear spacing of not less than 3db
(b) Bars in beams and columns with
(1) minimum cover as in (a-1) above, and
(2) enclosed within transverse reinforcement A1, along the development length
satisfying A1r ~ db s N /40, where db is the diameter of the bar being developed.
(c) Bars in the inner layer of slab or wall reinforcement and with clear spacing of not less than 3 db
(d) Any bars with cover of not less than 2 db and with clear spacing of not less than 3 db
ACI 12.2.3.2- For bars with cover of db or less or with clear spacing of2 db or less ................ 2.0
ACI 12.2.3.3 For bars not included in 12.2.3.1 or 12.2.3.2 ..................................................... 1.4
Both ACI 318-89 and AASHTO include a factor for widely spaced bars:
AASHTO 8.26.3.1 -Reinforcement being developed in the length under consideration is spaced laterally at least six inches on center with at least three inches clear cover measured in the direction of the spacing ................................................................................................................. 0.8
ACI 318 has the same provision but limits its application to #II or smaller bars, and expresses the spacings in terms of db. That is, 5db clear spacing rather than six inches center to center, and 2.5db clear cover rather than three inches.
It should be noted that the wide spacing and closely spaced spiral or tie factor can be used in addition to the factors in ACI Sections 12.2.3.1, 12.2.3.2 and 12.2.3.3.
84
7.5 DEVELOPMENT LENGTH
Combining all applicable factors with the basic development length equations and including the minimum length requirements leads to the following equations
AASHTO
ACI 318-89
where Fp
ld = ldh x Fp x FE x Fe and
ldh x Fe ;:::: 0.03dhfy / fJ:
casting position factor: 1.3 for ACI; 1.4 for AASHTO
(7.2)
(7.3)
epoxy coating factor but Fp x FE need not be taken greater than 1. 7 in both design codes
confinement factor: 0.75 and/or 0.8 for AASHTO; 0.75 and/or 0.8 and 1.0, 1.4 or 2.0 for ACI
7.6 APPLICATION TO BUNDLED BARS
Both codes include provisions for development length of individual bars in a bundle.
AASHTO 8.28 and ACI 318 12.4.1- Development of Bundled Bars- Development length of individual bars within a bundle, in tension or compression, shall be that for the individual bar, increased by 20 percent for three-bar bundles, and 33 percent for a four-bar bundle.
ACI 12.4.2- For determining the appropriate factors in 12.2.3 and 12.2.4.3, a unit of bundled bars shall be treated as a single bar of a diameter derived from the equivalent total area.
Both codes apply this provision to lap splices of bars in a bundle and stipulate that splices of individual bars in a bundle shall not overlap. ACI 318-89 also prohibits lap splices of entire bundles.
It is interesting to note that neither code requires any special consideration for two-bar bundles but ACI 318-89 does require an effective bar diameter to be used where db enters the design equations -even for two-bar bundles. The modification for bundles will be denoted as FB with a value of 1.0 for two bars, 1.2 for three bars and 1.33 for four bars.
7.7 CALCULATED BAR STRESSES USING AASHTO AND ACI PROCEDURES
Equation 7.1, 7.2 and 7.3 can be rewritten in terms of actual embedment length which was less than design values in the tests, and steel tress f5 • The predicted steel stresses are:
AASHTO
f.= ldfJ: x 1 < ld x--~--s 0.04AbF,; FPFEFeFB 0.0004db FPFEFeFB
(7.4)
85
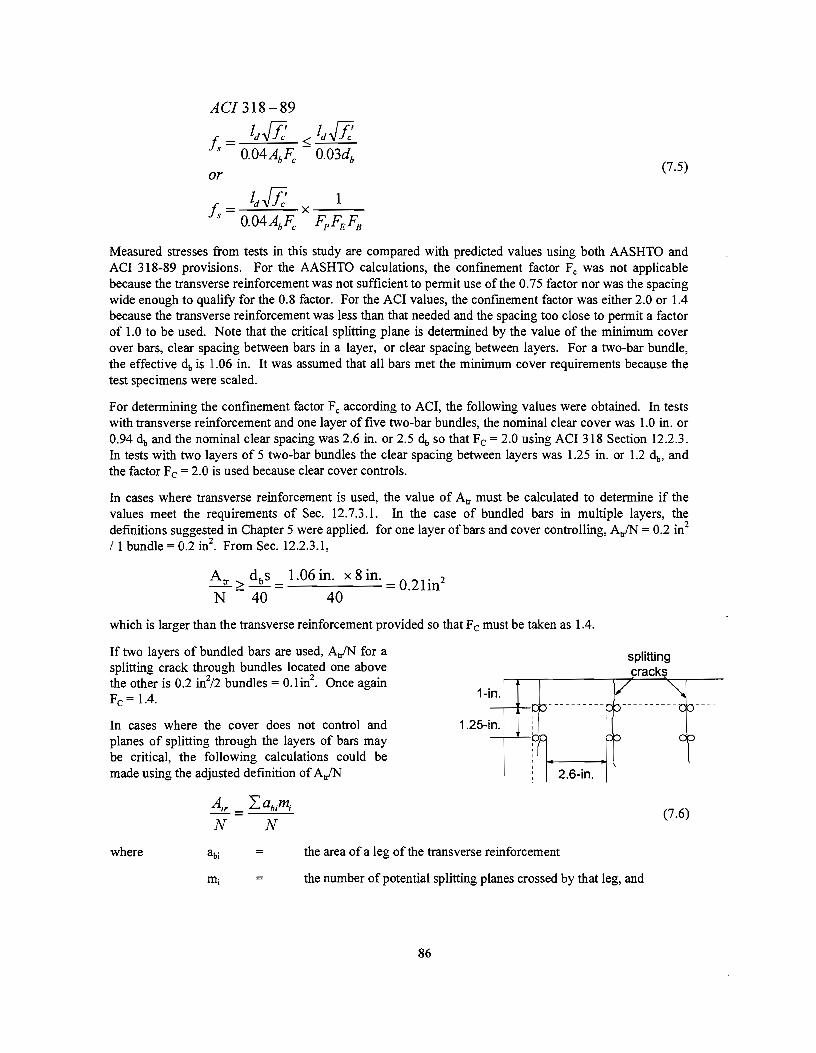
ACI 318-89
Is = ldfl: ::;; ldfl: 0.04AbF;; 0.03db
(7.5) or
/, = Jdfl: X 1 s 0.04AbF;; FpFEFB
Measured stresses from tests in this study are compared with predicted values using both AASHTO and ACI 318-89 provisions. For the AASHTO calculations, the confmement factor Fe was not applicable because the transverse reinforcement was not sufficient to permit use of the 0.75 factor nor was the spacing wide enough to qualify for the 0.8 factor. For the ACI values, the confmement factor was either 2.0 or 1.4 because the transverse reinforcement was less than that needed and the spacing too close to permit a factor of 1.0 to be used. Note that the critical splitting plane is determined by the value of the minimum cover over bars, clear spacing between bars in a layer, or clear spacing between layers. For a two-bar bundle, the effective db is 1.06 in. It was assumed that all bars met the minimum cover requirements because the test specimens were scaled.
For determining the confinement factor Fe according to ACI, the following values were obtained. In tests with transverse reinforcement and one layer of five two-bar bundles, the nominal clear cover was 1.0 in. or 0.94 db and the nominal clear spacing was 2.6 in. or 2.5 db so that Fe= 2.0 using ACI 318 Section 12.2.3. In tests with two layers of 5 two-bar bundles the clear spacing between layers was 1.25 in. or 1.2 db, and the factor Fe= 2.0 is used because clear cover controls.
In cases where transverse reinforcement is used, the value of Atr must be calculated to determine if the values meet the requirements of Sec. 12.7.3.1. In the case of bundled bars in multiple layers, the defmitions suggested in Chapter 5 were applied. for one layer of bars and cover controlling, AJN = 0.2 in2
/1 bundle= 0.2 in2. From Sec. 12.2.3.1,
Atr dbs _ 1.06 in. x 8 in._ 0 21
. 2 -;;:::-- -. m N 40 40
which is larger than the transverse reinforcement provided so that F c must be taken as 1.4.
If two layers of bundled bars are used, AJN for a splitting crack through bundles located one above the other is 0.2 in2/2 bundles= 0.1in2
• Once again Fe= 1.4.
In cases where the cover does not control and planes of splitting through the layers of bars may be critical, the following calculations could be made using the adjusted definition of AJN
N N
1-in.
1.25-in. ·
2.6-in.
where the area of a leg of the transverse reinforcement
the number of potential splitting planes crossed by that leg, and
86
(7.6)
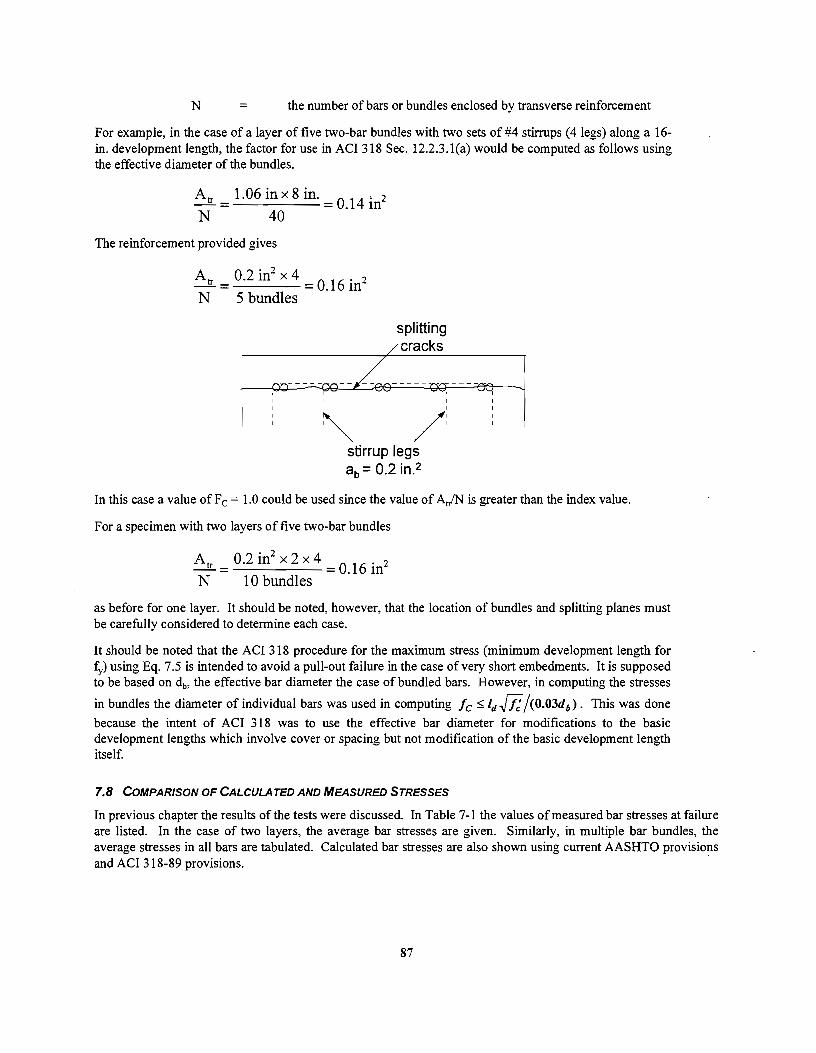
N the number of bars or bundles enclosed by transverse reinforcement
For example, in the case of a layer of five two-bar bundles with two sets of #4 stirrups ( 4 legs) along a 16-in. development length, the factor for use in ACI 318 Sec. 12.2.3.l(a) would be computed as follows using the effective diameter of the bundles.
Atr 1.06 in x 8 in. 0 14
. 2 -= = . ln N 40
The reinforcement provided gives
Atr _ 0.2 in2 x 4 _ 0 16
. 2 -- -. m N 5 bundles
splitting cracks
I
~ /: stirrup legs
-0 2. 2 ab- . ln.
In this case a value ofF c = 1.0 could be used since the value of AJN is greater than the index value.
For a specimen with two layers of five two-bar bundles
Atr = 0.2 in2
x2x4 =0. 16 in2
N 10 bundles
as before for one layer. It should be noted, however, that the location of bundles and splitting planes must be carefully considered to determine each case.
It should be noted that the ACI 318 procedure for the maximum stress (minimum development length for fy) using Eq. 7.5 is intended to avoid a pull-out failure in the case of very short embedments. It is supposed to be based on db, the effective bar diameter the case of bundled bars. However, in computing the stresses
in bundles the diameter of individual bars was used in computing fc ~ ld.Jfl j(0.03d6 ). This was done
because the intent of ACI 318 was to use the effective bar diameter for modifications to the basic development lengths which involve cover or spacing but not modification of the basic development length itself.
7.8 COMPARISON OF CALCULATED AND MEASURED STRESSES
In previous chapter the results of the tests were discussed. In Table 7-1 the values of measured bar stresses at failure are listed. In the case of two layers, the average bar stresses are given. Similarly, in multiple bar bundles, the average stresses in all bars are tabulated. Calculated bar stresses are also shown using current AASHTO provisions and ACI 318-89 provisions. ·
87
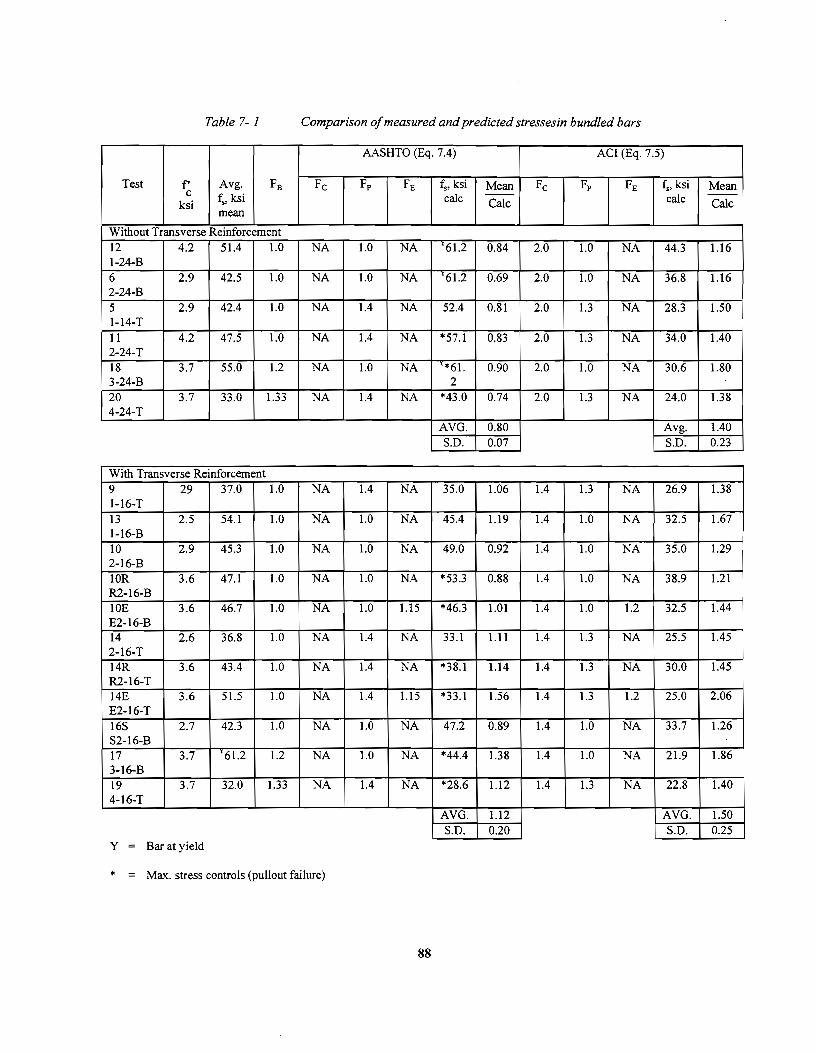
Table 7-1 Comparison of measured and predicted stresses in bundled bars
AASHTO (Eq. 7.4) ACI (Eq. 7.5)
Test f' Avg. FB Fe Fp FE f., ksi Mean Fe Fp FE f., ksi Mean c f,, ksi calc Calc calc --ksi Calc
mean
Without Transverse Reinforcement 12 4.2 51.4 1.0 NA 1.0 NA '61.2 0.84 2.0 1.0 NA 44.3 1.16 1-24-B 6 2.9 42.5 1.0 NA 1.0 NA '61.2 0.69 2.0 1.0 NA 36.8 1.16 2-24-B 5 2.9 42.4 1.0 NA 1.4 NA 52.4 0.81 2.0 1.3 NA 28.3 1.50 1-14-T ll 4.2 47.5 1.0 NA 1.4 NA *57.1 0.83 2.0 1.3 NA 34.0 1.40 2-24-T 18 3.7 55.0 1.2 NA 1.0 NA '*61. 0.90 2.0 1.0 NA 30.6 1.80
I 3-24-B 2 20 3.7 33.0 1.33 NA 1.4 NA *43.0 0.74 2.0 1.3 NA 24.0 1.38 4-24-T
· AVG. 0.80 Avg. 1.40 S.D. 0.07 S.D. 0.23
With Transverse Reinforcement 9 29 37.0 1.0 NA 1.4 NA 35.0 1.06 1.4 1.3 NA 26.9 1.38 1-16-T 13 2.5 54.1 1.0 NA 1.0 NA 45.4 1.19 1.4 1.0 NA 32.5 1.67 1-16-B i
10 2.9 45.3 1.0 NA 1.0 NA 49.0 0.92 1.4 1.0 NA 35.0 1.29 I 2-16-B lOR 3.6 47.1 1.0 NA 1.0 NA *53.3 0.88 1.4 1.0 NA 38.9 1.21 R2-16-B
!
10E 3.6 46.7 1.0 NA 1.0 1.15 *46.3 1.01 1.4 1.0 1.2 32.5 1.44 E2-16-B i
14 2.6 36.8 1.0 NA 1.4 NA 33.1 1.11 1.4 1.3 NA 25.5 1.45 2-16-T 14R 3.6 43.4 1.0 NA 1.4 NA *38.1 L14 1.4 1.3 NA 30.0 1.45 R2-16-T 14E 3.6 51.5 1.0 NA 1.4 1.15 *33.1 1.56 1.4 1.3 1.2 25.0 2.06 E2-16-T 16S 2.7 42.3 1.0 NA 1.0 NA 47.2 0.89 1.4 1.0 NA 33.7 1.26 S2-16-B 17 3.7 '61.2 1.2 NA 1.0 NA *44.4 1.38 1.4 1.0 NA 21.9 1.86 3-16-B 19 3.7 32.0 1.33 NA 1.4 NA *28.6 1.12 1.4 1.3 NA 22.8 1.40 4-16-T
AVO. 1.12 AVO. 1.50 S.D. 0.20 S.D. 0.25
y Bar at yield
* Max. stress controls (pullout failure)
88
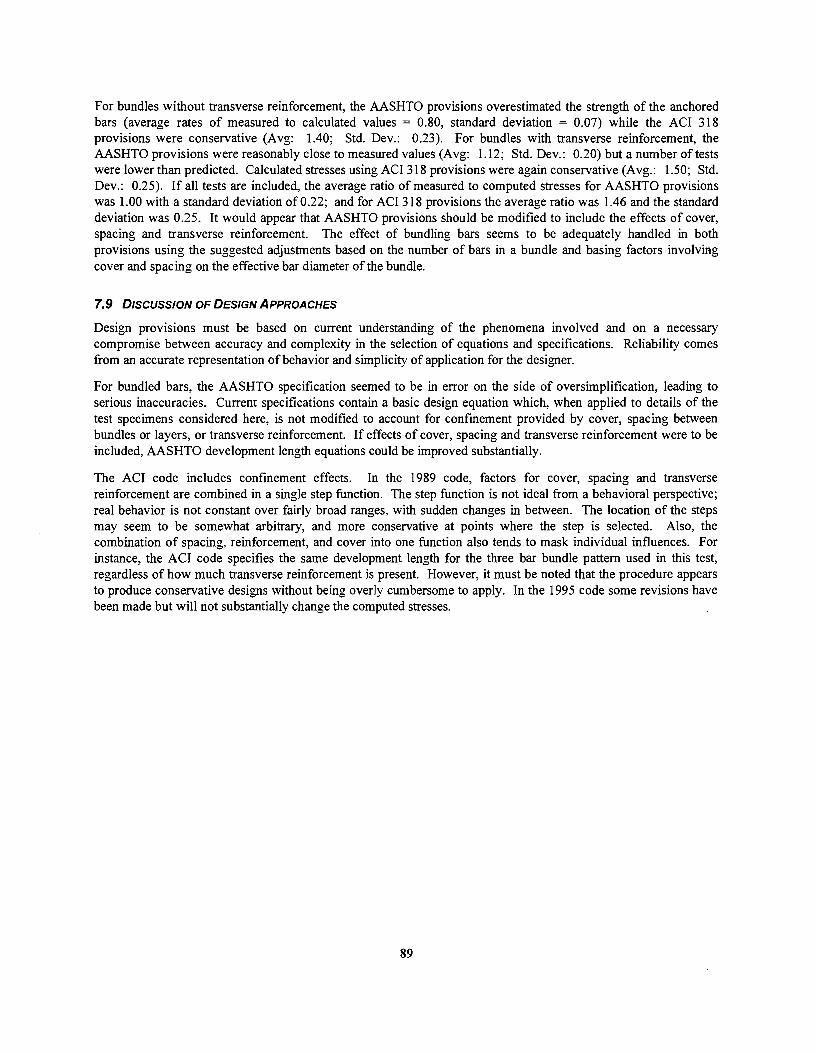
For bundles without transverse reinforcement, the AASHTO provisions overestimated the strength of the anchored bars (average rates of measured to calculated values = 0.80, standard deviation 0.07) while the ACI 318 provisions were conservative (Avg: 1.40; Std. Dev.: 0.23). For bundles with transverse reinforcement, the AASHTO provisions were reasonably close to measured values (Avg: 1.12; Std. Dev.: 0.20) but a number oftests were lower than predicted. Calculated stresses using ACI 318 provisions were again conservative (Avg.: 1.50; Std. Dev.: 0.25). If all tests are included, the average ratio of measured to computed stresses for AASHTO provisions was 1.00 with a standard deviation of 0.22; and for ACI 318 provisions the average ratio was 1.46 and the standard deviation was 0.25. It would appear that AASHTO provisions should be modified to include the effects of cover, spacing and transverse reinforcement. The effect of bundling bars seems to be adequately handled in both provisions using the suggested adjustments based on the number of bars in a bundle and basing factors involving cover and spacing on the effective bar diameter of the bundle.
7.9 DISCUSSION OF DESIGN APPROACHES
Design provisions must be based on current understanding of the phenomena involved and on a necessary compromise between accuracy and complexity in the selection of equations and specifications. Reliability comes from an accurate representation of behavior and simplicity of application for the designer.
For bundled bars, the AASHTO specification seemed to be in error on the side of oversimplification, leading to serious inaccuracies. Current specifications contain a basic design equation which, when applied to details of the test specimens considered here, is not modified to account for confinement provided by cover, spacing between bundles or layers, or transverse reinforcement. If effects of cover, spacing and transverse reinforcement were to be included, AASHTO development length equations could be improved substantially.
The ACI code includes confinement effects. In the 1989 code, factors for cover, spacing and transverse reinforcement are combined in a single step function. The step function is not ideal from a behavioral perspective; real behavior is not constant over fairly broad ranges, with sudden changes in between. The location of the steps may seem to be somewhat arbitrary, and more conservative at points where the step is selected. Also, the combination of spacing, reinforcement, and cover into one function also tends to mask individual influences. For instance, the ACI code specifies the same development length for the three bar bundle pattern used in this test, regardless of how much transverse reinforcement is present. However, it must be noted that the procedure appears to produce conservative designs without being overly cumbersome to apply. In the 1995 code some revisions have been made but will not substantially change the computed stresses.
89

90
CHAPTERS
SUMMARY AND CONCLUSIONS
8.1 SUMMARY
Test Program. The primary objective of this test program was to examine the bond strength of multiple-bar bundles considering the effect of the following variables: number of layers of bars, number of bars in a bundle, casting position, amount of transverse reinforcement, level of shear in anchorage zone, and epoxy coating. The configuration of reinforcement was based on typical TxDOT pier cap detail. Twenty-eight tests were conducted.
Mode of Failure. The measured stress in nearly all the bundled bars was below yield and all the bond failures were face-and-side split modes. Longitudinal cracks always appeared first above the two corner bundles. In the tests with transverse reinforcement, a third longitudinal crack appeared above the middle bundle since this bundle was not confmed by a stirrup leg. In the tests of two layers of bundled bars, a horizontal crack appeared frrst in the plane of the inner layer of bars at the free end of the anchored bars. If the load was maintained, a second horizontal crack formed in plane of the outer layer of bars. As soon as the second horizontal crack formed, the specimen failed.
In the two-layer case, the stress in the outer layer of bundled bars was higher than that in the inner layer. Since bond failure was brittle, there was no stress redistribution between the two layers until the peak load was reached. Near peak load the outer layer of bars was close to bond failure. If the load was maintained at that level, part of the stress in the outer layer of bars was transferred to the inner layer as the confmement for the outer bars was lost due to splitting. As the stress of inner layer of bars increased, bond failure in the inner layer was produced. Because the moment arm of the inner layer of bars was smaller than that of the outer layer, load began to decrease as stress was transferred from the outer layer to the inner layer. Bond failure occurred in both inner and outer planes. Failure mechanisms in both planes were due to concrete splitting produced by tension in the anchored bars.
8.2 EFFECT OF VARIABLES
.8..2.1_ Behavior of a Bundle
Bars within a bundle acted as a single unit. Stress was distributed equally between bars within a bundle as long as the potential splitting planes through the bars were identical. When the splitting planes were not equal, the failure surface passed through the weaker plane; that is, the layer with smaller clear spacing. In asymmetrical geometries, there was the potential for redistribution of stress to the bar or bars outside the splitting plane, as evidenced by the three-bar bundle tests. It is possible to make use of this behavior, but a note of caution is in order. Figure 8- I demonstrates that in the three-bar bundle, the bar outside the failure plane was located in monolithic concrete. Stress can be redistributed from the weaker, outer plane by transferring force to the inner bar, which is bonded directly to the rest of the beam. If the bundle is turned upside-down, then stress redistribution is no longer possible. The splitting plane would then separate the bar in question from the rest of the concrete, and all the force in that bar would have to be transferred through the weak plane to the rest of the beam, thereby increasing the stress on the splitting plane.
8.2.2 Casting Position
The top-cast bars generally did not reach stresses as high as bottom-cast bars. There was considerable scatter in the data but a I .3 or I .4 factor for top-casting seems appropriate.
91
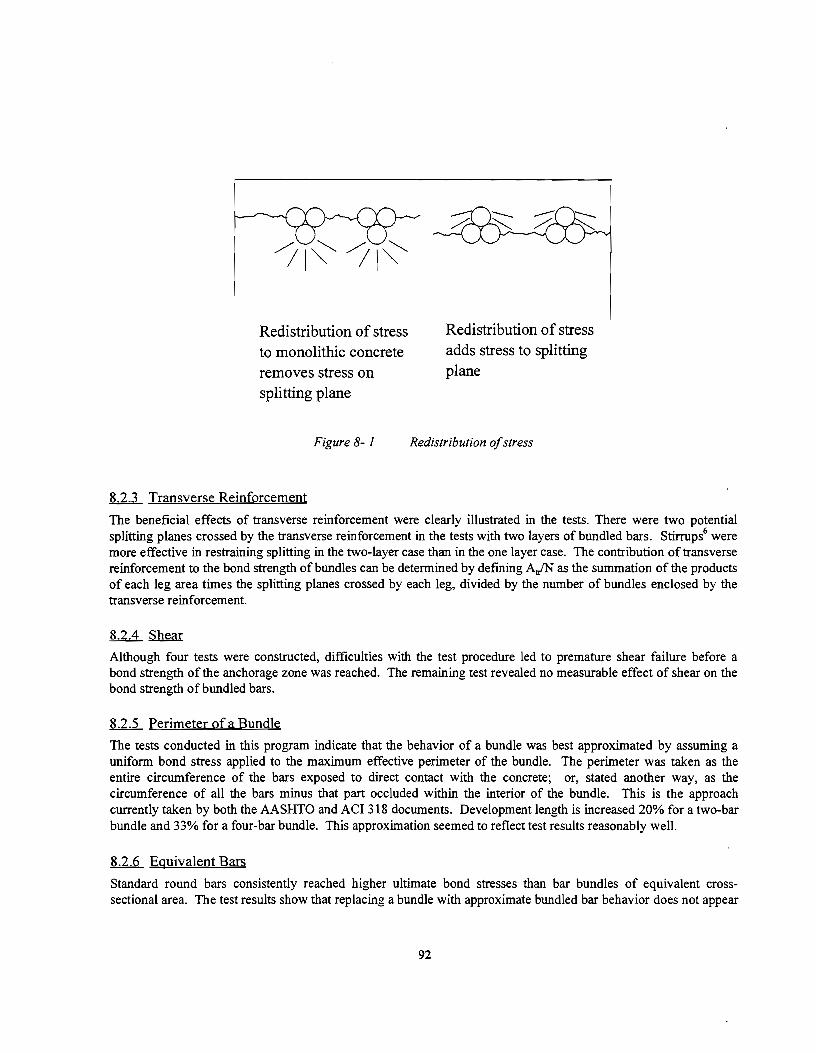
Redistribution of stress to monolithic concrete removes stress on splitting plane
Figure 8-1
8.2.3 Transverse Reinforcement
Redistribution of stress adds stress to splitting plane
Redistribution of stress
The beneficial effects of transverse reinforcement were clearly illustrated in the tests. There were two potential splitting planes crossed by the transverse reinforcement in the tests with two layers of bundled bars. Stirrups6 were more effective in restraining splitting in the two-layer case than in the one layer case. The contribution of transverse reinforcement to the bond strength of bundles can be determined by defming AJN as the summation of the products of each leg area times the splitting planes crossed by each leg, divided by the number of bundles enclosed by the transverse reinforcement.
8.2.4 ~
Although four tests were constructed, difficulties with the test procedure led to premature shear failure before a bond strength of the anchorage zone was reached. The remaining test revealed no measurable effect of shear on the bond strength of bundled bars .
.8..2...i_ Perimeter of a Bundle
The tests conducted in this program indicate that the behavior of a bundle was best approximated by assuming a uniform bond stress applied to the maximum effective perimeter of the bundle. The perimeter was taken as the entire circumference of the bars exposed to direct contact with the concrete; or, stated another way, as the circumference of all the bars minus that part occluded within the interior of the bundle. This is the approach currently taken by both the AASHTO and ACI 318 documents. Development length is increased 20% for a two-bar bundle and 33% for a four-bar bundle. This approximation seemed to reflect test results reasonably well .
.8.2..2.. EQuivalent Bars
Standard round bars consistently reached higher ultimate bond stresses than bar bundles of equivalent crosssectional area. The test results show that replacing a bundle with approximate bundled bar behavior does not appear
92
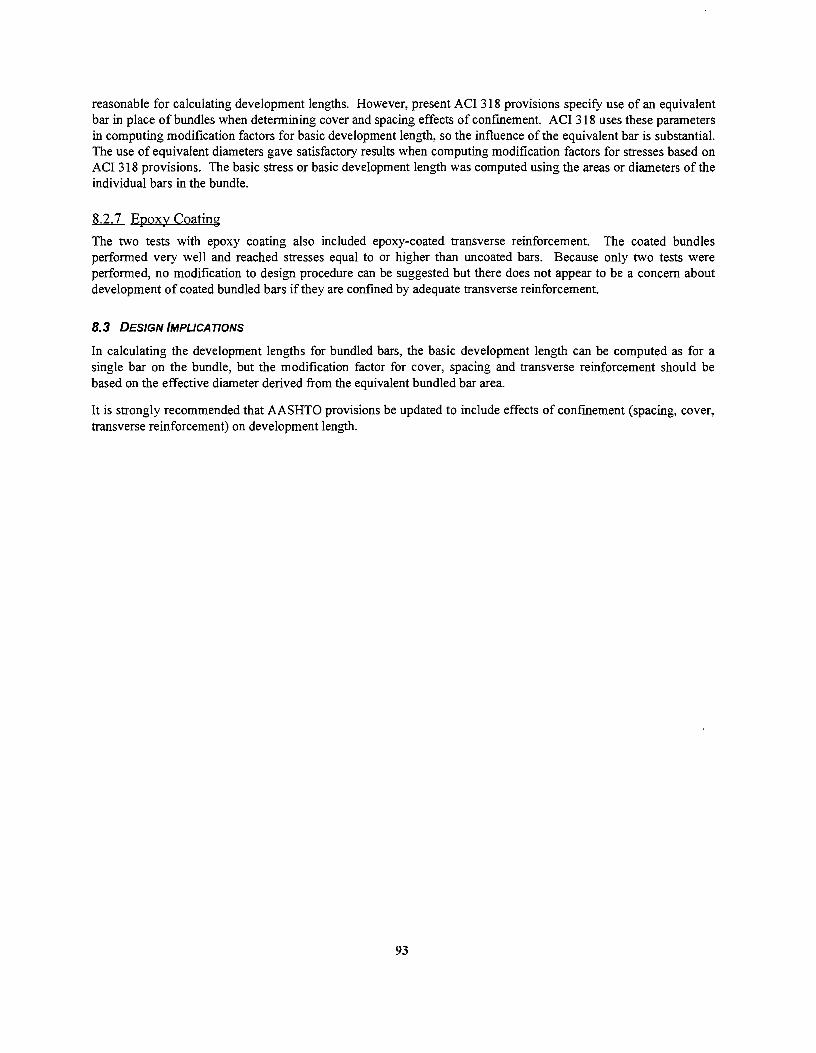
reasonable for calculating development lengths. However, present ACI 318 provisions specify use of an equivalent bar in place of bundles when determining cover and spacing effects of confmement. ACI 318 uses these parameters in computing modification factors for basic development length, so the influence of the equivalent bar is substantial. The use of equivalent diameters gave satisfactory results when computing modification factors for stresses based on ACI 318 provisions. The basic stress or basic development length was computed using the areas or diameters of the individual bars in the bundle.
8.2. 7 Epoxy Coating
The two tests with epoxy coating also included epoxy-coated transverse reinforcement. The coated bundles performed very well and reached stresses equal to or higher than uncoated bars. Because only two tests were performed, no modification to design procedure can be suggested but there does not appear to be a concern about development of coated bundled bars if they are confmed by adequate transverse reinforcement.
8.3 DESIGN IMPUCATIONS
In calculating the development lengths for bundled bars, the basic development length can be computed as for a single bar on the bundle, but the modification factor for cover, spacing and transverse reinforcement should be based on the effective diameter derived from the equivalent bundled bar area.
It is strongly recommended that AASHTO provisions be updated to include effects of confmement (spacing, cover, transverse reinforcement) on development length.
93

94
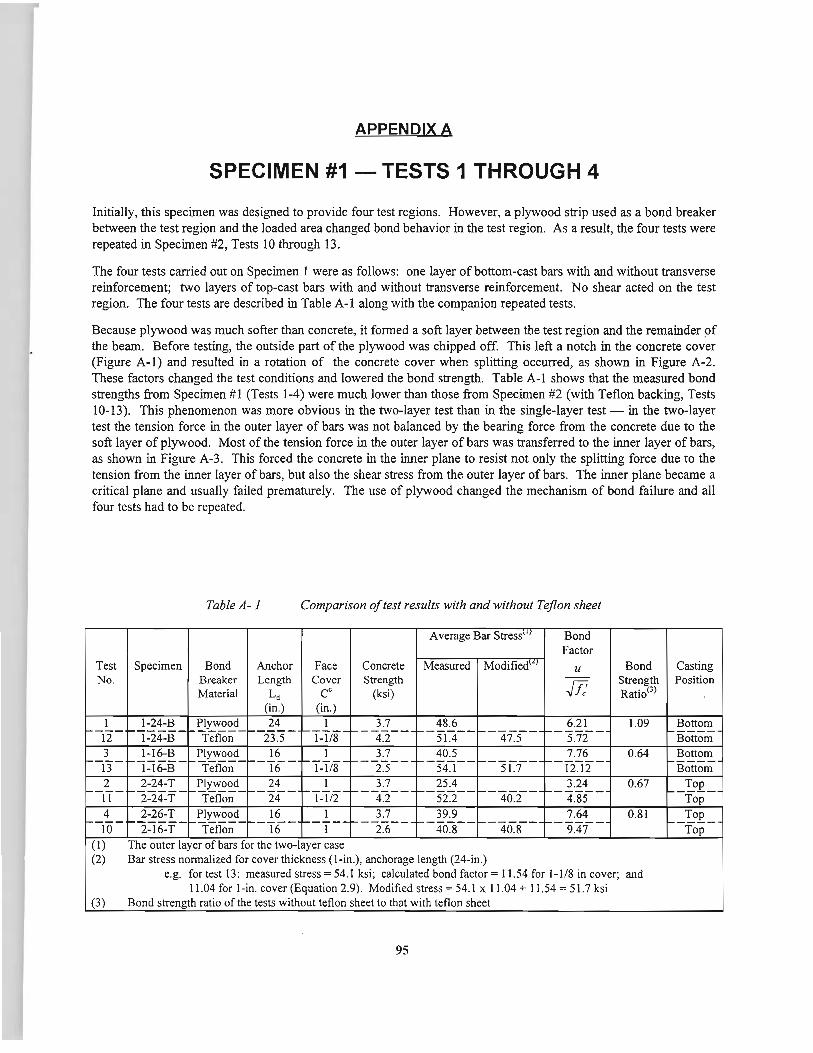
APPENDIX A
SPECIMEN #1 -TESTS 1 THROUGH 4
Initially, this specimen was designed to provide four test regions. However, a plywood strip used as a bond breaker between the test region and the loaded area changed bond behavior in the test region. As a result, the four tests were repeated in Specimen #2, Tests 10 through 13.
The four tests carried out on Specimen 1 were as follows: one layer of bottom-cast bars with and without transverse reinforcement; two layers of top-cast bars with and without transverse reinforcement. No shear acted on the test region. The four tests are described in Table A-1 along with the companion repeated tests.
Because plywood was much softer than concrete, it formed a soft layer between the test region and the remainder ~f the beam. Before testing, the outside part of the plywood was chipped off. This left a notch in the concrete cover (Figure A-1) and resulted in a rotation of the concrete cover when splitting occurred, as shown in Figure A-2. These factors changed the test conditions and lowered the bond strength. Table A-1 shows that the measured bond strengths from Specimen #1 (Tests 1-4) were much lower than those from Specimen #2 (with Teflon backing, Tests 10-13). This phenomenon was more obvious in the two-layer test than in the single-layer test- in the two-layer test the tension force in the outer layer of bars was not balanced by the bearing force from the concrete due to the soft layer of plywood. Most of the tension force in the outer layer of bars was transferred to the inner layer of bars, as shown in Figure A-3. This forced the concrete in the inner plane to resist not only the splitting force due to the tension from the inner layer of bars, but also the shear stress from the outer layer of bars. The inner plane became a critical plane and usually failed prematurely. The use of plywood changed the mechanism of bond failure and all four tests had to be repeated.
Table A-1 Comparison of test results with and without Teflon sheet
Average Bar Stress' '' Bond Factor
Test Specimen Bond Anchor Face Concrete Measured Modified1"'
1 u Bond Casting No. Breaker Length Cover Strength - - Strength Position
Material Ld cc (ksi) JJ7 Ratio<3l (in.) (in.)
I 1-24-B Plywood 24 I 3.7 48.6 6.21 1.09 Bottom ---- ------1----------- r-T-T/8-1------ '------------- 1------ 1-:----12 1-24-B Teflon 23.5 4.2 51.4 47.5 5.72 Bottom 3 1-16-B Plywood 16 I 3.7 40.5 7.76 0.64 Bottom ---- ------1----------- r-T-T/8-1------ c------------ r------ 1-:----13 1-16-B Teflon 16 2.5 54.1 51.7 12.12 Bottom 2 2-24-T Plywood 24 I 3.7 25.4 3.24 0.67 Top ---- ------1---- --- ---- r-T-T/2-1-- --- --1------- ----- 1------ 1-----11 2-24-T Teflon 24 4.2 52.2 40.2 4 .85 Top 4 2-26-T Plywood 16 I 3.7 39.9 7.64 0.81 Top ---- ------1----------- 1--~--1-------'------------- 1------ 1-----10 2-16-T Teflon 16 2.6 40.8 40.8 9.47 Top
(I) The outer layer of bars for the two-layer case (2) Bar stress normalized for cover thickness (l-in.), anchorage length (24-in.)
e.g. for test 13: measured stress= 54.1 ksi ; calculated bond factor= 11.54 for 1-1 /8 in cover; and 11.04 for l -in. cover (Equation 2.9). Modified stress = 54. 1 x 11.04 + 11.54 = 51.7 ksi
(3) Bond strength ratio of the tests without teflon sheet to that with teflon sheet
95
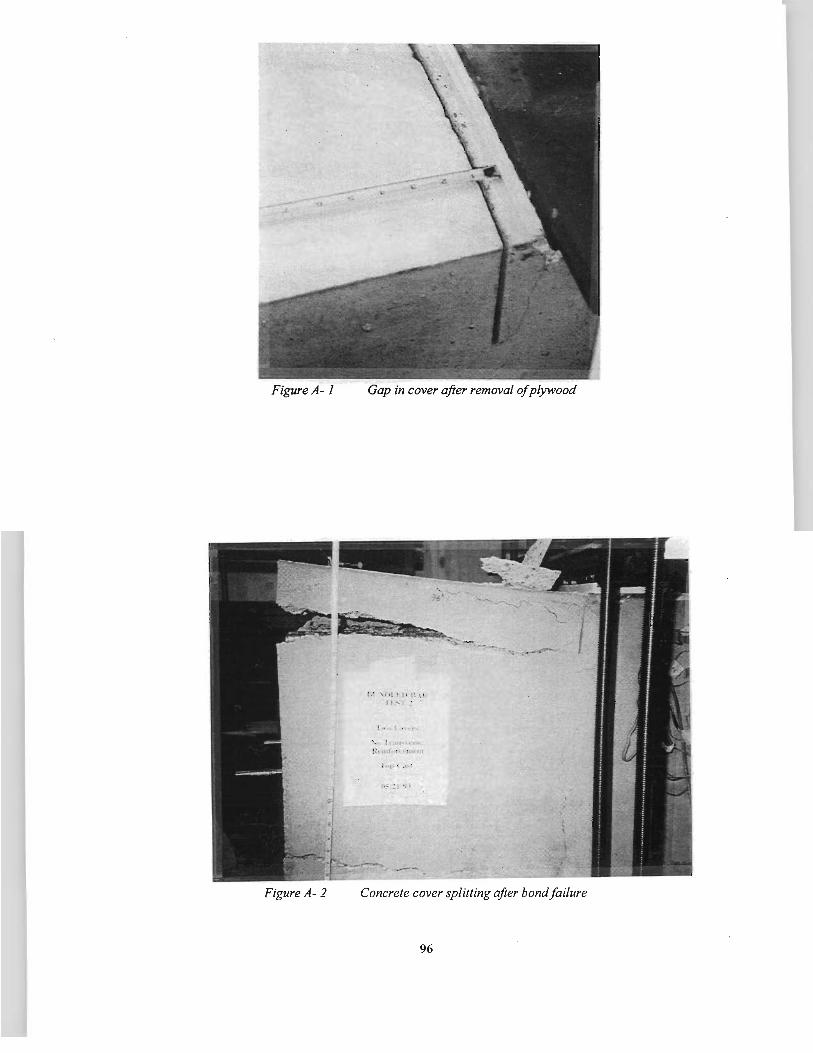
Figure A- I
Figure A- 2
Gap in cover after removal of plywood
!;; ,! ,: t ; i-: \i
} .... : ~
t I I
h:: ..:l ., '
Concrete cover splitting after bond failure
96
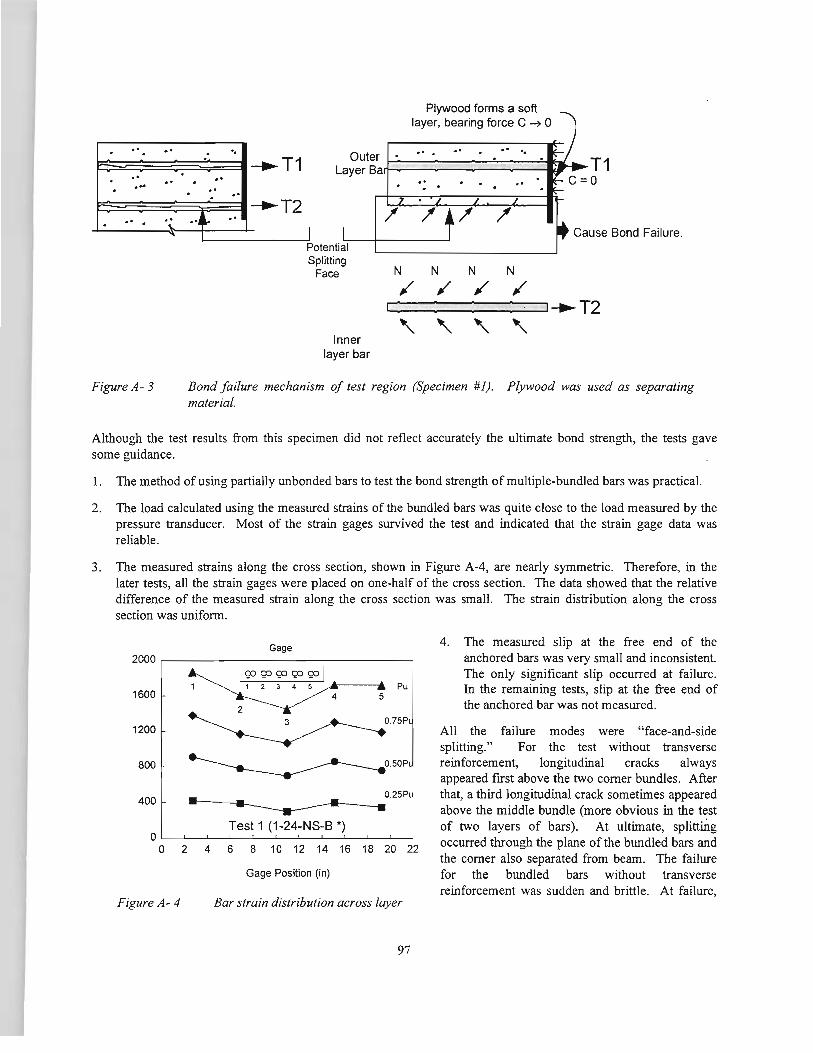
. .. . .. :
. .. .. . . . . ... . . . . . .. . ·~ ··•· '
.. ~T1
.. ~T2 ..
I Potential Splitting
Face
Inner layer bar
Plywood forms a soft layer, bearing force C ~ 0
.. . . . . .
N N N N / / / /
Cause Bond Failure.
'----~-------'~ T2
' ' ' ' Figure A- 3 Bond failure mechanism of test region (Specimen #1). Plywood was used as separating
material.
Although the test results from this specimen did not reflect accurately the ultimate bond strength, the tests gave some guidance.
1. The method of using partially unbonded bars to test the bond strength of multiple-bundled bars was practical.
2. The load calculated using the measured strains of the bundled bars was quite close to the load measured by the pressure transducer. Most of the strain gages survived the test and indicated that the strain gage data was reliable.
3. The measured strains along the cross section, shown in Figure A-4, are nearly symmetric. Therefore, in the later tests, all the strain gages were placed on one-half of the cross section. The data showed that the relative difference of the measured strain along the cross section was small. The strain distribution along the cross section was uniform.
Gage 2000,---------~--------------------,
I gJ Q:) Q:) <;o Q:) I ~---.l Pu
1600
1200
800
400
Test 1 (1-24-NS-B ") o L_~--L_~~L_~~L_~~L_-L~--~
0 2 4 6 8 10 12 14 16 18 20 22
Gage Position (in)
Figure A- 4 Bar strain distribution across layer
97
4. The measured slip at the free end of the anchored bars was very small and inconsistent. The only significant slip occurred at failure. In the remaining tests, slip at the free end of the anchored bar was not measured.
All the failure modes were "face-and-side splitting." For the test without transverse reinforcement, longitudinal cracks always appeared first above the two corner bundles. After that, a third longitudinal crack sometimes appeared above the middle bundle (more obvious in the test of two layers of bars). At ultimate, splittrng occurred through the plane of the bundled bars and the corner also separated from beam. The failure for the bundled bars without transverse reinforcement was sudden and brittle. At failure,
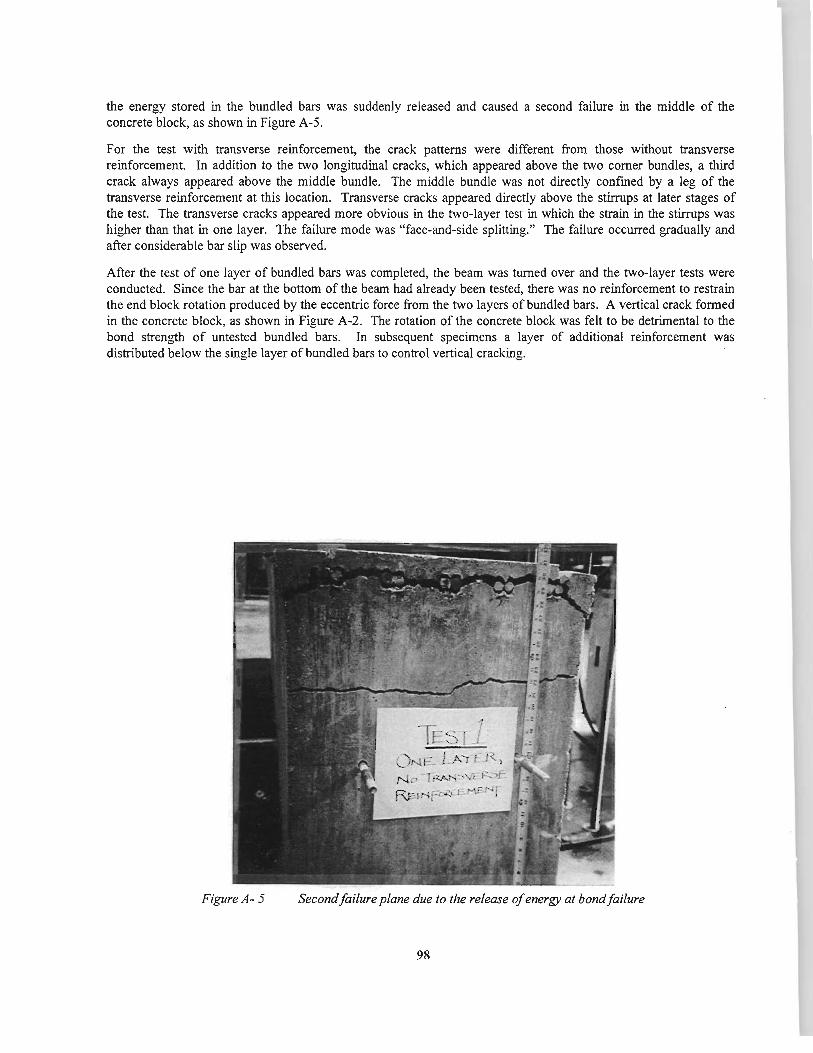
the energy stored in the bundled bars was suddenly released and caused a second failure in the middle of the concrete block, as shown in Figure A-5.
For the test with transverse reinforcement, the crack patterns were different from those without transverse reinforcement. In addition to the two longitudinal cracks, which appeared above the two comer bundles, a third crack always appeared above the middle bundle. The middle bundle was not directly confmed by a leg of the transverse reinforcement at this location. Transverse cracks appeared directly above the stirrups at later stages of the test. The transverse cracks appeared more obvious in the two-layer test in which the strain in the stirrups was higher than that in one layer. The failure mode was "face-and-side splitting." The failure occurred gradually and after considerable bar slip was observed.
After the test of one layer of bundled bars was completed, the beam was turned over and the two-layer tests were conducted. Since the bar at the bottom of the beam had already been tested, there was no reinforcement to restrain the end block rotation produced by the eccentric force from the two layers of bundled bars. A vertical crack formed in the concrete block, as shown in Figure A-2. The rotation of the concrete block was felt to be detrimental to the bond strength of untested bundled bars. In subsequent specimens a layer of additional reinforcement was distributed below the single layer of bundled bars to control vertical cracking.
Figure A- 5 Second failure plane due to the release of energy at bond failure
98


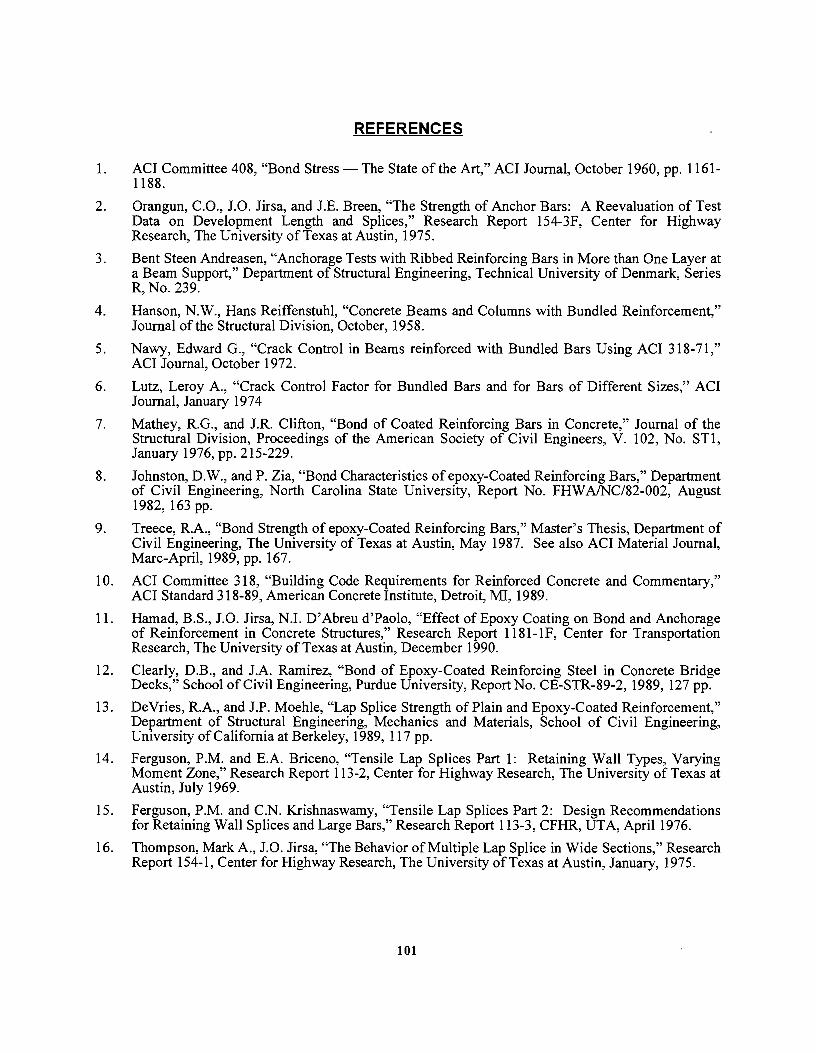
REFERENCES
1. ACI Committee 408, "Bond Stress- The State of the Art," ACI Journal, October 1960, pp. 1161-1188.
2. Orangun, C.O., J.O. Jirsa, and J.E. Breen, "The Strength of Anchor Bars: A Reevaluation of Test Data on Development Length and Splices," Research Report 154-3F, Center for Highway Research, The University of Texas at Austin, 1975.
3. Bent Steen Andreasen, "Anchorage Tests with Ribbed Reinforcing Bars in More than One Layer at a Beam Support," Department of Structural Engineering, Technical University of Denmark, Series R, No. 239.
4. Hanson, N.W., Hans Reiffenstuhl, "Concrete Beams and Columns with Bundled Reinforcement," Journal of the Structural Division, October, 1958.
5. Nawy, Edward G., "Crack Control in Beams reinforced with Bundled Bars Using ACI 318-71," ACI Journal, October 1972.
6. Lutz, Leroy A., "Crack Control Factor for Bundled Bars and for Bars of Different Sizes," ACI Journal, January 1974
7. Mathey, R.G., and J.R. Clifton, "Bond of Coated Reinforcing Bars in Concrete," Journal of the Structural Division, Proceedings of the American Society of Civil Engineers, V. 102, No. ST1, January 1976, pp. 215-229.
8. Johnston, D.W., and P. Zia, "Bond Characteristics of epoxy-Coated Reinforcing Bars," Department of Civil Engineering, North Carolina State University, Report No. FHW A/NC/82-002, August 1982, 163 pp.
9. Treece, R.A., "Bond Strength of epoxy-Coated Reinforcing Bars," Master's Thesis, Department of Civil Engineering, The University of Texas at Austin, May 1987. See also ACI Material Journal, Marc-April, 1989, pp. 167.
10. ACI Committee 318, "Building Code Requirements for Reinforced Concrete and Commentary," ACI Standard 318-89, American Concrete Institute, Detroit, MI, 1989.
11. Hamad, B.S., J.O. Jirsa, N.J. D'Abreu d'Paolo, "Effect of Epoxy Coating on Bond and Anchorage of Reinforcement in Concrete Structures," Research Report 1181-lF, Center for Transportation Research, The University of Texas at Austin, December 1990.
12. Clearly, D.B., and J.A. Ramirez, "Bond of Epoxy-Coated Reinforcing Steel in Concrete Bridge Decks," School of Civil Engineering, Purdue University, Report No. CE-STR-89-2, 1989, 127 pp.
13. DeVries, R.A., and J.P. Moehle, "Lap Splice Strength of Plain and Epoxy-Coated Reinforcement," Department of Structural Engineering, Mechanics and Materials, School of Civil Engineering, University of California at Berkeley, 1989, 117 pp.
14. Ferguson, P.M. and E.A. Briceno, "Tensile Lap Splices Part 1: Retaining Wall Types, Varying Moment Zone," Research Report 113-2, Center for Highway Research, The University of Texas at Austin, July 1969.
15. Ferguson, P.M. and C.N. Krishnaswamy, "Tensile Lap Splices Part 2: Design Recommendations for Retaining Wall Splices and Large Bars," Research Report 113-3, CFHR, UTA, Apri11976.
16. Thompson, Mark A., J.O. Jirsa, "The Behavior of Multiple Lap Splice in Wide Sections," Research Report 154-1, Center for Highway Research, The University of Texas at Austin, January, 1975.
101
17. Jirsa, J.O., J.E. Breen, "Influence of Casting Position and Shear on Development and Splice Length - Design Recommendation," Research Report 242-3F, Center for Transportation Research, The University of Texas at Austin.
18. Lukose, K., Gergely, P., and White, R.N., "Behavior of Reinforced Concrete Lapped Splices for Inelastic Cyclic Loading," ACI Journal, Sept.-Oct. 1982, pp. 355-365.
19. American Association of State Highway and Transportaiton Officials, "Standard Specifications for Highway Bridges," 1989.
20. AASHTO, "Standard Specification for Highway Bridges" (Fifteenth Edition), American Association of State Highway and Traffic Officials, Washington, D.C., 1992.
102