Embed Size (px)
Citation preview
Development of bioenergy in Ukraine
Georgiy Geletukha, PhD
Head of Board, Bioenergy Association of Ukraine
We are greening the energy!
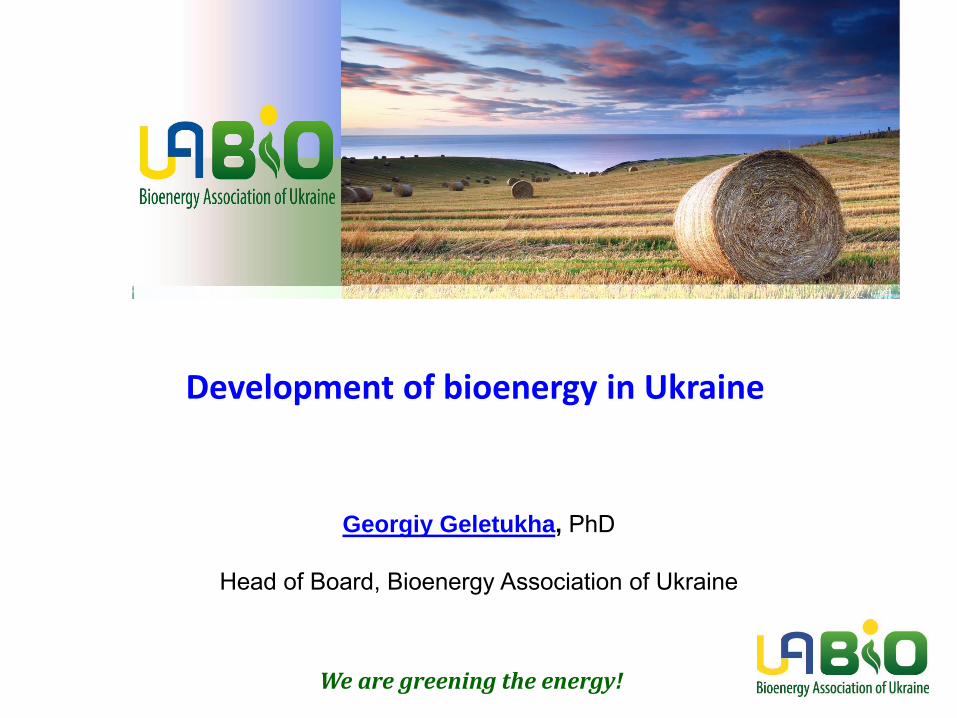
Sceintific-Engineering Center “Biomass”
LLC “Teplodar PV”
LLC «Salix Energy»
LLC “Equator Sun Energy“
Agricultural company “Danosha”
LLC “Naftogazrembud-1”
NGO “Renewable Energy Agency”
LLC “Novovodolazhski teplovi merezhi”
BioGTS Ltd, Finland LLC “Kyiv Green Energy”
TTS Eko s.r.o., Czech Republic
LLC “Volyn-Kalvis”
LLC “Contemporaty Energy Technologies"
Physical persons:
Maraykin R., Petrov Ya., Pavol Norulak, Ilchuk M.
UABio members (legal persons)
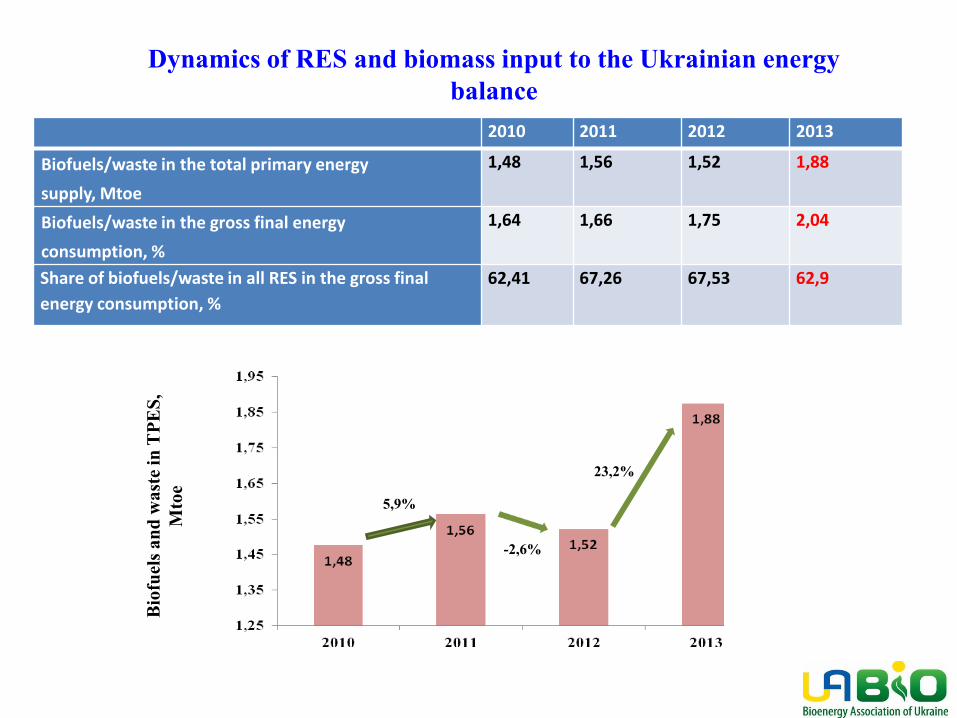
2010 2011 2012 2013
Biofuels/waste in the total primary energy
supply, Mtoe
1,48 1,56 1,52 1,88
Biofuels/waste in the gross final energy
consumption, %
1,64 1,66 1,75 2,04
Share of biofuels/waste in all RES in the gross final
energy consumption, %
62,41 67,26 67,53 62,9
Dynamics of RES and biomass input to the Ukrainian energy balance
-2,6%
23,2% 5,9%
Bio
fuel
s and
was
te in
TPE
S,
Mto
e
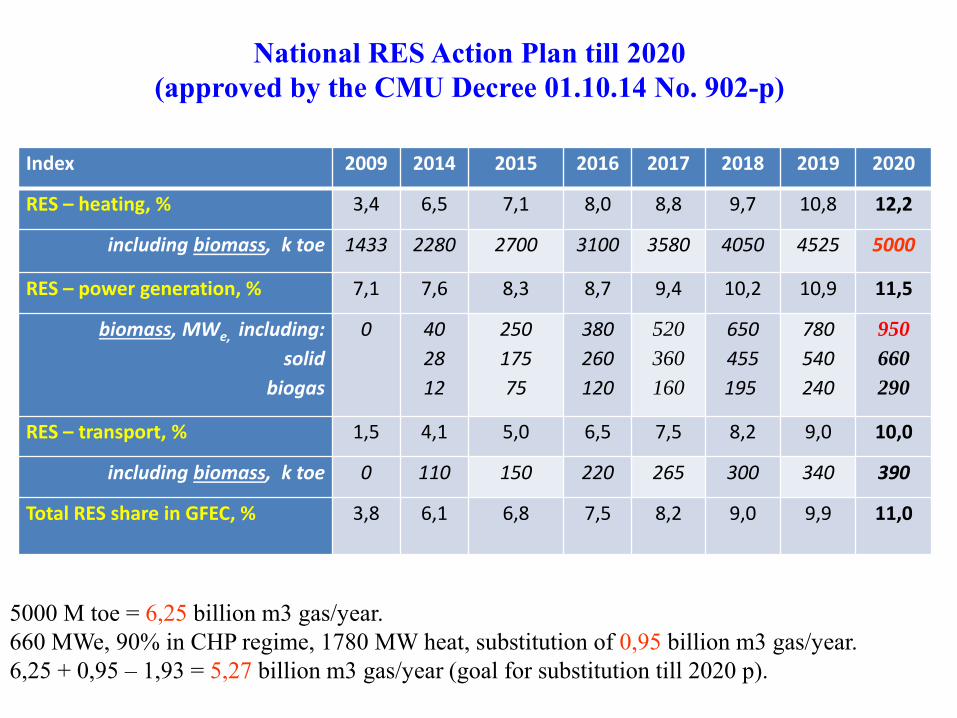
National RES Action Plan till 2020 (approved by the CMU Decree 01.10.14 No. 902-р)
Index 2009 2014 2015 2016 2017 2018 2019 2020
RES – heating, % 3,4 6,5 7,1 8,0 8,8 9,7 10,8 12,2
including biomass, k toe 1433 2280 2700 3100 3580 4050 4525 5000
RES – power generation, % 7,1 7,6 8,3 8,7 9,4 10,2 10,9 11,5
biomass, МWе, including:
solid
biogas
0 40
28
12
250
175
75
380
260
120
520
360
160
650
455
195
780
540
240
950
660
290
RES – transport, % 1,5 4,1 5,0 6,5 7,5 8,2 9,0 10,0
including biomass, k toe 0 110 150 220 265 300 340 390
Total RES share in GFEC, % 3,8 6,1 6,8 7,5 8,2 9,0 9,9 11,0
5000 M toe = 6,25 billion m3 gas/year. 660 МWe, 90% in CHP regime, 1780 МW heat, substitution of 0,95 billion m3 gas/year. 6,25 + 0,95 – 1,93 = 5,27 billion m3 gas/year (goal for substitution till 2020 р).
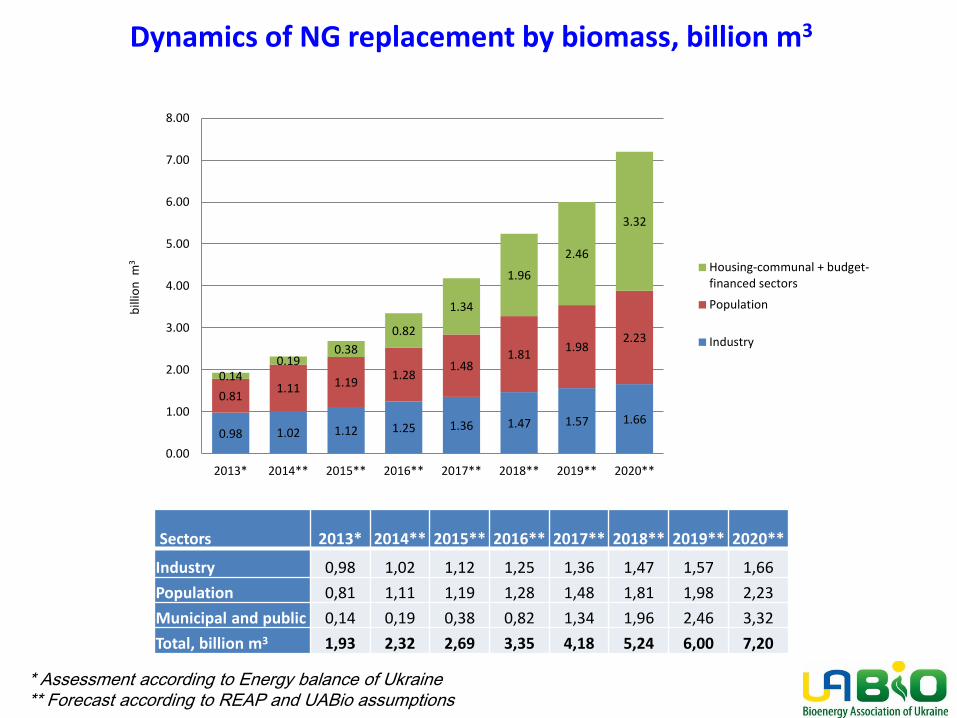
Sectors 2013* 2014** 2015** 2016** 2017** 2018** 2019** 2020**
Industry 0,98 1,02 1,12 1,25 1,36 1,47 1,57 1,66
Population 0,81 1,11 1,19 1,28 1,48 1,81 1,98 2,23
Municipal and public 0,14 0,19 0,38 0,82 1,34 1,96 2,46 3,32
Total, billion m3 1,93 2,32 2,69 3,35 4,18 5,24 6,00 7,20
* Assessment according to Energy balance of Ukraine ** Forecast according to REAP and UABio assumptions
Dynamics of NG replacement by biomass, billion m3
0.98 1.02 1.12 1.25 1.36 1.47 1.57 1.66
0.81 1.11 1.19
1.28 1.48
1.81 1.98
2.23
0.14 0.19
0.38
0.82
1.34
1.96
2.46
3.32
0.00
1.00
2.00
3.00
4.00
5.00
6.00
7.00
8.00
2013* 2014** 2015** 2016** 2017** 2018** 2019** 2020**
bill
ion
m3 Housing-communal + budget-
financed sectors
Population
Industry
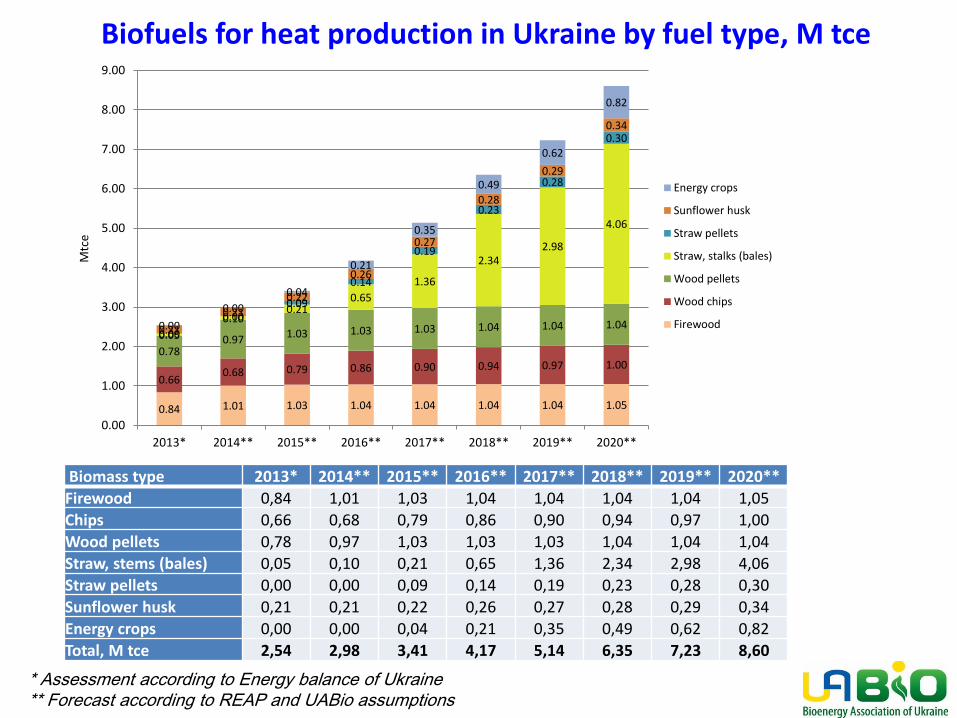
Biomass type 2013* 2014** 2015** 2016** 2017** 2018** 2019** 2020**
Firewood 0,84 1,01 1,03 1,04 1,04 1,04 1,04 1,05
Chips 0,66 0,68 0,79 0,86 0,90 0,94 0,97 1,00
Wood pellets 0,78 0,97 1,03 1,03 1,03 1,04 1,04 1,04
Straw, stems (bales) 0,05 0,10 0,21 0,65 1,36 2,34 2,98 4,06
Straw pellets 0,00 0,00 0,09 0,14 0,19 0,23 0,28 0,30
Sunflower husk 0,21 0,21 0,22 0,26 0,27 0,28 0,29 0,34
Energy crops 0,00 0,00 0,04 0,21 0,35 0,49 0,62 0,82
Total, M tce 2,54 2,98 3,41 4,17 5,14 6,35 7,23 8,60
Biofuels for heat production in Ukraine by fuel type, M tce
0.84 1.01 1.03 1.04 1.04 1.04 1.04 1.05
0.66 0.68 0.79 0.86 0.90 0.94 0.97 1.00
0.78 0.97 1.03 1.03 1.03 1.04 1.04 1.04
0.05
0.10 0.21
0.65
1.36
2.34 2.98
4.06
0.00
0.00 0.09
0.14
0.19
0.23
0.28
0.30
0.21
0.21
0.22
0.26
0.27
0.28
0.29
0.34
0.00
0.00
0.04
0.21
0.35
0.49
0.62
0.82
0.00
1.00
2.00
3.00
4.00
5.00
6.00
7.00
8.00
9.00
2013* 2014** 2015** 2016** 2017** 2018** 2019** 2020**
Mtc
e
Energy crops
Sunflower husk
Straw pellets
Straw, stalks (bales)
Wood pellets
Wood chips
Firewood
* Assessment according to Energy balance of Ukraine ** Forecast according to REAP and UABio assumptions
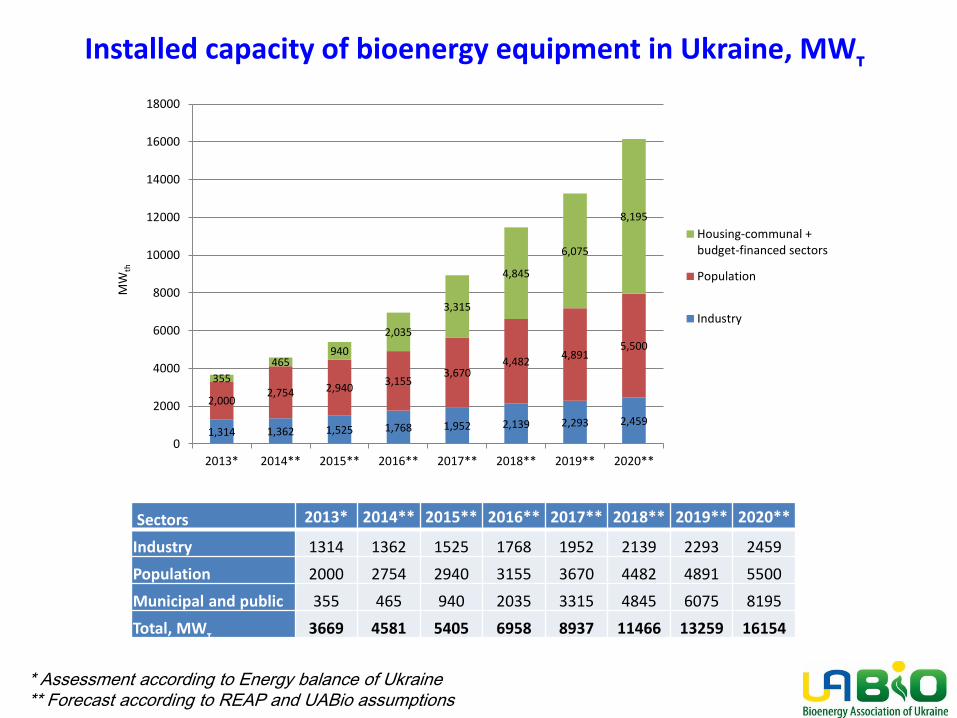
Sectors 2013* 2014** 2015** 2016** 2017** 2018** 2019** 2020**
Industry 1314 1362 1525 1768 1952 2139 2293 2459
Population 2000 2754 2940 3155 3670 4482 4891 5500
Municipal and public 355 465 940 2035 3315 4845 6075 8195
Total, МWт 3669 4581 5405 6958 8937 11466 13259 16154
Installed capacity of bioenergy equipment in Ukraine, МWт
1,314 1,362 1,525 1,768 1,952 2,139 2,293 2,459
2,000 2,754 2,940
3,155 3,670
4,482 4,891
5,500
355
465 940
2,035
3,315
4,845
6,075
8,195
0
2000
4000
6000
8000
10000
12000
14000
16000
18000
2013* 2014** 2015** 2016** 2017** 2018** 2019** 2020**
MW
th
Housing-communal +budget-financed sectors
Population
Industry
* Assessment according to Energy balance of Ukraine ** Forecast according to REAP and UABio assumptions
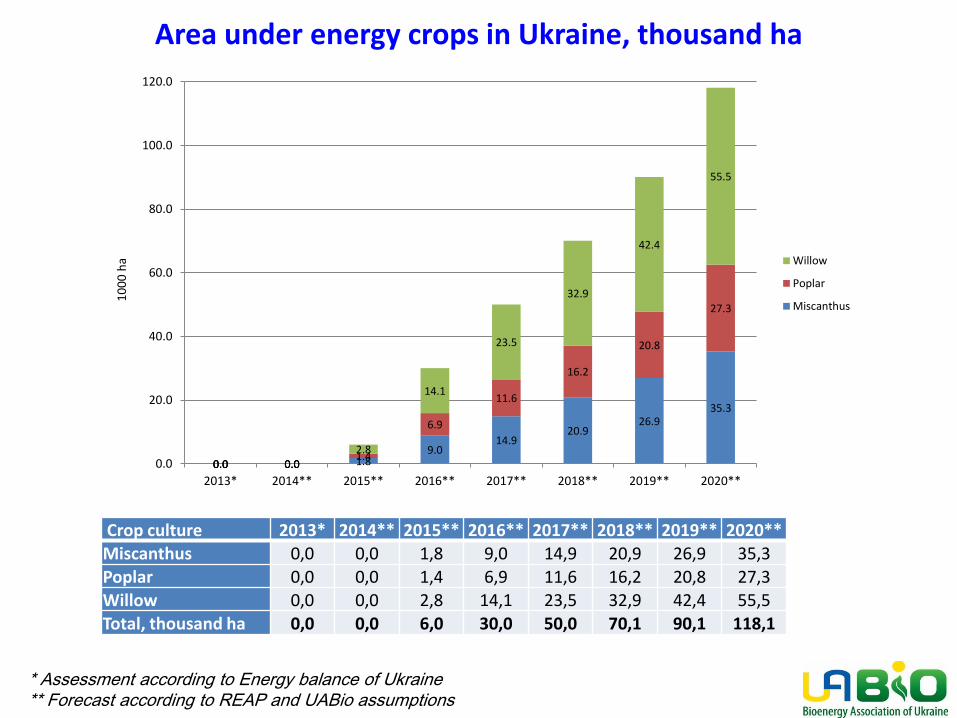
Crop culture 2013* 2014** 2015** 2016** 2017** 2018** 2019** 2020** Miscanthus 0,0 0,0 1,8 9,0 14,9 20,9 26,9 35,3
Poplar 0,0 0,0 1,4 6,9 11,6 16,2 20,8 27,3 Willow 0,0 0,0 2,8 14,1 23,5 32,9 42,4 55,5
Total, thousand ha 0,0 0,0 6,0 30,0 50,0 70,1 90,1 118,1
Area under energy crops in Ukraine, thousand ha
0.0 0.0 1.8 9.0
14.9 20.9
26.9 35.3
0.0 0.0 1.4
6.9
11.6
16.2
20.8
27.3
0.0 0.0 2.8
14.1
23.5
32.9
42.4
55.5
0.0
20.0
40.0
60.0
80.0
100.0
120.0
2013* 2014** 2015** 2016** 2017** 2018** 2019** 2020**
10
00
ha Willow
Poplar
Miscanthus
* Assessment according to Energy balance of Ukraine ** Forecast according to REAP and UABio assumptions
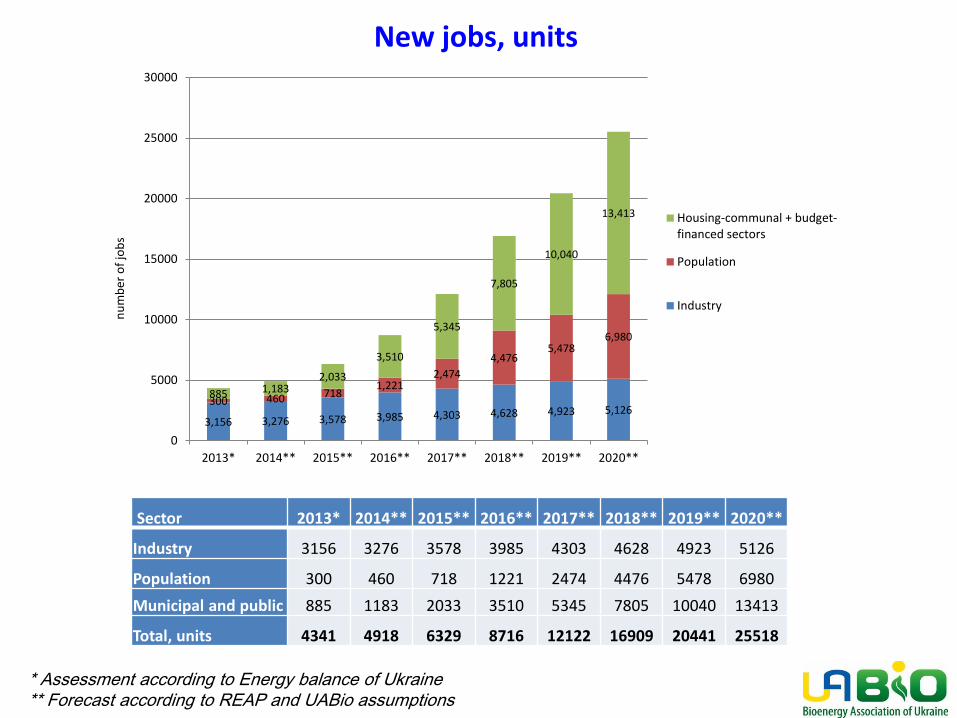
Sector 2013* 2014** 2015** 2016** 2017** 2018** 2019** 2020**
Industry 3156 3276 3578 3985 4303 4628 4923 5126
Population 300 460 718 1221 2474 4476 5478 6980
Municipal and public 885 1183 2033 3510 5345 7805 10040 13413
Total, units 4341 4918 6329 8716 12122 16909 20441 25518
New jobs, units
3,156 3,276 3,578 3,985 4,303 4,628 4,923 5,126 300 460 718
1,221 2,474
4,476 5,478
6,980
885 1,183 2,033
3,510
5,345
7,805
10,040
13,413
0
5000
10000
15000
20000
25000
30000
2013* 2014** 2015** 2016** 2017** 2018** 2019** 2020**
nu
mb
er o
f jo
bs
Housing-communal + budget-financed sectors
Population
Industry
* Assessment according to Energy balance of Ukraine ** Forecast according to REAP and UABio assumptions
1182 1089
1788
3645 3600
7188
0
1000
2000
3000
4000
5000
6000
7000
8000
Nat
ura
l gas
pri
ce f
or
po
pu
lati
on
(in
cl. V
AT)
, U
AH
/10
00
m3
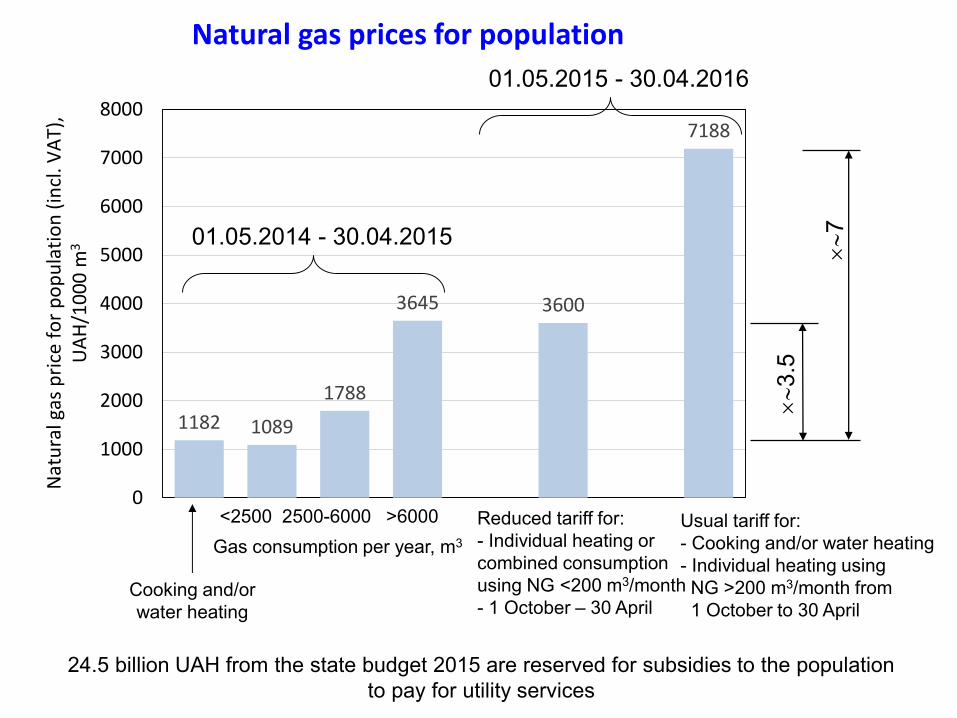
01.05.2014 - 30.04.2015
<2500 2500-6000 >6000
Gas consumption per year, m3
Natural gas prices for population
Reduced tariff for: - Individual heating or combined consumption using NG <200 m3/month - 1 October – 30 April
Usual tariff for: - Cooking and/or water heating - Individual heating using NG >200 m3/month from 1 October to 30 April
Cooking and/or water heating
3.
5
7
24.5 billion UAH from the state budget 2015 are reserved for subsidies to the population to pay for utility services
01.05.2015 - 30.04.2016
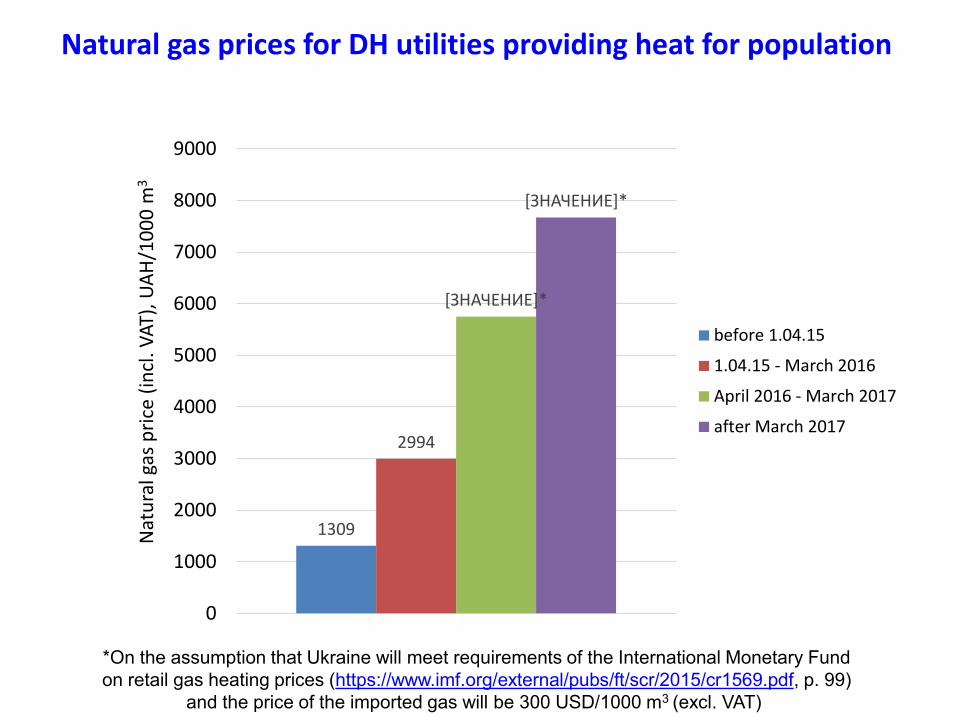
Natural gas prices for DH utilities providing heat for population
1309
2994
[ЗНАЧЕНИЕ]*
[ЗНАЧЕНИЕ]*
0
1000
2000
3000
4000
5000
6000
7000
8000
9000N
atu
ral g
as p
rice
(in
cl. V
AT)
, UA
H/1
00
0 m
3
before 1.04.15
1.04.15 - March 2016
April 2016 - March 2017
after March 2017
*On the assumption that Ukraine will meet requirements of the International Monetary Fund on retail gas heating prices (https://www.imf.org/external/pubs/ft/scr/2015/cr1569.pdf, p. 99)
and the price of the imported gas will be 300 USD/1000 m3 (excl. VAT)
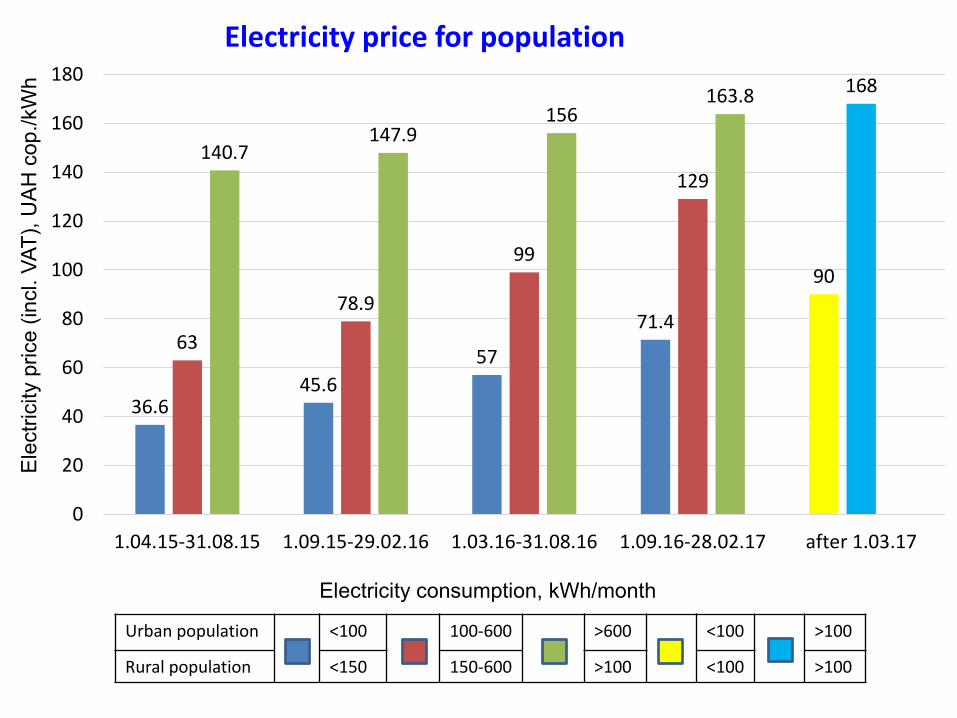
Urban population <100 100-600 >600 <100 >100
Rural population <150 150-600 >100 <100 >100
36.6 45.6
57
71.4
90
63
78.9
99
129
168
140.7 147.9
156 163.8
0
20
40
60
80
100
120
140
160
180
1.04.15-31.08.15 1.09.15-29.02.16 1.03.16-31.08.16 1.09.16-28.02.17 after 1.03.17
Electricity price for population
Electricity consumption, kWh/month
Ele
ctric
ity p
rice
(incl
. VAT
), U
AH
cop
./kW
h
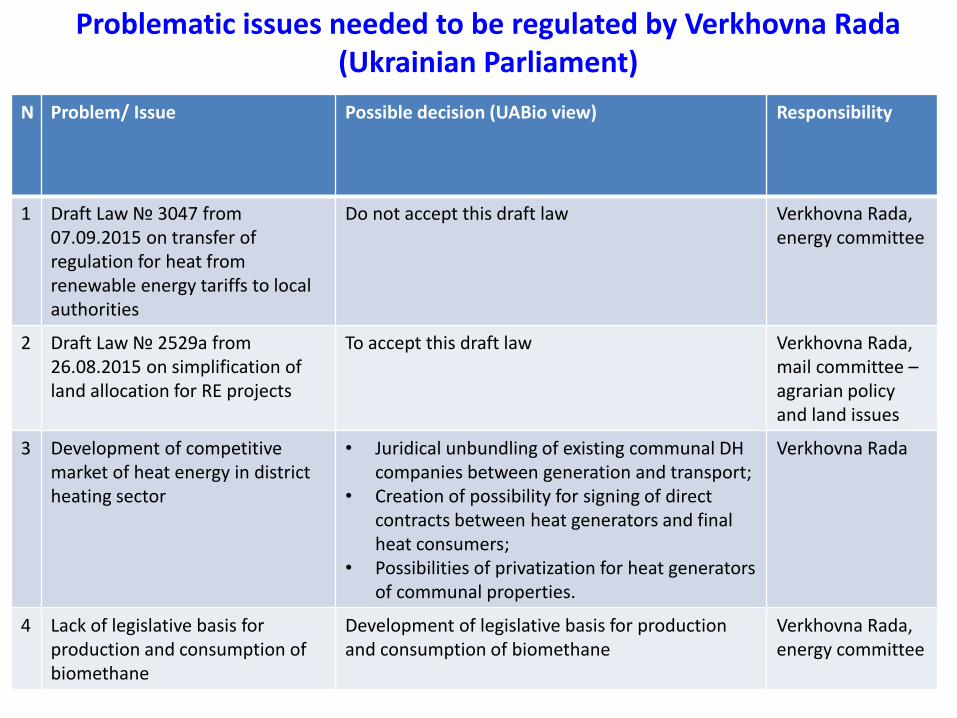
Problematic issues needed to be regulated by Verkhovna Rada (Ukrainian Parliament)
N Problem/ Issue Possible decision (UABio view) Responsibility
1 Draft Law № 3047 from 07.09.2015 on transfer of regulation for heat from renewable energy tariffs to local authorities
Do not accept this draft law Verkhovna Rada, energy committee
2 Draft Law № 2529a from 26.08.2015 on simplification of land allocation for RE projects
To accept this draft law Verkhovna Rada, mail committee – agrarian policy and land issues
3 Development of competitive market of heat energy in district heating sector
• Juridical unbundling of existing communal DH companies between generation and transport;
• Creation of possibility for signing of direct contracts between heat generators and final heat consumers;
• Possibilities of privatization for heat generators of communal properties.
Verkhovna Rada
4 Lack of legislative basis for production and consumption of biomethane
Development of legislative basis for production and consumption of biomethane
Verkhovna Rada, energy committee
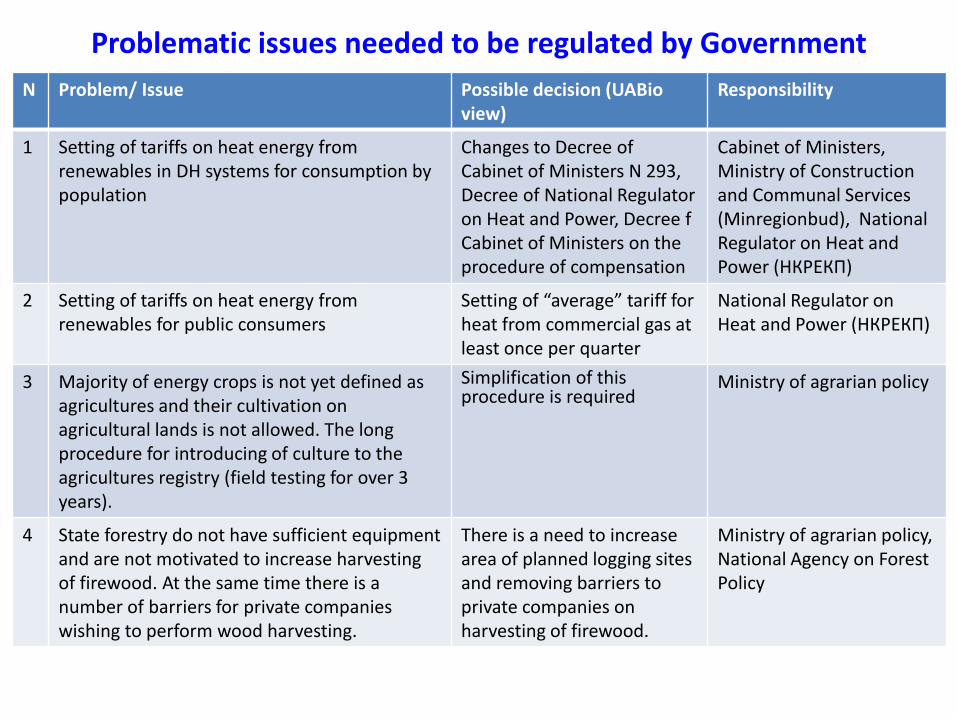
Problematic issues needed to be regulated by Government
N Problem/ Issue Possible decision (UABio view)
Responsibility
1 Setting of tariffs on heat energy from renewables in DH systems for consumption by population
Changes to Decree of Cabinet of Ministers N 293, Decree of National Regulator on Heat and Power, Decree f Cabinet of Ministers on the procedure of compensation
Cabinet of Ministers, Ministry of Construction and Communal Services (Minregionbud), National Regulator on Heat and Power (НКРЕКП)
2 Setting of tariffs on heat energy from renewables for public consumers
Setting of “average” tariff for heat from commercial gas at least once per quarter
National Regulator on Heat and Power (НКРЕКП)
3 Majority of energy crops is not yet defined as agricultures and their cultivation on agricultural lands is not allowed. The long procedure for introducing of culture to the agricultures registry (field testing for over 3 years).
Simplification of this procedure is required
Ministry of agrarian policy
4 State forestry do not have sufficient equipment and are not motivated to increase harvesting of firewood. At the same time there is a number of barriers for private companies wishing to perform wood harvesting.
There is a need to increase area of planned logging sites and removing barriers to private companies on harvesting of firewood.
Ministry of agrarian policy, National Agency on Forest Policy
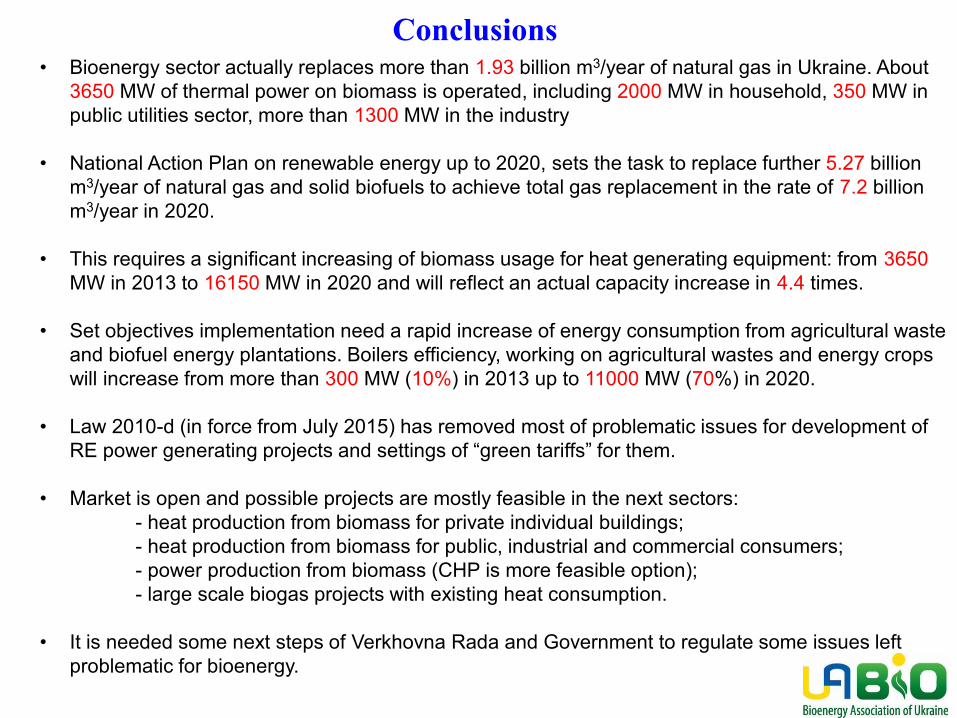
Conclusions • Bioenergy sector actually replaces more than 1.93 billion m3/year of natural gas in Ukraine. About
3650 MW of thermal power on biomass is operated, including 2000 MW in household, 350 MW in public utilities sector, more than 1300 MW in the industry
• National Action Plan on renewable energy up to 2020, sets the task to replace further 5.27 billion m3/year of natural gas and solid biofuels to achieve total gas replacement in the rate of 7.2 billion m3/year in 2020.
• This requires a significant increasing of biomass usage for heat generating equipment: from 3650 MW in 2013 to 16150 MW in 2020 and will reflect an actual capacity increase in 4.4 times.
• Set objectives implementation need a rapid increase of energy consumption from agricultural waste and biofuel energy plantations. Boilers efficiency, working on agricultural wastes and energy crops will increase from more than 300 MW (10%) in 2013 up to 11000 MW (70%) in 2020.
• Law 2010-d (in force from July 2015) has removed most of problematic issues for development of RE power generating projects and settings of “green tariffs” for them.
• Market is open and possible projects are mostly feasible in the next sectors: - heat production from biomass for private individual buildings; - heat production from biomass for public, industrial and commercial consumers; - power production from biomass (CHP is more feasible option); - large scale biogas projects with existing heat consumption.
• It is needed some next steps of Verkhovna Rada and Government to regulate some issues left
problematic for bioenergy.
Georgiy Geletukha
tel./fax: 044 332 9140 E-mail: [email protected]
www.uabio.org
Thank you for attention!
We kindly invite you to become UABio members
We are greening the energy!