Embed Size (px)
Citation preview
American Journal of Analytical Chemistry, 2014, 5, 1249-1260 Published Online December 2014 in SciRes. http://www.scirp.org/journal/ajac http://dx.doi.org/10.4236/ajac.2014.517131
How to cite this paper: Hotha, K.K., Patel, T., Roychowdhury, S. and Subramanian, V. (2014) Development of Better-Quality Assay Method for the Citric Acid and Sodium Citrate in Ophthalmic/Oral Solutions and Their Application to Deformulation Studies. American Journal of Analytical Chemistry, 5, 1249-1260. http://dx.doi.org/10.4236/ajac.2014.517131
Development of Better-Quality Assay Method for the Citric Acid and Sodium Citrate in Ophthalmic/Oral Solutions and Their Application to Deformulation Studies Kishore Kumar Hotha*, Tejashkumar Patel, Swapan Roychowdhury, Veerappan Subramanian Novel Laboratories Inc., Somerset, NJ, USA Email: *[email protected], *[email protected] Received 24 September 2014; revised 12 November 2014; accepted 30 November 2014
Copyright © 2014 by authors and Scientific Research Publishing Inc. This work is licensed under the Creative Commons Attribution International License (CC BY). http://creativecommons.org/licenses/by/4.0/
Abstract There were several techniques determined for the analysis of citrate and citric acid mixtures in the pharmaceutical dosage forms. Titration methods, photometric and ion chromatographic me-thods were used for their determination. These methods will restrict too many factors where the accurate quantification of citrate and citric acid is extremely challenging. Citric acid is the natural flavor used as a preservative for many pharmaceutical applications. Deformulation techniques used for the manufacturing of generic drugs require authentic data for their regulatory submis-sions. Simple accurate and reproducible validated method developed for the determination of ci-tric acid and sodium citrate by titration followed by HPLC analysis. Free citric acid was deter-mined by the titration method and total citric acid was determined by HPLC analysis. After sub- tracting the free citric acid from total citric acid content, citric acid present in the sodium citrate content was determined. Sodium citrate content was determined by applying sodium correction factor to the subtracted value of the citric acid. The results met all the validation parameters and the method was successfully measured the amount of citric acid and sodium citrate in the mar-keted ophthalmic/oral solutions.
Keywords Citric Acid, Sodium Citrate, Ophthalmic Solutions, Oral Solutions, Titration, HPLC
*Corresponding author.
K. K. Hotha et al.
1250
1. Introduction Citric acid and inorganic citrates are active ingredients in many dosage forms. Citric acid is a weak organic acid with the formula C6H8O7. It is a natural preservative/conservative which occurs naturally in citrus fruits and is also used to add an acidic or sour taste to foods and drinks. Sodium citrate refers to sodium salt of citric acid where sodium salt attaches to any of the hydroxyl group. Sodium citrate is available as mono, di- and tri-sodium salts [1]-[3]. It is also a form of the food additive like citric acid. The usage of citric acid is very significant in the pharmaceutical and biological research as anticoagulants to preserve blood and plasma for transfusion, as laxatives to treat constipation and to empty and prepare colon or rectal and colon examinations and surgery, as systemic alkalizers to help contain certain kidney stones, to provide rehydration treatment, and as ingredients in rectal enemas [4]. In the product development of ophthalmic solutions, citric acid, sodium citrate or combination shall be used as a preservative [5] [6]. Deformulation studies provide insight to the generic manufacturers in terms of quantity of excipient used. Measurement of citric acid and sodium citrate individually by HPLC is an easier process because of the vast literature availability [5]-[16]. But the mixtures of citrate and citric acid can-not be separated by HPLC because of their identical characteristics in the solution. Ion chromatographic me-thods help to provide the quantity of sodium citrate by measuring sodium through indirect measurement.
USP 37 NF 32 contains different techniques for the assay of citric acid and/or citrate including wet chemistry analysis, titration, colorimetric analysis, ion-exchange chromatography, ion-exclusion chromatography, and re-versed-phase chromatography [6]. These procedures often involve a number of steps that are monotonous, labor intensive and time consuming. Apart from the above, there were many methods measured total citric acid con-tent (mixture of sodium citrate and citric acid). An IC method for the assay of citrate in nine dosage formulations was reported [7], which involved elution of anion-exchange column by Trimesic acid and indirect UV detection at 280 nm. Trimesic acid contains UV-absorbing chromospheres. The negative citrate peak was recorded as a positive peak by reversing input polarity of the integrator. An ion-exclusion chromatographic method for the de-termination of citrate and acetate in pharmaceutical formulations was reported [8], in which Aminex column was eluted with sulfuric acid at 60˚C and monitored by UV detection at 280 nm. Samples were cleaned up using an SPE cartridge before chromatography to remove trace amounts of hydrophobic components, thus reducing the run time from 180 minutes to 35 minutes [9].
Till today only one method which determines the total and free citric acid in the alkalizing solutions. Tan HS et al. reported an improved method for the determination of citrate and citric acid [10]. Diluted sample is titrated with 0.02 N NaOH to find the free citric acid content [9]. The same solution was passed through cation-ex- change chromatography and the solution was titrated with 0.02 N NaOH to assay for total citric acid. Subtract-ing the results of the first titration from the second provides the citrate content. The major difficulty in this me-thod is the cation exchange chromatography in which the sodium ions were replaced by H+ ions when passing through glass column. This will produce major reproducible problems and also be time consuming with compli-cated steps and recoveries are not consistent.
The present method measured the free citric acid by titration method and total citric acid by a simple reverse phase HPLC method. Based on the existing methods, titration was performed by taking very low strength of NaOH (0.01 N) which measures the free citric acid present in the finished product. Total citric acid was measured by simple HPLC method. Literature shows that the NaOH titration only gives the free citric acid present in the citric acid and citrate mixture [9]. After subtracting the free citric acid from total citric acid con-tent, citric acid present in the sodium citrate content was determined. Sodium citrate content was determined by applying sodium correction factor to the subtracted value of the citric acid. The results met all the validation pa-rameters and the method was successfully measured the amount of citric acid and sodium citrate in the marketed ophthalmic/oral solutions. The present method was tested for the linearity, accuracy, precision for both free citric acid by titration and total citric acid by HPLC.
2. Experimental 2.1. Chemical and Reagents Citric acid and Sodium citrate dihydrate reference standards and Phenolphthalein indicator were procured from sigma Aldrich, USA. HPLC grade Acetonitrile, methanol, and ortho phosphoric acid were purchased from Merck, Darmstadt, Germany. Water used was obtained by using Millipore MilliQ Plus water purification system. Drug product samples were supplied by Novel Laboratories Inc., Somerset, New Jersey.
K. K. Hotha et al.
1251
2.2. Equipment Water HPLC with 2695 separation module equipped with 2996 PDA detector. The output signal was monitored and processed using Empower-3 software. Standard laboratory glassware, burette, 250-mL volumetric flask and volumetric pipets (5-mL, 10 mL and 15 mL) were used for titration.
2.3. Chromatographic Conditions The chromatographic column used was a Lichrospher 60 RP-select B, 4.0 × 250 mm, 5 μm. The separation was achieved on a gradient method. Solvent A is a 0.05% phosphoric acid in water and solvent B is Acetonitrile. The flow rate was 1.0 mL∙min−1 and the detection wavelength was 210 nm. The HPLC gradient program was set as: Time (min)/% solution B: 00/0, 6.5/0, 7.0/50, 11.0/50, 12.0/0, 30.0/0. The column temperature was maintained at 30˚C and the injection volume is 20 μL. Milli-Q water was used as a Diluent.
2.4. Titrimetric Conditions Known Molarity of sodium Hydroxide (0.01 N NaOH Standardized solution) was used for the titration. Phe-nolphthalein was used as an indicator. Based on the USP monograph 550 mg of optimized to 0.01 N NaOH which requires 859 mL of 0.01 N NaOH for 550 mg of the Citric acid content [6].
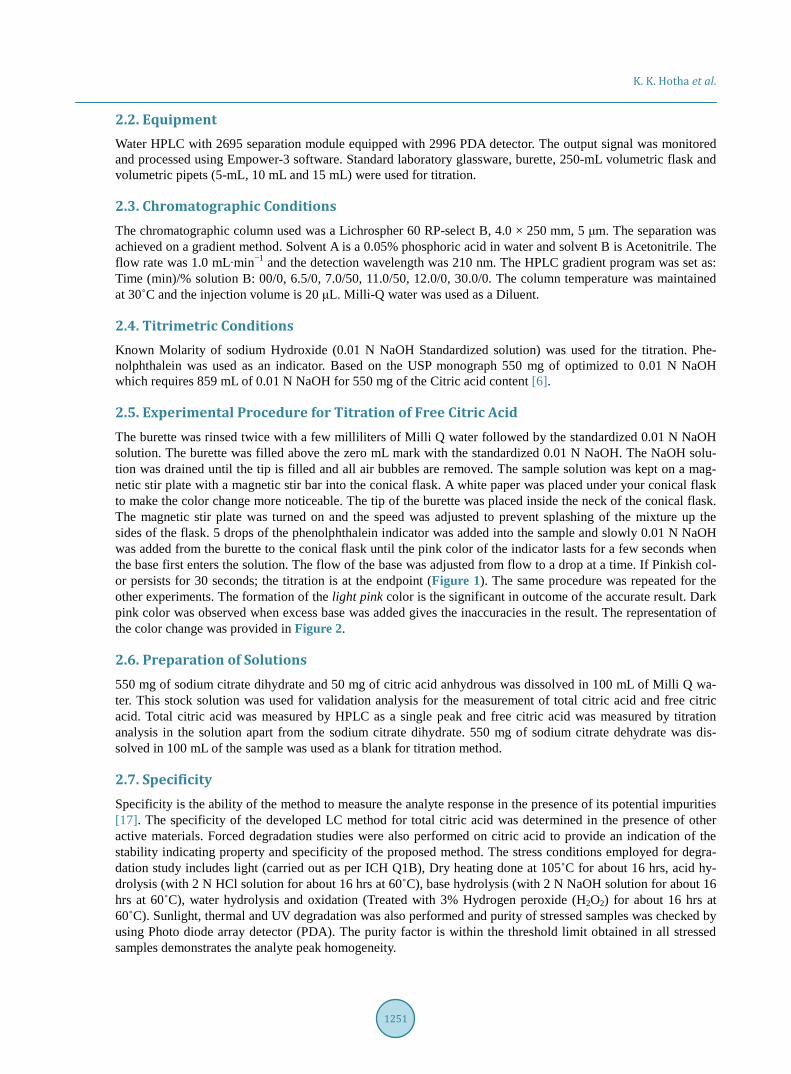
2.5. Experimental Procedure for Titration of Free Citric Acid The burette was rinsed twice with a few milliliters of Milli Q water followed by the standardized 0.01 N NaOH solution. The burette was filled above the zero mL mark with the standardized 0.01 N NaOH. The NaOH solu-tion was drained until the tip is filled and all air bubbles are removed. The sample solution was kept on a mag-netic stir plate with a magnetic stir bar into the conical flask. A white paper was placed under your conical flask to make the color change more noticeable. The tip of the burette was placed inside the neck of the conical flask. The magnetic stir plate was turned on and the speed was adjusted to prevent splashing of the mixture up the sides of the flask. 5 drops of the phenolphthalein indicator was added into the sample and slowly 0.01 N NaOH was added from the burette to the conical flask until the pink color of the indicator lasts for a few seconds when the base first enters the solution. The flow of the base was adjusted from flow to a drop at a time. If Pinkish col-or persists for 30 seconds; the titration is at the endpoint (Figure 1). The same procedure was repeated for the other experiments. The formation of the light pink color is the significant in outcome of the accurate result. Dark pink color was observed when excess base was added gives the inaccuracies in the result. The representation of the color change was provided in Figure 2.
2.6. Preparation of Solutions 550 mg of sodium citrate dihydrate and 50 mg of citric acid anhydrous was dissolved in 100 mL of Milli Q wa-ter. This stock solution was used for validation analysis for the measurement of total citric acid and free citric acid. Total citric acid was measured by HPLC as a single peak and free citric acid was measured by titration analysis in the solution apart from the sodium citrate dihydrate. 550 mg of sodium citrate dehydrate was dis-solved in 100 mL of the sample was used as a blank for titration method.
2.7. Specificity Specificity is the ability of the method to measure the analyte response in the presence of its potential impurities [17]. The specificity of the developed LC method for total citric acid was determined in the presence of other active materials. Forced degradation studies were also performed on citric acid to provide an indication of the stability indicating property and specificity of the proposed method. The stress conditions employed for degra-dation study includes light (carried out as per ICH Q1B), Dry heating done at 105˚C for about 16 hrs, acid hy-drolysis (with 2 N HCl solution for about 16 hrs at 60˚C), base hydrolysis (with 2 N NaOH solution for about 16 hrs at 60˚C), water hydrolysis and oxidation (Treated with 3% Hydrogen peroxide (H2O2) for about 16 hrs at 60˚C). Sunlight, thermal and UV degradation was also performed and purity of stressed samples was checked by using Photo diode array detector (PDA). The purity factor is within the threshold limit obtained in all stressed samples demonstrates the analyte peak homogeneity.
K. K. Hotha et al.
1252
Figure 1. Schematic representation of titration analysis.
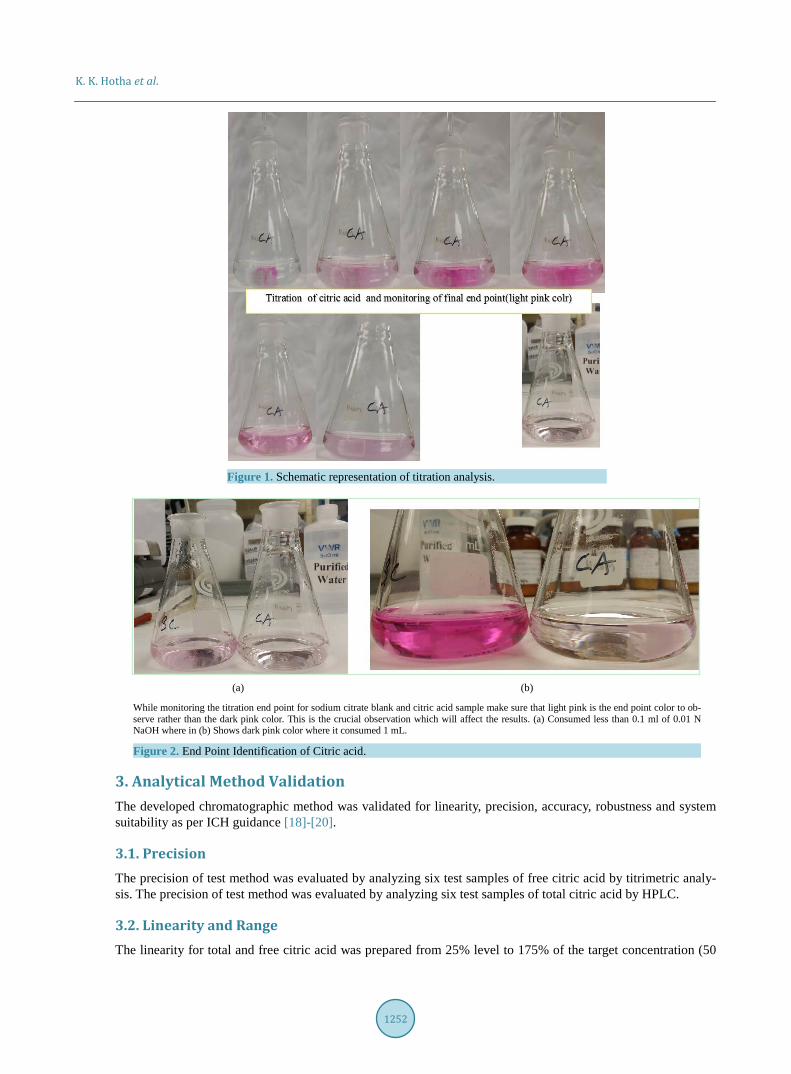
(a) (b)
While monitoring the titration end point for sodium citrate blank and citric acid sample make sure that light pink is the end point color to ob-serve rather than the dark pink color. This is the crucial observation which will affect the results. (a) Consumed less than 0.1 ml of 0.01 N NaOH where in (b) Shows dark pink color where it consumed 1 mL.
Figure 2. End Point Identification of Citric acid.
3. Analytical Method Validation The developed chromatographic method was validated for linearity, precision, accuracy, robustness and system suitability as per ICH guidance [18]-[20].
3.1. Precision The precision of test method was evaluated by analyzing six test samples of free citric acid by titrimetric analy-sis. The precision of test method was evaluated by analyzing six test samples of total citric acid by HPLC.
3.2. Linearity and Range The linearity for total and free citric acid was prepared from 25% level to 175% of the target concentration (50
K. K. Hotha et al.
1253
ppm for free citric acid and 600 ppm for total citric acid).
3.3. Accuracy Accuracy of total and free citric acid was prepared at 50% to 150% of target concentration level. Test solutions spiked at 50% to 150% of target concentration were prepared in triplicate and injected into HPLC system for to-tal citric acid content and by titration analysis for free citric acid content.
3.4. Robustness To determine the robustness of the developed method, experimental conditions were deliberately changed and the resolution (Rs) between citric acid and placebo was evaluated. The flow rate of the mobile phase was 1.0 mL∙min−1. To study the effect of flow rate on the developed method, 0.2 units of flow was changed (i.e. 0.8 and 1.2 mL∙min−1). The effect of column temperature on the developed method was studied at 25˚C and 35˚C instead of 30˚C. In the all above varied conditions, the components of the mobile phase were held constant.
3.5. Solution Stability The solution stability of citric acid was carried out by leaving both freshly prepared sample and standard for 72 hrs.
4. Results and Discussion 4.1. Method Development and Optimization There were many methods available for the determination of citric acid and sodium citrate individually [5]-[16]. The development of the free citric acid method by titration will be difficult due to the active drug and the re-maining excipients that were present in the finished product. Development was initiated by mixing sodium ci-trate dihydrate and citric acid into one container and thus by measuring the free citric acid content by Titration method. Sodium citrate dihydrate blank does not show any significant interference of citric acid by titration me-thod which confirms that the developed method measures only citric acid anhydrous. The Strength of the NaOH was optimized by based on the concentration of citric acid present in the finished product. 0.01 N NaOH gave accurate end point discrimination between blank (finished product sample) and the citric acid. The indicator used in the titration was phenolphthalein, which is colorless in acidic solution and pink in basic solution. The excipients present in the ophthalmic solution do not shown any interference in the placebo solution confirms the specificity of the titration method.
Development of the HPLC method for the total citric acid was performed by basic approach where the crucial parameter identified is the stationary phase to retain and separate the citric acid from the placebo. Lichrospher 60 RP-select B, 4.0 × 250 mm, 5 μm is the best column found during the optimization. Acidic mobile phase, high aqueous ratio kept to retain citric acid and high organic at the end to elute all the active component and ex-cipients present in the finished product sample. This method was tested for specificity and found suitable for the analysis of different pharmaceutical dosage forms.
After subtracting the free citric acid from total citric acid content, citric acid present in the sodium citrate content was determined. Sodium citrate content was determined by applying sodium correction factor to the subtracted value of the citric acid.
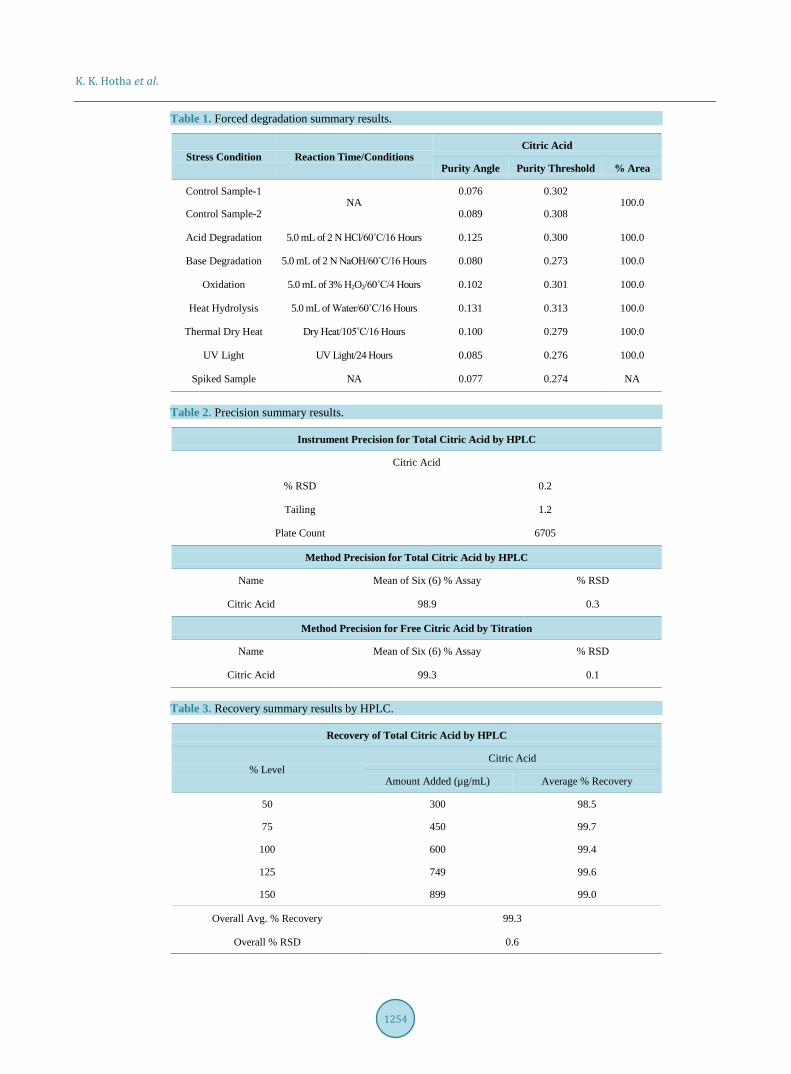
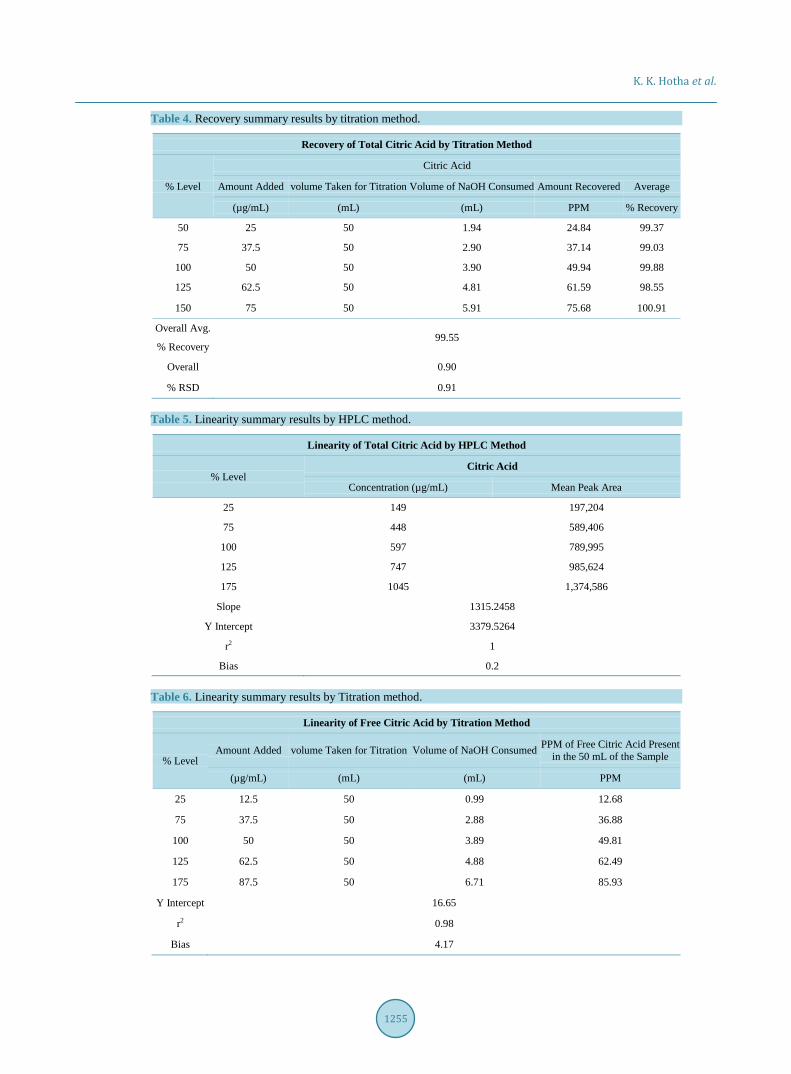
4.2. Validation Results All the forced degradation results were specific with respect to citric acid and all the purity determinations were within the acceptable limits and the results were presented in Table 1. The precision results were found satisfac-tory for free and total citric acid and the results were presented in Table 2. The percentage recovery of free and total citric acid was determined and all the recovery results are within the acceptable limits and the results were presented in Table 3 and Table 4. The linearity results were within the acceptable limits for free and total citric acid and the results were represented in Table 5 and Table 6. Close observation of analysis results for deliberately changed chromatographic conditions (flow rate, and column temperature) revealed that the robustness of the method is satisfactory. The solution stability of the standard solution and sample solution was found stable 72
K. K. Hotha et al.
1254
Table 1. Forced degradation summary results.
Stress Condition Reaction Time/Conditions Citric Acid
Purity Angle Purity Threshold % Area
Control Sample-1 NA
0.076 0.302 100.0
Control Sample-2 0.089 0.308
Acid Degradation 5.0 mL of 2 N HCl/60˚C/16 Hours 0.125 0.300 100.0
Base Degradation 5.0 mL of 2 N NaOH/60˚C/16 Hours 0.080 0.273 100.0
Oxidation 5.0 mL of 3% H2O2/60˚C/4 Hours 0.102 0.301 100.0
Heat Hydrolysis 5.0 mL of Water/60˚C/16 Hours 0.131 0.313 100.0
Thermal Dry Heat Dry Heat/105˚C/16 Hours 0.100 0.279 100.0
UV Light UV Light/24 Hours 0.085 0.276 100.0
Spiked Sample NA 0.077 0.274 NA
Table 2. Precision summary results.
Instrument Precision for Total Citric Acid by HPLC
Citric Acid
% RSD 0.2
Tailing 1.2
Plate Count 6705
Method Precision for Total Citric Acid by HPLC
Name Mean of Six (6) % Assay % RSD
Citric Acid 98.9 0.3
Method Precision for Free Citric Acid by Titration
Name Mean of Six (6) % Assay % RSD
Citric Acid 99.3 0.1
Table 3. Recovery summary results by HPLC.
Recovery of Total Citric Acid by HPLC
% Level Citric Acid
Amount Added (µg/mL) Average % Recovery
50 300 98.5
75 450 99.7
100 600 99.4
125 749 99.6
150 899 99.0
Overall Avg. % Recovery 99.3
Overall % RSD 0.6
K. K. Hotha et al.
1255
Table 4. Recovery summary results by titration method.
Recovery of Total Citric Acid by Titration Method
% Level
Citric Acid
Amount Added volume Taken for Titration Volume of NaOH Consumed Amount Recovered Average
(µg/mL) (mL) (mL) PPM % Recovery
50 25 50 1.94 24.84 99.37
75 37.5 50 2.90 37.14 99.03
100 50 50 3.90 49.94 99.88
125 62.5 50 4.81 61.59 98.55
150 75 50 5.91 75.68 100.91
Overall Avg. 99.55
% Recovery
Overall 0.90
% RSD 0.91
Table 5. Linearity summary results by HPLC method.
Linearity of Total Citric Acid by HPLC Method
% Level Citric Acid
Concentration (µg/mL) Mean Peak Area
25 149 197,204
75 448 589,406
100 597 789,995
125 747 985,624
175 1045 1,374,586
Slope 1315.2458
Y Intercept 3379.5264
r2 1
Bias 0.2
Table 6. Linearity summary results by Titration method.
Linearity of Free Citric Acid by Titration Method
% Level Amount Added volume Taken for Titration Volume of NaOH Consumed PPM of Free Citric Acid Present
in the 50 mL of the Sample
(µg/mL) (mL) (mL) PPM
25 12.5 50 0.99 12.68
75 37.5 50 2.88 36.88
100 50 50 3.89 49.81
125 62.5 50 4.88 62.49
175 87.5 50 6.71 85.93
Y Intercept 16.65
r2 0.98
Bias 4.17
K. K. Hotha et al.
1256
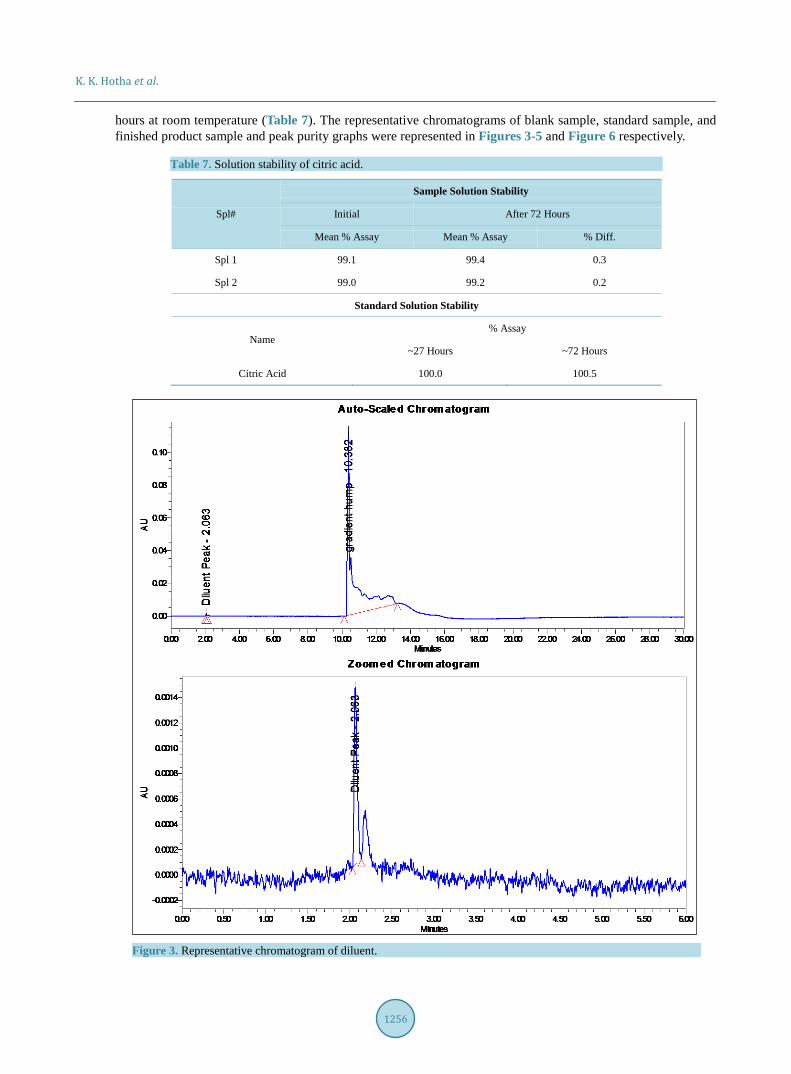
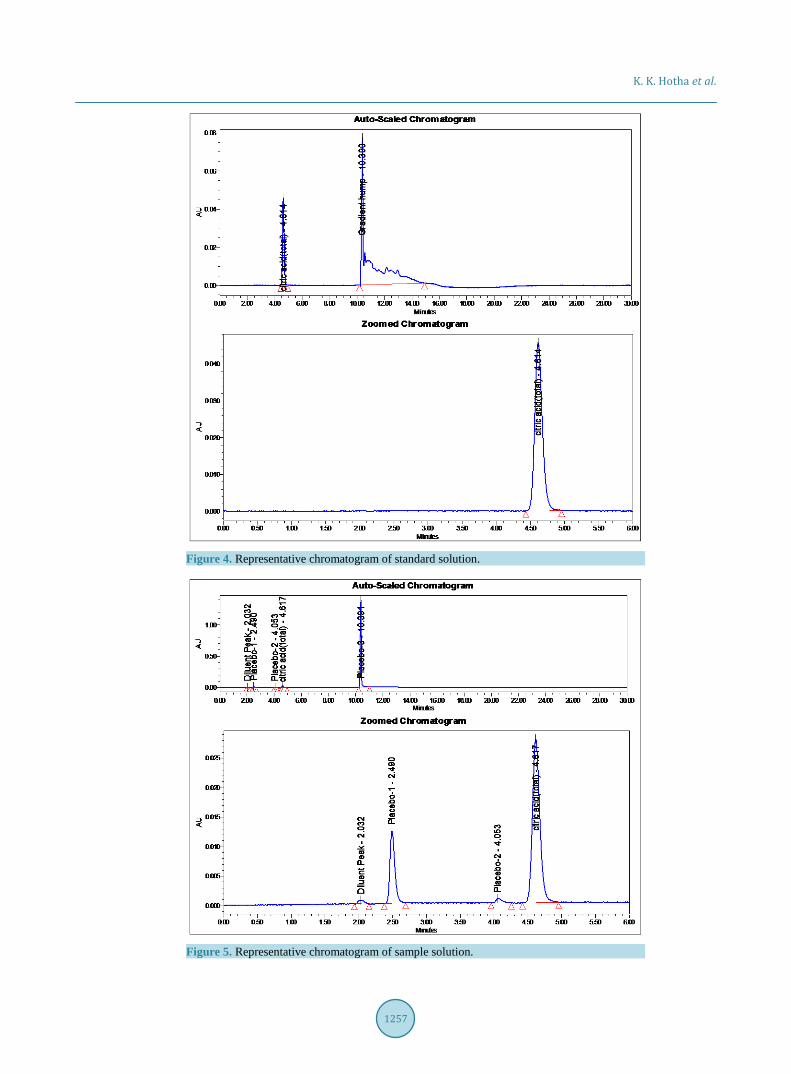
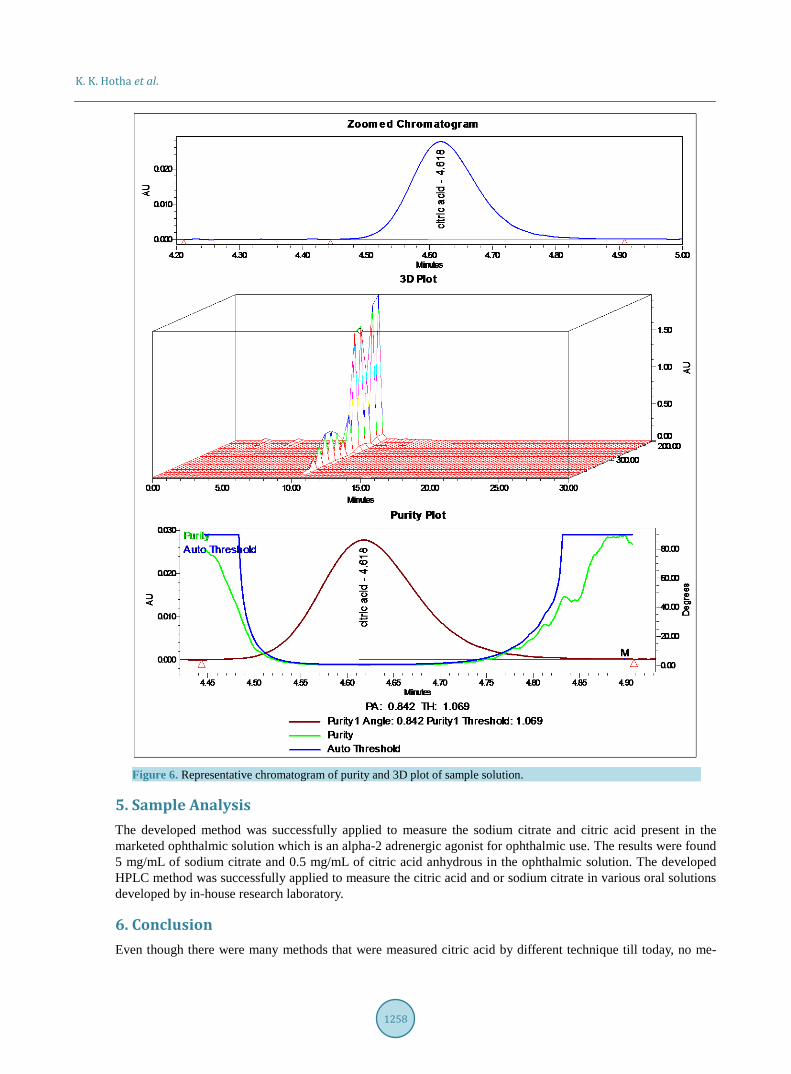
hours at room temperature (Table 7). The representative chromatograms of blank sample, standard sample, and finished product sample and peak purity graphs were represented in Figures 3-5 and Figure 6 respectively.
Table 7. Solution stability of citric acid.
Spl#
Sample Solution Stability
Initial After 72 Hours
Mean % Assay Mean % Assay % Diff.
Spl 1 99.1 99.4 0.3
Spl 2 99.0 99.2 0.2
Standard Solution Stability
Name % Assay
~27 Hours ~72 Hours
Citric Acid 100.0 100.5
Figure 3. Representative chromatogram of diluent.
K. K. Hotha et al.
1257
Figure 4. Representative chromatogram of standard solution.
Figure 5. Representative chromatogram of sample solution.
K. K. Hotha et al.
1258
Figure 6. Representative chromatogram of purity and 3D plot of sample solution.
5. Sample Analysis The developed method was successfully applied to measure the sodium citrate and citric acid present in the marketed ophthalmic solution which is an alpha-2 adrenergic agonist for ophthalmic use. The results were found 5 mg/mL of sodium citrate and 0.5 mg/mL of citric acid anhydrous in the ophthalmic solution. The developed HPLC method was successfully applied to measure the citric acid and or sodium citrate in various oral solutions developed by in-house research laboratory.
6. Conclusion Even though there were many methods that were measured citric acid by different technique till today, no me-
K. K. Hotha et al.
1259
thod was reported in the literature for the determination of sodium citrate and citric acid by titration followed by HPLC Method. Sodium citrate and citric acid anhydrous were successfully quantified in an alpha-2 adrenergic agonist used for ophthalmic use. Free citric acid was determined by titration method and total citric acid by HPLC method. After subtracting the free citric acid from total citric acid content, citric acid present in the so-dium citrate content was determined. Sodium citrate content was determined by applying sodium correction factor to the subtracted value of the citric acid. The developed method was successfully measured the citric acid content in the oral/ophthalmic solutions. The developed HPLC method was precise, accurate and stability indi-cating. The developed titration method was specific for the determination of free citric acid content in the mix-ture of sodium citrate dihydrate and citric acid.
Acknowledgements The authors wish to thank the management of Novel Laboratories INC for providing the infrastructure for the supporting of this research work. Cooperation from colleagues Quality Control and Analytical Research & De-velopment of Novel Laboratories is appreciated.
References [1] INCHEM Chemical Safety Information for Intergovernmental Organization.
http://www.inchem.org/documents/cicads/cicads/cicad26.htm#SubSectionNumber:5.1.1 [2] US FDA (2007) Food Contamination and Adulteration: Data on Benzene in Soft Drinks and Other Beverages Data
through May 16, 2007. http://www.fda.gov/Food/FoodSafety/FoodContaminantsAdulteration/ChemicalContaminants/Benzene/ucm055815.htm
[3] FAO/WHO (2002) Food and Agriculture Organization of the United Nations and World Health Organization. Human Vitamin and Mineral Requirements, Rome.
[4] Bhattacharyya, L. and Rohrer, J.S. (2012) Applications of Ion Chromatography for Pharmaceutical and Biological Products, First Edition. John Wiley & Sons, Inc., Hoboken. http://dx.doi.org/10.1002/9781118147009
[5] Destandau, E., Vial, J., Jardy, A., Hennion, M. C., Bonnet, D. and Lancelin, P. (2005) Development and Validation of a Reversed-Phase Liquid Chromatography Method for the Quantitative Determination of Carboxylic Acids in Industri-al Reaction Mixtures. Journal of Chromatography A, 1088, 49-56. http://dx.doi.org/10.1016/j.chroma.2005.01.002
[6] The United States Pharmacopeia (2006) Assay for Citric Acid/Citrate and Phosphate. In The United States Pharma-copeia, USP37. United Sates Pharmacopeia Convention, Rockville, 2565.
[7] Chalgeri, A. and Tan, H.I.S. (1996) Indirect Photometric Detection for the Determination of Citrate in Pharmaceutical Matrices by Ion Chromatography. Journal of Pharmaceutical and Biomedical Analysis, 14, 835-844. http://dx.doi.org/10.1016/0731-7085(96)01731-1
[8] Karmarkar, S., Koberda, M., Monami, J., Kotecki, D. and Garber, R. (2004) Validated Ion-Exclusion Chromatographic Method for Citrate and Acetate in Medical Fluids. Journal of Chromatography A, 1039, 147-153. http://dx.doi.org/10.1016/j.chroma.2003.11.057
[9] Debora, B.M., Rohrer, J.S. and Bhattacharyya, L. (2004) Development and Validation of an Assay for Citric Acid/Ci- trate and Phosphate in Pharmaceutical Dosage Forms Using Ionchromatography with Suppressed Conductivity Detec-tion. Journal of Pharmaceutical and Biomedical Analysis, 36, 517-524. http://dx.doi.org/10.1016/j.jpba.2004.07.003
[10] Tan, H.S., McKibben, D.M. and Glasser, A.C. (1981) Improved Assay for Mixtures of Citrate and Citric Acid in Sys-temic Alkalizer Solutions. Journal of Pharmaceutical Sciences, 70, 693-695. http://dx.doi.org/10.1002/jps.2600700634
[11] Jenke, D., Sadain, S., Nunez, K. and Byrne, F. (2007) Performance Characteristics of an Ion Chromatographic Method for the Quantitation of Citrate and Phosphate in Pharmaceutical Solutions. Journal of Chromatographic Science, 45, 50-56. http://dx.doi.org/10.1093/chromsci/45.1.50
[12] Chen, Q., Mou, S., Liu, K., Yang, Z., and Ni, Z. (1997) Separation and Determination of Four Artificial Sweeteners and Citric Acid by High Performance Anion Exchange Chromatography. Journal of Chromatography A, 771, 135-143. http://dx.doi.org/10.1016/S0021-9673(97)00067-8
[13] Jenke, D.R. (1988) Quantitation of Oxalate and Citrate by Ion Chromatography with a Buffered, Strong Acid Eluent. Journal of Chromatography A, 437, 231-237. http://dx.doi.org/10.1016/S0021-9673(00)90386-8
[14] Dionex Corporation (2004) Application Note 164 Assay for Citrate and Phosphate in Pharmaceutical Formulations Using Ion Chromatography. Dionex Corporation, Sunnyvale.
K. K. Hotha et al.
1260
[15] Fontannaz, P., Kilinc, T. and Heudi, O. (2006) HPLC-UV Determination of Total Vitamin C in a Wide Range of Forti-fied Food Products. Food Chemistry, 94, 626-631. http://dx.doi.org/10.1016/j.foodchem.2005.02.012
[16] Budziszewski, A. (1969) The Use of Ion Exchange for the Quantitative Assay of Mixtures of Citrate and Citric Acid. Archivum Immunologiae et Therapiae Experimentalis (Warsz), 17, 149-152.
[17] Hotha, K.K., Reddy, S.P.K., Raju, V.K. and Ravindranath, L.K. (2013) Forced Degradation Studies: Practical Ap- proach-Overview of Regulatory Guidance and Literature for the Drug Products and Drug Substances. International Research Journal of Pharmacy, 4, 78-85. http://dx.doi.org/10.7897/2230-8407.04517
[18] ICH Q2 (R1) (2005) Validation of Analytical Procedures: Text and Methodology. [19] ICH Q1A (R2) (2000) Stability Testing of New Drug Substances and Products. [20] ICH Guideline Q3A (R) (2002) Impurities in New Drug Substances.