Embed Size (px)
Citation preview
Development of
APEC Low-Carbon Town Indicator
( LCMT-TF7-041)
19 May 2014
Shinji YAMAMURA
NIKKEN SEKKEI Research Institute
Presented by Takahiro OGAWA
NIKKEN SEKKEI Research Institute
The 7th Meeting of Low Carbon Model Town Task Force (LCMT TF)
The 47th APEC Energy Working Group and Associated Meetings
Kunming China
Purpose
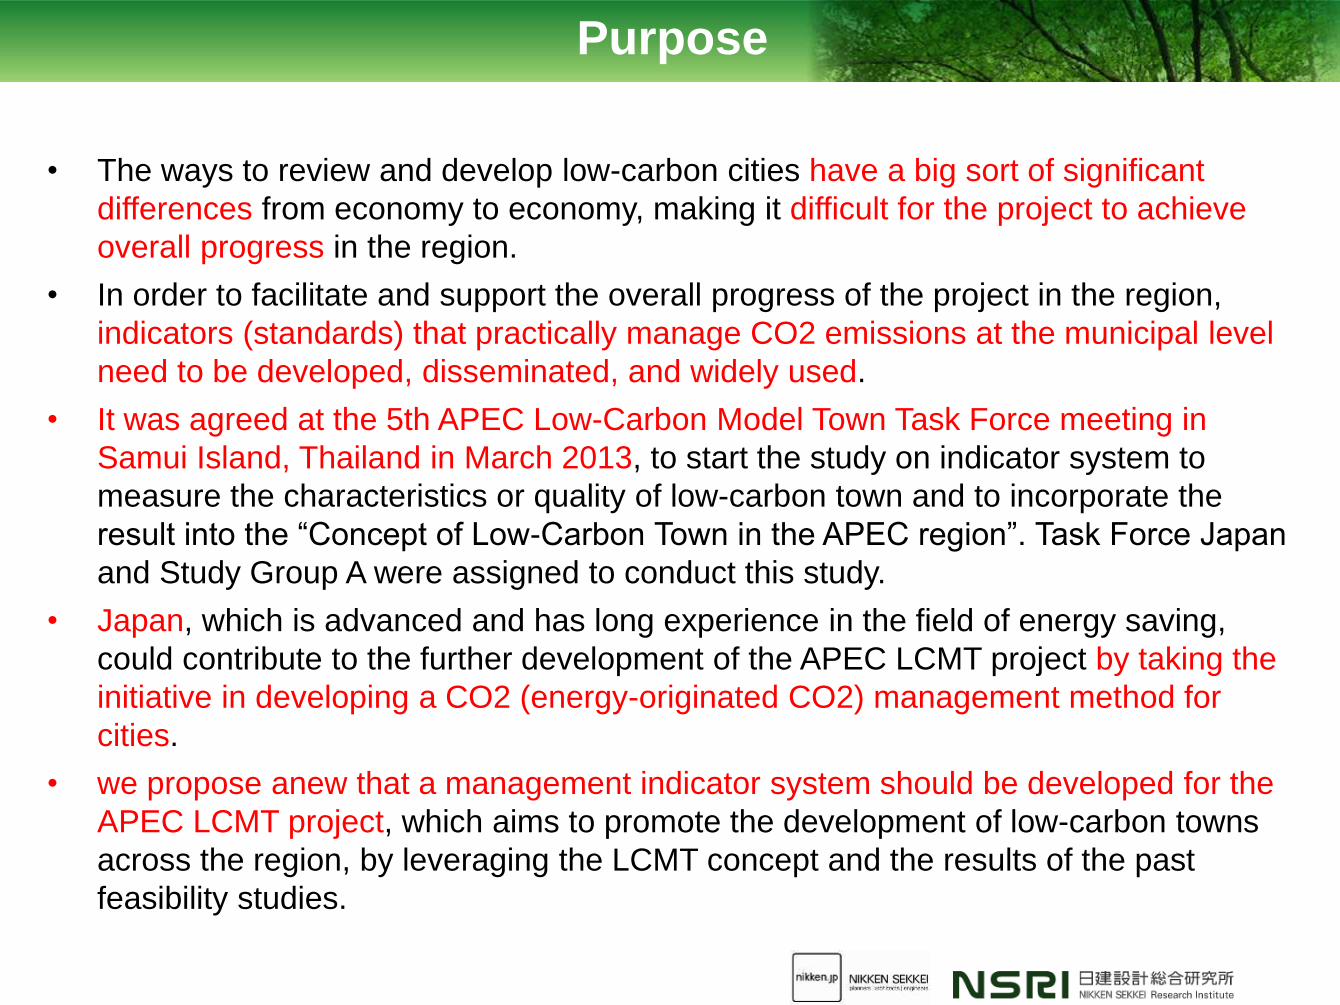
bull The ways to review and develop low-carbon cities have a big sort of significant
differences from economy to economy making it difficult for the project to achieve
overall progress in the region
bull In order to facilitate and support the overall progress of the project in the region
indicators (standards) that practically manage CO2 emissions at the municipal level
need to be developed disseminated and widely used
bull It was agreed at the 5th APEC Low-Carbon Model Town Task Force meeting in
Samui Island Thailand in March 2013 to start the study on indicator system to
measure the characteristics or quality of low-carbon town and to incorporate the
result into the ldquoConcept of Low-Carbon Town in the APEC regionrdquo Task Force Japan
and Study Group A were assigned to conduct this study
bull Japan which is advanced and has long experience in the field of energy saving
could contribute to the further development of the APEC LCMT project by taking the
initiative in developing a CO2 (energy-originated CO2) management method for
cities
bull we propose anew that a management indicator system should be developed for the
APEC LCMT project which aims to promote the development of low-carbon towns
across the region by leveraging the LCMT concept and the results of the past
feasibility studies
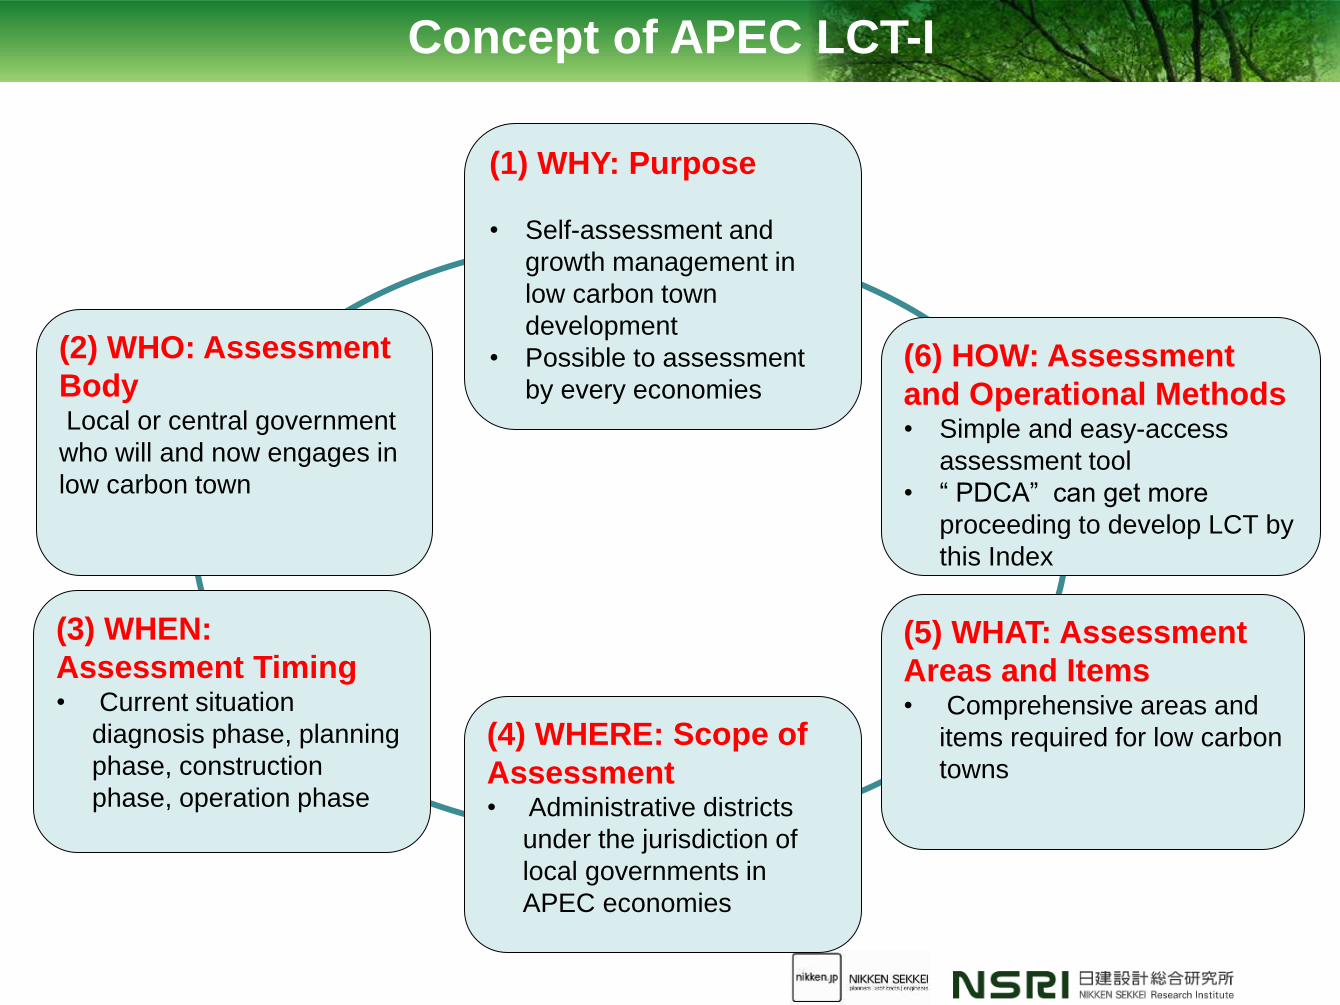
Concept of APEC LCT-I
(1) WHY Purpose
bull Self-assessment and
growth management in
low carbon town
development
bull Possible to assessment
by every economies
(6) HOW Assessment
and Operational Methods bull Simple and easy-access
assessment tool
bull ldquo PDCArdquo can get more
proceeding to develop LCT by
this Index
(5) WHAT Assessment
Areas and Items bull Comprehensive areas and
items required for low carbon
towns
(4) WHERE Scope of
Assessment bull Administrative districts
under the jurisdiction of
local governments in
APEC economies
(3) WHEN
Assessment Timing bull Current situation
diagnosis phase planning
phase construction
phase operation phase
(2) WHO Assessment
Body Local or central government
who will and now engages in
low carbon town
Examination of existing low carbon Energy efficiency and Smart city
Indicators
Collect major evaluation systems for urban areas projects cities
Perform analysis based on the principles of the study and LCT-I structure
①LEED-Neighborhood Development (LEED-ND)
②CASBEE-urban ③CASBEE-city ④Green Growth Indicators (Green Cities
programme) ⑤Global City Indicators ⑥Green City Index
⑦Sino-Singapore Tianjin Eco-city ⑧Smart city index (智慧城市指標) ⑨Reference Framework for Sustainable Cities ⑩European Initiative on Smart Cities ⑪J-CODE ⑫Tianjin Yujiapu CBD ⑬Other domestic tools
Existing Evaluation systems for Cities
Scope of evaluation
Field of evaluation
Purpose of evaluation
Evaluation format
Date of implementation
Origin (country) of
implementation
Number of indexes
Evaluation methods
(quantitativequalitative)
ApplicantsEvaluator
Required data
Practical applications
Example of practical applications
Complexities
Regional adaptability
Consistency with international
trends (eg ISO)
Classification attributes
Study Flow
(1) Universal Type (2)Domestic Type
5
Applicability of Existing Indicators
Ex) Where What is the scope of the assessment
An assessment should be made on a municipal or administrative district basis
Categorization of existing indicators by the size of the
Building City Block District
Assessment indicators that can cover urban development projects at a district level and those at a municipal level
(1)LEED-ND
(2)CASBEE Urban
Development (3) CASBEE Cities (4) UEI
(5) GCI (6) GrCI
(7) Tianjin
(8) Smart City
(9)RFSC (NA) (10)EISC (NA)
(11) J-CODE
(12) Yujiapu
small large
Metropolitan
Area
LEED-BD+C
CASBEE Buildings
LCT-I
Ease of Data Collection
(Number of indexes)
Easy (less) Difficult(more)
List Type
Rating System
(large)
Star Type
Rating System
(small)
Ease
of
Un
ders
tan
din
g
(vo
lum
e o
f in
form
ati
on
fro
m e
valu
ati
on
resu
lts)
Simple and easy-to-understand
indicators
①LEED-ND (110 4)
②CASBEE-Town(82 5) ③CASBEE-City(38 5)
④Green Growth Indicators (20 20)
⑤Global City Indicators (53 53)
⑥Green City Index (30 1)
⑦Tianjin Eco-city (26 26)
⑧Smart City Index(5757)
⑨Reference Framework for Sustainable Cities(33 33)
⑪J-CODE(53 3)
⑫Yujiapu(35 35)
⑩European
Initiative on Smart
Cities (NA)
Applicability of Existing Indicators
Ex) How How should the assessment be approached The assessment process should be simple and easy to understand and should
reflect the circumstances of each economy project characteristics and
international trends
Based on the above analyses we found the following
-There exist no indicators that fully match the LCT-I we aim at or any
indicators that can serve as reference across all aspects of 5W1H
(see Summary Table on the next page)
-Therefore a new set of low carbon city assessment indicators
should be developed
-However since some of the aforementioned existing indicators have
characteristics that can serve partially as reference in each aspect of
Who Why When Where What and How the effective way to
develop new low carbon city assessment indicators is to skillfully
combine these characteristics
-Use the indicators below as reference and tap into and leverage
their essence when developing LCT-I
-CASBEE Cities (scope of assessment CO2 calculation method)
-J-CODE (assessment ranks assessment criteria)
-Tianjin Yujiapu CBD (assessment criteria core + additional)
-Global City Indicators (World Bank) (use of existing statistical data) 7
Applicability of Existing Indicators
LCT-I Development Principles
(i) Indicators are simple and easy to
understand
(ii) Indicators reflect the conditions of each
economy and project characteristics
(iii) Indicators are based on existing APEC
LCMT FS outcomes existing assessment
indicators and international trends
Image of Low Carbon Town and LC measures
LCT-I Development Principles
Low Carbon Town in the APEC by APEC LCMT CONCEPT
Type of Town Low Carbon Town Project Economy Population
(I) Urban - 1
(Central Business District CBD)
Yujiapu CBDTianjin1 China 500000
Sino-Singapore Tianjin Eco City China 350000
Quezon City Green CBD Philippine
(II) Urban - 2 (Commercial Oriented Town)
Putrajaya Green City Malaysia 68000
(300000 planned)
Chiang Mai Thailand 160000
Da Nang 3 Viet Nam 1million
Cebu City 3 Philippine 820000
Surabaya 3 Indonesia 28 million
Yokohama Smart City Project Japan 37 million
(III) Urban ndash 3 (Residential Oriented Town)
Plunggol Eco Town Singapore
San Borja 4 Peru 110000
(IV) Rural
Muang Klang Low Carbon City Thailand 17000
Jeju Island Smart Green City Korea 6000 households
Low Carbon Island (Penghu Island and Others)
Chinese Taipei
88000
Samui Island 2 Thailand 53990
1 LCMT Phase I feasibility study 2 LCMT Phase II feasibility study source ) APEC LCMT CONCEPT 3 Pilot City of WB Eco2 Cities Project 4 LCMT Phase Ⅳ feasibility study Total population
Space Scale Setting
LCT-I Development Principles
Building Block amp District City
Higher insulation
High-efficiency building services system
Use of natural energy
(Natural ventilation day lighting)
Reuse of sewage water
Greenery on site
Allocating district heating and cooling systems and linking them
Untapped energy(sea amp river waterwaste heat from incinerator)dispersed power system
Renewable energy (PV Wind Power)
Reuse of water amp wastes
Wind along the canopy
Continuous greenery on site
Multiple use trench
Information network
Block plan (with appropriate open space)
Rich greenery network to mitigate heat-island impact
Appropriate transportation system
Water supply amp sewage Gas supply
Electric power supply
Region
- Power plant
- Gas plant
Directly related to CO2 reduction
Indirectly related to CO2 reduction
Since low-carbon measures vary with the scale of a target project the scope of assessment and target technology are closely connected
The scope of assessment shall include buildings transportation and districtblock infrastructure within an LCMT boundary (project boundary administrative boundary)
source)APEC LCMT Phase1 report
Areas and measures covered by APEC LCT-I
LCT-I Development Principles
Not only the areas that have a direct impact on low-carbonization but also those that indirectly impact it (areas that contribute to the enhancement of appeal for and sustainability of LCT) should be targeted
While the APEC LCMT CONCEPT states measures to achieve low-carbonization as one of areas the APEC LCT should assess the results (output) of using such measures
The assessment areas shall include nine basic categories (Qualitative Assessment 8 areas Quantitative Assessment CO2) and each economy shall be allowed to add extra categories on an as-needed basis
Assessment Areas
LCT-I Development Principles
Category Area Connection with the Concept of the Low-Carbon Town
in the APEC Region
Qualitative
Assessment
(1) City Structure 1 Town structure (Low-Carbon Town Structure)
(2) Building 2 Building ( Low-Carbon Building)
(3) Energy Management
System (EMS)
Business EMS home EMS Factory EMS Area EMS
(4) Transportation 4 Transportation (Low-Carbon Traffic)
(5) Energy 5 Area Energy Network
6 Untapped Energy
7 renewable Energy
8 Smart Grid System
(6) Environment Nature conservation air water quality soil noise
recycled water waste
(7) Lifestyle Education culture health environmental awareness
(8) Management Organization BCP
Quantitative
Assessment
(9)CO2 Reduction and absorption
Set goals using a three-star scale ( to ) A numerical value for each of shall be set by each economy When the numerical values cannot be set reference values shall be provided in the
reference so that they can be used as reference For assessment results strive to visualize the overall assessment rank area
assessments (radar chart) and individual assessments
Assessment Method
LCT-I Development Principles
The lowest level that
must be achieved Economy level
(national goal) LCT Target Level
While the numerical value for each level can be set by each
economy (they will vary with the economy) each secretariat
should provide some reference values
Assessment Method Approach to assessment Criteria
LCT-I Development Principles
Assessment Method Output Image
LCT-I Development Principles
Assessment Indicators by Area (draft) 13
LCT-I Development Principles
Set required items which correspond to a city category by assessment area Use qualitative indicators ([1]ndash[8]) as much as possible Assessment criteria for each indicator shall be developed by a localcentral government
For economies without criteria standard values or assessment methods should be given in the Reference section
17
Assessment Indicators by Area (draft) 23
LCT-I Development Principles
18
Assessment Indicators by Area (draft) 33
LCT-I Development Principles
An assessment should be conducted under the leadership of a localcentral government Based on the assessment results develop and implement an improvement plan (what
how and by when) (PDCA) When in operation monitor progress on a regular basis (annually or once in a few years) The LCT-I of each district should be managed by each economy and APEC Report progress at an APEC meeting on a regular basis and give an LCT-I certification to
or commend the economies that are actively conducting the LCT-I process It is desirable to establish an incentive program such as provision of preferential project
assistance (or low interest rates) to award-winning municipalities by the World Bank
How to implement an LCT-I assessment system
LCT-I Development Principles
Kashiwanoha Campus (Chiba Japan) an established
well-known smart city
Sensitivity Analysis (case study)
1
Development around Kashiwa-no-ha Campus Station
Chiba University
Kashiwa-no-ha Park Park City Kashiwa-no-ha Campus ldquo2nd Townrdquo119000(880 units)(under construction)
ldquoDistrict 148rdquo
Site area 23344m2
Total floor 53277m2
Office Commercial
Hotel Rental residence(under construction
by 2014)
University of Tokyo
Park City Kashiwa-no-ha Campus ldquo1st Townrdquo
From 2009144000(997 units)
Kashiwa-no-ha Campus Railway
Station
Aerial photo of site combined with computer-generated images of District 148 and Park City 2nd Town
Tsukuba EX
KashiwanohaShopping mall
from 2006144500
(180 tenants)
Kashiwanoha Project is the most
comprehensive and complex Smart
City project in Japan but this Index
evaluates its specification of low
carbon planning and grasp its
performances to reduceCO2
Advantages of using LCT-I
Conclusion
Following characteristics of LCT-I can be considered as the advantages to utilize LCT-I in the APEC region
-Simple and easy to understand LCT development bull Use existing statistics data to make it intuitively easy to understand
the comprehensive and quantitative status of low carbon town development
-Reflect the circumstances of each economy and project characteristics
bull Take into account the economic conditions of each economy and project characteristics so as not to hamper sustainable growth
bull Easy to grasp a long-term trend in achievement level at each stage of conception planning construction and maintenance
-Reflect existing APEC LCMT Feasibility Study results existing assessment indicators and international trends
bull Reflect international trends such as smart infrastructure assessment standards (TC268) and OECD activities and combined use of such items is expected to be supported in the future
Issues for the next step
Conclusion
-Validation of assessment indicators in each assessment
area
-Setting of quantitative values for assessment standards
in each assessment area (with referring existing indexes)
-Provision of reference indicators and reference
calculation equations to economies without their own
assessment standards
-Sensitivity analysis of selected citiestowns
-Method of operation and method for awarding
incentives
-Method of combining it with smart infrastructure
standards (TC268)
Thank you for your attention
24
Annex
Study Flow
(2)Examination of management indicator system structure ① Examination of scope of management indicator system ② Examination of evaluation field and indicators ③ Examination of quantitative (or qualitative) evaluation method
(3)Sensitivity analysis of management indicators ① Selection of target cities for evaluation studies ② Execution of evaluation studies and sensitive analysis
(4)External activities for the creation of management indicators
(5)Preparation of report
(1)Examination of existing low carbon energy efficiency and smart city indicators
Background
bull Current conditions of global warming
bull Global increase in urban population and city development
projects
bull Energy issues incidental to urban population increase
bull Relationship between income level and urbanization
0
10
20
30
40
50
60
70
80
90
100
1980 1985 1990 1995 2000 2005 2010 2015 2020 2025 2030 2035 2040 2045 2050
都市化率
()
年
China
China Hong Kong SAR
Japan
Republic of Korea
Brunei Darussalam
Indonesia
Malaysia
Philippines
Singapore
Thailand
Viet Nam
Russian Federation
Mexico
Chile
Peru
Canada
United States of America
Australia
New Zealand
Papua New Guinea
Urbanization = urban population total population Urban population population residing in ldquocitiesrdquo as defined by national census Source United Nations ldquoWorld Urbanization Prospects the 2011 Revisionrdquo
Urbanization trends in APEC Economies
1 LEED-Neighborhood Development
(LEED-ND)
2 CASBEE for Urban Development
3 CASBEE for Cities
4 Urban Environmental Indicators (UEI)
(OECDGreen Cities programme)
5 Global City Indicators (GCI) (World
Bank)
6 Green City Index (GrCI)
7 Tianjin Eco City (Tianjin)
8 Smart City Indicators
9 Reference Framework for Sustainable
Cities (RFSC)
10European Initiative on Smart Cities
(EISC)
11J-CODE
12Tianjin Yujiapu CBD (Yujiapu))
28
Review of Existing Indicators
ltCity assessment systems collectedgt
ltCity assessment systems collectedgt - Scope of Assessment
- Target Area
- Assessment Purpose
- Assessment Approach
- Year of Creation
- Creator (country)
- Number of Assessment
Indicators
- Assessment Method
(quantitativequalitative)
- Participating parties
(Applicant and
AssessmentCertification
Agency)
- Required Statistical Data
- Purpose of Use
- Case Examples
- Complexity
- Applicability to different
regions or cities
- Alignment with international
trends (ISO etc)
29
Applicability of Existing Indicators
Ex) When What phase should be assessed
key goal indicators to manage a situational change between the beginning and the end of a project
key performance indicators that monitor progress in the planning and implementation of countermeasures
during the intermediary stages of the project that is in the planning construction and operational phases
Planning Achievement
control
Design Construction
LEED-ND
CASBBE for Urban Development
③CASBEE
Cities
④UEI
⑤GCI
⑥GrCI
⑦Tianjin
⑧Smart City
⑨RFSC
⑩EISC (NA)
⑪J-CODE
⑫Yujiapu
earlier latter
Understanding of status quo
④UEI
③CASBEE
-Cities
⑤GCI
A new framework which combines key
goal indicators and key performance
indicators is required
LCT-I
⑥GrCI
Key goal
indicators
Key goal
indicators
Key Performance Indicators
Categorization of existing indicators by applicable phase
Assess each of the following phases thorough understanding of the
actual conditions planning design construction and operation
30
Applicability of Existing Indicators
Ex) How How should the assessment be approached
The assessment process should be simple and easy to understand and should
reflect the circumstances of each economy project characteristics and
international trends
Applicability to cities that have different characteristics
Easy Difficult
Local
Global
Glo
ba
l Exp
an
dab
ility
Indicators that are globally expandable
and applicable to other cities
(1)LEED-ND
(2) CASBEE Urban
Development
(3)CASBEE Cities
(4)UEI
(5)GCI (6)GrCI
(7) Tianjin
(8) Smart City
(9)RFSC
(10)EISC (NA)
(11)J-CODE
(12) Yujiapu
31
Applicability of Existing Indicators
Key
Requirements
Desired LCT-I Form
1 2 3 4 5 6 7 8 9 10 11 12
LE
ED
-ND
CA
SB
EE
Urb
an
Develo
pm
ent
CA
SB
EE
Citie
s
Urb
an E
nviro
nm
enta
l
Indic
ato
rs
Glo
bal C
ity In
dic
ato
rs
Gre
en C
ity In
dex
Tia
njin
Eco C
ity
Sm
art C
ity In
dic
ato
r
Refe
rence F
ram
ew
ork
for S
usta
inable
Citie
s
Euro
pean In
itiativ
e o
n
Sm
art C
ities
J-C
OD
E
Tia
njin
Yujia
pu C
BD
1 WHY
Assessment
Purpose
Self-assessment and
growth management
by cities
C
E
xte
rna
l C
ertific
atio
n
C
Exte
rna
l C
ertific
atio
n
A
C
E
xte
rna
l A
ssessm
en
t
C
E
xte
rna
l A
ssessm
en
t
C
E
xte
rna
l A
ssessm
en
t
C
Top
-do
wn
m
an
ag
em
en
t
C
To
p-d
ow
n
ma
nag
em
en
t
B
G
uid
elin
es fo
r a
dm
inis
trato
rs
C
Te
ch
no
log
ica
l d
evelo
pm
ent
C
To
p-d
ow
n
ma
nag
em
en
t
A
2 WHO
Assessment
Body
Can be assessed by
municipal senior
management
C
B
usin
ess
Op
era
tor
C
Bu
sin
ess
Op
era
tor
A
C
Inte
rna
tion
al
Org
an
iza
tion
C
Inte
rna
tion
al
Org
an
iza
tion
C
Inte
rna
tion
al
Org
an
iza
tion
C
Ce
ntra
l G
ove
rnm
en
t
C
Ce
ntra
l G
ove
rnm
en
t
C
Inte
rna
tion
al
Org
an
iza
tion
C
Inte
rna
tion
al
Org
an
iza
tion
C
Ce
ntra
l G
ove
rnm
en
t
A
3 WHEN
Assessment
Timing
Capability of
diagnosing the actual
conditions
C C A A A A C C C C C C
Assessable in design
and planning phases A A C C C C A A A C A A
Assessable in
construction phase A A C C C C A A A C A A
Assessable in
operational phase C C A A A A C C C C C C
4 WHERE
Scope of
Assessment
Administrative
districts under the
jurisdiction of local
governments in the
APEC region
C
P
roje
ct A
rea
C
P
roje
ct A
rea
A
C
Me
tropolita
n A
rea
A
A
A
A
A
C
Industry
A
A
5 WHAT
Assessment
Area
KGIs should be
considered C C A A A B B B A C B B
Not only the areas that have a direct impact on low-carbonization but also those that indirectly impact it (areas that contribute to the enhancement of appeal for and sustainability of LCT) should be targeted
While the APEC LCMT CONCEPT states measures to achieve low-carbonization as one of areas the APEC LCT should assess the results (output) of using such measures
The assessment areas shall include nine basic categories (Qualitative Assessment 8 areas Quantitative Assessment CO2) and each economy shall be allowed to add extra categories on an as-needed basis
Assessment Areas
LCT-I Development Principles
[Reference] The Concept of the Low-Carbon town in the APEC Region
Demand
Side
Demand amp Supply
Supply
side
Low Carbon Town Structure Environment space development
Passive energy design amp equipmentReducingheat loads
1 Town Structure
2 Buildings
3Energy ManagementSystems (EMS)
4 Transportation
5 Area Energy Network
6 Untapped Energy
7 Renewable Energy
8 Smart Grid System
Transit Oriented Development
Low CarbonBuilding
Highly efficient equipment amp facilities
Area Energy Network
Home EMS Factory EMS
Untapped Energy
Low carbon Traffic Public transportationsystems
Low Carbon Vehiclesamp Facilities
Renewable Energy
District heating cooling
Using seariver water Using waste heat
Smart energy systemSmart Grid
Business EMS Area EMS
Trafficdemandmanagement
Additional category Environment eco life style organization and CO2 emission
+ α
Evaluation Structure of APEC LCT-I Partial List of Evaluation Categories
Category Evaluation Item Evaluation Index
Town Classification Evaluation Score
①
U-1
CBD
②
U-2
Commercial
③
U-3
Residential
④
Rural
②Architecture
Energy-saving Buildings Ratio of number of energy efficient
buildings in the area
Building Insulation PAL 1)
Energy Efficiency of Building Equipment ERB 2)
③EMS
Building and Area Energy Management
Existence of building EMS
implementation plan
Existence of home EMS implementation
plan
Existence of factory EMS implementation
plan
Existence of area EMS implementation
plan
④Transportation
Promotion of Public Transportation Public transportation mode share
Formation of Transport Hub Existence of more than 2 types of
transport hubs
Low-carbon Public Transportation
Existence of BRT or LRT implementation
plan
Existence of electric bus or natural gas
vehicle implementation plan
Low-carbon Vehicles Diffusion rate of EV and PHV
Transportation Demand Management Existence of car sharing or rental bike
system implementation plan
⑤Energy
District Heating and Cooling System
(DHC)
Ratio over total energy consumption
Renewable Energy Ratio over total energy consumption
Untapped Energy Ratio over total energy consumption
Smart Grid Existence of smart grid implementation
plan
1) PAL Perimeter Annual Load
2) ERB Energy Reduction Rate of Building Equipment
[Structure of Evaluation]
Assessments are performed on individual categories and overall
performance
Assessment results are expressed in 3-scale rating systems ie
(overall) and 1-3 point (category)
Evaluation criteria for each category can be set by individual economies
Score of individual category is calculated based on the aggregate
performance of sub-items overall score of the LCT is the average score
of individual categories
Evaluation Structure of APEC LCT-I
Overall Score
17
CO2 reduction
470 t-co2year
①urban structure
③EMS
④transportation ⑤energy
⑥environment
⑦eco life style
⑧organization
Standard level for economy
Ideal level for economy
Minimum level for economy
②architecture
Purpose
bull The ways to review and develop low-carbon cities have a big sort of significant
differences from economy to economy making it difficult for the project to achieve
overall progress in the region
bull In order to facilitate and support the overall progress of the project in the region
indicators (standards) that practically manage CO2 emissions at the municipal level
need to be developed disseminated and widely used
bull It was agreed at the 5th APEC Low-Carbon Model Town Task Force meeting in
Samui Island Thailand in March 2013 to start the study on indicator system to
measure the characteristics or quality of low-carbon town and to incorporate the
result into the ldquoConcept of Low-Carbon Town in the APEC regionrdquo Task Force Japan
and Study Group A were assigned to conduct this study
bull Japan which is advanced and has long experience in the field of energy saving
could contribute to the further development of the APEC LCMT project by taking the
initiative in developing a CO2 (energy-originated CO2) management method for
cities
bull we propose anew that a management indicator system should be developed for the
APEC LCMT project which aims to promote the development of low-carbon towns
across the region by leveraging the LCMT concept and the results of the past
feasibility studies
Concept of APEC LCT-I
(1) WHY Purpose
bull Self-assessment and
growth management in
low carbon town
development
bull Possible to assessment
by every economies
(6) HOW Assessment
and Operational Methods bull Simple and easy-access
assessment tool
bull ldquo PDCArdquo can get more
proceeding to develop LCT by
this Index
(5) WHAT Assessment
Areas and Items bull Comprehensive areas and
items required for low carbon
towns
(4) WHERE Scope of
Assessment bull Administrative districts
under the jurisdiction of
local governments in
APEC economies
(3) WHEN
Assessment Timing bull Current situation
diagnosis phase planning
phase construction
phase operation phase
(2) WHO Assessment
Body Local or central government
who will and now engages in
low carbon town
Examination of existing low carbon Energy efficiency and Smart city
Indicators
Collect major evaluation systems for urban areas projects cities
Perform analysis based on the principles of the study and LCT-I structure
①LEED-Neighborhood Development (LEED-ND)
②CASBEE-urban ③CASBEE-city ④Green Growth Indicators (Green Cities
programme) ⑤Global City Indicators ⑥Green City Index
⑦Sino-Singapore Tianjin Eco-city ⑧Smart city index (智慧城市指標) ⑨Reference Framework for Sustainable Cities ⑩European Initiative on Smart Cities ⑪J-CODE ⑫Tianjin Yujiapu CBD ⑬Other domestic tools
Existing Evaluation systems for Cities
Scope of evaluation
Field of evaluation
Purpose of evaluation
Evaluation format
Date of implementation
Origin (country) of
implementation
Number of indexes
Evaluation methods
(quantitativequalitative)
ApplicantsEvaluator
Required data
Practical applications
Example of practical applications
Complexities
Regional adaptability
Consistency with international
trends (eg ISO)
Classification attributes
Study Flow
(1) Universal Type (2)Domestic Type
5
Applicability of Existing Indicators
Ex) Where What is the scope of the assessment
An assessment should be made on a municipal or administrative district basis
Categorization of existing indicators by the size of the
Building City Block District
Assessment indicators that can cover urban development projects at a district level and those at a municipal level
(1)LEED-ND
(2)CASBEE Urban
Development (3) CASBEE Cities (4) UEI
(5) GCI (6) GrCI
(7) Tianjin
(8) Smart City
(9)RFSC (NA) (10)EISC (NA)
(11) J-CODE
(12) Yujiapu
small large
Metropolitan
Area
LEED-BD+C
CASBEE Buildings
LCT-I
Ease of Data Collection
(Number of indexes)
Easy (less) Difficult(more)
List Type
Rating System
(large)
Star Type
Rating System
(small)
Ease
of
Un
ders
tan
din
g
(vo
lum
e o
f in
form
ati
on
fro
m e
valu
ati
on
resu
lts)
Simple and easy-to-understand
indicators
①LEED-ND (110 4)
②CASBEE-Town(82 5) ③CASBEE-City(38 5)
④Green Growth Indicators (20 20)
⑤Global City Indicators (53 53)
⑥Green City Index (30 1)
⑦Tianjin Eco-city (26 26)
⑧Smart City Index(5757)
⑨Reference Framework for Sustainable Cities(33 33)
⑪J-CODE(53 3)
⑫Yujiapu(35 35)
⑩European
Initiative on Smart
Cities (NA)
Applicability of Existing Indicators
Ex) How How should the assessment be approached The assessment process should be simple and easy to understand and should
reflect the circumstances of each economy project characteristics and
international trends
Based on the above analyses we found the following
-There exist no indicators that fully match the LCT-I we aim at or any
indicators that can serve as reference across all aspects of 5W1H
(see Summary Table on the next page)
-Therefore a new set of low carbon city assessment indicators
should be developed
-However since some of the aforementioned existing indicators have
characteristics that can serve partially as reference in each aspect of
Who Why When Where What and How the effective way to
develop new low carbon city assessment indicators is to skillfully
combine these characteristics
-Use the indicators below as reference and tap into and leverage
their essence when developing LCT-I
-CASBEE Cities (scope of assessment CO2 calculation method)
-J-CODE (assessment ranks assessment criteria)
-Tianjin Yujiapu CBD (assessment criteria core + additional)
-Global City Indicators (World Bank) (use of existing statistical data) 7
Applicability of Existing Indicators
LCT-I Development Principles
(i) Indicators are simple and easy to
understand
(ii) Indicators reflect the conditions of each
economy and project characteristics
(iii) Indicators are based on existing APEC
LCMT FS outcomes existing assessment
indicators and international trends
Image of Low Carbon Town and LC measures
LCT-I Development Principles
Low Carbon Town in the APEC by APEC LCMT CONCEPT
Type of Town Low Carbon Town Project Economy Population
(I) Urban - 1
(Central Business District CBD)
Yujiapu CBDTianjin1 China 500000
Sino-Singapore Tianjin Eco City China 350000
Quezon City Green CBD Philippine
(II) Urban - 2 (Commercial Oriented Town)
Putrajaya Green City Malaysia 68000
(300000 planned)
Chiang Mai Thailand 160000
Da Nang 3 Viet Nam 1million
Cebu City 3 Philippine 820000
Surabaya 3 Indonesia 28 million
Yokohama Smart City Project Japan 37 million
(III) Urban ndash 3 (Residential Oriented Town)
Plunggol Eco Town Singapore
San Borja 4 Peru 110000
(IV) Rural
Muang Klang Low Carbon City Thailand 17000
Jeju Island Smart Green City Korea 6000 households
Low Carbon Island (Penghu Island and Others)
Chinese Taipei
88000
Samui Island 2 Thailand 53990
1 LCMT Phase I feasibility study 2 LCMT Phase II feasibility study source ) APEC LCMT CONCEPT 3 Pilot City of WB Eco2 Cities Project 4 LCMT Phase Ⅳ feasibility study Total population
Space Scale Setting
LCT-I Development Principles
Building Block amp District City
Higher insulation
High-efficiency building services system
Use of natural energy
(Natural ventilation day lighting)
Reuse of sewage water
Greenery on site
Allocating district heating and cooling systems and linking them
Untapped energy(sea amp river waterwaste heat from incinerator)dispersed power system
Renewable energy (PV Wind Power)
Reuse of water amp wastes
Wind along the canopy
Continuous greenery on site
Multiple use trench
Information network
Block plan (with appropriate open space)
Rich greenery network to mitigate heat-island impact
Appropriate transportation system
Water supply amp sewage Gas supply
Electric power supply
Region
- Power plant
- Gas plant
Directly related to CO2 reduction
Indirectly related to CO2 reduction
Since low-carbon measures vary with the scale of a target project the scope of assessment and target technology are closely connected
The scope of assessment shall include buildings transportation and districtblock infrastructure within an LCMT boundary (project boundary administrative boundary)
source)APEC LCMT Phase1 report
Areas and measures covered by APEC LCT-I
LCT-I Development Principles
Not only the areas that have a direct impact on low-carbonization but also those that indirectly impact it (areas that contribute to the enhancement of appeal for and sustainability of LCT) should be targeted
While the APEC LCMT CONCEPT states measures to achieve low-carbonization as one of areas the APEC LCT should assess the results (output) of using such measures
The assessment areas shall include nine basic categories (Qualitative Assessment 8 areas Quantitative Assessment CO2) and each economy shall be allowed to add extra categories on an as-needed basis
Assessment Areas
LCT-I Development Principles
Category Area Connection with the Concept of the Low-Carbon Town
in the APEC Region
Qualitative
Assessment
(1) City Structure 1 Town structure (Low-Carbon Town Structure)
(2) Building 2 Building ( Low-Carbon Building)
(3) Energy Management
System (EMS)
Business EMS home EMS Factory EMS Area EMS
(4) Transportation 4 Transportation (Low-Carbon Traffic)
(5) Energy 5 Area Energy Network
6 Untapped Energy
7 renewable Energy
8 Smart Grid System
(6) Environment Nature conservation air water quality soil noise
recycled water waste
(7) Lifestyle Education culture health environmental awareness
(8) Management Organization BCP
Quantitative
Assessment
(9)CO2 Reduction and absorption
Set goals using a three-star scale ( to ) A numerical value for each of shall be set by each economy When the numerical values cannot be set reference values shall be provided in the
reference so that they can be used as reference For assessment results strive to visualize the overall assessment rank area
assessments (radar chart) and individual assessments
Assessment Method
LCT-I Development Principles
The lowest level that
must be achieved Economy level
(national goal) LCT Target Level
While the numerical value for each level can be set by each
economy (they will vary with the economy) each secretariat
should provide some reference values
Assessment Method Approach to assessment Criteria
LCT-I Development Principles
Assessment Method Output Image
LCT-I Development Principles
Assessment Indicators by Area (draft) 13
LCT-I Development Principles
Set required items which correspond to a city category by assessment area Use qualitative indicators ([1]ndash[8]) as much as possible Assessment criteria for each indicator shall be developed by a localcentral government
For economies without criteria standard values or assessment methods should be given in the Reference section
17
Assessment Indicators by Area (draft) 23
LCT-I Development Principles
18
Assessment Indicators by Area (draft) 33
LCT-I Development Principles
An assessment should be conducted under the leadership of a localcentral government Based on the assessment results develop and implement an improvement plan (what
how and by when) (PDCA) When in operation monitor progress on a regular basis (annually or once in a few years) The LCT-I of each district should be managed by each economy and APEC Report progress at an APEC meeting on a regular basis and give an LCT-I certification to
or commend the economies that are actively conducting the LCT-I process It is desirable to establish an incentive program such as provision of preferential project
assistance (or low interest rates) to award-winning municipalities by the World Bank
How to implement an LCT-I assessment system
LCT-I Development Principles
Kashiwanoha Campus (Chiba Japan) an established
well-known smart city
Sensitivity Analysis (case study)
1
Development around Kashiwa-no-ha Campus Station
Chiba University
Kashiwa-no-ha Park Park City Kashiwa-no-ha Campus ldquo2nd Townrdquo119000(880 units)(under construction)
ldquoDistrict 148rdquo
Site area 23344m2
Total floor 53277m2
Office Commercial
Hotel Rental residence(under construction
by 2014)
University of Tokyo
Park City Kashiwa-no-ha Campus ldquo1st Townrdquo
From 2009144000(997 units)
Kashiwa-no-ha Campus Railway
Station
Aerial photo of site combined with computer-generated images of District 148 and Park City 2nd Town
Tsukuba EX
KashiwanohaShopping mall
from 2006144500
(180 tenants)
Kashiwanoha Project is the most
comprehensive and complex Smart
City project in Japan but this Index
evaluates its specification of low
carbon planning and grasp its
performances to reduceCO2
Advantages of using LCT-I
Conclusion
Following characteristics of LCT-I can be considered as the advantages to utilize LCT-I in the APEC region
-Simple and easy to understand LCT development bull Use existing statistics data to make it intuitively easy to understand
the comprehensive and quantitative status of low carbon town development
-Reflect the circumstances of each economy and project characteristics
bull Take into account the economic conditions of each economy and project characteristics so as not to hamper sustainable growth
bull Easy to grasp a long-term trend in achievement level at each stage of conception planning construction and maintenance
-Reflect existing APEC LCMT Feasibility Study results existing assessment indicators and international trends
bull Reflect international trends such as smart infrastructure assessment standards (TC268) and OECD activities and combined use of such items is expected to be supported in the future
Issues for the next step
Conclusion
-Validation of assessment indicators in each assessment
area
-Setting of quantitative values for assessment standards
in each assessment area (with referring existing indexes)
-Provision of reference indicators and reference
calculation equations to economies without their own
assessment standards
-Sensitivity analysis of selected citiestowns
-Method of operation and method for awarding
incentives
-Method of combining it with smart infrastructure
standards (TC268)
Thank you for your attention
24
Annex
Study Flow
(2)Examination of management indicator system structure ① Examination of scope of management indicator system ② Examination of evaluation field and indicators ③ Examination of quantitative (or qualitative) evaluation method
(3)Sensitivity analysis of management indicators ① Selection of target cities for evaluation studies ② Execution of evaluation studies and sensitive analysis
(4)External activities for the creation of management indicators
(5)Preparation of report
(1)Examination of existing low carbon energy efficiency and smart city indicators
Background
bull Current conditions of global warming
bull Global increase in urban population and city development
projects
bull Energy issues incidental to urban population increase
bull Relationship between income level and urbanization
0
10
20
30
40
50
60
70
80
90
100
1980 1985 1990 1995 2000 2005 2010 2015 2020 2025 2030 2035 2040 2045 2050
都市化率
()
年
China
China Hong Kong SAR
Japan
Republic of Korea
Brunei Darussalam
Indonesia
Malaysia
Philippines
Singapore
Thailand
Viet Nam
Russian Federation
Mexico
Chile
Peru
Canada
United States of America
Australia
New Zealand
Papua New Guinea
Urbanization = urban population total population Urban population population residing in ldquocitiesrdquo as defined by national census Source United Nations ldquoWorld Urbanization Prospects the 2011 Revisionrdquo
Urbanization trends in APEC Economies
1 LEED-Neighborhood Development
(LEED-ND)
2 CASBEE for Urban Development
3 CASBEE for Cities
4 Urban Environmental Indicators (UEI)
(OECDGreen Cities programme)
5 Global City Indicators (GCI) (World
Bank)
6 Green City Index (GrCI)
7 Tianjin Eco City (Tianjin)
8 Smart City Indicators
9 Reference Framework for Sustainable
Cities (RFSC)
10European Initiative on Smart Cities
(EISC)
11J-CODE
12Tianjin Yujiapu CBD (Yujiapu))
28
Review of Existing Indicators
ltCity assessment systems collectedgt
ltCity assessment systems collectedgt - Scope of Assessment
- Target Area
- Assessment Purpose
- Assessment Approach
- Year of Creation
- Creator (country)
- Number of Assessment
Indicators
- Assessment Method
(quantitativequalitative)
- Participating parties
(Applicant and
AssessmentCertification
Agency)
- Required Statistical Data
- Purpose of Use
- Case Examples
- Complexity
- Applicability to different
regions or cities
- Alignment with international
trends (ISO etc)
29
Applicability of Existing Indicators
Ex) When What phase should be assessed
key goal indicators to manage a situational change between the beginning and the end of a project
key performance indicators that monitor progress in the planning and implementation of countermeasures
during the intermediary stages of the project that is in the planning construction and operational phases
Planning Achievement
control
Design Construction
LEED-ND
CASBBE for Urban Development
③CASBEE
Cities
④UEI
⑤GCI
⑥GrCI
⑦Tianjin
⑧Smart City
⑨RFSC
⑩EISC (NA)
⑪J-CODE
⑫Yujiapu
earlier latter
Understanding of status quo
④UEI
③CASBEE
-Cities
⑤GCI
A new framework which combines key
goal indicators and key performance
indicators is required
LCT-I
⑥GrCI
Key goal
indicators
Key goal
indicators
Key Performance Indicators
Categorization of existing indicators by applicable phase
Assess each of the following phases thorough understanding of the
actual conditions planning design construction and operation
30
Applicability of Existing Indicators
Ex) How How should the assessment be approached
The assessment process should be simple and easy to understand and should
reflect the circumstances of each economy project characteristics and
international trends
Applicability to cities that have different characteristics
Easy Difficult
Local
Global
Glo
ba
l Exp
an
dab
ility
Indicators that are globally expandable
and applicable to other cities
(1)LEED-ND
(2) CASBEE Urban
Development
(3)CASBEE Cities
(4)UEI
(5)GCI (6)GrCI
(7) Tianjin
(8) Smart City
(9)RFSC
(10)EISC (NA)
(11)J-CODE
(12) Yujiapu
31
Applicability of Existing Indicators
Key
Requirements
Desired LCT-I Form
1 2 3 4 5 6 7 8 9 10 11 12
LE
ED
-ND
CA
SB
EE
Urb
an
Develo
pm
ent
CA
SB
EE
Citie
s
Urb
an E
nviro
nm
enta
l
Indic
ato
rs
Glo
bal C
ity In
dic
ato
rs
Gre
en C
ity In
dex
Tia
njin
Eco C
ity
Sm
art C
ity In
dic
ato
r
Refe
rence F
ram
ew
ork
for S
usta
inable
Citie
s
Euro
pean In
itiativ
e o
n
Sm
art C
ities
J-C
OD
E
Tia
njin
Yujia
pu C
BD
1 WHY
Assessment
Purpose
Self-assessment and
growth management
by cities
C
E
xte
rna
l C
ertific
atio
n
C
Exte
rna
l C
ertific
atio
n
A
C
E
xte
rna
l A
ssessm
en
t
C
E
xte
rna
l A
ssessm
en
t
C
E
xte
rna
l A
ssessm
en
t
C
Top
-do
wn
m
an
ag
em
en
t
C
To
p-d
ow
n
ma
nag
em
en
t
B
G
uid
elin
es fo
r a
dm
inis
trato
rs
C
Te
ch
no
log
ica
l d
evelo
pm
ent
C
To
p-d
ow
n
ma
nag
em
en
t
A
2 WHO
Assessment
Body
Can be assessed by
municipal senior
management
C
B
usin
ess
Op
era
tor
C
Bu
sin
ess
Op
era
tor
A
C
Inte
rna
tion
al
Org
an
iza
tion
C
Inte
rna
tion
al
Org
an
iza
tion
C
Inte
rna
tion
al
Org
an
iza
tion
C
Ce
ntra
l G
ove
rnm
en
t
C
Ce
ntra
l G
ove
rnm
en
t
C
Inte
rna
tion
al
Org
an
iza
tion
C
Inte
rna
tion
al
Org
an
iza
tion
C
Ce
ntra
l G
ove
rnm
en
t
A
3 WHEN
Assessment
Timing
Capability of
diagnosing the actual
conditions
C C A A A A C C C C C C
Assessable in design
and planning phases A A C C C C A A A C A A
Assessable in
construction phase A A C C C C A A A C A A
Assessable in
operational phase C C A A A A C C C C C C
4 WHERE
Scope of
Assessment
Administrative
districts under the
jurisdiction of local
governments in the
APEC region
C
P
roje
ct A
rea
C
P
roje
ct A
rea
A
C
Me
tropolita
n A
rea
A
A
A
A
A
C
Industry
A
A
5 WHAT
Assessment
Area
KGIs should be
considered C C A A A B B B A C B B
Not only the areas that have a direct impact on low-carbonization but also those that indirectly impact it (areas that contribute to the enhancement of appeal for and sustainability of LCT) should be targeted
While the APEC LCMT CONCEPT states measures to achieve low-carbonization as one of areas the APEC LCT should assess the results (output) of using such measures
The assessment areas shall include nine basic categories (Qualitative Assessment 8 areas Quantitative Assessment CO2) and each economy shall be allowed to add extra categories on an as-needed basis
Assessment Areas
LCT-I Development Principles
[Reference] The Concept of the Low-Carbon town in the APEC Region
Demand
Side
Demand amp Supply
Supply
side
Low Carbon Town Structure Environment space development
Passive energy design amp equipmentReducingheat loads
1 Town Structure
2 Buildings
3Energy ManagementSystems (EMS)
4 Transportation
5 Area Energy Network
6 Untapped Energy
7 Renewable Energy
8 Smart Grid System
Transit Oriented Development
Low CarbonBuilding
Highly efficient equipment amp facilities
Area Energy Network
Home EMS Factory EMS
Untapped Energy
Low carbon Traffic Public transportationsystems
Low Carbon Vehiclesamp Facilities
Renewable Energy
District heating cooling
Using seariver water Using waste heat
Smart energy systemSmart Grid
Business EMS Area EMS
Trafficdemandmanagement
Additional category Environment eco life style organization and CO2 emission
+ α
Evaluation Structure of APEC LCT-I Partial List of Evaluation Categories
Category Evaluation Item Evaluation Index
Town Classification Evaluation Score
①
U-1
CBD
②
U-2
Commercial
③
U-3
Residential
④
Rural
②Architecture
Energy-saving Buildings Ratio of number of energy efficient
buildings in the area
Building Insulation PAL 1)
Energy Efficiency of Building Equipment ERB 2)
③EMS
Building and Area Energy Management
Existence of building EMS
implementation plan
Existence of home EMS implementation
plan
Existence of factory EMS implementation
plan
Existence of area EMS implementation
plan
④Transportation
Promotion of Public Transportation Public transportation mode share
Formation of Transport Hub Existence of more than 2 types of
transport hubs
Low-carbon Public Transportation
Existence of BRT or LRT implementation
plan
Existence of electric bus or natural gas
vehicle implementation plan
Low-carbon Vehicles Diffusion rate of EV and PHV
Transportation Demand Management Existence of car sharing or rental bike
system implementation plan
⑤Energy
District Heating and Cooling System
(DHC)
Ratio over total energy consumption
Renewable Energy Ratio over total energy consumption
Untapped Energy Ratio over total energy consumption
Smart Grid Existence of smart grid implementation
plan
1) PAL Perimeter Annual Load
2) ERB Energy Reduction Rate of Building Equipment
[Structure of Evaluation]
Assessments are performed on individual categories and overall
performance
Assessment results are expressed in 3-scale rating systems ie
(overall) and 1-3 point (category)
Evaluation criteria for each category can be set by individual economies
Score of individual category is calculated based on the aggregate
performance of sub-items overall score of the LCT is the average score
of individual categories
Evaluation Structure of APEC LCT-I
Overall Score
17
CO2 reduction
470 t-co2year
①urban structure
③EMS
④transportation ⑤energy
⑥environment
⑦eco life style
⑧organization
Standard level for economy
Ideal level for economy
Minimum level for economy
②architecture
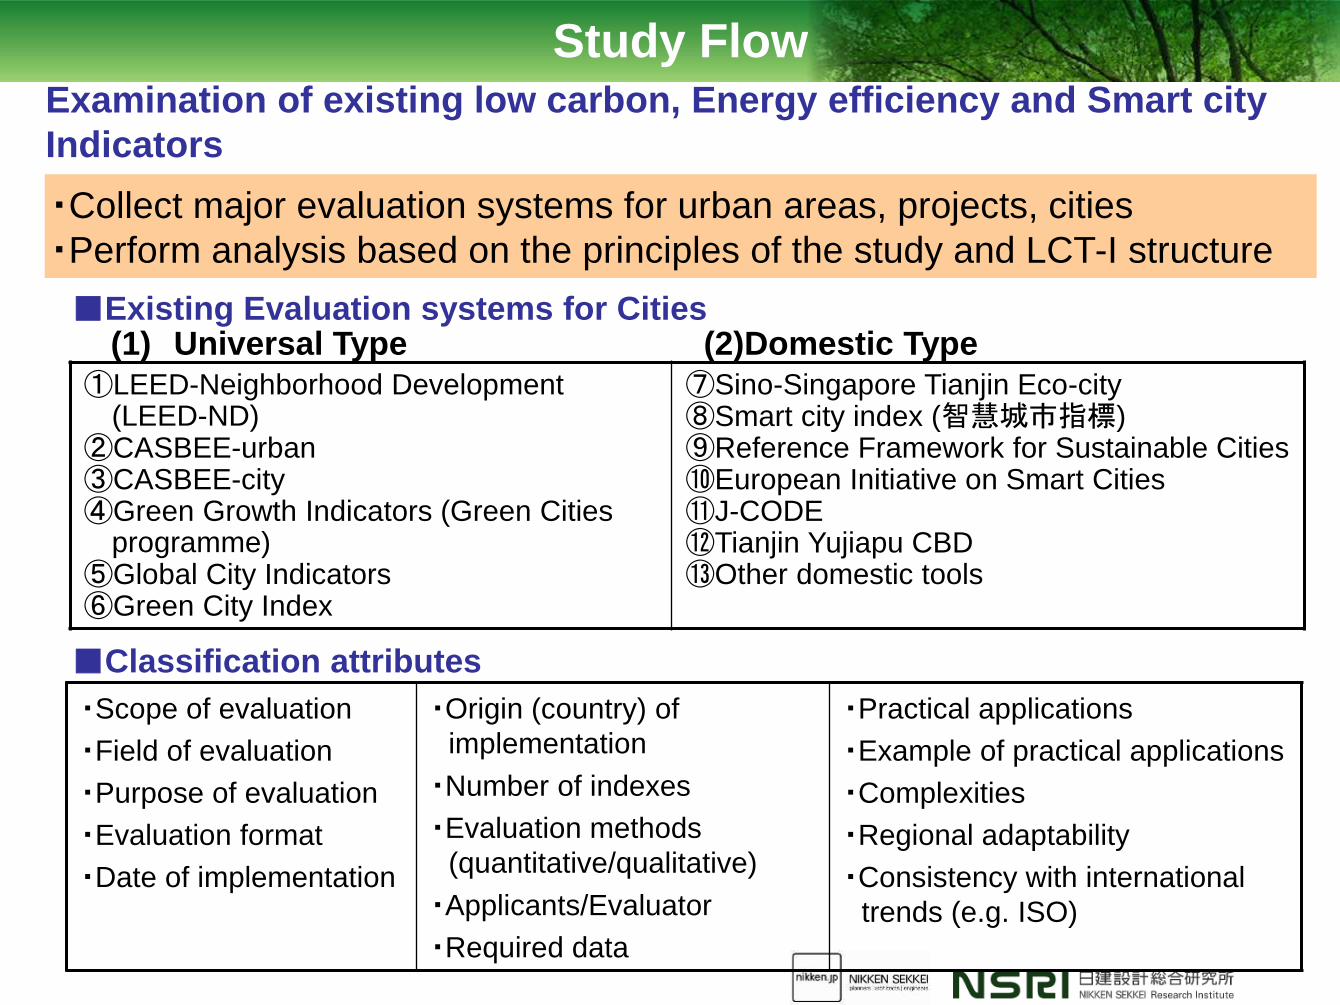
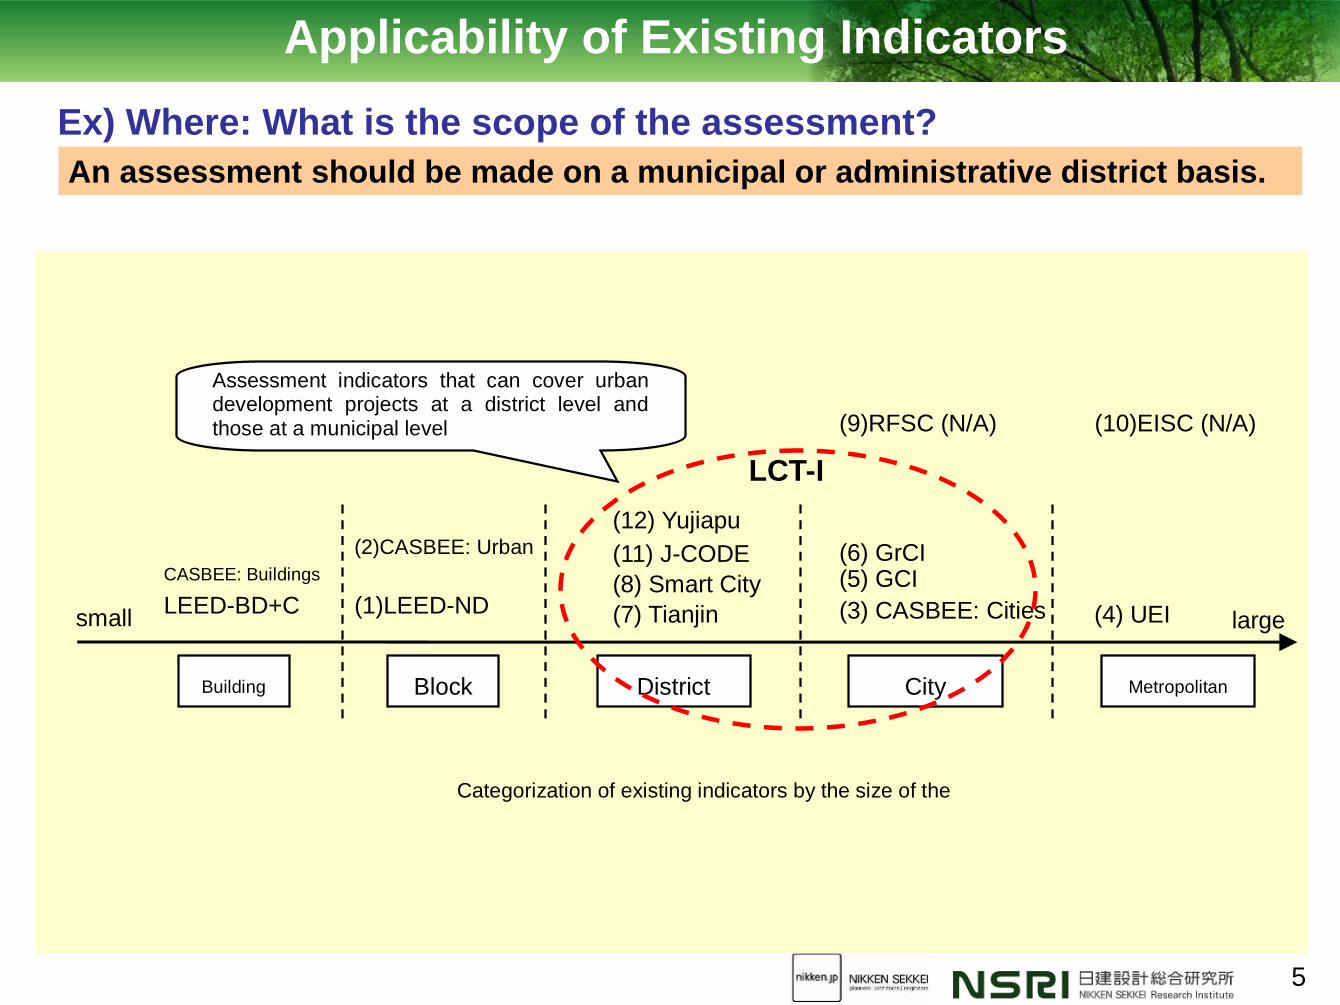
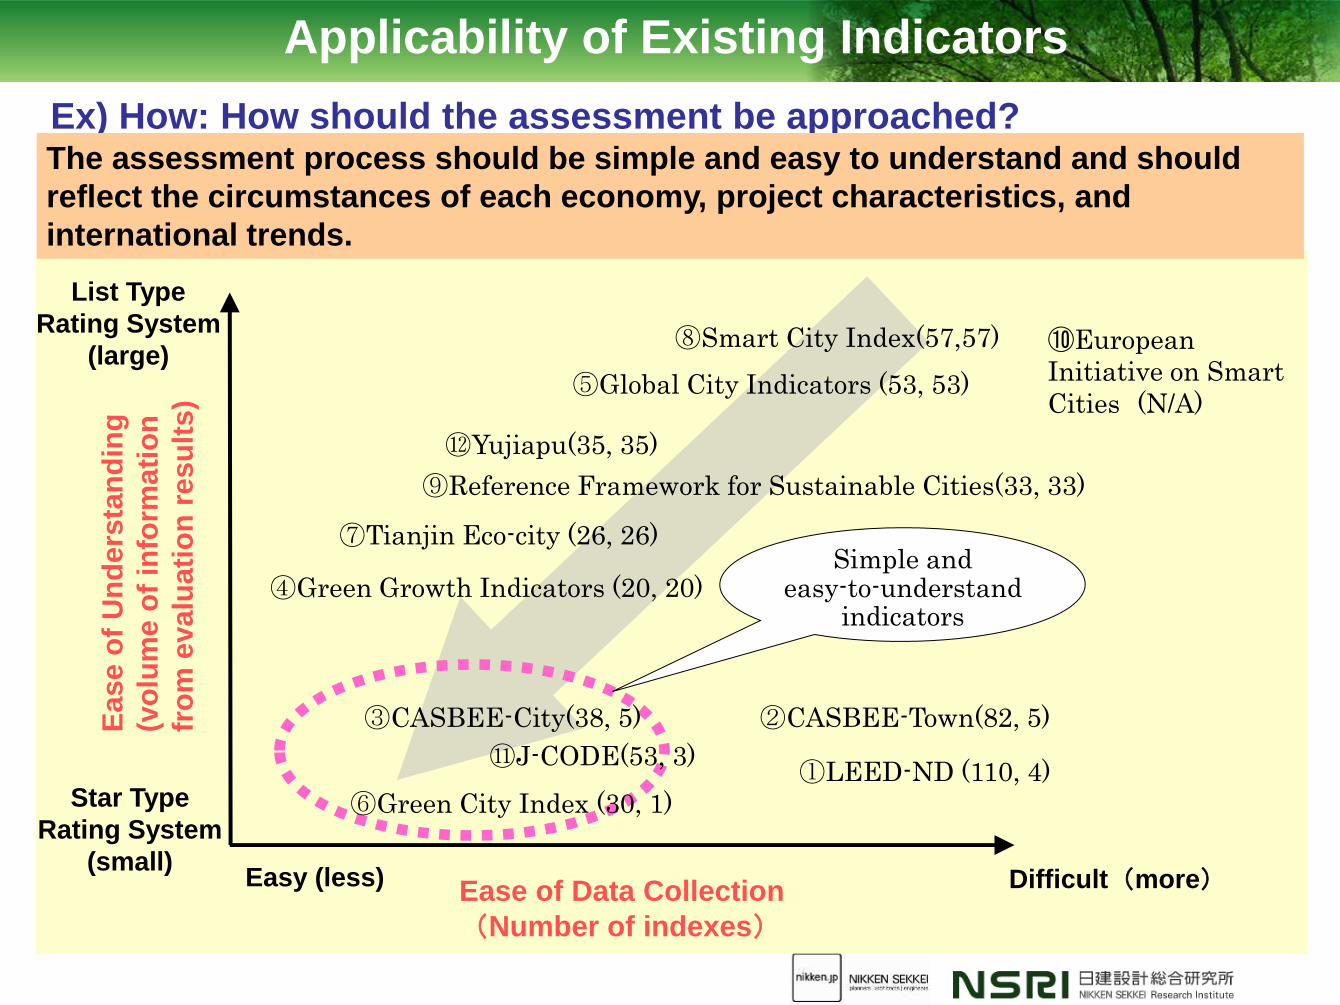
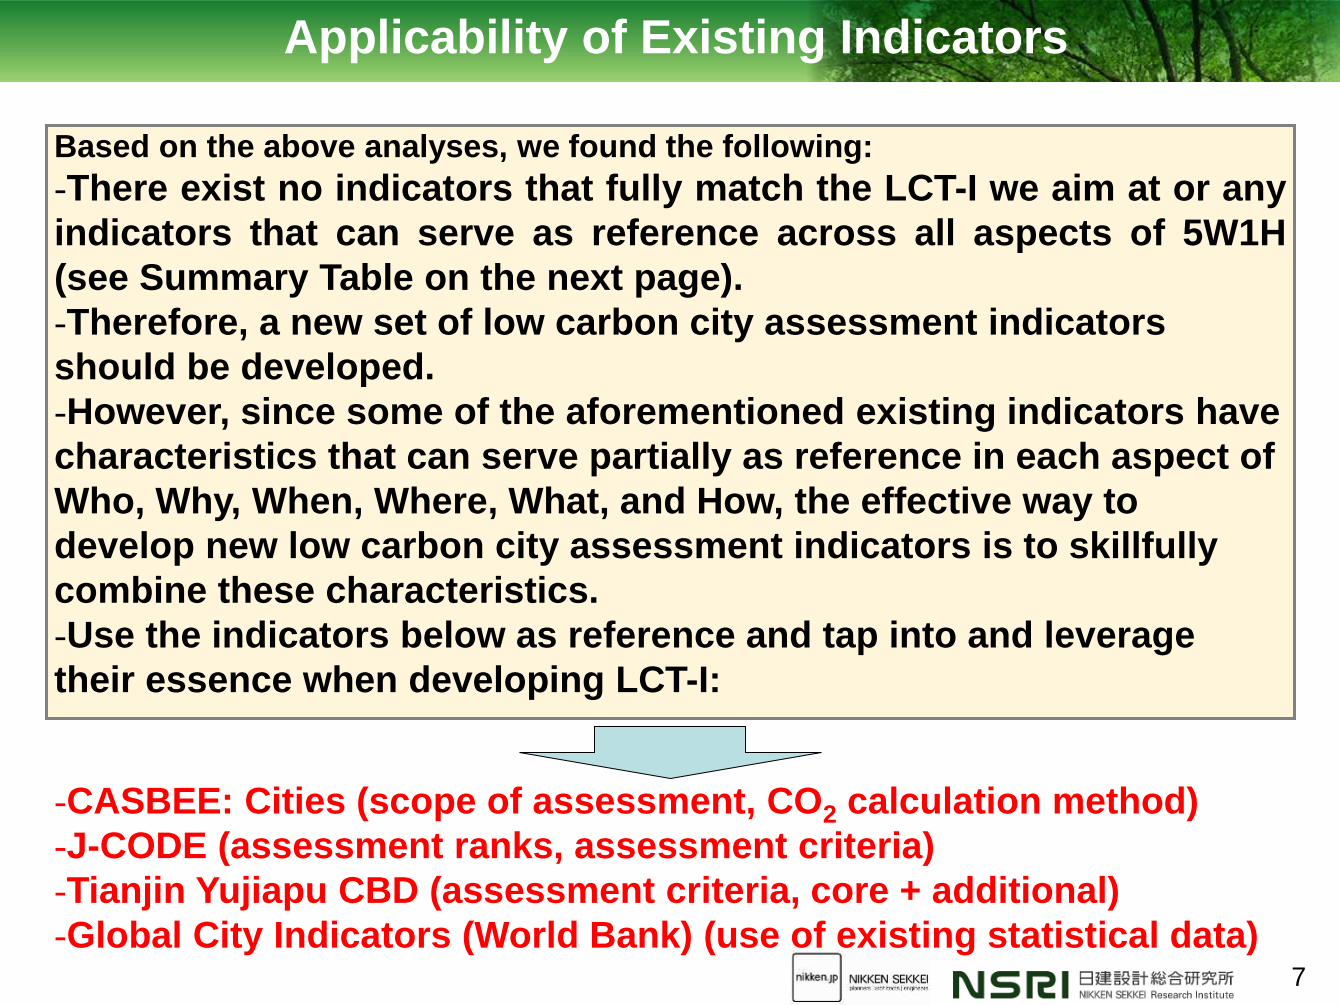
LCT-I Development Principles
(i) Indicators are simple and easy to
understand
(ii) Indicators reflect the conditions of each
economy and project characteristics
(iii) Indicators are based on existing APEC
LCMT FS outcomes existing assessment
indicators and international trends
Image of Low Carbon Town and LC measures
LCT-I Development Principles
Low Carbon Town in the APEC by APEC LCMT CONCEPT
Type of Town Low Carbon Town Project Economy Population
(I) Urban - 1
(Central Business District CBD)
Yujiapu CBDTianjin1 China 500000
Sino-Singapore Tianjin Eco City China 350000
Quezon City Green CBD Philippine
(II) Urban - 2 (Commercial Oriented Town)
Putrajaya Green City Malaysia 68000
(300000 planned)
Chiang Mai Thailand 160000
Da Nang 3 Viet Nam 1million
Cebu City 3 Philippine 820000
Surabaya 3 Indonesia 28 million
Yokohama Smart City Project Japan 37 million
(III) Urban ndash 3 (Residential Oriented Town)
Plunggol Eco Town Singapore
San Borja 4 Peru 110000
(IV) Rural
Muang Klang Low Carbon City Thailand 17000
Jeju Island Smart Green City Korea 6000 households
Low Carbon Island (Penghu Island and Others)
Chinese Taipei
88000
Samui Island 2 Thailand 53990
1 LCMT Phase I feasibility study 2 LCMT Phase II feasibility study source ) APEC LCMT CONCEPT 3 Pilot City of WB Eco2 Cities Project 4 LCMT Phase Ⅳ feasibility study Total population
Space Scale Setting
LCT-I Development Principles
Building Block amp District City
Higher insulation
High-efficiency building services system
Use of natural energy
(Natural ventilation day lighting)
Reuse of sewage water
Greenery on site
Allocating district heating and cooling systems and linking them
Untapped energy(sea amp river waterwaste heat from incinerator)dispersed power system
Renewable energy (PV Wind Power)
Reuse of water amp wastes
Wind along the canopy
Continuous greenery on site
Multiple use trench
Information network
Block plan (with appropriate open space)
Rich greenery network to mitigate heat-island impact
Appropriate transportation system
Water supply amp sewage Gas supply
Electric power supply
Region
- Power plant
- Gas plant
Directly related to CO2 reduction
Indirectly related to CO2 reduction
Since low-carbon measures vary with the scale of a target project the scope of assessment and target technology are closely connected
The scope of assessment shall include buildings transportation and districtblock infrastructure within an LCMT boundary (project boundary administrative boundary)
source)APEC LCMT Phase1 report
Areas and measures covered by APEC LCT-I
LCT-I Development Principles
Not only the areas that have a direct impact on low-carbonization but also those that indirectly impact it (areas that contribute to the enhancement of appeal for and sustainability of LCT) should be targeted
While the APEC LCMT CONCEPT states measures to achieve low-carbonization as one of areas the APEC LCT should assess the results (output) of using such measures
The assessment areas shall include nine basic categories (Qualitative Assessment 8 areas Quantitative Assessment CO2) and each economy shall be allowed to add extra categories on an as-needed basis
Assessment Areas
LCT-I Development Principles
Category Area Connection with the Concept of the Low-Carbon Town
in the APEC Region
Qualitative
Assessment
(1) City Structure 1 Town structure (Low-Carbon Town Structure)
(2) Building 2 Building ( Low-Carbon Building)
(3) Energy Management
System (EMS)
Business EMS home EMS Factory EMS Area EMS
(4) Transportation 4 Transportation (Low-Carbon Traffic)
(5) Energy 5 Area Energy Network
6 Untapped Energy
7 renewable Energy
8 Smart Grid System
(6) Environment Nature conservation air water quality soil noise
recycled water waste
(7) Lifestyle Education culture health environmental awareness
(8) Management Organization BCP
Quantitative
Assessment
(9)CO2 Reduction and absorption
Set goals using a three-star scale ( to ) A numerical value for each of shall be set by each economy When the numerical values cannot be set reference values shall be provided in the
reference so that they can be used as reference For assessment results strive to visualize the overall assessment rank area
assessments (radar chart) and individual assessments
Assessment Method
LCT-I Development Principles
The lowest level that
must be achieved Economy level
(national goal) LCT Target Level
While the numerical value for each level can be set by each
economy (they will vary with the economy) each secretariat
should provide some reference values
Assessment Method Approach to assessment Criteria
LCT-I Development Principles
Assessment Method Output Image
LCT-I Development Principles
Assessment Indicators by Area (draft) 13
LCT-I Development Principles
Set required items which correspond to a city category by assessment area Use qualitative indicators ([1]ndash[8]) as much as possible Assessment criteria for each indicator shall be developed by a localcentral government
For economies without criteria standard values or assessment methods should be given in the Reference section
17
Assessment Indicators by Area (draft) 23
LCT-I Development Principles
18
Assessment Indicators by Area (draft) 33
LCT-I Development Principles
An assessment should be conducted under the leadership of a localcentral government Based on the assessment results develop and implement an improvement plan (what
how and by when) (PDCA) When in operation monitor progress on a regular basis (annually or once in a few years) The LCT-I of each district should be managed by each economy and APEC Report progress at an APEC meeting on a regular basis and give an LCT-I certification to
or commend the economies that are actively conducting the LCT-I process It is desirable to establish an incentive program such as provision of preferential project
assistance (or low interest rates) to award-winning municipalities by the World Bank
How to implement an LCT-I assessment system
LCT-I Development Principles
Kashiwanoha Campus (Chiba Japan) an established
well-known smart city
Sensitivity Analysis (case study)
1
Development around Kashiwa-no-ha Campus Station
Chiba University
Kashiwa-no-ha Park Park City Kashiwa-no-ha Campus ldquo2nd Townrdquo119000(880 units)(under construction)
ldquoDistrict 148rdquo
Site area 23344m2
Total floor 53277m2
Office Commercial
Hotel Rental residence(under construction
by 2014)
University of Tokyo
Park City Kashiwa-no-ha Campus ldquo1st Townrdquo
From 2009144000(997 units)
Kashiwa-no-ha Campus Railway
Station
Aerial photo of site combined with computer-generated images of District 148 and Park City 2nd Town
Tsukuba EX
KashiwanohaShopping mall
from 2006144500
(180 tenants)
Kashiwanoha Project is the most
comprehensive and complex Smart
City project in Japan but this Index
evaluates its specification of low
carbon planning and grasp its
performances to reduceCO2
Advantages of using LCT-I
Conclusion
Following characteristics of LCT-I can be considered as the advantages to utilize LCT-I in the APEC region
-Simple and easy to understand LCT development bull Use existing statistics data to make it intuitively easy to understand
the comprehensive and quantitative status of low carbon town development
-Reflect the circumstances of each economy and project characteristics
bull Take into account the economic conditions of each economy and project characteristics so as not to hamper sustainable growth
bull Easy to grasp a long-term trend in achievement level at each stage of conception planning construction and maintenance
-Reflect existing APEC LCMT Feasibility Study results existing assessment indicators and international trends
bull Reflect international trends such as smart infrastructure assessment standards (TC268) and OECD activities and combined use of such items is expected to be supported in the future
Issues for the next step
Conclusion
-Validation of assessment indicators in each assessment
area
-Setting of quantitative values for assessment standards
in each assessment area (with referring existing indexes)
-Provision of reference indicators and reference
calculation equations to economies without their own
assessment standards
-Sensitivity analysis of selected citiestowns
-Method of operation and method for awarding
incentives
-Method of combining it with smart infrastructure
standards (TC268)
Thank you for your attention
24
Annex
Study Flow
(2)Examination of management indicator system structure ① Examination of scope of management indicator system ② Examination of evaluation field and indicators ③ Examination of quantitative (or qualitative) evaluation method
(3)Sensitivity analysis of management indicators ① Selection of target cities for evaluation studies ② Execution of evaluation studies and sensitive analysis
(4)External activities for the creation of management indicators
(5)Preparation of report
(1)Examination of existing low carbon energy efficiency and smart city indicators
Background
bull Current conditions of global warming
bull Global increase in urban population and city development
projects
bull Energy issues incidental to urban population increase
bull Relationship between income level and urbanization
0
10
20
30
40
50
60
70
80
90
100
1980 1985 1990 1995 2000 2005 2010 2015 2020 2025 2030 2035 2040 2045 2050
都市化率
()
年
China
China Hong Kong SAR
Japan
Republic of Korea
Brunei Darussalam
Indonesia
Malaysia
Philippines
Singapore
Thailand
Viet Nam
Russian Federation
Mexico
Chile
Peru
Canada
United States of America
Australia
New Zealand
Papua New Guinea
Urbanization = urban population total population Urban population population residing in ldquocitiesrdquo as defined by national census Source United Nations ldquoWorld Urbanization Prospects the 2011 Revisionrdquo
Urbanization trends in APEC Economies
1 LEED-Neighborhood Development
(LEED-ND)
2 CASBEE for Urban Development
3 CASBEE for Cities
4 Urban Environmental Indicators (UEI)
(OECDGreen Cities programme)
5 Global City Indicators (GCI) (World
Bank)
6 Green City Index (GrCI)
7 Tianjin Eco City (Tianjin)
8 Smart City Indicators
9 Reference Framework for Sustainable
Cities (RFSC)
10European Initiative on Smart Cities
(EISC)
11J-CODE
12Tianjin Yujiapu CBD (Yujiapu))
28
Review of Existing Indicators
ltCity assessment systems collectedgt
ltCity assessment systems collectedgt - Scope of Assessment
- Target Area
- Assessment Purpose
- Assessment Approach
- Year of Creation
- Creator (country)
- Number of Assessment
Indicators
- Assessment Method
(quantitativequalitative)
- Participating parties
(Applicant and
AssessmentCertification
Agency)
- Required Statistical Data
- Purpose of Use
- Case Examples
- Complexity
- Applicability to different
regions or cities
- Alignment with international
trends (ISO etc)
29
Applicability of Existing Indicators
Ex) When What phase should be assessed
key goal indicators to manage a situational change between the beginning and the end of a project
key performance indicators that monitor progress in the planning and implementation of countermeasures
during the intermediary stages of the project that is in the planning construction and operational phases
Planning Achievement
control
Design Construction
LEED-ND
CASBBE for Urban Development
③CASBEE
Cities
④UEI
⑤GCI
⑥GrCI
⑦Tianjin
⑧Smart City
⑨RFSC
⑩EISC (NA)
⑪J-CODE
⑫Yujiapu
earlier latter
Understanding of status quo
④UEI
③CASBEE
-Cities
⑤GCI
A new framework which combines key
goal indicators and key performance
indicators is required
LCT-I
⑥GrCI
Key goal
indicators
Key goal
indicators
Key Performance Indicators
Categorization of existing indicators by applicable phase
Assess each of the following phases thorough understanding of the
actual conditions planning design construction and operation
30
Applicability of Existing Indicators
Ex) How How should the assessment be approached
The assessment process should be simple and easy to understand and should
reflect the circumstances of each economy project characteristics and
international trends
Applicability to cities that have different characteristics
Easy Difficult
Local
Global
Glo
ba
l Exp
an
dab
ility
Indicators that are globally expandable
and applicable to other cities
(1)LEED-ND
(2) CASBEE Urban
Development
(3)CASBEE Cities
(4)UEI
(5)GCI (6)GrCI
(7) Tianjin
(8) Smart City
(9)RFSC
(10)EISC (NA)
(11)J-CODE
(12) Yujiapu
31
Applicability of Existing Indicators
Key
Requirements
Desired LCT-I Form
1 2 3 4 5 6 7 8 9 10 11 12
LE
ED
-ND
CA
SB
EE
Urb
an
Develo
pm
ent
CA
SB
EE
Citie
s
Urb
an E
nviro
nm
enta
l
Indic
ato
rs
Glo
bal C
ity In
dic
ato
rs
Gre
en C
ity In
dex
Tia
njin
Eco C
ity
Sm
art C
ity In
dic
ato
r
Refe
rence F
ram
ew
ork
for S
usta
inable
Citie
s
Euro
pean In
itiativ
e o
n
Sm
art C
ities
J-C
OD
E
Tia
njin
Yujia
pu C
BD
1 WHY
Assessment
Purpose
Self-assessment and
growth management
by cities
C
E
xte
rna
l C
ertific
atio
n
C
Exte
rna
l C
ertific
atio
n
A
C
E
xte
rna
l A
ssessm
en
t
C
E
xte
rna
l A
ssessm
en
t
C
E
xte
rna
l A
ssessm
en
t
C
Top
-do
wn
m
an
ag
em
en
t
C
To
p-d
ow
n
ma
nag
em
en
t
B
G
uid
elin
es fo
r a
dm
inis
trato
rs
C
Te
ch
no
log
ica
l d
evelo
pm
ent
C
To
p-d
ow
n
ma
nag
em
en
t
A
2 WHO
Assessment
Body
Can be assessed by
municipal senior
management
C
B
usin
ess
Op
era
tor
C
Bu
sin
ess
Op
era
tor
A
C
Inte
rna
tion
al
Org
an
iza
tion
C
Inte
rna
tion
al
Org
an
iza
tion
C
Inte
rna
tion
al
Org
an
iza
tion
C
Ce
ntra
l G
ove
rnm
en
t
C
Ce
ntra
l G
ove
rnm
en
t
C
Inte
rna
tion
al
Org
an
iza
tion
C
Inte
rna
tion
al
Org
an
iza
tion
C
Ce
ntra
l G
ove
rnm
en
t
A
3 WHEN
Assessment
Timing
Capability of
diagnosing the actual
conditions
C C A A A A C C C C C C
Assessable in design
and planning phases A A C C C C A A A C A A
Assessable in
construction phase A A C C C C A A A C A A
Assessable in
operational phase C C A A A A C C C C C C
4 WHERE
Scope of
Assessment
Administrative
districts under the
jurisdiction of local
governments in the
APEC region
C
P
roje
ct A
rea
C
P
roje
ct A
rea
A
C
Me
tropolita
n A
rea
A
A
A
A
A
C
Industry
A
A
5 WHAT
Assessment
Area
KGIs should be
considered C C A A A B B B A C B B
Not only the areas that have a direct impact on low-carbonization but also those that indirectly impact it (areas that contribute to the enhancement of appeal for and sustainability of LCT) should be targeted
While the APEC LCMT CONCEPT states measures to achieve low-carbonization as one of areas the APEC LCT should assess the results (output) of using such measures
The assessment areas shall include nine basic categories (Qualitative Assessment 8 areas Quantitative Assessment CO2) and each economy shall be allowed to add extra categories on an as-needed basis
Assessment Areas
LCT-I Development Principles
[Reference] The Concept of the Low-Carbon town in the APEC Region
Demand
Side
Demand amp Supply
Supply
side
Low Carbon Town Structure Environment space development
Passive energy design amp equipmentReducingheat loads
1 Town Structure
2 Buildings
3Energy ManagementSystems (EMS)
4 Transportation
5 Area Energy Network
6 Untapped Energy
7 Renewable Energy
8 Smart Grid System
Transit Oriented Development
Low CarbonBuilding
Highly efficient equipment amp facilities
Area Energy Network
Home EMS Factory EMS
Untapped Energy
Low carbon Traffic Public transportationsystems
Low Carbon Vehiclesamp Facilities
Renewable Energy
District heating cooling
Using seariver water Using waste heat
Smart energy systemSmart Grid
Business EMS Area EMS
Trafficdemandmanagement
Additional category Environment eco life style organization and CO2 emission
+ α
Evaluation Structure of APEC LCT-I Partial List of Evaluation Categories
Category Evaluation Item Evaluation Index
Town Classification Evaluation Score
①
U-1
CBD
②
U-2
Commercial
③
U-3
Residential
④
Rural
②Architecture
Energy-saving Buildings Ratio of number of energy efficient
buildings in the area
Building Insulation PAL 1)
Energy Efficiency of Building Equipment ERB 2)
③EMS
Building and Area Energy Management
Existence of building EMS
implementation plan
Existence of home EMS implementation
plan
Existence of factory EMS implementation
plan
Existence of area EMS implementation
plan
④Transportation
Promotion of Public Transportation Public transportation mode share
Formation of Transport Hub Existence of more than 2 types of
transport hubs
Low-carbon Public Transportation
Existence of BRT or LRT implementation
plan
Existence of electric bus or natural gas
vehicle implementation plan
Low-carbon Vehicles Diffusion rate of EV and PHV
Transportation Demand Management Existence of car sharing or rental bike
system implementation plan
⑤Energy
District Heating and Cooling System
(DHC)
Ratio over total energy consumption
Renewable Energy Ratio over total energy consumption
Untapped Energy Ratio over total energy consumption
Smart Grid Existence of smart grid implementation
plan
1) PAL Perimeter Annual Load
2) ERB Energy Reduction Rate of Building Equipment
[Structure of Evaluation]
Assessments are performed on individual categories and overall
performance
Assessment results are expressed in 3-scale rating systems ie
(overall) and 1-3 point (category)
Evaluation criteria for each category can be set by individual economies
Score of individual category is calculated based on the aggregate
performance of sub-items overall score of the LCT is the average score
of individual categories
Evaluation Structure of APEC LCT-I
Overall Score
17
CO2 reduction
470 t-co2year
①urban structure
③EMS
④transportation ⑤energy
⑥environment
⑦eco life style
⑧organization
Standard level for economy
Ideal level for economy
Minimum level for economy
②architecture
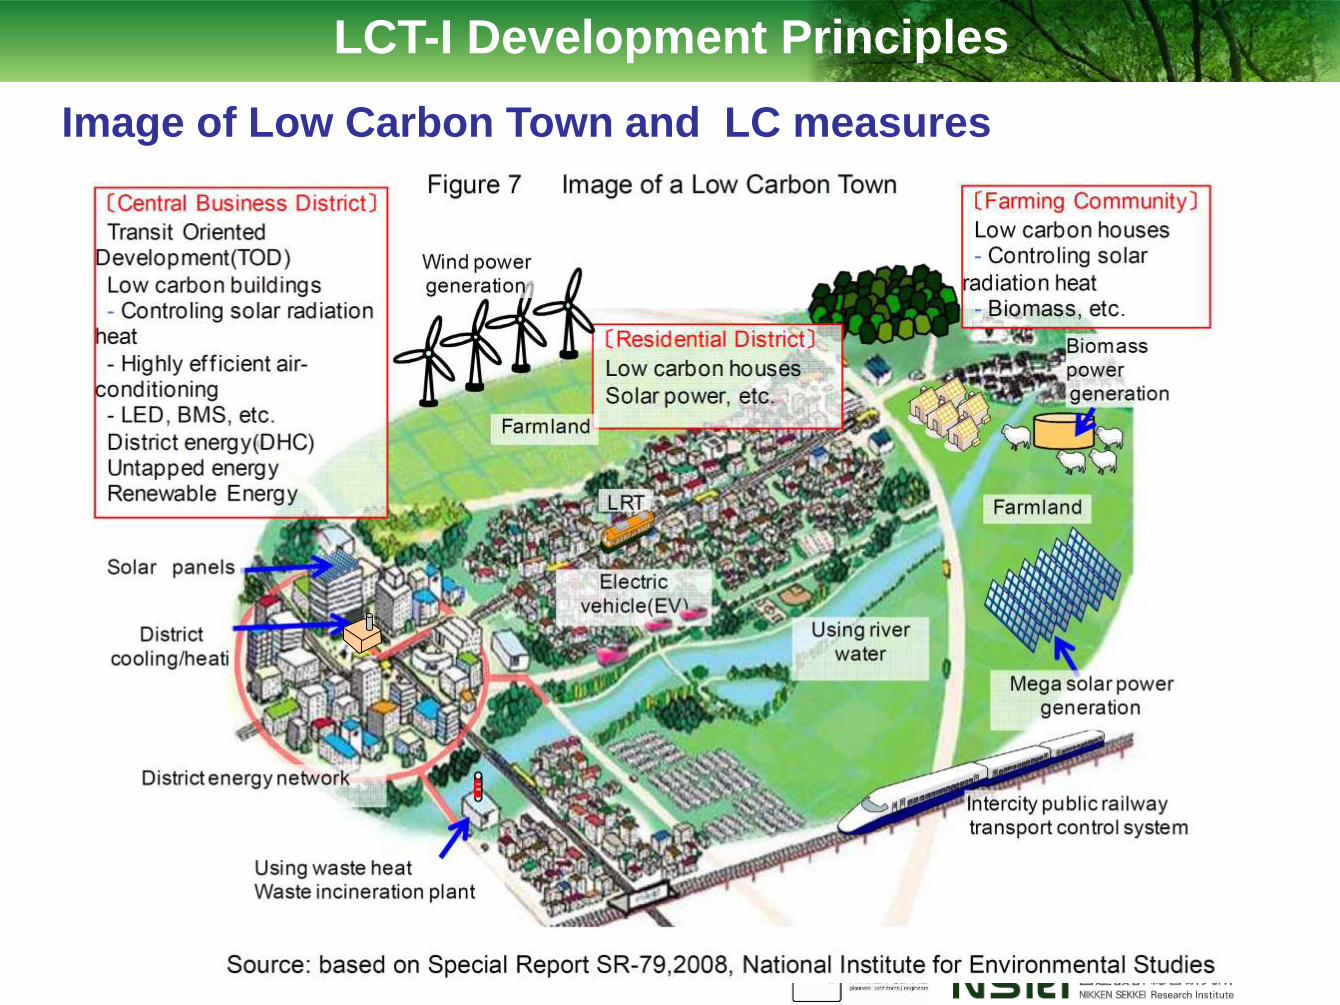
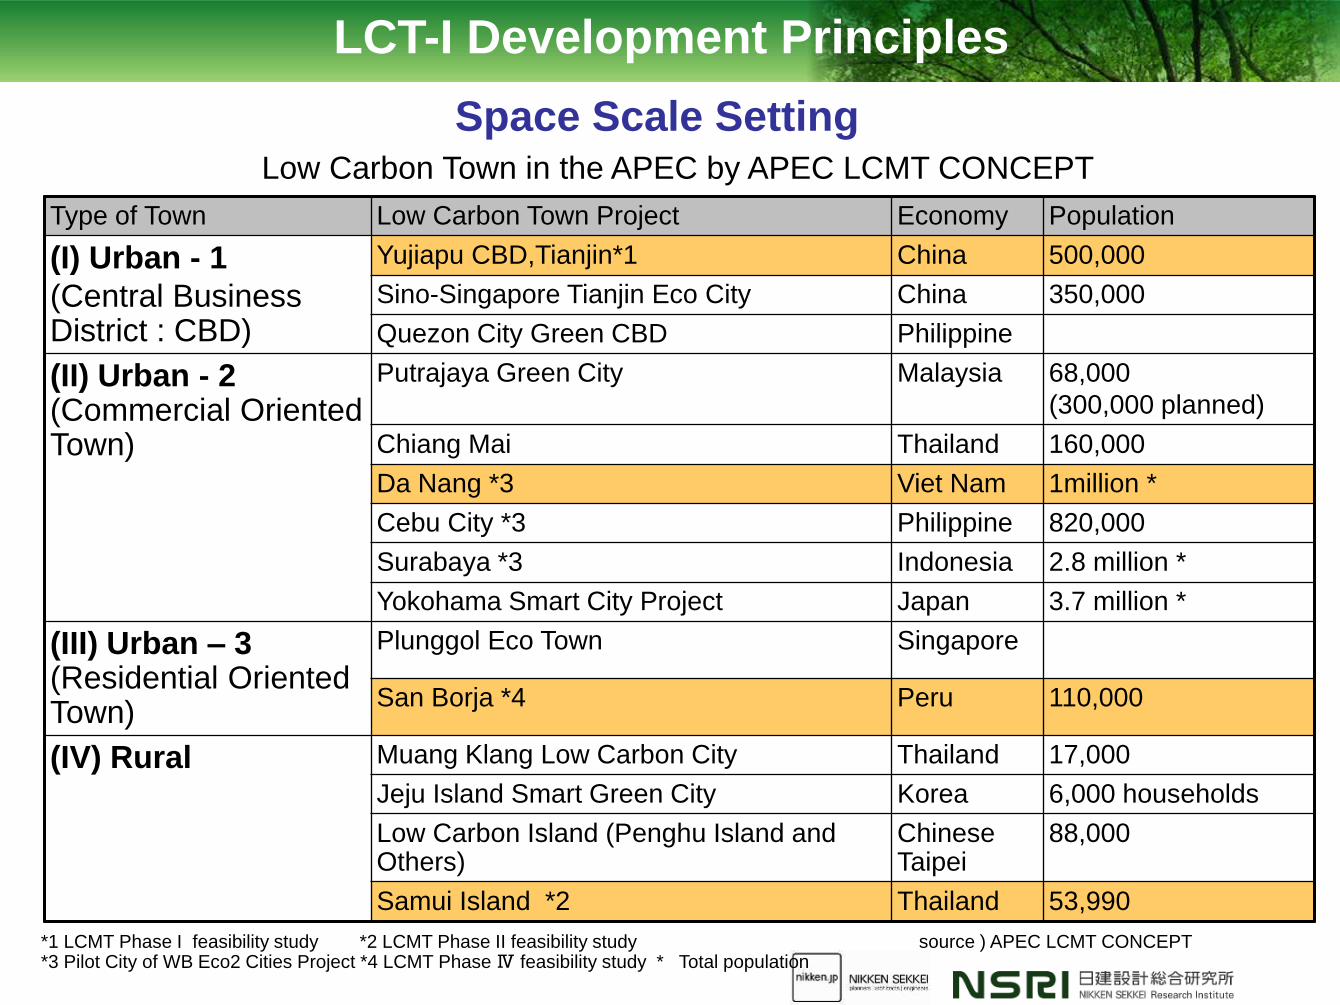
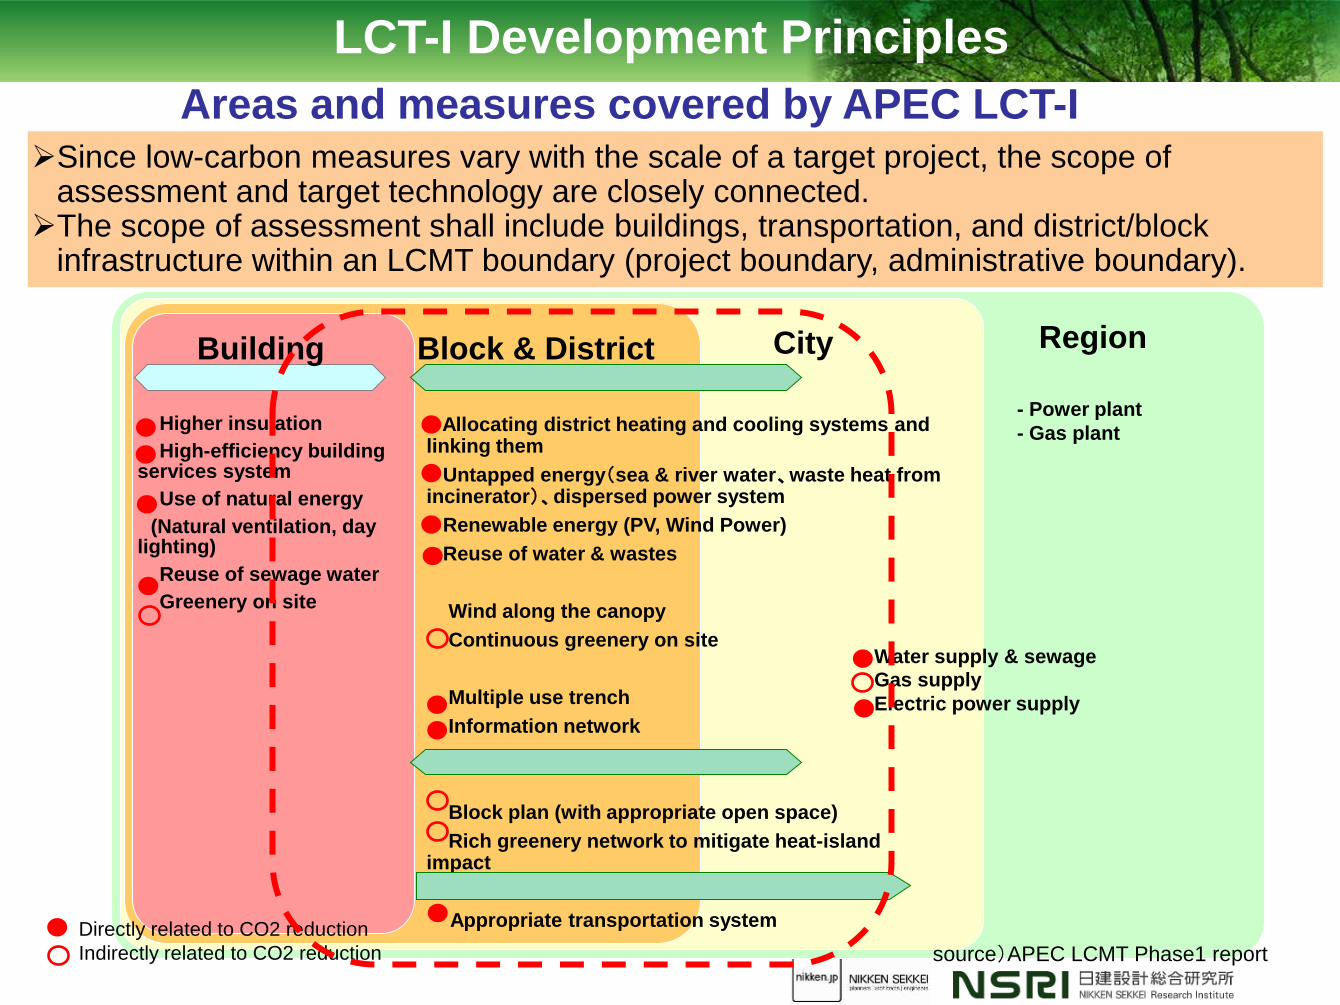
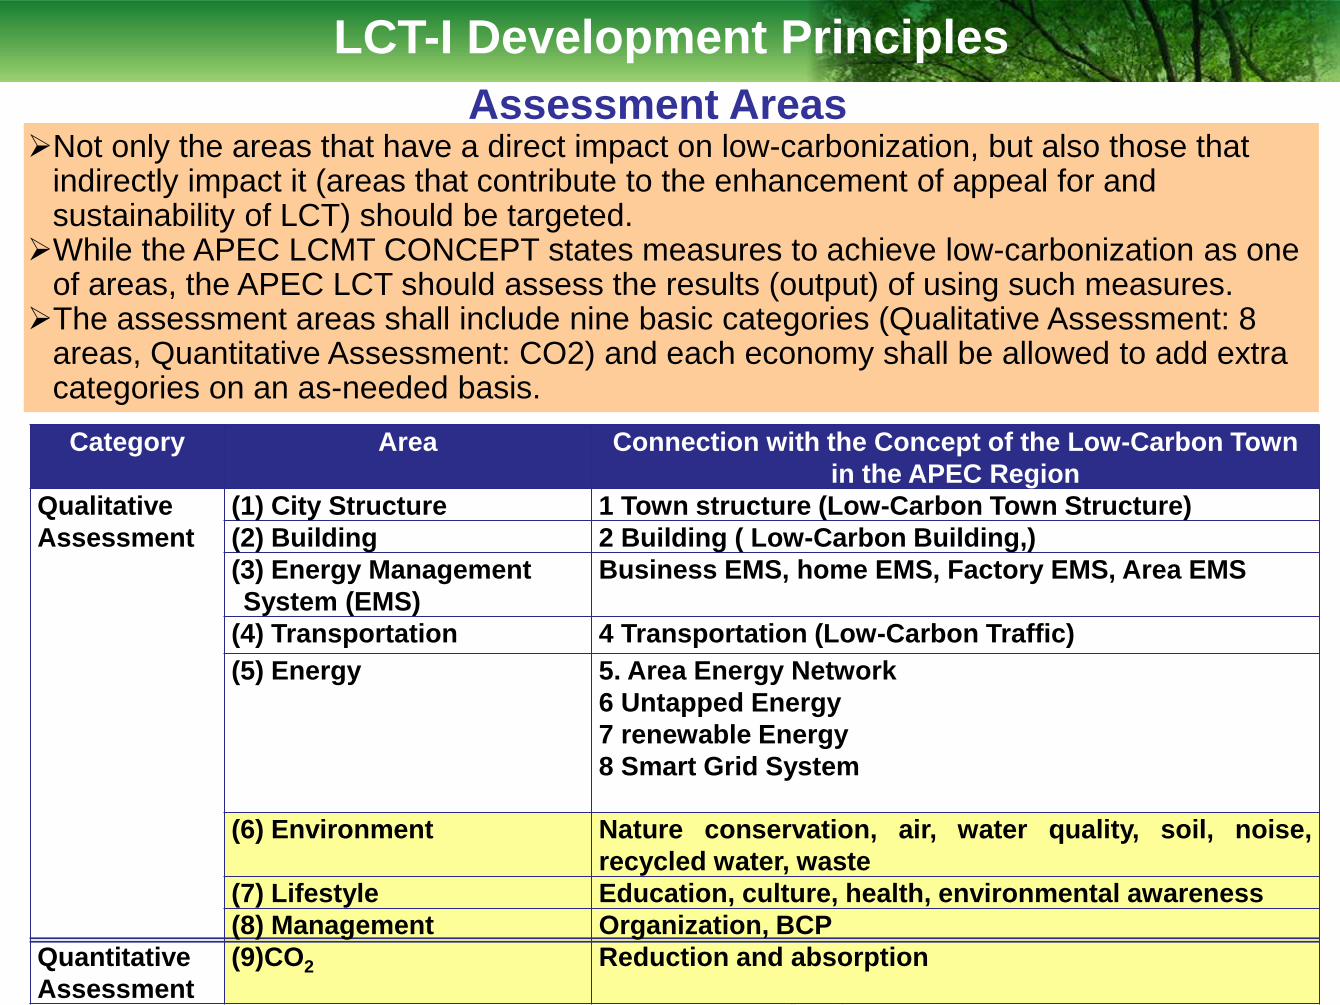
Not only the areas that have a direct impact on low-carbonization but also those that indirectly impact it (areas that contribute to the enhancement of appeal for and sustainability of LCT) should be targeted
While the APEC LCMT CONCEPT states measures to achieve low-carbonization as one of areas the APEC LCT should assess the results (output) of using such measures
The assessment areas shall include nine basic categories (Qualitative Assessment 8 areas Quantitative Assessment CO2) and each economy shall be allowed to add extra categories on an as-needed basis
Assessment Areas
LCT-I Development Principles
Category Area Connection with the Concept of the Low-Carbon Town
in the APEC Region
Qualitative
Assessment
(1) City Structure 1 Town structure (Low-Carbon Town Structure)
(2) Building 2 Building ( Low-Carbon Building)
(3) Energy Management
System (EMS)
Business EMS home EMS Factory EMS Area EMS
(4) Transportation 4 Transportation (Low-Carbon Traffic)
(5) Energy 5 Area Energy Network
6 Untapped Energy
7 renewable Energy
8 Smart Grid System
(6) Environment Nature conservation air water quality soil noise
recycled water waste
(7) Lifestyle Education culture health environmental awareness
(8) Management Organization BCP
Quantitative
Assessment
(9)CO2 Reduction and absorption
Set goals using a three-star scale ( to ) A numerical value for each of shall be set by each economy When the numerical values cannot be set reference values shall be provided in the
reference so that they can be used as reference For assessment results strive to visualize the overall assessment rank area
assessments (radar chart) and individual assessments
Assessment Method
LCT-I Development Principles
The lowest level that
must be achieved Economy level
(national goal) LCT Target Level
While the numerical value for each level can be set by each
economy (they will vary with the economy) each secretariat
should provide some reference values
Assessment Method Approach to assessment Criteria
LCT-I Development Principles
Assessment Method Output Image
LCT-I Development Principles
Assessment Indicators by Area (draft) 13
LCT-I Development Principles
Set required items which correspond to a city category by assessment area Use qualitative indicators ([1]ndash[8]) as much as possible Assessment criteria for each indicator shall be developed by a localcentral government
For economies without criteria standard values or assessment methods should be given in the Reference section
17
Assessment Indicators by Area (draft) 23
LCT-I Development Principles
18
Assessment Indicators by Area (draft) 33
LCT-I Development Principles
An assessment should be conducted under the leadership of a localcentral government Based on the assessment results develop and implement an improvement plan (what
how and by when) (PDCA) When in operation monitor progress on a regular basis (annually or once in a few years) The LCT-I of each district should be managed by each economy and APEC Report progress at an APEC meeting on a regular basis and give an LCT-I certification to
or commend the economies that are actively conducting the LCT-I process It is desirable to establish an incentive program such as provision of preferential project
assistance (or low interest rates) to award-winning municipalities by the World Bank
How to implement an LCT-I assessment system
LCT-I Development Principles
Kashiwanoha Campus (Chiba Japan) an established
well-known smart city
Sensitivity Analysis (case study)
1
Development around Kashiwa-no-ha Campus Station
Chiba University
Kashiwa-no-ha Park Park City Kashiwa-no-ha Campus ldquo2nd Townrdquo119000(880 units)(under construction)
ldquoDistrict 148rdquo
Site area 23344m2
Total floor 53277m2
Office Commercial
Hotel Rental residence(under construction
by 2014)
University of Tokyo
Park City Kashiwa-no-ha Campus ldquo1st Townrdquo
From 2009144000(997 units)
Kashiwa-no-ha Campus Railway
Station
Aerial photo of site combined with computer-generated images of District 148 and Park City 2nd Town
Tsukuba EX
KashiwanohaShopping mall
from 2006144500
(180 tenants)
Kashiwanoha Project is the most
comprehensive and complex Smart
City project in Japan but this Index
evaluates its specification of low
carbon planning and grasp its
performances to reduceCO2
Advantages of using LCT-I
Conclusion
Following characteristics of LCT-I can be considered as the advantages to utilize LCT-I in the APEC region
-Simple and easy to understand LCT development bull Use existing statistics data to make it intuitively easy to understand
the comprehensive and quantitative status of low carbon town development
-Reflect the circumstances of each economy and project characteristics
bull Take into account the economic conditions of each economy and project characteristics so as not to hamper sustainable growth
bull Easy to grasp a long-term trend in achievement level at each stage of conception planning construction and maintenance
-Reflect existing APEC LCMT Feasibility Study results existing assessment indicators and international trends
bull Reflect international trends such as smart infrastructure assessment standards (TC268) and OECD activities and combined use of such items is expected to be supported in the future
Issues for the next step
Conclusion
-Validation of assessment indicators in each assessment
area
-Setting of quantitative values for assessment standards
in each assessment area (with referring existing indexes)
-Provision of reference indicators and reference
calculation equations to economies without their own
assessment standards
-Sensitivity analysis of selected citiestowns
-Method of operation and method for awarding
incentives
-Method of combining it with smart infrastructure
standards (TC268)
Thank you for your attention
24
Annex
Study Flow
(2)Examination of management indicator system structure ① Examination of scope of management indicator system ② Examination of evaluation field and indicators ③ Examination of quantitative (or qualitative) evaluation method
(3)Sensitivity analysis of management indicators ① Selection of target cities for evaluation studies ② Execution of evaluation studies and sensitive analysis
(4)External activities for the creation of management indicators
(5)Preparation of report
(1)Examination of existing low carbon energy efficiency and smart city indicators
Background
bull Current conditions of global warming
bull Global increase in urban population and city development
projects
bull Energy issues incidental to urban population increase
bull Relationship between income level and urbanization
0
10
20
30
40
50
60
70
80
90
100
1980 1985 1990 1995 2000 2005 2010 2015 2020 2025 2030 2035 2040 2045 2050
都市化率
()
年
China
China Hong Kong SAR
Japan
Republic of Korea
Brunei Darussalam
Indonesia
Malaysia
Philippines
Singapore
Thailand
Viet Nam
Russian Federation
Mexico
Chile
Peru
Canada
United States of America
Australia
New Zealand
Papua New Guinea
Urbanization = urban population total population Urban population population residing in ldquocitiesrdquo as defined by national census Source United Nations ldquoWorld Urbanization Prospects the 2011 Revisionrdquo
Urbanization trends in APEC Economies
1 LEED-Neighborhood Development
(LEED-ND)
2 CASBEE for Urban Development
3 CASBEE for Cities
4 Urban Environmental Indicators (UEI)
(OECDGreen Cities programme)
5 Global City Indicators (GCI) (World
Bank)
6 Green City Index (GrCI)
7 Tianjin Eco City (Tianjin)
8 Smart City Indicators
9 Reference Framework for Sustainable
Cities (RFSC)
10European Initiative on Smart Cities
(EISC)
11J-CODE
12Tianjin Yujiapu CBD (Yujiapu))
28
Review of Existing Indicators
ltCity assessment systems collectedgt
ltCity assessment systems collectedgt - Scope of Assessment
- Target Area
- Assessment Purpose
- Assessment Approach
- Year of Creation
- Creator (country)
- Number of Assessment
Indicators
- Assessment Method
(quantitativequalitative)
- Participating parties
(Applicant and
AssessmentCertification
Agency)
- Required Statistical Data
- Purpose of Use
- Case Examples
- Complexity
- Applicability to different
regions or cities
- Alignment with international
trends (ISO etc)
29
Applicability of Existing Indicators
Ex) When What phase should be assessed
key goal indicators to manage a situational change between the beginning and the end of a project
key performance indicators that monitor progress in the planning and implementation of countermeasures
during the intermediary stages of the project that is in the planning construction and operational phases
Planning Achievement
control
Design Construction
LEED-ND
CASBBE for Urban Development
③CASBEE
Cities
④UEI
⑤GCI
⑥GrCI
⑦Tianjin
⑧Smart City
⑨RFSC
⑩EISC (NA)
⑪J-CODE
⑫Yujiapu
earlier latter
Understanding of status quo
④UEI
③CASBEE
-Cities
⑤GCI
A new framework which combines key
goal indicators and key performance
indicators is required
LCT-I
⑥GrCI
Key goal
indicators
Key goal
indicators
Key Performance Indicators
Categorization of existing indicators by applicable phase
Assess each of the following phases thorough understanding of the
actual conditions planning design construction and operation
30
Applicability of Existing Indicators
Ex) How How should the assessment be approached
The assessment process should be simple and easy to understand and should
reflect the circumstances of each economy project characteristics and
international trends
Applicability to cities that have different characteristics
Easy Difficult
Local
Global
Glo
ba
l Exp
an
dab
ility
Indicators that are globally expandable
and applicable to other cities
(1)LEED-ND
(2) CASBEE Urban
Development
(3)CASBEE Cities
(4)UEI
(5)GCI (6)GrCI
(7) Tianjin
(8) Smart City
(9)RFSC
(10)EISC (NA)
(11)J-CODE
(12) Yujiapu
31
Applicability of Existing Indicators
Key
Requirements
Desired LCT-I Form
1 2 3 4 5 6 7 8 9 10 11 12
LE
ED
-ND
CA
SB
EE
Urb
an
Develo
pm
ent
CA
SB
EE
Citie
s
Urb
an E
nviro
nm
enta
l
Indic
ato
rs
Glo
bal C
ity In
dic
ato
rs
Gre
en C
ity In
dex
Tia
njin
Eco C
ity
Sm
art C
ity In
dic
ato
r
Refe
rence F
ram
ew
ork
for S
usta
inable
Citie
s
Euro
pean In
itiativ
e o
n
Sm
art C
ities
J-C
OD
E
Tia
njin
Yujia
pu C
BD
1 WHY
Assessment
Purpose
Self-assessment and
growth management
by cities
C
E
xte
rna
l C
ertific
atio
n
C
Exte
rna
l C
ertific
atio
n
A
C
E
xte
rna
l A
ssessm
en
t
C
E
xte
rna
l A
ssessm
en
t
C
E
xte
rna
l A
ssessm
en
t
C
Top
-do
wn
m
an
ag
em
en
t
C
To
p-d
ow
n
ma
nag
em
en
t
B
G
uid
elin
es fo
r a
dm
inis
trato
rs
C
Te
ch
no
log
ica
l d
evelo
pm
ent
C
To
p-d
ow
n
ma
nag
em
en
t
A
2 WHO
Assessment
Body
Can be assessed by
municipal senior
management
C
B
usin
ess
Op
era
tor
C
Bu
sin
ess
Op
era
tor
A
C
Inte
rna
tion
al
Org
an
iza
tion
C
Inte
rna
tion
al
Org
an
iza
tion
C
Inte
rna
tion
al
Org
an
iza
tion
C
Ce
ntra
l G
ove
rnm
en
t
C
Ce
ntra
l G
ove
rnm
en
t
C
Inte
rna
tion
al
Org
an
iza
tion
C
Inte
rna
tion
al
Org
an
iza
tion
C
Ce
ntra
l G
ove
rnm
en
t
A
3 WHEN
Assessment
Timing
Capability of
diagnosing the actual
conditions
C C A A A A C C C C C C
Assessable in design
and planning phases A A C C C C A A A C A A
Assessable in
construction phase A A C C C C A A A C A A
Assessable in
operational phase C C A A A A C C C C C C
4 WHERE
Scope of
Assessment
Administrative
districts under the
jurisdiction of local
governments in the
APEC region
C
P
roje
ct A
rea
C
P
roje
ct A
rea
A
C
Me
tropolita
n A
rea
A
A
A
A
A
C
Industry
A
A
5 WHAT
Assessment
Area
KGIs should be
considered C C A A A B B B A C B B
Not only the areas that have a direct impact on low-carbonization but also those that indirectly impact it (areas that contribute to the enhancement of appeal for and sustainability of LCT) should be targeted
While the APEC LCMT CONCEPT states measures to achieve low-carbonization as one of areas the APEC LCT should assess the results (output) of using such measures
The assessment areas shall include nine basic categories (Qualitative Assessment 8 areas Quantitative Assessment CO2) and each economy shall be allowed to add extra categories on an as-needed basis
Assessment Areas
LCT-I Development Principles
[Reference] The Concept of the Low-Carbon town in the APEC Region
Demand
Side
Demand amp Supply
Supply
side
Low Carbon Town Structure Environment space development
Passive energy design amp equipmentReducingheat loads
1 Town Structure
2 Buildings
3Energy ManagementSystems (EMS)
4 Transportation
5 Area Energy Network
6 Untapped Energy
7 Renewable Energy
8 Smart Grid System
Transit Oriented Development
Low CarbonBuilding
Highly efficient equipment amp facilities
Area Energy Network
Home EMS Factory EMS
Untapped Energy
Low carbon Traffic Public transportationsystems
Low Carbon Vehiclesamp Facilities
Renewable Energy
District heating cooling
Using seariver water Using waste heat
Smart energy systemSmart Grid
Business EMS Area EMS
Trafficdemandmanagement
Additional category Environment eco life style organization and CO2 emission
+ α
Evaluation Structure of APEC LCT-I Partial List of Evaluation Categories
Category Evaluation Item Evaluation Index
Town Classification Evaluation Score
①
U-1
CBD
②
U-2
Commercial
③
U-3
Residential
④
Rural
②Architecture
Energy-saving Buildings Ratio of number of energy efficient
buildings in the area
Building Insulation PAL 1)
Energy Efficiency of Building Equipment ERB 2)
③EMS
Building and Area Energy Management
Existence of building EMS
implementation plan
Existence of home EMS implementation
plan
Existence of factory EMS implementation
plan
Existence of area EMS implementation
plan
④Transportation
Promotion of Public Transportation Public transportation mode share
Formation of Transport Hub Existence of more than 2 types of
transport hubs
Low-carbon Public Transportation
Existence of BRT or LRT implementation
plan
Existence of electric bus or natural gas
vehicle implementation plan
Low-carbon Vehicles Diffusion rate of EV and PHV
Transportation Demand Management Existence of car sharing or rental bike
system implementation plan
⑤Energy
District Heating and Cooling System
(DHC)
Ratio over total energy consumption
Renewable Energy Ratio over total energy consumption
Untapped Energy Ratio over total energy consumption
Smart Grid Existence of smart grid implementation
plan
1) PAL Perimeter Annual Load
2) ERB Energy Reduction Rate of Building Equipment
[Structure of Evaluation]
Assessments are performed on individual categories and overall
performance
Assessment results are expressed in 3-scale rating systems ie
(overall) and 1-3 point (category)
Evaluation criteria for each category can be set by individual economies
Score of individual category is calculated based on the aggregate
performance of sub-items overall score of the LCT is the average score
of individual categories
Evaluation Structure of APEC LCT-I
Overall Score
17
CO2 reduction
470 t-co2year
①urban structure
③EMS
④transportation ⑤energy
⑥environment
⑦eco life style
⑧organization
Standard level for economy
Ideal level for economy
Minimum level for economy
②architecture
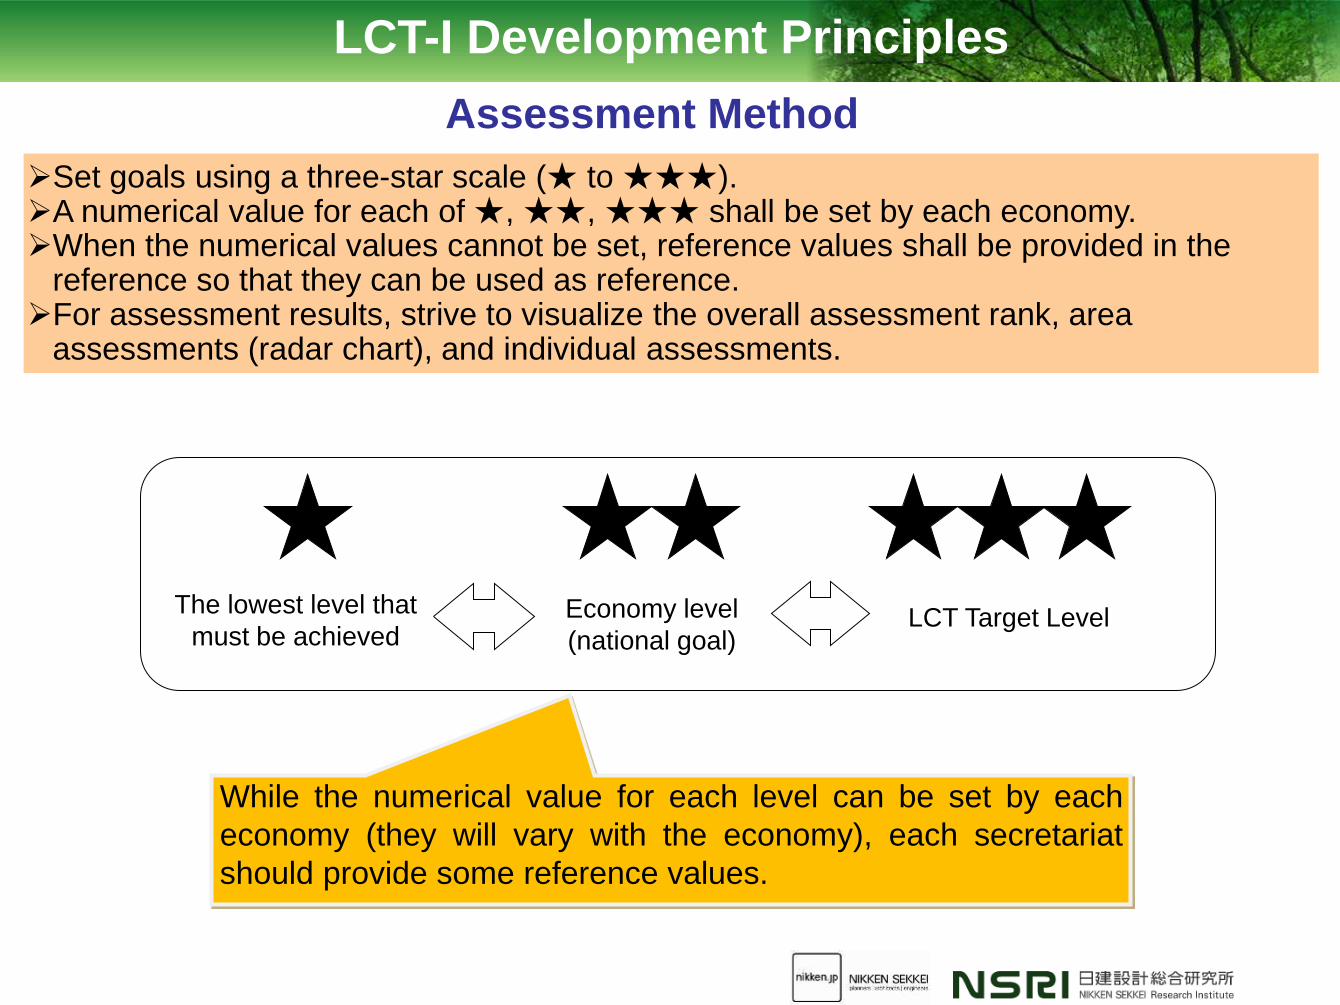
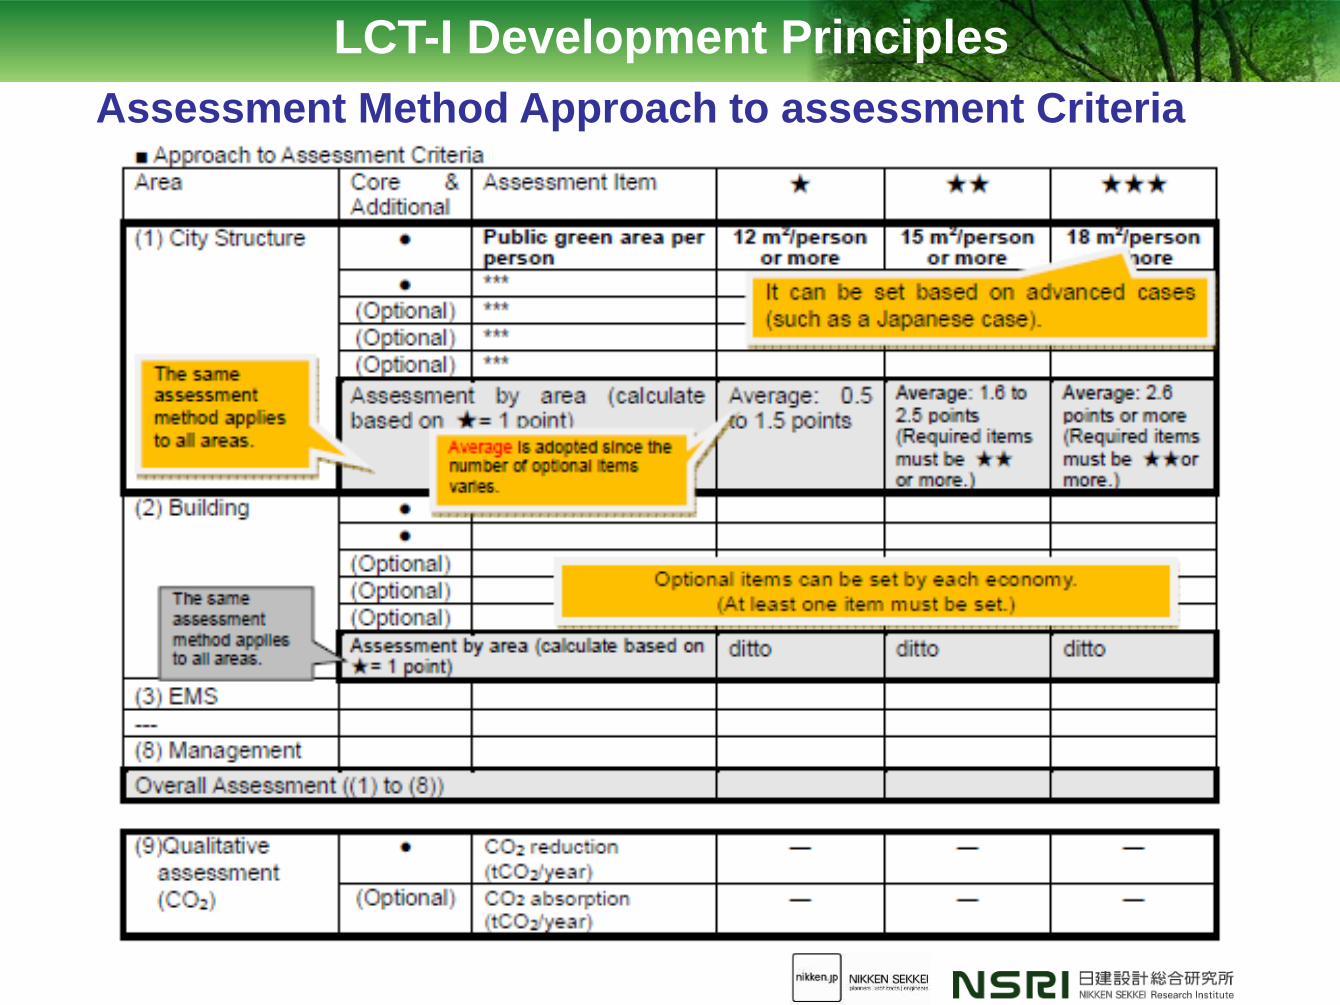
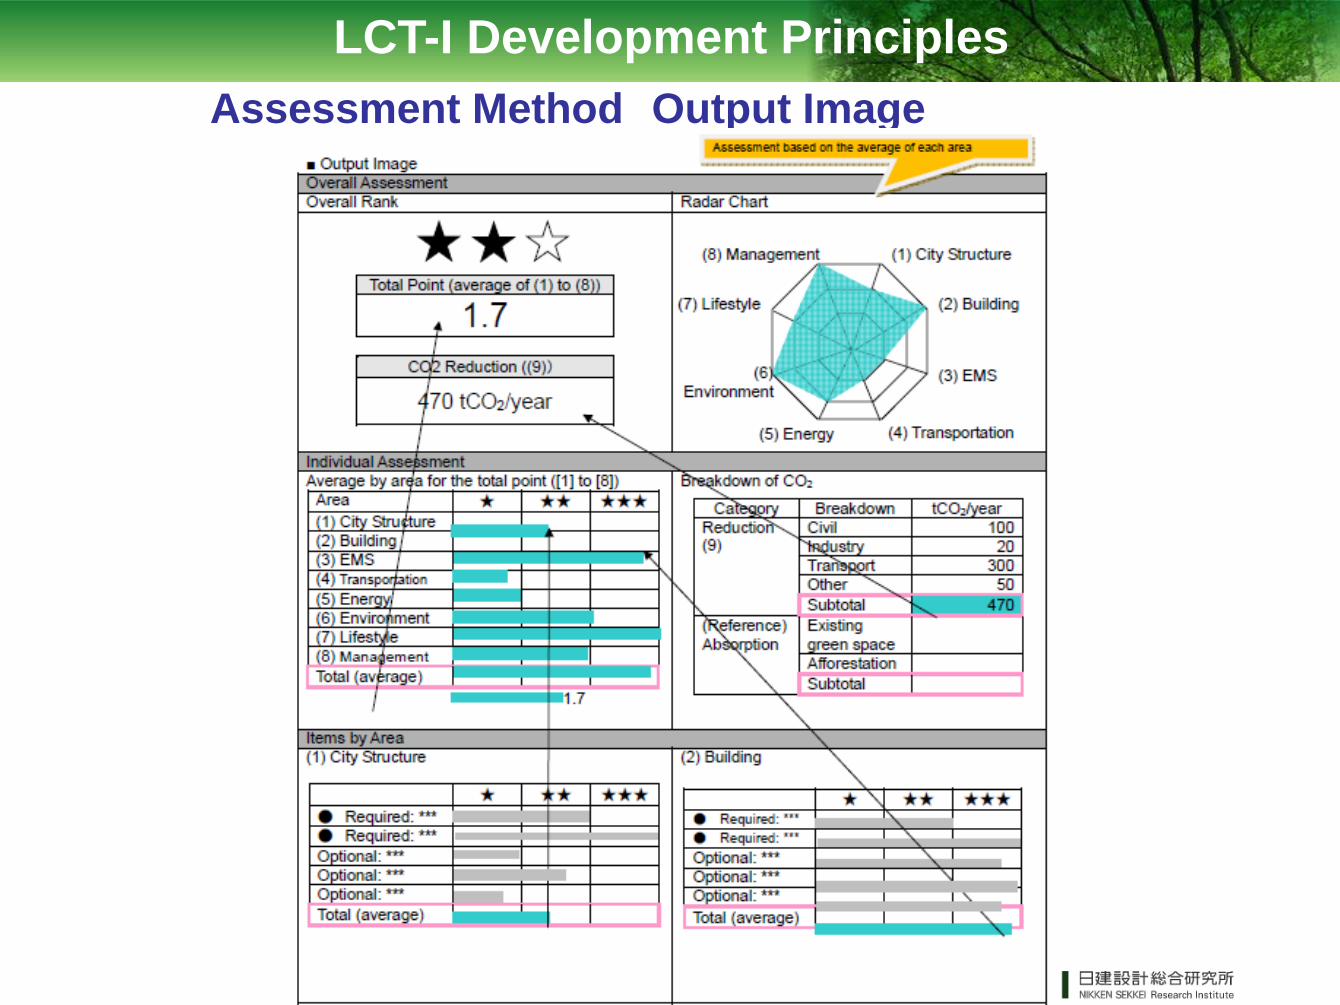
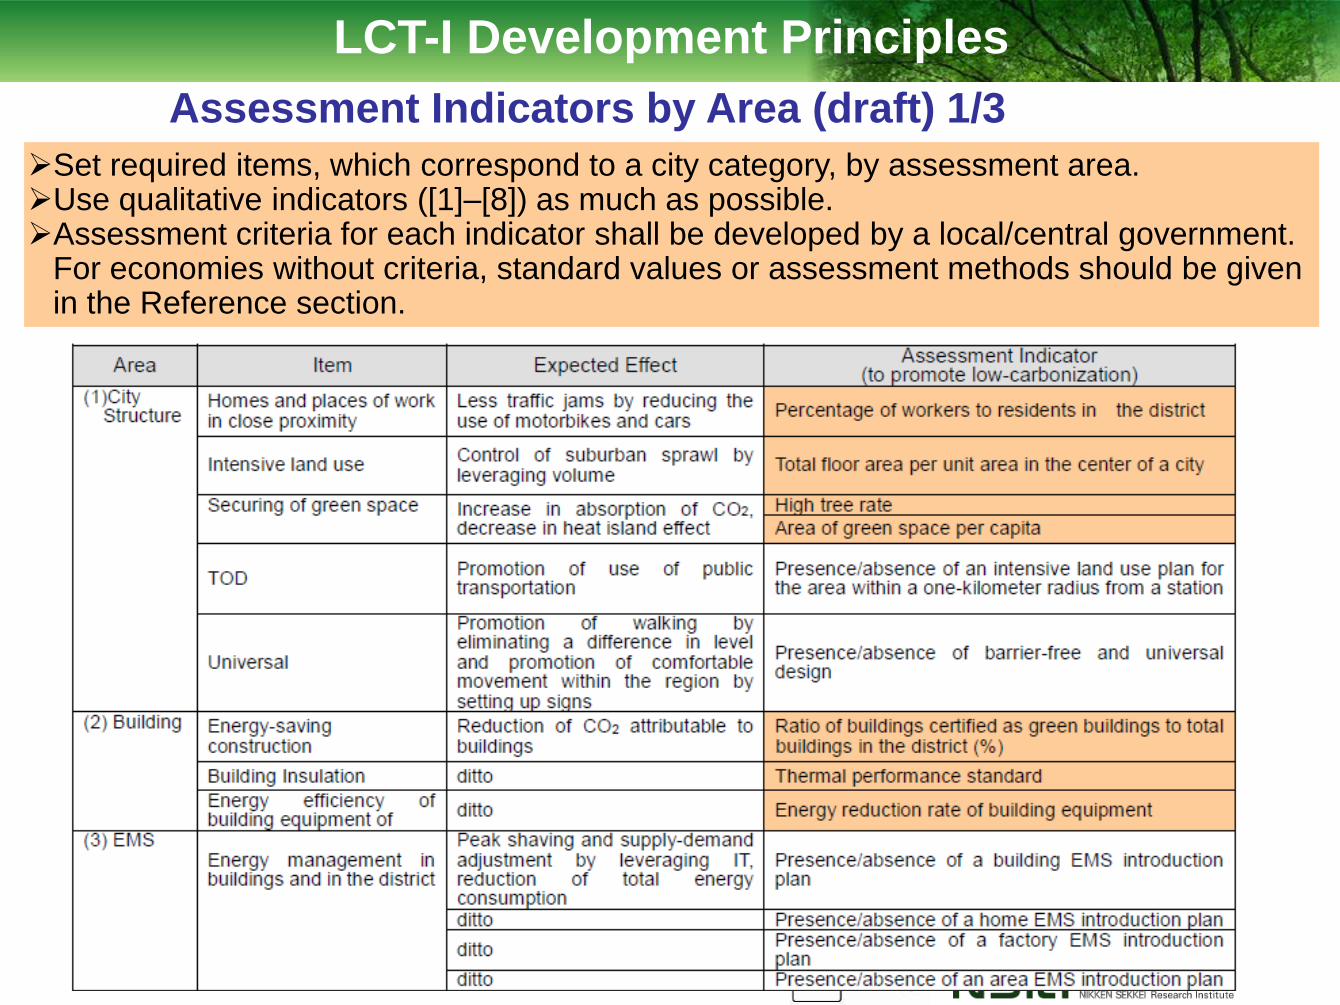
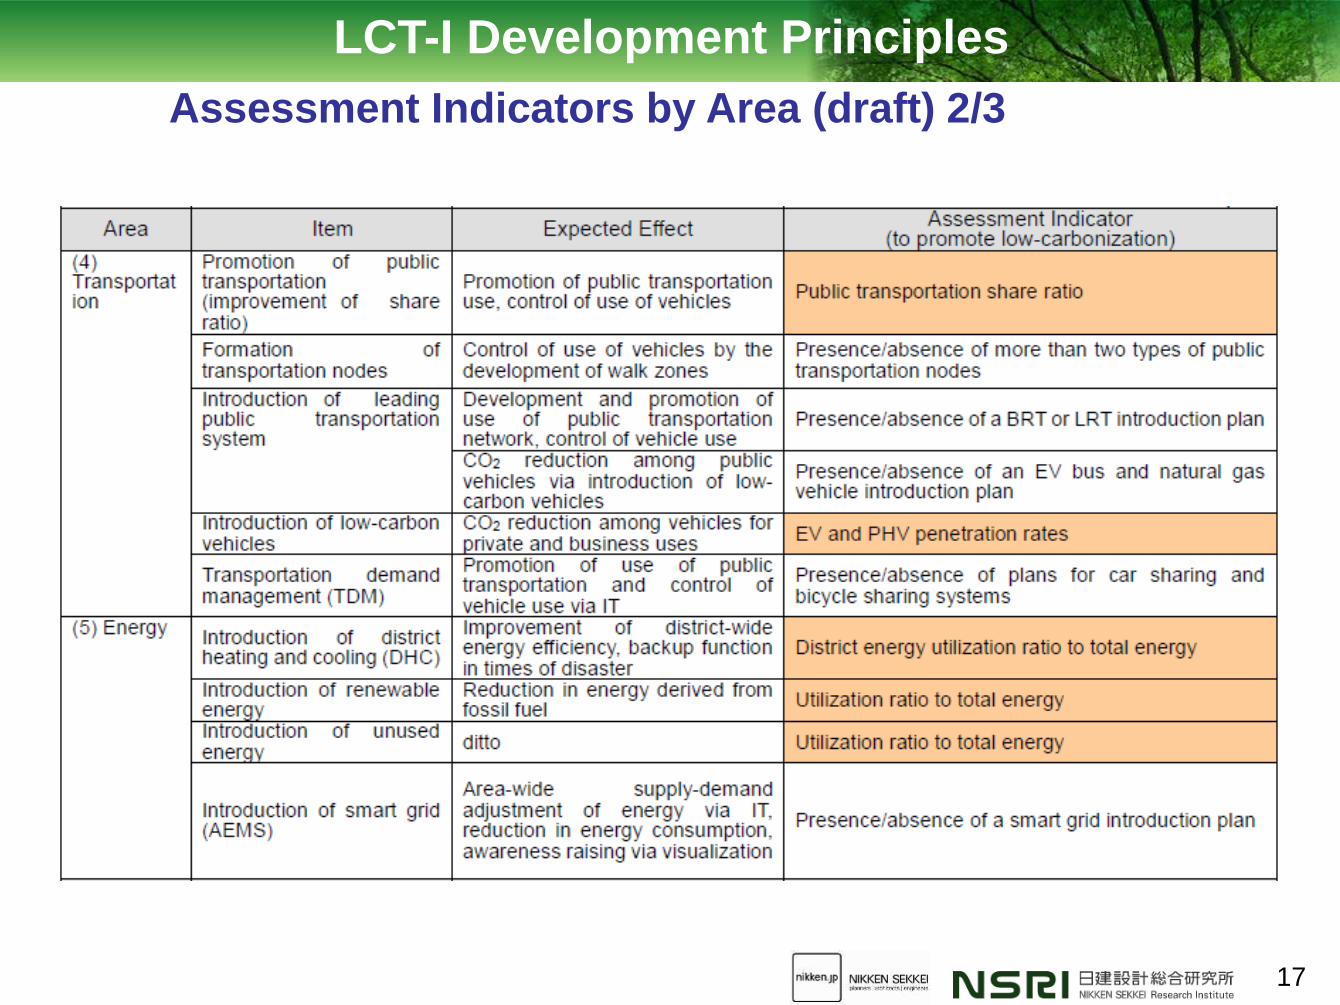
17
Assessment Indicators by Area (draft) 23
LCT-I Development Principles
18
Assessment Indicators by Area (draft) 33
LCT-I Development Principles
An assessment should be conducted under the leadership of a localcentral government Based on the assessment results develop and implement an improvement plan (what
how and by when) (PDCA) When in operation monitor progress on a regular basis (annually or once in a few years) The LCT-I of each district should be managed by each economy and APEC Report progress at an APEC meeting on a regular basis and give an LCT-I certification to
or commend the economies that are actively conducting the LCT-I process It is desirable to establish an incentive program such as provision of preferential project
assistance (or low interest rates) to award-winning municipalities by the World Bank
How to implement an LCT-I assessment system
LCT-I Development Principles
Kashiwanoha Campus (Chiba Japan) an established
well-known smart city
Sensitivity Analysis (case study)
1
Development around Kashiwa-no-ha Campus Station
Chiba University
Kashiwa-no-ha Park Park City Kashiwa-no-ha Campus ldquo2nd Townrdquo119000(880 units)(under construction)
ldquoDistrict 148rdquo
Site area 23344m2
Total floor 53277m2
Office Commercial
Hotel Rental residence(under construction
by 2014)
University of Tokyo
Park City Kashiwa-no-ha Campus ldquo1st Townrdquo
From 2009144000(997 units)
Kashiwa-no-ha Campus Railway
Station
Aerial photo of site combined with computer-generated images of District 148 and Park City 2nd Town
Tsukuba EX
KashiwanohaShopping mall
from 2006144500
(180 tenants)
Kashiwanoha Project is the most
comprehensive and complex Smart
City project in Japan but this Index
evaluates its specification of low
carbon planning and grasp its
performances to reduceCO2
Advantages of using LCT-I
Conclusion
Following characteristics of LCT-I can be considered as the advantages to utilize LCT-I in the APEC region
-Simple and easy to understand LCT development bull Use existing statistics data to make it intuitively easy to understand
the comprehensive and quantitative status of low carbon town development
-Reflect the circumstances of each economy and project characteristics
bull Take into account the economic conditions of each economy and project characteristics so as not to hamper sustainable growth
bull Easy to grasp a long-term trend in achievement level at each stage of conception planning construction and maintenance
-Reflect existing APEC LCMT Feasibility Study results existing assessment indicators and international trends
bull Reflect international trends such as smart infrastructure assessment standards (TC268) and OECD activities and combined use of such items is expected to be supported in the future
Issues for the next step
Conclusion
-Validation of assessment indicators in each assessment
area
-Setting of quantitative values for assessment standards
in each assessment area (with referring existing indexes)
-Provision of reference indicators and reference
calculation equations to economies without their own
assessment standards
-Sensitivity analysis of selected citiestowns
-Method of operation and method for awarding
incentives
-Method of combining it with smart infrastructure
standards (TC268)
Thank you for your attention
24
Annex
Study Flow
(2)Examination of management indicator system structure ① Examination of scope of management indicator system ② Examination of evaluation field and indicators ③ Examination of quantitative (or qualitative) evaluation method
(3)Sensitivity analysis of management indicators ① Selection of target cities for evaluation studies ② Execution of evaluation studies and sensitive analysis
(4)External activities for the creation of management indicators
(5)Preparation of report
(1)Examination of existing low carbon energy efficiency and smart city indicators
Background
bull Current conditions of global warming
bull Global increase in urban population and city development
projects
bull Energy issues incidental to urban population increase
bull Relationship between income level and urbanization
0
10
20
30
40
50
60
70
80
90
100
1980 1985 1990 1995 2000 2005 2010 2015 2020 2025 2030 2035 2040 2045 2050
都市化率
()
年
China
China Hong Kong SAR
Japan
Republic of Korea
Brunei Darussalam
Indonesia
Malaysia
Philippines
Singapore
Thailand
Viet Nam
Russian Federation
Mexico
Chile
Peru
Canada
United States of America
Australia
New Zealand
Papua New Guinea
Urbanization = urban population total population Urban population population residing in ldquocitiesrdquo as defined by national census Source United Nations ldquoWorld Urbanization Prospects the 2011 Revisionrdquo
Urbanization trends in APEC Economies
1 LEED-Neighborhood Development
(LEED-ND)
2 CASBEE for Urban Development
3 CASBEE for Cities
4 Urban Environmental Indicators (UEI)
(OECDGreen Cities programme)
5 Global City Indicators (GCI) (World
Bank)
6 Green City Index (GrCI)
7 Tianjin Eco City (Tianjin)
8 Smart City Indicators
9 Reference Framework for Sustainable
Cities (RFSC)
10European Initiative on Smart Cities
(EISC)
11J-CODE
12Tianjin Yujiapu CBD (Yujiapu))
28
Review of Existing Indicators
ltCity assessment systems collectedgt
ltCity assessment systems collectedgt - Scope of Assessment
- Target Area
- Assessment Purpose
- Assessment Approach
- Year of Creation
- Creator (country)
- Number of Assessment
Indicators
- Assessment Method
(quantitativequalitative)
- Participating parties
(Applicant and
AssessmentCertification
Agency)
- Required Statistical Data
- Purpose of Use
- Case Examples
- Complexity
- Applicability to different
regions or cities
- Alignment with international
trends (ISO etc)
29
Applicability of Existing Indicators
Ex) When What phase should be assessed
key goal indicators to manage a situational change between the beginning and the end of a project
key performance indicators that monitor progress in the planning and implementation of countermeasures
during the intermediary stages of the project that is in the planning construction and operational phases
Planning Achievement
control
Design Construction
LEED-ND
CASBBE for Urban Development
③CASBEE
Cities
④UEI
⑤GCI
⑥GrCI
⑦Tianjin
⑧Smart City
⑨RFSC
⑩EISC (NA)
⑪J-CODE
⑫Yujiapu
earlier latter
Understanding of status quo
④UEI
③CASBEE
-Cities
⑤GCI
A new framework which combines key
goal indicators and key performance
indicators is required
LCT-I
⑥GrCI
Key goal
indicators
Key goal
indicators
Key Performance Indicators
Categorization of existing indicators by applicable phase
Assess each of the following phases thorough understanding of the
actual conditions planning design construction and operation
30
Applicability of Existing Indicators
Ex) How How should the assessment be approached
The assessment process should be simple and easy to understand and should
reflect the circumstances of each economy project characteristics and
international trends
Applicability to cities that have different characteristics
Easy Difficult
Local
Global
Glo
ba
l Exp
an
dab
ility
Indicators that are globally expandable
and applicable to other cities
(1)LEED-ND
(2) CASBEE Urban
Development
(3)CASBEE Cities
(4)UEI
(5)GCI (6)GrCI
(7) Tianjin
(8) Smart City
(9)RFSC
(10)EISC (NA)
(11)J-CODE
(12) Yujiapu
31
Applicability of Existing Indicators
Key
Requirements
Desired LCT-I Form
1 2 3 4 5 6 7 8 9 10 11 12
LE
ED
-ND
CA
SB
EE
Urb
an
Develo
pm
ent
CA
SB
EE
Citie
s
Urb
an E
nviro
nm
enta
l
Indic
ato
rs
Glo
bal C
ity In
dic
ato
rs
Gre
en C
ity In
dex
Tia
njin
Eco C
ity
Sm
art C
ity In
dic
ato
r
Refe
rence F
ram
ew
ork
for S
usta
inable
Citie
s
Euro
pean In
itiativ
e o
n
Sm
art C
ities
J-C
OD
E
Tia
njin
Yujia
pu C
BD
1 WHY
Assessment
Purpose
Self-assessment and
growth management
by cities
C
E
xte
rna
l C
ertific
atio
n
C
Exte
rna
l C
ertific
atio
n
A
C
E
xte
rna
l A
ssessm
en
t
C
E
xte
rna
l A
ssessm
en
t
C
E
xte
rna
l A
ssessm
en
t
C
Top
-do
wn
m
an
ag
em
en
t
C
To
p-d
ow
n
ma
nag
em
en
t
B
G
uid
elin
es fo
r a
dm
inis
trato
rs
C
Te
ch
no
log
ica
l d
evelo
pm
ent
C
To
p-d
ow
n
ma
nag
em
en
t
A
2 WHO
Assessment
Body
Can be assessed by
municipal senior
management
C
B
usin
ess
Op
era
tor
C
Bu
sin
ess
Op
era
tor
A
C
Inte
rna
tion
al
Org
an
iza
tion
C
Inte
rna
tion
al
Org
an
iza
tion
C
Inte
rna
tion
al
Org
an
iza
tion
C
Ce
ntra
l G
ove
rnm
en
t
C
Ce
ntra
l G
ove
rnm
en
t
C
Inte
rna
tion
al
Org
an
iza
tion
C
Inte
rna
tion
al
Org
an
iza
tion
C
Ce
ntra
l G
ove
rnm
en
t
A
3 WHEN
Assessment
Timing
Capability of
diagnosing the actual
conditions
C C A A A A C C C C C C
Assessable in design
and planning phases A A C C C C A A A C A A
Assessable in
construction phase A A C C C C A A A C A A
Assessable in
operational phase C C A A A A C C C C C C
4 WHERE
Scope of
Assessment
Administrative
districts under the
jurisdiction of local
governments in the
APEC region
C
P
roje
ct A
rea
C
P
roje
ct A
rea
A
C
Me
tropolita
n A
rea
A
A
A
A
A
C
Industry
A
A
5 WHAT
Assessment
Area
KGIs should be
considered C C A A A B B B A C B B
Not only the areas that have a direct impact on low-carbonization but also those that indirectly impact it (areas that contribute to the enhancement of appeal for and sustainability of LCT) should be targeted
While the APEC LCMT CONCEPT states measures to achieve low-carbonization as one of areas the APEC LCT should assess the results (output) of using such measures
The assessment areas shall include nine basic categories (Qualitative Assessment 8 areas Quantitative Assessment CO2) and each economy shall be allowed to add extra categories on an as-needed basis
Assessment Areas
LCT-I Development Principles
[Reference] The Concept of the Low-Carbon town in the APEC Region
Demand
Side
Demand amp Supply
Supply
side
Low Carbon Town Structure Environment space development
Passive energy design amp equipmentReducingheat loads
1 Town Structure
2 Buildings
3Energy ManagementSystems (EMS)
4 Transportation
5 Area Energy Network
6 Untapped Energy
7 Renewable Energy
8 Smart Grid System
Transit Oriented Development
Low CarbonBuilding
Highly efficient equipment amp facilities
Area Energy Network
Home EMS Factory EMS
Untapped Energy
Low carbon Traffic Public transportationsystems
Low Carbon Vehiclesamp Facilities
Renewable Energy
District heating cooling
Using seariver water Using waste heat
Smart energy systemSmart Grid
Business EMS Area EMS
Trafficdemandmanagement
Additional category Environment eco life style organization and CO2 emission
+ α
Evaluation Structure of APEC LCT-I Partial List of Evaluation Categories
Category Evaluation Item Evaluation Index
Town Classification Evaluation Score
①
U-1
CBD
②
U-2
Commercial
③
U-3
Residential
④
Rural
②Architecture
Energy-saving Buildings Ratio of number of energy efficient
buildings in the area
Building Insulation PAL 1)
Energy Efficiency of Building Equipment ERB 2)
③EMS
Building and Area Energy Management
Existence of building EMS
implementation plan
Existence of home EMS implementation
plan
Existence of factory EMS implementation
plan
Existence of area EMS implementation
plan
④Transportation
Promotion of Public Transportation Public transportation mode share
Formation of Transport Hub Existence of more than 2 types of
transport hubs
Low-carbon Public Transportation
Existence of BRT or LRT implementation
plan
Existence of electric bus or natural gas
vehicle implementation plan
Low-carbon Vehicles Diffusion rate of EV and PHV
Transportation Demand Management Existence of car sharing or rental bike
system implementation plan
⑤Energy
District Heating and Cooling System
(DHC)
Ratio over total energy consumption
Renewable Energy Ratio over total energy consumption
Untapped Energy Ratio over total energy consumption
Smart Grid Existence of smart grid implementation
plan
1) PAL Perimeter Annual Load
2) ERB Energy Reduction Rate of Building Equipment
[Structure of Evaluation]
Assessments are performed on individual categories and overall
performance
Assessment results are expressed in 3-scale rating systems ie
(overall) and 1-3 point (category)
Evaluation criteria for each category can be set by individual economies
Score of individual category is calculated based on the aggregate
performance of sub-items overall score of the LCT is the average score
of individual categories
Evaluation Structure of APEC LCT-I
Overall Score
17
CO2 reduction
470 t-co2year
①urban structure
③EMS
④transportation ⑤energy
⑥environment
⑦eco life style
⑧organization
Standard level for economy
Ideal level for economy
Minimum level for economy
②architecture
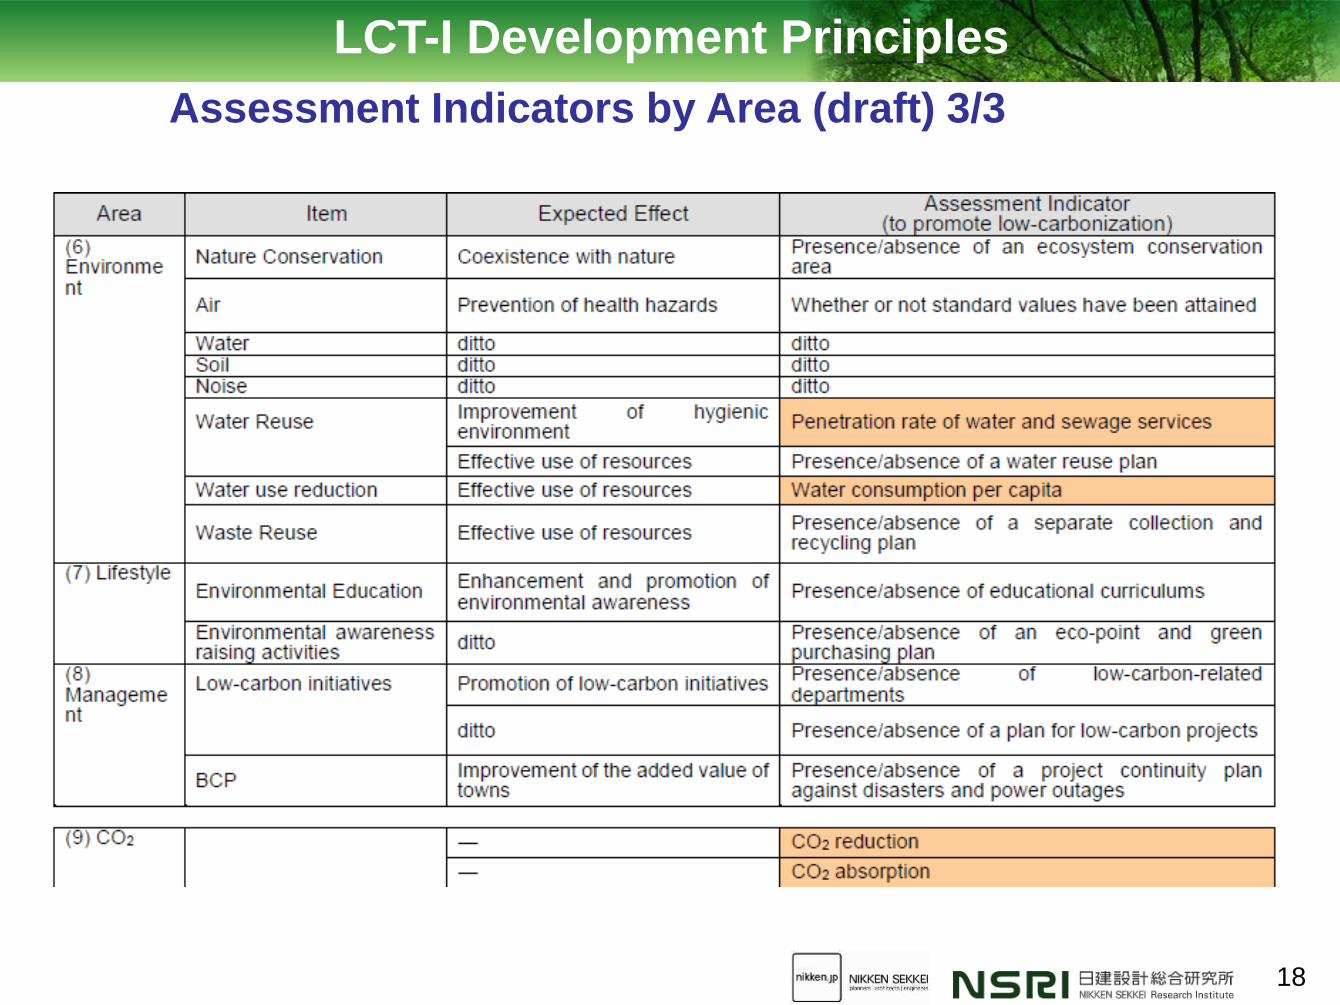
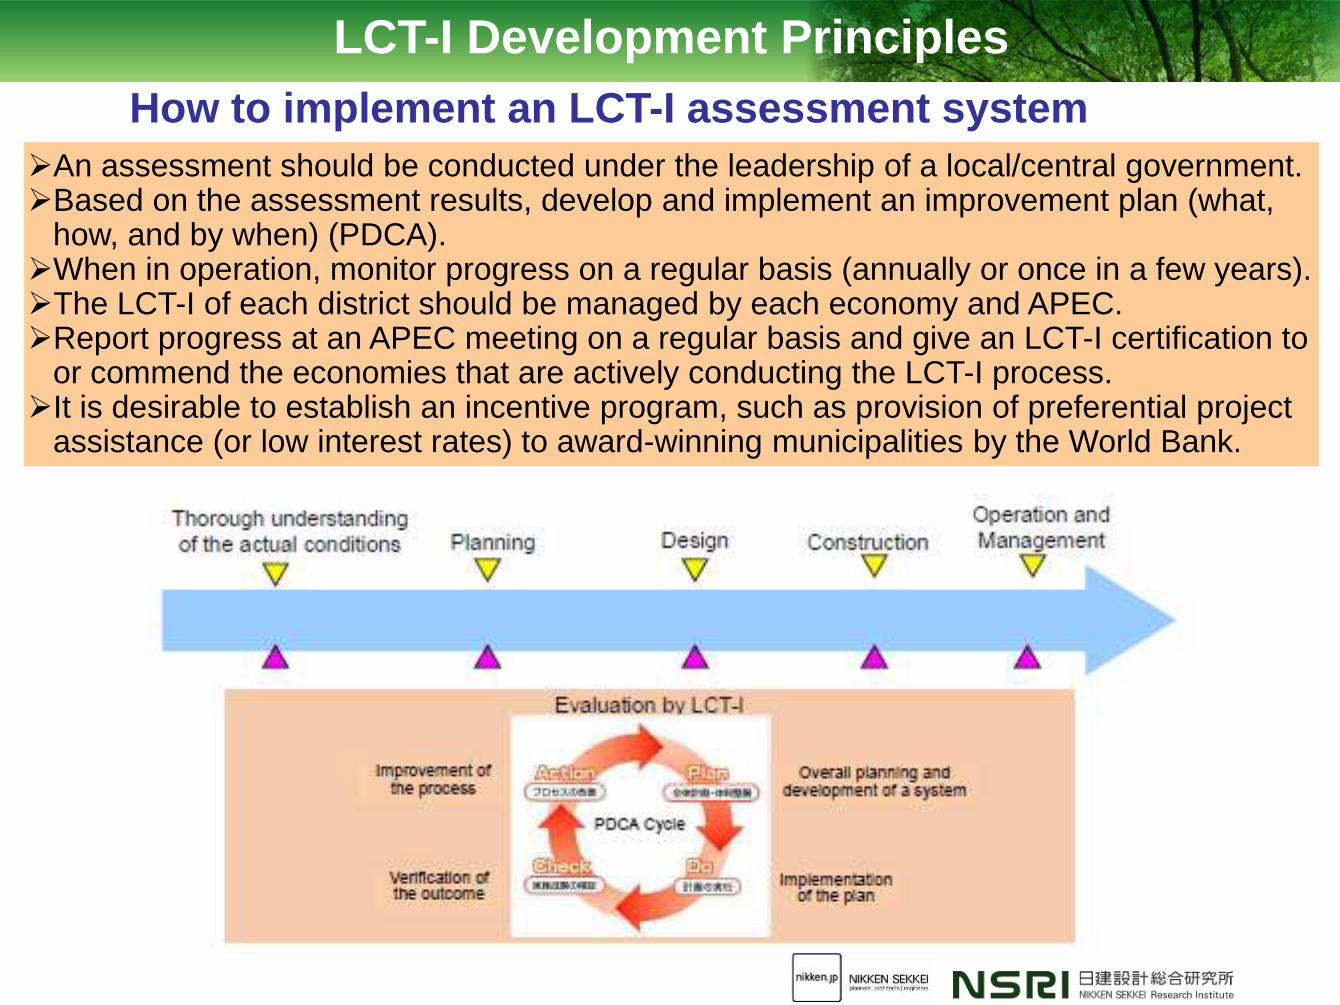
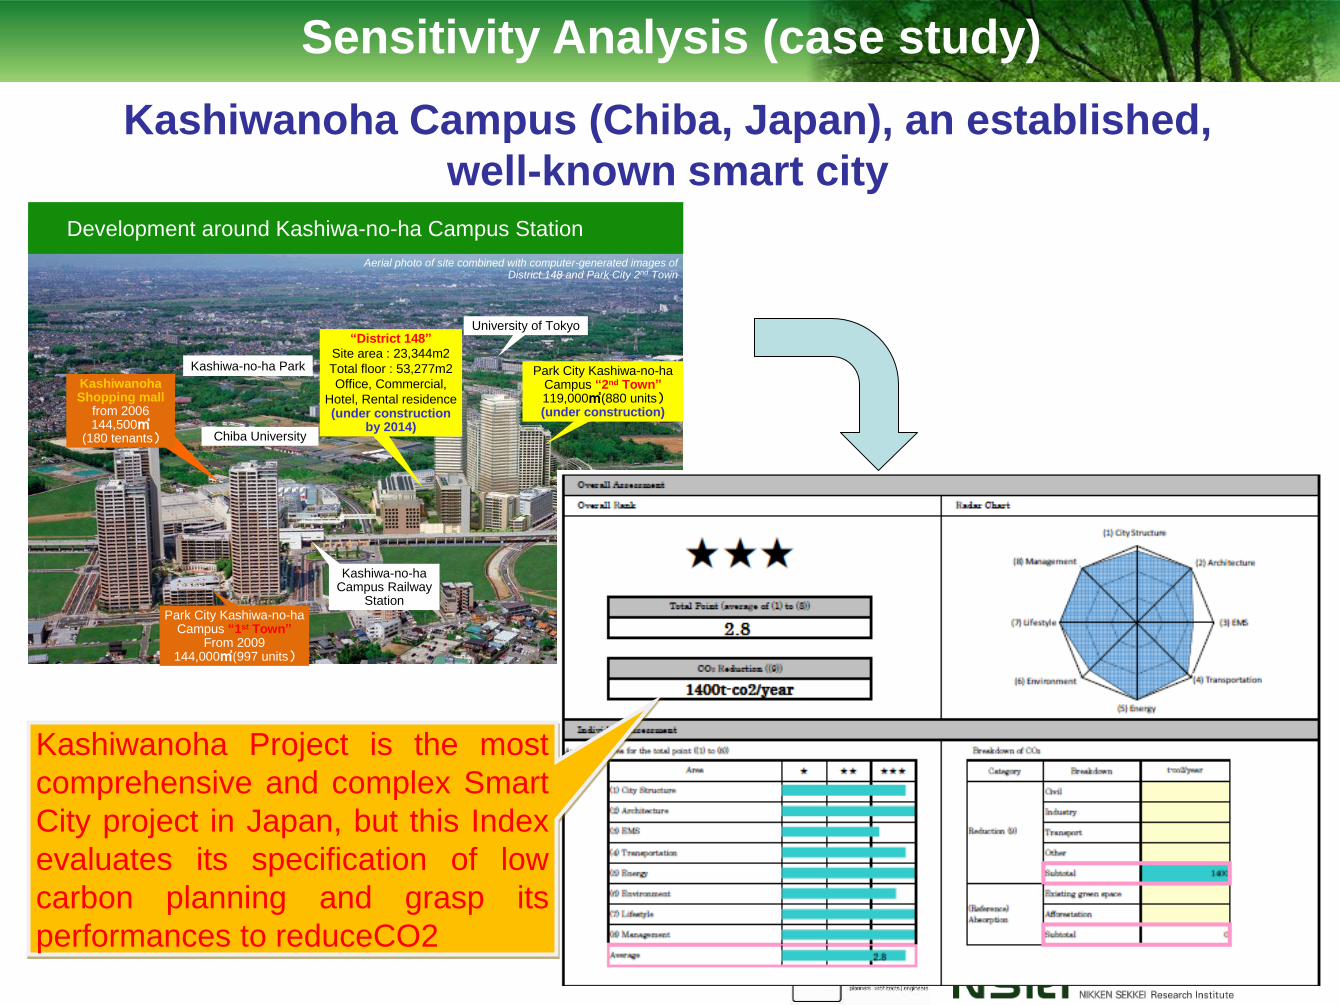
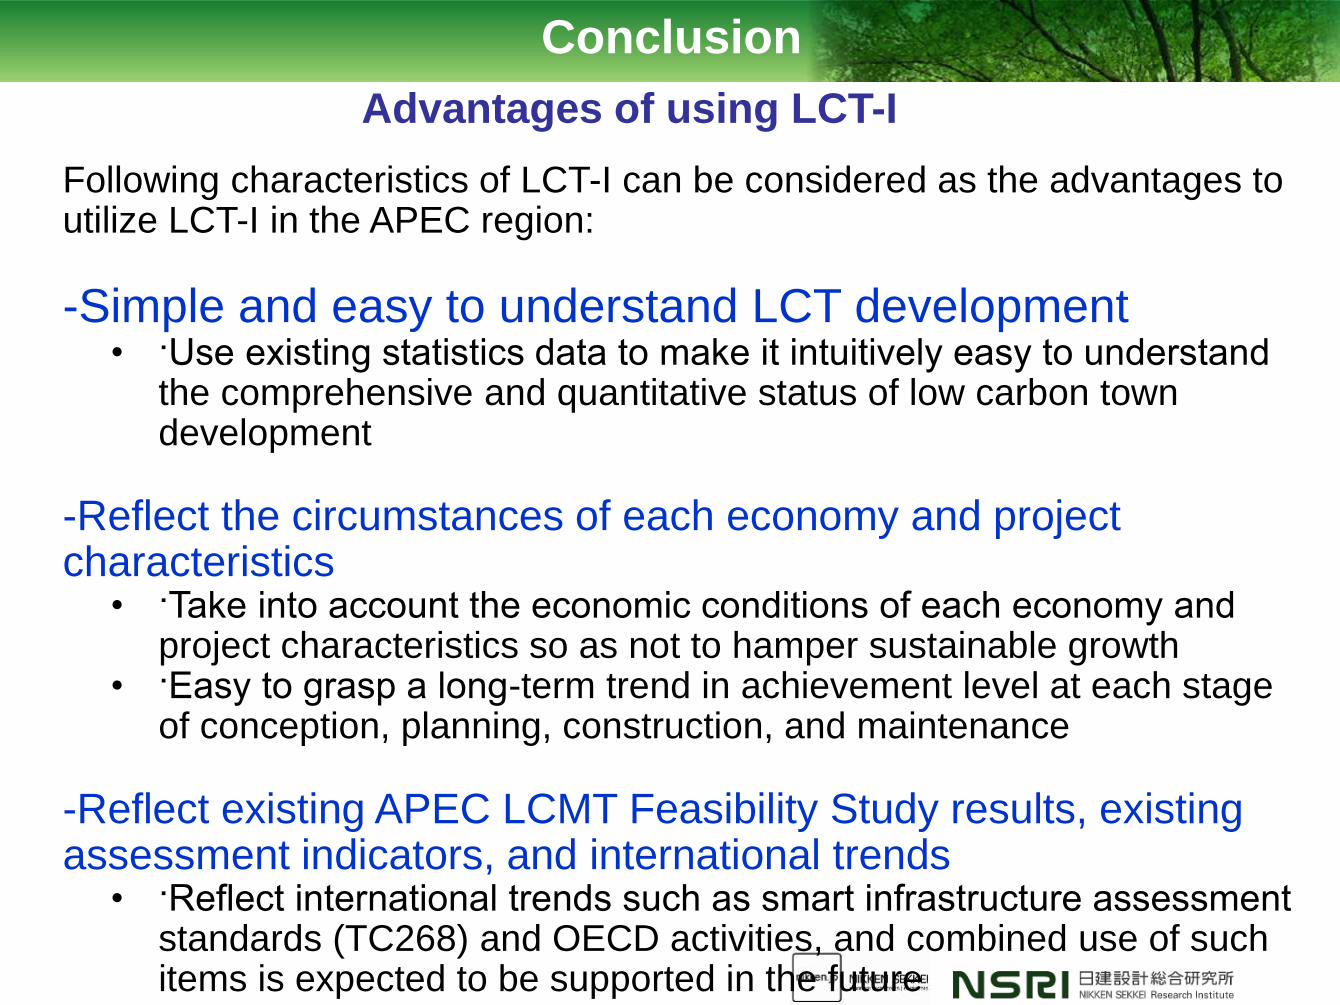
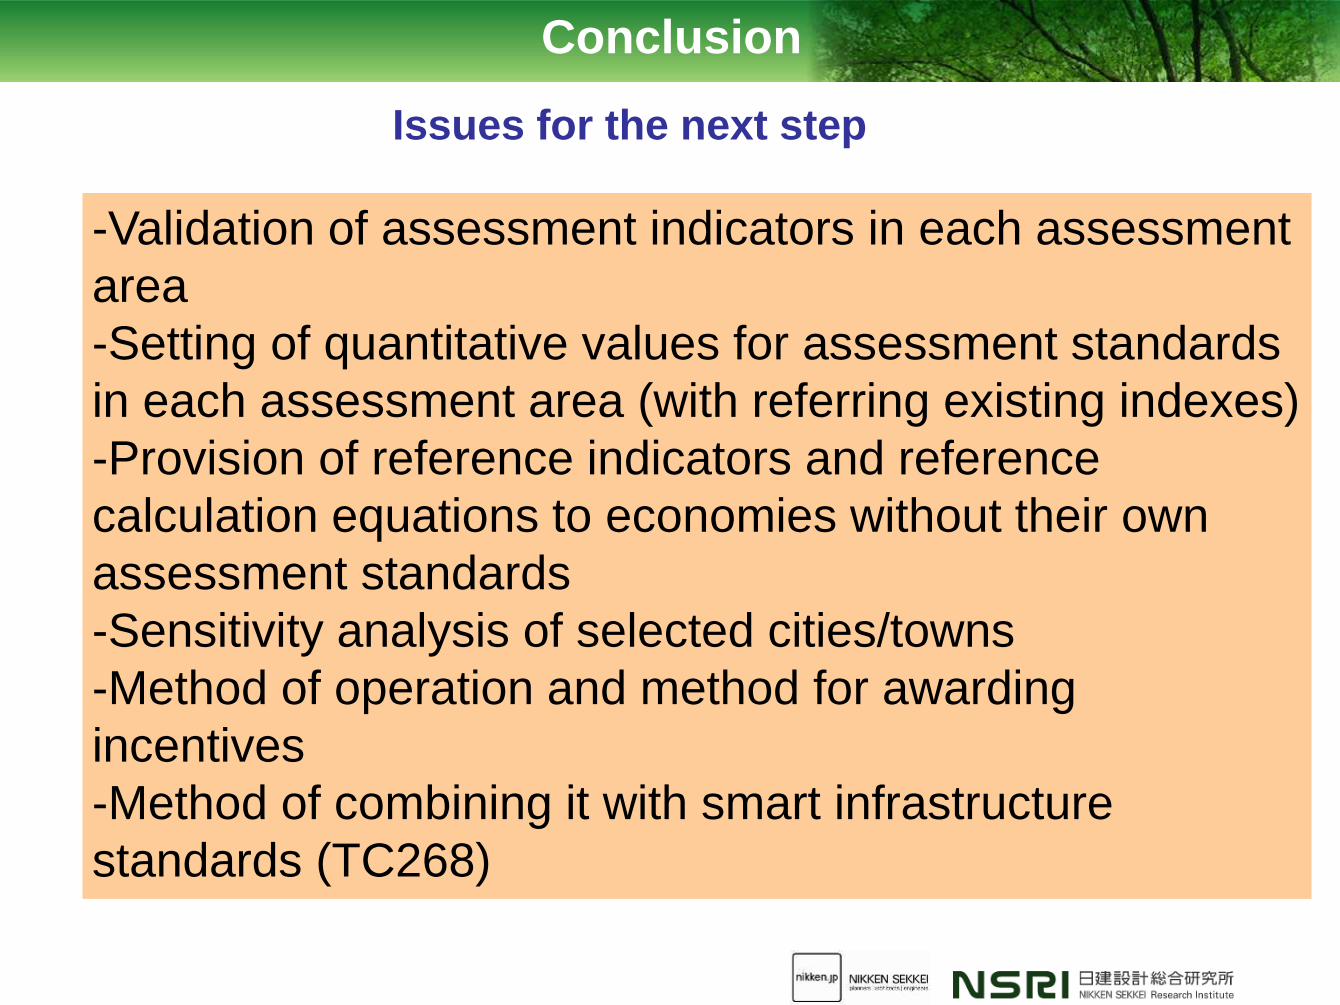
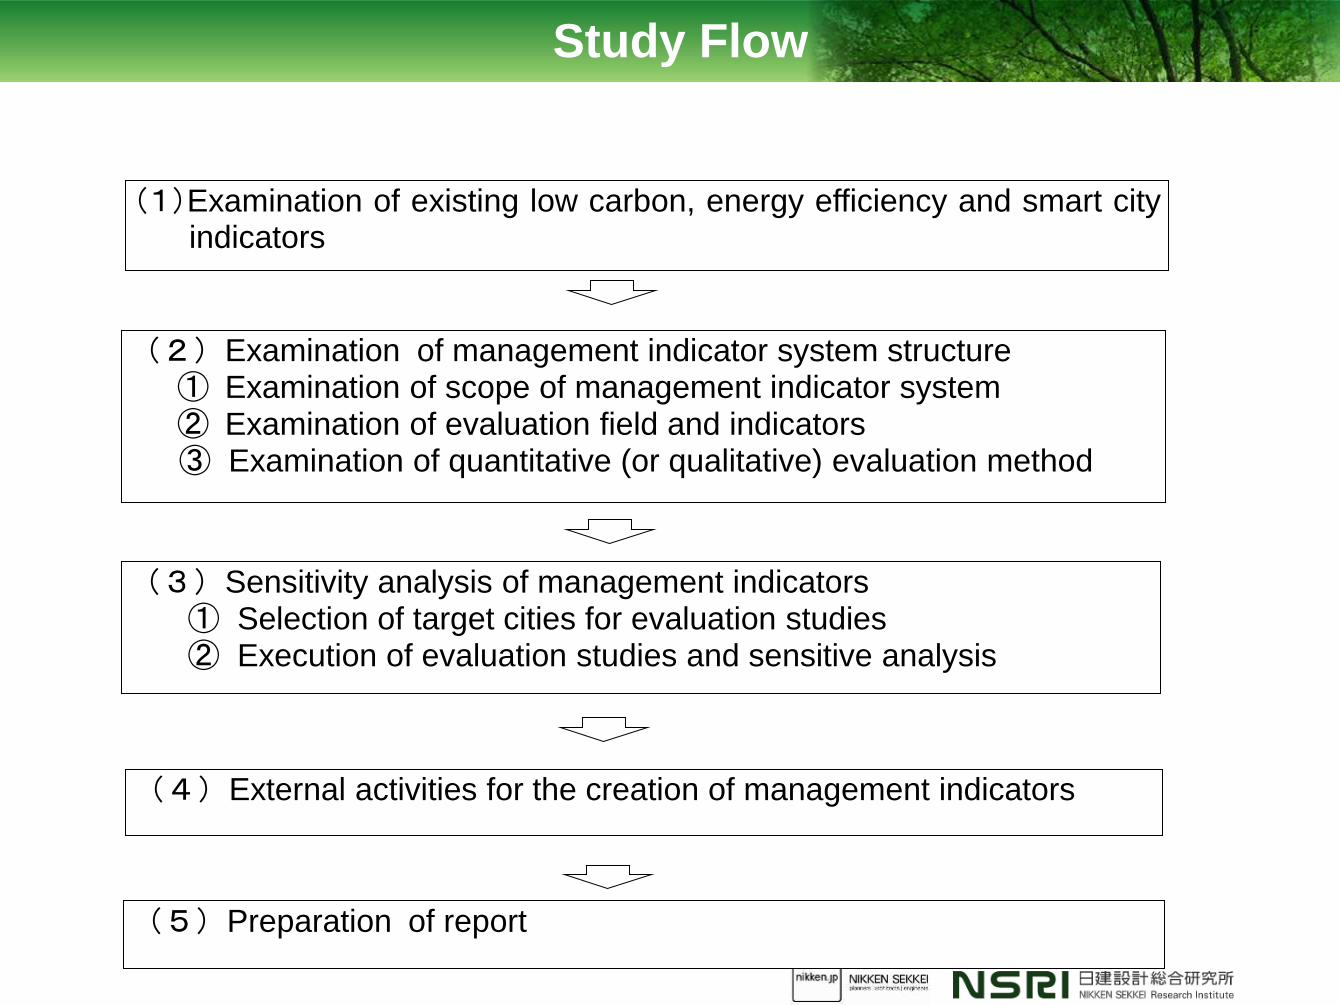
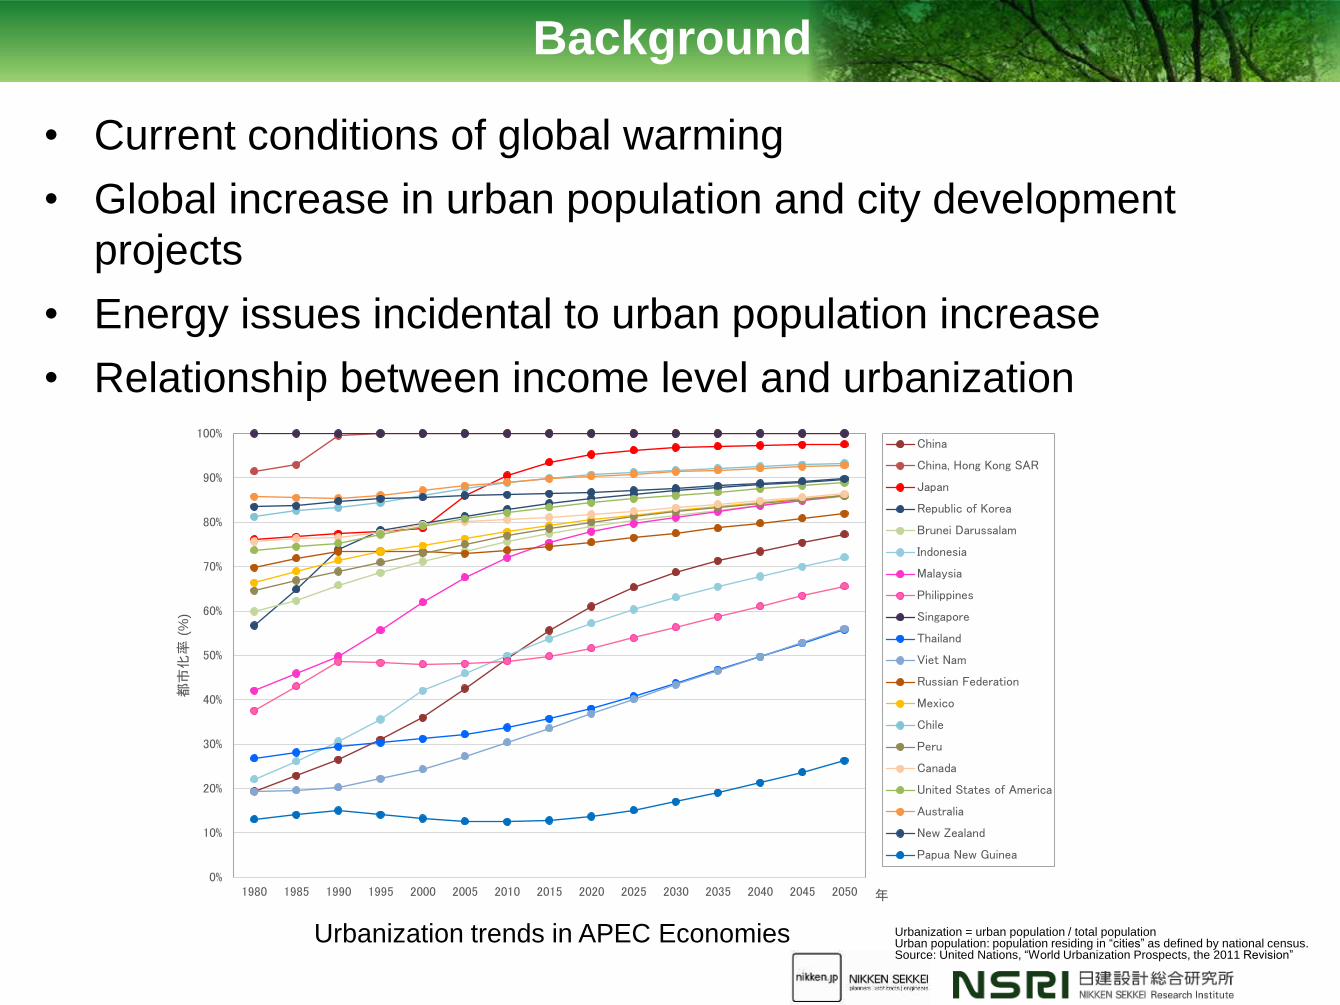
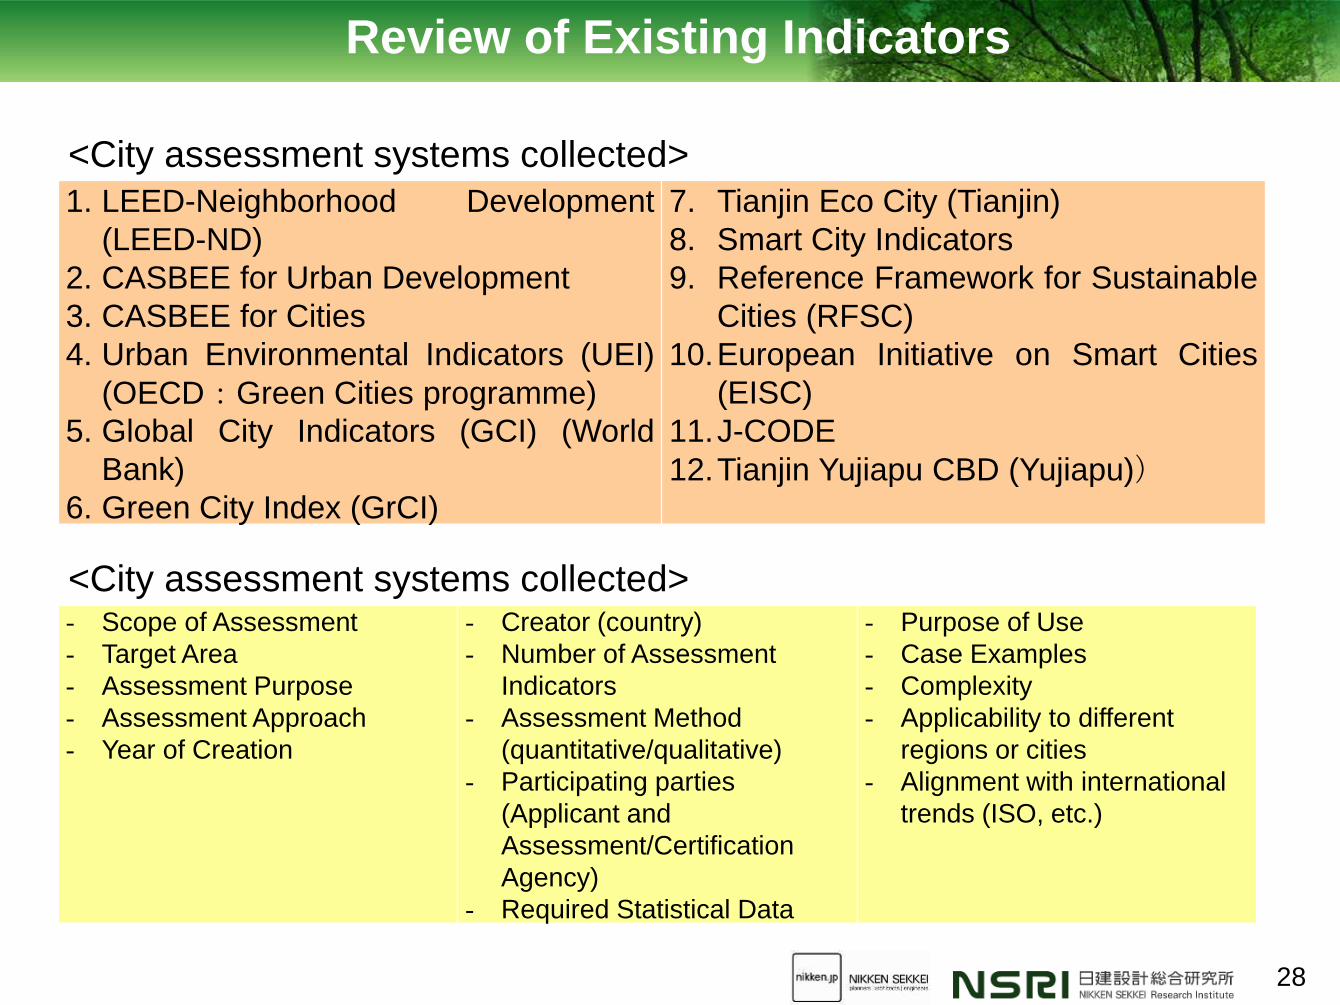
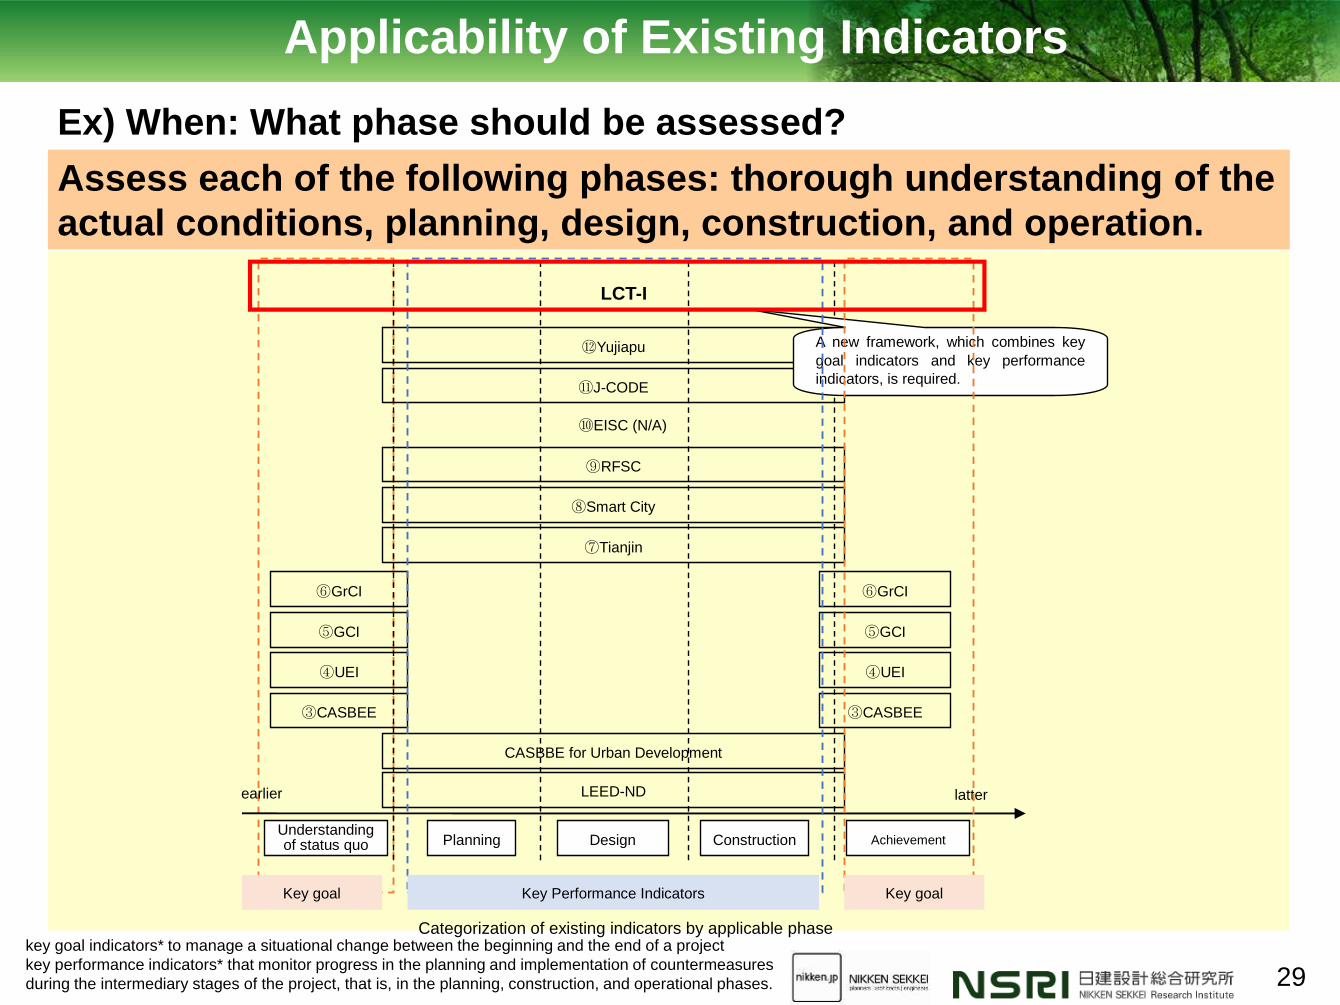
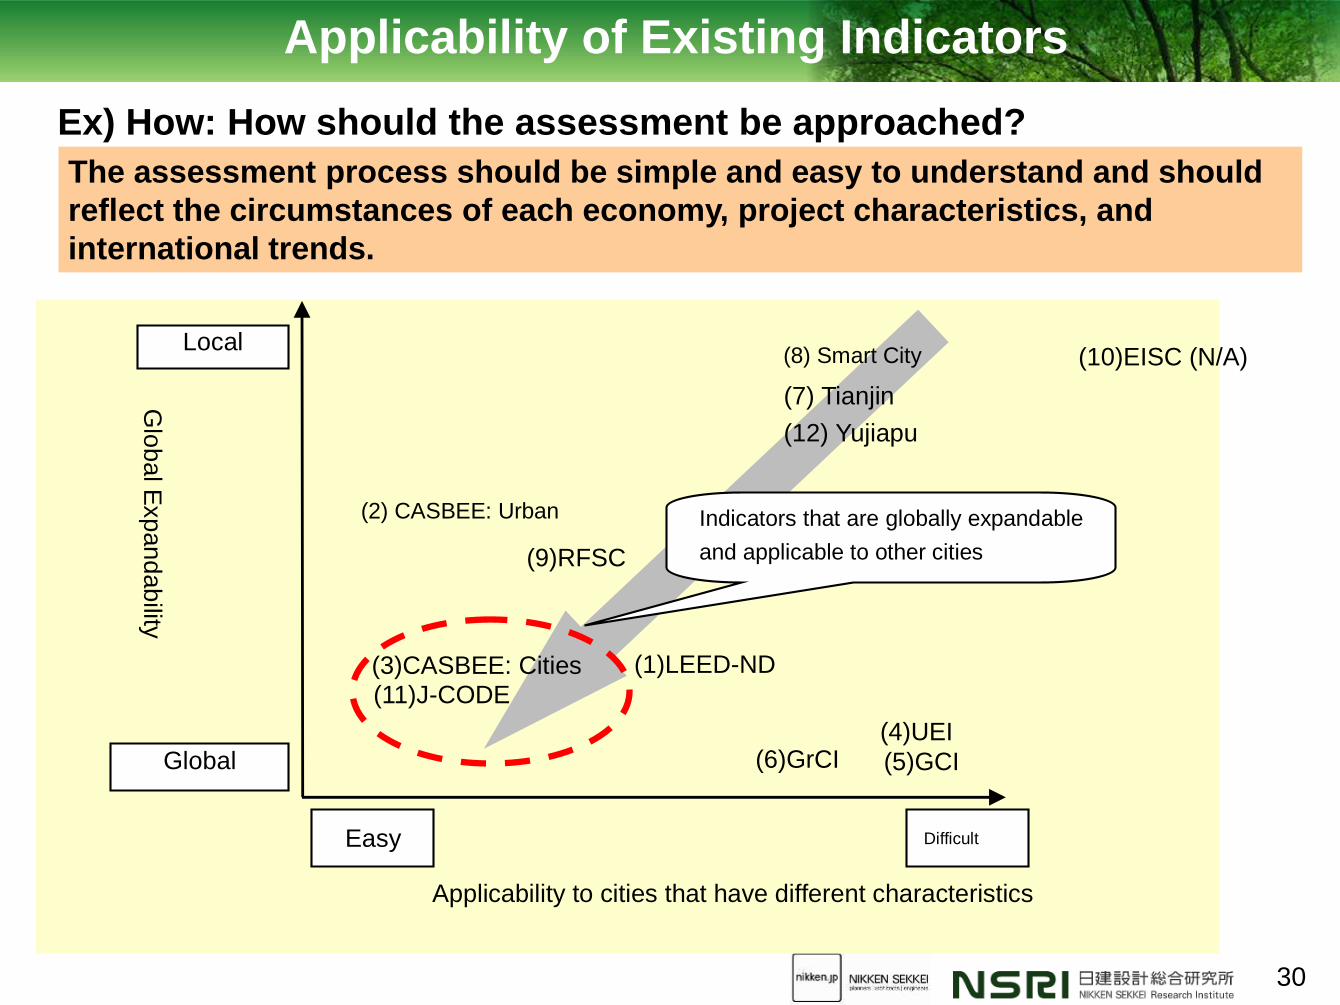
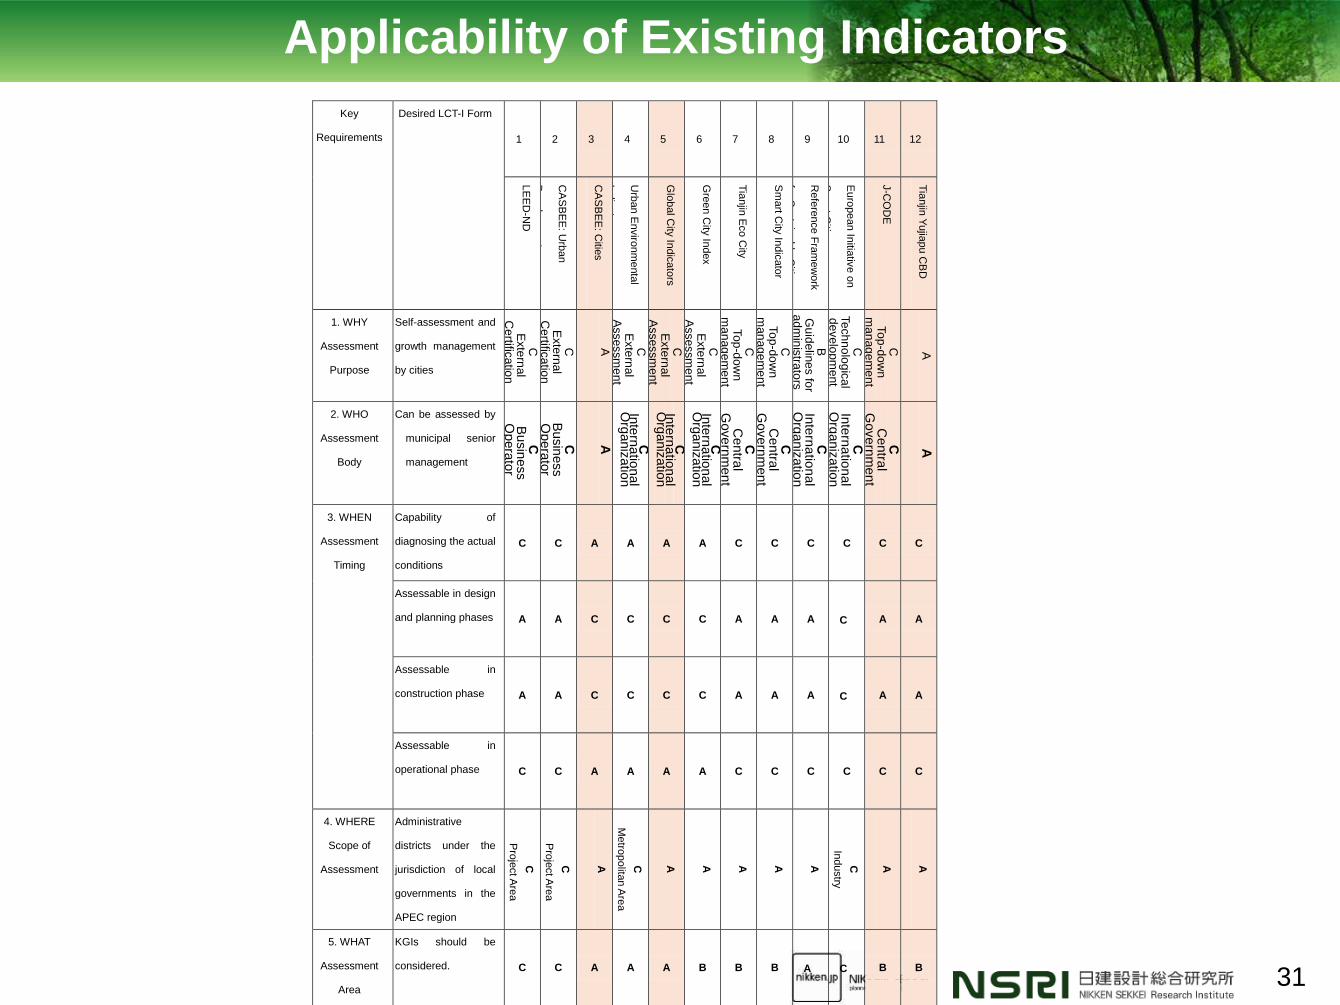
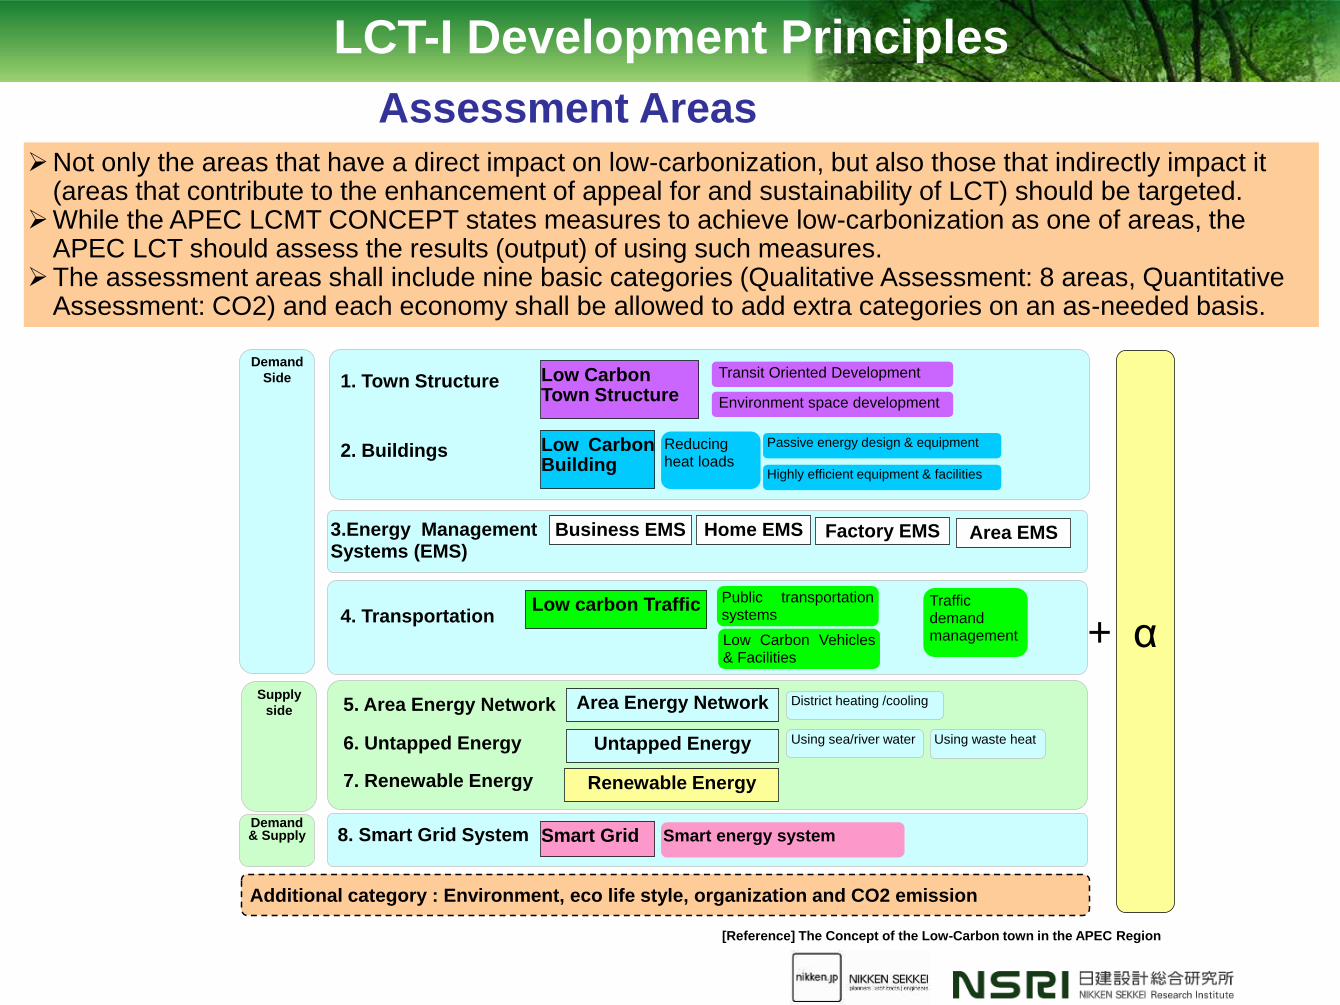
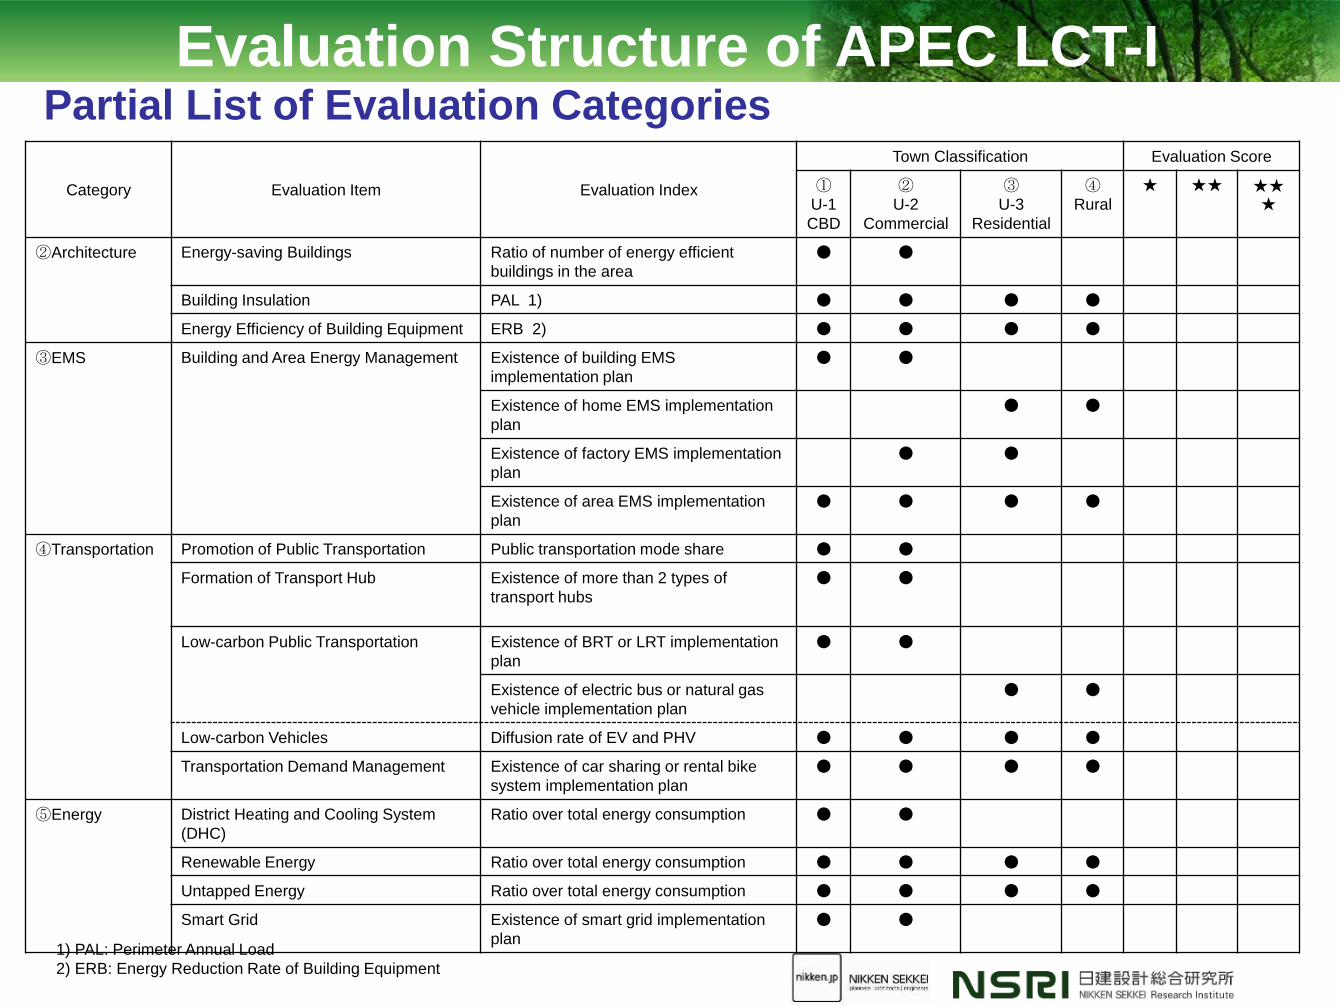
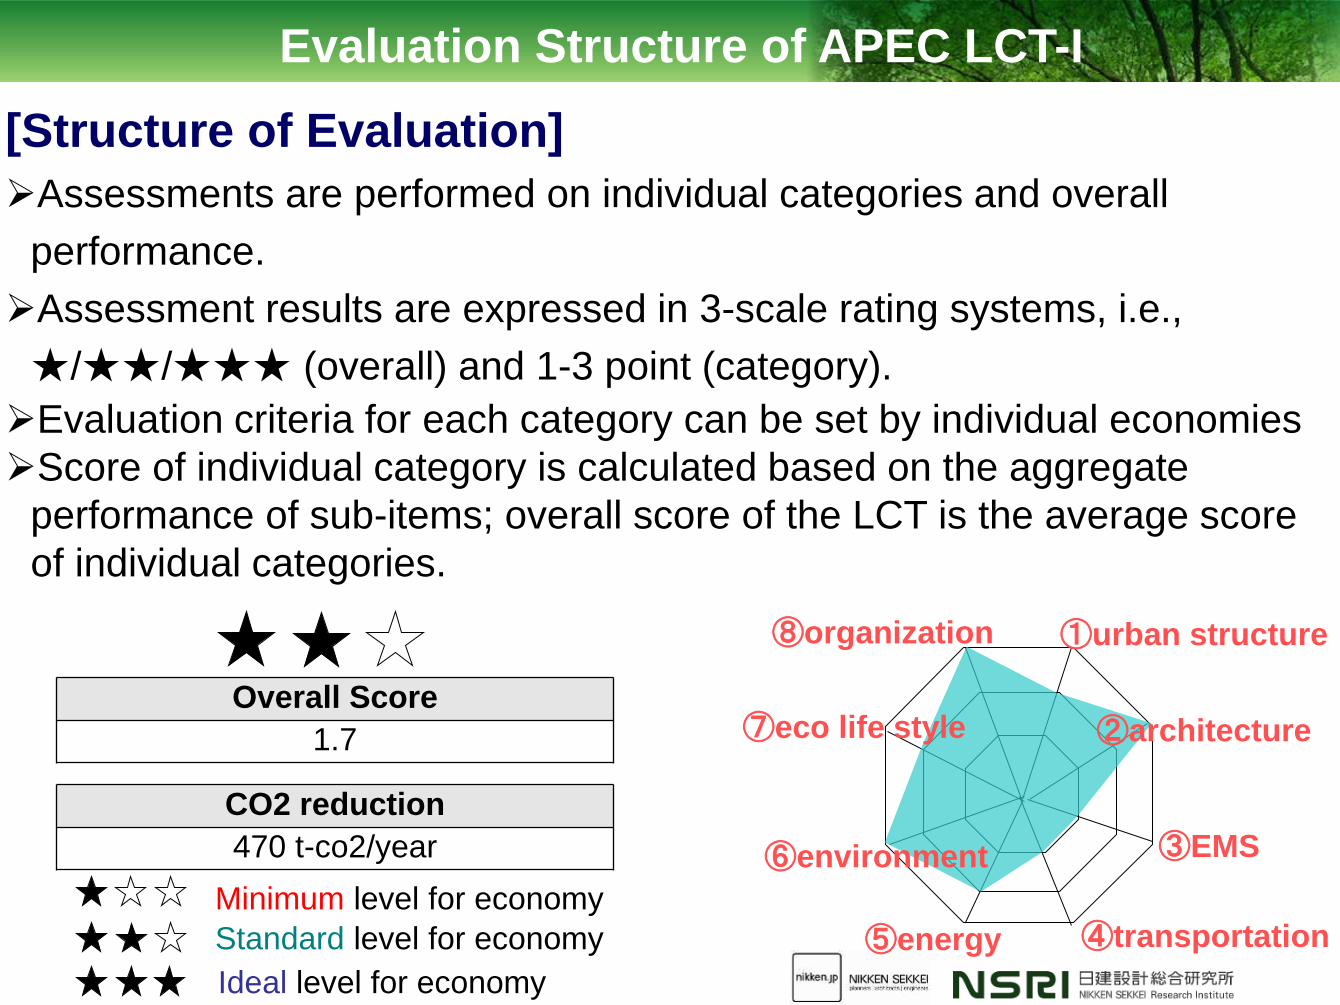