Embed Size (px)
Citation preview
Development of Analytical Approach for an Automated Analysis of Continuous Long-Term Single Lead ECG for Diagnosis of Paroxysmal Atrioventricular Block
Muammar M Kabir, Larisa G Tereshchenko
Oregon Health and Science University, Knight Cardiovascular Institute, Portland, OR, USA
Abstract
Reliable detection of significant ECG features such as the P-wave, QRS-complex and T-wave are of major clinical importance. In this paper we introduce a new algorithm based on synchrosqueezing wavelet transform for detection of P-waves in long-term ECG recordings. Synchrosqueezing is a powerful time-frequency analysis tool that provides precise frequency representation of a multicomponent signal through mode decomposition. First, we analyzed four wavelet filters with different filter parameters, to identify the best specification for quantification of QRS and P-wave. Second, the algorithm was tested on ECG recording comprising of events with paroxysmal atrioventricular block and validated through visual scanning. Using morlet wavelet with a peak frequency of 5Hz and separation of 0.1Hz, our proposed algorithm was able to detect 95.5% of P-waves. From this study, it appears that synchrosqueezing wavelet transform may provide a powerful robust technique for automated ECG analysis.
1. Introduction
Recent data shows a decline in primary ventricular tachyarrhythmias (VT) as a cause of the out-of-patient sudden cardiac arrest (SCA), while the rate of non-VT/VF causative arrhythmias of SCA remains unchanged [1]. Paroxysmal atrioventricular block (PAVB) [2] is one of such non-VT/VF causes of SCA. Idiopathic PAVB or phase 4 PAVB, is a poorly recognized phenomenon of a sudden, pause-dependent AV block occurring in diseased conduction system [2-4]. Sudden change from apparently normal 1:1 AV conduction to complete heart block leads to ventricular asystole and SCA [2]. Importantly, SCA due to PAVB could be easily prevented by permanent pacemaker implantation. Therefore, prediction and early diagnosis of PAVB is crucial. It is important to distinguish life-threatening PAVB from benign vagal AV block. PR interval and behavior of PP’ intervals can help to discriminate malignant PAVB from benign vagal AVB. PAVB, in contrast to vagal AVB, is characterized
by normal PR interval, and unchanged PP’ intervals [2]. PAVB is not frequently witnessed, and manifestation by symptomatic syncope depends on the duration of ventricular asystole, which is highly unpredictable. PAVB is frequently overlooked and under-diagnosed.
Recently continuous long-term (up to 14 days) ECG monitoring (via single-lead ECG patch) became available in the clinical practice. Potentially ECG patch can provide an opportunity for early diagnosis of PAVB. Automated analysis of ECG plays an important role in analysis of long-term ECG recordings. However, automated ECG analysis and automated detection of P-waves of a single-lead ECG is challenging.
The main objective of this paper was to present a novel methodology for detection of P-waves, based on a recent signal processing technique known as synchrosqueezing. Synchrosqueezing is a powerful wavelet based method, proposed by Daubechies et al. [5], that provides adaptive time-frequency decomposition of multicomponent signals and represents them in the time-frequency plane. Synchrosqueezing transform provides precise frequency estimates through preserving essential frequency characteristics, and hence is hypothesized to be an efficient technique for characterization of ECG features.
2. Methods
The study conformed to principles outlined in the Declaration of Helsinki and was approved by the local ethics committee. Each participant provided written informed consent. We analyzed the data of pilot ancillary ECG patch study (PI Tereshchenko) of prospective incident dialysis cohort.
For data analysis, custom written computer program was developed in MATLAB® using the signal processing toolbox.
2.1. Data
One-lead surface ECG, sampled at 200 Hz, was recorded for up to 14 days using an ECG patch (ZioPatch, iRhythm Technologies, Inc.) in study participants. Raw digital ECG signal was used for this analysis. Only one
ISSN 2325-8861 Computing in Cardiology 2014; 41:913-916.913
single ECG recording of 10 days duration was used in this study. Sinus rhythm was present with average heart rate of 79 bpm (range 41-130 bpm). Second degree AV block, Mobitz I (Wenckebach) was observed. Premature supraventricular contractions and premature ventricular contractions were rare (<1%). Study investigators confirmed all findings as described in the report provided by the iRhythm.
2.2. Synchrosqueezing transform
Synchrosqueezing is a more consistent, adaptive and invertible time-frequency analysis technique, designed to extract and compare oscillatory components of signals that arise in complex systems. It is sensitive and robust to noise, and provides estimates of data in the time-frequency plane [5]. In general, signals containing components with time-varying oscillatory characteristics can be represented as
)()(1
tftfK
kk
where fk(t)=Ak(t)cos(2πφk(t)) is a Fourier-like oscillatory component with time-varying amplitude (Ak(t)) and frequency (φk(t)).
The synchrosqueezing algorithm primarily involves
the following three steps: (a) calculation of the continuous wavelet transform
Wf(a,b) of function f(t) with a chosen mother wavelet ψ,
dta
bt
atfbaW
R
f )(1
)(),(
Here, the mother wavelet requires satisfying the condition:
d0
2)(
and is said to be analytic if Fourier transform Ψ(ξ)=0, ξ<0, i.e. concentrated on the positive frequency axis.
(b) initial estimation of the FM-demodulated frequency, wf(a,b) at each location (a,b) on the support of Wf,
(c) squeezing Wf(a,b) via reassignment using the estimate, thus giving the synchrosqueezing representation
daaba
hbaWbS f
bA
ff
f
2/3
)(
~, )),(
(1
),(),(,~
where,
~),(;)(,~ baWabA ff
with accuracy α and threshold ε. The wavelet is selected such that its Fourier transform
is supported in [ξΨ-Δ, ξΨ +Δ] in the Fourier domain, where ξΨ is the peak frequency and Δ is the separation. 2.3. ECG pre-processing
The ECG recordings were segmented into 24-hr periods for analysis. In order to remove baseline wandering, median filter with a moving window of length 1/10th of sampling frequency was chosen [6]. Furthermore, factors such as muscle noise and movement artifacts, marked as high frequency components by synchrosqueezing transform, were eliminated from our analysis.
2.4. Detection of QRS and P waves
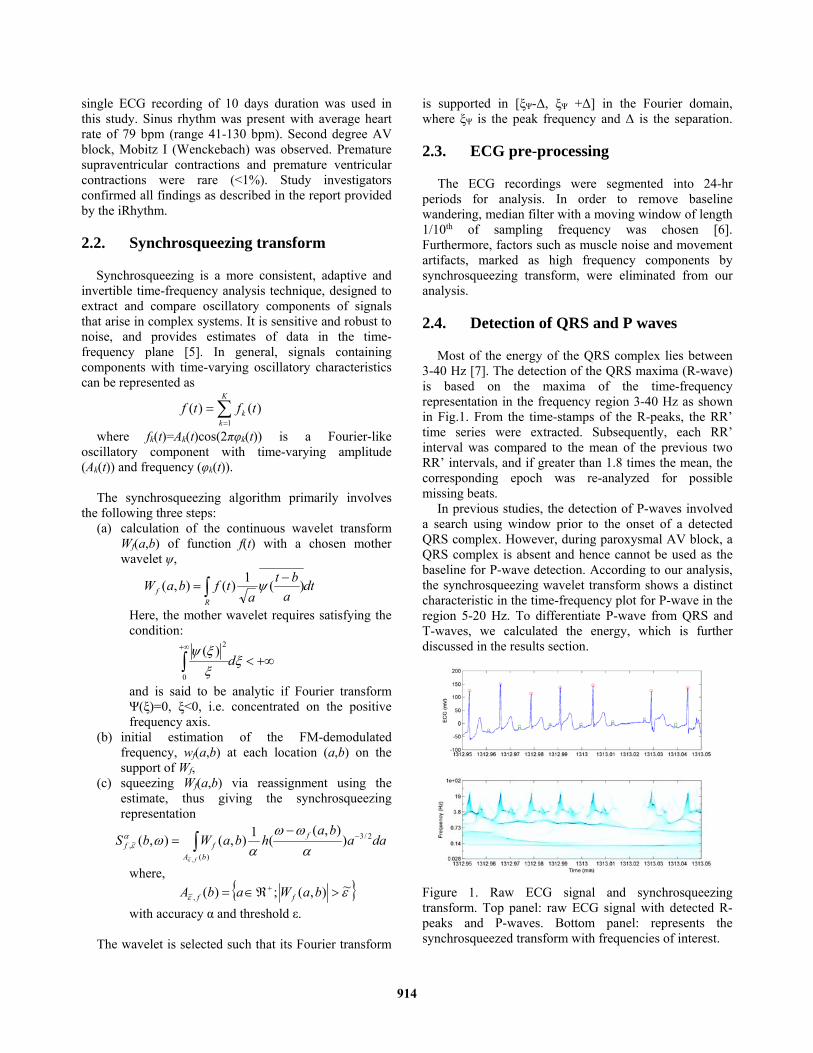
Most of the energy of the QRS complex lies between 3-40 Hz [7]. The detection of the QRS maxima (R-wave) is based on the maxima of the time-frequency representation in the frequency region 3-40 Hz as shown in Fig.1. From the time-stamps of the R-peaks, the RR’ time series were extracted. Subsequently, each RR’ interval was compared to the mean of the previous two RR’ intervals, and if greater than 1.8 times the mean, the corresponding epoch was re-analyzed for possible missing beats.
In previous studies, the detection of P-waves involved a search using window prior to the onset of a detected QRS complex. However, during paroxysmal AV block, a QRS complex is absent and hence cannot be used as the baseline for P-wave detection. According to our analysis, the synchrosqueezing wavelet transform shows a distinct characteristic in the time-frequency plot for P-wave in the region 5-20 Hz. To differentiate P-wave from QRS and T-waves, we calculated the energy, which is further discussed in the results section.
Figure 1. Raw ECG signal and synchrosqueezing transform. Top panel: raw ECG signal with detected R-peaks and P-waves. Bottom panel: represents the synchrosqueezed transform with frequencies of interest.
914
3. Results
A fundamental issue in using synchrosqueezing transform is the choice of mother wavelet and the corresponding filter parameters; a poor selection can lead to a poor result [8].
3.1. Selection of parameters for wavelet filter
For the purpose of selection of suitable wavelet filter parameters, ξΨ and Δ, 30 minutes of clean ECG signal was analyzed using four different wavelets. Table 1 compares the percentage of P-wave detection for each wavelet using different combinations of parameter values. As hypothesized, for each wavelet, a particular combination of parameter values enhanced overall detection performance. The best performance was achieved using morlet wavelet with ξΨ=5 and Δ=0.1.
Table 1. Comparison of the percentage of P-wave
detection using different wavelet filters with varying parameters, based on 30 minutes of clean ECG recording. Wavelets ξΨ % of P-wave detection
Δ 0.1 0.5 1 2
bump 1 92.1 95.4 88.5 86.2 5 99.5 97.2 93.2 87.6 10 89.9 91.2 87.5 82.9 15 86.2 87.7 85.2 81.6
morlet 1 94.5 93.2 89.8 85.2 5 100 99.5 97.3 94.8 10 91.2 89.8 86.2 81.8 15 85.4 82.1 79.8 75.5
mhat 1 91.2 90.6 88.5 85.2 5 93.3 94.1 89.5 86.3 10 92.8 89.7 86.2 82.9 15 87.3 85.8 82.1 78.9
gauss 1 82.7 83.6 81.1 79.9 5 88.2 86.7 82.5 80.5 10 87.5 85.5 82.1 78.5 15 85.9 82.3 79.8 75.4
3.2. P-wave detection
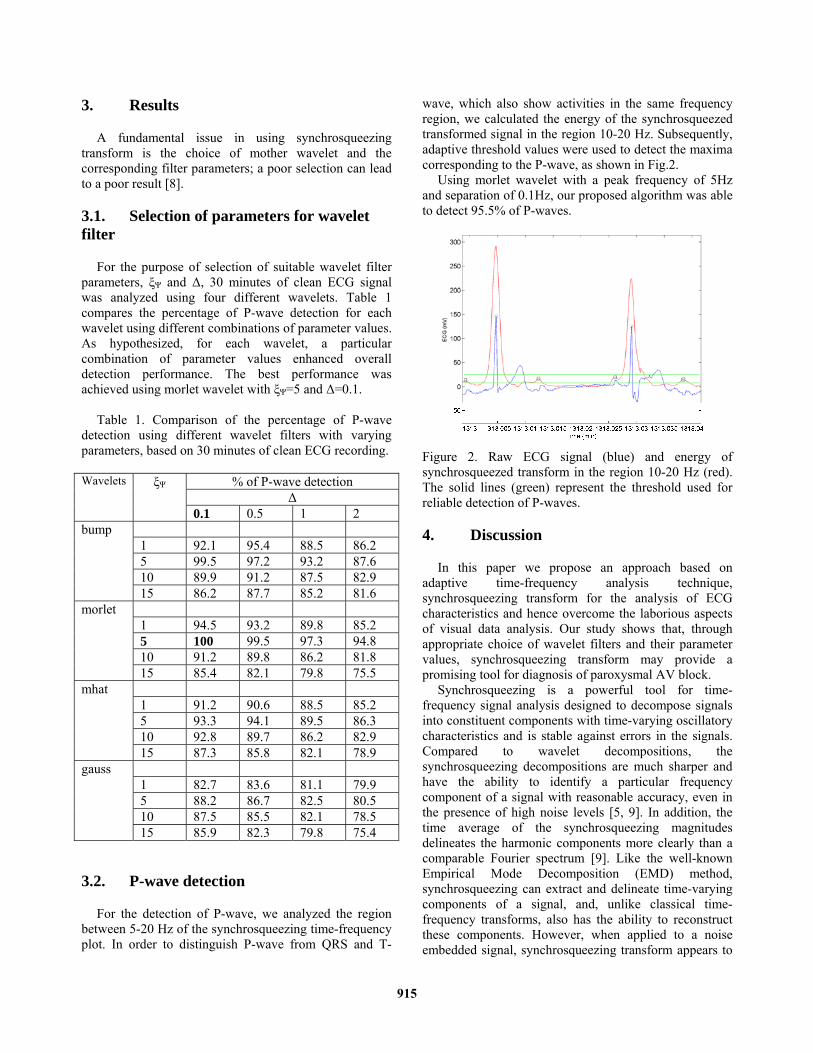
For the detection of P-wave, we analyzed the region between 5-20 Hz of the synchrosqueezing time-frequency plot. In order to distinguish P-wave from QRS and T-
wave, which also show activities in the same frequency region, we calculated the energy of the synchrosqueezed transformed signal in the region 10-20 Hz. Subsequently, adaptive threshold values were used to detect the maxima corresponding to the P-wave, as shown in Fig.2.
Using morlet wavelet with a peak frequency of 5Hz and separation of 0.1Hz, our proposed algorithm was able to detect 95.5% of P-waves.
Figure 2. Raw ECG signal (blue) and energy of synchrosqueezed transform in the region 10-20 Hz (red). The solid lines (green) represent the threshold used for reliable detection of P-waves.
4. Discussion
In this paper we propose an approach based on adaptive time-frequency analysis technique, synchrosqueezing transform for the analysis of ECG characteristics and hence overcome the laborious aspects of visual data analysis. Our study shows that, through appropriate choice of wavelet filters and their parameter values, synchrosqueezing transform may provide a promising tool for diagnosis of paroxysmal AV block.
Synchrosqueezing is a powerful tool for time-frequency signal analysis designed to decompose signals into constituent components with time-varying oscillatory characteristics and is stable against errors in the signals. Compared to wavelet decompositions, the synchrosqueezing decompositions are much sharper and have the ability to identify a particular frequency component of a signal with reasonable accuracy, even in the presence of high noise levels [5, 9]. In addition, the time average of the synchrosqueezing magnitudes delineates the harmonic components more clearly than a comparable Fourier spectrum [9]. Like the well-known Empirical Mode Decomposition (EMD) method, synchrosqueezing can extract and delineate time-varying components of a signal, and, unlike classical time-frequency transforms, also has the ability to reconstruct these components. However, when applied to a noise embedded signal, synchrosqueezing transform appears to
915

be more robust and provides easily-interpretable results compared to EMD [5]. Synchrosqueezing has been successfully used in the analysis of electrocardiogram (ECG) signals for T-end detection and derivation of respiratory signal [10].
This was a preliminary study and hence the proposed algorithm was tested on one ECG recording. Although the study is provides promising results, the algorithm needs to be validated using larger number of subjects to verify the performance under inter-subject signal variations. Future work will include larger data and additional experts to further evaluate the performance of our algorithms. The algorithm will also be tested in patients suffering from different pathologies such as obstructive sleep apnea syndrome which affects cardiovascular system and P-wave [11, 12], to evaluate the performance under challenging clinical conditions.
5. Conclusion
Synchrosqueezing transform provides a powerful time-frequency analysis tool that can be used for robust detection of ECG signal characteristics. We plan to employ this technique for automated analysis of continuous and long ECG recordings.
Acknowledgements
The authors would like to thank iRhythm for providing raw ECG data, and the staff and participants of the clinical study for their important contribution.
References
[1] Teodorescu C, Reinier K, Dervan C, Uy-Evanado A, Samara M, Mariani R, et al. Factors associated with pulseless electric activity versus ventricular fibrillation: the Oregon sudden unexpected death study. Circulation 2010;122:2116-22.
[2] Lee S, Wellens HJ, Josephson ME. Paroxysmal atrioventricular block. Heart Rhythm 2009;6(8):1229-34.
[3] Shohat-Zabarski R, Iakobishvili Z, Kusniec J, Mazur A, Strasberg B. Paroxysmal atrioventricular block: clinical experience with 20 patients. International Journal of Cardiology 2004;97:399-405.
[4] Rosenbaum MB, Elizari MV, Levi RJ, Nau GJ. Paroxysmal atrioventricular block related to hypopolarization and spontaneous diastolic depolarization. Chest 1973;63:678-88.
[5] Daubechies I, Lu J, Wu H. Synchrosqueezed wavelet transforms: An empirical mode decomposition-like tool. Appl Comput Harmon Anal 2011;30:243-61.
[6] De Chazal P, Heneghan C, Sheridan E, Reilly R, Nolan P, O'Malley M. Automated processing of the single-lead electrocardiogram for the detection of obstructive sleep apnoea. IEEE Trans Biomed Eng 2003;50:686-89.
[7] Thakor NV, Webster JG, Tompkins WJ. Estimation of QRS complex power spectra for design of a QRS filter. IEEE Transactions on Biomedical Engineering 1986;31:702-6.
[8] Meignen S, Oberlin T, McLaughlin S. A new algorithm for multicomponent signals analysis based on synchrosqueezing: With an application to signal sampling and denoising. IEEE Trans Signal Process 2012;60:5787-98.
[9] Thakur G, Brevdo E, Fuckar NS, Wu H-T. The synchrosqueezing algorithm for time-varying spectral analysis: Robustness properties and new paleoclimate applications. Signal Processing 2013;93:1079-94.
[10] Chan Y-H, Wu H-T, Hseu S-S, Kuo C-T, Yeh Y-H. ECG-derived respiration and instantaneous frequency based on the synchrosqueezing transform: Application to patients with atrial fibrillation. 2011; arXiv:preprint1105.1571 <http://arxiv.org/abs/1105.1571>.
[11] Kabir MM, Dimitri H, Sanders P, Antic R, Nalivaiko E, Abbott D, Baumert M. Cardiorespiratory phase-coupling is reduced in patients with obstructive sleep apnea. PLoS ONE 2010;5:e10602.
[12] Maeno K, Kasagi S, Ueda A, Kawana F, Ishiwata S, Ohno M, Yamaguchi T, Narui K, Kasai T. Effects of obstructive sleep apnea and its treatment on signal-averaged p-wave duration in men. Circ Arrhythm Electrophysiol 2013;6:287-93.
Address for correspondence. Muammar M Kabir. Knight Cardiovascular Institute, Oregon Health and Science University. Portland, OR 97239, USA [email protected]
916