Embed Size (px)
Citation preview
DEVELOPMENT OF AN ENZYME IMMUNOASSAY
AND CELLULAR FUNCTION ASSAYS TO PROBE THE
FUNCTION OF TENEURIN C-TERMINAL
ASSOCIATED PEPTIDE (TCAP)
by
Tanya Gwendolyn Nock
A thesis submitted in conformity with the requirements for the degree of Master of Science
Cell & Systems Biology University of Toronto
© Copyright by Tanya Gwendolyn Nock 2010
ii
Development of an enzyme immunoassay and cellular function assays to
probe the function of teneurin c-terminal associated peptide (TCAP)
Tanya Gwendolyn Nock
Master of Science
Cell & Systems Biology University of Toronto
2010
Abstract
The teneurin C-terminal associated peptides (TCAP) are a family of four predicted
peptides that are expressed in all metazoans where the teneurins have been studied to date. Of
the four peptides, TCAP-1 has been studied most extensively. In vitro, TCAP-1 increases
neuronal proliferation and neurite outgrowth. In vivo, the peptide reduces CRF-induced
behavioural responses in rats. Despite the large body of evidence indicating a strong biological
role for TCAP-1, little is known about the chemistry and solubility of the peptide, or the
signaling pathway(s) mediating these effects. The aim of this research was to appropriately
solubilize the peptide and to develop detection assays for its study in greater detail. I have now
established an appropriate formulation of TCAP-1 and developed an immunoassay to assess its
concentrations in tissues and in circulation. Also, by examining a number of transcriptional
response elements, I have found two assays for probing the signal transduction mechanisms of
this peptide.

iii
Acknowledgments
I would like to thank David Lovejoy for the opportunity to pursue this thesis and for being an
excellent teacher and an inspirational force as a supervisor, Dalia Barsyte for her guidance
throughout my graduate program and for working by my side to design protocols, analyze data
and perform experiments. I would also like to thank Gina, my former labmate and friend, for
helping me grow as an individual through support, companionship, honesty, and most of all
laughter; Arij for her expertise- she was the most senior in the lab when I arrived and she taught
me all of the basics; Dhan and Tiffany for their company and excitement for science; Laura for
engaging conversation and ultimate stress relief; my friends and family for their confidence in
me, in particular my mom and dad, Fred and Gladys, for being so supportive of my schooling.
Finally I would like to thank my brothers for lending their eyes and ears whenever I needed
proofreading or a sound board from the outside world to talk to about my work.

iv
Table of Contents
Acknowledgments .......................................................................................................................... iii
Table of Contents ........................................................................................................................... iii
List of Figures ............................................................................................................................... vii
List of Appendices .......................................................................................................................... x
List of Abbreviations ..................................................................................................................... xi
Chapter One Introduction: Significance of Teneurin C-terminal Associated Peptides and its relationship to function ............................................................................................... 1
Abstract ...................................................................................................................................... 1
The Discovery of the Teneurin C-terminal Associated Peptides (TCAP) ................................. 1
Chemistry of Peptides ................................................................................................................ 6
Problems associated with studying TCAP and other peptides ................................................. 11
Objectives and Hypothesis ....................................................................................................... 13
Chapter Two Solubilization and chemistry of TCAP .............................................................. 14
Abstract .................................................................................................................................... 14
Introduction .............................................................................................................................. 14
Solubilizing Agents used in Peptide Formulations .................................................................. 15
Materials and Methods ............................................................................................................. 17
Peptide Synthesis .............................................................................................................. 17
Hydropathy Plots .............................................................................................................. 18
Light Scattering/Turbidity Measurements ...................................................................... 18
[Q1]-mTCAP-1 solubility in various solubilizing agents ................................................ 19
mTCAP-1 solubility in various solubilizing agents ........................................................ 19
Recognition of mTCAP-1 epitope by ELISA in selected solubilizing agents ................ 19
TCAP solubility in 200mM L-Arginine – Titration of pH .............................................. 19

v
TCAP solubility in L-arginine based buffers with the inclusion of various excipients: comparison with three other buffer systems ..................................... 20
Recovery of mTCAP-1 in ammonium-based buffers after long-term storage (2 weeks) at 4°C, 22°C and 37°C ............................................................................. 20
Recovery of mTCAP-1 in ammonium-based buffers after subjugation to five freeze-thaw cycles ............................................................................................................ 20
Recovery of mTCAP-1 in ammonium-based and standard buffers after dehydration by vacuum centrifugation (as determined by ELISA) ........................................ 21
Recovery of mTCAP-1 in ammonium-based buffers after lyophilization and storage . 21
Short-term storage at -80°C and 4°C of mTCAP-1 in ammonium-based buffers ......... 21
37°C incubation on recovery of biotinylated TCAP from serum ................................... 22
Polysorbate on recovery of mTCAP-1 in ELISA ............................................................ 22
Results ...................................................................................................................................... 22
Discussion ................................................................................................................................ 37
Solubility in solution ........................................................................................................ 40
Surface Tension ............................................................................................................... 40
The nature of arginine ..................................................................................................... 42
Freeze-thawing solutions ................................................................................................. 42
Stability of proteins in a dried-state by lyophilization .................................................... 43
Protein Structural Changes and Inactivation ................................................................. 44
Surface Adhesion ............................................................................................................. 45
Chapter Three Development of an Enzyme linked Immunosorbent Assay (ELISA) and an extraction method from serum to detect the presence of TCAP .................................. 46
Abstract .................................................................................................................................... 46
Introduction .............................................................................................................................. 46
Materials and methods ............................................................................................................. 48
Optimized competitive ELISA protocol ........................................................................... 48
Optimized TCAP extraction ............................................................................................. 49
vi
Results ...................................................................................................................................... 49
Discussion ................................................................................................................................ 59
Chapter Four Development of transcriptional assay systems to probe the function of TCAP ....................................................................................................................................... 65
Abstract .................................................................................................................................... 65
Introduction .............................................................................................................................. 65
Materials and Methods ............................................................................................................. 71
Cell Lines .......................................................................................................................... 71
Promoter Constructs ........................................................................................................ 71
Luciferase Reporter Assay ............................................................................................... 73
Transfection ..................................................................................................................... 74
TCAP Treatment .............................................................................................................. 74
Reporter Assays ................................................................................................................ 74
Results ...................................................................................................................................... 75
Discussion ................................................................................................................................ 82
Chapter Five Conclusions and significance of findings ........................................................... 89
Abstract .................................................................................................................................... 89
Overview .................................................................................................................................. 89
Solubility .................................................................................................................................. 90
Detection .................................................................................................................................. 91
Function.................................................................................................................................... 92
References ..................................................................................................................................... 95
Appendices .................................................................................................................................. 107
Table 4.1 ................................................................................................................................ 107
Copyright Acknowledgements ....................................................... Error! Bookmark not defined.
vii
List of Figures
Figure 2.1: Hydropathy Measurements. ................................................................................... 23
Figure 2.2: The effect of various solubilizing agents on [Q1]-mTCAP-1 solubility as
determined by light scattering. .................................................................................................. 24
Figure 2.3: The effect of selected solubilizing agents on mTCAP-1 as determined by light
scattering. ..................................................................................................................................... 25
Figure 2.4: Recognition of mTCAP-1 epitope by ELISA in selected solubilizing agents. .... 26
Figure 2.5: The effect of pH on L-arginine-based mTCAP-1 solubilization as determined by
light scattering. ............................................................................................................................ 27
Figure 2.6: The effect of pH on epitope preservation as determined by recovery of mTCAP-
1 from L-arginine-based solutions in ELISA. .......................................................................... 28
Figure 2.7: The effect of various excipients on L-arginine-based buffers in comparison with
three other buffer systems as determined by light scattering. ................................................ 29
Figure 2.8: Recovery of mTCAP-1 in ammonium-based buffers after five freeze-thaw
cycles (as determined by ELISA) ............................................................................................... 30
Figure 2.9: Recovery of mTCAP-1 in ammonium-based buffers after two weeks of storage
at 4ºC, 22ºC and 37ºC. ................................................................................................................ 31
Figure 2.10: Recovery of mTCAP-1 in ammonium-based buffers after subjugation to five
freeze-thaw cycles. ....................................................................................................................... 32
Figure 2.11: Recovery of mTCAP-1 in ammonium-based and standard buffers after
dehydration by vacuum centrifugation (as determined by ELISA) ....................................... 33
Figure 2.12: Recovery of mTCAP-1 in ammonium-based buffers after lyophilization and
storage. ......................................................................................................................................... 34

viii
Figure 2.13: Effect of short-term storage at -80ºC and 4ºC mTCAP-1 in ammonium-based
buffers. ......................................................................................................................................... 35
Figure 2.14: Effect of 37ºC incubation on recovery of biotinylated TCAP from serum. ..... 36
Figure 2.15: Effect of Polysorbate on recovery of mTCAP-1 in ELISA. ............................... 36
Figure 3.1: Titration of TCAP antiserum TCR4 and biotin. .................................................. 50
Figure 3.2: Further titration of TCAP antiserum TCR 4. ....................................................... 50
Figure 3.3: Optimization of Biotin-TCAP concentrations to establish the competition
parameters in ELISA. ................................................................................................................. 51
Figure 3.4: Optimization of BSA concentration in ELISA with TCR4-5 as primary
antiserum. .................................................................................................................................... 52
Figure 3.5: Lack of CRF and UCN epitope recognition by TCAP antiserum (TCR4 IgG
fraction) in 100ul reaction volume. ............................................................................................ 53
Figure 3.6: Comparison of N-terminal and C-terminal TCAP antiserum in ELISA. .......... 53
Figure 3.7: Optimization of TNR1-5 antiserum in ELISA. .................................................... 54
Figure 3.8: Relative binding activity of antiserum TNR1 for mTCAP-1. ............................. 55
Figure 3.9: Characterization of TCAP antisera. ...................................................................... 56
Figure 3.10: Relative binding of mTCAP-1 to antiserum TNR1 in the absence and presence
of serum. ....................................................................................................................................... 57
Figure 3.12: Comparison of synthetic mTCAP-1 recovery between spiked blood samples
and BSA samples using HLB Oasis columns. ........................................................................... 58
Figure 3.13: Determination of the lowest limit of synthetic mTCAP-1 recovery from spiked
blood samples. ............................................................................................................................. 59
Figure 4.1 Transcriptional Activation of cfos. .......................................................................... 67
ix
Figure 4.2: AP1 reporter activity in response to TCAP in N3 hypothalamic cells. .............. 75
Figure 4.3 Reporter activity of the serum response element (SRE) in response to TCAP
addition. ....................................................................................................................................... 76
Figure 4.4 Reporter Activity of the serum response element (SRE) in response to TCAP
addition. ....................................................................................................................................... 77
Figure 4.5: Reporter Activity of the cAMP Response Element (CRE) in 293T human
embryonic kidney cells ............................................................................................................... 78
Figure 4.6: Reporter activation of the cfos promoter with DRE in N38 immortalized
hypothalamic cells. ...................................................................................................................... 79
Figure 4.7: Reporter activation of the cfos promoter with DRE in N38 immortalized
hypothalamic cells. ...................................................................................................................... 79
Figure 4.8: Reporter Activity of Wnt promoter . ...................................................................... 80
Figure 4.9: Reporter activation of the glucocorticoid response element (GRE). .................. 81
Figure 4.10: Reporter activation of the antioxidant response element (ARE). ..................... 82

x
List of Appendices
Table 4.1: Promoter element sequences .................................................................................. 107
xi
List of Abbreviations
ADNP Activity-dependent neuroprotective protein
ANS 8-anilino-1-naphthalene sulfonic acid
AP-1 Activator protein-1
ARE Antioxidant response element
ATF Activating transcription factor
BBB Blood brain barrier
BC Binding capacity
BSA Bovine serum albumin
CaM kinase Ca2+-calmodulin kinase
C/EBP CCAAT/enhancer-binding protein
CD Circular dichroism
CHOP C/EBP homologous protein (also known as GADD153)
CKII Casein kinase II
CNTF Ciliary neurotrophic factor
CRE cAMP response element
CREB CRE binding protein
αCREM αcAMP responsive element modulator
CRF Corticotropin releasing factor
xii
CSF cerebral spinal fluid
DMEM Dulbecco's minimal essential medium
DMF N,N-dimethylformide
DOC Downstream of chop
DRE Downstream regulatory element
DREAM DRE antagonist modulator
EDTA Ethylenediaminetetraacetic acid
EGF Early growth factor
Elk-1 Ets LiKe gene-1
ELISA Enzyme-linked immunosorbent assay
ER Endoplasmic reticulum
Erk Early response kinase
FBS Fetal bovine serum
GABA Gamma-aminobutyric acid
GADD153 Growth arrest and DNA damage-inducible gene 153
GPCR G protein-coupled receptor
GRE Glucocorticoid response element
GSK3 Glycogen synthase kinase 3
HATU O-7-azabenzotriazol-1-,3,3-tetramethyluronium hexfluorophosphate
HPA Hypothalamic-pituitary axis

xiii
HPLC High performance liquid chromatography
HRP Horse radish peroxidase
HSP Heat shock protein
5-HT 5-hydroxytryptamine/serotonin
IEG Immediate early gene
JNK Jun N-terminal kinase
L-DOPA L-3,4-dihydroxyphenylalanine
LE Leucine enkephaline
LEF-1 Lymphoid enhancer-binding factor 1
LPS Lipopolysaccharide
MAP Mitogen-activated protein
MHr Myohemerythrin
MnSOD Manganese superoxide dismutase
NF-κB Nuclear factor-κB
NMR Nuclear magnetic resonance
OD Optical density
ONPG Ortho-Nitrophenyl-β-galactoside
OVLT Organum vasculosum of the lamina terminalis
PACAP Pituitary adenylate cyclase activating polypeptide
PBS Phosphate-buffered saline
xiv
PBST PBS Tween-20
PC Prohormone convertase
PEG-PS Poly (ethylene glycol) polystyrene
PFK Phosphofructokinase
PKA Protein kinase A
PKC Protein kinase C
PMA Phorbol myristate acetate
PNK Polynucleotide kinase
POMC Pro-opiomelanocortin
PPAR Peroxisome proliferator-activated receptor
ROS Radical oxygen species
SDS Sodium dodecyl sulfate
SIE Sis-inducible element
SOD1 Superoxide dismutase 1
SPE Solid-phase extraction
SRE Serum response element
SRF Serum response factor
TCAP Teneurin c-terminal associated peptide
TCF T cell factor
TF Transcription factor

xv
TFA Trifluoroacetic acid
TMAO Trimethylamine N-oxide
TNF Tumor necrosis factor
TPA 12-O-tetradecanoylphorbol-13-acetate
tPA Tissue plasminogen activator
UCN Urocortin
VIP Vasoactive intestinal peptide

1
Chapter One
Introduction: Significance of Teneurin C-terminal Associated
Peptides and its relationship to function
Abstract
The teneurin C-terminal associated peptides (TCAP) are newly discovered peptides that have a
number of biological effects in the brain including cell protection, neurite outgrowth and
regulation of anxiety-related behaviour. However little is known about the molecular and
physiological mechanisms that bring about these effects. TCAP has some structural similarity to
the corticotropin releasing factor (CRF) family of peptides. Thus these peptides could offer
insight into the chemistry of TCAP. A number of methods have been utilized to determine the
structure/function relationships of peptides. Therefore the objective of this thesis is to establish
the appropriate methods to prepare TCAP for study in biological systems and to develop
methods by which TCAP can be studied in vitro and in vivo.
The Discovery of the Teneurin C-terminal Associated Peptides (TCAP)
Many hormones have evolved before the first animals evolved. Some examples include
glutamate, GABA (gamma-aminobutyric acid), 5-HT (5-hydroxytryptamine) or serotonin,
melatonin and the catecholamine hormones. Also, many active peptide systems including those
in primordial animals have early evolutionary origins. Peptides may have been among the first
biogenic macromolecules synthesized on earth before life evolved (Rode, 1999; Reiner et al.,
2006). This theory may explain why there are so many peptide hormones found in the animal
kingdom. Peptide hormones may constitute the largest family of high affinity and specific
hormone systems. Evidence for this early evolution of peptide hormones comes from the
numerous examples of peptide systems identified in various model species using genomic
sequencing programs.
The corticotropin-releasing factor (CRF) family of peptides is one such peptide system that is
well represented among the model organisms studied. There are four groups of peptides that are
2
related to CRF. Most closely related to CRF is urocortin (UCN) in mammals, urotensin I in
fishes and sauvagine in frogs (Lovejoy and Balment, 1999). Two other peptides, that are related
to each other more than either is to CRF, are called UCN 2 and UCN 3 (Reyes et al., 2001;
Lewis et al., 2001). CRF and its family members play a major role in the regulation of stress
physiology. Because these peptides are very ancient, and are exceptionally important in the
regulation of adaptation and survival of animals, there may be other peptides that are related to
this family.
TCAP is the other group of peptides related to CRF. TCAP was discovered in an attempt to find
paralogues to the CRF peptide family. The TCAP sequence was recognized by a hamster UCN
probe during a low-stringency screen of a rainbow trout hypothalamic cDNA library for CRF-
like peptides. Primary sequence analysis reveals that it shares more than 20% sequence
similarity with the CRF peptides and is part of a larger transmembrance protein called Teneurin
(Qian et al., 2004). Database searches confirmed that all teneurin and ten-m sequences
possessed such a putative peptide sequence. The sequence was 40 amino acids in teneurin-3 and
41 amino acids in teneurins-1, -2, and -4. Each of the four TCAP peptides is encoded by an exon
that is closely associated with the teneurin gene. Although it is a newly discovered peptide, it
appears to have a long evolutionary history that originated around the same time as the CRF
family.
The four TCAP peptides (1-4) resemble a peptide in terms of structure and composition. TCAP
is flanked by a R/K-Xn-R/K prohormone convertase (PC) cleavage motif (Seidah and Chretien,
1999) that suggest it is liberated from a larger protein as an amidated peptide (Qian et al., 2004).
Amidation at the C-terminal as well as a pyroglutamyl residue in position 1 (Qian et al., 2004)
are indications of an active, independent peptide in the body. As the next step in determining the
nature of TCAP, a synthetic version was synthesized to explore its biological characteristics in
vivo and in vitro and to identify the hallmarks of peptide behaviours where they occurred. At
present, it appears that TCAP is a bioactive peptide that may represent a novel signaling system
in modulating stress and aberrant environments.
The teneurins, the protein where TCAP is found, have a number of actions that are similar to
TCAP. In terms of structure, all four mouse teneurin proteins are 2700-2800 amino acids in
length and lack signal peptides at the NH2 terminus (Levine et al., 1994; Baumgartner et al.,

3
1994). A series of short hydrophobic residues is found 300-400 amino acids after the translation
start and is characteristic of a transmembrane domain. A stretch of 200 amino acids separates
this region from a series of 8 consecutive early growth factor (EGF)-like repeats that follow.
EGFs are highly conserved among the teneurins: they share 65-72% similarity. The EGF repeats
appear to mediate the covalent dimerization of teneurins via the formation of salt bridges
between the odd cysteine residues residing in the 2nd and 5th EGF structure and are a conserved
property of the proteins. Following the EGF repeats, there is a stretch of 26 tyrosine-aspartic
acid (YD) repeats that show similarity to the core of rhs elements in E. coli and to repeats in
toxin A of the bacteria Clostridium difficile. The similarity of sequences in the teneurin
molecule to those in bacteria supports the notion of their distant origin and their conservation
through evolution. The YD repeats appear to be involved in binding carbohydrate and
specifically, the chicken teneurin-1 YD-repeat region has been shown to bind heparin (Minet et
al., 1999). Heparin molecules have been shown to inhibit neurite outgrowth. Following the YD
repeats in the C-terminal is the last exon of the teneurin molecule within which the TCAP
molecule is found.
The teneurin gene appears to be upregulated by stressors. Wang et al. (1998) showed that a
teneurin-like transcript, named DOC4 (downstream of chop) in mammalian cells was
upregulated by the transcription factor CHOP (CCAAT/enhancer-binding protein (C/EBP)
homologous protein-10 (also known as growth arrest and DNA damage-inducible gene 153
(GADD153)). This transcription factor is induced by genotoxic stress such as UV light and
alkylating agents and certain growth arrest signals triggered by endoplasmic reticulum (ER)
stress such as deprivation of oxygen, glucose or amino acids and interference of calcium flux
across the ER membrane (Zinszner et al., 1998). These studies suggest that the Ten-m gene may
play a significant role in the regulation of the stress response of neurons and other cells.
GADD153 is a small nuclear protein that dimerizes with members of the C/EBP family of
transcription factors (Ron and Habener, 1992). It does not appear to homodimerize. GADD153
undergoes a stress inducible phosphorylation by a p38-type mitogen-activated protein (MAP)
kinase which also enhances the transcriptional activation of GADD153 (Wang and Ron, 1996).
High expression of GADD153 leads to cell cycle arrest (Zhan et al., 1994). Overexpression of
teneurin-2 into the mouse neuroblastoma cells (Nb2a) augmented the amount of neurite
outgrowth and a tendency to enlarge the growth cones. The number of filamentous actin-
4
containing filopodia was also enhanced in the teneurin-2 overexpressing cells (Rubin et al.,
1999).
The expression of the Ten-m genes have been examined in embryonic zebrafish (Mieda et al.,
1999), chicken (Rubin et al., 1999) and mouse (Ben-Zur et al., 2000) although their expression
patterns have not been finely resolved. The transcripts are found in a number of peripheral
tissues but are found predominantly in the central nervous system. In the embryonic chicken
brain, teneurin-1 and -2 are expressed in the retina, telencephalon, the optic tectum and the
diencephalons. The mRNA for teneurin-1 was found mainly in the intermediate zone of the
dorsal thalamus whereas teneurin-2 was found in the intermediate zone of the thalamus (Rubin et
al., 1999). In zebrafish, ten-m4 is faintly expressed throughout gastrulation, although there is no
ten-m3 expression. Ten-m3 expression begins at the notochord and the somite around the
tailbud stage. In later stages (14h post fertilization), ten-m3 is expressed in the somites,
notochord and brain while ten-m4 expression was confined to the brain. Ten-m3 becomes
defined within the optic vesicles and region covering the caudal diencephalons and
mesencephalon with the expression strongest in the anterior mesencephalon. Ten-m4 has its
strongest expression toward the midbrain hindbrain border. By 23h post fertilization, ten-m3 is
expressed in the dorsal part of the tectal primordium and the ventral midbrain while ten-m4 is
expressed in the ventral primordium (Mieda et al., 1999). Human Ten-M1 maps to position
Xq25 of the X chromosome (Minet et al., 1999). Conditions mapped to this region are
associated with severe X-linked mental retardation syndromes and may include motory sensory
neuropathy, deafness and sometimes seizures and impaired vision (Gustavson et al., 1993;
Malmgren et al., 1993; Priest et al., 1995 Gedeon et al., 1996).
The TCAP-teneurin system may be involved in the protection of neurons during periods of
oxygen deprivation such as hypoxia and ischemia. Studies have led to the conclusion that TCAP
prevents necrotic cell death during periods of stress induced by high cellular pH. TCAP-1
significantly inhibited the decline in cell proliferation of an immortalized hypothalamic cells
(N38) growing in media buffered at pHs 8 and 8.4 as determined by cell viability assays and
morphological analysis of necrosis. TCAP-1 treated cells also had 4-5 fold fewer cells
undergoing necrosis by uptake of ethidium homodimer III (Trubiani et al., 2007). On the
5
molecular level, TCAP-1 treated cells show a decrease in superoxide radical species coupled
with an increase in superoxide dismutase 1 (SOD1) protein expression. In addition, the mRNA
levels as well as the protein expression of SOD copper chaperone and catalase were upregulated.
TCAP is involved in the regulation of neurite outgrowth and differentiation as analysed using
Sholl’s analysis of primary hippocampal cells stained with neuron-specific tubulin (Al Chawaf et
al., 2007a). Specifically, the gene expression of α-actinin-4 and β-actin was upregulated as well
as the mRNA expression of β-tubulin after 7 days of TCAP administration once daily. In
addition, treatment of these same neurons increase neurite outgrowth, and in primary cultures of
embryonic rat hippocampal cells, increases axon growth and fasciculation (Al Chawaf et al.,
2007a).
TCAP also modulates anxiety behaviour in male Wistar rats (Tan et al., 2009). Repeated
injections of TCAP in vivo diminish the anxiogenic affects of CRF as determined using an
acoustic startle behavioural test (Wang et al., 2005; Tan et al., 2008), the elevated plus maze and
open field tests (Tan et al., 2008; Al Chawaf et al., 2007b). In connection with this, previous
work in our laboratory has shown that TCAP attenuates CRF-induced cfos expression in areas of
the brain related to contextual fear (Tronson et al., 2009). This occurs in the hippocampus of the
limbic system specifically the CA1, CA2 and most significantly the dendate gyrus and CA3
subfields of the hippocampus (Tan et al., 2009). Repeated ICV administration of TCAP alters
the dendritic morphology of CA3 neurons in the hippocampus (Al Chawaf et al., 2009). These
studies suggest that TCAP could have potential as a therapeutic agent to treat some neurological
conditions.
There are other peptides in addition to TCAP that cause similar biological effects and are
effective in the picomolar-fentomolar range of concentrations. NAP (whose name represents the
single letter abbreviation of the three amino acids that make up the peptide) is such a peptide as
is activity-dependent neuroprotective protein (ADNP), the parent molecule from which NAP is
liberated (Dong, 2003). NAP is neuroprotective against necrotic insults in various models of
hippocampal cultures including ischemic stroke model, KA toxicity or epilepsy model and
metabolic poisoning. The variety of insults to which NAP is protective suggests a single

6
mechanism. NAP stabilizes tubulin and microtubules. Previous studies have demonstrated that
NAP increases neurite outgrowth in cortical cultures (Divinski et al., 2006) and in hippocampal
cultures in the presence of glial cells and serum (Smith-Swintosky et al., 2005). Other peptides
effective at ameliorating neurodegeneration and acting within this range are pituitary adenylate
cyclase activating polypeptide (PACAP) (Gozes et al., 1997), vasoactive intestinal peptide (VIP)
and leucine enkephaline (LE) (Qin, 2005). These peptides inhibit the production of superoxide
from microglia through NADPH oxidase via a mechanism independent from the conventional
opioid receptors. Currently, the mechanistic details of how these novel neuroprotective peptides
exert their effects are lacking. One of the main goals of this thesis is to elucidate an initial
framework with which to probe the mechanism of TCAP’s neuroprotective effects. To do this, a
reporter assay will be developed to study TCAP’s effect on the transcriptional activation (or
repression) of selected response elements found in the promoter of genes regulated by TCAP.
A number of neuroprotective proteins have also been associated with CRF and share similarities
to regions of its structure. Astressin is an example of a novel and potent CRF antagonist. It is
neuroprotective against damage caused after a seizure. The most probable route by which CRF
contributes to necrosis is through electrophysical excitation of neurons. It is still not known
whether TCAP signals through the CRF receptor system. ∝-helical CRF (9-41) and [D-
Phe12,Nle21,38,C∝MeLeu37] hCRF(12-41)] are both antagonist of CRF (Guylas et al., 1995),
the latter developed synthetically as a potential therapeutic. One of the problems with the
administration of synthetic peptides is their toxicity in animals and potentially humans, which is
reflected by the fact that very few are actually successful. However, TCAP has neuroprotective
actions in its natural state. Therefore, the next step towards further development as a therapeutic
will be isolation of the endogenous peptide and its solubilization into a suitable formulation for
in vivo administration. The chemistry of a peptide is extremely useful indicator of how the
peptide will behave in different chemical environments, as in a formulation, and for this reason
the chemistry of peptides and TCAP will be analysed.
Chemistry of Peptides As a group, all peptides are composed of individual amino acids linked together via a peptide
bond. Peptides have some shared chemical properties because of this commonality. The
differences between peptides are due to the varying side chains on each amino acid and alter the
7
conformation of the peptide in terms of the degree of hydrophobicity and of charge distribution,
and the capacity for hydrogen bonding. Ultimately, the peptide takes on a stable or flexible
combination and in some cases a combination of the two. The conformation can be useful as an
indicator of a peptide’s biological activity, including its interactions with other molecules at the
peptide surface and motility in the cell and body. The chemistry of a peptide dictates its
biological activity and so there are advantages to both rigid and flexible conformations. Rigidity
tends to be a characteristic of the larger globular polypeptide hormones such as insulin, the
glycoprotein and growth hormones, and of cyclic peptides such as oxytocin. A hormone having
relatively stable conformers is advantageous in the initial hormone-receptor recognition process
due to the minimal entropy lost on formation of the hormone receptor complex. A high
biological potency can also result from rigidity. This is true of the cyclic analogues of
somatostatin and enkephalin where their high biological potency results from their rigid
conformation complementary to the receptor.
Flexibility of a hormone is common in more small molecules with a high motility, especially
those in aqueous solutions, but even larger molecules such as insulin can undergo conformational
changes on modification of the environment when it is advantageous to do so. Conformational
changes in the hormone may accelerate the hormone-receptor recognition process by allowing
more interactions to be explored. In fact, for some hormones it may be required once the
hormone is bound in order to activate the biological response. In the case of oxytocin, increasing
the rigidity creates an antagonist that will bind to the receptor but will not allow for further
signaling because of its limited movement. Another example is glucagons where the flexibility
of the N-terminus is required for its full potency (Blundell and Wood, 1982). A similar
interaction occurs during transcription where a conformational change is required once the basal
transcriptional machinery is bound in order to activate transcription. In this situation, additional
proteins are involved and changing conformation may be more parsimonious. Flexibility of the
hormone may also be also important for its clearance from the circulation or for its deactivation
by proteolysis. The biological activity of a peptide is determined by its conformation and
intermediate-sized peptides can and do assume radically different shapes in different
environments. One can only conclude that the molecular biology of polypeptide hormones is
complex, often involving changing environments and multiple interactions that favour greater
8
flexibility. The roles of conformation in these processes may be varied, reflecting different ways
of optimizing through evolution of their overall usefulness.
Small peptides (of less than 30 amino acids) are generally flexible. The central carbon in the
amino acids that make up the peptide is stabilized by resonance, which confers a partial double-
bond character that allows for rotation and a variety of conformations to exist. Their
conformations will be dependent on their concentration, on the solvent molecules and its
concentration, and the presence of other molecules in solution (Kaiser and Kezdy, 1983). Many
biologically active peptides lack disulfide bonds because of the rigidity they impart, are linear,
(Blundell and Wood, 1982) and their conformation depends entirely on their environment; they
can assume completely different secondary structures in water, in a detergent micelle, or organic
solvents. Glucagon, for instance, has little defined structure in dilute aqueous solutions (Blundell
and Wood, 1982), but its secondary structure is stabilized by self-association at high
concentrations (Barany and Merrifield, 1980) and by the presence of nonaqueous solvents and
lipid micelles (Schiffer, 1967). Because of this, once an endogenous peptide is isolated it is
necessary to dissolve it in such a way that the environment preserves its biological activity, its
native conformation.
One could imagine that the biological activity is not dependent solely on the structure of the
peptide but also by considerations of biocompatibility, degradability, specificity, and lack of
immune reactivity. Thus, the structure may be suboptimal in terms of stability and could be
modified to obtain a synthetic version with improved activity. It is now common to design and
construct biologically active peptides in a relatively short time using solid phase peptide
synthesis, invented by Barany and Merifield (1980).
The probability of a secondary structure can be calculated due to the development of several
semiempirical methods. With current methods available, numerous structural features of
peptides and proteins have been predicted from their amino acid sequence. They are
hydrophobicity/ hydrophilicity and its subsequent relevance to secondary structure, glycosylation
sites, and flexibility. These features are not mutually exclusive and will be discussed in relation
to one another.
The Kyte-Doolittle scale is widely used for detecting hydrophobic regions in proteins. Regions
with a positive value have some degree of hydrophobicity. This scale can be used for identifying
9
both surface-exposed regions as well as transmembrane regions, depending on the window size
used. Window sizes of 5-7 with an average above 1 predict putative surface-exposed regions.
Larger window sizes of 19-21 are well suited for finding transmembrane domains if the values
calculated are above 1.6. Again, these values should be used as a rule of thumb and deviations
from the rule may occur. Hopp and Woods developed their hydrophilicity scale for
identification of potential antigenic sites in proteins. In this scale apolar residues have been
assigned negative values. The point of highest local average hydrophilicity is invariably located
in, or immediately adjacent to, an antigenic determinant. The prediction success rate using 12
proteins with which extensive immunochemical analysis had been conducted depended on
averaging group length, with hexapeptide averages (window size of 6) yielding optimal results
(Hopp and Woods, 1983). The Engelman hydrophobicity scale, also known as the GES-scale, is
another scale that can be used for prediction of protein hydrophobicity (Engelman et al., 1986).
As the Kyte-Doolittle scale, this scale is useful for prediction of transmembrane regions in
proteins. Eisenberg and colleagues (1984) introduced the hydrophobic moment to quantify the
amphiphilicity of protein secondary structures, that is, the partitioning of hydrophilic and
hydrophobic residues in a structure with a regular period.
The assignment of hydrophobicity values to amino acids, a hydrophobicity scale, affects the
display of periodicity and therefore, the recognition of alpha helicies. An alpha helix is
frequently adopted in chains of six or more helix-forming amino acids. These can then be
plotted on a helical wheel to illustrate the orientations of the constituent amino acids. Often in
globular proteins, as well as in specialized structures such as coiled-coils and leucine zippers, an
alpha helix will exhibit two "faces" - one containing predominantly hydrophobic amino acids
oriented toward the interior of the protein, in the hydrophobic core, and one containing
predominantly polar amino acids oriented toward the solvent-exposed surface of the protein.
Cornette et al. computed an optimal hydrophobicity scale based on 38 published scales (1987)
and it is suitable for the prediction of amphipathic alpha-helices in proteins because it identifies
their characteristic period of 3.6 hydrophobic residues per cycle. For simplicity, we used the
original method of Chou and Fasman (1978) to predict helices and sheets.
The glycosylation sites on a peptide or protein are also able to be predicted. Strong
glycosylation sites are likely when amino acids have the sequence NXT or NXS and weak sites

10
when X is D, W, or P. TCAP has none of these sites in its sequence and therefore, it is not likely
to have any carbohydrates attached to it.
Since their development, numerous scales have been published in the literature for the prediction
of secondary structure motifs, including more advanced methods as well as papers discrediting
the methodologies in favour of other factors such as temperature having a higher correlation to
certain structures within the protein (Westhof et al., 1984). Despite this, the simple and very fast
calculations are still highly used perhaps because of these qualities.
The next level of order within a protein is tertiary structure. It affects protein stability in that it
involves, and therefore can be determined by: hydrophobic interactions (Kauzmann, 1959),
electrostatic ion pairs (Sundaralingam et al., 1987; Nakamura, 1996), helix dipole model
(Shoemaker et al., 1987), amphiphilicity (Kaiser and Kézdy, 1984), salt bridges (Marqusee and
Baldwin, 1987) and hydrophobic ion pairing. Peptides less than 50-60 amino acids do not have a
rigid tertiary structure and require additional structural restraints for their maintenance such as
disulfide bonds. TCAP is less than 50 amino acids and is unable to form salt bridges due to a
lack of cysteine residues and relies on induction of a specific conformer. Peptides under 10
amino acids are likely induced by association with another protein (receptor, antibody) however,
peptides between 10-50 amino acids such as TCAP, are likely induced by their environment
(Kaiser and Kézdy, 1983).
When deciding the environment most suitable for TCAP solubilization, structural analysis of the
peptide is useful. TCAP is amphipathic having both hydrophobic and hydrophilic regions. The
“like dissolves like” premise suggests an environment having both of these properties would best
dissolve TCAP and also suggests why it would not dissolve in water alone. Increased solubility
can be achieved by the addition of a hydrotrope, broadly defined as an addition that increases the
aqueous solubility of a poorly soluble compound (Yalkowsky, 1999). Though there are many
agents that fit into this category, there is no universal hydrotropic agent effective at increasing
the aqueous solubility of any hydrophobic molecule to which it is added. Instead, the current
practice for finding a suitable hydrotropic agent for a particular hydrophobic molecule is to
screen a large number of candidate hydrotropes (Lee, 2003).
Effective hydrotropes are mediators: they break up the self-association of water molecules and
interact with the drug at the same time. Water structure formers, such as sucrose and sorbitol
11
inhibit solubilization of poorly water soluble drugs whereas water structure breakers improve
solubility by destroying clusters of water molecules (Müller and Albers, 1991). The poor
hydrotropic property of urea illustrates the necessity for the agent to interact with the solute as
well as destabilize the water clusters. Urea is known to break up hydrogen bonds amongst water
molecules but its interaction with the solute must not be substantial for adequate solubilization.
Hydrotropic agents that are not hydrophobic in some aspect are not effective at all. From this it
would seem that TCAP would not solubilize well with sucrose as an additive and this is
discussed and substantiated in the results section.
A balance needs to be achieved whereby the agent has maximum hydrophobicity without
sacrificing water solubility. It is possible to increase the hydrotropic property by a factor of two
with the addition of a methyl group or ring (non-polar moiety) and consistently, one can decrease
the hydrotropic property with the addition of a polar hydroxyl moiety. Also, one longer
hydrophobic chain appears to be more effective than two shorter hydrophobic chains. The
importance of pyridine and benzene rings on the hydrotrope has also been investigated. Arginine
has been said to have the properties similar to a pyridine ring and to the structure of cyclodextrin.
These will be discussed in detail.
Many techniques are in use to investigate the hydrotropy of a peptide. It is possible to analyse
peptides in solution for their hydrotropic effect using pyrene solubility or 1-anilino-8-
naphthhalene sulfonic acid fluorescence, mass spectrometry, light scattering, reverse phase
chromatographic profiling, changes in hydrodynamic volume as measured by size exclusion
chromatography, atomic force microscopy and solubility measurements (Das et al., 2007). Of
these, light scattering was performed on the set of formulations designed to dissolve TCAP as an
initial starting point.
Problems associated with studying TCAP and other peptides
The evidence found so far indicates that TCAP is a bioactive peptide and likely plays an
important role in the regulation of neuronal function. However, in order to study TCAP and
other peptides, it is important to understand the best way to treat the peptide in order to perform
studies in the animal. It is possible that TCAP and other peptides could be used in the treatment
of some brain related diseases. If so, then the peptide needs to be administered to the animal so

12
that it gains entry into the brain. One of the problems of peptides gaining entry into the brain is
the blood brain barrier (BBB).
In the rest of the body outside the brain, the walls of the capillaries (the smallest of the blood
vessels) are made up of endothelial cells which are fenestrated, meaning they have small gaps.
Chemicals soluble in aqueous solutions can pass through these gaps, from blood to tissues or
from tissues into blood. However in the brain endothelial cells are packed together more tightly
with what are called tight junctions. This blocks the movement of all molecules except those
that cross cell membranes by means of lipid solubility (such as oxygen, carbon dioxide, ethanol,
and steroid hormones), by specific transport systems (such as sugars and some amino acids) and
by low molecular weight of under 500 daltons. Tight junctions have been found outside of the
brain in differentiated human airway epithelia (Vermeer et al., 2003) and may reside in other
tissues still to be discovered.
In terms of degradation, the endothelial cells metabolize certain molecules to prevent their entry
into the central nervous system. For example, L-DOPA (L-3,4-dihydroxyphenylalanine), the
precursor to dopamine, can cross the BBB, whereas dopamine itself cannot. As a result, L-
DOPA is administered for dopamine deficiences such as Parkinson's disease rather than
dopamine. TCAP also needs to be in a stable form that is protected from degradation in
biological media. Currently, TCAP has not been isolated and purified endogenously and
therefore, the molecular form in circulation is not known (Lovejoy et al., 2009). Based on
preliminary experiments, TCAP appears to circulate in a bound form in the blood (Trubiani, Al
Chawaf and Lovejoy, unpublished results). Mechanisms of peptide circulation and inactivation
are of importance: physiologically, as a method of terminating the hormone message;
therapeutically, as a method of regulating the concentrations of exogeneous hormones in terms of
duration and magnitude of their actions; pharmacologically, as a tool for the development of
analogues with improved properties.
In addition to the role of tight junctions in preventing transport between endothelial cells, there
are two mechanisms to prevent passive diffusion through the cell membranes of hydrophilic
molecules. Glial cells surrounding the capillaries in the brain pose a secondary hindrance to
hydrophilic molecules, and the low concentration of interstitial proteins in the brain prevent
access by hydrophilic molecules.
13
The blood-brain barrier protects the brain from numerous chemicals in the blood. In doing so
however, many hormones necessary for bodily functions are also prevented from access to the
brain once secreted into circulation. This would prevent the brain from directly monitoring the
rate of hormone secretion. However, there are specialized structures bordering the 3rd and 4th
ventricles where neurons have access to the circulation and these include the pineal organ,
median eminense, subfornical organ, area postrema, subcommissural organ and organum
vasculosum of the lamina terminalis (OVLT) (the posterior pituitary may also share this
property). It is these areas where TCAP may cross into the brain and modulate CRF behaviours.
Objectives and Hypothesis
In conclusion, TCAP-teneurin system is an important peptide-protein system for the normal
function of the nervous system. The hallmarks of a biologically active peptide have been
confirmed for TCAP: it has 2 putative furin cleavage sites that generate an amidated peptide
from a larger transmembrane II protein, Teneurin.
TCAP is a novel peptide of which much is still unknown. The structure of TCAP in its native
form has yet to be elucidated as well as much of its molecular activity within the cell. Therefore,
one of the objectives of this study was to establish useful solvents for the peptide that are
compatible with biological systems. These solvents can form a basis of further peptide
formulation, a set of solvents and stabilizers, designed to keep the peptide in the biologically
active form for a certain period of time under certain conditions. The significance of this
characterization is critical for developing future research goals such as identifying signal
transduction pathways activated by TCAP.
It is also necessary to measure the amount of TCAP in tissues or that is added to tissues to
understand the physiological concentrations of the peptide required to elicit a biological
response. With a synthetic version of mouse TCAP-1 now available, it is necessary to determine
the parameters required to investigate the peptide. Having these goals in mind, the following
objectives were accomplished.
I. Determine the solubilization characteristics and chemistry of TCAP in solution
II. Development of an enzyme-linked immunosorbent assay (ELISA) and extraction
methods for quantification and extraction of TCAP in biological media such as serum
III. Determine the signal transduction pathways functionally affected by TCAP

14
Chapter Two
Solubilization and chemistry of TCAP
Abstract
Little is known about the solubility characteristics of TCAP. Previous studies have used
ammonium vapour to solubilize the peptide. However, this method is not practical to solubilize
large amounts of the peptide nor is it consistent between batches. It is necessary to determine the
solubilization characteristics and chemistry of TCAP in solution. Therefore, several different
buffer systems using various excipient reagents were used to solubilize synthetic TCAP-1. The
amount of solubility was determined spectrophotometrically. In addition, the solubility of TCAP
in the various buffer systems was examined under a variety of conditions of storage to determine
its stability. A few pharmacological parameters in terms of administration were looked at as well
including surface adhesion and its stability in serum.
Introduction
In living systems, proteins are present in aqueous solutions amongst a high concentration of
other macromolecules. The total concentration of all solute molecules (greater than 100mg/ml)
contributes to protein folding to native and biologically active states. The high concentration of
molecules among peptides and proteins in compact conformation take up more space than the
surrounding volume thus increasing the steric repulsion that molecules exert on each other in the
absence of ion exchange. Furthermore this condition can be said to result from the impossibility
of two molecules occupying the same space at the same time in solution, which thereby
encourages functional protein conformation. This phenomenon is referred to as the volume
exclusion effect. We exploit this effect to create a suitable formulation for solubilizing TCAP in
vitro with the use of amino acids L-arginine and L-histidine.
Bioactive amphiphilic peptides such as TCAP may possess a number of different secondary
structures depending upon their ambient environment. The solubility characteristics are a result
of their evolution in these complex biological systems. Thus for many peptides, they do not

15
dissolve well in water for example. Many peptides aggregate in aqueous environments such as
water significantly reducing their biological activity.
TCAP is a newly discovered peptide and little is known about these characteristics. Also not
known is how the peptide is processed from its precursor protein, Teneurin, and therefore, the
kinds of environments it is motile in. However the peptide is made available, when signaled, it
circulates in the bloodstream to specific target tissues. In many cases the message is conveyed to
the target cell via a cell surface receptor for the peptide, and rapid degradation, often mediated by
receptor binding and internalization, seems to be a common set of events. We clearly need to
define the conformation of (poly)peptides during this complex life cycle if we are to understand
the various processes at the molecular level that are necessary for therapeutic administration
(Blundell and Woods, 1982).
Therefore, this study was performed to establish a useful formulation for the peptide that is
compatible with biological systems. A series of formulations were prepared to adequately
solubilize TCAP-1 based on analysis of its amino acid sequence. TCAP has a series of
hydrophobic and hydrophilic residues indicating an amphiphilic character. However, there are
more acidic residues and basic residues resulting in a neutral molecule at pH of 4.4 (referred to
as isoelectric point or pI). Thus, our hypothesis was that TCAP might be soluble in buffers with
pH above 7. A weak solution of ammonia was the solvent of choice before this work started as
this has been used in the past to solubilize peptides with a similar chemical character as TCAP-1.
Solubilizing Agents used in Peptide Formulations
Numerous chemical agents have been used in peptide formulations that act to enhance the
solubility by stabilizing pH and peptide structure. A number of them can be used for these
chemical studies, but comparatively few can be used for biological studies as many of these
excipients can have injurious effects on biological tissues.
The use of arginine in TCAP-1 solubilization solutions is particularly useful. These formulations
are used typically to solubilize amphiphilic type peptides like TCAP because of their specific
chemical interactions with the peptide in solution. L-arginine is one of three basic amino acids
(lysine and histidine are the others) and therefore it is hydrophilic in character. The arginine side
chain consists of three non-polar methylene groups followed by the strongly basic (and planar)
16
guanidinium group. It has an pI of ~11.5 indicating a positive guanidinium group at pH levels
below this pI. The protonated guanidinium groups interact with deprotonated carboxyl (COO-)
groups in the peptide for solubilization. The guanidinium group allows the molecule to exhibit
properties of aromaticity or resonance, whereby the structure allows electrons to evenly
distribute around the molecule. This contributes to a stronger stabilization than would be
expected by the stabilization of conjugation alone as well as an increase in basic character. The
methylene groups of the arginine molecules may also be involved in the solubilization of
peptides with a hydrophobic character. In solution, arginine molecules are observed in clusters
(Das et al., 2007). One explanation given for this behaviour is that the methylene groups align
with each other and present a hydrophobic surface capable of binding hydrophobic areas of
peptides that would otherwise bind to one another and, thereby, prevents hydrophobic surface
induced aggregation. The masking of the hydrophobic surface likely suppresses protein-protein
interactions. Noteworthy, is possibility for the guanidinium group to contribute to protein-DNA
recognition via its interactions with phosphate groups on the DNA backbone. Therefore, the
biological activity of protein may be altered if arginine is used as an additive.
A number of other chemicals have also been used successfully to solubilize peptides. Dialkyl
amphiphiles are used to solubilize molecules with a hydrophobic character of which sodium
dodecyl sulfate (SDS) is most studied. The nature of the SDS interactions are dependent on the
SDS concentration and the SDS:peptide ratio (reviewed in Meyer and Manning, 1998). At high
concentrations, SDS forms micelles capable of solubilizing a variety of organic compounds.
However, this reagent has limited use in biological systems because of its toxicity which is
exacerbated at high concentrations. Okahata and Ijiro (1988) reported using a concentration of
dialkyl amphiphiles sufficient to coat the surface of the peptide with SDS but less than required
in the formation of micelles. In this method, there is less available water when using lower
quantities of SDS which may also be advantageous for the stability of the peptide under certain
storage conditions. More recently, Powers et al., (1993) described a way to solubilize peptides
using SDS by forming hydrophobic ion pair with N-terminals of either basic groups of amino
acids or the free N-terminal of the first amino acid in the peptide. In this concentration regime,
the amount of SDS required is roughly stoichiometric with the number of basic groups in the
peptide and the SDS to peptide ratio is more than a magnitude less than other methods of
solubilization using SDS. Cyclodextrin-based formulations are also used to solubilize
17
amphiphilic peptides by a molecular phenomenon known as solvent inclusion. Cyclodextrin has
a hydrophobic cavity that associates with any hydrophobic portions of the peptide while the
hydrophilic outer surface interacts with the polar solvent, which is usually water because of its
extreme polarity. Polar solvents minimize any competition between the peptide and the solvent
for the apolar cavity. A variety of non-covalent forces such as van der Waal, hydrophobic
interaction, dipole moment and others are also involved in the formation of a stable complex
with the cyclodextrin molecule. Bicarbonate-based formulations utilize the buffering capacity of
the carbonate ion for dissolving peptides. This application is borrowed from observations in
nature. Our digestive system, for example, uses bicarbonate to dissolve secretory enzymes in
acidic environments. These proteins aggregate under storage in vesicles at high concentrations
and would remain insoluble when released from the acidity of the vesicle without the co-
secretion of bicarbonate to neutralize the environment (Freedman and Scheele, 1994).
A series of formulations have been selected based on the amino acid composition of TCAP and
isoelectric point. These formulations will be tested for solubility in a spectrophotometer and
subsequently for epitope recognition (an indictor of proper conformation) in an ELISA.
Materials and Methods
Peptide Synthesis
Mouse TCAP-1 was synthesized as previously reported (Wang et al., 2005). Briefly, the peptide
was prepared on an automated peptide synthesizer, Model Novayn Crystal (NovaBiochem, UK
Ltd. Nottingham, UK) on PEG-PS (poly(ethylene glycol) polystyrene) resin using continuous
flow Fmoc chemistry (Calbiochem-Novabiochem Group, San Diego, CA) (Wang et al., 2005).
Eight times excess diisopropyl ethyl amine (Sigma Aldrich Canada Ltd) and four times excess
Fmoc-amino acid activated with HATU (O-7-azabenzotriazol-1-,3,3-tetramethyluronium
hexfluorophosphate, Applied Biosystems, Foster City, CA) at a 1:1 (mole/mole) ratio were used
during the coupling reaction. A solution of 20% piperidine (Sigma-Aldrich Canada Ltd) in N,N-
dimethylformide (DMF; Caledon Laboratories Ltd, Canada) was used for the deprotection step
in the synthesis cycle. The cleavage/deprotection of the final peptide was carried out with
trifluoroacetic acid (TFA), thioanisole, 1,2 ethandithiol, m-cresole, triisopropylsilane, and
bromotrimethyl silane (Sigma-Aldrich Canada Ltd) at a ratio of 40:10:5:1:1:5. Finally, it was
desalted on a Sephadex G-10 column using aqueous 0.1% TFA solution and lyophilized.
18
Confirmation of the homogeneity of the synthetic peptide was determined by reverse-phase
HPLC. A Beckman model 126 HPLC System Gold (Beckman, Palo Alto, CA), attached to a UV
detector module 168 and C18 column (3.5µm particle size; Waters Inc) was used to purify the
TCAP peptide. A single injection (50µl) was applied to the column through a 100 µl injection
loop and carried to the column at a flow rate of 0.1ml/min using a dual solvent system (A: 0.05%
trifluoroacetic acid (TFA); B: 80% acetonitrile, 0.05% TFA). The mobile phase B was increased
from 0% to 60% over 80 min. Samples were dissolved in 5ml of 1:1 (vol/vol) acetonitrile:water
(plus 0.1% (vol/vol) formic acid). Typically, 2-3ml of each sample was loaded on a glass
capillary probe tip and analyzed on a Micromass Q-TOF (hybrid quadrupole time of flight) mass
spectrometer (Micromass, Manchester, UK). All spectra were acquired under nanospray,
positive-ion mode. For MS measurements the quadrupole RF value was set at 0.5. The scanning
region (m/z) was between 200-2000 with a scan time of 1s and a dwell time of 0.1s. The data
was analyzed using MassLynx program (Micromass, Manchester, UK).
Hydropathy Plots
The hydrophobicity of mTCAP-1 and CRF were analysed using the well-established Kyte-
Doolittle (1982) and Hopp-Woods (1981) hydropathy scales. Each residue is assigned a value
based on the scale and an average value of a set number of residues (referred to as the window)
is calculated. The window shifts to the right by one residue until the entire sequence is
computed. The values were plotted as a function of window number for both sets of criteria.
The tendency to form alpha helix and beta sheet was analysed using methods outlined by Chou-
Fasman (1978). Each residue was assigned a value, positive for a tendency to form an alpha
helix or beta strand and negative for a tendency to break the structure, and plotted as a function
of window number according to the same method for hydrophobicity above. Stretches of 6 or
more and 5 or more positive residues suggest alpha helix and beta sheet formation, respectively.
Light Scattering/Turbidity Measurements
The optical density (OD) of each formulation was measured at the following wavelengths (nm):
205, 280, 350, 450, 500 using a SPECTRAmax PLUS 384 microplate spectrophotometer
(Molecular Devices, CA, USA). Aggregate solubilization was indicated by the absorption at
wavelengths above 280 nm.

19
[Q1]-mTCAP-1 solubility in various solubilizing agents
Lyophilized [Q]-mTCAP-1 was dissolved in the following solubilizing agents to a final
concentration of 1mg/ml: ddH2O, pH7; cyclodextrin 0.1M, pH7; cyclodextrin 0.1M + sodium
citrate 2%, pH9; ddH2O + ammonium hydroxide vapour, pH7; ammonium citrate dibasic 0.1M,
pH5; ammonium citrate tribasic 0.1M, pH6.5; L-arginine 200mM, pH10; ammonium hydroxide
0.1M, pH10; ammonium phosphate dibasic 0.1M, pH8; PBS (phosphate-buffered saline) +
0.18mg/ml SDS, pH9; 0.1% PEG-3350, pH7; 0.1% PEG-8000, pH5. The OD was measured
according to the light scattering measurements described above.
mTCAP-1 solubility in various solubilizing agents
Lyophilized mTCAP-1 was dissolved in the following solubilizing agents to a final concentration
of 1mg/ml: ddH2O + ammonium hydroxide vapour; cyclodextrin + 2% sodium citrate; PBS +
0.18mg/ml SDS; ammonium phosphate dibasic 0.1M; L-arginine 200mM; L-arginine 200mM,
H3PO4 10ng/ml, polysorbate 80 0.11mg/ml. The OD was measured according to the light
scattering measurements described above.
Recognition of mTCAP-1 epitope by ELISA in selected solubilizing agents
The following solubilizing agents were tested in ELISA according to optimized protocol
described in Chapter 3: ddH20 + ammonium hydroxide vapour; ammonium phosphate dibasic
0.1M; L-arginine 200mM; PBS + 0.18mg/ml SDS. See Chapter 3 Materials and Methods for
detailed ELISA protocol and preparation of test samples.
TCAP solubility in 200mM L-Arginine – Titration of pH
mTCAP-1 dissolved to a concentration of 1mg/ml in 200mM L-Arginine with polysorbate 80 at
0.11mg/ml, has a pH of 11.6. The addition of phosphoric acid was used to lower the pH to the
various levels described below. The OD of each sample was measured using the SPECTRAmax
and mTCAP precipitation was determined by light scattering methods described. The solutions
used were: pH 11.6, no phosphoric acid; pH 10, 0.04M phosphoric acid; pH 9, 0.1325M
phosphoric acid; pH 8.6, 0.164M phosphoric acid; pH 8, 0.189M phosphoric acid; pH 7.3, 0.21M
phosphoric acid and pH 7, 0.22M phosphoric acid. These formulations of TCAP in L-arginine
were also assessed in ELISA so that peptide content was consistent across formulations and, with
exception of the ammonium phosphate, all solutions measured same peptide concentration.

20
TCAP solubility in L-arginine based buffers with the inclusion of various excipients: comparison with three other buffer systems
TCAP was lyophilized in a Freezone 4.5 freeze dry system (Labconco, Kansas City, MO).
Lyophilized mTCAP-1 from -20°C storage was dissolved to a concentration of 1mg/ml in the
following buffers: ddH2O + NH4OH vapour, pH7; L-arginine 20mM + H3PO4 0.1325M pH9; L-
arginine 20mM + HCl to pH9; L-arginine 20mM KH2PO4 pH8.8; L-arginine 20mM K/K2PO4
5mM pH9; L-arginine 20mM KH2PO4 pH9; L-arginine 20mM KH2PO4 + 9% sucrose pH9;
KH2PO4 10mM pH9; Na2CO3 20mM NaOH 1mM HCl to pH9; Histidine 100mM pH6.9. The
samples were vortexed and left to stand for 15-30 minutes.
a) The OD of each sample was measured using the SPECTRAmax and mTCAP
precipitation was determined by light scattering methods described.
b) Each formulation was subjected to five freeze-thaw cycles and long-term storage.
Recovery of TCAP material was determined by ELISA. See Freeze-thaw protocol and
long-term protocol for methodology.
Recovery of mTCAP-1 in ammonium-based buffers after long-term storage (2 weeks) at 4°C, 22°C and 37°C
The above L-arginine based buffers and comparison buffer systems at a volume of 30µl were
placed at 4°C in the fridge, 22°C on the bench, and 37°C in the incubator for the indicated period
of time. On the day of ELISA, an aliquot of 5µl was taken out of a tube under each storage
condition to be tested in ELISA and the remaining sample in the tube returned to the designated
condition for continued storage to be tested at later timepoints if degradation is not 100% and
peptide remains.
Recovery of mTCAP-1 in ammonium-based buffers after subjugation to five freeze-thaw cycles
The following formulations were made to a concentration of 1mg/ml: ddH20 + NH4OH vapour,
pH7; ddH2O + NH4OH vapour in excess, pH 9; ddH20 + NH4OH vapour, pH7 with shortened
freezing time; L-arginine 20mM K2HPO4 5mM pH9; K2HPO4 10mM pH9; Na2CO3 20mM
NaOH 0.1mM HCl to pH9; Histidine 100mM pH6.9. Polysorbate 80 at 0.11mg/ml was added to
all formulations. A volume of 50µl was used for freeze-thaw cycles. An aliquot of 5µl was
initially taken out as the unfrozen sample and kept in the fridge 4°C for the duration of the

21
experiment. All samples were frozen completely at -80°C for 40min (or 20min in the case of the
ddH2O + ammonium vapour duplicate) and then thawed completely at 37°C in a waterbath. The
samples were then vortexed and spun briefly. An aliquot of 5µl was taken out after each cycle,
placed into an eppendorf tube and stored in the fridge 4°C. This was completed 5 times and only
cycles 1, 3, and 5 were collected for assay in ELISA the following day. The standard curve was
made with ddH2O + ammonium vapour TCAP that was frozen.
Recovery of mTCAP-1 in ammonium-based and standard buffers after dehydration by vacuum centrifugation (as determined by ELISA)
mTCAP-1 was dissolved in the following formulations to a concentration of 1mg/ml: ddH20 +
NH4OH vapour; L-arginine 20mM, 5mM K2HPO4 polysorbate pH9; K2HPO4 10mM
polysorbate; Na2CO3 20mM, 0.1mM NaOH HCl to pH8.5 polysorbate; Histidine 10mM
polysorbate. [polysorbate] = 0.11mg/ml. The samples were dissolved for 15-30 minutes, placed
into a vacufuge (Eppendorf) connected to a Vac V-500 vacuum system (Büchi, Switzerland) and
dried completely. The samples were kept in the fridge at 4°C overnight and reconstituted in
water prior to their assay in ELISA on the following day.
Recovery of mTCAP-1 in ammonium-based buffers after lyophilization and storage
The following formulations were used to dissolved mTCAP-1 at 1mg/ml: ddH20 + NH4OH
vapour, ddH20 + 10-fold excess of NH4OH vapour, L-arginine 20mM 5mM K2HPO4 pH9,
K2HPO4 10mM pH9, Na2CO3 20mM 0.1mM NaOH HCl to pH9, Histidine 100mM pH6.9. All
formulations have 0.11mg/ml polysorbate 80 added. The samples were dissolved for 15-30
minutes in eppendorf tubes bearing screw caps for a complete seal (VWR, cat # 16466-064) and
then frozen at -80°C. The samples were then lyophilized in a Freezone 4.5 freeze dry system
(Labconco, Kansas City, MO). Immediately after lyophilization, parafilm was used to seal the
tubes to prevent moisture entry. Samples from each formulation were stored at 4°C in the fridge,
22°C on the bench and 37°C in the incubator and assayed in ELISA at a specific time. Samples
were reconstituted in water prior to ELISA.
Short-term storage at -80°C and 4°C of mTCAP-1 in ammonium-based buffers
The samples were dissolved in the following formulations at 1mg/ml: ddH20 + NH4OH vapour
pH7; L-arginine 20mM, 5mM K2HPO4, pH9; K2HPO4 10mM, pH9; Na2CO3 20mM, NaOH
0.1mM, HCl to pH9. The samples were stored for a certain number of days at -80°C storage and
22
then placed into the fridge for 4°C storage for a certain number of days (see figure 2.13 for
specific times) prior to assay in ELISA.
37°C incubation on recovery of biotinylated TCAP from serum
[K8]-mTCAP-1 and [K37]-mTCAP-1 were dissolved in thawed rat serum from -20°C storage
(collected from control animals of previous experiments) to a concentration of 50ng/ml and a
volume of 40µl. The samples were incubated in a waterbath at 37°C for 0, 15min, 30min, 1h,
1h30min, 2h, 3h, 4h. At the necessary time, an aliquot of 5µl was collected and stored in the
fridge 4°C overnight. Samples were diluted 1/10 and assayed in ELISA.
Polysorbate influence on recovery of mTCAP-1 in ELISA
Samples were assayed in ELISA with and without the addition of polysorbate 80 at 0.55mg/ml
and 0.11mg/ml.
Results
The amphilicity and secondary structure of TCAP-1 was determined theoretically using
previously published methods of structure prediction (Kyte and Doolittle, 1982; Chou and
Fasman, 1978; Hopp and Woods, 1981). Several other hydrophobicity scales have been
published for various uses. In the case of TCAP, a 41 amino acid highly motile peptide lacking a
defined tertiary structure, we are concerned with antigenic regions rather than transmembrane
regions characteristic of its parent molecule. Using the Kyte-Doolittle analysis, TCAP has a
hydrophobic region of 7 residues around 15-21 indicated by an average hydrophobic index above
1 in Figure 2.1B. This is consistent in both methods of analysis where the same region of TCAP
has a hydrophilic index less than -1 using the Hopp-Woods method (Figure A). Also apparent is
the variation between the profiles of TCAP compared to that of CRF. Figure C and D illustrate
the propensity of forming a helix or a beta strand using the Chou-Fasman parameters. CRF has a
propensity above 1 to form alpha helicies over its entire sequence where as TCAP has a helix-
forming region around residues 18-27 (Figure 2.1C). Interestingly, TCAP also has the
propensity to form a beta sheet around the same residues 14-22 and also 32-37 while CRF has
propensity values conducive to beta-sheet forming around residues 8-14 (Figure 2.1D). Once the
probability of a peptide having a particular structure is established, experimental approaches are
necessary to test the hypothesis and establish the existence of such a conformation.

23
Figure 2.1: Hydropathy Measurements. A. Hopp-Woods scale, window size of 6; B. Kyte-Doolittle scale window size of 7; C. Chou-Fasman propensity for alpha helix scale window size of 6; D. Chou-Fasman propensity for beta strand scale window size of 5. The window size was selected on what was considered optimum for each analysis.
Upon visual inspection it was obvious that some solvents dissolved TCAP (clear solution) and
some did not (cloudy solution, particulates present) thus, we used a spectrophotometric method
to quantify this observation. The presence of large particles in solution results in passing light
being scattered in all directions thus the light passing through is diminished and optical density
(OD) is greater. OD is a sum of absorption of light and light scatter by large particles. TCAP-1,
being a peptide, when completely dissolved should only absorb light within the UV range at 220-
280nm (for example, see Fig. 2.2B), thus any increase in OD in the visible range (above 280nm)
should indicate light scatter of undissolved particles (for example, see Fig. 2.2A).
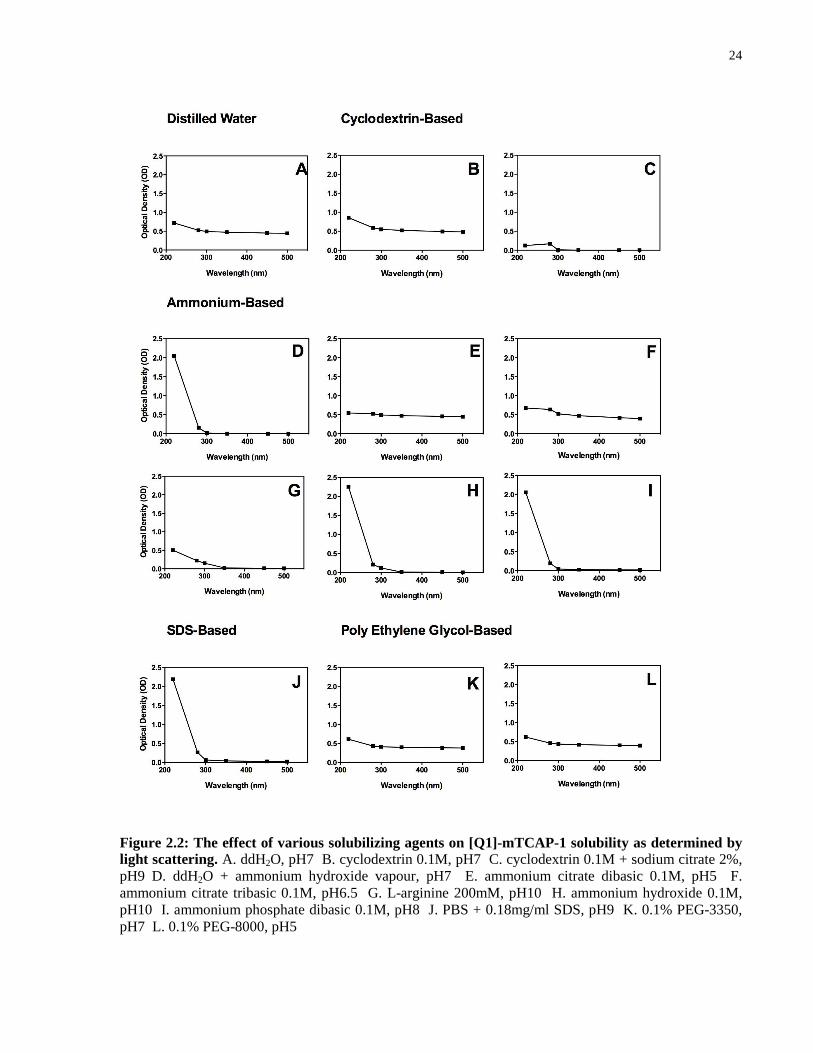
24
Figure 2.2: The effect of various solubilizing agents on [Q1]-mTCAP-1 solubility as determined by light scattering. A. ddH2O, pH7 B. cyclodextrin 0.1M, pH7 C. cyclodextrin 0.1M + sodium citrate 2%, pH9 D. ddH2O + ammonium hydroxide vapour, pH7 E. ammonium citrate dibasic 0.1M, pH5 F. ammonium citrate tribasic 0.1M, pH6.5 G. L-arginine 200mM, pH10 H. ammonium hydroxide 0.1M, pH10 I. ammonium phosphate dibasic 0.1M, pH8 J. PBS + 0.18mg/ml SDS, pH9 K. 0.1% PEG-3350, pH7 L. 0.1% PEG-8000, pH5
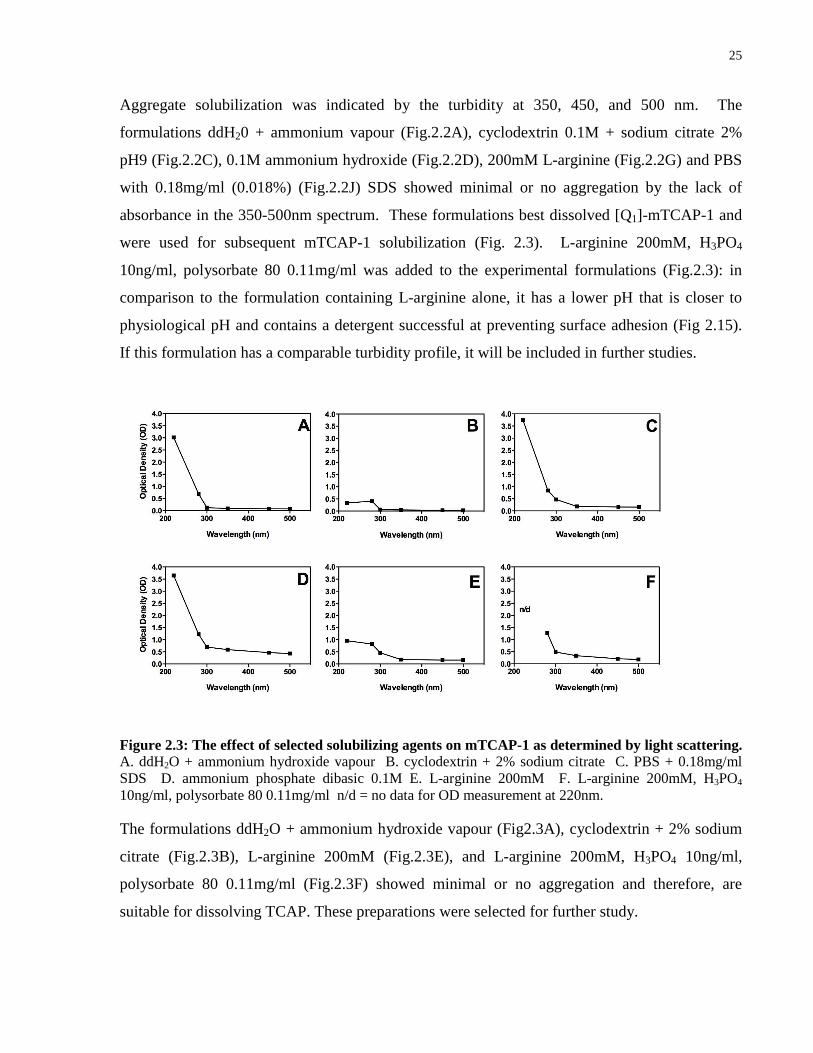
25
Aggregate solubilization was indicated by the turbidity at 350, 450, and 500 nm. The
formulations ddH20 + ammonium vapour (Fig.2.2A), cyclodextrin 0.1M + sodium citrate 2%
pH9 (Fig.2.2C), 0.1M ammonium hydroxide (Fig.2.2D), 200mM L-arginine (Fig.2.2G) and PBS
with 0.18mg/ml (0.018%) (Fig.2.2J) SDS showed minimal or no aggregation by the lack of
absorbance in the 350-500nm spectrum. These formulations best dissolved [Q1]-mTCAP-1 and
were used for subsequent mTCAP-1 solubilization (Fig. 2.3). L-arginine 200mM, H3PO4
10ng/ml, polysorbate 80 0.11mg/ml was added to the experimental formulations (Fig.2.3): in
comparison to the formulation containing L-arginine alone, it has a lower pH that is closer to
physiological pH and contains a detergent successful at preventing surface adhesion (Fig 2.15).
If this formulation has a comparable turbidity profile, it will be included in further studies.
Figure 2.3: The effect of selected solubilizing agents on mTCAP-1 as determined by light scattering. A. ddH2O + ammonium hydroxide vapour B. cyclodextrin + 2% sodium citrate C. PBS + 0.18mg/ml SDS D. ammonium phosphate dibasic 0.1M E. L-arginine 200mM F. L-arginine 200mM, H3PO4 10ng/ml, polysorbate 80 0.11mg/ml n/d = no data for OD measurement at 220nm.
The formulations ddH2O + ammonium hydroxide vapour (Fig2.3A), cyclodextrin + 2% sodium
citrate (Fig.2.3B), L-arginine 200mM (Fig.2.3E), and L-arginine 200mM, H3PO4 10ng/ml,
polysorbate 80 0.11mg/ml (Fig.2.3F) showed minimal or no aggregation and therefore, are
suitable for dissolving TCAP. These preparations were selected for further study.

26
Figure 2.4: Recognition of mTCAP-1 epitope by ELISA in selected solubilizing agents. A. ddH20 + ammonium hydroxide vapour B. ammonium phosphate dibasic 0.1M C. L-arginine 200mM D. PBS + 0.18mg/ml SDS. The horizontal and vertical dashed lines indicate the amount of TCAP at the BC50. Experiment was done in triplicates where the solid and dashed curves represent non-linear regression curve and standard error respectively. See Chapter 3 for detail on the preparation and development of the ELISA.
In addition to solubility, it is imperative that the peptide, once dissolved, maintains its native
conformation. One indication of proper conformation is epitope preservation. An ELISA is
based on epitope recognition by antibodies in antiserum and was used to evaluate candidate
formulations. The ELISA will be discussed in greater detail in Chapter 3. The epitope
recognition is measured by a point on the curve called Binding Capacity (BC) 50. These values
are used as a measure of sensitivity: the lower the concentration of peptide required for 50%
binding, the more sensitive the epitope-antibody recognition. The BC50 values, and therefore
the greatest sensitivity in terms of epitope preservation of mTCAP-1, in ascending order are:
ammonium phosphate 0.1M = 6.0-9.3ng/ml, PBS in 0.18 mg/ml = 3.3-5.3ng/ml, ammonium
vapour = 3.3-4.7ng/ml, L-arginine 200mM = 2.5-3.8ng/ml. From the data, L-arginine 200mM
has the greatest sensitivity.

27
These studies indicated that the L-arginine formulation was excellent for solubilizing TCAP
(Fig.2.3E) and was the most sensitive formulation in ELISA when BC50 values were compared.
Therefore, this formulation was selected for further studies exploring the turbidity profile of
various excipients added to the L-arginine formulation.
Figure 2.5: The effect of pH on L-arginine-based mTCAP-1 solubilization as determined by light scattering.
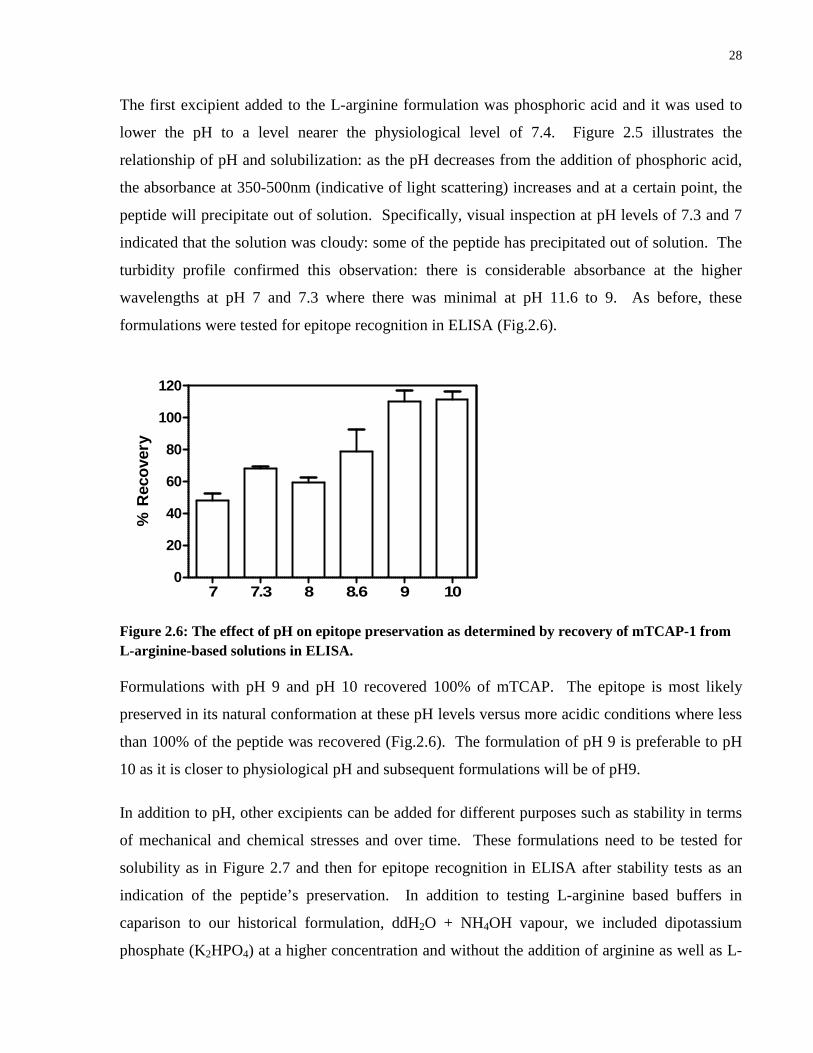
28
The first excipient added to the L-arginine formulation was phosphoric acid and it was used to
lower the pH to a level nearer the physiological level of 7.4. Figure 2.5 illustrates the
relationship of pH and solubilization: as the pH decreases from the addition of phosphoric acid,
the absorbance at 350-500nm (indicative of light scattering) increases and at a certain point, the
peptide will precipitate out of solution. Specifically, visual inspection at pH levels of 7.3 and 7
indicated that the solution was cloudy: some of the peptide has precipitated out of solution. The
turbidity profile confirmed this observation: there is considerable absorbance at the higher
wavelengths at pH 7 and 7.3 where there was minimal at pH 11.6 to 9. As before, these
formulations were tested for epitope recognition in ELISA (Fig.2.6).
7 7.3 8 8.6 9 100
20
40
60
80
100
120
% R
eco
very
Figure 2.6: The effect of pH on epitope preservation as determined by recovery of mTCAP-1 from L-arginine-based solutions in ELISA.
Formulations with pH 9 and pH 10 recovered 100% of mTCAP. The epitope is most likely
preserved in its natural conformation at these pH levels versus more acidic conditions where less
than 100% of the peptide was recovered (Fig.2.6). The formulation of pH 9 is preferable to pH
10 as it is closer to physiological pH and subsequent formulations will be of pH9.
In addition to pH, other excipients can be added for different purposes such as stability in terms
of mechanical and chemical stresses and over time. These formulations need to be tested for
solubility as in Figure 2.7 and then for epitope recognition in ELISA after stability tests as an
indication of the peptide’s preservation. In addition to testing L-arginine based buffers in
caparison to our historical formulation, ddH2O + NH4OH vapour, we included dipotassium
phosphate (K2HPO4) at a higher concentration and without the addition of arginine as well as L-

29
histidine, another amino acid in addition to L-arginine. Both of these additions are based on the
volume exclusion effect as discussed in chapter one.
Figure 2.7: The effect of various excipients on L-arginine-based buffers in comparison with three other buffer systems as determined by light scattering. A. ddH2O + NH4OH vapour, pH7 B. L-arginine 20mM + H3PO4 0.1325M pH9 C. L-arginine 20mM + HCl to pH9 D. L-arginine 20mM KH2PO4 pH8.8 E. L-arginine 20mM K/K2PO4 5mM pH9 F. L-arginine 20mM K2HPO4 pH9 G. L-arginine 20mM K2HPO4 + 9% sucrose pH9 H. K2HPO4 10mM pH9 I. Na2CO3 20mM NaOH 1mM HCl to pH9 J. Histidine 100mM pH6.9
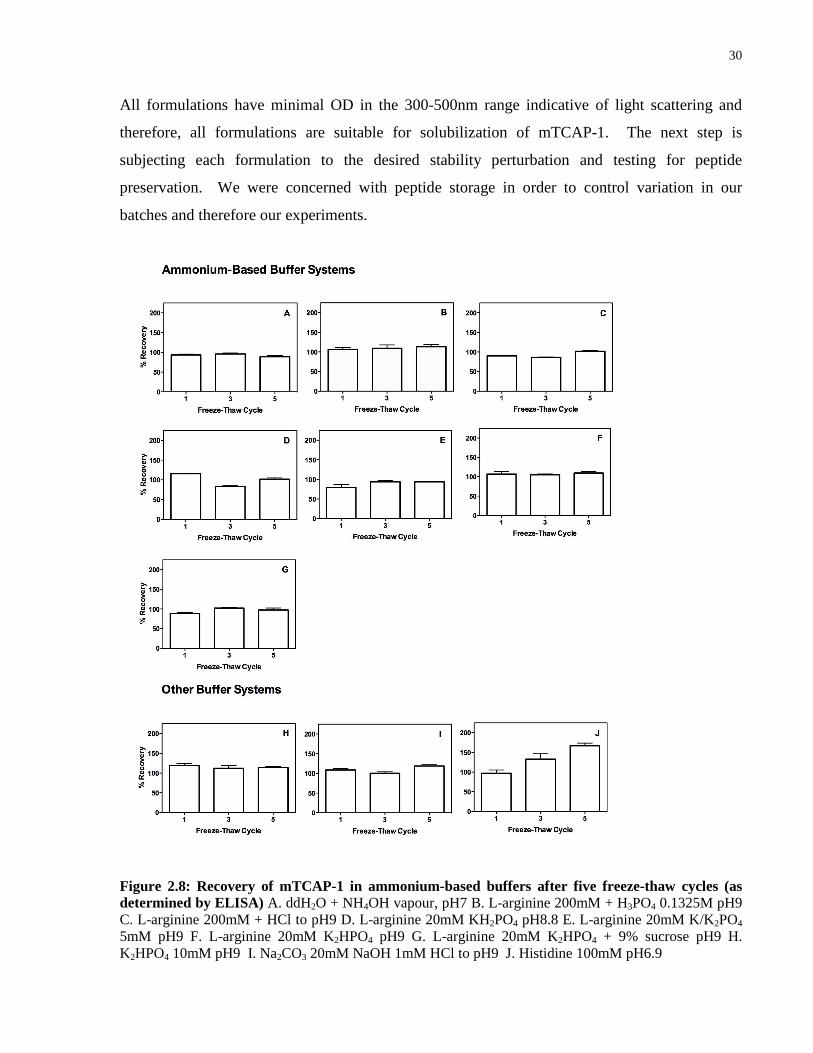
30
All formulations have minimal OD in the 300-500nm range indicative of light scattering and
therefore, all formulations are suitable for solubilization of mTCAP-1. The next step is
subjecting each formulation to the desired stability perturbation and testing for peptide
preservation. We were concerned with peptide storage in order to control variation in our
batches and therefore our experiments.
Figure 2.8: Recovery of mTCAP-1 in ammonium-based buffers after five freeze-thaw cycles (as determined by ELISA) A. ddH2O + NH4OH vapour, pH7 B. L-arginine 200mM + H3PO4 0.1325M pH9 C. L-arginine 200mM + HCl to pH9 D. L-arginine 20mM KH2PO4 pH8.8 E. L-arginine 20mM K/K2PO4 5mM pH9 F. L-arginine 20mM K2HPO4 pH9 G. L-arginine 20mM K2HPO4 + 9% sucrose pH9 H. K2HPO4 10mM pH9 I. Na2CO3 20mM NaOH 1mM HCl to pH9 J. Histidine 100mM pH6.9

31
The first perturbation is freeze-thawing a peptide in solution. All formulations in Figure 2.8 are
able to be frozen at -80ºC and thawed at least five times as shown by 100% recovery of mTCAP-
1 in ELISA. Interestingly, the histidine 100mM pH6.9 formulation has a recovery above 100%.
This increase in recovered amount of TCAP was reconciled when repeated in another
experiment: the recovery over five freeze-thaw cycles was 100% (Fig. 2.10G). A possible
explanation for what is occurring is that the solution upon thawing is more concentrated due to
evaporation of water in the buffer. As a solution containing water freezes, the solute is restricted
to the bottom and center of the solution as the sides and top containing the water freeze. Water
freezes at a higher temperature than that containing a solute. The part of the solution containing
the solute will freeze as well as the temperature decreases. When thawed, the water is at the top
and subject to evaporation. There are other cases of greater than 100% recovery in Figure 2.10
and the same explanation can be applied to these results.
Figure 2.9: Recovery of mTCAP-1 in ammonium-based buffers after two weeks of storage at 4ºC, 22ºC and 37ºC. A. ddH2O + NH4OH vapour, pH7 B. L-arginine 200mM H3PO4 pH9 C. L-arginine 200mM + HCl to pH9 D. K2HPO4 10mM pH9 E. Na2CO3 20mM NaOH 0.1mM HCl to pH9 F. Histidine 100mM pH6.9 All formulations have 0.11mg/ml polysorbate 80 added.
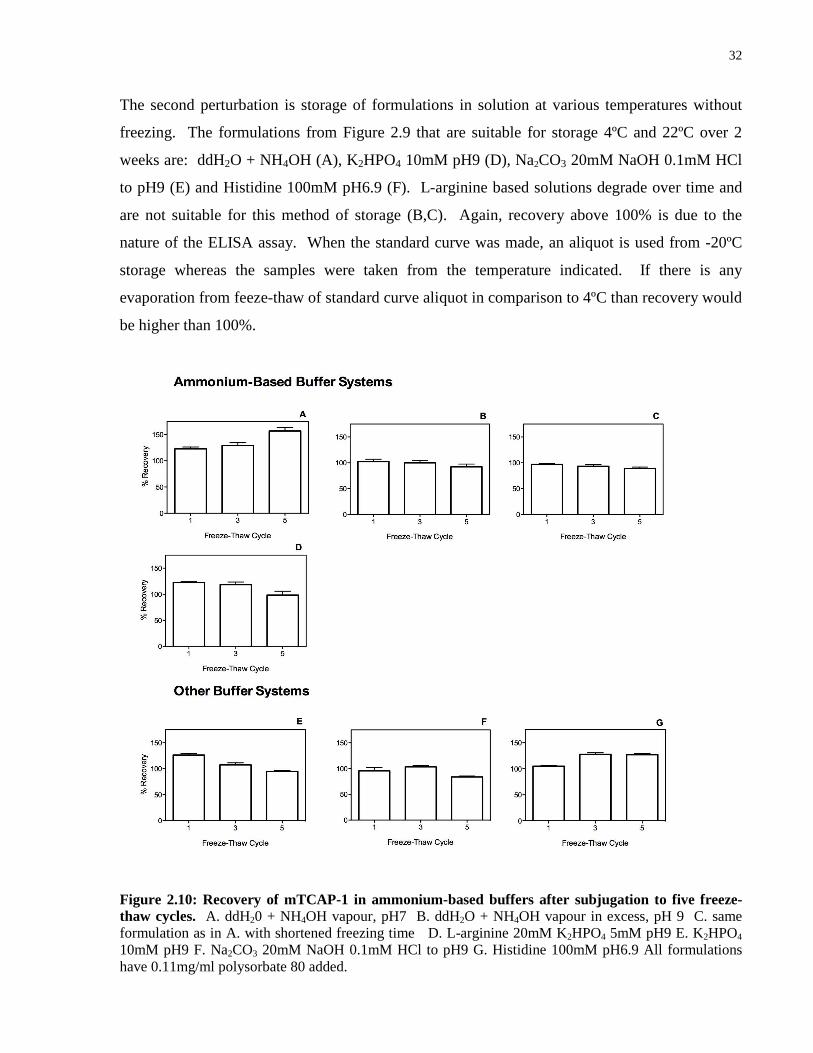
32
The second perturbation is storage of formulations in solution at various temperatures without
freezing. The formulations from Figure 2.9 that are suitable for storage 4ºC and 22ºC over 2
weeks are: ddH2O + NH4OH (A), K2HPO4 10mM pH9 (D), Na2CO3 20mM NaOH 0.1mM HCl
to pH9 (E) and Histidine 100mM pH6.9 (F). L-arginine based solutions degrade over time and
are not suitable for this method of storage (B,C). Again, recovery above 100% is due to the
nature of the ELISA assay. When the standard curve was made, an aliquot is used from -20ºC
storage whereas the samples were taken from the temperature indicated. If there is any
evaporation from feeze-thaw of standard curve aliquot in comparison to 4ºC than recovery would
be higher than 100%.
Figure 2.10: Recovery of mTCAP-1 in ammonium-based buffers after subjugation to five freeze-thaw cycles. A. ddH20 + NH4OH vapour, pH7 B. ddH2O + NH4OH vapour in excess, pH 9 C. same formulation as in A. with shortened freezing time D. L-arginine 20mM K2HPO4 5mM pH9 E. K2HPO4 10mM pH9 F. Na2CO3 20mM NaOH 0.1mM HCl to pH9 G. Histidine 100mM pH6.9 All formulations have 0.11mg/ml polysorbate 80 added.

33
The reasons for greater than 100% recovery have been previously explained. Additionally,
formulations with greater water content may be especially prone to evaporation. One example is
the ddH2O + NH4OH formulation (Fig.2.10A).
A B C D E0
50
100
150
Formulation
% R
ecov
ery
Figure 2.11: Recovery of mTCAP-1 in ammonium-based and standard buffers after dehydration by vacuum centrifugation (as determined by ELISA) A. ddH20 + NH4OH vapour B. L-arginine 20mM, 5mM K2HPO4 polysorbate pH9 C. K2HPO4 10mM polysorbate D. Na2CO3 20mM, 0.1mM NaOH HCl to pH8.5 polysorbate E. Histidine 10mM polysorbate [polysorbate] = 0.11mg/ml
In addition to storage in solution, a formulation can be dried and reconstituted at a later time.
This experiment explored drying via centrifugation. All formulations, with the exception of
ddH20 + ammonium vapour, performed well when subjected to vacuum centrifugation and
recovered all of the material dried (Fig.2.11). The ammonium vapour solution had a recovery of
60% and this method would not be used for this formulation (Fig 2.11A). Another alternative is
freeze-drying or lyophilization. Because this method is temperature controlled, it preserves the
peptide more so than other drying methods. Figure 2.12A illustrates that all formulations can be
stored at 4ºC for up to 7 days without compromising the biological activity of the peptide. At
elevated temperatures of 22ºC and 37ºC (Fig. 2.12 B and C), variability and loss of peptide are
introduced. It is often the case that these temperatures are used for consistency as additional
reference points.

34
Figure 2.12: Recovery of mTCAP-1 in ammonium-based buffers after lyophilization and storage. A. 4ºC B. 22ºC C. 37ºC Complete list of formulations: ddH20 + NH4OH vapour, L-arginine 20mM 5mM K2HPO4 pH9, K2HPO4 10mM pH9, Na2CO3 20mM 0.1mM NaOH HCl to pH9, Histidine 100mM pH6.9. All formulations have 0.11mg/ml polysorbate 80 added.
A
B
C

35
Figure 2.13: Effect of short-term storage at -80ºC and 4ºC mTCAP-1 in ammonium-based buffers. A. ddH20 + NH4OH vapour pH7 B. L-arginine 20mM 5mM K2HPO4 pH9 C. K2HPO4 10mM pH9 D. Na2CO3 20mM 0.1mM NaOH HCl to pH9 Table illustrates days at -80ºC storage and days at 4ºC storage prior to assay in ELISA.
All formulations in figure 2.13 are suitable for short-term storage at 4ºC up to 8 days. This
experiment is similar in terms of the conclusions that can be made regarding storage capabilities
as that of Figure 2.12A. However, the experiment in Figure 2.13 was designed so that all
samples were tested in the ELISA measuring the epitope preservation on the same day reducing
any variability introduced by the ELISA itself.
We also explored its rate of degradation in vitro by measuring the half-life of Biotin-TCAP in
serum using ELISA. Degradation studies provide information on the potential motility of the
molecule as well as the concentration in the vicinity of the cell after traveling in the blood able to
elicit a cellular response.

36
Figure 2.14: Effect of 37ºC incubation on recovery of biotinylated TCAP from serum. A. [K 8]-mTCAP-1 B. [K37]-mTCAP-1.
The % recovery of 50ng/ml [K8]-mTCAP-1 and [K37]-mTCAP-1 after 4 hours incubation in 10%
serum is approximately 40% and 30% respectively (Fig. 2.14). The half-life of [K8]-mTCAP-1
and [K37]-mTCAP-1 is 4hrs and 2.5hrs respectively.
Figure 2.15: Effect of Polysorbate on recovery of mTCAP-1 in ELISA.
In the absence of a detergent, after TCAP is solubilized in an eppendorf tube (and subsequently
assayed in ELISA), the % recovery of material at low concentrations of TCAP (2.45 and
24.5nM) is minimal compared to higher concentrations (245nM). With the addition of a
detergent (polysorbate 80), the recovery of TCAP at low concentrations increases to 100%. The
higher concentration of detergent introduced higher variability in the % recovery. For
parsimony, the lowest concentration of detergent was chosen.
37
Discussion
For initial characterization and the ongoing pursuit of its biological importance, it was essential
to synthesize mTCAP-1 synthetically (a procedure previously described (Qian et al., 2004) and
to isolate it from the blood or other fluids and tissues (a method is discussed in Chapter 3).
However, when isolated or after synthesis, proteins are only marginally stable and require a
specific environment for solubilization. The formulations developed for dissolving TCAP were
designed after analyzing its structure and reflect its chemistry and the experimental results of
peptides having similar character from the literature. The formulations attempt to replicate the
cellular environment of this endogenous peptide.
The CRF peptides, the closest evolutionary family of peptides to the TCAP family, can be used
as a model upon which to investigate TCAP. The secondary structure of CRF has been
investigated under different conditions that resemble its cellular environment (Kaiser and Kezdy,
1984). The behaviour confirms theoretical analysis by Chou and Fasman (1978) suggesting it
has an amphiphilic structure and pronounced alpha helical potential. In aqueous solution CRF
exists predominately as a random coil. At concentrations greater than 10-5M, CRF shows a
tendency to self-aggregate. It readily binds to hydrophobic regions and at the air-water interface
forms an insoluble monolayer composed of monomers in which measurements of compactness
and collapse pressure confirm a compact secondary structure (Kaiser and Kezdy, 1984). At high
concentrations approaching 10-3M (Lovejoy and Nock, unpublished observations) or at low
concentrations in the absence of a detergent (Figure 2.15), TCAP does not dissolve or
precipitates out of solution when prepared in standard eppendorf tubes. These observations are
most likely due to self-aggregation caused by the abundance of molecules at high concentrations
resulting in a lack of interactions with the solvent and the abundance of hydrophobic interactions
in the latter case without a detergent to interact with the hydrophobic surface of the vessel. Other
measures such as the ones described for CRF to test the amphiphilic properties of TCAP could
be investigated in a similar manner. The peptide should form micellular structures: small
oligomers formed from a well-defined number of monomers interacting at their lipophilic
domains. The secondary structure of a peptide can be confirmed by circular dichroism (CD),
nuclear magnetic resonance (NMR) or optical rotary dispersion (Tu et al., 1979).
38
Examining other peptides has lent useful information as to the understanding of how peptides
function in general. Experimental evidence from a model peptide of apolipoprotein A-I has
confirmed that secondary structures are involved in the biological activity of peptides. Active
peptides require stretches of several amino acids within the entire length for function, in contrast
to enzymes, in which much larger sections of amino acids are required to establish the functions
associated with tertiary structure. The model was constructed exclusively of regions thought to
confer biological activity- 22 amino acids comprising a helical region out of a total of 243. This
demonstrates that the number of functional groups interacting with the receptor must be small
and most of the amino acid components serve a purely structural role in the proper positioning of
the ligand functions (Kaiser and Kezdy, 1984).
TCAP is an amphiphilic peptide with a number of hydrophobic residues that make it insoluble in
aqueous solutions. The peptide dissolves in solvents that have hydrophobic properties. With this
in mind, a series of initial formulations were developed and measured for their degree of
solubilization and insolubility using absorbance and turbidity measurements. Formulations with
minimal light scattering/turbidity were selected for further degradation studies. The experiments
performed in this chapter establish that TCAP-1 is compatible with only some types of
formulations. Moreover the conditions of pH and choice of excipient reagents play a major role
in developing an appropriate formulation for TCAP-1.
Na2CO3, NaHCO3, and H2CO3 are forms of the divalent carbon anion present in solution.
Hydrochloric acid was added to lower the pH from 11.6 to 8.5. As acid (or most importantly, the
H+) is added to the solution, some Na2CO3 is converted to NaHCO3 and H2CO3, the relative
amounts being determined by how much acid (H+) is added. In our case, enough carbonate was
needed to form ionic bonds with TCAP. A solution of the sodium salts of carbonate can react
with either an acidic H+ (at which time it is acting as a base, or with OH- at which point it is
acting as an acid. This buffering property is important for the stability of a peptide in solution
when the conditions change. This formulation performed quite well under our storage
conditions.
Traditionally, sucrose, glycerol and amino acids were added at high concentrations to optimize
protein solubility (von Hippel and Wong, 1962). Certain low molecular weight amino acids such
as glycine, alanine and proline increase the osmotic pressure in a cell with high salinity and this
39
enhances the stability of proteins without compromising their function. Examination of the cells
in organisms living under high salinity or able to survive high osmolality reveals an
accumulation in the cytoplasm of a few specific classes of low molecular weight molecules
(Arakawa et al., 2007).
A few common features of good hydrotropes for TCAP were identified. Effective hydrotropic
agents have a high solubility in water. Effective hydrotropic agents have a high hydrophobicity
in order to interact with the drug. Their effectiveness is correlated to their degree of
hydrophobicity. Molecules that dissolve poorly in water are hydrophobic, at least in part and
they do not interact with water molecules through hydrogen bonding. In fact, hydrophobic
hydration, the term describing the presence of hydrophobic molecules in water, causes an
alteration in the hydrogen-bonding state of the water molecules. This is a characteristic of TCAP
as shown in the light scattering profile of TCAP in ddH2O (Fig. 2.2A).
Certain additives are needed to protect proteins after freezing and freeze-drying as well as
degradation over long-term storage in the lyophilized form. Sugars and amino acids protect
protein stability during these procedures and in a dried state (Carpenter et al., 1987b). However,
it was found that for long-term storage stability, solvent additives, named excipients, were also
added to the formulation to avoid it forming aggregates upon exposure to mechanical stress such
as agitation and elevated temperature at 37°C. Sucrose and lysine or arginine are used to protect
ciliary neurotrophic factor (CNTF) from heat stress, while detergents such as Tween20 and
organic solvents such as propylene glycol (PG) were effective against agitation. Combination of
the amino acids and PG protected the protein from both stresses reinforcing the importance of
combining additives, against multiple stresses, which may have negative as well as positive
influence individually against one particular stress (Arakawa et al., 2003).
A number of excipient reagents were used in the formulations with the goal of stabilizing the
biological structure of TCAP. When isolated in vivo by solid-phase extraction of a blood sample
(a method developed for isolation of mTCAP-1 from serum is discussed in Chapter 3), or when
synthesized synthetically for characterization and biological importance (a procedure previously
described for mouse TCAP-1 (Wang et al., 2005)), proteins are only marginally stable and
require a specific environment. Various formulations of salts and/or amino acids and/or additives
were developed from relation of successful interactions after characterization of TCAP in terms
40
of its structure and experimental evidence in the literature. The formulations attempt to replicate
the living environment and the experimentation will confirm our hypothesis.
Administration of TCAP or any other peptide formulation into the vascular system needs to be
compatible with the osmolarity of the tissue. Examination of the cells in organisms living under
high salinity or able to survive high osmolality reveals an accumulation in the cytoplasm of a few
specific classes of low molecular weight molecules (Arakawa et al., 2007).
Solubility in solution
Solvent conditions dictate the successfulness of protein purification, processing and storage. The
behaviour or solubility and stability of a protein in solution obeys the principle of minimum total
potential energy: a protein shall deform or displace to a conformation at which its total potential
energy is minimized the total potential energy of the protein and maximizes the entropy of the
solution according to the second law of thermodynamics. Proteins that are dissolved in an
environment with these criteria are said to be the most stable and lost potential energy dissipated
as heat from the vibration of atoms within or adjacent to the protein will occur at a minimum.
Protein stabilizers come from several chemically dissimilar classes and yet, as Timasheff and his
colleagues proposed, they all behave similarly and must invoke the same mechanism for solute-
induced stabilization in aqueous solution. In successful stabilizers, they observed a deficiency in
the concentration of stabilizing solutes in the immediate vicinity of the protein and suggested
they must not be in contact with the protein surface (Timasheff, 1982) because it is energetically
unfavourable to do so.
These are solutes that do not bind to the surface of the protein. They function by increasing the
chemical potential of a protein if it was to unfold and occupy a larger space. Because they do not
interact with the protein specifically, they are universally effective for all proteins in solution.
Surface Tension
Gibbs binding isotherm (reviewed in Maget-Dana, 1999; Arakawa and Timasheff, 1983)
provided a mathematical explanation for the molecular environment at the interphase or
boundary between 2 phases. The theorm suggests that those solutes that increase the surface
tension of water will be deficient in the water-air interface. This is the basis for the cavity theory
41
which considers the interface at the protein surface: the ability of the surface free energy of the
formation of a cavity to accommodate solute molecules (proteins and nucleic acids) in a solvent
will largely dictate the stability and self-association of these molecules. Amino acids are
excluded from the protein surface as are sugars and polyols. Arginine is an exception to this rule
and it will be considered separately. Experiments still need to be conducted on how the side
chains of individual amino acids within the protein interact with the additives. The principles
can be applied to the frozen state but not to the freeze-drying state because of the removal of
water. The ability of proteins to remain in their conformation depends on their binding to water
molecules: in the frozen state there is residual non-freezable water that remains bound to the
protein however, in the dried state these interactions cannot be made and another molecule is
needed to replace water.
Amino acids are often targeted for use based on the following observations: certain low
molecular weight amino acids including glycine, alanine, and proline accumulated in the cell or
organism to raise the osmotic pressure in the presence of high salt concentrations and they also
provide a protective role in addition to sugars in stabilizing proteins during the process of
freezing or freeze-drying as well as in the dried state (Tang and Pikal, 2005).
Amino acids stabilize proteins by increasing their melting temperature. Molarities near 1M of
glycine increase melting temperature of lysozyme and bovine serum albumin (BSA).
Thermodynamic stability is determined by the differences in the free energy of the folded and
unfolded state. The greater the quantity of free energy, the more stable the protein is and this can
be achieved in two ways: 1) decrease the free energy of the folded state using a structure-
stabilizing additive and/or 2) increase the free energy of the unfolded state more than the folded
state and this can be done using what is referred to as a preferentially excluded additive.
The opposite is seen for protein denaturants such as Guanidine HCl and urea. It has been stated
that arginine has similar chemical properties as guanidine however, this rationale cannot be
extended to apply to arginine because their differences affect the solubilization of proteins.
These solutes bind to the protein and decrease its chemical potential. The chemical potential
further decreases upon unfolding because the number of available binding sites is increased
which increases the potential for preferential binding. This is unfavorable for protein function as
its conformation often has implications for proper function.
42
The same principle applies to polymerization. The formation of contact sites between constituent
monomers decreases the surface area of the protein and so preferentially excluded solutes induce
dimerization and the number of binding sites on the protein surface decrease. Preferential
binding of solutes induces depolymerization as the number of available binding sites is
increased. (Carpenter et al., 1991)
The nature of arginine
Arginine is added at concentrations of 55mg/ml (315mM) and 35mg/ml (200mM) to human
tissue plasminogen activator (tPA) as an excipient in commercial products (Arakawa et al.,
2007). The lower concentration was initially adopted for the solubilization of TCAP and
subsequently lower concentrations were tested for parsimony. There was no difference between
the initial 200mM and the lowest tested, 20mM, and the latter was used. L-glycine and L-
histidine are also used as excipients at concentrations of 0.17-260mM and 5-55mM, respectively
(Arakawa et al., 2007).
The formulations containing arginine at pH 9 and 10 successfully solubilized TCAP and
preserved the conformation and function of the peptide while lower pH levels lowered its
biological activity. Above pH 9, the α-amino group becomes deprotonated from NH3+ to NH2
and electrically neutral. This increase in hydrophobicity in addition to the methylene groups
may be the explanation for its enhanced ability to adequately solubilize TCAP. Arginine does
bind to the protein surface and so has little effect on the melting temperatures of the proteins
with which it is combined (Arakawa and Tsumoto, 2003). This is a property of denaturants.
However, arginine was found to suppress aggregation against heat-induced unfolding and is
effective at reducing aggregation associated with refolding (Ho et al., 2003). The properties of
arginine are unique and the interaction of arginine differs from that of urea and GdnHCl: there is
limited binding of arginine to the protein surface which does not affect the native structure of the
protein (Prakash et al., 1981).
Freeze-thawing solutions
Sugars, polyols, amino acids and certain salts are added to a formulation because they are
effective at minimizing protein denaturation during freeze-thawing. Substances that protect
proteins from damage during freezing are referred to as cryoprotectants. The mechanism is akin
to solute-induced stabilization in aqueous solution: the additives are absent from the vicinity of
43
the protein surface because they preferentially do not bind to the protein and this makes it
thermodynamically unfavourable for the protein to unfold into the area occupied by the
additives.
One amino acid used in the formulations as a cryoprotectant was L-histidine, pH 6.9. The
specific properties of L-histidine are attributed to its imidazoline group: it possesses basicity and
π-electron acceptor capability (Osterberg and Wadsten, 1999). At physiological pH levels (pH
6.1-9.0) L-histidine is a zwitterion and its imidazoline group confers good buffer capacity. This
is achieved in vitro when the formulation pH is close to the pKa of the imidazole nitrogen
(pKa=6.1).
The freezing/thawing behaviour of L-hisitidine at various pH levels has been studied (Osterberg
and Wadsten, 1999). They found that crystallization of the peptide, which tends to compromise
protein structure, is minimal at a pH near the pKa of the imidazole group (pH=6, pKa=6.1) and
thus is favourable for maximizing protein integrity.
Stability of proteins in a dried-state by lyophilization
On the other hand, carbohydrate-induced preservation of proteins during freeze-drying is
fundamentally different in mechanism of action to preferential exclusion in freeze-thawing:
carbohydrates substitute water in forming the necessary hydrogen bonds with the protein for
stabilization.
In living systems certain organisms called anhydrobiotes can survive extreme desiccation.
Previous research on Artemia (brine shrimp) embroyos has shown that this ability is directly
correlated with the level of disaccharide accumulated in the organism (Leopold, 1986). In the
laboratory setting, disaccharide was successful at preserving the protein phosphofructokinase
(PFK) while many other cryoprotectants were not indicating that the drying procedure confers a
greater solute specificity than freezing or solubilizing proteins in solution (Carpenter et al.,
1987a). The molecules found in accumulation in the cell are: polyhydric alcohols (polyols and
sugars), specific amino acids and their derivatives, and methylamines (Yancey et al., 1982;).
The amino acids or derivatives were glutamic acid, proline, glycine, alanine, betaine and
trimethylamine N-oxide (TMAO) as they do not interact with the protein.

44
Non-reducing sugars, mostly the disaccharide trehalose in animals and sucrose in plants,
although other disacchrides can achieve the same goal, are used as non-crystallizing excipients in
formulations after observing their usefulness in anhydrobiotic cells. They function as a water
substitute in the dried state, as an aide in glass formation, as well as a stabilizer during freezing
by preferential exclusion (Carpenter and Crowe, 1989). During desiccation, the hydrogen bonds
formed between proteins and water are lost as the bulk water supply is depleted and the proteins
will attempt to form interactions with other molecules. In the absence of small molecules,
proteins may aggregate and lose function as well as precipitate. In these desiccation-tolerant
organisms, proteins form hydrogen bonds with other molecules that normally would not interact
in the presence of water.
Trehalose, a type of sugar, has a high glass transition temperature which provides an amorphous
glassy environment in the dried state that functions to limit the mobility of the molecules and to
slow any chemical reactions. In principle, any liquid can be made into an amorphous solid given
a high cooling rate. If the cooling rate is faster than the rate at which molecules can organize
into a more thermodynamically favorable crystalline state, then an amorphous solid will be
formed which is beneficial for protein preservation.
Protein Structural Changes and Inactivation
Results of the incubation of TCAP in serum indicate that some type of chemical modification is
occurring to alter the conformation and biological activity of the peptide. In the ELISA, this is
evident in the lack of recognition of its epitope (Figure 2.14). Deamidation of conserved
residues (such as those involved in the formation of the peptide’s epitope) alters the isoelectric
point and hence, the peptides interaction with its environment at a given pH.
Irreversible thermal inactivation can occur during heating (and rapid cooling as in the case
during the lyophilization process) of a protein. In this circumstance, conformational or chemical
changes occurred that prevent the protein from refolding or compromise its integrity.
Aggregation is one of the conformational changes that can occur: temperature increases intensify
conformational breathing or flexibility until local changes in secondary and tertiary, or
cooperative loss of higher ordered structure can occur that dismantle intramolecular forces. This
exposes some of the hydrophobic residues to the aqueous environment. This occurrence is
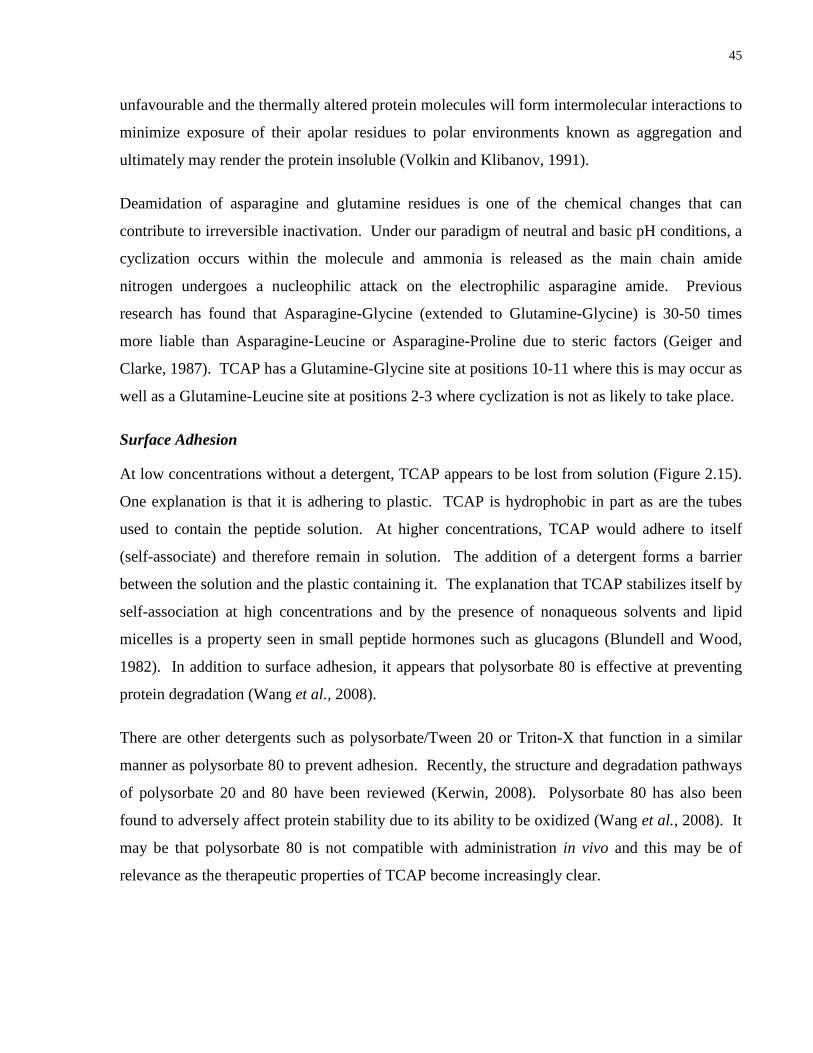
45
unfavourable and the thermally altered protein molecules will form intermolecular interactions to
minimize exposure of their apolar residues to polar environments known as aggregation and
ultimately may render the protein insoluble (Volkin and Klibanov, 1991).
Deamidation of asparagine and glutamine residues is one of the chemical changes that can
contribute to irreversible inactivation. Under our paradigm of neutral and basic pH conditions, a
cyclization occurs within the molecule and ammonia is released as the main chain amide
nitrogen undergoes a nucleophilic attack on the electrophilic asparagine amide. Previous
research has found that Asparagine-Glycine (extended to Glutamine-Glycine) is 30-50 times
more liable than Asparagine-Leucine or Asparagine-Proline due to steric factors (Geiger and
Clarke, 1987). TCAP has a Glutamine-Glycine site at positions 10-11 where this is may occur as
well as a Glutamine-Leucine site at positions 2-3 where cyclization is not as likely to take place.
Surface Adhesion
At low concentrations without a detergent, TCAP appears to be lost from solution (Figure 2.15).
One explanation is that it is adhering to plastic. TCAP is hydrophobic in part as are the tubes
used to contain the peptide solution. At higher concentrations, TCAP would adhere to itself
(self-associate) and therefore remain in solution. The addition of a detergent forms a barrier
between the solution and the plastic containing it. The explanation that TCAP stabilizes itself by
self-association at high concentrations and by the presence of nonaqueous solvents and lipid
micelles is a property seen in small peptide hormones such as glucagons (Blundell and Wood,
1982). In addition to surface adhesion, it appears that polysorbate 80 is effective at preventing
protein degradation (Wang et al., 2008).
There are other detergents such as polysorbate/Tween 20 or Triton-X that function in a similar
manner as polysorbate 80 to prevent adhesion. Recently, the structure and degradation pathways
of polysorbate 20 and 80 have been reviewed (Kerwin, 2008). Polysorbate 80 has also been
found to adversely affect protein stability due to its ability to be oxidized (Wang et al., 2008). It
may be that polysorbate 80 is not compatible with administration in vivo and this may be of
relevance as the therapeutic properties of TCAP become increasingly clear.

46
Chapter Three
Development of an Enzyme Linked Immunosorbent Assay (ELISA)
and an extraction method from serum to detect the presence of
TCAP
Abstract
TCAP is a newly discovered molecule that has profound effects in the nervous system in terms
of modulating the effects of stress-related molecules in vitro and the behaviours in vivo. Newly
discovered molecules require extensive characterization necessitating an isolation and detection
method for its study. In this chapter, the development of an enzyme linked immunosorbant assay
(ELISA) for the quantification of TCAP and an isolation method of quantifying from serum or
other biological fluids are described. Both assays are specific to the structure and properties of
mTCAP-1 and can be utilized solely for this molecule. The assay is specific and detection limit
is from 0.5ng/ml to 100ng/ml.
Introduction
When the project was initiated, there were no reliable methods for TCAP detection and
quantification in multiple samples. Accurate quantification of the peptide is essential for
physicochemical and biological in vitro and in vivo characterization. Most of the small peptides
(3-20 residues) are routinely quantified using HPLC (high performance liquid chromatography)
based or radioimmunoassay methods. Larger peptides can be detected and quantified by HPLC,
radioimmunoassay or ELISA. We have chosen to develop the ELISA method because of its high
sensitivity, rapidity and relative simplicity.
In the ELISA, antigen (TCAP) is recognized by specific antibody that has been immobilized on
the plastic surface to facilitate the non-specific binding removal. Competitive ELISA represents
the simplest version where only one specific antibody is needed and the analyte antigen
competes with a labeled version of the antigen for the limited binding sites on the antibody. The
47
labeled antigen is later detected and the amount of signal is directly proportional to the labeled
antigen present. Adding increasing known amounts of unlabeled antigen competes out more of
the labeled one and thus decreases the signal. In this method the quantification of the unknown
TCAP amount is based on the use of a standard curve.
The label chosen for TCAP was the biotin molecule. The molecular weight of bioitn is 339.5 Da
and the molecular weight of TCAP is 4700 Da, more than 10-fold larger, thus biotin should have
a minimal interference with the antibody-antigen reaction which can be a concern. To facilitate a
successful labeling reaction, we needed to introduce lysine residues into the TCAP molecule
because their side chain has a primary amine group required for the labeling. We chose to put
them in place of existing arginine residues because of the functional similarity between the two
basic residues. The first arginine resides in position 8, the eighth amino acid in the peptide
chain, and it was replaced with lysine 8 (K8). The other arginine in position 37 was replaced
with lysine 37 (K37). These molecules are referred to as Biotin-[K8/37]-mTCAP-1. The other
option of labeling via carboxyl groups was not considered because of multiple carboxyl groups
present that are likely to be important in antigenicity (also discussed in chapter 2). The biotin
labeled TCAP is bound by streptavidin conjugated to horse radish peroxidase that in turn
oxidizes the substrate into readily detectable colored product. The ELISA is a signal-generating
system and the inclusion of an enzyme confers the ability of the immunoassay to measure the
concentration of an analyte. Other signals in use range from a precipitation reaction used in
nephelometry, to more commonly used labels attached to antigens in the form of radioisotopes,
cofactors, fluorogens, luminogens or other enzymes.
When this project was initiated, 3 TCAP-specific polyclonal antisera were available from
previous work done by Cynthia Qian. The concentration of each antiserum and biotinylated
TCAP were optimized to obtain the best signal to noise ratio, detection limits and
reproducibility.
Competitive ELISA, although rapid and simple, is relatively sensitive to inhibitory effects of
biological media such as serum or plasma. Therefore, in order to quantify TCAP from serum
and/or tissues, TCAP needs to be isolated using a suitable extraction method prior to downstream
testing in ELISA. Thus we developed a solid-phase extraction (SPE) method using reverse-
phase columns and optimized the procedure for high recovery and increased sensitivity. In terms

48
of separation techniques, a method based on a single variable such as SPE is referred to as a 1-
dimensional separation. It is this most simple method in use. In a successful solid-phase
extraction, the peptide is retained on the sorbent and the impurities flow through. In the general
procedure, TCAP is first acidified to remove any interactions with other molecules. TCAP is
then loaded onto a conditioned column. In order to retain TCAP, the column selected has both
the hydrophobic and hydrophilic properties necessary for binding an amphiphilic molecule such
as TCAP. In this way, hydrophobicity is the primary variable for eluting the peptide from the
column. The column is washed to remove impurities with a solution of mostly water so as not to
elute TCAP. The final step is eluting the peptide using an organic acid.
With one assay and one purification technique established, quantifying TCAP in various areas of
the body and at various stages is possible. Further optimization may be required if lower limits
of detection are required and concentration of the sample is not an option or if isolation from
other biological fluids is desired.
Materials and methods
Optimized competitive ELISA protocol
Nunc Maxisorp Flat bottom plates (VWR, Mississauga, ON) were coated with 100µl of goat
anti-rabbit IgG Fc fragment (Pierce, Rockford, IL) at 10µg/ml in PBS overnight at 4°C. The
remaining binding sites were blocked with 1% (BSA) in PBS 0.05% Tween-20 (PBST) for 2-24h
and the wells then washed with PBST to remove excess unbound BSA. TCAP-1-specific
antisera at 1/1000 dilution in PBST 1%BSA was bound to the goat anti-rabbit IgG Fc fragment
coated plates for 2h. The wells were washed 2 times with PBST. TCAP-1 variants with lysine
substituted for arginine at positions 8 or 37 (K8 and K37 respectively) were labeled with biotin
using EZ-Link Sulfo-NHS-LC-Biotinylation Kit (Pierce). Serial dilutions of unlabelled TCAP
(1000 - 0.1ng/ml, sufficient for generating a dose-response curve) and 10ng/ml biotinylated
TCAP (K8 or K37) in PBST 1% BSA were incubated for 4h at room temperature. The wells were
washed 4 times with PBST for 10 minutes each time and incubated with streptavidin-HRP
(Pierce) at 0.1µg/ml in PBST 1% BSA for 25min. After 3 washes with PBST, the substrate
Super Signal TMB (Pierce) was added for 10-30 min, the reaction stopped with 2M sulfuric acid
and HRP activity measured at 450nm. For the Biotin TCAP ELISA, the competition was
omitted. The absorbance values were normalized to 100% for no competition value and further
49
analysed with GraphPad 4 software (San Diego, CA) as follows. Standard curve for competitive
ELISA was generated with sigmoidal variable slope equation (four parameter logistic):
The equation was used to calculate unknown concentrations of the peptide.
Optimized TCAP extraction
Synthetic TCAP was added to thawed rat serum from -20˚C storage. Serum was obtained from
the control rats of previous experiments. TCAP in serum is first acidified with TFA (0.1% in
water) in a 1:3 ratio to remove any protein-peptide interactions, the final pH is 5-6. TCAP is
then loaded onto a methanol conditioned HLB Oasis column (Waters). Small molecules and
peptides bind to the column while large molecules pass through. Washes were performed first
with 0.1% TFA in water and then with 0.1% TFA and 20% acetonitrile in water. This last wash
removes molecules attached through weak hydrophobic interactions. The final elution step is
with 0.1% TFA and 60% acetonitrile in water. Elution samples along with flow through and
washes were collected for process control and dried in the vacuum drier to be reconstituted on
the day the sample is assayed in the ELISA.
Results
The first stage in ELISA optimization was to determine most suitable amount of antiserum and
labeled TCAP. A range of antisera dilutions from 1/10 to 1/2560 as well as no antiserum was
assayed with a range of Biotin-TCAP concentrations (Figure 3.1). There was high background
when 2500 and 10000ng/ml Biotin-TCAP was used even in no antiserum wells. At the highest
antiserum dilution, 1/2560, 10ng/ml of Biotin-TCAP could be detected. Thus in the next
experiment, we focused on a narrower range of dilutions, 1/1000 – 1/2560 for the antiserum and
0 – 500ng/ml for Biotin-TCAP.
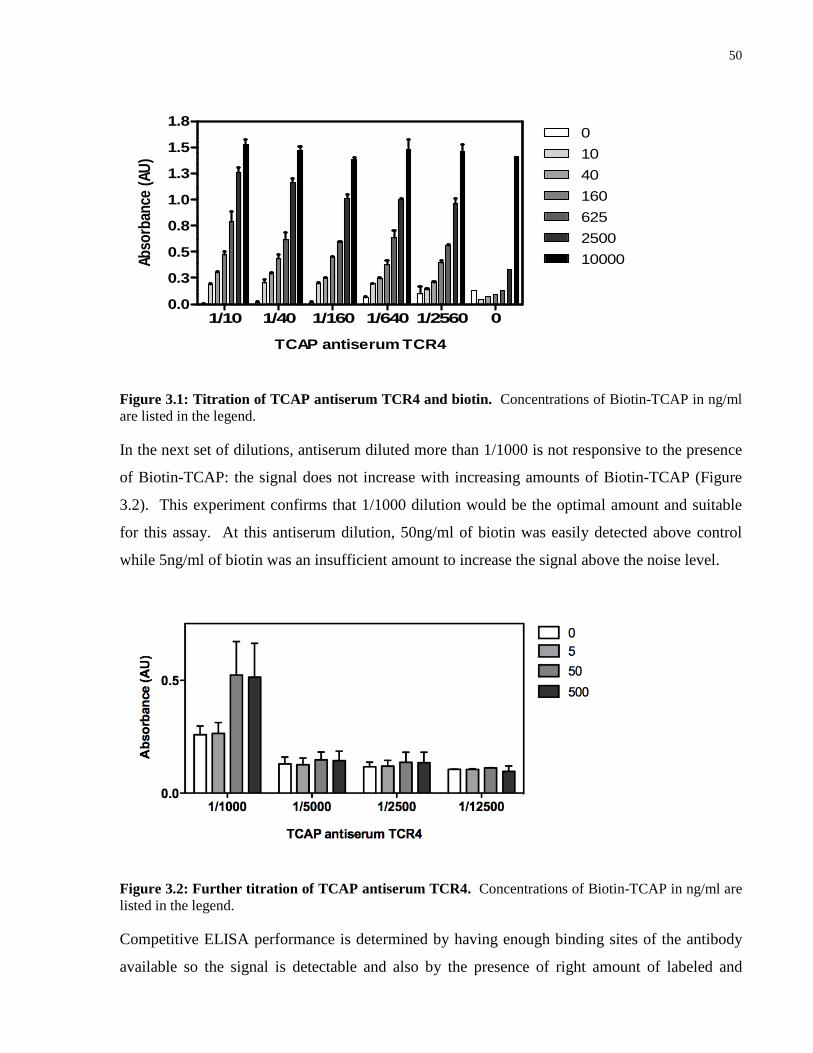
50
1/10 1/40 1/160 1/640 1/2560 00.0
0.3
0.5
0.8
1.0
1.3
1.5
1.80
10
40
160
625
2500
10000
TCAP antiserum TCR4
Abso
rban
ce (A
U)
Figure 3.1: Titration of TCAP antiserum TCR4 and biotin. Concentrations of Biotin-TCAP in ng/ml are listed in the legend.
In the next set of dilutions, antiserum diluted more than 1/1000 is not responsive to the presence
of Biotin-TCAP: the signal does not increase with increasing amounts of Biotin-TCAP (Figure
3.2). This experiment confirms that 1/1000 dilution would be the optimal amount and suitable
for this assay. At this antiserum dilution, 50ng/ml of biotin was easily detected above control
while 5ng/ml of biotin was an insufficient amount to increase the signal above the noise level.
Figure 3.2: Further titration of TCAP antiserum TCR 4. Concentrations of Biotin-TCAP in ng/ml are listed in the legend.
Competitive ELISA performance is determined by having enough binding sites of the antibody
available so the signal is detectable and also by the presence of right amount of labeled and
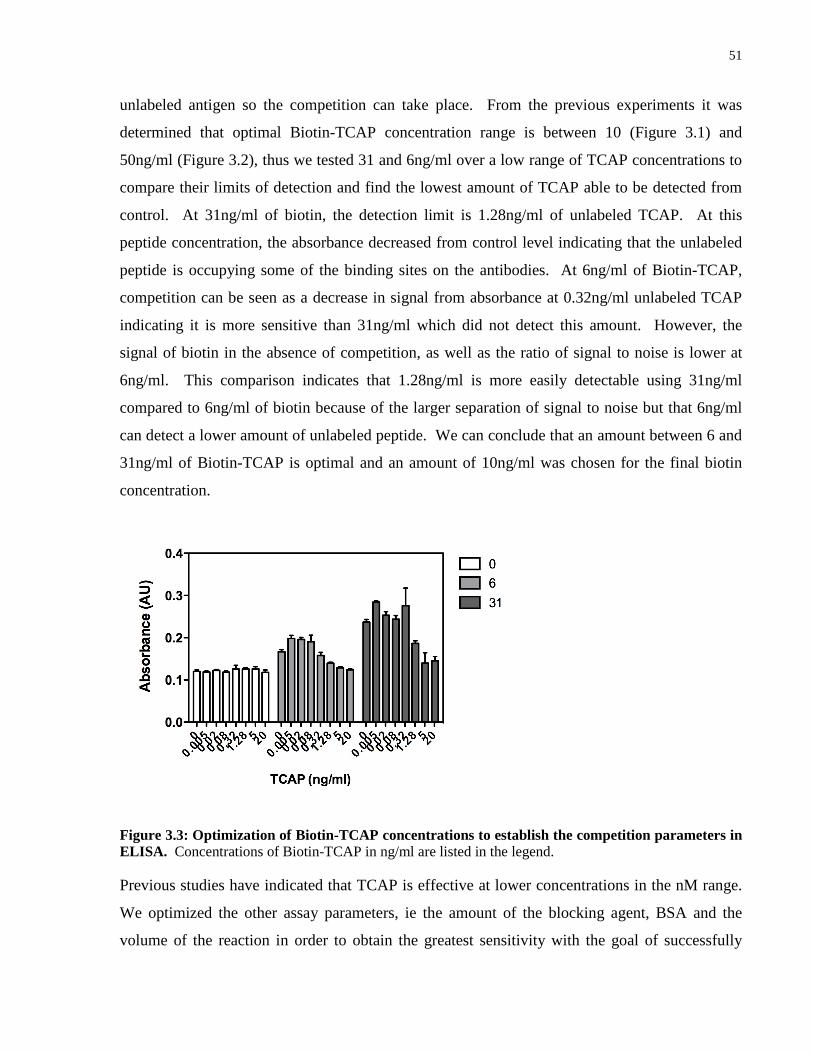
51
unlabeled antigen so the competition can take place. From the previous experiments it was
determined that optimal Biotin-TCAP concentration range is between 10 (Figure 3.1) and
50ng/ml (Figure 3.2), thus we tested 31 and 6ng/ml over a low range of TCAP concentrations to
compare their limits of detection and find the lowest amount of TCAP able to be detected from
control. At 31ng/ml of biotin, the detection limit is 1.28ng/ml of unlabeled TCAP. At this
peptide concentration, the absorbance decreased from control level indicating that the unlabeled
peptide is occupying some of the binding sites on the antibodies. At 6ng/ml of Biotin-TCAP,
competition can be seen as a decrease in signal from absorbance at 0.32ng/ml unlabeled TCAP
indicating it is more sensitive than 31ng/ml which did not detect this amount. However, the
signal of biotin in the absence of competition, as well as the ratio of signal to noise is lower at
6ng/ml. This comparison indicates that 1.28ng/ml is more easily detectable using 31ng/ml
compared to 6ng/ml of biotin because of the larger separation of signal to noise but that 6ng/ml
can detect a lower amount of unlabeled peptide. We can conclude that an amount between 6 and
31ng/ml of Biotin-TCAP is optimal and an amount of 10ng/ml was chosen for the final biotin
concentration.
Figure 3.3: Optimization of Biotin-TCAP concentrations to establish the competition parameters in ELISA. Concentrations of Biotin-TCAP in ng/ml are listed in the legend.
Previous studies have indicated that TCAP is effective at lower concentrations in the nM range.
We optimized the other assay parameters, ie the amount of the blocking agent, BSA and the
volume of the reaction in order to obtain the greatest sensitivity with the goal of successfully
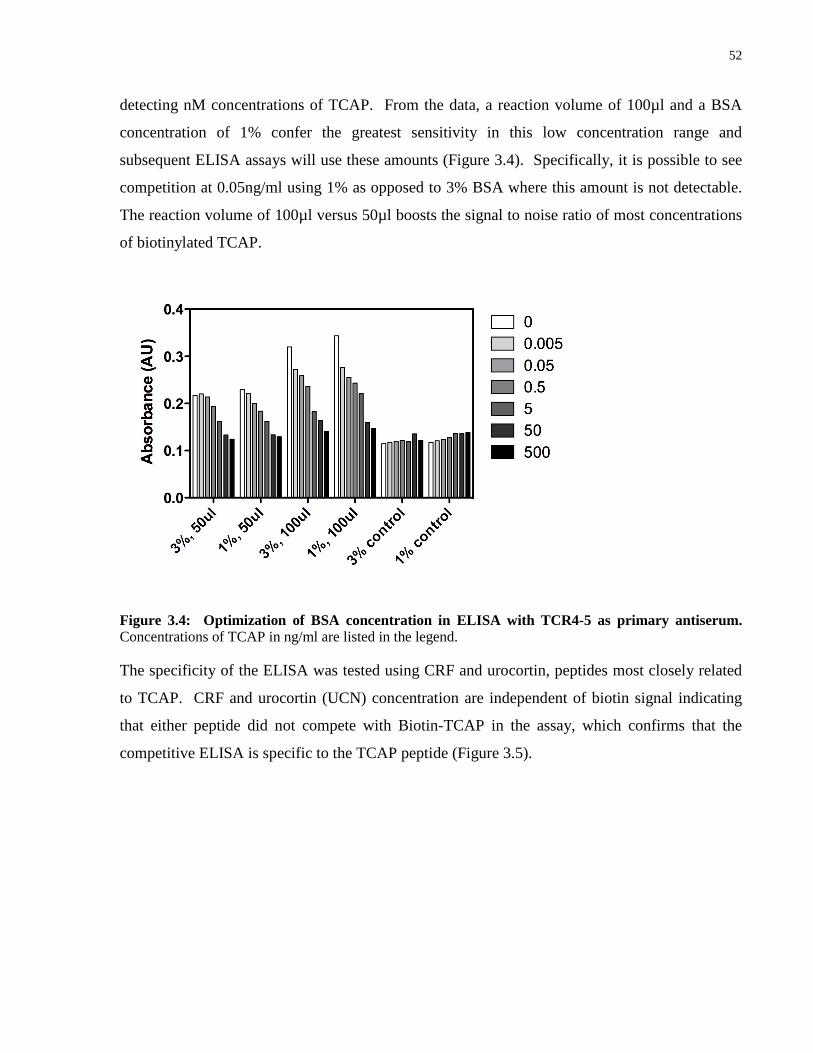
52
detecting nM concentrations of TCAP. From the data, a reaction volume of 100µl and a BSA
concentration of 1% confer the greatest sensitivity in this low concentration range and
subsequent ELISA assays will use these amounts (Figure 3.4). Specifically, it is possible to see
competition at 0.05ng/ml using 1% as opposed to 3% BSA where this amount is not detectable.
The reaction volume of 100µl versus 50µl boosts the signal to noise ratio of most concentrations
of biotinylated TCAP.
Figure 3.4: Optimization of BSA concentration in ELISA with TCR4-5 as primary antiserum. Concentrations of TCAP in ng/ml are listed in the legend.
The specificity of the ELISA was tested using CRF and urocortin, peptides most closely related
to TCAP. CRF and urocortin (UCN) concentration are independent of biotin signal indicating
that either peptide did not compete with Biotin-TCAP in the assay, which confirms that the
competitive ELISA is specific to the TCAP peptide (Figure 3.5).

53
0 1 2 3 4 5 60
20
40
60
80
100
120
Log peptide (pg/ml)
% B
ound
Figure 3.5: Lack of CRF and UCN epitope recognition by TCAP antiserum (TCR4 IgG fraction) in 100ul reaction volume. Solid line TCAP, solid dark line refrozen TCAP, Dashed dark line CRF, dashed line UCN.
The results of an ELISA comparing available antiserum to mTCAP-1 are shown in Figure 3.6.
TNR1 was chosen for further optimization because there is a greater increase in signal
(absorbance) with increasing amount of Biotin-TCAP. TNR1 has the largest signal to noise ratio
at 5 and 50ng/ml Biotin-TCAP compared to no Biotin-TCAP. For this reason, TNR1 was
chosen as the primary antiserum in ELISA for future experiments.
Figure 3.6: Comparison of N-terminal and C-terminal TCAP antiserum in ELISA. Concentrations of TCAP-Biotin in ng/ml are listed in the legend.
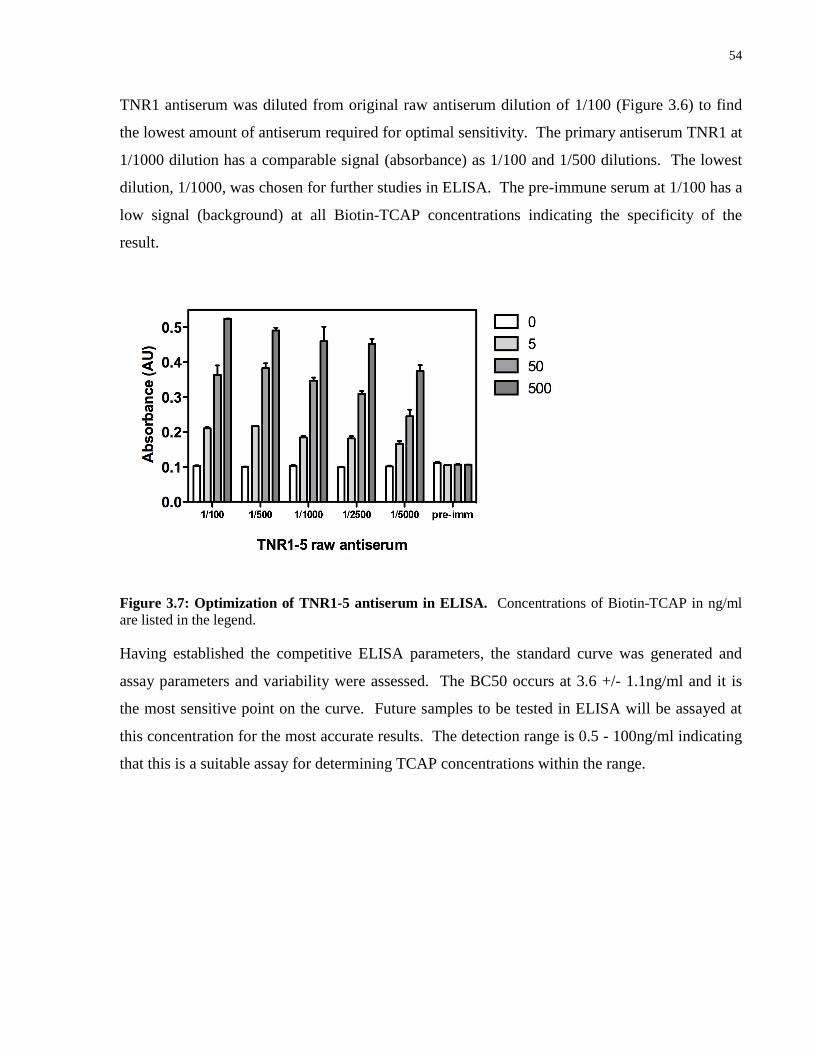
54
TNR1 antiserum was diluted from original raw antiserum dilution of 1/100 (Figure 3.6) to find
the lowest amount of antiserum required for optimal sensitivity. The primary antiserum TNR1 at
1/1000 dilution has a comparable signal (absorbance) as 1/100 and 1/500 dilutions. The lowest
dilution, 1/1000, was chosen for further studies in ELISA. The pre-immune serum at 1/100 has a
low signal (background) at all Biotin-TCAP concentrations indicating the specificity of the
result.
Figure 3.7: Optimization of TNR1-5 antiserum in ELISA. Concentrations of Biotin-TCAP in ng/ml are listed in the legend.
Having established the competitive ELISA parameters, the standard curve was generated and
assay parameters and variability were assessed. The BC50 occurs at 3.6 +/- 1.1ng/ml and it is
the most sensitive point on the curve. Future samples to be tested in ELISA will be assayed at
this concentration for the most accurate results. The detection range is 0.5 - 100ng/ml indicating
that this is a suitable assay for determining TCAP concentrations within the range.
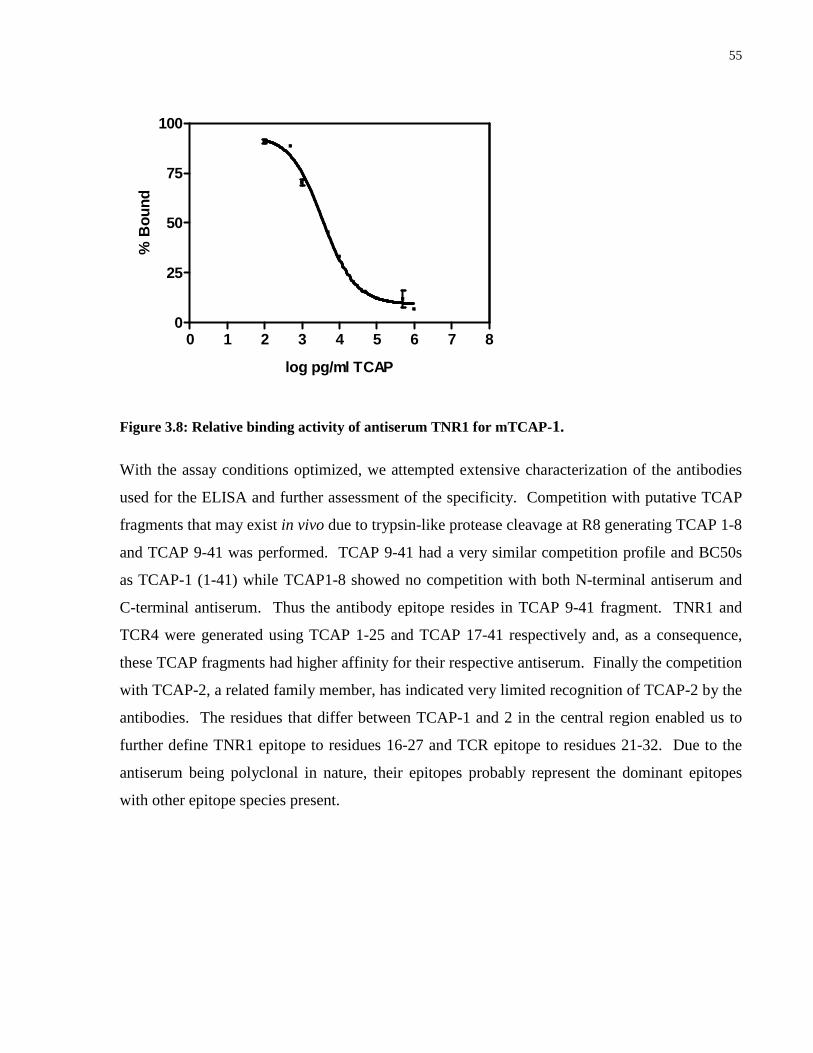
55
0 1 2 3 4 5 6 7 80
25
50
75
100
log pg/ml TCAP
% B
ound
Figure 3.8: Relative binding activity of antiserum TNR1 for mTCAP-1.
With the assay conditions optimized, we attempted extensive characterization of the antibodies
used for the ELISA and further assessment of the specificity. Competition with putative TCAP
fragments that may exist in vivo due to trypsin-like protease cleavage at R8 generating TCAP 1-8
and TCAP 9-41 was performed. TCAP 9-41 had a very similar competition profile and BC50s
as TCAP-1 (1-41) while TCAP1-8 showed no competition with both N-terminal antiserum and
C-terminal antiserum. Thus the antibody epitope resides in TCAP 9-41 fragment. TNR1 and
TCR4 were generated using TCAP 1-25 and TCAP 17-41 respectively and, as a consequence,
these TCAP fragments had higher affinity for their respective antiserum. Finally the competition
with TCAP-2, a related family member, has indicated very limited recognition of TCAP-2 by the
antibodies. The residues that differ between TCAP-1 and 2 in the central region enabled us to
further define TNR1 epitope to residues 16-27 and TCR epitope to residues 21-32. Due to the
antiserum being polyclonal in nature, their epitopes probably represent the dominant epitopes
with other epitope species present.
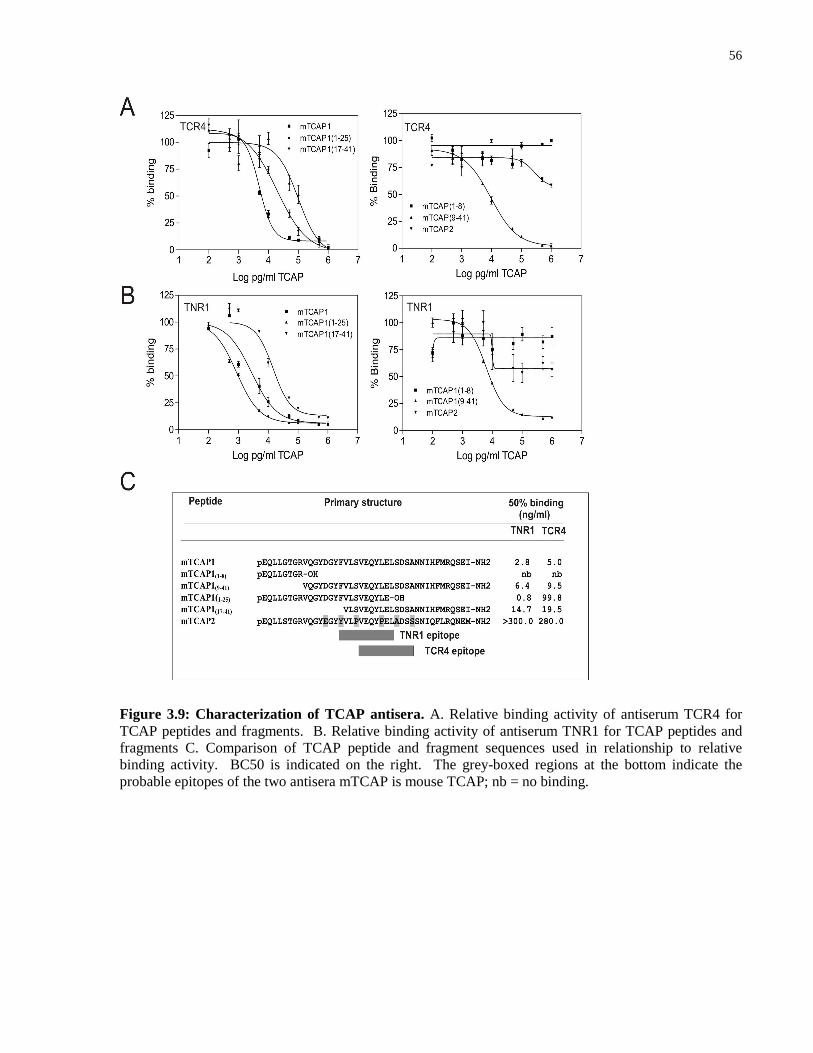
56
Figure 3.9: Characterization of TCAP antisera. A. Relative binding activity of antiserum TCR4 for TCAP peptides and fragments. B. Relative binding activity of antiserum TNR1 for TCAP peptides and fragments C. Comparison of TCAP peptide and fragment sequences used in relationship to relative binding activity. BC50 is indicated on the right. The grey-boxed regions at the bottom indicate the probable epitopes of the two antisera mTCAP is mouse TCAP; nb = no binding.

57
TCAP Extraction from serum
Serum was found to inhibit the detection capability of the ELISA (Figure 3.10). It was found
that a solid-phase extraction method using commercially-available HLB columns was successful
at recovering a consistently high percentage of TCAP material (Figure 3.11- 3.13). First we
assayed the extraction of TCAP from 5% BSA which is roughly the BSA concentration found in
serum. 79% of TCAP 500ng/ml was recovered from Oasis columns while only 39% was
recovered from the C18 columns (Figure 3.11). The presence of TFA in the initial step of
acidifying the peptide in a 1:3 ratio did not influence the final recovery (76%) as opposed to its
omission (79%).
Figure 3.10: Relative binding of mTCAP-1 to antiserum TNR1 in the absence and presence of serum.
Serum inhibition, as measured by the ratio of no serum to 30% serum, is not equal over all
concentrations of TCAP assayed and therefore, samples containing serum cannot be accurately
tested for quantification in ELISA. A method of extracting the samples prior to ELISA testing is
necessary and was developed.
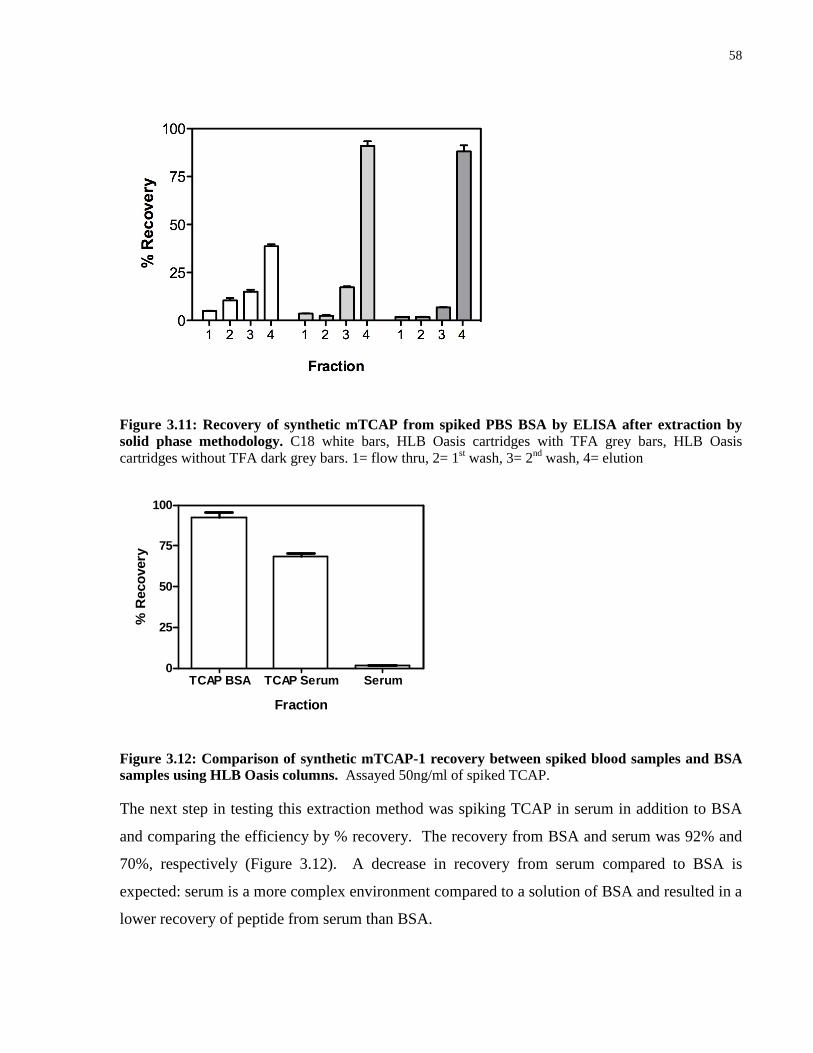
58
Figure 3.11: Recovery of synthetic mTCAP from spiked PBS BSA by ELISA after extraction by solid phase methodology. C18 white bars, HLB Oasis cartridges with TFA grey bars, HLB Oasis cartridges without TFA dark grey bars. 1= flow thru, 2= 1st wash, 3= 2nd wash, 4= elution
TCAP BSA TCAP Serum Serum0
25
50
75
100
Fraction
% R
eco
very
Figure 3.12: Comparison of synthetic mTCAP-1 recovery between spiked blood samples and BSA samples using HLB Oasis columns. Assayed 50ng/ml of spiked TCAP.
The next step in testing this extraction method was spiking TCAP in serum in addition to BSA
and comparing the efficiency by % recovery. The recovery from BSA and serum was 92% and
70%, respectively (Figure 3.12). A decrease in recovery from serum compared to BSA is
expected: serum is a more complex environment compared to a solution of BSA and resulted in a
lower recovery of peptide from serum than BSA.
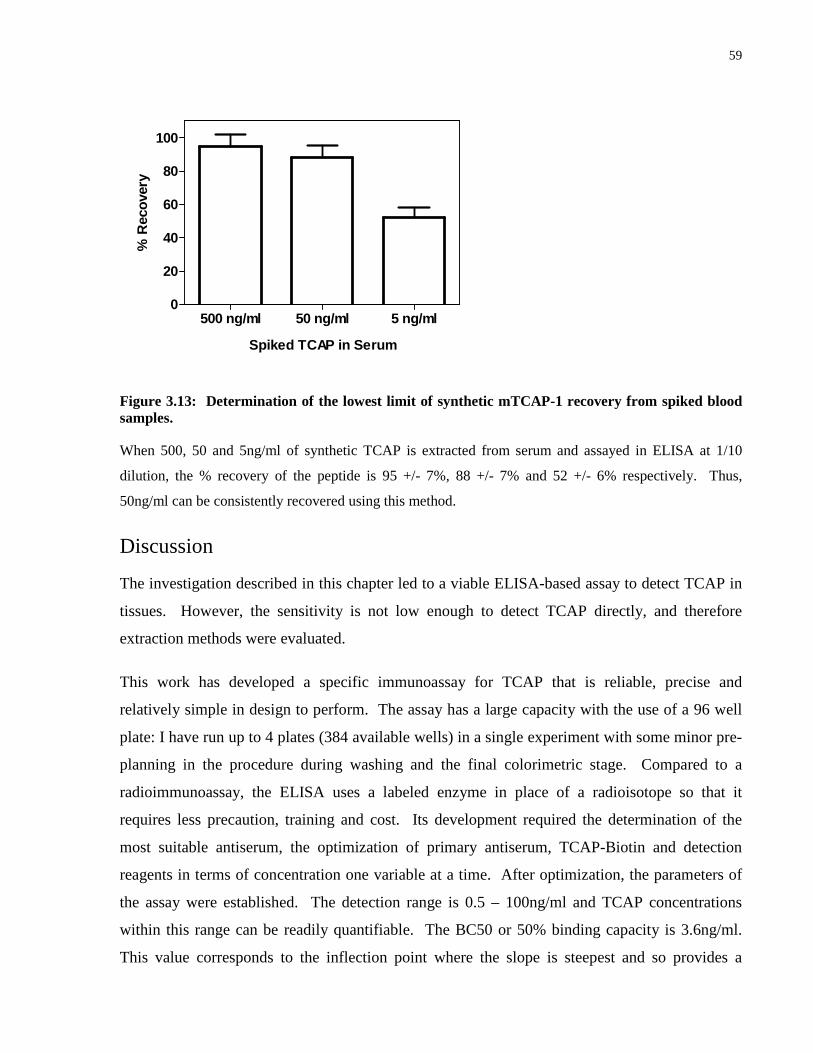
59
500 ng/ml 50 ng/ml 5 ng/ml0
20
40
60
80
100
Spiked TCAP in Serum
% R
ecov
ery
Figure 3.13: Determination of the lowest limit of synthetic mTCAP-1 recovery from spiked blood samples.
When 500, 50 and 5ng/ml of synthetic TCAP is extracted from serum and assayed in ELISA at 1/10
dilution, the % recovery of the peptide is 95 +/- 7%, 88 +/- 7% and 52 +/- 6% respectively. Thus,
50ng/ml can be consistently recovered using this method.
Discussion
The investigation described in this chapter led to a viable ELISA-based assay to detect TCAP in
tissues. However, the sensitivity is not low enough to detect TCAP directly, and therefore
extraction methods were evaluated.
This work has developed a specific immunoassay for TCAP that is reliable, precise and
relatively simple in design to perform. The assay has a large capacity with the use of a 96 well
plate: I have run up to 4 plates (384 available wells) in a single experiment with some minor pre-
planning in the procedure during washing and the final colorimetric stage. Compared to a
radioimmunoassay, the ELISA uses a labeled enzyme in place of a radioisotope so that it
requires less precaution, training and cost. Its development required the determination of the
most suitable antiserum, the optimization of primary antiserum, TCAP-Biotin and detection
reagents in terms of concentration one variable at a time. After optimization, the parameters of
the assay were established. The detection range is 0.5 – 100ng/ml and TCAP concentrations
within this range can be readily quantifiable. The BC50 or 50% binding capacity is 3.6ng/ml.
This value corresponds to the inflection point where the slope is steepest and so provides a
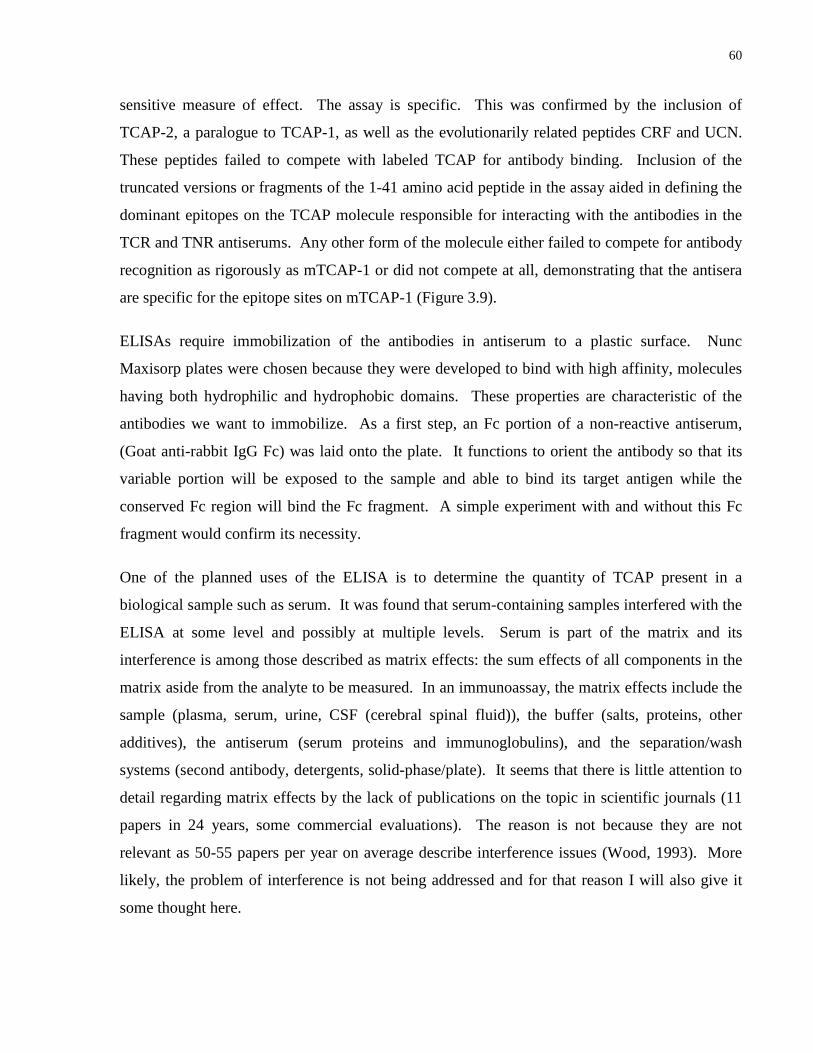
60
sensitive measure of effect. The assay is specific. This was confirmed by the inclusion of
TCAP-2, a paralogue to TCAP-1, as well as the evolutionarily related peptides CRF and UCN.
These peptides failed to compete with labeled TCAP for antibody binding. Inclusion of the
truncated versions or fragments of the 1-41 amino acid peptide in the assay aided in defining the
dominant epitopes on the TCAP molecule responsible for interacting with the antibodies in the
TCR and TNR antiserums. Any other form of the molecule either failed to compete for antibody
recognition as rigorously as mTCAP-1 or did not compete at all, demonstrating that the antisera
are specific for the epitope sites on mTCAP-1 (Figure 3.9).
ELISAs require immobilization of the antibodies in antiserum to a plastic surface. Nunc
Maxisorp plates were chosen because they were developed to bind with high affinity, molecules
having both hydrophilic and hydrophobic domains. These properties are characteristic of the
antibodies we want to immobilize. As a first step, an Fc portion of a non-reactive antiserum,
(Goat anti-rabbit IgG Fc) was laid onto the plate. It functions to orient the antibody so that its
variable portion will be exposed to the sample and able to bind its target antigen while the
conserved Fc region will bind the Fc fragment. A simple experiment with and without this Fc
fragment would confirm its necessity.
One of the planned uses of the ELISA is to determine the quantity of TCAP present in a
biological sample such as serum. It was found that serum-containing samples interfered with the
ELISA at some level and possibly at multiple levels. Serum is part of the matrix and its
interference is among those described as matrix effects: the sum effects of all components in the
matrix aside from the analyte to be measured. In an immunoassay, the matrix effects include the
sample (plasma, serum, urine, CSF (cerebral spinal fluid)), the buffer (salts, proteins, other
additives), the antiserum (serum proteins and immunoglobulins), and the separation/wash
systems (second antibody, detergents, solid-phase/plate). It seems that there is little attention to
detail regarding matrix effects by the lack of publications on the topic in scientific journals (11
papers in 24 years, some commercial evaluations). The reason is not because they are not
relevant as 50-55 papers per year on average describe interference issues (Wood, 1993). More
likely, the problem of interference is not being addressed and for that reason I will also give it
some thought here.
61
Components of the assay buffer may be potential sources of interference. I will consider
detergent and protein additives here. Many assay buffers have a low concentration of protein
added to it. BSA at 1% was used in this thesis work. BSA binds many haptens and peptides so
if you chose to add it to your assay buffer containing your peptide of interest (analyte), it may
bind to it (Kourides et al., 1976; Shearer et al., 1978).
Many buffers also contain a low concentration of detergent. Tween 20, a monolaurate
derivative, was the detergent used in this assay. The reason they are added is two-fold: 1) the
detergent molecule reduces the surface tension and the non-specific binding of components to
the reaction vessel wall as a result and, 2) the detergent molecules substitute for proteins that are
present in vivo and the more natural environment encourages antigen-antibody recognition. The
only drawback to its use is that the formulation includes peroxides that may negatively affect the
functionality of the assay. The mechanism by which peroxides interact with the assay is not
discussed. Wood cites Triton-X 405 as an adequate detergent and one that often reduces the
non-specific binding to below that of Tween 20 while increasing the dynamic range (signal to
noise ratio) of the assay.
Sources of interference can also come from the sample if it is contained in biological fluids.
Blood is such as example (Lensmeyer et al., 1986; Brombacher et al., 1988) though rarely used
for immunoassays because of the design of the assay. Whole blood contains many chromagens,
the most important here being haemoglobin and the degradation products formed upon blood
standing and haemolysis. Haemoglobin absorbs light between 500-550nm and bilirubin and
biliverdin (pyrrole-ring conjugates) absorb light between 400-500nm. These are within the range
of light absorbed by the chromagen used for detection is this ELISA: horse radish peroxidase
(HRP) absorbs light at 450nm after treatment with stop solution. Without prior separation of
these components, the haem compounds act as false positives and increase the absorbance of the
sample.
The alternatives to using whole blood are to isolate its plasma or serum components. Plasma
does not contain the haem compounds found in whole blood but it does contain fibrinogen and
clotting factors. Inclusion of these may cause a disturbance of the Ab-An reaction (Rooke et al.,
1982) or may initiate clotting during the assay and prevent subsequent separation of unwanted
molecules. Ethylenediaminetetraacetic acid (EDTA) (Bruynzeel et al., 1980), polyanions like
62
heparin (Krogstad et al., 1982) or additives such as sodium citrate or oxalate may be added to
prevent clotting however, these were also cited as sources of interference in immunoassays and
may generate additional problems.
The serum component of whole blood is most often used in immunoassays because it gives rise
to the least amount of interference in comparison to whole blood and plasma. Serum is devoid of
the clotting factors and fibrinogen found in plasma as well as the additives that are put into
plasma to counter their effects. In the past, serum was not considered the ideal material because
of the potential for proteolytic and hydrolytic activities inherent in blood combined with the
reality that additional time is required for serum to be extracted from whole blood and so
degradation will occur to some degree. This was measured experimentally: the peptide was
placed into serum and fractions were assessed in ELISA over time. There was no degradation of
the K8 labeled peptide (and minimal loss of the K37 labeled peptide) detected after 30 minutes,
an amount of time sufficiently longer than the estimated 5 minutes required for the extraction of
serum from whole blood (Figure 2.14).
The components not removed from serum are non-esterified fatty acids and binding proteins.
These components have been cited as a source of interference with the An-Ab binding process
(Shaw et al., 1976; Liewendahl and Helenius, 1976; Rash et al., 1979; Gold and Edgar, 1978). A
binding protein for TCAP has yet to be confirmed however, some western blots for TCAP have
indicated that one may exist (Chand, unpublished results). Binding proteins act at the An-Ab
binding level to the degree that they compete for the analyte molecules, especially if the binding
protein has an affinity constant equal to or greater than that of the antibody in question (Masters
and Hähnel, 1989). The number of “unspecific” molecules bound may influence the binding for
the “specific” molecule in question because an antibody that is blocked is unable to react with
the intact target in the sample. To resolve the problem, what are referred to as “blocking agents”
such as 8-anilino-1-naphthalene sulfonic acid (ANS) or salicylate (Seth et al., 1975; Laurberg
and Weeke, 1977) are used because they liberate the analytes from the binding proteins.
Aside from the interference of blood in ELISA, other biological fluids such as urine and more
relevant, CSF contribute to interference and are somewhat common materials used in
immunoassays. CSF, usually used when analyzing diseases of the central nervous system, may
be of interest to analyzing TCAP since TCAP was found to cross the blood brain barrier (Al

63
Chawaf et al., 2007b). Future ELISAs may be designed to quantify the peptide from this fluid in
order to further characterize its uptake and motility (Lovejoy et al., 2009). If this path is
explored, interference from other components in the CSF should be a consideration (Ferrero et
al., 1988).
TCAP can be successfully separated from serum using 1-D reverse-phase sorbents. The method
is a simple technique designed to remove major interferences such as plasma proteins and polar
compounds. In the event that TCAP will need to be isolated from more complex fluids or
tissues, more complex extraction procedures exist (2-D) and more than one method can be
employed. 1-dimensional refers to the number of variables in the method. In this case, only the
amount of organic solvent is varied. 2-D methods vary the concentration of the organic solvent
as well as the pH.
For samples in complex material such as plasma, dilution of the sample will decrease its
viscosity and the inclusion of a small percentage of acid or base will remove the interactions of
the molecule of interest with any plasma proteins. The next step is to condition the cartridge or
wet it. The ability to condition the column in water distinguishes the Oasis HLB columns from
other reverse-phase sorbents such as the silica-based C18 columns initially used with poor
recovery (data not shown). The problem with purely hydrophobic materials is that the column
may dry out and decrease the column’s adsorption capacity. The wetting property also allows
aqueous fluids to be added to the column directly such as plasma. The reason for wetting the
sorbent prior to the addition of a plasma sample is due to the pre-concentration effect that plasma
or serum encounter on a dry sorbent. Because large proteins are excluded from the pore space,
the viscosity of the fluid increases and the flow rate of samples decreases and can become non-
uniform which may affect the extraction efficiency. The next step is the wash and it functions to
remove weak protein interactors and other polar interferences such as carbohydrates (Wilson,
2003). The pore distribution in the HLB cartridges is designed to minimize the adsorption of
large amounts of protein (Bouvier et al., 1997).
In conclusion, the development of an ELISA was critical for the quantification of TCAP in a
quick, easy and reliable manner. A range of concentrations can be detected using this assay and
it is sensitive in the nanomolar range. The compatibility of blood in the ELISA was problematic:
the components in serum were the likely sources of interference in our system that necessitated

64
the separation of analyte from serum before testing. Various isolation methods have been
employed to deal with the complications of serum. Our chosen method of separation was a 1-
dimensional solid-phase extraction based on hydrophobicity. The optimized protocol is useful
for extracting concentrations above 50ng/ml and further optimization may increase this
sensitivity.
65
Chapter Four
Development of transcriptional assay systems to probe the function
of TCAP
Abstract
TCAP is a novel peptide presently under intense investigations. Of the TCAP functions known
at this time, the observation that TCAP rescues neuronal cultures from cell death and modulates
stress-induced behaviour in vivo suggests that TCAP could ameliorate both causes and effects of
depression and anxiety. In light of this, it is important to determine the cellular mechanisms of
TCAP that manifest in the morphology and behaviour we observe. The effects of the peptide on
the cellular signaling networks were investigated at the level of the end receivers of the signal,
the transcription factors, and their activation state was assessed by measuring the induction of
promoter elements using a luciferase reporter assay system. Of the response elements and
promoters tested, TCAP induced the serum response element (SRE) and repressed the activator
protein (AP)-1 and cfos promoters in hypothalamic cell cultures. These results are a stepping-
stone in elucidating the complex signaling network. They reinforce the idea that TCAP is a
biologically active neuroprotective peptide and suggest a role for TCAP in mediating the
transmission of neurodegenerative signals, possibly by intracellular calcium levels at the
transcriptional level. Investigation into the upstream kinases involved and repeating positive
experiments in an aberrant cellular environment would add to our current understanding of what
is occurring at the cellular level.
Introduction
TCAP is a biologically active peptide that can rescue neuronal cells from stress-induced death
(Trubiani et al., 2007) and leads to dendrite outgrowth in neuronal cell cultures (Al Chawaf et
al., 2007a). The receptor for TCAP and therefore the cellular mechanism of these TCAP actions
is unknown. TCAP is structurally similar to CRF, the peptide from which it was found and has
related effects. CRF signals via the GPCR system and induces cAMP. TCAP’s action on the
cAMP pathway has been investigated and a modest increase in cAMP levels was found (Wang et

66
al., 2005).
We sought to further explore the cellular signaling pathways affected by TCAP, choosing the
broad approach of looking at the transcriptional activity changes in response to TCAP.
Transcriptional gene control is achieved by the binding of trans-acting proteins called
transcription factors (TFs) to cis-acting regulatory DNA sequences. These DNA sequences are
at areas proximal to the initiation site of transcription and can also include TFs that bind to sites
at distant locations from the initiation site. When transcription factors bind or if already bound,
are activated, they recruit RNA polymerase II to the TATAAA, TATA box sequence.
Polymerase has a carboxy-terminal domain that becomes phosphorylated and initiates
transcription 25-30 base pairs downstream from the TATA box. Thus the TFs are the specific
regulators that convey the message from the cell signaling networks in the cytosol to the
transcriptional machinery within the nucleus.
TFs are very convenient to screen as markers for transcriptional activity because their binding to
DNA regulatory elements is specific and the target genes of many signaling pathways are
known. In this way, the promoter elements within the target gene can be investigated in the
simple format of reporter assays as a measure of pathway induction. For the reporter assay, the
transcriptional response elements were fused to the luciferase gene reporter. Thus the amount of
the luciferase activity would correspond to the activation state of the TF binding the response
element. The luciferase gene from the firefly is used as a reporter for the transcriptional activity
because the enzyme is easily assayed in cell extracts and for the same reason, the enzyme β-
galactosidase from the Lac Z gene in E. coli is utilized as a marker for transfection efficiency.
Transcriptional activity measured as the effect on a particular transcriptional response element
represents a rapid screening of signaling pathways, where many of them usually converge on a
single or several transcriptional response elements. The cfos promoter in figure 4.1 is regulated
by Elk1-SRF (Ets LiKe gene1-serum response factor), CREB (cAMP response element binding
protein), AP1 and other transcription factors that are in turn activated by p38, JNK (Jun N-
terminal kinase), early response kinase (Erk), protein kinase (PK) A, RhoA or elevated
cytoplasmic calcium ions (Kovács, 1998).

67
Figure 4.1 Transcriptional Activation of cfos.
Therefore, modulation of a response element (or a promoter containing multiple response
elements) will give a good starting point in terms of which signaling pathways to focus on.
Our first transcriptional target to screen was the cfos gene. It was chosen based on previous
work in our laboratory that found an attenuation of a CRF-induced increase in cfos expression
with TCAP administration. This occurs in many of the areas of the brain associated with
behavioral responses to stress including the hippocampus of the limbic system and specifically
the CA1, CA2 and most significantly the dendate gyrus and CA3 subfields of the hippocampus.
TCAP is structurally related to the CRF family of stress related hormones (Lovejoy et al., 2006)
and is able to modulate CRF-induced behaviours (Lovejoy et al., 2006; Al Chawaf et al., 2007b;
Tan et al., 2008; Tan et al., 2009) though the mechanism by which this occurs is not known. The
CRF pathway signals through a G protein-coupled receptor (GPCR) mechanism. It is unknown
whether TCAP utilizes the CRF receptor system to modulate CRF-induced behaviours but it is
possible given the structural similarity of the two peptides. cfos regulation occurs at the
transcriptional level. Thus we investigated whether TCAP inhibits basal activation of the cfos
promoter.
Based on the regulation of the cfos gene by TCAP and also on the effect of TCAP on neurite
outgrowth, we selected the transcriptional response elements involved in these pathways because

68
they are most likely to be affected by TCAP. cfos belongs to a family of genes called immediate
early genes (IEGs). These genes share the characteristics of having their expression rapidly and
transiently induced upon stimulation of cells. They also encode for transcription factors that
activate the expression of other genes and do not require de novo protein synthesis, that is, they
are activated even in the presence of protein sysnthesis inhibitors (Angel and Karin, 1991).
In some cases, induction induces synthesis of the transcription factors such as Fos and Jun and
their activity is subsequently regulated by dimerization and post-translational modification. The
IEG pathway provides a way to couple very different short-term events at the cell surface to
long-term changes in gene expression (Morgan and Curran, 1989). Most resting levels of IEGs
are acknowledged as being low however, several areas of the brain show constitutive expression
of cfos including the hypothalamus and the hippocampus. cFos expression in the hippocampus
under resting conditions is thought to reflect recent experience rather than attributing differences
in resting levels as random (Marrone et al., 2008). The cfos promoter contains multiple
transcriptional response elements including SRE, AP1, CRE (cAMP response element). In
addition, the cfos promoter also includes a calcium responsive sequence referred to as
Downstream Regulatory Element (DRE). The protein DREAM (DRE antagonist modulator) acts
as a transcriptional repressor of the cfos gene at this site. In the presence of calcium, DREAM
dissociates from the DNA and cfos transcription occurs (Carrion et al., 1999). Multiple elements
of the cfos promoter are targets of cAMP (Fisch et al., 1989), which TCAP was found to increase
(Wang et al., 2005).
Fos protein, regulated by CRF and TCAP in vivo (Tan et al., 2009) is a component of the AP-1
complex. The complex binds diverse functionally related proteins of the AP-1 family as a
heterodimer of Jun (c-Jun, Jun B, Jun D) and Fos (cfos, Fos B, Fra 1, and Fra 2) proteins or as a
homodimer of the Jun proteins (Angel and Karin, 1991). The AP-1 response element is induced
in response to stress, mitogen activation and participates in cell proliferation, death, and
quiescence processes (Herdegen and Waetzig, 2001). We sought to investigate if the
relationship between TCAP and inhibition of cfos expression has an effect on its role as a
transcription factor by inhibiting the transcriptional activation of the AP-1 site. Antioxidant
response element (ARE) is a composite element with two or more AP1-like responsive
sequences. It is found in promoters of genes that are responsible for the cellular detoxification of
xenobiotics such as glutathione S transferase and NAD(P)H:quinone oxidoreductase (Xie et al.,
69
1995). TCAP can rescue cells from stress-induced death by mediating the levels of radical
oxygen species (Trubiani et al., 2007) thus we investigated if the mechanism involved would be
through the ARE containing gene activation.
The CRE binding protein (CREB) is activated by various signaling pathways, most notably
cAMP elevation and phosphorylation by PKA, and as well by Ca2+ signaling acting via Ca2+-
calmodulin kinases (CaMkinases) and the mitogen-activated protein (MAP) kinases (Maturana et
al., 2002). CRF receptors use cAMP/PKA and Ca2+/calmodulin kinase to induce cfos expression
(Boutillier et al., 1991). Because TCAP downregulates CRF-induced Fos protein we questioned
where in the CRF signaling pathway this downregulation takes place. One hypothesis is that
TCAP inhibits the CRF-induced cfos transcription via the CRE site within the cfos promoter.
Another possible mechanism by which TCAP may repress CRF-induced cfos expression is by
inhibition of CRF expression itself via its promoter sites, resulting in less CRF expressed in the
cell. The promoter and 5′-upstream region of the CRF gene contains a glucocorticoid response
element (GRE) and a cAMP response element (CRE), as well as POU transcription factor
binding sites (Roche et al., 1988; Xu et al., 2001; Parham et al., 2004, reviewed in Hauger et al.,
2006). The GREs are bound by ligand activated glucocorticoid (GC) receptors and positively or
negatively regulate gene transcription directly or indirectly through association with other
transcription factors such as AP-1 or nuclear factor-κB (NF-κB). As a part of the hypothalamic-
pituitary axis (HPA) glucocorticoids cause negative regulation of some of the CRF responsive
genes such as pro-opiomelanocortin (POMC), and thus it is important to establish if TCAP acts
through GRE. Thus we explored whether TCAP affects the CRE and/or the GRE in the CRF
promoter. If these results prove negative, POU (a domain of 150-160 amino acids in specific
proteins involved in transcription control) (Herr et al., 1988) binding sites could also be
explored.
TCAP has been shown to be involved in the regulation of neurite outgrowth and differentiation
as analysed using Sholl’s analysis (Al Chawaf et al., 2007a). Specifically β-tubulin and α-
actinin translation were elevated in the presence of TCAP-1 over 7 days. Also, mRNA transcript
levels were upregulated in N38 cells. In addition, TCAP facilitates neurite fasciculation and
arbor branching (Al Chawaf et al., 2007a). The Serum Response Element (SRE) is not only
present in cfos gene but also regulates both actinin and tubulin that are important proteins in
neurite growth. SRE is recognized by the transcription factor serum response factor (SRF). The
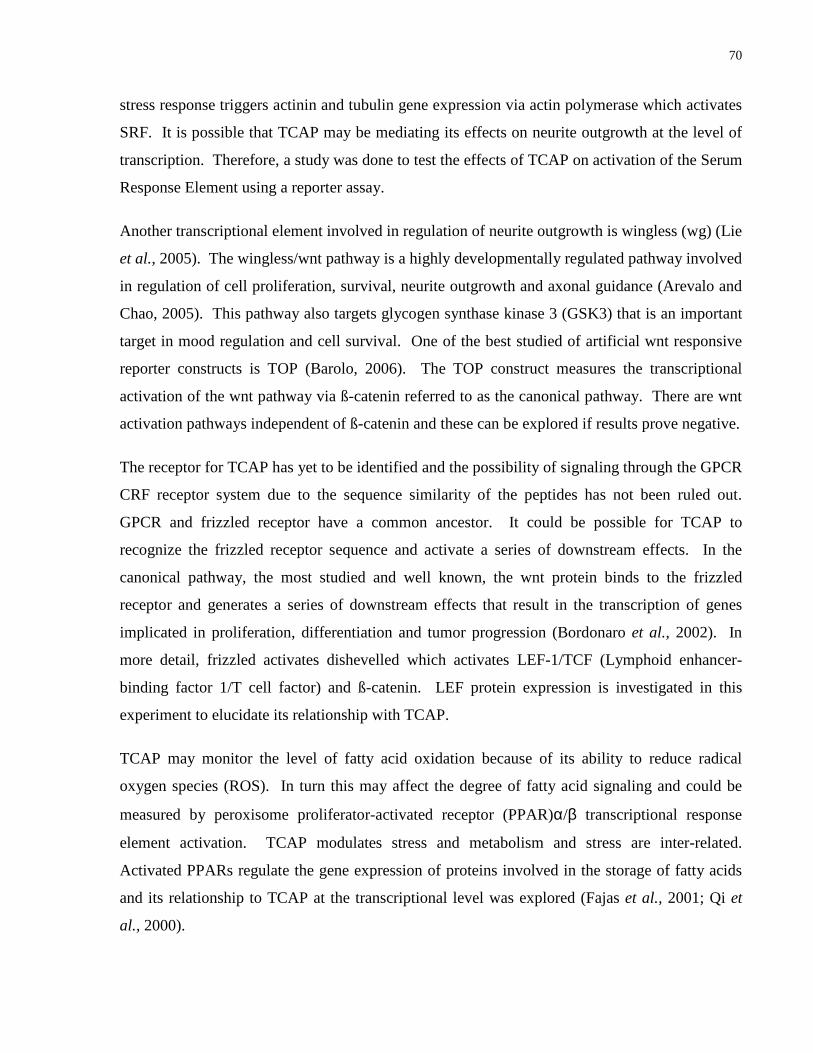
70
stress response triggers actinin and tubulin gene expression via actin polymerase which activates
SRF. It is possible that TCAP may be mediating its effects on neurite outgrowth at the level of
transcription. Therefore, a study was done to test the effects of TCAP on activation of the Serum
Response Element using a reporter assay.
Another transcriptional element involved in regulation of neurite outgrowth is wingless (wg) (Lie
et al., 2005). The wingless/wnt pathway is a highly developmentally regulated pathway involved
in regulation of cell proliferation, survival, neurite outgrowth and axonal guidance (Arevalo and
Chao, 2005). This pathway also targets glycogen synthase kinase 3 (GSK3) that is an important
target in mood regulation and cell survival. One of the best studied of artificial wnt responsive
reporter constructs is TOP (Barolo, 2006). The TOP construct measures the transcriptional
activation of the wnt pathway via ß-catenin referred to as the canonical pathway. There are wnt
activation pathways independent of ß-catenin and these can be explored if results prove negative.
The receptor for TCAP has yet to be identified and the possibility of signaling through the GPCR
CRF receptor system due to the sequence similarity of the peptides has not been ruled out.
GPCR and frizzled receptor have a common ancestor. It could be possible for TCAP to
recognize the frizzled receptor sequence and activate a series of downstream effects. In the
canonical pathway, the most studied and well known, the wnt protein binds to the frizzled
receptor and generates a series of downstream effects that result in the transcription of genes
implicated in proliferation, differentiation and tumor progression (Bordonaro et al., 2002). In
more detail, frizzled activates dishevelled which activates LEF-1/TCF (Lymphoid enhancer-
binding factor 1/T cell factor) and ß-catenin. LEF protein expression is investigated in this
experiment to elucidate its relationship with TCAP.
TCAP may monitor the level of fatty acid oxidation because of its ability to reduce radical
oxygen species (ROS). In turn this may affect the degree of fatty acid signaling and could be
measured by peroxisome proliferator-activated receptor (PPAR)α/β transcriptional response
element activation. TCAP modulates stress and metabolism and stress are inter-related.
Activated PPARs regulate the gene expression of proteins involved in the storage of fatty acids
and its relationship to TCAP at the transcriptional level was explored (Fajas et al., 2001; Qi et
al., 2000).

71
Materials and Methods A luciferase reporter assay is based on measuring transcriptional activity of a promoter element
that is fused to easily quantifiable gene such as luciferase. The reporter constructs are introduced
into the cells by the means of transfection. Once the plasmid is delivered into the cells, TCAP is
added in a dose dependent manner and then the cells are harvested for the quantification of
luciferase catalyzed luminescent product. Liposome-mediated transfection, lipofection, is a
powerful technique for DNA transfer into cultured eukaryotic cells. Transfection reagents are
engineered to form cationic liposomal complexes that neutralize negatively charged DNA
through condensation. It has a slight positive charge allowing it to interact with anionic
proteoglycans of the cell membrane, settle on the cell surface by gravity and become absorbed
into the cell by endocytosis. The properties of the complex cause the vesicles to rupture and
release the complex into the cytoplasm, where it is translocated to the nucleus. (Simberg et al.,
2001)
Cell Lines
N38 or N3 immortalized hypothalamic cells were used in the reporter assays were obtained from
Dr D Belsham and have been described before (Belsham et al., 2004). Briefly, N3/38 cell lines
were developed using a retroviral transfer of SV40 T-Ag into primary hypothalamic cultures to
generate an array of cell models. The mixed populations of neurons needed to be subsequently
isolated and characterized and were subcloned and defined by expression of specific
neuropeptides and receptors. The clonal cell models express neural cell markers, exhibit
neurosecretory peptides, and respond appropriately to hormonal stimulation.
The 293T cell line was used for experiments focusing on the CRF receptor system in order to
transfect exogenous CRF receptor plasmids.
Promoter Constructs
pGL3 vector was used for cloned promoter inserts. The vector was modified to contain a
TATAA box region following the responsive element. The TATAA sequence used was identical
to well characterized adenovirus E1b gene TATA box. The pGL3 vector was cut with KpnI first
using 2-3µg vector, 10µl enzyme, buffer, BSA, in 20µl volume at 37°C for 1h. 1% agarose gel
was used to purify the cut 5kb fragment and extracted from the get using Invitrogen SureLink gel
purification kit. The vector was then digested with MluI and dephosphorylated using Calf

72
intestinal phosphatase CIP 1µl (Fermentas). Dephosphorylation removes the phosphates so that
in case the vector was cut only with one enzyme it can not ligate to itself. The oligonucleotides
were obtained from Sigma Genosys and comprised sense strand, ARE is shown here as an
example:
ARE-s
5’CAATCGCAGTCA CAGTGACTCA GCAGAATCTGAGCCT A
And antisense strand of ARE-a
5’CGCGTAGGCTCAGATTCTGCTGAGTCACTGTGACTGCGATTGGTAC
The oligonucleotides were resuspended at 1mg/ml in water and further phosphorylated using 1µg
each oligo, 5µl ligation buffer containing salts and ATP, 43µl water, 1µl Polynucleotide kinase
(PNK) (Fermentas) and incubated at 37°C for 1h. The PNK was inactivated by incubating at
95C for 10min and then allowed to slowly cool down to facilitate the annealing of sense and
antisense. The annealed oligos have overhanging 3’ and 5’ ends that are complementary to the
vector cut with KpnI and MluI ends, as shown below.
5’ CAATCGCAGTCA CAGTGACTCA GCAGAATCTGAGCCT A3’
3’CATGGTTAGCGTCAGTGTCACTGAGTCGTCTTAGACTCGGATGCGC5’
The vector was cut so the receiving ends are:
GGTAC CGCGT
G A
The cfos promoter fragment was amplified by PCR with oligonucleotides (Sigma Genosys, see
table), mouse genomic DNA (gift from Dalia Barsyte), Taq polymerase (NEB), dNTPs
(Amersham) with the following parameters: 95°C for 5min, 30 cycles of 95°C for 30sec, 55°C
for 30sec, 72°C for 1min and final extension at 72°C for 3min. The fragments were gel isolated
as described above, digested with KpnI MluI and cloned as above. The ligation was performed
using about 100ng of the cut vector, 1µl of annealed oligo mix, ligase 1µl (NEB) and ligation
73
buffer in 20µl volume at 16°C overnight. The ligation mix was transformed into DH5α
subcloning effiency competent bacteria (Invitrogen) according to the manufacturers instructions.
E. coli DH5α containing the plasmids were grown on LB media agar. Single colonies were
chosen from the plate, placed in 3ml of LB media and incubated at 37°C for overnight growth
(no longer than 15 hours). Samples were then centrifuged at 14K for 5min, the supernatant was
removed and the bacteria pellet used for plasmid purification.
Plasmids were purified using a commercially available kit and in accordance to the
manufacturer’s instructions (QIAprep Spin Miniprep Kit). Subsequently, the plasmid DNA was
measured using a spectrophotometer at 2 wavelengths: absorbance at 260 nm measures the
concentration of purified DNA and absorbance at 280nm measures the concentration of all
protein contamination in the sample. Diagnostic restriction digests were performed on all
reporter plasmids using the appropriate enzymes to generate discernable nucleotides by length
when subsequently run on an agarose gel. Fragments that appear at the corresponding size after
running them on a gel confirm that the intended sequence is in the plasmid.
Luciferase Reporter Assay
The firefly luciferase was used as a reporter. It encodes the 62kDa enzyme luciferase which
produces light by the ATP-dependent oxidation of luciferin. Typically, luciferase expression is
measured by adding the substrates ATP and luciferin to cell lysates and immediately analyzing
light production with a luminometer at 560nm. Light emission peaks within seconds after
substrate addition and subsequently decays to zero after approximately 30 minutes. The
chemiluminescence from the reaction is proportional to the luciferase concentration (in the
presence of excess substrate).
Plasmid expressing β-galactosidase was co-transfected together with the luciferase reporter
plasmid in order to control for the transfection efficiency. Cell lysates were assayed for β-gal
that hydrolyses ortho-Nitrophenyl-β-galactoside (ONPG), a synthetic colourless substrate, to
produce a yellow coloured product that is easily visible and able to be measured at 405nm in a
spectrophotometer.
For the assay, N38 cells (75,000/well), N3 cells (50,000/well) or 293 cells (250,000/well) were
seeded into 6-well plates with 2ml Dulbecco's minimal essential medium (DMEM) containing
74
10% fetal bovine serum (FBS) and 1% Penicillin-Streptomycin and left undisturbed for 24 hours.
Prior to transfection, the medium was changed to revive unhealthy cells and remove the cells not
adhering to the flask appropriately or those detached and floating in the media. At this stage,
cells were at least 50% confluent to proceed with transfection.
Transfection
The 50%-75% confluent cells were transfected with FuGENE-6 transfection reagent (Roche Molecular
Biochemicals, Mannheim, Germany) in accordance with the manufacturer’s instructions. Specifically,
0.1µg of CMV β-galactosidase control plasmid was co-transfected with 0.9µg of reporter plasmid in each
well. Amounts of plasmids fluctuated depending on the concentration/OD reading after purification
which alters the amount of DNA added. pcDNA3 plasmid DNA was added to the transfections if needed
to achieve the same total amount of plasmid DNA per transfection. The ratio of DNA: transfection
reagent was optimized for maximal transfection with minimal cell death and a ratio of 3:1 was selected.
Following transfection, cells were either left undisturbed for 48h or 24h after which new media was given
and left for an additional 24h.
TCAP Treatment
Cells were treated with the indicated concentrations of TCAP at the indicated time point prior to
harvest. Desired treatment concentrations were made through serial dilutions using a frozen
stock of 1mg/ml. At the appropriate time, the media was exchanged with the media containing
the corresponding TCAP concentration. Control wells were exchanged with fresh media at the
same time as drug treatments were given. All positive controls were added at indicated times.
Reporter Assays
Luciferase assays were conducted using the Luciferase Assay System (Promega). All cells were
lysed for 10 min on ice in 150µl of lysis buffer and collected using a cell scraper. A 25µl aliquot
of each lysate was added to individual wells of a 96 well CLINIPLATE plate (Labsystems).
Luciferase expression was quantified using a Luminoskan Ascent luminometer (Labsystems) in
accordance with the manufacturer’s instructions. Luciferase activities were normalized with
respect to parallel β-galactosidase activities, to correct for differences in transfection efficiency.
A volume of 20µl of cell lysate and 200µl of a solution of 10mg/ml ONPG in ONPG buffer were
aliquoted into separate wells in a clear 96 well plate and measured at 405nm using a

75
spectrophtometer (previously described). Results were analysed using a one-way analysis of
variance (ANOVA) followed by Bonferroni’s post test if ANOVA was significant (p<0.05).
Results
The purpose of these experiments was to see if TCAP modulates certain transcriptional response
elements found in the promoter region of specific genes were modulated by TCAP. We had
initiated the cloning of cfos promoter and at the same time tested individual response elements
present on the cfos promoter including AP1, SRE, CRE. In addition, the hypotheses that TCAP
regulates neuroprotection through other elements were also tested.
Figure 4.2: AP1 reporter activity in response to TCAP in N3 hypothalamic cells. Treatments were given 4 hours prior to harvest. Experiment was done in triplicates. Numbers along the x-axis indicate the TCAP fragment and concentration.
AP1 was examined initially with full-length TCAP and in later experiments with fragments of
the TCAP peptide included to determine if the activity observed was associated with a particular
region of the peptide. TCAP 1-8 significantly decreased basal activation of the AP1 promoter at
10-7M, 10-9M and 10-11M. TCAP 1-41 (full length) tended to decrease AP1 basal activation in
a dose-dependent manner, though this trend was not statistically significant. TCAP 9-41 had no
effect on the AP1 promoter. Results were analysed using a one-way analysis of variance

76
(p=0.0067) (Figure 4.2). A β-galactosidase vector was tested and is unresponsive to TCAP
treatment. The parental pGL3 vector was also tested and found to be unresponsive to TCAP
(results not shown).
control 10-7 10-9 10-110.00
0.25
0.50
0.75
1.00
1.25
1.50
1.75
TCAP (M)
RLU
Figure 4.3 Reporter activity of the serum response element (SRE) in response to TCAP addition. Treatments were given at 16 hours and again at 4 hours to the same samples prior to harvest. Experiment was done in duplicates using N3 hypothalamic cells.
The SRE on the cfos promoter was tested for TCAP responsiveness in a dose-dependent manner.
There was no significant effect of TCAP on the SRE. There is a tendency to increase basal
activation in a direct dose-dependent relation from 10-7M to 10-11M however, because the
experiment was done in duplicates, only the significant difference was not achieved (Figure 4.3).
77
control 10-7 10-9 10-11 10-13 10-15 EGF0.00
0.25
0.50
0.75
1.00
1.25
1.50
1.75
*R
LU
Figure 4.4 Reporter Activity of the serum response element (SRE) in response to TCAP addition. Treatment was given 4 hours prior to harvest. [EGF] (early growth factor) = 0.5µg/ml. Experiment was done in triplicates using N3 hypothalamic cells.
There is a significant difference between control and TCAP at 10-13M however, a one-way
analysis of variance indicates that there is no significant difference between treatments overall
(p=0 .0667) although there is a tendency to increase SRE activation (Figure 4.4) and this trend
was present in repeated experiments.
The CRE is another element on the cfos promoter that may be modulated by TCAP. CRF
activates the cfos promoter as well other CRE sites by cAMP elevation. TCAP-1 shares primary
sequence similarity to the CRF peptide and molecules with structural similarity can have the
ability to signal via the same receptor mechanism based on the factors involved in ligand-
receptor recognition. It is not known whether TCAP signals via the CRF receptor system.
Presently, the receptor for TCAP is not known. In this experimental design, in addition to testing
CRE activation, we also tested whether TCAP signals through the CRF receptors type 1 and/or 2.
The rationale was that if TCAP competed with CRF for signaling through the CRF receptor, it
would be detectable as cAMP Response Element (CRE) activation or repression.

78
Figure 4.5: Reporter Activity of the cAMP Response Element (CRE) in 293T human embryonic kidney cells A. CRF Receptor 1. B. CRF Receptor 2. Treatments were given 4 hours prior to harvest. Experiment was done in triplicates and figure shown is representative of results from 3 separate experiments. Concentration of TCAP and CRF was 10-9M.
CRF addition at 10-9M significantly increased activation of the cAMP response element above
basal conditions via CRF receptor 1 (R1) (Fig. 4.5A) and CRF receptor 2 (R2) (Fig. 4.5B).
Results were analysed using a one-way analysis of variance (p<0.0001). The results confirm that
CRF does activate the CRE via the CRF receptor and this response does not differ from the
response of TCAP and CRF together. In addition, TCAP alone had no effect on CRE activation
via CRF R1 or R2 compared to basal conditions. The results suggest that TCAP does not modify
the CRF-induced activation of CRE.
In terms of the cell model chosen, 293T cells with CRF R1 or R2 receptor transfected were used
because immortalized hypothalamic cell lines showed no consistent response to CRF and the
transfection efficiency for N3 and N38 is quite low such that introducing another plasmid would
likely decrease the response to an undetectable level. In addition, 293T cells were also
unresponsive to TCAP in the absence of ectopic receptors however, they were chosen as the cell
model because the transfection efficiency is much greater.
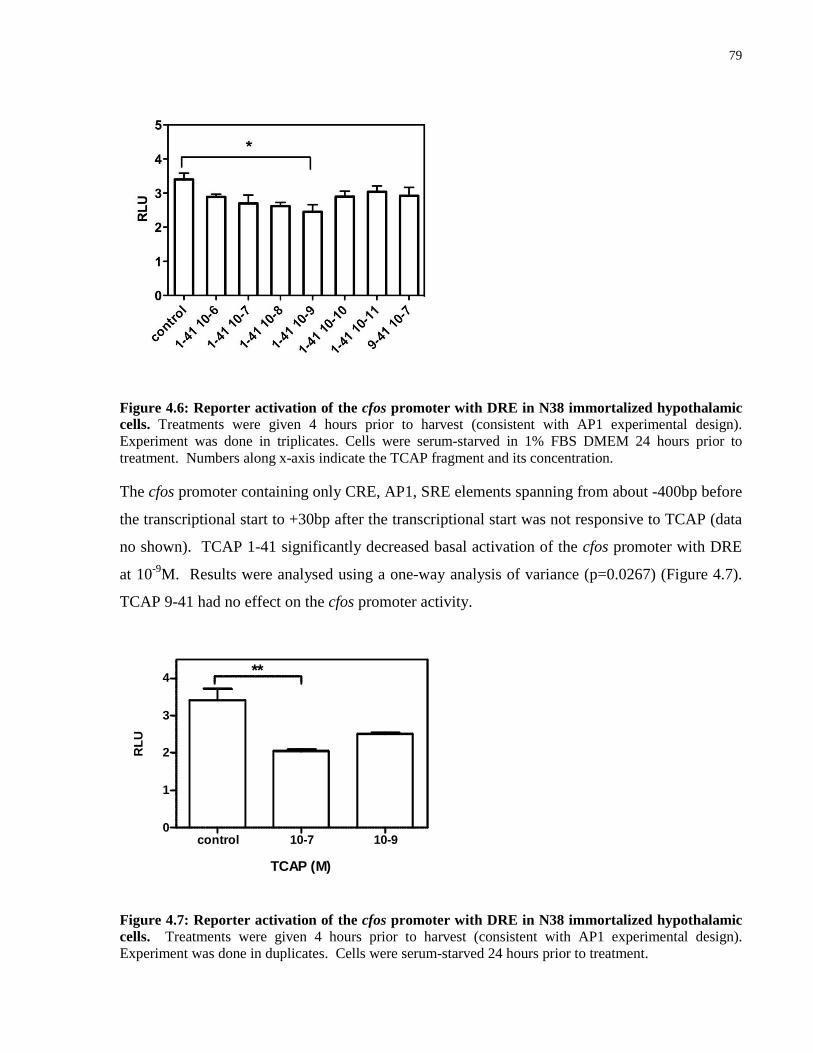
79
Figure 4.6: Reporter activation of the cfos promoter with DRE in N38 immortalized hypothalamic cells. Treatments were given 4 hours prior to harvest (consistent with AP1 experimental design). Experiment was done in triplicates. Cells were serum-starved in 1% FBS DMEM 24 hours prior to treatment. Numbers along x-axis indicate the TCAP fragment and its concentration.
The cfos promoter containing only CRE, AP1, SRE elements spanning from about -400bp before
the transcriptional start to +30bp after the transcriptional start was not responsive to TCAP (data
no shown). TCAP 1-41 significantly decreased basal activation of the cfos promoter with DRE
at 10-9M. Results were analysed using a one-way analysis of variance (p=0.0267) (Figure 4.7).
TCAP 9-41 had no effect on the cfos promoter activity.
control 10-7 10-90
1
2
3
4 **
TCAP (M)
RL
U
Figure 4.7: Reporter activation of the cfos promoter with DRE in N38 immortalized hypothalamic cells. Treatments were given 4 hours prior to harvest (consistent with AP1 experimental design). Experiment was done in duplicates. Cells were serum-starved 24 hours prior to treatment.
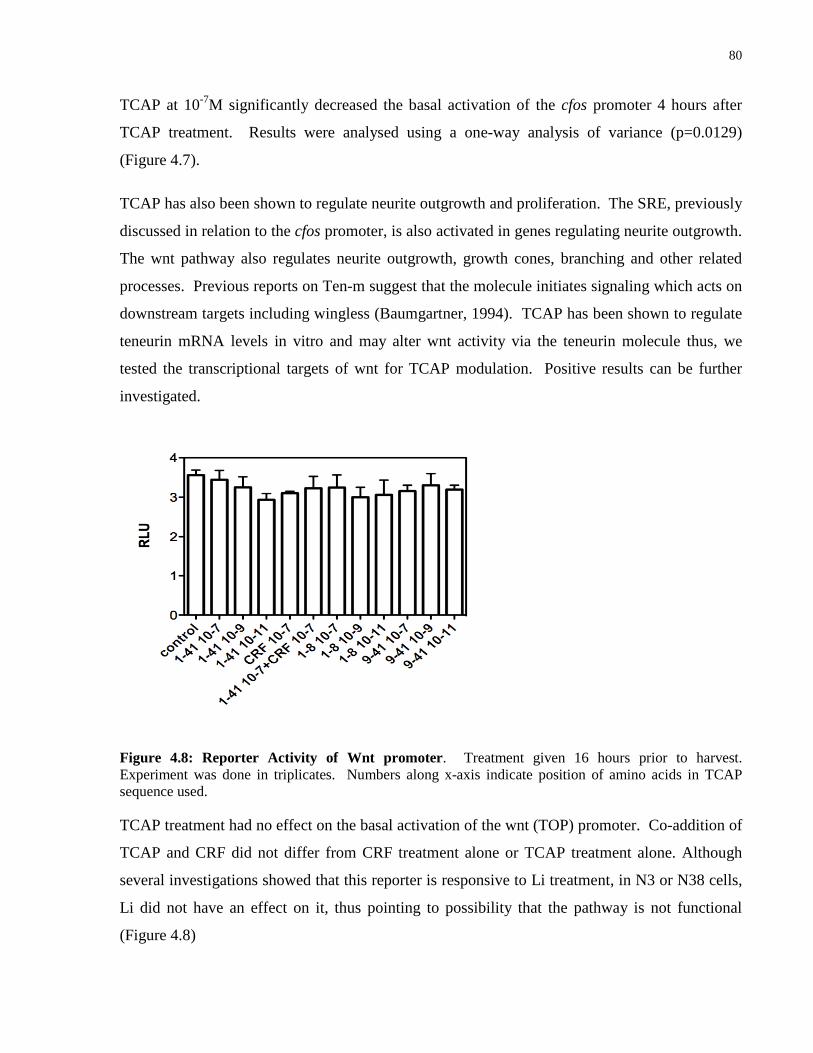
80
TCAP at 10-7M significantly decreased the basal activation of the cfos promoter 4 hours after
TCAP treatment. Results were analysed using a one-way analysis of variance (p=0.0129)
(Figure 4.7).
TCAP has also been shown to regulate neurite outgrowth and proliferation. The SRE, previously
discussed in relation to the cfos promoter, is also activated in genes regulating neurite outgrowth.
The wnt pathway also regulates neurite outgrowth, growth cones, branching and other related
processes. Previous reports on Ten-m suggest that the molecule initiates signaling which acts on
downstream targets including wingless (Baumgartner, 1994). TCAP has been shown to regulate
teneurin mRNA levels in vitro and may alter wnt activity via the teneurin molecule thus, we
tested the transcriptional targets of wnt for TCAP modulation. Positive results can be further
investigated.
Figure 4.8: Reporter Activity of Wnt promoter . Treatment given 16 hours prior to harvest. Experiment was done in triplicates. Numbers along x-axis indicate position of amino acids in TCAP sequence used.
TCAP treatment had no effect on the basal activation of the wnt (TOP) promoter. Co-addition of
TCAP and CRF did not differ from CRF treatment alone or TCAP treatment alone. Although
several investigations showed that this reporter is responsive to Li treatment, in N3 or N38 cells,
Li did not have an effect on it, thus pointing to possibility that the pathway is not functional
(Figure 4.8)

81
TCAP and CRF display a significant level of homology. Because CRF activated the HPA that
ultimately is known to affect GRE, we tested if TCAP has an effect on GRE. Our hypothesis
was to test whether TCAP directly affects GRE or modulates the glucocorticoid mediated
activation of GRE. The results show that TCAP does not activate or repress the GRE and does
not modify dexamethasone induced activation. Dexamethasone at 10nM significantly increased
activation of the GRE above basal levels and confirmed functionality of the GRE insert in the
reporter system (Figure 4.9). Results were analysed using ANOVA (p=0.0104).
Figure 4.9: Reporter activation of the glucocorticoid response element (GRE). Treatments were given 24 hours prior to harvest. Dex = dexamethasone at 10nM. Experiment was done in triplicates.
The antioxidant response element (ARE) is often induced under aberrant conditions to order to
return the cell to homeostasis. In relation to TCAP’s neuroprotective effects, the response
elements activated under stress including ARE were tested for modulation by TCAP.
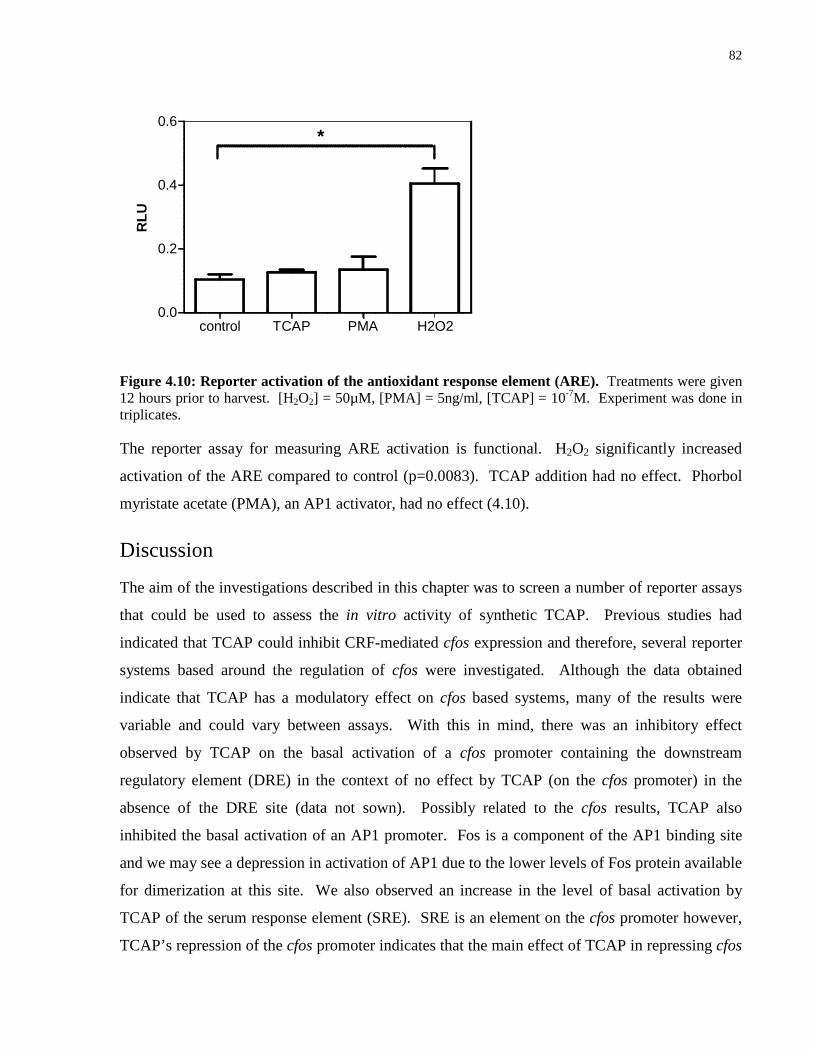
82
control TCAP PMA H2O20.0
0.2
0.4
0.6*
RL
U
Figure 4.10: Reporter activation of the antioxidant response element (ARE). Treatments were given 12 hours prior to harvest. [H2O2] = 50µM, [PMA] = 5ng/ml, [TCAP] = 10-7M. Experiment was done in triplicates.
The reporter assay for measuring ARE activation is functional. H2O2 significantly increased
activation of the ARE compared to control (p=0.0083). TCAP addition had no effect. Phorbol
myristate acetate (PMA), an AP1 activator, had no effect (4.10).
Discussion
The aim of the investigations described in this chapter was to screen a number of reporter assays
that could be used to assess the in vitro activity of synthetic TCAP. Previous studies had
indicated that TCAP could inhibit CRF-mediated cfos expression and therefore, several reporter
systems based around the regulation of cfos were investigated. Although the data obtained
indicate that TCAP has a modulatory effect on cfos based systems, many of the results were
variable and could vary between assays. With this in mind, there was an inhibitory effect
observed by TCAP on the basal activation of a cfos promoter containing the downstream
regulatory element (DRE) in the context of no effect by TCAP (on the cfos promoter) in the
absence of the DRE site (data not sown). Possibly related to the cfos results, TCAP also
inhibited the basal activation of an AP1 promoter. Fos is a component of the AP1 binding site
and we may see a depression in activation of AP1 due to the lower levels of Fos protein available
for dimerization at this site. We also observed an increase in the level of basal activation by
TCAP of the serum response element (SRE). SRE is an element on the cfos promoter however,
TCAP’s repression of the cfos promoter indicates that the main effect of TCAP in repressing cfos
83
activation is likely not mediated at this site. The implications of TCAP’s action on the SRE will
be discussed in its importance on other genes involved in neurite outgrowth.
TCAP has neuroprotective effects in cell culture and may be a future treatment used to decrease
the effects of hypoxic insults after they have occurred. TCAP treatment protects against radical
oxygen species and this may be related to its inhibition of cfos activation. The cfos promoter
contains a number of elements that are targets for the mitogen-activated protein kinase (MAPK)
signaling (reviewed in Whitmarsh and Davis, 1996) and hypoxia induces cfos transcription in
this way via the MAPK-dependent pathway (Müller et al., 1997). Given the findings that TCAP
represses activation of the cfos promoter as well as the role it plays in mediating readical oxygen
species that result from hypoxic conditions, TCAP could be mediating cfos repression through
the MAPK pathway. There is evidence that TCAP tends to activate the SRE, a target of the
MAPK pathway (Ransone and Verma, 1990). Measurement of the phosphorylated versions of
kinases involved in the pathway after TCAP exposure would also be useful in narrowing down
the pathway but inconclusive because kinases from more than one pathway are often involved.
For example, upstream of the serum response element (SRE) and we find transcription factors
serum response factor (SRF) and ETS-domain ternary complex factors (TCFs), including Elk-1
and SAP-1. Elk-1 can be phosphorylated and activated by any of ERK, JNK and p38 and SAP-1
by ERK and p38 and SRF by casein kinase II (CKII) and calmodulin kinase (CaMK), leading to
enhanced transcription of the cfos gene (reviewed in Sharrocks, 2001). The regulation of
immediate early genes such as cfos (and if of interest c-jun) is therefore highly complex
requiring the integration of multiple signaling pathways that target multiple promoter elements.
Changes in intracellular Ca2+ levels are important determinants of cfos gene expression (Bading
et al., 1993; Ghosh and Greenberg, 1995; Hardingham et al., 1997). Transcription is regulated
by calcium through a downstream regulatory element (DRE) site. DRE is a location-dependent
gene silencer (Carrion et al., 1999) that binds DREAM to repress gene induction. Ca2+ binding
to DREAM reduces its affinity for the DRE sequence and transcription occurs. There is
evidence that this is cell-specific and that a more elaborate process may be in effect involving
elements in addition to DREAM (Ledo et al., 2000).
In addition to the DRE site in the first intron downstream, CRE, and not the SRE (both classical
leucine zipper sites upstream of the transcription start site), was found to be another element
84
involved in the cfos regulation. Mutating the SRE site had no effect, while mutations in the CRE
site and a major part of the intron decreased cfos transcription by 60% and 75% respectively.
Inhibitors of Ca2+/calmodulin-dependent kinases and PKA each decreased activation of
transcription by 50% and together, abolished the induction completely (Susini et al., 2000). The
effect of TCAP on the cfos promoter seems to be unrelated to its actions on the SRE site.
Exactly how TCAP activates the SRE and inhibit the cfos promoter in light of the presence of an
SRE is an element within the promoter is not yet known. TCAP must be acting at another site to
inhibit cfos basal activation. After including the DRE site into our promoter, TCAP was found to
repress basal activation. The relationship between TCAP and calcium is likely to be a future
topic to be studied.
TCAP has been shown to play a role in the regulation of superoxide dismutase, one of the
enzymes responsible for the detoxification of reactive oxygen species (Trubiani et al., 2007).
Transcription of the manganese superoxide dismutase (MnSOD) gene is activated following
oxidative stress by 12-O-tetradecanoylphorbol-13-acetate (TPA). MnSOD has several
responsive sites within its promoter including NF-κB, AP1 and CRE. Of these, CRE, and not
NF-κB or AP1, appears to mediate transcriptional activation of the MnSOD gene via TPA. In
our reporter design, TCAP was given under healthy (non-stressed) conditions and in this
environment, the protein was not found to modulate CRE activation. This could be because
TCAP does not modulate its antioxidative effects through this response element or it could be
that the conditions were not conducive for it to do so. The former point could be due to the
relationship between the DREAM protein and αCREM (cAMP responsive element modulator).
Recall that TCAP treatment mildly increased cAMP levels and this in turn activates protein
kinase A (PKA). cAMP-dependent gene expression control occurs at the transcriptional level by
bZIP transcription factors including CREB, CREM, and ATF (Activating transcription factor).
In the absence of Ca2+, DREAM binds to CREB to inhibit cfos transcription. DREAM binding
to CREB impairs recruitment of CBP by phospho CREB and blocks CBP-mediated
transactivation at CRE sites in a Ca2+-dependent manner. Thus, Ca2+-dependent interactions
between DREAM and CREB represent a novel point of cross-talk between cAMP and Ca2+
signalling pathways in the nucleus (Ledo et al., 2002)
Epidermal growth factor (EGF) repeats are a major evolutionarily conserved component within
the teneurins. EGF and TCAP have both been shown to activate SRE and modulate

85
transcriptional activation of cfos. The cfos modulation by EGF occurs via a pathway
independent of protein kinase C. In the case of TCAP, cfos modulation requires the absence of
calcium. If TCAP signaling was independent of calcium, through the same pathway as EGF,
TCAP would not be expected to modulate cfos via typical protein kinase C (PKC), nor alter CRE
levels.
AP1 proteins are a family of transcription factors that bind to AP1 transcriptional elements as
dimers. Because their binding to DNA is required for the activation of basal transcription
machinery, they co-determine the time and amount of gene transcription of those genes having
promoters that contain them (Herdegen and Waetzig, 2001). The observation that TCAP inhibits
the AP1 element is consistent with TCAP’s inhibition of basal transcription of the cfos promoter:
down-regulation of the Fos protein reduces its availability to dimerize with other Fos proteins
and bind to the AP-1 site.
The activation of the SRE site may be more important for the transcription of genes other than
cfos that contain this site in their promoter. SRE is a nuclear target for neurite outgrowth
signaling, a process that is regulated by TCAP. The observations that TCAP increases mRNA
and protein levels of cytoskeletal elements in the neuron may be mediated via the SRE site
within the promoter of these genes.
The wnt pathway was examined in a reporter assay using a luciferase-expressing transfection
construct, TOPFLASH. The construct contains multimerized ‘optimal’ TCF binding sites that
respond specifically to the Wnt/beta-catenin pathway stimulation in culture (Korinek et al.,
1997). These sites are (nearly) identical to the highest-affinity known in vitro binding site for
Tcf-1, CCTTTGAT (van Beest et al., 2000). TCAP does not appear to modulate Wnt activation
through the canonical beta-catenin/TCF pathway in our reporter design. TCAP has been shown
to inhibit basal activation of a cfos promoter construct containing downstream regulatory element
(DRE). The cfos gene is a transcriptional target of Wnt/beta-catenin signaling (Staal et al.,
2004). Its promoter has been used in TCF reporter constructs to monitor wnt activation. Though
the cfos promoter site does not contain any TCF binding sites, it does contain a cyclic AMP
response element (CRE) (Robertson et al., 1995), which may contribute to or independently
activate certain wnt genes. TCF sites and CREs act cooperatively on certain Wnt target genes
(Hernandez-Munain et al., 1998; Yu et al., 1998; Spychala et al., 1999; Pradeep et al., 2004) and
86
have recently been shown to activate transcription directly via CREs (Chen et al., 2005). When
this project began, several transcriptional elements were screened simultaneously and wnt, CRE
and cfos were among them. If TCAP regulated CRE, it may regulate the wnt pathway via the
same site. The wnt pathway was chosen for its structural and functional similarities to the
teneurins and in addition, the similarity between cfos and beta-catenin binding wnt promoters,
that is, the CRE. The hypothesis was that TCAP may affect the transcriptional activation of wnt
in the same manner as cfos. TCAP does not modulate wnt activation in hypothalamic cells nor
does it modulate CRE activation. From these observations, we can say that TCAP does not
modulate wnt via TCF or CRE binding sites.
As previously stated, the receptor for TCAP has yet to be identified. It is possible that TCAP
activates the wnt pathway via the Frizzled receptor, an evolutionarily related receptor to the CRF
family because they share common ancestor. Thus, we investigated TCAP’s action on the wnt
pathway. The Wnt family of secreted proteins plays a crucial role in the nervous system wiring.
Wnts regulate neuronal positioning, polarization, axon and dendrite development, and
synaptogenesis. Wnt-receptor signaling is required for anterior-posterior organization of
neuronal polarity in C. elegans as well as axon-dendrite polarity in hippocampal neuronal culture
via aPKC/Par3/Par6 pathway (Salinas and Zou, 2008). The knockdown of the teneurin homolog
ten-1 in C. elegans leads to defasciculation and aberrant pathfinding. Teneurin is vital in the
nervous system development. The phenotype of the teneurin knockout is similar to the wnt
knockout. Although both TCAP and wnt regulate aspects of the nervous system and knockouts
of wnt and Teneurin (including TCAP) share a similar phenotype, TCAP had no effect on
transcriptional activation of the Wnt pathway through beta-cateinin/TCF binding, thus the
regulation of these effects may occur through parallel pathways or may not be readily detectable
in the cell lines used.
The cell model is an important factor in conducting in vitro assays. Previous studies have
established that wnt is active during neuronal development and only in specific areas of
regeneration in the adult (Lie et al., 2005). The cell cultures used in the reporter assay were
taken from fetal mouse hypothalamus at E15, E17, and E18, representing a period of recognized
neurogenesis in the mouse (Gardette et al., 1982). Therefore, this model is appropriate for
studying wnt activity. Initial investigations indicate that teneurins-1, -2, and -4 are expressed in
the adult mouse brain, whereas teneurin-3 is primarily expressed in the embryonic mouse brain
87
(Wang and Lovejoy, unpublished observations). The TCAP processing mechanism is
unresolved. If the TCAP portion of the teneurin gene is translated along with the rest of the
teneurin gene, the different forms of the TCAP peptide would be expressed at the same time as
the teneurins, that is, TCAP-1, -2, and -4 expressed in the adult and TCAP-3 in the embryo.
TCAP-1 was chosen for administration in the assay because it is the most studied TCAP peptide.
However, this form may not appropriately signal if the necessary cell components are not present
in the embryonic model. Future studies investigating the relationship between the wnt pathway
and TCAP could explore using a cell line generated from areas of the brain where new neurons
are proliferating or the the form of TCAP expressed in the embryo, TCAP-3, could be chosen for
administration.
In addition to the cell model, the cellular environment is another experimental factor to consider.
There are certain genes whose transcriptional activity depends on their cellular environment. In
previous work, TCAP-1 treatment had no significant effect on the behavioural responses in vivo
compared to control. In a CRF-induced stress paradigm, in which TCAP treatment was given
prior to an acute CRF treatment in vivo, TCAP significantly decreased the anxiety-generating
behavioural responses from those given CRF without TCAP pretreatment (Al Chawaf et al.,
2007b). If TCAP does modulate CRF at the transcriptional level via CRE, an environment
similar to that in which modulation was observed may need to be replicated in the reporter assay,
specifically an acute bout of CRF.
TCAP does regulate the transcriptional activity of certain genes and some of the response
elements on a promoter by which they do so have been identified. Some transcriptional response
elements were not modulated by TCAP in the reporter design tested, however, other
experimental designs could be explored. The luciferase reporter assay is designed for measuring
transcriptional activation at a single time point: once the cells are harvested they die and no
further data can be generated from them. To this end, there is a newly developed reporter system
using an SEAP tag that allows for the measurement of multiple time points from a single
experimental set up. The reporter protein is secreted into the cytosol where multiple samples
from the media can be taken without disturbing the cells (Yang et al., 1997; Berger et al., 1988).
TCAP has biological affects on the nervous system. The relationship of TCAP and the cellular
transduction pathways mediating these effects were investigated at the transcriptional level using

88
reporter constructs in vitro. The assays indicated that TCAP-1 inhibits the basal activation of a
cfos-based reporter assay, and an AP1-based reporter assay. This study also provides evidence
that TCAP-1 does not affect CRF activity either by a direct action on the CRF receptor 1 or the
CRF receptor 2 or by affecting the activity of a glucocorticoid responsive element (GRE) in the
immortalized cells.
One of the concerns with these studies was the variability from assay to assay. Despite running
these assays under stringent controls, the variability continued. As a result, a number of different
cell line systems were used with similar results. Recent unpublished studies in our laboratory
indicate that TCAP acts both cytosolically, through a plasma receptor, but also is internalized
and enters the nucleus. Thus it appears that TCAP may have direct genomic actions. However,
these studies have indicated that TCAP targets proliferating cells and the number of proliferating
cells vary as a function of cell confluency. Unfortunately, these studies had not been completed
during the development of the reporter assays. However, this information should be useful in
determining the appropriate conditions on which to improve the assay conditions.

89
Chapter Five
Conclusions and significance of findings
Abstract
The findings from this study will aid in improving further TCAP research and the study and
understanding of peptides in general. A formulation that solubilizes the peptide and is stable
through a number of perturbations is essential for the further inquiry into its neuroprotective
effects and to its ability to be pursued as a drug treatment. An immunoassay with high
specificity was needed to establish the effective concentration of this peptide in the tissues where
it is active. Again, this is essential for the development of this peptide in terms of its therapeutic
effects.
In addition to the information generated, that is, the development of a formulation for
administering TCAP in vitro and in vivo as well as an assay for quantifying its concentration, and
the establishment of specific convergence points from multiple signaling pathways, the
significance of which will be evident in the research now possible using these tools and
knowledge.
Overview
When new peptides are discovered, often many studies are performed under conditions that may
not be appropriate for either the peptide or the organism. In addition, some new peptides may
have the potential to be used as drugs. In order to test a new peptide, it must be synthesized,
because there are no practical ways of doing the synthesis biologically, for example, by
recombinant methods or isolation techniques. The synthesis results in a number of impure forms
that must be purified from the intact form. Although these methods are effective, the
solubilizing agents may not be biologically compatible. Therefore, in order to perform
biological tests, the peptide needs to be solubilized in a manner that will not harm the cell or
organism it is tested in. Many times, a peptide shows promise as a possible drug type

90
therapeutic, only to fail when the testing is done in a more appropriate manner. So it is very
important to develop a biologically compatible method for solubilization.
Another problem with trying to determine how effective a peptide is, is trying to establish its
concentration in tissues. This is really important for studying natural peptides, because the
organism may also produce the same peptide. This is a big problem with TCAP because the
structure of TCAP is very similar in all vertebrates. So a method of detection is really necessary
for this. Usually immuno-type methods are used. However, this requires the development of
specific antisera to detect the peptide. If the antisera are particularly effective, then the peptide
can be detected and then it is possible to measure how the peptide changes during experiments,
either naturally or when the synthetic peptide is added to the organism. In the case of TCAP,
specific antisera were generated, but a viable assay had not been developed.
Once a peptide is discovered, particularly if it represents a new type of peptide, little is known
about how the structure of the peptide relates to its functional activity. Peptides were
traditionally discovered on the basis of a biological assay so when they were discovered, the
function was already known. Today, most peptides are discovered on the basis of their structural
similarity to known peptides, and so their function may not be the same as the others they may
be structurally related to. Fortunately, there is considerable amount of information regarding the
function of various peptides and how they relate to the cell function and genomic regulation.
Thus these methods can be used to establish how a new peptide works.
Solubility
A number of formulations were developed to solubilize TCAP consistently and in large
quantities. Consistency is desirable in order to decrease variability between assays and better
understand the efficacy and mehanism of action both in the body and the cell respectively. Mass
generation is desirable in order to maintain the possibility of its development as a therapeutic in
the current form. A number of excipient reagents were used in the formulations with the goal of
stabilizing the biological structure of TCAP. The peptide needs to be in a form suitable for long-
term storage until needed if developed as a treatment. In the case of TCAP, a detergent needed
to be added to minimize surface adhesion during its solubilization, and administration both in
vivo and in vitro.
91
Detection
An ELISA was developed to detect TCAP from a sample by antigen-antibody recognition. The
ELISA can be used to check the efficacy of the antisera using the synthetic peptide.
The antigenic region of TCAP has been identified in ELISA. This region can be correlated with
the antigenic region that is predicted based on the antigenic index and the index can be evaluated
for its predictive power. Also, the antigenic region may aid in the structural predictions of the
molecule.
Antigenic sites and their recognition by antibodies is the basis for how immunoreactive assays
work and using this type of assay allows for these sites to be identified to a certain degree. In
general, antigenic sites are often complex conformations dependent on the tertiary folding of a
peptide chain and so are difficult to determine by primary sequence analysis alone. This, in
combination with mutational variants and variants from genomic duplication that are generated
over time, makes pinpointing the amino acids of the epitope region problematic. In spite of this,
successful methods of prediction from structural analysis have been devised to locate these sites
based on the observation that segmental flexibility is more indicative of an antigenic region in a
protein than any other character trait (Westhof et al., 1984) including antigenicity (Hopp and
Woods, 1981), hydrophilicity (Kyte and Doolittle, 1982), or reverse-turn potential (Chou and
Fasman, 1979; Garnier et al., 1978). When tested, segments of a protein predicted to have the
highest flexibility correlated most strongly with known epitope regions. In addition, flexibility
was demonstrated as the most suitable trait for identifying cross-reactive peptides (Weshof et al.,
1984) and this is important in drug development. There are certain structural traits such as
disulfide bonds that may change the nature of the segment from flexible to rigid (Karplus and
Schulz, 1985) but we can disregard this caveat due to the absence of cysteine residues in TCAP
that are required to form disulfide bridges. There are others who have also developed an
antigenic index (AI) by summing several weighted measures of secondary structure under a
similar premise that regional backbone flexibility and surface exposure are more important than
other traits (Jameson and Wolf, 1988).
Geysen and colleagues (1987) arrived at the same conclusion after characterizing the epitope
regions of myohemerythrin (MHr) experimentally. They mapped the antigenicity of the protein
with peptide homologs of the protein sequence. Their results suggested that though it is possible

92
in theory for any region on the surface of a protein to be antigenic, what determines the regions
where this occurs is local stereochemistry. The most reactive regions of a peptide, and therefore
the most recognized by antibody binding domains, have high local mobility (meaning that they
are flexible), convex surface shape, and frequently negative electrostatic potential. Accordingly,
the least reactive sites have little mobility: the residues are tightly packed into narrow, concave
grooves on the surface of the protein where they tightly bind water molecules. The development
of a robust ELISA allows the antigenic regions to be largely defined (though not to exact
residues) by comparing assay performance using different combinations of antisera and peptide
forms. Analysis of epitope region in TCAP by experimentation is discussed in Chapter 3. The
characterization of the antigen-antibody binding sites in proteins and peptides thus far can be
applied to TCAP for additional insight as to its structure but can only be confirmed once the
structure is elucidated. This will also allow for the integration of the epitope regions identified
from the ELISA to its structure.
Immunoreactive assays are specific such that molecules paralogous to TCAP-1, TCAP-2, are not
compatible for use in the assay. The antigen-antibody recognition is complex and unique. The
results indicate TCAP-2 does not have the same structure and antigenic region as TCAP-1
although they have a high sequence similarity.
Fluorescence imaging of the brain (in rat and a mammalian species) indicate TCAP present in
the several areas: substantia nigra, dendate gyrus, pineal gland, hippocampus and many others
(Al Chawaf et al., 2007b; Casatti, unpublished results). However, TCAP has yet to be isolated in
vivo from the tissues in which it is expressed or the circulation. With the development of the
ELISA, peripheral administration and uptake of the peptide can be measured to study its
clearance and distribution in the body. The areas of fluorescence can be targeted for isolation
from the tissues using the extraction procedure and subsequently quantified in ELISA.
Function
TCAP has the ability either directly or indirectly to activate certain transcriptional elements
found in the promoter of certain genes. These are the serum response element (SRE), activator
protein-1 (AP1) and the downstream regulatory element (DRE) of the cfos promoter. Because
these elements are common to the promoters of many genes, genes of interest containing them
can be targeted for TCAP regulation. In the reporter assay design, the transcriptional response

93
elements tested were consensus sequences of elements targeted by specific transcription factors
and common to more than a single gene. The alternative approach would be to clone and test a
construct having a section, or the entire promoter, of a specific gene that is unique to the species.
The approach chosen is quick and insightful in the absence of any signaling information
however, the results are not conclusive.
In terms of the reporter assays, it is also unknown exactly how indicative reporter constructs are
of in vivo promoters. A recent paper comments on the discrepancies between in vitro and in vivo
results (Barolo, 2006). The reporter assay may be reflective of a general ability to regulate
transcriptional elements but not necessarily the likelihood or probability of doing so in vivo.
Since some nuclear targets modulated by TCAP have been established, these could be further
substantiated in a number of ways. One option is to test the construct in vivo. Another option is
to tag the mRNA from the gene of interest in vivo, a process referred to as CD tagging (Jarvik et
al., 1996).
CD tagging is a genetic technology that provides a novel opportunity to annotate peptide and
protein function in living cells and organisms. The process is facilitated by inserting a specially
designed DNA sequence referred to as the CD-cassette into genomic DNA. When inserted in the
proper orientation in an intron of a transcriptionally active gene, the cassette provides splicing
signals that direct the inclusion of a new exon (the guest exon) into the transcript. Translation of
the tagged transcript results in the incorporation of a unique peptide tag into the peptide or
protein. Thus a single DNA insertion will tag and track the molecule at all stages of production:
DNA, RNA and Protein.
Molecular tagging methods are widely used to study protein structure, function and location.
Most often this is accomplished by the addition of a tagged sequence into cloned cDNA. This is
the procedure employed in the reporter design. This necessitates making assumptions as to the
likely location of transcriptional regulatory elements when deciding what section(s) of the
promoter to clone. This is problematic because our understanding of the regions involved in
transcriptional regulation is incomplete. Initially, it was thought that the promoter region was the
sole regulatory element located proximal to the basal transcriptional machinery. Then, the
introduction of regulatory regions called enhancers located distal from the promoter expanded
94
the region considered to be regulatory as did the inclusion of intronic regions and, most relevant
to our study, downstream regulatory elements such as the one in the cfos gene.
In the alternative method of CD-tagging or protein trapping, the CD-tag is added to the complete
gene itself. This makes natural regulation of the gene likely and avoids the assumptions inherent
in the clonal design of constructs. The CD-tag contains two introduced exons, one encoding an
epitope tag for the isolation of the molecule and the other encoding a GFP (green fluorescent
protein) tag for its visulaization. This method is also streamlined in that it does not require the
use of different tags for different purposes.
TCAP as a bioactive peptide has been established both structurally/physically and functionally.
Yet it is unclear how TCAP is liberated from Teneurin and how TCAP is processed into its
bioactive form. Future studies will explore various methods of an unconventional pathway,
endocytosis, to which little research on the subject has been carried out thus far. The above
technique could be used to answer this question. Teneurin gene and TCAP gene could be
marked and through transcription, translation, processing, etc. and the molecules can be localized
and isolated.
In conclusion, the study of the chemical behaviour of TCAP in formulations, its
immunoreactivity in ELISA and its transcriptional regulation in reporter assays have all
contributed to this understanding and provide a solid foundation for future study.
95
References
Adcock IM, Brown CR, Shirasaki H, Barnes PJ. (1994) Efects of dexamethasone on cytokine and phorbol ester stimulated cFos and c-Jun DNA binding and gene expression in human lung. European Respiratory Journal: official journal of the European Society for Clinical Respiratory Physiology. 7(12): 2117-2123. doi: 10.1183/09031936.94.07122117
Al Chawaf A, St. Amant K, Belsham DD, Lovejoy DA. (2007a) Regulation of neurite outgrowth in immortalized hypothalamic cells and hippocampal primary cultures by teneurin C-terminal associate peptide-1. Neuroscience. 144(4): 1241-1254. doi:10.1016/j.neuroscience.2006.09.062
Al Chawaf A, Xu K, Tan L, Vaccarino F, Lovejoy DA, Rotzinger S. (2007b) Corticotropin-releasing factor (CRF)-induced behaviors are modulated by intravenous administration of teneurin C-terminal associated peptide-1 (TCAP-1). Peptides. 28(7): 1406-1415. doi:10.1016/j.peptides.2007.05.014
Al Chawaf A, Tan L, Boutros P, Lovejoy DA, Rotzinger R. (2009) In vivo dendritic modelling of CA3 hippocampal neurons by repeated intracerebroventricular administration of teneurin C-terminal associated peptide (TCAP)-1. Submitted to Hormones and Behaviour.
Angel P and Karin M. (1991) The role of Jun, Fos and the AP-1 complex in cell proliferation and transformation. Biochimica et Biophysica Acta. 1072(2-3): 129-157. doi:10.1016/0304-419X(91)90011-9
Arakawa T, Dix DB, Chang BS. (2003) [The effects of protein stabilizers on aggregation induced by multiple-stresses] Yakugaku Zasshi. 123(11): 957-961. doi:10.1248/yakushi.123.957
Arakawa T, Ejima D, Tsumoto K, Obeyama N, Tanaka Y, Kita Y, Timasheff SN. (2007) Suppression of protein interactions by arginine: a proposed mechanism of the arginine effects. Biophysical Chemistry. 127(1-2): 1-8. doi:10.1016/j.bpc.2006.12.007
Arakawa T and Timasheff SN. (1983) Preferential interactions between proteins and solvent components in aqueous amino acid solutions. Archives of biochemistry and biophysics. 224(1): 169-177. doi: 10.1016/0003-9861(83)90201-1
Arakawa T and Tsumoto K. (2003) The effects of arginine on refolding of aggregated proteins: not facilitate refolding, but suppress aggregation. Biochemical and biophysical research communications. 304(1): 148-152.
Arévalo JC and Chao MV. (2005) Axonal growth: where neurotrophins meet Wnts. Current Opinion in Cell Biology. 17(2): 112-115. doi: 10.1016/j.ceb.2005.01.004
Bading H, Ginty DD, Greenberg ME. (1993) Regulation of gene expression in hippocampal neurons by distinct calcium signaling pathways. Science. 260(5105): 181-186. doi: 10.1126/science.8097060
Barany G and Merrifield RB. (1980) The Peptides. New York: Academic Press.
Barolo S. (2006) Transgenic Wnt/TCF pathway reporters: all you need is Lef? Oncogene. 25(57): 7505-7511. doi:10.1038/sj.onc.1210057
96
Baumgartner S, Martin D, Hagios C, Chiquet-Ehrismann R. (1994) ten m, a Drosophila gene related to tenascin, is a new pair-rule gene. The EMBO Journal. 13(16): 3728-3740.
Belsham DD, Cai F, Cui H, Smukler SR, Salapatek AMF, Shkreta L. (2004) Generation of a phenotypic array of hypothalamic neuronal cell models to study complex neuroendocrine disorders. Endocrinology. 145(1): 393–400. doi: 10.1210/en.2003-0946
Ben-Zur T, Feige E, Motro B, Wides R. (2000) The mammalian Odz gene family: homologs of a Drosophila pair-rule gene with expression implying distinct yet overlapping developmental roles. Developmental Biology. 217(1): 107-120. doi:10.1006/dbio.1999.9532
Berger J, Hauber J, Hauber R, Geiger R, Cullen BR. (1988) Secreted placental alkaline phosphatase: a powerful new quantitative indicator of gene expression in eukaryotic cells. Gene. 66(1): 1-10. doi:10.1016/0378-1119(88)90219-3
Blundell T and Wood S. (1982) The Conformation, Flexibility, and Dynamics of Polypeptide Hormones. Annual Review of Biochemistry. 51: 123-154. doi:10.1146/annurev.bi.51.070182.001011
Bordonaro M, Lazarova DL, Augenlicht LH, Sartorelli AC. (2002) Cell type and promoter-dependent modulation of the Wnt signiling pathway by sodium butyrate. International Journal of Cancer. 97(1): 42-51. doi: 10.1002/ijc.1577
Boutillier AL, Sassone-Corsi P, Loeffler JP. (1991) the protooncogene cfos is induced by corticotrophin-releasing factor and stimulates proopiomelanocortin gene transcription in pituitary cells. Molecular Endocrinology. 5(9): 1301-1310.
Bouvier ESP, Martin DM, Iraneta PC, Capparella M, Cheng Y-F, Phillips DJ. (1997) A Novel Polymeric Reversed-Phase Sorbent for Solid Phase Extraction. LC GC. 15(2): 152-158.
Brombacher PJ, Henkel E, Kessler AC, Van Dieijen-Visser MP. (1988) Multicentre study of a new test for TSH-screening in blood spots. Annals of Clinical Biochemistry. 25(Pt 5): 530-535.
Bruynzeel PL, Hamelink ML, van den Bogaard W. (1980) Interference of EDTA in determinations of c-AMP and c-GMP in plasma by radioimmunoassay. Clinical Chemistry. 26(5): 668-669.
Carpenter JF, Arakawa T, Crowe JH. (1991) Interactions of stabilizing additives with proteins during freeze-thawing and freeze-drying. Developments in Biological Standardization. 74: 225-239.
Carpenter JF and Crowe JH. (1989) An infrared spectroscopic study of the interactions of carbohydrates with dried proteins. Biochemistry. 28(9): 3916-3922.
Carpenter JF, Crowe LM, Crowe JH. (1987a) Stabilization of phosphofructokinase with sugars freeze-drying: Characterization of enhanced protection in the presence of divalent cations. Biochimica et Biophysica Acta. 923(1): 109-115. doi:10.1016/0304-4165(87)90133-4
Carpenter JF, Martin B, Crowe LM, Crowe JH. (1987b) Stabilization of phosphofructokinase during air-drying with sugars and sugar/transition metal mixtures. Cryobiology. 24(5): 455-464. doi:10.1016/0011-2240(87)90049-6

97
Carrion AM, Link WA, Ledo F, Mellström B, Naranjo JR. (1999) DREAM is a Ca2+-regulated transcriptional repressor. Nature. 398(6722): 80-84. doi:10.1038/18044
Chen AE, Ginty DD, Fan C-M. (2005) Protein kinase A signalling via CREB controls myogenesis induced by Wnt proteins. Nature. 433(7023): 317-322. doi:10.1038/nature03126
Chou PY and Fasman GD. (1978) Empirical Predictions of Protein Conformation. Annual Review of Biochemistry. 47: 251-276. doi:10.1146/annurev.bi.47.070178.001343
Chou PY and Fasman GD. (1979) Conservation of chain reversal in proteins. Biophysical Journal. 26(3): 385-399. doi:10.1016/S0006-3495(79)85260-1
Coghlan MP, Culbert AA, Cross DA, Corcoran SL, Yates JW, Pearce NJ, Rausch OL, Murphy GJ, Carter PS, Roxbee Cox L, Mills D, Brown MJ, Haigh D, Ward RW, Smith DG, Murray KJ, Reith AD, Holder JC. (2000) Selective small molecule inhibitors of glycogen synthase kinase-3 modulate glycogen metabolism and gene transcription. Chemistry & Biology. 7(10): 793-803. doi:10.1016/S1074-5521(00)00025-9
Cornette JL, Cease KB, Margalit H, Spouge JL, Berzofsky JA, DeLisi C. (1987) Hydrophobicity scales and computational techniques for detecting amphipathic structures in proteins. Journal of Molecular Biology. 195(3): 659-685. doi: 10.1016/0022-2836(87)90189-6
Das U, Hariprasad G, Ethayathulla AS, Manral P, Das TK, Pasha S, Mann A, Ganguli M, Verma AK, Bhat R, Chandrayan SK, Ahmed S, Sharma S, Kaur P, Singh TP, Srinivasan A. (2007) Inhibition of protein aggregation: supramolecular assemblies of arginine hold the key. PLoS One. 2(11): e1176. doi:10.1371/journal.pone.0001176
Divinski I, Holtser-Cochav M, Vulih-Schultzman I, Steingart RA, Gozes I. (2006) Peptide neuroprotection through specific interaction with brain tubulin. Journal of Neurochemistry. 98(3): 973–984. doi:10.1111/j.1471-4159.2006.03936.x
Dong H, Csernansky CA, Goico B, Csernansky JG. (2003) Hippocampal neurogenesis follows kainic acid-induced apoptosis in neonatal rats. Journal of Neuroscience. 23(5): 1742–1749.
Eisenberg D, Schwarz E, Komaromy M, Wall R. (1984) Analysis of membrane and surface protein sequences with the hydrophobic moment plot. Journal of Molecular Biology. 179(1): 125-142. doi:10.1016/0022-2836(84)90309-7
Engelman DM, Steitz TA, Goldman A. (1986) Identifying nonpolar transbilayer helices in amino acid sequences of membrane proteins. Annual Review of Biophysics and Biophysical Chemistry. 15: 321-353.
Fajas L, Debril MB, Auwerx J. (2001) Peroxisome proliferator-activated receptor-gamma: from adipogenesis to carcinogenesis. Journal of Molecular Endocrinology. 27(1): 1-9.
Ferrero P, Benna P, Costa P, Tarenzi L, Baggio G, Bergamesco B, Bergamini L. (1988) Diazepam binding inhibitor-like immunoreactivity (DBI-LI) in human CSF. Correlations with neurological disorders. Journal of the Neurological Sciences. 87(2-3): 327-349.
Fisch TM, Prywes R, Simon MC, Roeder RG. (1989) Multiple sequence elements in the cfos promoter mediate induction by cAMP. Genes & Development. 3: 198-211.
98
Freeman SD, Scheele GA. (1994) Acid-base interactions during exocrine pancreatic secretion. Primary role for ductal bicarbonate in acinar lumen function. Annals of the New York Academy of Sciences. 713: 199-206. doi: 10.1111/j.1749-6632.1994.tb44066.x
Gardette R, Courtois M, Bisconte JC. (1982) Prenatal development of mouse central nervous structures: time of neuron origin and gradients of neuronal production. A radiographic study. Journal fur Hirnforschung. 23(4): 415-431.
Garnier J, Osguthorpe DJ, Robson B. (1978) Analysis of the accuracy and implications of simple methods for predicting the secondary structure of globular proteins. Journal of Molecular Biology. 120(1): 97-120. doi:10.1016/0022-2836(78)90297-8
Gedeon AK, Glass IA, Connor JM, Mulley JC. (1996) Genetic localisation of MRX27 to Xq24-26 defines another discrete gene for non-specific X-linked mental retardation. American Journal of Medical Genetics. 64(1): 121-124.
Geiger T and Clarke S. (1987) Deamidation, isomerization and racemization at asparaginyl and aspartyl residues in proteins. Succinimide-linked reactions that contribute to protein degradation. Journal of Biological Chemistry. 262(2): 785-794.
Geysen HM, Tainer JA, Rodda SJ, Mason TJ, Alexander H, Getzoff ED, Lerner RA. (1987) Chemistry of antibody binding to a protein. Science. 235(4793): 1184-1190.
Ghosh A and Greenberg ME. (1995) Calcium signaling in neurons: molecular mechanisms and cellular consequences. Science. 268(5208): 239-247.
Gold EW and Edgar PR. (1978) The effect of physiological levels of non-esterified fatty acids on the radioimmunoassay of prostaglandins. Prostaglandins. 16(6): 945-952.
Gozes I, Bachar M, Bardea A, Davidson A, Rubinraut S, Fridkin M, Giladi E. (1997) Protection against developmental retardation in apolipoprotein E-deficient mice by a fatty neuropeptide: implications for early treatment of Alzheimer’s disease. Journal of Neurobiology. 33(3): 329–342.
Gustavson KH, Annerén G, Malmgren H, Dahl N, Ljunggren CG, Bäckman H. (1993) New X-linked syndrome with severe mental retardation, severely impaired vision, severe hearing defect, epileptic seizures, spasticity, restricted joint mobility, and early death. American Journal of Medical Genetics. 45(5): 654-658.
Guylas K, Rivier C, Perrin M, Koerber S, Sutton S, Corrigan A, Lahrich S, Craig A, Vale W and Rivier J. (1995) Potent, structurally constrained agonists and competitive antagonists of corticotropin-releasing factor. Proceedings of the National Academy of Sciences of the United States of America. 92(23): 10575-10579.
Hardingham GE, Chawla S, Johnson CM, Bading H. (1997) Distinct functions of nuclear and cytoplasmic calcium in the control of gene expression. Nature. 385(6613): 260-265. doi:10.1038/385260a0
Hauger RL, Risbrough V, Brauns O, Dautzenberg FM. (2006) Corticotropin Releasing Factor (CRF) Receptor Signaling in the Central Nervous System: New Molecular Targets. CNS & Neurological Disorders - Drug Targets. 5(4): 453-479.
Herdegen T and Waetzig V. (2001) AP-1 proteins in the adult brain: facts and fiction about effectors of neuroprotection and neurodegeneration. Oncogene. 20(19): 2424-2437.
99
Hernandez-Munain C, Roberts JL, Krangel MS. (1998) Cooperation among multiple transcription factors is required for access to minimal T-cell receptor alpha-enhancer chromatin in vivo. Molecular Cell Biology. 18(6): 3223-3233.
Herr W, Sturm RA, Clerc RG, Corcoran LM, Baltimore D, Sharp PA, Ingraham HA, Rosenfeld MG, Finney M, Ruvkun G, et al. (1988) The POU domain: a large conserved region in the mammalian pit-1, oct-1, oct-2, and Caenorhabditis elegans unc-86 gene products. Genes & Development. 2(12A): 1513-1516. doi: 10.1101/gad.2.12a.1513
Ho JG, Middelberg AP, Ramage P, Kocher HP. (2003) The likelihood of aggregation during protein renaturation can be assessed using the second virial coefficient. Protein Science: a publication of the Protein Society. 12(4): 708-716.
Hopp TP and Woods KR. (1981) Prediction of protein antigenic determinants from amino acid sequences. Proceedings of the National Academy of Sciences of the United States of America. 78(6): 3824-3828.
Hopp TP and Woods KR. (1983) A computer program for predicting protein antigenic determinants. Molecular Immunology. 20(4): 483-489.
Jameson BA and Wolf H. (1988) The antigenic index: a novel algorithm for predicting antigenic determinants. Computer Applications in the Biosciences: CABIOS. 4(1): 181-186.
Jarvik JW, Adler SA, Telmer CA, Subramaniam V, Lopez AJ. (1996) CD-tagging: a new approach to gene and protein discovery and analysis. Biotechniques. 20(5): 896-904.
Kaiser ET and Kézdy FJ. Secondary structures of proteins and peptides in amphiphilic environments. (A review). (1983) Proceedings from the National Academy of Sciences of the United States of America. 80(4): 1137-1143.
Kaiser ET and Kézdy FJ. Amphiphilic Secondary Structure: Design of Peptide Hormones. (1984) Science. 223(4633): 249-255. doi: 10.1126/science.6322295
Karplus PA and Schulz GE. (1985) Prediction of chain flexibility in proteins. Naturwissenschaften. 72(4): 212-213. doi: 10.1007/BF01195768
Kauzmann W. (1959) Some factors in the interpretation of protein denaturation. Advances in Protein Chemistry. 14: 1-63.
Kerwin BA. (2008) Polysorbates 20 and 80 used in the formulation of protein biotherapeutics: structure and degradation pathways. Journal of Pharmaceutical Sciences. 97(8): 2924-2935. doi: 10.1002/jps.21190
Korinek V, Barker N, Morin PJ, van Wichen D, de Weger R, Kinzler KW, Vogelstein B, Clevers H. (1997) Constitutive transcriptional activation by a beta-catenin-Tcf complex in APC-/- colon carcinoma. Science. 275: 1784-1787. doi: 10.1126/science.275.5307.1784
Kourides IA, Weintraub BD, Martorana MA, Maloof F. (1976) Alpha subunit contamination of human albumin preparations: interference in radioimmunoassy. The Journal of Clinical Endocrinology and Metabolism. 43(4): 919-23.
Kovács KJ. (1998) cFos as a transcription factor: a stressful (re)view from a functional map. Neurochemistry International. 33(4): 287-297. doi:10.1016/S0197-0186(98)00023-0
100
Krogstad DJ, Granich GG, Murray PR, Pfaller MA, Valdes R. (1982) Heparin interferes with the radioenzymatic and homogeneous enzyme immunoassays for aminoglycosides. Clinical Chemistry. 28(7): 1517-1521.
Kyte J and Doolittle RF. (1982) A simple method for displaying the hydropathic character of a protein. Journal of Molecular Biology. 157(1): 105-132. doi: 10.1016/0022-2836(82)90515-0
Laurberg P and Weeke J. (1977) Radioimmunological determination of reverse triiodothyronine in unextracted serum and serum dialysates. Scandinavian journal of clinical and laboratory investigation. 37(8): 735-739.
Ledo F, Kremer L, Mellström B, Naranjo JR. (2002) Ca2+-dependent block of CREB−CBP transcription by repressor DREAM. The EMBO Journal. 21(17): 4583–4592. doi: 10.1093/emboj/cdf440
Lee J, Lee SC, Acharya G, Chang CJ, Park K. (2003) Hydrotropic Solubilization of Paclitaxel: Analysis of Chemical Structures for Hydrotropic Property. Pharmaceutical Research. 20(7): 1022-1030. doi: 10.1023/A:1024458206032
Lensmeyer GL, Fields BL, Carlson IH, deVos D, Sollinger HW. (1986) Sample pretreatment to minimize interferences from whole blood in the radioimmunoassay for cyclosporine. Transplantation. 42(4): 372-386.
Leopold C. (1986) Membranes, metabolism, and dry organisms. Ithaca: Cornell University Press.
Levine A, Bashan-Ahrend A, Budai-Hadrian O, Gartenberg D, Menasherow S, Wides R. (1994) Odd Oz: a novel Drosophila pair-rule gene. Cell. 77(4): 587-598. doi: 10.1016/0092-8674(94)90220-8
Lewis K, Li C, Perrin MH, Blout A, Kunitake K, Donaldson C, Vaughan J, Reyes TM, Guylas J, Fischer W, Bilezikjian L, Rivier J, Sawchenko PE, Vale WW. (2001) Identification of urocortin III, an additional member of the corticotropin-releasing factor (CRF) family with high affinity for the CRF2 receptor. Proceedings of the National Academy of Sciences of the United States of America. 98(13): 7570-7575. doi: 10.1073/pnas.121165198.
Lie D-C, Colamarino SA, Song HJ, Désiré L, Mira H, Consiglio A, Lein ES, Jessberger S, Lansford H, Dearie AR, Gage FH. (2005) Wnt signaling regulates adult hippocampal neurogenesis. Nature. 437(7063): 1370-1375. doi: 10.1038/nature04108
Liewendahl K and Helenius T. (1976) Effect of fatty acids on thyroid function tests in vitro and in vivo. Clinica Chimica Acta; International Journal of Clinical Chemistry. 72(3): 301-313.
Lovejoy DA, Al Chawaf, A, Cadinouche A. (2006) Teneurin C-terminal associated peptides: An enigmatic family of neuropeptides with structural similarity to the corticotrophin releasing factor and calcitonin family of peptides. General and Comparative Endocrinology. 148(3): 299-305. doi:10.1016/j.ygcen.2006.01.012
Lovejoy DA and Balment RJ. (1999) Evolution and physiology of the corticotropin-releasing factor (CRF) family of neuropeptides in vertebrates. General and Comparative Endocrinology. 115(1): 1-22. doi: 10.1006/gcen.1999.7298
101
Lovejoy DA, Rotzinger S, Barsyte-Lovejoy D. (2009) Evolution of complementary peptide systems: teneurin C-terminal associated peptides and corticotropin-releasing factor superfamilies. Annals of the New York Academy of Sciences. 1163: 215-220.
Maget-Dana R. (1999) The monolayer technique: a potent tool for studying the interfacial properties of antimicrobial and membrane-lytic peptides and their interactions with lipid membranes. Biochimica et Biophysica Acta. 1462(1-2): 109-140. doi: 10.1016/S0005-2736(99)00203-5
Malmgren H, Sundvall M, Dahl N, Gustavson KH, Annerén G, Wadelius C, Steén-Bondeson ML, Pettersson U. (1993) Linkage mapping of a severe X-linked mental retardation syndrome. American Journal of Human Genetics. 52(6): 1046-1052.
Marqusee S and Baldwin RL. (1987) Helix stabilization by Glu-...Lys+ salt bridges in short peptides of de novo design. Proceedings of the National Academy of Sciences of the United States of America. 84(24): 8898-8902.
Marrone DF, Schaner MJ, McNaughton BL, Worley PF, Barnes CA. (2008) Immediate-early gene expression at rest recapitulates recent experience. Journal of Neuroscience. 28(5): 1030-1033. doi:10.1523/JNEUROSCI.4235-07.2008
Masters AM and Hähnel R. (1989) Investigation of sex-hormone binding globulin interference in direct radioimmunoassays for testosterone and estradiol. Clinical Chemistry. 35(6): 979-984.
Maturana A, Van Haasteren G, Piuz I, Castelbou C, Demaurex N, Schlegel W. (2002) Spontaneous calcium oscillations control cfos transcription via the serum response element in neuroendocrine cells. Journal of Biological Chemistry. 277(42): 39713-39721.
Meyer JD and Manning MC. (1998) Hydrophobic ion pairing: altering the solubility properties of biomolecules. Pharmaceutical Research. 15(2): 188-193. doi: 10.1023/A:1011998014474
Mieda M, Kikuchi Y, Hirate Y, Aoki M, Okamoto H. (1999) Compartmentalized expression of zebrafish ten-m3 and ten-m4, homologues of the Drosophila ten(m)/odd Oz gene, in the central nervous system. Mechanisms of Development. 87(1-2): 223-227. doi: 10.1016/S0925-4773(99)00155-0
Minet AD, Rubin BP, Tucker RP, Baumgartner S, Chiquet-Ehrismann R. (1999) Teneurin-1, a vertebrate homologue of the Drosophila pair-rule gene ten-m, is a neuronal protein with a novel type of heparin-binding domain. Journal of cell science. 112(Pt 12): 2019-2032.
Morgan JI and Curran T. (1989) Stimulus-transcription coupling in neurons: the role of cellular immediate-early genes. Trends in Neurosciences. 12(11): 459-462.
Müller BW and Albers E. (1991) Effect of hydrotropic substances on the complexation of sparingly soluble drugs with cyclodextrin derivatives and the influence of cyclodextrin complexation on the pharmacokinetics of the drugs. Journal of Pharmaceutical Sciences. 80(6): 599-604.
Müller JM, Krauss B, Kaltschmidt C, Baeuerle PA, Rupec RA. (1997) Hypoxia induces cfos transcription via a mitogen-activated protein kinase-dependent pathway. The Journal of Biological Chemistry. 272(37): 23435-23439.

102
Nakamura H. (1996) Roles of electrostatic interaction in proteins. Quarterly Reviews of Biophysics. 29(1): 1-90.
Okahata Y and Ijiro K. (1988) A Lipid coated lipase as a new catalyst for triglyceride synthesis in organic solvents. Journal of the Chemical Society, Chemical Communications. 1392-1394.
Osterberg T and Wadsten T. (1999) Physical state of L-histidine after freeze-drying and long-term storage. European Journal of Pharmaceutical Sciences. 8(4): 301-308. doi: 10.1016/S0928-0987(99)00028-7
Parham KL, Zervou S, Karteris E, Catalano RD, Old RW, Hillhouse EW. (2004) Promoter analysis of human corticotropin-releasing factor (CRF) type 1 receptor and regulation by CRF and urocortin. Endocrinology. 145(8): 3971–3983. doi:10.1210/en.2004-0194
Powers ME, Matsuura J, Brassell J, Manning MC, Shefter E. (1993) Enhanced solubility of proteins and peptides in nonpolar solvents through hydrophobic ion pairing. Biopolymeres. 33(6): 927-932. doi: 10.1002/bip.360330608
Pradeep A, Sharma C, Sathyanarayana P, Albanese C, Fleming JV, Wang TC, Wolfe MM, Baker KM, Pestell RG, Rana B. (2004) Gastrin-mediated activation of cyclin D1 transcription involves beta-catenin and CREB pathways in gastric cancer cells. Oncogene. 23(20): 3689-3699. doi:10.1038/sj.onc.1207454
Prakash V, Loucheux C, Scheufele S, Gorbunoff MJ, Timasheff SN. (1981) Interactions of proteins with solvent components in 8 M urea. Archives of Biochemistry and Biophysics. 210(2): 455-464.
Priest JM, Fischbeck KH, Nouri N, Keats BJ. (1995) A locus for axonal motor-sensory neuropathy with deafness and mental retardation maps to Xq24-q26. Genomics. 29(2): 409-412. doi: 10.1006/geno.1995.9987
Qi C, Zhu Y, Reddy JK. (2000) Peroxisome proliferator-activated receptors, coactivators, and downstream targets. Cell Biochemistry and Biophysics. 32 Spring: 187-204.
Qian X, Barsyte-Lovejoy D, Chewpoy RB, Wang L, Gautam N, Wang Al Chawaf A, Lovejoy DA. (2004) Characterization of teneurin C-terminal associated peptide (TCAP)-3 from rainbow trout hypothalamus. General and Comparative Endocrinology. 137(2): 205-216. doi: 10.1016/j.ygcen.2004.02.007
Qin L, Liu Y, Qian X, Hong JS, Block ML. (2005) Microglial NADPH oxidase mediates leucine enkephalin dopaminergic neuroprotection. Annals of the New York Academy of Sciences. 1053:107–120. doi: 10.1111/j.1749-6632.2005.tb00016.x
Ransone L and Verma IM. (1990) Nuclear proto-oncogenes fos and jun. Annual Review of Cell Biology. 6: 539–557. doi: 10.1146/annurev.cb.06.110190.002543
Rash JM, Jerkunica I, Sgoutas D. (1979) Mechanisms of interference of nonesterified fatty acids in radioimmunoassays of steroids. Clinica Chimica Acta; International Journal of Clinical Chemistry and Diagnostic Laboratory Medicine. 93(2): 283-294. doi: 10.1016/0009-8981(79)90101-3
Reiner H, Plankensteiner K, Fitz D, Rode BM. (2006) The possible influence of L-histidine on the origin of the first peptides on the primordial Earth. Chemistry & Biodiversity. 3(6): 611-621. doi: 10.1002/cbdv.200690064

103
Reyes TM, Lewis K, Perrin MH, Kunitake KS, Vaughan J, Arias CA, Hogenesch JB, Gulyas J, Rivier J, Vale WW, Sawchenko PE. (2001) Urocortin II: a member of the corticotropin-releasing factor (CRF) neuropeptide family that is selectively bound by type 2 CRF receptors. Proceedings of the National Academy of Sciences of the United States of America. 98(5): 2843-2848. doi: 10.1073/pnas.051626398.
Robertson LM, Kerppola TK, Vendrell M, Luk D, Smeyne RJ, Bocchiaro C, Morgan JI, Curran T. (1995) Regulation of cfos expression in transgenic mice requires multiple interdependent transcription control elements. Neuron. 14(2): 241-252. doi: 10.1016/0896-6273(95)90282-1
Roche PJ, Crawford RJ, Fernley RT, Tregear GW, Coghlan JP. (1988) Nucleotide sequence of the gene coding for ovine corticotropin-releasing factor and regulation of its mRNA levels by glucocorticoids. Gene. 71(2): 421–431.
Rode BM. (1999) Peptides and the origin of life. Peptides. 20(6): 773-786. doi: 10.1016/S0196-9781(99)00062-5
Ron D and Habener JF. (1992) CHOP, a novel developmentally regulated nuclear protein that dimerizes with transcription factors C/EBP and LAP and functions as a dominant-negative inhibitor of gene transcription. Genes & Development. 6(3): 439-453. doi: 10.1101/gad.6.3.439
Rooke P, Baylis PH. (1982) Effect of plasma interference on different vasopressin antisera. Journal of Immunoassay. 3(2): 133-143.
Rubin BP, Tucker RP, Martin D, Chiquet-Ehrismann R. (1999) Teneurins: a novel family of neuronal cell surface proteins in vertebrates, homologous to the Drosophila pair-rule gene product Ten-m. Developmental Biology. 216(1): 195-209. doi:10.1006/dbio.1999.9503
Salinas PC and Zou Y. (2008) Wnt signaling in neural circuit assembly. Annual Review of Neuroscience. 31:339-358. doi: 10.1146/annurev.neuro.31.060407.125649
Sanchez T, Xu L, Buchanan M, Zheng C-F. (1998) Strategies. 11(2): 52–54
Schiffer M, Edmundson AB. (1967) Use of helical wheels to represent the structures of proteins and to identify segments with helical potential. Biophysical Journal. 7(2): 121-135. doi: 10.1016/S0006-3495(67)86579-2
Seidah NG and Chretien M. (1999) Proprotein and prohormone convertases: a family of subtilases generating diverse bioactive polypeptides. Brain Research. 848(1-2): 45-62. doi: 10.1016/S0006-8993(99)01909-5
Seth J, Rutherford FJ, McKenzie I. (1975) Solid-phase radioimmunoassay of thyroxine in untreated serum. Clinical Chemistry. 21(10): 1406-1413.
Sharrocks AD. (2001) The ETS-domain transcription factor family. Nature Reviews. Molecular Cell Biology. 2(11): 827-837. doi: 10.1038/35099076
Shaw W, Powell J, Hubert IL, Spierto FW. (1976) A comparison of the interference of fatty acids in the competitive binding radioassay and radioimmunoassay for serum T4. Clinica Chimica Acta. 73(1): 25-29. doi: 10.1016/0009-8981(76)90299-0
Shearer MR, Thomas FM, Bonig JA. (1978) Detection of bovine serum albumin interference in radioimmunoassay systems. Clinical Chemistry. 24(10): 1857-1858.
104
Shoemaker KR, Kim PS, York EJ, Stewart JM, Baldwin RL. (1987) Tests of the helix dipole model for stabilization of alpha-helices. Nature. 326(6113): 563-567. doi:10.1038/326563a0
Simberg D, Danino D, Talmon Y, Minsky A, Ferrari ME, Wheeler CJ, Barenholz Y. (2001) Phase behavior, DNA ordering, and size instability of cationic lipoplexes. Relevance to optimal transfection activity. Journal of Biological Chemistry. 276(50): 47453-47459. doi: 10.1074/jbc.M105588200
Smith-Swintosky VL, Gozes I, Brenneman DE, D’Andrea MR, Plata-Salaman CR. (2005) Activity-dependent neurotrophic factor-9 and NAP promote neurite outgrowth in rat hippocampal and cortical cultures. Journal of Molecular Neuroscience. 25(3): 225–38. doi: 10.1385/JMN:25:3:225
Spychala J, Zimmerman AG, Mitchell BS. (1999) Tissue-specific regulation of the ecto-5’-nucleotidase promoter. Role of the cAMP response element site in mediating repression by the upstream regulatory region. Journal of Biological Chemistry. 274(32): 22705-22712.
Staal FJ, Weerkamp F, Baert MR, van dern Burg CM, van Noort M, de Haas EF, van Dongen JJ. (2004) Wnt target genes identified by DNA microarrays in immature CD34+ thymocytes regulate prolifferation and cell adhesion. Journal of Immunology. 172(2): 1099-1108.
Sundaralingam M, Sekharudu YC, Yathindra N, Ravichandran V. Ion pairs in alpha helices. Proteins. (1987) 2(1): 64-71.
Susini S, Van Haasteren G, Li S, Prentki M, Schlegel W. Essentiality of intron control in the induction of cfos by glucose and glucoincretin peptides in INS-1 beta-cells. (2000) The FASEB Journal: official publication of the Federation of American Societies for Experimental Biology. 14(1): 128-136.
Tan L, Xu K, Vaccarino F, Lovejoy DA, Rotzinger S. (2008) Repeated intracerebral teneurin C-terminal associated peptide (TCAP)-1 injections produce enduring changes in behavioral responses to corticotropin-releasing factor (CRF) in rat models of anxiety. Behavioural Brain Research. 188(1): 195-200. doi: 10.1016/j.bbr.2007.10.032
Tan L, Xu K ,Vaccarino FJ, Lovejoy DA, Rotzinger S. (2009) Teneurin C-terminal associated peptide (TCAP)-1 attenuates corticotropin-releasing factor (CRF)-induced cfos expression in the limbic system and modulates anxiety behaviour in male Wistar rats. Behavioural Brain Research. 201(1): 198-206. doi: 10.1016/j.bbr.2009.02.013
Tang XC, Pikal MJ. (2005) The effect of stabilizers and denaturants on the cold denaturation temperatures of proteins and implications for freeze-drying. Pharmaceutical Research. 22(7): 1167-1175.
Timasheff SN. (1982) Preferential interactions in protein-water-cosolvent system. In F. Franks, S. Mathias (Eds.), Biophysics of Water (pp. 70-72). New York, NY: Wiley.
Tronson NC, Schrick C, Guzman YF, Huh KH, Srivastava DP, Penzes P, Guedea AL, Gao C, Radulovic J. (2009) Segregated populations of hippocampal principal CA1 neurons mediating conditioning and extinction of contextual fear. Journal of Neuroscience. 29(11): 3387-3394. doi: 10.1523/JNEUROSCI.5619-08.2009

105
Trubiani G, Al Chawaf A, Belsham DD, Barsyte-Lovejoy D, Lovejoy DA. (2007) Teneurin carboxy (C)-terminal associated peptide-1 inhibits alkalosis-associated necrotic cell death by stimulating superoxide dismutase and catalase activity in immortalized mouse hypothalamic cells. Brain Research. 1176: 27-36. doi: 10.1016/j.brainres.2007.07.087
Tu AT, Lee J, Deb KK, Hruby VJ. (1979) Laser Raman spectroscopy and circular dichroism studies of the peptide hormones mesotocin, vasotocin, lysone vasopressin, and arginine vasopressin. Conformational analysis. Journal of Biological Chemistry. 254(9): 3272-3278.
Van Beest M, Dooijes D, van De Wetering M, Kjaerulff S, Bonvin A, Nielsen O, Clevers H. (2000) Sequence-specific high mobility Group box factors recognize 10-12-base pair minor groove motifs. Journal of Biological Chemistry. 275(35): 27266-27273. doi: 10.1074/jbc.M004102200
Vermeer PD, Einwalter LA, Moninger TO, Rokhlina T, Kern JA, Zabner J, Welsh MJ. (2003) Segregation of receptor and ligan regulates activation of epithelial growth factor receptor. Nature. 422(6929): 322-326. doi: 10.1038/nature01440.
Volkin DB and Klibanov AM. (1992). Alterations in proteins that cause their irreversible inactivation. Developments in Biological Standardization. 74: 73-81.
Von Hippel PH and Wong KY. (1962) The effect of ions on the kinetics of formation and the stability of the collagenfold. Biochemistry. 1: 664-74.
Wang L, Rotzinger S, Barsyte-Lovejoy D, Qian X, Elias CF, Bittencourt JC, De Cristofaro A, Wang NC, Belsham DD, Vaccarino F, Lovejoy DA. (2005) Teneurin proteins possess a carboxy terminal corticotropin-releasing factor-like sequence that modulates emotionality and neuronal growth. Molecular Brain Research. 133(2): 253-265. doi:10.1016/j.molbrainres.2004.10.019
Wang W, Wang YJ, Wang DQ. (2008) Dual effects of Tween 80 on protein stability. International Journal of Pharmaceutics. 347(1-2): 31-38. doi:10.1016/j.ijpharm.2007.06.042
Wang XZ, Kuroda M, Sok J, Batchvarova N, Kimmel R, Chung P, Zinszner H, Ron D. (1998) Identification of novel stress-induced genes downstream of chop. The EMBO Journal. 17(13): 3619-3630. doi: 10.1093/emboj/17.13.3619
Wang XZ and Ron D. (1996) Stress-induced phosphorylation and activation of the transcription factor CHOP (GADD153) by p38 MAP Kinase. Science. 272(5266): 1347-1349. doi: 10.1126/science.272.5266.1347
Westhof E, Altschuh D, Moras D, Bloomer AC, Mondragon A, Klug A, Van Regenmortel MH. (1984) Correlation between segmental mobility and the location of antigenic determinants in proteins. Nature. 311(5982): 123-126.
Whitmarsh AJ and Davis RJ. (1996) Transcription factor AP-1 regulation by mitogen-activated protein kinase signal transduction pathways. Journal of Molecular Medicine. 74(10): 589-607.
Wilson ID. (2003) Bioanalytical separations. New York: Elsevier Academic Press.
Wood, WG. (1993) Limitations and drawbacks. In RF. Masseyeff, WH. Albert, NA. Staines (Eds.), Methods of immunological analysis (pp. 604-621). New York, NY: VCH.
106
Xie T, Belinsky M, Xu Y, Jaiswal AK. (1995) ARE- and TRE-mediated regulation of gene expression. Response to xenobiotics and antioxidants. Journal of Biological Chemistry. 270(12): 6894-6900.
Xu G, Rabadan-Diehl C, Nikodemova M, Wynn P, Spiess J, Aguilera G. (2001) Inhibition of corticotropin releasing hormone type-1 receptor translation by an upstream AUG triplet in the 5' untranslated region. Molecular Pharmacology. 59(3): 485– 492.
Xu L, Hsu M, Buchanan M, Zheng C-F. (2000) Strategies. 13(1): 22–23.
Xu L, Sanchez T, Buchanan M, Zheng C-F. (1998) Strategies. 11(3): 94–97.
Xu L, Sanchez T, Zheng C-F. (1997) Strategies. 10(2): 79–80.
Yalkowsky SH. (1999) Solubility and stabilization in aqueous media. Washington, D.C.: American Chemical Society.
Yancey PH, Clark ME, Hand SC, Bowlus RD, Somero GN. (1982) Living with water stress: evolution of osmolyte systems. Science. 217(4566): 1214-1222.
Yang TT, Sinai P, Kitts PA, Kain SR. (1997) Quantification of gene expression with a secreted alkaline phosphatase reporter system. Biotechniques. 23(6): 1110-1114.
Yu X, Riese J, Eresh S, Bienz M. (1998) Transcriptional repression due to high levels of Wingless signaling. The EMBO Journal. 17(23): 7021-7032. doi: 10.1093/emboj/17.23.7021.
Zhan Q, Lord KA, Alamo I Jr, Hollander MC, Carrier F, Ron D, Kohn KW, Hoffman B, Liebermann DA, Fornace AJ Jr. (1994) The gad and MyD genes define a novel set of mammalian genes encoding acidic proteins that synergistically suppress cell growth. Molecular Cell Biology. 14(4): 2361-2371.
Zinszner H, Kuroda M, Wang X, Batchvarova N, Lightfoot RT, Remotti H, Stevens JL, Ron D. (1998) CHOP is implicated in programmed cell death in response to impaired function of the endoplasmic reticulum. Genes & Development. 12(7): 982-995.
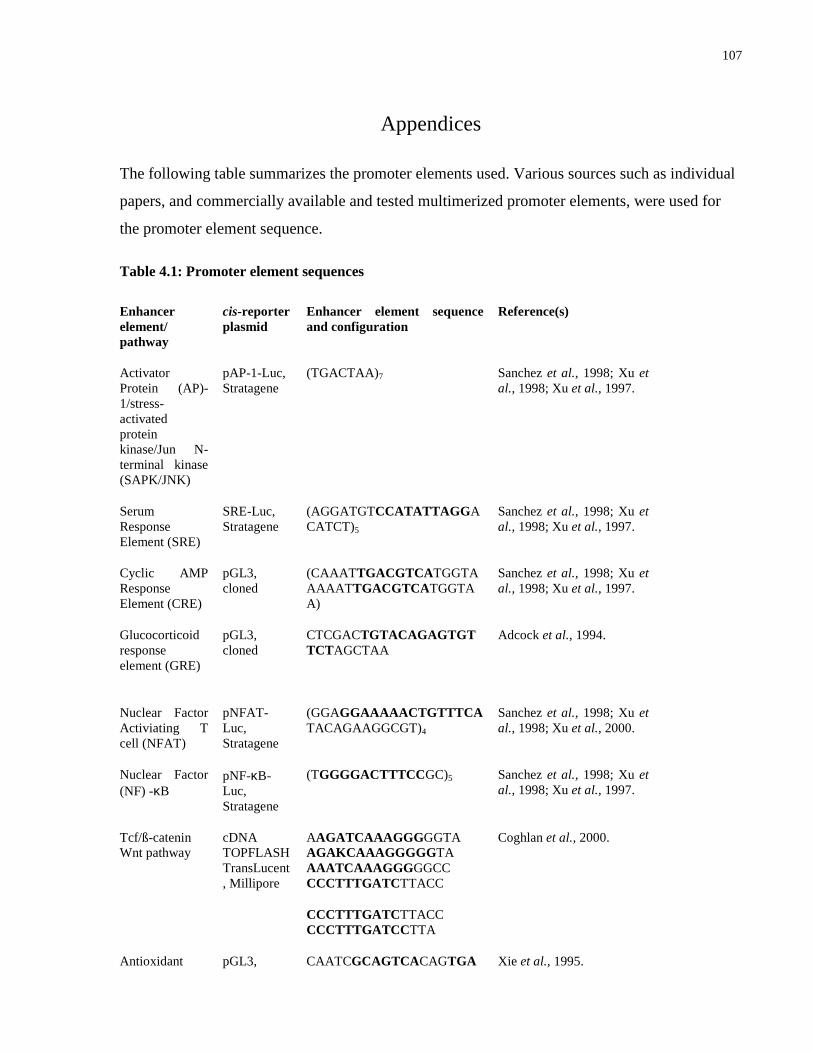
107
Appendices
The following table summarizes the promoter elements used. Various sources such as individual
papers, and commercially available and tested multimerized promoter elements, were used for
the promoter element sequence.
Table 4.1: Promoter element sequences
Enhancer element/ pathway
cis-reporter plasmid
Enhancer element sequence and configuration
Reference(s)
Activator Protein (AP)-1/stress-activated protein kinase/Jun N-terminal kinase (SAPK/JNK)
pAP-1-Luc, Stratagene
(TGACTAA)7 Sanchez et al., 1998; Xu et al., 1998; Xu et al., 1997.
Serum Response Element (SRE)
SRE-Luc, Stratagene
(AGGATGTCCATATTAGG ACATCT)5
Sanchez et al., 1998; Xu et al., 1998; Xu et al., 1997.
Cyclic AMP Response Element (CRE)
pGL3, cloned
(CAAATTGACGTCA TGGTAAAAAT TGACGTCA TGGTAA)
Sanchez et al., 1998; Xu et al., 1998; Xu et al., 1997.
Glucocorticoid response element (GRE)
pGL3, cloned
CTCGACTGTACAGAGTGTTCTAGCTAA
Adcock et al., 1994.
Nuclear Factor Activiating T cell (NFAT)
pNFAT-Luc, Stratagene
(GGAGGAAAAACTGTTTCATACAGAAGGCGT)4
Sanchez et al., 1998; Xu et al., 1998; Xu et al., 2000.
Nuclear Factor (NF) -κB
pNF-κB-Luc, Stratagene
(TGGGGACTTTCC GC)5 Sanchez et al., 1998; Xu et al., 1998; Xu et al., 1997.
Tcf/ß-catenin Wnt pathway
cDNA TOPFLASH TransLucent, Millipore
AAGATCAAAGGG GGTA AGAKCAAAGGGGG TA AAATCAAAGGG GGCC CCCTTTGATC TTACC
CCCTTTGATC TTACC CCCTTTGATCC TTA
Coghlan et al., 2000.
Antioxidant pGL3, CAATCGCAGTCA CAGTGA Xie et al., 1995.

108
Response Element (ARE)
cloned CTCAGCAGAATCTGAGCCTA
12-O-tetradecanoylphorbol-13-acetate Response Element (TRE)
pGL3, cloned
CATTGAGTCAGG GTAACGATTGAGTCAGG AA
Xie et al., 1995.
Forkhead Binding Protein Sequence (FBS)
pGL3, cloned
CTTCAAAATAAGTTTGTTTTGCTTCAAAATAAGTTTGTTTTGCTTCAAAATAAGTTTGTTTTGCA
Peroxisome Proliferator- Activated-receptor-γ (PPAR)
pGL3, cloned
CGCGGGACCAGGACAAAGGTCACGTTCGGACCAGGACAAAGGTCACGTTC
cfos with downstream regulatory element (DRE)
pGL3, cloned
Sense Primer sequence: 5’-ATCAGGTGCGAATG TTCGCT-3’
Antisense primer sequence: 5’-GGAGGATGACGCCT CGTAGT-3’
Carrion et al., 1999.