Embed Size (px)
Citation preview
UNCLASSIFIED
UNCLASSIFIED
DEVELOPMENT OF AN ARMY STATIONARY AXLE EFFICIENCY TEST STAND – PART II
INTERIM REPORT TFLRF No. 484
by Adam C. Brandt Edwin A. Frame
U.S. Army TARDEC Fuels and Lubricants Research Facility Southwest Research Institute® (SwRI®)
San Antonio, TX
for Allen S. Comfort
U.S. Army TARDEC Force Projection Technology
Warren, Michigan
Contract No. W56HZV-09-C-0100 (WD33)
UNCLASSIFIED: Distribution Statement A. Approved for public release
January 2017

UNCLASSIFIED
UNCLASSIFIED
Disclaimers Reference herein to any specific commercial company, product, process, or service by trade name, trademark, manufacturer, or otherwise, does not necessarily constitute or imply its endorsement, recommendation, or favoring by the United States Government or the Department of the Army (DoA). The opinions of the authors expressed herein do not necessarily state or reflect those of the United States Government or the DoA, and shall not be used for advertising or product endorsement purposes.
Contracted Author As the author(s) is(are) not a Government employee(s), this document was only reviewed for export controls, and improper Army association or emblem usage considerations. All other legal considerations are the responsibility of the author and his/her/their employer(s).
DTIC Availability Notice Qualified requestors may obtain copies of this report from the Defense Technical Information Center, Attn: DTIC-OCC, 8725 John J. Kingman Road, Suite 0944, Fort Belvoir, Virginia 22060-6218.
Disposition Instructions Destroy this report when no longer needed. Do not return it to the originator.

UNCLASSIFIED
UNCLASSIFIED
DEVELOPMENT OF AN ARMY STATIONARY AXLE
EFFICIENCY TEST STAND – PART II
INTERIM REPORT TFLRF No. 484
by
Adam C. Brandt Edwin A. Frame
U.S. Army TARDEC Fuels and Lubricants Research Facility
Southwest Research Institute® (SwRI®) San Antonio, TX
for Allen S. Comfort
U.S. Army TARDEC Force Projection Technology
Warren, Michigan
Contract No. W56HZV-09-C-0100 (WD33) SwRI® Project No. 08.20508
UNCLASSIFIED: Distribution Statement A. Approved for public release
January 2017
Approved by:
Gary B. Bessee, Director U.S. Army TARDEC Fuels and Lubricants
Research Facility (SwRI®)

UNCLASSIFIED
UNCLASSIFIED iv
REPORT DOCUMENTATION PAGE Form Approved OMB No. 0704-0188
Public reporting burden for this collection of information is estimated to average 1 hour per response, including the time for reviewing instructions, searching existing data sources, gathering and maintaining the data needed, and completing and reviewing this collection of information. Send comments regarding this burden estimate or any other aspect of this collection of information, including suggestions for reducing this burden to Department of Defense, Washington Headquarters Services, Directorate for Information Operations and Reports (0704-0188), 1215 Jefferson Davis Highway, Suite 1204, Arlington, VA 22202-4302. Respondents should be aware that notwithstanding any other provision of law, no person shall be subject to any penalty for failing to comply with a collection of information if it does not display a currently valid OMB control number. PLEASE DO NOT RETURN YOUR FORM TO THE ABOVE ADDRESS. 1. REPORT DATE (DD-MM-YYYY) 13-01-2017
2. REPORT TYPE Interim Report
3. DATES COVERED (From - To) June 2014 – January 2017
4. TITLE AND SUBTITLE Stationary Axle Test Stand for Lubricant Efficiency Evaluation – Part II
5a. CONTRACT NUMBER W56HZV-09-C-0100
5b. GRANT NUMBER
5c. PROGRAM ELEMENT NUMBER
6. AUTHOR(S) Brandt, Adam C.; Frame, Edwin A.
5d. PROJECT NUMBER SwRI 08.20508
5e. TASK NUMBER WD 33
5f. WORK UNIT NUMBER
7. PERFORMING ORGANIZATION NAME(S) AND ADDRESS(ES) 8. PERFORMING ORGANIZATION REPORT NUMBER
U.S. Army TARDEC Fuels and Lubricants Research Facility (SwRI®) Southwest Research Institute® P.O. Drawer 28510 San Antonio, TX 78228-0510
TFLRF No. 484
9. SPONSORING / MONITORING AGENCY NAME(S) AND ADDRESS(ES) 10. SPONSOR/MONITOR’S ACRONYM(S)
U.S. Army RDECOM U.S. Army TARDEC 11. SPONSOR/MONITOR’S REPORT Force Projection Technologies NUMBER(S) Warren, MI 48397-5000 12. DISTRIBUTION / AVAILABILITY STATEMENT UNCLASSIFIED: Dist A Approved for public release; distribution unlimited 13. SUPPLEMENTARY NOTES 14. ABSTRACT The U.S. Army Tank Automotive Research, Development, and Engineering Center (TARDEC) has initiated the construction and development of a stationary axle efficiency test stand to allow for laboratory based investigation of Fuel Efficient Gear Oils (FEGO) and their impact on vehicle efficiency. Development work using the stationary axle efficiency test stand was completed using hardware representative of light and medium duty tactical wheeled vehicles. Stationary axle efficiency testing was conducted following a draft Federal Test Method (FTM) using developmental and commercial oils. The most differentiation of efficiency between tested lubricants was achieved in the low speed/lower load operating conditions of the FTM cycle, while efficiency results at the higher speed/high load operating conditions showed significantly tighter grouping. Overall, results tended to show increased efficiency trending with reduced viscosity. 15. SUBJECT TERMS Fuel Efficient Gear Oil, FEGO, Axle Efficiency, Fuel Efficiency, 80W-90, 75W-90, 75W-110, 75W-140, 75W-85 16. SECURITY CLASSIFICATION OF: 17. LIMITATION
OF ABSTRACT 18. NUMBER OF PAGES
19a. NAME OF RESPONSIBLE PERSON
a. REPORT Unclassified
b. ABSTRACT Unclassified
c. THIS PAGE Unclassified
Unclassified
93
19b. TELEPHONE NUMBER (include area code)
Standard Form 298 (Rev. 8-98) Prescribed by ANSI Std. Z39.18

UNCLASSIFIED
UNCLASSIFIED v
EXECUTIVE SUMMARY The U.S. Army Tank Automotive Research, Development, and Engineering Center (TARDEC)
desires to increase the fuel efficiency of its ground vehicle fleet, and has initiated the construction
and development of a stationary axle efficiency test stand to allow for laboratory based
investigation of Fuel Efficient Gear Oils (FEGO) and their impact on vehicle efficiency. The test
stand was designed and developed with the following goals:
• Provide a lower cost alternative for quantifying vehicle efficiency impact from new axle
gear lubricants compared to full scale vehicle testing
• Provide improved testing accuracy and precision when assessing axle gear lubricants to
improve ability to discriminate between similarly performing oils
• Be modular in design to provide sufficient motoring and absorption capabilities required
to test a wide range of light to heavy duty driveline hardware representative of those fielded
by the U.S. Army
• Support the future development of a standardized Federal Test Method intended to be used
for future product qualification for the U.S. Army
Development work using the stationary axle efficiency test stand was completed using hardware
representative of light and medium duty tactical wheeled vehicles. This included the High Mobility
Multipurpose Wheeled Vehicle (HMMWV), and the 5-Ton Cargo variant of the Family of
Medium Tactical Vehicles (FMTV). Results show that the stationary axle test stand provides
excellent representation of real world results based on driving cycle replications of actual full scale
SAE J1321 vehicle testing. Through development, the rearmost axle of the M1083A1 MTV was
selected as a basis for a Federal Test Method (FTM) that specifies testing procedures to measure
the efficiency improvement of an axle gear oil for use in military equipment. Table 1 shows the
operating conditions for the MTV axle as defined by the current draft FTM.

UNCLASSIFIED
UNCLASSIFIED vi
Table 1. Final MTV FTM Cycle Operation Conditions
Step Approximate Vehicle Velocity
Pinion Input Speed [rpm] Pinion Input Load Approximate Input
Power Differential Temperature
1 40kph (25mph) 1,469 610Nm (450lbft) 94kW (126hp)
79.4 °C (175 °F)
2 56kph (35mph) 2,100 338Nm (250lbft) 75kW (100hp) 3 40kph (25mph) 1,469 440Nm (325lbft) 68kW (91hp) 4 72kph (45mph) 2,600 237Nm (175lbft) 65kW (87hp) 5 24kph (15mph) 865 542Nm (400lbft) 49kW (66hp) 6 88kph (55mph) 3,207 141Nm (104lbft) 48kW (64hp) 7 56kph (35mph) 2,100 91Nm (67lbft) 20kW (27hp) 8 40kph (25mph) 1,469 73Nm (54lbft) 11kW (15hp) 9 24kph (15mph) 865 61Nm (45lbft) 5kW (7hp) 10 8kph (5mph) 294 108Nm (80lbft) 4kW (5hp)
Stationary axle efficiency testing was conducted following the draft FTM using developmental
and commercial oils. This included two different formulations of a 75W-90 product, a 75W-85, a
75W-110, and a 75W-140. Results of efficiency improvement for each individual oil are presented
in Figure 1.
. Complied FTM Results using MTV Axle
-0.75%
-0.50%
-0.25%
0.00%
0.25%
0.50%
0.75%
1.00%
1.25%
1.50%
1.75%
2.00%
Effic
ienc
y Ch
ange
Rel
ativ
e to
Bas
elin
e [%
]
Compiled Candidate Results (all vs. LO330868 80W90)
LO33222075W-90
LO33237475W-140
LO31041175W-90
LO33802875W-85
LO35165675W-110

UNCLASSIFIED
UNCLASSIFIED vii
The greatest differentiation of efficiency between tested lubricants was achieved in the low
speed/lower load operating conditions of the FTM cycle, while efficiency results at the higher
speed/high load operating conditions showed significantly tighter grouping. Overall, results tended
to show increased efficiency trending with reduced viscosity.

UNCLASSIFIED
UNCLASSIFIED viii
FOREWORD/ACKNOWLEDGMENTS
The U.S. Army TARDEC Fuel and Lubricants Research Facility (TFLRF) located at Southwest
Research Institute (SwRI), San Antonio, Texas, performed this work during the period June 2014
through January 2017 under Contract No. W56HZV-09-C-0100. The U.S. Army Tank Automotive
RD&E Center, Force Projection Technologies, Warren, Michigan administered the project. Mr. Eric
Sattler (RDTA-SIE-ES-FPT) served as the TARDEC contracting officer’s technical representative.
Mr. Allen Comfort of TARDEC served as project technical monitor.

UNCLASSIFIED
UNCLASSIFIED
ix
TABLE OF CONTENTS
Section Page EXECUTIVE SUMMARY .......................................................................................................................... v FOREWORD/ACKNOWLEDGMENTS .................................................................................................. viii LIST OF FIGURES ...................................................................................................................................... x LIST OF TABLES ...................................................................................................................................... xi ACRONYMS AND ABBREVIATIONS ................................................................................................... xii 1.0 BACKGROUND AND OBJECTIVE ................................................................................................. 1 2.0 BASELINE AND DEVELOPMENTAL OIL PROPERTIES ............................................................ 2 3.0 STATIONARY AXLE STAND REFINEMENT (ORIGINAL MTV INSTALLATION) ............... 2
3.1 DATA ACQUISITION SIGNAL HANDLING ................................................................................... 4 3.2 DIFFERENTIAL TEMPERATURE CONTROL .................................................................................. 5
4.0 MTV AXLE TEST DEVELOPMENT ............................................................................................... 8 4.1 TRANSIENT DRIVING CYCLE REPLICATION (POST STAND REFINEMENTS) ............................... 8
4.1.1 Temperature Investigation .......................................................................................... 10 4.2 EFFICIENCY MAPPING ............................................................................................................. 12 4.3 PROPOSED FEDERAL TEST METHOD CYCLE (MTV) ............................................................... 16
5.0 HMMWV AXLE TEST DEVELOPMENT ..................................................................................... 21 5.1 HMMWV AXLE INSTALLATION DETAILS............................................................................... 22 5.2 TEMPERATURE INVESTIGATION .............................................................................................. 24 5.3 BREAK-IN ................................................................................................................................. 25 5.4 EFFICIENCY MAPPING ............................................................................................................. 26 5.5 PROPOSED FEDERAL TEST METHOD CYCLE (HMMWV) ....................................................... 29
6.0 Final Federal Test Method Development .......................................................................................... 33 6.1 HARDWARE DOWN-SELECT ..................................................................................................... 34 6.2 TEST PROCEDURE DOCUMENTATION ...................................................................................... 35
6.2.1 Double Flush Fluid Change ........................................................................................ 35 6.2.2 General Efficiency Test Procedure ............................................................................. 36 6.2.3 Calculations ................................................................................................................ 38
6.3 FINAL TEST RESULTS .............................................................................................................. 41 6.3.1 Baseline and FEGO Chemical & Physical Analysis .................................................. 41 6.3.2 Developmental 75W-90 ............................................................................................. 43 6.3.3 Developmental 75W-140 ........................................................................................... 45 6.3.4 Commercial 75W-90 .................................................................................................. 47 6.3.5 Commercial 75W-85 .................................................................................................. 49 6.3.6 Commercial 75W-110 ................................................................................................ 51 6.3.7 Compiled Results ....................................................................................................... 53
7.0 GENERAL OBSERVATIONS ......................................................................................................... 55 7.1 LONG TERM BREAK-IN/BASELINE SHIFT ................................................................................ 55 7.2 ADDITIVE PACK TRIBO-FILM CHANGE BETWEEN TESTED CANDIDATES ............................... 56
8.0 RESULTS AND CONCLUSIONS ................................................................................................... 57 9.0 RECOMMENDATIONS .................................................................................................................. 58 10.0 REFERENCES .................................................................................................................................. 59 APPENDIX A. MTV Axle Efficiency Maps ...................................................................................... A-1 APPENDIX B. Draft FTM.................................................................................................................. B-1

UNCLASSIFIED
UNCLASSIFIED
x
LIST OF FIGURES
Figure Page Figure 1. Complied FTM Results using MTV Axle .................................................................................... vi Figure 2. Block Diagram of Temperature Control Loop System .................................................................. 6 Figure 3. Heater Control Loop Hardware ..................................................................................................... 6 Figure 4. Heater Control Loop - Return to Axle ........................................................................................... 7 Figure 5. Heater Control Loop – Supply From Axle .................................................................................... 7 Figure 6. MTV Efficiency Results – SAE J1321 Driving Cycle Replication ............................................... 9 Figure 7. Efficiency Response, Replicated Driving Cycle, Simplified Temperature Profile ..................... 11 Figure 8. Typical MTV Axle Temperature Response ................................................................................. 12 Figure 9. MTV Efficiency Map – 80W-90 ................................................................................................. 14 Figure 10. MTV Efficiency Map – 75W-90 ............................................................................................... 14 Figure 11. MTV Efficiency Map – 75W-140 ............................................................................................. 15 Figure 12. MTV Efficiency Map, 80W-90, Proposed FTM Point Overlay ................................................ 17 Figure 13. MTV Efficiency Results – Proposed FTM – 75W-90 ............................................................... 18 Figure 14. MTV Efficiency Results – Proposed FTM – 75W-140 ............................................................. 18 Figure 15. MTV Axle Statistical Efficiency Improvement – Proposed FTM – 75W-90 ............................ 20 Figure 16. MTV Axle Statistical Efficiency Improvement – Proposed FTM – 75W-140 .......................... 20 Figure 17. HMMWV Axle Installation ....................................................................................................... 22 Figure 18. Completed HMMWV Axle Installation .................................................................................... 24 Figure 19. HMMWV Efficiency Map – 80W-90........................................................................................ 27 Figure 20. HMMWV Efficiency Map – 75W-90........................................................................................ 27 Figure 21. HMMWV Efficiency Map – 75W-140...................................................................................... 28 Figure 22. HMMWV Peace Time Duty Cycle Differential Input Conditions ............................................ 30 Figure 23. HMMWV Efficiency Results – Proposed FTM – 75W-90 ....................................................... 31 Figure 24. HMMWV Proposed Efficiency Results – Proposed FTM – 75W-140 ..................................... 32 Figure 25. HMMWV Axle Statistical Efficiency Improvement – Proposed FTM – 75W-90 .................... 32 Figure 26. HMMWV Axle Statistical Efficiency Improvement – Proposed FTM – 75W-140 .................. 33 Figure 27. MTV Axle LO332270 75W-90 vs LO330868 80W-90 (Plotted) ............................................. 43 Figure 28. MTV Axle LO332270 75W-90 vs LO330868 80W-90 (Statistical Plotted) ............................. 44 Figure 29. MTV Axle LO332374 75W-140 vs LO330868 80W-90 (Plotted) ........................................... 45 Figure 30. MTV Axle LO332374 75W-140 vs LO330868 80W-90 (Statistical Plotted) ........................... 46 Figure 31. MTV Axle LO310411 75W-90 vs LO330868 80W-90 (Plotted) ............................................. 47 Figure 32. MTV Axle LO310411 75W-90 vs LO330868 80W-90 (Statistical Plotted) ............................. 48 Figure 33. MTV Axle LO338028 75W-85 vs LO330868 80W-90 (Plotted) ............................................. 49 Figure 34. MTV Axle LO338028 75W-85 vs LO330868 80W-90 (Statistical Plotted) ............................. 50 Figure 35. MTV Axle LO351656 75W-110 vs LO330868 80W-90 (Plotted) ........................................... 51 Figure 36. MTV Axle LO351656 75W-110 vs LO330868 80W-90 (Statistical Plotted) ........................... 52 Figure 37. Compiled FEGO Candidate Results (Plotted) ........................................................................... 54 Figure 38. MTV Axle Baseline Shift .......................................................................................................... 55

UNCLASSIFIED
UNCLASSIFIED
xi
LIST OF TABLES
Table Page Table 1. Final MTV FTM Cycle Operation Conditions .............................................................................. vi Table 2. Baseline and Developmental Gear Oil Chemical & Physical Properties ........................................ 3 Table 3. MTV Replicated Driving Cycle, Input Speed & Load Conditions ................................................. 8 Table 4. MTV Replicated Driving Cycle, Input Speed & Load Conditions (Modified) ............................ 10 Table 5. Proposed Federal Test Method Conditions for MTV Axle ........................................................... 16 Table 6. HMMWV Axle Break-In Conditions ........................................................................................... 26 Table 7. HMMWV Peace Time Duty Cycle Torque/Speed Bins ............................................................... 30 Table 8. HMMWV Proposed FTM Operating Conditions ......................................................................... 31 Table 9. Final MTV Axle FTM Input Speed and Load Conditions ............................................................ 35 Table 10. Example Single Run Results Table ............................................................................................. 38 Table 11. Example Composite Single Run Result Table ............................................................................ 39 Table 12. Example Baseline/Candidate Result Table ................................................................................. 39 Table 13. Statistical Analysis Table ............................................................................................................ 40 Table 14. Example Final Results Table ...................................................................................................... 40 Table 15. Baseline and Candidate FEGO Chemical and Physical Properties ............................................. 42 Table 16. MTV Axle LO332270 75W-90 vs LO330868 80W-90 (Statistical Tabular) ............................. 44 Table 17. MTV Axle LO332374 75W-140 vs LO330868 80W-90 (Statistical Tabular) ........................... 46 Table 18. MTV Axle LO310411 75W-90 vs LO330868 80W-90 (Statistical Tabular) ............................. 48 Table 19. MTV Axle LO338028 75W-85 vs LO330868 80W-90 (Statistical Tabular) ............................. 50 Table 20. MTV Axle LO351656 75W-110 vs LO330868 80W-90 (Statistical Tabular) ........................... 52 Table 21. Compiled FEGO Candidate Results (Tabular) ........................................................................... 53

UNCLASSIFIED
UNCLASSIFIED
xii
ACRONYMS AND ABBREVIATIONS °C – degrees Celsius
°F – degrees Fahrenheit
FEGO – Fuel Efficient Gear Oil
FMTV – Family of Medium Tactical Vehicle
FTM – Federal Test Method
GPM – Gallons Per Minute
HET – Heavy Equipment Transporter
HMMWV – High Mobility Multipurpose Wheeled Vehicle
Hz - hertz
kHz - kilohertz
kph – kilometer per hour
lbft – pound feet
mph – miles per hour
MTV – Medium Tactical Vehicle
Nm – newton meter
OMS/MP – Operational Mode Summary/Mission Profile
rpm – revolutions per minute
sec - seconds
SwRI – Southwest Research Institute
TARDEC – Tank Automotive Research Development and Engineering Center
TFLRF – TARDEC Fuels and Lubricants Research Facility
kNm – kilo newton meter

UNCLASSIFIED
UNCLASSIFIED 1
1.0 BACKGROUND AND OBJECTIVE
The U.S. Army Tank Automotive Research, Development, and Engineering Center (TARDEC)
desires to increase the fuel efficiency of its ground vehicle fleet. One potential area for fuel
consumption improvement is through optimization of driveline lubricating fluids. By improving
the lubricating fluids to reduce mechanical losses, an increase in vehicle fuel efficiency can be
achieved. TARDEC has previously conducted research to determine fuel consumption effects of
fuel efficient axle gear lubricants in light, medium, and heavy duty tactical wheeled vehicles. Full
scale vehicle fuel efficiency tests were conducted on the M1151A1 High Mobility Multipurpose
Wheeled Vehicle (HMMWV), the M1083A1 5-ton cargo variant of the Family of Medium Tactical
Vehicles (MTV), and the M1070 Heavy Equipment Transporter (HET). Results showed good
potential for fuel efficiency gains through the use of “drop-in” fluids, while also highlighting the
importance of fluid selection versus expected driving/duty cycle and vehicle application [1, 2, 3].
In conjunction with full scale vehicle testing, TARDEC also initiated the construction and
development of a stationary axle efficiency test stand to allow for laboratory based investigation
of Fuel Efficient Gear Oils (FEGO). This test stand was constructed at the U.S. Army TARDEC
Fuels and Lubricants Research Facility (TFLRF), located at Southwest Research Institute (SwRI)
in San Antonio TX [4, 5], and was designed and developed with the following goals:
• Provide a lower cost alternative for quantifying vehicle efficiency impact from new axle
gear lubricants compared to full scale vehicle testing
• Provide improved testing accuracy and precision when assessing axle gear lubricants to
improve ability to discriminate between similarly performing oils
• Be modular in design to provide sufficient motoring and absorption capabilities required
to test a wide range of light to heavy duty driveline hardware representative of those fielded
by the U.S. Army
• Support the future development of a standardized Federal Test Method intended to be used
for future product qualification for the U.S. Army

UNCLASSIFIED
UNCLASSIFIED 2
This report covers the continued progression of the stationary axle efficiency stand development,
picking up on work last reported under TFLRF Interim Report No. 471, where the stationary axle
test stand construction was completed, and preliminary shakedown and repeatability work was
conducted using the MTV axle and a baseline 80W-90 gear oil.
2.0 BASELINE AND DEVELOPMENTAL OIL PROPERTIES
For all development work conducted on the axle efficiency test stand, the same oils used in the
previously mentioned full scale vehicle testing were utilized. This includes a baseline 80W-90 gear
oil, as well as a two synthetic 75W-90 and 75W-140 fuel efficient candidates. Table 2 outlines the
basic chemical and physical properties of each oil. It is worth noting that three separate batches of
baseline 80W-90 oil have been used over the course of the development process, and some minor
changes in composition and performance of the baseline 80W-90 have been noted. The
compositional changes can be noted in the table below, while performance changes are touched
on in their respective sections in the report.
3.0 STATIONARY AXLE STAND REFINEMENT
(ORIGINAL MTV INSTALLATION)
Continuing from work reported under IR471, additional changes were implemented to the
stationary axle test stand in an effort to improve run to run repeatability of efficiency data. Changes
focused on two primary areas, the data acquisition/signal handling systems, and the
implementation of a differential oil temperature control system.

UNCLASSIFIED
UNCLASSIFIED 3
Table 2. Baseline and Developmental Gear Oil Chemical & Physical Properties
LO246580 LO272251 LO330868 LO332374 LO332220Baseline 80W-90
Baseline 80W-90
Baseline 80W-90
Developmental 75W-140
Developmental 75W-90
Elements D5185 (Batch 1) (Batch 2) (Batch 3)Aluminum ppm <1 <1 <1 <1 <1Antimony ppm <1 <1 <1 <1 <1
Barium ppm <1 <1 <1 <1 <1Boron ppm 105 236 233 224 151
Calcium ppm 14 6 7 <1 3Chromium ppm <1 <1 <1 <1 <1
Copper ppm <1 <1 <1 <1 <1Iron ppm 149 <1 <1 <1 <1Lead ppm <1 <1 <1 <1 <1
Magnesium ppm 4 <1 <1 <1 10Manganese ppm <1 <1 <1 <1 <1
Molybdenum ppm <1 <1 <1 <1 <1Nickel ppm <1 <1 <1 <1 <1
Phosphorus ppm 949 947 942 1331 1812Silicon ppm <1 <1 <1 <1 <1Silver ppm <1 <1 <1 <1 <1
Sodium ppm <5 <5 <5 <5 <5Tin ppm <1 <1 <1 <1 <1
Zinc ppm 8 2 5 <1 2Potassium ppm <5 <5 <5 <5 <5Strontium ppm <1 <1 <1 <1 <1Vanadium ppm <1 <1 <1 <1 <1Titanium ppm <1 <1 <1 <1 <1Cadmium ppm <1 <1 <1 <1 <1
Kinematic Viscosity D445Test Temperature °C 40 40 40 40 40
Viscosity mm²/s 126.07 135.62 138.81 178.28 87.27Kinematic Viscosity D445
Test Temperature °C 100 100 100 100 100Viscosity mm²/s 13.2 14.54 14.63 24.43 13.97
Test ASTM Method Units

UNCLASSIFIED
UNCLASSIFIED 4
3.1 DATA ACQUISITION SIGNAL HANDLING
For the data acquisition/signal handling system, adjustments were first made to the gate times used
for the measurement of the input and output torque frequency signals. In the data acquisition
system, the gate time specifies the duration of time the frequency signal is sampled for a single
discrete measurement, and the overall resolution of this measurement is effected by the length of
the gate time and number of counts that occur during the specified gate. For example, for the input
1kNm (737.6 lbft) torque flange used on the MTV axle installation, the output signal operates over
a nominal frequency range of 120kHz for the full 1kNm measurement range of the torque flange.
This results in a signal measurement resolution of approximately 0.61 lbft/count at a nominal gate
time of 0.01 seconds. For the same conditions under a longer 0.05 second gate time, overall signal
measurement resolution improves to 0.13 lbft/count. This is because at the same input frequency
(i.e., torque level), the longer gate time accumulates more counts. In general, resolution for
frequency measurement increases with the longer gate times, but as the gate times increase, update
rates for the measured parameters slow. Overall gate time is also practically limited by the counting
capacity of the data acquisition systems frequency counter/timer chipset. For the original
shakedown and repeatability work conducted and reported under IR471, a specified gate time of
0.01 sec was used to provide the quickest data update rate. Through investigation and testing, an
updated gate time of 0.05 sec was implemented. This improved the measurement resolution of the
input and output torque frequency signals to a level greater than that of the actual measurement
accuracy class of the torque flange itself (i.e., the accuracy of the measurement device became the
limiting factor, not the signal measurement resolution), while not showing any noticeable impact
from the changed update rate. In addition to the change in gate time, the input signals from the
axle input/output torque and input/output speed measurements had 0.5 sec digital low-pass filters
applied to reduce any signal noise present that might negatively impact the repeatability of the
efficiency calculations. Through testing, both of these changes demonstrated an improvement in
data repeatability and calculations of axle efficiency.

UNCLASSIFIED
UNCLASSIFIED 5
3.2 DIFFERENTIAL TEMPERATURE CONTROL
The second change investigated to improve run to run repeatability was the design and
implementation of a differential/gear oil temperature control system. Temperature of the
differential gear oil during operation has substantial influence in overall mechanical efficiency of
the axle/differential, thus temperature variation between efficiency runs can impact data
repeatability. In stationary type axle efficiency testing, two general schools of thought have been
identified regarding temperature control. The first considers that during real-world operation, the
axle will naturally stabilize to its own steady state temperature dependent on the loading
conditions, the lubricant being used, its resulting efficiency, and the ambient temperature it’s being
operated in. To replicate this in laboratory testing, a temperature control system would be
configured in such a way to provide a fixed cooling rate to the axle for base cooling, while still
allowing the gear oil temperature to seek its natural steady state based on loading conditions. The
second school of thought is that in order to get a direct comparison between two differing fluids,
all variables, including temperature, need to be precisely and repeatability controlled. This requires
a control system that can maintain a specified differential oil temperature over a potentially wide
range of operating conditions, requiring the ability to heat or cool the axle gear oil, depending on
the temperature specification and the specified input/output speed and loading conditions. For this
testing a fixed temperature control system was selected. While both of these schools of thought
have merit, the fixed temperature recirculation loop was more dictated by laboratory limitations
than greater technical merit over the fixed cooling rate approach.
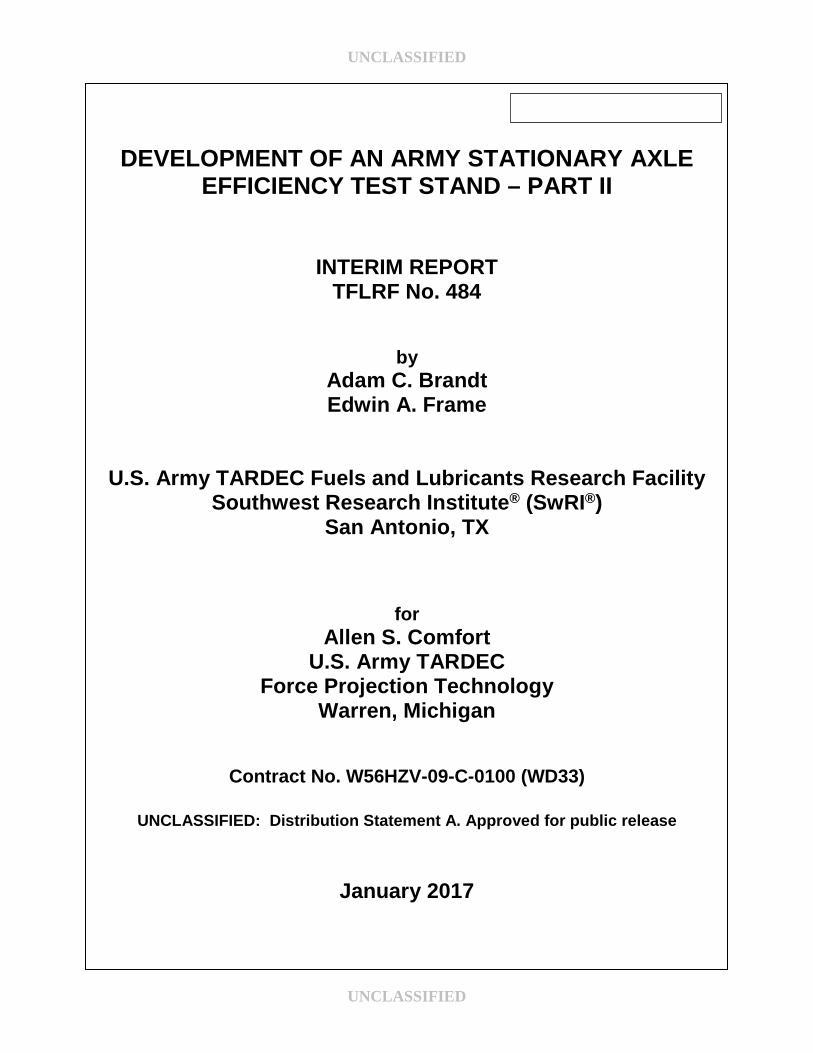
The temperature control loop designed for the axle efficiency stand was based off of a similar
control system successfully developed by Anderson et al. during General Motors axle efficiency
testing [6]. The external control system is made up of a small fixed displacement gear pump, an
appropriately sized recirculation heater, and a liquid to liquid heat exchanger. The gear pump was
sized to provide approximately 5 GPM of flow during operation, and the differential temperature
control measurement is taken at the drain port of the axle with a closed tip thermocouple protruding
approximately 1″ into the differential housing. Figure 2 shows a simplified block diagram of the
temperature control loop, while Figure 3, Figure 4, and Figure 5 respectively show the actual
installed system, the control loop return port located at the axles original fill port, and the control
loop supply port located at the axles original drain port (shown for the originally installed MTV
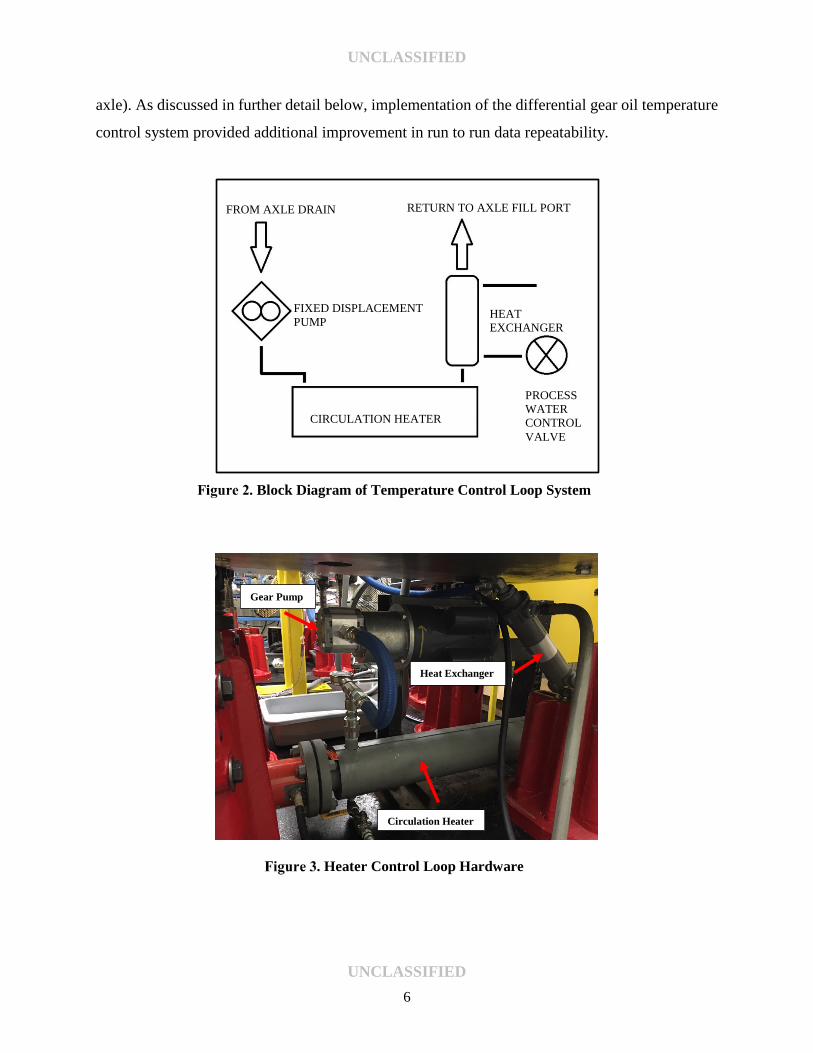
UNCLASSIFIED
UNCLASSIFIED 6
axle). As discussed in further detail below, implementation of the differential gear oil temperature
control system provided additional improvement in run to run data repeatability.
. Block Diagram of Temperature Control Loop System
. Heater Control Loop Hardware
FROM AXLE DRAIN RETURN TO AXLE FILL PORT
FIXED DISPLACEMENT PUMP
CIRCULATION HEATER
HEAT EXCHANGER
PROCESS WATER CONTROL VALVE
Circulation Heater
Heat Exchanger
Gear Pump

UNCLASSIFIED
UNCLASSIFIED 7
. Heater Control Loop - Return to Axle
. Heater Control Loop – Supply From Axle

UNCLASSIFIED
UNCLASSIFIED 8
4.0 MTV AXLE TEST DEVELOPMENT
With the successful completion of the test stand refinements, development work continued using
the MTV axle. The following sections outline SAE J1321 transient driving cycle replication,
differential fluid temperature impact investigation, efficiency mapping, and development of the
final proposed FTM test cycle for the MTV axle.
4.1 TRANSIENT DRIVING CYCLE REPLICATION (POST STAND REFINEMENTS)
With the implementation of the differential oil temperature control system, continued transient
driving cycle replication was conducted using the MTV axle. Table 3 lists the MTV transient
driving cycle axle operating conditions (i.e., input speed and load) previously introduced under
IR471. In addition, the table now shows initial target differential fluid temperature setpoints used
in testing. These temperatures were derived from the average natural stabilization temperatures
from the axle efficiency stand test observed during early 80W-90 repeatability testing prior to
temperature control. This allowed for a direct comparison of the “post temperature controlled”
runs to those conducted before temperature control to identify improvement in run to run
repeatability, and they also provided a starting point to control the follow-on developmental oils
when introduced into the system to investigate the stands ability to discriminate oils.
Table 3. MTV Replicated Driving Cycle, Input Speed & Load Conditions Approximate Vehicle
Velocity Pinion Input Speed
[rpm] Pinion Input
Load Approximate Input
Power Differential Temperature
88.5kph (55mph) 3,207 141Nm (104lbft) 48kW (64hp) 107 °C (225 °F) 56kph (35mph) 2,033 91Nm (67lbft) 19kW (26hp) 103 °C (217 °F) 48kph (30mph) 1,723 89Nm (66lbft) 16kW (22hp) 98 °C (208 °F) 40kph (25mph) 1,469 73Nm (54lbft) 11kW (15hp) 93 °C (200 °F) 32kph (20mph) 1,157 61Nm (45lbft) 7kW (10hp) 88 °C (190 °F) 24kph (15mph) 865 61Nm (45lbft) 5kW (7hp) 82 °C (180 °F) 16khp (10mph) 684 88Nm (56lbft) 5kW (7hp) 78 °C (173 °F) 8kph (5mph) 294 108Nm (80lbft) 3kW (4hp) 75 °C (167 °F)
Testing with the implemented temperature control loop was conducted for the baseline 80W-90
and the developmental 75W-90 and 75W-140 oils. Upon completion of each oil, the axle and
temperature control system was then double flushed to reduce any oil carryover. Multiple
UNCLASSIFIED
UNCLASSIFIED 9
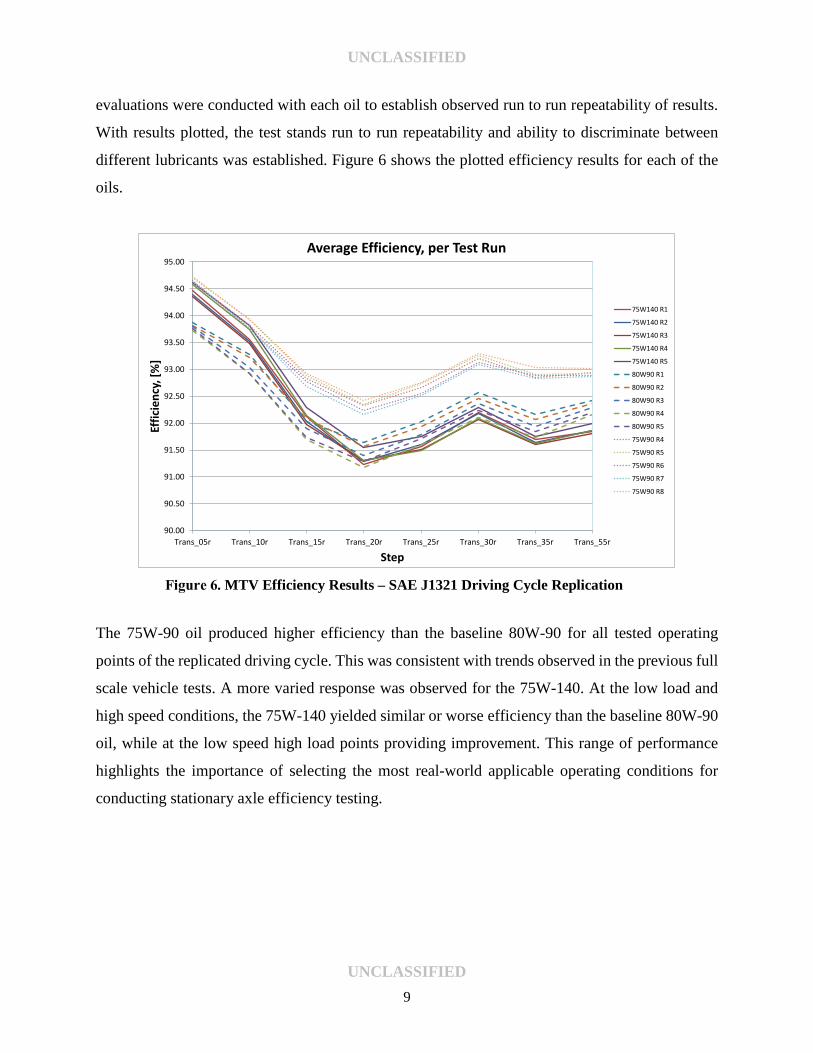
evaluations were conducted with each oil to establish observed run to run repeatability of results.
With results plotted, the test stands run to run repeatability and ability to discriminate between
different lubricants was established. Figure 6 shows the plotted efficiency results for each of the
oils.
. MTV Efficiency Results – SAE J1321 Driving Cycle Replication
The 75W-90 oil produced higher efficiency than the baseline 80W-90 for all tested operating
points of the replicated driving cycle. This was consistent with trends observed in the previous full
scale vehicle tests. A more varied response was observed for the 75W-140. At the low load and
high speed conditions, the 75W-140 yielded similar or worse efficiency than the baseline 80W-90
oil, while at the low speed high load points providing improvement. This range of performance
highlights the importance of selecting the most real-world applicable operating conditions for
conducting stationary axle efficiency testing.
90.00
90.50
91.00
91.50
92.00
92.50
93.00
93.50
94.00
94.50
95.00
Trans_05r Trans_10r Trans_15r Trans_20r Trans_25r Trans_30r Trans_35r Trans_55r
Effic
ienc
y, [%
]
Step
Average Efficiency, per Test Run
75W140 R1
75W140 R2
75W140 R3
75W140 R4
75W140 R5
80W90 R1
80W90 R2
80W90 R3
80W90 R4
80W90 R5
75W90 R4
75W90 R5
75W90 R6
75W90 R7
75W90 R8
UNCLASSIFIED
UNCLASSIFIED 10
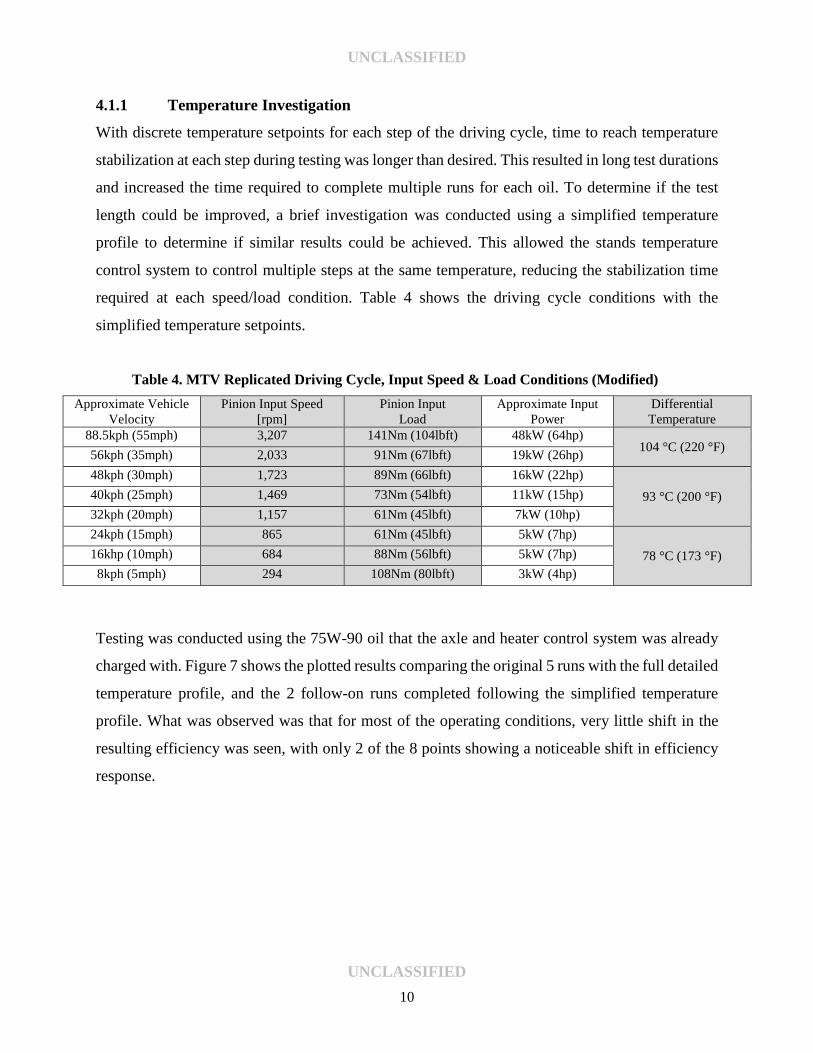
4.1.1 Temperature Investigation
With discrete temperature setpoints for each step of the driving cycle, time to reach temperature
stabilization at each step during testing was longer than desired. This resulted in long test durations
and increased the time required to complete multiple runs for each oil. To determine if the test
length could be improved, a brief investigation was conducted using a simplified temperature
profile to determine if similar results could be achieved. This allowed the stands temperature
control system to control multiple steps at the same temperature, reducing the stabilization time
required at each speed/load condition. Table 4 shows the driving cycle conditions with the
simplified temperature setpoints.
Table 4. MTV Replicated Driving Cycle, Input Speed & Load Conditions (Modified) Approximate Vehicle
Velocity Pinion Input Speed
[rpm] Pinion Input
Load Approximate Input
Power Differential Temperature
88.5kph (55mph) 3,207 141Nm (104lbft) 48kW (64hp) 104 °C (220 °F) 56kph (35mph) 2,033 91Nm (67lbft) 19kW (26hp)
48kph (30mph) 1,723 89Nm (66lbft) 16kW (22hp) 93 °C (200 °F) 40kph (25mph) 1,469 73Nm (54lbft) 11kW (15hp)
32kph (20mph) 1,157 61Nm (45lbft) 7kW (10hp) 24kph (15mph) 865 61Nm (45lbft) 5kW (7hp)
78 °C (173 °F) 16khp (10mph) 684 88Nm (56lbft) 5kW (7hp) 8kph (5mph) 294 108Nm (80lbft) 3kW (4hp)
Testing was conducted using the 75W-90 oil that the axle and heater control system was already
charged with. Figure 7 shows the plotted results comparing the original 5 runs with the full detailed
temperature profile, and the 2 follow-on runs completed following the simplified temperature
profile. What was observed was that for most of the operating conditions, very little shift in the
resulting efficiency was seen, with only 2 of the 8 points showing a noticeable shift in efficiency
response.
UNCLASSIFIED
UNCLASSIFIED 11
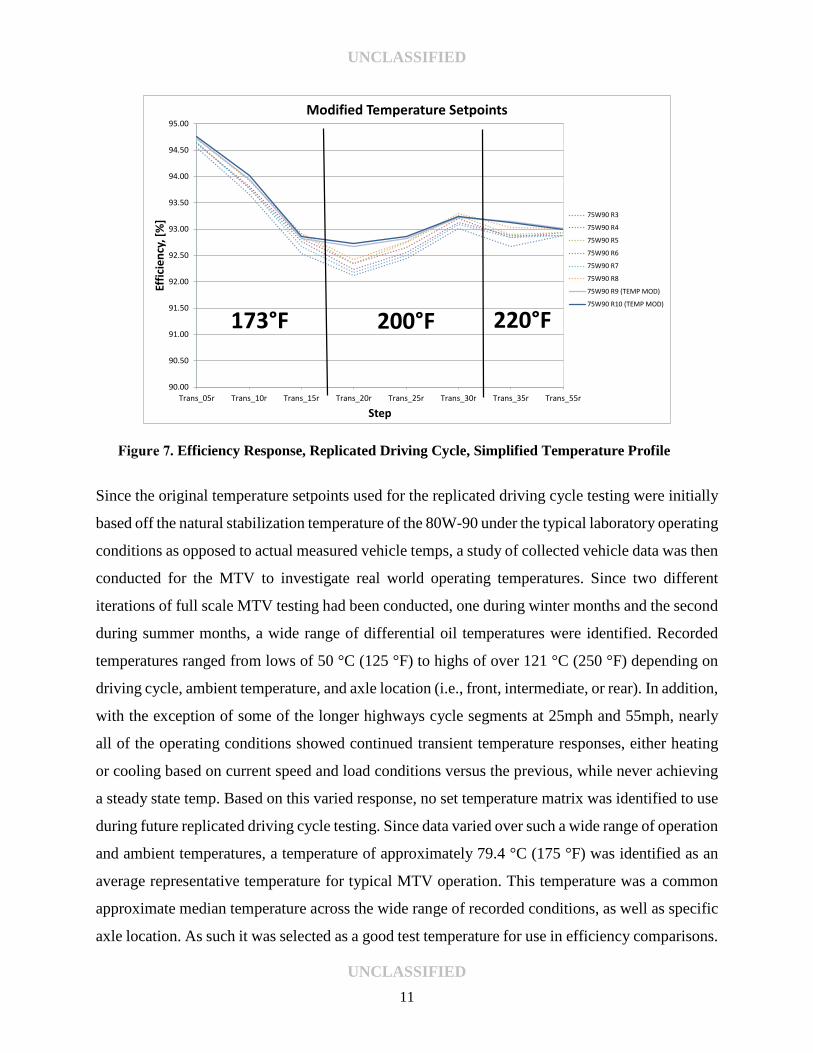
. Efficiency Response, Replicated Driving Cycle, Simplified Temperature Profile
Since the original temperature setpoints used for the replicated driving cycle testing were initially
based off the natural stabilization temperature of the 80W-90 under the typical laboratory operating
conditions as opposed to actual measured vehicle temps, a study of collected vehicle data was then
conducted for the MTV to investigate real world operating temperatures. Since two different
iterations of full scale MTV testing had been conducted, one during winter months and the second
during summer months, a wide range of differential oil temperatures were identified. Recorded
temperatures ranged from lows of 50 °C (125 °F) to highs of over 121 °C (250 °F) depending on
driving cycle, ambient temperature, and axle location (i.e., front, intermediate, or rear). In addition,
with the exception of some of the longer highways cycle segments at 25mph and 55mph, nearly
all of the operating conditions showed continued transient temperature responses, either heating
or cooling based on current speed and load conditions versus the previous, while never achieving
a steady state temp. Based on this varied response, no set temperature matrix was identified to use
during future replicated driving cycle testing. Since data varied over such a wide range of operation
and ambient temperatures, a temperature of approximately 79.4 °C (175 °F) was identified as an
average representative temperature for typical MTV operation. This temperature was a common
approximate median temperature across the wide range of recorded conditions, as well as specific
axle location. As such it was selected as a good test temperature for use in efficiency comparisons.
90.00
90.50
91.00
91.50
92.00
92.50
93.00
93.50
94.00
94.50
95.00
Trans_05r Trans_10r Trans_15r Trans_20r Trans_25r Trans_30r Trans_35r Trans_55r
Effic
ienc
y, [%
]
Step
Modified Temperature Setpoints
75W90 R3
75W90 R4
75W90 R5
75W90 R6
75W90 R7
75W90 R8
75W90 R9 (TEMP MOD)
75W90 R10 (TEMP MOD)
173°F 200°F 220°F

UNCLASSIFIED
UNCLASSIFIED 12
Figure 8 shows a representative plot of axle temperature response for the MTV under the transient
driving cycle during ambient air temperatures of nominally 29.4 °C (85 °F) to 35 °C (95 °F). For
nearly all testing, the front and rearmost axle of the MTV tended to show similar temperatures,
while the intermediate axle, which is also a power pass through to the rear axle, tended to run at a
higher temperature.
. Typical MTV Axle Temperature Response
4.2 EFFICIENCY MAPPING
After initial driving cycle replication results were reviewed, consideration was given as to what
direction the development path should then take. If the primary goal was to create a laboratory
based test that mimicked the exact results of the SAE J1321 city and highway driving cycles,
weighted averages of each of the replicated driving cycles operating points based on the duration
of time that the vehicle operated in them could be easily calculated, and the preliminary results
suggested that the test would likely predict realistic vehicle results. However for the results to be
applicable to real world field use, the driving cycle being replicated should be representative of
real world operation. Confidence in this was less clear. All of the operating points derived from
05101520253035404550556065707580859095100105110115120125130135140145150
75
85
95
105
115
125
135
145
155
165
175
185
195
205
215
225
235
245
0:00
:00
0:02
:22
0:04
:44
0:07
:06
0:09
:28
0:11
:50
0:14
:12
0:16
:34
0:18
:56
0:21
:18
0:23
:40
0:26
:02
0:28
:24
0:30
:46
0:33
:08
0:35
:30
0:37
:52
0:40
:14
0:42
:36
0:44
:58
0:47
:20
0:49
:42
0:52
:04
0:54
:26
0:56
:48
0:59
:10
1:01
:32
1:03
:54
1:06
:16
1:08
:38
1:11
:00
1:13
:22
1:15
:44
1:18
:06
1:20
:28
1:22
:50
1:25
:12
1:27
:34
1:29
:56
1:32
:18
1:34
:40
1:37
:02
1:39
:24
1:41
:46
Vehi
cle
Spee
d [m
ph]
Tem
pera
ture
[°F]
MTV Axle Temperature ResponseInterOilT
RearAxleOilT
FrtAxleT
AmbientT
Calculated Vehicle Speed

UNCLASSIFIED
UNCLASSIFIED 13
the MTV driving cycle consisted of relatively low input loads, with all of the points being
essentially less than 135Nm (100lbft) of input pinion torque. As the MTV’s engine peaks at around
8 times that level of torque (without considering torque multiplication of the torque convertor and
transmission gear ratios), a test cycle with that low of input torque levels was not expected to have
the ability to accurately predict a more varied real world operational cycle. As a result, it was
determined that additional investigation into how the axle reacted over a wider range of input
loading conditions would be beneficial, and that a final efficiency test cycle should include higher
load operating conditions. This would ensure a greater confidence that predicted efficiency results
from the test stand could be realized during real world operation.
To determine what other speed and load points should be used in a final efficiency test cycle, an
efficiency mapping exercise was devised to investigate and document the MTV axle’s response
over a wide range of conditions. In order to ensure that the efficiency test did not turn into a
hardware durability test, it was decided that the maximum pinion input load would be limited to
677Nm (500lbft). This was based on what was expected to be approximately 50% of the maximum
torque the powertrain package could deliver to the a single rear axle under peak operating
conditions (This value was estimated based on the engines maximum peak torque output,
multiplied by the transmissions typical 2nd gear starting ratio, and then factored by the advertised
torque split front to rear of the vehicle). This was expected to be within the capabilities of the axle
where durability would not be effected, and efficiency response would remain stable.
Prior to the mapping exercise, a secondary break-in cycle was conducted to run-in the axle up to
the new maximum input load, as additional break-in of the axle was expected during higher load
operation. After completion, efficiency mapping was conducted for each of the three
developmental oils. Maps were created for several axle gear oil temperatures to establish the
consistency of temperature impact. Figure 9, Figure 10, and Figure 11 show the resulting efficiency
maps at a gear oil temperature of 79.4 °C (175 °F) (Note, the dotted line overlay at the bottom of
the map represents the original operating points of the vehicle driving cycle).

UNCLASSIFIED
UNCLASSIFIED 14
. MTV Efficiency Map – 80W-90
. MTV Efficiency Map – 75W-90

UNCLASSIFIED
UNCLASSIFIED 15
. MTV Efficiency Map – 75W-140
From these maps it is apparent how the resulting efficiencies differ based on the oil being
evaluated. The 75W-90 fluid shows improved efficiencies over the full range of operating
conditions compared to the baseline 80W-90 fluid. This is consistent with the earlier stationary
axle test stand results and the full scale vehicle testing. For the 75W-140, the map revealed greater
detail into how its efficiency either improved or reduced based on specific operating conditions.
For a large portion of the low to mid speed and high load conditions, the 75W-140 shows improved
efficiency over both the baseline 80W-90 and the 75W-90. However at the low loads and especially
high speeds, the 75W-140 suffers showing efficiencies below both other oils. This response from
the 75W-140 is attributed to its viscosity profile. At the higher loads and low speeds when the gear
mesh would be expected to be mostly effected by mixed or boundary lubrication, the higher
viscosity of the 75W-140 results in an increased film thickness that aids in reducing gear mesh
friction and improved efficiency. However as the load decreases and speed increases, churning
losses in the differential become a large driver and the 75W-140’s higher viscosity becomes a
detriment. This shows how dependent on operating conditions, the ranking of these oils in terms
of efficiency could vary.

UNCLASSIFIED
UNCLASSIFIED 16
Additional efficiency maps were conducted at 65.5 °C (150 °F), 93.3 °C (200 °F), and 107.2 °C
(225 °F) to further understand the temperature impact. These plots are included in Appendix A for
reference.
4.3 PROPOSED FEDERAL TEST METHOD CYCLE (MTV)
Based on the findings from the efficiency maps, new test points were identified for inclusion into
the final efficiency test cycle for the MTV axle. To limit the growth of the overall test cycle, the
existing drive cycle replication points were also reviewed to determine their necessity in the final
test cycle. It was desired that the resulting test cycle would be able to capture the full spectrum of
efficiency response that the MTV axle exhibited, so points were identified and selected between
the original driving cycle and efficiency map results to coincide with the major efficiency islands
present in the axle operation. Based on these criteria, the following points shown in Table 5 were
proposed for the FTM cycle for the MTV axle. They are also shown graphically in Figure 12,
overlaid on the baseline 80W-90 efficiency map. For the proposed or draft FTM cycle, the points
were arranged in an order of decreasing power. Based on the previous temperature investigation
and vehicle data, it was decided that the target differential oil temperature would continue to be
79.4 °C (175 °F).
Table 5. Proposed Federal Test Method Conditions for MTV Axle
Step Approximate Vehicle Velocity
Pinion Input Speed [rpm] Pinion Input Load Approximate Input
Power Differential Temperature
1 40kph (25mph) 1,469 610Nm (450lbft) 94kW (126hp)
79.4 °C (175 °F)
2 56kph (35mph) 2,033 338Nm (250lbft) 72kW (97hp) 3 40kph (25mph) 1,469 440Nm (325lbft) 68kW (91hp) 4 72kph (45mph) 2,600 237Nm (175lbft) 65kW (87hp) 5 24kph (15mph) 865 542Nm (400lbft) 49kW (66hp) 6 88kph (55mph) 3,207 141Nm (104lbft) 48kW (64hp) 7 56kph (35mph) 2,033 91Nm (67lbft) 19kW (26hp) 8 40kph (25mph) 1,469 73Nm (54lbft) 11kW (15hp) 9 24kph (15mph) 865 61Nm (45lbft) 5kW (7hp) 10 8kph (5mph) 294 108Nm (80lbft) 4kW (5hp)

UNCLASSIFIED
UNCLASSIFIED 17
. MTV Efficiency Map, 80W-90, Proposed FTM Point Overlay
With the proposed test points identified, evaluations were conducted for each of the three oils to
measure efficiency response. Figure 13 and Figure 14 show the plotted results for the 75W-90 and
75W-140 versus the baseline 80W-90.

UNCLASSIFIED
UNCLASSIFIED 18
. MTV Efficiency Results – Proposed FTM – 75W-90
. MTV Efficiency Results – Proposed FTM – 75W-140
90.00
90.50
91.00
91.50
92.00
92.50
93.00
93.50
94.00
94.50
95.00
95.50
96.00
96.50
97.00
97.50
98.00
Effic
ienc
y, [%
]
Step
Average Efficiency, per Test Run
80W90 R1
80W90 R2
80W90 R3
80W90 R4
80W90 R5
80W90 R6
75W90 R1
75W90 R2
75W90 R3
75W90 R4
75W90 R5
75W90 R6
90.00
90.50
91.00
91.50
92.00
92.50
93.00
93.50
94.00
94.50
95.00
95.50
96.00
96.50
97.00
97.50
98.00
Effic
ienc
y, [%
]
Step
Average Efficiency, per Test Run
80W90 R1
80W90 R2
80W90 R3
80W90 R4
80W90 R5
75W140 R1
75W140 R2
75W140 R3
75W140 R4
75W140 R5
UNCLASSIFIED
UNCLASSIFIED 19
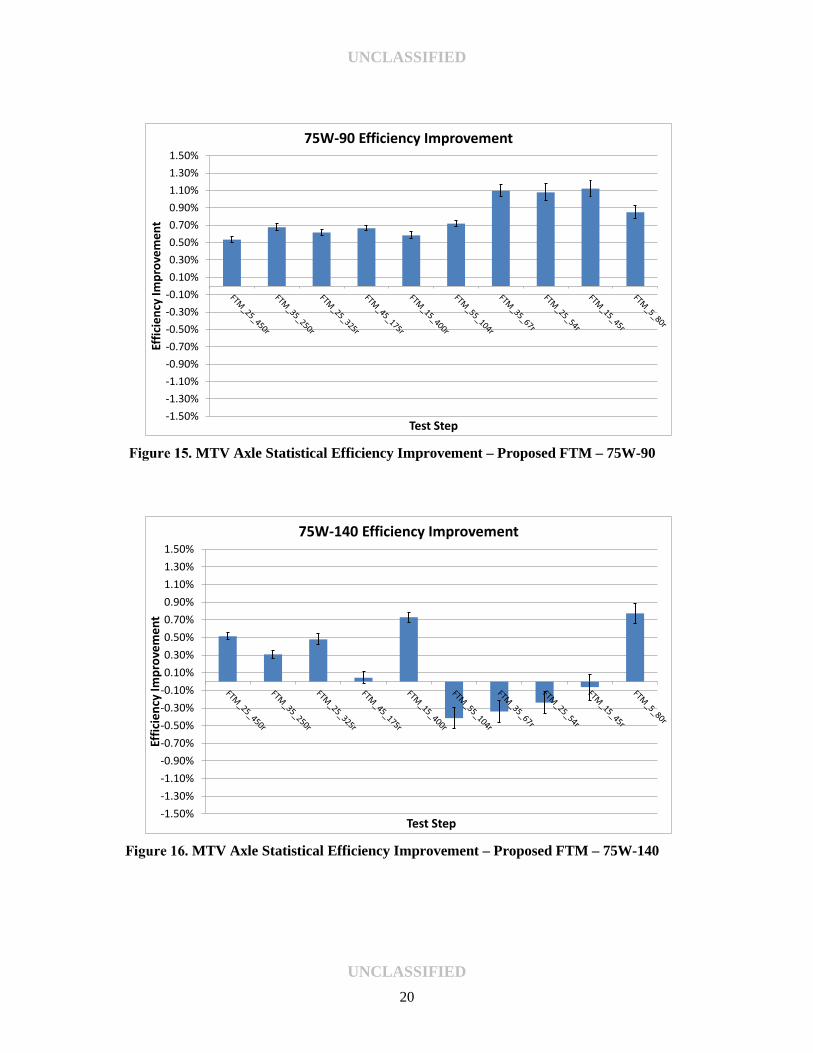
The 75W-90 continued to show improved efficiency over the 80W-90 at all operating conditions
using the new FTM operating points. However the 75W-140 now showed its propensity to
improve, decrease, or match the 80W-90 efficiency based on the particular operating conditions.
With this greater diversity in the test cycle, a more applicable weighting system could be developed
to predict resulting real world efficiency changes. It is also worth noting that the visual grouping
of the data for each oil appeared to be tighter and more repeatable than what was seen in the earlier
lighter load vehicle cycle replication runs. This is a result of the initial stand improvement efforts,
and improved control consistency with the higher load operation.
Statistical analysis was then conducted to establish the statistical significance in the changes
between each oil with regards to the stands repeatability. The statistical approach was as follows.
First, the variance for each oil’s data set was calculated. This variance was then used in a statistical
F-test model to determine if the variances between the two compared data sets could be considered
equal. Based on that result, two different T-test models (one for variances equal, and one for
unequal) were used to calculate the differences in means between the two compared oils, and
establish upper and lower 95% confidence interval bounds. These values were calculated for each
operating condition of the FTM cycle. Figure 15 and Figure 16 show the plotted improvement of
each of the oils along with the confidence intervals.
UNCLASSIFIED
UNCLASSIFIED 20
. MTV Axle Statistical Efficiency Improvement – Proposed FTM – 75W-90
. MTV Axle Statistical Efficiency Improvement – Proposed FTM – 75W-140
-1.50%-1.30%-1.10%-0.90%-0.70%-0.50%-0.30%-0.10%0.10%0.30%0.50%0.70%0.90%1.10%1.30%1.50%
Effic
ienc
y Im
prov
emen
t
Test Step
75W-90 Efficiency Improvement
-1.50%-1.30%-1.10%-0.90%-0.70%-0.50%-0.30%-0.10%0.10%0.30%0.50%0.70%0.90%1.10%1.30%1.50%
Effic
ienc
y Im
prov
emen
t
Test Step
75W-140 Efficiency Improvement
UNCLASSIFIED
UNCLASSIFIED 21
The efficiency response of the 75W-90 ranged from +0.5% to just over +1.1% improvement at all
operating points. Results are clearly statistically significant, with the resulting confidence intervals
being +/- 0.1% or less for all conditions. For the 75W-140, improvement ranged from +0.3% to
just over +0.7% for the more highly loaded or extreme low speed points, and detriments ranged
from approximately -0.2% to -0.4% where low loads or high speeds were prevalent. Although
measured efficiency response was slightly more varied in the 75W-140, results for all but two of
the operating points showed statistically significant difference in efficiency from the baseline
80W-90. At the completion of these tests the MTV hardware was removed from the test stand and
the HMMWV hardware was installed to investigate light duty hardware performance.
5.0 HMMWV AXLE TEST DEVELOPMENT
Similar to the work conducted on the MTV hardware, the HMMWV rear differential was used to
determine efficiency response of light-duty hardware used by the U.S. Army. The following
sections outline the overall development process using the HMMWV hardware, starting with a
description of the hardware and specifics of its installation, differential oil temperature
investigation, efficiency mapping, and proposed FTM operating conditions for the light duty
hardware.
(NOTE: at the completion of the MTV development work, a new batch of 80W-90
baseline oil was introduced to the stand as LO272251. As confirmed by later checks
with the MTV axle reinstalled, no changes in performance were identified between
the new baseline batch and the previous LO246580 batch. For all developmental
testing reported for the HMMWV axle, the baseline 80W-90 was the LO272251
batch).

UNCLASSIFIED
UNCLASSIFIED 22
5.1 HMMWV AXLE INSTALLATION DETAILS
For the HMMWV, the complete rear axle consists of a separate center differential housing, two
constant velocity (CV) shafts, and left and right wheel end reduction hubs. This general
configuration is the same at both the front and rear of the HMMWV. To set the axle arrangement
up on the stationary axle test stand, a structural frame was built to locate and support all
components in their correct relative locations. Figure 17 shows an overhead shot of the structural
frame constructed. The frame was built in such a way as to facilitate the removal and replacement
of each component as required, specifically pertaining to the differential housing, so that
components could be easily replaced to support a wide range of potential testing.
. HMMWV Axle Installation
For differential temperature control, the center differential housing was plumbed into the same
heater control loop constructed for the MTV axle. The suction/supply side of the loop was plumbed
to the lower differential housing drain port, and the return side of the loop was plumbed to the
differential housings fill port consistent with the MTV axle plumbing. No other changes were
made to the control loops hardware or configuration for this installation. For the M1151A1 version
of the HMMWV tested in this program, the rearmost differential included a factory rear differential
cover that incorporated a small liquid heat exchanger internal to the differential housing. In the
HMMWV, this heat exchanger is then plumbed to the coolant system and is used to control the
differential gear oil temperate during operation. Although the heat exchanger was present in the
tested differential housing, no cooling medium was supplied, and all temperature control was
provided with the test stands heater control loop. (Note: the front differential of the HMMWV, as

UNCLASSIFIED
UNCLASSIFIED 23
well as the rear differentials for earlier model HMMWV’s do not have integrated cooling. They
rely solely on forced convection from air cooling)
Since the wheel reduction hubs and center differential are not housed in a common system, each
wheel end hub contained its own oil sump for lubrication. For all of the HMMWV testing the
wheel end hubs were filled with the baseline 80W-90 gear oil, thus all changes in measured
efficiency during testing were specific to the differential assembly only. In addition, the
temperature of the wheel end hubs were not directly controlled during testing, apart from two small
cooling fans positioned underneath the stand to provide a nominal level of cooling.
Similar to those constructed for the MTV, special output hubs where fabricated to mount the output
torque flanges to wheel end reduction hub’s wheel mounting flange. In addition, the output torque
flanges were replaced from the MTV’s 3kNm range down to a lower 2kNm range to help support
better measurement resolution for the lower operating loads of the HMMWV hardware. For the
input torque flange, the same 1kNm input torque flange used on the MTV axle was used. However
for the HMMWV, it was relocated in between the input motor drive flange and input driveshaft as
opposed to being mounted directly at the differential. This was done so that the input driveshaft
could directly couple to the differential pinions factory universal joint input yoke, which could not
be modified in a satisfactory manner to allow the direct mounting of the input torque meter. Apart
from input and output guard changes adapted to the smaller HMMWV axle, the remainder of the
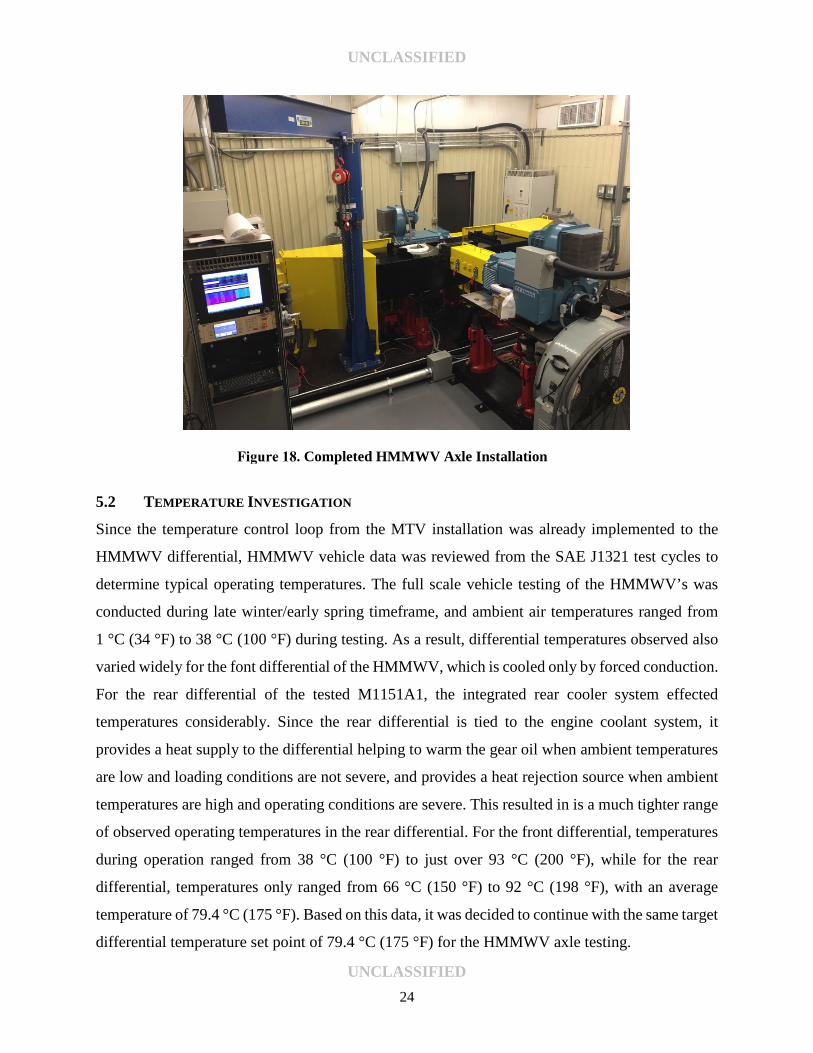
stand used the same configuration as the MTV axle. Figure 18 shows the completed installation of
the HMMWV axle on the stationary axle efficiency test stand.
UNCLASSIFIED
UNCLASSIFIED 24
. Completed HMMWV Axle Installation
5.2 TEMPERATURE INVESTIGATION
Since the temperature control loop from the MTV installation was already implemented to the
HMMWV differential, HMMWV vehicle data was reviewed from the SAE J1321 test cycles to
determine typical operating temperatures. The full scale vehicle testing of the HMMWV’s was
conducted during late winter/early spring timeframe, and ambient air temperatures ranged from
1 °C (34 °F) to 38 °C (100 °F) during testing. As a result, differential temperatures observed also
varied widely for the font differential of the HMMWV, which is cooled only by forced conduction.
For the rear differential of the tested M1151A1, the integrated rear cooler system effected
temperatures considerably. Since the rear differential is tied to the engine coolant system, it
provides a heat supply to the differential helping to warm the gear oil when ambient temperatures
are low and loading conditions are not severe, and provides a heat rejection source when ambient
temperatures are high and operating conditions are severe. This resulted in is a much tighter range
of observed operating temperatures in the rear differential. For the front differential, temperatures
during operation ranged from 38 °C (100 °F) to just over 93 °C (200 °F), while for the rear
differential, temperatures only ranged from 66 °C (150 °F) to 92 °C (198 °F), with an average
temperature of 79.4 °C (175 °F). Based on this data, it was decided to continue with the same target
differential temperature set point of 79.4 °C (175 °F) for the HMMWV axle testing.

UNCLASSIFIED
UNCLASSIFIED 25
5.3 BREAK-IN
Prior to efficiency testing the HMMWV differential was operated on a break-in cycle to ensure
that differential efficiency response was stabilized prior to testing. The break-in cycle was
developed to operate the HMMWV over its full range of input speed correlating with 5mph to
55mph vehicle speed. Similar to the MTV mapping exercise where an upper input torque limit was
defined, a reduced maximum HMMWV input torque was established to ensure its durability was
maintained. 339Nm (250lbft) was identified as approximately 50% of the maximum possible
sustained load that could be supplied to the single axle by the HMMWV’s powertrain, and thus
was established as the maximum limit for input pinion torque for the light duty hardware (This
value was estimated based on the engines maximum peak torque output, multiplied by the
transmissions 1st gear ratio, high range transfer case ratio, and then factored by the advertised
torque split front to rear of the vehicle). The end of the run-in was determined by plotting the
resulting efficiency response versus time for the axle. Once the efficiency stabilized, the break-in
was terminated. Table 6 shows the operating conditions developed for the break-in cycle. One
complete pass through all 11 steps completed a single cycle. A total of 87 cycles were completed
before efficiency was observed to stabilize. This was equivalent to approximately 43hrs of
continuous operation, or a total of just over 1,600 accumulated miles. (Note, in general the axle is
expected to experience additional break-in with continued operation over a large portion of its life.
The run-in conducted for this testing just ensures that gross initial break-in effects have stabilized
prior to efficiency testing.)

UNCLASSIFIED
UNCLASSIFIED 26
Table 6. HMMWV Axle Break-In Conditions
5.4 EFFICIENCY MAPPING
After break-in, development moved directly into efficiency mapping efforts. This was because
loading conditions for replicating the SAE J1321 drive cycle were not available. At the time of the
SAE J1321 testing, direct measurement of input pinion speed and load was outside of the scope
and budget for the project, and since the HMMWV has a mechanically controlled powertrain, CAN
data did not exist to use in estimating the loading conditions. For the HMMWV efficiency
mapping, the differential was operated from 5mph to 55mph over an input load of 34 Nm (25lbft)
to the established maximum of 339 Nm (250lbft) maximum to map efficiency response. Figure
19, Figure 20, and Figure 21 show the results of the efficiency mapping for the 80W-90, 75W-90,
and 75W-140 oils respectively. All mapping was conducted at the controlled differential fluid
temperature of 79.4 °C (175 °F).
Pinion Speed Input Load DurationApproximate
Power[RPM] [lbft] [min] [hp]
warmup 2417.00 150 Condition Based 6955 2954.79 200 2 11350 2686.17 100 4 5145 2417.56 250 2 11540 2148.94 50 4 2035 1880.32 150 2 5430 1611.70 75 4 2325 1343.09 250 2 6420 1074.47 50 4 1015 805.85 200 2 3110 537.23 100 4 105 268.62 150 2 8

UNCLASSIFIED
UNCLASSIFIED 27
. HMMWV Efficiency Map – 80W-90
. HMMWV Efficiency Map – 75W-90

UNCLASSIFIED
UNCLASSIFIED 28
. HMMWV Efficiency Map – 75W-140
When scaled the same as the MTV maps, it was immediately observed that the overall efficiency
level of the HMMWV differential was much lower than the MTV axle. However, much of the
general efficiency trends between the oils observed in the MTV axle persisted in the HMMWV
axle. Overall the 75W-90 showed an improved efficiency response across the entire map compared
to the 80W-90, and the 75W-140 showed even greater gains than both the baseline 80W-90 and
75W-90 in loads greater than 100lbft. One distinct difference in response between the HMMWV
and MTV maps was the observed lack of efficiency loss at higher speeds and low loads with the
75W-140. Unlike the losses that appeared for the MTV axle in this area, churning losses in the
HMMWV differential as a result of increased viscosity didn’t appear as prominent. This was
attributed to overall differential oil capacity differences between the two axles. For the HMMWV,
oil capacity is approximately 1.9L (2qts), while the MTV has a capacity of approximately 13.2L
(3.5gal).

UNCLASSIFIED
UNCLASSIFIED 29
5.5 PROPOSED FEDERAL TEST METHOD CYCLE (HMMWV)
With the efficiency mapping data collected, investigation into proposed test points for an
efficiency test cycle began. Since driving cycle data from the SAE J1321 tests did not exist, other
sources of vehicle operating data was investigated for applicability. In previously identified work
supported by the U.S. Army TARDEC and Southwest Research Institute (SwRI), investigation
into HMMWV differential efficiency was conducted to determine effects of super-finished hypoid
gear sets for the HMMWV over a Peacetime – Operational Mode Summary/Mission Profile
(OMS/MP) [7]. In this work, detailed axle pinion loads and speeds for the HMMWV were
identified through use of vehicle simulation under a peacetime type operational duty cycle. As this
operational cycle was considered representative of typical military HMMWV use, this same data
set was revisited to determine applicability in defining points for an efficiency test cycle.
Figure 22 shows the plotted results for the differential input torque versus vehicle speed for the
Peace Time OMS/MP. The full set of operating points were trimmed to the core usable area for
the efficiency test, eliminating any vehicle speeds lower than 5mph, and any torque values higher
than 338Nm (250lbft) or less than zero (the simulation included possible downhill gradients where
engine braking occurred, resulting in negative pinion input torque). With the remaining data, the
input torque conditions were binned based on discrete vehicle speed and torque ranges to
determine the frequency of operation in a particular area. This identified the most common
occurring input loads and speeds. Table 7 shows the resulting input torque versus vehicle speed
frequency bins.

UNCLASSIFIED
UNCLASSIFIED 30
. HMMWV Peace Time Duty Cycle Differential Input Conditions
Table 7. HMMWV Peace Time Duty Cycle Torque/Speed Bins
From this data and the previous efficiency mapping data, 10 discrete speed and load points were
identified and proposed for the HMMWV FTM test cycle (see Table 8).
-100
0
100
200
300
400
500
0 10 20 30 40 50 60
Inpu
t Tor
que
[lbfr
]
Vehicle Speed [mph]
HMMWV Peace Time Duty Cycle, Differential Speed vs Input Torque
15 20 30 35 40 45 5025 57 116 13 17 15 0 2450 2 129 7 4 16 0 2175 5 24 11 3 8 0 32
100 4 14 9 6 18 0 34125 5 5 2 2 7 5 16150 8 0 10 2 4 7 11175 6 2 0 7 3 0 0200 6 1 2 1 0 0 0225 6 1 0 0 0 1 0250 1 1 0 0 0 0 0
Pini
on In
put T
orqu
e Bi
ns [l
bft]
Vehicle Speed Bins [mph]
UNCLASSIFIED
UNCLASSIFIED 31
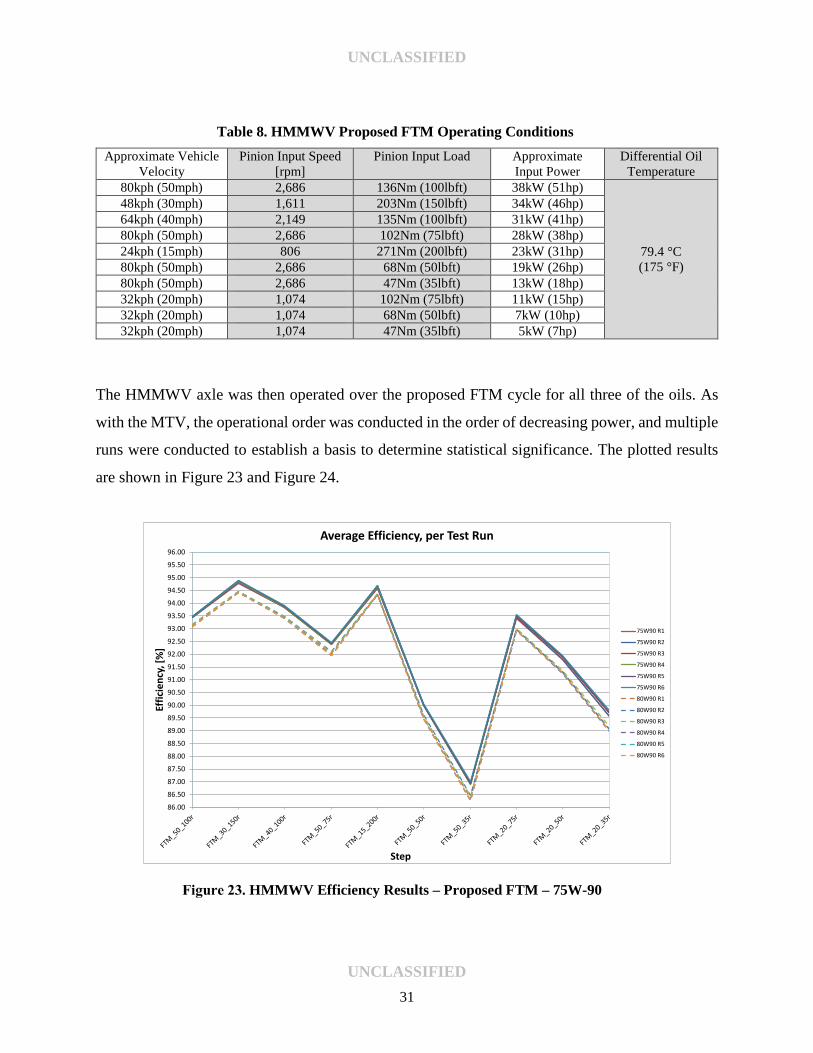
Table 8. HMMWV Proposed FTM Operating Conditions Approximate Vehicle
Velocity Pinion Input Speed
[rpm] Pinion Input Load Approximate
Input Power Differential Oil
Temperature 80kph (50mph) 2,686 136Nm (100lbft) 38kW (51hp)
79.4 °C (175 °F)
48kph (30mph) 1,611 203Nm (150lbft) 34kW (46hp) 64kph (40mph) 2,149 135Nm (100lbft) 31kW (41hp) 80kph (50mph) 2,686 102Nm (75lbft) 28kW (38hp) 24kph (15mph) 806 271Nm (200lbft) 23kW (31hp) 80kph (50mph) 2,686 68Nm (50lbft) 19kW (26hp) 80kph (50mph) 2,686 47Nm (35lbft) 13kW (18hp) 32kph (20mph) 1,074 102Nm (75lbft) 11kW (15hp) 32kph (20mph) 1,074 68Nm (50lbft) 7kW (10hp) 32kph (20mph) 1,074 47Nm (35lbft) 5kW (7hp)
The HMMWV axle was then operated over the proposed FTM cycle for all three of the oils. As
with the MTV, the operational order was conducted in the order of decreasing power, and multiple
runs were conducted to establish a basis to determine statistical significance. The plotted results
are shown in Figure 23 and Figure 24.
. HMMWV Efficiency Results – Proposed FTM – 75W-90
86.00
86.50
87.00
87.50
88.00
88.50
89.00
89.50
90.00
90.50
91.00
91.50
92.00
92.50
93.00
93.50
94.00
94.50
95.00
95.50
96.00
Effic
ienc
y, [%
]
Step
Average Efficiency, per Test Run
75W90 R1
75W90 R2
75W90 R3
75W90 R4
75W90 R5
75W90 R6
80W90 R1
80W90 R2
80W90 R3
80W90 R4
80W90 R5
80W90 R6

UNCLASSIFIED
UNCLASSIFIED 32
. HMMWV Proposed Efficiency Results – Proposed FTM – 75W-140
Statistical analysis was conducted on the HMMWV data to determine significance in results. The
plotted results showing efficiency improvement and resulting confidence interval at each point can
be seen in Figure 25 and Figure 26.
. HMMWV Axle Statistical Efficiency Improvement – Proposed FTM – 75W-90
86.00
86.50
87.00
87.50
88.00
88.50
89.00
89.50
90.00
90.50
91.00
91.50
92.00
92.50
93.00
93.50
94.00
94.50
95.00
95.50
96.00
Effic
ienc
y, [%
]
Step
Average Efficiency, per Test Run
75W140 R1
75W140 R2
75W140 R3
75W140 R4
75W140 R5
75W140 R6
80W90 R1
80W90 R2
80W90 R3
80W90 R4
80W90 R5
80W90 R6
-1.50%-1.30%-1.10%-0.90%-0.70%-0.50%-0.30%-0.10%0.10%0.30%0.50%0.70%0.90%1.10%1.30%1.50%
Effic
ienc
y Im
prov
emen
t
Test Step
75W90 - Efficiency Improvement

UNCLASSIFIED
UNCLASSIFIED 33
. HMMWV Axle Statistical Efficiency Improvement – Proposed FTM – 75W-140
The 75W-90 showed gains ranging from +0.3% to +0.6% improvement over the 80W-90 for all
operating conditions. Similar to the MTV testing, repeatability in the results was excellent, with
resulting confidence intervals of +/- 0.1% or less for each condition. For the 75W-140, results
ranged from approximately +0.15% to about +0.85% improvement, with confidence intervals
again being +/- 0.1% or less. This trended correctly with the data derived from the SAE J1321
testing. Also clearly evident is the impact of the 75W-140 on efficiency related to load. For the
highest 200lbft input pinion condition, the resulting efficiency improvement was the greatest
compared to all other points for both the 75W-90 and 80W-90.
6.0 Final Federal Test Method Development
With development completed for the MTV and HMMWV, focus shifted to defining the final draft
FTM. The following sections cover the down select rationale for the hardware selected for the
FTM, documentation of the desired test procedure, re-testing of the baseline and developmental
oils, and testing a selection of commercially available candidates to bolster the efficiency result
data base.
-1.50%-1.30%-1.10%-0.90%-0.70%-0.50%-0.30%-0.10%0.10%0.30%0.50%0.70%0.90%1.10%1.30%1.50%
Effic
ienc
y Im
prov
emen
t
Test Step
75W140 - Efficiency Improvement

UNCLASSIFIED
UNCLASSIFIED 34
(NOTE: at the completion of the HMMWV development work, a new batch of 80W-
90 baseline oil was introduced to the stand as LO330868. With this batch change,
some minor shift in baseline performance was identified between the new baseline
batch and the previous LO272251 and LO246580 batches. Changes in
performance were noted primarily at the low load operating points in the MTV
axle, yielding a slightly higher resulting efficiency at those point versus the previous
baseline data collected. For all testing reported from here out, the baseline 80W-
90 is the latest LO330868 batch).
6.1 HARDWARE DOWN-SELECT
The MTV axle was selected for the proposed final FTM based on the results from the
developmental process, and consideration of the test stand installation and representation in the
current military fleet. The rationale for this selection is as follows:
• The MTV axle utilizes a common oil sump for the differential and wheel end hub
reductions as opposed to the HMMWV’s separate wheel end reduction hubs. This provides
greater consistency, and ensures the entire axle system responds to changes in the lubricant
composition and/or operating conditions.
• The HMMWV, although currently numerous in the fleet, is an aging light tactical platform
with a replacement vehicle in development. HMMWV utilization and numbers in the fleet
are expected to see a marked reduction in the future.
• The MTV being the representative “medium” sized axle provides a good middle ground
approach for representing the wide range of military hardware currently fielded.
• Current and future “light” tactical vehicle hardware is approaching the same overall vehicle
size and weight (thus driveline hardware size) as the current medium tactical vehicle range,
thus the MTV axle should have good relevancy to future light tactical vehicles.

UNCLASSIFIED
UNCLASSIFIED 35
6.2 TEST PROCEDURE DOCUMENTATION
A draft FTM procedure was created to document the final testing procedure specific to the MTV
axle (See Appendix B). There were no significant changes made to the scope or procedure from
that followed during the earlier development process, apart from some minor adjustment to one of
the input operating speeds to attenuate an undesirable dynamic instability in the driveline
experienced during operation (35mph point changed from 2033rpm to 2100rpm). This change in
input pinion speed was referenced against the efficiency map prior to implementation, and was
noted to not represent any significant shift in the operating efficiency island that the point was
aimed to capture. Table 9 outlines the final operating conditions for the FTM.
Table 9. Final MTV Axle FTM Input Speed and Load Conditions
Step Approximate Vehicle Velocity
Pinion Input Speed [rpm] Pinion Input Load Approximate Input
Power Differential Temperature
1 40kph (25mph) 1,469 610Nm (450lbft) 94kW (126hp)
79.4 °C (175 °F)
2 56kph (35mph) 2,100 338Nm (250lbft) 75kW (100hp) 3 40kph (25mph) 1,469 440Nm (325lbft) 68kW (91hp) 4 72kph (45mph) 2,600 237Nm (175lbft) 65kW (87hp) 5 24kph (15mph) 865 542Nm (400lbft) 49kW (66hp) 6 88kph (55mph) 3,207 141Nm (104lbft) 48kW (64hp) 7 56kph (35mph) 2,100 91Nm (67lbft) 20kW (27hp) 8 40kph (25mph) 1,469 73Nm (54lbft) 11kW (15hp) 9 24kph (15mph) 865 61Nm (45lbft) 5kW (7hp) 10 8kph (5mph) 294 108Nm (80lbft) 4kW (5hp)
The following sections outline details regarding the double flush procedure used in changing
between tested fluids in the axle, the general efficiency test procedure, and calculations used in
data analysis.
6.2.1 Double Flush Fluid Change
A double flush procedure is used to ensure that a thorough changeover occurs between tested
lubricants. Samples pulled during the development process have demonstrated that changeover
efficiencies of the double flush procedure are in the high 90% range. The following steps pulled
from the proposed FTM outline the general procedure for a double flush:

UNCLASSIFIED
UNCLASSIFIED 36
1. If starting with the axle already drained, proceed to step 3. If starting with the axle
full, start the test stand and operate the axle at approximately 3200 rpm and 200 lbft
until the differential fluid temperature is ≥ 175 °F.
2. Next bring the test stand to a stop while keeping the fluid temperature elevated (i.e.,
do not apply cooling). Once stopped, drain the axle and heater control loop and
dispose of the drained fluid.
3. Ensure that the circulation pump is off, and position the three way valve at the rear
fill port of the axle to the vent position. Add fluid to the axle housing through the
upper vent port until the fluid level is even with the rear housing fill port (this is
noted by a trickle of fluid from the vented three way valve on the rear of the axle).
4. Move the three way valve at the rear fill port of the axle to the recirculation position,
and turn on the circulation pump and allow the fluid to flow through the heating
system for a minimum of 2 minutes to purge air from the heating system.
5. Turn off the circulation pump and reposition the three way valve at the rear fill port
of the axle to the vent position. Add fluid to the axle housing through the upper
vent port until the fluid level is topped off to the rear housing fill port level (this is
noted by a trickle of fluid from the vented three way valve on the rear of the axle).
6. Reposition the three way valve at the rear fill port of the axle back to the
recirculation position for testing.
7. Repeat steps 1 through 6 to complete the second flush.
6.2.2 General Efficiency Test Procedure
At the start of the testing a minimum of 5 baseline runs are conducted using the reference fluid to
determine baseline axle efficiency. The axle is then double flushed with the candidate axle gear
lubricant, and a minimum of 5 candidate runs are conducted following the same operating
procedure. At the completion of the candidate testing, the axle is double flushed back to the
reference lubricant, and an additional single baseline run is conducted using the reference oil to
determine test validity. The overall test is considered valid if the post-candidate reference run
UNCLASSIFIED
UNCLASSIFIED 37
returns data statistically equivalent to the pre-candidate reference runs. If valid, the pre-candidate
reference test data is compared to the candidate test data to determine the change in measured
efficiency of the axle. Combined statistical analysis is conducted on all of the reference and
candidate runs to determine efficiency change and confidence interval for each operating
condition. The general procedure for conducting a single run on the stationary axle efficiency test
stand is as follows:
1. Start the test stand and ramp the axle to step 1 test conditions (see Table 9) and hold
until the differential oil temperature reaches 175 °F +/- 1 °F.
2. Once the differential oil reaches temperature, progress the axle through the speed
and load points outlined in Table 9 while logging (at a minimum) input torque, left
and right output torque, input speed, output speed, and axle differential fluid
temperature.
3. Operation at each test condition of the FTM should consist of two sub-steps, first a
stabilization sub-step to allow the axle to stabilize at the specified test conditions,
then second a data recording sub-step.
4. During the stabilization sub-step, the axle should be operated at the specified test
condition in Table 9 for a minimum of 5 minutes, and the moving average of the
axle differential fluid temperature should be 175 +/- 0.25 °F before continuing to
the recording step. The moving average should be calculated over a 60 second
interval with a 1 second sample time. Overall data logging rate during the
stabilization step should be a minimum of 0.2 Hz (5 sec).
5. During the recording sub-step, the axle should be operated at the specified test
condition for 60 seconds at a logging rate of 2 Hz (0.5 sec). Once complete the axle
can be ramped to the next test condition for stabilization.
6. The axle should be operated through all 10 steps to complete 1 cycle. For each
individual test, 10 cycles should be completed for data averaging.
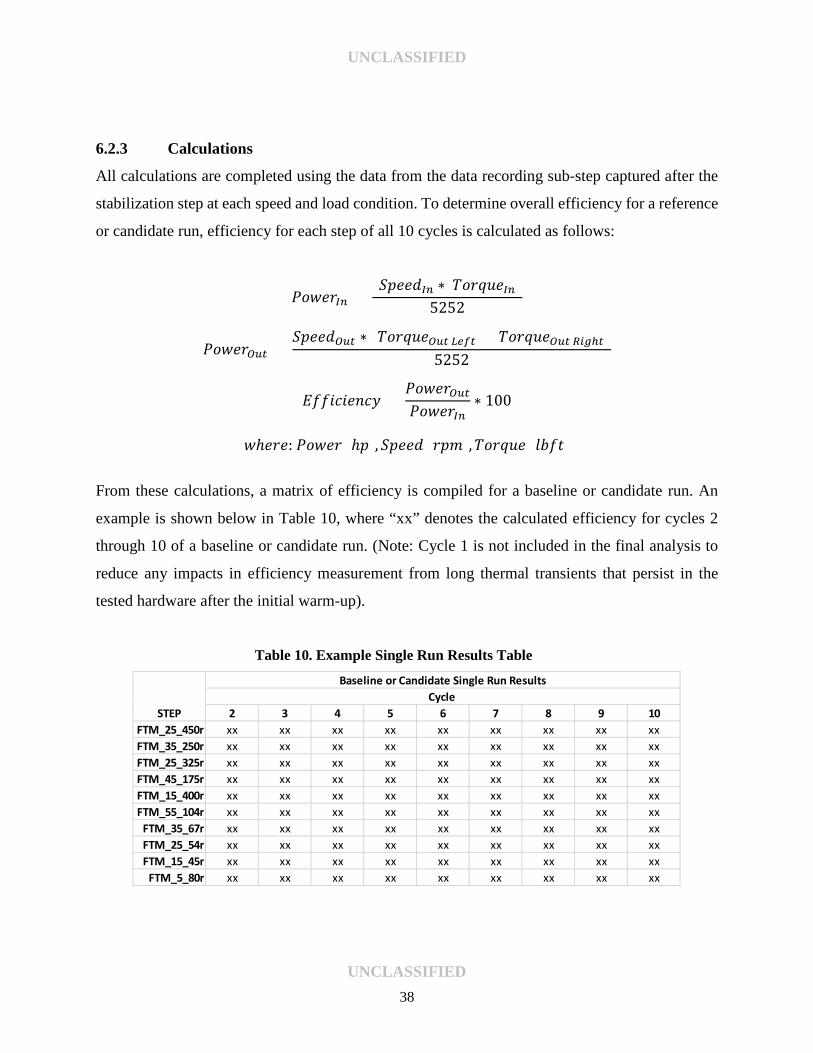
UNCLASSIFIED
UNCLASSIFIED 38
6.2.3 Calculations
All calculations are completed using the data from the data recording sub-step captured after the
stabilization step at each speed and load condition. To determine overall efficiency for a reference
or candidate run, efficiency for each step of all 10 cycles is calculated as follows:
𝑃𝑃𝑃𝑃𝑃𝑃𝑃𝑃𝑃𝑃𝐼𝐼𝐼𝐼 = (𝑆𝑆𝑆𝑆𝑃𝑃𝑃𝑃𝑆𝑆𝐼𝐼𝐼𝐼 ∗ 𝑇𝑇𝑃𝑃𝑃𝑃𝑇𝑇𝑇𝑇𝑃𝑃𝐼𝐼𝐼𝐼)
5252
𝑃𝑃𝑃𝑃𝑃𝑃𝑃𝑃𝑃𝑃𝑂𝑂𝑂𝑂𝑂𝑂 = 𝑆𝑆𝑆𝑆𝑃𝑃𝑃𝑃𝑆𝑆𝑂𝑂𝑂𝑂𝑂𝑂 ∗ (𝑇𝑇𝑃𝑃𝑃𝑃𝑇𝑇𝑇𝑇𝑃𝑃𝑂𝑂𝑂𝑂𝑂𝑂 𝐿𝐿𝐿𝐿𝐿𝐿𝑂𝑂 + 𝑇𝑇𝑃𝑃𝑃𝑃𝑇𝑇𝑇𝑇𝑃𝑃𝑂𝑂𝑂𝑂𝑂𝑂 𝑅𝑅𝑅𝑅𝑅𝑅ℎ𝑂𝑂)
5252
𝐸𝐸𝐸𝐸𝐸𝐸𝐸𝐸𝐸𝐸𝐸𝐸𝑃𝑃𝑒𝑒𝐸𝐸𝑒𝑒 = 𝑃𝑃𝑃𝑃𝑃𝑃𝑃𝑃𝑃𝑃𝑂𝑂𝑂𝑂𝑂𝑂𝑃𝑃𝑃𝑃𝑃𝑃𝑃𝑃𝑃𝑃𝐼𝐼𝐼𝐼
∗ 100
𝑃𝑃ℎ𝑃𝑃𝑃𝑃𝑃𝑃: 𝑃𝑃𝑃𝑃𝑃𝑃𝑃𝑃𝑃𝑃 [ℎ𝑆𝑆], 𝑆𝑆𝑆𝑆𝑃𝑃𝑃𝑃𝑆𝑆 [𝑃𝑃𝑆𝑆𝑟𝑟],𝑇𝑇𝑃𝑃𝑃𝑃𝑇𝑇𝑇𝑇𝑃𝑃 [𝑙𝑙𝑙𝑙𝐸𝐸𝑙𝑙]
From these calculations, a matrix of efficiency is compiled for a baseline or candidate run. An
example is shown below in Table 10, where “xx” denotes the calculated efficiency for cycles 2
through 10 of a baseline or candidate run. (Note: Cycle 1 is not included in the final analysis to
reduce any impacts in efficiency measurement from long thermal transients that persist in the
tested hardware after the initial warm-up).
Table 10. Example Single Run Results Table
2 3 4 5 6 7 8 9 10FTM_25_450r xx xx xx xx xx xx xx xx xxFTM_35_250r xx xx xx xx xx xx xx xx xxFTM_25_325r xx xx xx xx xx xx xx xx xxFTM_45_175r xx xx xx xx xx xx xx xx xxFTM_15_400r xx xx xx xx xx xx xx xx xxFTM_55_104r xx xx xx xx xx xx xx xx xx
FTM_35_67r xx xx xx xx xx xx xx xx xxFTM_25_54r xx xx xx xx xx xx xx xx xxFTM_15_45r xx xx xx xx xx xx xx xx xx
FTM_5_80r xx xx xx xx xx xx xx xx xx
Cycle Baseline or Candidate Single Run Results
STEP

UNCLASSIFIED
UNCLASSIFIED 39
The composite result for a single baseline or candidate run is then calculated by taking the average
efficiency over cycles 2 through 10 for each step of the individual run. An example, a composite
result table for a single run is shown in Table 11.
Table 11. Example Composite Single Run Result Table
A minimum of 5 composite runs must be conducted for each baseline or candidate test. After all 5
composite runs are completed, a baseline or candidate composite result table can be formed. An
example is shown Table 12.
Table 12. Example Baseline/Candidate Composite Result Table
Once a composite result table for the baseline and candidate oil has been established, statistical
analysis can be conducted to determine overall efficiency change and confidence interval for each
STEP Run #FTM_25_450r xxFTM_35_250r xxFTM_25_325r xxFTM_45_175r xxFTM_15_400r xxFTM_55_104r xx
FTM_35_67r xxFTM_25_54r xxFTM_15_45r xx
FTM_5_80r xx
Baseline or Candidate Run Composite Result
Run 1 Run 2 Run 3 Run 4 Run 5FTM_25_450r xx xx xx xx xxFTM_35_250r xx xx xx xx xxFTM_25_325r xx xx xx xx xxFTM_45_175r xx xx xx xx xxFTM_15_400r xx xx xx xx xxFTM_55_104r xx xx xx xx xx
FTM_35_67r xx xx xx xx xxFTM_25_54r xx xx xx xx xxFTM_15_45r xx xx xx xx xx
FTM_5_80r xx xx xx xx xx
STEPBaseline or Candidate Test Result

UNCLASSIFIED
UNCLASSIFIED 40
operating condition. For both the baseline and candidate test composite result table, calculate the
mean, standard deviation, and variance for each individual operating condition.
Table 13. Statistical Analysis Table
For each step, conduct an F-Test to determine if the baseline and candidate tests have equal
variances. Based on the results of F-Test, conduct an appropriate T-Test for each step between the
baseline and candidate test to establish the statistical significance (95% confidence interval) of the
difference in means. Final results should be complied in a single table as shown below.
Table 14. Example Final Results Table
Mean Std Dev Variance Mean Std Dev VarianceFTM_25_450r xx xx xx xx xx xxFTM_35_250r xx xx xx xx xx xxFTM_25_325r xx xx xx xx xx xxFTM_45_175r xx xx xx xx xx xxFTM_15_400r xx xx xx xx xx xxFTM_55_104r xx xx xx xx xx xx
FTM_35_67r xx xx xx xx xx xxFTM_25_54r xx xx xx xx xx xxFTM_15_45r xx xx xx xx xx xx
FTM_5_80r xx xx xx xx xx xx
STEPBaseline Candidate
% changeStatistically Significant?
Confidence Interval
FTM_25_450r xx Y/N ± xxFTM_35_250r xx Y/N ± xxFTM_25_325r xx Y/N ± xxFTM_45_175r xx Y/N ± xxFTM_15_400r xx Y/N ± xxFTM_55_104r xx Y/N ± xx
FTM_35_67r xx Y/N ± xxFTM_25_54r xx Y/N ± xxFTM_15_45r xx Y/N ± xx
FTM_5_80r xx Y/N ± xx
STEP
Candidiate Improvement

UNCLASSIFIED
UNCLASSIFIED 41
6.3 FINAL TEST RESULTS
Using the proposed final FTM procedure, a full matrix of efficiency tests were initiated. This
included baseline segments between each individual FEGO candidate, and the FEGO candidates
included the developmental 75W-90 and 75W-140, as well as second 75W-90 from an alternate
supplier, a 75W-85, and a 75W-110 product. The following sections outline the chemical and
physical properties for each oil, and the final efficiency results for each.
6.3.1 Baseline and FEGO Chemical & Physical Analysis
Table 15 contains the basic chemical and physical properties of the baseline and candidate gear
oils tested in the final matrix. Shown is the elemental analysis which gives some indication of the
additive pack differences between oils, as well as measured viscosity at 40 °C (104 °F) and 100 °C
(212 °F), and calculated viscosity at the operating temperature of 79.4 °C (175 °F). Based on the
chemical and physical properties and the actual efficiency results that follow, it is identified that
the efficiency of the MTV axle is not only a singular viscosity response, and that additive chemistry
also plays an important role in resulting efficiency (Reference 6.3.2 and 6.3.4 which tested two
different formulations of a 75W-90 product with different resulting efficiencies).
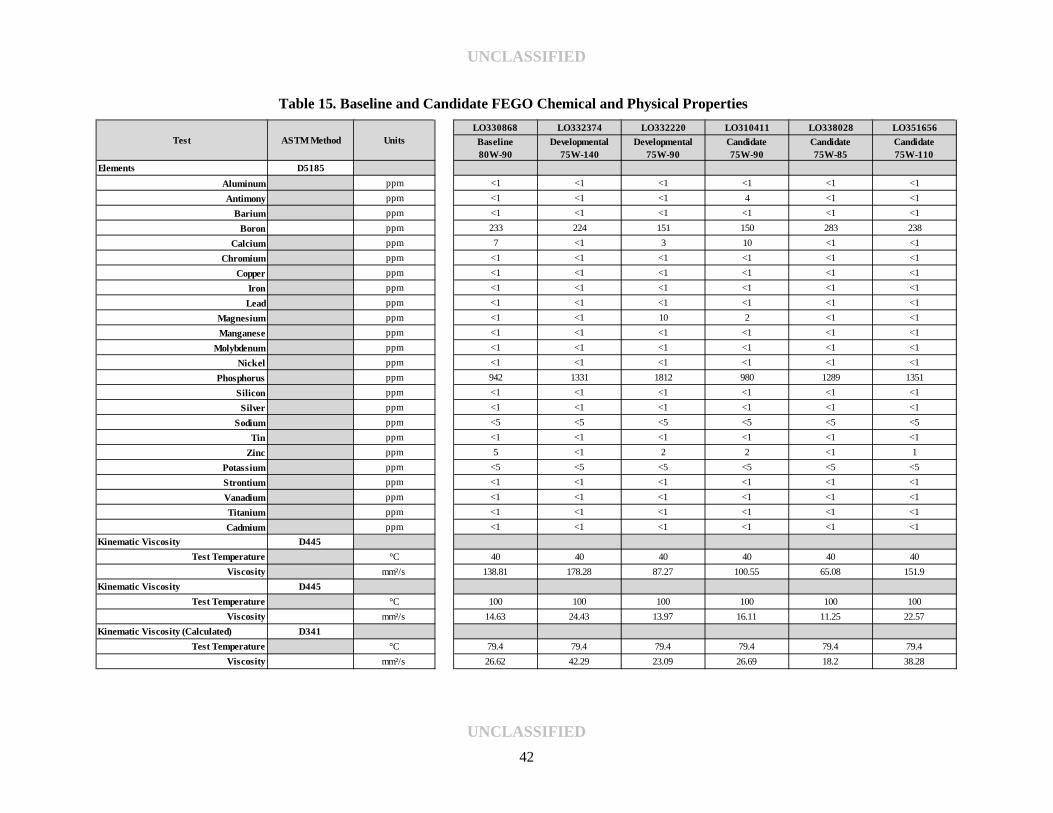
UNCLASSIFIED
UNCLASSIFIED 42
Table 15. Baseline and Candidate FEGO Chemical and Physical Properties LO330868 LO332374 LO332220 LO310411 LO338028 LO351656Baseline 80W-90
Developmental 75W-140
Developmental 75W-90
Candidate 75W-90
Candidate 75W-85
Candidate 75W-110
Elements D5185Aluminum ppm <1 <1 <1 <1 <1 <1Antimony ppm <1 <1 <1 4 <1 <1
Barium ppm <1 <1 <1 <1 <1 <1Boron ppm 233 224 151 150 283 238
Calcium ppm 7 <1 3 10 <1 <1Chromium ppm <1 <1 <1 <1 <1 <1
Copper ppm <1 <1 <1 <1 <1 <1Iron ppm <1 <1 <1 <1 <1 <1Lead ppm <1 <1 <1 <1 <1 <1
Magnesium ppm <1 <1 10 2 <1 <1Manganese ppm <1 <1 <1 <1 <1 <1
Molybdenum ppm <1 <1 <1 <1 <1 <1Nickel ppm <1 <1 <1 <1 <1 <1
Phosphorus ppm 942 1331 1812 980 1289 1351Silicon ppm <1 <1 <1 <1 <1 <1Silver ppm <1 <1 <1 <1 <1 <1
Sodium ppm <5 <5 <5 <5 <5 <5Tin ppm <1 <1 <1 <1 <1 <1
Zinc ppm 5 <1 2 2 <1 1Potassium ppm <5 <5 <5 <5 <5 <5Strontium ppm <1 <1 <1 <1 <1 <1Vanadium ppm <1 <1 <1 <1 <1 <1Titanium ppm <1 <1 <1 <1 <1 <1Cadmium ppm <1 <1 <1 <1 <1 <1
Kinematic Viscosity D445Test Temperature °C 40 40 40 40 40 40
Viscosity mm²/s 138.81 178.28 87.27 100.55 65.08 151.9Kinematic Viscosity D445
Test Temperature °C 100 100 100 100 100 100Viscosity mm²/s 14.63 24.43 13.97 16.11 11.25 22.57
Kinematic Viscosity (Calculated) D341Test Temperature °C 79.4 79.4 79.4 79.4 79.4 79.4
Viscosity mm²/s 26.62 42.29 23.09 26.69 18.2 38.28
Test ASTM Method Units
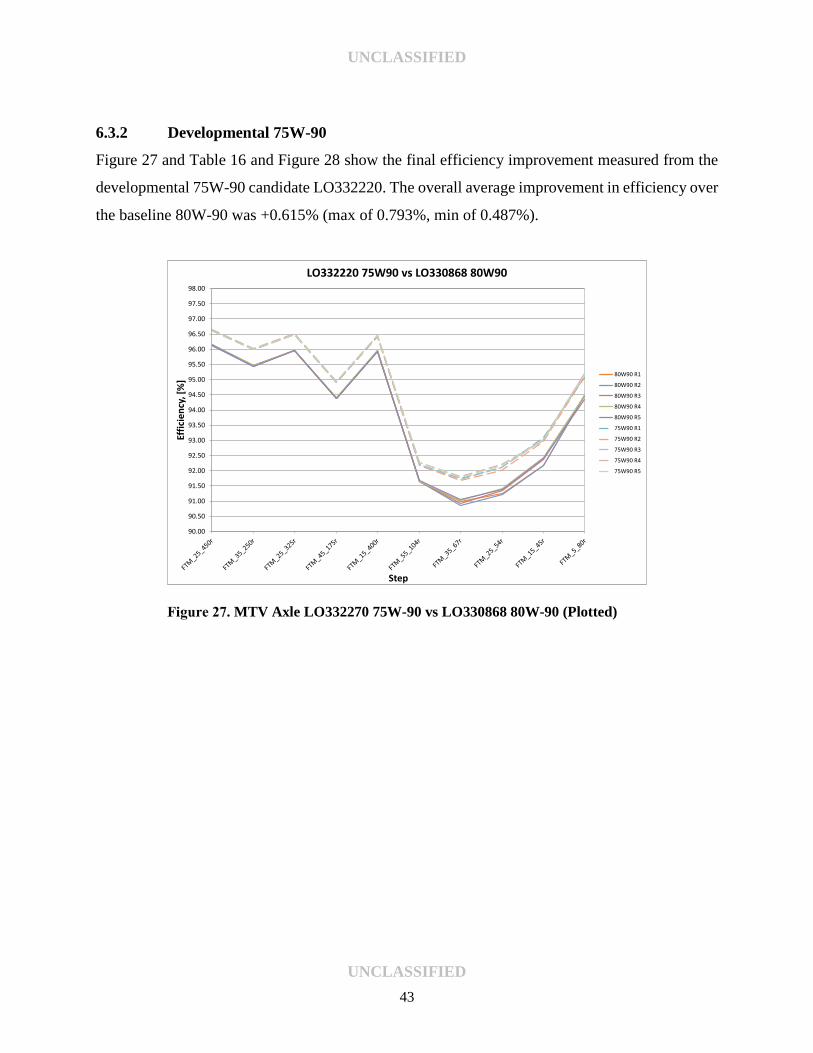
UNCLASSIFIED
UNCLASSIFIED 43
6.3.2 Developmental 75W-90
Figure 27 and Table 16 and Figure 28 show the final efficiency improvement measured from the
developmental 75W-90 candidate LO332220. The overall average improvement in efficiency over
the baseline 80W-90 was +0.615% (max of 0.793%, min of 0.487%).
. MTV Axle LO332270 75W-90 vs LO330868 80W-90 (Plotted)
90.00
90.50
91.00
91.50
92.00
92.50
93.00
93.50
94.00
94.50
95.00
95.50
96.00
96.50
97.00
97.50
98.00
Effic
ienc
y, [%
]
Step
LO332220 75W90 vs LO330868 80W90
80W90 R1
80W90 R2
80W90 R3
80W90 R4
80W90 R5
75W90 R1
75W90 R2
75W90 R3
75W90 R4
75W90 R5
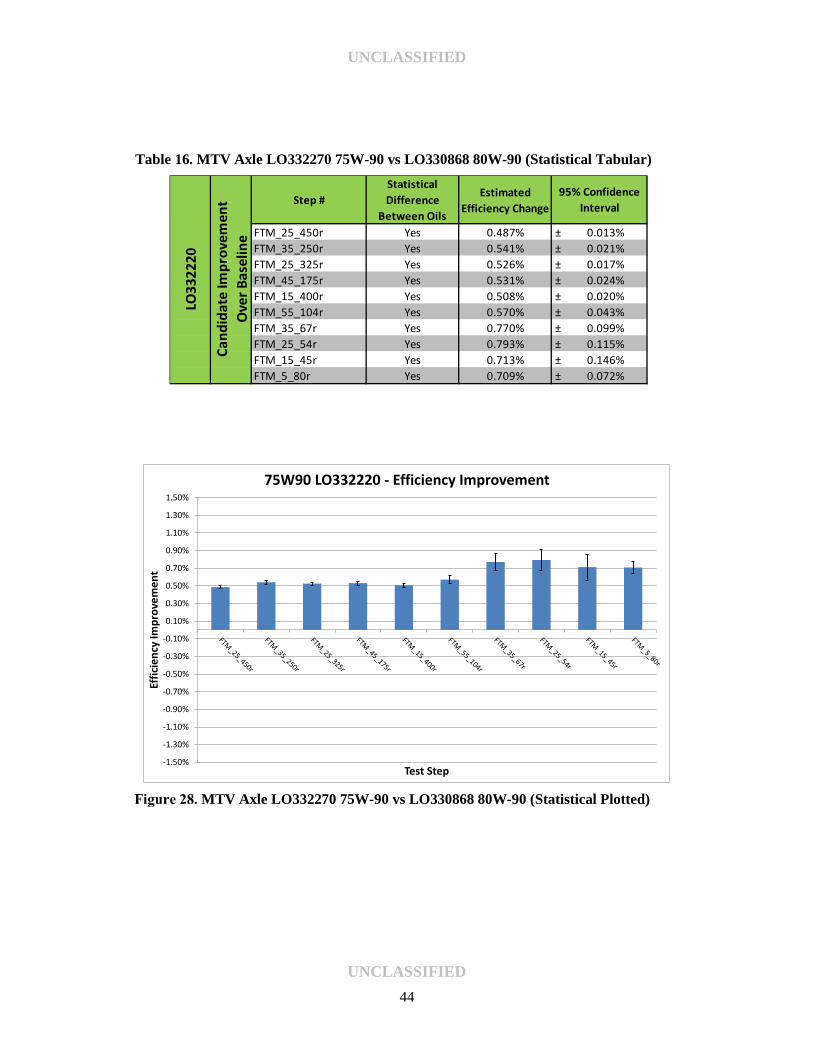
UNCLASSIFIED
UNCLASSIFIED 44
Table 16. MTV Axle LO332270 75W-90 vs LO330868 80W-90 (Statistical Tabular)
. MTV Axle LO332270 75W-90 vs LO330868 80W-90 (Statistical Plotted)
Step #Statistical Difference
Between Oils
Estimated Efficiency Change
FTM_25_450r Yes 0.487% ± 0.013%FTM_35_250r Yes 0.541% ± 0.021%FTM_25_325r Yes 0.526% ± 0.017%FTM_45_175r Yes 0.531% ± 0.024%FTM_15_400r Yes 0.508% ± 0.020%FTM_55_104r Yes 0.570% ± 0.043%FTM_35_67r Yes 0.770% ± 0.099%FTM_25_54r Yes 0.793% ± 0.115%FTM_15_45r Yes 0.713% ± 0.146%FTM_5_80r Yes 0.709% ± 0.072%
LO33
2220
Cand
idat
e Im
prov
emen
tO
ver B
asel
ine
95% Confidence Interval
-1.50%
-1.30%
-1.10%
-0.90%
-0.70%
-0.50%
-0.30%
-0.10%
0.10%
0.30%
0.50%
0.70%
0.90%
1.10%
1.30%
1.50%
Effic
ienc
y Im
prov
emen
t
Test Step
75W90 LO332220 - Efficiency Improvement
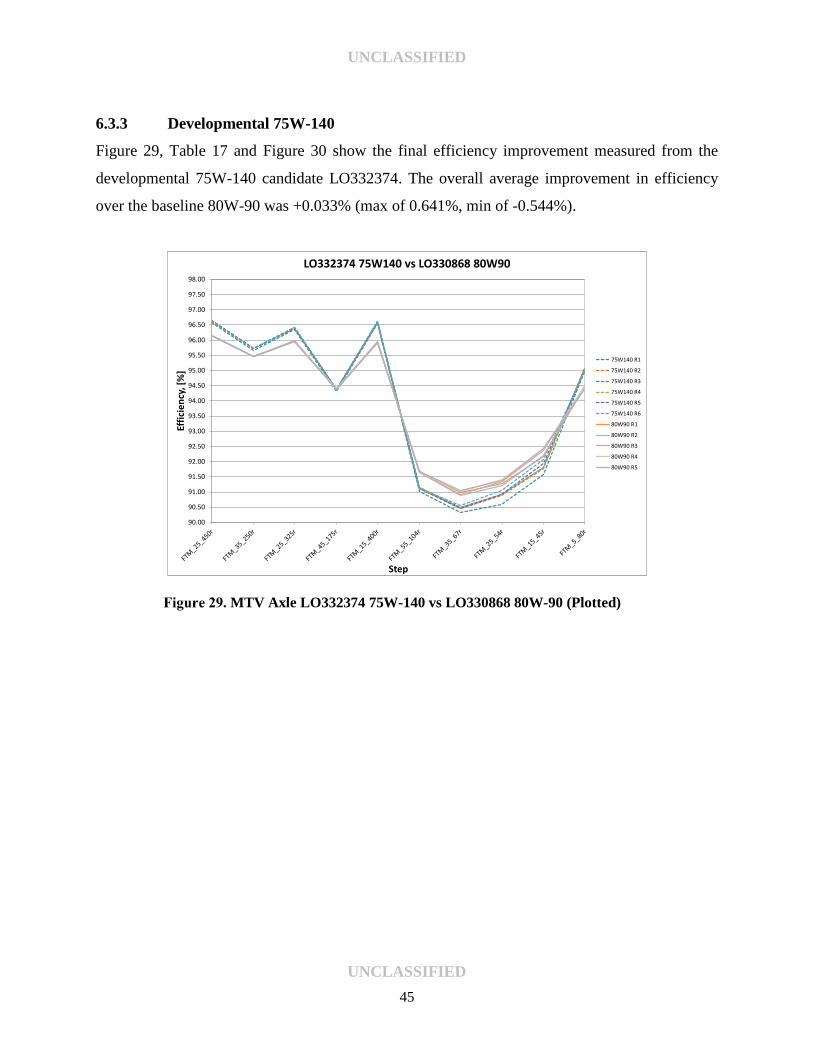
UNCLASSIFIED
UNCLASSIFIED 45
6.3.3 Developmental 75W-140
Figure 29, Table 17 and Figure 30 show the final efficiency improvement measured from the
developmental 75W-140 candidate LO332374. The overall average improvement in efficiency
over the baseline 80W-90 was +0.033% (max of 0.641%, min of -0.544%).
. MTV Axle LO332374 75W-140 vs LO330868 80W-90 (Plotted)
90.00
90.50
91.00
91.50
92.00
92.50
93.00
93.50
94.00
94.50
95.00
95.50
96.00
96.50
97.00
97.50
98.00
Effic
ienc
y, [%
]
Step
LO332374 75W140 vs LO330868 80W90
75W140 R1
75W140 R2
75W140 R3
75W140 R4
75W140 R5
75W140 R6
80W90 R1
80W90 R2
80W90 R3
80W90 R4
80W90 R5

UNCLASSIFIED
UNCLASSIFIED 46
Table 17. MTV Axle LO332374 75W-140 vs LO330868 80W-90 (Statistical Tabular)
. MTV Axle LO332374 75W-140 vs LO330868 80W-90 (Statistical Plotted)
Step #Statistical Difference
Between Oils
Estimated Efficiency Change
FTM_25_450r Yes 0.480% ± 0.025%FTM_35_250r Yes 0.255% ± 0.027%FTM_25_325r Yes 0.424% ± 0.029%FTM_45_175r No N/A ± 0.037%FTM_15_400r Yes 0.641% ± 0.026%FTM_55_104r Yes -0.544% ± 0.048%FTM_35_67r Yes -0.510% ± 0.109%FTM_25_54r Yes -0.456% ± 0.177%FTM_15_45r Yes -0.491% ± 0.210%FTM_5_80r Yes 0.555% ± 0.064%
LO33
2374
Cand
idat
e Im
prov
emen
tO
ver B
asel
ine
95% Confidence Interval
-1.50%
-1.30%
-1.10%
-0.90%
-0.70%
-0.50%
-0.30%
-0.10%
0.10%
0.30%
0.50%
0.70%
0.90%
1.10%
1.30%
1.50%
Effic
ienc
y Im
prov
emen
t
Test Step
75W140 LO332374 - Efficiency Improvement

UNCLASSIFIED
UNCLASSIFIED 47
6.3.4 Commercial 75W-90
Figure 31, Table 18 and Figure 32 show the efficiency improvement measured from the alternate
supplier 75W-90 candidate LO310411. The overall average improvement in efficiency over the
baseline 80W-90 was +0.709% (max of 1.029%, min of 0.531%).
. MTV Axle LO310411 75W-90 vs LO330868 80W-90 (Plotted)
90.00
90.50
91.00
91.50
92.00
92.50
93.00
93.50
94.00
94.50
95.00
95.50
96.00
96.50
97.00
97.50
98.00
Effic
ienc
y, [%
]
Step
LO310411 75W90 vs LO330868 80W90
80W90 R1
80W90 R2
80W90 R3
80W90 R4
80W90 R5
75W90 R1
75W90 R2
75W90 R3
75W90 R4
75W90 R5
75W90 R6

UNCLASSIFIED
UNCLASSIFIED 48
Table 18. MTV Axle LO310411 75W-90 vs LO330868 80W-90 (Statistical Tabular)
. MTV Axle LO310411 75W-90 vs LO330868 80W-90 (Statistical Plotted)
Step #Statistical Difference
Between Oils
Estimated Efficiency Change
FTM_25_450r Yes 0.531% ± 0.019%FTM_35_250r Yes 0.596% ± 0.022%FTM_25_325r Yes 0.584% ± 0.026%FTM_45_175r Yes 0.617% ± 0.023%FTM_15_400r Yes 0.532% ± 0.019%FTM_55_104r Yes 0.679% ± 0.058%FTM_35_67r Yes 0.883% ± 0.109%FTM_25_54r Yes 1.029% ± 0.141%FTM_15_45r Yes 1.002% ± 0.151%FTM_5_80r Yes 0.634% ± 0.040%
LO31
0411
Cand
idat
e Im
prov
emen
tO
ver B
asel
ine
95% Confidence Interval
-1.50%
-1.30%
-1.10%
-0.90%
-0.70%
-0.50%
-0.30%
-0.10%
0.10%
0.30%
0.50%
0.70%
0.90%
1.10%
1.30%
1.50%
Effic
ienc
y Im
prov
emen
t
Test Step
75W90 LO310411 - Efficiency Improvement
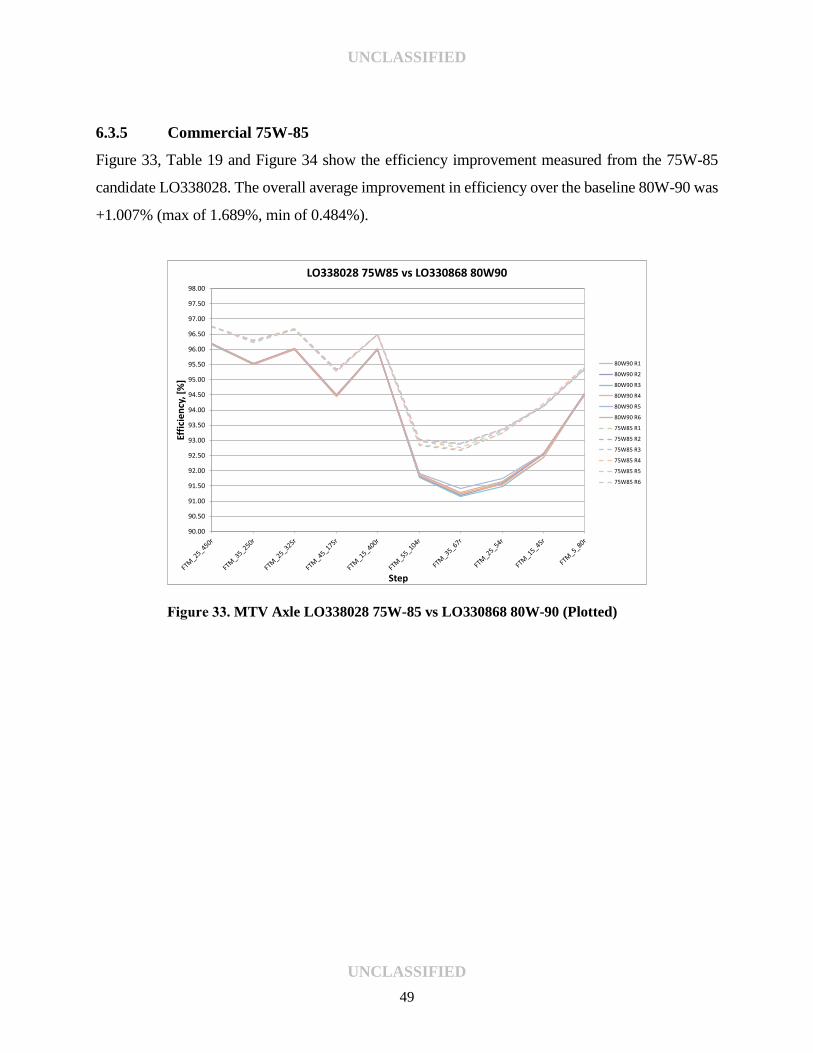
UNCLASSIFIED
UNCLASSIFIED 49
6.3.5 Commercial 75W-85
Figure 33, Table 19 and Figure 34 show the efficiency improvement measured from the 75W-85
candidate LO338028. The overall average improvement in efficiency over the baseline 80W-90 was
+1.007% (max of 1.689%, min of 0.484%).
. MTV Axle LO338028 75W-85 vs LO330868 80W-90 (Plotted)
90.00
90.50
91.00
91.50
92.00
92.50
93.00
93.50
94.00
94.50
95.00
95.50
96.00
96.50
97.00
97.50
98.00
Effic
ienc
y, [%
]
Step
LO338028 75W85 vs LO330868 80W90
80W90 R1
80W90 R2
80W90 R3
80W90 R4
80W90 R5
80W90 R6
75W85 R1
75W85 R2
75W85 R3
75W85 R4
75W85 R5
75W85 R6

UNCLASSIFIED
UNCLASSIFIED 50
Table 19. MTV Axle LO338028 75W-85 vs LO330868 80W-90 (Statistical Tabular)
. MTV Axle LO338028 75W-85 vs LO330868 80W-90 (Statistical Plotted)
Step #Statistical Difference
Between Oils
Estimated Efficiency Change
FTM_25_450r Yes 0.564% ± 0.007%FTM_35_250r Yes 0.745% ± 0.023%FTM_25_325r Yes 0.650% ± 0.015%FTM_45_175r Yes 0.824% ± 0.034%FTM_15_400r Yes 0.484% ± 0.010%FTM_55_104r Yes 1.094% ± 0.084%FTM_35_67r Yes 1.543% ± 0.126%FTM_25_54r Yes 1.689% ± 0.101%FTM_15_45r Yes 1.630% ± 0.066%FTM_5_80r Yes 0.850% ± 0.037%
LO33
8028
Cand
idat
e Im
prov
emen
tO
ver B
asel
ine
95% Confidence Interval
-1.00%
-0.80%
-0.60%
-0.40%
-0.20%
0.00%
0.20%
0.40%
0.60%
0.80%
1.00%
1.20%
1.40%
1.60%
1.80%
2.00%
Effic
ienc
y Im
prov
emen
t
Test Step
75W85 LO338028 - Efficiency Improvement

UNCLASSIFIED
UNCLASSIFIED 51
6.3.6 Commercial 75W-110
Figure 35, Table 20 and Figure 36 show the efficiency improvement measured from the 75W-
110 candidate LO351656. The overall average improvement in efficiency over the baseline
80W-90 was +0.349% (max of 0.757%, min of -0.033%).
. MTV Axle LO351656 75W-110 vs LO330868 80W-90 (Plotted)
90.00
90.50
91.00
91.50
92.00
92.50
93.00
93.50
94.00
94.50
95.00
95.50
96.00
96.50
97.00
97.50
98.00
Effic
ienc
y, [%
]
Step
LO351656 75W110 vs LO330868 80W90
80W90 R5
80W90 R6
80W90 R7
80W90 R8
80W90 R9
75W110 R1
75W110 R2
75W110 R3
75W110 R4
75W110 R5

UNCLASSIFIED
UNCLASSIFIED 52
Table 20. MTV Axle LO351656 75W-110 vs LO330868 80W-90 (Statistical Tabular)
. MTV Axle LO351656 75W-110 vs LO330868 80W-90 (Statistical Plotted)
Step #Statistical Difference
Between Oils
Estimated Efficiency Change
FTM_25_450r Yes 0.547% ± 0.032%FTM_35_250r Yes 0.406% ± 0.057%FTM_25_325r Yes 0.522% ± 0.044%FTM_45_175r Yes 0.282% ± 0.098%FTM_15_400r Yes 0.680% ± 0.034%FTM_55_104r No N/A ± N/AFTM_35_67r No N/A ± N/AFTM_25_54r No N/A ± N/AFTM_15_45r Yes 0.249% ± 0.144%FTM_5_80r Yes 0.757% ± 0.088%
LO35
1656
Cand
idat
e Im
prov
emen
tO
ver B
asel
ine
95% Confidence Interval
-1.50%
-1.30%
-1.10%
-0.90%
-0.70%
-0.50%
-0.30%
-0.10%
0.10%
0.30%
0.50%
0.70%
0.90%
1.10%
1.30%
1.50%
Effic
ienc
y Im
prov
emen
t
Test Step
75W110 LO351656 - Efficiency Improvement

UNCLASSIFIED
UNCLASSIFIED 53
6.3.7 Compiled Results
Table 21 and Figure 37 show the compiled final results for efficiency improvement over the
baseline 80W-90 for each of the tested oils. As shown, the largest differentiator in efficiency
response for each oil was in the low power/low load operating points, which ranged from a
detriment in efficiency by approximately -0.5%, to an increase in efficiency at just over 1.6%. For
the higher load/high power steps, efficiency response for all oil was group much tighter, but the
results still tended to align the oils by viscosity with the 15mph 400lbft operating point as the only
exception.
Table 21. Compiled FEGO Candidate Results (Tabular)
Step # LO33222075W-90
LO33237475W-140
LO31041175W-90
LO33802875W-85
LO35165675W-110
FTM_25_450r 0.487% 0.480% 0.531% 0.564% 0.547%FTM_35_250r 0.541% 0.255% 0.596% 0.745% 0.406%FTM_25_325r 0.526% 0.424% 0.584% 0.650% 0.522%FTM_45_175r 0.531% N/A 0.617% 0.824% 0.282%FTM_15_400r 0.508% 0.641% 0.532% 0.484% 0.680%FTM_55_104r 0.570% -0.544% 0.679% 1.094% N/AFTM_35_67r 0.770% -0.510% 0.883% 1.543% N/AFTM_25_54r 0.793% -0.456% 1.029% 1.689% N/AFTM_15_45r 0.713% -0.491% 1.002% 1.630% 0.249%FTM_5_80r 0.709% 0.555% 0.634% 0.850% 0.757%
Cand
idat
e Im
prov
emen
tO
ver B
asel
ine

UNCLASSIFIED
UNCLASSIFIED 54
. Compiled FEGO Candidate Results (Plotted)
-0.75%
-0.50%
-0.25%
0.00%
0.25%
0.50%
0.75%
1.00%
1.25%
1.50%
1.75%
2.00%
Effic
ienc
y Ch
ange
Rel
ativ
e to
Bas
elin
e [%
]Compiled Candidate Results (all vs. LO330868 80W90)
LO33222075W-90
LO33237475W-140
LO31041175W-90
LO33802875W-85
LO35165675W-110

UNCLASSIFIED
UNCLASSIFIED 55
7.0 GENERAL OBSERVATIONS
Over the course of the development process, other trends in collected data were identified, but
have not been fully investigated at this time. This section includes documentation of these areas
for future consideration.
7.1 LONG TERM BREAK-IN/BASELINE SHIFT
Low level changes in efficiency versus usage have been noticed for the MTV axle over the
development process. These were identified through the repeated 80W-90 baseline runs completed
on the axle between each candidate test. At the completion of the project the MTV axle had
accumulated approximately 72k miles, and despite this, trends in increasing efficiency were still
being observed in the low power/light load operating conditions of the FTM cycle. Figure 38 shows
the average baseline results for each of the baseline segments completed since the MTV axle was
reinstalled for the final FTM testing. (Note: Disregard shifts shown between BL1 and BL2, and
BL6 and BL7. Each of these were a results of other extenuating circumstances not attributed to
break-in).
. MTV Axle Baseline Shift
90.00
91.00
92.00
93.00
94.00
95.00
96.00
97.00
BL1* BL2 BL3 BL4 BL5 BL6 BL7 BL8
80W90 - Baseline Shift
80W90 Baseline Shift
FTM_25_450r
FTM_35_250r
FTM_25_325r
FTM_45_175r
FTM_15_400r
FTM_55_104r
FTM_35_67r
FTM_25_54r
FTM_15_45r
FTM_5_80r
UNCLASSIFIED
UNCLASSIFIED 56
As shown, for the low power/light load operating condition, efficiency has increased by
approximately 0.75% from BL2 to BL6. This highlights the importance of requiring continued
baseline testing before each candidate, as each candidate is being compared against baseline data
on the axles current condition. It is currently undetermined how the results from re-running any of
the previous run candidates would compare to their earlier evaluations as a result of continued
break-in. It is expected that the results would continue to trend the same, but overall magnitude of
efficiency improvement predicted by the test might vary depending on when it was conducted.
7.2 ADDITIVE PACK TRIBO-FILM CHANGE BETWEEN TESTED CANDIDATES
During candidate testing some oils tended to show a progressively improving response in
efficiency between their first and second runs in the axle versus their later runs when conducting
the minimum 5 runs for the proposed FTM cycle. This potentially suggests that some oils additive
packs require an extended amount of time to deplete/change the chemical tribofilm created on the
gear surface when changing from one oil chemistry to the next. Although not seen with every oil
change, several of the oils showed this effect (review previous plots). An extended flush procedure
which includes some specified axle operation time/loading conditions could be implemented
between oil changes to help reduce this effect, and would potentially further tighten the statistical
data analysis for the candidate oils.

UNCLASSIFIED
UNCLASSIFIED 57
8.0 RESULTS AND CONCLUSIONS
• Development work for the MTV and HMMWV axles on the stationary axle efficiency test
stand yield results that align with full scale SAE J1321 vehicle tests. This suggests that the
design and operation of the stationary axle stand is realistic, and given that a specified
stationary axle test cycle is an accurate representation of real world vehicle operation,
results derived from the stationary axle stand can be expected to be translated to real world
performance changes.
• The draft FTM developed using the MTV axle provides a good measure of axle efficiency
as a function of the lubricant. Run to run results are consistent, and statistical analysis
demonstrates good differentiation in efficiency as a function of the lubricant.
• Final prove out testing following the draft FTM shows that the largest differentiation in
axle efficiency is shown in the MTV axle in the lower power and lightly loaded operating
conditions. For the high power/high load conditions, overall grouping of the results
between oils tightened significantly, but still appeared to rank primarily against the oils
viscosity (lowest viscosity equating to highest efficiency).
• Based on the results attained in the efficiency testing, and given sufficient information
regarding no-harm impact to durability, the lowest viscosity candidate (75W-85) shows the
most potential for improvement in axle efficiency, and would be expected to provide the
highest level of fuel consumption improvement in a full scale vehicle.
• Continued operation of the MTV axle does document the axle’s propensity to continually
shift with usage. This was primarily noted in the lower power and lightly loaded operating
points, which tended to show a trend of increasing efficiency over the course of the entire
development process, despite the accumulated mileage of the MTV axle exceeding 70k
miles.
UNCLASSIFIED
UNCLASSIFIED 58
9.0 RECOMMENDATIONS
• The current draft FTM yields changes in efficiency and confidence interval for each of the
10 defined operating conditions. Future work should investigate real world operating data
to determine a weighting system to apply to the current FTM cycle results.
• Fixed cooling rate versus a fixed temperature control system should be investigated to
determine impact on results ranking. Efficiency of each oil is expected to impact actual
observed operating temperatures during real world operation, and as a result could have
the potential to change the results of each oil relative to one another.
• Additional candidate testing should be conducted to further investigate differences in oil
chemistry, and to better understand the effect on efficiency from viscosity versus additive
pack.
• Future revisions of the FTM procedure should consider an extended run-in/flush procedure
with each new oil, as data collected suggests that changes in axle efficiency for a new oil
can take time to stabilize as the chemical/tribofilm present on the gear surfaces changes
from one oil to the next.

UNCLASSIFIED
UNCLASSIFIED 59
10.0 REFERENCES
1. Warden, R. W., Frame, E. A., Brandt, A. C., “SAE J1321 Testing Using M1083A1
FMTVS”, Interim Report TFLRF No. 404, March 2010.
2. Warden, R. W., Frame, E. A., “Axle Lubricant Efficiency”, Interim Report TFLRF No. 444, May 2014
3. Brandt, A. C., Frame, E. A., “Light and Heavy Duty Tactical Wheeled Vehicle Fuel
Consumption Evaluations Using Fuel Efficient Gear Oils (FEGO)”, Final Report TFLRF
No. 477, May 2016
4. Warden, R. W., Frame, E. A., Brandt, A. C., Tedesco, S. J., “Laboratory Based Axle
Lubricant Efficiency Evaluation”, TFLRF Interim Report 459, July 2014
5. Brandt, A. C., Frame, E. A., Tedesco, S. J., “Development of an Army Stationary Axle
Efficiency Test Stand”, TFLRF Interim Report 471, September 2015
6. Anderson, N., and Maddock, D., “Development of a Standardized Axle Efficiency Test
Methodology,” 2nd CTI Symposium, Automotive Transmissions, North America, 2008
7. Dykas, B., Rizzo, D., Fussner, D., McDonnell, R. et al., "HMMWV Axle Testing
Methodology to Determine Efficiency Improvements with Superfinished Hypoids," SAE
Int. J. Passeng. Cars - Mech. Syst. 6(2):665-673, 2013

UNCLASSIFIED
UNCLASSIFIED
A-1
APPENDIX A. MTV Axle Efficiency Maps

UNCLASSIFIED
UNCLASSIFIED
A-1
(LO246580 80W-90 Baseline)

UNCLASSIFIED
UNCLASSIFIED
A-2
(LO246580 80W-90 Baseline)

UNCLASSIFIED
UNCLASSIFIED
A-3
(LO246580 80W-90 Baseline)

UNCLASSIFIED
UNCLASSIFIED
A-4
(LO246580 80W-90 Baseline)

UNCLASSIFIED
UNCLASSIFIED
A-5
(LO246580 80W-90 Baseline)
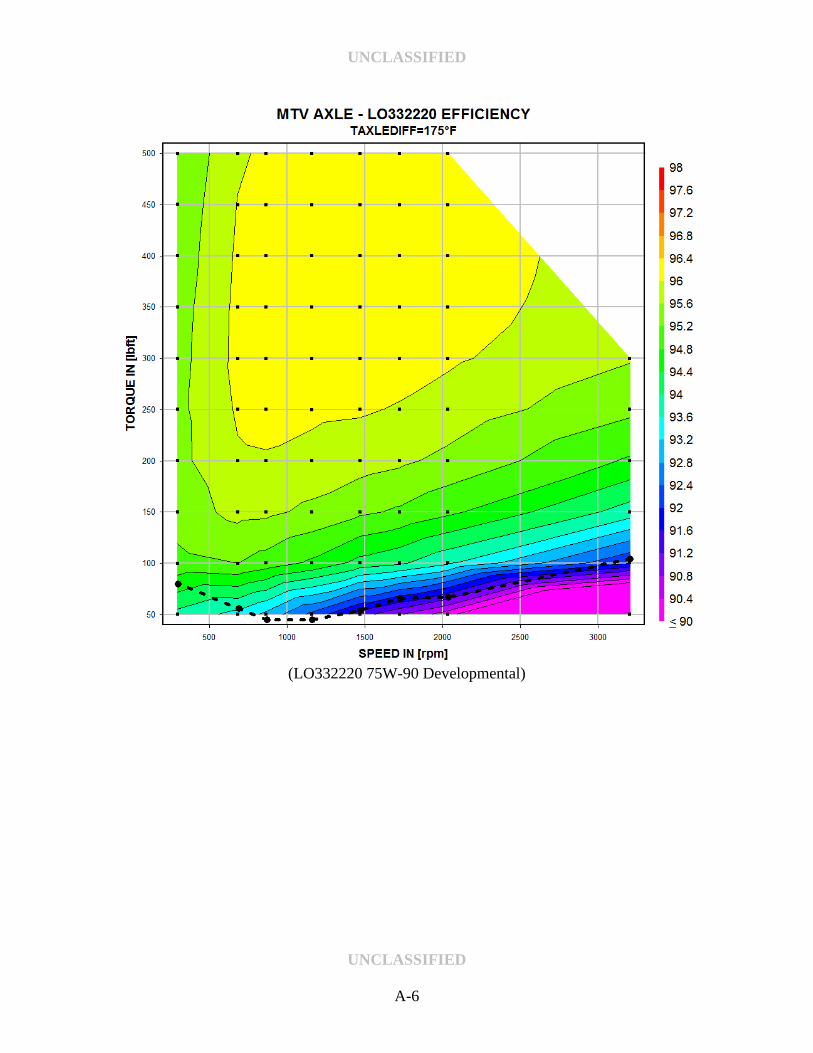
UNCLASSIFIED
UNCLASSIFIED
A-6
(LO332220 75W-90 Developmental)

UNCLASSIFIED
UNCLASSIFIED
A-7
(LO332220 75W-90 Developmental)

UNCLASSIFIED
UNCLASSIFIED
A-8
(LO332220 75W-90 Developmental)

UNCLASSIFIED
UNCLASSIFIED
A-9
(LO332374 75W-140 Developmental)
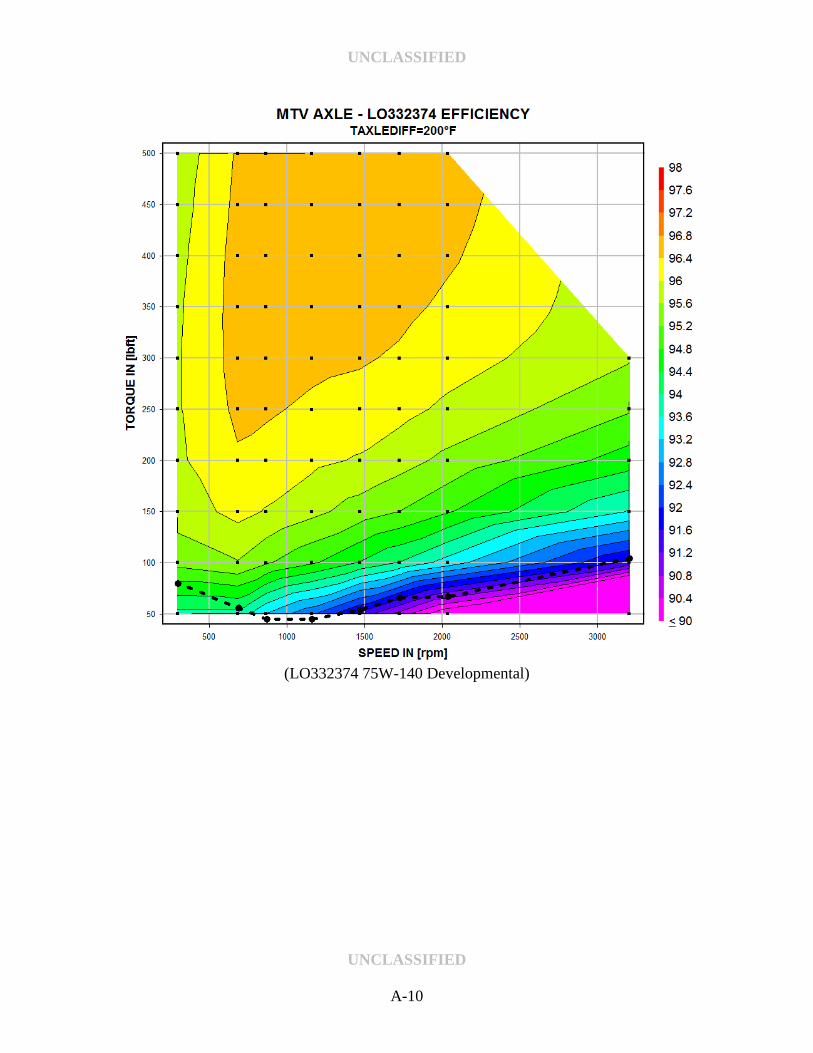
UNCLASSIFIED
UNCLASSIFIED
A-10
(LO332374 75W-140 Developmental)

UNCLASSIFIED
UNCLASSIFIED
A-11
(LO332374 75W-140 Developmental)

UNCLASSIFIED
UNCLASSIFIED
B-1
APPENDIX B. Draft FTM
UNCLASSIFIED
UNCLASSIFIED
B-1
FED-STD-791D Method xxxx.x
Date EFFICIENCY OF AXLE GEAR LUBRICANTS
1. SCOPE
1.1. This method is used for determining the relative mechanical efficiency improvement provided by a candidate axle gear
lubricant against a reference lubricant under controlled laboratory conditions.
2. SUMMARY 2.1. A medium tactical vehicle axle is used to measure the efficiency change between axle gear lubricants under controlled
laboratory conditions. At the start of the test segment, a minimum of 5 baseline runs are conducted using the reference fluid to determine baseline axle efficiency. The axle is then double flushed with the candidate axle gear lubricant, and a minimum of 5 candidate runs are conducted following the same operating procedure. At the completion of the candidate testing, the axle is double flushed with the reference lubricant, and a single test run is conducted using the reference oil to determine test validity. A test is considered valid if the post-candidate reference run returns data that is statistically equivalent to the pre-candidate reference runs. If valid, the pre-candidate reference test data is compared to the candidate test data to determine the change in measured efficiency of the axle. Combined statistical analysis is conducted on all of the reference and candidate runs to determine efficiency change and confidence interval for each operating condition.
3. SAMPLE SIZE 3.1. A total of 38 L (10 gallons) of candidate lubricant is required to double flush the axle and oil temperature control loop.
4. REFERENCES, STANDARDS, and APPARATUS
4.1. References
4.1.1. SAE Standard J2360, Automotive Gear Lubricants for Commercial and Military Use
4.2. Test Apparatus 4.2.1. The axle test apparatus is a T-type test stand where the axle is driven by an electric AC motor, and the two outputs
of the axle are coupled using speed increasing gear boxes and absorbed by an identically sized AC motor/generator. Speed control is provided by the input motor, while load control is provided by the output absorber (controlling against input torque measurement). Speed is measured through incrementing encoders mounted at the input and output motors, and torque is measured using high accuracy digital torque flanges mounted directly at the axle’s input and output interfaces to reduce any outside influence from the remainder of the test stand on the resulting efficiency calculation.
4.3. Test Axle Description 4.3.1. The axle used for testing is the rearmost axle from the 5-ton M1083A1 cargo truck from the Family of Medium
Tactical Vehicles (FMTV). The axle is produced by Meritor and is identified by the part number: RR15611NFDF32-780.
4.3.2. The axle is a typical beam type axle with an open differential and an overall gear ratio of 7.8:1 (3.9:1 ring and pinion ratio, and 2:1 wheel end reduction). The axle has a common oil sump between the center differential section and wheel end hub reductions.
4.3.3. The factory input pinion yoke is replaced by a custom machined input yoke that allows for direct mounting of the input torque flange.
4.3.4. Special output hubs are machined to bolt to the axle’s wheel studs and provide mounting for the output torque flange.
4.4. Test Stand Detailed System Description 4.4.1. Axle input power and output absorption is provided by two 250hp AC electric motor/generators controlled
through two variable frequency drives (VFD). 4.4.2. A total of two speed increasing gear boxes are utilized to increase each axle wheel end output speed and reduce
torque prior to the absorbing motor. The gearboxes have a mechanical gear ratio of 7.259:1, and contain an integrated lubrication and cooling circuit.
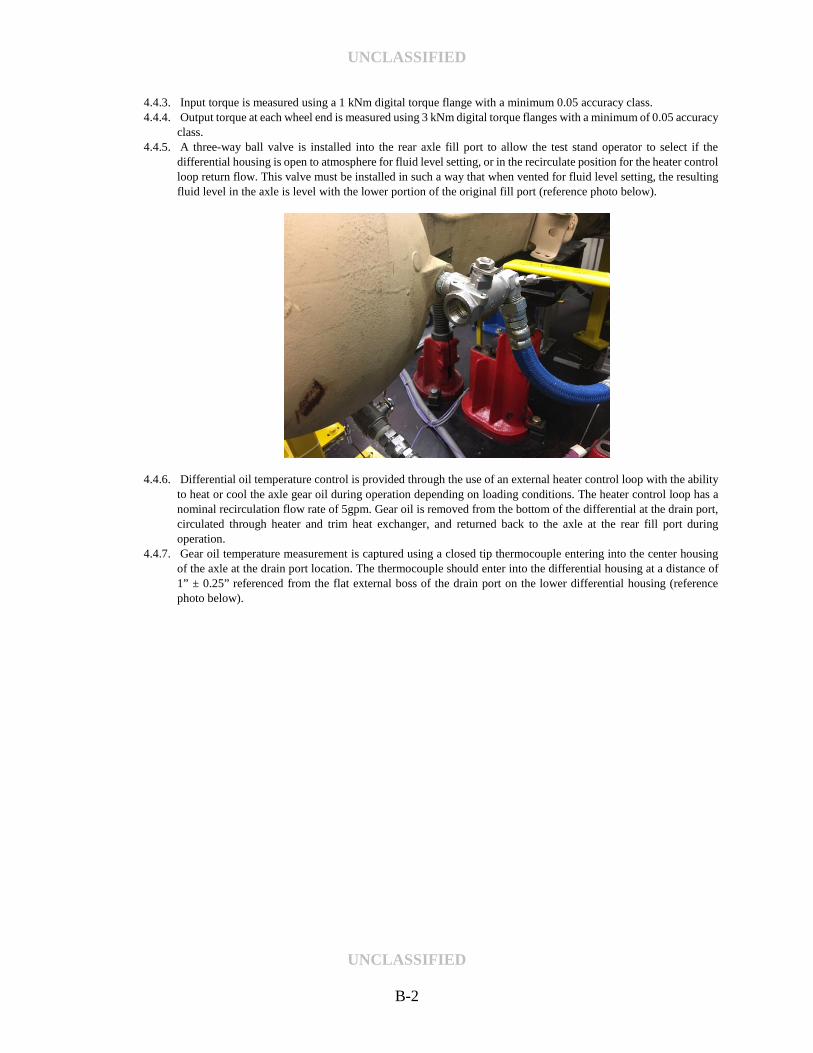
UNCLASSIFIED
UNCLASSIFIED
B-2
4.4.3. Input torque is measured using a 1 kNm digital torque flange with a minimum 0.05 accuracy class. 4.4.4. Output torque at each wheel end is measured using 3 kNm digital torque flanges with a minimum of 0.05 accuracy
class. 4.4.5. A three-way ball valve is installed into the rear axle fill port to allow the test stand operator to select if the
differential housing is open to atmosphere for fluid level setting, or in the recirculate position for the heater control loop return flow. This valve must be installed in such a way that when vented for fluid level setting, the resulting fluid level in the axle is level with the lower portion of the original fill port (reference photo below).
4.4.6. Differential oil temperature control is provided through the use of an external heater control loop with the ability to heat or cool the axle gear oil during operation depending on loading conditions. The heater control loop has a nominal recirculation flow rate of 5gpm. Gear oil is removed from the bottom of the differential at the drain port, circulated through heater and trim heat exchanger, and returned back to the axle at the rear fill port during operation.
4.4.7. Gear oil temperature measurement is captured using a closed tip thermocouple entering into the center housing of the axle at the drain port location. The thermocouple should enter into the differential housing at a distance of 1” ± 0.25” referenced from the flat external boss of the drain port on the lower differential housing (reference photo below).

UNCLASSIFIED
UNCLASSIFIED
B-3
4.5. Instrumentation 4.5.1. The following parameters are the minimum required measurements to be recorded during testing:
• Input speed • Output speed • Input torque • Left output torque • Right output torque • Differential gear oil temperature • Heater control loop return temperature • Ambient temperature
4.6. Data Acquisition
4.6.1. A data acquisition and control system must be utilized to simultaneously record all testing parameters and provide speed and torque control for the axle under test. The data acquisition system must be capable of logging data at the specified 2Hz for the stabilized data recording steps during the efficiency test. It is recommended that the data acquisition system be able to monitor and control the system at an update rate of 100Hz to ensure precise control of the system.
4.6.2. The data acquisition and control system must also be capable of controlling limits for over/under oil temperature, and over/under torque and speed.
4.7. Test Stand Diagram 4.7.1. A detailed diagram of the test stand and heater control loop is provided in Appendix A.
5. MATERIALS 5.1. A sufficient volume of reference lubricant is required to double flush the axle and heater control loop for the pre-
candidate and post-candidate test reference runs. This is equivalent to approximately 8 gallons, plus two times the capacity of the external heater control loop volume.

UNCLASSIFIED
UNCLASSIFIED
B-4
6. PROCEDURE
6.1. Fluid Change:
NOTE: If the axle fluid is being changed from one lubricant to another, a double flush procedure should always be used! The procedure below outlines the process to complete a SINGLE flush. Complete steps 6.1.1 through 6.1.6 twice to complete a double flush.
6.1.1. If starting with the axle already drained, proceed to step 6.1.3. If starting with the axle full, start the test stand and operate the axle at approximately 3200 rpm and 200 lbft until the differential fluid temperature is ≥ 175°F.
6.1.2. Once the temperature has reached 175°F, bring the test stand to a stop while keeping the fluid temperature elevated (i.e. do not apply cooling). Once stopped, drain the axle and heater control loop and dispose of the drained fluid.
6.1.3. Ensure that the circulation pump is off, and position the three way valve at the rear fill port of the axle to the vent position. Add fluid to the axle housing through the upper vent port until the fluid level is even with the rear housing fill port (this is noted by a trickle of fluid from the vented three way valve on the axle).
6.1.4. Move the three way valve at the rear fill port of the axle to the recirculation position, and turn on the circulation pump and allow the fluid to flow through the heater system for a minimum of 2 minutes to purge air from the heater system.
6.1.5. Turn off the circulation pump and reposition the three way valve at the rear fill port of the axle to the vent position, and add fluid to the axle housing through the upper vent port until the fluid level is topped back off to the rear housing fill port level.
6.1.6. Once complete, position the three way valve at the rear fill port of the axle back to the recirculation position for testing.
6.2. Efficiency Testing:
6.2.1. Start the test stand and ramp the axle to step one test conditions (see Table 1.) and hold until the differential oil temperature reaches 175°F +/- 1°F.
6.2.2. Once the differential oil reaches temperature, progress the axle through the speed and load points outlined in Table 1 while logging (at a minimum) input torque, output torque left and right, input speed, output speed, and axle differential fluid temperature.
6.2.3. Operation at each step should consist of two sub-steps, first a stabilization sub-step to allow the axle to stabilize at the specified test conditions, then second, a specified data recording sub-step.
6.2.4. During the stabilization sub-step, the axle should be operated at the specified test condition in table 1 for a minimum of 5 minutes, and the moving average of the axle differential fluid temperature should be 175° +/- 0.25°F before continuing to the recording step. The moving average should be calculated over a 60 second interval with a 1 second sample time. Overall data logging rate during the stabilization step should be 0.2 Hz (5 sec).
6.2.5. During the recording sub-step, the axle should be operated at the specified test condition for 60 seconds at a logging rate of 2 Hz (0.5 sec). Once complete the axle can be ramped to the next step/test condition for stabilization.
Table 1. Federal Test Method Speed & Load Points
Step Nominal Speed [mph] Pinion Speed [rpm]
Pinion Load [lbft]
1 25 1469 450 2 35 2100 250 3 25 1469 325 4 45 2600 175 5 15 865 400 6 55 3207 104 7 35 2100 67 8 25 1469 54 9 15 865 45
10 5 294 80

UNCLASSIFIED
UNCLASSIFIED
B-5
6.2.6. The axle should be operated through all 10 steps to complete 1 cycle. For each individual test, 10 cycles should
be completed for data averaging.
7. CALCULATIONS 7.1. Efficiency of Individual Test Run
7.1.1. All final calculations are completed using the data from the data recording sub-step captured after stabilization at each speed and load. To determine efficiency results for the reference or candidates tests, input and output power and efficiency for each step of all 10 cycles should be calculated as follows:
𝑃𝑃𝑃𝑃𝑃𝑃𝑃𝑃𝑃𝑃𝐼𝐼𝐼𝐼 = (𝑆𝑆𝑆𝑆𝑃𝑃𝑃𝑃𝑆𝑆𝐼𝐼𝐼𝐼 ∗ 𝑇𝑇𝑃𝑃𝑃𝑃𝑇𝑇𝑇𝑇𝑃𝑃𝐼𝐼𝐼𝐼)
5252
𝑃𝑃𝑃𝑃𝑃𝑃𝑃𝑃𝑃𝑃𝑂𝑂𝑂𝑂𝑂𝑂 = 𝑆𝑆𝑆𝑆𝑃𝑃𝑃𝑃𝑆𝑆𝑂𝑂𝑂𝑂𝑂𝑂 ∗ (𝑇𝑇𝑃𝑃𝑃𝑃𝑇𝑇𝑇𝑇𝑃𝑃𝑂𝑂𝑂𝑂𝑂𝑂 𝐿𝐿𝐿𝐿𝐿𝐿𝑂𝑂 + 𝑇𝑇𝑃𝑃𝑃𝑃𝑇𝑇𝑇𝑇𝑃𝑃𝑂𝑂𝑂𝑂𝑂𝑂 𝑅𝑅𝑅𝑅𝑅𝑅ℎ𝑂𝑂)
5252
𝐸𝐸𝐸𝐸𝐸𝐸𝐸𝐸𝐸𝐸𝐸𝐸𝑃𝑃𝑒𝑒𝐸𝐸𝑒𝑒 = 𝑃𝑃𝑃𝑃𝑃𝑃𝑃𝑃𝑃𝑃𝑂𝑂𝑂𝑂𝑂𝑂𝑃𝑃𝑃𝑃𝑃𝑃𝑃𝑃𝑃𝑃𝐼𝐼𝐼𝐼
∗ 100
𝑃𝑃ℎ𝑃𝑃𝑃𝑃𝑃𝑃: 𝑃𝑃𝑃𝑃𝑃𝑃𝑃𝑃𝑃𝑃 [ℎ𝑆𝑆], 𝑆𝑆𝑆𝑆𝑃𝑃𝑃𝑃𝑆𝑆 [𝑃𝑃𝑆𝑆𝑟𝑟],𝑇𝑇𝑃𝑃𝑃𝑃𝑇𝑇𝑇𝑇𝑃𝑃 [𝑙𝑙𝑙𝑙𝐸𝐸𝑙𝑙]
7.1.2. From these calculations, a matrix of resulting efficiency can be tabulated for each baseline or candidate run. An
example table is shown below, where “xx” denotes the calculated efficiency for all 10 cycles of the baseline or candidate run. (Note: cycle 1 is not included in the final analysis to reduce any impacts in efficiency measurement from long thermal transients that persist in the tested hardware after the initial warm-up).
7.1.3. The composite result for a single baseline or candidate run is then calculated by taking the average efficiency over cycles 2 through 10 for each step of the individual run. An example composite result table for a single run is shown below.
2 3 4 5 6 7 8 9 10FTM_25_450r xx xx xx xx xx xx xx xx xxFTM_35_250r xx xx xx xx xx xx xx xx xxFTM_25_325r xx xx xx xx xx xx xx xx xxFTM_45_175r xx xx xx xx xx xx xx xx xxFTM_15_400r xx xx xx xx xx xx xx xx xxFTM_55_104r xx xx xx xx xx xx xx xx xx
FTM_35_67r xx xx xx xx xx xx xx xx xxFTM_25_54r xx xx xx xx xx xx xx xx xxFTM_15_45r xx xx xx xx xx xx xx xx xx
FTM_5_80r xx xx xx xx xx xx xx xx xx
Cycle Baseline or Candidate Single Run Results
STEP
STEP Run #FTM_25_450r xxFTM_35_250r xxFTM_25_325r xxFTM_45_175r xxFTM_15_400r xxFTM_55_104r xx
FTM_35_67r xxFTM_25_54r xxFTM_15_45r xx
FTM_5_80r xx
Baseline or Candidate Run Composite Result

UNCLASSIFIED
UNCLASSIFIED
B-6
7.1.4. Recall, a minimum of 5 runs must be conducted for each baseline or candidate test. After all 5 runs are completed, a baseline or candidate test results table can be formed. An example is shown below.
7.2. Statistical Analysis – Comparison of Reference Test to Candidate Test 7.2.1. Once all baseline and candidate test data is gathered, statistical analysis can be conducted to determine overall
efficiency change and confidence interval. 7.2.2. For both the baseline and candidate test results, calculate the mean, standard deviation, and variance for each
individual step.
7.2.3. For each step, conduct an F-Test to determine if the baseline and candidate tests have equal variances. 7.2.4. Based on the results of 7.2.3, conduct an appropriate T-Test for each step between the baseline and candidate test
results to establish the statistical significance (95% confidence interval) of the difference in means between the reference and candidate results. A results should be complied in a single table as shown below.
8. REPORTING 8.1. At the completion of testing, report the baseline and candidate test result tables calculated in step 0, the candidate
improvement table calculated in step 7.2.4, and the post-candidate reference run result to document test validity.
Run 1 Run 2 Run 3 Run 4 Run 5FTM_25_450r xx xx xx xx xxFTM_35_250r xx xx xx xx xxFTM_25_325r xx xx xx xx xxFTM_45_175r xx xx xx xx xxFTM_15_400r xx xx xx xx xxFTM_55_104r xx xx xx xx xx
FTM_35_67r xx xx xx xx xxFTM_25_54r xx xx xx xx xxFTM_15_45r xx xx xx xx xx
FTM_5_80r xx xx xx xx xx
STEPBaseline or Candidate Test Result
Mean Std Dev Variance Mean Std Dev VarianceFTM_25_450r xx xx xx xx xx xxFTM_35_250r xx xx xx xx xx xxFTM_25_325r xx xx xx xx xx xxFTM_45_175r xx xx xx xx xx xxFTM_15_400r xx xx xx xx xx xxFTM_55_104r xx xx xx xx xx xx
FTM_35_67r xx xx xx xx xx xxFTM_25_54r xx xx xx xx xx xxFTM_15_45r xx xx xx xx xx xx
FTM_5_80r xx xx xx xx xx xx
STEPBaseline Candidate
% changeStatistically Significant?
Confidence Interval
FTM_25_450r xx Y/N ± xxFTM_35_250r xx Y/N ± xxFTM_25_325r xx Y/N ± xxFTM_45_175r xx Y/N ± xxFTM_15_400r xx Y/N ± xxFTM_55_104r xx Y/N ± xx
FTM_35_67r xx Y/N ± xxFTM_25_54r xx Y/N ± xxFTM_15_45r xx Y/N ± xx
FTM_5_80r xx Y/N ± xx
STEP
Candidiate Improvement

UNCLASSIFIED
UNCLASSIFIED
B-7
9. PRECISION 9.1. Precision data has not been developed for this method. Since candidate testing includes the completion of reference runs
for data comparison, statistical analysis of the reference and candidate results effectively captures and reflects the repeatability of the test stand measurement.
Method Prepared By: Army – 2016

UNCLASSIFIED
UNCLASSIFIED
B-8
APPENDIX A
1. Axle test stand block diagram:
INPUT TORQUE
OUTPUT TORQUE, LEFT
OUTPUT TORQUE, RIGHT
INPUT MOTOR
OUTPUT MOTOR SPEED INCREASING GEARBOX
TEST AXLE
SPEED INCREASING GEARBOX
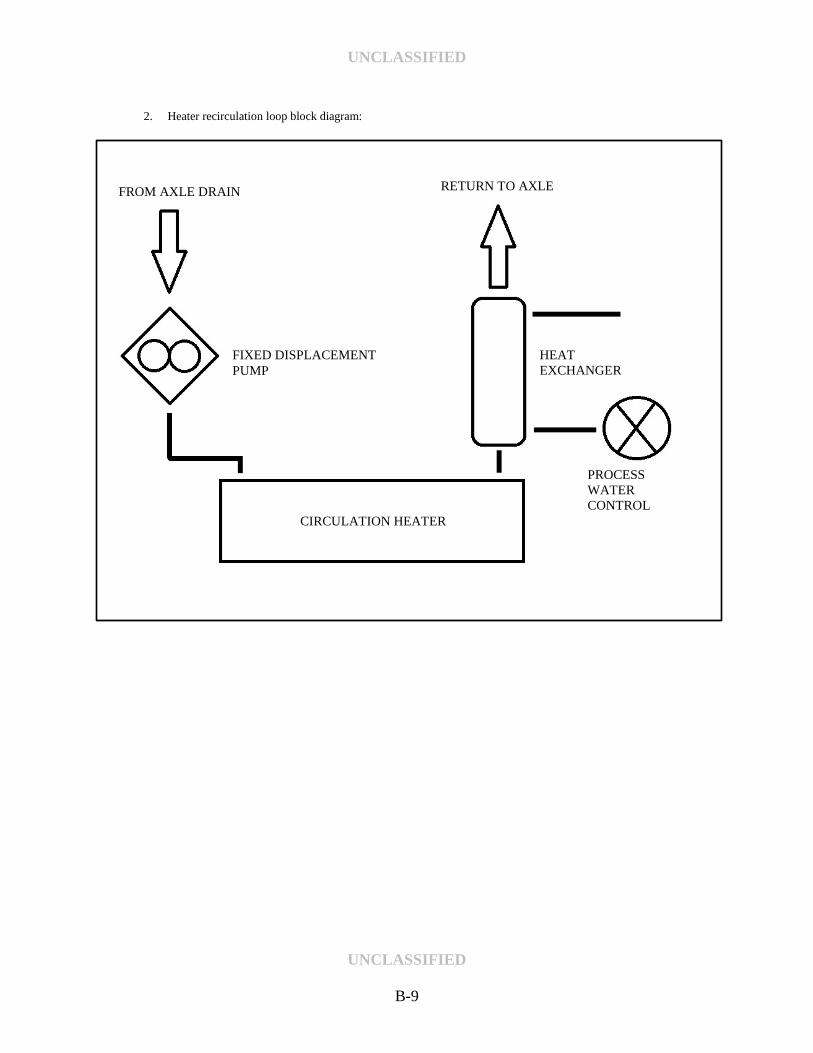
UNCLASSIFIED
UNCLASSIFIED
B-9
2. Heater recirculation loop block diagram:
FROM AXLE DRAIN RETURN TO AXLE
FIXED DISPLACEMENT PUMP
CIRCULATION HEATER
HEAT EXCHANGER
PROCESS WATER CONTROL VALVE