Embed Size (px)
Citation preview
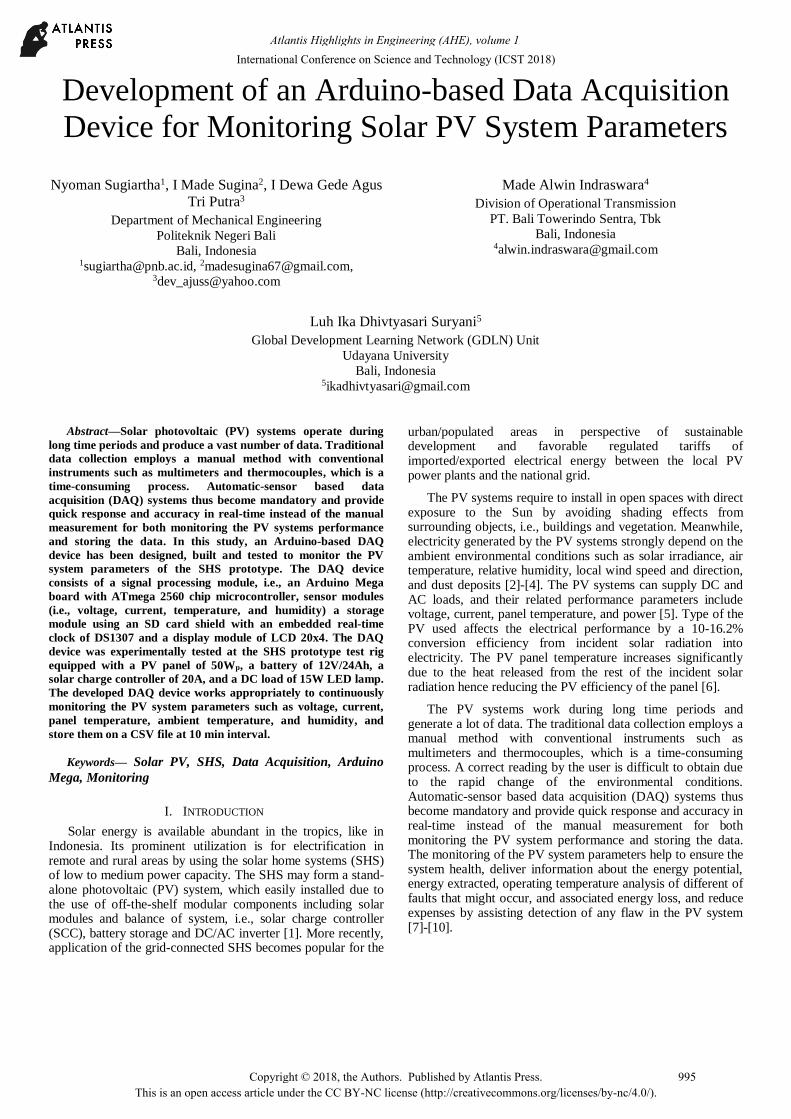
Development of an Arduino-based Data Acquisition
Device for Monitoring Solar PV System Parameters
Nyoman Sugiartha1, I Made Sugina2, I Dewa Gede Agus
Tri Putra3
Department of Mechanical Engineering
Politeknik Negeri Bali
Bali, Indonesia [email protected], [email protected],
Made Alwin Indraswara4
Division of Operational Transmission
PT. Bali Towerindo Sentra, Tbk
Bali, Indonesia [email protected]
Luh Ika Dhivtyasari Suryani5
Global Development Learning Network (GDLN) Unit
Udayana University
Bali, Indonesia [email protected]
Abstract—Solar photovoltaic (PV) systems operate during
long time periods and produce a vast number of data. Traditional
data collection employs a manual method with conventional
instruments such as multimeters and thermocouples, which is a
time-consuming process. Automatic-sensor based data
acquisition (DAQ) systems thus become mandatory and provide
quick response and accuracy in real-time instead of the manual
measurement for both monitoring the PV systems performance
and storing the data. In this study, an Arduino-based DAQ
device has been designed, built and tested to monitor the PV
system parameters of the SHS prototype. The DAQ device
consists of a signal processing module, i.e., an Arduino Mega
board with ATmega 2560 chip microcontroller, sensor modules
(i.e., voltage, current, temperature, and humidity) a storage
module using an SD card shield with an embedded real-time
clock of DS1307 and a display module of LCD 20x4. The DAQ
device was experimentally tested at the SHS prototype test rig
equipped with a PV panel of 50Wp, a battery of 12V/24Ah, a
solar charge controller of 20A, and a DC load of 15W LED lamp.
The developed DAQ device works appropriately to continuously
monitoring the PV system parameters such as voltage, current,
panel temperature, ambient temperature, and humidity, and
store them on a CSV file at 10 min interval.
Keywords— Solar PV, SHS, Data Acquisition, Arduino
Mega, Monitoring
I. INTRODUCTION
Solar energy is available abundant in the tropics, like in Indonesia. Its prominent utilization is for electrification in remote and rural areas by using the solar home systems (SHS) of low to medium power capacity. The SHS may form a stand-alone photovoltaic (PV) system, which easily installed due to the use of off-the-shelf modular components including solar modules and balance of system, i.e., solar charge controller (SCC), battery storage and DC/AC inverter [1]. More recently, application of the grid-connected SHS becomes popular for the
urban/populated areas in perspective of sustainable development and favorable regulated tariffs of imported/exported electrical energy between the local PV power plants and the national grid.
The PV systems require to install in open spaces with direct exposure to the Sun by avoiding shading effects from surrounding objects, i.e., buildings and vegetation. Meanwhile, electricity generated by the PV systems strongly depend on the ambient environmental conditions such as solar irradiance, air temperature, relative humidity, local wind speed and direction, and dust deposits [2]-[4]. The PV systems can supply DC and AC loads, and their related performance parameters include voltage, current, panel temperature, and power [5]. Type of the PV used affects the electrical performance by a 10-16.2% conversion efficiency from incident solar radiation into electricity. The PV panel temperature increases significantly due to the heat released from the rest of the incident solar radiation hence reducing the PV efficiency of the panel [6].
The PV systems work during long time periods and generate a lot of data. The traditional data collection employs a manual method with conventional instruments such as multimeters and thermocouples, which is a time-consuming process. A correct reading by the user is difficult to obtain due to the rapid change of the environmental conditions. Automatic-sensor based data acquisition (DAQ) systems thus become mandatory and provide quick response and accuracy in real-time instead of the manual measurement for both monitoring the PV system performance and storing the data. The monitoring of the PV system parameters help to ensure the system health, deliver information about the energy potential, energy extracted, operating temperature analysis of different of faults that might occur, and associated energy loss, and reduce expenses by assisting detection of any flaw in the PV system [7]-[10].
995
Atlantis Highlights in Engineering (AHE), volume 1
Copyright © 2018, the Authors. Published by Atlantis Press. This is an open access article under the CC BY-NC license (http://creativecommons.org/licenses/by-nc/4.0/).
International Conference on Science and Technology (ICST 2018)
Recent developments of the microcontroller-based DAQ devices deliver a great solution to monitor the correct operation of the PV systems. However, the commercial DAQ devices or data loggers are too expensive, demand special software with specific skills requirement, and require continuous connection to a power supply or a personal computer [11]. In this present study, the main objective is to design, build and test a customized, low-cost DAQ device for monitoring the PV system parameters of the SHS prototype. The DAQ device is based on the ATmega 2560 chip microcontroller of the Arduino Mega board with real-time data recording, low energy consumption, and utilizing open source software. The specific objective includes analyzing the PV system performance, in which its parameters are derived from the DAQ device stored data.
Numerous researches reported low-cost hardware-based monitoring systems for solar energy applications. Marfil et al., [12] developed a DAQ and control system for a prototype water-flow glazing based on the Arduino Mega ADK board. A solar test box equipped with the water-flow window was examined to compare its thermal performance towards a clear glass reference test box. The cost to build their DAQ device was around €151. Touati et al. [13] proposed a customized, cost-effective measurement system to predict the performance of polycrystalline PV modules in Doha under a harsh environment with wireless monitoring and data logging. Their system composed of an Atmega 32A microcontroller, six sensors with signal conditioning circuits, a buck-booster (DC-DC) converter with a maximum power point tracker (MPPT), X-Bee Pro wireless modules and a LabVIEW based monitoring and recording station. They found that the maximum power output of the PV modules decreases by 30% for a dust exposure of five months. Suryavanshi et al. [14] developed an online monitoring system and simulate load control of the two PV panels of 10 Wp and 20Wp based on an AVR Atmega 16 microcontroller and the use of Matlab for monitoring and logging data. Gad and Gad [9] developed a low-cost recording DAQ system for monitoring temperature data in solar installation. They employed sixteen analog temperature sensors of LM35DZ, an Atmega 2560 microcontroller, a master control board of PIC18F46K20 and an SD card shield for storing sensors data. The data was stored on a comma-separated values (CSV) file with a sampling rate of 5 min.
II. METHODOLOGY
2.1. Materials and Design
The development of the DAQ device is performed in five steps. First: determine main components and related accessories by considering easily obtained hardware with proper accuracy and availability of open source software. Second: design the DAQ device circuit and the components layout. Third: write, compile and upload programming codes on the Arduino board using the Arduino IDE. Fourth: calibrate sensors and test functional work of the DAQ device. Fifth: conduct performance tests on the SHS prototype.
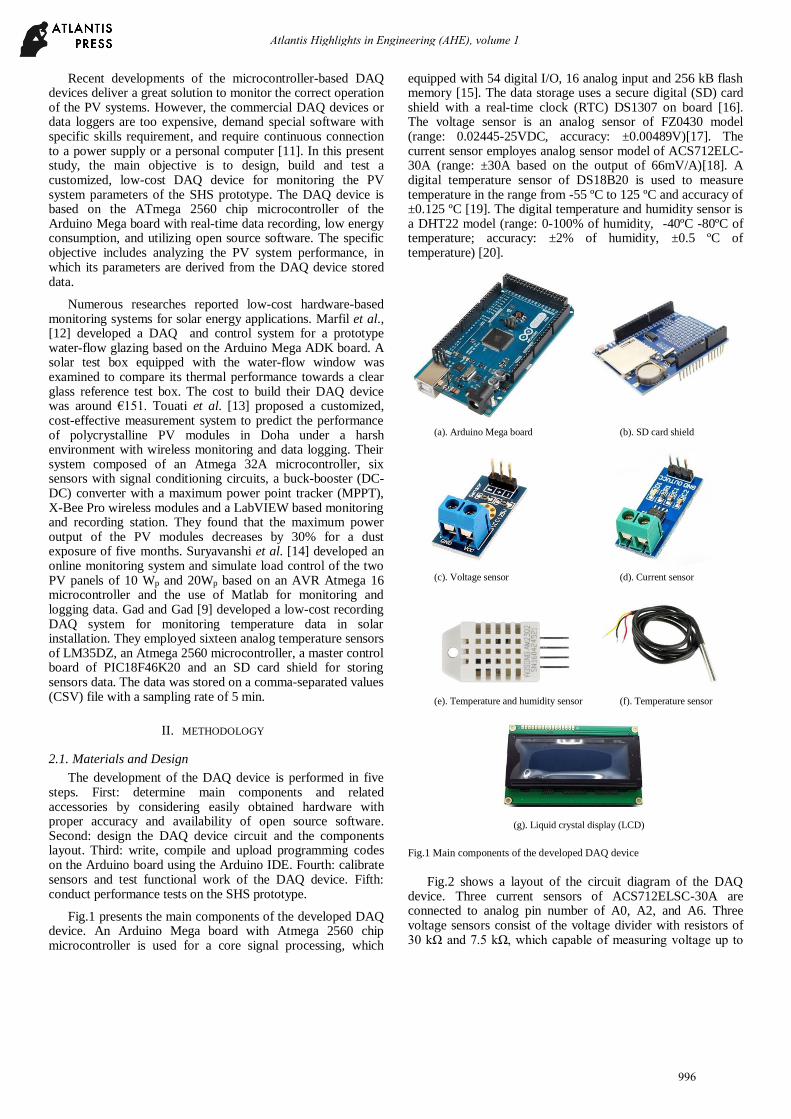
Fig.1 presents the main components of the developed DAQ device. An Arduino Mega board with Atmega 2560 chip microcontroller is used for a core signal processing, which
equipped with 54 digital I/O, 16 analog input and 256 kB flash memory [15]. The data storage uses a secure digital (SD) card shield with a real-time clock (RTC) DS1307 on board [16]. The voltage sensor is an analog sensor of FZ0430 model (range: 0.02445-25VDC, accuracy: ±0.00489V)[17]. The current sensor employes analog sensor model of ACS712ELC-30A (range: ±30A based on the output of 66mV/A)[18]. A digital temperature sensor of DS18B20 is used to measure temperature in the range from -55 ºC to 125 ºC and accuracy of ±0.125 ºC [19]. The digital temperature and humidity sensor is a DHT22 model (range: 0-100% of humidity, -40ºC -80ºC of temperature; accuracy: ±2% of humidity, ±0.5 ºC of temperature) [20].
Fig.1 Main components of the developed DAQ device
Fig.2 shows a layout of the circuit diagram of the DAQ
device. Three current sensors of ACS712ELSC-30A are connected to analog pin number of A0, A2, and A6. Three voltage sensors consist of the voltage divider with resistors of 30 kΩ and 7.5 kΩ, which capable of measuring voltage up to
(a). Arduino Mega board (b). SD card shield
(c). Voltage sensor (d). Current sensor
(e). Temperature and humidity sensor (f). Temperature sensor
(g). Liquid crystal display (LCD)
996
Atlantis Highlights in Engineering (AHE), volume 1
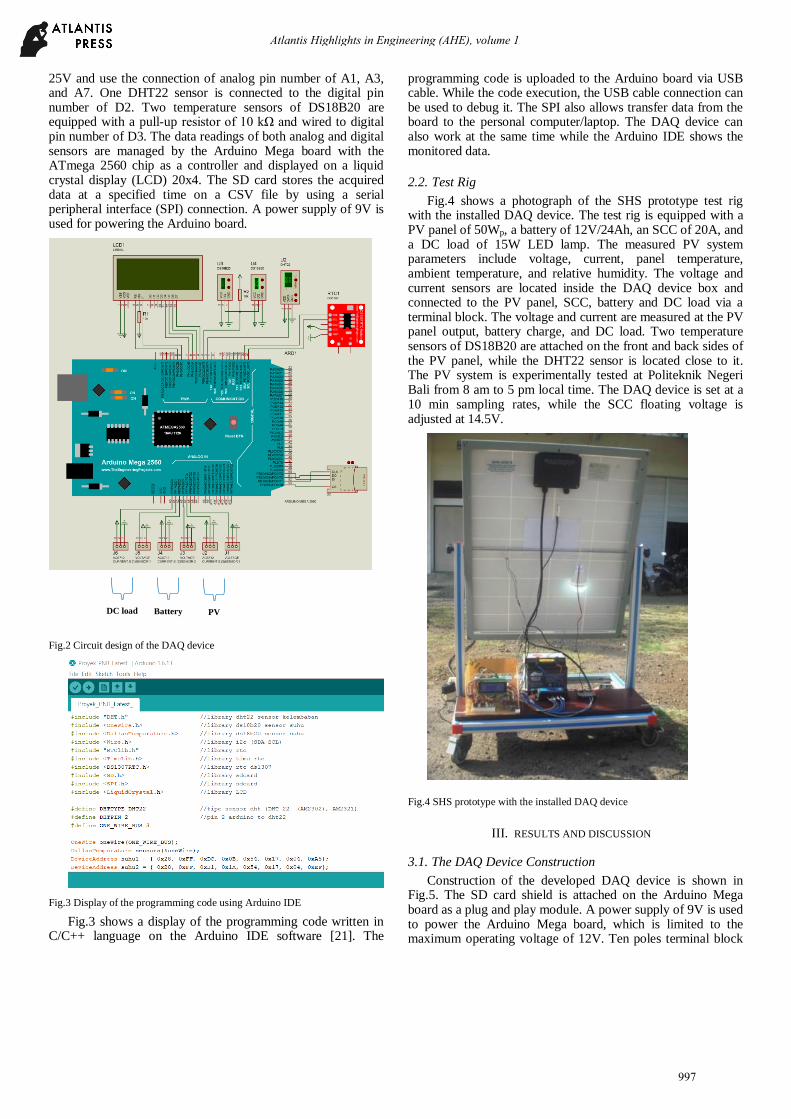
25V and use the connection of analog pin number of A1, A3, and A7. One DHT22 sensor is connected to the digital pin number of D2. Two temperature sensors of DS18B20 are equipped with a pull-up resistor of 10 kΩ and wired to digital pin number of D3. The data readings of both analog and digital sensors are managed by the Arduino Mega board with the ATmega 2560 chip as a controller and displayed on a liquid crystal display (LCD) 20x4. The SD card stores the acquired data at a specified time on a CSV file by using a serial peripheral interface (SPI) connection. A power supply of 9V is used for powering the Arduino board.
Fig.2 Circuit design of the DAQ device
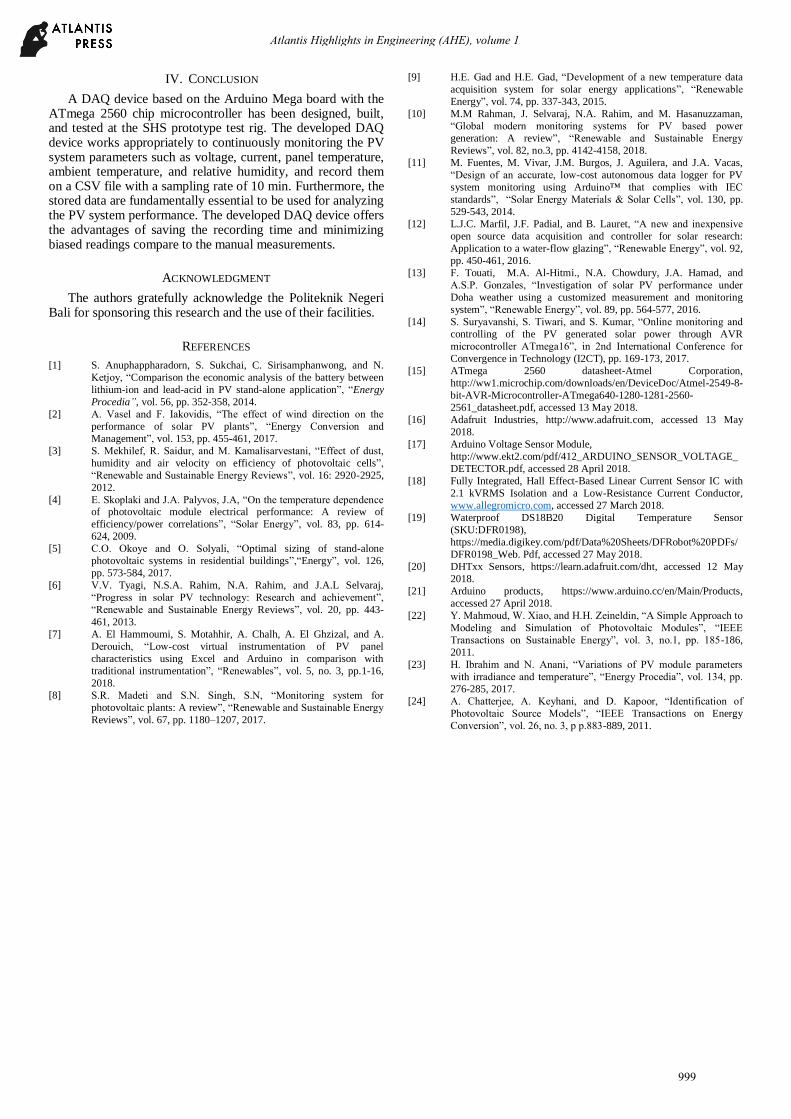
Fig.3 Display of the programming code using Arduino IDE
Fig.3 shows a display of the programming code written in C/C++ language on the Arduino IDE software [21]. The
programming code is uploaded to the Arduino board via USB cable. While the code execution, the USB cable connection can be used to debug it. The SPI also allows transfer data from the board to the personal computer/laptop. The DAQ device can also work at the same time while the Arduino IDE shows the monitored data.
2.2. Test Rig
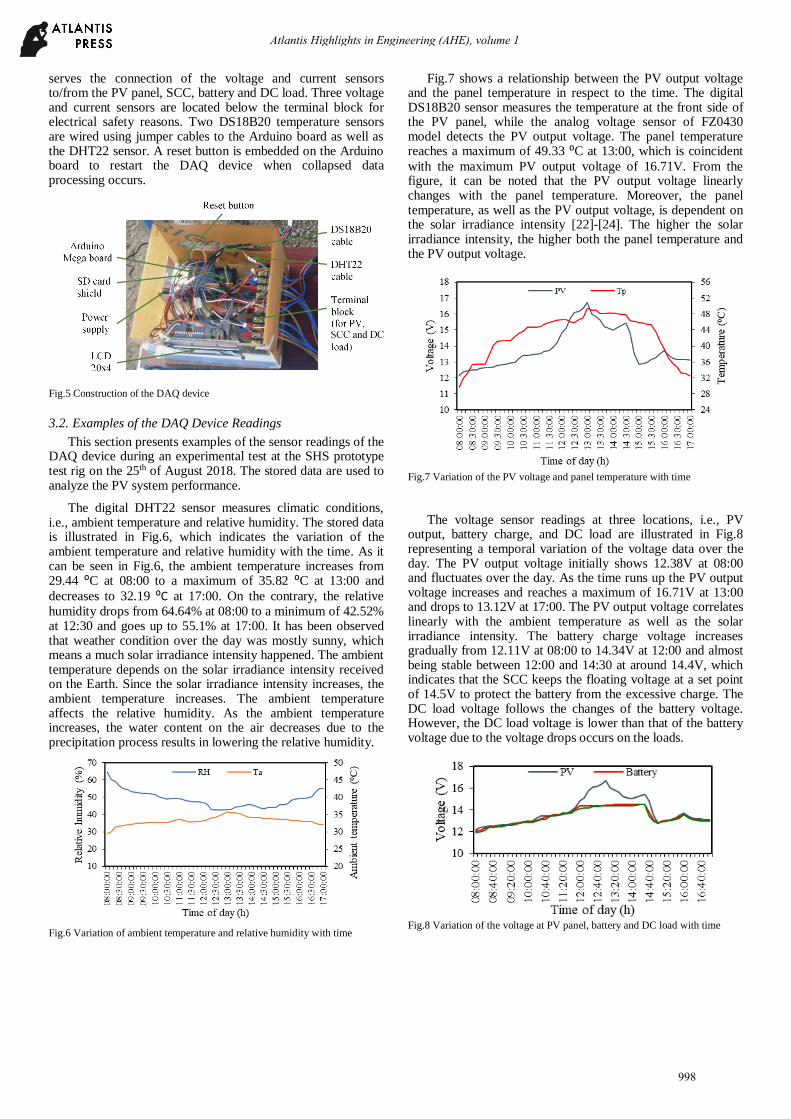
Fig.4 shows a photograph of the SHS prototype test rig with the installed DAQ device. The test rig is equipped with a PV panel of 50Wp, a battery of 12V/24Ah, an SCC of 20A, and a DC load of 15W LED lamp. The measured PV system parameters include voltage, current, panel temperature, ambient temperature, and relative humidity. The voltage and current sensors are located inside the DAQ device box and connected to the PV panel, SCC, battery and DC load via a terminal block. The voltage and current are measured at the PV panel output, battery charge, and DC load. Two temperature sensors of DS18B20 are attached on the front and back sides of the PV panel, while the DHT22 sensor is located close to it. The PV system is experimentally tested at Politeknik Negeri Bali from 8 am to 5 pm local time. The DAQ device is set at a 10 min sampling rates, while the SCC floating voltage is adjusted at 14.5V.
Fig.4 SHS prototype with the installed DAQ device
III. RESULTS AND DISCUSSION
3.1. The DAQ Device Construction
Construction of the developed DAQ device is shown in Fig.5. The SD card shield is attached on the Arduino Mega board as a plug and play module. A power supply of 9V is used to power the Arduino Mega board, which is limited to the maximum operating voltage of 12V. Ten poles terminal block
DC load Battery PV
997
Atlantis Highlights in Engineering (AHE), volume 1
serves the connection of the voltage and current sensors to/from the PV panel, SCC, battery and DC load. Three voltage and current sensors are located below the terminal block for electrical safety reasons. Two DS18B20 temperature sensors are wired using jumper cables to the Arduino board as well as the DHT22 sensor. A reset button is embedded on the Arduino board to restart the DAQ device when collapsed data processing occurs.
Fig.5 Construction of the DAQ device
3.2. Examples of the DAQ Device Readings
This section presents examples of the sensor readings of the DAQ device during an experimental test at the SHS prototype test rig on the 25th of August 2018. The stored data are used to analyze the PV system performance.
The digital DHT22 sensor measures climatic conditions, i.e., ambient temperature and relative humidity. The stored data is illustrated in Fig.6, which indicates the variation of the ambient temperature and relative humidity with the time. As it can be seen in Fig.6, the ambient temperature increases from 29.44 ⁰C at 08:00 to a maximum of 35.82 ⁰C at 13:00 and
decreases to 32.19 ⁰C at 17:00. On the contrary, the relative
humidity drops from 64.64% at 08:00 to a minimum of 42.52% at 12:30 and goes up to 55.1% at 17:00. It has been observed that weather condition over the day was mostly sunny, which means a much solar irradiance intensity happened. The ambient temperature depends on the solar irradiance intensity received on the Earth. Since the solar irradiance intensity increases, the ambient temperature increases. The ambient temperature affects the relative humidity. As the ambient temperature increases, the water content on the air decreases due to the precipitation process results in lowering the relative humidity.
Fig.6 Variation of ambient temperature and relative humidity with time
Fig.7 shows a relationship between the PV output voltage and the panel temperature in respect to the time. The digital DS18B20 sensor measures the temperature at the front side of the PV panel, while the analog voltage sensor of FZ0430 model detects the PV output voltage. The panel temperature reaches a maximum of 49.33 ⁰C at 13:00, which is coincident
with the maximum PV output voltage of 16.71V. From the figure, it can be noted that the PV output voltage linearly changes with the panel temperature. Moreover, the panel temperature, as well as the PV output voltage, is dependent on the solar irradiance intensity [22]-[24]. The higher the solar irradiance intensity, the higher both the panel temperature and the PV output voltage.
Fig.7 Variation of the PV voltage and panel temperature with time
The voltage sensor readings at three locations, i.e., PV output, battery charge, and DC load are illustrated in Fig.8 representing a temporal variation of the voltage data over the day. The PV output voltage initially shows 12.38V at 08:00 and fluctuates over the day. As the time runs up the PV output voltage increases and reaches a maximum of 16.71V at 13:00 and drops to 13.12V at 17:00. The PV output voltage correlates linearly with the ambient temperature as well as the solar irradiance intensity. The battery charge voltage increases gradually from 12.11V at 08:00 to 14.34V at 12:00 and almost being stable between 12:00 and 14:30 at around 14.4V, which indicates that the SCC keeps the floating voltage at a set point of 14.5V to protect the battery from the excessive charge. The DC load voltage follows the changes of the battery voltage. However, the DC load voltage is lower than that of the battery voltage due to the voltage drops occurs on the loads.
Fig.8 Variation of the voltage at PV panel, battery and DC load with time
998
Atlantis Highlights in Engineering (AHE), volume 1
IV. CONCLUSION
A DAQ device based on the Arduino Mega board with the ATmega 2560 chip microcontroller has been designed, built, and tested at the SHS prototype test rig. The developed DAQ device works appropriately to continuously monitoring the PV system parameters such as voltage, current, panel temperature, ambient temperature, and relative humidity, and record them on a CSV file with a sampling rate of 10 min. Furthermore, the stored data are fundamentally essential to be used for analyzing the PV system performance. The developed DAQ device offers the advantages of saving the recording time and minimizing biased readings compare to the manual measurements.
ACKNOWLEDGMENT
The authors gratefully acknowledge the Politeknik Negeri Bali for sponsoring this research and the use of their facilities.
REFERENCES
[1] S. Anuphappharadorn, S. Sukchai, C. Sirisamphanwong, and N.
Ketjoy, “Comparison the economic analysis of the battery between
lithium-ion and lead-acid in PV stand-alone application”, “Energy
Procedia”, vol. 56, pp. 352-358, 2014.
[2] A. Vasel and F. Iakovidis, “The effect of wind direction on the
performance of solar PV plants”, “Energy Conversion and
Management”, vol. 153, pp. 455-461, 2017.
[3] S. Mekhilef, R. Saidur, and M. Kamalisarvestani, “Effect of dust,
humidity and air velocity on efficiency of photovoltaic cells”,
“Renewable and Sustainable Energy Reviews”, vol. 16: 2920-2925,
2012.
[4] E. Skoplaki and J.A. Palyvos, J.A, “On the temperature dependence of photovoltaic module electrical performance: A review of
efficiency/power correlations”, “Solar Energy”, vol. 83, pp. 614-
624, 2009.
[5] C.O. Okoye and O. Solyali, “Optimal sizing of stand-alone
photovoltaic systems in residential buildings”,“Energy”, vol. 126,
pp. 573-584, 2017.
[6] V.V. Tyagi, N.S.A. Rahim, N.A. Rahim, and J.A.L Selvaraj,
“Progress in solar PV technology: Research and achievement”,
“Renewable and Sustainable Energy Reviews”, vol. 20, pp. 443-
461, 2013.
[7] A. El Hammoumi, S. Motahhir, A. Chalh, A. El Ghzizal, and A.
Derouich, “Low‑cost virtual instrumentation of PV panel
characteristics using Excel and Arduino in comparison with
traditional instrumentation”, “Renewables”, vol. 5, no. 3, pp.1-16,
2018.
[8] S.R. Madeti and S.N. Singh, S.N, “Monitoring system for
photovoltaic plants: A review”, “Renewable and Sustainable Energy
Reviews”, vol. 67, pp. 1180–1207, 2017.
[9] H.E. Gad and H.E. Gad, “Development of a new temperature data
acquisition system for solar energy applications”, “Renewable
Energy”, vol. 74, pp. 337-343, 2015.
[10] M.M Rahman, J. Selvaraj, N.A. Rahim, and M. Hasanuzzaman,
“Global modern monitoring systems for PV based power
generation: A review”, “Renewable and Sustainable Energy
Reviews”, vol. 82, no.3, pp. 4142-4158, 2018.
[11] M. Fuentes, M. Vivar, J.M. Burgos, J. Aguilera, and J.A. Vacas,
“Design of an accurate, low-cost autonomous data logger for PV
system monitoring using Arduino™ that complies with IEC
standards”, “Solar Energy Materials & Solar Cells”, vol. 130, pp.
529-543, 2014.
[12] L.J.C. Marfil, J.F. Padial, and B. Lauret, “A new and inexpensive
open source data acquisition and controller for solar research:
Application to a water-flow glazing”, “Renewable Energy”, vol. 92,
pp. 450-461, 2016.
[13] F. Touati, M.A. Al-Hitmi., N.A. Chowdury, J.A. Hamad, and
A.S.P. Gonzales, “Investigation of solar PV performance under
Doha weather using a customized measurement and monitoring
system”, “Renewable Energy”, vol. 89, pp. 564-577, 2016.
[14] S. Suryavanshi, S. Tiwari, and S. Kumar, “Online monitoring and
controlling of the PV generated solar power through AVR
microcontroller ATmega16”, in 2nd International Conference for
Convergence in Technology (I2CT), pp. 169-173, 2017.
[15] ATmega 2560 datasheet-Atmel Corporation,
http://ww1.microchip.com/downloads/en/DeviceDoc/Atmel-2549-8-
bit-AVR-Microcontroller-ATmega640-1280-1281-2560-
2561_datasheet.pdf, accessed 13 May 2018.
[16] Adafruit Industries, http://www.adafruit.com, accessed 13 May
2018.
[17] Arduino Voltage Sensor Module,
http://www.ekt2.com/pdf/412_ARDUINO_SENSOR_VOLTAGE_
DETECTOR.pdf, accessed 28 April 2018.
[18] Fully Integrated, Hall Effect-Based Linear Current Sensor IC with
2.1 kVRMS Isolation and a Low-Resistance Current Conductor,
www.allegromicro.com, accessed 27 March 2018.
[19] Waterproof DS18B20 Digital Temperature Sensor
(SKU:DFR0198),
https://media.digikey.com/pdf/Data%20Sheets/DFRobot%20PDFs/
DFR0198_Web. Pdf, accessed 27 May 2018.
[20] DHTxx Sensors, https://learn.adafruit.com/dht, accessed 12 May
2018.
[21] Arduino products, https://www.arduino.cc/en/Main/Products,
accessed 27 April 2018.
[22] Y. Mahmoud, W. Xiao, and H.H. Zeineldin, “A Simple Approach to
Modeling and Simulation of Photovoltaic Modules”, “IEEE
Transactions on Sustainable Energy”, vol. 3, no.1, pp. 185-186,
2011.
[23] H. Ibrahim and N. Anani, “Variations of PV module parameters
with irradiance and temperature”, “Energy Procedia”, vol. 134, pp.
276-285, 2017.
[24] A. Chatterjee, A. Keyhani, and D. Kapoor, “Identification of
Photovoltaic Source Models”, “IEEE Transactions on Energy
Conversion”, vol. 26, no. 3, p p.883-889, 2011.
999
Atlantis Highlights in Engineering (AHE), volume 1