Embed Size (px)
Citation preview
Alexandria Engineering Journal (2013) 52, 447–454
Alexandria University
Alexandria Engineering Journal
www.elsevier.com/locate/aejwww.sciencedirect.com
ORIGINAL ARTICLE
Development of an Advanced Public Transportation
System for captive commuters on urban arterials in Ilorin,
Nigeria
Oluwafemi O. Adeleke *, Yinusa Alaro Jimoh, Mutiu A. Akinpelu
Department of Civil Engineering, University of Ilorin, PMB 1515, Ilorin, Nigeria
Received 21 December 2012; revised 4 March 2013; accepted 6 April 2013Available online 7 May 2013
*
E-
ya
Pe
U
11
ht
KEYWORDS
Captive commuters
Advanced Public Transpor-
tation System
Automated Trip Scheduling
Digital Geographic Database
Corresponding author. Tel.:
mail addresses: victorsgate@
hoo.com (Y.A. Jimoh).
er review under responsibility
niversity.
Production an
10-0168 ª 2013 Production
tp://dx.doi.org/10.1016/j.aej.2
+234 80
yahoo.com
of Facu
d hostin
and hosti
013.04.0
Abstract The study developed an Advanced Public Transportation System (APTS) software pack-
age that serves as an intelligent movement system for captive commuters. Although a typical APTS
has an Automated Trip Scheduling System (ATSS), a Digital Geographic Database (DGD), and an
Automated Vehicle Location Equipment (AVLE) as subsystems, the fact that vehicles in the study
area are not equipped with AVLE made the authors to design for an APTS that has only the ATSS
and DGD components. The ATSS subsystem has the specific objectives of reducing commuters
waiting time at bus terminals, automating trip booking thus assuring a passenger of the availability
of a bus and also keeps an inventory of passengers and trips made by commuters and the vehicles.
The DGD allows maps of the service area to be displayed to the scheduler/operator and the com-
muters/clients on computer screen. The Ilorin metropolis a typical urban center in Nigeria, a devel-
oping economy, is used as the study area. Nigeria stands to benefit from ITS potentials if the
developed package is put to use by urban transit operators.ª 2013 Production and hosting by Elsevier B.V. on behalf of Faculty of Engineering, Alexandria
University.
1. Introduction
The transportation challenges experienced in most Nigerianurban centers include traffic congestion, inadequate provision
60812278.
(O.O.Adeleke), dryajimoh@
lty of Engineering, Alexandria
g by Elsevier
ng by Elsevier B.V. on behalf of F
04
of carriers for commuters in quantity and timeliness, poor traf-fic management, poor condition of roads, attitudinal behaviorof drivers, among others. The situation calls for a very strong
push by all stakeholders in the transportation sector to en-hance the service performance of transportation facilities usingIntelligent Transportation System (ITS). A study [1] enumer-ated the hindrances militating against Nigeria in benefiting
from ITS potentials to include low level or total absence ofeither in-vehicle or facility based navigation systems, electronicsensors, traffic surveillance and control, information gathering
and communication as well as traffic analytical computer hard-ware and software. Finance and skilled manpower are theother important factors identified. The authors were however
aculty of Engineering, Alexandria University.
448 O.O. Adeleke et al.
of the opinion that considering the level of technological andtechnical (manpower) capability and potentials of Nigeria,the country can begin to benefit from the innovative ITS espe-
cially in the aspects relating to the Pre-trip Travel Information,Route Guidance and Travelers Information subsystems andhence advocated for government and private sector driven pol-
icies toward this objective. This paper reports a software pack-age developed for Advanced Public Transportation System.
Advanced Public Transportation System consists of three
related technologies: A Digital Geographic Database (DGD),An Automated Trip Scheduling System (ATSS), and Auto-mated Vehicle Location Equipment (AVLE) [2,3]. However,because the commercial vehicles and indeed almost all the
vehicles in the study area are not installed with AVLE, this as-pect of APTS is not included in the developed softwarepackage.
The aim of the study was therefore to develop an APTSsoftware with a DGD and ATSS capabilities/functionalities.The DGD allows maps of the service area to be displayed to
the scheduler/operator and the commuters/clients on the com-puter screen. The ATSS subsystem has the specific objectivesof reducing commuters waiting time at bus terminals by auto-
mating trip booking thus assuring a passenger of the availabil-ity of a bus. The ATSS subsystem also keeps an inventory ofpassengers and trips made by commuters and the vehicles(carriers).
2. Literature review/state-of-art
This section discusses/describes the implementation status
(state-of-art) of advances in technologies as implemented inthe public transportation industry. Many public transporta-tion agencies in the developed countries like US, Japan, Korea
Britain, Canada, and a few in the developing countries such asIndia, Indonesia, Brazil among others, have been applyingtechnological advancements to improve their services [4–9].
An application which has been successfully tested and de-ployed in APTS is AVL tracking system in public transportbuses [10,11]. There are currently four major types of naviga-
tion technology employed by Automatic Vehicle Location sys-tems which include GPS Satellite Location, Signpost andOdometer, Radio Navigation and Location, and Dead-Reck-oning systems. Many AVL systems, however, use a combina-
tion of these technologies to compensate for the inherentshortcomings of using any one individual technology [10].
AVL helps in automatically determining the geographic
location of a vehicle along with its speed [4]. The real-timepositional information of vehicles is delivered via telephone,touch screen kiosk, internet through website, PDA/Mobile
(SMS), and LED display screen at bus stations [10,4]. Thetransmitted information may include both the predictionabout arrival/departure time and information about natureand cause of disruption, if any [4,12,13]. Analysis of the
AVL system data would give such information as idle timesof vehicles, speed violation, non-completion of trips, cancel-ation of trips, skipping of bus stops, etc. [4]. Benefits of AVL
include improved fleet management through better time man-agement and optimum utilization of available fleet and crew[4,14].
State-of-the-art advances in GIS application as acomponent of APTS have occurred in several areas, with many
regional and enterprise-wide GIS systems implemented bytransit agencies. GIS systems are used as tools for creating,managing, analyzing, and displaying spatial data. Web-based
maps and GIS applications are faster to develop and fasterto use; their features and appearances have also improved. Agrowing number of agencies are incorporating multiple views
of the spatial data, such as showing the street network in lineform, in remotely sensed images, or with the two combined.Bus locations can also be displayed on GIS maps. In addition,
LIDAR (Light Detection and Ranging) data, which providesspatial data with x–y–z coordinates, is starting to be used ina few transit applications. TriMet software for example is re-ported to have produced some of the most progressive GIS
applications in the US [10,11].APTS as deployed in developed countries also include
Automatic Passengers Counters (APCs). In APC treadle mats,
horizontal or vertical infrared beams, or machine vision appli-cations record the time, location and number of boarding andalighting passengers (and thus passenger load) at each stop
[10,11]. APC counts are used for service planning. Electronic(or automatic) fare collection is done through efficient cashlesspassenger fare payment system, incorporating magnetic stripe
fare cards or smartcards, fare validation devices, turnstiles,and ticket vending machines. Fare collection can be on-boardor off-board the bus [8,15].
3. Study area
Ilorin, the capital city of Kwara State in Nigeria, is a typicalgrowing city in a developing economy. The township transpor-
tation network constituted the study area. The city’s publictransportation system is largely dominated by 14-seater capac-ity buses that ply designated routes (from a terminal to an-
other). Each bus queues up at the terminal and only departsthe terminal when it is filled to capacity i.e., their departuresare not scheduled. Also, the ‘‘request or flag stop’’ bus stop
system operates in the city as there are no scheduled stopsalong operated bus routes. The bus will only stop to allowboarding or alighting if requested.
4. Materials and methods
4.1. Data collection
4.1.1. Road network
The map of the road network of Ilorin metropolis was digi-tized and the major bus terminals labeled appropriately.
4.1.2. Origin–destination survey
Considering the nature of public transport system in the studyarea where the ‘‘request or flag stop’’ bus stop system operates,there is the need to identify and determine the number and
locations of the terminals and consequently define the numberof routes to be served by the system. An origin–destinationsurvey questionnaire was administered on a sampled commer-
cial commuting bus drivers and commuting passengers withinthe metropolis. The outcome of the survey was used to developa database of the origins and destinations of commercial com-
muting bus drivers and commuters and to define the terminalsused in the study. The terminals used in the design of the
Your booking is successful
Exit
Process and access granted
Add or delete row and columnOut put result of search
Confirmavailabilityof vehicle
No
Search by date, trip, name or bus code
Input source, destinations, passenger, date and time
Enter password
Process
Output
Start
Loading of home page
Book trip, Passenger Display
Passenger list Setting
Yes
Stop
Book trip/view map
list, Setting, Exit Button
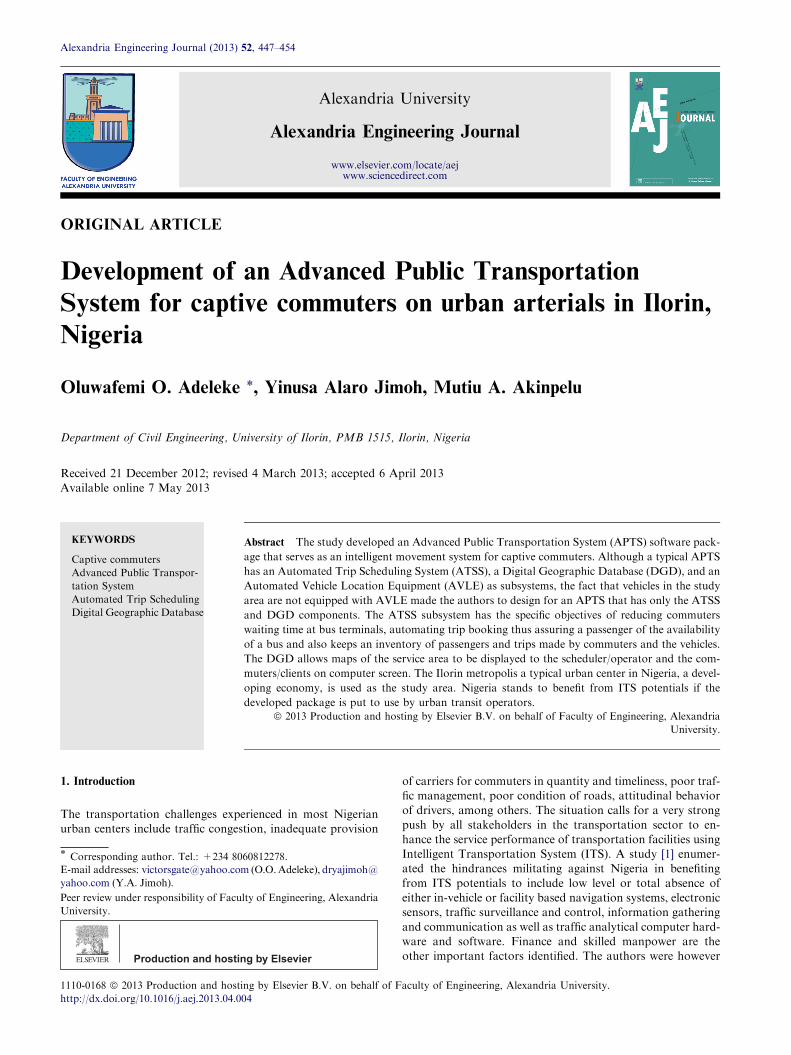
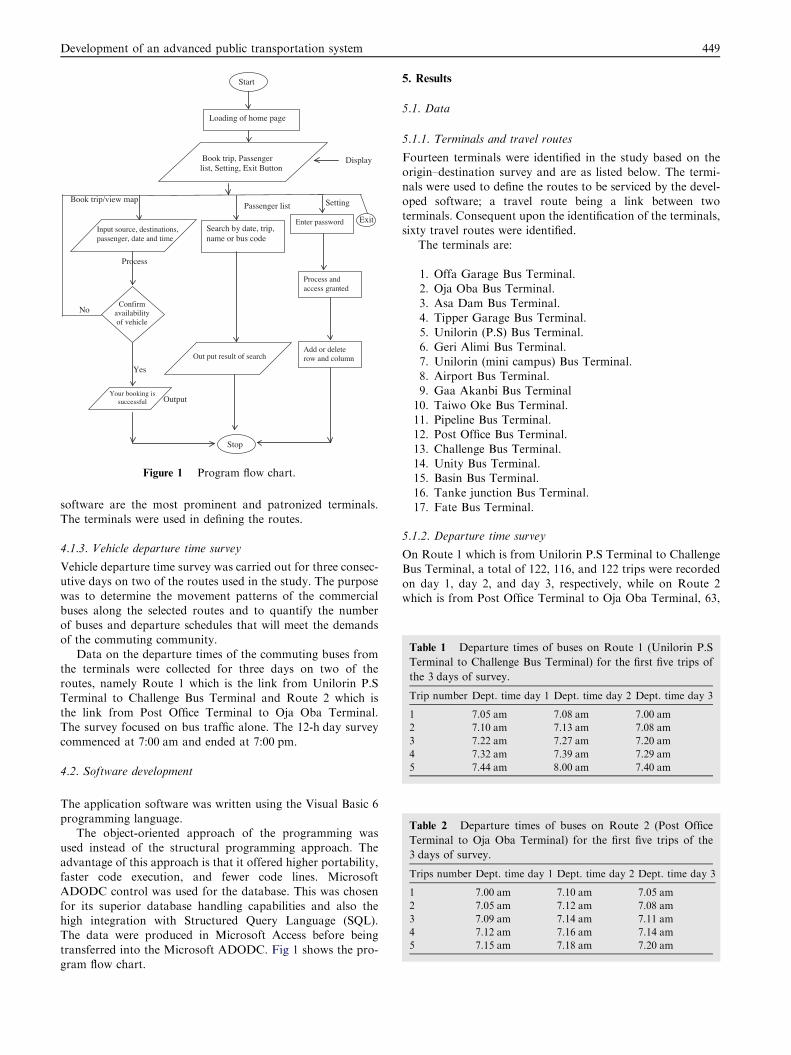
Figure 1 Program flow chart.
Table 1 Departure times of buses on Route 1 (Unilorin P.S
Terminal to Challenge Bus Terminal) for the first five trips of
the 3 days of survey.
Trip number Dept. time day 1 Dept. time day 2 Dept. time day 3
1 7.05 am 7.08 am 7.00 am
2 7.10 am 7.13 am 7.08 am
3 7.22 am 7.27 am 7.20 am
4 7.32 am 7.39 am 7.29 am
5 7.44 am 8.00 am 7.40 am
Table 2 Departure times of buses on Route 2 (Post Office
Terminal to Oja Oba Terminal) for the first five trips of the
3 days of survey.
Trips number Dept. time day 1 Dept. time day 2 Dept. time day 3
1 7.00 am 7.10 am 7.05 am
2 7.05 am 7.12 am 7.08 am
3 7.09 am 7.14 am 7.11 am
4 7.12 am 7.16 am 7.14 am
5 7.15 am 7.18 am 7.20 am
Development of an advanced public transportation system 449
software are the most prominent and patronized terminals.The terminals were used in defining the routes.
4.1.3. Vehicle departure time survey
Vehicle departure time survey was carried out for three consec-utive days on two of the routes used in the study. The purpose
was to determine the movement patterns of the commercialbuses along the selected routes and to quantify the numberof buses and departure schedules that will meet the demandsof the commuting community.
Data on the departure times of the commuting buses fromthe terminals were collected for three days on two of theroutes, namely Route 1 which is the link from Unilorin P.S
Terminal to Challenge Bus Terminal and Route 2 which isthe link from Post Office Terminal to Oja Oba Terminal.The survey focused on bus traffic alone. The 12-h day survey
commenced at 7:00 am and ended at 7:00 pm.
4.2. Software development
The application software was written using the Visual Basic 6programming language.
The object-oriented approach of the programming wasused instead of the structural programming approach. The
advantage of this approach is that it offered higher portability,faster code execution, and fewer code lines. MicrosoftADODC control was used for the database. This was chosen
for its superior database handling capabilities and also thehigh integration with Structured Query Language (SQL).The data were produced in Microsoft Access before being
transferred into the Microsoft ADODC. Fig 1 shows the pro-gram flow chart.
5. Results
5.1. Data
5.1.1. Terminals and travel routes
Fourteen terminals were identified in the study based on theorigin–destination survey and are as listed below. The termi-nals were used to define the routes to be serviced by the devel-
oped software; a travel route being a link between twoterminals. Consequent upon the identification of the terminals,sixty travel routes were identified.
The terminals are:
1. Offa Garage Bus Terminal.2. Oja Oba Bus Terminal.
3. Asa Dam Bus Terminal.4. Tipper Garage Bus Terminal.5. Unilorin (P.S) Bus Terminal.
6. Geri Alimi Bus Terminal.7. Unilorin (mini campus) Bus Terminal.8. Airport Bus Terminal.9. Gaa Akanbi Bus Terminal
10. Taiwo Oke Bus Terminal.11. Pipeline Bus Terminal.12. Post Office Bus Terminal.
13. Challenge Bus Terminal.14. Unity Bus Terminal.15. Basin Bus Terminal.
16. Tanke junction Bus Terminal.17. Fate Bus Terminal.
5.1.2. Departure time survey
On Route 1 which is from Unilorin P.S Terminal to ChallengeBus Terminal, a total of 122, 116, and 122 trips were recorded
on day 1, day 2, and day 3, respectively, while on Route 2which is from Post Office Terminal to Oja Oba Terminal, 63,
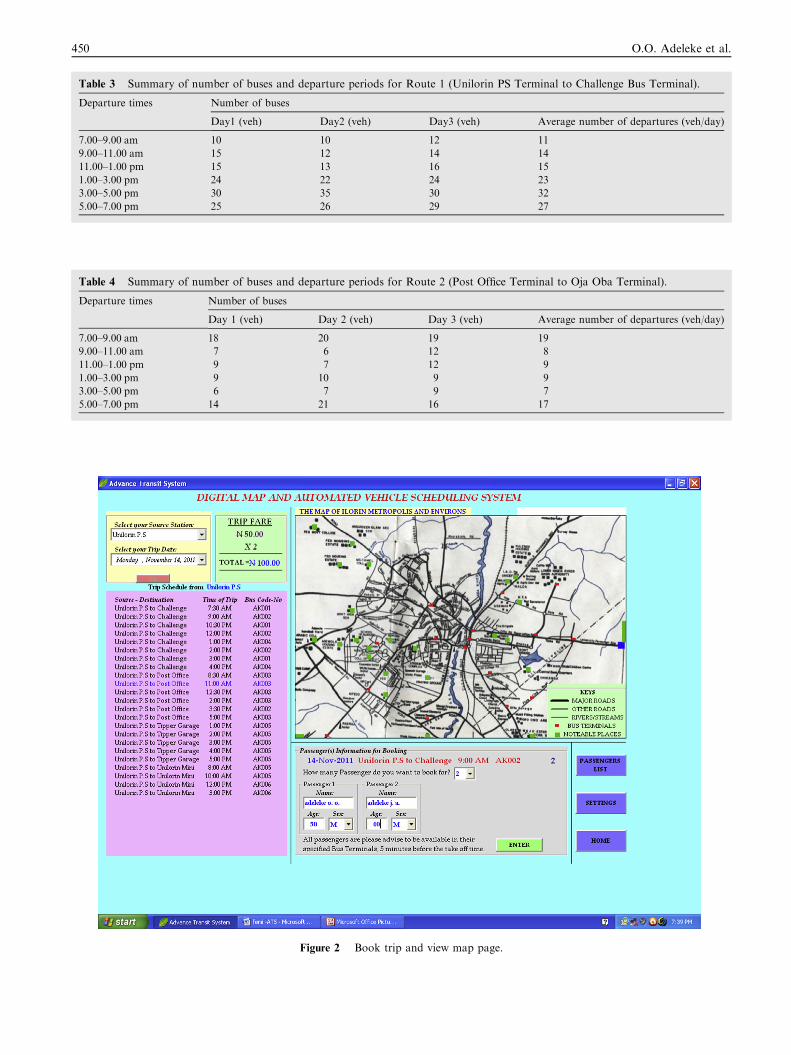
Table 3 Summary of number of buses and departure periods for Route 1 (Unilorin PS Terminal to Challenge Bus Terminal).
Departure times Number of buses
Day1 (veh) Day2 (veh) Day3 (veh) Average number of departures (veh/day)
7.00–9.00 am 10 10 12 11
9.00–11.00 am 15 12 14 14
11.00–1.00 pm 15 13 16 15
1.00–3.00 pm 24 22 24 23
3.00–5.00 pm 30 35 30 32
5.00–7.00 pm 25 26 29 27
Table 4 Summary of number of buses and departure periods for Route 2 (Post Office Terminal to Oja Oba Terminal).
Departure times Number of buses
Day 1 (veh) Day 2 (veh) Day 3 (veh) Average number of departures (veh/day)
7.00–9.00 am 18 20 19 19
9.00–11.00 am 7 6 12 8
11.00–1.00 pm 9 7 12 9
1.00–3.00 pm 9 10 9 9
3.00–5.00 pm 6 7 9 7
5.00–7.00 pm 14 21 16 17
Figure 2 Book trip and view map page.
450 O.O. Adeleke et al.
Development of an advanced public transportation system 451
70, and 64 trips were recorded on day 1, day 2, and day 3,respectively. Extract of the obtained data from the departuretime survey are given in Tables 1 and 2 for the first five trips
on each of the 3 days of the survey for Route 1 and Route 2,respectively.
The collected data from the 3-day departure time survey
were analyzed and summarized as given in Tables 3 and 4. Ta-ble 3 shows the number of buses that depart Unilorin P.S Ter-minal to Challenge Bus Terminal (Route 1) within the specified
period of the day, while Table 4 shows the number of busesthat depart Post Office Terminal for Oja Oba Terminal (Route2) within the specified period of the day.
From Table 3, since an average of eleven buses (filled to
capacity) depart between 7.00 am and 9.00 am, it is deducedthat eleven buses will be needed along Route 1 to meet the tra-vel demand of commuters along the route, and the buses will
need to be supplied between the period of 7.00 am and9.00 am at 10 min interval. Similarly, fourteen buses will needto be supplied between the period of 9.00 am and 11.00 am at
9 min interval, 15 buses between the period of 11.00 am and1.00 pm at 8 min interval, 23 buses between 1.00 pm and3.00 pm at 5 min interval, 32 buses between 3.00 pm and
5.00 pm at 4 min interval, and 27 buses between the periodof 5.00 pm and 7.00 pm at 4 min interval.
From Table 4, an average of nineteen buses at 6 min inter-val can be economically supplied between 7.00 am and
9.00 am, eight buses at 15 min interval between 9.00 am and
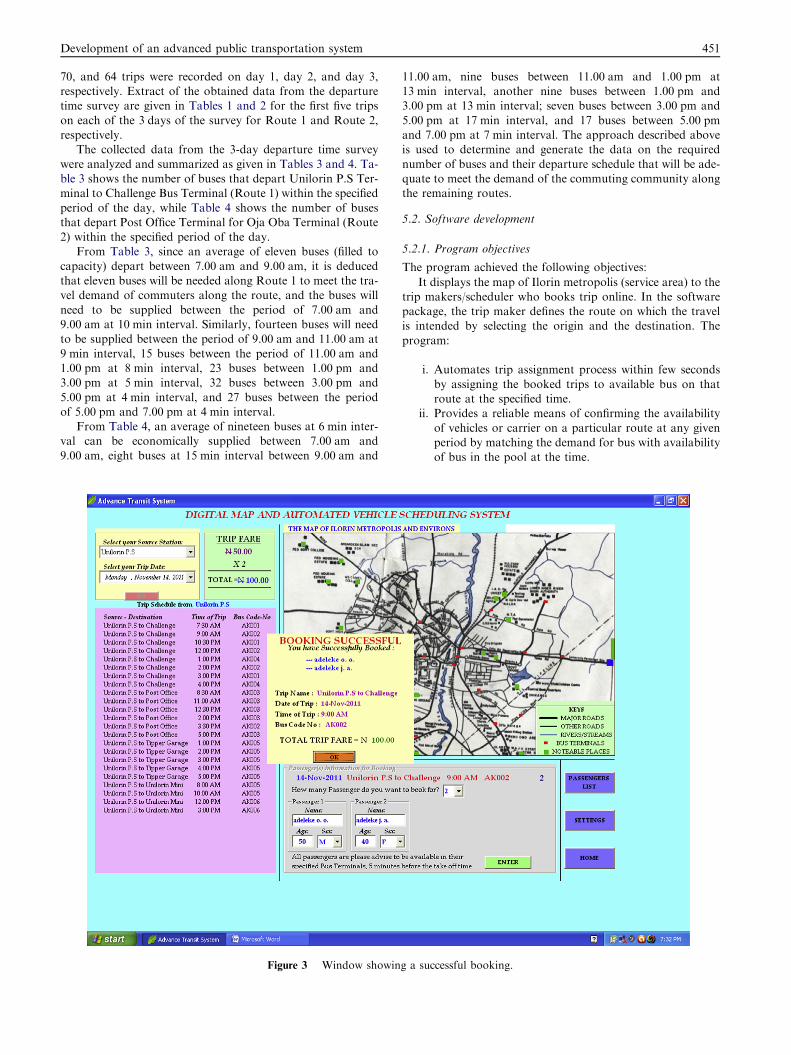
Figure 3 Window showin
11.00 am, nine buses between 11.00 am and 1.00 pm at13 min interval, another nine buses between 1.00 pm and3.00 pm at 13 min interval; seven buses between 3.00 pm and
5.00 pm at 17 min interval, and 17 buses between 5.00 pmand 7.00 pm at 7 min interval. The approach described aboveis used to determine and generate the data on the required
number of buses and their departure schedule that will be ade-quate to meet the demand of the commuting community alongthe remaining routes.
5.2. Software development
5.2.1. Program objectives
The program achieved the following objectives:
It displays the map of Ilorin metropolis (service area) to thetrip makers/scheduler who books trip online. In the softwarepackage, the trip maker defines the route on which the travelis intended by selecting the origin and the destination. The
program:
i. Automates trip assignment process within few seconds
by assigning the booked trips to available bus on thatroute at the specified time.
ii. Provides a reliable means of confirming the availability
of vehicles or carrier on a particular route at any givenperiod by matching the demand for bus with availabilityof bus in the pool at the time.
g a successful booking.
452 O.O. Adeleke et al.
iii. Keeps a comprehensive historic record for the bookings,
which the Operators can analyze for future trip scheduleplanning.
5.2.2. Application of developed package
5.2.2.1. The home page. The date and the time of the computer
system must be in correct settings before the operations canwork. The ‘‘home page’’ has four command buttons namely:
– Book trip/view map.– Setting.– Passenger list and
– Exit button.
These buttons would allow both the scheduler/operator andthe trip marker/client navigate to any part of the software
depending on the required operation.
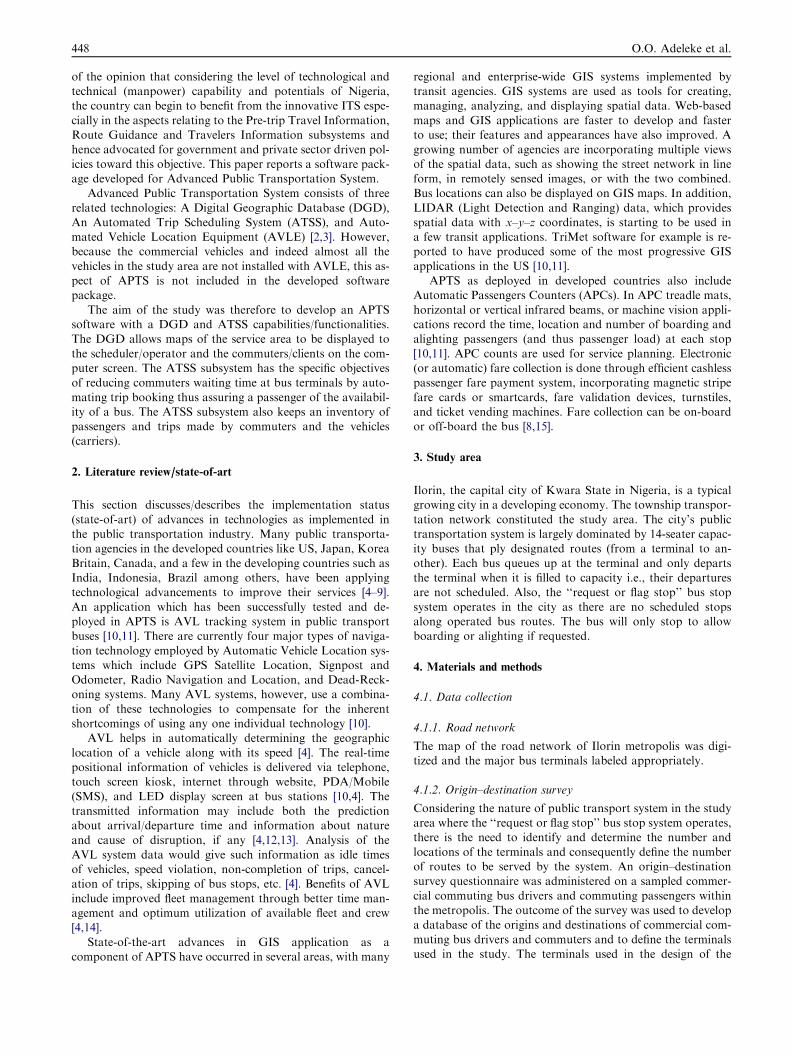
5.2.2.2. Book trip/view map page. The preview of the page is gi-
ven in Fig. 2. It is designed in a very simple way, so that sched-uler can interact with the system without the assistance of atutor. The top right-hand corner of the screen displays the
map of the Ilorin metropolis and environs. A key is providedon the map to guide both client and operator. Textbox is alsolocated at the top right-hand corner of the map to display the
bus terminals or the notable places highlighted by the cursor.
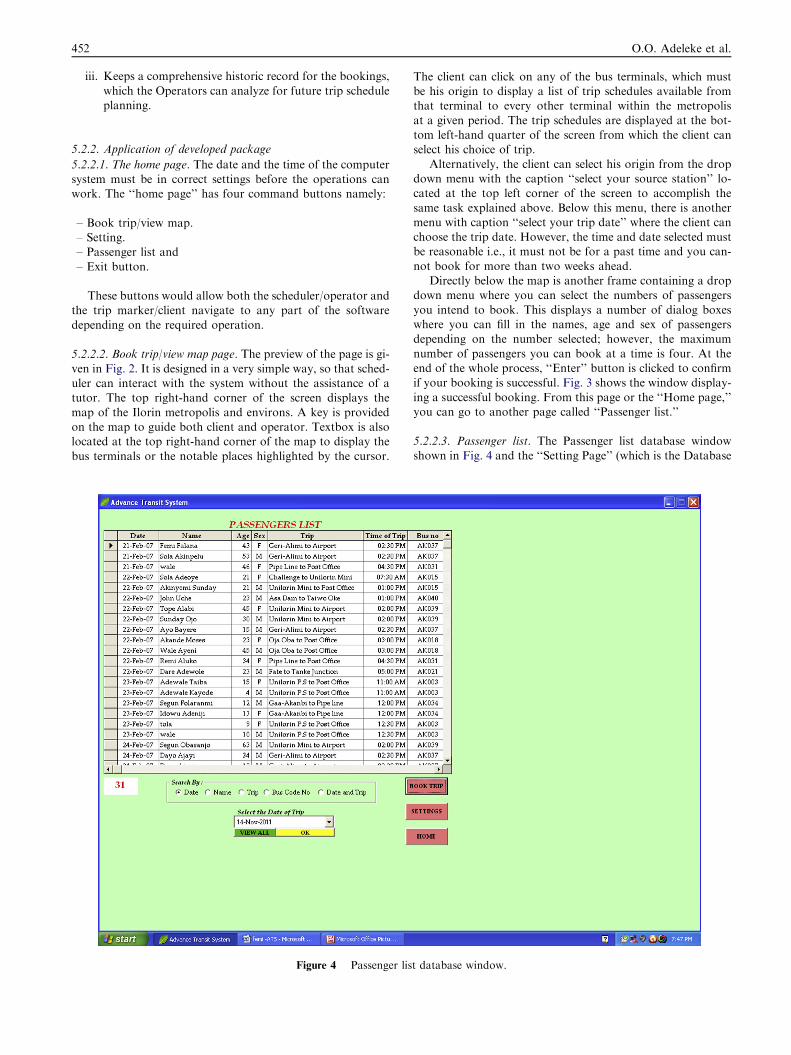
Figure 4 Passenger lis
The client can click on any of the bus terminals, which mustbe his origin to display a list of trip schedules available fromthat terminal to every other terminal within the metropolis
at a given period. The trip schedules are displayed at the bot-tom left-hand quarter of the screen from which the client canselect his choice of trip.
Alternatively, the client can select his origin from the dropdown menu with the caption ‘‘select your source station’’ lo-cated at the top left corner of the screen to accomplish the
same task explained above. Below this menu, there is anothermenu with caption ‘‘select your trip date’’ where the client canchoose the trip date. However, the time and date selected mustbe reasonable i.e., it must not be for a past time and you can-
not book for more than two weeks ahead.Directly below the map is another frame containing a drop
down menu where you can select the numbers of passengers
you intend to book. This displays a number of dialog boxeswhere you can fill in the names, age and sex of passengersdepending on the number selected; however, the maximum
number of passengers you can book at a time is four. At theend of the whole process, ‘‘Enter’’ button is clicked to confirmif your booking is successful. Fig. 3 shows the window display-
ing a successful booking. From this page or the ‘‘Home page,’’you can go to another page called ‘‘Passenger list.’’
5.2.2.3. Passenger list. The Passenger list database window
shown in Fig. 4 and the ‘‘Setting Page’’ (which is the Database
t database window.
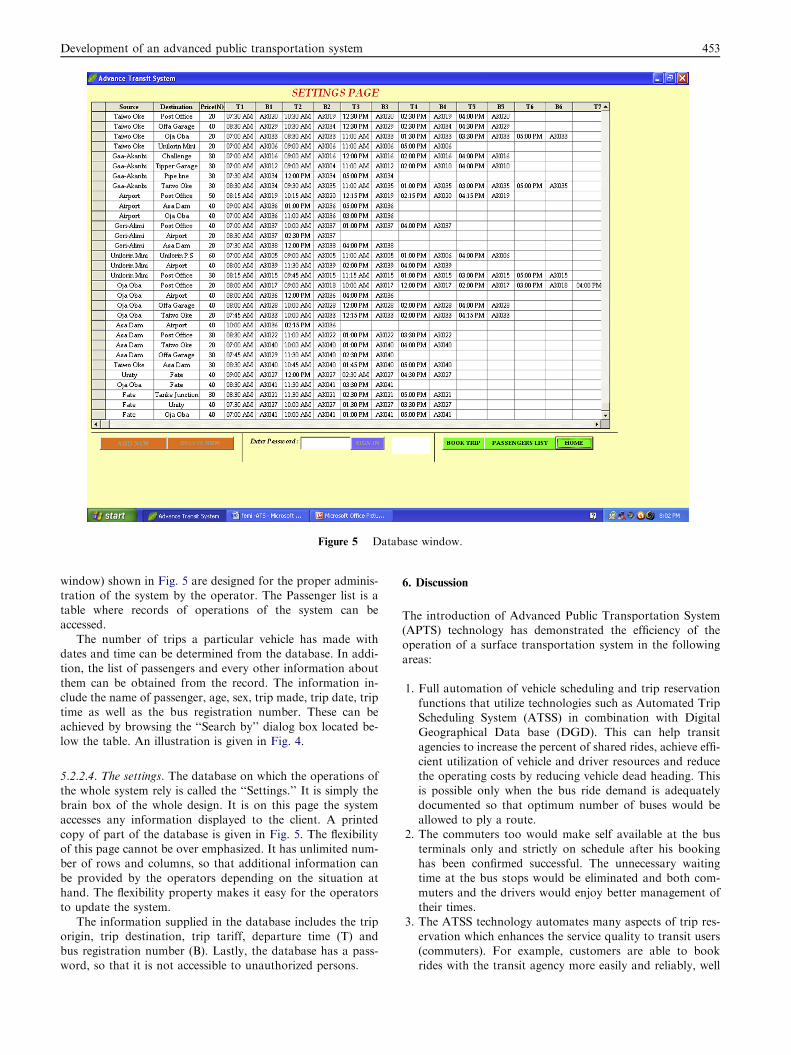
Figure 5 Database window.
Development of an advanced public transportation system 453
window) shown in Fig. 5 are designed for the proper adminis-tration of the system by the operator. The Passenger list is atable where records of operations of the system can beaccessed.
The number of trips a particular vehicle has made withdates and time can be determined from the database. In addi-tion, the list of passengers and every other information about
them can be obtained from the record. The information in-clude the name of passenger, age, sex, trip made, trip date, triptime as well as the bus registration number. These can be
achieved by browsing the ‘‘Search by’’ dialog box located be-low the table. An illustration is given in Fig. 4.
5.2.2.4. The settings. The database on which the operations ofthe whole system rely is called the ‘‘Settings.’’ It is simply thebrain box of the whole design. It is on this page the systemaccesses any information displayed to the client. A printed
copy of part of the database is given in Fig. 5. The flexibilityof this page cannot be over emphasized. It has unlimited num-ber of rows and columns, so that additional information can
be provided by the operators depending on the situation athand. The flexibility property makes it easy for the operatorsto update the system.
The information supplied in the database includes the triporigin, trip destination, trip tariff, departure time (T) andbus registration number (B). Lastly, the database has a pass-word, so that it is not accessible to unauthorized persons.
6. Discussion
The introduction of Advanced Public Transportation System(APTS) technology has demonstrated the efficiency of theoperation of a surface transportation system in the following
areas:
1. Full automation of vehicle scheduling and trip reservation
functions that utilize technologies such as Automated TripScheduling System (ATSS) in combination with DigitalGeographical Data base (DGD). This can help transit
agencies to increase the percent of shared rides, achieve effi-cient utilization of vehicle and driver resources and reducethe operating costs by reducing vehicle dead heading. Thisis possible only when the bus ride demand is adequately
documented so that optimum number of buses would beallowed to ply a route.
2. The commuters too would make self available at the bus
terminals only and strictly on schedule after his bookinghas been confirmed successful. The unnecessary waitingtime at the bus stops would be eliminated and both com-
muters and the drivers would enjoy better management oftheir times.
3. The ATSS technology automates many aspects of trip res-
ervation which enhances the service quality to transit users(commuters). For example, customers are able to bookrides with the transit agency more easily and reliably, well
454 O.O. Adeleke et al.
ahead of the actual time of the trip. The critical information
of whether vehicles are available and the operating busdeparture headways are helpful ITS framework for anurban trip making network. Furthermore, workload of
schedulers or operator could be significantly reduced asATSS is capable of providing all desired information suchas trip schedules, transportation fare, and availability ofcarriers at their finger tips while booking ride requests.
Desired information on the screen in a timely manner aswell as the headways at particular times of the day are alsoavailable.
4. Advanced Transit System keeps a comprehensive historicrecord of bookings, vehicle trips, etc. which the operatorscan analyze for proper administration of the system and
future trip schedule planning and estimation of revenuefor the operation of commuting vehicles in a fleet.
The following are however the limitations of the developed
ATSS software;
1. The software cannot handle more than thirty trip schedules
for a given route in a day.2. The DGD highlights only the origin when a given route is
selected.
3. The software only reflects journeys from one terminal toanother.
7. Conclusion and recommendations
The benefits derivable from the implementation of developed
Advanced Public Transportation System software (APTS) in-clude the follows:
1. It reduces commuters waiting time at bus terminals, auto-
mates trip booking thus assuring a passenger of the avail-ability of a bus and keeps an inventory of passengers andtrips made by commuters and the vehicles (carriers).
2. The DGD allows maps of the service area to be displayedto the scheduler/operator and the commuters/clients oncomputer screen.
3. APTS can be more efficiently operated with the availabilityof Automated Vehicle Location Equipment (AVLE). Incase of a trip cancelation as a result of traffic incident such
as vehicle breakdown, it would be easy to alter the ATSS-built trip plans for the vehicle in-real-time with AVLE asAVLE provides real-time information about the vehiclelocation and status. Efforts should be made by Govern-
ments of developing nations to establish industries, whichwill develop necessary technology to produce AVL equip-ment to enhance transportation services.
4. Governments of developing nations should encourage andprovide incentives for demonstration of projects with theAPTS technology in various localities and under differing
conditions so as to advance the use of such systems in thecountry.
References
[1] Y.A. Jimoh, O.O. Adeleke, Potential benefits of intelligent
transportation system (ITS) in Nigeria, USEP: Journal of
Research in Civil Engineering 2 (1) (2005) 46–56.
[2] T. Chira-chavala, C. Venter, Advanced Paratransit System: an
Application of Digital Map, Automated Vehicle Scheduling and
Vehicle Location System, Institute of Transportation Studies,
University of California, Berkeley, 1997.
[3] Federal Highway Administration, Intelligent Transportation
System Architecture and Standards. Federal Highway Admin.
23CFR, Parts 655 and 940 USA, 2002.
[4] H.M. Naqvi, Applications of ITS in bus transit. National
Workshop on Intelligent Transportation System, Pune, India,
25–26 June, 2010.
[5] V. Vieira, A.C. Salgado, P. Tedesco, V. Times, C. Ferraz, H.
Huzita, A.P. Chaves, I. Steinmacher, The UbiBus Project: Using
Context and Ubiquitous Computing to build Advanced Public
Transportation Systems to Support Bus Passengers. <http://
www.cin.ufpe.br/~ubibus/artigos/
VieiraEtAl_UBIBUS_SBSI2012.pdf> (Web 24.02.13).
[6] K.V.R.R. Shankar, Applications of advanced technologies to
transportation systems in Indian context, International Journal
of Earth Sciences and Engineering 04 (06 SPL) (2011) 394–397.
[7] US Department of Transportation, Advanced Public
Transportation Systems: The State of the Art, Update ’94, US
Department of Transportation, 1994.
[8] World Resource Institute, Modernising Public Transportation:
Lessons learned from major bus improvements in Latin America
and Asia, The WRI Center for Sustainable Transport, USA,
2010.
[9] L. Vanajakshi, G. Ramadurai, A. Anand, Intelligent
Transportation Systems, Synthesis Report on ITS Including
Issues and Challenges in India, IIT Madras, India, December
2010. <http://coeut.iitm.ac.in/ITS_synthesis.pdf> (Web
24.02.13)
[10] G. Bolella, Intelligent Public Transportation Systems: State-of-
the-Art Transportation Tracking, University of Connecticut,
USA, 2010. Web. 24 February, 2013. <http://its-ct.org/
documents/StudentGrant/BolellaStudentReport.pdf>.
[11] US Dept of Administration, Advanced Public Transportation
Systems: The State of the Art Update 2006, US Dept of
Administration, 2006.
[12] S.R. Seema, S. Alex, Dynamic bus arrival time prediction using
GPS data, in: 10th National Conference on Technological
Trends (NCTT09) 6–7 November, 2009. Web. 24 February
2013. <http://117.211.100.42:8180/jspui/bitstream/123456789/
604/1/CE_TE_06.pdf>.
[13] J. Levine, Q. Hong, G. E. Hug Jr., D. Rodriguez, Impacts of an
Advanced Public Transportation System Demonstration
Project. Web. 24 February 2013. <http://ntl.bts.gov/lib/
jpodocs/repts_te/13193.pdf>.
[14] S. Padmanabhan, S.Ar. Rajasree, Intelligent transportation
system for Indian cities, National Technological Congress,
Kerala – 2011, College of Engineering Trivandrum, India,
January 28–29, 2011.
[15] M. Hansen, M. Qureshl, D. Rydzewskl, Improving Transit
Performance with Advanced Public Transportation System
Technologies. UCTC No 392, Department of Civil
Engineering, Institute of Transportational Studies, University
of California, Berkeley, US, 1994.