Embed Size (px)
Citation preview
NASA TM-1998-207913
Development of Algorithms and Error Analysesfor the Short Baseline Lightning Detection andRanging System
Stan Starr
Dynacs Engineering Co., Inc.John F. Kennedy Space Center, Florida
National Aeronautics and Space Administration
John F. Kennedy Space Center, Kennedy Space Center, Florida 32899-0001
August 1998
https://ntrs.nasa.gov/search.jsp?R=19980219352 2018-06-01T19:07:03+00:00Z

ABSTRACT
NASA, at the John F. Kennedy Space Center (KSC), developed and operates a uniquehigh-precision lightning location system to provide lightning-related weather warnings.These warnings are used to stop lightning-sensitive operations such as space vehiclelaunches and ground operations where equipment and personnel are at risk. The data isprovided to the Range Weather Operations (45th Weather Squadron, U. S. Air Force)where it is used with other meteorological data to issue weather advisories and warningsfor Cape Canaveral Air Station and KSC operations. This system, called LightningDetection and Ranging (LDAR), provides users with a graphical display in threedimensions of 66 megahertz radio frequency events generated by lightning processes. Thelocations of these events provide a sound basis for the prediction of lightning hazards.This document provides the basis for the design approach and data analysis for a system ofradio frequency receivers to provide azimuth and elevation data for lightning pulsesdetected simultaneously by the LDAR system. The intent is for this direction-findingsystem to correct and augment the data provided by LDAR and, thereby, increase the rateof valid data and to correct or discard any invalid data. This document develops thenecessary equations and algorithms, identifies sources of systematic errors and means tocorrect them, and analyzes the algorithms for random error. This data analysis approach isnot found in the existing literature and was developed to facilitate the operation of this ShortBaseline LDAR (SBLDAR). These algorithms may also be useful for other direction-
finding systems using radio pulses or ultrasonic pulse data.
ACKNOWLEDGEMENTS
The author would like to thank the following individuals for their contributions to thiswork. First, thanks to both the KSC Weather Office (John Madura and Dr. FrankMerceret) and the KSC Technolog3' Programs and Commercialization Office (especiallyDavid Makufka, Joni Richards, and Jim Aliberti) for sponsoring the development of theShort Baseline LDAR System. Thanks to Steve Boyd of the Engineering DevelopmentDirectorate for coordinating and directing all the LDAR projects, including this one. Thanksto Carl Lennon for conceiving the SBLDAR system and providing continuous moral andtechnical support throughout its development. Thanks to Mike Brooks who performed orcoordinated the physical build up of the system including trenching, computer setup,programming, algorithm testing, and, perhaps most important of all, establishing the arraygeometry. Thanks to Bradley Burns for his many contributions to Mike's work and hisown accomplishments in the setup, conceptual development, and testing of the SBLDAR.Mike and Bradley also very carefully reviewed this work and provided many correctionsand clarifications. Thanks also to Anne Roseberry and Jane Flynn for careful and
insightful review and editing. Thanks to Dr. Robert Youngquist and Dr. Pedro Medeliusfor many stimulating conversations regarding lightning physics and location math. Thanksto Caroline Zaffery for the great illustrations. Greatest thanks to Michele Athman for atremendous job of typing and editing, but most of all for her patience and perseverance.
iii/iv

Section
°
1.11.21.3
o
2.12.22.32.4
,
3.13.23.33.43.5
3.63.7
.
4.14.24.3
°
APPENDIX AAPPENDIX B
TABLE OF CONTENTS
Title
INTRODUCTION ......................................................
Background ..............................................................SBLDAR System Description .........................................SBLDAR Compared to Other Radio Frequency (RF) and LightningLocation Systems .......................................................
ALGORITHM DERIVATIONS ......................................
Equation for a Single Baseline ........................................Definitions of Coordinates .............................................
Equation for Single Baseline Arbitrary Orientation .................SBLDAR Algorithm ....................................................
ERROR ANALYSES ..................................................
Sources of Errors in AZ and EL Estimates ..........................Derivation of AZDOP ..................................................Derivation of ELDOP for the Y Array ................................Elevation Angles and ELDOP Derived from a Vertical Baseline..Effect of Curvature (Finite Source Range) on the MeasuredDTOA's ..................................................................SBLDAR Fixed Delays (K Factors) ..................................SBLDAR Errors Due to Offset Between SBLDAR Origin and
LDAR Origin ............................................................
DATA ANALYSIS .....................................................
Data Integrity ............................................................Data Triggering ..........................................................SBLDAR Data Processing .............................................
CONCLUSIONS AND RECOMMENDATIONS ..................
AN ITERATIVE SOLUTION FOR R, AZ, AND EL ..............REFERENCES .........................................................
1
69
1112
15
15192223
2531
32
34
343536
37
A-1B-1
C:**W°rd_ata_'StankK SC-M M-4583'D°c v/vi


ABBREVIATIONS AND ACRONYMS
AZ
AZDOP
C
CCAS
cm
COS
COS -I
CRC
DOP
DTOA
EL
ELDOP
ER
FIFO
FM
GHz
km
KSC
l
LDAR
LLP
log
MHz
NASA
NLDN
NOAA
ns
ONERA
RF
rnls
SBLDAR
SGN
sin
sin -1
tan
tan -1
TOA
USAF
VHF
azimuth
azimuth dilution of precision
speed of light (0.2997 meters/nanosecond)
Cape Canaveral Air Station
centimeter
cosine
arc cosine
Chemical Rubber Company
dilution of precisiondifference of time of arrival
elevation
elevation dilution of precision
EastemRangefirst-in-first-out
frequency modulation
gigahertz
kilometer
John F. Kennedy Space Center
length of baseline (meters)
Lightning Detection and Ranging
Lightning Location and Protection
logarithm, base 10
megahertz
National Aeronautics and Space Administration
National Lightning Detection Network
National Oceanic and Atmospheric Administration
nanosecond
Office National D'Etudes et de Reserches Aerospatiales
radio frequency
root mean square
Short Baseline Lightning Detection and Ranging
sign function, equal to + or -
sine
arc sine
tangent
arc tangenttime of arrival
United States Air Force
very high frequency
vii

ABBREVIATIONS AND ACRONYMS (cont)
13
3-D
7g
standard deviation
three-dimensional
pi, the ratio of the circumference to the diameter of a circle
viii
1. INTRODUCTION
1.1 BACKGROUND
John F. Kennedy Space Center (KSC) operations emphasize safety. The combination of
Florida's frequent thunderstorms and the hazardous and expensive equipment involved in
space flight operations requires strict attention to lightning hazards. Lightning can ignite
propellants, induce damaging voltages and currents in critical circuitry, and injure or kill
personnel. KSC and the United States Air Force (USAF) Eastern Range (ER) have
experienced significant lightning-induced system failures including the double lightning
strike to the Apollo 12 Saturn V launch vehicle, which almost aborted the second moon
landing mission in 1969 [1,2,3]; significant damage to the Viking 1 orbiter spacecraft
while inside a processing facility in 1975 [4]; and the triggered strike to and subsequent
loss of the Atlas Centaur AC-67 launch vehicle in 1987 [ 5]. As a result of these and
other experiences, a major emphasis is placed on proper facility protection, the real-time
monitoring of lightning hazards, and the cessation of sensitive operations when lightning
activity occurs in the vicinity. These safety rules [ 6] require systems capable of
measuring atmospheric electrical potentials and accurately locating lightning events.
Lightning and clouds posing the threat of lightning in the KSC/Cape Canaveral Air Station
(CCAS) area are monitored using six separate systems: "field mill" network that
measures atmospheric electric potential gradients near the ground, the National Lightning
Detection Network (NLDN), a local equivalent of NLDN called Lightning Location and
Protection (LLP), a 5-centimeter (cm) weather radar (WSR-74C), a 10-cm Doppler
weather radar (WSR-88D), and the Lightning Detection and Ranging (LDAR) System for
locating and displaying radio pulses produced by lightning events. Based on input from
these systems, especially LDAR, KSC lightning safety policy dictates that personnel be
warned of lightning events occurring near the KSC area and that specific operational and
personnel controls be established when lightning is detected within 5 miles of an
operational area [6].
KSC developed and operates the LDAR system, which receives and detects radio pulses
emitted during lightning events and locates each pulse in local east, north, and height
(x, y, z) coordinates. It operates on the principle of hyperbolic position location. In this
scheme, the difference of time of arrival (DTOA) of a signal received by two separated
radio receivers indicates that the source lies on a hyperbolic cone centered on the baseline
joining the two receivers. A hyperbola is defined as a curve that, for any point on the
curve, the difference in distances between that point and two fixed loci is a constant.
This constant is the difference in times of arrival multiplied by the speed of light. The
system establishes a number of baselines, each one producing a hyperbolic cone; the
intersection of these cones gives the estimated position of the source.
LDAR was developed by Carl Lermon, a former NASA engineer, and others in the mid-
1970's, to support lightning research activities in the KSC area. The LDAR system was
upgraded several times to support research objectives and came to be unofficially relied
upon to determine lightning risks to KSC operations. In the early 1990's, Mr. Lennon,
Launa Maier, and others established the LDAR system as operational, and it has become
an integral part of the weather warning system at KSC and CCAS. A more complete
description of the LDAR system is available in references 7 and 8.
The LDAR system has seven very high frequency (VHF) radio receivers, one at the
central site and six on a roughly 10-kilometer (km) circle. The receivers operate at 66
megahertz (MHz) with a bandwidth of about 6 MHz. The receivers form two Y-shaped
arrays laid on top of each other in opposite orientations forming a star shape. Each
remote site includes an LDAR receiving antenna, a logarithmic amplifier, and a 4-gigahertz
(GHz) microwave line-of-site link back to the central site. The log amp results in a much
higher dynamic range but also minimizes amplitude differences and rectifies the signal
(i.e., all signal values are positive with no zero crossings). At a preestablished signal level,
the central channel triggers a recording of 81.92 microseconds of data from all seven
channels. Each data stream is sampled at 100 MHz with 8-bit resolution. The peak
amplitude time tag is determined from each channel and corrected for the known time
delay due to the microwave transmission link. The time of arrival from each remote site is
subtracted from that of the central and used to form two solutions of location, one for
each Y-shaped array. If the horizontal range for two solutions agrees to within 0.35 km
when the determined range is less than 7 km and otherwise agrees to within 5 percent of
the horizontal range, the solution is declared valid. If not, a voting procedure involving all
20 combinations of sites is implemented involving comparison of the horizontal range
solutions. If at least seven of the combinations agree to within the above stated limits,
the solution is declared valid.
The LDAR system is very useful to KSC and ER meteorologists in providing graphical
displays of recently recorded valid events. These displays, when used in conjunction
with radar images of precipitation and other information sources, provide excellent
warnings of possible lightning hazards in operational areas. Unfommately, some 60
percent of all system triggers result in discarded solutions. In addition, the possibility for
false solutions exists such that events are plotted at the correct range but with azimuth
error of 180 degrees. The sources of these errors in the LDAR solutions are believed toinclude:
a. The use of peak value rather than waveform matching to determine DTOA's.
bo The change in order in time of events measured at widely separated
locations.
2
C. The nonisotropic emission of radio waves from sources resulting in wide
variations in intensity at different locations.
d. The nonlinear nature of LDAR equations resulting in occasional sign errors
in X and Y coordinates.
Discarded events and incorrectly placed events can result in shutting down operations
unnecessarily, wasting valuable resources, or the underestimation of lightning hazards.
Carl Lennon conceived of a solution to augment the LDAR system with a short baseline
version of LDAR located near the central site, which would reliably provide azimuth
(AZ) and elevation (EL) data to validate and perhaps correct both false solutions and
failed solutions. This system is called Short Baseline LDAR (SBLDAR).
1.2 SBLDAR SYSTEM DESCRIPTION
The SBLDAR system is a radio direction-finding system intended to augment the existing
LDAR system. The SBLDAR system consists of six antennas, four in a "Y" pattern in
the local horizontal plane and two mounted on a tower one above the other. Radio signals
received by the antennas over a frequency band from roughly 25 to 250 MHz are
recorded using high-speed transient digitizers that are triggered at the same moment the
operational LDAR system triggers. The data is high pass filtered at 25 MHz to eliminate
low-frequency noise, notch filtered in the frequency modulation (FM) radio broadcast
band to eliminate radio and television interference, and low-pass filtered at 250 MHz to
eliminate aliasing. The data records in the prototype system are only 2 microseconds
long but are sampled at 500 MHz. Each data record is cross correlated with the others.
The peak of the cross correlation function is curve fit with a polynomial to enhance the
estimation of the DTOA. The DTOA's are used to form an estimate of the AZ and EL of
the lightning source. This AZ and EL estimate may be used to efficiently filter out
erroneous LDAR solutions for the matching lightning events or may be used to improve
the accuracy of the LDAR solution.
This document develops the necessary equations to analyze DTOA data to determine AZ
and EL using arrays like the SBLDAR. It does not address the process of analyzing the
data to estimate the DTOA's themselves.
1.3 SBLDAR COMPARED TO OTHER RADIO FREQUENCY (RF) AND
LIGHTNING LOCATION SYSTEMS
It may be surprising that algorithms and analyses would need to be developed in a field as
mature as radio direction finding. This section places the SBLDAR system in the context
of this field.
RFdirection-findingsystemscanbecategorizedby themannerinwhichtheyinteractwith the incomingradiationto deriveadirection.For sourcesthatarecontinuousin timeandin whichtheradiatedenergyhasanarrowspectraldistribution,direction-findingsystemscanutilizethe interferenceof wavesfromthesource.Detectorscanbespacedatlessthanonewavelengthandtheir receivedphasecompared.Thesetypesof systemsarecalledinterferometers,althoughmanydonotdirectlyaddthereceivedwavestogethervectorally. Directionalambiguitiescanberesolvedbyaddingdetectorrowsatrightanglesandby addingadditionalarraysatdifferentspacings.Themathematicsof thesetypesofreceiversiswell establishedandcontinuestobeanactivefield. Applicationsof directionfinding for narrowbandcontinuoussourcesincludeelectronicwarfare,radionavigation,radioastronomy,and,morerecently,cellularphonereceptionenhancement.Forrecentreviewsof thefield, seereferences9 and10.
Interferometershavealsobeenusedto providethedirectionto lightningradiosources.AFrenchorganization,theOfficeNational D'Etudes et de Reserches Aerospatiales
(ONERA), has provided the National Oceanic and Atmospheric Administration
(NOAA), with a VHF interferometer lightning radio mapping system. This system
includes a station that operates on the grounds of KSC not far from the location of the
LDAR central site. The system works by using multiple antennas along a single (azimuth
only) or multiple (azimuth and elevation) baselines. The signals received by pairs of
antennae are narrow band filtered (so they can interfere) then quadrature summed to
derive a relative phase. This phase difference is a function of the wavelength (provided
by the speed of light divided by the center frequency) and the spacing of the antennae in
wavelengths. By having two such baselines at different wavelength spacings, an integer
number of wavelengths can be eliminated so the phase residual depends only on the angles
of azimuth and elevation. These systems are described in references 11, 12, and 13.
They are very similar to the Short Baseline LDAR in that they derive angle-only data.
Range must be provided by using multiple systems with overlapping sensitive areas.
Lightning interferometers suffer from numerous false locations at the actual azimuth plus
90, 180, and 270 degrees. Because the ONERA-3D system is a research system, not a
real-time warning system, an operator can pick through the data, eliminating false data.
As stated in reference 11, which compared KSC LDAR and the ONERA 3D System:
"...the TOA system [LDAR] (1) is best suited for mapping the individual, spaced
pulses of short duration (a few microseconds long) in a low rate radiation process,
(2) resolves pulses separated in space and occurring in time intervals greater than
the data window, but (3) cannot discern individual pulses in noise-like Q trains.
The ITF system [ONERA-3D] (1) is better suited for mapping the Q train
sequences (characterized by continuity of phase), but (2) cannot resolve two
simultaneous continuing radiation processes separated in space (e.g., two Q train
sequences or one Q train and a discontinuous sequence of pulses)."
Note that Q trains are semicontinuous noise like RF lightning signals.
4
Time-of-arrival(TOA) systemsincluderadarandLDAR. In radar,theoperatororiginatestheradiatedpulsesoreflectedpulsestructureandtimingisavailable.LDAR issomewhatlike passivebistaticradar,whereinaneavesdropperlistensto pulsesreflectedfrom targetswithoutknowledgeof theoriginalpulseshapeor timing. Systemsbasedonuncontrolledpulsedsourcestypicallyusehyperbolicpositioninglike LDAR becausethetimeof signalstartis notavailable.A considerableamountof mathematicshasbeendevelopedto performpassivehyperbolicpositioning,butmostis basedon trackingmovingsourceswheresomeassumptionsabouttargetdynamicscanbeassumed(e.g.,aircraftflying onstraightcourse)andmultipledatapointsareavailablethroughrepetition.For example,locatingadownedflyer byusingapulsedtransmitterappliesknowledgeofthesearchaircraftmotionandtheassumptionthattheemitteris notmoving. Applicableandexcellentgeneralreferencesontheproblemsof thesehyperboliclocationsystemsincludereferences14and15.
LDAR receivesonly asinglepulseor pulsetrainperevent. Systemsof this typemustrelyonmaximizingtheinformationavailablefromthesingleisolatedeventrecordedatmultiplestations.Thedesignapproachof suchsystemscanbepartitionedinto twoareas:themeansfor estimatingtheDTOA's(includingantennadesign,filtering, digitizing,datastorage,anddifferencing)andthealgorithmapproachtothedeterminationofposition.Thealgorithmsavailablefor hyperbolicpositioninginvolvesolvingfor pointsinx, y, andz thatarecommonto multiplehyperboliccones.Theseapproachestypicallytaketheformofa pseudolinearalgebraicapproach.All eventually boil down to solving
for the roots of several simultaneous equations. Several schemes have been conceived to
perform this function, the best of which is probably that used by the LDAR system.
Most of the approaches in the literature are not capable of operating in cases where all the
detectors lie in a plane such as with LDAR and SBLDAR unless the source is confined to
the same plane. All the approaches found in our research, except LDAR's, are iterative
approaches, involving searching for these roots. These algorithms are evaluated and
compared in the literature based on the time required to locate these roots and the
probability that the incorrect root or solution will be selected. Since LDAR is a near real-
time system and must process up to 10,000 events per second (100 microseconds per
event), iteration is not a feasible approach. The LDAR algorithm, while it has some
flaws, is very rapid and efficient in reaching a solution. Analyses specific to the LDAR
geometry and algorithm can be found in references 16, 17, 18, and 19. Another lightning
detection system developed jointly between the University of Florida and KSC is called
"TOA" and uses a very similar system geometry and the same location algorithm as
described in LDAR [20].
The lightning time-of-arrival systems are generally grouped according to baseline length.
Long baseline systems have receivers separated by kilometers or more and use recorded
data to be correlated later or, in the case of LDAR, use microwave links to merge the data
streams in real time. Short baseline systems are small enough so signals are carried to a
5
central point by cable. Long baseline systems can provide coverage in three dimensions
to a large area, whereas short baseline systems are basically direction finders.
The background of radio direction finding of lightning events is nicely summarized by
Uman [21, pg. 358]:
"Oetzel and Pierce (1969) first suggested that a short baseline time-of-arrival
technique could be used for locating lightning VHF sources. A criticism of short
baseline systems and a discussion of the advantages and disadvantages of long and
short baseline systems are given by Proctor (1973)...Basically with a short
baseline system, pulse identification is no problem since the same pulse arrives at
each of the closely spaced receivers in a time that is short compared to the time
between pulses, and thus the sequences of pulses arrive at each receiver in the
same order. On the other hand, a short baseline system produces at best a two
dimensional direction: with two receivers one can obtain azimuth; with three
receivers one can obtain both azimuth and elevation...Long baseline VHF time-of-
arrival systems have the advantage of providing three-dimensional locations, but
suffer the disadvantage of the difficulty in identifying VHF pulses from two or
more simultaneous separated sources because the pulses arrive in a different orderat each receiver."
For the reasons cited earlier in this document, the various combinations of receivers used
by LDAR to form solutions often widely disagree. In addition, the multiple roots
problem can result in a 180-degree directional error. The detailed reasons for this
directional error in the algorithm are not known and, at present, cannot be internally
detected using just the LDAR data. Tests conducted during this development project
showed that roughly 60 percent of all events detected by LDAR are rejected based on bad
comparisons between solutions provided by the 20 different subarrays of the system.
An unknown percentage that is incorrect is passed forward as valid.
Direction-finding systems involving uncontrolled, nonperiodic pulse detection were found
to be in a poor state of development. Some early work by Pierce and Oertzel was found
to be along similar lines but much simpler than the approach taken here. No related work
was found in the literature for the general problem encountered with the SBLDAR
system, so one was developed. The approach to developing the SBLDAR algorithm was
based on a noniterative approach in order to meet high processing speed requirements.
2. ALGORITHM DERIVATIONS
2.1 EQUATION FOR A SINGLE BASELINE
Any two receivers form a "baseline," that is a line connecting the two receiver
coordinates. The location of a source S that produces a DTOA signal lies on a hyperbola
in theplaneformedbythetwo antennasandthesource(figure1). Remember,thatforeachpoint ona hyperbola,thedifferencebetweenthedistancesto thetwo foci is aconstant.In this case,eachantennaformsafocusof thehyperbola.Thisdistancedifferenceis theDTOA, in timeunits,timesthespeedof lightc. Sincethelocationof Sand,hence,theorientationof theplaneis unknown,onecanonlysaythatSlies ona"hyperbolaof revolution" (i.e.,ahyperbolicconegivenbyrotatingthehyperbolaaroundtheaxisdefinedbythebaseline).
As thecurveof ahyperbolais examined,furtherawayfromtheorigin, it asymptoticallyapproachesastraightlinethatdeviatesfromthebaselinewith interiorangle_ (figure2).In SBLDAR, theonly concerniswith distantpointsrelativeto the lengthof thebaselines.Therefore, the equations can be simplified by using only straight lines instead
of hyperbolic curves. The error due to the assumption of the infinite source range R will
be quantified later in the report. When the straight line is rotated about the axis, it
generates a circular cone (figure 3).
S
i S, ..- / /
/--; ..-+- ",,,/ // .--" F,, !
/j-- /--.. /C ..--- / "-..J
R7 BASELINE
Figure 1. Location of a Source S Lies on a Hyperbola in the Plane
Defined by S, R1, R2
7
S
,_r 1 I.. I"_'''I"_IZ1t • _•_
c (TO-T1) .-'""" "" '"',
0 baseline, 1 1
Figure 2. As "S" Goes to Infinity, cAT Becomes Equal to lcos_
CIRCULAR ARC ON
THE UNIT CIRCLE
/
X
ELEVATION = 0
PLANE
Figure 3. Cone Forms a Constant Angle _ Between the Baseline
and the Cone Surface
The SBLDAR system measures a time difference in nanoseconds between the time of
signal arrival at one antenna minus the time of arrival to a second antenna. This DTOA
times c, the speed of light, is a distance difference. If the measured TOA from antenna 1
as T1 is designated, it defines:
ATol = TO - T1 (1)
If the AT01 term is positive, then TO is a larger number and is later in time; the event
reached "1" first. Therefore, the cone angles toward antenna 1. Likewise, if AT01 is
negative, the event reached "0" first and the cone opening lies toward antenna 0 (_ > rd2).
The cone of constant AT0j forms a constant angle between the baseline and the cone
surface _ (figure 2). In terms of the AT01, it can be seen that, for sources far away from
the baseline:
cAT01 = I01 cos _ (2)
where lol is the length of the baseline between receivers 1 and 0.
So that the cone angle _ is given by:
W = arc cos 0 - T1 (3)
This cone traces a circular arc on the sky. Using multiple baselines, multiple arcs can be
produced such that their intersection defines the azimuth and elevation of the source. In
order to accomplish this, the baseline orientation must be defined in terms of azimuth and
elevation, which, coupled with the above DTOA equation, will allow the definition of the
arc. Note also that for sources at infinite range, it can be assumed that the cone angle
originates at the reference receiver and not at the midpoint between the two receivers.
2.2 DEFINITIONS OF COORDINATES
In this section, the AZ and EL angles are defined in terms of the local Cartesian coordinate
system. It is necessary to express the orientation of each receiver pair baseline and the
direction to each source in terms of AZ and EL. The locally flat Cartesian coordinate
system is called (east, north, up) for (x, y, z), respectively. The AZ and EL angles are
defined on figure 4. It is assumed that the reference receiver (point 0 in the SBLDAR
system) lies at the point (x0, y0, z0) = (0, 0, 0).
The baseline vector is defined as the vector from (0, 0, 0) to the receiver listed first in the
DTOA equation. For example, the baseline "10" vector runs from the point (0, 0, 0) to
(xl, y 1, zl). This vector defines a baseline orientation in terms of azimuth and elevation.
The azimuth is measured from the north (y axis) in a clockwise direction. The elevation
angle is measured up from the (x, y) plane. Points lying in the (x, y) plane define position
vectors with a zero elevation angle.
9

z (uP)
P (x, y, z)
I I
J i lm y (NORTH)
x (EAST)
Figure 4. Definitions of Azimuth (AZ) and the Elevation Angle (EL)
The baseline vector is therefore given by:
l'10 = (Xl - 0)i" + (v 1 - 0)] + (z 1 - 0)/_ (4)
where i', ], /c denote unit vectors along the x, y, and z axis, respectively.
The length of this vector is given by:
- 2 2liloll=,/x,+yl =,,o (5)
llo, 120 ,and /30 will be used to indicate the length of the three SBLDAR baselines vectors.
It must be kept in mind that the results below will depend on the sign of the DTOA,
which is implicitly affected by the direction assumed for the baseline vector.
To transform these results into AZ, EL, the transformations between spherical and
Cartesian coordinates are recalled. Given a point P(x,, y,, z,), which could be an antenna
or a source point, it can be transformed to spherical coordinates as follows, where again l,o
is used to denote the length of the vector from the origin to the point (figure 4):
z, = l,o sinEL
x, = LocosEL sinAZ (6)
y_ = l_0cosEL cosAZ
10
Sincethe only interest is in AZ and EL, it is divided through by the length and solved for
the angles:
EL = arc sin ( z/-_'01 (7a)
(7b)
Next, the angles of the baseline vector are defined using receiver 0 as the reference origin
(0, 0, 0):
( ZlELI0 arc sin /
i/x 2 + y2 + z_
(8)
Equation 8 defines the AZ and EL of any point P(x,,y,,z,) in terms of the Cartesian
system.
2.3 EQUATION FOR SINGLE BASELINE ARBITRARY ORIENTATION
This section derives the equation for the arc on the sky based on the measured delta T,
baseline length, and baseline orientation. The following is a general treatment that can be
solved for any baseline orientation. Given a source point S(xs, Ys, zs) or, in spherical
coordinates, S (Is, AZs, Els), and a baseline unit vector the following equation is applicable:
Yl
r 1 r 1 r 1
(9)
Equations 10 and 11 express the vector pointing from the origin to the source point:
g = xsi+Ys] +zsk (10)
and its corresponding unit vector:
_;=--_Xs'+Ys]+Zsf¢r s rs rs
(11)
11
Notethatthedot productbetweenthesetwo unit vectorsis equalto thecosineof the
angle between them.
_._/ = cosgt (12)
The dot product is given by the sum of the products of the three components:
_-- Ys Yl Zl_._" _ Xs. Xl +_._ + Zs._ (13)rs rl rs rl rs rl
Equation 14 uses the following spherical coordinate conversion formulas (equation 6) to
express the dot product in terms of angles:
_- l" = cosELs sinAZ s cos EL1 sin AZ1 + cosELs cosAZ sCOSEL1 cos AZ1
+ sin ELs sin EL1
By rearranging, equation 15 is obtained:
(14)
_-l" = cosELs cosEL1 sinAZssin AZ1 +cosEL s cosEL 1 cosAZs cosAZ1
+sin ELs sin EL1
(15)
Using equation 2 to eliminate _, the DTOA equation for an arbitrary baseline becomes
/-_-t (T0 - T1)C= cos EL s cos EL1 sin AZs sin AZI + cos EL s cos EL1 cos AZs cos AZ1
+ sin EL s sin EL 1
(16)
One equation is provided by each baseline in the system. Two baselines are required to
find a solution for AZ and EL. Three baselines provide an over determination of these
variables, which allows the use of statistical techniques to reduce the measurement error.
The system of three equations provided by a three-baseline array are typically not linear
in AZ and EL and, therefore, tend to be difficult to solve. The goal is an array geometry
that provides for accurate estimates of AZ and EL and is relatively easy to solve. A fiat
"Y" shaped array meets this requirement as is shown in the next section.
2.4 SBLDAR ALGORITHM
SBLDAR contains four antennas arrayed in a flat Y pattern with one in the center and
three on symmetrical 300-foot (90-meter) nominal baselines at azimuths of_/3, rt, and
12
5x/3 (AZ=0 north,measuredfromnorthto east,etc.). Cross-correlationsareperformedbetweenthereferencechannelandeachouterchannel,in turnproducingthreedatarecordsof deltaT's to provideazimuthandelevationestimatesof thesourcelocation.Thedetectorchannelsarenumberedasfollows:
0 = central (reference channel)
1 = northeast
2 = northwest
3 = south
The following equations are developed for each DTOA produced by a single source event
(using equation 16 and noting that cosELoi = 1 and sinELoi = 0 for baselines in the ground
plane):
c(To - Yl)
lol= (cosELs) (cos AZ s cos AZ01 + sin AZ s sin AZ01 )
c(To - T2)102
= (cosELs) (cos AZ s cosAZ02 + sin AZ s sin AZ02 ) (17)
c(ro -T3)
103- (cosEL s ) (cos AZ s cosAZ03 + sin AZ s sin AZ03)
These three equations can be cast as a set of linear equations by naming two unknowns, A
and B.
A = cos ELs cos AZs
B = cos ELs sin AZs
which results (in matrix form) in the following equation:
(18)
¢
/-_-1(To -TI)
C
_(To- T3)/03
cos AZoi sin AZ01 _ (
J
Iml
cos AZ02 sin AZ02 [ I
cos AZ03 sin AZ03 l B J
(19)
13
Usingthegeneralizedinverseto solve for the matrix of unknowns A and B (inverse of H,
when H is nonsquare is (HTH) l HT), the following equations are obtained:
h
£ c
( Y_sin 2 AZo, ) (y_)"cos AZo, AToi) - (_. cos AZoi sin AZoJ (Y_]-sin AZo, AToi)
B
]_sin 2 AZo, _. cos 2 AZo, - (_. cos AZo, sin AZo,
(20)
c c
( ZcosAZoi sinAZoi) (Y,-Tcos AZoi AT0i ) - (Y_cos 2 AZoi ) (]_-}-sin AZoiAToi)
Zsin 2 AZoi Y.cos2 AZoi - (_cosAZoi sin AZ Oi_
The AZs and ELs are solved for as follows:
EL s = cos-1 (1/A 2 + B2)
AZs = tan-1 (B) + nrt (n = 0,_ or 2r_)
(21 a)
(21b)
where n is determined from the sign of A and B:
if
if
if
if
SGN (A) = (+) and
SGN (A) = (-) and
SGN (A) = (-) and
SGN (A) = (+) and
SGN (B) = (-); then n = 0
SGN (B) = (-); then n = 1
SGN (B) = (+); then n = 1
SGN (B) = (+); then n = 2 (22)
The sign evaluations are required due to the multiple values of the arctangent over the
interval from 0 to 2n. Note that ELs only ranges from 0 to n/2, so no ambiguity exists for
the arc-cosine.
These coordinates are assumed to be in a local Cartesian frame centered on the center, or
number 0, antenna. Making the following substitutions:
xisin AZoi = -7"
ti
cos AZoi Yili
(23)
14
Onethenhasequation24:
A
lc ) (yo,xoi Ic)c,8,J 7[7
(24)
B
(x_i] ly2il (_Yo,Xoil 2
Y_t&JYtTJ-t _o;J
These exact formulas are used for the analysis of data from the SBLDAR system. This
last formula also simplifies the use of this approach for nonsymmetrical arrays.
An approximate form of the above equations for A and B can be formed using the three
baseline azimuths of rd3, n, and 5rt/3, and assuming equal baseline lengths as follows:
A= to,+ ATo=- 2/,g, ) (25)
(26)
The above formulas are not exact because the SBLDAR array is not perfectly
symmetrical but are extremely close for the array built. This form of the equations will
facilitate the error analyses that follow.
3. ERRORANALYSES
3.1 SOURCES OF ERRORS IN AZ AND EL ESTIMATES
Each measurement provides an arc that makes a large circle on the sky (see figure 3). If
the measurements contain some errors, the three circles will not intersect at a single point
but will form a triangle as shown in figure 5. Each comer of the triangle represents the
15
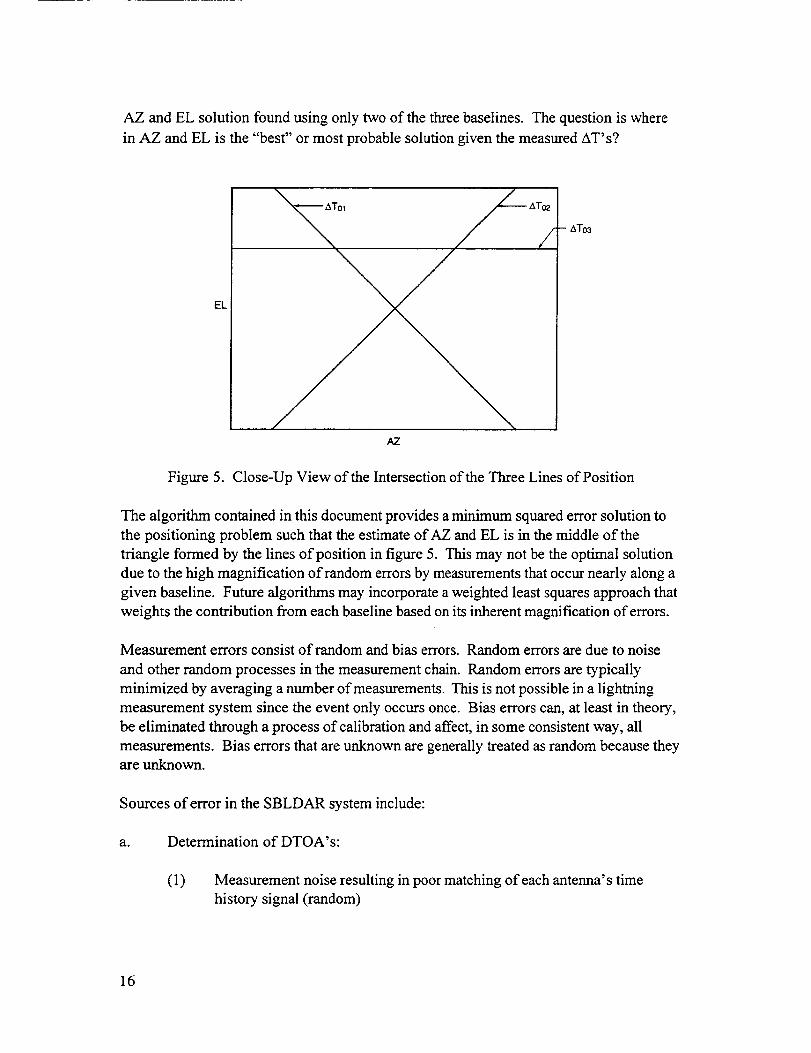
AZ and EL solution found using only two of the three baselines. The question is where
in AZ and EL is the "best" or most probable solution given the measured AT's?
EL
AZ
-- ATo3
Figure 5. Close-Up View of the Intersection of the Three Lines of Position
The algorithm contained in this document provides a minimum squared error solution to
the positioning problem such that the estimate of AZ and EL is in the middle of the
triangle formed by the lines of position in figure 5. This may not be the optimal solution
due to the high magnification of random errors by measurements that occur nearly along a
given baseline. Future algorithms may incorporate a weighted least squares approach that
weights the contribution from each baseline based on its inherent magnification of errors.
Measurement errors consist of random and bias errors. Random errors are due to noise
and other random processes in the measurement chain. Random errors are typically
minimized by averaging a number of measurements. This is not possible in a lightning
measurement system since the event only occurs once. Bias errors can, at least in theory,
be eliminated through a process of calibration and affect, in some consistent way, all
measurements. Bias errors that are unknown are generally treated as random because they
are unknown.
Sources of error in the SBLDAR system include:
a. Determination of DTOA's:
(1) Measurement noise resulting in poor matching of each antenna's time
history signal (random)
16

(2) Digitizing error (random)
(3) Aliasing of unfiltered high frequency signal components to lower
frequencies (random)
(4) Time jitter in the analog-to-digital conversion stage (random)
(5) Multipath errors (again causing differences between channels)(random)
(6) Error in the polynomial curve fit of the correlation function (random)
(7) Errors in the relative channel time delays (delta K's) due to cable lengths,
filters, and other differences (systematic or bias error)
(8) Movement in the source during the RF emission process or other effects
that result in the lightning source not being a point source (random)
(9) Errors caused by changes in ambient temperature affecting cables and
electronics (bias)
(10) Errors caused by changes in the atmospheric index of refraction gradient
(bias)
b. Computation of AZ and EL:
(1) Poor baseline geometry resulting in amplification of errors (random for any
particular direction of source, depends on source AZ and EL and on the
baseline geometry)
(2) Numerical error growth in algorithm due to singularities in the math or
nearly singular matrices (typically random)
(3) Errors due to finite source range (which is assumed to be infinite in the
algorithm)(systematic)
(4) Errors due to mixing of accurate and inaccurate baseline data (use of a
DTOA measured nearly along the baseline and at a high random error)
(random)
(5) Offsets between the SBLDAR from the LDAR reference antenna
(systematic)
17
This document only addresses the errors in computing the AZ and EL values from the set
of provided DTOA's. This report examines ways to mitigate the sources of the errors
listed in 3.1.b to maximize the accuracy and precision of the SBLDAR design.
To find how each measurement may be affected by random errors, using equation 2 the
derivatives of both sides are taken.
cdZxT = -Isin gtdgr
By rearranging equation 27, equation 28 is obtained:
(27)
d-'_'= 7 s-_ (28)
This expression can be interpreted as the ratio of standard.deviations..Taking the
absolute value (since the timing error can be positive or negative), equation 29 is obtained.
c 1(29)
If the standard deviation of the timing difference error is 1 nanosecond (ns), the baseline
length is 90 meters; and, using a value of c equal to 0.2997 m/ns, it is evident that equation
30 applies.
c_¢ = _ x egrees/ns ]sin
(30)
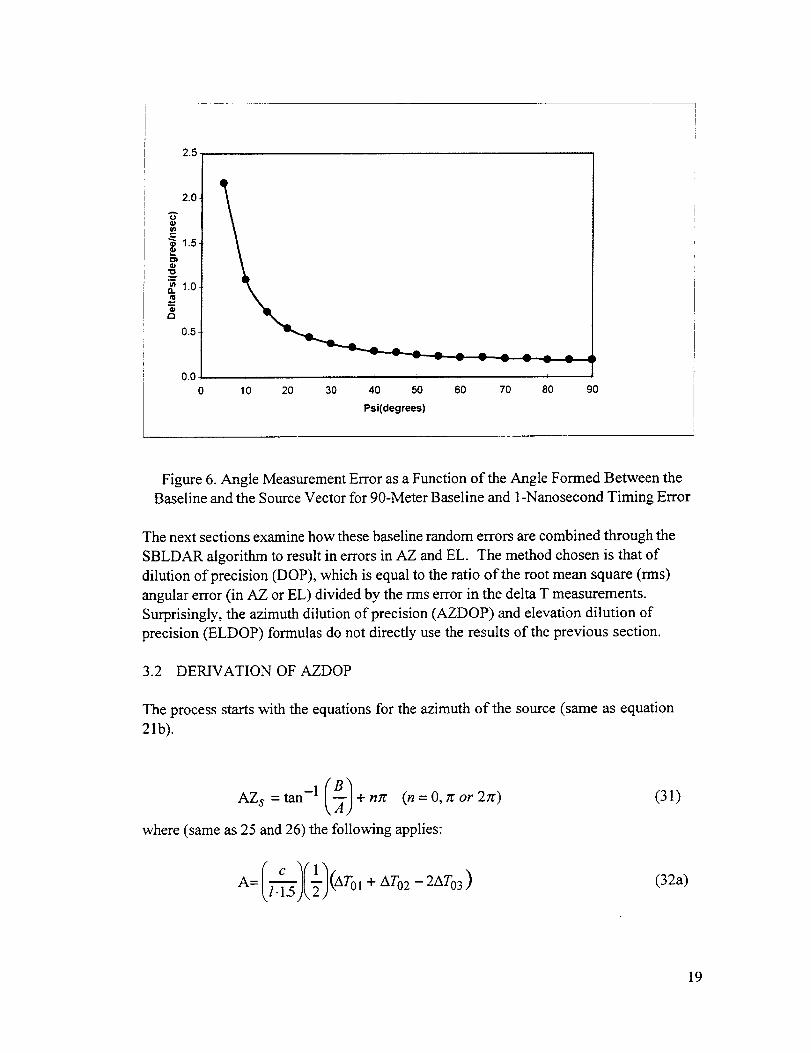
The last term is to convert from radians to degrees. The best accuracy is achieved when
the source is at right angles to the baseline and, for SBLDAR, is equal to 0.19 degrees per
nanosecond timing accuracy (in the absence of other errors). Figure 6 shows the angular
accuracy as a function of _ ("delta psi" denotes o v the standard deviation of _ as given in
equation 30):
This means that, in areas where a given baseline is parallel or nearly parallel to the
incoming rays, it should probably be excluded from the solution; howe-,_ the current
algorithm does not exclude any baselines.
18
I
I
2.5
I
1 2.0i
1.5
1.0
0.5
0.0 10 20 30 70 80
[
Figure 6. Angle Measurement Error as a Function of the Angle Formed Between the
Baseline and the Source Vector for 90-Meter Baseline and 1-Nanosecond Timing Error
The next sections examine how these baseline random errors are combined through the
SBLDAR algorithm to result in errors in AZ and EL. The method chosen is that of
dilution of precision (DOP), which is equal to the ratio of the root mean square (rms)
angular error (in AZ or EL) divided by the rms error in the delta T measurements.
Surprisingly, the azimuth dilution of precision (AZDOP) and elevation dilution of
precision (ELDOP) formulas do not directly use the results of the previous section.
3.2 DERIVATION OF AZDOP
The process starts with the equations for the azimuth of the source (same as equation
21b).
AZs = tan-1 (B) + nx (n=O, rcor2zc)
where (same as 25 and 26) the following applies:
c 1
A= I/.-_('71(AT01 +AT02- 2AT03 )
(31)
(32a)
19
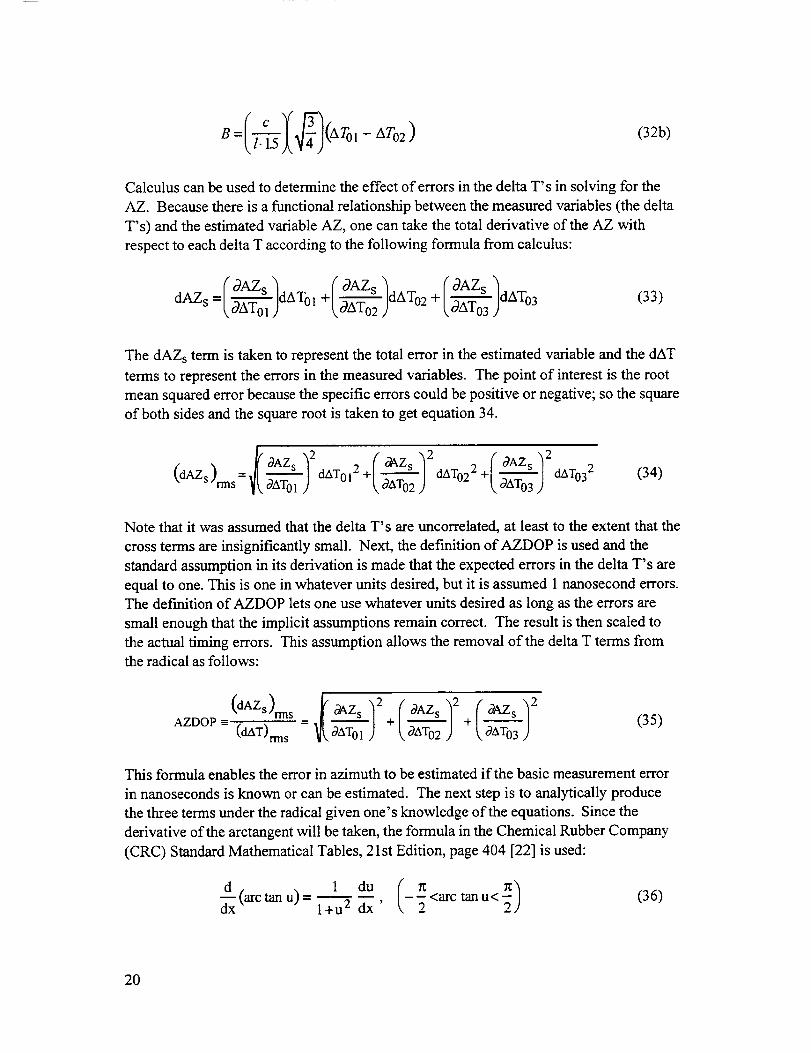
(32b)
Calculuscanbeusedto determinetheeffectof errorsin thedeltaT's insolvingfor theAZ. Because there is a functional relationship between the measured variables (the delta
T's) and the estimated variable AZ, one can take the total derivative of the AZ with
respect to each delta T according to the following formula from calculus:
(0AZs) ( 0AZs (OAZs(33)
The dAZ s term is taken to represent the total error in the estimated variable and the dAT
terms to represent the errors in the measured variables. The point of interest is the root
mean squared error because the specific errors could be positive or negative; so the square
of both sides and the square root is taken to get equation 34.
(34)
Note that it was assumed that the delta T's are uncorrelated, at least to the extent that the
cross terms are insignificantly small. Next, the definition of AZDOP is used and the
standard assumption in its derivation is made that the expected errors in the delta T's are
equal to one. This is one in whatever units desired, but it is assumed 1 nanosecond errors.
The definition of AZDOP lets one use whatever units desired as long as the errors are
small enough that the implicit assumptions remain correct. The result is then scaled to
the actual timing errors. This assumption allows the removal of the delta T terms from
the radical as follows:
7 (35)
This formula enables the error in azimuth to be estimated if the basic measurement error
in nanoseconds is known or can be estimated. The next step is to analytically produce
the three terms under the radical given one's knowledge of the equations. Since the
derivative of the arctangent will be taken, the formula in the Chemical Rubber Company
(CRC) Standard Mathematical Tables, 21 st Edition, page 404 [22] is used:
1 , - - <arc tan u< (36)l+u 2 dx 2
20
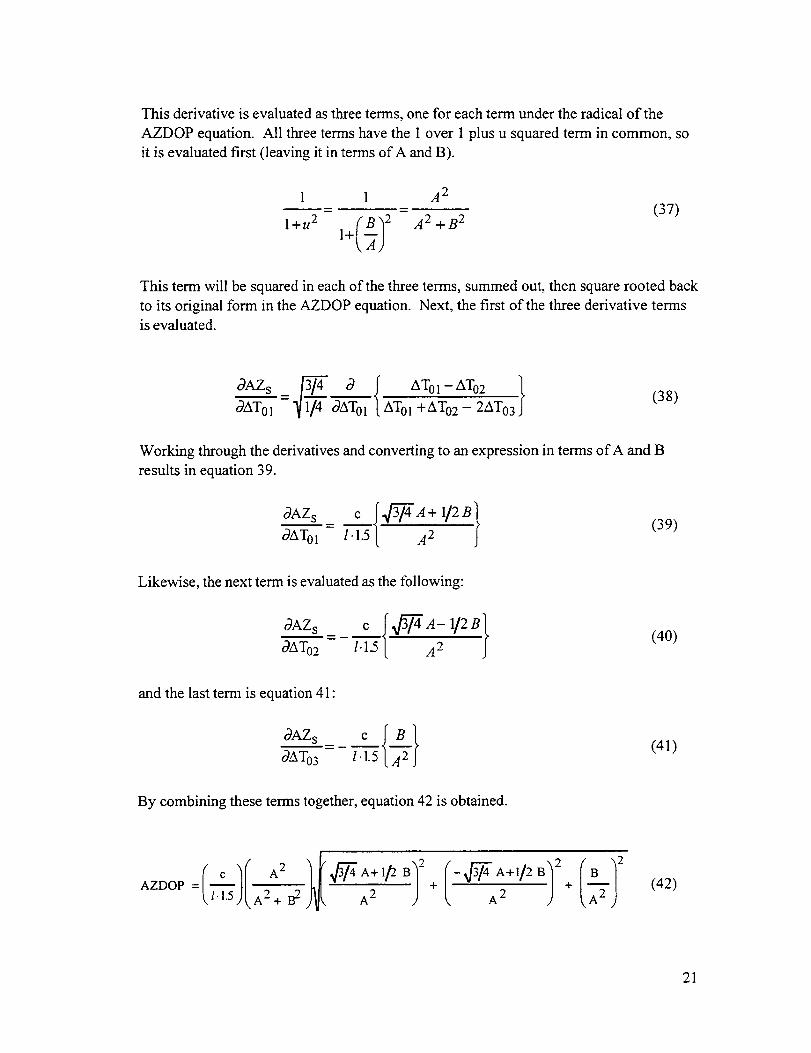
Thisderivativeisevaluatedasthreeterms,onefor eachtermundertheradicalof theAZDOPequation.All threetermshavethe1over1plusu squaredtermin common,soit is evaluatedfirst (leavingit in termsof A andB).
1 1 A 2B m
,+u21+(_)2A2+_2(37)
This term will be squared in each of the three terms, summed out, then square rooted back
to its original form in the AZDOP equation. Next, the first of the three derivative terms
is evaluated.
o3AT01 = "_1_ cgAT01 AT0/'_'_'T'_2---_-AT03(38)
Working through the derivatives and converting to an expression in terms of A and B
results in equation 39.
_s c I4_+_/_.l,_ATo_= _-_'L 7 J
(39)
Likewise, the next term is evaluated as the following:
0AZ s c
o3AT02 1.1.5(40)
and the last term is equation 41 :
OaZsc{5}o_AT03 1.1.5
By combining these terms together, equation 42 is obtained.
AZDOP = _ AiTB 2 A2 ?+t A2 + 7
21
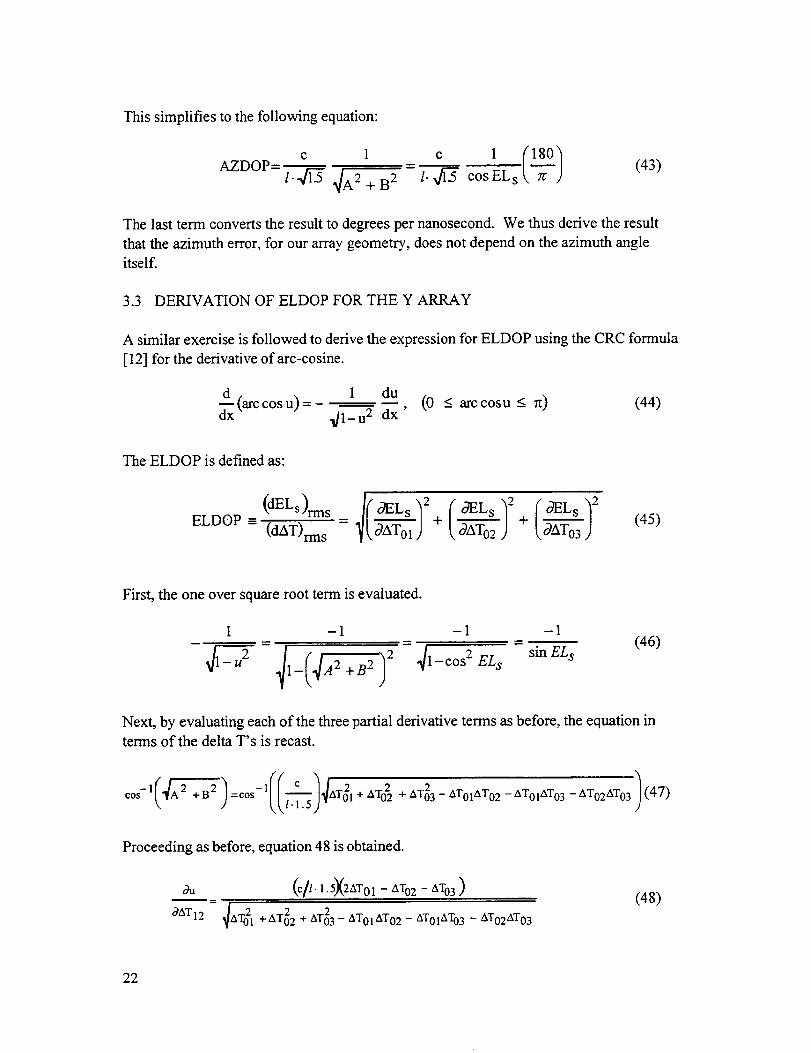
This simplifies to the following equation:
AZDOP=
1.4i'5 ,]A2+B 2 l.,K3- cosELs(43)
The last term converts the result to degrees per nanosecond. We thus derive the result
that the azimuth error, for our array geometry, does not depend on the azimuth angle
itself.
3.3 DERIVATION OF ELDOP FOR THE Y ARRAY
A similar exercise is followed to derive the expression for ELDOP using the CRC formula
[12] for the derivative of arc-cosine.
d (arc cos u) = 1 du (0 _< arc cosu < rt) (44)_xx _/l_u 2 dx'
The ELDOP is defined as:
(45)
First, the one over square root term is evaluated.
1 -1 -1 -1
)2 cos2ELsinELs(46)
Next, by evaluating each of the three partial derivative terms as before, the equation in
terms of the delta T's is recast.
cos .. I+AT022 +_T23-AT01AT02-AT01AT03-Z_T02AT03 (47)
Proceeding as before, equation 48 is obtained.
au (c/,. 1.5X2AT01 - AT02 - AT03)
°3AT'2 _ATg 1 +AT22 + AT23 - AT01AT02 - _ST01AT03 - AT02AT03
(48)
22
The remaining two terms are likewise found to be the following:
0u (c///" 1.5X2A T02 - AT01 - AT03 )(49)
(c/l.1.5XZAro_- ATo,- A_o_)
a_42 _/_To2,+_ +_T_3- ATo,AT02-_To_To_- _To_To_(50)
Taking the root of the sum of squares of equations 48, 49, and 50 results in the lengthy
term in the radical sign canceling (details left to the reader), and the resulting ELDOP
expression is equation 51 :
ELDOP =/._('sin ELs _(_-/[deg tees/ns ] (51)
Note that the equation for ELDOP and, therefore, the amplification of errors goes to
infinity at zero elevation. This is a concern because most detected events will be distant
from the array and will be at low elevation angle.
3.4 ELEVATION ANGLES AND ELDOP DERIVED FROM A VERTICAL
BASELINE
The SBLDAR system also has a vertical baseline consisting of two antennae mounted on
a tower, near the Y array, with a vertical separation of about 20 meters. This section
addresses the use of this vertical baseline to improve the elevation angle accuracy of the
SBLDAR system. Almost by inspection from equation 16, it can be seen that when the
baseline is vertical and, therefore, has no azimuth components, the measurement equation
becomes the following:
l(T B -TT) = --sin EL (52)
C
TB and Tr represent TOA's for the bottom antenna and top antenna respectively, and
l is the height of the baseline. Solving for EL, the following expression is obtained:
EL = sin-I((TB-TT)I), where 0<EL<rd2. (53)
23
An error analysis can immediately be performed to determine the propagation of timing
errors into elevation angle errors. This is done by taking the Taylor series expansion of
the sine of EL in terms of the delta T expression from the measured values to the actual
value.
(AT)act - (AT)meas = _EL)meas - (EL)act)(c/-/cosEL (54)
If the formula is made more concise, the following expression is obtained:
d-"_ = cos-EL(55)
The error is a minimum when the elevation is zero and a maximum at the zenith. Note,
however, that at higher elevation angles, the Taylor series in error would need to include
some higher order terms. So this expression somewhat over estimates the error at high
EL. ELDOP is defined by:
ELDOP=/(.coslLs/(18_0)[degrees/ns] (56)
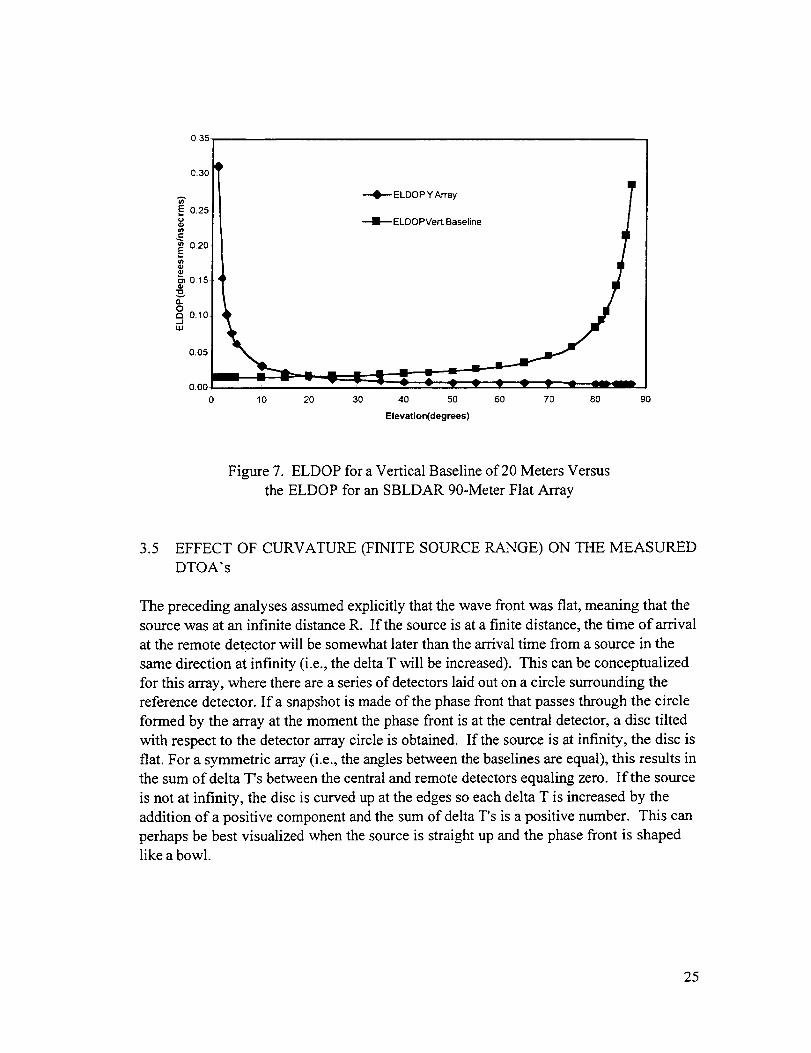
This suggests that there is significant benefit in providing for a vertical baseline when
events are to be detected at low elevations. The expression also allows for the evaluation
of needed vertical baseline height for a given error reduction. The cost of baseline height
is very expensive in the case of an array of sensors such as the SBLDAR system. An
evaluation of the benefits of a vertical array should include an analysis of the mask angle
of the antenna design chosen and the effect of the terrain so that the lowest useful
elevation angle for actually detecting events is considered. In figure 7 for example, for
equal timing errors and a vertical baseline of 20 meters coupled to a Y array of 90 meters
baseline, the two ELDOP curves cross at 20 degrees. Mask angles of 15 degrees are not
uncommon, so the benefit of the vertical array may only be realized for events below 20
and above 15 degrees.
24
0,35
0.30
_ 0.25-
_ 0.20-
0.15
ag_ 0.10
0,05
0.00
0
+ ELDOP Y Array /
10 20 30 40 50 60 70 80 90
Elevation(degrees)
Figure 7. ELDOP for a Vertical Baseline of 20 Meters Versus
the ELDOP for an SBLDAR 90-Meter Flat Array
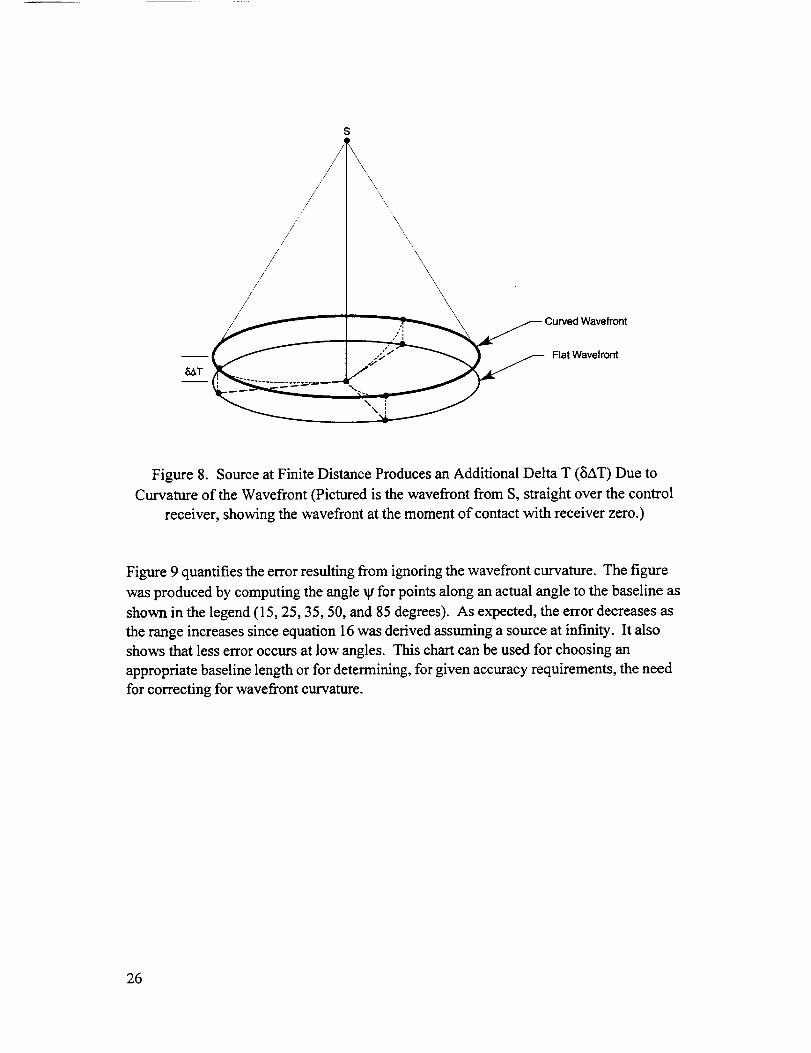
3.5 EFFECT OF CURVATURE (FINITE SOURCE RANGE) ON THE MEASURED
DTOA's
The preceding analyses assumed explicitly that the wave from was fiat, meaning that the
source was at an infinite distance R. If the source is at a finite distance, the time of arrival
at the remote detector will be somewhat later than the arrival time from a source in the
same direction at infinity (i.e., the delta T will be increased). This can be conceptualized
for this array, where there are a series of detectors laid out on a circle surrounding the
reference detector. If a snapshot is made of the phase front that passes through the circle
formed by the array at the moment the phase front is at the central detector, a disc tilted
with respect to the detector array circle is obtained. If the source is at infinity, the disc is
fiat. For a symmetric array (i.e., the angles between the baselines are equal), this results in
the sum of delta T's between the central and remote detectors equaling zero. If the source
is not at infinity, the disc is curved up at the edges so each delta T is increased by the
addition of a positive component and the sum of delta T's is a positive number. This can
perhaps be best visualized when the source is straight up and the phase front is shaped
like a bowl.
25
_T
//
/
,//
//
/J//
/
S
,/J
\\
\\
\
\
Flat Wavefront
Figure 8. Source at Finite Distance Produces an Additional Delta T (SAT) Due to
Curvature of the Wavefront (Pictured is the wavefront from S, straight over the control
receiver, showing the wavefront at the moment of contact with receiver zero.)
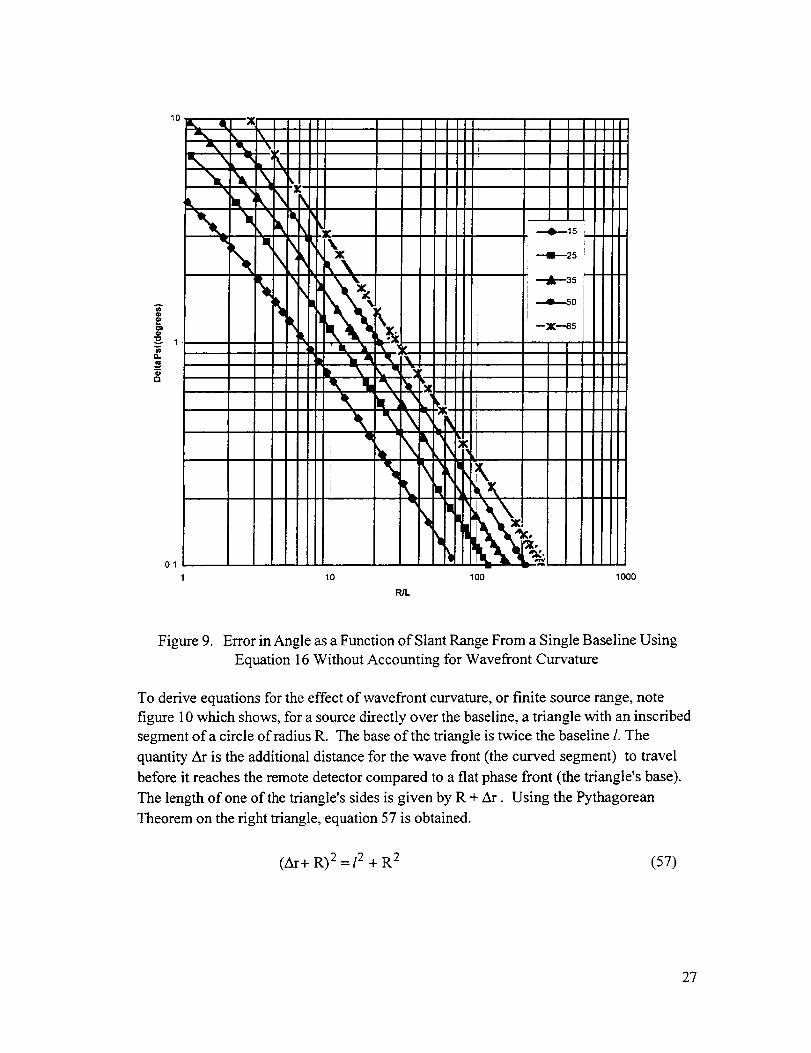
Figure 9 quantifies the error resulting from ignoring the wavefront curvature. The figure
was produced by computing the angle _g for points along an actual angle to the baseline as
shown in the legend (15, 25, 35, 50, and 85 degrees). As expected, the error decreases as
the range increases since equation 16 was derived assuming a source at infinity. It also
shows that less error occurs at low angles. This chart can be used for choosing an
appropriate baseline length or for determining, for given accuracy requirements, the need
for correcting for wavefront curvature.
26
10
A
n
g
0,1
1 10 100 1000
R/L
Figure 9. Error in Angle as a Function of Slant Range From a Single Baseline Using
Equation 16 Without Accounting for Wavefront Curvature
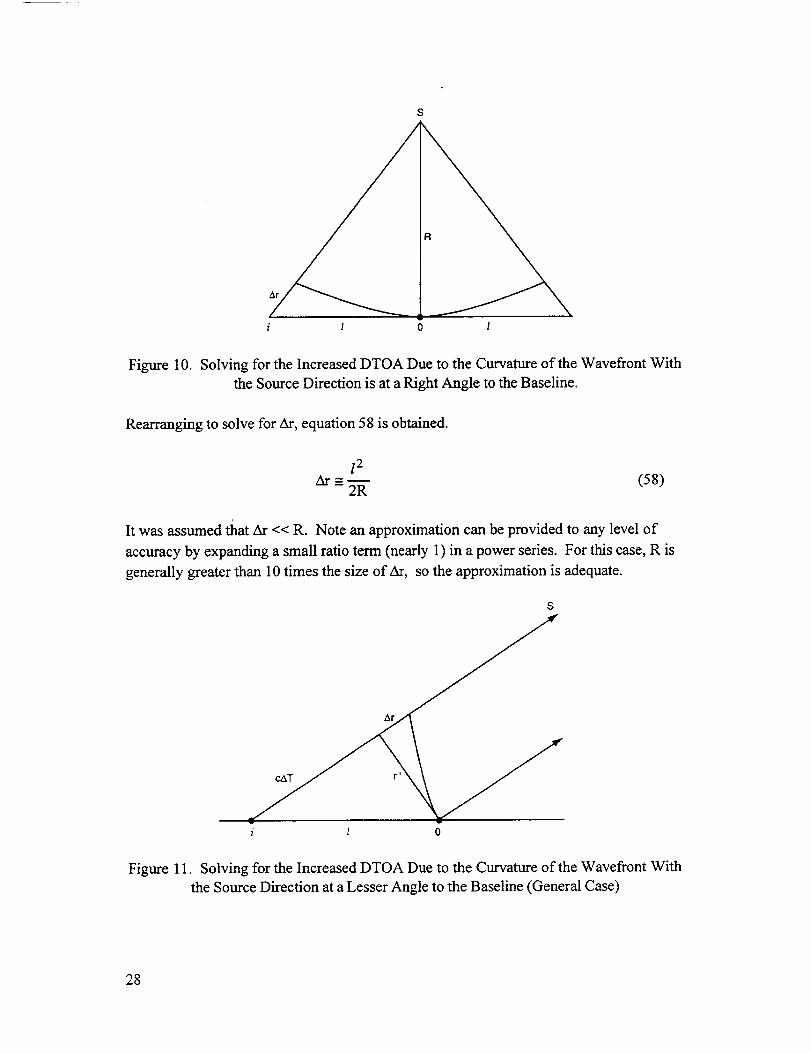
To derive equations for the effect of wavefront curvature, or finite source range, note
figure 10 which shows, for a source directly over the baseline, a triangle with an inscribed
segment of a circle of radius R. The base of the triangle is twice the baseline l. The
quantity Ar is the additional distance for the wave front (the curved segment) to travel
before it reaches the remote detector compared to a flat phase front (the triangle's base).
The length of one of the triangle's sides is given by R + Ar. Using the Pythagorean
Theorem on the right triangle, equation 57 is obtained.
(Ar+ R) 2 =l 2 + R 2 (57)
27
i l 0 I
Figure 10. Solving for the Increased DTOA Due to the Curvature of the Wavefront With
the Source Direction is at a Right Angle to the Baseline.
Rearranging to solve for zSa',equation 58 is obtained.
l 2ar _--_m (58)
2R
It was assumed that ttr << R. Note an approximation can be provided to any level of
accuracy by expanding a small ratio term (nearly 1) in a power series. For this case, R is
generally greater than 10 times the size of &r, so the approximation is adequate.
S
Ar
i l 0
Figure 11. Solving for the Increased DTOA Due to the Curvature of the Wavefront With
the Source Direction at a Lesser Angle to the Baseline (General Case)
28
Thisexpressioncanbeconverteddirectlyto additionalDTOAwhenthesourcedirectionisataright angleto thebaselineasin figure 10. ThisDTOA isreducedasthebaselinedirectionbecomescloserto thesourcedirectionuntil nocorrectionis requiredwhenthetwoarecollinear.Therefore,anexpressionisneededfor theperpendiculardistance.Figure11showsthecasefor asourcedirectionat a lesserangleto thebaseline.It is firstnotedthat,in thecaseof aplanewave,thebaseline(timedelaytimesc) andthisperpendiculardistanceformarighttriangle.Thehypotenuseof thetriangleis thebaselinelengthl. Denoting the perpendicular distance as r', equation 59 is obtained:
l2 = c2AT 2 + (r') 2 (59)
By substituting into the above expression for Ar and replacing l with r', equation 60 is
obtained.
< /Ar = 1- l 2(60)
Since the Ar term can be denoted as 5AT as a correction to the plane wave AT, equation
61 is obtained.
12 ( c2AT2aAT -2cR 1 l 2(61)
As can be verified by performing the summation analytically, for a plane wave, the sum
of the three baseline AT's is equal to zero (with no noise). Since each of the BAT's is
positive, the sum of measured AT's should equal the sum of the BAT's. Therefore, the
three equations for the 8AT's can be summed and solved for R explicitly:
R
c__.Z_c 3- AT21
l 2 i(62)
29
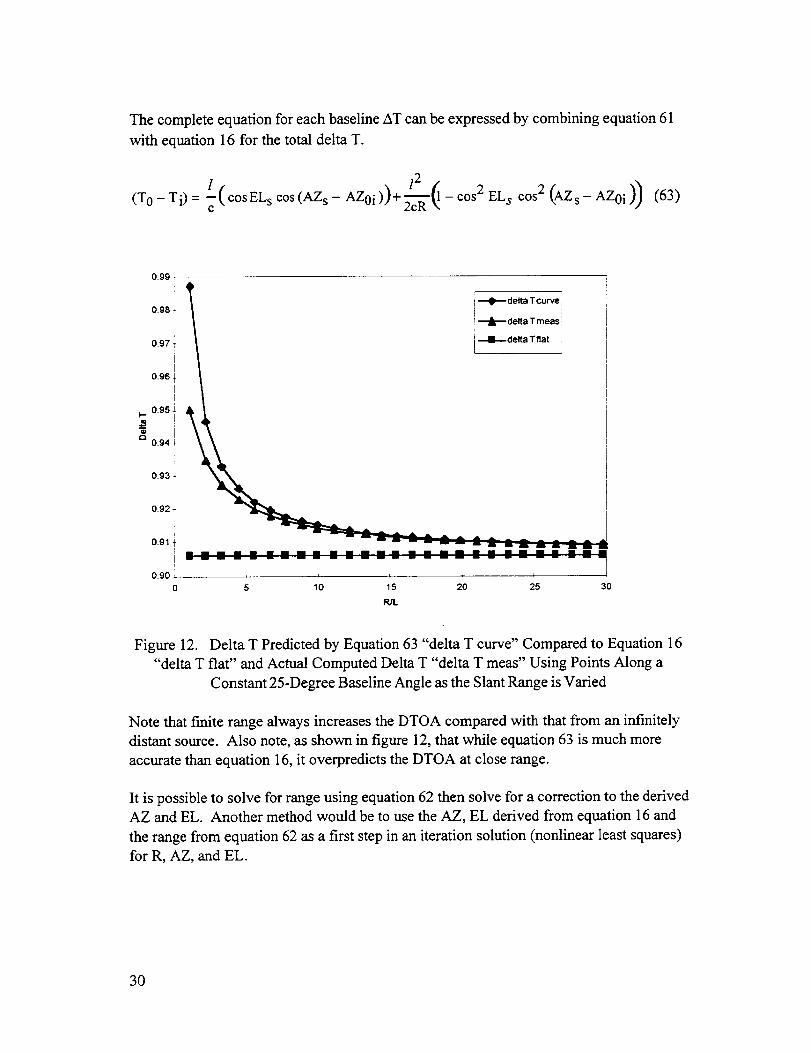
Thecompleteequationfor eachbaselineATcanbeexpressedby combiningequation61with equation16for thetotaldeltaT.
oo,: s
0.99
l f0.98 i _delta Tcurve
|] "----'Am delta T meas
0.97 _ _delta Tflat
0.96 i
0.95 i
_o9,,iI
0.93 i
0.92 !
io.91 ;
i .... ,.... -_.... ,....... --,-- ---_o.9o'_0 5 10 15 20 25 30
R/L
Figure 12. Delta T Predicted by Equation 63 "delta T curve" Compared to Equation 16
"delta T flat" and Actual Computed Delta T "delta T meas" Using Points Along a
Constant 25-Degree Baseline Angle as the Slant Range is Varied
Note that finite range always increases the DTOA compared with that from an infinitely
distant source. Also note, as shown in figure 12, that while equation 63 is much more
accurate than equation 16, it overpredicts the DTOA at close range.
It is possible to solve for range using equation 62 then solve for a correction to the derived
AZ and EL. Another method would be to use the AZ, EL derived from equation 16 and
the range from equation 62 as a first step in an iteration solution (nonlinear least squares)
for R, AZ, and EL.
3O
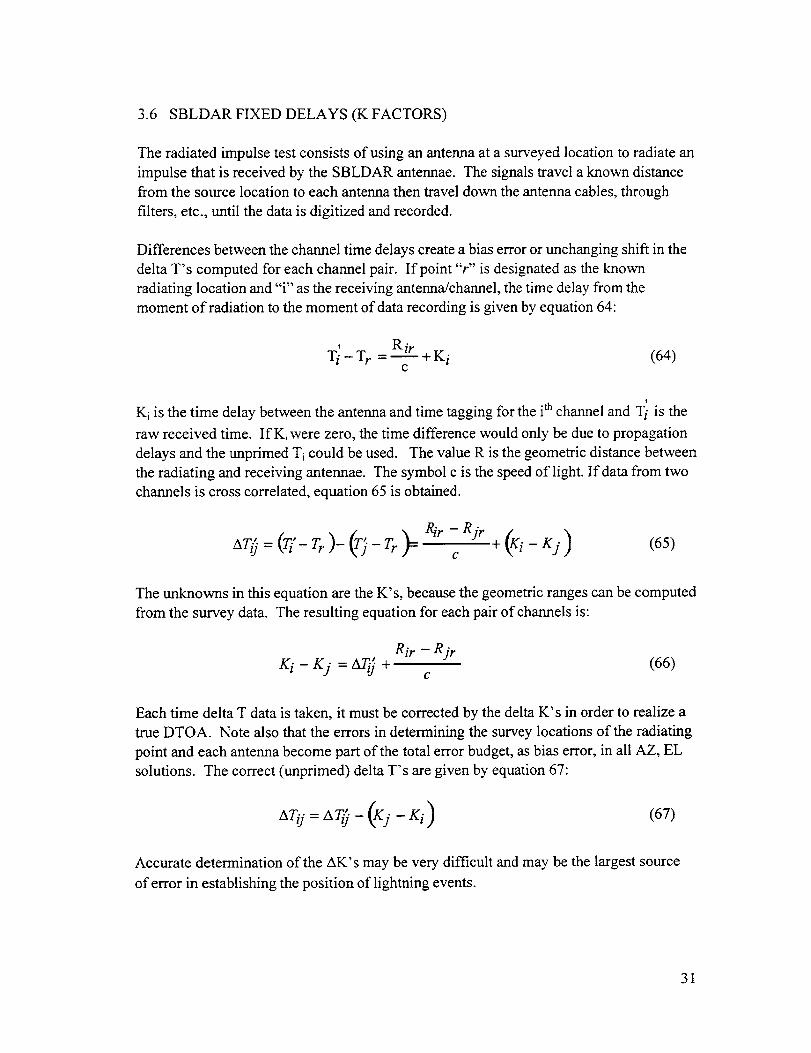
3.6 SBLDAR FIXED DELAYS(K FACTORS)
Theradiatedimpulsetestconsistsof usinganantennaatasurveyedlocationto radiateanimpulsethatis receivedby theSBLDARantennae.ThesignalstravelaknowTtdistancefromthesourcelocationto eachantennathentraveldowntheantennacables,throughfilters,etc.,until thedatais digitizedandrecorded.
Differencesbetweenthechanneltimedelayscreateabiaserroror unchangingshift in thedeltaT's computedfor eachchannelpair. If point"r" isdesignatedastheknownradiatinglocationand"i" asthereceivingantenna/channel,thetimedelayfromthemomentof radiationto themomentof datarecordingisgivenbyequation64:
T] _ Tr Rir= _ + K i (64)C
Ki is the time delay between the antenna and time tagging for the ith channel and Ti is the
raw received time. If K_were zero, the time difference would only be due to propagation
delays and the unprimed Ti could be used. The value R is the geometric distance between
the radiating and receiving antennae. The symbol c is the speed of light. If data from two
channels is cross correlated, equation 65 is obtained.
AT(1"= (Ti'- Tr )- (T) - Tr ) = Rir - Rjr _ _i - Kj )C
(65)
The unknowns in this equation are the K's, because the geometric ranges can be computed
from the survey data. The resulting equation for each pair of channels is:
Rir - R jrK i - Kj = AT_j + (66)
C
Each time delta T data is taken, it must be corrected by the delta K's in order to realize a
true DTOA. Note also that the errors in determining the survey locations of the radiating
point and each antenna become part of the total error budget, as bias error, in all AZ, EL
solutions. The correct (unprimed) delta T's are given by equation 67:
(67)
Accurate determination of the AK's may be very difficult and may be the largest source
of error in establishing the position of lightning events.
31
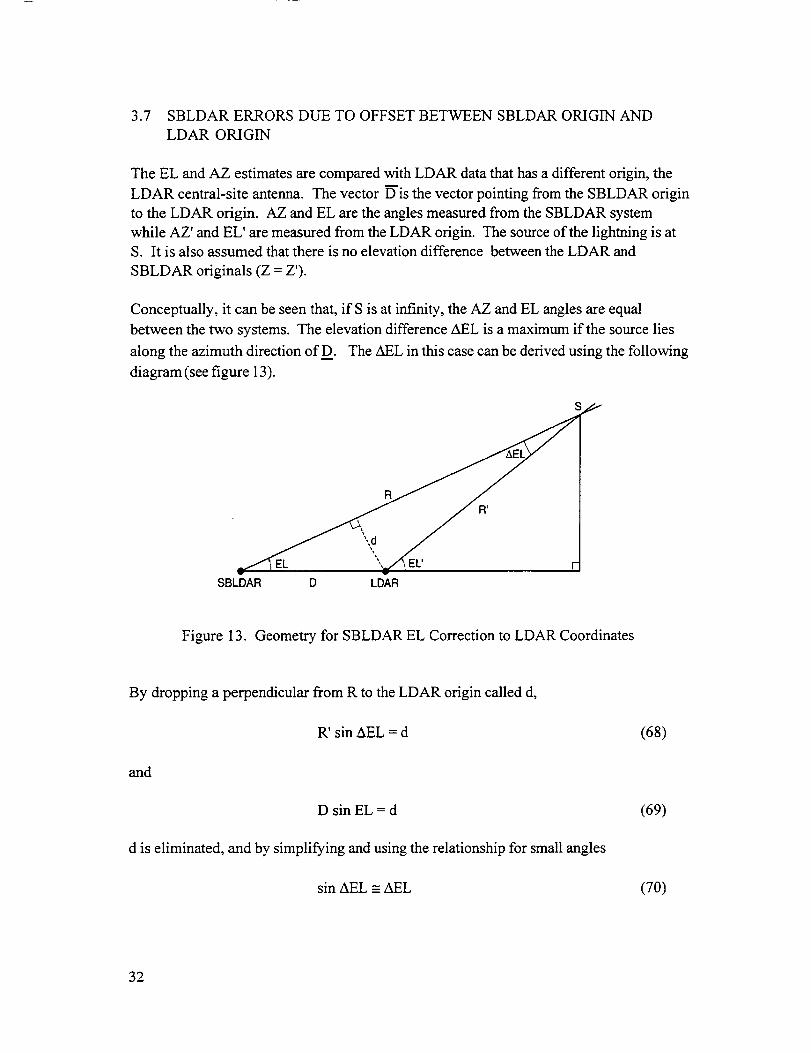
3.7 SBLDARERRORSDUE TOOFFSETBETWEENSBLDARORIGINANDLDAR ORIGIN
TheEL andAZ estimatesarecomparedwithLDAR datathathasadifferentorigin,theLDAR central-siteantenna.ThevectorD is thevectorpointingfromtheSBLDARoriginto theLDAR origin. AZ andEL aretheanglesmeasuredfromtheSBLDARsystemwhileAZ' andEL' aremeasuredfromtheLDAR origin. Thesourceof thelightningisatS. It isalsoassumedthatthereisnoelevationdifferencebetweentheLDAR andSBLDAR originals(Z = Z').
Conceptually, it can be seen that, if S is at infinity, the AZ and EL angles are equal
between the two systems. The elevation difference AEL is a maximum if the source lies
along the azimuth direction of D. The AEL in this case can be derived using the following
diagram (see figure 13).
s_
EL' F
SBLDAR D LDAR
Figure 13. Geometry for SBLDAR EL Correction to LDAR Coordinates
By dropping a perpendicular from R to the LDAR origin called d,
R' sin AEL = d
and
D sin EL = d
d is eliminated, and by simplifying and using the relationship for small angles
sin AEL =__AEL
(68)
(69)
(70)
32
equation71 isobtained
DAEL= "_7sinEL (71)
ForsmallAEL, R'andRarenearlyequal,equation72is obtainedfor sourcesalongthedirectionD.
DEL' = EL + _- sinEL (72)
BecauseatazimuthsatrightanglestoD the elevation angles will be equal, it can be argued
that the second term is modified by a cosine function in azimuth as measured from the
direction of D.I
D
EL '= EL + _- sin EL cos(AZ + AZD)(73)
i
or in terms of the X and Y components of D
°EL '= EL + _- (sin EL)(cos (AZ + tan "1(74)
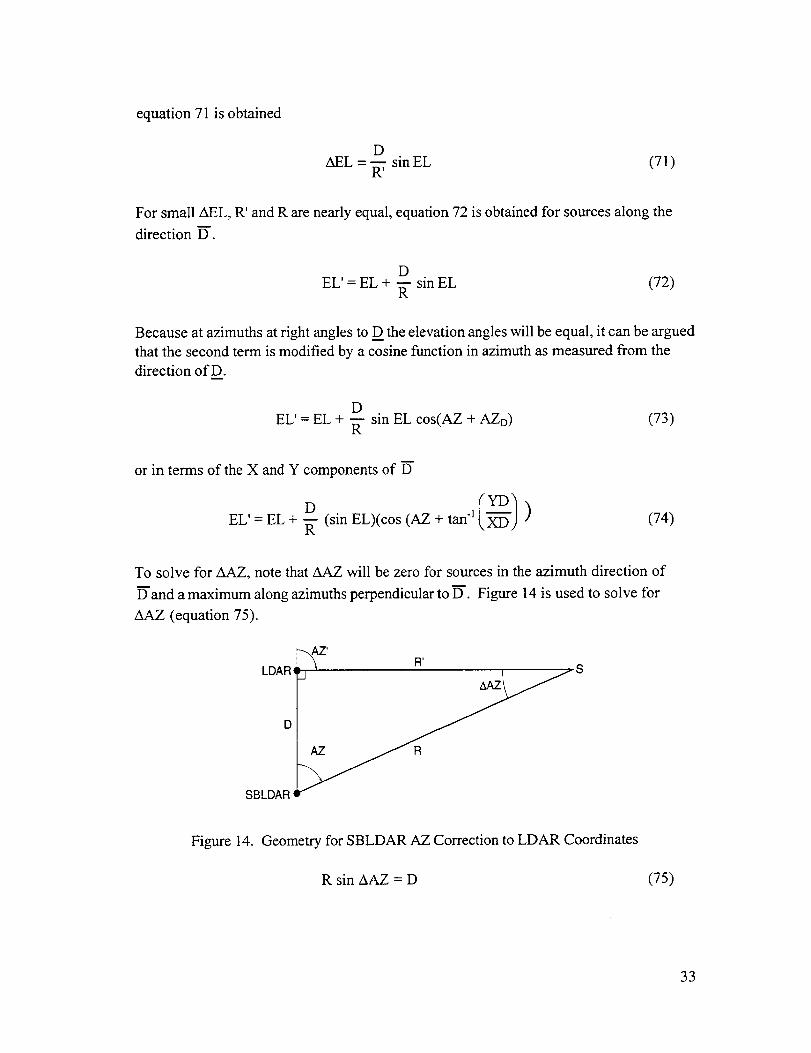
To solve for AAZ, note that AAZ will be zero for sources in the azimuth direction of
D'and a maximum along azimuths perpendicular to D'. Figure 14 is used to solve for
AAZ (equation 75).
LDAR ,_Z'
D
SBLDAR
RI
LJ ,_LZ_jj,- S
Figure 14. Geometry for SBLDAR AZ Correction to LDAR Coordinates
R sin AAZ = D (75)
33
and for small zLa,Z
DAAZ - (76)
R
D
Because zLAZ is a maximum when the source azimuth is perpendicular to D, the function
is modified with a sine function:
AZ' = AZ + _- cos (AZ + ) (77)
The origin of coordinate systems for the LDAR and the SBLDAR differ, so adjustments
must be made to compare or mix the results from the two systems. For sources at an
infinite distance, the AZ and EL seen from each system will be the same; however, for
finite source distances, these corrections must be applied.
4. DATA ANALYSIS
4.1 DATA INTEGRITY
There are several useful approaches available to perform data and system integrity
analysis. The most basic is to form additional channel-to-channel cross correlations and
evaluate sums such as equation 78:
(r0- _)- (r_- T,)-(T0- r_)- 0 (78)
This expression is not a tautology because the time differences are formed using the
process of cross correlation and peak fitting. This approach does not work with a system
such as LDAR, which simply identifies the peak value in the data record of each channel.
This formula was found to be very valuable during SBLDAR development because it
characterized the total random timing errors in locating each lightning event. It is also
useful in evaluating system repeatability when producing artificial RF pulses from a fixed
location.
Unfortunately, this equation is not helpful in determining bias errors because each
channel's fixed delays (K factors) also cancel.
Another useful relationship, valid only for the symmetrical, flat Y array is shown in
equation 79:
(to- _)+(to- v_)+(to- r_)_>o (79)
34

For sources at infinity, the equality holds. This can be seen by summing the equations in
17. For sources at finite range, each baseline contributes a positive residual so that the
number is positive. During SBLDAR development, this equation was used as a quick
data validity check. Sums that were negative were discarded. Also, events with large
positive sums were discarded. All of these resulted from equipment failures and low
signal levels (distant events).
This formula is also more useful than formula 78 because it does not entail additional
cross correlations and because, for small residuals, it can produce a range estimate (see
equation 62).
4.2 DATA TRIGGERING
Operation of the SBLDAR system depends on a system trigger (i.e., a command pulse
directing the system to record and analyze data). Generally the hardware will be set up to
record pretrigger data by using a continuous first-in-first-out (FIFO) data recording
buffer. If the system is used in conjunction with LDAR to refine position estimates, the
triggering scheme must ensure that the same pulse is analyzed on both systems. Using a
pulse produced by a threshold trigger operated using the LDAR central site channel can
ensure this because the SBLDAR is juxtapositioned with the LDAR (both places).
A moving trigger on the LDAR central channel (which has been proposed for an LDAR
upgrade) presents a further difficulty but is still solvable by having a longer FIFO buffer.
A moving trigger is one where potential events are identified but may be discarded in
preference for a new" one should a higher peak appear in a given time slot. Another
proposed triggering scheme would trigger from any of the seven LDAR channels.
In the case of a simple real-time LDAR trigger, the SBLDAR FIFO need only be long
enough to capture the data that occurs while the peak of the waveform traverses the
SBLDAR array. In this system with 90-meter baselines, this would be the time required
for light to traverse 180 meters plus signal on either side for about 650 nanoseconds. At a
digitizing rate of 500 MHz (one data point per 2 nanoseconds), this is only 325 data
points. A longer record may be desirable to ensure good correlation coherence (e.g., 512
points).
If any point in LDAR's 81.92 microsecond window could be chosen after the window
closed, this recording requirement is increased to 40,960 data points per channel.
However, if the windows are indefinite and the rate at which events are selected is high,
then the FIFO size requirements can become extraordinary - not to mention the FIFO
access time. An alternative could be to correlate data channels from each candidate peak
rather than saving high data streams.
35
An entirely different approach to an integrated short- and long-baseline LDAR system is
possible. Assuming the central antennas of each system are colocated and perhaps the
same antenna, the SBLDAR system could just as well be used as the trigger. Thus, the
SBLDAR system would identify events large enough to exceed a threshold, reliably
estimate the direction (AZ, EL) of the source, and provide a rough estimate of range.
Using the equations developed herein, an estimate of the location of the event record in
the FIFO records from the long baselines could be quickly generated. This would
facilitate either a rapid and efficient search of the long FIFO record or, even better, the
more precise digitizing of the long baseline signals, only in the portion of the record of
interest. This later approach would require long delay lines, so the SBLDAR processing
is completed prior to the arrival of the earliest long-baseline pulse. This would
potentially increase the time resolution on the long-baseline records and could eliminate
completely incorrect event DTOA's (which is a common problem with the existing
LDAR system).
The following discussion on data processing will not address the integration of short- and
long-baseline LDAR because this issue is in a state of flux.
4.3 SBLDAR DATA PROCESSING
The flow of data processing should proceed generally as follows:
a. Receive trigger pulse (including time marker).
b. Continue to fill FIFO's for each channel to the specified level.
C. Read FIFO's in pairs into fast fourier transform processors that compute
the cross correlation function. (The peak of this function is the best
estimate of the time delay.)
d. Refine the time delay by performing a low order curve fit (i.e., third order)
on an appropriately small number of points around the peak, then solve for
the peak. (Alternatively, bond limited interpolation may be used for the
curve fit.)
e. Subtract the bias delay differences (delta K's) from each delta T.
f. Evaluate the set of baseline delta T's for validity by performing a direct sum
(which should be slightly positive).
g. Solve for AZ and EL for valid events.
36
h. Estimate the range for close events and refine estimates for AZ and EL
(optional).
i. Clear trigger and reset FIFO for the next event.
5. CONCLUSIONS AND RECOMMENDATIONS
This report provides the results of analyses and algorithm development for an SBLDAR
system. The analyses indicate that an equal arm Y-shaped array has very desirable
properties because:
a. A single-step, least-squared-error algorithm can be used to rapidly and
reliably estimate the AZ and EL of distant events.
b. The AZ error is independent of AZ.
C. The EL error is degraded compared to AZ but may be acceptable down to
low elevation angles (near the mask angles of antennas).
d. The array can be easily augmented by a vertical baseline to capture EL data
at low EL if necessary.
e. An iterative approach to solve for R, AZ, AEL for close-in events is
available if required (see appendix A).
At the time of the development of this report, lightning data has been obtained by both
the SBLDAR prototype system (described herein) and the LDAR system and acceptable
agreement obtained. Full validation of the SBLDAR concept as an operational system
has been completed.
Future work is anticipated to include additional SBLDAR data analysis with emphasis on
increasing event processing speed. Also, integration of the SBLDAR into an overall
LDAR system must be addressed. Both of these requirements will require the
development, fabrication, and testing of state-of-the-art data capture and analysis
hardware and software due to the high digitizing rate and rapid throughput (6,000 events
per second) requirements. Future upgrades of LDAR may result in 30,000 events per
second.
The work documented in this report is new. Carl Lennon developed the concept of using
a short-baseline LDAR to correct the deficiencies of the existing LDAR system. Mike
Brooks and Carl Lennon laid out the Y and vertical arrays. Stan Starr developed all the
algorithms and formulas in this report and the concept of using the SBLDAR to trigger on
events and find them on the long baselines. Mike Brooks and Bradley Bums developed
37

all the hardware and software in the prototype SBLDAR system. The exception to this
is Geoff Rowe's work on the approach to cross correlating and peak fitting data records
to estimate the time delays.
38
APPENDIX A
ITERATIVE SOLUTION FOR R, AZ, AND EL
When the source is relatively close to the array, significant errors in AZ and EL can result
from the sensitivity of AT to R. In some applications of the algorithms, it may also be
desirable to estimate R along with AZ and EL. This section derives a procedure for
estimating all three variables.
Starting with equation 63, which approximates the measured delta T including the effectsof curvature:
(Ti - T0) = /(cosELs cos (AZs - AZ0i ))+ 2@R _ - cos2 ELs cos2 (AZs - AZ0i))(A1)
for a baseline lying in the EL = 0 plane.
It can be said, therefore, that AT is a function ofAZs, Els, Rs
AToi = f(AZ s, EL s, Rs) (A2)
If there is an approximate solution for these variables, the equation A1 can be used to
compute an approximate AT2i designated as AT2i"
A"Toi = f(AZs,ELs,Rs) (A3)
A procedure is needed for using the measured data (3 AT's) and the approximate AZs,
ELs, Rs to solve for the best AZs, ELs, and Rs compatible with the data. If a Taylor
expansion of AZ is taken using as a starting point the approximate solution, the equation
A-4 is obtained.
AT0i = A"T0i + (AZs -_7-,s)0"_s + (ELs -ELs 0E_Lf s + (Rs- P"s0_Rf s (A4)
where all derivatives are evaluated at the estimated coordinates and only the first order
terms have been retained. Evaluating each partial derivative:
A-1
8f -I-- = ---cosE-L'ssin ('A-Zs - AZ0i)3AZ s c
72
+ _--i--cos2E-L's(cosA('A-Zs- AZ0i )sinA_s - AZ0i) )cRs
(A5)
°nf = -/sin EL s (cos ('A'-Zs - AZ0i ))3EL s c
/2+--COS E-Ls sin E-L's (cOs2 A_s - AZ0i ))
CRs
(A6)
Of -12 _s (cos2 (_s_ AZ0i_s =2CR2_ c°s2 )))
(A7)
If the equation is labeled as:
Of Of Of
i0AZ0-- = _0i, OEL0 i - _oi' iR0--O =70i(A8)
then the Taylor expansion equations for all three baselines can be written as a matrix
equation:
AT02 A'T02 = 0¢02 fl02 Y02[
AT03 A--_03 a03 f103 Y03 )
AZs- sELs -E-Ls
Rs - R's
(A9)
For this equation to be solvable, the determinant of the derivatives matrix must exist (be
nonzero). Although complicated, it can be shown that the solution exists. It should be
noted, however, that as R increases, the size of the 7 terms rapidly decrease, which
decreases the numerical stability of the scheme.
The solution approach could be to: solve for AZ and EL using the algorithm given in
section 2.4; then estimate the range using equation 62; compute the AT-''ns using equation
63; next, compute the residuals matrix of the AT - A-_ terms; solve for each of the terms
in the derivatives matrix; and invert fine derivatives ma_ix and apply it to the residuals
matrix. Tbds will give fine matrix of corrections to the estimated AZ, EL, and R
coordinates. These corrections are applied to the original estimates to derive a new set.
This process is repeated until the residuals matrix becomes very small or zero.
A-2
APPENDIX B
REFERENCES
°
,
°
°
.
*
.
°
.
10.
I1.
Godfrey, R., Mathews, E.R., and McDivitt, J.A., "Analysis of Apollo 12 Lightning
Incident," MSC-01540, February 1970.
Uman, Martin A., "Electrical Breakdown in the Apollo 12/Saturn V First Stage
Exhaust," Westinghouse Research Laboratories, Research Report 70-9C8-HIVOL-
R1. May 4, 1970.
Brooks, M., Holmes, C.R., and Moore, C.B., Lightning and Rockets: Some
Implications of the Apollo 12 Lightning Event, New Mexico Institute of Mining and
Technology, Socorro, New Mexico.
Durrett, W.R., Lightning - Apollo to Shuttle, Thirteenth Space Congress
Proceedings, April 7-9, 1976.
Christian, H.J., Crouch, K., Fisher, B., Mazur, V., and Perala, R.A., The Atlas-
Centaur 67 Incident, Document ID: 19880035060 A (88A22287), Report Number:
AIAA Paper 88-0389, January 01, 1988.
Kennedy Space Center Safety Practices Handbook, KHB 1710.2C, February 27,
1997.
Lennon, C., and Maier, L., Lightning Mapping System, NASA Conference
Publication 3106, Vol. II, John F. Kennedy Space Center, 1991 International
Aerospace and Ground Conference on Lightning and Static Electricity, Cocoa Beach,
Florida, April 16-19, 1991.
Lightning Detection and Ranging (LDAR) System Certification Document, NASA
and NYMA, Inc., Under NASA Contract NAS10-11835, September 14, 1994.
Godara, Lal C., IEEE, Application of Antenna Arrays to Mobile Communications,
Part II: Beam-Forming and Direction-of-Arrival Considerations, Proceedings of the
IEEE, Vol. 85, No. 8, August 1997.
Jenkins, Hemdon H., Small-Aperture Radio Direction-Finding, Artech House, Inc.,
Boston:1991.
Mazur, Vladislav, Williams, Earle, Boldi, Robert, Maier, Launa, and Proctor David
E., "Initial Comparison of Lightning Mapping With Operational Time-Of-Arrival
and Interferometric Systems, Journal of Geophysical Research, Vol. 102, No. D 10,
Pages 11,071-11,085, May 27, 1997.
B-1
12.
13.
14.
15.
16.
17.
18.
19.
20.
Mazur,Vladislav,Williams,Earle,Boldi, Robert,Maier,Launa,andProctor,DavidE., "Comparisonof LightningMappingWithOperationalTime-Of-Arrival andInterferometricSystems,"NAWCADPAX--95306-PRO,Proceedingsof the 1995InternationalAerospace and Ground Conference on Lightning and Static Electricity,
Williamsburg, Virginia, September 26-28, 1995.
Rhodes, C.T., Shao, X.M., Krehbiel, P.R., and Thomas, R., "Observations of
Lightning Processes Using VHF Radio Interferometry," NASA Conference
Publication 3106, Vol. II, 1991 International Aerospace and Ground Conference on
Lightning and Static Electricity, Cocoa Beach, Florida, April 16-19, 1991.
Lee, Harry B., "A Novel Procedure for Assessing the Accuracy of Hyperbolic
Multilateration Systems," IEEE Transactions on Aerospace and Electronic Systems,
Vol. AES-11, No. 1, January 1975.
Torrieri, Don J., "Statistical Theory of Passive Location Systems," IEEE
Transactions on Aerospace and Electronic Systems_ Vol. AES-20, No. 2, March
1984.
Poehler, Horst A., Ph.D., "Error Analysis of Y-Configured Hyperbolic and
Alternative Systems," RCA 620-5006, January 23, 1979.
Poehler, Horst A., Ph.D., "An Accuracy Analysis of the LDAR System," NASA
Contractor Report CR- 154631, Federal Electric Corporation, FEC-7146, 8 March
1977.
Cannon, John R., Ph.D. and Lennon, Carl L., "A Study of Various Methods for
Calculating Locations of Lightning Events," 1995 NASA/ASEE Summer Faculty
Fellowship Program, John F. Kennedy Space Center, University of Central Florida,
August 22, 1995.
Cannon, John R., Ph.D., and Pyle, Bradford A., "A Study of the Geometric
Dilution of Precision (GDOP) for the Lightning Detection and Ranging System
(LDAR) and Methods of Solution Compensating for GDOP," 1996
NASA/Graduate Student Researchers Program, John F. Kennedy Space Center,
University of Central Florida, December 12, 1996.
Thomson, E.M., Medelius, P.J., and Davis, S., "System for Locating the Sources of
Wideband dE/dt from Lightning," Journal of Geophysical Research, Vol. 99, No.
D 11, Pages 22, 793-22, 802, November 20, 1994.
21. Uman, Martin A., The Lightning Discharge, Academic Press, Inc., Harcourt Brace
Jovanovich, Orlando: 1987.
22. Shelby, S.M. Ed., Standard Mathematical Tables, 21 st Ed., Chemical Rubber Co.,
Cleveland, OH, 1973.
B-2

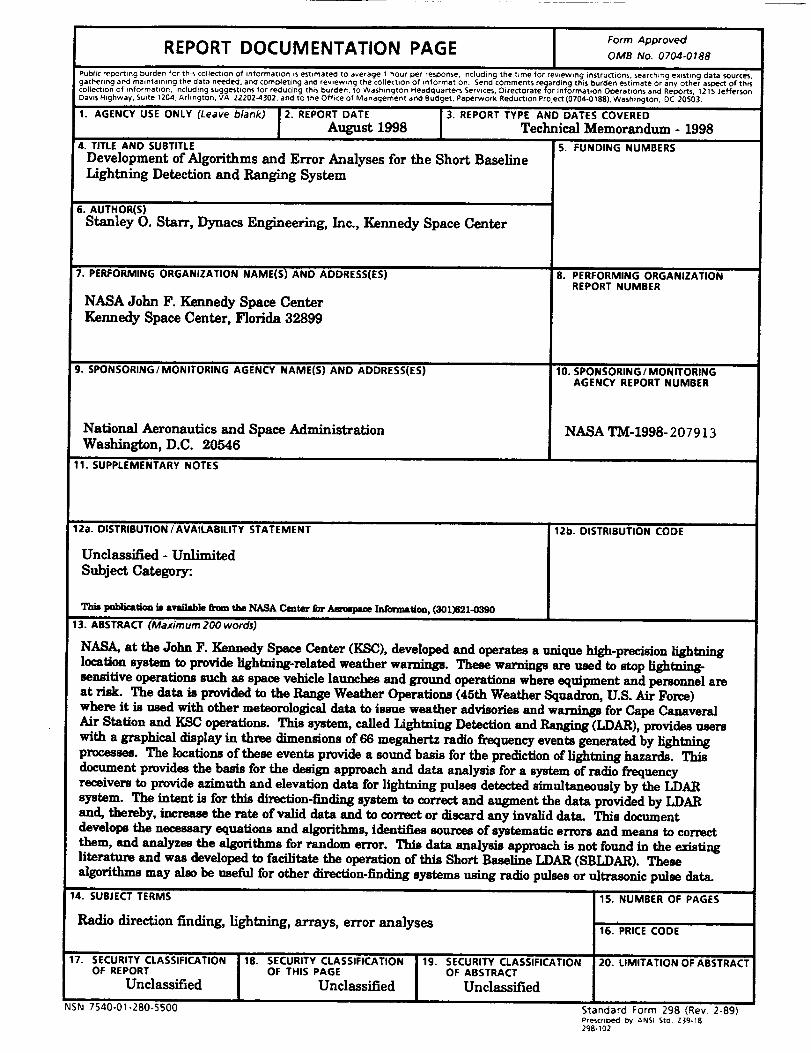
Form Approved
REPORT DOCUMENTATION PAGE OMS o7o -o,88
Public reDortlng burden for thls collection of information is estlmate¢l to average 1 hour iD_r resl:sonse, including the time for reviewing instructions, search=ng existing data sources,
gathenng and ma,nta,n_ng the data ne_led, and combleting and rev,ewlng the collect,on of information. Send comments re,larding this burden estimate or any other aspect of this
collect,on of informat0on, ,ncluding suggestions for reducing this burden, to Washington Headquarters Services, Directorate for Information O_rat,ons and Reports, 1215 Jefferson
Oavms Hmghway, Suite 1204, A rlington. VA 22202-4302, and tO the Office of Management and Budget, Paperwork Reduction Project (0704-0188). Washington, DC 20503.
1. AGENCY USE ONLY (Leave blank) 2. REPORT DATE 3. REPORT TYPE AND DATES COVERED
August 1998 Technical Memorandum - 1998
4. TITLE AND SUBTITLE 5. FUNDING NUMBERS
Development of Algorithms and Error Analyses for the Short BaselineLightning Detection and Ranging System
6. AUTHOR(S)
Stanley O. Starr, Dynacs Engineering, Inc., Kennedy Space Center
7. PERFORMINGORGANIZATIONNAME(S)ANDADDRESS(ES)
NASA John F. Kennedy Space CenterKennedy Space Center, Florida 32899
9. SPONSORING/MONITORING AGENCY NAME(S) AND ADDRESS(ES)
National Aeronautics and Space AdministrationWashington, D.C. 20546
11. SUPPLEMENTARY NOTES
8. PERFORMING ORGANIZATIONREPORT NUMBER
10. SPONSORING / MONITORINGAGENCY REPORT NUMBER
NASA TM-1998- 207913
12a. DISTRIBUTION / AVAILABILITY STATEMENT
Unclassified - Unlimited
Subject Category:
This publication is available Ikom the NASA Center for Aerospace Infca, mati_, (301)621-O390
13. ABSTRACT (Maximum 200 words)
12b. DISTRIBUTION CODE
NASA, at the John F. Kennedy Space Center (KSC), developed and operates a unique high-precision lightninglocation system to provide ]/ghtuing-related weather warnings. These warnin_ are used to stop I/ghtning-sensitive operations such as space vehicle launches and ground operations where equipment and personnel areat risk. The data is provided to the Range Weather Operations (45th Weather Squadron, U.S. Air Force)where it is used with other meteorological data to issue weather advisories and warnings for Cape CanaveralAir Station and KSC operations. This system, called Lightning Detection and Ranging (LDAR), provides userswith a graphical display in three dimensions of 66 megahertz radio frequency events generated by lightningprocesses. The locations of these events provide a sound basis for the prediction of lightuing hazards. Thisdocument provides the basis for the design approach and data analysis for a system of radio frequencyreceivers to provide azimuth and elevation data for lightning pulses detected simultaneously by the LDARsystem. The intent is for this direction-finding system to correct and augment the data provided by LDARand, thereby, increase the rate ofvahd data and to correct or discard any invalid data+ This documentdevelops the necessary equations and algorithms, identifies sources of systematic errors and means to correctthem, and analyzes the algorithms for random error. This data analysis approach is not found in the existingliterature and was developed to facilitate the operation of this Short Baseline LDAR (SBLDAR). Thesealgorithms may also he useful for other direction-finding systems using radio pulses or ultrasonic pulse data+
14. SUBJECT TERMS
Radio directionfinding,lightning,arrays,erroranalyses
17. SECURITYCLASSIFICATION18.SECURITYCLASSIFICATION 19.OF REPORT OF THISPAGE
Unclassified Unclassified
NSN 7540-01-280-5500
SECURITY CLASSIFICATIONOF ABSTRACT
Unclassified
15. NUMBER OF PAGES
i
16. PRICE CODE
20. LIMITATION OF ABSTRACT
Standard Form 298 (Rev 2-B9)Prescr.Ded by ANSI Std Z39-18298-102